User login
Perspectives of Clinicians, Staff, and Veterans in Transitioning Veterans from non-VA Hospitals to Primary Care in a Single VA Healthcare System
As the VA moves toward increased utilization of non-VA care, it is crucial to understand and address the challenges of transitional care faced by dual-use veterans to provide high-quality care that improves healthcare outcomes.7,11,12 The VA implemented a shift in policy from the Veterans Access, Choice, and Accountability Act of 2014 (Public Law 113-146; “Choice Act”) to the VA Maintaining Internal Systems and Strengthening Integrated Outside Networks (MISSION) Act beginning June 6, 2019.13,14 Under the MISSION Act, veterans have more ways to access healthcare within the VA’s network and through approved non-VA medical providers in the community known as “community care providers.”15 This shift expanded the existing VA Choice Act of 2014, where the program allowed those veterans who are unable to schedule an appointment within 30 days of their preferred date or the clinically appropriate date, or on the basis of their place of residence, to elect to receive care from eligible non-VA healthcare entities or providers.14,15 These efforts to better serve veterans by increasing non-VA care might present added care coordination challenges for patients and their providers when they seek care in the VA.
High-quality transitional care prevents poor outcomes such as hospital readmissions.16-18 When communication and coordination across healthcare delivery systems are lacking, patients and their families often find themselves at risk for adverse events.19,20 Past research shows that patients have fewer adverse events when they receive comprehensive postdischarge care, including instructions on medications and self-care, symptom recognition and management, and reminders to attend follow-up appointments.17,21,22 Although researchers have identified the components of effective transitional care,23 barriers persist. The communication and collaboration needed to provide coordinated care across healthcare delivery systems are difficult due to the lack of standardized approaches between systems.24 Consequently, follow-up care may be delayed or missed altogether. To our knowledge, there is no published research identifying transitional care challenges for clinicians, staff, and veterans in transitioning from non-VA hospitals to a VA primary care setting.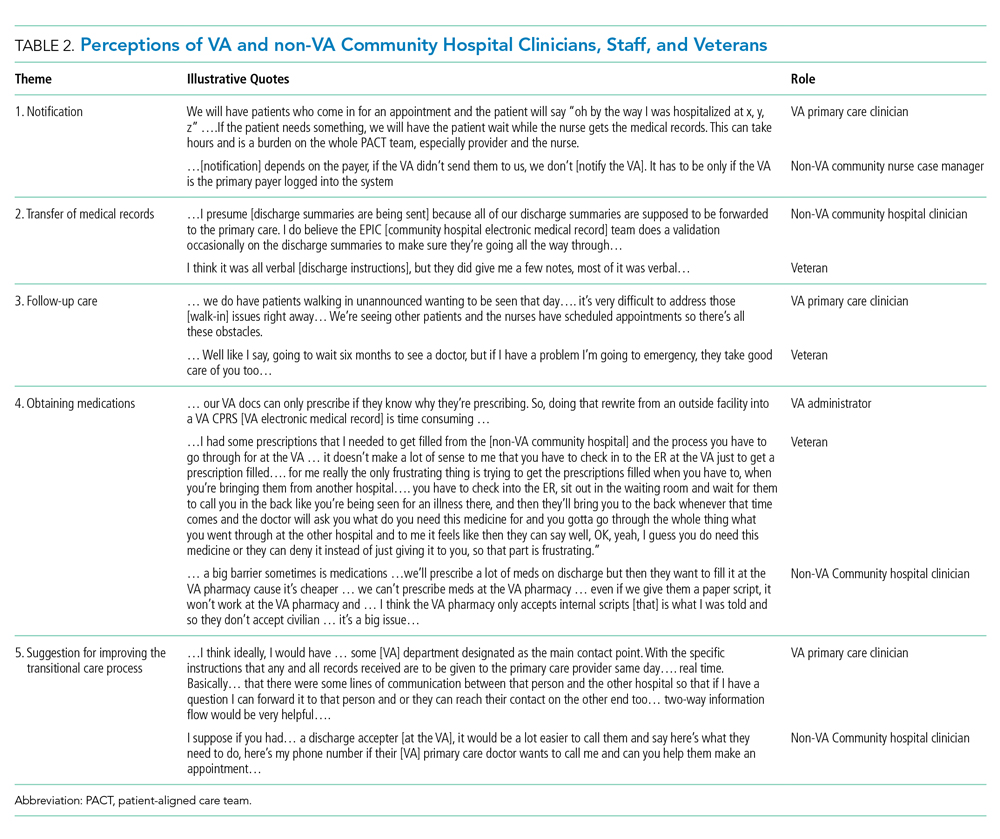
The objective of this quality assessment was to understand VA and non-VA hospital clinicians’ and staff as well as veterans’ perspectives of the barriers and facilitators to providing high-quality transitional care.
METHODS
Study Design
We conducted a qualitative assessment within the VA Eastern Colorado Health Care System, an urban tertiary medical center, as well as urban and rural non-VA hospitals used by veterans. Semi-structured interview guides informed by the practical robust implementation and sustainability (PRISM) model, the Lean approach, and the Ideal Transitions of Care Bridge were used.25-27 We explored the PRISM domains such as recipient’s characteristics, the interaction with the external environment, and the implementation and sustainability infrastructure to inform the design and implementation of the intervention.25 The Lean approach included methods to optimize processes by maximizing efficiency and minimizing waste.26 The Ideal Transitions of Care Bridge was used to identify the domains in transitions of care such as discharge planning, communication of information, and care coordination.27
Setting and Participants
We identified the top 10 non-VA hospitals serving the most urban and rural veterans in 2015 using VA administrative data. Purposive sampling was used to ensure that urban and rural non-VA hospitals and different roles within these hospitals were represented. VA clinicians and staff were selected from the Denver VA Medical Center, a tertiary hospital within the Eastern Colorado Health Care System and one VA Community-Based Outpatient Clinic (CBOC) that primarily serves rural veterans. The Denver VA Medical Center has three clinics staffed by Patient Aligned Care Teams (PACTs), a model built on the concept of Patient-Centered Medical Home.28 Hospital leadership were initially approached for permission to recruit their staff and to be involved as key informants, and all agreed. To ensure representativeness, diversity of roles was recruited, including PACT primary care physicians, nurses, and other staff members such as medical assistants and administrators. Veterans were approached for sampling if they were discharged from a non-VA hospital during June–September 2015 and used the VA for primary care. This was to ensure that they remembered the process they went through postdischarge at the time of the interview.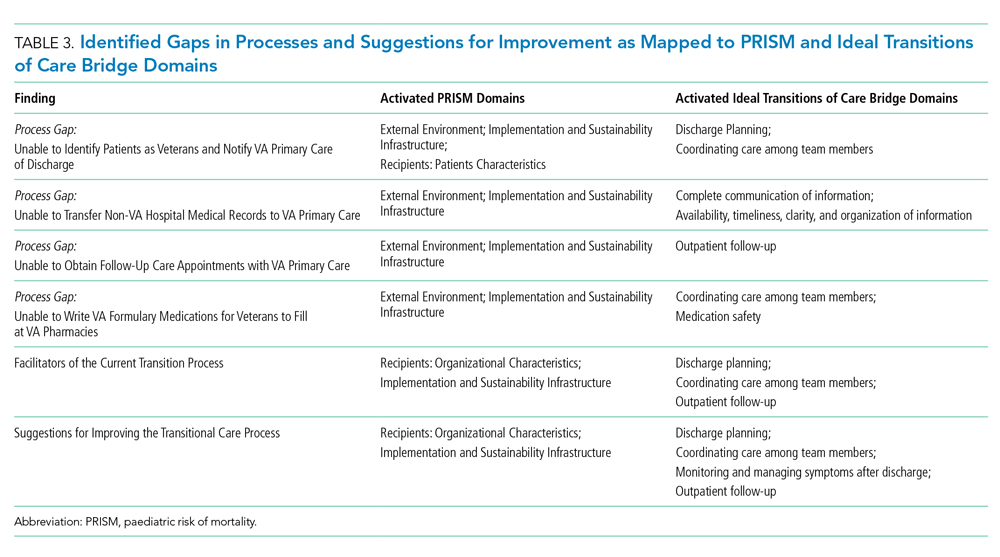
Data Collection and Analysis
The evaluation team members (RA, EL, and MM) conducted the interviews from November 2015 to July 2016. Clinicians, staff, and veterans were asked semi-structured questions about their experiences and their role in transitioning VA patients across systems (see Appendix for interview guides). Veterans were asked to describe their experience and satisfaction with the current postdischarge transition process. We stopped the interviews when we reached data saturation.29
Interviews were audio-recorded, transcribed verbatim, and validated (transcribed interviews were double-checked against recording) to ensure data quality and accuracy. Coding was guided by a conventional content analysis technique30, 31 using a deductive and inductive coding approach.31 The deductive coding approach was drawn from the Ideal Transitions of Care Bridge and PRISM domains. 32,33 Two evaluation team members (RA and EL) defined the initial code book by independently coding the first three interviews, worked to clarify the meanings of emergent codes, and came to a consensus when disagreements occurred. Next, a priori codes were added by team members to include the PRISM domains. These PRISM domains included the implementation and sustainability infrastructure, the external environment, the characteristics of intervention recipients, and the organizational and patient perspectives of an intervention.
Additional emergent codes were added to the code book and agreed upon by team members (RA, EL, and MM). Consistent with previously used methods, consensus building was achieved by identifying and resolving differences by discussing with team members (RA, EL, MM, CB, and RB).29 Codes were examined and organized into themes by team members.29,34-36 This process was continued until no new themes were identified. Results were reviewed by all evaluation team members to assess thoroughness and comprehensiveness.34,35 In addition, team members triangulated the findings with VA and non-VA participants to ensure validity and reduce researcher bias.29,37
RESULTS
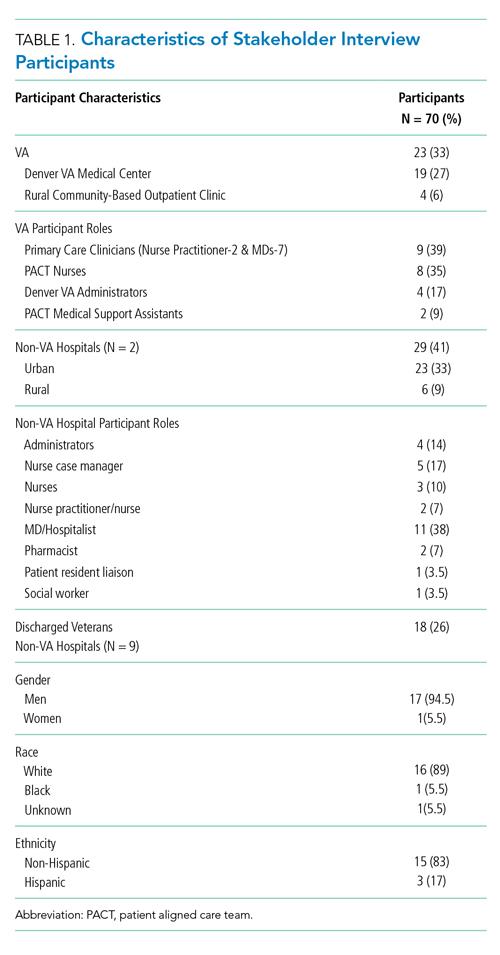
We conducted a total of 70 interviews with 23 VA and 29 non-VA hospital clinicians and staff and 18 veterans (Table 1). Overall, we found that there was no standardized process for transitioning veterans across healthcare delivery systems. Participants reported that transitions were often inefficient when non-VA hospitals could not (1) identify patients as veterans and notify VA primary care of discharge; (2) transfer non-VA hospital medical records to VA primary care; (3) obtain follow-up care appointments with VA primary care; and (4) write VA formulary medications for veterans to fill at VA pharmacies. In addition, participants discussed about facilitators and suggestions to overcome these inefficiencies and improve transitional care (Table2). We mapped the identified barriers as well as the suggestions for improvement to the PRISM and the Ideal Transitions of Care Bridge domains (Table 3).
Unable to Identify Patients as Veterans and Notify VA Primary Care of Discharge
VA and non-VA participants reported difficulty in communicating about veterans’ hospitalizations and discharge follow-up needs across systems. Non-VA clinicians referenced difficulty in identifying patients as veterans to communicate with VA, except in instances where the VA is a payor, while VA providers described feeling largely uninformed of the veterans non-VA hospitalization. For non-VA clinicians, the lack of a systematic method for veteran identification often left them to inadvertently identify veteran status by asking about their primary care clinicians and insurance and even through an offhanded comment made by the veteran. If a veteran was identified, non-VA clinicians described being uncertain about the best way to notify VA primary care of the patient’s impending discharge. Veterans described instances of the non-VA hospital knowing their veteran status upon admission, but accounts varied on whether the non-VA hospital notified the VA primary care of their hospitalization (Table 2, Theme 1).
Unable to Transfer Non-VA Hospital Medical Records to VA Primary Care
VA clinicians discussed about the challenges associated with obtaining the veteran’s medical record from the non-VA hospitals, and when it was received, it was often incomplete information and significantly delayed. They described relying on the veteran’s description of the care received, which was not complete or accurate information needed to make clinical judgment or coordinate follow-up care. Non-VA clinicians mentioned about trying several methods for transferring the medical record to VA primary care, including discharge summary via electronic system and sometimes solely relying on patients to deliver discharge paperwork to their primary care clinicians. In instances where non-VA hospitals sent discharge paperwork to VA, there was no way for non-VA hospitals to verify whether the faxed electronic medical record was received by the VA hospital. Most of the veterans discussed receiving written postdischarge instructions to take to their VA primary care clinicians; however, they were unsure whether the VA primary care received their medical record or any other information from the non-VA hospital (Table 2, Theme 2).
Unable to Obtain Follow-Up Care Appointments with VA Primary Care
All participants described how difficult it was to obtain a follow-up appointment for veterans with VA primary care. This often resulted in delayed follow-up care. VA clinicians also shared that a non-VA hospitalization can be the impetus for a veteran to seek care at the VA for the very first time. Once eligibility is determined, the veteran is assigned a VA primary care clinician. This process may take up to six weeks, and in the meantime, the veteran is scheduled in VA urgent care for immediate postdischarge care. This lag in primary care assignment creates delayed and fragmented care (Table 2, Theme 3).
Non-VA clinicians, administrators, and staff also discussed the difficulties in scheduling follow-up care with VA primary care. Although discharge paperwork instructed patients to see their VA clinicians, there was no process in place for non-VA clinicians to confirm whether the follow-up care was received due to lack of bilateral communication. In addition, veterans discussed the inefficiencies in scheduling follow-up appointments with VA clinicians where attempts to follow-up with primary care clinicians took eight weeks or more. Several veterans described walking into the clinic without an appointment asking to be seen postdischarge or utilizing the VA emergency department for follow-up care after discharge from a non-VA hospital. Veterans admitted utilizing the VA emergency department for nonemergent reasons such as filling their prescriptions because they are unable to see a VA PCP in a timely manner (Table 2, Theme 3).
Unable to Write VA Formulary Medications for Veterans to Fill at VA Pharmacies
All participants described the difficulties in obtaining medications at VA pharmacies when prescribed by the non-VA hospital clinicians. VA clinicians often had to reassess, and rewrite prescriptions written by clinicians, causing delays. Moreover, rural VA clinicians described lack of VA pharmacies in their locations, where veterans had to mail order medications, causing further delays in needed medications. Non-VA clinicians echoed these frustrations. They noted that veterans were confused about their VA pharmacy benefits as well as the need for the non-VA clinicians to follow VA formulary guidelines. Veterans expressed that it was especially challenging to physically go to the VA pharmacy to pick up medications after discharge due to lack of transportation, limited VA pharmacy hours, and long wait times. Several veterans discussed paying for their prescriptions out of pocket even though they had VA pharmacy benefits because it was more convenient to use the non-VA pharmacy. In other instances, veterans discussed going to a VA emergency department and waiting for hours to have their non-VA clinician prescription rewritten by a VA clinician (Table 2, Theme 4).
Facilitators of the Current Transition Process
Several participants provided examples of when transitional care communication between systems occurred seamlessly. VA staff and veterans noted that the VA increased the availability of urgent care appointments, which allowed for timelier postacute care follow-up appointments. Non-VA hospital clinicians also noted the availability of additional appointment slots but stated that they did not learn about these additional appointments directly from the VA. Instead, they learned of these through medical residents caring for patients at both VA and non-VA hospitals. One VA CBOC designated two nurses to care for walk-in veterans for their postdischarge follow-up needs. Some VA participants also noted that the VA Call Center Nurses occasionally called veterans upon discharge to schedule a follow-up appointment and facilitated timely care.
Participants from a VA CBOC discussed being part of a Community Transitions Consortium aimed at identifying high-utilizing patients (veteran and nonveteran) and improving communication across systems. The consortium members discussed each facility’s transition-of-care process, described having access to local non-VA hospital medical records and a backline phone number at the non-VA hospitals to coordinate transitional care. This allowed the VA clinicians to learn about non-VA hospital processes and veteran needs.
Suggestions for Improving the Transitional Care Process
VA and non-VA clinicians suggested hiring a VA liaison, preferably with a clinical background to facilitate care coordination across healthcare systems. They recommended that this person work closely with VA primary care, strengthen the relationship with non-VA hospitals, and help veterans learn more about the transition-of-care processes. Topics discussed for veteran education included how to (1) access their primary care tea
Veterans agreed that improvements to the current process should include an efficient system for obtaining medications and the ability to schedule timely follow-up appointments. Furthermore, veterans wanted education about the VA transition-of-care process following a non-VA hospitalization, including payment and VA notification processes (Table 2, Theme 5).
DISCUSSION
Participants described the current transitional care process as inefficient with specific barriers that have negative consequences on patient care and clinician and staff work processes. They described difficulties in obtaining medications prescribed by non-VA clinicians from VA pharmacies, delays in follow-up appointments at the VA, and lack of bilateral communication between systems and medical record transfer. Participants also provided concrete suggestions to improving the current process, including a care coordinator with clinical background. These findings are important in the context of VA increasing veteran access to care in the community.
Despite an increasing emphasis on veteran access to non-VA care as a result of the VA strategic goals and several new programs,7,12,13 there has not been a close examination of the current transition-of-care process from non-VA hospitals to VA primary care. Several studies have shown that the period following a hospitalization is especially vulnerable and associated with adverse events such as readmission, high cost, and death.12,31,32 Our findings agree with previous research that identified medical record transfer across systems as one of the most challenging issues contributing to deficits in communication between care teams.33 In addition, our study brought into focus the significant challenges faced by veterans in obtaining medications post non-VA hospital discharge. Addressing these key barriers in transitional care will improve the quality, safety, and value of healthcare in the current transition process.38,39
Based on our findings, our participants’ concern in transitional care can be addressed in various ways. First, as veterans are increasingly receiving care in the community, identifying their veteran status early on in the non-VA hospital setting could help in improved, real time communication with the VA. This could be done by updating patient intake forms to ask patients whether they are veterans or not. Second, VA policy-level changes should work to provide veterans access to non-VA pharmacy benefits equivalent to the access patients are receiving for hospital, specialty, and outpatient care. Third, patient and provider satisfaction for dual-use veterans should be examined closely. Although participants expressed frustration with the overall transitions of care from non-VA hospitals to VA primary care setting, influence of this on the Quadruple Aim-improving patient outcomes, experience, and reducing clinician and staff burnout should be examined closely.40 Fourth, evidence-based interventions such as nurse-led transitional care programs that have proven helpful in reducing adverse outcomes in both VA and non-VA settings will be useful to implement.41-45 Such programs could be located in the VA, and a care coordinator role could help facilitate transitional care needs for veterans by working with multiple non-VA hospitals.
The limitations of this study are that the perspectives shared by these participants may not represent all VA and non-VA hospitals as well as veterans’ experiences with transition of care. In addition, the study was conducted in one state and the findings may not be applicable to other healthcare systems. However, our study highlighted the consistent challenges of receiving care across VA and other hospital systems. Two strengths of this study are that it was conducted by multidisciplinary research team members with expertise in qualitative research, clinical care, and implementation science and that we obtained convergent information from VA, non-VA, and veteran participants.
Our current transition-of-care process has several shortcomings. There was a clear agreement on barriers, facilitators, and suggestions for improving the current transitions-of-care process among VA and non-VA hospital participants, as well as from veterans who experienced transitions across different delivery systems. Transitioning veterans to VA primary care following a non-VA hospitalization is a crucial first step for improving care for veterans and reducing adverse outcomes such as avoidable hospital readmissions and death.
These results describe the inefficiencies experienced by patients, clinicians, and staff and their suggestions to alleviate these barriers for optimal continuum of care. To avoid frustration and inefficiencies, the increased emphasis of providing non-VA care for veterans should consider the challenges experienced in transitional care and the opportunities for increased coordination of care.
1. Borowsky SJ, Cowper DC. Dual use of VA and non-VA primary care. J Gen Intern Med. 1999;14(5):274-280. https://doi.org/10.1046/j.1525-1497.1999.00335.x.
2. Charlton ME, Mengeling MA, Schlichting JA, et al. Veteran use of health care systems in rural states. Comparing VA and Non-VA health care use among privately insured veterans under age 65. J Rural Health. 2016;32(4):407-417. https://doi.org/10.1111/jrh.12206.
3. Forster AJ, Murff HJ, Peterson JF, Gandhi TK, Bates DW. The incidence and severity of adverse events affecting patients after discharge from the hospital. Ann Intern Med. 2003;138(3):161. https://doi.org/10.7326/0003-4819-138-3-200302040-00007.
4. Nguyen KA, Haggstrom DA, Ofner S, et al. Medication use among veterans across health care systems. Appl Clin Inform. 2017;26(1):235-249. https://doi.org/10.4338/ACI-2016-10-RA-0184.
5. Nayar P, Apenteng B, Yu F, Woodbridge P, Fetrick A. Rural veterans’ perspectives of dual care. J Commun Health. 2013;38(1):70-77. https://doi.org/10.1007/s10900-012-9583-7.
6. West AN, Charlton ME. Insured veterans’ use of VA and Non-VA health care in a rural state. J Rural Health. 2016;32(4):387-396. https://doi.org/10.1111/jrh.12196.
7. Gellad WF. The veterans choice act and dual health system use. J Gen Intern Med. 2016;31(2):153-154. https://doi.org/10.1007/s11606-015-3492-2.
8. Axon RN, Gebregziabher M, Everett CJ, Heidenreich P, Hunt KJ. Dual health care system use is associated with higher rates of hospitalization and hospital readmission among veterans with heart failure. Am Heart J. 2016;174:157-163. https://doi.org/10.1016/j.ahj.2015.09.023.
9. Humensky J, Carretta H, de Groot K, et al. Service utilization of veterans dually eligible for VA and medicare fee-for-service: 1999–2004. Medicare Medicaid Res Rev. 2012;2(3). https://doi.org/10.5600/mmrr.002.03.A06.
10. West AN, Charlton ME, Vaughan-Sarrazin M. Dual use of VA and non-VA hospitals by veterans with multiple hospitalizations. BMC Health Serv Res. 2015;15(1):431. https://doi.org/10.1186/s12913-015-1069-8.
11. Gaglioti A, Cozad A, Wittrock S, et al. Non-VA primary care providers’ perspectives on comanagement for rural veterans. Mil Med. 2014;179(11):1236-1243. https://doi.org/10.7205/MILMED-D-13-00342.
12. Department of Veterans Affairs. Expanded access to non-VA care through the veterans choice program. Final rule. Fed Regist. 2018;83(92):21893-21897.
13. Shuster B. Text-H.R.3236-114th Congress. Surface Transportation and Veterans Health Care Choice Improvement Act of 2015.. https://www.congress.gov/bill/114th-congress/house-bill/3236/text/pl. Accessed April 16, 2017; 2015-2016.
14. Veterans Affairs Mission Act. MISSIONAct.va.gov Available at. https://missionact.va.gov/. Accessed August 9, 2019.
15. Veterans Choice Program (VCP). Community care. https://www.va.gov/COMMUNITYCARE/programs/veterans/VCP/index.asp. Accessed August 9, 2019.
16. A Decade of Transitional Care Research with Vulnerable Elder… : journal of cardiovascular nursing. LWW. http://journals.lww.com/jcnjournal/Fulltext/2000/04000/A_Decade_of_Transitional_Care_Research_with.4.aspx. Accessed April 16, 2017.
17. Coleman EA, Boult C. Improving the quality of transitional care for persons with complex care needs. J Am Geriatr Soc. 2003;51(4):556-557. https://doi.org/10.1046/j.1532-5415.2003.51186.x.
18. Krichbaum K. GAPN postacute care coordination improves hip fracture outcomes. West J Nurs Res. 2007;29(5):523-544. https://doi.org/10.1177/0193945906293817.
19. Kripalani S, Jackson AT, Schnipper JL, Coleman EA. Promoting effective transitions of care at hospital discharge: a review of key issues for hospitalists. J Hosp Med. 2007;2(5):314-323. https://doi.org/10.1002/jhm.228.
20. Coleman EA, Mahoney E, Parry C. Assessing the quality of preparation for posthospital care from the patient’s perspective: the care transitions measure. Med Care. 2005;43(3):246-255. https://doi.org/10.1097/00005650-200503000-00007.
21. Naylor MD, Aiken LH, Kurtzman ET, Olds DM, Hirschman KB. The importance of transitional care in achieving health reform. Health Aff (Millwood). 2011;30(4):746-754. https://doi.org/10.1377/hlthaff.2011.0041.
22. Naylor MD, Brooten DA, Campbell RL, et al. Transitional care of older adults hospitalized with heart failure: a randomized, controlled trial. J Am Geriatr Soc. 2004;52(5):675-684. https://doi.org/10.1111/j.1532-5415.2004.52202.x.
23. Snow V, Beck D, Budnitz T, et al. Transitions of care consensus policy statement: American College of Physicians, Society of General Internal Medicine, society of hospital medicine, American Geriatrics Society, American College of Emergency Physicians, and Society for Academic Emergency Medicine. J Hosp Med. 2009;4(6):364-370. https://doi.org/10.1002/jhm.510.
24. Coleman EA. Falling through the cracks: challenges and opportunities for improving transitional care for persons with continuous complex care needs. J Am Geriatr Soc. 2003;51(4):549-555. https://doi.org/10.1046/j.1532-5415.2003.51185.x.
25. Feldstein AC, Glasgow RE. A practical, robust implementation and sustainability model (PRISM) for integrating research findings into practice. Jt Comm J Qual Patient Saf. 2008;34(4):228-243. https://doi.org/10.1016/S1553-7250(08)34030-6.
26. Schweikhart SA, Dembe AE. The applicability of lean and six sigma techniques to clinical and translational research. J Investig Med. 2009;57(7):748-755. https://doi.org/10.2310/JIM.0b013e3181b91b3a.
27. Burke RE, Kripalani S, Vasilevskis EE, Schnipper JL. Moving beyond readmission penalties: creating an ideal process to improve transitional care. J Hosp Med. 2013;8(2):102-109. https://doi.org/10.1002/jhm.1990.
28. Patient Aligned Care Team (PACT)-Patient Care. Services. https://www.patientcare.va.gov/primarycare/PACT.asp. Accessed November 20, 2017.
29. Morse JM. Critical analysis of strategies for determining rigor in qualitative inquiry. Qual Health Res. 2015;25(9):1212-1222. https://doi.org/10.1177/1049732315588501.
30. Hsieh H-F, Shannon SE. Three approaches to qualitative content analysis. Qual Health Res. 2005;15(9):1277-1288. https://doi.org/10.1177/1049732305276687.
31. Fereday J, Muir-Cochrane E. Demonstrating rigor using thematic analysis: a hybrid approach of inductive and deductive coding and theme development. Int J Qual Methods. 2006;5(1):80-92. https://doi.org/10.1177/160940690600500107.
32. Ayele RA, Lawrence E, McCreight M, et al. Study protocol: improving the transition of care from a non-network hospital back to the patient’s medical home. BMC Health Serv Res. 2017;17(1):123. https://doi.org/10.1186/s12913-017-2048-z.
33. Burke RE, Kripalani S, Vasilevskis EE, Schnipper JL. Moving beyond readmission penalties: creating an ideal process to improve transitional care. J Hosp Med. 2013;8(2):102-109. https://doi.org/10.1002/jhm.1990.
34. Qualitative research & evaluation methods. https://us.sagepub.com/en-us/nam/qualitative-research-evaluation-methods/book232962. Accessed April 16, 2017. SAGE Publications Inc.
35. Curry LA, Nembhard IM, Bradley EH. Qualitative and mixed methods provide unique contributions to outcomes research. Circulation. 2009;119(10):1442-1452. https://doi.org/10.1161/CIRCULATIONAHA.107.742775.
36. Creswell JW, Hanson WE, Clark Plano VL, Morales A. Qualitative research designs: selection and implementation. Couns Psychol. 2007;35(2):236-264. https://doi.org/10.1177/0011000006287390.
37. Carter N, Bryant-Lukosius D, DiCenso A, Blythe J, Neville AJ. The use of triangulation in qualitative research. Oncol Nurs Forum. 2014;41(5):545-547. https://doi.org/10.1188/14.ONF.545-547.
38. Krumholz HM. Post-hospital syndrome—an acquired, transient condition of generalized risk. N Engl J Med. 2013;368(2):100-102. https://doi.org/10.1056/NEJMp1212324.
39. Improving Care Transitions. Health affairs-health policy briefs. http://www.healthaffairs.org/healthpolicybriefs/brief.php?brief_id=76. Accessed August 13, 2016.
40. Bodenheimer T, Sinsky C. From triple to quadruple aim: care of the patient requires care of the provider. Ann Fam Med. 2014;12(6):573-576. https://doi.org/10.1370/afm.1713.
41. Burke RE, Kelley L, Gunzburger E, et al. Improving transitions of care for veterans transferred to tertiary VA medical centers. Am J Med Qual. 2018;33(2):147-153. https://doi.org/10.1177/1062860617715508.
42. Capp R, Misky GJ, Lindrooth RC, et al. Coordination program reduced acute care use and increased primary care visits among frequent emergency care users. Health Aff (Millwood). 2017;36(10):1705-1711. https://doi.org/10.1377/hlthaff.2017.0612.
43. Kind AJH, Brenny-Fitzpatrick M, Leahy-Gross K, et al. Harnessing protocolized adaptation in dissemination: successful implementation and sustainment of the veterans affairs coordinated-transitional care program in a non-veterans affairs hospital. J Am Geriatr Soc. 2016;64(2):409-416. https://doi.org/10.1111/jgs.13935.
44. Kind AJH, Jensen L, Barczi S, et al. Low-cost transitional care with nurse managers making mostly phone contact With patients cut rehospitalization at a VA Hospital. Health Aff. 2012;31(12):2659-2668. https://doi.org/10.1377/hlthaff.2012.0366.
45. Reese RL, Clement SA, Syeda S, et al. Coordinated-transitional care for veterans with heart failure and chronic lung disease. J Am Geriatr Soc. 2019;67(7):1502-1507. https://doi.org/10.1111/jgs.15978.
As the VA moves toward increased utilization of non-VA care, it is crucial to understand and address the challenges of transitional care faced by dual-use veterans to provide high-quality care that improves healthcare outcomes.7,11,12 The VA implemented a shift in policy from the Veterans Access, Choice, and Accountability Act of 2014 (Public Law 113-146; “Choice Act”) to the VA Maintaining Internal Systems and Strengthening Integrated Outside Networks (MISSION) Act beginning June 6, 2019.13,14 Under the MISSION Act, veterans have more ways to access healthcare within the VA’s network and through approved non-VA medical providers in the community known as “community care providers.”15 This shift expanded the existing VA Choice Act of 2014, where the program allowed those veterans who are unable to schedule an appointment within 30 days of their preferred date or the clinically appropriate date, or on the basis of their place of residence, to elect to receive care from eligible non-VA healthcare entities or providers.14,15 These efforts to better serve veterans by increasing non-VA care might present added care coordination challenges for patients and their providers when they seek care in the VA.
High-quality transitional care prevents poor outcomes such as hospital readmissions.16-18 When communication and coordination across healthcare delivery systems are lacking, patients and their families often find themselves at risk for adverse events.19,20 Past research shows that patients have fewer adverse events when they receive comprehensive postdischarge care, including instructions on medications and self-care, symptom recognition and management, and reminders to attend follow-up appointments.17,21,22 Although researchers have identified the components of effective transitional care,23 barriers persist. The communication and collaboration needed to provide coordinated care across healthcare delivery systems are difficult due to the lack of standardized approaches between systems.24 Consequently, follow-up care may be delayed or missed altogether. To our knowledge, there is no published research identifying transitional care challenges for clinicians, staff, and veterans in transitioning from non-VA hospitals to a VA primary care setting.
The objective of this quality assessment was to understand VA and non-VA hospital clinicians’ and staff as well as veterans’ perspectives of the barriers and facilitators to providing high-quality transitional care.
METHODS
Study Design
We conducted a qualitative assessment within the VA Eastern Colorado Health Care System, an urban tertiary medical center, as well as urban and rural non-VA hospitals used by veterans. Semi-structured interview guides informed by the practical robust implementation and sustainability (PRISM) model, the Lean approach, and the Ideal Transitions of Care Bridge were used.25-27 We explored the PRISM domains such as recipient’s characteristics, the interaction with the external environment, and the implementation and sustainability infrastructure to inform the design and implementation of the intervention.25 The Lean approach included methods to optimize processes by maximizing efficiency and minimizing waste.26 The Ideal Transitions of Care Bridge was used to identify the domains in transitions of care such as discharge planning, communication of information, and care coordination.27
Setting and Participants
We identified the top 10 non-VA hospitals serving the most urban and rural veterans in 2015 using VA administrative data. Purposive sampling was used to ensure that urban and rural non-VA hospitals and different roles within these hospitals were represented. VA clinicians and staff were selected from the Denver VA Medical Center, a tertiary hospital within the Eastern Colorado Health Care System and one VA Community-Based Outpatient Clinic (CBOC) that primarily serves rural veterans. The Denver VA Medical Center has three clinics staffed by Patient Aligned Care Teams (PACTs), a model built on the concept of Patient-Centered Medical Home.28 Hospital leadership were initially approached for permission to recruit their staff and to be involved as key informants, and all agreed. To ensure representativeness, diversity of roles was recruited, including PACT primary care physicians, nurses, and other staff members such as medical assistants and administrators. Veterans were approached for sampling if they were discharged from a non-VA hospital during June–September 2015 and used the VA for primary care. This was to ensure that they remembered the process they went through postdischarge at the time of the interview.
Data Collection and Analysis
The evaluation team members (RA, EL, and MM) conducted the interviews from November 2015 to July 2016. Clinicians, staff, and veterans were asked semi-structured questions about their experiences and their role in transitioning VA patients across systems (see Appendix for interview guides). Veterans were asked to describe their experience and satisfaction with the current postdischarge transition process. We stopped the interviews when we reached data saturation.29
Interviews were audio-recorded, transcribed verbatim, and validated (transcribed interviews were double-checked against recording) to ensure data quality and accuracy. Coding was guided by a conventional content analysis technique30, 31 using a deductive and inductive coding approach.31 The deductive coding approach was drawn from the Ideal Transitions of Care Bridge and PRISM domains. 32,33 Two evaluation team members (RA and EL) defined the initial code book by independently coding the first three interviews, worked to clarify the meanings of emergent codes, and came to a consensus when disagreements occurred. Next, a priori codes were added by team members to include the PRISM domains. These PRISM domains included the implementation and sustainability infrastructure, the external environment, the characteristics of intervention recipients, and the organizational and patient perspectives of an intervention.
Additional emergent codes were added to the code book and agreed upon by team members (RA, EL, and MM). Consistent with previously used methods, consensus building was achieved by identifying and resolving differences by discussing with team members (RA, EL, MM, CB, and RB).29 Codes were examined and organized into themes by team members.29,34-36 This process was continued until no new themes were identified. Results were reviewed by all evaluation team members to assess thoroughness and comprehensiveness.34,35 In addition, team members triangulated the findings with VA and non-VA participants to ensure validity and reduce researcher bias.29,37
RESULTS
We conducted a total of 70 interviews with 23 VA and 29 non-VA hospital clinicians and staff and 18 veterans (Table 1). Overall, we found that there was no standardized process for transitioning veterans across healthcare delivery systems. Participants reported that transitions were often inefficient when non-VA hospitals could not (1) identify patients as veterans and notify VA primary care of discharge; (2) transfer non-VA hospital medical records to VA primary care; (3) obtain follow-up care appointments with VA primary care; and (4) write VA formulary medications for veterans to fill at VA pharmacies. In addition, participants discussed about facilitators and suggestions to overcome these inefficiencies and improve transitional care (Table2). We mapped the identified barriers as well as the suggestions for improvement to the PRISM and the Ideal Transitions of Care Bridge domains (Table 3).
Unable to Identify Patients as Veterans and Notify VA Primary Care of Discharge
VA and non-VA participants reported difficulty in communicating about veterans’ hospitalizations and discharge follow-up needs across systems. Non-VA clinicians referenced difficulty in identifying patients as veterans to communicate with VA, except in instances where the VA is a payor, while VA providers described feeling largely uninformed of the veterans non-VA hospitalization. For non-VA clinicians, the lack of a systematic method for veteran identification often left them to inadvertently identify veteran status by asking about their primary care clinicians and insurance and even through an offhanded comment made by the veteran. If a veteran was identified, non-VA clinicians described being uncertain about the best way to notify VA primary care of the patient’s impending discharge. Veterans described instances of the non-VA hospital knowing their veteran status upon admission, but accounts varied on whether the non-VA hospital notified the VA primary care of their hospitalization (Table 2, Theme 1).
Unable to Transfer Non-VA Hospital Medical Records to VA Primary Care
VA clinicians discussed about the challenges associated with obtaining the veteran’s medical record from the non-VA hospitals, and when it was received, it was often incomplete information and significantly delayed. They described relying on the veteran’s description of the care received, which was not complete or accurate information needed to make clinical judgment or coordinate follow-up care. Non-VA clinicians mentioned about trying several methods for transferring the medical record to VA primary care, including discharge summary via electronic system and sometimes solely relying on patients to deliver discharge paperwork to their primary care clinicians. In instances where non-VA hospitals sent discharge paperwork to VA, there was no way for non-VA hospitals to verify whether the faxed electronic medical record was received by the VA hospital. Most of the veterans discussed receiving written postdischarge instructions to take to their VA primary care clinicians; however, they were unsure whether the VA primary care received their medical record or any other information from the non-VA hospital (Table 2, Theme 2).
Unable to Obtain Follow-Up Care Appointments with VA Primary Care
All participants described how difficult it was to obtain a follow-up appointment for veterans with VA primary care. This often resulted in delayed follow-up care. VA clinicians also shared that a non-VA hospitalization can be the impetus for a veteran to seek care at the VA for the very first time. Once eligibility is determined, the veteran is assigned a VA primary care clinician. This process may take up to six weeks, and in the meantime, the veteran is scheduled in VA urgent care for immediate postdischarge care. This lag in primary care assignment creates delayed and fragmented care (Table 2, Theme 3).
Non-VA clinicians, administrators, and staff also discussed the difficulties in scheduling follow-up care with VA primary care. Although discharge paperwork instructed patients to see their VA clinicians, there was no process in place for non-VA clinicians to confirm whether the follow-up care was received due to lack of bilateral communication. In addition, veterans discussed the inefficiencies in scheduling follow-up appointments with VA clinicians where attempts to follow-up with primary care clinicians took eight weeks or more. Several veterans described walking into the clinic without an appointment asking to be seen postdischarge or utilizing the VA emergency department for follow-up care after discharge from a non-VA hospital. Veterans admitted utilizing the VA emergency department for nonemergent reasons such as filling their prescriptions because they are unable to see a VA PCP in a timely manner (Table 2, Theme 3).
Unable to Write VA Formulary Medications for Veterans to Fill at VA Pharmacies
All participants described the difficulties in obtaining medications at VA pharmacies when prescribed by the non-VA hospital clinicians. VA clinicians often had to reassess, and rewrite prescriptions written by clinicians, causing delays. Moreover, rural VA clinicians described lack of VA pharmacies in their locations, where veterans had to mail order medications, causing further delays in needed medications. Non-VA clinicians echoed these frustrations. They noted that veterans were confused about their VA pharmacy benefits as well as the need for the non-VA clinicians to follow VA formulary guidelines. Veterans expressed that it was especially challenging to physically go to the VA pharmacy to pick up medications after discharge due to lack of transportation, limited VA pharmacy hours, and long wait times. Several veterans discussed paying for their prescriptions out of pocket even though they had VA pharmacy benefits because it was more convenient to use the non-VA pharmacy. In other instances, veterans discussed going to a VA emergency department and waiting for hours to have their non-VA clinician prescription rewritten by a VA clinician (Table 2, Theme 4).
Facilitators of the Current Transition Process
Several participants provided examples of when transitional care communication between systems occurred seamlessly. VA staff and veterans noted that the VA increased the availability of urgent care appointments, which allowed for timelier postacute care follow-up appointments. Non-VA hospital clinicians also noted the availability of additional appointment slots but stated that they did not learn about these additional appointments directly from the VA. Instead, they learned of these through medical residents caring for patients at both VA and non-VA hospitals. One VA CBOC designated two nurses to care for walk-in veterans for their postdischarge follow-up needs. Some VA participants also noted that the VA Call Center Nurses occasionally called veterans upon discharge to schedule a follow-up appointment and facilitated timely care.
Participants from a VA CBOC discussed being part of a Community Transitions Consortium aimed at identifying high-utilizing patients (veteran and nonveteran) and improving communication across systems. The consortium members discussed each facility’s transition-of-care process, described having access to local non-VA hospital medical records and a backline phone number at the non-VA hospitals to coordinate transitional care. This allowed the VA clinicians to learn about non-VA hospital processes and veteran needs.
Suggestions for Improving the Transitional Care Process
VA and non-VA clinicians suggested hiring a VA liaison, preferably with a clinical background to facilitate care coordination across healthcare systems. They recommended that this person work closely with VA primary care, strengthen the relationship with non-VA hospitals, and help veterans learn more about the transition-of-care processes. Topics discussed for veteran education included how to (1) access their primary care tea
Veterans agreed that improvements to the current process should include an efficient system for obtaining medications and the ability to schedule timely follow-up appointments. Furthermore, veterans wanted education about the VA transition-of-care process following a non-VA hospitalization, including payment and VA notification processes (Table 2, Theme 5).
DISCUSSION
Participants described the current transitional care process as inefficient with specific barriers that have negative consequences on patient care and clinician and staff work processes. They described difficulties in obtaining medications prescribed by non-VA clinicians from VA pharmacies, delays in follow-up appointments at the VA, and lack of bilateral communication between systems and medical record transfer. Participants also provided concrete suggestions to improving the current process, including a care coordinator with clinical background. These findings are important in the context of VA increasing veteran access to care in the community.
Despite an increasing emphasis on veteran access to non-VA care as a result of the VA strategic goals and several new programs,7,12,13 there has not been a close examination of the current transition-of-care process from non-VA hospitals to VA primary care. Several studies have shown that the period following a hospitalization is especially vulnerable and associated with adverse events such as readmission, high cost, and death.12,31,32 Our findings agree with previous research that identified medical record transfer across systems as one of the most challenging issues contributing to deficits in communication between care teams.33 In addition, our study brought into focus the significant challenges faced by veterans in obtaining medications post non-VA hospital discharge. Addressing these key barriers in transitional care will improve the quality, safety, and value of healthcare in the current transition process.38,39
Based on our findings, our participants’ concern in transitional care can be addressed in various ways. First, as veterans are increasingly receiving care in the community, identifying their veteran status early on in the non-VA hospital setting could help in improved, real time communication with the VA. This could be done by updating patient intake forms to ask patients whether they are veterans or not. Second, VA policy-level changes should work to provide veterans access to non-VA pharmacy benefits equivalent to the access patients are receiving for hospital, specialty, and outpatient care. Third, patient and provider satisfaction for dual-use veterans should be examined closely. Although participants expressed frustration with the overall transitions of care from non-VA hospitals to VA primary care setting, influence of this on the Quadruple Aim-improving patient outcomes, experience, and reducing clinician and staff burnout should be examined closely.40 Fourth, evidence-based interventions such as nurse-led transitional care programs that have proven helpful in reducing adverse outcomes in both VA and non-VA settings will be useful to implement.41-45 Such programs could be located in the VA, and a care coordinator role could help facilitate transitional care needs for veterans by working with multiple non-VA hospitals.
The limitations of this study are that the perspectives shared by these participants may not represent all VA and non-VA hospitals as well as veterans’ experiences with transition of care. In addition, the study was conducted in one state and the findings may not be applicable to other healthcare systems. However, our study highlighted the consistent challenges of receiving care across VA and other hospital systems. Two strengths of this study are that it was conducted by multidisciplinary research team members with expertise in qualitative research, clinical care, and implementation science and that we obtained convergent information from VA, non-VA, and veteran participants.
Our current transition-of-care process has several shortcomings. There was a clear agreement on barriers, facilitators, and suggestions for improving the current transitions-of-care process among VA and non-VA hospital participants, as well as from veterans who experienced transitions across different delivery systems. Transitioning veterans to VA primary care following a non-VA hospitalization is a crucial first step for improving care for veterans and reducing adverse outcomes such as avoidable hospital readmissions and death.
These results describe the inefficiencies experienced by patients, clinicians, and staff and their suggestions to alleviate these barriers for optimal continuum of care. To avoid frustration and inefficiencies, the increased emphasis of providing non-VA care for veterans should consider the challenges experienced in transitional care and the opportunities for increased coordination of care.
1. Borowsky SJ, Cowper DC. Dual use of VA and non-VA primary care. J Gen Intern Med. 1999;14(5):274-280. https://doi.org/10.1046/j.1525-1497.1999.00335.x.
2. Charlton ME, Mengeling MA, Schlichting JA, et al. Veteran use of health care systems in rural states. Comparing VA and Non-VA health care use among privately insured veterans under age 65. J Rural Health. 2016;32(4):407-417. https://doi.org/10.1111/jrh.12206.
3. Forster AJ, Murff HJ, Peterson JF, Gandhi TK, Bates DW. The incidence and severity of adverse events affecting patients after discharge from the hospital. Ann Intern Med. 2003;138(3):161. https://doi.org/10.7326/0003-4819-138-3-200302040-00007.
4. Nguyen KA, Haggstrom DA, Ofner S, et al. Medication use among veterans across health care systems. Appl Clin Inform. 2017;26(1):235-249. https://doi.org/10.4338/ACI-2016-10-RA-0184.
5. Nayar P, Apenteng B, Yu F, Woodbridge P, Fetrick A. Rural veterans’ perspectives of dual care. J Commun Health. 2013;38(1):70-77. https://doi.org/10.1007/s10900-012-9583-7.
6. West AN, Charlton ME. Insured veterans’ use of VA and Non-VA health care in a rural state. J Rural Health. 2016;32(4):387-396. https://doi.org/10.1111/jrh.12196.
7. Gellad WF. The veterans choice act and dual health system use. J Gen Intern Med. 2016;31(2):153-154. https://doi.org/10.1007/s11606-015-3492-2.
8. Axon RN, Gebregziabher M, Everett CJ, Heidenreich P, Hunt KJ. Dual health care system use is associated with higher rates of hospitalization and hospital readmission among veterans with heart failure. Am Heart J. 2016;174:157-163. https://doi.org/10.1016/j.ahj.2015.09.023.
9. Humensky J, Carretta H, de Groot K, et al. Service utilization of veterans dually eligible for VA and medicare fee-for-service: 1999–2004. Medicare Medicaid Res Rev. 2012;2(3). https://doi.org/10.5600/mmrr.002.03.A06.
10. West AN, Charlton ME, Vaughan-Sarrazin M. Dual use of VA and non-VA hospitals by veterans with multiple hospitalizations. BMC Health Serv Res. 2015;15(1):431. https://doi.org/10.1186/s12913-015-1069-8.
11. Gaglioti A, Cozad A, Wittrock S, et al. Non-VA primary care providers’ perspectives on comanagement for rural veterans. Mil Med. 2014;179(11):1236-1243. https://doi.org/10.7205/MILMED-D-13-00342.
12. Department of Veterans Affairs. Expanded access to non-VA care through the veterans choice program. Final rule. Fed Regist. 2018;83(92):21893-21897.
13. Shuster B. Text-H.R.3236-114th Congress. Surface Transportation and Veterans Health Care Choice Improvement Act of 2015.. https://www.congress.gov/bill/114th-congress/house-bill/3236/text/pl. Accessed April 16, 2017; 2015-2016.
14. Veterans Affairs Mission Act. MISSIONAct.va.gov Available at. https://missionact.va.gov/. Accessed August 9, 2019.
15. Veterans Choice Program (VCP). Community care. https://www.va.gov/COMMUNITYCARE/programs/veterans/VCP/index.asp. Accessed August 9, 2019.
16. A Decade of Transitional Care Research with Vulnerable Elder… : journal of cardiovascular nursing. LWW. http://journals.lww.com/jcnjournal/Fulltext/2000/04000/A_Decade_of_Transitional_Care_Research_with.4.aspx. Accessed April 16, 2017.
17. Coleman EA, Boult C. Improving the quality of transitional care for persons with complex care needs. J Am Geriatr Soc. 2003;51(4):556-557. https://doi.org/10.1046/j.1532-5415.2003.51186.x.
18. Krichbaum K. GAPN postacute care coordination improves hip fracture outcomes. West J Nurs Res. 2007;29(5):523-544. https://doi.org/10.1177/0193945906293817.
19. Kripalani S, Jackson AT, Schnipper JL, Coleman EA. Promoting effective transitions of care at hospital discharge: a review of key issues for hospitalists. J Hosp Med. 2007;2(5):314-323. https://doi.org/10.1002/jhm.228.
20. Coleman EA, Mahoney E, Parry C. Assessing the quality of preparation for posthospital care from the patient’s perspective: the care transitions measure. Med Care. 2005;43(3):246-255. https://doi.org/10.1097/00005650-200503000-00007.
21. Naylor MD, Aiken LH, Kurtzman ET, Olds DM, Hirschman KB. The importance of transitional care in achieving health reform. Health Aff (Millwood). 2011;30(4):746-754. https://doi.org/10.1377/hlthaff.2011.0041.
22. Naylor MD, Brooten DA, Campbell RL, et al. Transitional care of older adults hospitalized with heart failure: a randomized, controlled trial. J Am Geriatr Soc. 2004;52(5):675-684. https://doi.org/10.1111/j.1532-5415.2004.52202.x.
23. Snow V, Beck D, Budnitz T, et al. Transitions of care consensus policy statement: American College of Physicians, Society of General Internal Medicine, society of hospital medicine, American Geriatrics Society, American College of Emergency Physicians, and Society for Academic Emergency Medicine. J Hosp Med. 2009;4(6):364-370. https://doi.org/10.1002/jhm.510.
24. Coleman EA. Falling through the cracks: challenges and opportunities for improving transitional care for persons with continuous complex care needs. J Am Geriatr Soc. 2003;51(4):549-555. https://doi.org/10.1046/j.1532-5415.2003.51185.x.
25. Feldstein AC, Glasgow RE. A practical, robust implementation and sustainability model (PRISM) for integrating research findings into practice. Jt Comm J Qual Patient Saf. 2008;34(4):228-243. https://doi.org/10.1016/S1553-7250(08)34030-6.
26. Schweikhart SA, Dembe AE. The applicability of lean and six sigma techniques to clinical and translational research. J Investig Med. 2009;57(7):748-755. https://doi.org/10.2310/JIM.0b013e3181b91b3a.
27. Burke RE, Kripalani S, Vasilevskis EE, Schnipper JL. Moving beyond readmission penalties: creating an ideal process to improve transitional care. J Hosp Med. 2013;8(2):102-109. https://doi.org/10.1002/jhm.1990.
28. Patient Aligned Care Team (PACT)-Patient Care. Services. https://www.patientcare.va.gov/primarycare/PACT.asp. Accessed November 20, 2017.
29. Morse JM. Critical analysis of strategies for determining rigor in qualitative inquiry. Qual Health Res. 2015;25(9):1212-1222. https://doi.org/10.1177/1049732315588501.
30. Hsieh H-F, Shannon SE. Three approaches to qualitative content analysis. Qual Health Res. 2005;15(9):1277-1288. https://doi.org/10.1177/1049732305276687.
31. Fereday J, Muir-Cochrane E. Demonstrating rigor using thematic analysis: a hybrid approach of inductive and deductive coding and theme development. Int J Qual Methods. 2006;5(1):80-92. https://doi.org/10.1177/160940690600500107.
32. Ayele RA, Lawrence E, McCreight M, et al. Study protocol: improving the transition of care from a non-network hospital back to the patient’s medical home. BMC Health Serv Res. 2017;17(1):123. https://doi.org/10.1186/s12913-017-2048-z.
33. Burke RE, Kripalani S, Vasilevskis EE, Schnipper JL. Moving beyond readmission penalties: creating an ideal process to improve transitional care. J Hosp Med. 2013;8(2):102-109. https://doi.org/10.1002/jhm.1990.
34. Qualitative research & evaluation methods. https://us.sagepub.com/en-us/nam/qualitative-research-evaluation-methods/book232962. Accessed April 16, 2017. SAGE Publications Inc.
35. Curry LA, Nembhard IM, Bradley EH. Qualitative and mixed methods provide unique contributions to outcomes research. Circulation. 2009;119(10):1442-1452. https://doi.org/10.1161/CIRCULATIONAHA.107.742775.
36. Creswell JW, Hanson WE, Clark Plano VL, Morales A. Qualitative research designs: selection and implementation. Couns Psychol. 2007;35(2):236-264. https://doi.org/10.1177/0011000006287390.
37. Carter N, Bryant-Lukosius D, DiCenso A, Blythe J, Neville AJ. The use of triangulation in qualitative research. Oncol Nurs Forum. 2014;41(5):545-547. https://doi.org/10.1188/14.ONF.545-547.
38. Krumholz HM. Post-hospital syndrome—an acquired, transient condition of generalized risk. N Engl J Med. 2013;368(2):100-102. https://doi.org/10.1056/NEJMp1212324.
39. Improving Care Transitions. Health affairs-health policy briefs. http://www.healthaffairs.org/healthpolicybriefs/brief.php?brief_id=76. Accessed August 13, 2016.
40. Bodenheimer T, Sinsky C. From triple to quadruple aim: care of the patient requires care of the provider. Ann Fam Med. 2014;12(6):573-576. https://doi.org/10.1370/afm.1713.
41. Burke RE, Kelley L, Gunzburger E, et al. Improving transitions of care for veterans transferred to tertiary VA medical centers. Am J Med Qual. 2018;33(2):147-153. https://doi.org/10.1177/1062860617715508.
42. Capp R, Misky GJ, Lindrooth RC, et al. Coordination program reduced acute care use and increased primary care visits among frequent emergency care users. Health Aff (Millwood). 2017;36(10):1705-1711. https://doi.org/10.1377/hlthaff.2017.0612.
43. Kind AJH, Brenny-Fitzpatrick M, Leahy-Gross K, et al. Harnessing protocolized adaptation in dissemination: successful implementation and sustainment of the veterans affairs coordinated-transitional care program in a non-veterans affairs hospital. J Am Geriatr Soc. 2016;64(2):409-416. https://doi.org/10.1111/jgs.13935.
44. Kind AJH, Jensen L, Barczi S, et al. Low-cost transitional care with nurse managers making mostly phone contact With patients cut rehospitalization at a VA Hospital. Health Aff. 2012;31(12):2659-2668. https://doi.org/10.1377/hlthaff.2012.0366.
45. Reese RL, Clement SA, Syeda S, et al. Coordinated-transitional care for veterans with heart failure and chronic lung disease. J Am Geriatr Soc. 2019;67(7):1502-1507. https://doi.org/10.1111/jgs.15978.
© 2020 Society of Hospital Medicine
GRECC Connect: Geriatrics Telehealth to Empower Health Care Providers and Improve Management of Older Veterans in Rural Communities
Nearly 2.7 million veterans who rely on the Veterans Health Administration (VHA) for their health care live in rural communities.1 Of these, more than half are aged ≥ 65 years. Rural veterans have greater rates of service-related disability and chronic medical conditions than do their urban counterparts.1,2 Yet because of their rural location, they face unique challenges, including long travel times and distances to health care services, lack of public transportation options, and limited availability of specialized medical and social support services.
Compounding these geographic barriers is a more general lack of workforce infrastructure and a dearth of clinical health care providers (HCPs) skilled in geriatric medicine. The demand for geriatricians is projected to outpace supply and result in a national shortage of nearly 27 000 geriatricians by 2025.3 Moreover, the overwhelming majority (90%) of HCPs identifying as geriatric specialists reside in urban areas.4 This creates tremendous pressure on the health care system to provide remote care for older veterans contending with complex conditions, and ultimately these veterans may not receive the specialized care they need.
Telehealth modalities bridge these gaps by bringing health care to veterans in rural communities. They may also hold promise for strengthening community care in rural areas through workforce development and dissemination of educational resources. The VHA has been recognized as a leader in the field of telehealth since it began offering telehealth services to veterans in 19775-8 and served more than 677 000 Veterans via telehealth in fiscal year (FY) 2015.9 The VHA currently employs multiple modes of telehealth to increase veterans’ access to health care, including: (1) synchronous technology like clinical video telehealth (CVT), which provides live encounters between HCPs and patients using videoconferencing software; and (2) asynchronous technology, such as store-and-forward communication that offers remote transmission and clinical interpretation of veteran health data. The VHA has also strengthened its broad telehealth infrastructure by staffing VHA clinical sites with telehealth clinical technicians and providing telehealth hardware throughout.
The Department of Veterans Affairs (VA) Office of Geriatrics and Extended Care (GEC) and Office of Rural Health (ORH) established the Geriatric Research Education and Clinical Centers (GRECC) Connect project in 2014 to leverage the existing telehealth technologies at the VA to meet the health care needs of older veterans. GRECC Connect builds on the VHA network of geriatrics expertise in GRECCs by providing telehealth-based consultative support for rural primary care provider (PCP) teams, older veterans, and their families. This program profile describes this project’s mission, structure, and activities.
Program Overview
GRECC Connect leverages the clinical expertise and administrative infrastructure of participating GRECCs in order to reach clinicians and veterans in primarily rural communities.10 GRECCs are VA centers of excellence focused on aging and comprise a large network of interdisciplinary geriatrics expertise. All GRECCs have strong affiliations with local universities and are located in urban VA medical centers (VAMCs). GRECC Connect is based on a hub-and-spoke model in which urban GRECC hub sites are connected to community-based outpatient clinic (CBOC) and VAMC spokes that primarily serve veterans in other communities. CBOCs are stand-alone clinics that are geographically separate from a related VA medical center and provide outpatient primary care, mental health care services, and some specialty care services such as cardiology or neurology. They range in size from small, mainly telehealth clinics with 1 technician to large clinics with several specialty providers. Each GRECC hub site partners with an average of 6 CBOCs (range 3-16), each of which is an average distance of 92.8 miles from the related VA medical center (range 20-406 miles).
GRECC Connect was established under the umbrella of the VA Geriatric Scholars Program, which since 2008 integrates geriatrics into rural primary care practices through tailored education for continuing professional development.11 Through intensive courses in geriatrics and quality improvement methods and through participation in local quality improvement projects benefiting older veterans, the Geriatric Scholars Program trains rural PCPs so that they can more effectively and independently diagnose and manage common geriatric syndromes.12 The network of clinician scholars developed by the Geriatric Scholars Program, all rural frontline clinicians at VA clinics, has given the GRECC Connect project a well-prepared, geriatrics-trained workforce to act as project champions at rural CBOCs and VAMCs. The GRECC Connect project’s goals are to enhance access to geriatric specialty care among older veterans with complex medical problems, geriatric syndromes, and increased risk for institutionalization, and to provide geriatrics-focused educational support to rural HCP teams.
Geriatric Provider Consultations
The first overarching goal of the GRECC Connect project is to improve access to geriatrics specialty care by facilitating linkages between GRECC hub sites and the CBOCs and VAMCs that primarily serve veterans in rural communities. GRECC hub sites offer consultative support from geriatrics specialty team members (eg, geriatricians, nurse practitioners, pharmacists, gero- or neuropsychologists, registered nurses [RNs], and social workers) to rural PCP in their catchment area. This support is offered through a variety of telehealth modalities readily available in the VA (Table 1). These include CVT, in which a veteran located at a rural CBOC is seen using videoconferencing software by a geriatrics specialty provider who is located at a GRECC hub site. At some GRECC hub sites, CVT has also been used to conduct group visits between a GRECC provider at the hub site and several veterans who participate from a rural CBOC. Electronic consultations, or e-consults, involve a rural provider entering a clinical question in the VA Computerized Patient Record System. The question is then triaged, and a geriatrics provider at a GRECC responds, based on review of that veteran’s chart. At some GRECC hub sites, the e-consults are more extensive and may include telephone contact with the veteran or their caregiver.
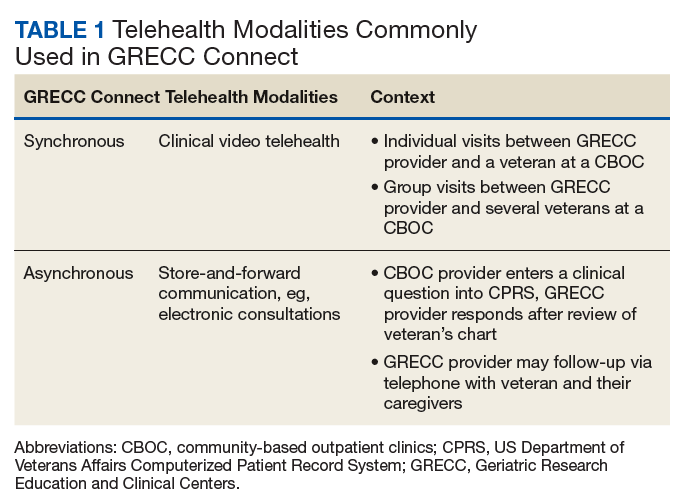
Consultations between GRECC-based teams and rural PCPs may cover any aspect of geriatrics care, ranging from broad concerns to subspecialty areas of geriatric medicine. For instance, general geriatrics consultation may address polypharmacy, during either care transitions or ongoing care. Consultation may also reflect the specific focus area of a particular GRECC, such as cognitive assessment (eg, Pittsburgh GRECC), management of osteoporosis to address falls (eg, Durham GRECC, Miami GRECC), and continence care (eg, Birmingham/Atlanta GRECC).13 Most consultations are initiated by a remote HCP who is seeking geriatrics expertise from the GRECC team.
Some GRECC hub sites, however, employ case finding strategies, or detailed chart reviews, in order to identify older veterans who may benefit from geriatrics consultation. For veterans identified through those mechanisms, the GRECC clinicians suggest that the rural HCP either request or allow an e-consult or evaluation via CVT for those veterans. The geriatric consultations may help identify additional care needs for older veterans and lead to recommendations, orders, or remote provision of a variety of other actions, including VA or non-VA services (eg, home-based primary care, home nursing service, respite service, social support services such as Meals on Wheels); neuropsychological testing; physical or occupational therapy; audiology or optometry referral; falls and fracture risk assessment and interventions to reduce falls (eg, home safety evaluation, physical therapy); osteoporosis risk assessments (eg, densitometry, recommendations for pharmacologic therapy) to reduce the risk of injury or nontraumatic fractures from falls; palliative care for incontinence and hospice; and counseling on geriatric issues such as dementia caregiving, advanced directives, and driving cessation.
More recently, the Miami GRECC has begun evaluating rural veterans at risk for hypoglycemia, providing patient education and counseling about hypoglycemia, and making recommendations to the veterans’ primary care teams.14 Consultations may also lead to the appropriate use or discontinuation of medications, related to polypharmacy. GRECC-based teams, for example, have helped rural HCPs modify medication doses, start appropriate medications for dementia and depression, and identify and stop potentially inappropriate medications (eg, those that increase fall risk or that have significant anticholinergic properties).15
GRECC Connect Geriatric Case Conference Series
The second overarching goal of the GRECC Connect project is to provide geriatrics-focused educational support to equip PCPs to better serve their aging veteran patients. This is achieved through twice-monthly, case-based conferences supported by the VA Employee Education System (EES) and delivered through a webinar interface. Case conferences are targeted to members of the health care team who may provide care for rural older adults, including physicians, nurse practitioners, physician assistants, RNs, psychologists, social workers, physical and occupational therapists, and pharmacists. The format of these sessions includes a clinical case presentation, a didactic portion to enhance knowledge of participants, and an open question/answer period. The conferences focus on discussions of challenging clinical cases, addressing common problems (eg, driving concerns), and the assessment/management of geriatric syndromes (eg, cognitive decline, falls, polypharmacy). These conferences aim to improve the knowledge and skills of rural clinical teams in taking care of older veterans and to disseminate best practices in geriatric medicine, using case discussions to highlight practical applications of practices to clinical care. Recent GRECC Connect geriatric case conferences are listed in Table 2 and are recorded and archived to ensure that busy clinicians may access these trainings at the time of their choosing. These materials are catalogued and archived on the EES server.
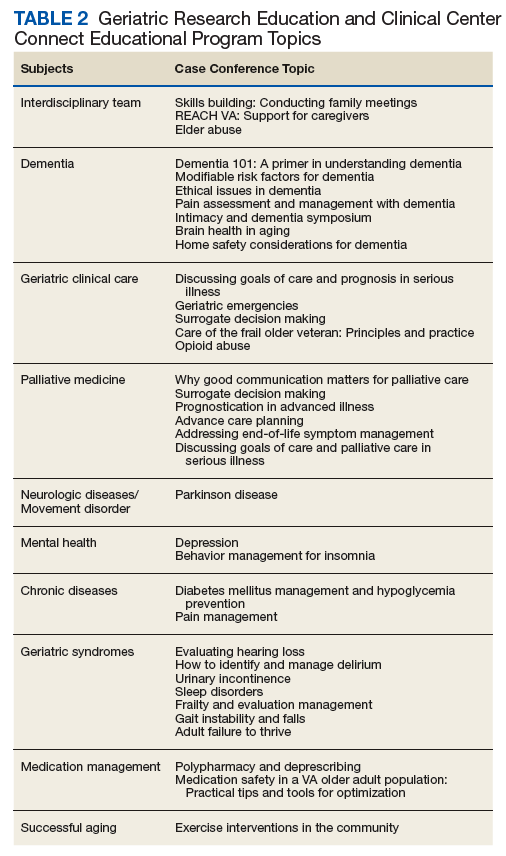
Early Experience
GRECC Connect tracks on an annual basis the number of unique veterans served, number of participating GRECC hub sites and CBOCs, mileage from veteran homes to teleconsultation sites, and number of clinicians and staff engaged in GRECC Connect education programs.16 Since its inception in 2014, the GRECC Connect project has provided direct clinical support to more than 4000 unique veterans (eFigure), of whom half were seen for a cognition-related issue. Consultations were made on behalf of 1,622 veterans in FY 2018, of whom 60% were from rural or highly rural communities and 56.8% were served by CVT visits. The number of GRECC hub sites has increased from 4 in FY 2014 to 12 (of 20 total GRECCs) in FY 2018. The locations of current GRECC hub sites can be found on the Geriatric Scholars website: www.gerischolars.org. Through this expansion, GRECC Connect provides geriatric consultative and educational support to > 70 rural VA clinics in 10 of the 18 Veterans Integrated Service Networks (VISNs).
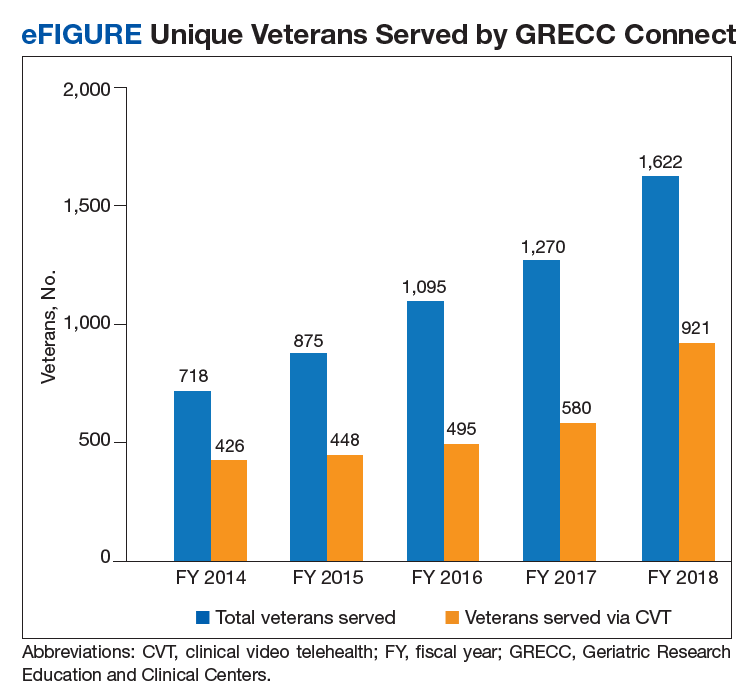
To assess the reduction in commute times from teleconsultation, we calculated the difference between the mileage from veteran homes to teleconsultation sites (ie, rural clinics) and the mileage from veteran homes to VAMCs where geriatric teams are located. We estimate that the 1622 veterans served in FY 2018 saved a total of 179 121 miles in travel through GRECC Connect. Veterans traveled 106 fewer miles and on average saved $58 in out-of-pocket savings (based on US General Services Administration 2018 standard mileage reimbursement rate of $0.545 per mile). However, many of the veterans have reported anecdotally that the reduction in mileage traveled was less important than the elimination of stress involved in urban navigating, driving, and parking.
More difficult to measure, GRECC Connect seeks to enhance veteran safety by reducing driving distances for older veterans whose driving abilities may be influenced by many age-related health conditions (eg, visual changes, cognitive impairment). For these and other reasons, surveyed veterans overwhelmingly reported that they would be likely to recommend teleconsultation services to other veterans, and that they preferred telemedicine consultation over traveling long distances for in-person clinical consultations.16
Since its inception in 2014, GRECC Connect has provided case-based education to a total of 2335 unique clinicians and staff. Participants have included physicians, nurse practitioners, RNs, social workers, and pharmacists. This distribution reflects the interdisciplinary nature of geriatric care. A plurality of participants (39%) were RNs. Surveyed participants in the GRECC Connect geriatrics case conference series report high overall satisfaction with the learning activity, acquisition of new knowledge and skills, and intention to apply new knowledge and skills to improve job performance.10 In addition, participants agreed that the online training platform was effective for learning and that they would recommend the education series to other HCPs.10,16
Discussion
During its rapid 4-year scale up, GRECC Connect has established a national network and enhanced relationships between GRECC-based clinical teams and rural provider teams. In doing so, the program has begun to improve rural veterans’ access to geriatric specialty care. By providing continuing education to members of the interprofessional health care team, GRECC Connect develops rural providers’ clinical competency and promotes geriatrics skills and expertise. These activities are synergistic: Clinical support enables rural HCPs to become better at managing their own patients, while formal educational activities highlight the availability of specialized consultation available through GRECC Connect. Through ongoing creation of handbooks, workflows, and data analytic strategies, GRECC Connect aims to disseminate this model to additional GRECCs as well as other GEC programs to promote “anywhere to anywhere” VA health care.17
Barriers and Facilitators
GRECC Connect has had notable implementation challenges while new consultation relationships have been forged in order to provide geriatric expertise to rural areas where it is not otherwise available. Many GRECCs had already established connections with rural CBOCs. Among GRECCs that had previously established consultative relationships with rural clinics, the use of telehealth modalities to provide geriatric clinical resources has been a natural extension of these partnerships. GRECCs that lacked these connections, however, often had to obtain buy-in from multiple stakeholders, including rural HCPs and teams, administrative leads, and local telehealth coordinators, and they required VISN- and facility-level leadership to encourage and sustain rural team participation.
Depending on the distance of the GRECC hub-site to the CBOC, efforts to establish and sustain partnerships may require multiple contacts over time (eg, via face-to-face meetings, one-on-one outreach) and large-scale advertising of consultative services. Continuous engagement with CBOC-based teams also involves development of case finding strategies (eg, hospital discharge information, diagnoses, clinical criteria) to better identify veterans who may benefit from GRECC Connect consultation. Owing to the heterogeneity of technological resources, space, scheduling capacity, and staffing at CBOCs, GRECC sites continue to have variable engagement with their CBOC partners.
The inclusion of GRECC Connect within the Geriatric Scholars Program helps ensure that clinician scholars can serve as project champions at their respective rural sites. Rural HCPs with full-time clinical duties initially had difficulty carving out time to participate in GRECC Connect’s case-based conferences. However, the webinar platform has improved and sustained provider participation, and enduring recordings of the presentations allow clinicians to participate in the conferences at their convenience. Finally, the project experienced delays in taking certain administrative steps and hiring staff needed to support the establishment of telehealth modalities—even within a single health care system like the VA, each medical center and regional system has unique policies that complicate how telehealth modalities can be set up.
Conclusion and Future Directions
The GRECC Connect project aims to establish and support meaningful partnerships between urban geriatric specialists and rural HCPs to facilitate veterans’ increased access to geriatric specialty care. VA ORH has recognized it as a Rural Promising Practice, and GRECC Connect is currently being disseminated through an enterprise-wide initiative. Early evidence demonstrates that over 4 years, the expansion of GRECC Connect has helped meet critical aims of improving provider confidence and skills in geriatric management, and of increasing direct service provision. We have also used nationwide education platforms (eg, VA EES) to deliver geriatrics-focused education to health care teams.
Older rural veterans and their caregivers may benefit from this program through decreased travel-associated burden and report high satisfaction with these programs. Through a recently established collaboration with the GEC Data Analysis Center, we will use national data to refine our ability to identify at-risk, older rural veterans and to better evaluate their service needs and the GRECC Connect clinical impact. Because the VA is rapidly expanding use of telehealth and other virtual and digital methods to increase access to care, continued investments in telehealth are central to the VA 5-year strategic plan.18 In this spirit, GRECC Connect will continue to expand its program offerings and to leverage telehealth technologies to meet the needs of older veterans.
Acknowledgments
The authors wish to acknowledge Lisa Tenover, MD, PhD, (Palo Alto GRECC) for her contributions to this manuscript; the VA Rural Health Resource Center–Western Region; and GRECC Connect team members for their tireless work to ensure this project’s success. The GRECC Teams include Atlanta/Birmingham (Julia [Annette] Tedford, RN; Marquitta Cox, LMSW; Lisa Welch, LMSW; Mark Phillips; Lanie Walters, PharmD; Kroshona Tabb, PhD; Robert Langford, and Jason [Thomas] Sanders, HT, TCT); Bronx/NY Harbor (Ab Brody, RN; PhD, GNP-BC; Nick Koufacos, LMSW; and Shatice Jones); Canandaigua (Gary Kochersberger, MD; Suzanne Gillespie, MD; Gary Warner, PhD; Christie Hylwa, RPh CCP; Sharon Fell, LMSW; and Dorian Savino, MPA); Durham (Mamata Yanamadala, MBBS; Christy Knight, LCSW, MSW; and Julie Vognsen); Eastern Colorado (Larry Bourg, MD; Skotti Church, MD; Morgan Elmore, DO; Stephanie Hartz, LCSW; Carolyn Horney, MD; Steven Huart, AuD; Kathryn Nearing, PhD; Elizabeth O’Brien, PharmD; Laurence Robbins, MD; Robert Schwartz, MD; Karen Shea, MD; and Joleen Sussman, PhD); Little Rock (Prasad Padala, MD; and Tanya Taylor, RN); Madison (Ryan Bartkus, MD; Timothy Howell, MD; Lindsay Clark, PhD; Lauren Welch, PharmD, BCGP; Ellen Wanninger, MSW, CAPSW; Stacie Monson, RN, BSN; and Teresa Swader, MSW, LCSW); Miami (Carlos Gomez Orozo); New England (Malissa Kraft, PsyD); Palo Alto (Terri Huh, PhD, ABPP; Philip Choe, DO; Dawna Dougherty, LCSW; Ashley Scales, MPH); Pittsburgh (Stacey Shaffer, MD; Carol Dolbee, CRNP; Nancy Kovell, LCSW; Paul Bulgarelli, DO; Lauren Jost, PsyD; and Marcia Homer, RN-BC); and San Antonio (Becky Powers, MD; Che Kelly, RN, BSN; Cynthia Stewart, LCSW; Rebecca Rottman-Sagebiel, PharmD, BCPS, CGP; Melody Moris; Daniel MacCarthy; and Chen-pin Wang, PhD).
1. US Department of Veterans Affairs. Office of Rural Health Annual report: Thrive 2016. https://www.ruralhealth.va.gov/docs/ORH2016Thrive508_FINAL.pdf. Accessed September 10, 2019.
2. Holder KA. Veterans in Rural America: 2011–2015. US Census Bureau: Washington, DC; 2016. American Community Survey Reports, ACS-36.
3. US Department of Health and Human Services, Health Resources and Services Administration, Bureau of Health Workforce, National Center for Health Workforce Analysis.2017. National and regional projections of supply and demand for geriatricians: 2013-2025. https://bhw.hrsa.gov/sites/default/files/bhw/health-workforce-analysis/research/projections/GeriatricsReport51817.pdf. Published April 2017. Accessed September 10, 2019.
4. Peterson L, Bazemore A, Bragg E, Xierali I, Warshaw GA. Rural–urban distribution of the U.S. geriatrics physician workforce. J Am Geriatr Soc. 2011;59(4):699-703.
5. Lindeman D. Interview: lessons from a leader in telehealth diffusion: a conversation with Adam Darkins of the Veterans Health Administration. Ageing Int. 2010;36(1):146-154.
6. Darkins A, Foster L, Anderson C, Goldschmidt L, Selvin G. The design, implementation, and operational management of a comprehensive quality management program to support national telehealth networks. Telemed J E Health. 2013;19(7):557-564.
7. US Department of Veterans Affairs. Clinical video telehealth into the home (CVTHM)toolkit for providers. https://www.mirecc.va.gov/visn16//docs/CVTHM_Toolkit.pdf. Accessed September 10, 2019.
8. Darkins A. Telehealth services in the United States Department of Veterans Affairs (VA). https://myvitalz.com/wp-content/uploads/2016/07/Telehealth-Services-in-the-United-States.pdf. Published July 2016. Accessed September 10, 2019.
9. US Department of Veterans Affairs. VA announces telemental health clinical resource centers during telemedicine association gathering [press release]. https://www.va.gov/opa/pressrel/includes/viewPDF.cfm?id=2789. Published May 16, 2016. Accessed September 10, 2019.
10. Hung WW, Rossi M, Thielke S, et al. A multisite geriatric education program for rural providers in the Veteran Health Care System (GRECC Connect). Gerontol Geriatr Educ. 2014;35(1):23-40.
11. Kramer BJ. The VA geriatric scholars program. Fed Pract. 2015;32(5):46-48.
12. Kramer BJ, Creekmur B, Howe JL, et al. Veterans Affairs Geriatric Scholars Program: enhancing existing primary care clinician skills in caring for older veterans. J Am Geriatr Soc. 2016;64(11):2343-2348.
13. Powers BB, Homer MC, Morone N, Edmonds N, Rossi MI. Creation of an interprofessional teledementia clinic for rural veterans: preliminary data. J Am Geriatr Soc. 2017;65(5):1092-1099.
14. Wright SM, Hedin SC, McConnell M, et al. Using shared decision-making to address possible overtreatment in patients at high risk for hypoglycemia: the Veterans Health Administration’s Choosing Wisely Hypoglycemia Safety Initiative. Clin Diabetes. 2018;36(2):120-127.
15. Chang W, Homer M, Rossi MI. Use of clinical video telehealth as a tool for optimizing medications for rural older veterans with dementia. Geriatrics (Basel). 2018;3(3):pii E44.
16. US Department of Veterans Affairs, Office of Rural Health. Rural promising practice issue brief: GRECC Connect Project: connecting rural providers with geriatric specialists through telemedicine. https://www.ruralhealth.va.gov/docs/promise/2017_02_01_Promising%20Practice_GRECC_Issue%20Brief.pdf. Published February 2017. Accessed September 10, 2019.
17. US Department of Veterans Affairs, Office of Public and Intergovernmental Affairs. VA expands telehealth by allowing health care providers to treat patients across state lines [press release]. https://www.va.gov/opa/pressrel/pressrelease.cfm?id=4054. Published May 11, 2018. Accessed September 10, 2019.
18. US Department of Veterans Affairs. Department of Veterans Affairs FY 2018 – 2024 strategic plan. https://www.va.gov/oei/docs/VA2018-2024strategicPlan.pdf. Updated May 31, 2019. Accessed September 10, 2019.
Nearly 2.7 million veterans who rely on the Veterans Health Administration (VHA) for their health care live in rural communities.1 Of these, more than half are aged ≥ 65 years. Rural veterans have greater rates of service-related disability and chronic medical conditions than do their urban counterparts.1,2 Yet because of their rural location, they face unique challenges, including long travel times and distances to health care services, lack of public transportation options, and limited availability of specialized medical and social support services.
Compounding these geographic barriers is a more general lack of workforce infrastructure and a dearth of clinical health care providers (HCPs) skilled in geriatric medicine. The demand for geriatricians is projected to outpace supply and result in a national shortage of nearly 27 000 geriatricians by 2025.3 Moreover, the overwhelming majority (90%) of HCPs identifying as geriatric specialists reside in urban areas.4 This creates tremendous pressure on the health care system to provide remote care for older veterans contending with complex conditions, and ultimately these veterans may not receive the specialized care they need.
Telehealth modalities bridge these gaps by bringing health care to veterans in rural communities. They may also hold promise for strengthening community care in rural areas through workforce development and dissemination of educational resources. The VHA has been recognized as a leader in the field of telehealth since it began offering telehealth services to veterans in 19775-8 and served more than 677 000 Veterans via telehealth in fiscal year (FY) 2015.9 The VHA currently employs multiple modes of telehealth to increase veterans’ access to health care, including: (1) synchronous technology like clinical video telehealth (CVT), which provides live encounters between HCPs and patients using videoconferencing software; and (2) asynchronous technology, such as store-and-forward communication that offers remote transmission and clinical interpretation of veteran health data. The VHA has also strengthened its broad telehealth infrastructure by staffing VHA clinical sites with telehealth clinical technicians and providing telehealth hardware throughout.
The Department of Veterans Affairs (VA) Office of Geriatrics and Extended Care (GEC) and Office of Rural Health (ORH) established the Geriatric Research Education and Clinical Centers (GRECC) Connect project in 2014 to leverage the existing telehealth technologies at the VA to meet the health care needs of older veterans. GRECC Connect builds on the VHA network of geriatrics expertise in GRECCs by providing telehealth-based consultative support for rural primary care provider (PCP) teams, older veterans, and their families. This program profile describes this project’s mission, structure, and activities.
Program Overview
GRECC Connect leverages the clinical expertise and administrative infrastructure of participating GRECCs in order to reach clinicians and veterans in primarily rural communities.10 GRECCs are VA centers of excellence focused on aging and comprise a large network of interdisciplinary geriatrics expertise. All GRECCs have strong affiliations with local universities and are located in urban VA medical centers (VAMCs). GRECC Connect is based on a hub-and-spoke model in which urban GRECC hub sites are connected to community-based outpatient clinic (CBOC) and VAMC spokes that primarily serve veterans in other communities. CBOCs are stand-alone clinics that are geographically separate from a related VA medical center and provide outpatient primary care, mental health care services, and some specialty care services such as cardiology or neurology. They range in size from small, mainly telehealth clinics with 1 technician to large clinics with several specialty providers. Each GRECC hub site partners with an average of 6 CBOCs (range 3-16), each of which is an average distance of 92.8 miles from the related VA medical center (range 20-406 miles).
GRECC Connect was established under the umbrella of the VA Geriatric Scholars Program, which since 2008 integrates geriatrics into rural primary care practices through tailored education for continuing professional development.11 Through intensive courses in geriatrics and quality improvement methods and through participation in local quality improvement projects benefiting older veterans, the Geriatric Scholars Program trains rural PCPs so that they can more effectively and independently diagnose and manage common geriatric syndromes.12 The network of clinician scholars developed by the Geriatric Scholars Program, all rural frontline clinicians at VA clinics, has given the GRECC Connect project a well-prepared, geriatrics-trained workforce to act as project champions at rural CBOCs and VAMCs. The GRECC Connect project’s goals are to enhance access to geriatric specialty care among older veterans with complex medical problems, geriatric syndromes, and increased risk for institutionalization, and to provide geriatrics-focused educational support to rural HCP teams.
Geriatric Provider Consultations
The first overarching goal of the GRECC Connect project is to improve access to geriatrics specialty care by facilitating linkages between GRECC hub sites and the CBOCs and VAMCs that primarily serve veterans in rural communities. GRECC hub sites offer consultative support from geriatrics specialty team members (eg, geriatricians, nurse practitioners, pharmacists, gero- or neuropsychologists, registered nurses [RNs], and social workers) to rural PCP in their catchment area. This support is offered through a variety of telehealth modalities readily available in the VA (Table 1). These include CVT, in which a veteran located at a rural CBOC is seen using videoconferencing software by a geriatrics specialty provider who is located at a GRECC hub site. At some GRECC hub sites, CVT has also been used to conduct group visits between a GRECC provider at the hub site and several veterans who participate from a rural CBOC. Electronic consultations, or e-consults, involve a rural provider entering a clinical question in the VA Computerized Patient Record System. The question is then triaged, and a geriatrics provider at a GRECC responds, based on review of that veteran’s chart. At some GRECC hub sites, the e-consults are more extensive and may include telephone contact with the veteran or their caregiver.
Consultations between GRECC-based teams and rural PCPs may cover any aspect of geriatrics care, ranging from broad concerns to subspecialty areas of geriatric medicine. For instance, general geriatrics consultation may address polypharmacy, during either care transitions or ongoing care. Consultation may also reflect the specific focus area of a particular GRECC, such as cognitive assessment (eg, Pittsburgh GRECC), management of osteoporosis to address falls (eg, Durham GRECC, Miami GRECC), and continence care (eg, Birmingham/Atlanta GRECC).13 Most consultations are initiated by a remote HCP who is seeking geriatrics expertise from the GRECC team.
Some GRECC hub sites, however, employ case finding strategies, or detailed chart reviews, in order to identify older veterans who may benefit from geriatrics consultation. For veterans identified through those mechanisms, the GRECC clinicians suggest that the rural HCP either request or allow an e-consult or evaluation via CVT for those veterans. The geriatric consultations may help identify additional care needs for older veterans and lead to recommendations, orders, or remote provision of a variety of other actions, including VA or non-VA services (eg, home-based primary care, home nursing service, respite service, social support services such as Meals on Wheels); neuropsychological testing; physical or occupational therapy; audiology or optometry referral; falls and fracture risk assessment and interventions to reduce falls (eg, home safety evaluation, physical therapy); osteoporosis risk assessments (eg, densitometry, recommendations for pharmacologic therapy) to reduce the risk of injury or nontraumatic fractures from falls; palliative care for incontinence and hospice; and counseling on geriatric issues such as dementia caregiving, advanced directives, and driving cessation.
More recently, the Miami GRECC has begun evaluating rural veterans at risk for hypoglycemia, providing patient education and counseling about hypoglycemia, and making recommendations to the veterans’ primary care teams.14 Consultations may also lead to the appropriate use or discontinuation of medications, related to polypharmacy. GRECC-based teams, for example, have helped rural HCPs modify medication doses, start appropriate medications for dementia and depression, and identify and stop potentially inappropriate medications (eg, those that increase fall risk or that have significant anticholinergic properties).15
GRECC Connect Geriatric Case Conference Series
The second overarching goal of the GRECC Connect project is to provide geriatrics-focused educational support to equip PCPs to better serve their aging veteran patients. This is achieved through twice-monthly, case-based conferences supported by the VA Employee Education System (EES) and delivered through a webinar interface. Case conferences are targeted to members of the health care team who may provide care for rural older adults, including physicians, nurse practitioners, physician assistants, RNs, psychologists, social workers, physical and occupational therapists, and pharmacists. The format of these sessions includes a clinical case presentation, a didactic portion to enhance knowledge of participants, and an open question/answer period. The conferences focus on discussions of challenging clinical cases, addressing common problems (eg, driving concerns), and the assessment/management of geriatric syndromes (eg, cognitive decline, falls, polypharmacy). These conferences aim to improve the knowledge and skills of rural clinical teams in taking care of older veterans and to disseminate best practices in geriatric medicine, using case discussions to highlight practical applications of practices to clinical care. Recent GRECC Connect geriatric case conferences are listed in Table 2 and are recorded and archived to ensure that busy clinicians may access these trainings at the time of their choosing. These materials are catalogued and archived on the EES server.
Early Experience
GRECC Connect tracks on an annual basis the number of unique veterans served, number of participating GRECC hub sites and CBOCs, mileage from veteran homes to teleconsultation sites, and number of clinicians and staff engaged in GRECC Connect education programs.16 Since its inception in 2014, the GRECC Connect project has provided direct clinical support to more than 4000 unique veterans (eFigure), of whom half were seen for a cognition-related issue. Consultations were made on behalf of 1,622 veterans in FY 2018, of whom 60% were from rural or highly rural communities and 56.8% were served by CVT visits. The number of GRECC hub sites has increased from 4 in FY 2014 to 12 (of 20 total GRECCs) in FY 2018. The locations of current GRECC hub sites can be found on the Geriatric Scholars website: www.gerischolars.org. Through this expansion, GRECC Connect provides geriatric consultative and educational support to > 70 rural VA clinics in 10 of the 18 Veterans Integrated Service Networks (VISNs).
To assess the reduction in commute times from teleconsultation, we calculated the difference between the mileage from veteran homes to teleconsultation sites (ie, rural clinics) and the mileage from veteran homes to VAMCs where geriatric teams are located. We estimate that the 1622 veterans served in FY 2018 saved a total of 179 121 miles in travel through GRECC Connect. Veterans traveled 106 fewer miles and on average saved $58 in out-of-pocket savings (based on US General Services Administration 2018 standard mileage reimbursement rate of $0.545 per mile). However, many of the veterans have reported anecdotally that the reduction in mileage traveled was less important than the elimination of stress involved in urban navigating, driving, and parking.
More difficult to measure, GRECC Connect seeks to enhance veteran safety by reducing driving distances for older veterans whose driving abilities may be influenced by many age-related health conditions (eg, visual changes, cognitive impairment). For these and other reasons, surveyed veterans overwhelmingly reported that they would be likely to recommend teleconsultation services to other veterans, and that they preferred telemedicine consultation over traveling long distances for in-person clinical consultations.16
Since its inception in 2014, GRECC Connect has provided case-based education to a total of 2335 unique clinicians and staff. Participants have included physicians, nurse practitioners, RNs, social workers, and pharmacists. This distribution reflects the interdisciplinary nature of geriatric care. A plurality of participants (39%) were RNs. Surveyed participants in the GRECC Connect geriatrics case conference series report high overall satisfaction with the learning activity, acquisition of new knowledge and skills, and intention to apply new knowledge and skills to improve job performance.10 In addition, participants agreed that the online training platform was effective for learning and that they would recommend the education series to other HCPs.10,16
Discussion
During its rapid 4-year scale up, GRECC Connect has established a national network and enhanced relationships between GRECC-based clinical teams and rural provider teams. In doing so, the program has begun to improve rural veterans’ access to geriatric specialty care. By providing continuing education to members of the interprofessional health care team, GRECC Connect develops rural providers’ clinical competency and promotes geriatrics skills and expertise. These activities are synergistic: Clinical support enables rural HCPs to become better at managing their own patients, while formal educational activities highlight the availability of specialized consultation available through GRECC Connect. Through ongoing creation of handbooks, workflows, and data analytic strategies, GRECC Connect aims to disseminate this model to additional GRECCs as well as other GEC programs to promote “anywhere to anywhere” VA health care.17
Barriers and Facilitators
GRECC Connect has had notable implementation challenges while new consultation relationships have been forged in order to provide geriatric expertise to rural areas where it is not otherwise available. Many GRECCs had already established connections with rural CBOCs. Among GRECCs that had previously established consultative relationships with rural clinics, the use of telehealth modalities to provide geriatric clinical resources has been a natural extension of these partnerships. GRECCs that lacked these connections, however, often had to obtain buy-in from multiple stakeholders, including rural HCPs and teams, administrative leads, and local telehealth coordinators, and they required VISN- and facility-level leadership to encourage and sustain rural team participation.
Depending on the distance of the GRECC hub-site to the CBOC, efforts to establish and sustain partnerships may require multiple contacts over time (eg, via face-to-face meetings, one-on-one outreach) and large-scale advertising of consultative services. Continuous engagement with CBOC-based teams also involves development of case finding strategies (eg, hospital discharge information, diagnoses, clinical criteria) to better identify veterans who may benefit from GRECC Connect consultation. Owing to the heterogeneity of technological resources, space, scheduling capacity, and staffing at CBOCs, GRECC sites continue to have variable engagement with their CBOC partners.
The inclusion of GRECC Connect within the Geriatric Scholars Program helps ensure that clinician scholars can serve as project champions at their respective rural sites. Rural HCPs with full-time clinical duties initially had difficulty carving out time to participate in GRECC Connect’s case-based conferences. However, the webinar platform has improved and sustained provider participation, and enduring recordings of the presentations allow clinicians to participate in the conferences at their convenience. Finally, the project experienced delays in taking certain administrative steps and hiring staff needed to support the establishment of telehealth modalities—even within a single health care system like the VA, each medical center and regional system has unique policies that complicate how telehealth modalities can be set up.
Conclusion and Future Directions
The GRECC Connect project aims to establish and support meaningful partnerships between urban geriatric specialists and rural HCPs to facilitate veterans’ increased access to geriatric specialty care. VA ORH has recognized it as a Rural Promising Practice, and GRECC Connect is currently being disseminated through an enterprise-wide initiative. Early evidence demonstrates that over 4 years, the expansion of GRECC Connect has helped meet critical aims of improving provider confidence and skills in geriatric management, and of increasing direct service provision. We have also used nationwide education platforms (eg, VA EES) to deliver geriatrics-focused education to health care teams.
Older rural veterans and their caregivers may benefit from this program through decreased travel-associated burden and report high satisfaction with these programs. Through a recently established collaboration with the GEC Data Analysis Center, we will use national data to refine our ability to identify at-risk, older rural veterans and to better evaluate their service needs and the GRECC Connect clinical impact. Because the VA is rapidly expanding use of telehealth and other virtual and digital methods to increase access to care, continued investments in telehealth are central to the VA 5-year strategic plan.18 In this spirit, GRECC Connect will continue to expand its program offerings and to leverage telehealth technologies to meet the needs of older veterans.
Acknowledgments
The authors wish to acknowledge Lisa Tenover, MD, PhD, (Palo Alto GRECC) for her contributions to this manuscript; the VA Rural Health Resource Center–Western Region; and GRECC Connect team members for their tireless work to ensure this project’s success. The GRECC Teams include Atlanta/Birmingham (Julia [Annette] Tedford, RN; Marquitta Cox, LMSW; Lisa Welch, LMSW; Mark Phillips; Lanie Walters, PharmD; Kroshona Tabb, PhD; Robert Langford, and Jason [Thomas] Sanders, HT, TCT); Bronx/NY Harbor (Ab Brody, RN; PhD, GNP-BC; Nick Koufacos, LMSW; and Shatice Jones); Canandaigua (Gary Kochersberger, MD; Suzanne Gillespie, MD; Gary Warner, PhD; Christie Hylwa, RPh CCP; Sharon Fell, LMSW; and Dorian Savino, MPA); Durham (Mamata Yanamadala, MBBS; Christy Knight, LCSW, MSW; and Julie Vognsen); Eastern Colorado (Larry Bourg, MD; Skotti Church, MD; Morgan Elmore, DO; Stephanie Hartz, LCSW; Carolyn Horney, MD; Steven Huart, AuD; Kathryn Nearing, PhD; Elizabeth O’Brien, PharmD; Laurence Robbins, MD; Robert Schwartz, MD; Karen Shea, MD; and Joleen Sussman, PhD); Little Rock (Prasad Padala, MD; and Tanya Taylor, RN); Madison (Ryan Bartkus, MD; Timothy Howell, MD; Lindsay Clark, PhD; Lauren Welch, PharmD, BCGP; Ellen Wanninger, MSW, CAPSW; Stacie Monson, RN, BSN; and Teresa Swader, MSW, LCSW); Miami (Carlos Gomez Orozo); New England (Malissa Kraft, PsyD); Palo Alto (Terri Huh, PhD, ABPP; Philip Choe, DO; Dawna Dougherty, LCSW; Ashley Scales, MPH); Pittsburgh (Stacey Shaffer, MD; Carol Dolbee, CRNP; Nancy Kovell, LCSW; Paul Bulgarelli, DO; Lauren Jost, PsyD; and Marcia Homer, RN-BC); and San Antonio (Becky Powers, MD; Che Kelly, RN, BSN; Cynthia Stewart, LCSW; Rebecca Rottman-Sagebiel, PharmD, BCPS, CGP; Melody Moris; Daniel MacCarthy; and Chen-pin Wang, PhD).
1. US Department of Veterans Affairs. Office of Rural Health Annual report: Thrive 2016. https://www.ruralhealth.va.gov/docs/ORH2016Thrive508_FINAL.pdf. Accessed September 10, 2019.
2. Holder KA. Veterans in Rural America: 2011–2015. US Census Bureau: Washington, DC; 2016. American Community Survey Reports, ACS-36.
3. US Department of Health and Human Services, Health Resources and Services Administration, Bureau of Health Workforce, National Center for Health Workforce Analysis.2017. National and regional projections of supply and demand for geriatricians: 2013-2025. https://bhw.hrsa.gov/sites/default/files/bhw/health-workforce-analysis/research/projections/GeriatricsReport51817.pdf. Published April 2017. Accessed September 10, 2019.
4. Peterson L, Bazemore A, Bragg E, Xierali I, Warshaw GA. Rural–urban distribution of the U.S. geriatrics physician workforce. J Am Geriatr Soc. 2011;59(4):699-703.
5. Lindeman D. Interview: lessons from a leader in telehealth diffusion: a conversation with Adam Darkins of the Veterans Health Administration. Ageing Int. 2010;36(1):146-154.
6. Darkins A, Foster L, Anderson C, Goldschmidt L, Selvin G. The design, implementation, and operational management of a comprehensive quality management program to support national telehealth networks. Telemed J E Health. 2013;19(7):557-564.
7. US Department of Veterans Affairs. Clinical video telehealth into the home (CVTHM)toolkit for providers. https://www.mirecc.va.gov/visn16//docs/CVTHM_Toolkit.pdf. Accessed September 10, 2019.
8. Darkins A. Telehealth services in the United States Department of Veterans Affairs (VA). https://myvitalz.com/wp-content/uploads/2016/07/Telehealth-Services-in-the-United-States.pdf. Published July 2016. Accessed September 10, 2019.
9. US Department of Veterans Affairs. VA announces telemental health clinical resource centers during telemedicine association gathering [press release]. https://www.va.gov/opa/pressrel/includes/viewPDF.cfm?id=2789. Published May 16, 2016. Accessed September 10, 2019.
10. Hung WW, Rossi M, Thielke S, et al. A multisite geriatric education program for rural providers in the Veteran Health Care System (GRECC Connect). Gerontol Geriatr Educ. 2014;35(1):23-40.
11. Kramer BJ. The VA geriatric scholars program. Fed Pract. 2015;32(5):46-48.
12. Kramer BJ, Creekmur B, Howe JL, et al. Veterans Affairs Geriatric Scholars Program: enhancing existing primary care clinician skills in caring for older veterans. J Am Geriatr Soc. 2016;64(11):2343-2348.
13. Powers BB, Homer MC, Morone N, Edmonds N, Rossi MI. Creation of an interprofessional teledementia clinic for rural veterans: preliminary data. J Am Geriatr Soc. 2017;65(5):1092-1099.
14. Wright SM, Hedin SC, McConnell M, et al. Using shared decision-making to address possible overtreatment in patients at high risk for hypoglycemia: the Veterans Health Administration’s Choosing Wisely Hypoglycemia Safety Initiative. Clin Diabetes. 2018;36(2):120-127.
15. Chang W, Homer M, Rossi MI. Use of clinical video telehealth as a tool for optimizing medications for rural older veterans with dementia. Geriatrics (Basel). 2018;3(3):pii E44.
16. US Department of Veterans Affairs, Office of Rural Health. Rural promising practice issue brief: GRECC Connect Project: connecting rural providers with geriatric specialists through telemedicine. https://www.ruralhealth.va.gov/docs/promise/2017_02_01_Promising%20Practice_GRECC_Issue%20Brief.pdf. Published February 2017. Accessed September 10, 2019.
17. US Department of Veterans Affairs, Office of Public and Intergovernmental Affairs. VA expands telehealth by allowing health care providers to treat patients across state lines [press release]. https://www.va.gov/opa/pressrel/pressrelease.cfm?id=4054. Published May 11, 2018. Accessed September 10, 2019.
18. US Department of Veterans Affairs. Department of Veterans Affairs FY 2018 – 2024 strategic plan. https://www.va.gov/oei/docs/VA2018-2024strategicPlan.pdf. Updated May 31, 2019. Accessed September 10, 2019.
Advancing Order Set Design
In the current health care environment, hospitals are constantly challenged to improve quality metrics and deliver better health care outcomes. One means to achieving quality improvement is through the use of order sets, groups of related orders that a health care provider (HCP) can place with either a few keystrokes or mouse clicks.1
Historically, design of order sets has largely focused on clicking checkboxes containing evidence-based practices. According to Bates and colleagues and the Institute for Safe Medication Practices, incorporating evidence-based medicine (EBM) into order sets is not by itself sufficient.2,3Execution of proper design coupled with simplicity and provider efficiency is paramount to HCP buy-in, increased likelihood of order set adherence, and to potentially better outcomes.
In this article, we outline advancements in order set design. These improvements increase provider efficiency and ease of use; incorporate human factors engineering (HFE); apply failure mode and effects analysis; and include EBM.
Methods
An inpatient nicotine replacement therapy (NRT) order was developed as part of a multifaceted solution to improve tobacco cessation care at the James A. Haley Veterans’ Hospital (JAHVH) in Tampa, Florida, a complexity level 1a facility. This NRT order set used the 4-step order set design framework the authors’ developed (for additional information about the NRT order set, contact the authors). We distinguish order set design technique between 2 different inpatient NRT order sets. The first order set in the comparison (Figure 1) is an inpatient NRT order set of unknown origin—it is common for US Department of Veterans Affairs (VA) medical facilities to share order sets and other resources. The second order set (Figure 2) is an inpatient NRT order set we designed using our 4-step process for comparison in this article. No institutional review board approval was required as this work met criteria for operational improvement activities exempt from ethics review.
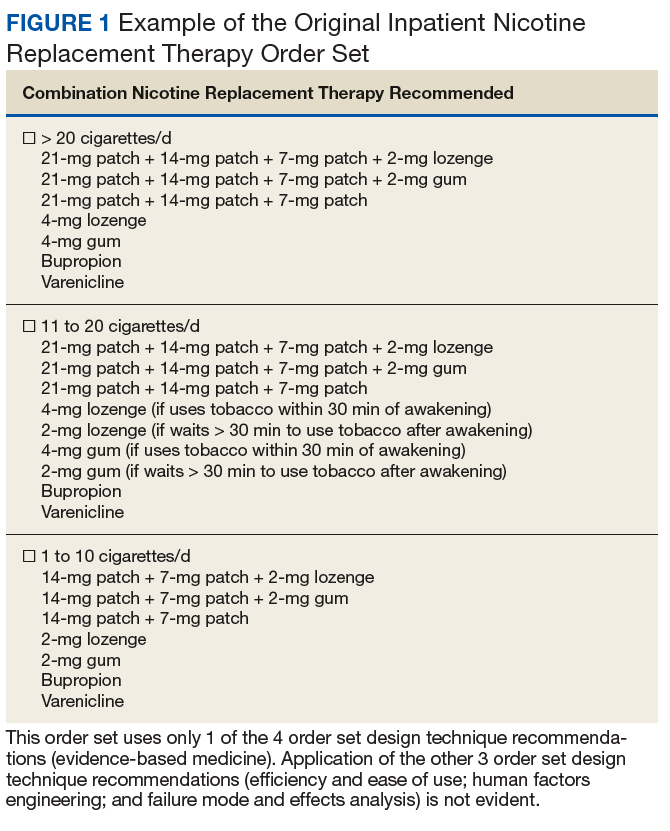
Justin Iannello, DO, MBA, was the team leader and developer of the 4-step order set design technique. The intervention team consisted of 4 internal medicine physicians with expertise in quality improvement and patient safety: 1 certified professional in patient safety and certified as a Lean Six Sigma Black Belt; 2 physicians certified as Lean Six Sigma Black Belts; and 1 physician certified as a Lean Six Sigma Green Belt. Two inpatient clinical pharmacists and 1 quality management specialist also were involved in its development.

Development of a new NRT order set was felt to be an integral part of the tobacco cessation care delivery process. An NRT order set perceived by users as value-added required a solution that merged EBM with standardization and applied quality improvement principles. The result was an approach to order set design that focused on 4 key questions: Is the order set efficient and easy to use/navigate? Is human factors engineering incorporated? Is failure mode and effects analysis applied? Are evidence-based practices included?
Ease of Use and Navigation
Implementing an order set that is efficient and easy to use or navigate seems straightforward but can be difficult to execute. Figure 1 shows many detailed options consisting of different combinations of nicotine patches, lozenges, and gum. Also included are oral tobacco cessation options (bupropion and varenicline). Although more options may seem better, confusion about appropriate medication selection can occur.
According to Heath and Heath, too many options can result in lack of action.4 For example, Heath and Heath discuss a food store that offered 6 free samples of different jams on one day and 24 jams the following day. The customers who sampled 6 different types of jam were 10 times more likely to buy jam. The authors concluded that the more options available, the more difficulty a potential buyer has in deciding on a course of action.4
In clinical situations where a HCP is using an order set, the number of options can mean the difference between use vs avoidance if the choices are overwhelming. HCPs process layers of detail every day when creating differential diagnoses and treatment plans. While that level of detail is necessary clinically, that same level of detail included in orders sets can create challenges for HCPs.
Figure 2 advances the order set in Figure 1 by providing a simpler and cleaner design, so HCPs can more easily review and process the information. This order set design minimizes the number of options available to help users make the right decision, focusing on value for the appropriate setting and audience. In other words, order sets should not be a “one size fits all” approach.
Order sets should be tailored to the appropriate clinical setting (eg, inpatient acute care, outpatient clinic setting, etc) and HCP (eg, hospitalist, tobacco cessation specialist, etc). We are comparing NRT order sets designed for HCPs who do not routinely prescribe oral tobacco cessation products in the inpatient setting. When possible, autogenerated bundle orders should also be used according to evidence-based recommendations (such as nicotine patch tapers) for ease of use and further simplification of order sets.
Finally, usability testing known as “evaluating a product or service by testing it with representative users” helps further refine an order set.5Usability testing should be applied during all phases of order set development with end user(s) as it helps identify problems with order set design prior to implementation. By applying usability testing, the order set becomes more meaningful and valued by the user.
Human Factors Engineering
HFE is “the study of all the factors that make it easier to do the work in the right way.”6 HFE seeks to identify, align, and apply processes for people and the world within which they live and work to promote safe and efficient practices, especially in relation to the technology and physical design features in their work environment.6
The average American adult makes about 35,000 decisions per day.7 Thus, there is potential for error at any moment. Design that does not take HFE into account can be dangerous. For example, when tube feed and IV line connectors look similar and are compatible, patients may inadvertently receive food administered directly into their bloodstream.8
HFE can and should be applied to order sets. Everything from the look, feel, and verbiage of an order set affects potential outcomes. For example, consider the impact even seemingly minor modifications can have on outcomes simply by guiding users in a different way: Figure 1 provides NRT options based on cigarette use per day, whereas Figure 2 conveys pack use per day in relation to the equivalent number of cigarettes used daily. These differences may seem small; however, it helps guide users to the right choice when considering that health care providers have been historically trained on social history gathering that emphasizes packs per day and pack-years.
Failure Mode and Effects Analysis
Failure mode and effects analysis (FMEA) is “a structured way to identify and address potential problems, or failures and their resulting effects on the system or process before an adverse event occurs.”9 The benefit of an order set must be weighed against the risk during development. FMEA should be applied during order set design to assess and limit risk just as with any other clinical care process.
FMEA examines both level of risk and frequency of risk occurrence associated with a new proposed process. For example, let’s evaluate an order set designed for pain control after surgery that consists of multiple high-risk opioids along with antihistamine medications for as-needed itch relief (a non-life-threatening adverse event (AE) of opioids well known by the medical community). An interdisciplinary FMEA team consisting of subject matter experts may examine how the process should flow in step-by-step detail and then discuss the benefit of a process and risk for potential error. A FMEA team would then analyze what could go wrong with each part of the process and assign a level of risk and risk frequency for various steps in the process, and then decide that certain steps should be modified or eliminated. Perhaps after FMEA, a facility might conclude that the risk of serious complications is high when you combine opioid use with antihistamine medications. The facility could decide to remove antihistamine medications from an order set if it is determined that risks outweigh benefits. While a root cause analysis might identify the cause of an AE after order set use, these situations can be prevented with FMEA.
When applying FMEA to Figure 1, while bupropion is known as an evidence-based oral tobacco cessation option, there is the possibility that bupropion could be inadvertently prescribed from the order set in a hospitalized patient with alcohol withdrawal and withdrawal seizure history. These potentially dangerous situations can be avoided with FMEA. Thus, although bupropion may be evidence-based for NRT, decisions regarding order set design using EBM alone are insufficient.
The practitioner must consider possible unintended consequences within order sets and target treatment options to the appropriate setting and audience. Although Figure 1 may appear to be more inclusive, the interdisciplinary committee designing the inpatient NRT order set felt there was heightened risk with introducing bupropion in Figure 1 and decided the risk would be lowered by removing bupropion from the redesigned NRT order set (Figure 2). In addition to the goal of balancing availability of NRT options with acceptable risk, Figure 2 also focused on building an NRT order set most applicable to the inpatient setting.
Including Evidence-Based Practices
EBM has become a routine part of clinical decision making. Therefore, including EBM in order set design is vital. EBM for NRT has demonstrated that combination therapy is more effective than is monotherapy to help tobacco users quit. Incremental doses of NRT are recommended for patients who use tobacco more frequently.10
As shown in Figures 1 and 2, both order set designs incorporate EBM for NRT. Although the importance of implementing EBM is evident, critical factors, such as HFE and FMEA make a difference with well-designed order sets.
Results
The 4-step order set design technique was used during development of an inpatient NRT order set at the JAHVH. Results for the inpatient Joint Commission Tobacco Treatment Measures were obtained from the Veterans Health Administration quality metric reporting system known as Strategic Analytics for Improvement and Learning (SAIL). SAIL performance measure outcomes, which include the inpatient Joint Commission Tobacco Treatment Measures, are derived from chart reviews conducted by the External Peer Review Program. Outcomes demonstrated that TOB-2 and TOB-3 (2 inpatient Joint Commission Tobacco Treatment Measures) known as tob20 and tob40, respectively, within SAIL improved by more than 300% after development of an NRT order set using the 4-step order set design framework along with implementation of a multifaceted tobacco cessation care delivery system at JAHVH.
Discussion
While the overall tobacco cessation care delivery system contributed to improved outcomes with the inpatient Joint Commission Tobacco Treatment Measures at JAHVH, the NRT order set was a cornerstone of the design. Although using our order set design technique does not necessarily guarantee successful outcomes, we believe using the 4-step order set design process increases the value of order sets and has potential to improve quality outcomes.
Limitations
Although improved outcomes following implementation of our NRT order set suggest correlation, causation cannot be proven. Also while the NRT order set is believed to have helped tremendously with outcomes, the entire tobacco cessation care delivery system at JAHVH contributed to the results. In addition, the inpatient Joint Commission Tobacco Treatment Measures help improve processes for tobacco cessation care. However, we are uncertain whether the results of our improvement efforts helped patients stop tobacco use. Further studies are needed to determine impact on population health. Finally, our results were based on improvement work done at a single center. Further studies are necessary to see whether results are reproducible.
Conclusion
There was significant improvement with the inpatient Joint Commission Tobacco Treatment Measures outcomes following development of a tobacco cessation care delivery system that included design of an inpatient NRT order set using a 4-step process we developed. This 4-step structure includes emphasis on efficiency and ease of use; human factors engineering; failure mode and effects analysis; and incorporation of evidence-based medicine (Box.) Postimplementation results showed improvement of the inpatient Joint Commission Tobacco Treatment Measures by greater than 3-fold at a single hospital.
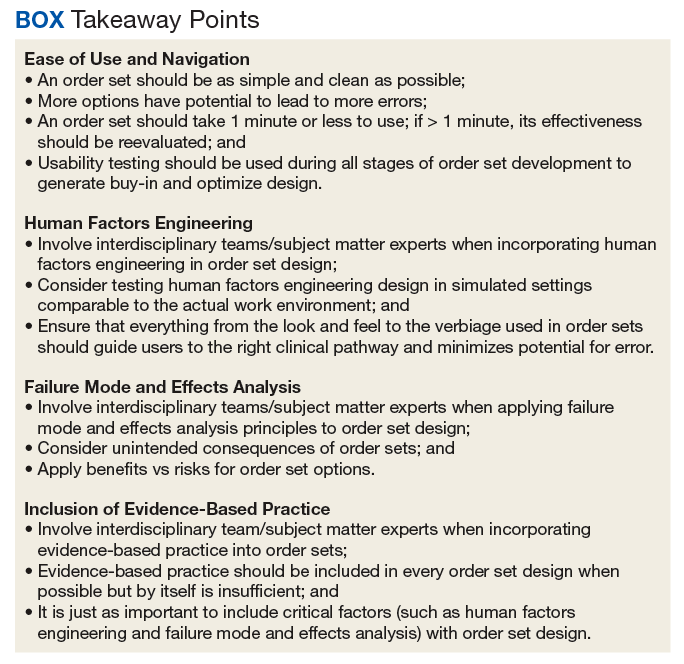
The next steps for this initiative include testing the 4-step order set design process in multiple clinical settings to determine the effectiveness of this approach in other areas of clinical care.
1. Order set. http://clinfowiki.org/wiki/index.php/Order_set. Updated October 15, 2015. Accessed August 30, 2019.
2. Bates DW, Kuperman GJ, Wang S, et al. Ten commandments for effective clinical decision support: making the practice of evidence-based medicine a reality. J Am Med Inform Assoc. 2003;10(6):523-530.
3. Institute for Safe Medication Practices. Guidelines for standard order sets. https://www.ismp.org/tools/guidelines/standardordersets.pdf. Published January 12, 2010. Accessed August 30, 2019.
4. Heath C, Heath D. Switch: How to Change Things When Change Is Hard. New York, NY: Crown Business; 2010:50-51.
5. US Department of Health and Human Services. Usability testing. https://www.usability.gov/how-to-and-tools/methods/usability-testing.html. Accessed August 30, 2019.
6. World Health Organization. What is human factors and why is it important to patient safety? www.who.int/patientsafety/education/curriculum/who_mc_topic-2.pdf. Accessed August 30, 2019.
7. Sollisch J. The cure for decision fatigue. Wall Street Journal. June 10, 2016. https://www.wsj.com/articles/the-cure-for-decision-fatigue-1465596928. Accessed August 30, 2019.
8. ECRI Institute. Implementing the ENFit initiative for preventing enteral tubing misconnections. https://www.ecri.org/components/HDJournal/Pages/ENFit-for-Preventing-Enteral-Tubing-Misconnections.aspx. Published March 29, 2017. Accessed August 30, 2019.
9. Guidance for performing failure mode and effects analysis with performance improvement projects. https://www.cms.gov/Medicare/Provider-Enrollment-and-Certification/QAPI/downloads/GuidanceForFMEA.pdf. Accessed August 30, 2019.
10. Diefanbach LJ, Smith PO, Nashelsky JM, Lindbloom E. What is the most effective nicotine replacement therapy? J Fam Pract. 2003;52(6):492-497.
In the current health care environment, hospitals are constantly challenged to improve quality metrics and deliver better health care outcomes. One means to achieving quality improvement is through the use of order sets, groups of related orders that a health care provider (HCP) can place with either a few keystrokes or mouse clicks.1
Historically, design of order sets has largely focused on clicking checkboxes containing evidence-based practices. According to Bates and colleagues and the Institute for Safe Medication Practices, incorporating evidence-based medicine (EBM) into order sets is not by itself sufficient.2,3Execution of proper design coupled with simplicity and provider efficiency is paramount to HCP buy-in, increased likelihood of order set adherence, and to potentially better outcomes.
In this article, we outline advancements in order set design. These improvements increase provider efficiency and ease of use; incorporate human factors engineering (HFE); apply failure mode and effects analysis; and include EBM.
Methods
An inpatient nicotine replacement therapy (NRT) order was developed as part of a multifaceted solution to improve tobacco cessation care at the James A. Haley Veterans’ Hospital (JAHVH) in Tampa, Florida, a complexity level 1a facility. This NRT order set used the 4-step order set design framework the authors’ developed (for additional information about the NRT order set, contact the authors). We distinguish order set design technique between 2 different inpatient NRT order sets. The first order set in the comparison (Figure 1) is an inpatient NRT order set of unknown origin—it is common for US Department of Veterans Affairs (VA) medical facilities to share order sets and other resources. The second order set (Figure 2) is an inpatient NRT order set we designed using our 4-step process for comparison in this article. No institutional review board approval was required as this work met criteria for operational improvement activities exempt from ethics review.
Justin Iannello, DO, MBA, was the team leader and developer of the 4-step order set design technique. The intervention team consisted of 4 internal medicine physicians with expertise in quality improvement and patient safety: 1 certified professional in patient safety and certified as a Lean Six Sigma Black Belt; 2 physicians certified as Lean Six Sigma Black Belts; and 1 physician certified as a Lean Six Sigma Green Belt. Two inpatient clinical pharmacists and 1 quality management specialist also were involved in its development.
Development of a new NRT order set was felt to be an integral part of the tobacco cessation care delivery process. An NRT order set perceived by users as value-added required a solution that merged EBM with standardization and applied quality improvement principles. The result was an approach to order set design that focused on 4 key questions: Is the order set efficient and easy to use/navigate? Is human factors engineering incorporated? Is failure mode and effects analysis applied? Are evidence-based practices included?
Ease of Use and Navigation
Implementing an order set that is efficient and easy to use or navigate seems straightforward but can be difficult to execute. Figure 1 shows many detailed options consisting of different combinations of nicotine patches, lozenges, and gum. Also included are oral tobacco cessation options (bupropion and varenicline). Although more options may seem better, confusion about appropriate medication selection can occur.
According to Heath and Heath, too many options can result in lack of action.4 For example, Heath and Heath discuss a food store that offered 6 free samples of different jams on one day and 24 jams the following day. The customers who sampled 6 different types of jam were 10 times more likely to buy jam. The authors concluded that the more options available, the more difficulty a potential buyer has in deciding on a course of action.4
In clinical situations where a HCP is using an order set, the number of options can mean the difference between use vs avoidance if the choices are overwhelming. HCPs process layers of detail every day when creating differential diagnoses and treatment plans. While that level of detail is necessary clinically, that same level of detail included in orders sets can create challenges for HCPs.
Figure 2 advances the order set in Figure 1 by providing a simpler and cleaner design, so HCPs can more easily review and process the information. This order set design minimizes the number of options available to help users make the right decision, focusing on value for the appropriate setting and audience. In other words, order sets should not be a “one size fits all” approach.
Order sets should be tailored to the appropriate clinical setting (eg, inpatient acute care, outpatient clinic setting, etc) and HCP (eg, hospitalist, tobacco cessation specialist, etc). We are comparing NRT order sets designed for HCPs who do not routinely prescribe oral tobacco cessation products in the inpatient setting. When possible, autogenerated bundle orders should also be used according to evidence-based recommendations (such as nicotine patch tapers) for ease of use and further simplification of order sets.
Finally, usability testing known as “evaluating a product or service by testing it with representative users” helps further refine an order set.5Usability testing should be applied during all phases of order set development with end user(s) as it helps identify problems with order set design prior to implementation. By applying usability testing, the order set becomes more meaningful and valued by the user.
Human Factors Engineering
HFE is “the study of all the factors that make it easier to do the work in the right way.”6 HFE seeks to identify, align, and apply processes for people and the world within which they live and work to promote safe and efficient practices, especially in relation to the technology and physical design features in their work environment.6
The average American adult makes about 35,000 decisions per day.7 Thus, there is potential for error at any moment. Design that does not take HFE into account can be dangerous. For example, when tube feed and IV line connectors look similar and are compatible, patients may inadvertently receive food administered directly into their bloodstream.8
HFE can and should be applied to order sets. Everything from the look, feel, and verbiage of an order set affects potential outcomes. For example, consider the impact even seemingly minor modifications can have on outcomes simply by guiding users in a different way: Figure 1 provides NRT options based on cigarette use per day, whereas Figure 2 conveys pack use per day in relation to the equivalent number of cigarettes used daily. These differences may seem small; however, it helps guide users to the right choice when considering that health care providers have been historically trained on social history gathering that emphasizes packs per day and pack-years.
Failure Mode and Effects Analysis
Failure mode and effects analysis (FMEA) is “a structured way to identify and address potential problems, or failures and their resulting effects on the system or process before an adverse event occurs.”9 The benefit of an order set must be weighed against the risk during development. FMEA should be applied during order set design to assess and limit risk just as with any other clinical care process.
FMEA examines both level of risk and frequency of risk occurrence associated with a new proposed process. For example, let’s evaluate an order set designed for pain control after surgery that consists of multiple high-risk opioids along with antihistamine medications for as-needed itch relief (a non-life-threatening adverse event (AE) of opioids well known by the medical community). An interdisciplinary FMEA team consisting of subject matter experts may examine how the process should flow in step-by-step detail and then discuss the benefit of a process and risk for potential error. A FMEA team would then analyze what could go wrong with each part of the process and assign a level of risk and risk frequency for various steps in the process, and then decide that certain steps should be modified or eliminated. Perhaps after FMEA, a facility might conclude that the risk of serious complications is high when you combine opioid use with antihistamine medications. The facility could decide to remove antihistamine medications from an order set if it is determined that risks outweigh benefits. While a root cause analysis might identify the cause of an AE after order set use, these situations can be prevented with FMEA.
When applying FMEA to Figure 1, while bupropion is known as an evidence-based oral tobacco cessation option, there is the possibility that bupropion could be inadvertently prescribed from the order set in a hospitalized patient with alcohol withdrawal and withdrawal seizure history. These potentially dangerous situations can be avoided with FMEA. Thus, although bupropion may be evidence-based for NRT, decisions regarding order set design using EBM alone are insufficient.
The practitioner must consider possible unintended consequences within order sets and target treatment options to the appropriate setting and audience. Although Figure 1 may appear to be more inclusive, the interdisciplinary committee designing the inpatient NRT order set felt there was heightened risk with introducing bupropion in Figure 1 and decided the risk would be lowered by removing bupropion from the redesigned NRT order set (Figure 2). In addition to the goal of balancing availability of NRT options with acceptable risk, Figure 2 also focused on building an NRT order set most applicable to the inpatient setting.
Including Evidence-Based Practices
EBM has become a routine part of clinical decision making. Therefore, including EBM in order set design is vital. EBM for NRT has demonstrated that combination therapy is more effective than is monotherapy to help tobacco users quit. Incremental doses of NRT are recommended for patients who use tobacco more frequently.10
As shown in Figures 1 and 2, both order set designs incorporate EBM for NRT. Although the importance of implementing EBM is evident, critical factors, such as HFE and FMEA make a difference with well-designed order sets.
Results
The 4-step order set design technique was used during development of an inpatient NRT order set at the JAHVH. Results for the inpatient Joint Commission Tobacco Treatment Measures were obtained from the Veterans Health Administration quality metric reporting system known as Strategic Analytics for Improvement and Learning (SAIL). SAIL performance measure outcomes, which include the inpatient Joint Commission Tobacco Treatment Measures, are derived from chart reviews conducted by the External Peer Review Program. Outcomes demonstrated that TOB-2 and TOB-3 (2 inpatient Joint Commission Tobacco Treatment Measures) known as tob20 and tob40, respectively, within SAIL improved by more than 300% after development of an NRT order set using the 4-step order set design framework along with implementation of a multifaceted tobacco cessation care delivery system at JAHVH.
Discussion
While the overall tobacco cessation care delivery system contributed to improved outcomes with the inpatient Joint Commission Tobacco Treatment Measures at JAHVH, the NRT order set was a cornerstone of the design. Although using our order set design technique does not necessarily guarantee successful outcomes, we believe using the 4-step order set design process increases the value of order sets and has potential to improve quality outcomes.
Limitations
Although improved outcomes following implementation of our NRT order set suggest correlation, causation cannot be proven. Also while the NRT order set is believed to have helped tremendously with outcomes, the entire tobacco cessation care delivery system at JAHVH contributed to the results. In addition, the inpatient Joint Commission Tobacco Treatment Measures help improve processes for tobacco cessation care. However, we are uncertain whether the results of our improvement efforts helped patients stop tobacco use. Further studies are needed to determine impact on population health. Finally, our results were based on improvement work done at a single center. Further studies are necessary to see whether results are reproducible.
Conclusion
There was significant improvement with the inpatient Joint Commission Tobacco Treatment Measures outcomes following development of a tobacco cessation care delivery system that included design of an inpatient NRT order set using a 4-step process we developed. This 4-step structure includes emphasis on efficiency and ease of use; human factors engineering; failure mode and effects analysis; and incorporation of evidence-based medicine (Box.) Postimplementation results showed improvement of the inpatient Joint Commission Tobacco Treatment Measures by greater than 3-fold at a single hospital.
The next steps for this initiative include testing the 4-step order set design process in multiple clinical settings to determine the effectiveness of this approach in other areas of clinical care.
1. Order set. http://clinfowiki.org/wiki/index.php/Order_set. Updated October 15, 2015. Accessed August 30, 2019.
2. Bates DW, Kuperman GJ, Wang S, et al. Ten commandments for effective clinical decision support: making the practice of evidence-based medicine a reality. J Am Med Inform Assoc. 2003;10(6):523-530.
3. Institute for Safe Medication Practices. Guidelines for standard order sets. https://www.ismp.org/tools/guidelines/standardordersets.pdf. Published January 12, 2010. Accessed August 30, 2019.
4. Heath C, Heath D. Switch: How to Change Things When Change Is Hard. New York, NY: Crown Business; 2010:50-51.
5. US Department of Health and Human Services. Usability testing. https://www.usability.gov/how-to-and-tools/methods/usability-testing.html. Accessed August 30, 2019.
6. World Health Organization. What is human factors and why is it important to patient safety? www.who.int/patientsafety/education/curriculum/who_mc_topic-2.pdf. Accessed August 30, 2019.
7. Sollisch J. The cure for decision fatigue. Wall Street Journal. June 10, 2016. https://www.wsj.com/articles/the-cure-for-decision-fatigue-1465596928. Accessed August 30, 2019.
8. ECRI Institute. Implementing the ENFit initiative for preventing enteral tubing misconnections. https://www.ecri.org/components/HDJournal/Pages/ENFit-for-Preventing-Enteral-Tubing-Misconnections.aspx. Published March 29, 2017. Accessed August 30, 2019.
9. Guidance for performing failure mode and effects analysis with performance improvement projects. https://www.cms.gov/Medicare/Provider-Enrollment-and-Certification/QAPI/downloads/GuidanceForFMEA.pdf. Accessed August 30, 2019.
10. Diefanbach LJ, Smith PO, Nashelsky JM, Lindbloom E. What is the most effective nicotine replacement therapy? J Fam Pract. 2003;52(6):492-497.
Comparing Artificial Intelligence Platforms for Histopathologic Cancer Diagnosis
Artificial intelligence (AI), first described in 1956, encompasses the field of computer science in which machines are trained to learn from experience. The term was popularized by the 1956 Dartmouth College Summer Research Project on Artificial Intelligence.1 The field of AI is rapidly growing and has the potential to affect many aspects of our lives. The emerging importance of AI is demonstrated by a February 2019 executive order that launched the American AI Initiative, allocating resources and funding for AI development.2 The executive order stresses the potential impact of AI in the health care field, including its potential utility to diagnose disease. Federal agencies were directed to invest in AI research and development to promote rapid breakthroughs in AI technology that may impact multiple areas of society.
Machine learning (ML), a subset of AI, was defined in 1959 by Arthur Samuel and is achieved by employing mathematic models to compute sample data sets.3 Originating from statistical linear models, neural networks were conceived to accomplish these tasks.4 These pioneering scientific achievements led to recent developments of deep neural networks. These models are developed to recognize patterns and achieve complex computational tasks within a matter of minutes, often far exceeding human ability.5 ML can increase efficiency with decreased computation time, high precision, and recall when compared with that of human decision making.6
ML has the potential for numerous applications in the health care field.7-9 One promising application is in the field of anatomic pathology. ML allows representative images to be used to train a computer to recognize patterns from labeled photographs. Based on a set of images selected to represent a specific tissue or disease process, the computer can be trained to evaluate and recognize new and unique images from patients and render a diagnosis.10 Prior to modern ML models, users would have to import many thousands of training images to produce algorithms that could recognize patterns with high accuracy. Modern ML algorithms allow for a model known as transfer learning, such that far fewer images are required for training.11-13
Two novel ML platforms available for public use are offered through Google (Mountain View, CA) and Apple (Cupertino, CA).14,15 They each offer a user-friendly interface with minimal experience required in computer science. Google AutoML uses ML via cloud services to store and retrieve data with ease. No coding knowledge is required. The Apple Create ML Module provides computer-based ML, requiring only a few lines of code.
The Veterans Health Administration (VHA) is the largest single health care system in the US, and nearly 50 000 cancer cases are diagnosed at the VHA annually.16 Cancers of the lung and colon are among the most common sources of invasive cancer and are the 2 most common causes of cancer deaths in America.16 We have previously reported using Apple ML in detecting non-small cell lung cancers (NSCLCs), including adenocarcinomas and squamous cell carcinomas (SCCs); and colon cancers with accuracy.17,18 In the present study, we expand on these findings by comparing Apple and Google ML platforms in a variety of common pathologic scenarios in veteran patients. Using limited training data, both programs are compared for precision and recall in differentiating conditions involving lung and colon pathology.
In the first 4 experiments, we evaluated the ability of the platforms to differentiate normal lung tissue from cancerous lung tissue, to distinguish lung adenocarcinoma from SCC, and to differentiate colon adenocarcinoma from normal colon tissue. Next, cases of colon adenocarcinoma were assessed to determine whether the presence or absence of the KRAS proto-oncogene could be determined histologically using the AI platforms. KRAS is found in a variety of cancers, including about 40% of colon adenocarcinomas.19 For colon cancers, the presence or absence of the mutation in KRAS has important implications for patients as it determines whether the tumor will respond to specific chemotherapy agents.20 The presence of the KRAS gene is currently determined by complex molecular testing of tumor tissue.21 However, we assessed the potential of ML to determine whether the mutation is present by computerized morphologic analysis alone. Our last experiment examined the ability of the Apple and Google platforms to differentiate between adenocarcinomas of lung origin vs colon origin. This has potential utility in determining the site of origin of metastatic carcinoma.22
Methods
Fifty cases of lung SCC, 50 cases of lung adenocarcinoma, and 50 cases of colon adenocarcinoma were randomly retrieved from our molecular database. Twenty-five colon adenocarcinoma cases were positive for mutation in KRAS, while 25 cases were negative for mutation in KRAS. Seven hundred fifty total images of lung tissue (250 benign lung tissue, 250 lung adenocarcinomas, and 250 lung SCCs) and 500 total images of colon tissue (250 benign colon tissue and 250 colon adenocarcinoma) were obtained using a Leica Microscope MC190 HD Camera (Wetzlar, Germany) connected to an Olympus BX41 microscope (Center Valley, PA) and the Leica Acquire 9072 software for Apple computers. All the images were captured at a resolution of 1024 x 768 pixels using a 60x dry objective. Lung tissue images were captured and saved on a 2012 Apple MacBook Pro computer, and colon images were captured and saved on a 2011 Apple iMac computer. Both computers were running macOS v10.13.
Creating Image Classifier Models Using Apple Create ML
Apple Create ML is a suite of products that use various tools to create and train custom ML models on Apple computers.15 The suite contains many features, including image classification to train a ML model to classify images, natural language processing to classify natural language text, and tabular data to train models that deal with labeling information or estimating new quantities. We used Create ML Image Classification to create image classifier models for our project (Appendix A).
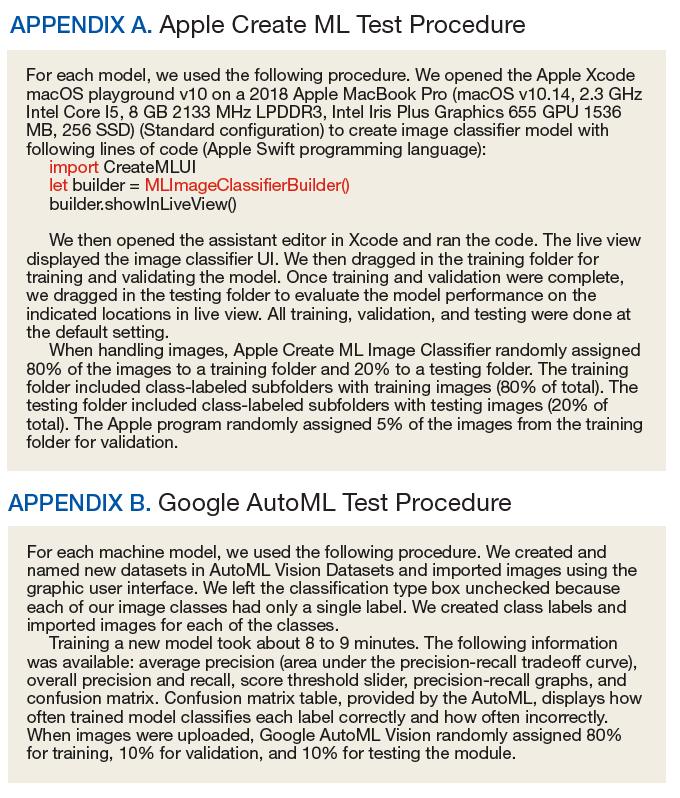
Creating ML Modules Using Google Cloud AutoML Vision Beta
Google Cloud AutoML is a suite of machine learning products, including AutoML Vision, AutoML Natural Language and AutoML Translation.14 All Cloud AutoML machine learning products were in beta version at the time of experimentation. We used Cloud AutoML Vision beta to create ML modules for our project. Unlike Apple Create ML, which is run on a local Apple computer, the Google Cloud AutoML is run online using a Google Cloud account. There are no minimum specifications requirements for the local computer since it is using the cloud-based architecture (Appendix B).
Experiment 1
We compared Apple Create ML Image Classifier and Google AutoML Vision in their ability to detect and subclassify NSCLC based on the histopathologic images. We created 3 classes of images (250 images each): benign lung tissue, lung adenocarcinoma, and lung SCC.
Experiment 2
We compared Apple Create ML Image Classifier and Google AutoML Vision in their ability to differentiate between normal lung tissue and NSCLC histopathologic images with 50/50 mixture of lung adenocarcinoma and lung SCC. We created 2 classes of images (250 images each): benign lung tissue and lung NSCLC.
Experiment 3
We compared Apple Create ML Image Classifier and Google AutoML Vision in their ability to differentiate between lung adenocarcinoma and lung SCC histopathologic images. We created 2 classes of images (250 images each): adenocarcinoma and SCC.
Experiment 4
We compared Apple Create ML Image Classifier and Google AutoML Vision in their ability to detect colon cancer histopathologic images regardless of mutation in KRAS status. We created 2 classes of images (250 images each): benign colon tissue and colon adenocarcinoma.
Experiment 5
We compared Apple Create ML Image Classifier and Google AutoML Vision in their ability to differentiate between colon adenocarcinoma with mutations in KRAS and colon adenocarcinoma without the mutation in KRAS histopathologic images. We created 2 classes of images (125 images each): colon adenocarcinoma cases with mutation in KRAS and colon adenocarcinoma cases without the mutation in KRAS.
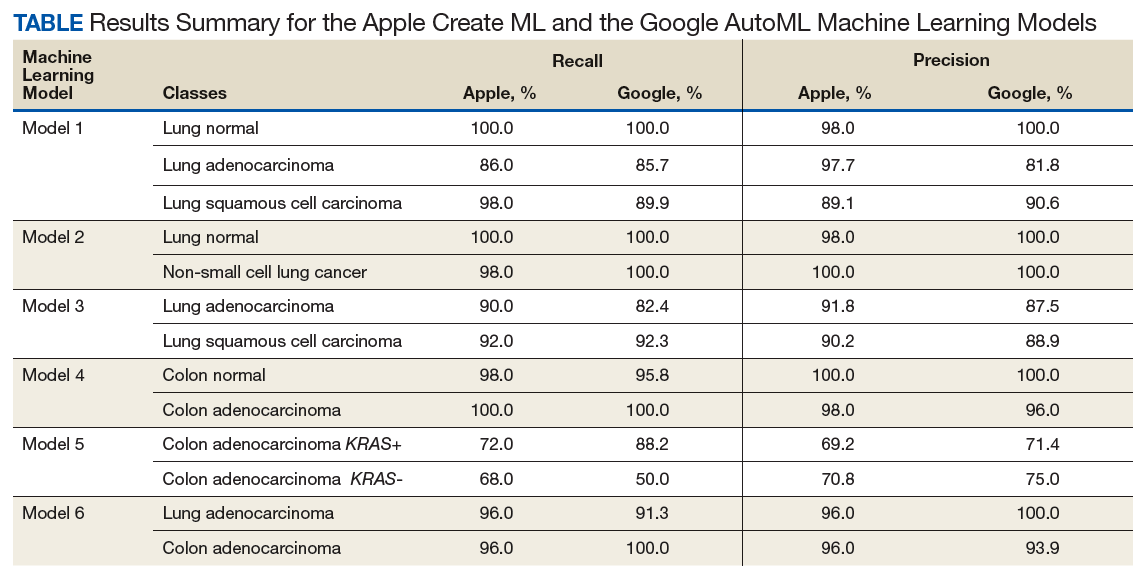
Experiment 6
We compared Apple Create ML Image Classifier and Google AutoML Vision in their ability to differentiate between lung adenocarcinoma and colon adenocarcinoma histopathologic images. We created 2 classes of images (250 images each): colon adenocarcinoma lung adenocarcinoma.
Results
Twelve machine learning models were created in 6 experiments using the Apple Create ML and the Google AutoML (Table). To investigate recall and precision differences between the Apple and the Google ML algorithms, we performed 2-tailed distribution, paired t tests. No statistically significant differences were found (P = .52 for recall and .60 for precision).
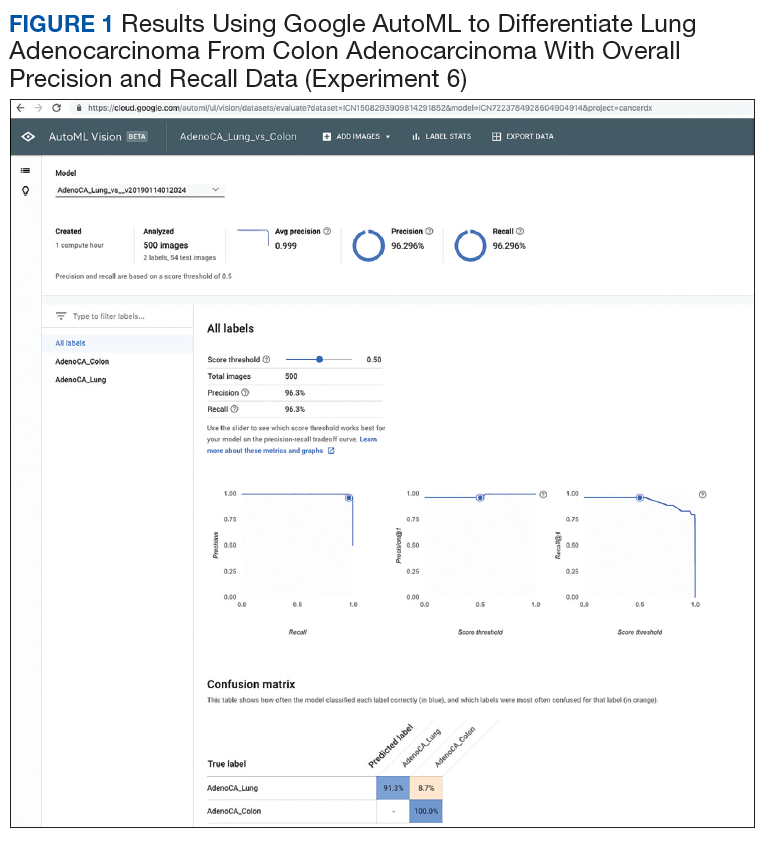
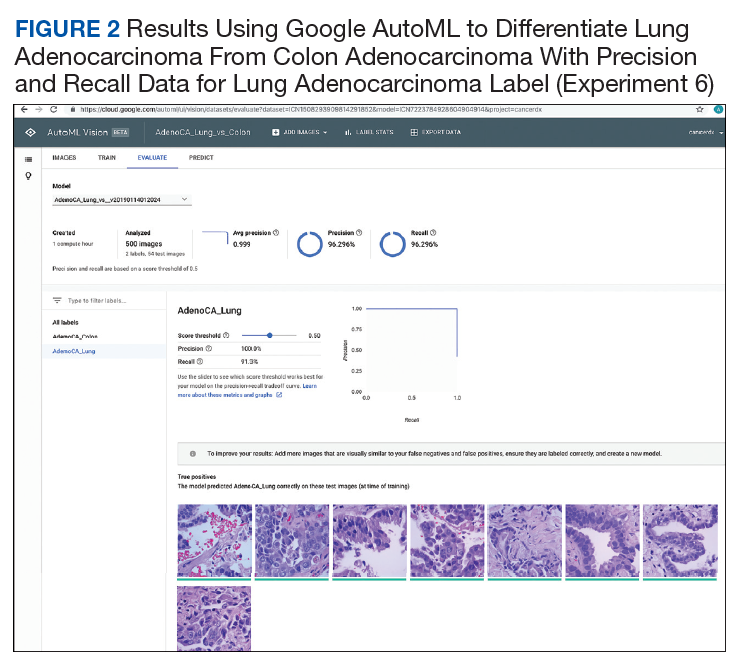
Overall, each model performed well in distinguishing between normal and neoplastic tissue for both lung and colon cancers. In subclassifying NSCLC into adenocarcinoma and SCC, the models were shown to have high levels of precision and recall. The models also were successful in distinguishing between lung and colonic origin of adenocarcinoma (Figures 1-4). However, both systems had trouble discerning colon adenocarcinoma with mutations in KRAS from adenocarcinoma without mutations in KRAS.
Discussion
Image classifier models using ML algorithms hold a promising future to revolutionize the health care field. ML products, such as those modules offered by Apple and Google, are easy to use and have a simple graphic user interface to allow individuals to train models to perform humanlike tasks in real time. In our experiments, we compared multiple algorithms to determine their ability to differentiate and subclassify histopathologic images with high precision and recall using common scenarios in treating veteran patients.
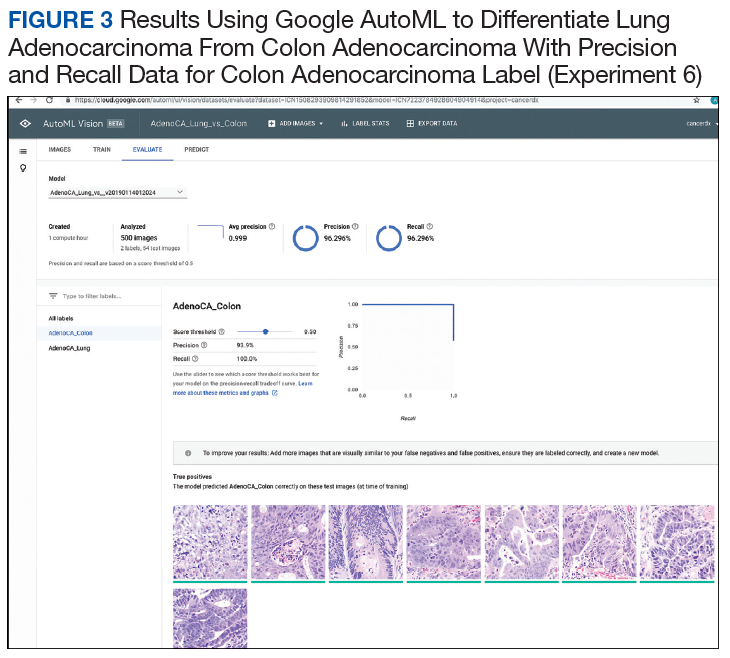
Analysis of the results revealed high precision and recall values illustrating the models’ ability to differentiate and detect benign lung tissue from lung SCC and lung adenocarcinoma in ML model 1, benign lung from NSCLC carcinoma in ML model 2, and benign colon from colonic adenocarcinoma in ML model 4. In ML model 3 and 6, both ML algorithms performed at a high level to differentiate lung SCC from lung adenocarcinoma and lung adenocarcinoma from colonic adenocarcinoma, respectively. Of note, ML model 5 had the lowest precision and recall values across both algorithms demonstrating the models’ limited utility in predicting molecular profiles, such as mutations in KRAS as tested here. This is not surprising as pathologists currently require complex molecular tests to detect mutations in KRAS reliably in colon cancer.
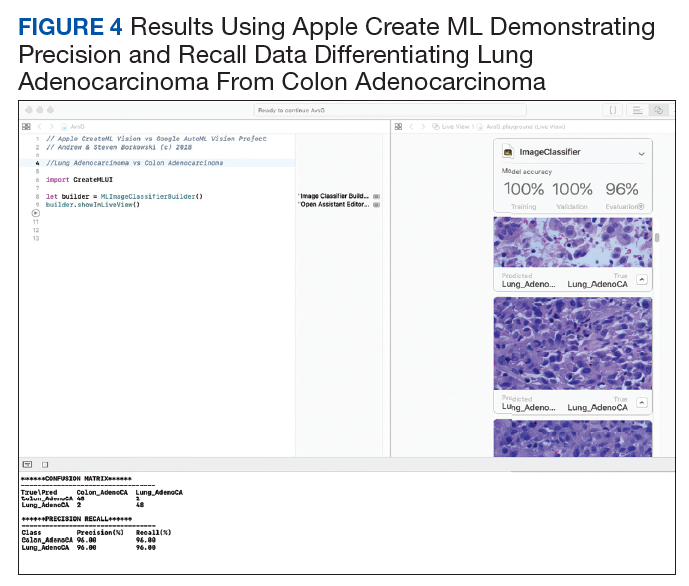
Both modules require minimal programming experience and are easy to use. In our comparison, we demonstrated critical distinguishing characteristics that differentiate the 2 products.
Apple Create ML image classifier is available for use on local Mac computers that use Xcode version 10 and macOS 10.14 or later, with just 3 lines of code required to perform computations. Although this product is limited to Apple computers, it is free to use, and images are stored on the computer hard drive. Of unique significance on the Apple system platform, images can be augmented to alter their appearance to enhance model training. For example, imported images can be cropped, rotated, blurred, and flipped, in order to optimize the model’s training abilities to recognize test images and perform pattern recognition. This feature is not as readily available on the Google platform. Apple Create ML Image classifier’s default training set consists of 75% of total imported images with 5% of the total images being randomly used as a validation set. The remaining 20% of images comprise the testing set. The module’s computational analysis to train the model is achieved in about 2 minutes on average. The score threshold is set at 50% and cannot be manipulated for each image class as in Google AutoML Vision.
Google AutoML Vision is open and can be accessed from many devices. It stores images on remote Google servers but requires computing fees after a $300 credit for 12 months. On AutoML Vision, random 80% of the total images are used in the training set, 10% are used in the validation set, and 10% are used in the testing set. It is important to highlight the different percentages used in the default settings on the respective modules. The time to train the Google AutoML Vision with default computational power is longer on average than Apple Create ML, with about 8 minutes required to train the machine learning module. However, it is possible to choose more computational power for an additional fee and decrease module training time. The user will receive e-mail alerts when the computer time begins and is completed. The computation time is calculated by subtracting the time of the initial e-mail from the final e-mail.
Based on our calculations, we determined there was no significant difference between the 2 machine learning algorithms tested at the default settings with recall and precision values obtained. These findings demonstrate the promise of using a ML algorithm to assist in the performance of human tasks and behaviors, specifically the diagnosis of histopathologic images. These results have numerous potential uses in clinical medicine. ML algorithms have been successfully applied to diagnostic and prognostic endeavors in pathology,23-28 dermatology,29-31 ophthalmology,32 cardiology,33 and radiology.34-36
Pathologists often use additional tests, such as special staining of tissues or molecular tests, to assist with accurate classification of tumors. ML platforms offer the potential of an additional tool for pathologists to use along with human microscopic interpretation.37,38 In addition, the number of pathologists in the US is dramatically decreasing, and many other countries have marked physician shortages, especially in fields of specialized training such as pathology.39-42 These models could readily assist physicians in underserved countries and impact shortages of pathologists elsewhere by providing more specific diagnoses in an expedited manner.43
Finally, although we have explored the application of these platforms in common cancer scenarios, great potential exists to use similar techniques in the detection of other conditions. These include the potential for classification and risk assessment of precancerous lesions, infectious processes in tissue (eg, detection of tuberculosis or malaria),24,44 inflammatory conditions (eg, arthritis subtypes, gout),45 blood disorders (eg, abnormal blood cell morphology),46 and many others. The potential of these technologies to improve health care delivery to veteran patients seems to be limited only by the imagination of the user.47
Regarding the limited effectiveness in determining the presence or absence of mutations in KRAS for colon adenocarcinoma, it is mentioned that currently pathologists rely on complex molecular tests to detect the mutations at the DNA level.21 It is possible that the use of more extensive training data sets may improve recall and precision in cases such as these and warrants further study. Our experiments were limited to the stipulations placed by the free trial software agreements; no costs were expended to use the algorithms, though an Apple computer was required.
Conclusion
We have demonstrated the successful application of 2 readily available ML platforms in providing diagnostic guidance in differentiation between common cancer conditions in veteran patient populations. Although both platforms performed very well with no statistically significant differences in results, some distinctions are worth noting. Apple Create ML can be used on local computers but is limited to an Apple operating system. Google AutoML is not platform-specific but runs only via Google Cloud with associated computational fees. Using these readily available models, we demonstrated the vast potential of AI in diagnostic pathology. The application of AI to clinical medicine remains in the very early stages. The VA is uniquely poised to provide leadership as AI technologies will continue to dramatically change the future of health care, both in veteran and nonveteran patients nationwide.
Acknowledgments
The authors thank Paul Borkowski for his constructive criticism and proofreading of this manuscript. This material is the result of work supported with resources and the use of facilities at the James A. Haley Veterans’ Hospital.
1. Moor J. The Dartmouth College artificial intelligence conference: the next fifty years. AI Mag. 2006;27(4):87-91.
2. Trump D. Accelerating America’s leadership in artificial intelligence. https://www.whitehouse.gov/articles/accelerating-americas-leadership-in-artificial-intelligence. Published February 11, 2019. Accessed September 4, 2019.
3. Samuel AL. Some studies in machine learning using the game of checkers. IBM J Res Dev. 1959;3(3):210-229.
4. SAS Users Group International. Neural networks and statistical models. In: Sarle WS. Proceedings of the Nineteenth Annual SAS Users Group International Conference. SAS Institute: Cary, North Carolina; 1994:1538-1550. http://www.sascommunity.org/sugi/SUGI94/Sugi-94-255%20Sarle.pdf. Accessed September 16, 2019.
5. Schmidhuber J. Deep learning in neural networks: an overview. Neural Networks. 2015;61:85-117.
6. LeCun Y, Bengio Y, Hinton G. Deep learning. Nature. 2015;521(7553):436-444.
7. Jiang F, Jiang Y, Li H, et al. Artificial intelligence in healthcare: past, present and future. Stroke Vasc Neurol. 2017;2(4):230-243.
8. Erickson BJ, Korfiatis P, Akkus Z, Kline TL. Machine learning for medical imaging. Radiographics. 2017;37(2):505-515.
9. Deo RC. Machine learning in medicine. Circulation. 2015;132(20):1920-1930.
10. Janowczyk A, Madabhushi A. Deep learning for digital pathology image analysis: a comprehensive tutorial with selected use cases. J Pathol Inform. 2016;7(1):29.
11. Oquab M, Bottou L, Laptev I, Sivic J. Learning and transferring mid-level image representations using convolutional neural networks. Presented at: IEEE Conference on Computer Vision and Pattern Recognition, 2014. http://openaccess.thecvf.com/content_cvpr_2014/html/Oquab_Learning_and_Transferring_2014_CVPR_paper.html. Accessed September 4, 2019.
12. Shin HC, Roth HR, Gao M, et al. Deep convolutional neural networks for computer-aided detection: CNN architectures, dataset characteristics and transfer learning. IEEE Trans Med Imaging. 2016;35(5):1285-1298.
13. Tajbakhsh N, Shin JY, Gurudu SR, et al. Convolutional neural networks for medical image analysis: full training or fine tuning? IEEE Trans Med Imaging. 2016;35(5):1299-1312.
14. Cloud AutoML. https://cloud.google.com/automl. Accessed September 4, 2019.
15. Create ML. https://developer.apple.com/documentation/createml. Accessed September 4, 2019.
16. Zullig LL, Sims KJ, McNeil R, et al. Cancer incidence among patients of the U.S. Veterans Affairs Health Care System: 2010 Update. Mil Med. 2017;182(7):e1883-e1891. 17. Borkowski AA, Wilson CP, Borkowski SA, Deland LA, Mastorides SM. Using Apple machine learning algorithms to detect and subclassify non-small cell lung cancer. https://arxiv.org/ftp/arxiv/papers/1808/1808.08230.pdf. Accessed September 4, 2019.
18. Borkowski AA, Wilson CP, Borkowski SA, Thomas LB, Deland LA, Mastorides SM. Apple machine learning algorithms successfully detect colon cancer but fail to predict KRAS mutation status. http://arxiv.org/abs/1812.04660. Revised January 15,2019. Accessed September 4, 2019.
19. Armaghany T, Wilson JD, Chu Q, Mills G. Genetic alterations in colorectal cancer. Gastrointest Cancer Res. 2012;5(1):19-27.
20. Herzig DO, Tsikitis VL. Molecular markers for colon diagnosis, prognosis and targeted therapy. J Surg Oncol. 2015;111(1):96-102.
21. Ma W, Brodie S, Agersborg S, Funari VA, Albitar M. Significant improvement in detecting BRAF, KRAS, and EGFR mutations using next-generation sequencing as compared with FDA-cleared kits. Mol Diagn Ther. 2017;21(5):571-579.
22. Greco FA. Molecular diagnosis of the tissue of origin in cancer of unknown primary site: useful in patient management. Curr Treat Options Oncol. 2013;14(4):634-642.
23. Bejnordi BE, Veta M, van Diest PJ, et al. Diagnostic assessment of deep learning algorithms for detection of lymph node metastases in women with breast cancer. JAMA. 2017;318(22):2199-2210.
24. Xiong Y, Ba X, Hou A, Zhang K, Chen L, Li T. Automatic detection of mycobacterium tuberculosis using artificial intelligence. J Thorac Dis. 2018;10(3):1936-1940.
25. Cruz-Roa A, Gilmore H, Basavanhally A, et al. Accurate and reproducible invasive breast cancer detection in whole-slide images: a deep learning approach for quantifying tumor extent. Sci Rep. 2017;7:46450.
26. Coudray N, Ocampo PS, Sakellaropoulos T, et al. Classification and mutation prediction from non–small cell lung cancer histopathology images using deep learning. Nat Med. 2018;24(10):1559-1567.
27. Ertosun MG, Rubin DL. Automated grading of gliomas using deep learning in digital pathology images: a modular approach with ensemble of convolutional neural networks. AMIA Annu Symp Proc. 2015;2015:1899-1908.
28. Wahab N, Khan A, Lee YS. Two-phase deep convolutional neural network for reducing class skewness in histopathological images based breast cancer detection. Comput Biol Med. 2017;85:86-97.
29. Esteva A, Kuprel B, Novoa RA, et al. Dermatologist-level classification of skin cancer with deep neural networks. Nature. 2017;542(7639):115-118.
30. Han SS, Park GH, Lim W, et al. Deep neural networks show an equivalent and often superior performance to dermatologists in onychomycosis diagnosis: automatic construction of onychomycosis datasets by region-based convolutional deep neural network. PLoS One. 2018;13(1):e0191493.
31. Fujisawa Y, Otomo Y, Ogata Y, et al. Deep-learning-based, computer-aided classifier developed with a small dataset of clinical images surpasses board-certified dermatologists in skin tumour diagnosis. Br J Dermatol. 2019;180(2):373-381.
32. Gulshan V, Peng L, Coram M, et al. Development and validation of a deep learning algorithm for detection of diabetic retinopathy in retinal fundus photographs. JAMA. 2016;316(22):2402-2010.
33. Weng SF, Reps J, Kai J, Garibaldi JM, Qureshi N. Can machine-learning improve cardiovascular risk prediction using routine clinical data? PLoS One. 2017;12(4):e0174944.
34. Cheng J-Z, Ni D, Chou Y-H, et al. Computer-aided diagnosis with deep learning architecture: applications to breast lesions in US images and pulmonary nodules in CT scans. Sci Rep. 2016;6(1):24454.
35. Wang X, Yang W, Weinreb J, et al. Searching for prostate cancer by fully automated magnetic resonance imaging classification: deep learning versus non-deep learning. Sci Rep. 2017;7(1):15415.
36. Lakhani P, Sundaram B. Deep learning at chest radiography: automated classification of pulmonary tuberculosis by using convolutional neural networks. Radiology. 2017;284(2):574-582.
37. Bardou D, Zhang K, Ahmad SM. Classification of breast cancer based on histology images using convolutional neural networks. IEEE Access. 2018;6(6):24680-24693.
38. Sheikhzadeh F, Ward RK, van Niekerk D, Guillaud M. Automatic labeling of molecular biomarkers of immunohistochemistry images using fully convolutional networks. PLoS One. 2018;13(1):e0190783.
39. Metter DM, Colgan TJ, Leung ST, Timmons CF, Park JY. Trends in the US and Canadian pathologist workforces from 2007 to 2017. JAMA Netw Open. 2019;2(5):e194337.
40. Benediktsson, H, Whitelaw J, Roy I. Pathology services in developing countries: a challenge. Arch Pathol Lab Med. 2007;131(11):1636-1639.
41. Graves D. The impact of the pathology workforce crisis on acute health care. Aust Health Rev. 2007;31(suppl 1):S28-S30.
42. NHS pathology shortages cause cancer diagnosis delays. https://www.gmjournal.co.uk/nhs-pathology-shortages-are-causing-cancer-diagnosis-delays. Published September 18, 2018. Accessed September 4, 2019.
43. Abbott LM, Smith SD. Smartphone apps for skin cancer diagnosis: Implications for patients and practitioners. Australas J Dermatol. 2018;59(3):168-170.
44. Poostchi M, Silamut K, Maude RJ, Jaeger S, Thoma G. Image analysis and machine learning for detecting malaria. Transl Res. 2018;194:36-55.
45. Orange DE, Agius P, DiCarlo EF, et al. Identification of three rheumatoid arthritis disease subtypes by machine learning integration of synovial histologic features and RNA sequencing data. Arthritis Rheumatol. 2018;70(5):690-701.
46. Rodellar J, Alférez S, Acevedo A, Molina A, Merino A. Image processing and machine learning in the morphological analysis of blood cells. Int J Lab Hematol. 2018;40(suppl 1):46-53.
47. Litjens G, Kooi T, Bejnordi BE, et al. A survey on deep learning in medical image analysis. Med Image Anal. 2017;42:60-88.
Artificial intelligence (AI), first described in 1956, encompasses the field of computer science in which machines are trained to learn from experience. The term was popularized by the 1956 Dartmouth College Summer Research Project on Artificial Intelligence.1 The field of AI is rapidly growing and has the potential to affect many aspects of our lives. The emerging importance of AI is demonstrated by a February 2019 executive order that launched the American AI Initiative, allocating resources and funding for AI development.2 The executive order stresses the potential impact of AI in the health care field, including its potential utility to diagnose disease. Federal agencies were directed to invest in AI research and development to promote rapid breakthroughs in AI technology that may impact multiple areas of society.
Machine learning (ML), a subset of AI, was defined in 1959 by Arthur Samuel and is achieved by employing mathematic models to compute sample data sets.3 Originating from statistical linear models, neural networks were conceived to accomplish these tasks.4 These pioneering scientific achievements led to recent developments of deep neural networks. These models are developed to recognize patterns and achieve complex computational tasks within a matter of minutes, often far exceeding human ability.5 ML can increase efficiency with decreased computation time, high precision, and recall when compared with that of human decision making.6
ML has the potential for numerous applications in the health care field.7-9 One promising application is in the field of anatomic pathology. ML allows representative images to be used to train a computer to recognize patterns from labeled photographs. Based on a set of images selected to represent a specific tissue or disease process, the computer can be trained to evaluate and recognize new and unique images from patients and render a diagnosis.10 Prior to modern ML models, users would have to import many thousands of training images to produce algorithms that could recognize patterns with high accuracy. Modern ML algorithms allow for a model known as transfer learning, such that far fewer images are required for training.11-13
Two novel ML platforms available for public use are offered through Google (Mountain View, CA) and Apple (Cupertino, CA).14,15 They each offer a user-friendly interface with minimal experience required in computer science. Google AutoML uses ML via cloud services to store and retrieve data with ease. No coding knowledge is required. The Apple Create ML Module provides computer-based ML, requiring only a few lines of code.
The Veterans Health Administration (VHA) is the largest single health care system in the US, and nearly 50 000 cancer cases are diagnosed at the VHA annually.16 Cancers of the lung and colon are among the most common sources of invasive cancer and are the 2 most common causes of cancer deaths in America.16 We have previously reported using Apple ML in detecting non-small cell lung cancers (NSCLCs), including adenocarcinomas and squamous cell carcinomas (SCCs); and colon cancers with accuracy.17,18 In the present study, we expand on these findings by comparing Apple and Google ML platforms in a variety of common pathologic scenarios in veteran patients. Using limited training data, both programs are compared for precision and recall in differentiating conditions involving lung and colon pathology.
In the first 4 experiments, we evaluated the ability of the platforms to differentiate normal lung tissue from cancerous lung tissue, to distinguish lung adenocarcinoma from SCC, and to differentiate colon adenocarcinoma from normal colon tissue. Next, cases of colon adenocarcinoma were assessed to determine whether the presence or absence of the KRAS proto-oncogene could be determined histologically using the AI platforms. KRAS is found in a variety of cancers, including about 40% of colon adenocarcinomas.19 For colon cancers, the presence or absence of the mutation in KRAS has important implications for patients as it determines whether the tumor will respond to specific chemotherapy agents.20 The presence of the KRAS gene is currently determined by complex molecular testing of tumor tissue.21 However, we assessed the potential of ML to determine whether the mutation is present by computerized morphologic analysis alone. Our last experiment examined the ability of the Apple and Google platforms to differentiate between adenocarcinomas of lung origin vs colon origin. This has potential utility in determining the site of origin of metastatic carcinoma.22
Methods
Fifty cases of lung SCC, 50 cases of lung adenocarcinoma, and 50 cases of colon adenocarcinoma were randomly retrieved from our molecular database. Twenty-five colon adenocarcinoma cases were positive for mutation in KRAS, while 25 cases were negative for mutation in KRAS. Seven hundred fifty total images of lung tissue (250 benign lung tissue, 250 lung adenocarcinomas, and 250 lung SCCs) and 500 total images of colon tissue (250 benign colon tissue and 250 colon adenocarcinoma) were obtained using a Leica Microscope MC190 HD Camera (Wetzlar, Germany) connected to an Olympus BX41 microscope (Center Valley, PA) and the Leica Acquire 9072 software for Apple computers. All the images were captured at a resolution of 1024 x 768 pixels using a 60x dry objective. Lung tissue images were captured and saved on a 2012 Apple MacBook Pro computer, and colon images were captured and saved on a 2011 Apple iMac computer. Both computers were running macOS v10.13.
Creating Image Classifier Models Using Apple Create ML
Apple Create ML is a suite of products that use various tools to create and train custom ML models on Apple computers.15 The suite contains many features, including image classification to train a ML model to classify images, natural language processing to classify natural language text, and tabular data to train models that deal with labeling information or estimating new quantities. We used Create ML Image Classification to create image classifier models for our project (Appendix A).
Creating ML Modules Using Google Cloud AutoML Vision Beta
Google Cloud AutoML is a suite of machine learning products, including AutoML Vision, AutoML Natural Language and AutoML Translation.14 All Cloud AutoML machine learning products were in beta version at the time of experimentation. We used Cloud AutoML Vision beta to create ML modules for our project. Unlike Apple Create ML, which is run on a local Apple computer, the Google Cloud AutoML is run online using a Google Cloud account. There are no minimum specifications requirements for the local computer since it is using the cloud-based architecture (Appendix B).
Experiment 1
We compared Apple Create ML Image Classifier and Google AutoML Vision in their ability to detect and subclassify NSCLC based on the histopathologic images. We created 3 classes of images (250 images each): benign lung tissue, lung adenocarcinoma, and lung SCC.
Experiment 2
We compared Apple Create ML Image Classifier and Google AutoML Vision in their ability to differentiate between normal lung tissue and NSCLC histopathologic images with 50/50 mixture of lung adenocarcinoma and lung SCC. We created 2 classes of images (250 images each): benign lung tissue and lung NSCLC.
Experiment 3
We compared Apple Create ML Image Classifier and Google AutoML Vision in their ability to differentiate between lung adenocarcinoma and lung SCC histopathologic images. We created 2 classes of images (250 images each): adenocarcinoma and SCC.
Experiment 4
We compared Apple Create ML Image Classifier and Google AutoML Vision in their ability to detect colon cancer histopathologic images regardless of mutation in KRAS status. We created 2 classes of images (250 images each): benign colon tissue and colon adenocarcinoma.
Experiment 5
We compared Apple Create ML Image Classifier and Google AutoML Vision in their ability to differentiate between colon adenocarcinoma with mutations in KRAS and colon adenocarcinoma without the mutation in KRAS histopathologic images. We created 2 classes of images (125 images each): colon adenocarcinoma cases with mutation in KRAS and colon adenocarcinoma cases without the mutation in KRAS.
Experiment 6
We compared Apple Create ML Image Classifier and Google AutoML Vision in their ability to differentiate between lung adenocarcinoma and colon adenocarcinoma histopathologic images. We created 2 classes of images (250 images each): colon adenocarcinoma lung adenocarcinoma.
Results
Twelve machine learning models were created in 6 experiments using the Apple Create ML and the Google AutoML (Table). To investigate recall and precision differences between the Apple and the Google ML algorithms, we performed 2-tailed distribution, paired t tests. No statistically significant differences were found (P = .52 for recall and .60 for precision).
Overall, each model performed well in distinguishing between normal and neoplastic tissue for both lung and colon cancers. In subclassifying NSCLC into adenocarcinoma and SCC, the models were shown to have high levels of precision and recall. The models also were successful in distinguishing between lung and colonic origin of adenocarcinoma (Figures 1-4). However, both systems had trouble discerning colon adenocarcinoma with mutations in KRAS from adenocarcinoma without mutations in KRAS.
Discussion
Image classifier models using ML algorithms hold a promising future to revolutionize the health care field. ML products, such as those modules offered by Apple and Google, are easy to use and have a simple graphic user interface to allow individuals to train models to perform humanlike tasks in real time. In our experiments, we compared multiple algorithms to determine their ability to differentiate and subclassify histopathologic images with high precision and recall using common scenarios in treating veteran patients.
Analysis of the results revealed high precision and recall values illustrating the models’ ability to differentiate and detect benign lung tissue from lung SCC and lung adenocarcinoma in ML model 1, benign lung from NSCLC carcinoma in ML model 2, and benign colon from colonic adenocarcinoma in ML model 4. In ML model 3 and 6, both ML algorithms performed at a high level to differentiate lung SCC from lung adenocarcinoma and lung adenocarcinoma from colonic adenocarcinoma, respectively. Of note, ML model 5 had the lowest precision and recall values across both algorithms demonstrating the models’ limited utility in predicting molecular profiles, such as mutations in KRAS as tested here. This is not surprising as pathologists currently require complex molecular tests to detect mutations in KRAS reliably in colon cancer.
Both modules require minimal programming experience and are easy to use. In our comparison, we demonstrated critical distinguishing characteristics that differentiate the 2 products.
Apple Create ML image classifier is available for use on local Mac computers that use Xcode version 10 and macOS 10.14 or later, with just 3 lines of code required to perform computations. Although this product is limited to Apple computers, it is free to use, and images are stored on the computer hard drive. Of unique significance on the Apple system platform, images can be augmented to alter their appearance to enhance model training. For example, imported images can be cropped, rotated, blurred, and flipped, in order to optimize the model’s training abilities to recognize test images and perform pattern recognition. This feature is not as readily available on the Google platform. Apple Create ML Image classifier’s default training set consists of 75% of total imported images with 5% of the total images being randomly used as a validation set. The remaining 20% of images comprise the testing set. The module’s computational analysis to train the model is achieved in about 2 minutes on average. The score threshold is set at 50% and cannot be manipulated for each image class as in Google AutoML Vision.
Google AutoML Vision is open and can be accessed from many devices. It stores images on remote Google servers but requires computing fees after a $300 credit for 12 months. On AutoML Vision, random 80% of the total images are used in the training set, 10% are used in the validation set, and 10% are used in the testing set. It is important to highlight the different percentages used in the default settings on the respective modules. The time to train the Google AutoML Vision with default computational power is longer on average than Apple Create ML, with about 8 minutes required to train the machine learning module. However, it is possible to choose more computational power for an additional fee and decrease module training time. The user will receive e-mail alerts when the computer time begins and is completed. The computation time is calculated by subtracting the time of the initial e-mail from the final e-mail.
Based on our calculations, we determined there was no significant difference between the 2 machine learning algorithms tested at the default settings with recall and precision values obtained. These findings demonstrate the promise of using a ML algorithm to assist in the performance of human tasks and behaviors, specifically the diagnosis of histopathologic images. These results have numerous potential uses in clinical medicine. ML algorithms have been successfully applied to diagnostic and prognostic endeavors in pathology,23-28 dermatology,29-31 ophthalmology,32 cardiology,33 and radiology.34-36
Pathologists often use additional tests, such as special staining of tissues or molecular tests, to assist with accurate classification of tumors. ML platforms offer the potential of an additional tool for pathologists to use along with human microscopic interpretation.37,38 In addition, the number of pathologists in the US is dramatically decreasing, and many other countries have marked physician shortages, especially in fields of specialized training such as pathology.39-42 These models could readily assist physicians in underserved countries and impact shortages of pathologists elsewhere by providing more specific diagnoses in an expedited manner.43
Finally, although we have explored the application of these platforms in common cancer scenarios, great potential exists to use similar techniques in the detection of other conditions. These include the potential for classification and risk assessment of precancerous lesions, infectious processes in tissue (eg, detection of tuberculosis or malaria),24,44 inflammatory conditions (eg, arthritis subtypes, gout),45 blood disorders (eg, abnormal blood cell morphology),46 and many others. The potential of these technologies to improve health care delivery to veteran patients seems to be limited only by the imagination of the user.47
Regarding the limited effectiveness in determining the presence or absence of mutations in KRAS for colon adenocarcinoma, it is mentioned that currently pathologists rely on complex molecular tests to detect the mutations at the DNA level.21 It is possible that the use of more extensive training data sets may improve recall and precision in cases such as these and warrants further study. Our experiments were limited to the stipulations placed by the free trial software agreements; no costs were expended to use the algorithms, though an Apple computer was required.
Conclusion
We have demonstrated the successful application of 2 readily available ML platforms in providing diagnostic guidance in differentiation between common cancer conditions in veteran patient populations. Although both platforms performed very well with no statistically significant differences in results, some distinctions are worth noting. Apple Create ML can be used on local computers but is limited to an Apple operating system. Google AutoML is not platform-specific but runs only via Google Cloud with associated computational fees. Using these readily available models, we demonstrated the vast potential of AI in diagnostic pathology. The application of AI to clinical medicine remains in the very early stages. The VA is uniquely poised to provide leadership as AI technologies will continue to dramatically change the future of health care, both in veteran and nonveteran patients nationwide.
Acknowledgments
The authors thank Paul Borkowski for his constructive criticism and proofreading of this manuscript. This material is the result of work supported with resources and the use of facilities at the James A. Haley Veterans’ Hospital.
1. Moor J. The Dartmouth College artificial intelligence conference: the next fifty years. AI Mag. 2006;27(4):87-91.
2. Trump D. Accelerating America’s leadership in artificial intelligence. https://www.whitehouse.gov/articles/accelerating-americas-leadership-in-artificial-intelligence. Published February 11, 2019. Accessed September 4, 2019.
3. Samuel AL. Some studies in machine learning using the game of checkers. IBM J Res Dev. 1959;3(3):210-229.
4. SAS Users Group International. Neural networks and statistical models. In: Sarle WS. Proceedings of the Nineteenth Annual SAS Users Group International Conference. SAS Institute: Cary, North Carolina; 1994:1538-1550. http://www.sascommunity.org/sugi/SUGI94/Sugi-94-255%20Sarle.pdf. Accessed September 16, 2019.
5. Schmidhuber J. Deep learning in neural networks: an overview. Neural Networks. 2015;61:85-117.
6. LeCun Y, Bengio Y, Hinton G. Deep learning. Nature. 2015;521(7553):436-444.
7. Jiang F, Jiang Y, Li H, et al. Artificial intelligence in healthcare: past, present and future. Stroke Vasc Neurol. 2017;2(4):230-243.
8. Erickson BJ, Korfiatis P, Akkus Z, Kline TL. Machine learning for medical imaging. Radiographics. 2017;37(2):505-515.
9. Deo RC. Machine learning in medicine. Circulation. 2015;132(20):1920-1930.
10. Janowczyk A, Madabhushi A. Deep learning for digital pathology image analysis: a comprehensive tutorial with selected use cases. J Pathol Inform. 2016;7(1):29.
11. Oquab M, Bottou L, Laptev I, Sivic J. Learning and transferring mid-level image representations using convolutional neural networks. Presented at: IEEE Conference on Computer Vision and Pattern Recognition, 2014. http://openaccess.thecvf.com/content_cvpr_2014/html/Oquab_Learning_and_Transferring_2014_CVPR_paper.html. Accessed September 4, 2019.
12. Shin HC, Roth HR, Gao M, et al. Deep convolutional neural networks for computer-aided detection: CNN architectures, dataset characteristics and transfer learning. IEEE Trans Med Imaging. 2016;35(5):1285-1298.
13. Tajbakhsh N, Shin JY, Gurudu SR, et al. Convolutional neural networks for medical image analysis: full training or fine tuning? IEEE Trans Med Imaging. 2016;35(5):1299-1312.
14. Cloud AutoML. https://cloud.google.com/automl. Accessed September 4, 2019.
15. Create ML. https://developer.apple.com/documentation/createml. Accessed September 4, 2019.
16. Zullig LL, Sims KJ, McNeil R, et al. Cancer incidence among patients of the U.S. Veterans Affairs Health Care System: 2010 Update. Mil Med. 2017;182(7):e1883-e1891. 17. Borkowski AA, Wilson CP, Borkowski SA, Deland LA, Mastorides SM. Using Apple machine learning algorithms to detect and subclassify non-small cell lung cancer. https://arxiv.org/ftp/arxiv/papers/1808/1808.08230.pdf. Accessed September 4, 2019.
18. Borkowski AA, Wilson CP, Borkowski SA, Thomas LB, Deland LA, Mastorides SM. Apple machine learning algorithms successfully detect colon cancer but fail to predict KRAS mutation status. http://arxiv.org/abs/1812.04660. Revised January 15,2019. Accessed September 4, 2019.
19. Armaghany T, Wilson JD, Chu Q, Mills G. Genetic alterations in colorectal cancer. Gastrointest Cancer Res. 2012;5(1):19-27.
20. Herzig DO, Tsikitis VL. Molecular markers for colon diagnosis, prognosis and targeted therapy. J Surg Oncol. 2015;111(1):96-102.
21. Ma W, Brodie S, Agersborg S, Funari VA, Albitar M. Significant improvement in detecting BRAF, KRAS, and EGFR mutations using next-generation sequencing as compared with FDA-cleared kits. Mol Diagn Ther. 2017;21(5):571-579.
22. Greco FA. Molecular diagnosis of the tissue of origin in cancer of unknown primary site: useful in patient management. Curr Treat Options Oncol. 2013;14(4):634-642.
23. Bejnordi BE, Veta M, van Diest PJ, et al. Diagnostic assessment of deep learning algorithms for detection of lymph node metastases in women with breast cancer. JAMA. 2017;318(22):2199-2210.
24. Xiong Y, Ba X, Hou A, Zhang K, Chen L, Li T. Automatic detection of mycobacterium tuberculosis using artificial intelligence. J Thorac Dis. 2018;10(3):1936-1940.
25. Cruz-Roa A, Gilmore H, Basavanhally A, et al. Accurate and reproducible invasive breast cancer detection in whole-slide images: a deep learning approach for quantifying tumor extent. Sci Rep. 2017;7:46450.
26. Coudray N, Ocampo PS, Sakellaropoulos T, et al. Classification and mutation prediction from non–small cell lung cancer histopathology images using deep learning. Nat Med. 2018;24(10):1559-1567.
27. Ertosun MG, Rubin DL. Automated grading of gliomas using deep learning in digital pathology images: a modular approach with ensemble of convolutional neural networks. AMIA Annu Symp Proc. 2015;2015:1899-1908.
28. Wahab N, Khan A, Lee YS. Two-phase deep convolutional neural network for reducing class skewness in histopathological images based breast cancer detection. Comput Biol Med. 2017;85:86-97.
29. Esteva A, Kuprel B, Novoa RA, et al. Dermatologist-level classification of skin cancer with deep neural networks. Nature. 2017;542(7639):115-118.
30. Han SS, Park GH, Lim W, et al. Deep neural networks show an equivalent and often superior performance to dermatologists in onychomycosis diagnosis: automatic construction of onychomycosis datasets by region-based convolutional deep neural network. PLoS One. 2018;13(1):e0191493.
31. Fujisawa Y, Otomo Y, Ogata Y, et al. Deep-learning-based, computer-aided classifier developed with a small dataset of clinical images surpasses board-certified dermatologists in skin tumour diagnosis. Br J Dermatol. 2019;180(2):373-381.
32. Gulshan V, Peng L, Coram M, et al. Development and validation of a deep learning algorithm for detection of diabetic retinopathy in retinal fundus photographs. JAMA. 2016;316(22):2402-2010.
33. Weng SF, Reps J, Kai J, Garibaldi JM, Qureshi N. Can machine-learning improve cardiovascular risk prediction using routine clinical data? PLoS One. 2017;12(4):e0174944.
34. Cheng J-Z, Ni D, Chou Y-H, et al. Computer-aided diagnosis with deep learning architecture: applications to breast lesions in US images and pulmonary nodules in CT scans. Sci Rep. 2016;6(1):24454.
35. Wang X, Yang W, Weinreb J, et al. Searching for prostate cancer by fully automated magnetic resonance imaging classification: deep learning versus non-deep learning. Sci Rep. 2017;7(1):15415.
36. Lakhani P, Sundaram B. Deep learning at chest radiography: automated classification of pulmonary tuberculosis by using convolutional neural networks. Radiology. 2017;284(2):574-582.
37. Bardou D, Zhang K, Ahmad SM. Classification of breast cancer based on histology images using convolutional neural networks. IEEE Access. 2018;6(6):24680-24693.
38. Sheikhzadeh F, Ward RK, van Niekerk D, Guillaud M. Automatic labeling of molecular biomarkers of immunohistochemistry images using fully convolutional networks. PLoS One. 2018;13(1):e0190783.
39. Metter DM, Colgan TJ, Leung ST, Timmons CF, Park JY. Trends in the US and Canadian pathologist workforces from 2007 to 2017. JAMA Netw Open. 2019;2(5):e194337.
40. Benediktsson, H, Whitelaw J, Roy I. Pathology services in developing countries: a challenge. Arch Pathol Lab Med. 2007;131(11):1636-1639.
41. Graves D. The impact of the pathology workforce crisis on acute health care. Aust Health Rev. 2007;31(suppl 1):S28-S30.
42. NHS pathology shortages cause cancer diagnosis delays. https://www.gmjournal.co.uk/nhs-pathology-shortages-are-causing-cancer-diagnosis-delays. Published September 18, 2018. Accessed September 4, 2019.
43. Abbott LM, Smith SD. Smartphone apps for skin cancer diagnosis: Implications for patients and practitioners. Australas J Dermatol. 2018;59(3):168-170.
44. Poostchi M, Silamut K, Maude RJ, Jaeger S, Thoma G. Image analysis and machine learning for detecting malaria. Transl Res. 2018;194:36-55.
45. Orange DE, Agius P, DiCarlo EF, et al. Identification of three rheumatoid arthritis disease subtypes by machine learning integration of synovial histologic features and RNA sequencing data. Arthritis Rheumatol. 2018;70(5):690-701.
46. Rodellar J, Alférez S, Acevedo A, Molina A, Merino A. Image processing and machine learning in the morphological analysis of blood cells. Int J Lab Hematol. 2018;40(suppl 1):46-53.
47. Litjens G, Kooi T, Bejnordi BE, et al. A survey on deep learning in medical image analysis. Med Image Anal. 2017;42:60-88.
Feeding during High-Flow Nasal Cannula for Bronchiolitis: Associations with Time to Discharge
Bronchiolitis is the most common cause of nonbirth hospitalization in children in the United States less than one year of age.1 For children with severe bronchiolitis, high-flow nasal cannula (HFNC) is increasingly used2-4 to reduce work of breathing and prevent the need for further escalation of ventilatory support.5,6 Although previous studies suggest that enteral feeding is recommended in the management of patients hospitalized with bronchiolitis,7-9 limited evidence exists to guide feeding practices for patients receiving HFNC support.5,10,11
Respiratory support with HFNC has been associated with prolonged periods without enteral hydration/nutrition (ie, nil per os [NPO])12 primarily due to anticipation of further escalation of respiratory support or concern for increased risk of aspiration. The majority of patients with bronchiolitis managed with HFNC, however, do not require escalation of care.5,13 When feeding is attempted during HFNC support, it is frequently interrupted.5 Moreover, keeping all children NPO when receiving HFNC may be associated with weight loss and longer length of stay (LOS).12,14 Two small studies found that children admitted to the intensive care unit who received HFNC support for bronchiolitis did not have increased rates of emesis, worsening respiratory distress or aspiration pneumonia when enterally fed.10,11 However, no comparison of adverse events or LOS has been made between patients who were fed and those who were not fed during HFNC therapy, and previous studies have included only patients who have received HFNC in the intensive care setting.
Supporting safe feeding early in hospitalizations for bronchiolitis may facilitate expedited clinical improvement and discharge. As part of an ongoing bronchiolitis quality improvement initiative at our hospital, we sought to characterize feeding practices during HFNC therapy and assess whether feeding exposure was associated with (1) time to discharge after HFNC or (2) feeding-related adverse events. We hypothesized that feeding during HFNC therapy would be associated with a shorter time to discharge after HFNC cessation.
METHODS
Study Design, Setting, Participants
This was a retrospective cohort study of patients aged 1-24 months receiving HFNC support for respiratory failure due to bronchiolitis at an academic children’s hospital between January 1, 2015 and March 1, 2017. Our institution has had a clinical practice guideline, associated order set, and respiratory therapy protocol for general care patients with bronchiolitis since 2009. Patients with bronchiolitis who were weaning HFNC have been cared for in both the intensive and general care settings since 2013. A formal process for initiation of HFNC on general care units was instituted in January of 2017. During the study period, no patients with HFNC support for bronchiolitis had all their care entirely outside the intensive care unit at our institution. However, initiation and subsequent use of HFNC may have occurred in either the intensive care or general care setting. No specific guidance for feeding during HFNC existed during this period.
Patients were identified using the Virtual PICU Systems database, (VPS LLC, myvps.org, Los Angeles, California) and, by definition, all patients received at least some of their care in the intensive care unit. Patients with comorbid conditions of prematurity (<35 weeks) and those with cardiopulmonary, neuromuscular, and genetic diseases were included. Patients with preexisting dysphagia, defined as ongoing outpatient speech therapy for swallowing concerns, an admission diagnosis of aspiration pneumonia or on home respiratory support, were excluded. Children (n = 7) were excluded if they had more than one period of HFNC during admission. This study was determined to be exempt by the University of Wisconsin School of Medicine and Public Health’s Institutional Review Board.
Data Collection and Study Variables
The following variables were collected from VPS administrative data: patient gender, age, admission and discharge date and time, type and total hours of respiratory support, intensive care admission, and LOS (in hours). Additional demographic, clinical, and feeding exposure variables were abstracted manually from the electronic medical record (Epic, Verona, Wisconsin) using a structured data collection tool and stored in REDCap (Research Electronic Data Capture)15 including prematurity, race/ethnicity, insurance status, primary language, and passive tobacco smoke exposure. Clinical variables included duration of illness (days) at the time of admission, unit of HFNC initiation (emergency department, general care, intensive care, respiratory rate and oxygen saturation at HFNC initiation (<90%, 91%-92%, or >92%), acquisition of blood gas at HFNC admission, duration of time on HFNC (hours) and need for intubation or noninvasive ventilation prior to HFNC. The Pediatric Index of Mortality 2 Risk of Mortality (PIM 2 ROM)16 was used to estimate the severity of illness. The PIM2ROM uses clinical variables (systolic blood pressure, fixed pupils, measure of hypoxia using PaO2/FiO2 ratio, base excess, mechanical ventilation, elective admission, recovery from surgery, cardiac bypass, high-risk diagnosis, low-risk diagnosis) collected at the time of intensive care admission to generate a score that predicts the risk of mortality for an individual patient.17
Feeding exposures were documented in three-hour intervals from HFNC initiation to completion using a structured protocol. At each interval the following feeding information was abstracted from a review of nursing and physician documentation and relevant clinical flowsheets: presence or absence of feeding during the interval, route of feeding (oral, nasogastric [NG] or nasojejunal [NJ]). Feeding exposure was categorized a priori as fed at any point during HFNC (vs not fed at any point). Fed children were further characterized as (1) mixed feeding consisting of oral and tube feeds (NG or NJ) or (2) exclusive oral feeding throughout HFNC support (Appendix 1).
The primary outcome was the number of hours to discharge from HFNC cessation. Secondary outcomes were time to discharge from HFNC initiation, all-cause readmissions within seven days of discharge, and potential feeding-related adverse events. Potential adverse events included: (1) aspiration, defined as initiation of antibiotic AND either chest radiograph official interpreted as evidence for aspiration and/or documented concern for aspiration from the treating physician, or (2) intubation after feeding during HFNC.
Statistical Analysis
Descriptive statistics evaluated differences in demographics and clinical variables for feeding exposure groups. We used chi-squared tests for differences in proportions and t-tests or Wilcoxon Rank-Sum tests for differences in means or medians for continuous variables, respectively. Associations between feeding exposure during HFNC and time to discharge (measured in hours) after HFNC completion were modeled with Cox proportional hazards regression. Using this approach, hazard ratios (HR)>1 indicate a higher hazard (rate) of discharge for children with a feeding exposure than for children without the exposure. For example, a hazard ratio equal to two indicates that the exposed population is discharged at twice the rate per unit time as the nonexposed population. Death or censoring events did not occur. Feeding exposure was first modeled dichotomously as not fed or fed. To further explore associations between feeding modality and our outcome, we then modeled feeding exposure categorically as not fed (reference), mixed (oral and tube) feeding, or exclusive oral feeding throughout HFNC.
After constructing a set of unadjusted models, we then adjusted the models for variables having independent (bivariate P < .10) associations with time to discharge: age, unit of HFNC initiation, highest respiratory support required before HFNC, and HFNC duration. Finally, to attempt to account for residual confounding from latent constructs, we also created a set of propensity-weighted Cox proportional hazards models. Propensity weights18 reflecting the probability of being fed or never being fed during HFNC were created using logistic regression with predictors we hypothesized a priori that may have influenced the clinical decision to feed during HFNC: age, day of illness on admission, prematurity, PIM2 ROM score, respiratory rate, oxygen saturation and blood gas acquisition at HFNC initiation, and highest respiratory support required before HFNC. All analyses were conducted using STATA 14.0 (StataCorp, College Station, Texas), and adjusted hazard ratios (aHR) with 95% confidence intervals (95% CIs) were reported.
RESULTS
Patients (n = 123) had a mean age of 7.3 months (standard deviation [SD] 7.1) and presented on day of illness 4.8 (SD 2.3). Prior to HFNC, 10% required higher respiratory support (3% mechanical ventilation). Former preterm children were 12% of the overall sample.
During HFNC, 37% of patients were never fed, 41% were exclusively orally fed, and 23% had tube or mixed oral and tube feedings (Table 1 and Appendix 2). Children who were not fed were older, but groups were otherwise similar in terms of gender, race/ethnicity, passive smoke exposure, day of illness, unit of HFNC initiation, respiratory support required prior to HFNC, and respiratory rate at HFNC initiation.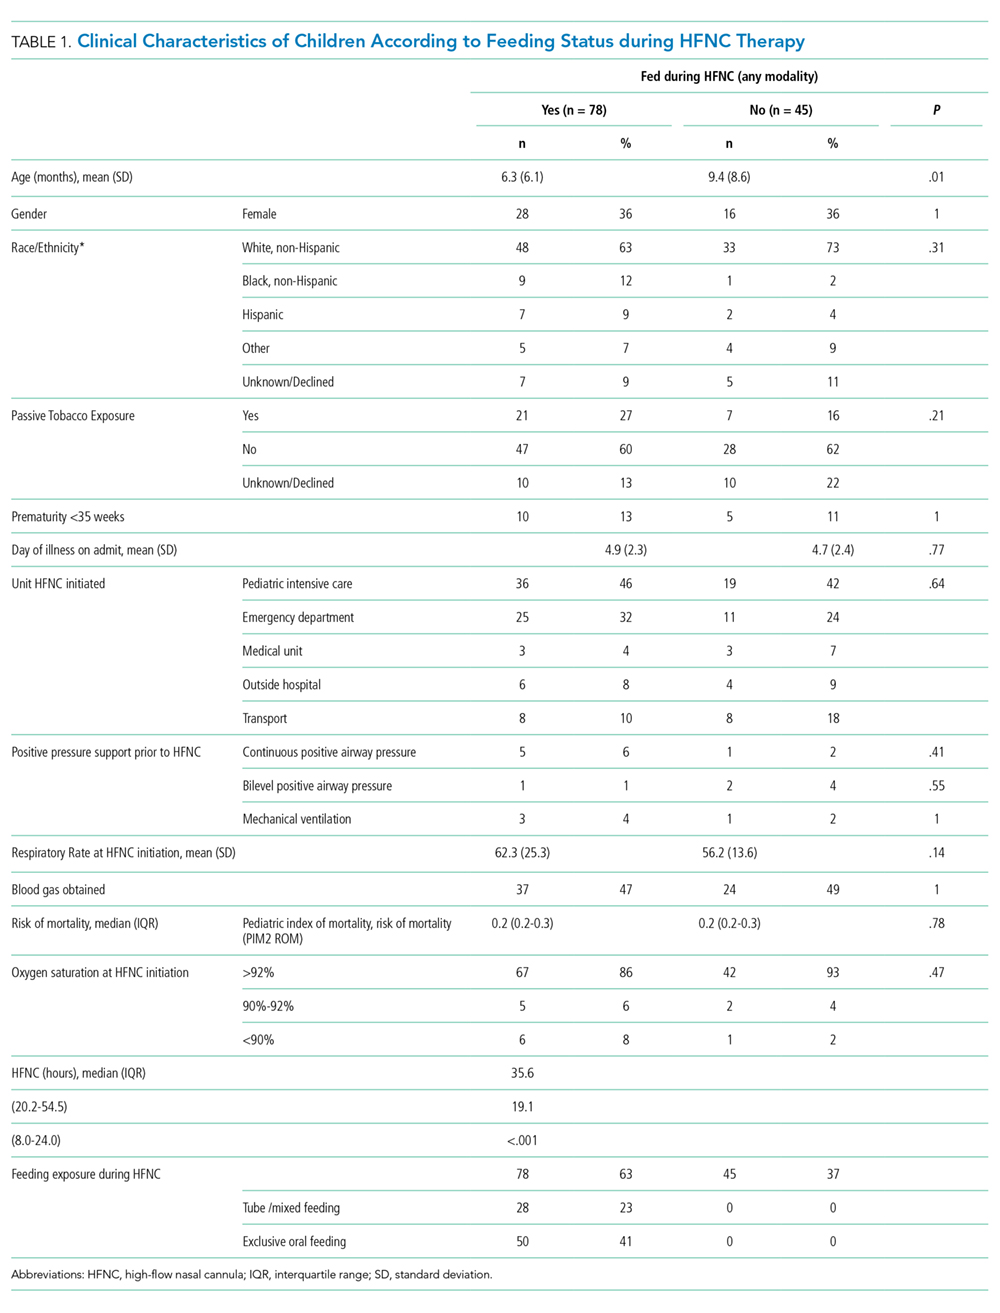
Median time to discharge after HFNC completion was 31.4 hours (interquartile range [IQR] 23.9-52). Median (IQR) time to discharge was 29.5 (IQR 23.5-47.9) hours in children who were fed and 39.8 (26.4-61.5) hours in those who were not fed (unadjusted HR 1.25 [0.86-1.82], aHR 1.83 [95% CI: 1.16-2.88]). Time to discharge was shortest when children were fed exclusively orally (Figure). Compared with children who were not fed, time to discharge following HFNC completion was significantly shorter for those who were exclusively orally fed (aHR 2.13 [95% CI: 1.31-3.45]; Table 2). Results of the propensity-weighted model were similar: time to discharge after completing HFNC was shorter in fed versus not fed children (HR 2.17; 95 % CI: 1.34-3.50). The secondary outcome, time to discharge from HFNC initiation, had a similar relationship, ie, shorter time to discharge with exclusive oral feeding vs not feeding [aHR 1.95 (95% CI: 1.19-3.18)]. Time to discharge after initiation of HFNC was also shorter for fed versus not fed in propensity-weighted analysis (HR 1.97; 95% CI: 1.13-3.43).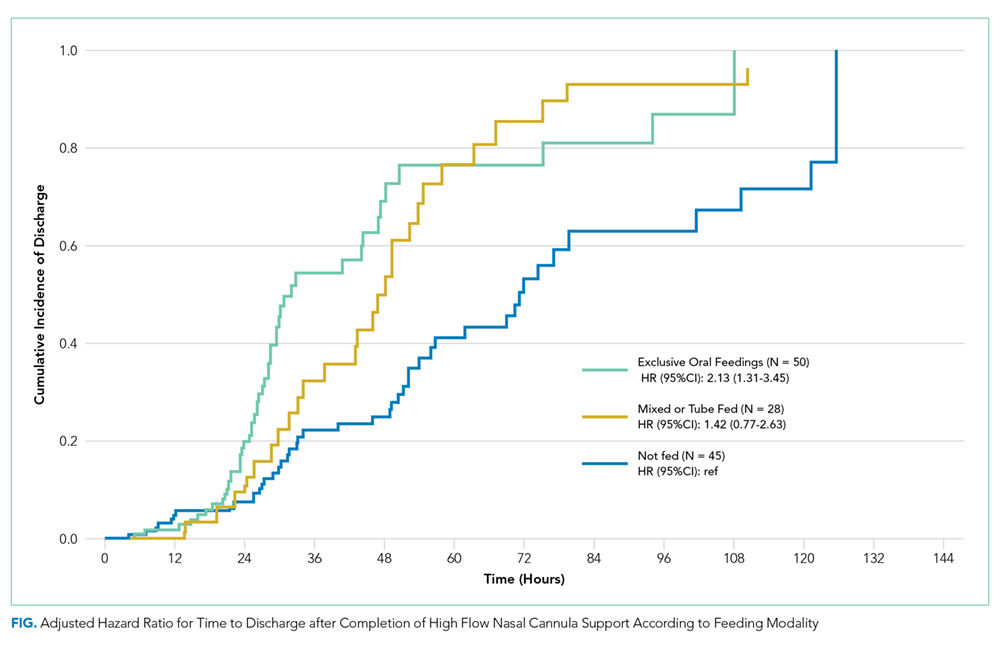
DISCUSSION
This observational study found that being fed during HFNC was associated with shorter time to discharge after HFNC support was completed. Exclusive oral feeding was associated with the shortest time to discharge, and these results were consistent across a variety of analytical approaches. Adverse events were rare and occurred in both fed and unfed children.
These findings advance research on relationships between nutrition and bronchiolitis outcomes. Studies of general care patients with bronchiolitis without HFNC have observed associations between poor nutrition and prolonged LOS.19,20 Two previous studies of patients receiving HFNC therapy for bronchiolitis concluded that frequent interruption11 and later initiation of enteral nutrition10 during ICU stay was associated with longer time to discharge.11 To our knowledge, this is the first study of patients with bronchiolitis treated with HFNC in both general care and ICU settings that compared outcomes according to whether children were fed during HFNC therapy. Our results extend previous work demonstrating that delays in feeding may be associated with longer LOS.
Decisions to feed children with respiratory distress due to bronchiolitis are complex and often subjective. Readiness to feed may be based upon the assessment of a child’s work of breathing, trajectory of illness, institutional culture, and individual physician, nurse, respiratory therapist or speech-language pathologist comfort. In the absence of established feeding best practices,21 some institutions have developed guidelines based on local expert opinion; however, often these recommendations remain largely subjective and nonspecific.5,10,22-24 Although decisions to feed may be influenced by concern about a child’s clinical stability and feeding risk, we found few objective clinical differences between children fed (orally or by enteral tube) or not fed. Moreover, our results were consistent even when we used a propensity-weighted model to account for measured factors that may have been associated with the decision to initiate feeding. This suggests the decision to feed could be more arbitrary than we assume and is important to investigate in future research.
Additionally, although a few early studies have aimed to standardize the process of weaning HFNC support in bronchiolitis,25,26 this process is also largely subjective.10,22,23 As such, the weaning process may be influenced by perceptions of the child’s overall health. Orally fed children may be viewed as more comfortable or well and thus, more readily weaned, which ultimately influences the length of HFNC therapy. Our study design attempted to account for this potential bias by measuring time to discharge following HFNC therapy, rather than measuring total LOS. Meeting adequate calorie, weight, or hydration goals prior to discharge may take longer if feeds have been withheld. We speculate that prolonged periods of NPO might also risk transient oral aversion or feeding discoordination that could influence LOS. Previous research involving broad intensive care unit populations has established the importance of providing nutrition to critically ill children as soon as possible as a means of improving outcomes.27-29 Patients receiving HFNC support for bronchiolitis could plausibly experience similar benefits.
This single-center study with a relatively small sample size has important limitations to consider. The observational design limits our ability to draw conclusions about causal relationships between feeding, time to discharge, and adverse events. In particular, feeding exposure did not account for nuances in feeding timing, feeding density, and other elements of feeding exposure. Additionally, adverse events are rare, and this study is inadequately powered to detect differences between exposure groups. Although we included children cared for in general and intensive care units, our findings may not be generalizable to other hospitals with different placement criteria. Despite the creation of adjusted and propensity-weighted models, our results are still subject to possible residual indication bias. We cannot control for all possible confounders, particularly unmeasured factors which might simultaneously motivate decisions whether, when, and how to feed children receiving HFNC therapy and influence time to discharge after HFNC is finished. Although this study observed associations between feeding during HFNC and both our primary (time to discharge after HFNC was complete) and secondary (time to discharge after HFNC was initiated) outcomes, future work should evaluate how feeding strategies might impact total LOS, particularly as management becomes more standardized.
Prospective studies of feeding exposures during HFNC therapy in bronchiolitis, as well as rigorous interventional study designs, are needed to confirm shorter lengths of stay and safety with larger and more diverse samples. Future research should evaluate methods to safely and effectively feed children with severe bronchiolitis, which would inform standardized evidence-based approaches. Given the scale on which children with bronchiolitis are admitted each year, the implications of such work could be substantial.
CONCLUSION
Children fed while receiving HFNC for bronchiolitis may have shorter time to discharge than those who are not fed. Feeding-related adverse events were rare regardless of the feeding method. Controlled prospective studies addressing residual confounding are needed to justify a change in the current practice.
Acknowledgments
The authors would like to acknowledge the valuable feedback on earlier drafts from members of the University of Wisconsin Division of Pediatric Hospital Medicine CREATE writing group.
1. HCUPnet. http s://hcupnet.ahrq.gov/. Accessed February 7, 2019.
2. Beggs S, Wong ZH, Kaul S, Ogden KJ, Walters JA. High-flow nasal cannula therapy for infants with bronchiolitis. Cochrane Database Syst Rev. 2014;1(1):CD009609. https://doi.org/10.1002/14651858.CD009609.pub2.
3. Mayfield S, Bogossian F, O’Malley L, Schibler A. High-flow nasal cannula oxygen therapy for infants with bronchiolitis: pilot study. J Paediatr Child Health. 2014;50(5):373-378. https://doi.org/10.1111/jpc.12509.
4. Hilliard TN, Archer N, Laura H, et al. Pilot study of vapotherm oxygen delivery in moderately severe bronchiolitis. Arch Dis Child. 2012;97(2):182-183. https://doi.org/10.1136/archdischild-2011-301151.
5. Franklin D, Babl FE, Schlapbach LJ, et al. A randomized trial of high-flow oxygen therapy in infants with bronchiolitis. N Engl J Med. 2018;378(12):1121-1131. https://doi.org/10.1056/NEJMoa1714855.
6. McKiernan C, Chua LC, Visintainer PF, Allen H. High flow nasal cannulae therapy in infants with bronchiolitis. J Pediatr. 2010;156(4):634-638. https://doi.org/10.1016/j.jpeds.2009.10.039.
7. Maffey A, Moviglia T, Mirabello C, et al. Swallowing and respiratory distress in hospitalized patients with bronchiolitis. Dysphagia. 2013;28(4):582-587. https://doi.org/10.1007/s00455-013-9470-0.
8. Kugelman A, Raibin K, Dabbah H, et al. Intravenous fluids versus gastric-tube feeding in hospitalized infants with viral bronchiolitis: a randomized, prospective pilot study. J Pediatr. 2013;162(3):640-642.e641. https://doi.org/10.1016/j.jpeds.2012.10.057.
9. Oakley E, Borland M, Neutze J, et al. Nasogastric hydration versus intravenous hydration for infants with bronchiolitis: a randomised trial. Lancet Respir Med. 2013;1(2):113-120. https://doi.org/10.1016/S2213-2600(12)70053-X.
10. Slain KN, Martinez-Schlurmann N, Shein SL, Stormorken A. Nutrition and high-flow nasal cannula respiratory support in children with bronchiolitis. Hosp Pediatr. 2017;7(5):256-262. https://doi.org/10.1542/hpeds.2016-0194.
11. Sochet AA, McGee JA, October TW. Oral nutrition in children with bronchiolitis on high-flow nasal cannula is well tolerated. Hosp Pediatr. 2017;7(5):249-255. https://doi.org/10.1542/hpeds.2016-0131.
12. Canarie MF, Barry S, Carroll CL, et al. Risk factors for delayed enteral nutrition in critically ill children. Pediatr Crit Care Med. 2015;16(8):e283-e289. https://doi.org/10.1097/PCC.0000000000000527.
13. Schibler A, Pham TM, Dunster KR, et al. Reduced intubation rates for infants after introduction of high-flow nasal prong oxygen delivery. Intensive Care Med. 2011;37(5):847-852. https://doi.org/10.1007/s00134-011-2177-5.
14. Hamilton S, McAleer DM, Ariagno K, et al. A stepwise enteral nutrition algorithm for critically ill children helps achieve nutrient delivery goals*. Pediatr Crit Care Med. 2014;15(7):583-589. https://doi.org/10.1097/PCC.0000000000000179.
15. Harris PA, Taylor R, Thielke R, et al. Research electronic data capture (REDCap)--a metadata-driven methodology and workflow process for providing translational research informatics support. J Biomed Inform. 2009;42(2):377-381. https://doi.org/10.1016/j.jbi.2008.08.010.
16. Slater A, Shann F, Group APS. The suitability of the Pediatric Index of Mortality (PIM), PIM2, the Pediatric Risk of Mortality (PRISM), and PRISM III for monitoring the quality of pediatric intensive care in Australia and New Zealand. Pediatr Crit Care Med. 2004;5(5):447-454. https://doi.org/10.1097/01.PCC.0000138557.31831.65.
17. Slater A, Shann F, Pearson G, Paediatric Index of Mortality Study G. PIM2: a revised version of the Paediatric Index of Mortality. Intensive Care Med. 2003;29(2):278-285. https://doi.org/10.1007/s00134-002-1601-2.
18. Lanza ST, Moore JE, Butera NM. Drawing causal inferences using propensity scores: a practical guide for community psychologists. Am J Commun Psychol. 2013;52(3-4):380-392. https://doi.org/10.1007/s10464-013-9604-4.
19. Weisgerber MC, Lye PS, Li SH, et al. Factors predicting prolonged hospital stay for infants with bronchiolitis. J Hosp Med. 2011;6(5):264-270. https://doi.org/10.1002/jhm.903.
20. Halvorson EE, Chandler N, Neiberg R, Ervin SE. Association of NPO status and type of nutritional support on weight and length of stay in infants hospitalized with bronchiolitis. Hosp Pediatr. 2013;3(4):366-370. https://doi.org/10.1542/hpeds.2013-0011.
21. Ralston SL, Lieberthal AS, Meissner HC, et al. Clinical practice guideline: the diagnosis, management, and prevention of bronchiolitis. Pediatrics. 2014;134(5):e1474-e1502. https://doi.org/10.1542/peds.2014-2742.
22. Seattle Children’s Hospital ZS, Beardsley E, Crotwell D, et al. Bronchiolitis Pathway. http:// www.seattlechildrens.org/pdf/bronchiolitis-pathway.pdf. Accessed January 29, 2019.
23. Children’s Hospital of Philidelphia DM, Zorc J, Kreindler, J, et al. Inpatient Pathway for Treatment of the Child with Bronchiolitis. https://www.chop.edu/clinical-pathway/bronchiolitis-inpatient-treatment-clinical-pathway. Accessed January 29, 2019.
24. Children’s Hospital Colorado TA, Topoz I, Freeman J, et al. Pediatric Viral Bronchiolitis. https://www.childrenscolorado.org/globalassets/healthcare-professionals/clinical-pathways/bronchiolitis.pdf. Accessed January 29, 2019.
25. Betters KA, Hebbar KB, McCracken C, et al. A novel weaning protocol for high-flow nasal cannula in the PICU. Pediatr Crit Care Med. 2017;18(7):e274-e280. https://doi.org/10.1097/PCC.0000000000001181.
26. Kepreotes E, Whitehead B, Attia J, et al. High-flow warm humidified oxygen versus standard low-flow nasal cannula oxygen for moderate bronchiolitis (HFWHO RCT): an open, phase 4, randomised controlled trial. Lancet. 2017;389(10072):930-939. https://doi.org/10.1016/S0140-6736(17)30061-2.
Bronchiolitis is the most common cause of nonbirth hospitalization in children in the United States less than one year of age.1 For children with severe bronchiolitis, high-flow nasal cannula (HFNC) is increasingly used2-4 to reduce work of breathing and prevent the need for further escalation of ventilatory support.5,6 Although previous studies suggest that enteral feeding is recommended in the management of patients hospitalized with bronchiolitis,7-9 limited evidence exists to guide feeding practices for patients receiving HFNC support.5,10,11
Respiratory support with HFNC has been associated with prolonged periods without enteral hydration/nutrition (ie, nil per os [NPO])12 primarily due to anticipation of further escalation of respiratory support or concern for increased risk of aspiration. The majority of patients with bronchiolitis managed with HFNC, however, do not require escalation of care.5,13 When feeding is attempted during HFNC support, it is frequently interrupted.5 Moreover, keeping all children NPO when receiving HFNC may be associated with weight loss and longer length of stay (LOS).12,14 Two small studies found that children admitted to the intensive care unit who received HFNC support for bronchiolitis did not have increased rates of emesis, worsening respiratory distress or aspiration pneumonia when enterally fed.10,11 However, no comparison of adverse events or LOS has been made between patients who were fed and those who were not fed during HFNC therapy, and previous studies have included only patients who have received HFNC in the intensive care setting.
Supporting safe feeding early in hospitalizations for bronchiolitis may facilitate expedited clinical improvement and discharge. As part of an ongoing bronchiolitis quality improvement initiative at our hospital, we sought to characterize feeding practices during HFNC therapy and assess whether feeding exposure was associated with (1) time to discharge after HFNC or (2) feeding-related adverse events. We hypothesized that feeding during HFNC therapy would be associated with a shorter time to discharge after HFNC cessation.
METHODS
Study Design, Setting, Participants
This was a retrospective cohort study of patients aged 1-24 months receiving HFNC support for respiratory failure due to bronchiolitis at an academic children’s hospital between January 1, 2015 and March 1, 2017. Our institution has had a clinical practice guideline, associated order set, and respiratory therapy protocol for general care patients with bronchiolitis since 2009. Patients with bronchiolitis who were weaning HFNC have been cared for in both the intensive and general care settings since 2013. A formal process for initiation of HFNC on general care units was instituted in January of 2017. During the study period, no patients with HFNC support for bronchiolitis had all their care entirely outside the intensive care unit at our institution. However, initiation and subsequent use of HFNC may have occurred in either the intensive care or general care setting. No specific guidance for feeding during HFNC existed during this period.
Patients were identified using the Virtual PICU Systems database, (VPS LLC, myvps.org, Los Angeles, California) and, by definition, all patients received at least some of their care in the intensive care unit. Patients with comorbid conditions of prematurity (<35 weeks) and those with cardiopulmonary, neuromuscular, and genetic diseases were included. Patients with preexisting dysphagia, defined as ongoing outpatient speech therapy for swallowing concerns, an admission diagnosis of aspiration pneumonia or on home respiratory support, were excluded. Children (n = 7) were excluded if they had more than one period of HFNC during admission. This study was determined to be exempt by the University of Wisconsin School of Medicine and Public Health’s Institutional Review Board.
Data Collection and Study Variables
The following variables were collected from VPS administrative data: patient gender, age, admission and discharge date and time, type and total hours of respiratory support, intensive care admission, and LOS (in hours). Additional demographic, clinical, and feeding exposure variables were abstracted manually from the electronic medical record (Epic, Verona, Wisconsin) using a structured data collection tool and stored in REDCap (Research Electronic Data Capture)15 including prematurity, race/ethnicity, insurance status, primary language, and passive tobacco smoke exposure. Clinical variables included duration of illness (days) at the time of admission, unit of HFNC initiation (emergency department, general care, intensive care, respiratory rate and oxygen saturation at HFNC initiation (<90%, 91%-92%, or >92%), acquisition of blood gas at HFNC admission, duration of time on HFNC (hours) and need for intubation or noninvasive ventilation prior to HFNC. The Pediatric Index of Mortality 2 Risk of Mortality (PIM 2 ROM)16 was used to estimate the severity of illness. The PIM2ROM uses clinical variables (systolic blood pressure, fixed pupils, measure of hypoxia using PaO2/FiO2 ratio, base excess, mechanical ventilation, elective admission, recovery from surgery, cardiac bypass, high-risk diagnosis, low-risk diagnosis) collected at the time of intensive care admission to generate a score that predicts the risk of mortality for an individual patient.17
Feeding exposures were documented in three-hour intervals from HFNC initiation to completion using a structured protocol. At each interval the following feeding information was abstracted from a review of nursing and physician documentation and relevant clinical flowsheets: presence or absence of feeding during the interval, route of feeding (oral, nasogastric [NG] or nasojejunal [NJ]). Feeding exposure was categorized a priori as fed at any point during HFNC (vs not fed at any point). Fed children were further characterized as (1) mixed feeding consisting of oral and tube feeds (NG or NJ) or (2) exclusive oral feeding throughout HFNC support (Appendix 1).
The primary outcome was the number of hours to discharge from HFNC cessation. Secondary outcomes were time to discharge from HFNC initiation, all-cause readmissions within seven days of discharge, and potential feeding-related adverse events. Potential adverse events included: (1) aspiration, defined as initiation of antibiotic AND either chest radiograph official interpreted as evidence for aspiration and/or documented concern for aspiration from the treating physician, or (2) intubation after feeding during HFNC.
Statistical Analysis
Descriptive statistics evaluated differences in demographics and clinical variables for feeding exposure groups. We used chi-squared tests for differences in proportions and t-tests or Wilcoxon Rank-Sum tests for differences in means or medians for continuous variables, respectively. Associations between feeding exposure during HFNC and time to discharge (measured in hours) after HFNC completion were modeled with Cox proportional hazards regression. Using this approach, hazard ratios (HR)>1 indicate a higher hazard (rate) of discharge for children with a feeding exposure than for children without the exposure. For example, a hazard ratio equal to two indicates that the exposed population is discharged at twice the rate per unit time as the nonexposed population. Death or censoring events did not occur. Feeding exposure was first modeled dichotomously as not fed or fed. To further explore associations between feeding modality and our outcome, we then modeled feeding exposure categorically as not fed (reference), mixed (oral and tube) feeding, or exclusive oral feeding throughout HFNC.
After constructing a set of unadjusted models, we then adjusted the models for variables having independent (bivariate P < .10) associations with time to discharge: age, unit of HFNC initiation, highest respiratory support required before HFNC, and HFNC duration. Finally, to attempt to account for residual confounding from latent constructs, we also created a set of propensity-weighted Cox proportional hazards models. Propensity weights18 reflecting the probability of being fed or never being fed during HFNC were created using logistic regression with predictors we hypothesized a priori that may have influenced the clinical decision to feed during HFNC: age, day of illness on admission, prematurity, PIM2 ROM score, respiratory rate, oxygen saturation and blood gas acquisition at HFNC initiation, and highest respiratory support required before HFNC. All analyses were conducted using STATA 14.0 (StataCorp, College Station, Texas), and adjusted hazard ratios (aHR) with 95% confidence intervals (95% CIs) were reported.
RESULTS
Patients (n = 123) had a mean age of 7.3 months (standard deviation [SD] 7.1) and presented on day of illness 4.8 (SD 2.3). Prior to HFNC, 10% required higher respiratory support (3% mechanical ventilation). Former preterm children were 12% of the overall sample.
During HFNC, 37% of patients were never fed, 41% were exclusively orally fed, and 23% had tube or mixed oral and tube feedings (Table 1 and Appendix 2). Children who were not fed were older, but groups were otherwise similar in terms of gender, race/ethnicity, passive smoke exposure, day of illness, unit of HFNC initiation, respiratory support required prior to HFNC, and respiratory rate at HFNC initiation.
Median time to discharge after HFNC completion was 31.4 hours (interquartile range [IQR] 23.9-52). Median (IQR) time to discharge was 29.5 (IQR 23.5-47.9) hours in children who were fed and 39.8 (26.4-61.5) hours in those who were not fed (unadjusted HR 1.25 [0.86-1.82], aHR 1.83 [95% CI: 1.16-2.88]). Time to discharge was shortest when children were fed exclusively orally (Figure). Compared with children who were not fed, time to discharge following HFNC completion was significantly shorter for those who were exclusively orally fed (aHR 2.13 [95% CI: 1.31-3.45]; Table 2). Results of the propensity-weighted model were similar: time to discharge after completing HFNC was shorter in fed versus not fed children (HR 2.17; 95 % CI: 1.34-3.50). The secondary outcome, time to discharge from HFNC initiation, had a similar relationship, ie, shorter time to discharge with exclusive oral feeding vs not feeding [aHR 1.95 (95% CI: 1.19-3.18)]. Time to discharge after initiation of HFNC was also shorter for fed versus not fed in propensity-weighted analysis (HR 1.97; 95% CI: 1.13-3.43).
DISCUSSION
This observational study found that being fed during HFNC was associated with shorter time to discharge after HFNC support was completed. Exclusive oral feeding was associated with the shortest time to discharge, and these results were consistent across a variety of analytical approaches. Adverse events were rare and occurred in both fed and unfed children.
These findings advance research on relationships between nutrition and bronchiolitis outcomes. Studies of general care patients with bronchiolitis without HFNC have observed associations between poor nutrition and prolonged LOS.19,20 Two previous studies of patients receiving HFNC therapy for bronchiolitis concluded that frequent interruption11 and later initiation of enteral nutrition10 during ICU stay was associated with longer time to discharge.11 To our knowledge, this is the first study of patients with bronchiolitis treated with HFNC in both general care and ICU settings that compared outcomes according to whether children were fed during HFNC therapy. Our results extend previous work demonstrating that delays in feeding may be associated with longer LOS.
Decisions to feed children with respiratory distress due to bronchiolitis are complex and often subjective. Readiness to feed may be based upon the assessment of a child’s work of breathing, trajectory of illness, institutional culture, and individual physician, nurse, respiratory therapist or speech-language pathologist comfort. In the absence of established feeding best practices,21 some institutions have developed guidelines based on local expert opinion; however, often these recommendations remain largely subjective and nonspecific.5,10,22-24 Although decisions to feed may be influenced by concern about a child’s clinical stability and feeding risk, we found few objective clinical differences between children fed (orally or by enteral tube) or not fed. Moreover, our results were consistent even when we used a propensity-weighted model to account for measured factors that may have been associated with the decision to initiate feeding. This suggests the decision to feed could be more arbitrary than we assume and is important to investigate in future research.
Additionally, although a few early studies have aimed to standardize the process of weaning HFNC support in bronchiolitis,25,26 this process is also largely subjective.10,22,23 As such, the weaning process may be influenced by perceptions of the child’s overall health. Orally fed children may be viewed as more comfortable or well and thus, more readily weaned, which ultimately influences the length of HFNC therapy. Our study design attempted to account for this potential bias by measuring time to discharge following HFNC therapy, rather than measuring total LOS. Meeting adequate calorie, weight, or hydration goals prior to discharge may take longer if feeds have been withheld. We speculate that prolonged periods of NPO might also risk transient oral aversion or feeding discoordination that could influence LOS. Previous research involving broad intensive care unit populations has established the importance of providing nutrition to critically ill children as soon as possible as a means of improving outcomes.27-29 Patients receiving HFNC support for bronchiolitis could plausibly experience similar benefits.
This single-center study with a relatively small sample size has important limitations to consider. The observational design limits our ability to draw conclusions about causal relationships between feeding, time to discharge, and adverse events. In particular, feeding exposure did not account for nuances in feeding timing, feeding density, and other elements of feeding exposure. Additionally, adverse events are rare, and this study is inadequately powered to detect differences between exposure groups. Although we included children cared for in general and intensive care units, our findings may not be generalizable to other hospitals with different placement criteria. Despite the creation of adjusted and propensity-weighted models, our results are still subject to possible residual indication bias. We cannot control for all possible confounders, particularly unmeasured factors which might simultaneously motivate decisions whether, when, and how to feed children receiving HFNC therapy and influence time to discharge after HFNC is finished. Although this study observed associations between feeding during HFNC and both our primary (time to discharge after HFNC was complete) and secondary (time to discharge after HFNC was initiated) outcomes, future work should evaluate how feeding strategies might impact total LOS, particularly as management becomes more standardized.
Prospective studies of feeding exposures during HFNC therapy in bronchiolitis, as well as rigorous interventional study designs, are needed to confirm shorter lengths of stay and safety with larger and more diverse samples. Future research should evaluate methods to safely and effectively feed children with severe bronchiolitis, which would inform standardized evidence-based approaches. Given the scale on which children with bronchiolitis are admitted each year, the implications of such work could be substantial.
CONCLUSION
Children fed while receiving HFNC for bronchiolitis may have shorter time to discharge than those who are not fed. Feeding-related adverse events were rare regardless of the feeding method. Controlled prospective studies addressing residual confounding are needed to justify a change in the current practice.
Acknowledgments
The authors would like to acknowledge the valuable feedback on earlier drafts from members of the University of Wisconsin Division of Pediatric Hospital Medicine CREATE writing group.
1. HCUPnet. http s://hcupnet.ahrq.gov/. Accessed February 7, 2019.
2. Beggs S, Wong ZH, Kaul S, Ogden KJ, Walters JA. High-flow nasal cannula therapy for infants with bronchiolitis. Cochrane Database Syst Rev. 2014;1(1):CD009609. https://doi.org/10.1002/14651858.CD009609.pub2.
3. Mayfield S, Bogossian F, O’Malley L, Schibler A. High-flow nasal cannula oxygen therapy for infants with bronchiolitis: pilot study. J Paediatr Child Health. 2014;50(5):373-378. https://doi.org/10.1111/jpc.12509.
4. Hilliard TN, Archer N, Laura H, et al. Pilot study of vapotherm oxygen delivery in moderately severe bronchiolitis. Arch Dis Child. 2012;97(2):182-183. https://doi.org/10.1136/archdischild-2011-301151.
5. Franklin D, Babl FE, Schlapbach LJ, et al. A randomized trial of high-flow oxygen therapy in infants with bronchiolitis. N Engl J Med. 2018;378(12):1121-1131. https://doi.org/10.1056/NEJMoa1714855.
6. McKiernan C, Chua LC, Visintainer PF, Allen H. High flow nasal cannulae therapy in infants with bronchiolitis. J Pediatr. 2010;156(4):634-638. https://doi.org/10.1016/j.jpeds.2009.10.039.
7. Maffey A, Moviglia T, Mirabello C, et al. Swallowing and respiratory distress in hospitalized patients with bronchiolitis. Dysphagia. 2013;28(4):582-587. https://doi.org/10.1007/s00455-013-9470-0.
8. Kugelman A, Raibin K, Dabbah H, et al. Intravenous fluids versus gastric-tube feeding in hospitalized infants with viral bronchiolitis: a randomized, prospective pilot study. J Pediatr. 2013;162(3):640-642.e641. https://doi.org/10.1016/j.jpeds.2012.10.057.
9. Oakley E, Borland M, Neutze J, et al. Nasogastric hydration versus intravenous hydration for infants with bronchiolitis: a randomised trial. Lancet Respir Med. 2013;1(2):113-120. https://doi.org/10.1016/S2213-2600(12)70053-X.
10. Slain KN, Martinez-Schlurmann N, Shein SL, Stormorken A. Nutrition and high-flow nasal cannula respiratory support in children with bronchiolitis. Hosp Pediatr. 2017;7(5):256-262. https://doi.org/10.1542/hpeds.2016-0194.
11. Sochet AA, McGee JA, October TW. Oral nutrition in children with bronchiolitis on high-flow nasal cannula is well tolerated. Hosp Pediatr. 2017;7(5):249-255. https://doi.org/10.1542/hpeds.2016-0131.
12. Canarie MF, Barry S, Carroll CL, et al. Risk factors for delayed enteral nutrition in critically ill children. Pediatr Crit Care Med. 2015;16(8):e283-e289. https://doi.org/10.1097/PCC.0000000000000527.
13. Schibler A, Pham TM, Dunster KR, et al. Reduced intubation rates for infants after introduction of high-flow nasal prong oxygen delivery. Intensive Care Med. 2011;37(5):847-852. https://doi.org/10.1007/s00134-011-2177-5.
14. Hamilton S, McAleer DM, Ariagno K, et al. A stepwise enteral nutrition algorithm for critically ill children helps achieve nutrient delivery goals*. Pediatr Crit Care Med. 2014;15(7):583-589. https://doi.org/10.1097/PCC.0000000000000179.
15. Harris PA, Taylor R, Thielke R, et al. Research electronic data capture (REDCap)--a metadata-driven methodology and workflow process for providing translational research informatics support. J Biomed Inform. 2009;42(2):377-381. https://doi.org/10.1016/j.jbi.2008.08.010.
16. Slater A, Shann F, Group APS. The suitability of the Pediatric Index of Mortality (PIM), PIM2, the Pediatric Risk of Mortality (PRISM), and PRISM III for monitoring the quality of pediatric intensive care in Australia and New Zealand. Pediatr Crit Care Med. 2004;5(5):447-454. https://doi.org/10.1097/01.PCC.0000138557.31831.65.
17. Slater A, Shann F, Pearson G, Paediatric Index of Mortality Study G. PIM2: a revised version of the Paediatric Index of Mortality. Intensive Care Med. 2003;29(2):278-285. https://doi.org/10.1007/s00134-002-1601-2.
18. Lanza ST, Moore JE, Butera NM. Drawing causal inferences using propensity scores: a practical guide for community psychologists. Am J Commun Psychol. 2013;52(3-4):380-392. https://doi.org/10.1007/s10464-013-9604-4.
19. Weisgerber MC, Lye PS, Li SH, et al. Factors predicting prolonged hospital stay for infants with bronchiolitis. J Hosp Med. 2011;6(5):264-270. https://doi.org/10.1002/jhm.903.
20. Halvorson EE, Chandler N, Neiberg R, Ervin SE. Association of NPO status and type of nutritional support on weight and length of stay in infants hospitalized with bronchiolitis. Hosp Pediatr. 2013;3(4):366-370. https://doi.org/10.1542/hpeds.2013-0011.
21. Ralston SL, Lieberthal AS, Meissner HC, et al. Clinical practice guideline: the diagnosis, management, and prevention of bronchiolitis. Pediatrics. 2014;134(5):e1474-e1502. https://doi.org/10.1542/peds.2014-2742.
22. Seattle Children’s Hospital ZS, Beardsley E, Crotwell D, et al. Bronchiolitis Pathway. http:// www.seattlechildrens.org/pdf/bronchiolitis-pathway.pdf. Accessed January 29, 2019.
23. Children’s Hospital of Philidelphia DM, Zorc J, Kreindler, J, et al. Inpatient Pathway for Treatment of the Child with Bronchiolitis. https://www.chop.edu/clinical-pathway/bronchiolitis-inpatient-treatment-clinical-pathway. Accessed January 29, 2019.
24. Children’s Hospital Colorado TA, Topoz I, Freeman J, et al. Pediatric Viral Bronchiolitis. https://www.childrenscolorado.org/globalassets/healthcare-professionals/clinical-pathways/bronchiolitis.pdf. Accessed January 29, 2019.
25. Betters KA, Hebbar KB, McCracken C, et al. A novel weaning protocol for high-flow nasal cannula in the PICU. Pediatr Crit Care Med. 2017;18(7):e274-e280. https://doi.org/10.1097/PCC.0000000000001181.
26. Kepreotes E, Whitehead B, Attia J, et al. High-flow warm humidified oxygen versus standard low-flow nasal cannula oxygen for moderate bronchiolitis (HFWHO RCT): an open, phase 4, randomised controlled trial. Lancet. 2017;389(10072):930-939. https://doi.org/10.1016/S0140-6736(17)30061-2.
© 2019 Society of Hospital Medicine
Does Scheduling a Postdischarge Visit with a Primary Care Physician Increase Rates of Follow-up and Decrease Readmissions?
Under the Hospital Readmission Reduction Program (HRRP), hospitals with higher than expected readmissions for select conditions receive a financial penalty. In 2017, hospitals were penalized a total of $528 million.1,2 In an effort to deter readmissions, hospitals have focused on the transition from inpatient to outpatient care with particular emphasis on timely follow-up with a primary care physician (PCP).3-7 Medicare has also introduced transitional care codes, which reimburse physicians for follow-up care after a hospitalization.
METHODS
Postdischarge Appointment Service
In the fall of 2009, Beth Israel Deaconess introduced a postdischarge appointment intervention to facilitate follow-up with PCPs and specialty physicians after discharge from the hospital. Within the provider order entry system, attending and resident physicians enter a discharge appointment request for specified providers within and outside of the medical center and a specified time period. For example, a physician may enter a request to schedule a PCP appointment within 2-3, 4-8, 9-15, 16-30, or >30 days of discharge.
Study Population
We conducted a retrospective, cohort study at Beth Israel Deaconess Medical Center, a tertiary care hospital, using data derived from electronic health records for all hospitalizations
Outcomes
The primary outcomes of this study were kept PCP follow-up visits within seven days and readmission within 30 days of discharge. We focused on PCP visits within seven days, as this has been the measure used in prior research,5,7 but conducted a sensitivity analysis of PCP follow-up within 14 days. No-shows for the scheduled follow-up PCP appointments were not included. We focused on readmissions within 30 days of discharge, given this is the measure used in the HRRP,16 but conducted a sensitivity analysis of 14 days. Secondary outcomes included ED revisit within the 30 days. Given the data available, we only observed physician visits and hospitalizations that occurred within the Beth Israel Deaconess system.
Analyses
We conducted two analyses to assess whether the implementation of the postdischarge appointment service was associated with an increase in PCP follow-up and a decrease in the readmission rate.
In the first analysis, we focused only on hospitalizations from the medical and cardiology services during the postintervention period between January 2011 and September 2015 (n = 17,582). We compared the PCP follow-up rate and the readmission rate among hospitalizations where the postdischarge appointment service was used versus those where it was not used. We used a multivariable logistic regression, and the covariates included in the model were age, gender, hospital length of stay, and diagnosis-related group (DRG) cost weight. The DRG cost weight captures the average resources used to treat Medicare patients’ hospitalizations within a given DRG category and was used as a surrogate marker for the complexity of hospitalization.17 Instead of presenting odds ratios, we used predictive margins to generate adjusted percentage point estimates of the differences in our outcomes associated with the use of the postdischarge appointment service.18
This instrumental variable exploits the fact that the postdischarge appointment service was only available on weekdays and that physicians are asked to only submit the order for follow-up appointments on the day of discharge. We focused on the day of the week of admission (versus discharge) because of concerns that patients with more complicated hospital courses might be kept in the hospital over the weekend (eg, to facilitate testing available only on weekdays or to consult with regular physicians only available on weekdays). This would create a relationship between the day of discharge and the outcomes (follow-up visits, readmissions). The day of admission is less likely to be impacted by this bias. Given concerns that admissions on different days of the week might be different, our instrument is the day of the week interacted with the time period. Therefore, to create bias, there must be a systematic change in the nature of admissions on a given day of the week during this time period. We provide more details on this analysis, testing of the instrument, and results in the Appendix.
Analyses were conducted in Stata, version 14.2 (StataCorp LP, College Station, Texas). Statistical testing was two-sided, with a significance level of 0.05, and the project was judged exempt by the Committee on Clinical Investigations for Beth Israel Deaconess Medical Center.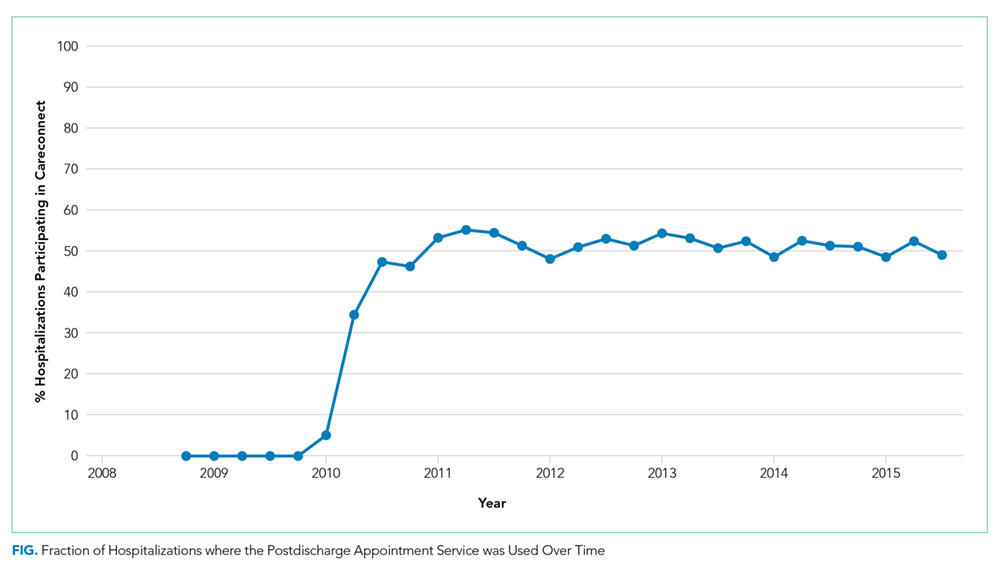
RESULTS
Overall, there were 17,582 hospitalizations on the medicine and cardiology services following implementation of the postdischarge appointment service. The use of the postdischarge appointment service rose rapidly after it was introduced (Figure) and then plateaued at roughly 50%. 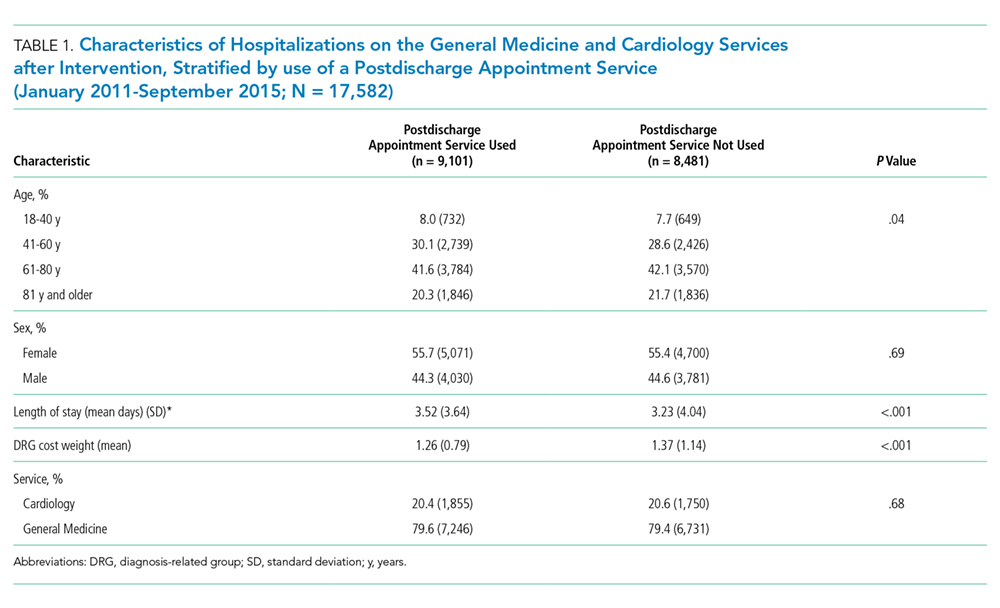
Multivariable Logistic Regression
In this analysis, we focused on the 17,582 hospitalizations from January 2011 to September 2015 on the general medicine and cardiology services that occurred after the postdischarge appointment service was introduced. Among these hospitalizations, the postdischarge appointment service was used in 51.8% of discharges.
In an unadjusted analysis, patients discharged using the tool had higher rates of seven-day PCP follow-up (60.2% vs 29.2%, P < .001) and lower 30-day readmission rates (14.7% vs 16.7%; P < .001) than those who were not (Table 2). There was no significant difference in 30-day ED revisit between hospitalizations with and without use of the postdischarge appointment service (22.3% vs 23.1%; P = .23).
This was echoed in our multivariable analysis where, controlling for other patient factors, use of the postdischarge appointment service was associated with an increased rate of follow-up with a PCP in seven days (+31.9 percentage points; 95% CI: 30.2, 33.6; P < .01) and a decreased likelihood of readmission within 30 days (−3.8 percentage points; 95% CI: −5.2, −2.4; P < .01) (Table 2).
Instrumental Variable Analysis
In our instrumental variable analysis, we used all hospitalizations both before and after the introduction of the intervention. In this analysis, we estimate that use of the postdischarge appointment service increases the probability of visiting a PCP within seven days by 33.4 percentage points (95% CI: 7.9%, 58.9%; P = .01) (Table 3). The use of the postdischarge appointment was associated with a 2.5 percentage point (95% CI: −22.0%, 17.1%; P = .80) reduction in readmissions and a 4.8 percentage point (95% CI; −27.5%, 17.9%; P = .68) reduction in an ED visit within 30 days (Table 3). Neither of these differences were statistically significant with wide confidence intervals.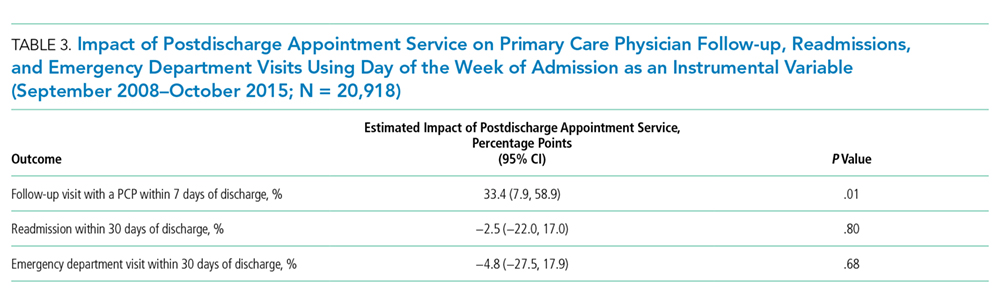
In sensitivity analyses, we obtained similar results when we considered PCP visits and readmissions within 14 days.
DISCUSSION
The hospital introduced the postdischarge appointment service to facilitate postdischarge appointments and to deter readmissions. In our analyses the use of the postdischarge appointment service was associated with a substantial 30 percentage point increase in the likelihood of a PCP follow-up visit within seven days after hospital discharge. There was a roughly 2% reduction in 30-day readmissions, but this difference was not consistently statistically significant across our analyses. Together, our evaluation implies that this type of intervention may make it much easier for patients to attend a PCP appointment, but scheduling an appointment alone may have a modest impact on deterring a readmission.
Our findings are inconsistent with prior studies that described a strong association between early PCP follow-up and readmissions. However, our results were consistent with research where follow-up visits were not clearly protective against readmissions.20 One potential explanation of the discrepant findings is that there are unmeasured socioeconomic differences between patients who have a PCP follow-up appointment and those who do not.
Regardless of the impact on readmissions, it is important to acknowledge that early PCP follow-up offers many potential benefits. Continuing to evaluate and treat new diagnoses, adjusting and reconciling medications, reconnecting with outpatient providers, capturing new incidental findings, and ensuring stability through regular follow-up are just a few of the potential benefits. We believe the dramatic increase observed in PCP follow-up reflects the administrative complexity required for a patient to call their PCP’s office and to schedule a follow-up appointment soon after they are discharged from the hospital.
Our study has many limitations. The study was limited to a single academic center, and the intervention was limited to patients cared for by the general medicine and cardiology services.
In summary, we found that the introduction of a postdischarge appointment service resulted in substantially increased rates of early PCP follow-up but less clear benefits in preventing readmissions.
1. Boccutti C, Casillas G. Aiming for Fewer Hospital U-turns: The Medicare Hospital Readmission Reduction Program; March 10, 2017. https://www.kff.org/medicare/issue-brief/aiming-for-fewer-hospital-u-turns-the-medicare-hospital-readmission-reduction-program. Accessed July 22, 2019
2. Centers for Medicare and Medicaid Services. FY 2017 IPPS Final Rule: Hospital Readmissions Reduction Program Su pplemental Data File. https://www.cms.gov/Medicare/Medicare-Fee-for-Service-Payment/AcuteInpatientPPS/Archived-Supplemental-Data-Files.html. Accessed June 22, 2019
3. Sharma G, Kuo YF, Freeman JL, Zhang DD, Goodwin JS. Outpatient follow-up visit and 30-day emergency department visit and readmission in patients hospitalized for chronic obstructive pulmonary disease. Arch Intern Med. 2010;170(18):1664-1670. https://doi.org/10.1001/archinternmed.2010.345.
4. Rennke S, Nguyen OK, Shoeb MH, et al. Hospital-initiated transitional care interventions as a patient safety strategy: a systematic review. Ann Intern Med. 2013;158(5 Pt 2):433-440. https://doi.org/10.7326/0003-4819-158-5-201303051-00011.
5. Misky GJ, Wald HL, Coleman EA. Post hospitalization transitions: examining the effects of timing of primary care provider follow-up. J Hosp Med. 2010;5(7):392-397. https://doi.org/10.1002/jhm.666.
6. Hesselink G, Schoonhoven L, Barach P, et al. Improving patient handovers from hospital to primary care: a systematic review. Ann Intern Med. 2012;157(6):417-428. https://doi.org/10.7326/0003-4819-157-6-201209180-00006.
7. Hernandez AF, Greiner MA, Fonarow GC, et al. Relationship between early physician follow-up and 30-day readmission among Medicare beneficiaries hospitalized for heart failure. JAMA. 2010;303(17):1716-1722. https://doi.org/10.1001/jama.2010.533.
8. Muus KJ, Knudson A, Klug MG, et al. Effect of post discharge follow-up care on re-admissions among US veterans with congestive heart failure: a rural-urban comparison. Rural Remote Health. 2010;10(2):1447.
9. Brooke BS, Stone DH, Cronenwett JL, et al. Early primary care provider follow-up and readmission after high-risk surgery. JAMA Surg. 2014;149(8):821-828. https://doi.org/10.1001/jamasurg.2014.157.
10. Leschke J, Panepinto JA, Nimmer M, et al. Outpatient follow-up and rehospitalizations for sickle cell disease patients. Pediatr Blood Cancer. 2012;58(3):406-409. https://doi.org/10.1002/pbc.23140.
11. Field TS, Ogarek J, Garber L, Reed G, Gurwitz JH. Association of early post discharge follow-up by a primary care physician and 30-day rehospitalization among older adults. J Gen Intern Med. 2015;30(5):565-571. https://doi.org/10.1007/s11606-014-3106-4.
12. Kashiwagi DT, Burton MC, Kirkland LL, Cha S, Varkey P. Do timely outpatient follow-up visits decrease hospital readmission rates? Am J Med Qual. 2012;27(1):11-15. https://doi.org/10.1177/1062860611409197.
13. Hansen LO, Young RS, Hinami K, Leung A, Williams MV. Interventions to reduce 30-day rehospitalization: a systematic review. Ann Intern Med. 2011;155(8):520-528. https://doi.org/10.7326/0003-4819-155-8-201110180-00008.
14. Ryan J, Kang S, Dolacky S, Ingrassia J, Ganeshan R. Change in readmissions and follow-up visits as part of a heart failure readmission quality improvement initiative. Am J Med. 2013;126(11):989–994.e1. https://doi.org/10.1016/j.amjmed.2013.06.027.
15. Coleman EA, Parry C, Chalmers S, Min SJ. The care transitions intervention: results of a randomized controlled trial. Arch Intern Med. 2006;166(17):1822-1828. https://doi.org/10.1001/archinte.166.17.1822.
16. Thomas JW. Should episode-based economic profiles be risk adjusted to account for differences in patients’ health risks? Health Serv Res. 2006;41(2):581-598. https://doi.org/10.1111/j.1475-6773.2005.00499.x.
17. Mendez CM, Harrington DW, Christenson P, Spellberg B. Impact of hospital variables on case mix index as a marker of disease severity. Popul Health Manag. 2014;17(1):28-34. https://doi.org/10.1089/pop.2013.0002.
18. Muller CJ, MacLehose RF. Estimating predicted probabilities from logistic regression: different methods correspond to different target populations. Int J Epidemiol. 2014;43(3):962-970. https://doi.org/10.1093/ije/dyu029.
19. Angrist JD, Krueger AB. Instrumental variables and the search for identification: From supply and demand to natural experiments. J Econ Perspect. 2001;15(4):69-85. https://doi.org/10.1257/jep.15.4.69.
20. Dimick JB, Ryan AM. Methods for evaluating changes in health care policy: the difference-in-differences approach. JAMA. 2014;312(22):2401-2402. https://doi.org/10.1001/jama.2014.16153.
21. Peikes D, Chen A, Schore J, Brown R. Effects of care coordination on hospitalization, quality of care, and health care expenditures among Medicare beneficiaries: 15 randomized trials. JAMA. 2009;301(6):603-618. https://doi.org/10.1001/jama.2009.126.
22. Jack BW, Chetty VK, Anthony D, et al. A reengineered hospital discharge program to decrease rehospitalization: a randomized trial. Ann Intern Med. 2009;150(3):178-187. https://doi.org/10.7326/0003-4819-150-3-200902030-00007.
23. Naylor MD, Brooten DA, Campbell RL, et al. Transitional care of older adults hospitalized with heart failure: a randomized, controlled trial. J Am Geriatr Soc. 2004;52(5):675-684. https://doi.org/10.1111/j.1532-5415.2004.52202.x.
24. Leppin AL, Gionfriddo MR, Kessler M, et al. Preventing 30-day hospital readmissions: a systematic review and meta-analysis of randomized trials. JAMA Intern Med. 2014;174(7):1095-1107. https://doi.org/10.1001/jamainternmed.2014.1608.
25. Kripalani S, LeFevre F, Phillips CO, et al. Deficits in communication and information transfer between hospital-based and primary care physicians: implications for patient safety and continuity of care. JAMA. 2007;297(8):831-841. https://doi.org/10.1001/jama.297.8.831.
26. van Walraven C, Seth R, Austin PC, Laupacis A. Effect of discharge summary availability during post discharge visits on hospital readmission. J Gen Intern Med. 2002;17(3):186-192. https://doi.org/10.1046/j.1525-1497.2002.10741.x.
27. Hoyer EH, Brotman DJ, Apfel A, et al. Improving outcomes after hospitalization: A prospective observational multicenter evaluation of care coordination strategies for reducing 30-day readmissions to Maryland Hospitals. J Gen Intern Med. 2018;33(5):621-627. https://doi.org/10.1007/s11606-017-4218-4.
Under the Hospital Readmission Reduction Program (HRRP), hospitals with higher than expected readmissions for select conditions receive a financial penalty. In 2017, hospitals were penalized a total of $528 million.1,2 In an effort to deter readmissions, hospitals have focused on the transition from inpatient to outpatient care with particular emphasis on timely follow-up with a primary care physician (PCP).3-7 Medicare has also introduced transitional care codes, which reimburse physicians for follow-up care after a hospitalization.
METHODS
Postdischarge Appointment Service
In the fall of 2009, Beth Israel Deaconess introduced a postdischarge appointment intervention to facilitate follow-up with PCPs and specialty physicians after discharge from the hospital. Within the provider order entry system, attending and resident physicians enter a discharge appointment request for specified providers within and outside of the medical center and a specified time period. For example, a physician may enter a request to schedule a PCP appointment within 2-3, 4-8, 9-15, 16-30, or >30 days of discharge.
Study Population
We conducted a retrospective, cohort study at Beth Israel Deaconess Medical Center, a tertiary care hospital, using data derived from electronic health records for all hospitalizations
Outcomes
The primary outcomes of this study were kept PCP follow-up visits within seven days and readmission within 30 days of discharge. We focused on PCP visits within seven days, as this has been the measure used in prior research,5,7 but conducted a sensitivity analysis of PCP follow-up within 14 days. No-shows for the scheduled follow-up PCP appointments were not included. We focused on readmissions within 30 days of discharge, given this is the measure used in the HRRP,16 but conducted a sensitivity analysis of 14 days. Secondary outcomes included ED revisit within the 30 days. Given the data available, we only observed physician visits and hospitalizations that occurred within the Beth Israel Deaconess system.
Analyses
We conducted two analyses to assess whether the implementation of the postdischarge appointment service was associated with an increase in PCP follow-up and a decrease in the readmission rate.
In the first analysis, we focused only on hospitalizations from the medical and cardiology services during the postintervention period between January 2011 and September 2015 (n = 17,582). We compared the PCP follow-up rate and the readmission rate among hospitalizations where the postdischarge appointment service was used versus those where it was not used. We used a multivariable logistic regression, and the covariates included in the model were age, gender, hospital length of stay, and diagnosis-related group (DRG) cost weight. The DRG cost weight captures the average resources used to treat Medicare patients’ hospitalizations within a given DRG category and was used as a surrogate marker for the complexity of hospitalization.17 Instead of presenting odds ratios, we used predictive margins to generate adjusted percentage point estimates of the differences in our outcomes associated with the use of the postdischarge appointment service.18
This instrumental variable exploits the fact that the postdischarge appointment service was only available on weekdays and that physicians are asked to only submit the order for follow-up appointments on the day of discharge. We focused on the day of the week of admission (versus discharge) because of concerns that patients with more complicated hospital courses might be kept in the hospital over the weekend (eg, to facilitate testing available only on weekdays or to consult with regular physicians only available on weekdays). This would create a relationship between the day of discharge and the outcomes (follow-up visits, readmissions). The day of admission is less likely to be impacted by this bias. Given concerns that admissions on different days of the week might be different, our instrument is the day of the week interacted with the time period. Therefore, to create bias, there must be a systematic change in the nature of admissions on a given day of the week during this time period. We provide more details on this analysis, testing of the instrument, and results in the Appendix.
Analyses were conducted in Stata, version 14.2 (StataCorp LP, College Station, Texas). Statistical testing was two-sided, with a significance level of 0.05, and the project was judged exempt by the Committee on Clinical Investigations for Beth Israel Deaconess Medical Center.
RESULTS
Overall, there were 17,582 hospitalizations on the medicine and cardiology services following implementation of the postdischarge appointment service. The use of the postdischarge appointment service rose rapidly after it was introduced (Figure) and then plateaued at roughly 50%.
Multivariable Logistic Regression
In this analysis, we focused on the 17,582 hospitalizations from January 2011 to September 2015 on the general medicine and cardiology services that occurred after the postdischarge appointment service was introduced. Among these hospitalizations, the postdischarge appointment service was used in 51.8% of discharges.
In an unadjusted analysis, patients discharged using the tool had higher rates of seven-day PCP follow-up (60.2% vs 29.2%, P < .001) and lower 30-day readmission rates (14.7% vs 16.7%; P < .001) than those who were not (Table 2). There was no significant difference in 30-day ED revisit between hospitalizations with and without use of the postdischarge appointment service (22.3% vs 23.1%; P = .23).
This was echoed in our multivariable analysis where, controlling for other patient factors, use of the postdischarge appointment service was associated with an increased rate of follow-up with a PCP in seven days (+31.9 percentage points; 95% CI: 30.2, 33.6; P < .01) and a decreased likelihood of readmission within 30 days (−3.8 percentage points; 95% CI: −5.2, −2.4; P < .01) (Table 2).
Instrumental Variable Analysis
In our instrumental variable analysis, we used all hospitalizations both before and after the introduction of the intervention. In this analysis, we estimate that use of the postdischarge appointment service increases the probability of visiting a PCP within seven days by 33.4 percentage points (95% CI: 7.9%, 58.9%; P = .01) (Table 3). The use of the postdischarge appointment was associated with a 2.5 percentage point (95% CI: −22.0%, 17.1%; P = .80) reduction in readmissions and a 4.8 percentage point (95% CI; −27.5%, 17.9%; P = .68) reduction in an ED visit within 30 days (Table 3). Neither of these differences were statistically significant with wide confidence intervals.
In sensitivity analyses, we obtained similar results when we considered PCP visits and readmissions within 14 days.
DISCUSSION
The hospital introduced the postdischarge appointment service to facilitate postdischarge appointments and to deter readmissions. In our analyses the use of the postdischarge appointment service was associated with a substantial 30 percentage point increase in the likelihood of a PCP follow-up visit within seven days after hospital discharge. There was a roughly 2% reduction in 30-day readmissions, but this difference was not consistently statistically significant across our analyses. Together, our evaluation implies that this type of intervention may make it much easier for patients to attend a PCP appointment, but scheduling an appointment alone may have a modest impact on deterring a readmission.
Our findings are inconsistent with prior studies that described a strong association between early PCP follow-up and readmissions. However, our results were consistent with research where follow-up visits were not clearly protective against readmissions.20 One potential explanation of the discrepant findings is that there are unmeasured socioeconomic differences between patients who have a PCP follow-up appointment and those who do not.
Regardless of the impact on readmissions, it is important to acknowledge that early PCP follow-up offers many potential benefits. Continuing to evaluate and treat new diagnoses, adjusting and reconciling medications, reconnecting with outpatient providers, capturing new incidental findings, and ensuring stability through regular follow-up are just a few of the potential benefits. We believe the dramatic increase observed in PCP follow-up reflects the administrative complexity required for a patient to call their PCP’s office and to schedule a follow-up appointment soon after they are discharged from the hospital.
Our study has many limitations. The study was limited to a single academic center, and the intervention was limited to patients cared for by the general medicine and cardiology services.
In summary, we found that the introduction of a postdischarge appointment service resulted in substantially increased rates of early PCP follow-up but less clear benefits in preventing readmissions.
1. Boccutti C, Casillas G. Aiming for Fewer Hospital U-turns: The Medicare Hospital Readmission Reduction Program; March 10, 2017. https://www.kff.org/medicare/issue-brief/aiming-for-fewer-hospital-u-turns-the-medicare-hospital-readmission-reduction-program. Accessed July 22, 2019
2. Centers for Medicare and Medicaid Services. FY 2017 IPPS Final Rule: Hospital Readmissions Reduction Program Su pplemental Data File. https://www.cms.gov/Medicare/Medicare-Fee-for-Service-Payment/AcuteInpatientPPS/Archived-Supplemental-Data-Files.html. Accessed June 22, 2019
3. Sharma G, Kuo YF, Freeman JL, Zhang DD, Goodwin JS. Outpatient follow-up visit and 30-day emergency department visit and readmission in patients hospitalized for chronic obstructive pulmonary disease. Arch Intern Med. 2010;170(18):1664-1670. https://doi.org/10.1001/archinternmed.2010.345.
4. Rennke S, Nguyen OK, Shoeb MH, et al. Hospital-initiated transitional care interventions as a patient safety strategy: a systematic review. Ann Intern Med. 2013;158(5 Pt 2):433-440. https://doi.org/10.7326/0003-4819-158-5-201303051-00011.
5. Misky GJ, Wald HL, Coleman EA. Post hospitalization transitions: examining the effects of timing of primary care provider follow-up. J Hosp Med. 2010;5(7):392-397. https://doi.org/10.1002/jhm.666.
6. Hesselink G, Schoonhoven L, Barach P, et al. Improving patient handovers from hospital to primary care: a systematic review. Ann Intern Med. 2012;157(6):417-428. https://doi.org/10.7326/0003-4819-157-6-201209180-00006.
7. Hernandez AF, Greiner MA, Fonarow GC, et al. Relationship between early physician follow-up and 30-day readmission among Medicare beneficiaries hospitalized for heart failure. JAMA. 2010;303(17):1716-1722. https://doi.org/10.1001/jama.2010.533.
8. Muus KJ, Knudson A, Klug MG, et al. Effect of post discharge follow-up care on re-admissions among US veterans with congestive heart failure: a rural-urban comparison. Rural Remote Health. 2010;10(2):1447.
9. Brooke BS, Stone DH, Cronenwett JL, et al. Early primary care provider follow-up and readmission after high-risk surgery. JAMA Surg. 2014;149(8):821-828. https://doi.org/10.1001/jamasurg.2014.157.
10. Leschke J, Panepinto JA, Nimmer M, et al. Outpatient follow-up and rehospitalizations for sickle cell disease patients. Pediatr Blood Cancer. 2012;58(3):406-409. https://doi.org/10.1002/pbc.23140.
11. Field TS, Ogarek J, Garber L, Reed G, Gurwitz JH. Association of early post discharge follow-up by a primary care physician and 30-day rehospitalization among older adults. J Gen Intern Med. 2015;30(5):565-571. https://doi.org/10.1007/s11606-014-3106-4.
12. Kashiwagi DT, Burton MC, Kirkland LL, Cha S, Varkey P. Do timely outpatient follow-up visits decrease hospital readmission rates? Am J Med Qual. 2012;27(1):11-15. https://doi.org/10.1177/1062860611409197.
13. Hansen LO, Young RS, Hinami K, Leung A, Williams MV. Interventions to reduce 30-day rehospitalization: a systematic review. Ann Intern Med. 2011;155(8):520-528. https://doi.org/10.7326/0003-4819-155-8-201110180-00008.
14. Ryan J, Kang S, Dolacky S, Ingrassia J, Ganeshan R. Change in readmissions and follow-up visits as part of a heart failure readmission quality improvement initiative. Am J Med. 2013;126(11):989–994.e1. https://doi.org/10.1016/j.amjmed.2013.06.027.
15. Coleman EA, Parry C, Chalmers S, Min SJ. The care transitions intervention: results of a randomized controlled trial. Arch Intern Med. 2006;166(17):1822-1828. https://doi.org/10.1001/archinte.166.17.1822.
16. Thomas JW. Should episode-based economic profiles be risk adjusted to account for differences in patients’ health risks? Health Serv Res. 2006;41(2):581-598. https://doi.org/10.1111/j.1475-6773.2005.00499.x.
17. Mendez CM, Harrington DW, Christenson P, Spellberg B. Impact of hospital variables on case mix index as a marker of disease severity. Popul Health Manag. 2014;17(1):28-34. https://doi.org/10.1089/pop.2013.0002.
18. Muller CJ, MacLehose RF. Estimating predicted probabilities from logistic regression: different methods correspond to different target populations. Int J Epidemiol. 2014;43(3):962-970. https://doi.org/10.1093/ije/dyu029.
19. Angrist JD, Krueger AB. Instrumental variables and the search for identification: From supply and demand to natural experiments. J Econ Perspect. 2001;15(4):69-85. https://doi.org/10.1257/jep.15.4.69.
20. Dimick JB, Ryan AM. Methods for evaluating changes in health care policy: the difference-in-differences approach. JAMA. 2014;312(22):2401-2402. https://doi.org/10.1001/jama.2014.16153.
21. Peikes D, Chen A, Schore J, Brown R. Effects of care coordination on hospitalization, quality of care, and health care expenditures among Medicare beneficiaries: 15 randomized trials. JAMA. 2009;301(6):603-618. https://doi.org/10.1001/jama.2009.126.
22. Jack BW, Chetty VK, Anthony D, et al. A reengineered hospital discharge program to decrease rehospitalization: a randomized trial. Ann Intern Med. 2009;150(3):178-187. https://doi.org/10.7326/0003-4819-150-3-200902030-00007.
23. Naylor MD, Brooten DA, Campbell RL, et al. Transitional care of older adults hospitalized with heart failure: a randomized, controlled trial. J Am Geriatr Soc. 2004;52(5):675-684. https://doi.org/10.1111/j.1532-5415.2004.52202.x.
24. Leppin AL, Gionfriddo MR, Kessler M, et al. Preventing 30-day hospital readmissions: a systematic review and meta-analysis of randomized trials. JAMA Intern Med. 2014;174(7):1095-1107. https://doi.org/10.1001/jamainternmed.2014.1608.
25. Kripalani S, LeFevre F, Phillips CO, et al. Deficits in communication and information transfer between hospital-based and primary care physicians: implications for patient safety and continuity of care. JAMA. 2007;297(8):831-841. https://doi.org/10.1001/jama.297.8.831.
26. van Walraven C, Seth R, Austin PC, Laupacis A. Effect of discharge summary availability during post discharge visits on hospital readmission. J Gen Intern Med. 2002;17(3):186-192. https://doi.org/10.1046/j.1525-1497.2002.10741.x.
27. Hoyer EH, Brotman DJ, Apfel A, et al. Improving outcomes after hospitalization: A prospective observational multicenter evaluation of care coordination strategies for reducing 30-day readmissions to Maryland Hospitals. J Gen Intern Med. 2018;33(5):621-627. https://doi.org/10.1007/s11606-017-4218-4.
© 2019 Society of Hospital Medicine
Impact of the Hospital-Acquired Conditions Initiative on Falls and Physical Restraints: A Longitudinal Study
Accidental falls are among the most common incidents reported in hospitals, complicating approximately 2% of hospital stays.1-3 Approximately 25% of falls in hospitalized patients result in injury, and 2% involve fractures.4 Substantial costs are associated with falls, including patient care costs associated with increased length of stay and liability.5-7
Beginning October 1, 2008, the Centers for Medicare & Medicaid Services (CMS) stopped reimbursing hospitals for the additional care associated with eight hospital-acquired conditions (HACs), including serious fall-related injury, which were believed to be “reasonably preventable.”8,9 Before this change, hospitals recovered the costs of these “never events” by assigning a higher level MS-DRG (Medicare Severity Diagnosis-Related Group) code for patients experiencing such an event. This is no longer allowed under the revised CMS Prospective Payment System rules.
Although the financial penalty for iatrogenic injury was modest, the payment change placed pressure on hospital staff to decrease falls, and some nurses reported changing practice to be more restrictive of patient mobility.10 Increased use of physical restraints is a potential unintended consequence of this rule change.11 Restraints are known to cause agitation, delirium, decubiti, deconditioning, strangulation, and death.12 Not surprisingly, use of restraints is discouraged in hospitals and is a CMS quality of care indicator.13,14 Although there is no evidence that restraint use prevents patients from falling,15,16 there is a perception among both health professionals and patients that restraints reduce the risk of falling, and they are often used as a “last resort” method of fall prevention.17-19
The aim of this longitudinal study was to determine whether this payment change was associated with changes in short-, intermediate-, and long-term rates of falls, injurious falls, and physical restraint use in acute care hospitals. The CMS has included fall-related hip fracture in newer value-based purchasing programs by adding Patient Safety Indictor (PSI) 90 to both the HACs Reduction Program (HACRP)20 and the Hospital Value-Based Purchasing (VBP)21 in FY2015. However, the HACs Initiative remains the only Medicare value program that directly penalizes all injurious inpatient falls.
METHODS
Study Units
As previously described,22 the National Database of Nursing Quality Indicators (NDNQI) is a data collection project initiated by the American Nurses Association (ANA). The NDNQI provides national comparative data at the unit and facility levels on nursing-sensitive indicators endorsed by the National Quality Forum. More than 2,000 hospitals voluntarily participate in the NDNQI, including virtually all ANA Magnet-recognized hospitals, and more than 90% of nursing units participate in the fall measures (NDNQI, personal communication). At the start of study data collection, the project was administered by the School of Nursing at the University of Kansas Medical Center. In 2014, the ownership of the NDNQI was transferred from the ANA to Press Ganey Associates, Inc. In addition to standardized data on unit, facility, and staffing characteristics, the NDNQI member hospitals can elect to submit monthly data on falls and quarterly data on physical restraint use prevalence.
We examined the data collected from adult medical, medical-surgical, and surgical units in United States acute care hospitals that elected to participate in the fall and physical restraint use data collection within the NDNQI for the 27 months before and the 87 months after the implementation of the CMS rule change. Eligible units contributed at least one fall and physical restraint use data point during both the 27 months preceding October 1, 2008, and the 87 months immediately after. The Institutional Review Board at the University of Kansas Medical Center reviewed and approved the study before its implementation.
Endpoints
Fall Events
The NDNQI defines a patient fall as an unplanned descent to the floor, regardless of whether the fall results in injury and regardless of whether the patient was assisted to the floor by a member of the hospital staff. Events in which a patient lands on a surface where one would not expect to find a patient (eg, on a mat next to a low bed) are also counted as falls.
Using internal data sources (eg, medical records, incident reports), participating hospitals report the number of inpatient falls each month to the NDNQI. We analyzed the falls data for the period July 1, 2006, through December 31, 2015. Thus, each unit could contribute 114 months (27 months before the rule change and 87 months after the rule change) of falls data.
Hospitals classify the injury level of each fall as none, minor (resulting in bruise, pain, abrasion, wound cleaning, or limb elevation, or in the use of ice, dressing, or topical medication), moderate (resulting in suturing, splinting, muscle or joint strain, or application of steri-strips or skin glue), major (resulting in surgery, casting, traction, any type of fracture, consultation for neurological or internal injury, or receipt of blood products for patients with coagulopathy), or death (resulting from injuries sustained from falling). For this study, a fall resulting in any injury (including minor) was considered as an injurious fall. The NDNQI data have been validated for falls and fall injury.23,24
Based on patient counts from unit censuses and/or internal data on actual patient hours on the unit, hospitals also report to the NDNQI the monthly number of patient days for each unit for which falls data are reported. The NDNQI uses these data to calculate each unit’s total and injurious fall rate per 1,000 patient days.
Physical Restraint Use
The NDNQI follows the CMS definition of restraint, which is “any manual method, physical or mechanical device, material, or equipment that immobilizes or reduces the ability of a patient to move his or her arms, legs, body, or head freely”.13 The NDNQI restraint use data are collected quarterly. Participating hospitals choose one day each quarter to conduct a restraint use prevalence survey on participating units. On the selected day, designated RNs within these hospitals visually assess each patient on the unit for restraint use. Based on this survey, hospitals report to the NDNQI the total count of patients surveyed and whether each was restrained. For restrained patients, hospitals also report the type of restraint as limb, vest, or other (eg, four side rails, net beds, mitts not attached to the bed).
We analyzed the restraint use data for the period October 1, 2006, through December 31, 2015. Thus, 37 quarters of data (eight pre- and 29 postrule change) were available. For this study, we computed for each unit the quarterly proportion of surveyed patients who were physically restrained by dividing the total count of restrained patients (regardless of the type of restraint) on the day of the survey by the total count of surveyed patients.
Covariates
Unit- and facility-level covariates were included in several model specifications to determine whether patient or facility characteristics affected the results. The unit-level covariates included the type of nursing unit (medical, medical and surgical, or surgical), monthly rates of total nursing hours per patient day, and nursing skill mix (percent registered nurses/total nursing personnel). The three facility-level variables included urban–rural location (defined as metropolitan [located in an area containing an urban core with a population of at least 50,000], micropolitan [located in an area containing an urban core with a population of 10,000-49,999], or neither), bed size (<300 beds or ≥300 beds), and teaching status (academic health center, major teaching hospital, or nonteaching hospital).
Because larger, academically affiliated hospitals are overrepresented in the NDNQI, we conducted stratified analyses of these variables to explore how change in the rates of falls and restraint use in the entire sample might differ between hospitals according to bed size (<300 beds, ≥300 beds) and teaching status (nonteaching versus teaching and academic health center).
Statistical Methods
We compared the mean annual rates of change in falls, injurious falls, and physical restraint use prevalence during the two years before the HACs Initiative went into effect (October 2006-September 2008) with the mean annual rates of change following the implementation of the payment rule. Short-term (one-year) change was the slope from October 2008 to September 2009, intermediate-term (four-year) change was the slope from October 2008 to September 2012, and long-term (seven-year) change was the slope from October 2008 to September 2015.
Monthly rates of falls and injurious falls over the 114-month period were modeled using negative binomial models with a random intercept to account for heterogeneity between units. Each base mean model included the preimplementation intercept and slope (over time), the postimplementation intercept, and slope (both linear and quadratic). We also fit the models that included the terms in the base model and facility-level covariates, unit-level covariates, both individually and combined. All models included terms for seasonality.
Quarterly prevalence rates of restraint use over the 37 quarters were modeled using beta-binomial models with a random intercept to account for heterogeneity between units. Each base mean model included the preimplementation intercept and slope (over time), the postimplementation intercept, and slope (both linear and quadratic). Similar to the one specified for falls, models were also fitted that included facility- and unit-level covariates as described above.
To adjust for multiple comparisons of the three postimplementation slopes, all confidence intervals were Bonferroni corrected.
RESULTS
Nursing Units
We included nursing units with one or more months of falls data and one or more quarters of restraint use data before and after the rule change. Of the 11,117 nursing units that submitted data to the NDNQI, 2,862 units (983 medical, 1,219 medical-surgical, and 660 surgical) with the requisite demographic, falls, and restraint use data were considered for inclusion in the study. The characteristics of the nursing units (ie, the type of unit, total nursing hours per patient day, and nursing skill mix) and hospitals (ie, location, bed size, teaching status) included in the study were similar to those of the overall NDNQI member units.
Baseline Characteristics
In the first study month (July 2006), 1,941 sample nursing units reported 5,101 falls during 1,401,652 patient-days of observation. Of these, 1,502 (29%) resulted in injury (1,281 minor, 144 moderate, 75 major, and two deaths). Across falls, the median (interquartile range [IQR]) patient age was 70 (55-80) years, with males accounting for 51% of falls. Most of the falls, 4,328 (85%), were documented as unassisted. A total of 209 (4%) falls occurred while physical restraints were in use.
In the first quarterly restraint use prevalence survey (October 2006), the 829 participating nursing units surveyed 19,979 patients (median [IQR] = 23 [20-23] patients per nursing unit). The median (IQR) age was 66 (51-78) years, and 54% of them were females. At the time of the survey, restraints were in use for 326 (1.6%) patients. Restrained patients were older than unrestrained patients (median age: 78 vs 65 years) and more likely to be male (56% vs 46%). Limb restraints were used for 139 patients, vest restraints for 66, both limb and vest restraints for 24, and other restraint types were used for 113 patients (including 11 in limb restraints and 5 in limb and vest restraints).
Change in Endpoints after Implementation of the HACs Initiative
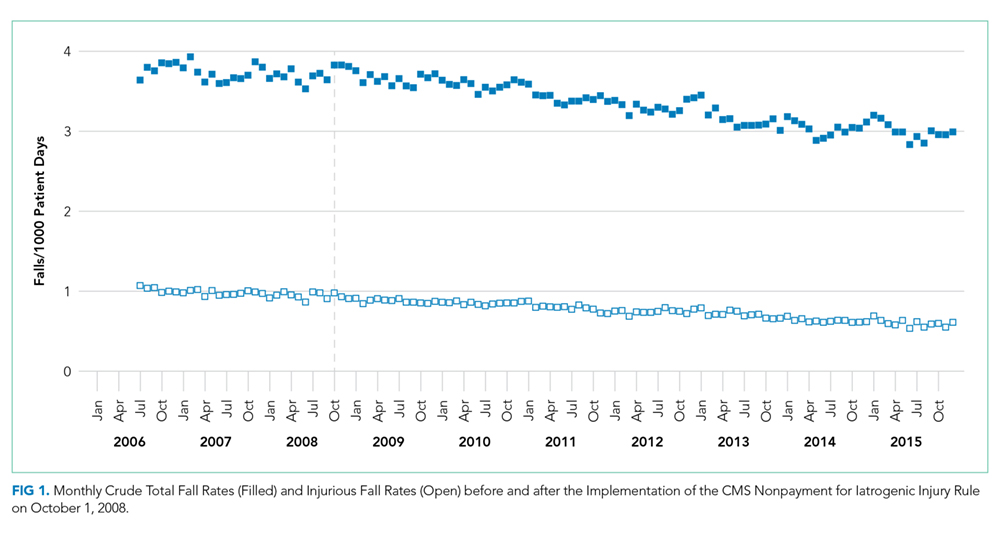
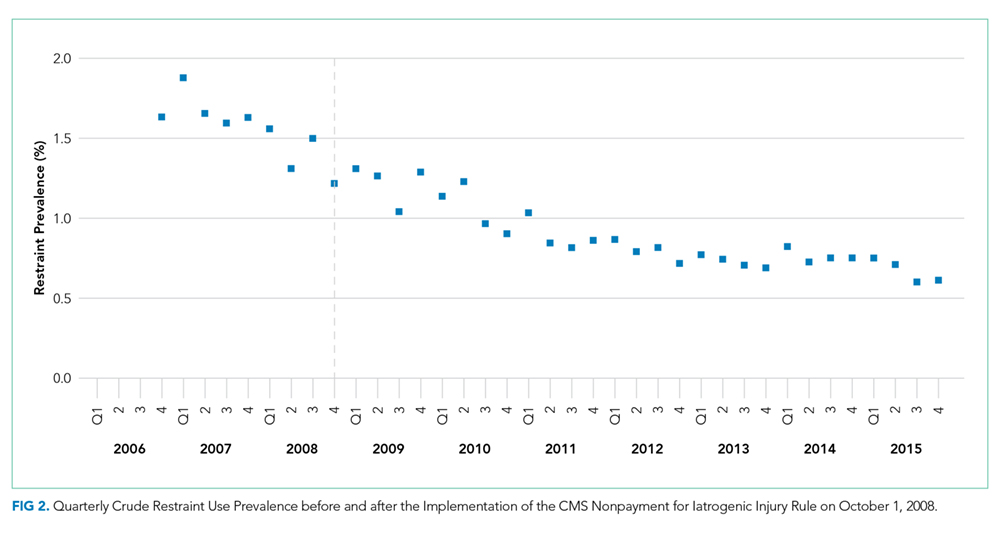
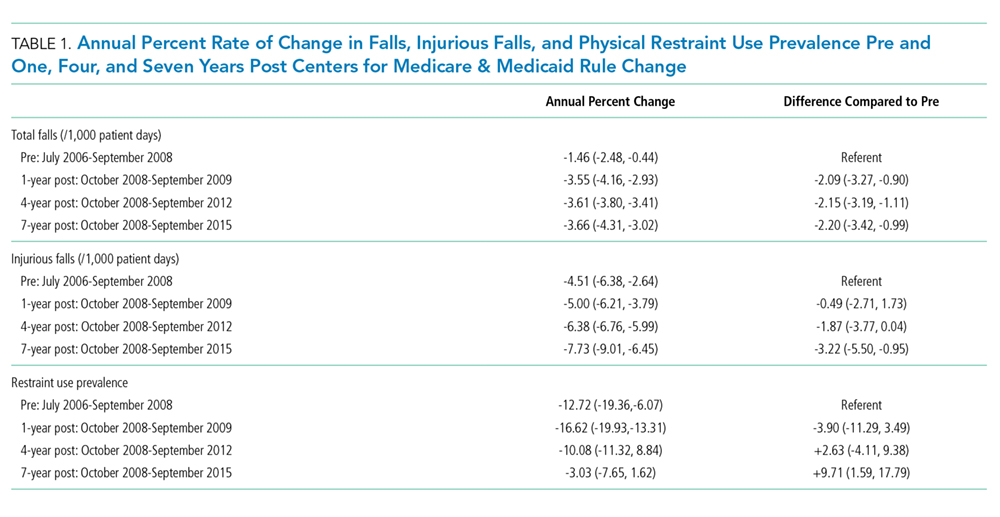
Stratified Analysis
At baseline, fall rates and restraint use prevalence were slightly higher, whereas the rate of injurious falls was slightly lower, among teaching and academic medical centers compared to those in nonteaching hospitals. Declines in falls rate and restraint use prevalence were higher in teaching hospitals than in nonteaching hospitals (data not included).
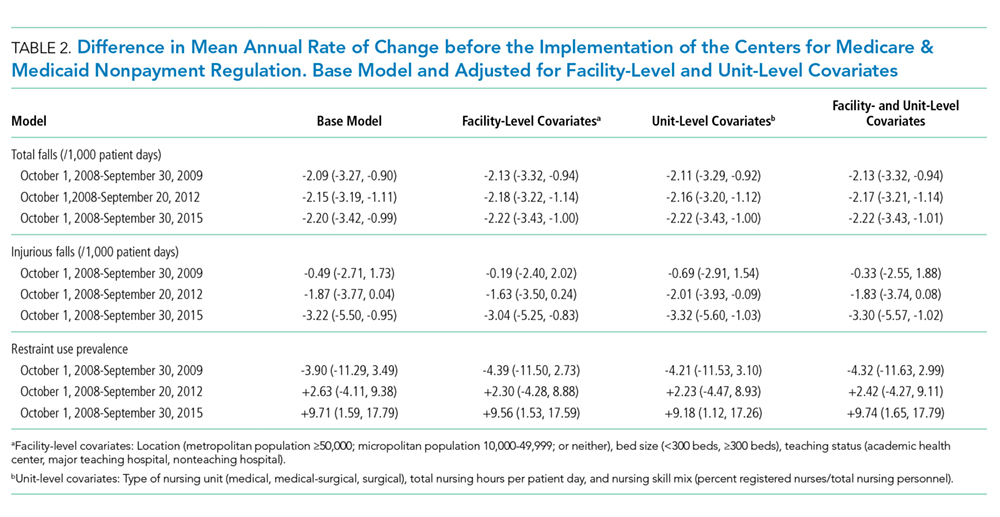
CONCLUSIONS
We examined the rates of falls and fall injuries among 2,862 hospital units before and after the implementation of the HACs Initiative. Implementation of the CMS payment change was associated with a modest improvement in the rate of decrease for falls; a statistically significant effect on the rate of decrease for injurious falls was detectable only at seven years postchange. Fall reductions were the greatest among teaching and larger hospitals. These findings are consistent with our previous analysis of NDNQI data that found no short-term effect of the rule change on the rate of injurious falls.25
We found no evidence indicating that restraint use prevalence increased because of this payment change. Physical -restraint use prevalence showed a rapidly decreasing trend before 2008, and although the rate of decline was attenuated seven years after the rule change, the overall physical restraint use prevalence in these units in 2015 was less than half of that in 2006. Unlike falls, the steepest declines in restraint use prevalence occurred in smaller hospitals.
The CMS decision to include falls with injury among the “reasonably preventable” HACs was controversial.11 Inpatient falls are largely attributable to individual patient risk factors and are unusual among HACs in the extent to which patient behavior plays a role in their occurrence. Although hospital fall prevention guidelines have been published, only a few controlled trials have been conducted, with little evidence supporting the recommendations.1,26 A quantitative review found no evidence of benefit in published hospital fall prevention studies using concurrent controls (internal rate of return = 0.92; 95% CI: 0.65-1.30),26 and a recent, well-executed, cluster randomized trial of multifactorial fall prevention interventions found no change in fall rates compared with controls.27 Current hospital fall prevention guidelines are limited to unproven and time-consuming nursing-level (eg, toileting schedules and use of alarms) or organizational-level strategies (eg, changing staff attitudes regarding the inevitability of falls or “leadership support”).1,28
Despite the large sample size and the use of nurse-reported data that include patient falls from all age groups and not subject to bias due to the regulation itself (eg, ICD coding changes), our findings should be interpreted taking into account several limitations.
First, hospitals participating in the NDNQI self-select to participate and are larger and disproportionately urban compared with nonparticipating hospitals.29 Although our findings were unchanged when hospital-level covariates were included in modeling, analyses stratified by teaching status and bed size demonstrated important differences. Larger teaching hospitals experienced greater fall reductions, whereas restraint use prevalence decreased more rapidly in smaller hospitals.
Second, the absence of a control group prevents us from conclusively attributing changes in falls rate and restraint use prevalence to the 2008 CMS payment change.30 Our findings may have been influenced by other policy changes. For example, in October 2014, the CMS implemented the Hospital-Acquired Condition Reduction Program (HACRP)20 and the Hospital Value-Based Purchasing (VBP)21 Program. Under these programs, falls with hip fractures were an indicator that could alter hospital payment.
Third, we did not ascertain the use of all available fall prevention measures such as companions, bed rails, very low beds, bed alarms, and restricted activity.31 Nor could the study address changes in patient functional status or discharge location. In a before- and after-study of four hospitals in a single hospital system, we found that bed alarm use increased, restraint orders decreased, and the use of room change or sitters remained stable after the implementation of the CMS payment.32
Nevertheless, we believe that these findings are consistent with the hypothesis that the HACs Initiative increased the cost of patient falls to hospitals, and, in response, some hospitals were able to modestly reduce the rate of falls. We found no evidence that physical restraint use prevalence increased.
In summary, our findings suggest modest impact of the HACs Initiative on falls and injurious falls, but no unintended impact on restraint use. These results highlight the importance of ensuring that pay-for-performance initiatives target outcomes where there are evidence-based approaches to prevention. The creation or identification of prevention tools and guidelines does not make an outcome preventable. Despite interval improvement in these self-selected hospital units in fall rates and physical restraint use prevalence, falls remain a difficult patient safety problem for hospitals, and further research is required to develop cost-effective, generalizable strategies for their prevention.
1. Miake-Lye IM, Hempel S, Ganz DA, Shekelle PG. Inpatient fall prevention programs as a patient safety strategy: a systematic review. Ann Intern Med. 2013;158(5):390-396. https://doi.org/10.7326/0003-4819-158-5-201303051-00005
2. Healey F, Darowski A. Older patients and falls in hospital. Clin Risk. 2012;18(5):170-176. https://doi.org/10.1258/cr.2012.012020.
3. Oliver D, Healey F, Haines TP. Preventing falls and fall-related injuries in hospitals. Clin Geriatr Med. 2010;26(4):645-692. https://doi.org/10.1016/j.cger.2010.06.005.
4. Currie L. Fall and Injury Prevention. In: Hughes RG, ed. Patient safety and quality: an evidence-based handbook for nurses (Prepared with support from the Robert Wood Johnson Foundation). AHRQ Publication NO.08-0043. Rockville, MD: Agency for Healthcare Research and Quality; 2008.
5. Wong CA, Recktenwald AJ, Jones ML, Waterman BM, Bollini ML, Dunagan WC. The cost of serious fall-related injuries at three Midwestern hospitals. Jt Comm J Qual Patient Saf. 2011;37(2):81-87. https://doi.org/10.1016/S1553-7250(11)37010-9.
6. Bates DW, Pruess K, Souney P, Platt R. Serious falls in hospitalized patients: correlates and resource utilization. Am J Med. 1995;99(2):137-143. https://doi.org/10.1016/s0002-9343(99)80133-8.
7. Fiesta J. Liability for falls. Nurs Manage. 1998;29(3):24-26. https://doi.org/10.1097/00006247-199803000-00007.
8. Rosenthal MB. Nonpayment for performance? Medicare’s new reimbursement rule. N Engl J Med. 2007;357(16):1573-1575. https://doi.org/10.1056/NEJMp078184.
9. Department of Health and Human Services, Centers for Medicare and Medicaid Services. 42 CFR Parts 411, 412, 413, and 489. Medicare program; proposed changes to the hospital inpatient prospective payment systems and fiscal year. 2008 rates; final rule. Federal Register. 2007;72(62):47130-47178.
10. King B, Pecanac K, Krupp A, Liebzeit D, Mahoney J. Impact of fall prevention on nurses and care of fall risk patients. Gerontologist. 2018;58(2):331-340. https://doi.org/10.1093/geront/gnw156.
11. Inouye SK, Brown CJ, Tinetti ME. Medicare nonpayment, hospital falls, and unintended consequences. N Engl J Med. 2009;360(23):2390-2393. https://doi.org/10.1056/NEJMp0900963.
12. Rakhmatullina M, Taub A, Jacob T. Morbidity and mortality associated with the utilization of restraints : a review of literature. Psychiatr Q. 2013;84(4):499-512. https://doi.org/10.1007/s11126-013-9262-6.
13. State Operations Manual Appendix A - Survey Protocol, Regulations and Interpretive Guidelines for Hospitals. (Revision 116, 06-06-14). http://cms.hhs.gov/Regulations-and-Guidance/Guidance/Manuals/downloads/som107ap_a_hospitals.pdf. Accessed October 26, 2014.
14. Nursing Sensitive Measures. NQF # 0203, Restraint prevalence (vest and limb only). Status: Endorsed on: August 05, 2009; Steward(s): The Joint Commission. Washington, D.C.: National Quality Forum; 2009.
15. Kopke S, Muhlhauser I, Gerlach A, et al. Effect of a guideline-based multicomponent intervention on use of physical restraints in nursing homes: a randomized controlled trial. JAMA. 2012;307(20):2177-2184. https://doi.org/10.1001/jama.2012.4517.
16. Enns E, Rhemtulla R, Ewa V, Fruetel K, Holroyd-Leduc JM. A controlled quality improvement trial to reduce the use of physical restraints in older hospitalized adults. J Am Geriatr Soc. 2014;62(3):541-545. https://doi.org/10.1111/jgs.12710.
17. Heinze C, Dassen T, Grittner U. Use of physical restraints in nursing homes and hospitals and related factors: a cross-sectional study. J Clin Nurs. 2012;21(7-8):1033-1040. https://doi.org/10.1111/j.1365-2702.2011.03931.x.
18. Minnick AF, Fogg L, Mion LC, Catrambone C, Johnson ME. Resource clusters and variation in physical restraint use. J Nurs Scholarsh. 2007;39(4):363-370. https://doi.org/10.1111/j.1547-5069.2007.00194.x.
19. Vassallo M, Wilkinson C, Stockdale R, Malik N, Baker R, Allen S. Attitudes to restraint for the prevention of falls in hospital. Gerontology. 2005;51(1):66-70. https://doi.org/10.1159/000081438.
20. Centers for Medicare & Medicaid Services. Hospital-Acquired Condition Reduction Program (HACRP). https://www.cms.gov/Medicare/Medicare-Fee-for-Service-Payment/AcuteInpatientPPS/HAC-Reduction-Program.html. Accessed September 9. 2018.
21. Centers for Medicare & Medicaid Services. The Hospital Value-Based Purchasing (VBP) Program. https://www.cms.gov/Medicare/Quality-Initiatives-Patient-Assessment-Instruments/Value-Based-Programs/HVBP/Hospital-Value-Based-Purchasing.html. Accessed September 9, 2018.
22. Dunton NE. Take a cue from the NDNQI. Nurs Manage. 2008;39(4):20, 22-23. https://doi.org/10.1097/01.NUMA.0000316054.35317.bf.
23. Garrard L, Boyle DK, Simon M, Dunton N, Gajewski B. Reliability and Validity of the NDNQI(R) Injury Falls Measure. West J Nurs Res. 2016;38(1):111-128. https://doi.org/10.1177/0193945914542851
24. Garrard L, Boyle DK, Simon M, Dunton N, Gajewski B. Reliability and validity of the NDNQI(R) injury falls measure. West J Nurs Res. 2016;38(1):111-128. https://doi.org/10.1177/0193945914542851.
25. Waters TM, Daniels MJ, Bazzoli GJ, et al. Effect of Medicare’s nonpayment for hospital-acquired conditions: lessons for future policy. JAMA Intern Med. 2015;175(3):347-354.
26. Hempel S, Newberry S, Wang Z, et al. Hospital fall prevention: a systematic review of implementation, components, adherence, and effectiveness. J Am Geriatr Soc. 2013;61(4):483-494. https://doi.org/10.1001/jamainternmed.2014.5486.
27. Barker AL, Morello RT, Wolfe R, et al. 6-PACK programme to decrease fall injuries in acute hospitals: cluster randomised controlled trial. BMJ. 2016;352:h6781. https://doi.org/10.1136/bmj.h6781.
28. Goldsack J, Bergey M, Mascioli S, Cunningham J. Hourly rounding and patient falls: what factors boost success? Nursing. 2015;45(2):25-30. https://doi.org/10.1097/01.NURSE.0000459798.79840.95.
29. Montalvo I. The National Database of Nursing Quality Indicators (NDNQI). Online Journal of Issues in Nursing. 2007;12(3).
30. Soumerai SB, Ceccarelli R, Koppel R. False dichotomies and health policy research designs: randomized trials are not always the answer. J Gen Intern Med. 2017;32(2):204-209. https://doi.org/10.1007/s11606-016-3841-9.
31. Growdon ME, Shorr RI, Inouye SK. The tension between promoting mobility and preventing falls in the hospital. JAMA Intern Med. 2017;177(6):759-760. https://doi.org/10.1001/jamainternmed.2017.0840.
32. Fehlberg EA, Lucero RJ, Weaver MT, et al. Impact of the CMS no-pay policy on hospital-acquired fall prevention related practice patterns. Innov Aging. 2017;1(3):igx036-igx036. https://doi.org/10.1093/geroni/igx036.
Accidental falls are among the most common incidents reported in hospitals, complicating approximately 2% of hospital stays.1-3 Approximately 25% of falls in hospitalized patients result in injury, and 2% involve fractures.4 Substantial costs are associated with falls, including patient care costs associated with increased length of stay and liability.5-7
Beginning October 1, 2008, the Centers for Medicare & Medicaid Services (CMS) stopped reimbursing hospitals for the additional care associated with eight hospital-acquired conditions (HACs), including serious fall-related injury, which were believed to be “reasonably preventable.”8,9 Before this change, hospitals recovered the costs of these “never events” by assigning a higher level MS-DRG (Medicare Severity Diagnosis-Related Group) code for patients experiencing such an event. This is no longer allowed under the revised CMS Prospective Payment System rules.
Although the financial penalty for iatrogenic injury was modest, the payment change placed pressure on hospital staff to decrease falls, and some nurses reported changing practice to be more restrictive of patient mobility.10 Increased use of physical restraints is a potential unintended consequence of this rule change.11 Restraints are known to cause agitation, delirium, decubiti, deconditioning, strangulation, and death.12 Not surprisingly, use of restraints is discouraged in hospitals and is a CMS quality of care indicator.13,14 Although there is no evidence that restraint use prevents patients from falling,15,16 there is a perception among both health professionals and patients that restraints reduce the risk of falling, and they are often used as a “last resort” method of fall prevention.17-19
The aim of this longitudinal study was to determine whether this payment change was associated with changes in short-, intermediate-, and long-term rates of falls, injurious falls, and physical restraint use in acute care hospitals. The CMS has included fall-related hip fracture in newer value-based purchasing programs by adding Patient Safety Indictor (PSI) 90 to both the HACs Reduction Program (HACRP)20 and the Hospital Value-Based Purchasing (VBP)21 in FY2015. However, the HACs Initiative remains the only Medicare value program that directly penalizes all injurious inpatient falls.
METHODS
Study Units
As previously described,22 the National Database of Nursing Quality Indicators (NDNQI) is a data collection project initiated by the American Nurses Association (ANA). The NDNQI provides national comparative data at the unit and facility levels on nursing-sensitive indicators endorsed by the National Quality Forum. More than 2,000 hospitals voluntarily participate in the NDNQI, including virtually all ANA Magnet-recognized hospitals, and more than 90% of nursing units participate in the fall measures (NDNQI, personal communication). At the start of study data collection, the project was administered by the School of Nursing at the University of Kansas Medical Center. In 2014, the ownership of the NDNQI was transferred from the ANA to Press Ganey Associates, Inc. In addition to standardized data on unit, facility, and staffing characteristics, the NDNQI member hospitals can elect to submit monthly data on falls and quarterly data on physical restraint use prevalence.
We examined the data collected from adult medical, medical-surgical, and surgical units in United States acute care hospitals that elected to participate in the fall and physical restraint use data collection within the NDNQI for the 27 months before and the 87 months after the implementation of the CMS rule change. Eligible units contributed at least one fall and physical restraint use data point during both the 27 months preceding October 1, 2008, and the 87 months immediately after. The Institutional Review Board at the University of Kansas Medical Center reviewed and approved the study before its implementation.
Endpoints
Fall Events
The NDNQI defines a patient fall as an unplanned descent to the floor, regardless of whether the fall results in injury and regardless of whether the patient was assisted to the floor by a member of the hospital staff. Events in which a patient lands on a surface where one would not expect to find a patient (eg, on a mat next to a low bed) are also counted as falls.
Using internal data sources (eg, medical records, incident reports), participating hospitals report the number of inpatient falls each month to the NDNQI. We analyzed the falls data for the period July 1, 2006, through December 31, 2015. Thus, each unit could contribute 114 months (27 months before the rule change and 87 months after the rule change) of falls data.
Hospitals classify the injury level of each fall as none, minor (resulting in bruise, pain, abrasion, wound cleaning, or limb elevation, or in the use of ice, dressing, or topical medication), moderate (resulting in suturing, splinting, muscle or joint strain, or application of steri-strips or skin glue), major (resulting in surgery, casting, traction, any type of fracture, consultation for neurological or internal injury, or receipt of blood products for patients with coagulopathy), or death (resulting from injuries sustained from falling). For this study, a fall resulting in any injury (including minor) was considered as an injurious fall. The NDNQI data have been validated for falls and fall injury.23,24
Based on patient counts from unit censuses and/or internal data on actual patient hours on the unit, hospitals also report to the NDNQI the monthly number of patient days for each unit for which falls data are reported. The NDNQI uses these data to calculate each unit’s total and injurious fall rate per 1,000 patient days.
Physical Restraint Use
The NDNQI follows the CMS definition of restraint, which is “any manual method, physical or mechanical device, material, or equipment that immobilizes or reduces the ability of a patient to move his or her arms, legs, body, or head freely”.13 The NDNQI restraint use data are collected quarterly. Participating hospitals choose one day each quarter to conduct a restraint use prevalence survey on participating units. On the selected day, designated RNs within these hospitals visually assess each patient on the unit for restraint use. Based on this survey, hospitals report to the NDNQI the total count of patients surveyed and whether each was restrained. For restrained patients, hospitals also report the type of restraint as limb, vest, or other (eg, four side rails, net beds, mitts not attached to the bed).
We analyzed the restraint use data for the period October 1, 2006, through December 31, 2015. Thus, 37 quarters of data (eight pre- and 29 postrule change) were available. For this study, we computed for each unit the quarterly proportion of surveyed patients who were physically restrained by dividing the total count of restrained patients (regardless of the type of restraint) on the day of the survey by the total count of surveyed patients.
Covariates
Unit- and facility-level covariates were included in several model specifications to determine whether patient or facility characteristics affected the results. The unit-level covariates included the type of nursing unit (medical, medical and surgical, or surgical), monthly rates of total nursing hours per patient day, and nursing skill mix (percent registered nurses/total nursing personnel). The three facility-level variables included urban–rural location (defined as metropolitan [located in an area containing an urban core with a population of at least 50,000], micropolitan [located in an area containing an urban core with a population of 10,000-49,999], or neither), bed size (<300 beds or ≥300 beds), and teaching status (academic health center, major teaching hospital, or nonteaching hospital).
Because larger, academically affiliated hospitals are overrepresented in the NDNQI, we conducted stratified analyses of these variables to explore how change in the rates of falls and restraint use in the entire sample might differ between hospitals according to bed size (<300 beds, ≥300 beds) and teaching status (nonteaching versus teaching and academic health center).
Statistical Methods
We compared the mean annual rates of change in falls, injurious falls, and physical restraint use prevalence during the two years before the HACs Initiative went into effect (October 2006-September 2008) with the mean annual rates of change following the implementation of the payment rule. Short-term (one-year) change was the slope from October 2008 to September 2009, intermediate-term (four-year) change was the slope from October 2008 to September 2012, and long-term (seven-year) change was the slope from October 2008 to September 2015.
Monthly rates of falls and injurious falls over the 114-month period were modeled using negative binomial models with a random intercept to account for heterogeneity between units. Each base mean model included the preimplementation intercept and slope (over time), the postimplementation intercept, and slope (both linear and quadratic). We also fit the models that included the terms in the base model and facility-level covariates, unit-level covariates, both individually and combined. All models included terms for seasonality.
Quarterly prevalence rates of restraint use over the 37 quarters were modeled using beta-binomial models with a random intercept to account for heterogeneity between units. Each base mean model included the preimplementation intercept and slope (over time), the postimplementation intercept, and slope (both linear and quadratic). Similar to the one specified for falls, models were also fitted that included facility- and unit-level covariates as described above.
To adjust for multiple comparisons of the three postimplementation slopes, all confidence intervals were Bonferroni corrected.
RESULTS
Nursing Units
We included nursing units with one or more months of falls data and one or more quarters of restraint use data before and after the rule change. Of the 11,117 nursing units that submitted data to the NDNQI, 2,862 units (983 medical, 1,219 medical-surgical, and 660 surgical) with the requisite demographic, falls, and restraint use data were considered for inclusion in the study. The characteristics of the nursing units (ie, the type of unit, total nursing hours per patient day, and nursing skill mix) and hospitals (ie, location, bed size, teaching status) included in the study were similar to those of the overall NDNQI member units.
Baseline Characteristics
In the first study month (July 2006), 1,941 sample nursing units reported 5,101 falls during 1,401,652 patient-days of observation. Of these, 1,502 (29%) resulted in injury (1,281 minor, 144 moderate, 75 major, and two deaths). Across falls, the median (interquartile range [IQR]) patient age was 70 (55-80) years, with males accounting for 51% of falls. Most of the falls, 4,328 (85%), were documented as unassisted. A total of 209 (4%) falls occurred while physical restraints were in use.
In the first quarterly restraint use prevalence survey (October 2006), the 829 participating nursing units surveyed 19,979 patients (median [IQR] = 23 [20-23] patients per nursing unit). The median (IQR) age was 66 (51-78) years, and 54% of them were females. At the time of the survey, restraints were in use for 326 (1.6%) patients. Restrained patients were older than unrestrained patients (median age: 78 vs 65 years) and more likely to be male (56% vs 46%). Limb restraints were used for 139 patients, vest restraints for 66, both limb and vest restraints for 24, and other restraint types were used for 113 patients (including 11 in limb restraints and 5 in limb and vest restraints).
Change in Endpoints after Implementation of the HACs Initiative
Stratified Analysis
At baseline, fall rates and restraint use prevalence were slightly higher, whereas the rate of injurious falls was slightly lower, among teaching and academic medical centers compared to those in nonteaching hospitals. Declines in falls rate and restraint use prevalence were higher in teaching hospitals than in nonteaching hospitals (data not included).
CONCLUSIONS
We examined the rates of falls and fall injuries among 2,862 hospital units before and after the implementation of the HACs Initiative. Implementation of the CMS payment change was associated with a modest improvement in the rate of decrease for falls; a statistically significant effect on the rate of decrease for injurious falls was detectable only at seven years postchange. Fall reductions were the greatest among teaching and larger hospitals. These findings are consistent with our previous analysis of NDNQI data that found no short-term effect of the rule change on the rate of injurious falls.25
We found no evidence indicating that restraint use prevalence increased because of this payment change. Physical -restraint use prevalence showed a rapidly decreasing trend before 2008, and although the rate of decline was attenuated seven years after the rule change, the overall physical restraint use prevalence in these units in 2015 was less than half of that in 2006. Unlike falls, the steepest declines in restraint use prevalence occurred in smaller hospitals.
The CMS decision to include falls with injury among the “reasonably preventable” HACs was controversial.11 Inpatient falls are largely attributable to individual patient risk factors and are unusual among HACs in the extent to which patient behavior plays a role in their occurrence. Although hospital fall prevention guidelines have been published, only a few controlled trials have been conducted, with little evidence supporting the recommendations.1,26 A quantitative review found no evidence of benefit in published hospital fall prevention studies using concurrent controls (internal rate of return = 0.92; 95% CI: 0.65-1.30),26 and a recent, well-executed, cluster randomized trial of multifactorial fall prevention interventions found no change in fall rates compared with controls.27 Current hospital fall prevention guidelines are limited to unproven and time-consuming nursing-level (eg, toileting schedules and use of alarms) or organizational-level strategies (eg, changing staff attitudes regarding the inevitability of falls or “leadership support”).1,28
Despite the large sample size and the use of nurse-reported data that include patient falls from all age groups and not subject to bias due to the regulation itself (eg, ICD coding changes), our findings should be interpreted taking into account several limitations.
First, hospitals participating in the NDNQI self-select to participate and are larger and disproportionately urban compared with nonparticipating hospitals.29 Although our findings were unchanged when hospital-level covariates were included in modeling, analyses stratified by teaching status and bed size demonstrated important differences. Larger teaching hospitals experienced greater fall reductions, whereas restraint use prevalence decreased more rapidly in smaller hospitals.
Second, the absence of a control group prevents us from conclusively attributing changes in falls rate and restraint use prevalence to the 2008 CMS payment change.30 Our findings may have been influenced by other policy changes. For example, in October 2014, the CMS implemented the Hospital-Acquired Condition Reduction Program (HACRP)20 and the Hospital Value-Based Purchasing (VBP)21 Program. Under these programs, falls with hip fractures were an indicator that could alter hospital payment.
Third, we did not ascertain the use of all available fall prevention measures such as companions, bed rails, very low beds, bed alarms, and restricted activity.31 Nor could the study address changes in patient functional status or discharge location. In a before- and after-study of four hospitals in a single hospital system, we found that bed alarm use increased, restraint orders decreased, and the use of room change or sitters remained stable after the implementation of the CMS payment.32
Nevertheless, we believe that these findings are consistent with the hypothesis that the HACs Initiative increased the cost of patient falls to hospitals, and, in response, some hospitals were able to modestly reduce the rate of falls. We found no evidence that physical restraint use prevalence increased.
In summary, our findings suggest modest impact of the HACs Initiative on falls and injurious falls, but no unintended impact on restraint use. These results highlight the importance of ensuring that pay-for-performance initiatives target outcomes where there are evidence-based approaches to prevention. The creation or identification of prevention tools and guidelines does not make an outcome preventable. Despite interval improvement in these self-selected hospital units in fall rates and physical restraint use prevalence, falls remain a difficult patient safety problem for hospitals, and further research is required to develop cost-effective, generalizable strategies for their prevention.
1. Miake-Lye IM, Hempel S, Ganz DA, Shekelle PG. Inpatient fall prevention programs as a patient safety strategy: a systematic review. Ann Intern Med. 2013;158(5):390-396. https://doi.org/10.7326/0003-4819-158-5-201303051-00005
2. Healey F, Darowski A. Older patients and falls in hospital. Clin Risk. 2012;18(5):170-176. https://doi.org/10.1258/cr.2012.012020.
3. Oliver D, Healey F, Haines TP. Preventing falls and fall-related injuries in hospitals. Clin Geriatr Med. 2010;26(4):645-692. https://doi.org/10.1016/j.cger.2010.06.005.
4. Currie L. Fall and Injury Prevention. In: Hughes RG, ed. Patient safety and quality: an evidence-based handbook for nurses (Prepared with support from the Robert Wood Johnson Foundation). AHRQ Publication NO.08-0043. Rockville, MD: Agency for Healthcare Research and Quality; 2008.
5. Wong CA, Recktenwald AJ, Jones ML, Waterman BM, Bollini ML, Dunagan WC. The cost of serious fall-related injuries at three Midwestern hospitals. Jt Comm J Qual Patient Saf. 2011;37(2):81-87. https://doi.org/10.1016/S1553-7250(11)37010-9.
6. Bates DW, Pruess K, Souney P, Platt R. Serious falls in hospitalized patients: correlates and resource utilization. Am J Med. 1995;99(2):137-143. https://doi.org/10.1016/s0002-9343(99)80133-8.
7. Fiesta J. Liability for falls. Nurs Manage. 1998;29(3):24-26. https://doi.org/10.1097/00006247-199803000-00007.
8. Rosenthal MB. Nonpayment for performance? Medicare’s new reimbursement rule. N Engl J Med. 2007;357(16):1573-1575. https://doi.org/10.1056/NEJMp078184.
9. Department of Health and Human Services, Centers for Medicare and Medicaid Services. 42 CFR Parts 411, 412, 413, and 489. Medicare program; proposed changes to the hospital inpatient prospective payment systems and fiscal year. 2008 rates; final rule. Federal Register. 2007;72(62):47130-47178.
10. King B, Pecanac K, Krupp A, Liebzeit D, Mahoney J. Impact of fall prevention on nurses and care of fall risk patients. Gerontologist. 2018;58(2):331-340. https://doi.org/10.1093/geront/gnw156.
11. Inouye SK, Brown CJ, Tinetti ME. Medicare nonpayment, hospital falls, and unintended consequences. N Engl J Med. 2009;360(23):2390-2393. https://doi.org/10.1056/NEJMp0900963.
12. Rakhmatullina M, Taub A, Jacob T. Morbidity and mortality associated with the utilization of restraints : a review of literature. Psychiatr Q. 2013;84(4):499-512. https://doi.org/10.1007/s11126-013-9262-6.
13. State Operations Manual Appendix A - Survey Protocol, Regulations and Interpretive Guidelines for Hospitals. (Revision 116, 06-06-14). http://cms.hhs.gov/Regulations-and-Guidance/Guidance/Manuals/downloads/som107ap_a_hospitals.pdf. Accessed October 26, 2014.
14. Nursing Sensitive Measures. NQF # 0203, Restraint prevalence (vest and limb only). Status: Endorsed on: August 05, 2009; Steward(s): The Joint Commission. Washington, D.C.: National Quality Forum; 2009.
15. Kopke S, Muhlhauser I, Gerlach A, et al. Effect of a guideline-based multicomponent intervention on use of physical restraints in nursing homes: a randomized controlled trial. JAMA. 2012;307(20):2177-2184. https://doi.org/10.1001/jama.2012.4517.
16. Enns E, Rhemtulla R, Ewa V, Fruetel K, Holroyd-Leduc JM. A controlled quality improvement trial to reduce the use of physical restraints in older hospitalized adults. J Am Geriatr Soc. 2014;62(3):541-545. https://doi.org/10.1111/jgs.12710.
17. Heinze C, Dassen T, Grittner U. Use of physical restraints in nursing homes and hospitals and related factors: a cross-sectional study. J Clin Nurs. 2012;21(7-8):1033-1040. https://doi.org/10.1111/j.1365-2702.2011.03931.x.
18. Minnick AF, Fogg L, Mion LC, Catrambone C, Johnson ME. Resource clusters and variation in physical restraint use. J Nurs Scholarsh. 2007;39(4):363-370. https://doi.org/10.1111/j.1547-5069.2007.00194.x.
19. Vassallo M, Wilkinson C, Stockdale R, Malik N, Baker R, Allen S. Attitudes to restraint for the prevention of falls in hospital. Gerontology. 2005;51(1):66-70. https://doi.org/10.1159/000081438.
20. Centers for Medicare & Medicaid Services. Hospital-Acquired Condition Reduction Program (HACRP). https://www.cms.gov/Medicare/Medicare-Fee-for-Service-Payment/AcuteInpatientPPS/HAC-Reduction-Program.html. Accessed September 9. 2018.
21. Centers for Medicare & Medicaid Services. The Hospital Value-Based Purchasing (VBP) Program. https://www.cms.gov/Medicare/Quality-Initiatives-Patient-Assessment-Instruments/Value-Based-Programs/HVBP/Hospital-Value-Based-Purchasing.html. Accessed September 9, 2018.
22. Dunton NE. Take a cue from the NDNQI. Nurs Manage. 2008;39(4):20, 22-23. https://doi.org/10.1097/01.NUMA.0000316054.35317.bf.
23. Garrard L, Boyle DK, Simon M, Dunton N, Gajewski B. Reliability and Validity of the NDNQI(R) Injury Falls Measure. West J Nurs Res. 2016;38(1):111-128. https://doi.org/10.1177/0193945914542851
24. Garrard L, Boyle DK, Simon M, Dunton N, Gajewski B. Reliability and validity of the NDNQI(R) injury falls measure. West J Nurs Res. 2016;38(1):111-128. https://doi.org/10.1177/0193945914542851.
25. Waters TM, Daniels MJ, Bazzoli GJ, et al. Effect of Medicare’s nonpayment for hospital-acquired conditions: lessons for future policy. JAMA Intern Med. 2015;175(3):347-354.
26. Hempel S, Newberry S, Wang Z, et al. Hospital fall prevention: a systematic review of implementation, components, adherence, and effectiveness. J Am Geriatr Soc. 2013;61(4):483-494. https://doi.org/10.1001/jamainternmed.2014.5486.
27. Barker AL, Morello RT, Wolfe R, et al. 6-PACK programme to decrease fall injuries in acute hospitals: cluster randomised controlled trial. BMJ. 2016;352:h6781. https://doi.org/10.1136/bmj.h6781.
28. Goldsack J, Bergey M, Mascioli S, Cunningham J. Hourly rounding and patient falls: what factors boost success? Nursing. 2015;45(2):25-30. https://doi.org/10.1097/01.NURSE.0000459798.79840.95.
29. Montalvo I. The National Database of Nursing Quality Indicators (NDNQI). Online Journal of Issues in Nursing. 2007;12(3).
30. Soumerai SB, Ceccarelli R, Koppel R. False dichotomies and health policy research designs: randomized trials are not always the answer. J Gen Intern Med. 2017;32(2):204-209. https://doi.org/10.1007/s11606-016-3841-9.
31. Growdon ME, Shorr RI, Inouye SK. The tension between promoting mobility and preventing falls in the hospital. JAMA Intern Med. 2017;177(6):759-760. https://doi.org/10.1001/jamainternmed.2017.0840.
32. Fehlberg EA, Lucero RJ, Weaver MT, et al. Impact of the CMS no-pay policy on hospital-acquired fall prevention related practice patterns. Innov Aging. 2017;1(3):igx036-igx036. https://doi.org/10.1093/geroni/igx036.
© 2019 Society of Hospital Medicine
Effect of Hospital Readmission Reduction Program on Hospital Readmissions and Mortality Rates
Chronic obstructive pulmonary disease (COPD) is recognized as the third leading cause of death nationally. Globally, it has been estimated that 10% of the population has COPD; in the United States, approximately 15 million people are affected.1,2 The annual estimated cost of COPD management in the United States is approximately $50 billion, one-third of which is directly related to inpatient hospitalization for COPD exacerbation.3,4,5 The 30-day readmission rate after hospitalization for acute exacerbation of COPD (AECOPD) is approximately 21% with an approximate cost of $13 billion per year.6,7 To reduce the cost and to improve patient outcomes, the Centers for Medicare and Medicaid Services (CMS) has designed several interventions with little effect.8
In October 2012, the Affordable Care Act added section 1886(q) to the Social Security Act and established the Hospital Readmission Reduction Program (HRRP), an initiative to decrease hospitalization costs by penalizing hospitals with high 30-day readmission rates. Under this program, hospitals received up to 3% penalty for excess readmissions after the index hospitalization with acute myocardial infarction (AMI), heart failure (HF), and pneumonia.9-11 Hospitals are penalized if their annual readmission rates are significantly above the average national readmission rate. In 2014, the HRRP was extended to include AECOPD for the FY 2015.
Since the implementation of readmission penalties, data have shown a significant decrease in the 30-day readmission rates for all conditions.12,13 On the other hand, studies have suggested that, at least for some conditions, the decrease in the 30-day readmission rate is associated with higher adverse patients outcomes, including higher mortality.14,15 However, whether a decrease in readmission rates after an AECOPD hospitalization is associated with a concomitant increase in mortality has not been examined. Therefore, our objective was to examine the association of the 30-day risk-adjusted hospital readmission rate with the 30-day risk-adjusted hospital mortality rate for patients discharged with a diagnosis of AECOPD.
METHOD
Data Sources
Publicly available data from three sources were used. The all-cause 30-day risk-standardized readmission rate (RSRR) and the 30-day risk-standardized mortality rate (RSMR) of each hospital for patients with AECOPD were obtained from the Hospital Compare database; a database maintained by the CMS.16,17 In 2014, the CMS started reporting three-year running average of 30-day mortality and readmission rate data on hospitals for AECOPD hospitalizations; the data start date was July 2010.18-22 We examined data from the FY 2010-2013 to 2014-2017 cycles on readmission and mortality reported by the CMS; this included data before and after the implementation of penalties.
Hospital characteristics were also obtained from the CMS website. Hospital ownership was defined as government (owned by Federal or state), for-profit (owned by physicians or another proprietary), or nonprofit (owned by a nonprofit organization such as a church). A hospital was considered as a teaching hospital if it obtained graduate medical education funding from the CMS.
Data on local population characteristics according to ZIP codes were obtained from the 2010 decennial census and the American Community Survey five-year (2009-2013) data files available at the United States Census Bureau website.23 For each ZIP code, we obtained data on the total population, percentage of African Americans in the population, median income, poverty level, and insurance status.
We used Hospital service area (HSA) information obtained from the Dartmouth Atlas of Health Care crosswalk files to link local population characteristics to hospitals. The Dartmouth Atlas defined 3,436 HSAs by assigning the ZIP codes to the hospital area where the greatest proportion of their Medicare residents was hospitalized.24,25
Hospital Compare data and Census Bureau population data were matched to the HSAs from the Dartmouth Atlas of Healthcare data at the ZIP code level. First, the ZIP code-level data from the Census Bureau were pooled by the HSAs obtained from the Dartmouth Atlas of Healthcare, followed by matching these data by the HSAs to the Hospital Compare data. Merging data from these three sources generated a dataset that contained information about readmission and mortality rates from a particular hospital and the population characteristics of the local healthcare market or neighborhood. Our final dataset included hospitals that had readmission and mortality information available at the Hospital Compare website and were included in the crosswalk files of the Dartmouth Atlas of Healthcare.
Statistical Analysis
Data are summarized as mean and standard deviation (SD), median with interquartile range, or frequencies as appropriate. To model the dependence of observations from the same hospital over time, we used mixed linear models with random intercept and slope. A strength of this modeling approach is that it incorporates information from all hospitals even when some hospitals are missing data for some time periods. We reached our final model through stages with increasing model complexity at each stage. In the first stage, we developed an empty model without any covariates to determine the unconditional variance components so that we can partition mortality variance into between- and within-hospital components. In the second stage, we developed an unconditional growth curve model to determine the shape of time trend in mortality over time using linear and quadratic (by including squared time in the model) growth curves. In the third stage, we added baseline readmission rates (from 2010 to 2013) to the model to determine the effect of baseline readmission rate on mortality trends and also examined its interaction with time and squared time. We generated a change in the readmission rate variable by subtracting the last readmission rate from the baseline readmission rate (readmission rate in 2010-2013 − readmission rate in 2014-2017). In the fourth stage, we included this change in readmission rate into the third-stage model to examine how changes in the readmission rate affected the time trends of mortality and also examined its interaction with time and squared time. In the final model, we included the following potential confounding variables to the fourth stage model: African American percentage in the HSA, HSA median income, percentage of people living in poverty in the HSA, median age, ownership of hospital (government, for profit), teaching status (teaching vs nonteaching), and acute care hospital beds in the HSA. Within each stage, the models were compared using the Akaike information criterion (AIC) and the Bayesian information criterion (BIC), and the model with the lowest value of each was moved to the next stage of model development. All analyses were performed in Stata 14.1 for Windows (College Station, Texas).
RESULTS
Of the 3,685 acute care hospitals analyzed in the 2010-2013 data cycle for COPD, the 30-day RSRR was 20.7% (1.28), which decreased to 19.6% (1.11) in 2014-2017 (Table 1). During the same period, the 30-day all-cause RSMR increased from 7.8% (1.03) in 2010-2013 to 8.4% (1.11) in 2014-2017. The partitioning of variance showed that 57% of variation in the mortality rate over the study period was due to between-hospital differences.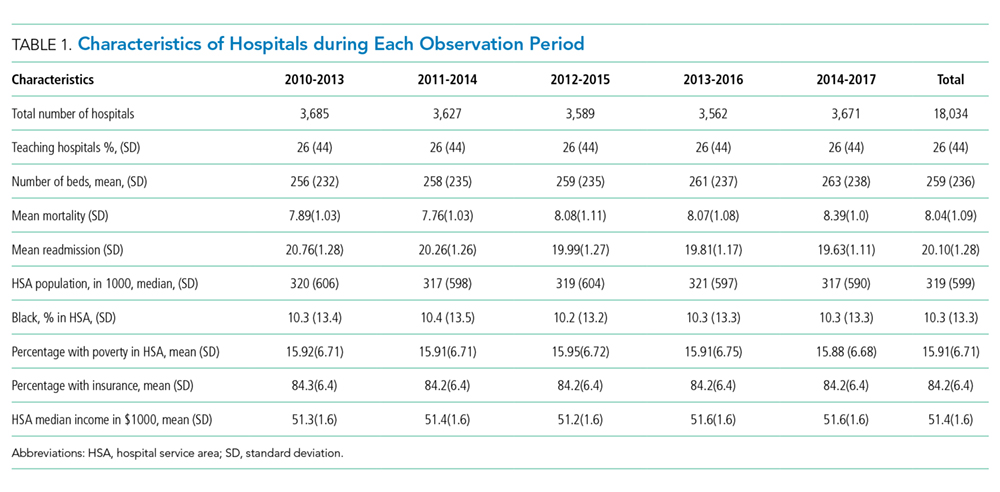
The unconditional growth model examining the linear time trend revealed a 0.13% per year (95% CI = 0.12 to 0.14; P < .0001) increase in mortality rate over the five data cycles. When the squared time variable was added to the model to examine a quadratic trend, both time and squared trend were statistically significant (Table 2) and the AIC and BIC were lower for the quadratic model. Thus, the unconditional growth curve model suggested that the mortality trend was nonlinear and the coefficients demonstrated that not only the mortality rate increased, but the rate of change in the mortality rate was also increasing during the study period.
When we added the baseline readmission rate to the abovementioned quadratic growth model, we found an inverse association; each 1% increase in baseline readmission rate was associated with 0.03% (95% CI = −0.05 to −0.005; P = .02) decrease in mortality rate. These findings suggest that hospitals with higher baseline readmission rates also had lower mortality rates. To examine whether the effect of baseline readmission rate on mortality varied over time, we included the interaction term with time in the model and then added the interaction term with squared time. As the AIC and BIC were the lowest for the model with interaction between time and baseline readmission (and not when interaction between squared time and baseline readmission were included), we accepted this model. In this model, although there was no difference in mortality according to readmissions at baseline, each 1% increase in baseline readmission rate was associated with a smaller increase in mortality rate by 0.015% (95% CI = −0.02 to −0.01; P < .0001; Table 2 and Figure 1). These findings suggest that hospitals with higher readmission rates at baseline had a smaller increase in mortality rate during the study period than those with lower readmission rates.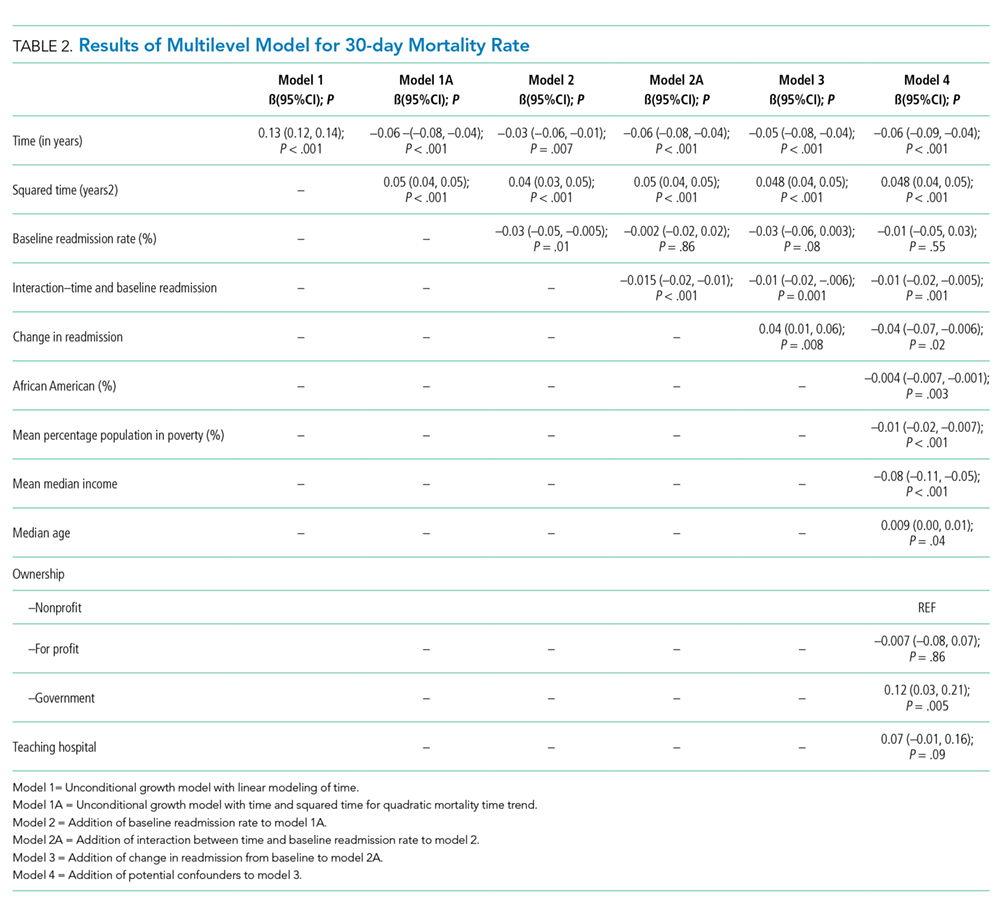
Inclusion of change in the readmissions variable in the model showed that each 1% decrease in readmission rate during the study period was associated with 0.04% (95% CI = 0.01 to 0.06; P = .008) increase in mortality. However, the interaction between change in readmission and time was not significant and the AIC and BIC of the model were higher than the model without interaction. Therefore, we retained the model without the interaction term and included other potential confounding variables to build our final model. Thus, although hospitals with different baseline readmission rates had different rates of change in mortality rate, the change in readmission rate had a consistent effect on the mortality rate. Including potential confounders in the model did not change the results; the mortality rate and the change in the mortality rate increased during the study period, a high baseline readmission rate was associated with a lower yearly increase in mortality, and a larger decrease in readmission rate was associated with a higher mortality rate (Table 2).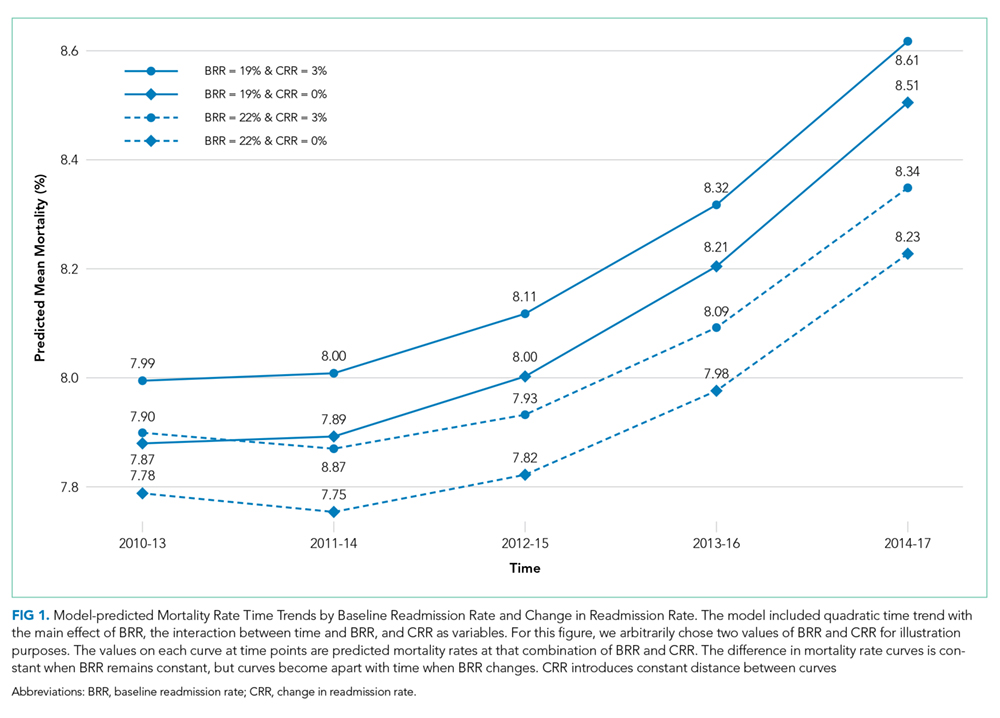
DISCUSSION
As efforts to decrease readmission rates continue as a part of the HRRP implementation by the CMS, our study shows that among hospitals that discharged patients with AECOPD during 2010-2017, the all-cause 30-day RSRR was decreased, whereas the all-cause 30-day RSMR was increased. Of particular concern is that the rate of increase in mortality also increased. We also found that hospitals with higher readmission rates in 2010-2013 had a lower rate of increase in mortality than hospitals with lower readmission rates. In addition, hospitals that had a larger decrease in readmission rates during the study period had a larger rate of increase in mortality than hospitals with a smaller decrease in readmission rates. Our findings were robust to potential confounders such as hospital characteristics and local population characteristics in which hospitals operate.
Our study findings raise the question whether the implementation of the HRRP resulted in unintentional patient harm by forcing hospitals to make changes that may affect overall patient care. This question is particularly important as other studies on hospitalized patients with HF have found similar results.13,14 On the other hand, a similar association between readmission and mortality rates has not been observed in patients with pneumonia or AMI.14 Several possible explanations can be given for the observed discrepancy between the diseases and their effect on the relationship between readmission rate and mortality rate. Both COPD and HF are chronic diseases and characterized by exacerbations, whereas AMI and pneumonia are episodic diseases that are treatable. As the number of patients hospitalized with AECOPD and HF is much larger, hospitals may have a greater focus on reducing the 30-day readmission rates and may attempt to game the process, such as by delaying admissions through the emergency department within the 30-day period or by admitting patients for observation. In fact, a study found a 3% reduction in the within-hospital readmission rate with a concurrent 0.8% increase in observation unit use since the implementation of the HRRP.26 Such approaches to patient care may lead to adverse outcomes.
It is possible that readmissions and mortality act as competing risks and hence hospitals with higher mortality rates are left with fewer patients and thus have fewer readmissions, whereas those with lower mortality rates have more patients and a higher readmission rate.27 Such studies are not possible with hospital-level data, and patient-level studies will be required to examine this competing risk hypothesis. Our study results provide some support to the competing risk hypothesis (hospitals with lower baseline readmission rates had a steeper increase in mortality); however, it is not possible to draw any conclusions due to the high risk of ecological fallacy bias.
This study has important potential implications for healthcare policy, public health, and research. We found that an important national intervention aimed at decreasing readmission rates and improving the quality of care for patients with AECOPD may be associated with higher mortality rates in these patients. There may be a need to redefine measures for determining the performance of an institution. Our study supports research into the underlying mechanisms resulting in an inverse association between readmissions and mortality. In particular, health policy researchers may need to examine how incentives and penalties affect the allocation of resources within hospitals.
This study has several strengths and some potential weaknesses. We used a national dataset to examine readmission and mortality rates that include the majority of hospitals in the United States. We also included data from the local population for each hospital, thus allowing us to examine hospital performance within the context of its target population. One potential limitation is that we used hospital-level data and not patient-level data; however, the readmission penalties are designed for hospitals, which justifies our use of hospital-level data. Furthermore, data were not available for shorter time intervals; data from shorter time intervals may be associated with greater variability. Being an observational study, it is difficult to establish a causal relationship; the longitudinal nature of the study does establish temporality, an important factor in establishing causality.
In conclusion, we found that although the readmission rates decreased, there was an increase in the mortality rate within the 30 days of discharge from the hospital in patients with AECOPD. The rate of increase in mortality was higher in hospitals with lower readmission rates than in hospitals with higher readmission rates. Further research for determining the mechanism responsible for this association is needed. Future health policy interventions may need to consider the potential for adverse outcomes.
1. Murphy SL, Xu J, Kochanek KD. Deaths: final data for 2010. Natl Vital Stat Rep. 2013;61(4):1-117.
2. Halbert RJ, Natoli JL, Gano A, et al. Global burden of copd: systematic review and meta-analysis. Eur Respir J. 2006;28(3):523-532. https://doi.org/10.1183/09031936.06.00124605.
3. Toy EL, Gallagher KF, Stanley EL, Swensen AR, Duh MS. The economic impact of exacerbations of chronic obstructive pulmonary disease and exacerbation definition: a review. COPD. 2010;7(3):214-228. https://doi.org/10.3109/15412555.2010.481697.
4. Shah T, Churpek MM, Coca Perraillon M, Konetzka RT. Understanding why patients with COPD get readmitted: a large national study to delineate the Medicare population for the readmissions penalty expansion. Chest. 2015;147(5):1219-1226. https://doi.org/10.1378/chest.14-2181.
5. Jencks SF, Williams MV, Coleman EA. Rehospitalizations among patients in the Medicare fee-for-service program. N Engl J Med. 2009;360(14):1418-1428. https://doi.org/10.1056/NEJMsa0803563.
6. Stein BD, Charbeneau JT, Lee TA, et al. Hospitalizations for acute exacerbations of chronic obstructive pulmonary disease: how you count matters. COPD. 2010;7(3):164-171. https://doi.org/10.3109/15412555.2010.481696.
7. Stein, B. D., Charbeneau, J. T., Lee, T. A., Schumock, G. T., Lindenauer, P. K., Bautista, A., . . . Krishnan, J. A. (2010). Hospitalizations for acute exacerbations of chronic obstructive pulmonary disease: how you count matters. COPD, 7(3), 164-171. doi:10.3109/15412555.2010.481696
8. McIlvennan CK, Eapen ZJ, Allen LA. Hospital readmissions reduction program. Circulation. 2015;131(20):1796-1803. https://doi.org/10.1161/CIRCULATIONAHA.114.010270.
9. McIlvennan CK, Eapen ZJ, Allen LA. Hospital readmissions reduction program. Circulation. 2015;131(20):179-1803. https://doi.org/10.1161/CIRCULATIONAHA.114.010270.
10. Centers for Medicare and Medicaid Services (CMS), HHS. Medicare Program; hospital inpatient prospective payment systems for acute care hospitals and the long-term care hospital prospective payment system and FY 2012 rates; Hospitals’ FTE Resident Caps for Graduate Medical Education Payment. Final Rules. Fed Regist. 2011;76(160):51476-51846.
11. Centers for Medicare and Medicaid Services (CMS). Medicare program; hospital inpatient prospective payment systems for acute care hospitals and the long-term care hospital prospective payment system and fiscal year 2014 rates; quality reporting requirements for specific providers; hospital conditions of participation; payment policies related to patient status. Final rules. Fed Regist. 2013;78(160):50495-51040.
12. Casillas G. Published: Mar 10 and 2017, “aiming for fewer hospital U-turns: the Medicare Hospital readmission reduction program,” [blog]. https://www.kff.org/medicare/issue-brief/aiming-for-fewer-hospital-u-turns-the-medicare-hospital-readmission-reduction-program/; Accessed March 10, 2017. The Henry J. Kaiser Family Foundation.
13. Desai NR, Ross JS, Kwon JY, et al. Association Between hospital penalty status Under the hospital readmission reduction program and readmission rates for target and nontarget conditions. JAMA. 2016;316(24): 2647-2656. https://doi.org/10.1001/jama.2016.18533.
14. Gupta A, Allen LA, Bhatt DL, et al. Association of the hospital readmissions reduction program implementation with readmission and mortality outcomes in heart failure. JAMA Cardiol. 2018;3(1):44-53. https://doi.org/10.1001/jamacardio.2017.4265.
15. Krumholz HM, Lin Z, Keenan PS, et al. Relationship between hospital readmission and mortality rates for patients hospitalized with acute myocardial infarction, heart failure, or pneumonia. JAMA. 2013;309(6):587-593. https://doi.org/10.1001/jama.2013.333.
16. Medicare Hospital compare overview,” https://www.medicare.gov/hospitalcompare/About/What-Is-HOS.html; Accessed April 17, 2019.
17. Archived datasets. Data.Medicare.Gov. Data.Medicare.Gov. Accessed April 17, 2019. https://data.medicare.gov/data/archives/hospital-compare.
18. Krumholz HM, Lin Z, Drye EE, et al. An administrative claims measure suitable for profiling hospital performance based on 30-day all-cause readmission rates among patients with acute myocardial infarction. Circ Cardiovasc Qual Outcomes. 2011;4(2):243-252. https://doi.org/10.1161/CIRCOUTCOMES.110.957498.
19. Bratzler DW, Normand SL, Wang Y, et al. An administrative claims model for profiling hospital 30-day mortality rates for pneumonia patients. PLOS ONE. 2011;6(4):e17401. https://doi.org/10.1371/journal.pone.0017401.
20. Centers for Medicare, Medicaid Services. Security Boulevard Baltimore, and Md21244 USA, “OutcomeMeasures,”. https://www.cms.gov/Medicare/Quality-Initiatives-Patient-Assessment-Instruments/HospitalQualityInits/OutcomeMeasures.html 7500; Accessed October 13, 2017.
21. Centers for Medicare and Medicaid Services (CMS), HHS. Medicare Program; Hospital Inpatient Prospective Payment Systems for Acute Care Hospitals and the Long-Term Care Hospital Prospective Payment System and Fiscal Year 2014 Rates; Quality Reporting Requirements for Specific Providers; Hospital Conditions of Participation; Payment Policies Related to Patient Status. Final Rules.”
22. Feemster LC, Au DH. Penalizing hospitals for chronic obstructive pulmonary disease readmissions. Am J Respir Crit Care Med. 2014;189(6):634-639. https://doi.org/10.1164/rccm.201308-1541PP.
23. United States Census Bureau. Census.Gov. Accessed April 17, 2019. https://www.census.gov/en.html.
24. Dartmouth atlas data,”. https://atlasdata.dartmouth.edu/. Aaccessed April 17, 2019.
25. Home. Dartmouth Atlas Healthc. https://www.dartmouthatlas.org/. Accessed April 17, 2019.
26. Zuckerman RB, Sheingold SH, Orav EJ, Ruhter J, Epstein AM. Readmissions, observation, and the hospital readmissions reduction program. N Engl J Med. 2016;374(16):1543-1551. https://doi.org/10.1056/NEJMsa1513024.
27. Gorodeski EZ, Starling RC, Blackstone EH. Are All Readmissions Bad Readmissions?, letter. World. 2010. https://doi.org/10.1056/NEJMc1001882.
Chronic obstructive pulmonary disease (COPD) is recognized as the third leading cause of death nationally. Globally, it has been estimated that 10% of the population has COPD; in the United States, approximately 15 million people are affected.1,2 The annual estimated cost of COPD management in the United States is approximately $50 billion, one-third of which is directly related to inpatient hospitalization for COPD exacerbation.3,4,5 The 30-day readmission rate after hospitalization for acute exacerbation of COPD (AECOPD) is approximately 21% with an approximate cost of $13 billion per year.6,7 To reduce the cost and to improve patient outcomes, the Centers for Medicare and Medicaid Services (CMS) has designed several interventions with little effect.8
In October 2012, the Affordable Care Act added section 1886(q) to the Social Security Act and established the Hospital Readmission Reduction Program (HRRP), an initiative to decrease hospitalization costs by penalizing hospitals with high 30-day readmission rates. Under this program, hospitals received up to 3% penalty for excess readmissions after the index hospitalization with acute myocardial infarction (AMI), heart failure (HF), and pneumonia.9-11 Hospitals are penalized if their annual readmission rates are significantly above the average national readmission rate. In 2014, the HRRP was extended to include AECOPD for the FY 2015.
Since the implementation of readmission penalties, data have shown a significant decrease in the 30-day readmission rates for all conditions.12,13 On the other hand, studies have suggested that, at least for some conditions, the decrease in the 30-day readmission rate is associated with higher adverse patients outcomes, including higher mortality.14,15 However, whether a decrease in readmission rates after an AECOPD hospitalization is associated with a concomitant increase in mortality has not been examined. Therefore, our objective was to examine the association of the 30-day risk-adjusted hospital readmission rate with the 30-day risk-adjusted hospital mortality rate for patients discharged with a diagnosis of AECOPD.
METHOD
Data Sources
Publicly available data from three sources were used. The all-cause 30-day risk-standardized readmission rate (RSRR) and the 30-day risk-standardized mortality rate (RSMR) of each hospital for patients with AECOPD were obtained from the Hospital Compare database; a database maintained by the CMS.16,17 In 2014, the CMS started reporting three-year running average of 30-day mortality and readmission rate data on hospitals for AECOPD hospitalizations; the data start date was July 2010.18-22 We examined data from the FY 2010-2013 to 2014-2017 cycles on readmission and mortality reported by the CMS; this included data before and after the implementation of penalties.
Hospital characteristics were also obtained from the CMS website. Hospital ownership was defined as government (owned by Federal or state), for-profit (owned by physicians or another proprietary), or nonprofit (owned by a nonprofit organization such as a church). A hospital was considered as a teaching hospital if it obtained graduate medical education funding from the CMS.
Data on local population characteristics according to ZIP codes were obtained from the 2010 decennial census and the American Community Survey five-year (2009-2013) data files available at the United States Census Bureau website.23 For each ZIP code, we obtained data on the total population, percentage of African Americans in the population, median income, poverty level, and insurance status.
We used Hospital service area (HSA) information obtained from the Dartmouth Atlas of Health Care crosswalk files to link local population characteristics to hospitals. The Dartmouth Atlas defined 3,436 HSAs by assigning the ZIP codes to the hospital area where the greatest proportion of their Medicare residents was hospitalized.24,25
Hospital Compare data and Census Bureau population data were matched to the HSAs from the Dartmouth Atlas of Healthcare data at the ZIP code level. First, the ZIP code-level data from the Census Bureau were pooled by the HSAs obtained from the Dartmouth Atlas of Healthcare, followed by matching these data by the HSAs to the Hospital Compare data. Merging data from these three sources generated a dataset that contained information about readmission and mortality rates from a particular hospital and the population characteristics of the local healthcare market or neighborhood. Our final dataset included hospitals that had readmission and mortality information available at the Hospital Compare website and were included in the crosswalk files of the Dartmouth Atlas of Healthcare.
Statistical Analysis
Data are summarized as mean and standard deviation (SD), median with interquartile range, or frequencies as appropriate. To model the dependence of observations from the same hospital over time, we used mixed linear models with random intercept and slope. A strength of this modeling approach is that it incorporates information from all hospitals even when some hospitals are missing data for some time periods. We reached our final model through stages with increasing model complexity at each stage. In the first stage, we developed an empty model without any covariates to determine the unconditional variance components so that we can partition mortality variance into between- and within-hospital components. In the second stage, we developed an unconditional growth curve model to determine the shape of time trend in mortality over time using linear and quadratic (by including squared time in the model) growth curves. In the third stage, we added baseline readmission rates (from 2010 to 2013) to the model to determine the effect of baseline readmission rate on mortality trends and also examined its interaction with time and squared time. We generated a change in the readmission rate variable by subtracting the last readmission rate from the baseline readmission rate (readmission rate in 2010-2013 − readmission rate in 2014-2017). In the fourth stage, we included this change in readmission rate into the third-stage model to examine how changes in the readmission rate affected the time trends of mortality and also examined its interaction with time and squared time. In the final model, we included the following potential confounding variables to the fourth stage model: African American percentage in the HSA, HSA median income, percentage of people living in poverty in the HSA, median age, ownership of hospital (government, for profit), teaching status (teaching vs nonteaching), and acute care hospital beds in the HSA. Within each stage, the models were compared using the Akaike information criterion (AIC) and the Bayesian information criterion (BIC), and the model with the lowest value of each was moved to the next stage of model development. All analyses were performed in Stata 14.1 for Windows (College Station, Texas).
RESULTS
Of the 3,685 acute care hospitals analyzed in the 2010-2013 data cycle for COPD, the 30-day RSRR was 20.7% (1.28), which decreased to 19.6% (1.11) in 2014-2017 (Table 1). During the same period, the 30-day all-cause RSMR increased from 7.8% (1.03) in 2010-2013 to 8.4% (1.11) in 2014-2017. The partitioning of variance showed that 57% of variation in the mortality rate over the study period was due to between-hospital differences.
The unconditional growth model examining the linear time trend revealed a 0.13% per year (95% CI = 0.12 to 0.14; P < .0001) increase in mortality rate over the five data cycles. When the squared time variable was added to the model to examine a quadratic trend, both time and squared trend were statistically significant (Table 2) and the AIC and BIC were lower for the quadratic model. Thus, the unconditional growth curve model suggested that the mortality trend was nonlinear and the coefficients demonstrated that not only the mortality rate increased, but the rate of change in the mortality rate was also increasing during the study period.
When we added the baseline readmission rate to the abovementioned quadratic growth model, we found an inverse association; each 1% increase in baseline readmission rate was associated with 0.03% (95% CI = −0.05 to −0.005; P = .02) decrease in mortality rate. These findings suggest that hospitals with higher baseline readmission rates also had lower mortality rates. To examine whether the effect of baseline readmission rate on mortality varied over time, we included the interaction term with time in the model and then added the interaction term with squared time. As the AIC and BIC were the lowest for the model with interaction between time and baseline readmission (and not when interaction between squared time and baseline readmission were included), we accepted this model. In this model, although there was no difference in mortality according to readmissions at baseline, each 1% increase in baseline readmission rate was associated with a smaller increase in mortality rate by 0.015% (95% CI = −0.02 to −0.01; P < .0001; Table 2 and Figure 1). These findings suggest that hospitals with higher readmission rates at baseline had a smaller increase in mortality rate during the study period than those with lower readmission rates.
Inclusion of change in the readmissions variable in the model showed that each 1% decrease in readmission rate during the study period was associated with 0.04% (95% CI = 0.01 to 0.06; P = .008) increase in mortality. However, the interaction between change in readmission and time was not significant and the AIC and BIC of the model were higher than the model without interaction. Therefore, we retained the model without the interaction term and included other potential confounding variables to build our final model. Thus, although hospitals with different baseline readmission rates had different rates of change in mortality rate, the change in readmission rate had a consistent effect on the mortality rate. Including potential confounders in the model did not change the results; the mortality rate and the change in the mortality rate increased during the study period, a high baseline readmission rate was associated with a lower yearly increase in mortality, and a larger decrease in readmission rate was associated with a higher mortality rate (Table 2).
DISCUSSION
As efforts to decrease readmission rates continue as a part of the HRRP implementation by the CMS, our study shows that among hospitals that discharged patients with AECOPD during 2010-2017, the all-cause 30-day RSRR was decreased, whereas the all-cause 30-day RSMR was increased. Of particular concern is that the rate of increase in mortality also increased. We also found that hospitals with higher readmission rates in 2010-2013 had a lower rate of increase in mortality than hospitals with lower readmission rates. In addition, hospitals that had a larger decrease in readmission rates during the study period had a larger rate of increase in mortality than hospitals with a smaller decrease in readmission rates. Our findings were robust to potential confounders such as hospital characteristics and local population characteristics in which hospitals operate.
Our study findings raise the question whether the implementation of the HRRP resulted in unintentional patient harm by forcing hospitals to make changes that may affect overall patient care. This question is particularly important as other studies on hospitalized patients with HF have found similar results.13,14 On the other hand, a similar association between readmission and mortality rates has not been observed in patients with pneumonia or AMI.14 Several possible explanations can be given for the observed discrepancy between the diseases and their effect on the relationship between readmission rate and mortality rate. Both COPD and HF are chronic diseases and characterized by exacerbations, whereas AMI and pneumonia are episodic diseases that are treatable. As the number of patients hospitalized with AECOPD and HF is much larger, hospitals may have a greater focus on reducing the 30-day readmission rates and may attempt to game the process, such as by delaying admissions through the emergency department within the 30-day period or by admitting patients for observation. In fact, a study found a 3% reduction in the within-hospital readmission rate with a concurrent 0.8% increase in observation unit use since the implementation of the HRRP.26 Such approaches to patient care may lead to adverse outcomes.
It is possible that readmissions and mortality act as competing risks and hence hospitals with higher mortality rates are left with fewer patients and thus have fewer readmissions, whereas those with lower mortality rates have more patients and a higher readmission rate.27 Such studies are not possible with hospital-level data, and patient-level studies will be required to examine this competing risk hypothesis. Our study results provide some support to the competing risk hypothesis (hospitals with lower baseline readmission rates had a steeper increase in mortality); however, it is not possible to draw any conclusions due to the high risk of ecological fallacy bias.
This study has important potential implications for healthcare policy, public health, and research. We found that an important national intervention aimed at decreasing readmission rates and improving the quality of care for patients with AECOPD may be associated with higher mortality rates in these patients. There may be a need to redefine measures for determining the performance of an institution. Our study supports research into the underlying mechanisms resulting in an inverse association between readmissions and mortality. In particular, health policy researchers may need to examine how incentives and penalties affect the allocation of resources within hospitals.
This study has several strengths and some potential weaknesses. We used a national dataset to examine readmission and mortality rates that include the majority of hospitals in the United States. We also included data from the local population for each hospital, thus allowing us to examine hospital performance within the context of its target population. One potential limitation is that we used hospital-level data and not patient-level data; however, the readmission penalties are designed for hospitals, which justifies our use of hospital-level data. Furthermore, data were not available for shorter time intervals; data from shorter time intervals may be associated with greater variability. Being an observational study, it is difficult to establish a causal relationship; the longitudinal nature of the study does establish temporality, an important factor in establishing causality.
In conclusion, we found that although the readmission rates decreased, there was an increase in the mortality rate within the 30 days of discharge from the hospital in patients with AECOPD. The rate of increase in mortality was higher in hospitals with lower readmission rates than in hospitals with higher readmission rates. Further research for determining the mechanism responsible for this association is needed. Future health policy interventions may need to consider the potential for adverse outcomes.
1. Murphy SL, Xu J, Kochanek KD. Deaths: final data for 2010. Natl Vital Stat Rep. 2013;61(4):1-117.
2. Halbert RJ, Natoli JL, Gano A, et al. Global burden of copd: systematic review and meta-analysis. Eur Respir J. 2006;28(3):523-532. https://doi.org/10.1183/09031936.06.00124605.
3. Toy EL, Gallagher KF, Stanley EL, Swensen AR, Duh MS. The economic impact of exacerbations of chronic obstructive pulmonary disease and exacerbation definition: a review. COPD. 2010;7(3):214-228. https://doi.org/10.3109/15412555.2010.481697.
4. Shah T, Churpek MM, Coca Perraillon M, Konetzka RT. Understanding why patients with COPD get readmitted: a large national study to delineate the Medicare population for the readmissions penalty expansion. Chest. 2015;147(5):1219-1226. https://doi.org/10.1378/chest.14-2181.
5. Jencks SF, Williams MV, Coleman EA. Rehospitalizations among patients in the Medicare fee-for-service program. N Engl J Med. 2009;360(14):1418-1428. https://doi.org/10.1056/NEJMsa0803563.
6. Stein BD, Charbeneau JT, Lee TA, et al. Hospitalizations for acute exacerbations of chronic obstructive pulmonary disease: how you count matters. COPD. 2010;7(3):164-171. https://doi.org/10.3109/15412555.2010.481696.
7. Stein, B. D., Charbeneau, J. T., Lee, T. A., Schumock, G. T., Lindenauer, P. K., Bautista, A., . . . Krishnan, J. A. (2010). Hospitalizations for acute exacerbations of chronic obstructive pulmonary disease: how you count matters. COPD, 7(3), 164-171. doi:10.3109/15412555.2010.481696
8. McIlvennan CK, Eapen ZJ, Allen LA. Hospital readmissions reduction program. Circulation. 2015;131(20):1796-1803. https://doi.org/10.1161/CIRCULATIONAHA.114.010270.
9. McIlvennan CK, Eapen ZJ, Allen LA. Hospital readmissions reduction program. Circulation. 2015;131(20):179-1803. https://doi.org/10.1161/CIRCULATIONAHA.114.010270.
10. Centers for Medicare and Medicaid Services (CMS), HHS. Medicare Program; hospital inpatient prospective payment systems for acute care hospitals and the long-term care hospital prospective payment system and FY 2012 rates; Hospitals’ FTE Resident Caps for Graduate Medical Education Payment. Final Rules. Fed Regist. 2011;76(160):51476-51846.
11. Centers for Medicare and Medicaid Services (CMS). Medicare program; hospital inpatient prospective payment systems for acute care hospitals and the long-term care hospital prospective payment system and fiscal year 2014 rates; quality reporting requirements for specific providers; hospital conditions of participation; payment policies related to patient status. Final rules. Fed Regist. 2013;78(160):50495-51040.
12. Casillas G. Published: Mar 10 and 2017, “aiming for fewer hospital U-turns: the Medicare Hospital readmission reduction program,” [blog]. https://www.kff.org/medicare/issue-brief/aiming-for-fewer-hospital-u-turns-the-medicare-hospital-readmission-reduction-program/; Accessed March 10, 2017. The Henry J. Kaiser Family Foundation.
13. Desai NR, Ross JS, Kwon JY, et al. Association Between hospital penalty status Under the hospital readmission reduction program and readmission rates for target and nontarget conditions. JAMA. 2016;316(24): 2647-2656. https://doi.org/10.1001/jama.2016.18533.
14. Gupta A, Allen LA, Bhatt DL, et al. Association of the hospital readmissions reduction program implementation with readmission and mortality outcomes in heart failure. JAMA Cardiol. 2018;3(1):44-53. https://doi.org/10.1001/jamacardio.2017.4265.
15. Krumholz HM, Lin Z, Keenan PS, et al. Relationship between hospital readmission and mortality rates for patients hospitalized with acute myocardial infarction, heart failure, or pneumonia. JAMA. 2013;309(6):587-593. https://doi.org/10.1001/jama.2013.333.
16. Medicare Hospital compare overview,” https://www.medicare.gov/hospitalcompare/About/What-Is-HOS.html; Accessed April 17, 2019.
17. Archived datasets. Data.Medicare.Gov. Data.Medicare.Gov. Accessed April 17, 2019. https://data.medicare.gov/data/archives/hospital-compare.
18. Krumholz HM, Lin Z, Drye EE, et al. An administrative claims measure suitable for profiling hospital performance based on 30-day all-cause readmission rates among patients with acute myocardial infarction. Circ Cardiovasc Qual Outcomes. 2011;4(2):243-252. https://doi.org/10.1161/CIRCOUTCOMES.110.957498.
19. Bratzler DW, Normand SL, Wang Y, et al. An administrative claims model for profiling hospital 30-day mortality rates for pneumonia patients. PLOS ONE. 2011;6(4):e17401. https://doi.org/10.1371/journal.pone.0017401.
20. Centers for Medicare, Medicaid Services. Security Boulevard Baltimore, and Md21244 USA, “OutcomeMeasures,”. https://www.cms.gov/Medicare/Quality-Initiatives-Patient-Assessment-Instruments/HospitalQualityInits/OutcomeMeasures.html 7500; Accessed October 13, 2017.
21. Centers for Medicare and Medicaid Services (CMS), HHS. Medicare Program; Hospital Inpatient Prospective Payment Systems for Acute Care Hospitals and the Long-Term Care Hospital Prospective Payment System and Fiscal Year 2014 Rates; Quality Reporting Requirements for Specific Providers; Hospital Conditions of Participation; Payment Policies Related to Patient Status. Final Rules.”
22. Feemster LC, Au DH. Penalizing hospitals for chronic obstructive pulmonary disease readmissions. Am J Respir Crit Care Med. 2014;189(6):634-639. https://doi.org/10.1164/rccm.201308-1541PP.
23. United States Census Bureau. Census.Gov. Accessed April 17, 2019. https://www.census.gov/en.html.
24. Dartmouth atlas data,”. https://atlasdata.dartmouth.edu/. Aaccessed April 17, 2019.
25. Home. Dartmouth Atlas Healthc. https://www.dartmouthatlas.org/. Accessed April 17, 2019.
26. Zuckerman RB, Sheingold SH, Orav EJ, Ruhter J, Epstein AM. Readmissions, observation, and the hospital readmissions reduction program. N Engl J Med. 2016;374(16):1543-1551. https://doi.org/10.1056/NEJMsa1513024.
27. Gorodeski EZ, Starling RC, Blackstone EH. Are All Readmissions Bad Readmissions?, letter. World. 2010. https://doi.org/10.1056/NEJMc1001882.
© 2019 Society of Hospital Medicine