User login
Comparing the Quality of Patient Guidance on Dermatologic Care Generated by ChatGPT vs Reddit
Comparing the Quality of Patient Guidance on Dermatologic Care Generated by ChatGPT vs Reddit
To the Editor:
Online resources that are convenient and affordable play a crucial role in mitigating health inequality and improving patient access to health care information; however, the benefits are limited by the quality of information available, as medical misinformation can lead to patients engaging in harmful practices, making dangerous decisions, and even avoiding safe and effective treatments. In this study, we aimed to assess and compare the quality of patient guidance on dermatologic care generated by ChatGPT vs Reddit based on accuracy, appropriateness, and safety. It is essential to assess the quality and reliability of online health information to support patients in making informed decisions about their health.
The emergence and advancement of artificial intelligence and large language models such as ChatGPT present a new method for patients to access health care advice. ChatGPT can engage in conversation by accessing information from existing publicly available data on the internet, including books and websites, up to the year 2023 and providing humanlike responses with context.1 ChatGPT’s access to a breadth of online evidence-based literature ensures the dissemination of quality information that is quick and without inherent bias, offering the potential to more closely align with health care professionals. ChatGPT’s use in dermatology by patients has shown efficacy, with a 98.87% approval rate by dermatologists scoring its ability to recommend appropriate medication for common dermatologic conditions.2 However, ChatGPT has limitations when providing health care advice and has been observed to misunderstand health care standards, lack personalization, and offer incorrect references; currently, the latest publicly available version (ChatGPT 3.5) also is unable to analyze clinical images.3,4
Reddit is an online social media forum that allows users to post questions and photographs to which anyone can reply and offer advice. Patients may find comfort in online communities where they can connect with others facing similar challenges related to their diagnosis. Within these communities, the responses often share users’ own lived experiences and offer support based on what has and has not worked for them. Prior research found that users intentionally seeking health information via Reddit are likely to implement the advice they receive even without verification of its credibility, suggesting a trust and receptibility to ideas offered on the platform.5 Furthermore, a study analyzing the dermatologic content of 17 dermatology related subreddits that had 1000 or more subscribers found that 70.6% of posts fell under the category of “seeking health/cosmetic advice.”6 Reddit users thus are vulnerable to receiving advice based on personal bias and exposing their health information to the public.
We hypothesized that ChatGPT would provide users with guidance that was more closely aligned with typical dermatologists’ advice due to its thorough analysis and compilation of diverse sources and recommendations available on the internet. We expected Reddit to yield recommendations of lesser quality and a diminished safety score, primarily due to the absence of credibility-vetting mechanisms and the influence of personal biases within the advice shared.
User-submitted posts to large dermatologic community Reddit forums representing a few of the most common skin conditions (r/eczema, r/acne, r/Folliculitis, r/SebDerm, r/Hidradenitis, r/keratosis, and r/Psoriasis) were retrospectively reviewed from January 2024 to March 2024. The most popular posts that did not include photographs were included in our study. Posts with photographs were excluded, as clinical images were not able to be uploaded to the publicly available ChatGPT 3.5. We collected real user questions about common skin conditions from Reddit forums and then asked ChatGPT to answer those same questions. We compared ChatGPT’s responses to the most upvoted Reddit comments to see how they matched up (eTable).

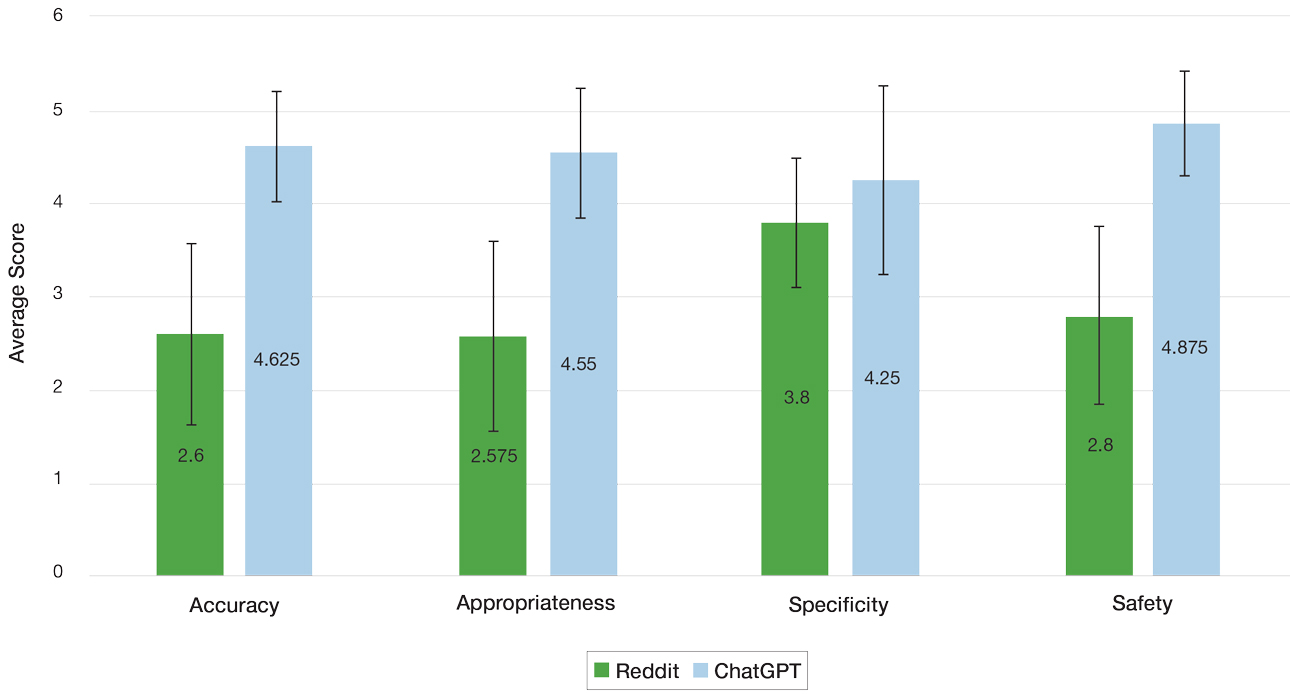
Each ChatGPT response and the top-rated Reddit comment were independently evaluated by a board certified dermatologist (S.A.) and a dermatology resident (A.H.K.). The quality of the ChatGPT and Reddit responses were determined by scoring the accuracy, appropriateness, safety consideration, and specificity on a 5-point Likert scale (1=low, 5=high). The 2 evaluators’ mean scores for each of the 4 categories were calculated based on adequate interrater reliability, which was tested using Cohen’s κ coefficient. Related-samples sign tests were used to compare ChatGPT and Reddit responses for each of the 4 categories. Analysis was completed using SPSS statistics software version 29.0 (IBM). The evaluators also were asked to provide qualitative feedback on the strengths and weaknesses of each response.
Our retrospective review yielded 20 total questions: 5 (25%) on atopic dermatitis, 4 (20%) on acne, 4 (20%) on hidradenitis suppurativa, 4 (20%) on psoriasis, 1 (5%) on folliculitis, 1 (5%) on keratosis pilaris, and 1 (5%) on seborrheic dermatitis. The number of posts was limited to 20 due to the extensive time required for grading each response. These 20 questions were selected from a larger pool of eligible posts based on factors such as clarity and relevance to common skin conditions. With regard to the types of questions that were asked, 6 (30%) were related to general management of a diagnosis, 5 (25%) were on treatment recommendations for symptom relief, 3 (15%) were on optimal utilization of current treatment regimens, 2 (10%) were on prescription side effects, 2 (10%) were on diagnosis presentation, 1 (5%) was on potential triggers of the diagnosis, and 1 (5%) was on natural treatment recommendations.
Mean (SD) evaluator scores for accuracy were significantly higher among ChatGPT responses compared with Reddit (4.63 [0.60] vs 2.60 [0.98])(P<.001). ChatGPT responses also were significantly higher for appropriateness compared with Reddit (4.55 [0.71] vs 2.58 [1.02])(P<.001) and safety consideration (4.88 [0.56] vs 2.80[0.97])(P <.001). There was no significant difference in mean specificity scores between ChatGPT and Reddit (4.25[1.02] vs 3.80 [0.70])(P=.096)(Figure).
For the Reddit responses, the weighted Cohen’s κ coefficient between the 2 evaluators was 0.200 (95% CI, –.089 to .489) for accuracy, 0.255 (95% CI, .014-.497) for appropriateness, 0.385 (95% CI, .176-.594) for safety consideration, and –0.024 (95% CI, –.177 to .129) for specificity. For the ChatGPT responses, the weighted Cohen’s κ coefficient between the 2 evaluators was 0.426 (95% CI, .122-.730) for accuracy, 0.571 (95% CI, .294-.849) for appropriateness, 0.655 (95% CI, .632-.678) for safety consideration, and 0.313 (95% CI, .043-.584) for specificity.
The strengths and weaknesses of the responses also were qualitatively analyzed. One commonly observed strength was ChatGPT’s frequent and appropriate recommendation for users to consult a dermatologist. In the case of atopic dermatitis—one of the more frequently asked about conditions—ChatGPT consistently emphasized evidence-based strategies such as gentle skin care and moisturization, reflecting alignment with clinical guidelines. Additionally, a common weakness of both ChatGPT and Reddit responses generally was the lack of personalized guidance and comprehensive discussion of the risks and benefits of specific treatments. It also was noted that neither platform consistently explored differential diagnoses—for example, distinguishing atopic dermatitis from conditions such as allergic contact dermatitis—limiting the diagnostic depth of the responses.
ChatGPT and Reddit can provide patients with quick and accessible health information for various dermatologic concerns. The results of our study demonstrated a significantly higher level of accuracy, appropriateness, and safety of responses generated by ChatGPT compared with human-generated responses on Reddit (P<.001). Both platforms offered similarly specific responses to user inquiries, demonstrating ChatGPT’s ability to comprehend user questions and draw from publicly available texts and Reddit users’ contributing insights based on their own first-hand experiences.
Reddit’s dermatologic forums often feature personal anecdotes and unique treatments described by individual users. Although specific to particular dermatologic concerns, such advice lacks an evidence-based standard of care. With the noted inherent trust of patients seeking guidance within Reddit communities, patients may follow unhelpful or potentially dangerous medical advice.5 A study examining 300 user-submitted posts on popular Reddit dermatology forums during the COVID-19 pandemic found that the mean scores for top-rated comments’ potential to be misleading or dangerous was 2.33 out of 5 on a Likert scale (95% CI, 2.18- 2.48).7 Dermatologists should be aware of the potential risks associated with dermatologic advice offered on Reddit and should caution patients against relying solely on this information without consulting a qualified dermatologist first.
Reddit’s open-forum design provides licensed dermatologists with the opportunity to disseminate evidence based information regarding dermatologic conditions. Currently, there is a subreddit (r/AskDocs) that allows users to post medical questions that can be answered by moderator-verified physicians. Participation from dermatologists in online communities such as this can improve the quality of dermatologic information shared online, combat misinformation, and promote safe skin care practices.
ChatGPT offers more accurate, appropriate, and safe information compared to Reddit responses, but its answers lack personalization. In a clinical setting, a personalized treatment plan from a physician can be tailored with a comprehensive discussion of the risks and benefits. Further, clinical settings allow for diagnosis and confirmation via biopsy and meticulous history taking to ensure that the diagnosis and treatment plan are accurate. While ChatGPT may be an option for seeking basic advice on dermatologic conditions, a licensed dermatologist should always be consulted for proper medical advice. Services such as telehealth may be another option to for patients with limited access to care.
Since ChatGPT 3.5 does not support the ability to upload images, our study acknowledges a limitation regarding the inclusion of Reddit posts containing photographs. Images can improve the response quality from both Reddit users and ChatGPT. While the updated ChatGPT 4o is capable of processing images, it requires a monthly subscription fee. The free version was chosen for use in this study, as this may reflect the most likely version that patients of low socioeconomic status would utilize to access dermatologic care; however, there is potential for growth and improvement of ChatGPT’s capability in providing medical advice.
This study compared the strengths and limitations of ChatGPT’s and Reddit’s responses to common dermatologic inquiries. ChatGPT and Reddit both show potential to be helpful sources of dermatologic health information; however, their current versions have many limitations and require caution and careful examination by patients of the guidance provided. Clinicians should be aware of these limitations when advising patients and emphasize the importance of consulting a licensed dermatologist for personalized, evidence-based care. For the best medical advice, it is always advisable to consult with a licensed dermatologist.
- Roumeliotis KI, Tselikas ND. ChatGPT and open-AI models: a preliminary review. Future Internet. 2023;15:192. doi:10.3390/fi15060192
- Iqbal U, Lee LTJ, Rahmanti AR, et al. Can large language models provide secondary reliable opinion on treatment options for dermatological diseases? J Am Med Inform Assoc. 2024;31:1341-1347. doi:10.1093/jamia/ocae067
- Whiles BB, Bird VG, Canales BK, et al. Caution! AI bot has entered the patient chat: ChatGPT has limitations in providing accurate urologic healthcare advice. Urology. 2023;180:278-284. doi:10.1016/j.urology.2023.07.010
- Nastasi AJ, Courtright KR, Halpern SD, et al. A vignette-based evaluation of ChatGPT’s ability to provide appropriate and equitable medical advice across care contexts. Sci Rep. 2023;13:17885. doi:10.1038/s41598-023-45223-y
- Record RA, Silberman WR, Santiago JE, et al. I sought it, I Reddit: examining health information engagement behaviors among Reddit users. J Health Commun. 2018;23:470-476. doi:10.1080/1081073 0.2018.1465493
- Buntinx-Krieg T, Caravaglio J, Domozych R, et al. Dermatology on Reddit: elucidating trends in dermatologic communications on the world wide web. Dermatol Online J. 2017;23:13030/qt9dr1f7x6.
- Aboul-Fettouh N, Lee KP, Kash N, et al. Social media and dermatology during the COVID-19 pandemic: analyzing usersubmitted posts seeking dermatologic advice on Reddit. Cureus. 2023;15:E33720. doi:10.7759/cureus.33720
To the Editor:
Online resources that are convenient and affordable play a crucial role in mitigating health inequality and improving patient access to health care information; however, the benefits are limited by the quality of information available, as medical misinformation can lead to patients engaging in harmful practices, making dangerous decisions, and even avoiding safe and effective treatments. In this study, we aimed to assess and compare the quality of patient guidance on dermatologic care generated by ChatGPT vs Reddit based on accuracy, appropriateness, and safety. It is essential to assess the quality and reliability of online health information to support patients in making informed decisions about their health.
The emergence and advancement of artificial intelligence and large language models such as ChatGPT present a new method for patients to access health care advice. ChatGPT can engage in conversation by accessing information from existing publicly available data on the internet, including books and websites, up to the year 2023 and providing humanlike responses with context.1 ChatGPT’s access to a breadth of online evidence-based literature ensures the dissemination of quality information that is quick and without inherent bias, offering the potential to more closely align with health care professionals. ChatGPT’s use in dermatology by patients has shown efficacy, with a 98.87% approval rate by dermatologists scoring its ability to recommend appropriate medication for common dermatologic conditions.2 However, ChatGPT has limitations when providing health care advice and has been observed to misunderstand health care standards, lack personalization, and offer incorrect references; currently, the latest publicly available version (ChatGPT 3.5) also is unable to analyze clinical images.3,4
Reddit is an online social media forum that allows users to post questions and photographs to which anyone can reply and offer advice. Patients may find comfort in online communities where they can connect with others facing similar challenges related to their diagnosis. Within these communities, the responses often share users’ own lived experiences and offer support based on what has and has not worked for them. Prior research found that users intentionally seeking health information via Reddit are likely to implement the advice they receive even without verification of its credibility, suggesting a trust and receptibility to ideas offered on the platform.5 Furthermore, a study analyzing the dermatologic content of 17 dermatology related subreddits that had 1000 or more subscribers found that 70.6% of posts fell under the category of “seeking health/cosmetic advice.”6 Reddit users thus are vulnerable to receiving advice based on personal bias and exposing their health information to the public.
We hypothesized that ChatGPT would provide users with guidance that was more closely aligned with typical dermatologists’ advice due to its thorough analysis and compilation of diverse sources and recommendations available on the internet. We expected Reddit to yield recommendations of lesser quality and a diminished safety score, primarily due to the absence of credibility-vetting mechanisms and the influence of personal biases within the advice shared.
User-submitted posts to large dermatologic community Reddit forums representing a few of the most common skin conditions (r/eczema, r/acne, r/Folliculitis, r/SebDerm, r/Hidradenitis, r/keratosis, and r/Psoriasis) were retrospectively reviewed from January 2024 to March 2024. The most popular posts that did not include photographs were included in our study. Posts with photographs were excluded, as clinical images were not able to be uploaded to the publicly available ChatGPT 3.5. We collected real user questions about common skin conditions from Reddit forums and then asked ChatGPT to answer those same questions. We compared ChatGPT’s responses to the most upvoted Reddit comments to see how they matched up (eTable).
Each ChatGPT response and the top-rated Reddit comment were independently evaluated by a board certified dermatologist (S.A.) and a dermatology resident (A.H.K.). The quality of the ChatGPT and Reddit responses were determined by scoring the accuracy, appropriateness, safety consideration, and specificity on a 5-point Likert scale (1=low, 5=high). The 2 evaluators’ mean scores for each of the 4 categories were calculated based on adequate interrater reliability, which was tested using Cohen’s κ coefficient. Related-samples sign tests were used to compare ChatGPT and Reddit responses for each of the 4 categories. Analysis was completed using SPSS statistics software version 29.0 (IBM). The evaluators also were asked to provide qualitative feedback on the strengths and weaknesses of each response.
Our retrospective review yielded 20 total questions: 5 (25%) on atopic dermatitis, 4 (20%) on acne, 4 (20%) on hidradenitis suppurativa, 4 (20%) on psoriasis, 1 (5%) on folliculitis, 1 (5%) on keratosis pilaris, and 1 (5%) on seborrheic dermatitis. The number of posts was limited to 20 due to the extensive time required for grading each response. These 20 questions were selected from a larger pool of eligible posts based on factors such as clarity and relevance to common skin conditions. With regard to the types of questions that were asked, 6 (30%) were related to general management of a diagnosis, 5 (25%) were on treatment recommendations for symptom relief, 3 (15%) were on optimal utilization of current treatment regimens, 2 (10%) were on prescription side effects, 2 (10%) were on diagnosis presentation, 1 (5%) was on potential triggers of the diagnosis, and 1 (5%) was on natural treatment recommendations.
Mean (SD) evaluator scores for accuracy were significantly higher among ChatGPT responses compared with Reddit (4.63 [0.60] vs 2.60 [0.98])(P<.001). ChatGPT responses also were significantly higher for appropriateness compared with Reddit (4.55 [0.71] vs 2.58 [1.02])(P<.001) and safety consideration (4.88 [0.56] vs 2.80[0.97])(P <.001). There was no significant difference in mean specificity scores between ChatGPT and Reddit (4.25[1.02] vs 3.80 [0.70])(P=.096)(Figure).
For the Reddit responses, the weighted Cohen’s κ coefficient between the 2 evaluators was 0.200 (95% CI, –.089 to .489) for accuracy, 0.255 (95% CI, .014-.497) for appropriateness, 0.385 (95% CI, .176-.594) for safety consideration, and –0.024 (95% CI, –.177 to .129) for specificity. For the ChatGPT responses, the weighted Cohen’s κ coefficient between the 2 evaluators was 0.426 (95% CI, .122-.730) for accuracy, 0.571 (95% CI, .294-.849) for appropriateness, 0.655 (95% CI, .632-.678) for safety consideration, and 0.313 (95% CI, .043-.584) for specificity.
The strengths and weaknesses of the responses also were qualitatively analyzed. One commonly observed strength was ChatGPT’s frequent and appropriate recommendation for users to consult a dermatologist. In the case of atopic dermatitis—one of the more frequently asked about conditions—ChatGPT consistently emphasized evidence-based strategies such as gentle skin care and moisturization, reflecting alignment with clinical guidelines. Additionally, a common weakness of both ChatGPT and Reddit responses generally was the lack of personalized guidance and comprehensive discussion of the risks and benefits of specific treatments. It also was noted that neither platform consistently explored differential diagnoses—for example, distinguishing atopic dermatitis from conditions such as allergic contact dermatitis—limiting the diagnostic depth of the responses.
ChatGPT and Reddit can provide patients with quick and accessible health information for various dermatologic concerns. The results of our study demonstrated a significantly higher level of accuracy, appropriateness, and safety of responses generated by ChatGPT compared with human-generated responses on Reddit (P<.001). Both platforms offered similarly specific responses to user inquiries, demonstrating ChatGPT’s ability to comprehend user questions and draw from publicly available texts and Reddit users’ contributing insights based on their own first-hand experiences.
Reddit’s dermatologic forums often feature personal anecdotes and unique treatments described by individual users. Although specific to particular dermatologic concerns, such advice lacks an evidence-based standard of care. With the noted inherent trust of patients seeking guidance within Reddit communities, patients may follow unhelpful or potentially dangerous medical advice.5 A study examining 300 user-submitted posts on popular Reddit dermatology forums during the COVID-19 pandemic found that the mean scores for top-rated comments’ potential to be misleading or dangerous was 2.33 out of 5 on a Likert scale (95% CI, 2.18- 2.48).7 Dermatologists should be aware of the potential risks associated with dermatologic advice offered on Reddit and should caution patients against relying solely on this information without consulting a qualified dermatologist first.
Reddit’s open-forum design provides licensed dermatologists with the opportunity to disseminate evidence based information regarding dermatologic conditions. Currently, there is a subreddit (r/AskDocs) that allows users to post medical questions that can be answered by moderator-verified physicians. Participation from dermatologists in online communities such as this can improve the quality of dermatologic information shared online, combat misinformation, and promote safe skin care practices.
ChatGPT offers more accurate, appropriate, and safe information compared to Reddit responses, but its answers lack personalization. In a clinical setting, a personalized treatment plan from a physician can be tailored with a comprehensive discussion of the risks and benefits. Further, clinical settings allow for diagnosis and confirmation via biopsy and meticulous history taking to ensure that the diagnosis and treatment plan are accurate. While ChatGPT may be an option for seeking basic advice on dermatologic conditions, a licensed dermatologist should always be consulted for proper medical advice. Services such as telehealth may be another option to for patients with limited access to care.
Since ChatGPT 3.5 does not support the ability to upload images, our study acknowledges a limitation regarding the inclusion of Reddit posts containing photographs. Images can improve the response quality from both Reddit users and ChatGPT. While the updated ChatGPT 4o is capable of processing images, it requires a monthly subscription fee. The free version was chosen for use in this study, as this may reflect the most likely version that patients of low socioeconomic status would utilize to access dermatologic care; however, there is potential for growth and improvement of ChatGPT’s capability in providing medical advice.
This study compared the strengths and limitations of ChatGPT’s and Reddit’s responses to common dermatologic inquiries. ChatGPT and Reddit both show potential to be helpful sources of dermatologic health information; however, their current versions have many limitations and require caution and careful examination by patients of the guidance provided. Clinicians should be aware of these limitations when advising patients and emphasize the importance of consulting a licensed dermatologist for personalized, evidence-based care. For the best medical advice, it is always advisable to consult with a licensed dermatologist.
- Roumeliotis KI, Tselikas ND. ChatGPT and open-AI models: a preliminary review. Future Internet. 2023;15:192. doi:10.3390/fi15060192
- Iqbal U, Lee LTJ, Rahmanti AR, et al. Can large language models provide secondary reliable opinion on treatment options for dermatological diseases? J Am Med Inform Assoc. 2024;31:1341-1347. doi:10.1093/jamia/ocae067
- Whiles BB, Bird VG, Canales BK, et al. Caution! AI bot has entered the patient chat: ChatGPT has limitations in providing accurate urologic healthcare advice. Urology. 2023;180:278-284. doi:10.1016/j.urology.2023.07.010
- Nastasi AJ, Courtright KR, Halpern SD, et al. A vignette-based evaluation of ChatGPT’s ability to provide appropriate and equitable medical advice across care contexts. Sci Rep. 2023;13:17885. doi:10.1038/s41598-023-45223-y
- Record RA, Silberman WR, Santiago JE, et al. I sought it, I Reddit: examining health information engagement behaviors among Reddit users. J Health Commun. 2018;23:470-476. doi:10.1080/1081073 0.2018.1465493
- Buntinx-Krieg T, Caravaglio J, Domozych R, et al. Dermatology on Reddit: elucidating trends in dermatologic communications on the world wide web. Dermatol Online J. 2017;23:13030/qt9dr1f7x6.
- Aboul-Fettouh N, Lee KP, Kash N, et al. Social media and dermatology during the COVID-19 pandemic: analyzing usersubmitted posts seeking dermatologic advice on Reddit. Cureus. 2023;15:E33720. doi:10.7759/cureus.33720
Comparing the Quality of Patient Guidance on Dermatologic Care Generated by ChatGPT vs Reddit
Comparing the Quality of Patient Guidance on Dermatologic Care Generated by ChatGPT vs Reddit
PRACTICE POINTS
- ChatGPT and Reddit are free, convenient, and accessible online resources that patients may use for guidance on dermatologic care.
- Dermatologists should be aware of the potential risks associated with obtaining medical guidance from ChatGPT and Reddit and caution patients on them.
- An increasing presence of dermatologists on online public forums can increase the dissemination of reliable health care information.
Impact of Multisite Patient Education on Pharmacotherapy for Veterans With Alcohol Use Disorder
Impact of Multisite Patient Education on Pharmacotherapy for Veterans With Alcohol Use Disorder
Excessive alcohol use is one of the leading preventable causes of death in the United States, responsible for about 178,000 deaths annually and an average of 488 daily deaths in 2020 and 2021.1Alcohol-related deaths increased by 49% between 2006 and 2019.2 This trend continued during the COVID-19 pandemic, with death certificates that listed alcohol increasing by > 25% from 2019 to 2020, and another 10% in 2021.3 This increase of alcohol-related deaths includes those as a direct result of chronic alcohol use, such as alcoholic cardiomyopathy, alcoholic hepatitis and cirrhosis, and alcohol-induced pancreatitis, as well as a result of acute use such as alcohol poisoning, suicide by exposure to alcohol, and alcohol-impaired driving fatalities.4
Excessive alcohol consumption poses other serious risks, including cases when intake is abruptly reduced without proper management. Alcohol withdrawal syndrome (AWS) can vary in severity, with potentially life-threatening complications such as hallucinations, seizures, and delirium tremens.5
These risks highlight the importance of professional intervention and support, not only to mitigate risks associated with AWS, but provide a pathway towards recovery from alcohol use disorder (AUD).
According to the 2022 National Survey on Drug Use and Health, 28.8 million US adults had AUD in the prior year, yet only 7.6% of these individuals received treatment and an even smaller group (2.2%) received medication-assisted treatment for alcohol.6,7 This is despite American Psychiatric Association guidelines for the pharmacological treatment of patients with AUD, including the use of naltrexone, acamprosate, disulfiram, topiramate, or gabapentin, depending on therapy goals, past medication trials, medication contraindications, and patient preference.8 Several of these medications are approved by the US Food and Drug Administration (FDA) for the treatment of AUD and have support for effectiveness from randomized controlled trials and meta-analyses.9-11
Clinical practice guidelines for the management of substance use disorders (SUDs) from the US Department of Veterans Affairs (VA) and US Department of Defense have strong recommendations for naltrexone and topiramate as first-line pharmacotherapies for moderate to severe AUD. Acamprosate and disulfiram are weak recommendations as alternative options. Gabapentin is a weak recommendation for cases where first-line treatments are contraindicated or ineffective. The guidelines emphasize the importance of a comprehensive approach to AUD treatment, including psychosocial interventions in addition to pharmacotherapy.12
A 2023 national survey found veterans reported higher alcohol consumption than nonveterans.13 At the end of fiscal year 2023, > 4.4 million veterans—6% of Veterans Health Administration patients—had been diagnosed with AUD.14 However, > 87% of these patients nationally, and 88% of Veterans Integrated Service Network (VISN) 21 patients, were not receiving naltrexone, acamprosate, disulfiram, or topiramate as part of their treatment. The VA Academic Detailing Service (ADS) now includes AUD pharmacotherapy as a campaign focus, highlighting its importance. The ADS is a pharmacy educational outreach program that uses unbiased clinical guidelines to promote aligning prescribing behavior with best practices. Academic detailing methods include speaking with health care practitioners (HCPs), and direct-to-consumer (DTC) patient education.
ADS campaigns include DTC educational handouts. Past ADS projects and research using DTC have demonstrated a significant improvement in outcomes and positively influencing patients’ pharmacotherapy treatment. 15,16 A VA quality improvement project found a positive correlation between the initiation of AUD pharmacotherapy and engagement with mental health care following the distribution of AUD DTC patient education. 17 This project aimed to apply the same principles of prior research to explore the use of DTC across multiple facilities within VISN 21 to increase AUD pharmacotherapy. VISN 21 includes VA facilities and clinics across the Pacific Islands, Nevada, and California and serves about 350,000 veterans.
METHODS
A prospective cohort of VISN 21 veterans with or at high risk for AUD was identified using the VA ADS AUD Dashboard. The cohort included those not on acamprosate, disulfiram, naltrexone, topiramate, or gabapentin for treatment of AUD and had an elevated Alcohol Use Disorder Identification Test-Consumption (AUDIT-C) score of ≥ 6 (high risk) with an AUD diagnosis or ≥ 8 (severe risk) without a diagnosis. The AUDIT-C scores used in the dashboard are supported by the VA AUD clinician guide as the minimum scores when AUD pharmacotherapy should be offered to patients.18 Prescriptions filled outside the VA were not included in this dashboard.
Data and patient information were collected using the VA Corporate Data Warehouse. To be eligible, veterans needed a valid mailing address within the VISN 21 region and a primary care, mental health, or SUD clinician prescriber visit scheduled between October 1, 2023, and January 31, 2024. Veterans were excluded if they were in hospice, had a 1-year mortality risk score > 50% based on their Care Assessment Need (CAN) score, or facility leadership opted out of project involvement. Patients with both severe renal and hepatic impairments were excluded because they were ineligible for AUD pharmacotherapy. However, veterans with either renal or hepatic impairment (but not both) were included, as they could be potential candidates for ≥ 1 AUD pharmacotherapy option.
Initial correspondence with facilities was initiated through local academic detailers. A local champion was identified for the 1 facility without an academic detailer. Facilities could opt in or out of the project. Approval was provided by the local pharmacy and therapeutics committee, pharmacy, primary care, or psychiatry leadership. Approval process and clinician involvement varied by site.
Education
The selected AUD patient education was designed and approved by the national VA ADS (eappendix). The DTC patient education provided general knowledge about alcohol, including what constitutes a standard amount of alcohol, what is considered heavy drinking, risks of heavy drinking, creating a plan with a clinician to reduce and manage withdrawal symptoms, and additional resources. The DTC was accompanied by a cover letter that included a local facility contact number.
A centralized mailing facility was used for all materials. VA Northern California Health Care System provided the funding to cover the cost of postage. The list of veterans to be contacted was updated on a rolling basis and DTC education was mailed 2 weeks prior to their scheduled prescriber visit.
The eligible cohort of 1260 veterans received DTC education. A comparator group of 2048 veterans that did not receive DTC education was obtained retrospectively by using the same inclusion and exclusion criteria with a scheduled primary care, mental health, or SUD HCP visit from October 1, 2022, to January 31, 2023. The outcomes assessed were within 30 days of the scheduled visit, with the primary outcome as the initiation of AUD-related pharmacotherapy and the secondary outcome as the placement of a consultation for mental health or SUD services. Any consultations sent to Behavioral Health, Addiction, Mental Health, Psychiatric, and SUD services following the HCP visit, within the specified time frame, were used for the secondary outcome.
Matching and Analysis
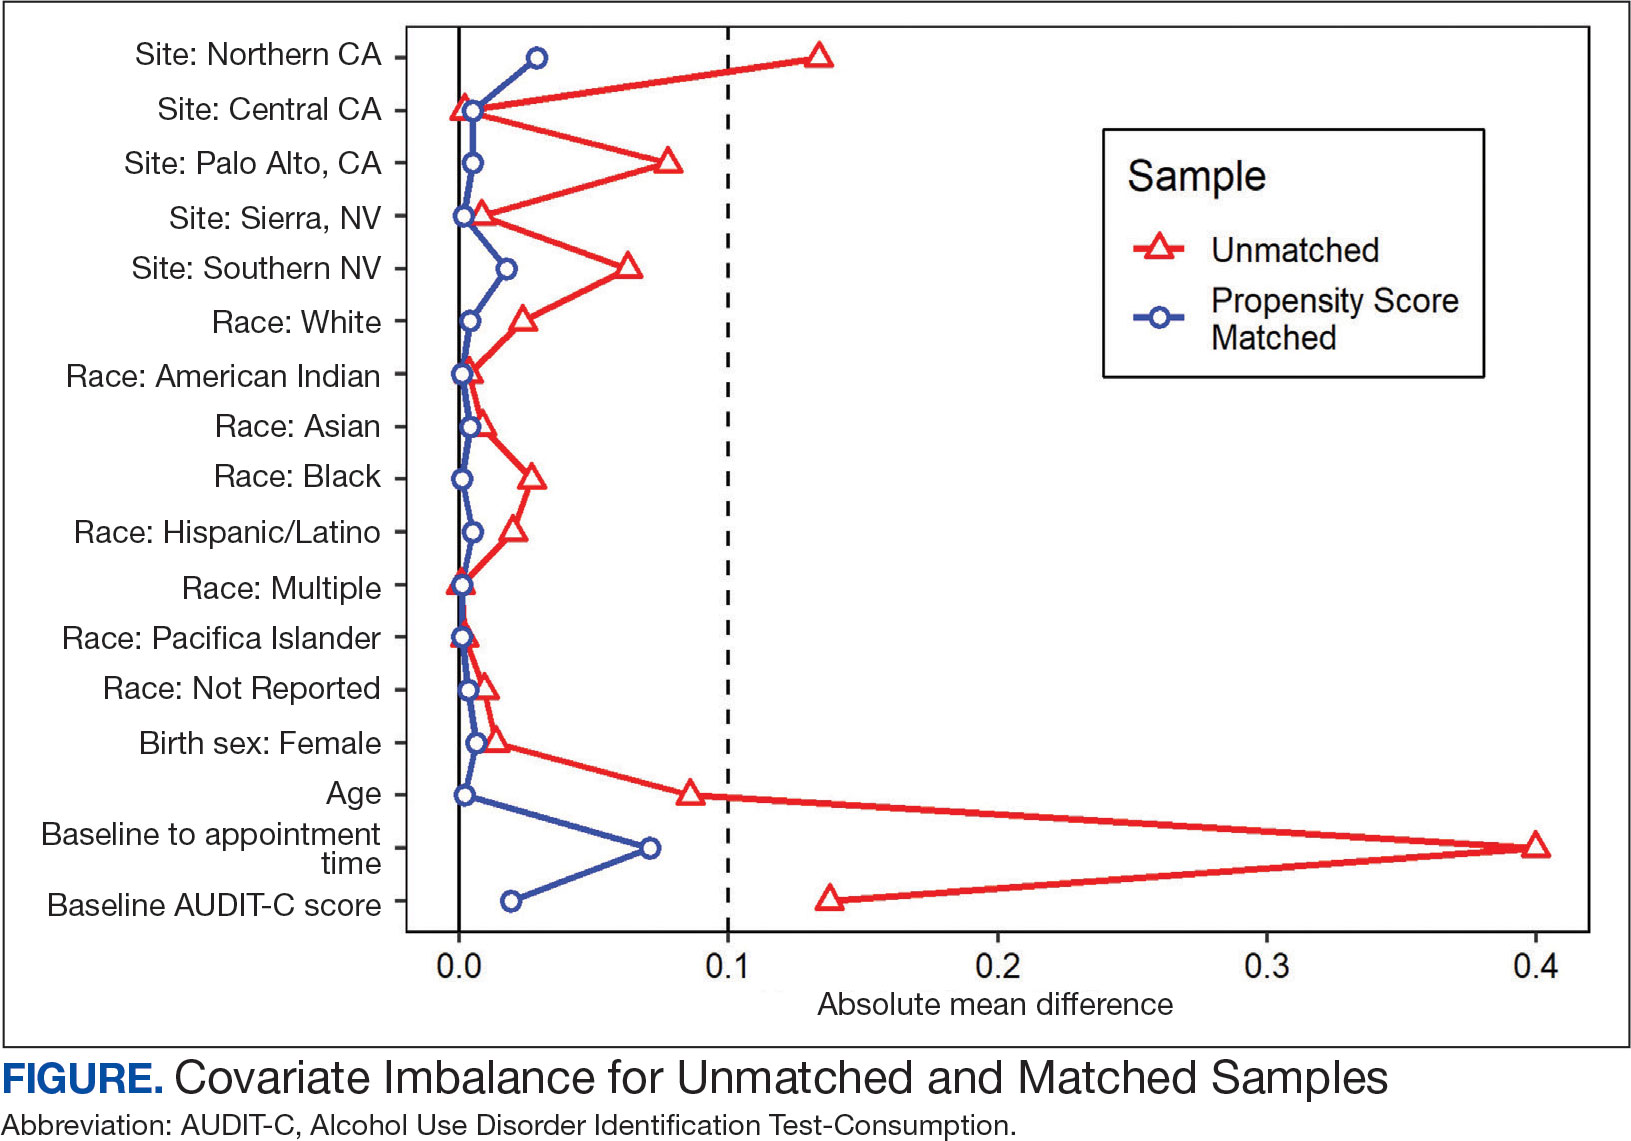
A 1-to-1 nearest neighbor propensity score (PS) matching without replacement was used to pair the 1260 veterans from the intervention group with similarly scored comparator group veterans for a PS-matched final dataset of 2520 veterans. The PS model was a multivariate logistic regression with the outcome being exposure and comparator group status. Baseline characteristics used in the PS model were age, birth sex, race, facility of care, baseline AUDIT-C score, and days between project start and scheduled appointment. Covariate imbalance for the PS-matched sample was assessed to ensure the standardized mean difference for all covariates fell under a 0.1 threshold (Figure).19
A frequency table was provided to compare the discrete distributions of the baseline characteristics in the intervention and comparator groups. Logistic regression analysis was performed to evaluate the association between DTC education exposure and pharmacotherapy initiation, while controlling for potential confounders. Univariate and multivariate P value results for each variable included in the model were reported along with the multivariate odds ratios (ORs) and their associated 95% CIs. Logistic regression analyses were run for both outcomes. Each model included the exposure and comparator group status as well as the baseline characteristics included in the PS model. Statistical significance was set at P < .05. All statistical analyses were performed with R version 4.2.1.
RESULTS
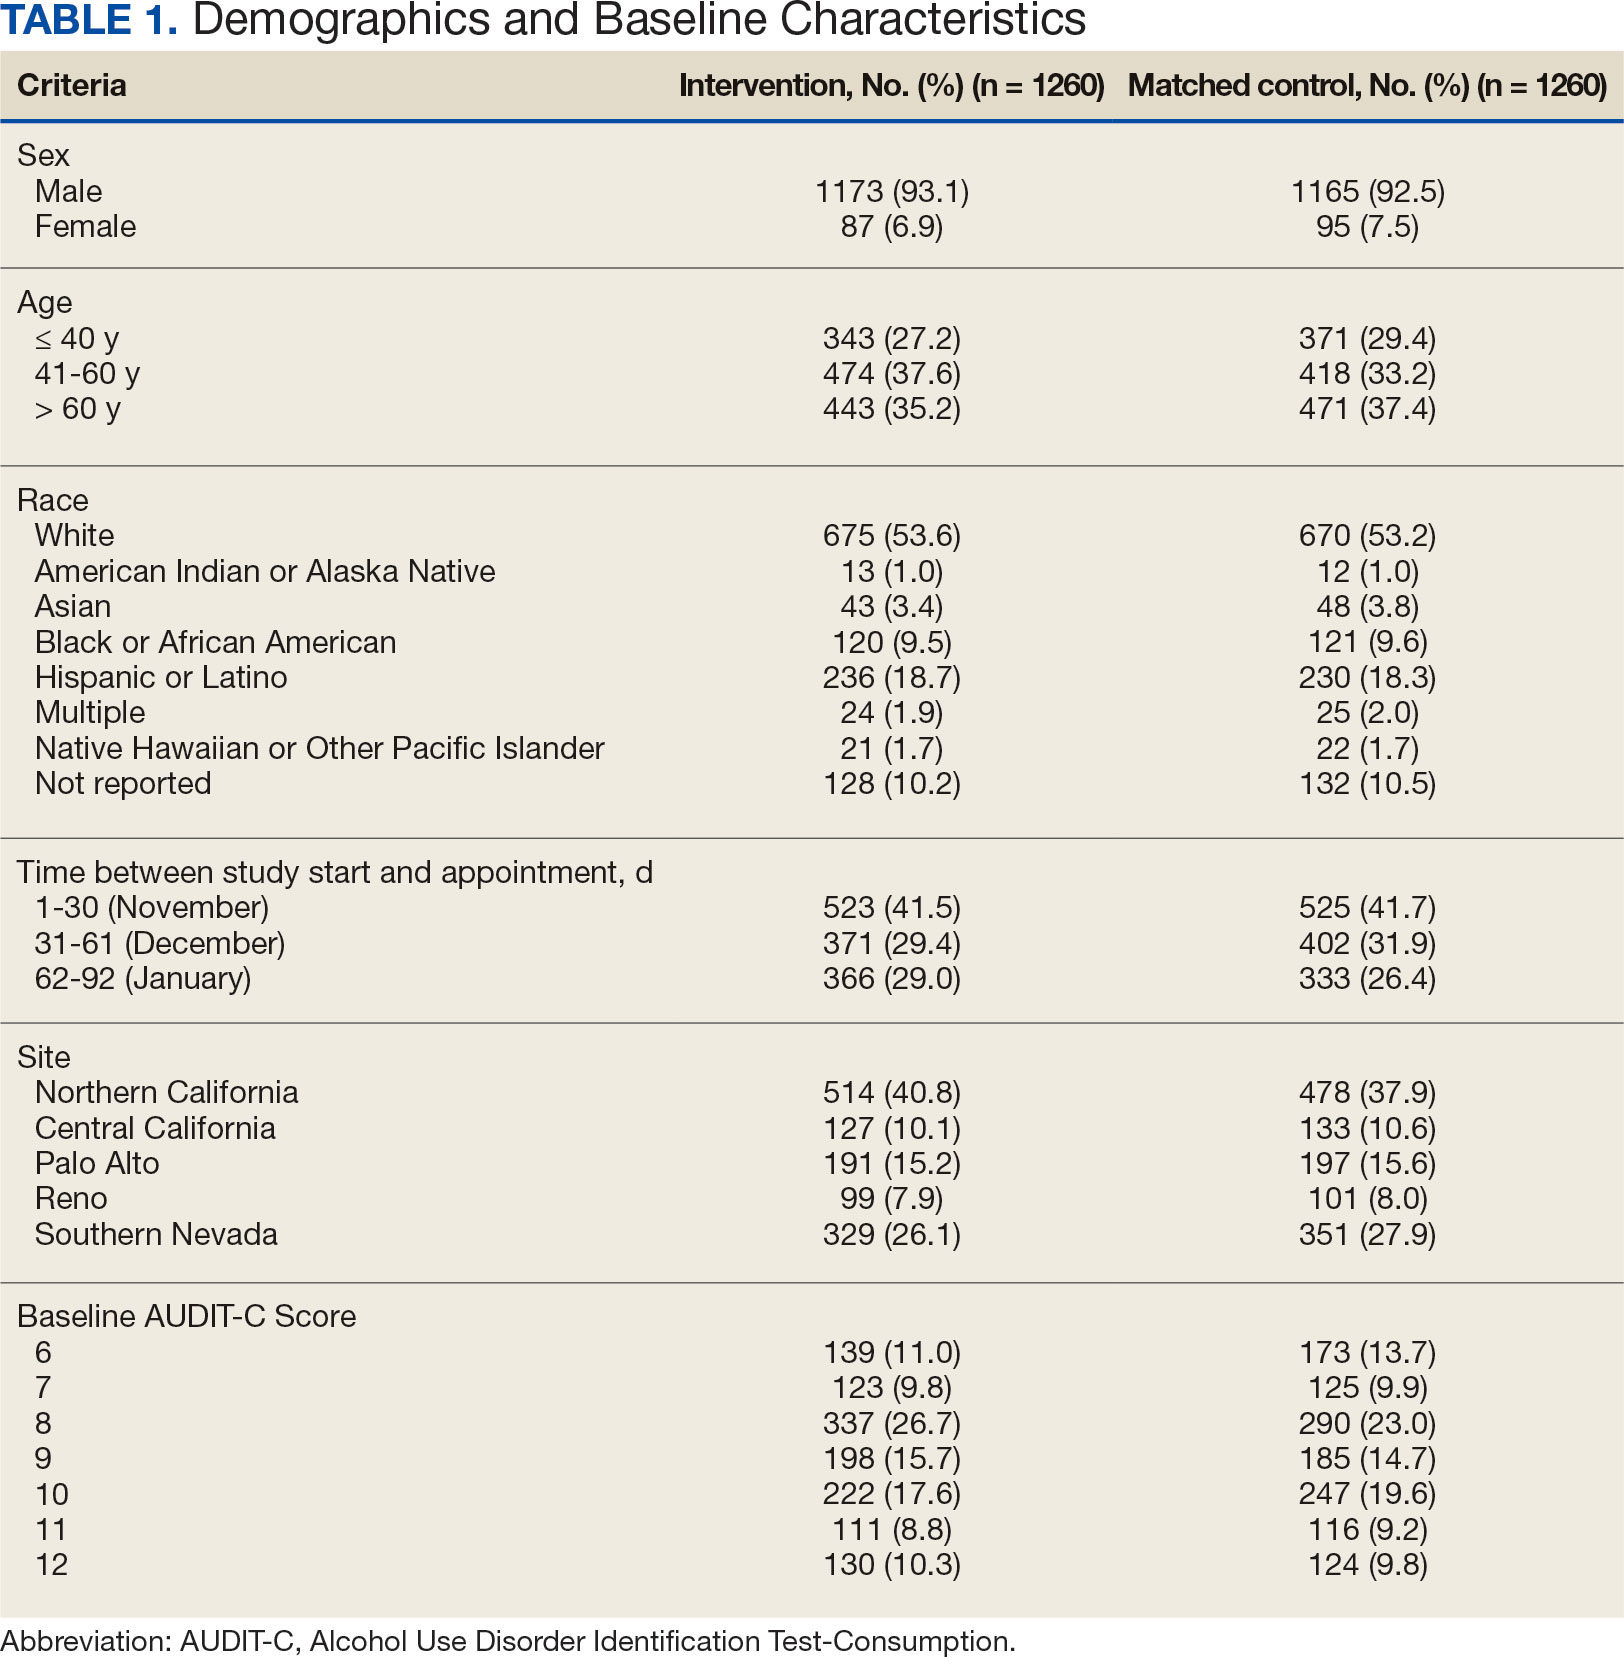
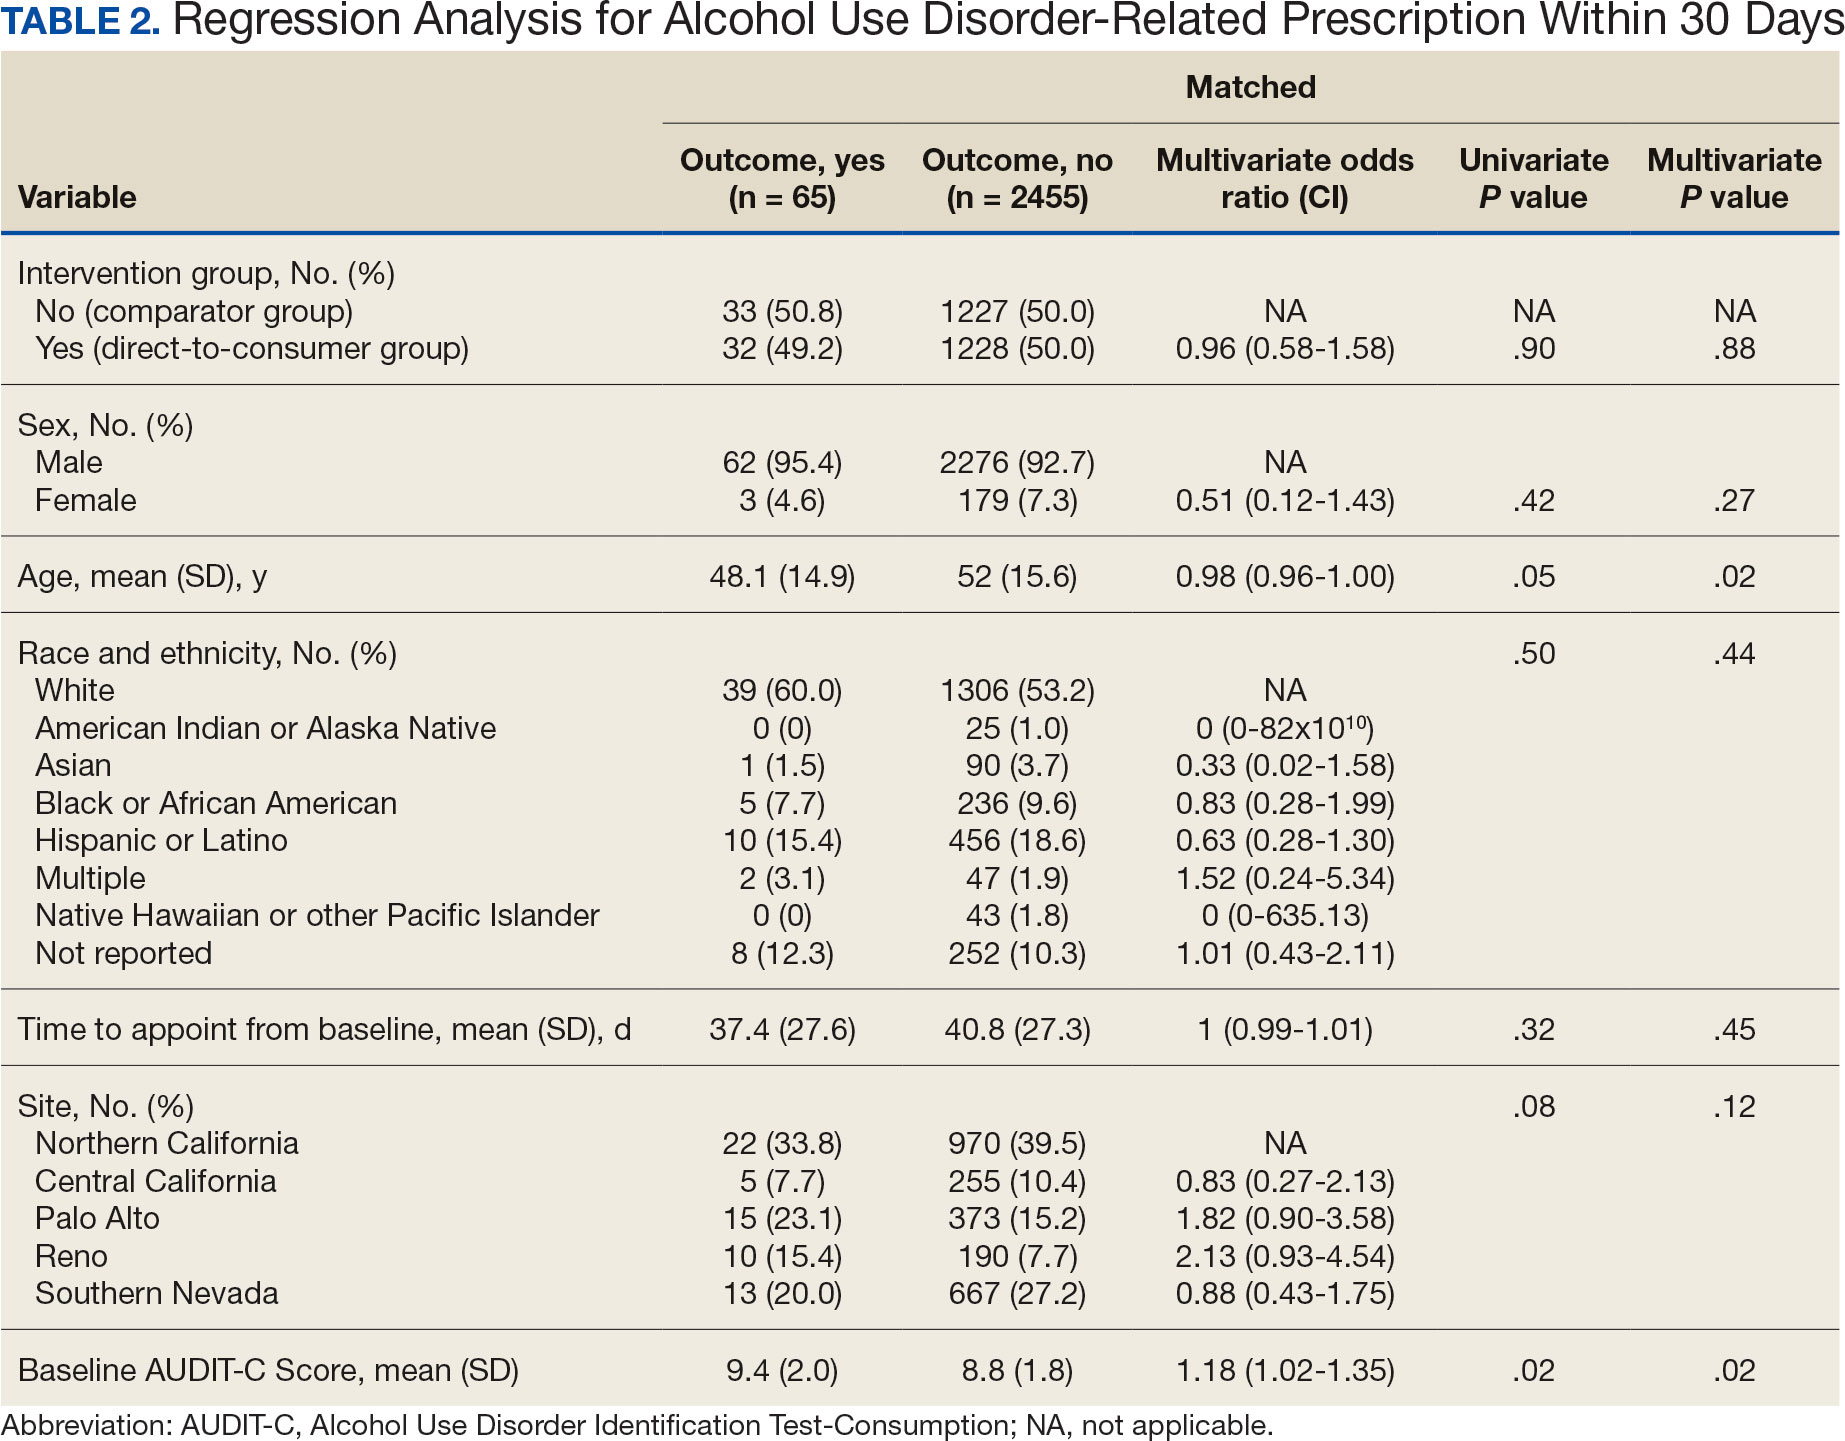
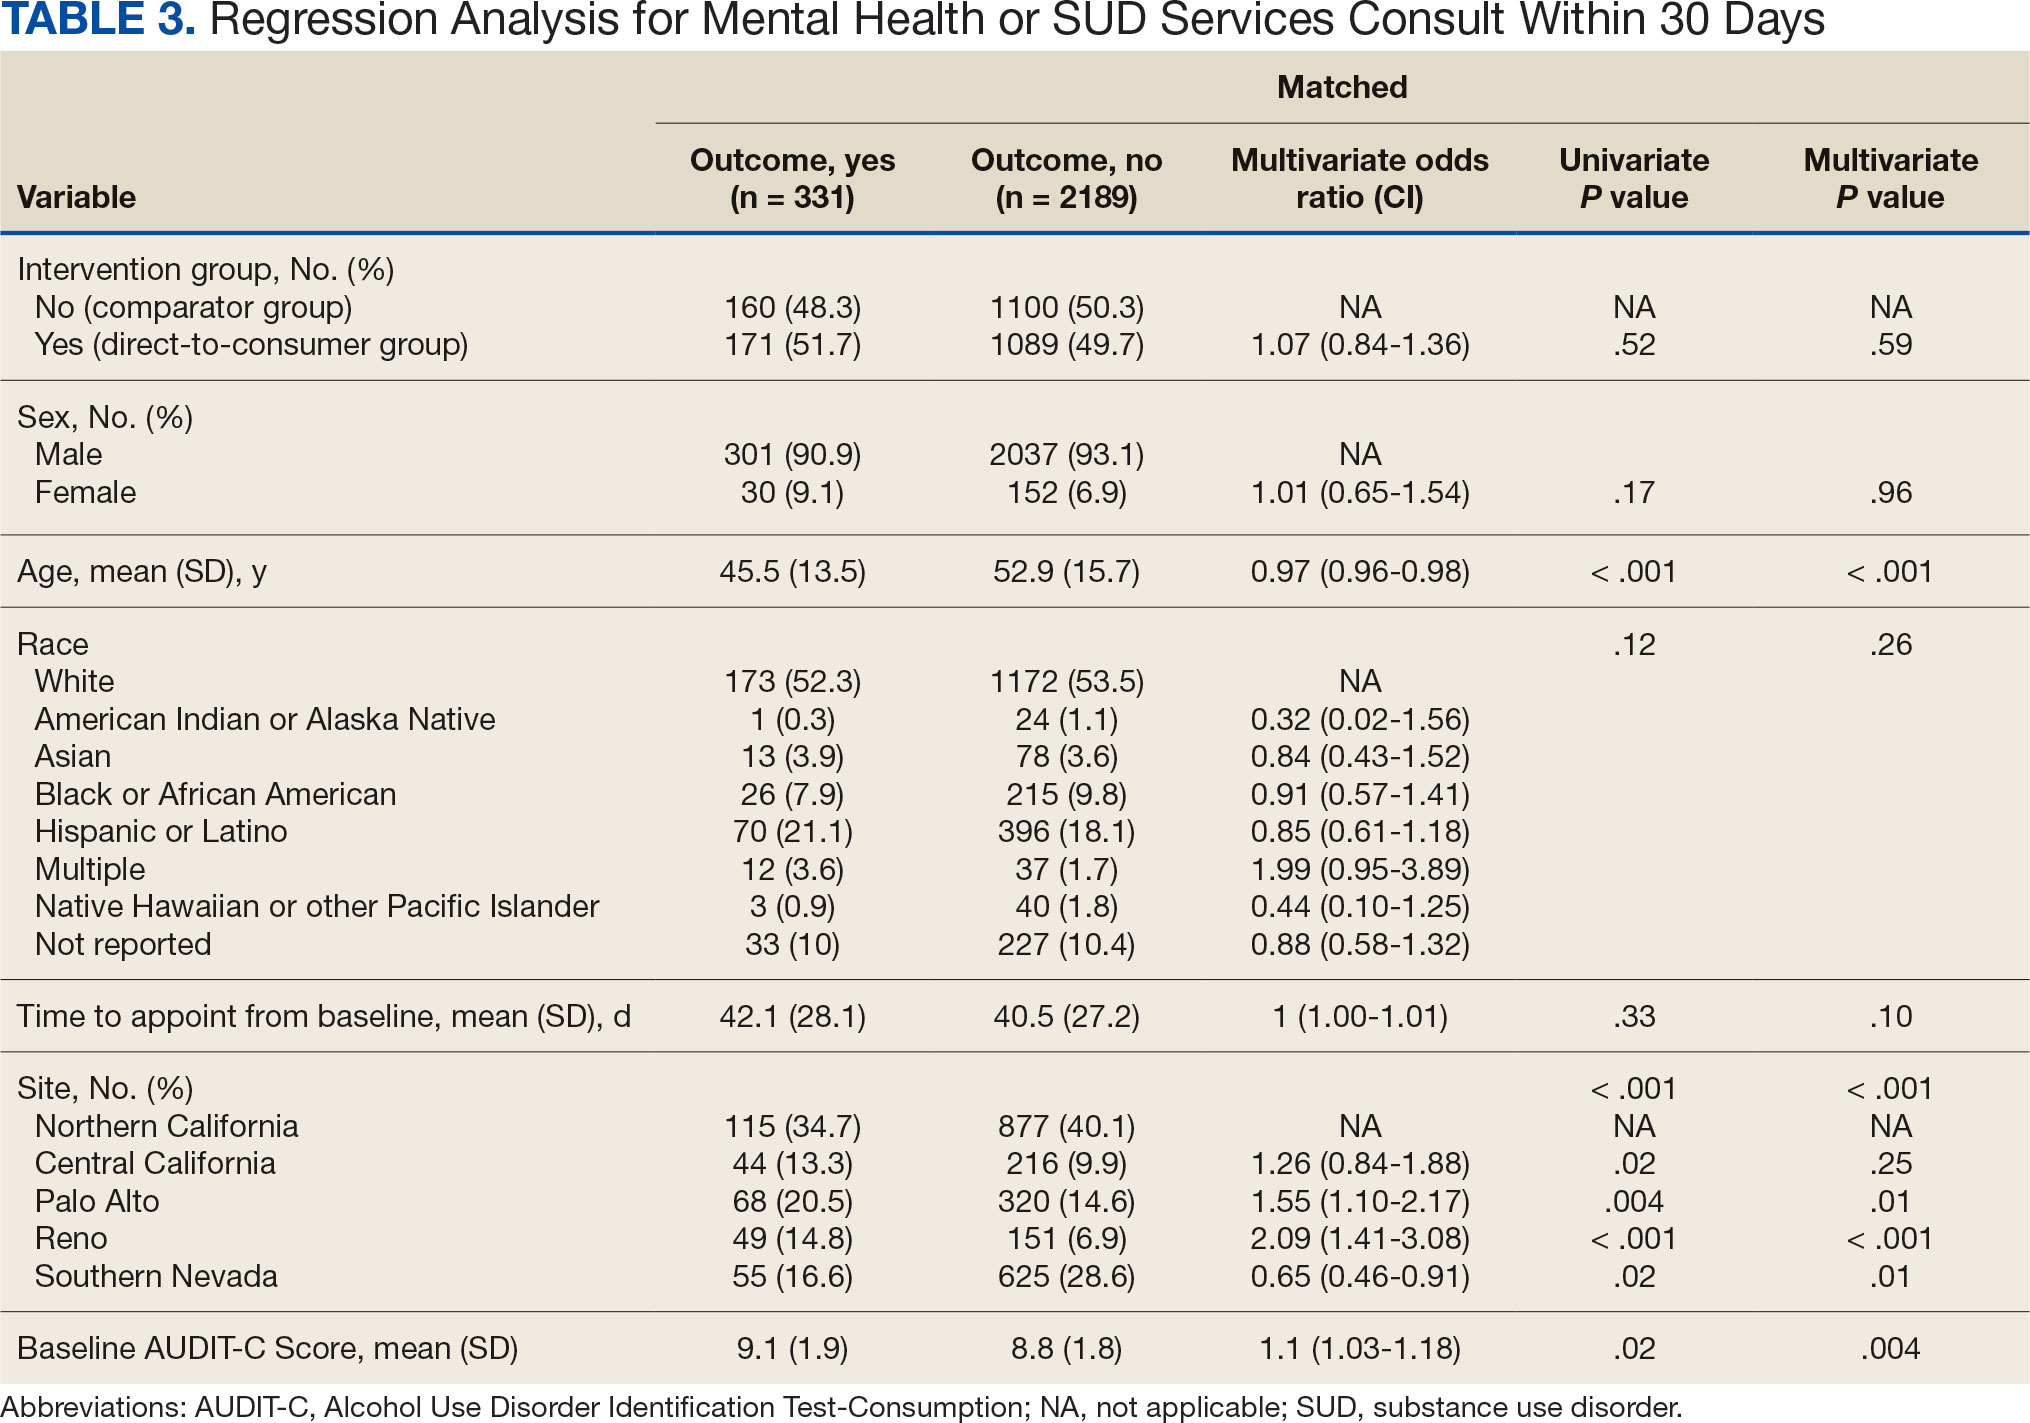
Two of 7 VISN 21 sites did not participate, and 3 had restrictions on participation. DTC education was mailed about 2 weeks prior to scheduled visit for 1260 veterans; 53.6% identified as White, 37.6% were aged 41 to 60 years, and 79.2% had an AUDIT-C ≥ 8 (Table 1). Of those mailed education, there were 173 no-show appointments (13.7%). Thirty-two veterans (2.5%) in the DTC group and 33 veterans (2.6%) in the comparator group received an AUD-related pharmacotherapy prescription (P = .88) (Table 2). One hundred seventy-one veterans (13.6%) in the DTC group and 160 veterans (12.7%) in the comparator group had a consult placed for mental health or SUD services within 30 days of their appointment (P = .59) (Table 3).
DISCUSSION
This project did not yield statistically significant differences in either the primary or secondary outcomes within the 30-day follow-up window and found limited impact from the DTC educational outreach to veterans. The percentage of veterans that received AUD-related pharmacotherapy or consultations for mental health or SUD services was similarly low in the DTC and comparator groups. These findings suggest that although DTC education may raise awareness, it may not be sufficient on its own to drive changes in prescribing behavior or referral patterns without system-level support.
Addiction is a complex disease faced with stigma and requiring readiness by both the HCP and patient to move forward in support and treatment. The consequences of stigma can be severe: the more stigma perceived by a person with AUD, the less likely they are to seek treatment.20 Stigma may exist even within HCPs and may lead to compromised care including shortened visits, less engagement, and less empathy.19 Cultural attitude towards alcohol use and intoxication can also be influenced through a wide range of sources including social media, movies, music, and television. Studies have shown targeted alcohol marketing may result in the development of positive beliefs about drinking and expand environments where alcohol use is socially acceptable and encouraged.21 These factors can impact drinking behavior, including the onset of drinking, binge drinking, and increased alcohol consumption.22
Three VISN 21 sites in this study had restrictions on or excluded primary care from participation. Leadership at some of these facilities were concerned that primary care teams did not have the bandwidth to take on additional items and/or there was variable primary care readiness for initiating AUD pharmacotherapy. Further attempts should be made to integrate primary care into the process of initiating AUD treatment as significant research suggests that integrated care models for AUD may be associated with improved process and outcome measures of care.23
There are several differences between this quality improvement project and prior research investigating the impact of DTC education for other conditions, such as the EMPOWER randomized controlled trial and VISN 22 project, which both demonstrated effectiveness of DTC education for reducing benzodiazepine use in geriatric veterans. 15,16 These studies focused on reducing or stopping pharmacotherapy use, whereas this project sought to promote the initiation of AUD pharmacotherapy. These studies evaluated outcomes at least 6 months postindex date, whereas this project evaluated outcomes within 30 days postappointment. Furthermore, the educational content varied significantly. Other projects provided patients with information focused on specific medications and interventions, such as benzodiazepine tapering, while this project mailed general information on heavy drinking, its risks, and strategies for cutting back, without mentioning pharmacotherapy. The DTC material used in this project was chosen because it was a preapproved national VA ADS resource, which expedited the project timeline by avoiding the need for additional approvals at each participating site. These differences may impact the observed effectiveness of DTC education in this project, especially regarding the primary outcome.
Strengths and Limitations
This quality improvement project sent a large sample of veterans DTC education in a clinical setting across multiple sites. Additionally, PS matching methods were used to balance covariates between the comparator and DTC education group, thereby simulating a randomized controlled trial and reducing selection bias. The project brought attention to the VISN 21 AUD treatment rates, stimulated conversation across sites about available treatments and resources for AUD, and sparked collaboration between academic detailing, mental health, and primary care services. The time frame for visits was selected during the winter; the National Institute on Alcohol Abuse and Alcoholism notes this is a time when people may be more likely to engage in excessive alcohol consumption than at other times of the year.24
The 30-day time frame for outcomes may have been too short to observe changes in prescribing or referral patterns. Additionally, the comparator group was comprised of veterans seen from October 1, 2022, to January 31, 2023, where seasonal timing may have influenced alcohol consumption behaviors and skewed the results. There were also no-show appointments in the DTC education group (13.7%), though it is likely some patients rescheduled and still received AUD pharmacotherapy within 30 days of the original appointment. Finally, it was not possible to confirm whether a patient opened and read the education that was mailed to them. This may be another reason to explore electronic distribution of DTC education. This all may have contributed to the lack of statistically significant differences in both the primary and secondary outcomes.
There was a high level of variability between facility participation in the project. Two of 7 sites did not participate, and 3 sites restricted primary care engagement. This represents a significant limitation, particularly for the secondary outcome of placing consultations for MH or SUD services. Facilities that only included mental health or SUD HCPs may have resulted in lower consultation rates due to their inherent specialization, reducing the likelihood of self-referrals.
The project may overestimate prescribed AUD pharmacotherapy in the primary outcome due to potential misclassification of medications. While the project adhered to the national VA ADS AUD dashboard’s definition of AUD pharmacotherapy, including acamprosate, disulfiram, naltrexone, topiramate, and gabapentin, some of these medications have multiple indications. For example, gabapentin is commonly prescribed for peripheral neuropathy, and topiramate is used to treat migraines and seizures. The multipurpose use adds uncertainty about whether they were prescribed specifically for AUD treatment, especially in cases where the HCP is responsible for treating a broad range of disease states, as in primary care.
CONCLUSIONS
Results of this quality improvement project did not show a statistically significant difference between patients sent DTC education and the comparator group for the initiation of AUD pharmacotherapy or placement of a consult to mental health or SUD services within 30 days of their scheduled visit. Future studies may seek to implement stricter criteria to confirm the intended use of topiramate and gabapentin, such as looking for keywords in the prescription instructions for use, performing chart reviews, and/or only including these medications if prescribed by a mental health or SUD HCP. Alternatively, future studies may consider limiting the analysis to only FDA-approved AUD medications: acamprosate, disulfiram, and naltrexone. It is vital to continue to enhance primary care HCP readiness to treat AUD, given the existing relationships and trust they often have with patients. Electronic methods for distributing DTC education could also be advantageous, as these methods may have the ability to track whether a message has been opened and read. Despite a lack of statistical significance, this project sparked crucial conversations and collaboration around AUD, available treatments, and addressing potential barriers to connecting patients to care within VISN 21.
- Centers for Disease Control and Prevention. Facts about U.S. deaths from excessive alcohol use. August 6, 2024. Accessed February 5, 2025. https://www.cdc.gov/alcohol/facts-stats/
- State Health Access Data Assistance Center. Escalating alcohol-involved death rates: trends and variation across the nation and in the states from 2006 to 2019. April 19, 2021. Accessed February 5, 2025. https://www.shadac.org/escalating-alcohol-involved-death-rates-trends-and-variation-across-nation-and-states-2006-2019
- National Institute on Alcohol Abuse and Alcoholism. Alcohol- related emergencies and deaths in the United States. Updated November 2024. Accessed February 5, 2025. https://www.niaaa.nih.gov/alcohols-effects-health/alcohol-topics/alcohol-facts-and-statistics/alcohol-related-emergencies-and-deaths-united-states
- Esser MB, Sherk A, Liu Y, Naimi TS. Deaths from excessive alcohol use - United States, 2016- 2021. MMWR Morb Mortal Wkly Rep. 2024;73(8):154-161. doi:10.15585/mmwr.mm7308a1
- Canver BR, Newman RK, Gomez AE. Alcohol Withdrawal Syndrome. In: StatPearls. StatPearls Publishing; 2024.
- National Institute on Alcohol Abuse and Alcoholism. Alcohol treatment in the United States. Updated January 2025. Accessed February 5, 2025. https://www.niaaa.nih.gov/alcohols-effects-health/alcohol-topics/alcohol-facts-and-statistics/alcohol-treatment-united-states
- National Institute on Alcohol Abuse and Alcoholism. Alcohol use disorder (AUD) in the United States: age groups and demographic characteristics. Updated September 2024. Accessed February 5, 2025. https://www.niaaa.nih.gov/alcohols-effects-health/alcohol-topics/alcohol-facts-and-statistics/alcohol-use-disorder-aud-united-states-age-groups-and-demographic-characteristics
- Reus VI, Fochtmann LJ, Bukstein O, et al. The American Psychiatric Association practice guideline for the pharmacological treatment of patients with alcohol use disorder. Am J Psychiatry. 2018;175(1):86-90. doi:10.1176/appi.ajp.2017.1750101
- Blodgett JC, Del Re AC, Maisel NC, Finney JW. A meta-analysis of topiramate’s effects for individuals with alcohol use disorders. Alcohol Clin Exp Res. 2014;38(6):1481-1488. doi:10.1111/acer.12411
- Maisel NC, Blodgett JC, Wilbourne PL, Humphreys K, Finney JW. Meta-analysis of naltrexone and acamprosate for treating alcohol use disorders: when are these medications most helpful? Addiction. 2013;108(2):275-293. doi:10.1111/j.1360-0443.2012.04054.x
- Jonas DE, Amick HR, Feltner C, et al. Pharmacotherapy for adults with alcohol use disorders in outpatient settings: a systematic review and meta-analysis. JAMA. 2014;311(18):1889-1900. doi:10.1001/jama.2014.3628
- US Department of Veterans Affairs, Department of Defense. VA/DoD clinical practice guideline for the management of substance use disorders. August 2021. Accessed February 5, 2025. https://www.healthquality.va.gov/guidelines/MH/sud/VADODSUDCPG.pdf
- Ranney RM, Bernhard PA, Vogt D, et al. Alcohol use and treatment utilization in a national sample of veterans and nonveterans. J Subst Use Addict Treat. 2023;146:208964. doi:10.1016/j.josat.2023.208964
- US Department of Veterans Affairs, Pharmacy Benefit Management Service, Academic Detailing Service. AUD Trend Report. https://vaww.pbi.cdw.va.gov/PBIRS/Pages/ReportViewer.aspx?/GPE/PBM_AD/SSRS/AUD/AUD_TrendReport
- Mendes MA, Smith JP, Marin JK, et al. Reducing benzodiazepine prescribing in older veterans: a direct-to-consumer educational brochure. Fed Pract. 2018;35(9):36-43.
- Tannenbaum C, Martin P, Tamblyn R, Benedetti A, Ahmed S. Reduction of inappropriate benzodiazepine prescriptions among older adults through direct patient education: the EMPOWER cluster randomized trial. JAMA Intern Med. 2014;174(6):890-898. doi:10.1001/jamainternmed.2014.949
- Maloney R, Funmilayo M. Acting on the AUDIT-C: implementation of direct-to-consumer education on unhealth alcohol use. Presented on March 31, 2023; Central Virginia Veterans Affairs Health Care System, Richmond, Virginia.
- US Department of Veterans Affairs, Pharmacy Benefit Management Service. Alcohol use disorder (AUD) – leading the charge in the treatment of AUD: a VA clinician’s guide. February 2022. Accessed February 5, 2025. https://www.pbm.va.gov/PBM/AcademicDetailingService/Documents/508/10-1530_AUD_ClinicianGuide_508Conformant.pdf
- Austin PC. An introduction to propensity score methods for reducing the effects of confounding in observational studies. Multivariate Behav Res. 2011;46(3):399-424. doi:10.1080/00273171.2011.568786
- National Institute on Alcohol Abuse and Alcoholism. Stigma: overcoming a pervasive barrier to optimal care. Updated January 6, 2025. Accessed February 5, 2025. https://www.niaaa.nih.gov/health-professionals-communities/core-resource-on-alcohol/stigma-overcoming-pervasive-barrier-optimal-care
- Sudhinaraset M, Wigglesworth C, Takeuchi DT. Social and cultural contexts of alcohol use: influences in a socialecological framework. Alcohol Res. 2016;38(1):35-45.
- Tanski SE, McClure AC, Li Z, et al. Cued recall of alcohol advertising on television and underage drinking behavior. JAMA Pediatr. 2015;169(3):264-271. doi:10.1001/jamapediatrics.2014.3345
- Hyland CJ, McDowell MJ, Bain PA, Huskamp HA, Busch AB. Integration of pharmacotherapy for alcohol use disorder treatment in primary care settings: a scoping review. J Subst Abuse Treat. 2023;144:108919. doi:10.1016/j.jsat.2022.108919
- National Institute on Alcohol Abuse and Alcoholism. The truth about holiday spirits. Updated November 2023. Accessed February 5, 2025. ,a href="https://www.niaaa.nih.gov/publications/brochures-and-fact-sheets/truth-about-holiday-spirits">https://www.niaaa.nih.gov/publications/brochures-and-fact-sheets/truth-about-holiday-spirits
Excessive alcohol use is one of the leading preventable causes of death in the United States, responsible for about 178,000 deaths annually and an average of 488 daily deaths in 2020 and 2021.1Alcohol-related deaths increased by 49% between 2006 and 2019.2 This trend continued during the COVID-19 pandemic, with death certificates that listed alcohol increasing by > 25% from 2019 to 2020, and another 10% in 2021.3 This increase of alcohol-related deaths includes those as a direct result of chronic alcohol use, such as alcoholic cardiomyopathy, alcoholic hepatitis and cirrhosis, and alcohol-induced pancreatitis, as well as a result of acute use such as alcohol poisoning, suicide by exposure to alcohol, and alcohol-impaired driving fatalities.4
Excessive alcohol consumption poses other serious risks, including cases when intake is abruptly reduced without proper management. Alcohol withdrawal syndrome (AWS) can vary in severity, with potentially life-threatening complications such as hallucinations, seizures, and delirium tremens.5
These risks highlight the importance of professional intervention and support, not only to mitigate risks associated with AWS, but provide a pathway towards recovery from alcohol use disorder (AUD).
According to the 2022 National Survey on Drug Use and Health, 28.8 million US adults had AUD in the prior year, yet only 7.6% of these individuals received treatment and an even smaller group (2.2%) received medication-assisted treatment for alcohol.6,7 This is despite American Psychiatric Association guidelines for the pharmacological treatment of patients with AUD, including the use of naltrexone, acamprosate, disulfiram, topiramate, or gabapentin, depending on therapy goals, past medication trials, medication contraindications, and patient preference.8 Several of these medications are approved by the US Food and Drug Administration (FDA) for the treatment of AUD and have support for effectiveness from randomized controlled trials and meta-analyses.9-11
Clinical practice guidelines for the management of substance use disorders (SUDs) from the US Department of Veterans Affairs (VA) and US Department of Defense have strong recommendations for naltrexone and topiramate as first-line pharmacotherapies for moderate to severe AUD. Acamprosate and disulfiram are weak recommendations as alternative options. Gabapentin is a weak recommendation for cases where first-line treatments are contraindicated or ineffective. The guidelines emphasize the importance of a comprehensive approach to AUD treatment, including psychosocial interventions in addition to pharmacotherapy.12
A 2023 national survey found veterans reported higher alcohol consumption than nonveterans.13 At the end of fiscal year 2023, > 4.4 million veterans—6% of Veterans Health Administration patients—had been diagnosed with AUD.14 However, > 87% of these patients nationally, and 88% of Veterans Integrated Service Network (VISN) 21 patients, were not receiving naltrexone, acamprosate, disulfiram, or topiramate as part of their treatment. The VA Academic Detailing Service (ADS) now includes AUD pharmacotherapy as a campaign focus, highlighting its importance. The ADS is a pharmacy educational outreach program that uses unbiased clinical guidelines to promote aligning prescribing behavior with best practices. Academic detailing methods include speaking with health care practitioners (HCPs), and direct-to-consumer (DTC) patient education.
ADS campaigns include DTC educational handouts. Past ADS projects and research using DTC have demonstrated a significant improvement in outcomes and positively influencing patients’ pharmacotherapy treatment. 15,16 A VA quality improvement project found a positive correlation between the initiation of AUD pharmacotherapy and engagement with mental health care following the distribution of AUD DTC patient education. 17 This project aimed to apply the same principles of prior research to explore the use of DTC across multiple facilities within VISN 21 to increase AUD pharmacotherapy. VISN 21 includes VA facilities and clinics across the Pacific Islands, Nevada, and California and serves about 350,000 veterans.
METHODS
A prospective cohort of VISN 21 veterans with or at high risk for AUD was identified using the VA ADS AUD Dashboard. The cohort included those not on acamprosate, disulfiram, naltrexone, topiramate, or gabapentin for treatment of AUD and had an elevated Alcohol Use Disorder Identification Test-Consumption (AUDIT-C) score of ≥ 6 (high risk) with an AUD diagnosis or ≥ 8 (severe risk) without a diagnosis. The AUDIT-C scores used in the dashboard are supported by the VA AUD clinician guide as the minimum scores when AUD pharmacotherapy should be offered to patients.18 Prescriptions filled outside the VA were not included in this dashboard.
Data and patient information were collected using the VA Corporate Data Warehouse. To be eligible, veterans needed a valid mailing address within the VISN 21 region and a primary care, mental health, or SUD clinician prescriber visit scheduled between October 1, 2023, and January 31, 2024. Veterans were excluded if they were in hospice, had a 1-year mortality risk score > 50% based on their Care Assessment Need (CAN) score, or facility leadership opted out of project involvement. Patients with both severe renal and hepatic impairments were excluded because they were ineligible for AUD pharmacotherapy. However, veterans with either renal or hepatic impairment (but not both) were included, as they could be potential candidates for ≥ 1 AUD pharmacotherapy option.
Initial correspondence with facilities was initiated through local academic detailers. A local champion was identified for the 1 facility without an academic detailer. Facilities could opt in or out of the project. Approval was provided by the local pharmacy and therapeutics committee, pharmacy, primary care, or psychiatry leadership. Approval process and clinician involvement varied by site.
Education
The selected AUD patient education was designed and approved by the national VA ADS (eappendix). The DTC patient education provided general knowledge about alcohol, including what constitutes a standard amount of alcohol, what is considered heavy drinking, risks of heavy drinking, creating a plan with a clinician to reduce and manage withdrawal symptoms, and additional resources. The DTC was accompanied by a cover letter that included a local facility contact number.
A centralized mailing facility was used for all materials. VA Northern California Health Care System provided the funding to cover the cost of postage. The list of veterans to be contacted was updated on a rolling basis and DTC education was mailed 2 weeks prior to their scheduled prescriber visit.
The eligible cohort of 1260 veterans received DTC education. A comparator group of 2048 veterans that did not receive DTC education was obtained retrospectively by using the same inclusion and exclusion criteria with a scheduled primary care, mental health, or SUD HCP visit from October 1, 2022, to January 31, 2023. The outcomes assessed were within 30 days of the scheduled visit, with the primary outcome as the initiation of AUD-related pharmacotherapy and the secondary outcome as the placement of a consultation for mental health or SUD services. Any consultations sent to Behavioral Health, Addiction, Mental Health, Psychiatric, and SUD services following the HCP visit, within the specified time frame, were used for the secondary outcome.
Matching and Analysis
A 1-to-1 nearest neighbor propensity score (PS) matching without replacement was used to pair the 1260 veterans from the intervention group with similarly scored comparator group veterans for a PS-matched final dataset of 2520 veterans. The PS model was a multivariate logistic regression with the outcome being exposure and comparator group status. Baseline characteristics used in the PS model were age, birth sex, race, facility of care, baseline AUDIT-C score, and days between project start and scheduled appointment. Covariate imbalance for the PS-matched sample was assessed to ensure the standardized mean difference for all covariates fell under a 0.1 threshold (Figure).19
A frequency table was provided to compare the discrete distributions of the baseline characteristics in the intervention and comparator groups. Logistic regression analysis was performed to evaluate the association between DTC education exposure and pharmacotherapy initiation, while controlling for potential confounders. Univariate and multivariate P value results for each variable included in the model were reported along with the multivariate odds ratios (ORs) and their associated 95% CIs. Logistic regression analyses were run for both outcomes. Each model included the exposure and comparator group status as well as the baseline characteristics included in the PS model. Statistical significance was set at P < .05. All statistical analyses were performed with R version 4.2.1.
RESULTS
Two of 7 VISN 21 sites did not participate, and 3 had restrictions on participation. DTC education was mailed about 2 weeks prior to scheduled visit for 1260 veterans; 53.6% identified as White, 37.6% were aged 41 to 60 years, and 79.2% had an AUDIT-C ≥ 8 (Table 1). Of those mailed education, there were 173 no-show appointments (13.7%). Thirty-two veterans (2.5%) in the DTC group and 33 veterans (2.6%) in the comparator group received an AUD-related pharmacotherapy prescription (P = .88) (Table 2). One hundred seventy-one veterans (13.6%) in the DTC group and 160 veterans (12.7%) in the comparator group had a consult placed for mental health or SUD services within 30 days of their appointment (P = .59) (Table 3).
DISCUSSION
This project did not yield statistically significant differences in either the primary or secondary outcomes within the 30-day follow-up window and found limited impact from the DTC educational outreach to veterans. The percentage of veterans that received AUD-related pharmacotherapy or consultations for mental health or SUD services was similarly low in the DTC and comparator groups. These findings suggest that although DTC education may raise awareness, it may not be sufficient on its own to drive changes in prescribing behavior or referral patterns without system-level support.
Addiction is a complex disease faced with stigma and requiring readiness by both the HCP and patient to move forward in support and treatment. The consequences of stigma can be severe: the more stigma perceived by a person with AUD, the less likely they are to seek treatment.20 Stigma may exist even within HCPs and may lead to compromised care including shortened visits, less engagement, and less empathy.19 Cultural attitude towards alcohol use and intoxication can also be influenced through a wide range of sources including social media, movies, music, and television. Studies have shown targeted alcohol marketing may result in the development of positive beliefs about drinking and expand environments where alcohol use is socially acceptable and encouraged.21 These factors can impact drinking behavior, including the onset of drinking, binge drinking, and increased alcohol consumption.22
Three VISN 21 sites in this study had restrictions on or excluded primary care from participation. Leadership at some of these facilities were concerned that primary care teams did not have the bandwidth to take on additional items and/or there was variable primary care readiness for initiating AUD pharmacotherapy. Further attempts should be made to integrate primary care into the process of initiating AUD treatment as significant research suggests that integrated care models for AUD may be associated with improved process and outcome measures of care.23
There are several differences between this quality improvement project and prior research investigating the impact of DTC education for other conditions, such as the EMPOWER randomized controlled trial and VISN 22 project, which both demonstrated effectiveness of DTC education for reducing benzodiazepine use in geriatric veterans. 15,16 These studies focused on reducing or stopping pharmacotherapy use, whereas this project sought to promote the initiation of AUD pharmacotherapy. These studies evaluated outcomes at least 6 months postindex date, whereas this project evaluated outcomes within 30 days postappointment. Furthermore, the educational content varied significantly. Other projects provided patients with information focused on specific medications and interventions, such as benzodiazepine tapering, while this project mailed general information on heavy drinking, its risks, and strategies for cutting back, without mentioning pharmacotherapy. The DTC material used in this project was chosen because it was a preapproved national VA ADS resource, which expedited the project timeline by avoiding the need for additional approvals at each participating site. These differences may impact the observed effectiveness of DTC education in this project, especially regarding the primary outcome.
Strengths and Limitations
This quality improvement project sent a large sample of veterans DTC education in a clinical setting across multiple sites. Additionally, PS matching methods were used to balance covariates between the comparator and DTC education group, thereby simulating a randomized controlled trial and reducing selection bias. The project brought attention to the VISN 21 AUD treatment rates, stimulated conversation across sites about available treatments and resources for AUD, and sparked collaboration between academic detailing, mental health, and primary care services. The time frame for visits was selected during the winter; the National Institute on Alcohol Abuse and Alcoholism notes this is a time when people may be more likely to engage in excessive alcohol consumption than at other times of the year.24
The 30-day time frame for outcomes may have been too short to observe changes in prescribing or referral patterns. Additionally, the comparator group was comprised of veterans seen from October 1, 2022, to January 31, 2023, where seasonal timing may have influenced alcohol consumption behaviors and skewed the results. There were also no-show appointments in the DTC education group (13.7%), though it is likely some patients rescheduled and still received AUD pharmacotherapy within 30 days of the original appointment. Finally, it was not possible to confirm whether a patient opened and read the education that was mailed to them. This may be another reason to explore electronic distribution of DTC education. This all may have contributed to the lack of statistically significant differences in both the primary and secondary outcomes.
There was a high level of variability between facility participation in the project. Two of 7 sites did not participate, and 3 sites restricted primary care engagement. This represents a significant limitation, particularly for the secondary outcome of placing consultations for MH or SUD services. Facilities that only included mental health or SUD HCPs may have resulted in lower consultation rates due to their inherent specialization, reducing the likelihood of self-referrals.
The project may overestimate prescribed AUD pharmacotherapy in the primary outcome due to potential misclassification of medications. While the project adhered to the national VA ADS AUD dashboard’s definition of AUD pharmacotherapy, including acamprosate, disulfiram, naltrexone, topiramate, and gabapentin, some of these medications have multiple indications. For example, gabapentin is commonly prescribed for peripheral neuropathy, and topiramate is used to treat migraines and seizures. The multipurpose use adds uncertainty about whether they were prescribed specifically for AUD treatment, especially in cases where the HCP is responsible for treating a broad range of disease states, as in primary care.
CONCLUSIONS
Results of this quality improvement project did not show a statistically significant difference between patients sent DTC education and the comparator group for the initiation of AUD pharmacotherapy or placement of a consult to mental health or SUD services within 30 days of their scheduled visit. Future studies may seek to implement stricter criteria to confirm the intended use of topiramate and gabapentin, such as looking for keywords in the prescription instructions for use, performing chart reviews, and/or only including these medications if prescribed by a mental health or SUD HCP. Alternatively, future studies may consider limiting the analysis to only FDA-approved AUD medications: acamprosate, disulfiram, and naltrexone. It is vital to continue to enhance primary care HCP readiness to treat AUD, given the existing relationships and trust they often have with patients. Electronic methods for distributing DTC education could also be advantageous, as these methods may have the ability to track whether a message has been opened and read. Despite a lack of statistical significance, this project sparked crucial conversations and collaboration around AUD, available treatments, and addressing potential barriers to connecting patients to care within VISN 21.
- Centers for Disease Control and Prevention. Facts about U.S. deaths from excessive alcohol use. August 6, 2024. Accessed February 5, 2025. https://www.cdc.gov/alcohol/facts-stats/
- State Health Access Data Assistance Center. Escalating alcohol-involved death rates: trends and variation across the nation and in the states from 2006 to 2019. April 19, 2021. Accessed February 5, 2025. https://www.shadac.org/escalating-alcohol-involved-death-rates-trends-and-variation-across-nation-and-states-2006-2019
- National Institute on Alcohol Abuse and Alcoholism. Alcohol- related emergencies and deaths in the United States. Updated November 2024. Accessed February 5, 2025. https://www.niaaa.nih.gov/alcohols-effects-health/alcohol-topics/alcohol-facts-and-statistics/alcohol-related-emergencies-and-deaths-united-states
- Esser MB, Sherk A, Liu Y, Naimi TS. Deaths from excessive alcohol use - United States, 2016- 2021. MMWR Morb Mortal Wkly Rep. 2024;73(8):154-161. doi:10.15585/mmwr.mm7308a1
- Canver BR, Newman RK, Gomez AE. Alcohol Withdrawal Syndrome. In: StatPearls. StatPearls Publishing; 2024.
- National Institute on Alcohol Abuse and Alcoholism. Alcohol treatment in the United States. Updated January 2025. Accessed February 5, 2025. https://www.niaaa.nih.gov/alcohols-effects-health/alcohol-topics/alcohol-facts-and-statistics/alcohol-treatment-united-states
- National Institute on Alcohol Abuse and Alcoholism. Alcohol use disorder (AUD) in the United States: age groups and demographic characteristics. Updated September 2024. Accessed February 5, 2025. https://www.niaaa.nih.gov/alcohols-effects-health/alcohol-topics/alcohol-facts-and-statistics/alcohol-use-disorder-aud-united-states-age-groups-and-demographic-characteristics
- Reus VI, Fochtmann LJ, Bukstein O, et al. The American Psychiatric Association practice guideline for the pharmacological treatment of patients with alcohol use disorder. Am J Psychiatry. 2018;175(1):86-90. doi:10.1176/appi.ajp.2017.1750101
- Blodgett JC, Del Re AC, Maisel NC, Finney JW. A meta-analysis of topiramate’s effects for individuals with alcohol use disorders. Alcohol Clin Exp Res. 2014;38(6):1481-1488. doi:10.1111/acer.12411
- Maisel NC, Blodgett JC, Wilbourne PL, Humphreys K, Finney JW. Meta-analysis of naltrexone and acamprosate for treating alcohol use disorders: when are these medications most helpful? Addiction. 2013;108(2):275-293. doi:10.1111/j.1360-0443.2012.04054.x
- Jonas DE, Amick HR, Feltner C, et al. Pharmacotherapy for adults with alcohol use disorders in outpatient settings: a systematic review and meta-analysis. JAMA. 2014;311(18):1889-1900. doi:10.1001/jama.2014.3628
- US Department of Veterans Affairs, Department of Defense. VA/DoD clinical practice guideline for the management of substance use disorders. August 2021. Accessed February 5, 2025. https://www.healthquality.va.gov/guidelines/MH/sud/VADODSUDCPG.pdf
- Ranney RM, Bernhard PA, Vogt D, et al. Alcohol use and treatment utilization in a national sample of veterans and nonveterans. J Subst Use Addict Treat. 2023;146:208964. doi:10.1016/j.josat.2023.208964
- US Department of Veterans Affairs, Pharmacy Benefit Management Service, Academic Detailing Service. AUD Trend Report. https://vaww.pbi.cdw.va.gov/PBIRS/Pages/ReportViewer.aspx?/GPE/PBM_AD/SSRS/AUD/AUD_TrendReport
- Mendes MA, Smith JP, Marin JK, et al. Reducing benzodiazepine prescribing in older veterans: a direct-to-consumer educational brochure. Fed Pract. 2018;35(9):36-43.
- Tannenbaum C, Martin P, Tamblyn R, Benedetti A, Ahmed S. Reduction of inappropriate benzodiazepine prescriptions among older adults through direct patient education: the EMPOWER cluster randomized trial. JAMA Intern Med. 2014;174(6):890-898. doi:10.1001/jamainternmed.2014.949
- Maloney R, Funmilayo M. Acting on the AUDIT-C: implementation of direct-to-consumer education on unhealth alcohol use. Presented on March 31, 2023; Central Virginia Veterans Affairs Health Care System, Richmond, Virginia.
- US Department of Veterans Affairs, Pharmacy Benefit Management Service. Alcohol use disorder (AUD) – leading the charge in the treatment of AUD: a VA clinician’s guide. February 2022. Accessed February 5, 2025. https://www.pbm.va.gov/PBM/AcademicDetailingService/Documents/508/10-1530_AUD_ClinicianGuide_508Conformant.pdf
- Austin PC. An introduction to propensity score methods for reducing the effects of confounding in observational studies. Multivariate Behav Res. 2011;46(3):399-424. doi:10.1080/00273171.2011.568786
- National Institute on Alcohol Abuse and Alcoholism. Stigma: overcoming a pervasive barrier to optimal care. Updated January 6, 2025. Accessed February 5, 2025. https://www.niaaa.nih.gov/health-professionals-communities/core-resource-on-alcohol/stigma-overcoming-pervasive-barrier-optimal-care
- Sudhinaraset M, Wigglesworth C, Takeuchi DT. Social and cultural contexts of alcohol use: influences in a socialecological framework. Alcohol Res. 2016;38(1):35-45.
- Tanski SE, McClure AC, Li Z, et al. Cued recall of alcohol advertising on television and underage drinking behavior. JAMA Pediatr. 2015;169(3):264-271. doi:10.1001/jamapediatrics.2014.3345
- Hyland CJ, McDowell MJ, Bain PA, Huskamp HA, Busch AB. Integration of pharmacotherapy for alcohol use disorder treatment in primary care settings: a scoping review. J Subst Abuse Treat. 2023;144:108919. doi:10.1016/j.jsat.2022.108919
- National Institute on Alcohol Abuse and Alcoholism. The truth about holiday spirits. Updated November 2023. Accessed February 5, 2025. ,a href="https://www.niaaa.nih.gov/publications/brochures-and-fact-sheets/truth-about-holiday-spirits">https://www.niaaa.nih.gov/publications/brochures-and-fact-sheets/truth-about-holiday-spirits
Impact of Multisite Patient Education on Pharmacotherapy for Veterans With Alcohol Use Disorder
Impact of Multisite Patient Education on Pharmacotherapy for Veterans With Alcohol Use Disorder
Comparison of Prescribing Patterns of Intranasal Naloxone in a Veteran Population
Comparison of Prescribing Patterns of Intranasal Naloxone in a Veteran Population
Since 1999, annual deaths attributed to opioid overdose in the United States have increased from about 10,000 to about 50,000 in 2019.1 During the COVID-19 pandemic > 74,000 opioid overdose deaths occurred in the US from April 2020 to April 2021.2,3 Opioid-related overdoses now account for about 75% of all drug-related overdose deaths.1 In 2017, the cost of opioid overdose deaths and opioid use disorder (OUD) reached $1.02 trillion in the United States and $26 million in Indiana.4 The total deaths and costs would likely be higher if it were not for naloxone.
Naloxone hydrochloride was first patented in the 1960s and approved by the US Food and Drug Administration (FDA) in 1971 to treat opioid-related toxicity.1 It is the most frequently prescribed antidote for opioid toxicity due to its activity as a pure υ-opioid receptor competitive antagonist. Naloxone formulations include intramuscular, intravenous, subcutaneous, and intranasal delivery methods.5 According to the Centers for Disease Control and Prevention, clinicians should offer naloxone to patients at high risk for opioid-related adverse events. Risk factors include a history of overdose, opioid dosages of ≥ 50 morphine mg equivalents/day, and concurrent use of opioids with benzodiazepines.6
Intranasal naloxone 4 mg has become more accessible following the classification of opioid use as a public health emergency in 2017 and its over-the-counter availability since 2023. Intranasal naloxone 4 mg was approved by the FDA in 2015 for the prevention of opioid overdoses (accidental or intentional), which can be caused by heroin, fentanyl, carfentanil, hydrocodone, oxycodone, methadone, and other substances. 7 Fentanyl has most recently been associated with xylazine, a nonopioid tranquilizer linked to increased opioid overdose deaths.8 Recent data suggest that 34% of opioid overdose reversals involved ≥ 2 doses of intranasal naloxone 4 mg, which led to FDA approval of an intranasal naloxone 8 mg spray in April 2021.9-11
Veteran Health Indiana (VHI) has implemented several initiatives to promote naloxone prescribing. Established in 2020, the Opioid Overdose Education and Naloxone Distribution (OEND) program sought to prevent opioid-related deaths through education and product distribution. These criteria included an opioid prescription for ≥ 30 days. In 2021, the Stratification Tool for Opioid Risk Mitigation (STORM) was created to identify patients at high risk of opioid overdose and allowing pharmacists to prescribe naloxone for at-risk patients without restrictions, increasing accessibility.12
Recent cases of fentanyl-related overdoses involving stronger fentanyl analogues highlight the need for higher naloxone dosing to prevent overdose. A pharmacokinetic comparison of intranasal naloxone 8 mg vs 4 mg demonstrated maximum plasma concentrations of 10.3 ng/mL and 5.3 ng/mL, respectively. 13 Patients may be at an increased risk of precipitated opioid withdrawal when using intranasal naloxone 8 mg over 4 mg; however, some patients may benefit from achieving higher serum concentrations and therefore require larger doses of naloxone.
No clinical trials have demonstrated a difference in reversal rates between naloxone doses. No clinical practice guidelines support a specific naloxone formulation, and limited US Department of Veterans Affairs (VA)-specific guidance exists. VA Naloxone Rescue: Recommendations for Use states that selection of naloxone 8 mg should be based on shared decision-making between the patient and clinician and based on individual risk factors.12 The purpose of this study is to analyze data to determine if there is a difference in prescribing patterns of intranasal naloxone 4 mg and intranasal naloxone 8 mg.
METHODS
A retrospective chart reviews using the VA Computerized Patient Record System (CPRS) analyzed patients prescribed intranasal naloxone 4 mg or intranasal naloxone 8 mg at VHI. A patient list was generated based on active naloxone prescriptions between April 1, 2022, and April 1, 2023. Data were obtained exclusively through CPRS and patients were not contacted. This study was reviewed and deemed exempt by the Indiana University Health Institutional Review Board and the VHI Research and Development Committee.
Patients were included if they were aged ≥ 18 years and had an active prescription for intranasal naloxone 4 mg or intranasal naloxone 8 mg during the trial period. Patients were excluded if their naloxone prescription was written by a non-VHI clinician, if the dose was not 4 mg or 8 mg, or if the dosage form was other than intranasal spray.
The primary endpoint was the comparison for prescribing patterns for intranasal naloxone 4 mg and intranasal naloxone 8 mg during the study period. Secondary endpoints included total naloxone prescriptions; monthly prescriptions; number of patients with repeated naloxone prescriptions; prescriber type by naloxone dose; clinic type by naloxone dose; and documented indication for naloxone use by dose.
Demographic data collected included baseline age, sex, race, comorbid mental health conditions, and active central nervous system depressant medications on patient profile (ie, opioids, gabapentinoids, benzodiazepines, antidepressants, antipsychotics). Opioid prescriptions that were active or discontinued within the last 3 months were also recorded. Comorbid mental health conditions were collected based on the most recent clinical note before initiating medication.
Prescription-related data included strength of medication prescribed (4 mg, 8 mg, or both), documented use of medication, prescriber name, prescriber discipline, prescription entered by, number of times naloxone was filled or refilled during the study period, indication, clinic location, and clinic name. If > 1 prescription was active during the study period, the number of refills, prescriber name and clinic location of the first prescription in the study period was recorded. Additionally, the indication of OUD was differentiated from substance use disorder (SUD) if the patient was only dependent on opioids, excluding tobacco or alcohol. Patients with SUDs may include opioid dependence in addition to other substance dependence (eg, cannabis, stimulants, gabapentinoids, or benzodiazepines).
Basic descriptive statistics, including mean, ranges, and percentages were used to characterize the study subjects. For nominal data, X2 tests were used. A 2-sided 5% significance level was used for all statistical tests.
RESULTS
A total of 1952 active naloxone prescriptions from 1739 patients met the inclusion criteria; none were eliminated based on the exclusion criteria and some were included multiple times because data were collected for each active prescription during the study period. One hundred one patients were randomized and included in the final analysis (Figure). Most patients identified as White (81%), male (90%), and had a mean (SD) age of 60.9 (14.2) years. Common mental health comorbidities included 59 patients with depression, 50 with tobacco use disorder, and 31 with anxiety. Eighty-four patients had opioid and 60 had antidepressants/antianxiety, and 40 had gabapentinoids prescriptions. Forty-three patients had ≥ 3 mental health comorbidities. Thirty-four patients had 2 active central nervous system depressant prescriptions, 30 had 3 active prescriptions, and 9 had ≥ 4 active prescriptions. Most patients (n = 83) had an active or recently discontinued opioid prescription (Table 1).
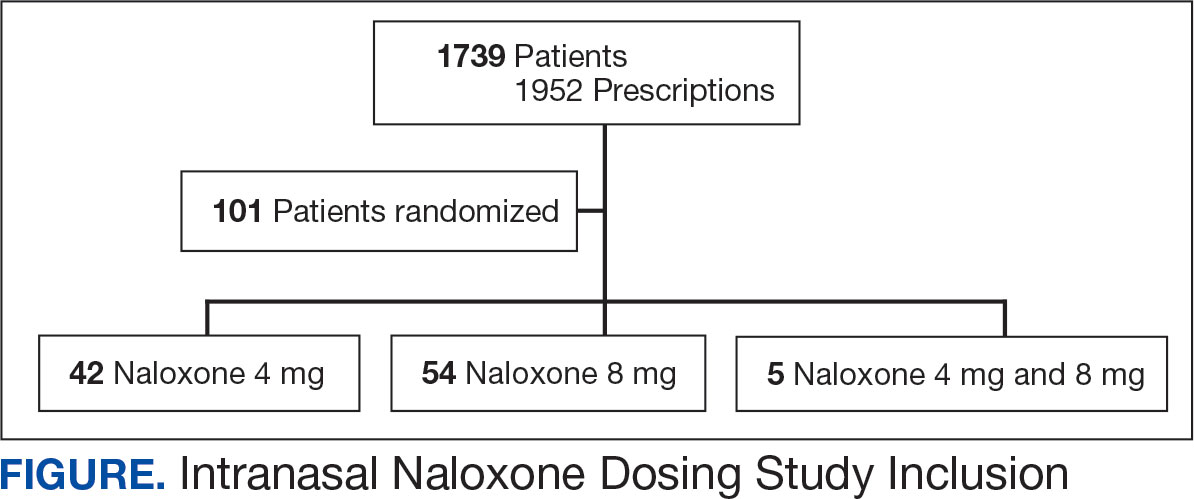
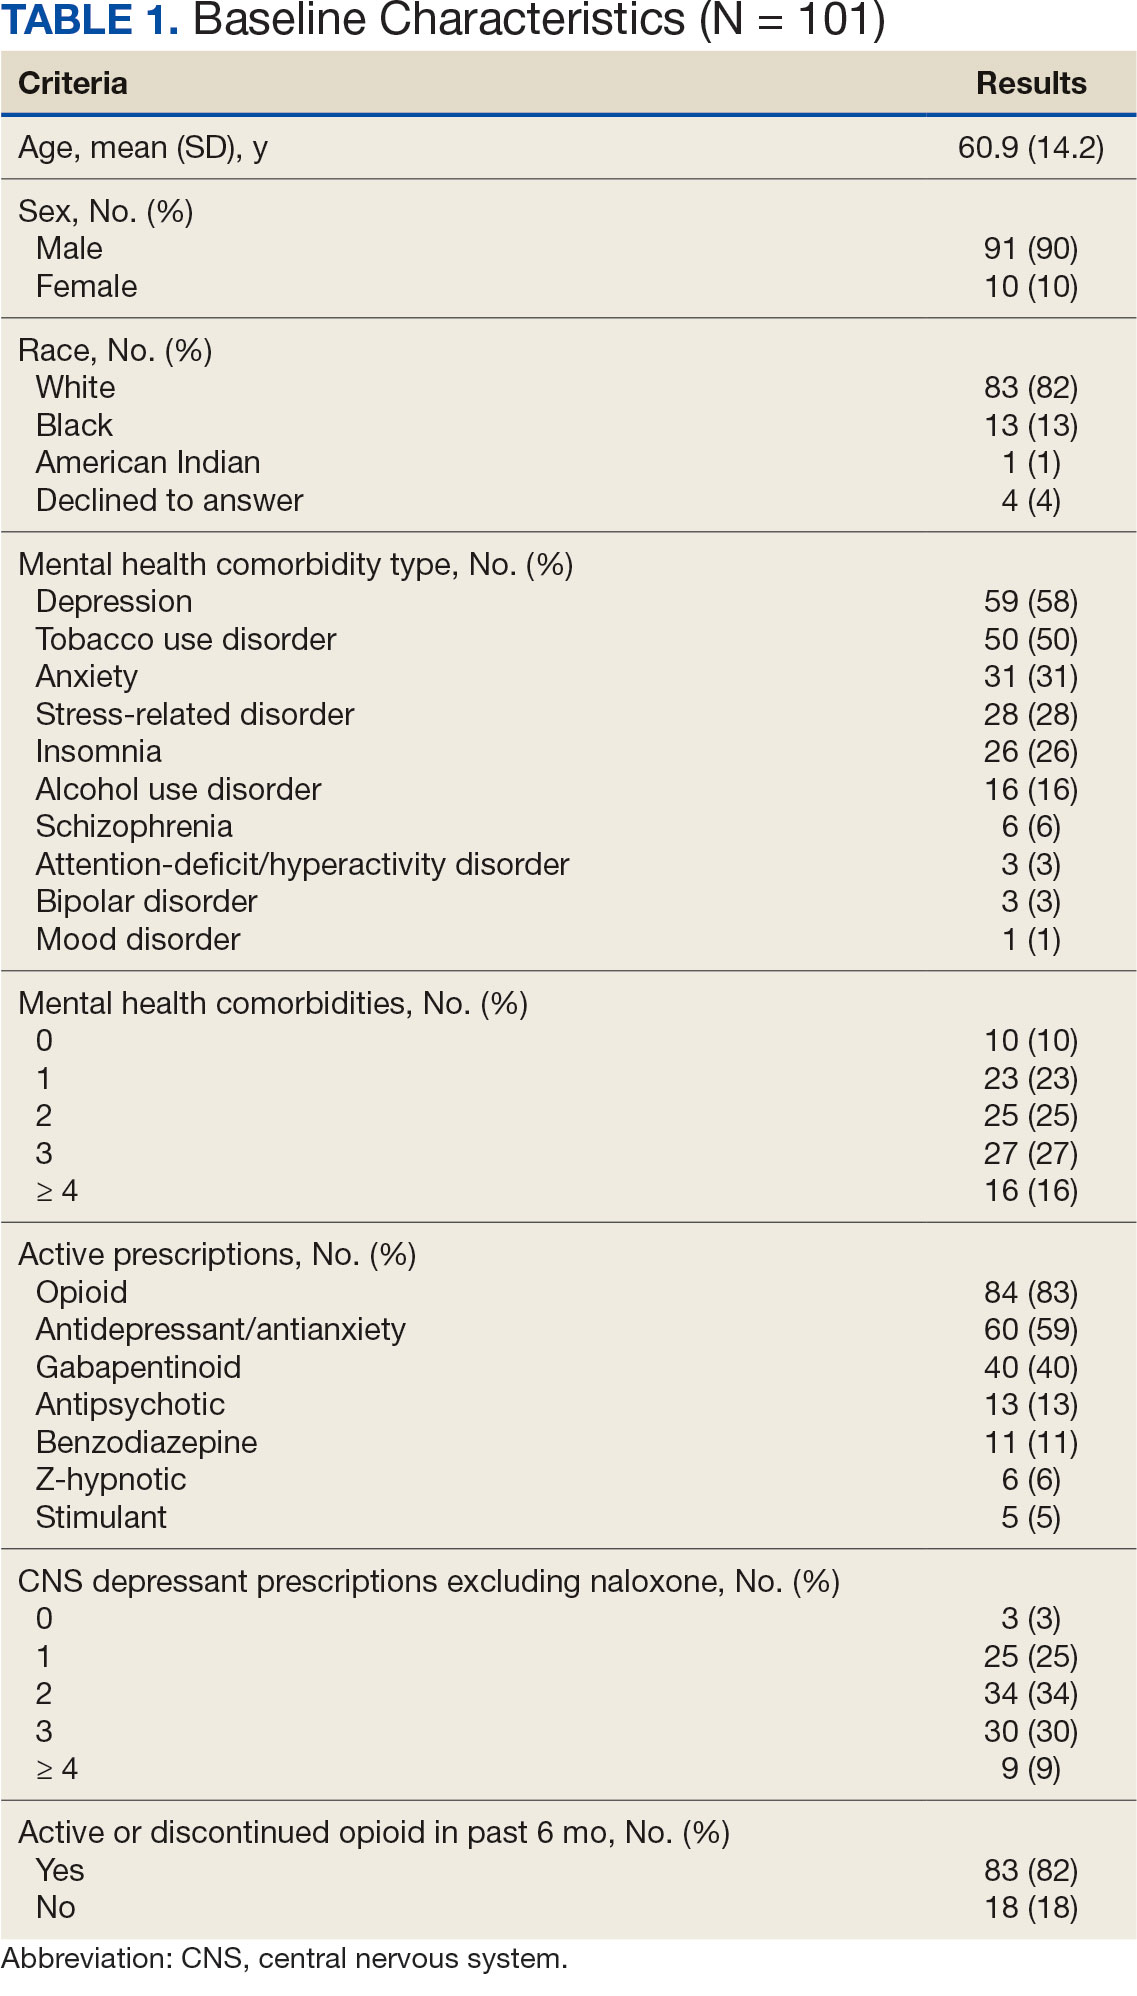
The 101 patients received 54 prescriptions for naloxone 8 mg and 47 for 4 mg (Table 2). Five patients received prescriptions for both the 4 mg and 8 mg intranasal naloxone formulations. Sixty-six patients had naloxone filled once (66%) during the study period. Intranasal naloxone 4 mg was prescribed to 30 patients by nurse practitioners, 17 patients by physicians, and not prescribed by pharmacists. Intranasal naloxone 8 mg was prescribed to 40 patients by pharmacists, 13 patients by physicians, and 6 patients by nurses. Patients who received prescriptions for both intranasal naloxone 4 mg and 8 mg were most routinely ordered by physicians (n = 3; 60%) in primary care (n = 2; 40%) for chronic opioid use (n = 2; 40%).
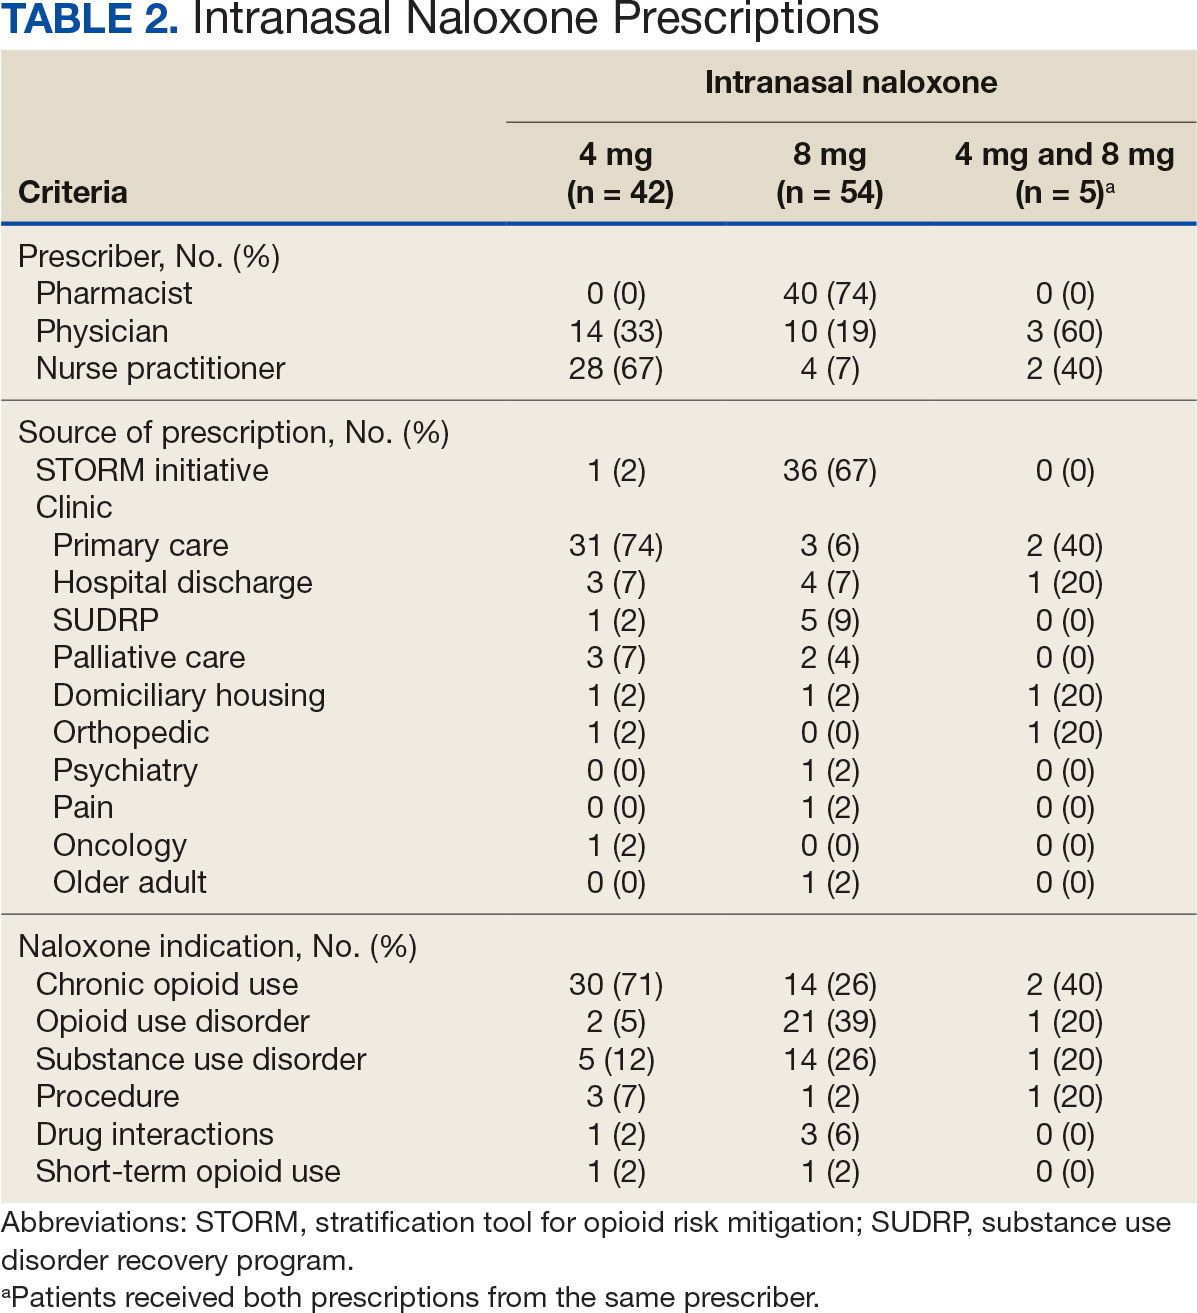
Patients access naloxone from many different VHI clinics. Primary care clinics prescribed the 4 mg formulation to 31 patients, 8 mg to 3 patients, and both to 2 patients. The STORM initiative was used for 37 of 106 prescriptions (35%): 4 mg intranasal naloxone was prescribed to 1 patient, 8 mg to 36 patients, and no patients received both formulations. Chronic opioid use was the most common indication (46%) with 30 patients prescribed intranasal naloxone 4 mg, 14 patients prescribed 8 mg, and 2 patients prescribed both. OUD was the indication for 24% of patients: 2 patients prescribed intranasal naloxone 4 mg, 21 patients prescribed 8 mg, and 1 patient prescribed both.
The 106 intranasal naloxone prescriptions were equally distributed across each month from April 1, 2022, to April 1, 2023. Of the 101 patients, 34 had multiple naloxone prescriptions filled during the study period. Pharmacists wrote 40 of 106 naloxone prescriptions (38%), all for the 8 mg formulation. Nurse practitioners prescribed naloxone 4 mg 30 times and 8 mg 6 times for 36 of 106 prescriptions (34%). Physicians prescribed 30 of 106 prescriptions (28%), including intranasal naloxone 4 mg 17 times and 8 mg 13 times.
Statistics were analyzed using a X2 test; however, it was determined that the expected frequencies made the tests inappropriate. Differences in prescribing patterns between naloxone doses, prescriber disciplines, source of the prescription, or indications were not statistically significant.
DISCUSSION
Many pharmacists possess a scope of practice under state law and/or institution policy to prescribe naloxone. In this study, pharmacists prescribed the most naloxone prescriptions compared to physicians and nurse practitioners. Initiatives such as OEND and STORM have given pharmacists at VHI an avenue to combat the growing opioid epidemic while expanding their scope of practice. A systematic review of 67 studies found that pharmacist-led OEND programs showed a statistically significant increase in naloxone orders. A statistical significance was likely met given the large sample sizes ranging from 10 to 217,000 individuals, whereas this study only assessed a small portion of patients.14 This study contributes to the overwhelming amount of data that highlights pharmacists’ impact on overall naloxone distribution.
The STORM initiative and primary care clinics were responsible for large portions of naloxone prescriptions in this study. STORM was used by pharmacists and contributed to more than half of the higher dose naloxone prescriptions. Following a discussion with members of the pain management team, pharmacists involved in STORM prescribing were revealed to exclusively prescribe intranasal naloxone 8 mg as opposed to 4 mg. At the risk of precipitating withdrawal from higher doses of naloxone, it was agreed that this risk was heavily outweighed by the benefit of successful opioid reversal. In this context, it is expected for this avenue of prescribing to influence naloxone prescribing patterns at VHI.
Prescribing in primary care clinics was shown to be equally as substantial. Primary care-based multidisciplinary transition clinics have been reported to be associated with increased access to OUD treatment.15 Primary care clinics at VHI, or patient aligned care teams (PACT), largely consist of multidisciplinary health care teams. PACT clinicians are heavily involved in transitions of care because one system provides patients with comprehensive acute and chronic care. Continuing to encourage naloxone distribution through primary care and using STORM affords various patient populations access to high-level care.
Notable differences were observed between indications for naloxone use and the corresponding dose. Patients with OUD or SUD were more likely to receive intranasal naloxone 8 mg as opposed to patients receiving intranasal naloxone for chronic opioid use, who were more likely to receive the 4 mg dose. This may be due to a rationale to provide a higher dose of naloxone to combat overdoses in the case of ingesting substances mixed with fentanyl or xylazine.12,13 Without standard of care guidelines, concerns remain for varying outcomes in opioid overdose prevention within vulnerable populations.
Limitations
Chart data were dependent on documentation, which may have omitted pertinent baseline characteristics and risk factors. Additional data collection could have further assessed a patient’s specific risk factors (eg, opioid dose in morphine equivalents) to draw conclusions to the dose of naloxone prescribed. The sample size was small, and the patient population was largely White and male, which minimized the generalizability of the results.
CONCLUSIONS
This study evaluated the differences in intranasal naloxone prescribing patterns within a veteran population at VHI over 12 months. Findings revealed that most prescriptions were written for intranasal naloxone 8 mg, by a pharmacist, in a primary care setting, and for chronic opioid use. The results revealed evidence of differing naloxone prescribing practices, which emphasize the need for clinical guidelines and better defined recommendations in relation to naloxone dosing.
The most evident gap in patient care could be addressed by urging the VA Pharmacy Benefits Management group to update naloxone recommendations for use to include more concrete dosing recommendations. Furthermore, it would be beneficial to re-educate clinicians on naloxone prescribing to increase awareness of different doses and the importance of equipping patients with the correct amount of naloxone in an emergency. Additional research assessing change in prescribing patterns is warranted as the use of higher dose naloxone becomes more routine.
- Britch SC, Walsh SL. Treatment of opioid overdose: current approaches and recent advances. Psychopharmacology (Berl). 2022;239(7):2063-2081. doi:10.1007/s00213-022-06125-5
- Ahmad FB, Cisewski JA, Rossen LM, Sutton P. Provisional Drug Overdose Death Counts. National Center for Health Statistics, Centers for Disease Control and Prevention; 2023. Accessed April 10, 2025. https://www.cdc.gov/nchs/nvss/vsrr/drug-overdose-data.htm
- O’Donnell J, Tanz LJ, Gladden RM, Davis NL, Bitting J. Trends in and characteristics of drug overdose deaths involving illicitly manufactured fentanyls — United States, 2019–2020. MMWR Morb Mortal Wkly Rep. 2021;70:1740-1746. doi:10.15585/mmwr.mm7050e3
- Luo F, Li M, Florence C. State-level economic costs of opioid use disorder and fatal opioid overdose — United States, 2017. MMWR Morb Mortal Wkly Rep. 2021;70:541-546. doi:10.15585/mmwr.mm7015a1
- Lexicomp. Lexicomp Online. Accessed April 10, 2025. http://online.lexi.com
- Dowell D, Ragan KR, Jones CM, Baldwin GT, Chou R. CDC Clinical practice guideline for prescribing opioids for pain — United States, 2022. MMWR Recomm Rep. 2022;71(3):1-95. doi:10.15585/mmwr.rr7103a1
- Narcan (naloxone) FDA approval history. Drugs.com. Accessed April 10, 2025. https://www.drugs.com/history/narcan.html
- Centers for Disease Control and Prevention. What you should know about xylazine. May 16, 2024. Accessed April 10, 2025. https://www.cdc.gov/overdose-prevention/about/what-you-should-know-about-xylazine.html
- Avetian GK, Fiuty P, Mazzella S, Koppa D, Heye V, Hebbar P. Use of naloxone nasal spray 4 mg in the community setting: a survey of use by community organizations. Curr Med Res Opin. 2018;34(4):573-576. doi:10.1080/03007995.2017.1334637
- Kloxxado [package insert]. Hikma Pharmaceuticals USA Inc; 2021.
- FDA approves higher dosage of naloxone nasal spray to treat opioid overdose. News release. FDA. April 30, 2021. Accessed April 10, 2025. https://www.fda.gov/news-events/press-announcements/fda-approves-higher-dosage-naloxone-nasal-spray-treat-opioid-overdose
- US Department of Veterans Affairs, Pharmacy Benefits Management Services and National Formulary Committee in Collaboration with the VA National Harm Reduction Support & Development Workgroup. Naloxone Rescue: Recommendations for Use. June 2014. Updated March 2024. Accessed April 10, 2025. https://www.va.gov/formularyadvisor/DOC_PDF/CRE_Naloxone_Rescue_Guidance_March_2024.pdf
- Krieter P, Chiang N, Gyaw S, et al. Pharmacokinetic properties and human use characteristics of an FDA-approved intranasal naloxone product for the treatment of opioid overdose. J Clin Pharmacol. 2016;56(10):1243-1253. doi:10.1002/jcph.759
- Rawal S, Osae SP, Cobran EK, Albert A, Young HN. Pharmacists’ naloxone services beyond community pharmacy settings: a systematic review. Res Social Adm Pharm. 2023;19(2):243-265. doi:10.1016/j.sapharm.2022.09.002
- Incze MA, Sehgal SL, Hansen A, Garcia L, Stolebarger L. Evaluation of a primary care-based multidisciplinary transition clinic for patients newly initiated on buprenorphine in the emergency department. Subst Abus. 2023;44(3):220-225. doi:10.1177/08897077231188592
Since 1999, annual deaths attributed to opioid overdose in the United States have increased from about 10,000 to about 50,000 in 2019.1 During the COVID-19 pandemic > 74,000 opioid overdose deaths occurred in the US from April 2020 to April 2021.2,3 Opioid-related overdoses now account for about 75% of all drug-related overdose deaths.1 In 2017, the cost of opioid overdose deaths and opioid use disorder (OUD) reached $1.02 trillion in the United States and $26 million in Indiana.4 The total deaths and costs would likely be higher if it were not for naloxone.
Naloxone hydrochloride was first patented in the 1960s and approved by the US Food and Drug Administration (FDA) in 1971 to treat opioid-related toxicity.1 It is the most frequently prescribed antidote for opioid toxicity due to its activity as a pure υ-opioid receptor competitive antagonist. Naloxone formulations include intramuscular, intravenous, subcutaneous, and intranasal delivery methods.5 According to the Centers for Disease Control and Prevention, clinicians should offer naloxone to patients at high risk for opioid-related adverse events. Risk factors include a history of overdose, opioid dosages of ≥ 50 morphine mg equivalents/day, and concurrent use of opioids with benzodiazepines.6
Intranasal naloxone 4 mg has become more accessible following the classification of opioid use as a public health emergency in 2017 and its over-the-counter availability since 2023. Intranasal naloxone 4 mg was approved by the FDA in 2015 for the prevention of opioid overdoses (accidental or intentional), which can be caused by heroin, fentanyl, carfentanil, hydrocodone, oxycodone, methadone, and other substances. 7 Fentanyl has most recently been associated with xylazine, a nonopioid tranquilizer linked to increased opioid overdose deaths.8 Recent data suggest that 34% of opioid overdose reversals involved ≥ 2 doses of intranasal naloxone 4 mg, which led to FDA approval of an intranasal naloxone 8 mg spray in April 2021.9-11
Veteran Health Indiana (VHI) has implemented several initiatives to promote naloxone prescribing. Established in 2020, the Opioid Overdose Education and Naloxone Distribution (OEND) program sought to prevent opioid-related deaths through education and product distribution. These criteria included an opioid prescription for ≥ 30 days. In 2021, the Stratification Tool for Opioid Risk Mitigation (STORM) was created to identify patients at high risk of opioid overdose and allowing pharmacists to prescribe naloxone for at-risk patients without restrictions, increasing accessibility.12
Recent cases of fentanyl-related overdoses involving stronger fentanyl analogues highlight the need for higher naloxone dosing to prevent overdose. A pharmacokinetic comparison of intranasal naloxone 8 mg vs 4 mg demonstrated maximum plasma concentrations of 10.3 ng/mL and 5.3 ng/mL, respectively. 13 Patients may be at an increased risk of precipitated opioid withdrawal when using intranasal naloxone 8 mg over 4 mg; however, some patients may benefit from achieving higher serum concentrations and therefore require larger doses of naloxone.
No clinical trials have demonstrated a difference in reversal rates between naloxone doses. No clinical practice guidelines support a specific naloxone formulation, and limited US Department of Veterans Affairs (VA)-specific guidance exists. VA Naloxone Rescue: Recommendations for Use states that selection of naloxone 8 mg should be based on shared decision-making between the patient and clinician and based on individual risk factors.12 The purpose of this study is to analyze data to determine if there is a difference in prescribing patterns of intranasal naloxone 4 mg and intranasal naloxone 8 mg.
METHODS
A retrospective chart reviews using the VA Computerized Patient Record System (CPRS) analyzed patients prescribed intranasal naloxone 4 mg or intranasal naloxone 8 mg at VHI. A patient list was generated based on active naloxone prescriptions between April 1, 2022, and April 1, 2023. Data were obtained exclusively through CPRS and patients were not contacted. This study was reviewed and deemed exempt by the Indiana University Health Institutional Review Board and the VHI Research and Development Committee.
Patients were included if they were aged ≥ 18 years and had an active prescription for intranasal naloxone 4 mg or intranasal naloxone 8 mg during the trial period. Patients were excluded if their naloxone prescription was written by a non-VHI clinician, if the dose was not 4 mg or 8 mg, or if the dosage form was other than intranasal spray.
The primary endpoint was the comparison for prescribing patterns for intranasal naloxone 4 mg and intranasal naloxone 8 mg during the study period. Secondary endpoints included total naloxone prescriptions; monthly prescriptions; number of patients with repeated naloxone prescriptions; prescriber type by naloxone dose; clinic type by naloxone dose; and documented indication for naloxone use by dose.
Demographic data collected included baseline age, sex, race, comorbid mental health conditions, and active central nervous system depressant medications on patient profile (ie, opioids, gabapentinoids, benzodiazepines, antidepressants, antipsychotics). Opioid prescriptions that were active or discontinued within the last 3 months were also recorded. Comorbid mental health conditions were collected based on the most recent clinical note before initiating medication.
Prescription-related data included strength of medication prescribed (4 mg, 8 mg, or both), documented use of medication, prescriber name, prescriber discipline, prescription entered by, number of times naloxone was filled or refilled during the study period, indication, clinic location, and clinic name. If > 1 prescription was active during the study period, the number of refills, prescriber name and clinic location of the first prescription in the study period was recorded. Additionally, the indication of OUD was differentiated from substance use disorder (SUD) if the patient was only dependent on opioids, excluding tobacco or alcohol. Patients with SUDs may include opioid dependence in addition to other substance dependence (eg, cannabis, stimulants, gabapentinoids, or benzodiazepines).
Basic descriptive statistics, including mean, ranges, and percentages were used to characterize the study subjects. For nominal data, X2 tests were used. A 2-sided 5% significance level was used for all statistical tests.
RESULTS
A total of 1952 active naloxone prescriptions from 1739 patients met the inclusion criteria; none were eliminated based on the exclusion criteria and some were included multiple times because data were collected for each active prescription during the study period. One hundred one patients were randomized and included in the final analysis (Figure). Most patients identified as White (81%), male (90%), and had a mean (SD) age of 60.9 (14.2) years. Common mental health comorbidities included 59 patients with depression, 50 with tobacco use disorder, and 31 with anxiety. Eighty-four patients had opioid and 60 had antidepressants/antianxiety, and 40 had gabapentinoids prescriptions. Forty-three patients had ≥ 3 mental health comorbidities. Thirty-four patients had 2 active central nervous system depressant prescriptions, 30 had 3 active prescriptions, and 9 had ≥ 4 active prescriptions. Most patients (n = 83) had an active or recently discontinued opioid prescription (Table 1).
The 101 patients received 54 prescriptions for naloxone 8 mg and 47 for 4 mg (Table 2). Five patients received prescriptions for both the 4 mg and 8 mg intranasal naloxone formulations. Sixty-six patients had naloxone filled once (66%) during the study period. Intranasal naloxone 4 mg was prescribed to 30 patients by nurse practitioners, 17 patients by physicians, and not prescribed by pharmacists. Intranasal naloxone 8 mg was prescribed to 40 patients by pharmacists, 13 patients by physicians, and 6 patients by nurses. Patients who received prescriptions for both intranasal naloxone 4 mg and 8 mg were most routinely ordered by physicians (n = 3; 60%) in primary care (n = 2; 40%) for chronic opioid use (n = 2; 40%).
Patients access naloxone from many different VHI clinics. Primary care clinics prescribed the 4 mg formulation to 31 patients, 8 mg to 3 patients, and both to 2 patients. The STORM initiative was used for 37 of 106 prescriptions (35%): 4 mg intranasal naloxone was prescribed to 1 patient, 8 mg to 36 patients, and no patients received both formulations. Chronic opioid use was the most common indication (46%) with 30 patients prescribed intranasal naloxone 4 mg, 14 patients prescribed 8 mg, and 2 patients prescribed both. OUD was the indication for 24% of patients: 2 patients prescribed intranasal naloxone 4 mg, 21 patients prescribed 8 mg, and 1 patient prescribed both.
The 106 intranasal naloxone prescriptions were equally distributed across each month from April 1, 2022, to April 1, 2023. Of the 101 patients, 34 had multiple naloxone prescriptions filled during the study period. Pharmacists wrote 40 of 106 naloxone prescriptions (38%), all for the 8 mg formulation. Nurse practitioners prescribed naloxone 4 mg 30 times and 8 mg 6 times for 36 of 106 prescriptions (34%). Physicians prescribed 30 of 106 prescriptions (28%), including intranasal naloxone 4 mg 17 times and 8 mg 13 times.
Statistics were analyzed using a X2 test; however, it was determined that the expected frequencies made the tests inappropriate. Differences in prescribing patterns between naloxone doses, prescriber disciplines, source of the prescription, or indications were not statistically significant.
DISCUSSION
Many pharmacists possess a scope of practice under state law and/or institution policy to prescribe naloxone. In this study, pharmacists prescribed the most naloxone prescriptions compared to physicians and nurse practitioners. Initiatives such as OEND and STORM have given pharmacists at VHI an avenue to combat the growing opioid epidemic while expanding their scope of practice. A systematic review of 67 studies found that pharmacist-led OEND programs showed a statistically significant increase in naloxone orders. A statistical significance was likely met given the large sample sizes ranging from 10 to 217,000 individuals, whereas this study only assessed a small portion of patients.14 This study contributes to the overwhelming amount of data that highlights pharmacists’ impact on overall naloxone distribution.
The STORM initiative and primary care clinics were responsible for large portions of naloxone prescriptions in this study. STORM was used by pharmacists and contributed to more than half of the higher dose naloxone prescriptions. Following a discussion with members of the pain management team, pharmacists involved in STORM prescribing were revealed to exclusively prescribe intranasal naloxone 8 mg as opposed to 4 mg. At the risk of precipitating withdrawal from higher doses of naloxone, it was agreed that this risk was heavily outweighed by the benefit of successful opioid reversal. In this context, it is expected for this avenue of prescribing to influence naloxone prescribing patterns at VHI.
Prescribing in primary care clinics was shown to be equally as substantial. Primary care-based multidisciplinary transition clinics have been reported to be associated with increased access to OUD treatment.15 Primary care clinics at VHI, or patient aligned care teams (PACT), largely consist of multidisciplinary health care teams. PACT clinicians are heavily involved in transitions of care because one system provides patients with comprehensive acute and chronic care. Continuing to encourage naloxone distribution through primary care and using STORM affords various patient populations access to high-level care.
Notable differences were observed between indications for naloxone use and the corresponding dose. Patients with OUD or SUD were more likely to receive intranasal naloxone 8 mg as opposed to patients receiving intranasal naloxone for chronic opioid use, who were more likely to receive the 4 mg dose. This may be due to a rationale to provide a higher dose of naloxone to combat overdoses in the case of ingesting substances mixed with fentanyl or xylazine.12,13 Without standard of care guidelines, concerns remain for varying outcomes in opioid overdose prevention within vulnerable populations.
Limitations
Chart data were dependent on documentation, which may have omitted pertinent baseline characteristics and risk factors. Additional data collection could have further assessed a patient’s specific risk factors (eg, opioid dose in morphine equivalents) to draw conclusions to the dose of naloxone prescribed. The sample size was small, and the patient population was largely White and male, which minimized the generalizability of the results.
CONCLUSIONS
This study evaluated the differences in intranasal naloxone prescribing patterns within a veteran population at VHI over 12 months. Findings revealed that most prescriptions were written for intranasal naloxone 8 mg, by a pharmacist, in a primary care setting, and for chronic opioid use. The results revealed evidence of differing naloxone prescribing practices, which emphasize the need for clinical guidelines and better defined recommendations in relation to naloxone dosing.
The most evident gap in patient care could be addressed by urging the VA Pharmacy Benefits Management group to update naloxone recommendations for use to include more concrete dosing recommendations. Furthermore, it would be beneficial to re-educate clinicians on naloxone prescribing to increase awareness of different doses and the importance of equipping patients with the correct amount of naloxone in an emergency. Additional research assessing change in prescribing patterns is warranted as the use of higher dose naloxone becomes more routine.
- Britch SC, Walsh SL. Treatment of opioid overdose: current approaches and recent advances. Psychopharmacology (Berl). 2022;239(7):2063-2081. doi:10.1007/s00213-022-06125-5
- Ahmad FB, Cisewski JA, Rossen LM, Sutton P. Provisional Drug Overdose Death Counts. National Center for Health Statistics, Centers for Disease Control and Prevention; 2023. Accessed April 10, 2025. https://www.cdc.gov/nchs/nvss/vsrr/drug-overdose-data.htm
- O’Donnell J, Tanz LJ, Gladden RM, Davis NL, Bitting J. Trends in and characteristics of drug overdose deaths involving illicitly manufactured fentanyls — United States, 2019–2020. MMWR Morb Mortal Wkly Rep. 2021;70:1740-1746. doi:10.15585/mmwr.mm7050e3
- Luo F, Li M, Florence C. State-level economic costs of opioid use disorder and fatal opioid overdose — United States, 2017. MMWR Morb Mortal Wkly Rep. 2021;70:541-546. doi:10.15585/mmwr.mm7015a1
- Lexicomp. Lexicomp Online. Accessed April 10, 2025. http://online.lexi.com
- Dowell D, Ragan KR, Jones CM, Baldwin GT, Chou R. CDC Clinical practice guideline for prescribing opioids for pain — United States, 2022. MMWR Recomm Rep. 2022;71(3):1-95. doi:10.15585/mmwr.rr7103a1
- Narcan (naloxone) FDA approval history. Drugs.com. Accessed April 10, 2025. https://www.drugs.com/history/narcan.html
- Centers for Disease Control and Prevention. What you should know about xylazine. May 16, 2024. Accessed April 10, 2025. https://www.cdc.gov/overdose-prevention/about/what-you-should-know-about-xylazine.html
- Avetian GK, Fiuty P, Mazzella S, Koppa D, Heye V, Hebbar P. Use of naloxone nasal spray 4 mg in the community setting: a survey of use by community organizations. Curr Med Res Opin. 2018;34(4):573-576. doi:10.1080/03007995.2017.1334637
- Kloxxado [package insert]. Hikma Pharmaceuticals USA Inc; 2021.
- FDA approves higher dosage of naloxone nasal spray to treat opioid overdose. News release. FDA. April 30, 2021. Accessed April 10, 2025. https://www.fda.gov/news-events/press-announcements/fda-approves-higher-dosage-naloxone-nasal-spray-treat-opioid-overdose
- US Department of Veterans Affairs, Pharmacy Benefits Management Services and National Formulary Committee in Collaboration with the VA National Harm Reduction Support & Development Workgroup. Naloxone Rescue: Recommendations for Use. June 2014. Updated March 2024. Accessed April 10, 2025. https://www.va.gov/formularyadvisor/DOC_PDF/CRE_Naloxone_Rescue_Guidance_March_2024.pdf
- Krieter P, Chiang N, Gyaw S, et al. Pharmacokinetic properties and human use characteristics of an FDA-approved intranasal naloxone product for the treatment of opioid overdose. J Clin Pharmacol. 2016;56(10):1243-1253. doi:10.1002/jcph.759
- Rawal S, Osae SP, Cobran EK, Albert A, Young HN. Pharmacists’ naloxone services beyond community pharmacy settings: a systematic review. Res Social Adm Pharm. 2023;19(2):243-265. doi:10.1016/j.sapharm.2022.09.002
- Incze MA, Sehgal SL, Hansen A, Garcia L, Stolebarger L. Evaluation of a primary care-based multidisciplinary transition clinic for patients newly initiated on buprenorphine in the emergency department. Subst Abus. 2023;44(3):220-225. doi:10.1177/08897077231188592
Comparison of Prescribing Patterns of Intranasal Naloxone in a Veteran Population
Comparison of Prescribing Patterns of Intranasal Naloxone in a Veteran Population
Community Care Radiation Oncology Cost Calculations for a VA Medical Center
Community Care Radiation Oncology Cost Calculations for a VA Medical Center
William Kissick’s description of health care’s iron triangle in 1994 still resonates. Access, quality, and cost will always come at the expense of the others.1 In 2018, Congress passed the VA MISSION Act, allowing patients to pursue community care options for extended waits (> 28 days) or longer distance drive times of > 60 minutes for specialty care services, such as radiation oncology. According to Albanese et al, the VA MISSION Act sought to address gaps in care for veterans living in rural and underserved areas.2 The Veterans Health Administration (VHA) continues to increase community care spending, with a 13.8% increase in fiscal year 2024 and an expected cost of > $40 billion for 2025.3 One could argue this pays for access for remote patients and quality when services are unavailable, making it a direct application of the iron triangle.
The VA MISSION Act also bolstered the expansion of existing community care department staff to expediently facilitate and coordinate care and payments.2 Cost management and monitoring have become critical in predicting future staff requirements, maintaining functionality, and ensuring patients receive optimal care. The VHA purchases care through partner networks and defines these bundled health care services as standard episodes of care (SEOCs), which are “clinically related health care services for a specific unique illness or medical condition… over a defined period of time.”4 Medicare publishes its rates quarterly, and outpatient procedure pricing is readily available online.5 Along these same lines, the US Department of Veterans Affairs (VA) publishes a current list of available procedures and associated Current Procedure Technology (CPT) codes that are covered under its VA fee schedule for community care.
Unique challenges persist when using this system to accurately account for radiation oncology expenditures. This study was based on the current practices at the Richard L. Roudebush VA Medical Center (RLRVAMC), a large 1a hospital. A detailed analysis reveals the contemporaneous cost of radiation oncology cancer care from October 1, 2021, through February 1, 2024, highlights the challenges in SEOC definition and duration, communication issues between RLRVAMC and purchase partners, inconsistencies in billing, erroneous payments, and difficulty of cost categorization.
METHODS
Community care radiation oncology-related costs were examined from October 1, 2021, to February 1, 2024 for RLRVAMC, 6 months prior to billing data extraction. Figure 1 shows a simple radiation oncology patient pathway with consultation or visit, simulation and planning, and treatment, with codes used to check billing. It illustrates the expected relationships between the VHA (radiation oncology, primary, and specialty care) and community care (clinicians and radiation oncology treatment sites).
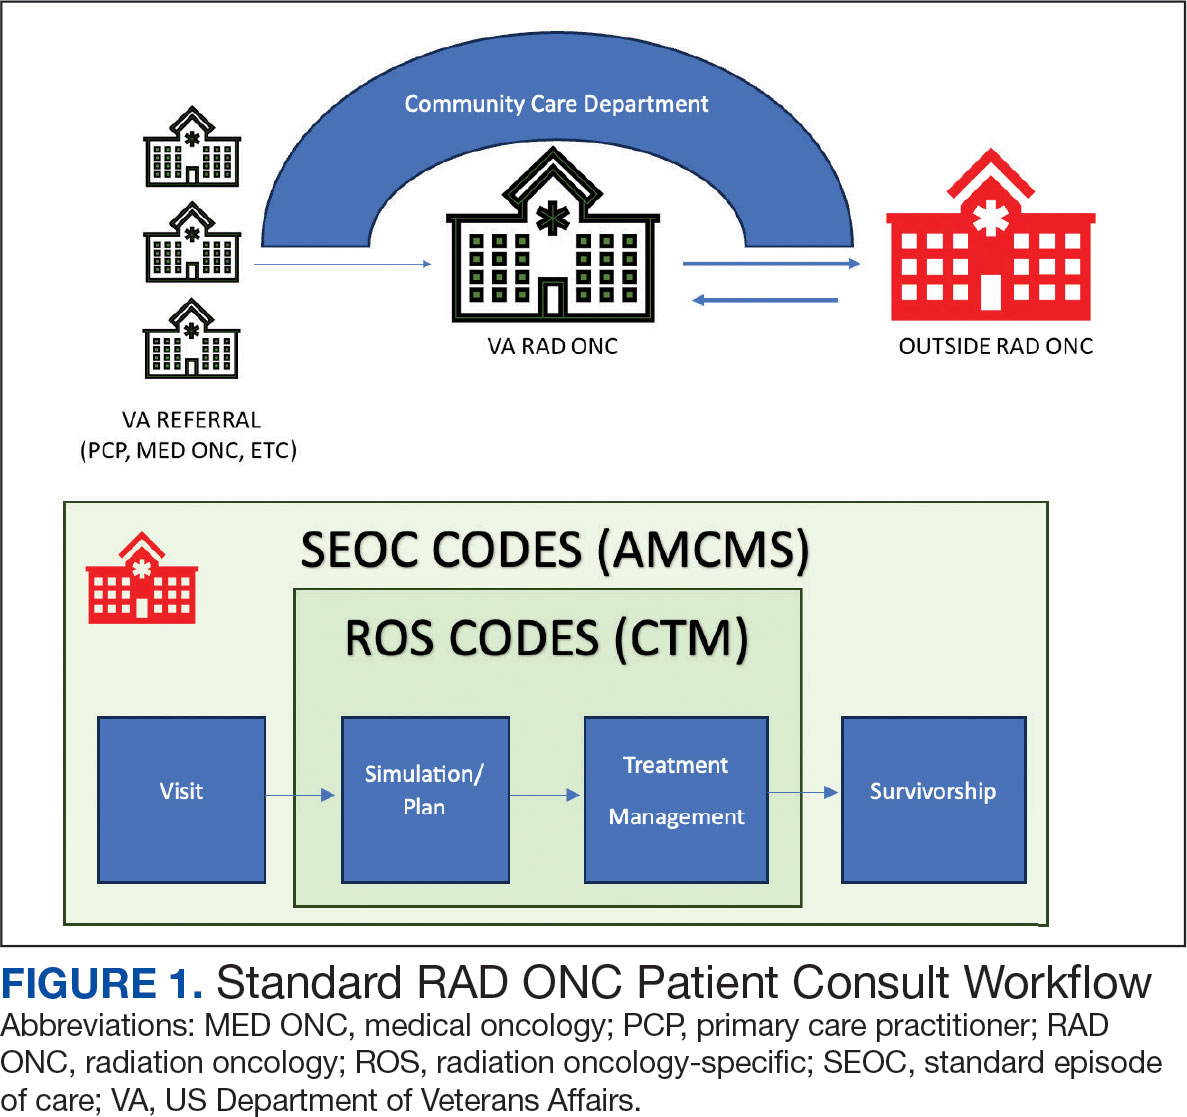
VHA standard operating procedures for a patient requesting community-based radiation oncology care require a board-certified radiation oncologist at RLRVAMC to review and approve the outside care request. Community care radiation oncology consultation data were accessed from the VA Corporate Data Warehouse (CDW) using Pyramid Analytics (V25.2). Nurses, physicians, and community care staff can add comments, forward consultations to other services, and mark them as complete or discontinued, when appropriate. Consultations not completed within 91 days are automatically discontinued. All community care requests from 2018 through 2024 were extracted; analysis began April 1, 2021, 6 months prior to the cost evaluation date of October 1, 2021.
An approved consultation is reviewed for eligibility by a nurse in the community care department and assigned an authorization number (a VA prefix followed by 12 digits). Billing codes are approved and organized by the community care networks, and all procedure codes should be captured and labeled under this number. The VAMC Community Care department obtains initial correspondence from the treating clinicians. Subsequent records from the treating radiation oncologist are expected to be scanned into the electronic health record and made accessible via the VA Joint Legacy Viewer (JLV) and Computerized Patient Record System (CPRS).
Radiation Oncology SEOC
The start date of the radiation oncology SEOC is determined by the community care nurse based on guidance established by the VA. It can be manually backdated or delayed, but current practice is to start at first visit or procedure code entry after approval from the VAMC Radiation Oncology department. Approved CPT codes from SEOC versions between October 1, 2021, and February 1, 2024, are in eAppendix 1 (available at doi:10.12788/fp.0585). These generally include 10 types of encounters, about 115 different laboratory tests, 115 imaging studies, 25 simulation and planning procedures, and 115 radiation treatment codes. The radiation oncology SEOCs during the study period had an approval duration of 180 days. Advanced Medical Cost Management Solutions software (AMCMS) is the VHA data analytics platform for community care medical service costs. AMCMS includes all individual CPT codes billed by specific radiation oncology SEOC versions. Data are refreshed monthly, and all charges were extracted on September 12, 2024, > 6 months after the final evaluated service date to allow for complete billing returns.6
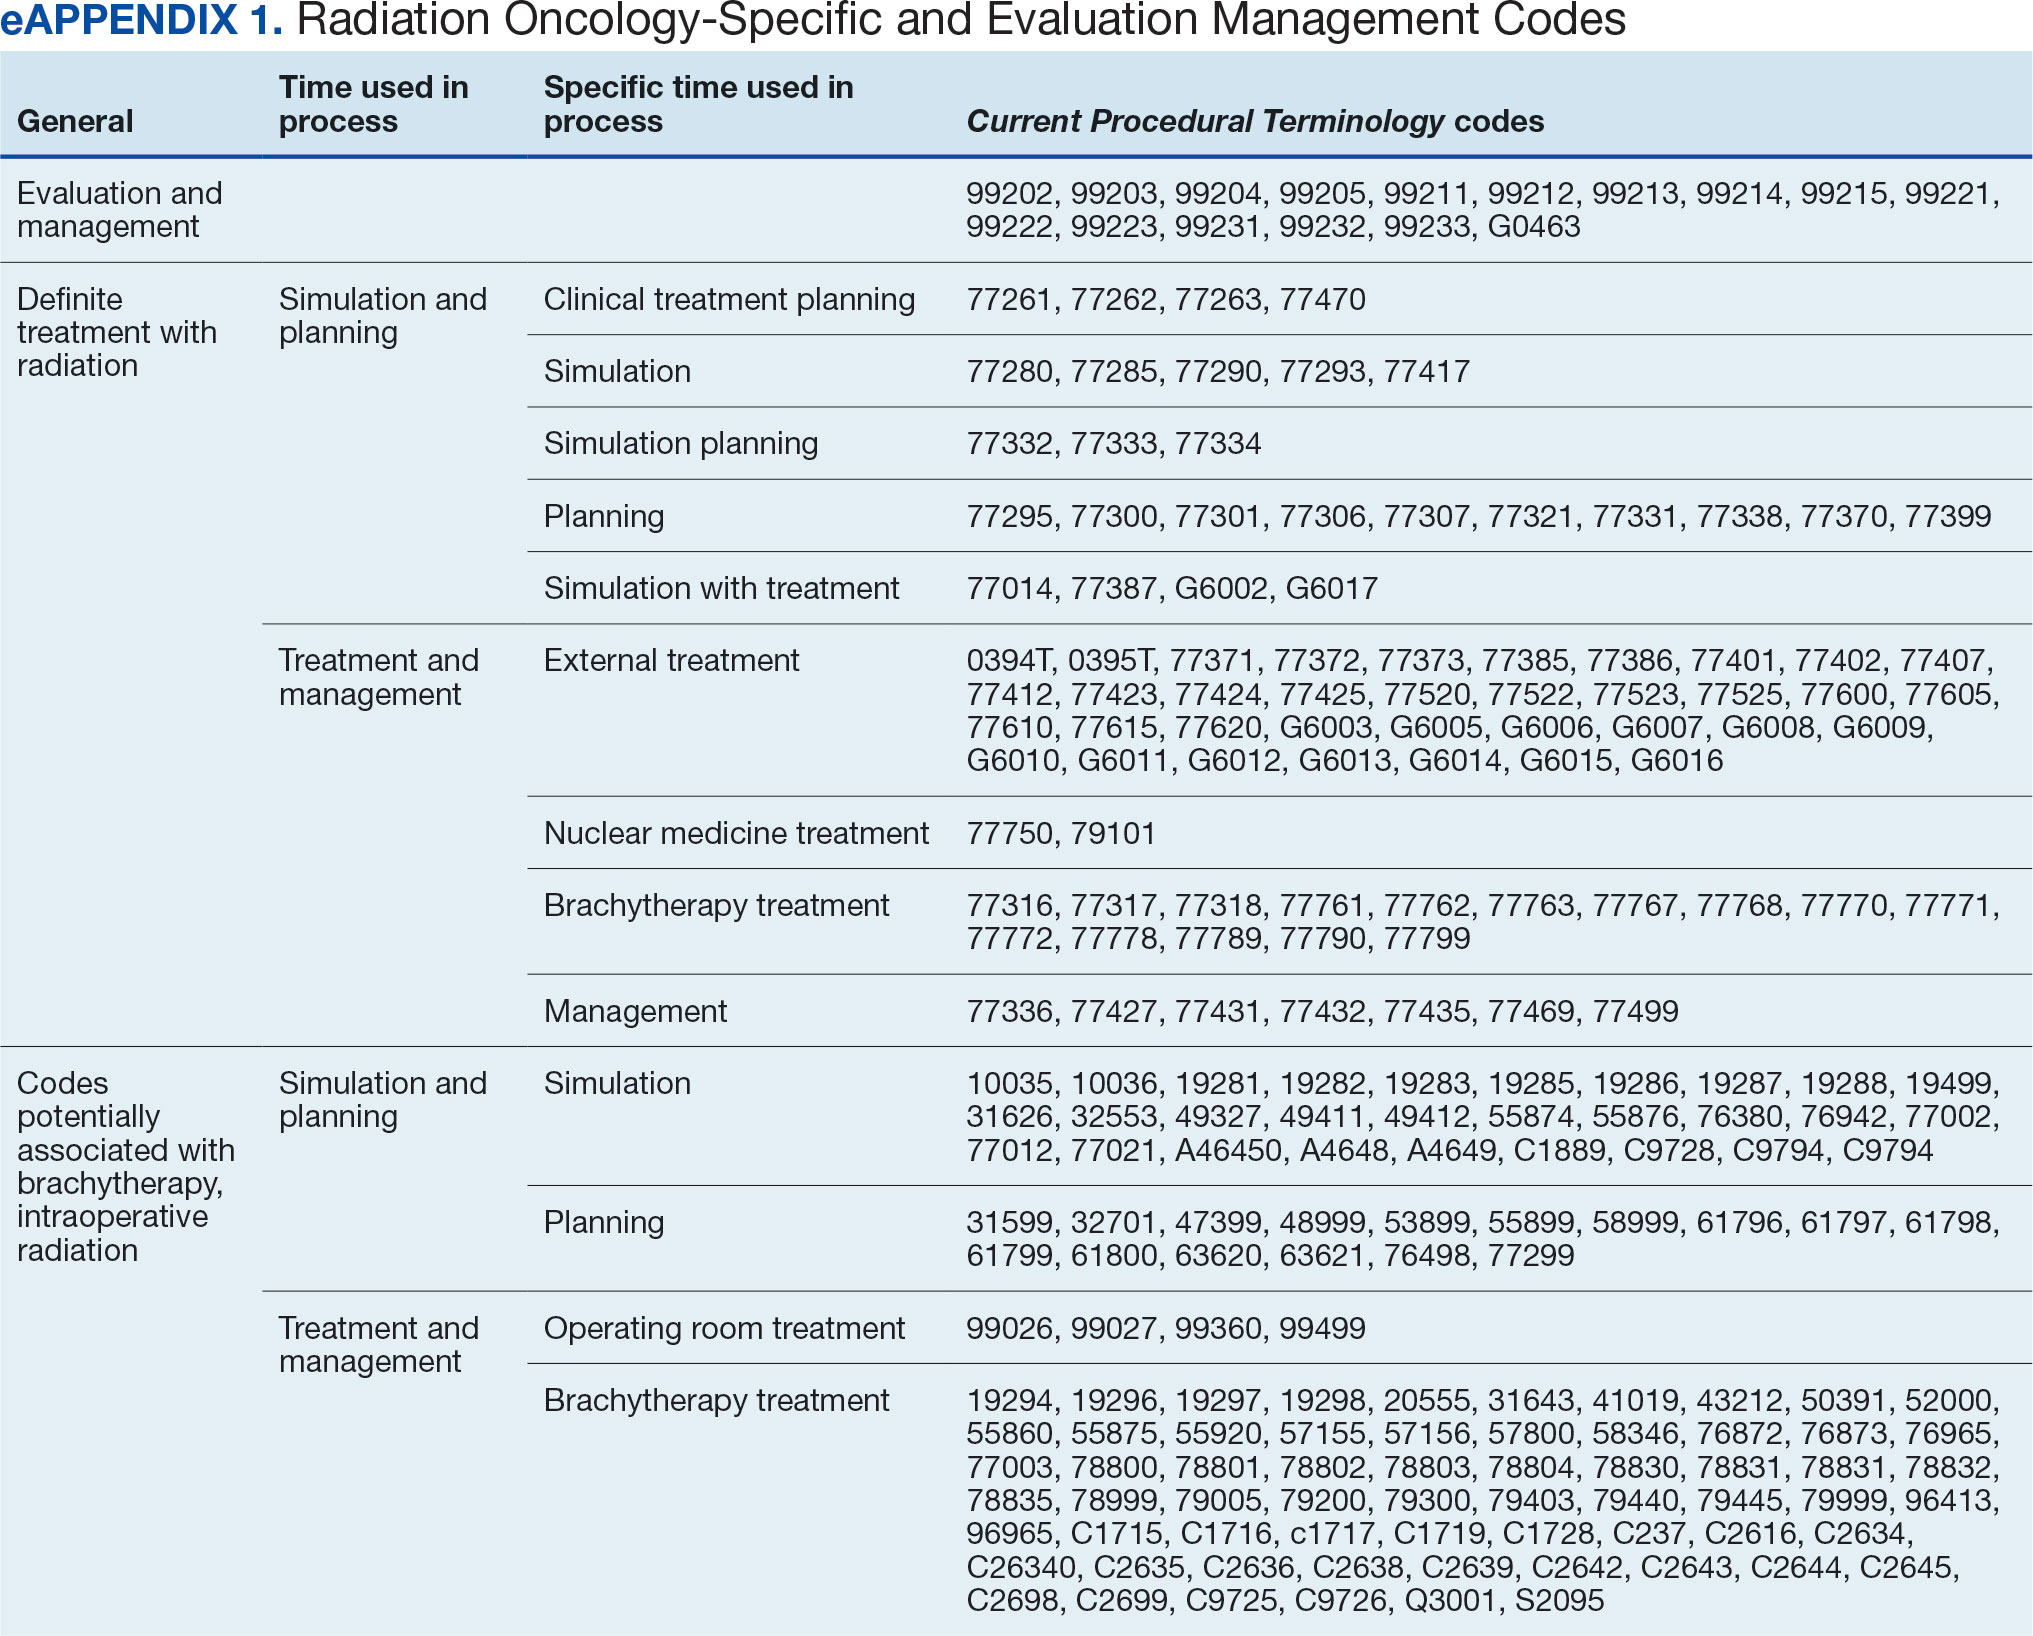
Radiation Oncology-Specific Costs
The VA Close to Me (CTM) program was used to find 84 specific radiation oncology CPT codes, nearly all within the 77.XXX or G6.XXX series, which included all radiation oncology-specific (ROS) codes (except visits accrued during consultation and return appointments). ROS costs are those that could not be performed by any other service and include procedures related to radiation oncology simulation, treatment planning, treatment delivery (with or without image guidance), and physician or physicist management. All ROS costs should be included in a patient’s radiation oncology SEOC. Other costs that may accompany operating room or brachytherapy administration did not follow a 77.XXX or G6.XXX pattern but were included in total radiation therapy operating costs.
Data obtained from AMCMS and CTM included patient name and identifier; CPT billed amount; CPT paid amount; dates of service; number of claims; International Classification of Diseases, Tenth Revision (ICD) diagnosis; and VA authorization numbers. Only CTM listed code modifiers. Only items categorized as paid were included in the analysis. Charges associated with discontinued consultations that had accrued costs also were included. Codes that were not directly related to ROS were separately characterized as other and further subcategorized.
Deep Dive Categorization
All scanned documents tagged to the community consultation were accessed and evaluated for completeness by a radiation oncologist (RS). The presence or absence of consultation notes and treatment summaries was evaluated based on necessity (ie, not needed for continuation of care or treatment was not given). In the absence of a specific completion summary or follow-up note detailing the treatment modality, number of fractions, and treatment sites, available documentation, including clinical notes and billing information, was used. Radical or curative therapies were identified as courses expected to eradicate disease, including stereotactic ablative radiotherapy to the brain, lung, liver, and other organs. Palliative therapies included whole-brain radiotherapy or other low-dose treatments. If the patient received the intended course, this was categorized as full. If incomplete, it was considered partial.
Billing Deviations
The complete document review allowed for close evaluation of paid therapy and identification of gaps in billing (eg, charges not found in extracted data that should have occurred) for external beam radiotherapy patients. Conversely, extra charges, such as an additional weekly treatment management charge (CPT code 77427), would be noted. Patients were expected to have the number of treatments specified in the summary, a clinical treatment planning code, and weekly treatment management notes from physicians and physicists every 5 fractions. Consultations and follow-up visits were expected to have 1 visit code; CPT codes 99205 and 99215, respectively, were used to estimate costs in their absence.
Costs were based on Medicare rates as of January 1 of the year in which they were accrued. 7-10 Duplicates were charges with the same code, date, billed quantity, and paid amounts for a given patient. These would always be considered erroneous. Medicare treatment costs for procedures such as intensity modulated radiotherapy (CPT code 77385 or 77386) are available on the Medicare website. When reviewing locality deviations for 77427, there was a maximum of 33% increase in Medicare rates. Therefore, for treatment codes, one would expect the range to be at least the Medicare rate and maximally 33% higher. These rates are negotiated with insurance companies, but this range was used for the purpose of reviewing and adjusting large data sets.
RESULTS
Since 2018, > 500 community care consults have been placed by radiation oncology for treatment in the community, with more following implementation of the VA MISSION Act. Use of radiation oncology community care services annually increased during the study period for this facility (Table 1, Figure 2). Of the 325 community care consults placed from October 1, 2021, to February 1, 2024, 248 radiation oncology SEOCs were recorded with charges for 181 patients (range, 1-5 SEOCs). Long drive time was the rationale for > 97% of patients directed to community care (Supplemental materials, available at doi:10.12788/fp.0585). Based on AMCMS data, $22.2 million was billed and $2.7 million was paid (20%) for 8747 CPT codes. Each community care interval cost the VA a median (range) of $5000 ($8-$168,000 (Figure 3).
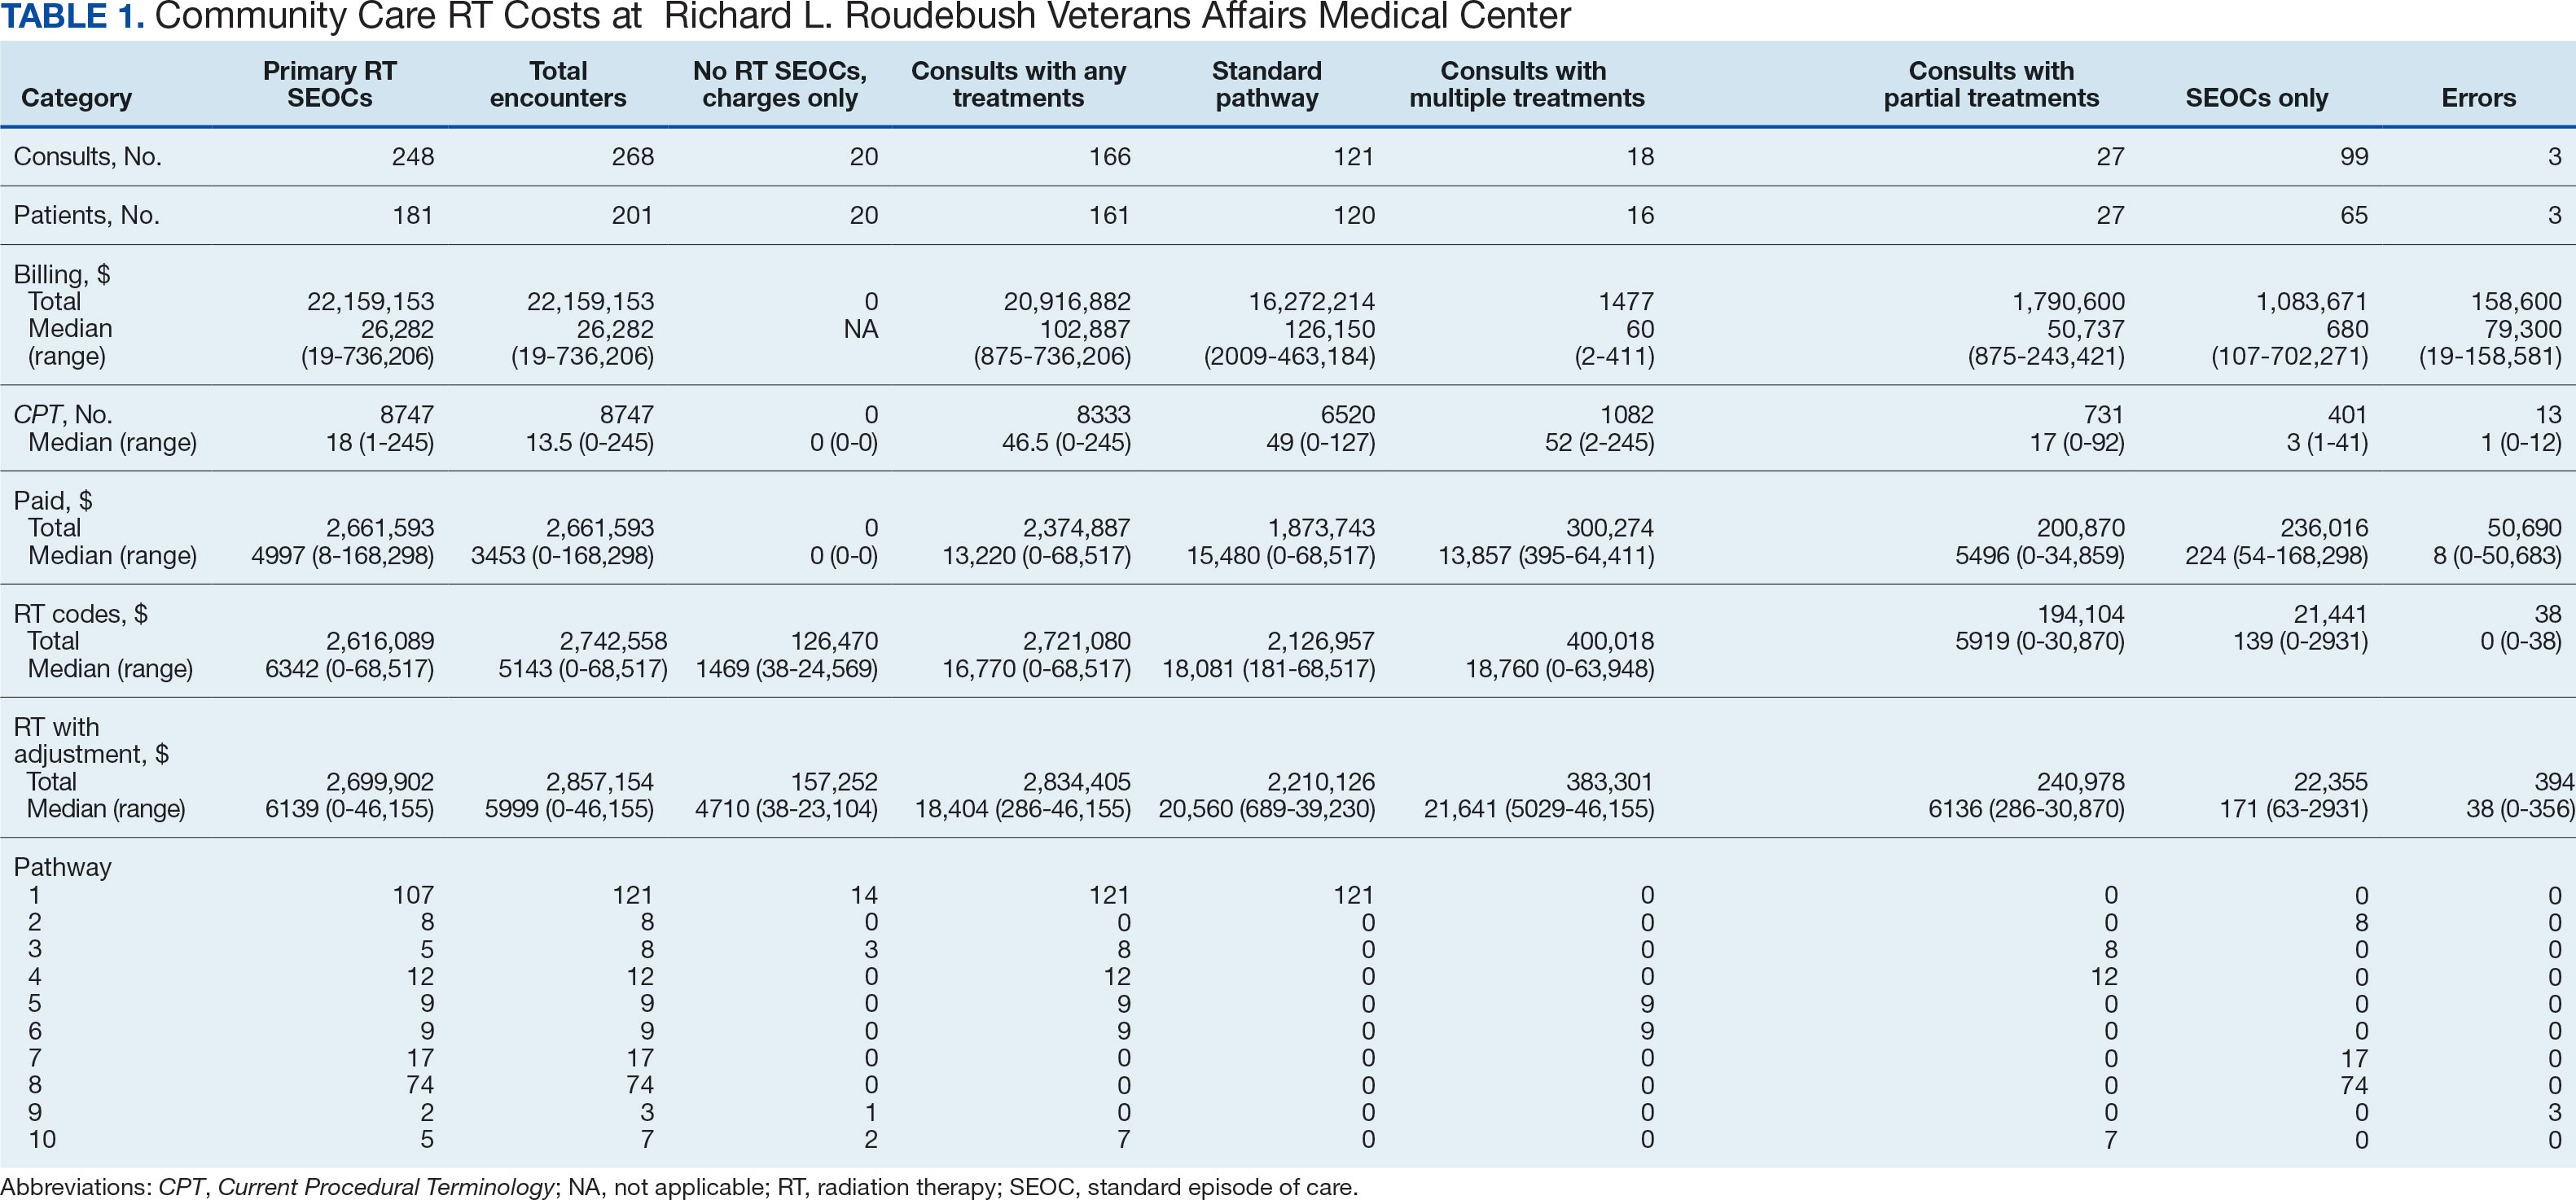
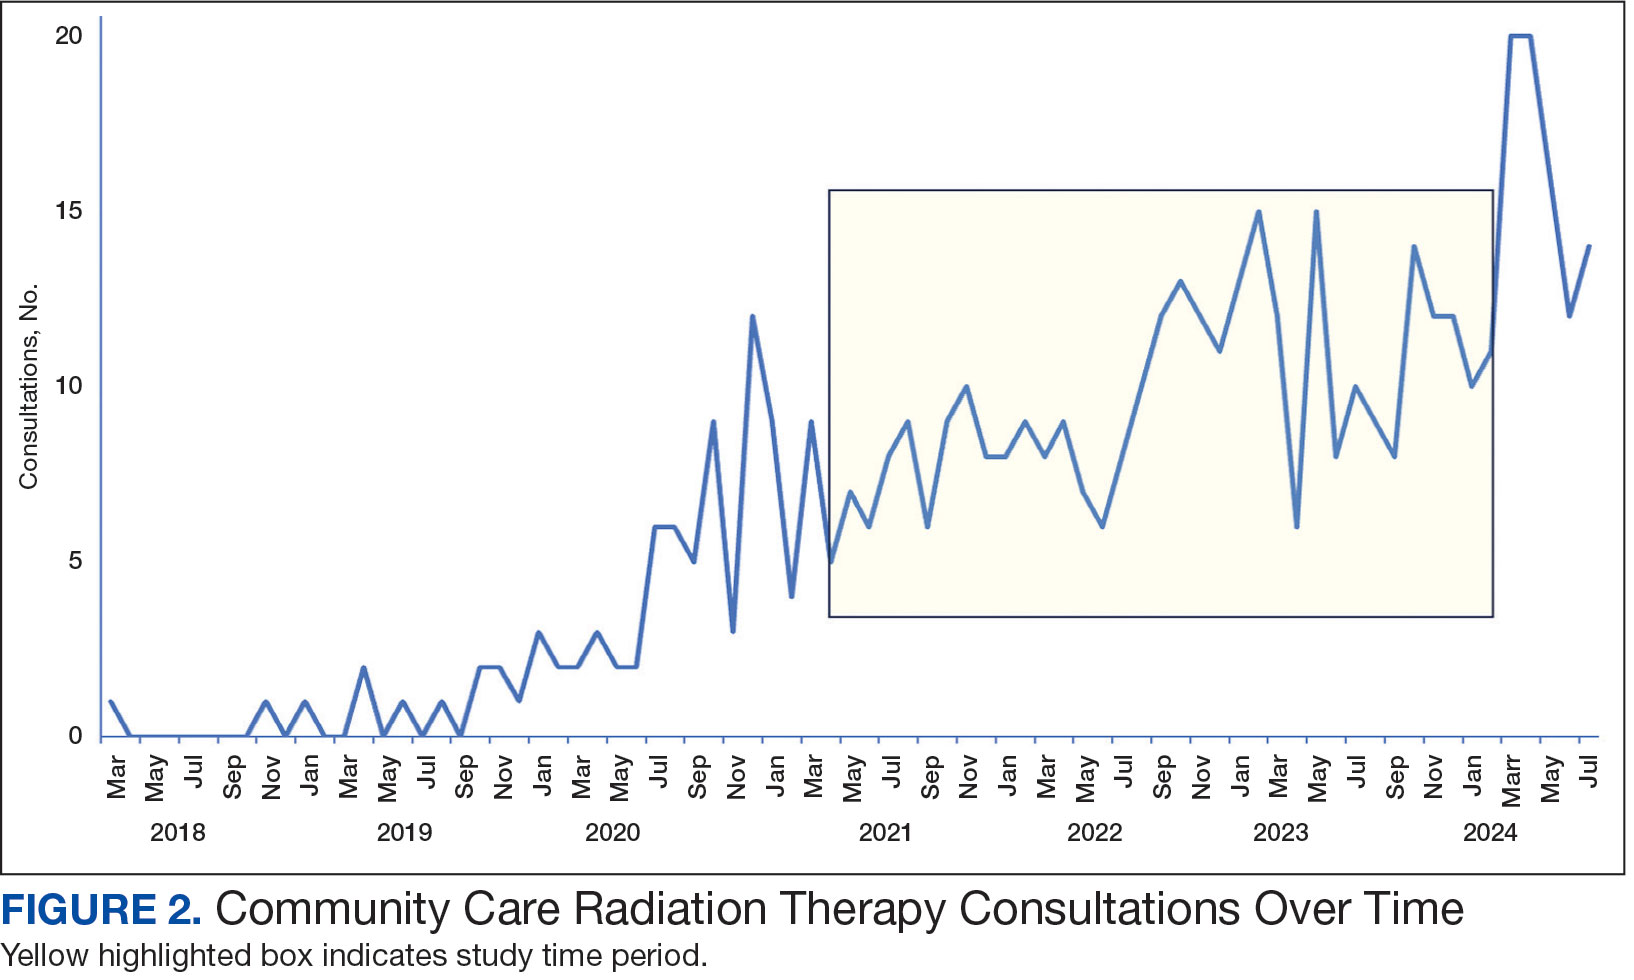
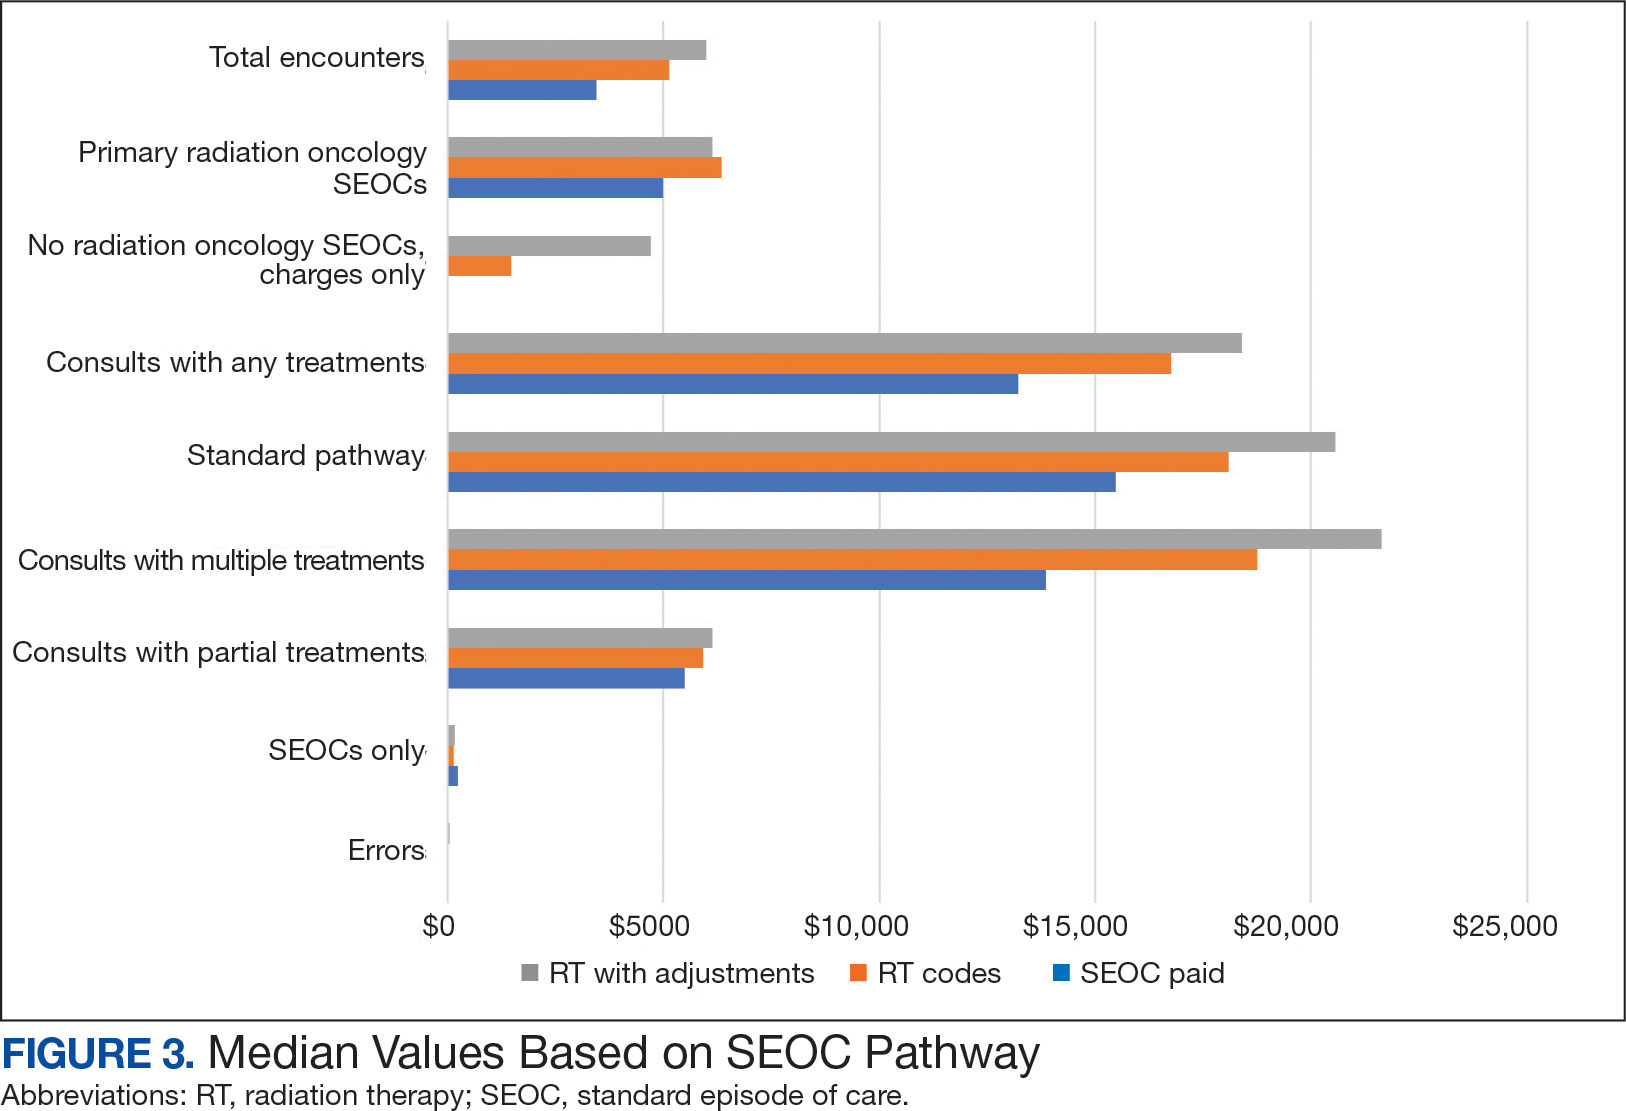
After reviewing ROS charges extracted from CTM, 20 additional patients had radiation oncology charges but did not have a radiation oncology SEOC for 268 episodes of care for 201 unique patients. In addition to the 20 patients who did not have a SEOC, 42 nonradiation oncology SEOCs contained 1148 radiation oncology codes, corresponding to almost $500,000 paid. Additional charges of about $416,000, which included biologic agents (eg, durvalumab, nivolumab), procedures (eg, mastectomies), and ambulance rides were inappropriately added to radiation oncology SEOCs.
While 77% of consultations were scanned into CPRS and JLV, only 54% of completion summaries were available with an estimated $115,000 in additional costs. The total adjusted costs was about $2.9 million. Almost 37% of SEOCs were for visits only. For the 166 SEOCs where patients received any radiation treatment or planning, the median cost was $18,000. Differences in SEOC pathways are shown in Figure 4. One hundred twenty-one SEOCs (45%) followed the standard pathway, with median SEOC costs of $15,500; when corrected for radiation-specific costs, the median cost increased to $18,000. When adjusted for billing irregularities, the median cost was $20,600. Ninety-nine SEOCs (37%) were for consultation/ follow-up visits only, with a median cost of $220. When omitting shared scans and nonradiation therapy costs and correcting for billing gaps, the median cost decreased to $170. A median of $9200 was paid per patient, with $12,900 for radiation therapy-specific costs and $13,300 adjusted for billing deviations. Narrowing to the 106 patients who received full, radical courses, the median SEOC, ROS, and adjusted radiation therapy costs increased to $19,400, $22,200, and $22,900, respectively (Table 2, Figure 5). Seventy-one SEOCs (26%) had already seen a radiation oncologist before the VA radiation oncology department was aware, and 49 SEOCs (18%) had retroactive approvals (Supplemental materials available at doi:10.12788/fp.0585).
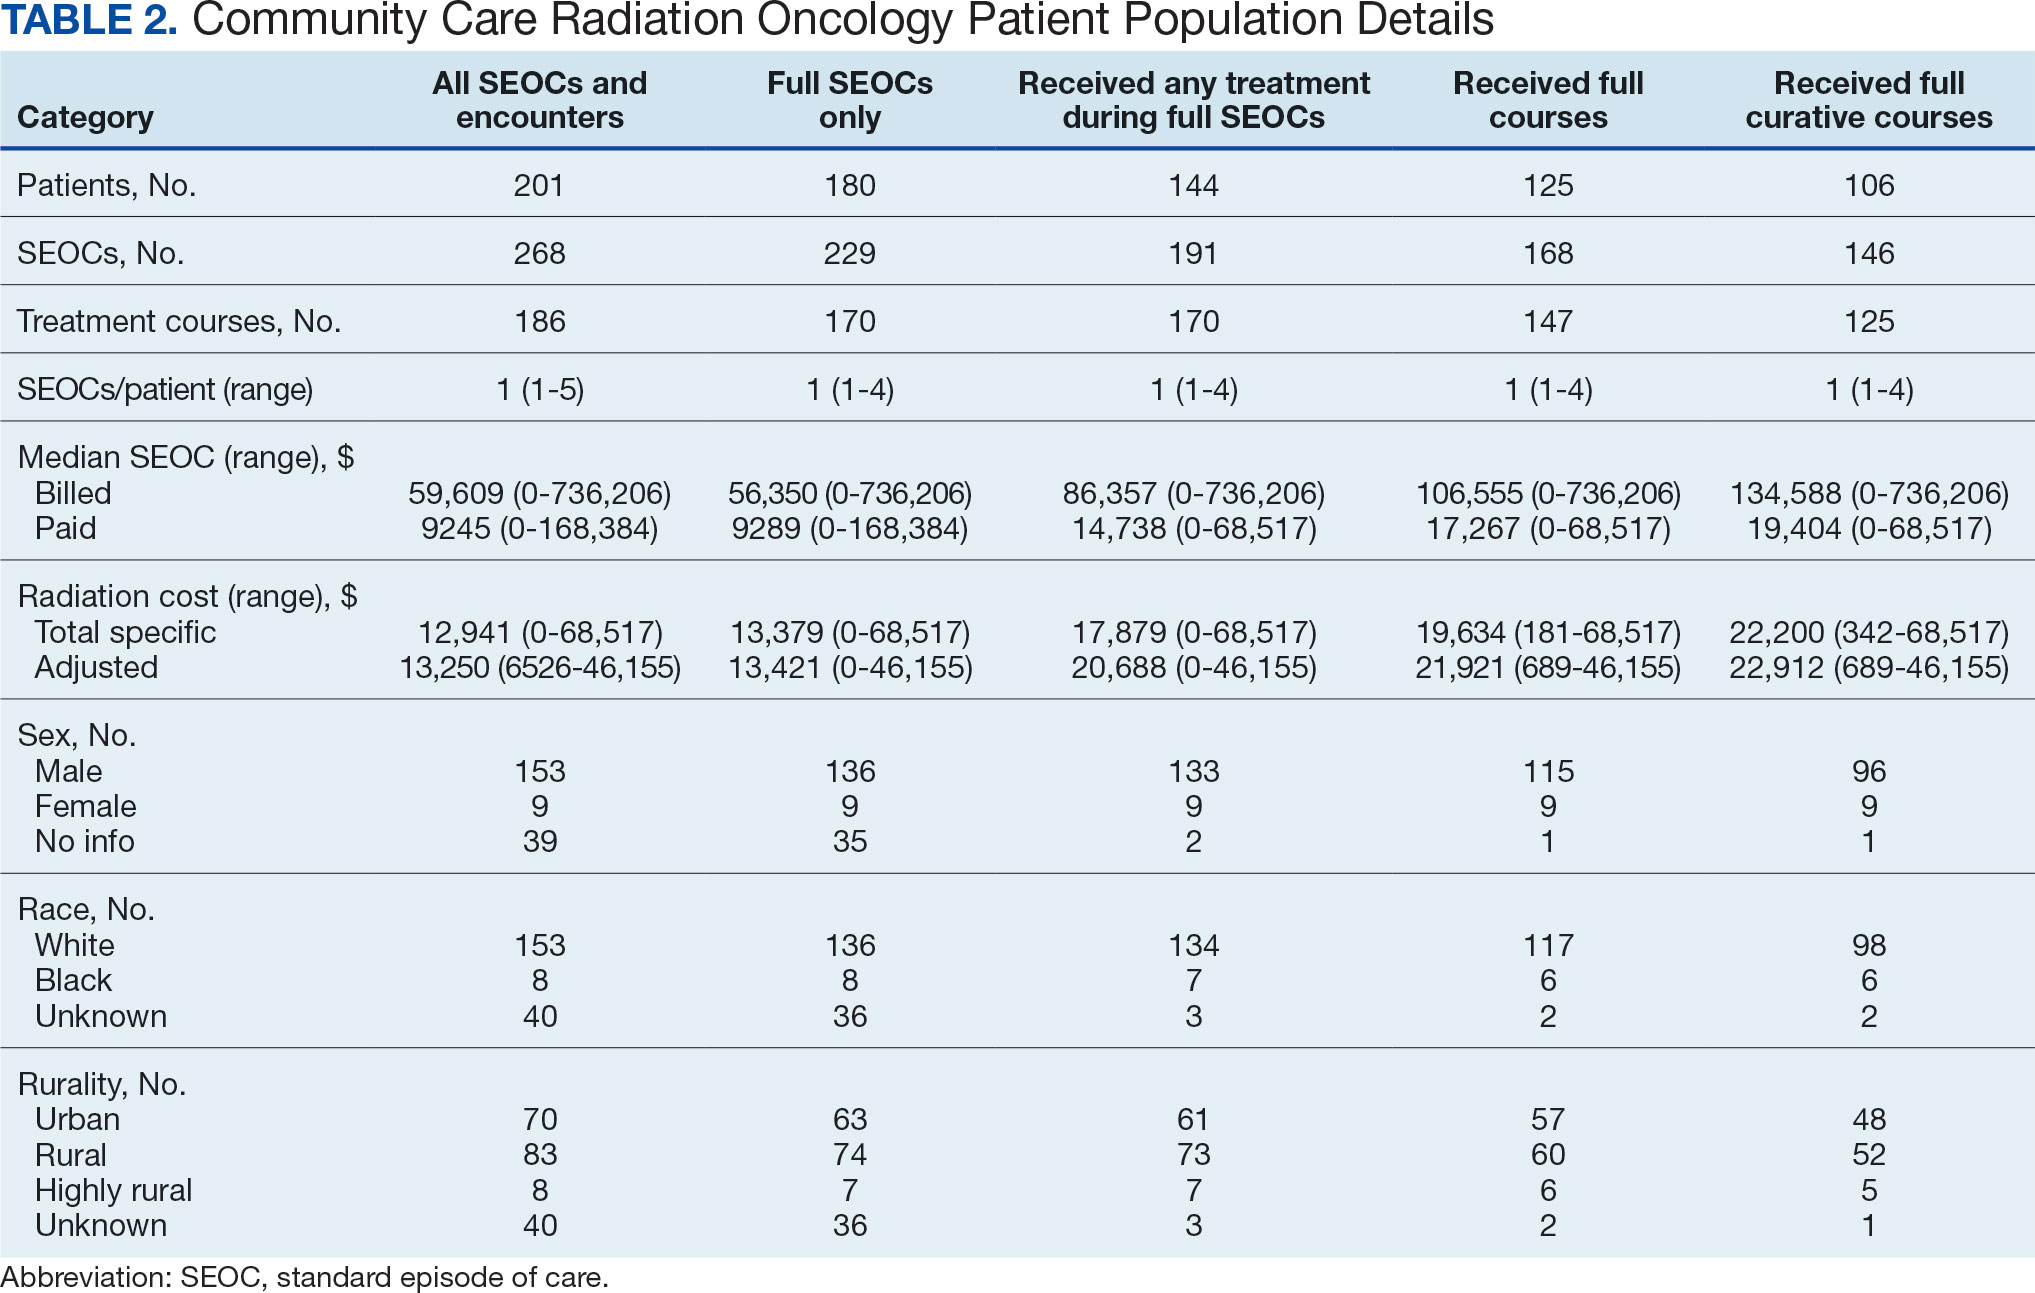
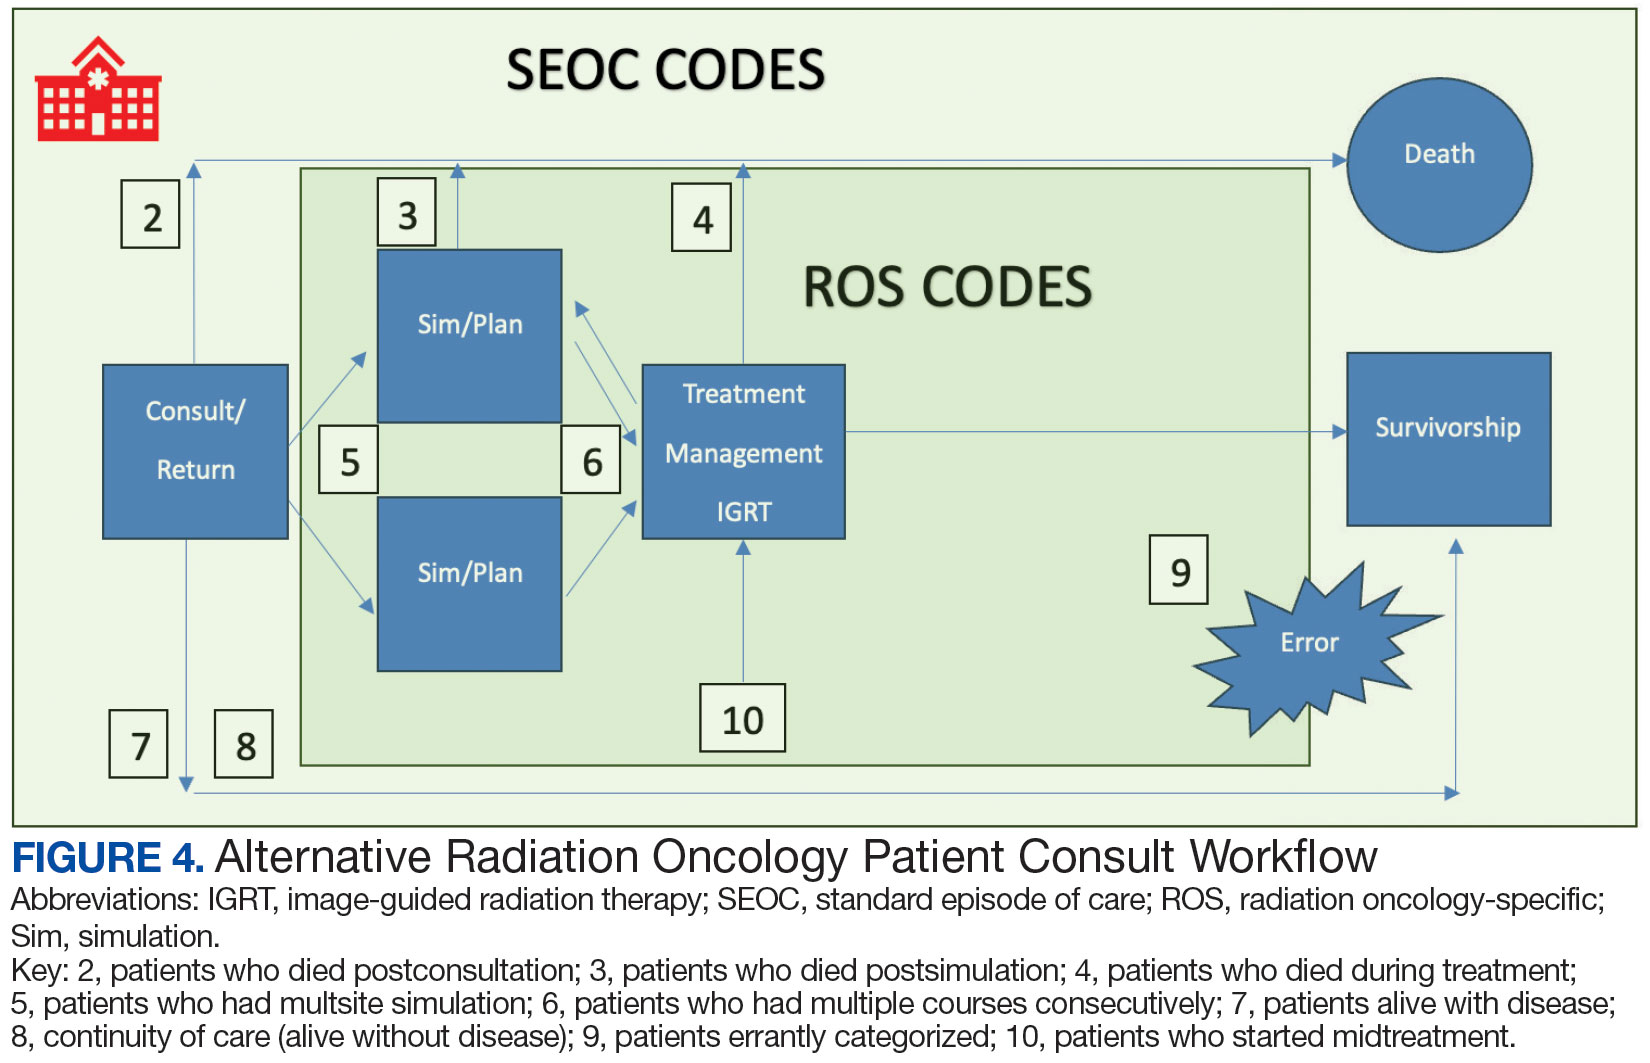
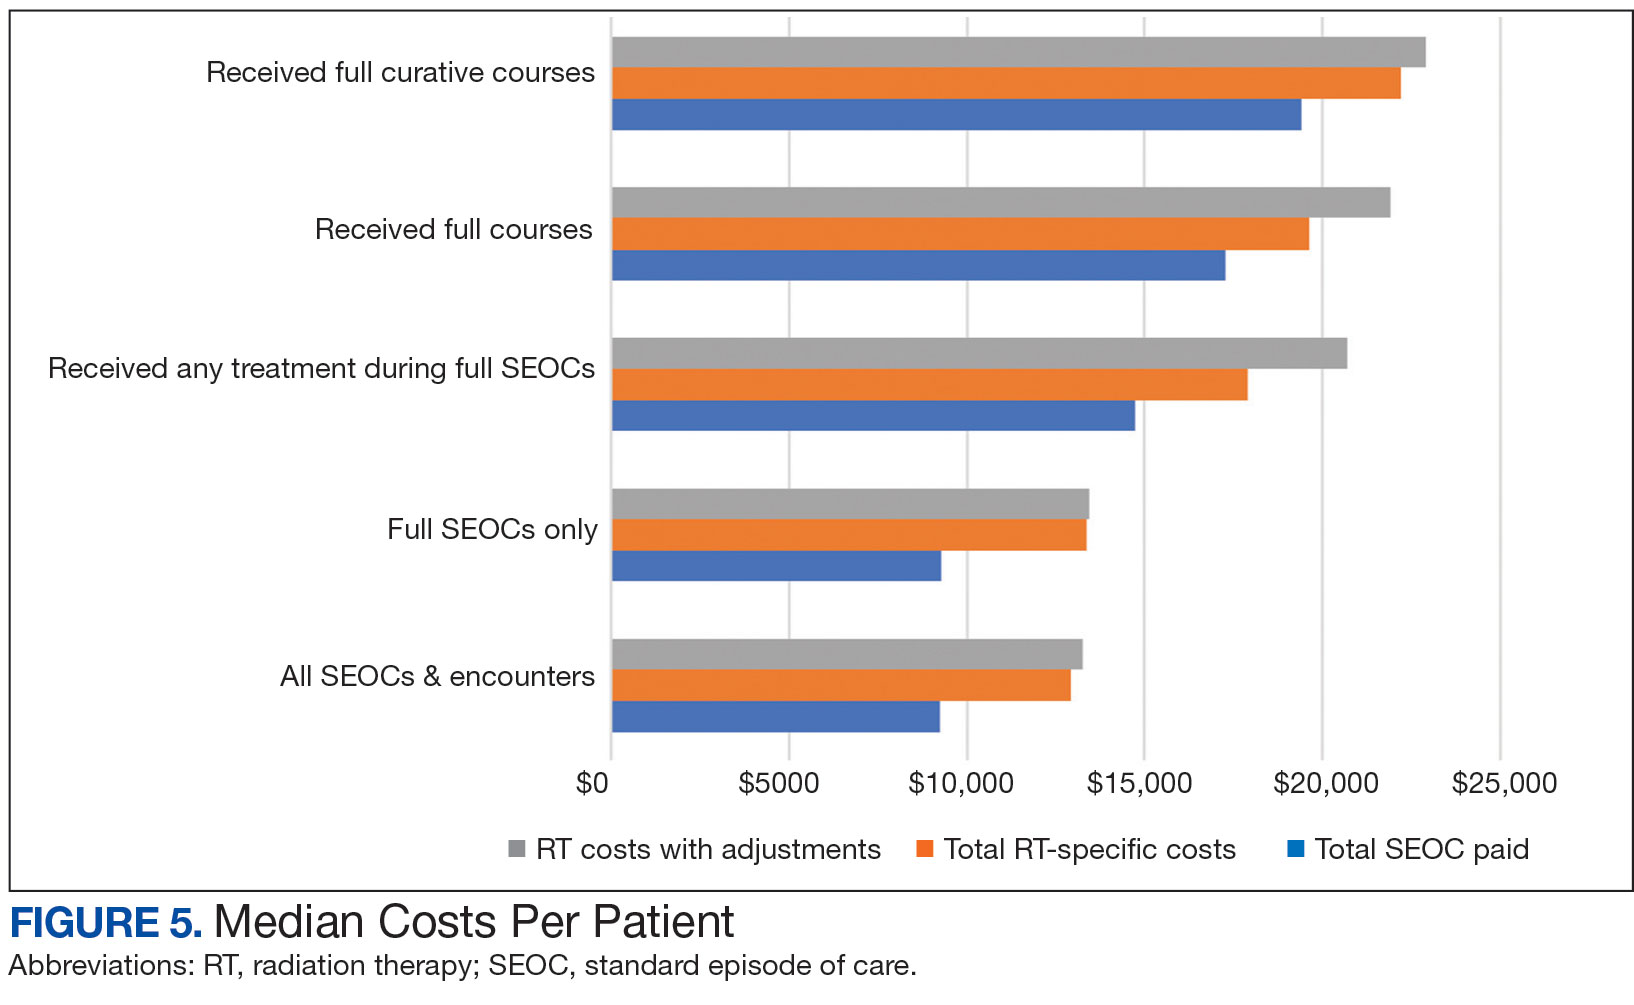
Every consultation charge was reviewed. A typical patient following the standard pathway (eAppendix 2, available at doi:10.12788/ fp.0585) exhibited a predictable pattern of consultation payment, simulation and planning, multiple radiation treatments interspersed with treatment management visits and a cone-down phase, and finishing with a follow-up visit. A less predictable case with excess CPT codes, gaps in charges, and an additional unexpected palliative course is shown in eAppendix 3 (available at doi:10.12788/fp.0585). Gaps occurred in 42% of SEOCs with missed bills costing as much as $12,000. For example, a patient with lung cancer had a treatment summary note for lung cancer after completion that showed the patient received 30 fractions of 2 Gy, a typical course. Only 10 treatment codes and 3 of 6 weekly treatment management codes were available. There was a gap of 20 volumetric modulated arc therapy treatments, 3 physics weekly status checks, 3 physician managements notes, and a computed tomography simulation charge.
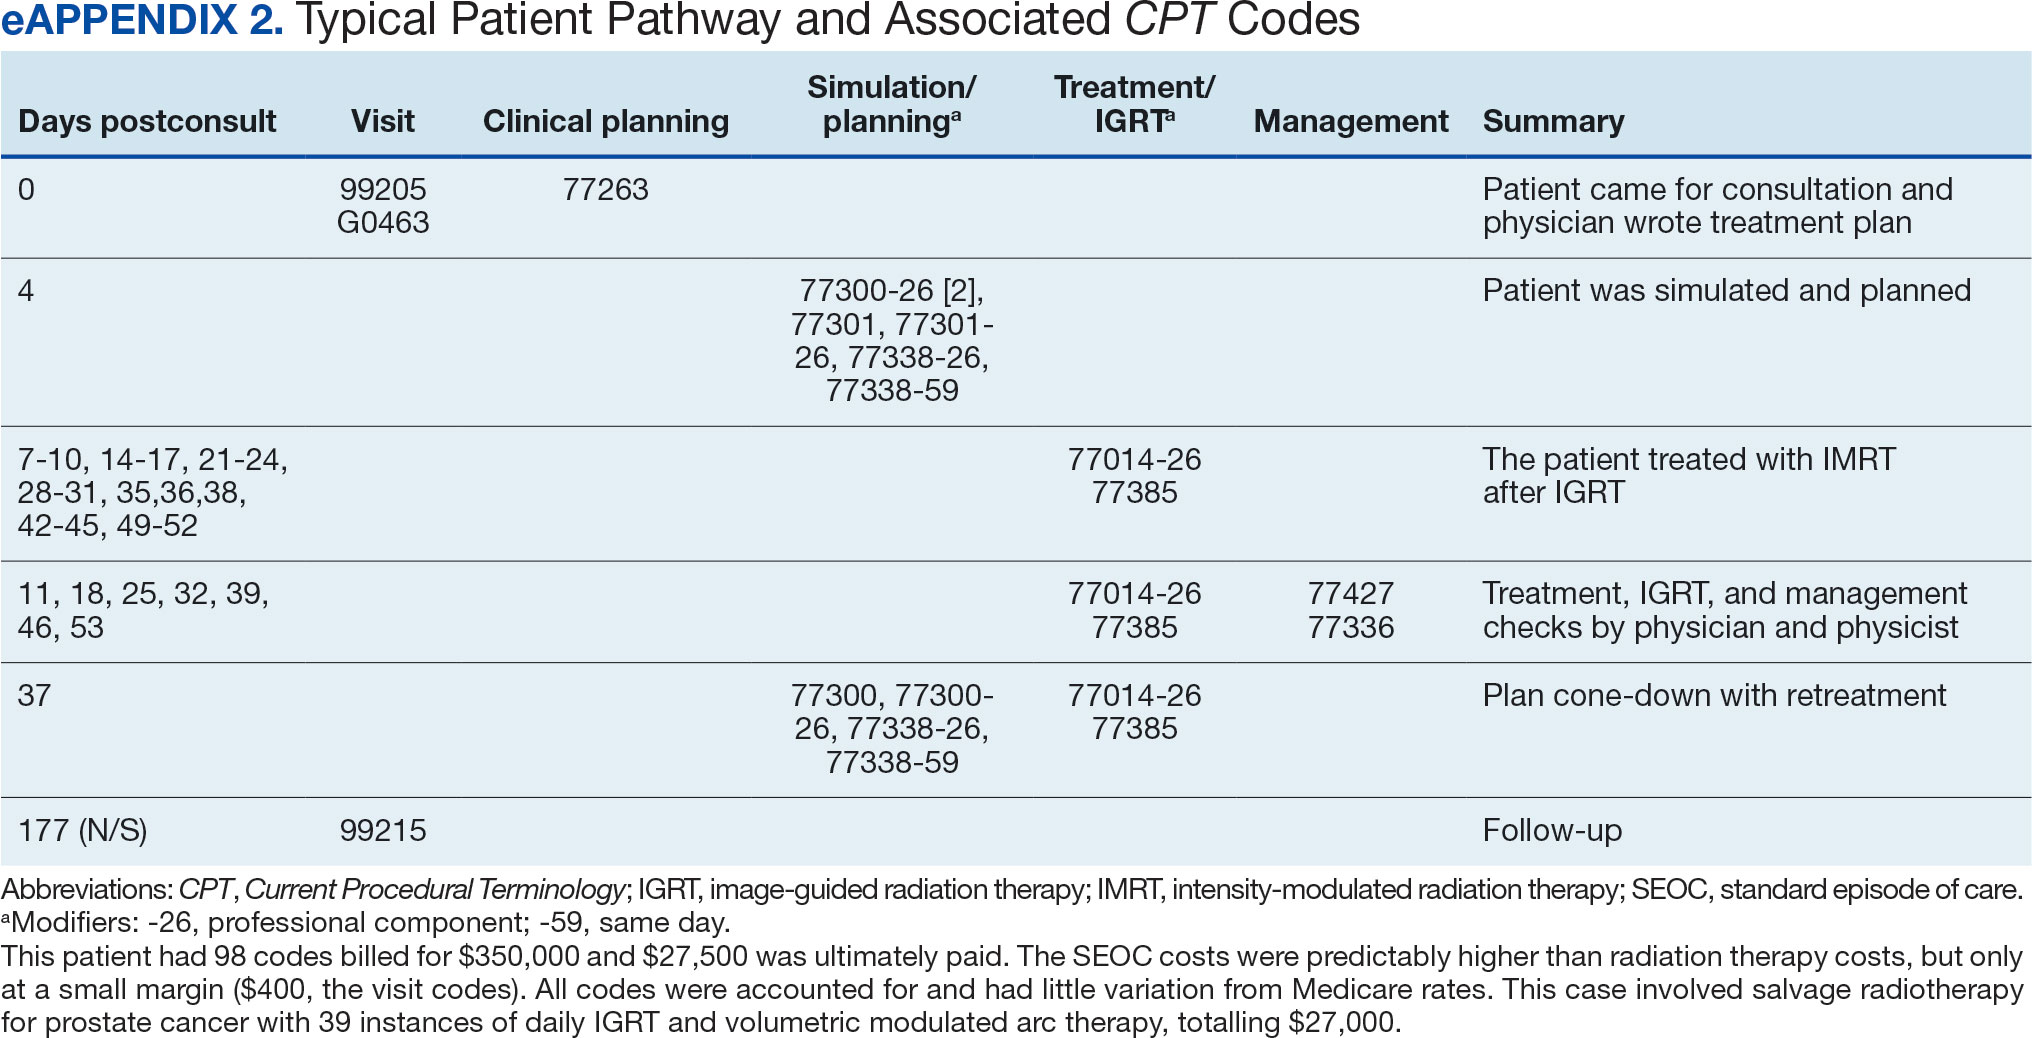

Between AMCMS and CTM, 10,005 CPT codes were evaluated; 1255 (12.5%) were unique to AMCMS (either related to the radiation oncology course, such as Evaluation and Management CPT codes or “other” unrelated codes) while 1158 (11.6%) were unique to CTM. Of the 7592 CPT codes shared between AMCMS and CTM, there was a discrepancy in 135 (1.8%); all were duplicates (CTM showed double payment while AMCMS showed $0 paid). The total CPT code costs came to $3.2 million with $560,000 unique to SEOCs and $500,000 unique to CTM. Treatment codes were the most common (33%) as shown in Table 3 and accounted for 55% of the cost ($1.8 million). About 700 CPT codes were considered “other,” typically for biologic therapeutic agents (Table 4 and eAppendix 4, available at doi:10.12788/fp.0585).
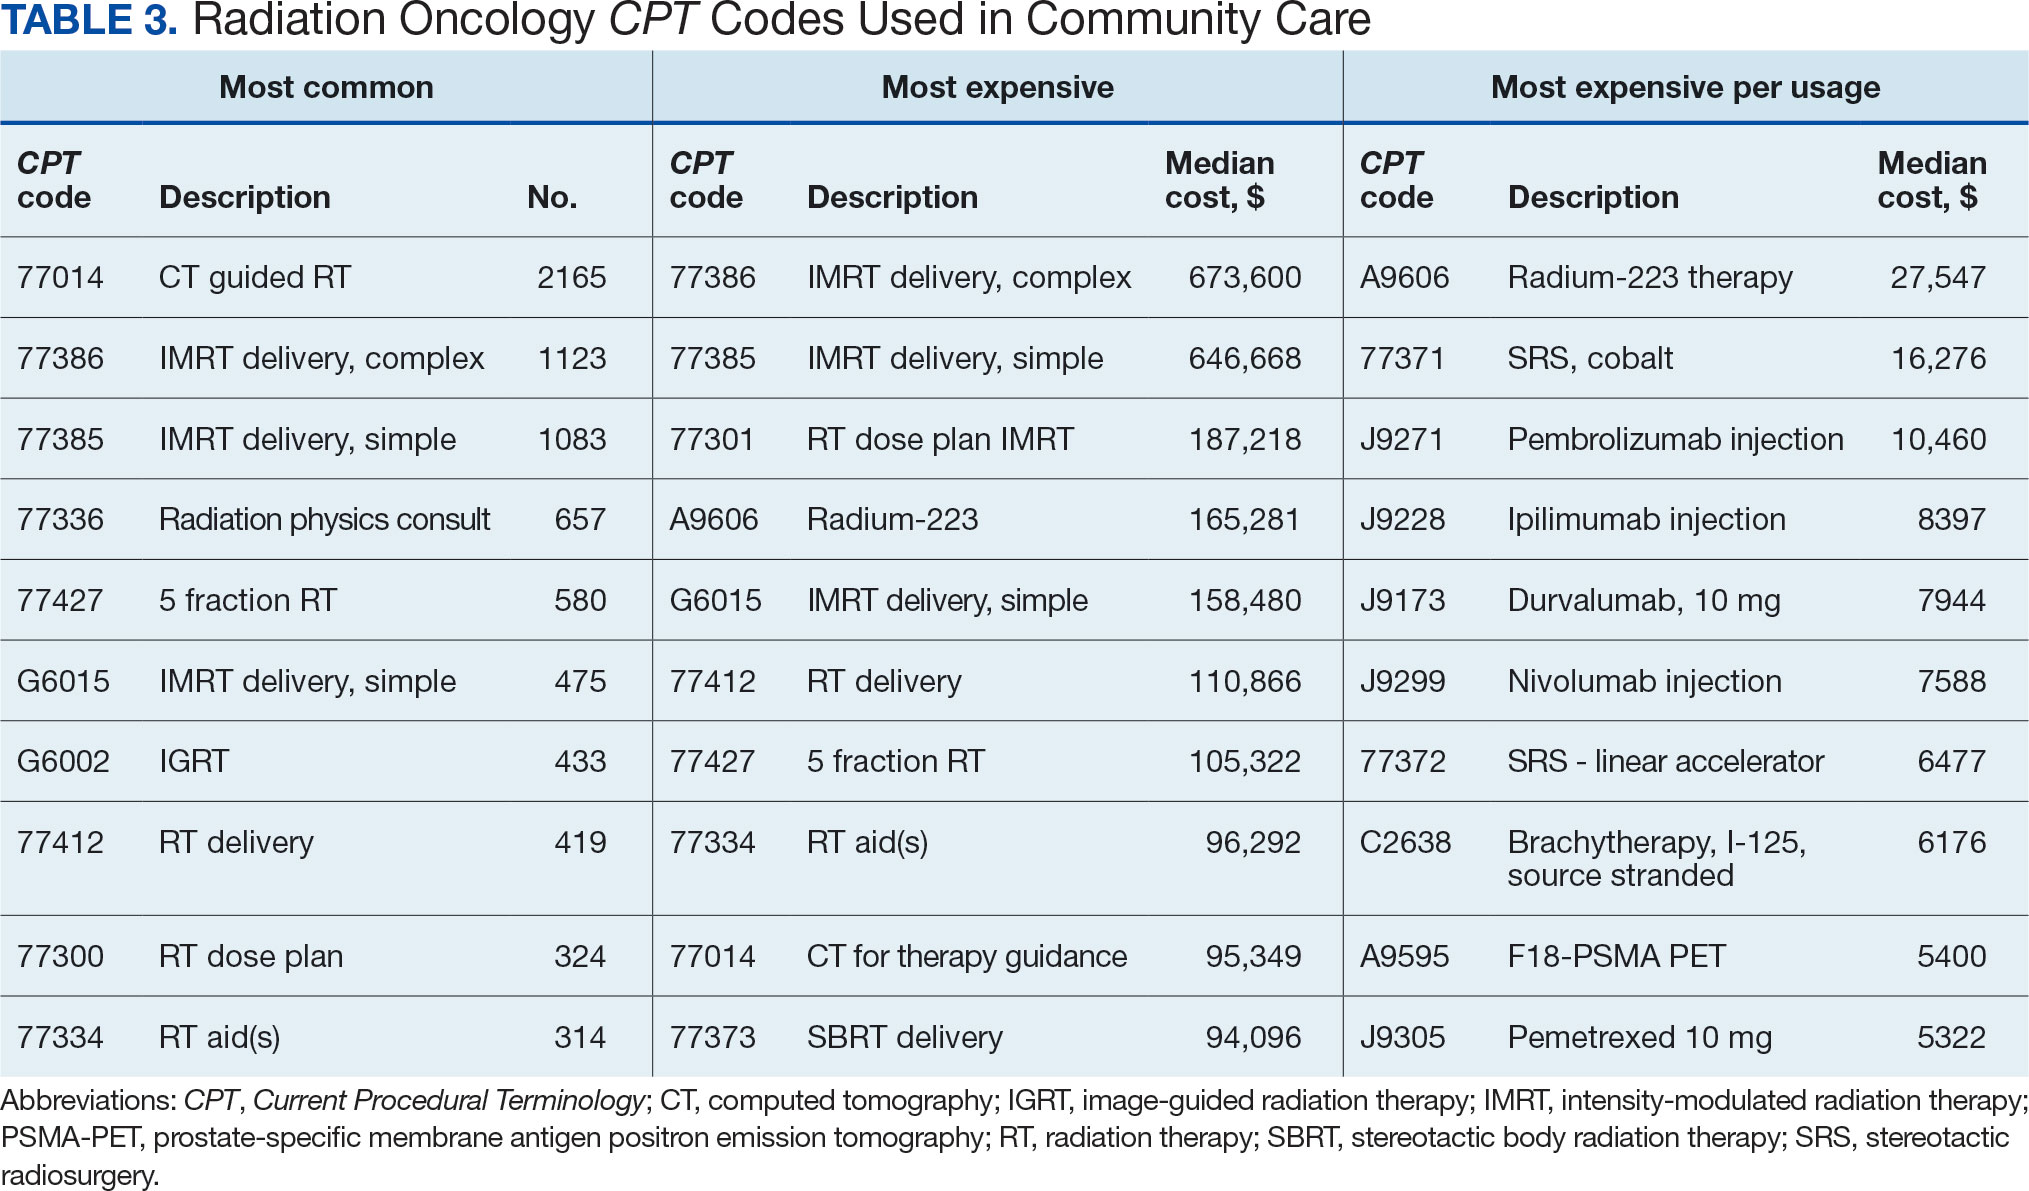
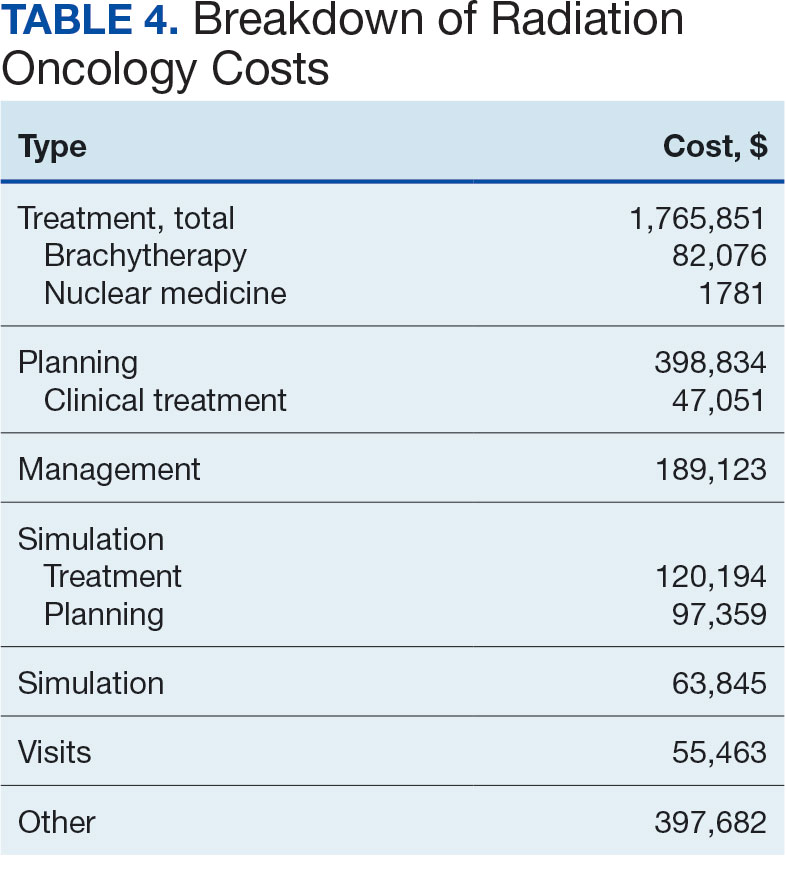

DISCUSSION
The current method of reporting radiation oncology costs used by VA is insufficient and misleading. Better data are needed to summarize purchased care costs to guide decisions about community care at the VA. Investigations into whether the extra costs for quality care (ie, expensive capital equipment, specialized staff, mandatory accreditations) are worthwhile if omitted at other facilities patients choose for their health care needs. No study has defined specialty care-specific costs by evaluating billing receipts from the CDW to answer the question. Kenamond et al highlight the need for radiation oncology for rural patients.11 Drive time was cited as the reason for community care referral for 97% of veterans, many of whom lived in rural locations. Of patients with rurality information who enrolled in community care, 57% came from rural or highly rural counties, and this ratio held for those who received full curative therapies. An executive administrator relying on AMCMS reports would see a median SEOC cost of $5000, but without ROS knowledge in coding, the administrator would miss many additional costs. For example, 2 patients who each had 5 SEOCs during the evaluated period, incurred a total cost of only $1800.
Additionally, an administrator could include miscategorized costs with significant ramifications. The 2 most expensive SEOCs were not typical radiation oncology treatments. A patient undergoing radium-223 dichloride therapy incurred charges exceeding $165,000, contributing disproportionately to the overall median cost analysis; this would normally be administered by the nuclear medicine department. Immunotherapy and chemotherapy are uniformly overseen by medical oncology services, but drug administration codes were still found in radiation oncology SEOCs. A patient (whose SEOC was discontinued but accrued charges) had an electrocardiogram interpretation for $8 as the SEOC cost; 3 other SEOCs continued to incur costs after being discontinued. There were 24 empty SEOCs for patients that had consults to the community, and 2 had notes stating treatment had been delivered yet there was no ROS costs or SEOC costs. Of the 268 encounters, 43% had some sort of billing irregularities (ie, missing treatment costs) that would be unlikely for a private practice to omit; it would be much more likely that the CDW miscategorized the payment despite confirmation of the 2 retrieval systems.
It would be inadvisable to make staffing decisions or forecast costs based on current SEOC reports without specialized curation. A simple yet effective improvement to the cost attribution process would be to restrict the analysis to encounters containing primary radiation treatment codes. This targeted approach allows more accurate identification of patients actively receiving radiation oncology treatment, while excluding those seen solely for consultations or follow-up visits. Implementing this refinement leads to a substantial increase in the median payment—from $5000 to $13,000—without requiring additional coding or data processing, thereby enhancing the accuracy of cost estimates with minimal effort.
Clarifying radiation oncology service costs requires addressing the time frame and services included, given laxity and interpretation of the SEOCs. VA community care departments have streamlined the reimbursement process at the expense of medical cost organization and accuracy; 86% of VA practitioners reported that ≥ 1 potential community health care partners had refused to work with the VA because of payment delays.12 Payments are contingent on correspondence from outside practices for community work. For radiation oncology, this includes the consultation but also critical radiation-related details of treatment, which were omitted nearly half the time. SEOC approval forms have many costly laboratory tests, imaging, and procedures that have little to do with radiation oncology cancer treatments but may be used in the workup and staging process; this creates noise when calculating radiation oncology fiscal cost.
The presumption that an episode of care equates to a completed radiation therapy course is incorrect; this occurs less than half of the time. An episode often refers to a return visit, or conversely, multiple treatment courses. As the patients’ medical homes are their VHA primary care practitioners, it would be particularly challenging to care for the patients without full treatment information, especially if adverse effects from therapy were to arise. As a tertiary specialty, radiation oncology does not seek out patients and are sent consultations from medical oncology, surgical, and medical oncologic specialties. Timesensitive processes such as workup, staging, and diagnosis often occur in parallel. This analysis revealed that patients see outside radiation oncologists prior to the VA. There are ≥ 100 patients who had radiation oncology codes without a radiation oncology SEOC or community care consultation, and in many cases, the consultation was placed after the patient was seen.
Given the lack of uniformity and standardization of patient traffic, the typical and expected pathways were insufficient to find the costs. Too many opportunities for errors and incorrect categorization of costs meant a different method would be necessary. Starting at the inception of the community care consult, only 1 diagnosis code can be entered. For patients with multiple diagnoses, one would not be able to tell what was treated without chart access. Radiation oncology consults come from primary and specialty care practitioners and nurses throughout the VA. Oftentimes, the referral would be solicited by the community radiation oncology clinic, diagnosing community specialty (ie, urology for a patient with prostate cancer), or indirectly from the patient through primary care. Many cases were retroactively approved as the veteran had already been consulted by the community care radiation oncologist. If the patient is drive-time eligible, it would be unlikely that they would leave and choose to return to the VA. There is no way for a facility VA service chief or administrator to mitigate VA community costs of care, especially as shown by the miscategorization of several codes. Database challenges exacerbate the issue: 1 patient changed her first and last name during this time frame, and 2 patients had the same name but different social security numbers. In order to strictly find costs between 2 discrete timepoints, 39 (15%) SEOCs were split and incomplete, and 6 SEOCs contained charges for 2 different patients. This was corrected, and all inadvertent charges were cancelled. Only 1 ICD code is allowed per community care consultation, so an investigation is required to find costs for patients with multiple sites of disease. Additionally, 5 of the patients marked for drive time were actually patients who received Gamma Knife and brachytherapy, services not available at the VA.
Hanks et al first attempted to calculate cost of radiation oncology services. External beam prostate cancer radiotherapy at 3 suburban California centers cost $6750 ($20,503 inflation adjusted) per patient before October 1984 and $5600 ($17,010 inflation adjusted) afterwards.13 According to the American Society for Radiation Oncology, Advocacy Radiation Oncology Case Rate Program Curative radiation courses should cost $20,000 to $30,000 and palliative courses should cost $10,000 to $15,000. These costs are consistent with totals demonstrated in this analysis and similar to the inflation-adjusted Hanks et al figures. Preliminary findings suggest that radiation treatment constituted more than half of the total expenditures, with a notable $4 million increase in adjusted cost compared to the Medicare rates, indicating significant variation. Direct comparisons with Medicaid or commercial payer rates remain unexplored.
Future Directions
During the study period, 201 patients received 186 courses of radiation therapy in the community, while 1014 patients were treated in-house for a total of 833 courses. A forthcoming analysis will directly compare the cost of in-house care with that of communitybased treatment, specifically breaking down expenditure differences by diagnosis. Future research should investigate strategies to align reimbursement with quality metrics, including the potential role of tertiary accreditation in incentivizing high-value care. Additional work is also warranted to assess patient out-ofpocket expenses across care settings and to benchmark VA reimbursement against Medicare, Medicaid, and private insurance rates. In any case, with the increasing possibility of fewer fractions for treatments such as stereotactic radiotherapy or palliative care therapy, there is a clear financial incentive to treat as frequently as allowed despite equal clinical outcomes.
CONCLUSIONS
Veterans increasingly choose to receive care closer to home if the option is available. In the VA iron triangle, cost comes at the expense of access but quantifying this has proved elusive in the cost accounting model currently used at the VA.1 The inclusion of all charges loosely associated with SEOCs significantly impairs the ability to conduct meaningful cost analyses. The current VA methodology not only introduces substantial noise into the data but also leads to a marked underestimation of the true cost of care delivered in community settings. Such misrepresentation risks driving policy decisions that could inappropriately reduce or eliminate in-house radiation oncology services. Categorizing costs effectively in the VA could assist in making managerial and administrative decisions and would prevent damaging service lines based on misleading or incorrect data. A system which differentiates between patients who have received any treatment codes vs those who have not would increase accuracy.
- Kissick W. Medicine’s Dilemmas: Infinite Needs Versus Finite Resources. 1st ed. Yale University Press; 1994.
- Albanese AP, Bope ET, Sanders KM, Bowman M. The VA MISSION Act of 2018: a potential game changer for rural GME expansion and veteran health care. J Rural Health. 2020;36(1):133-136. doi:10.1111/jrh.12360
- Office of Management and Budget (US). Budget of the United States Government, Fiscal Year 2025. Washington, DC: US Government Publishing Office; 2024. Available from: US Department of Veterans Affairs FY 2025 Budget Submission: Budget in Brief.
- US Department of Veterans Affairs. Veteran care claims. Accessed April 3, 2025. https://www.va.gov/COMMUNITYCARE/revenue-ops/Veteran-Care-Claims.asp
- US Centers for Medicare and Medicaid Services. Accessed April 3, 2025. Procedure price lookup https://www.medicare.gov/procedure-price-lookup
- US Department of Veterans Affairs. WellHive -Enterprise. Accessed April 3, 2025. https://department.va.gov/privacy/wp-content/uploads/sites/5/2023/05/FY23WellHiveEnterprisePIA.pdf
- US Centers for Medicare and Medicaid Services. RVU21a physician fee schedule, January 2021 release. Accessed April 3, 2025. https://www.cms.gov/medicaremedicare-fee-service-paymentphysicianfeeschedpfs-relative-value-files/rvu21a
- US Centers for Medicare and Medicaid Services. RVU22a physician fee schedule, January 2022 release. Accessed April 3, 2025. https://www.cms.gov/medicaremedicare-fee-service-paymentphysicianfeeschedpfs-relative-value-files/rvu22a
- US Centers for Medicare and Medicaid Services. RVU23a physician fee schedule, January 2023 release. Accessed April 3, 2025. https://www.cms.gov/medicare/medicare-fee-service-payment/physicianfeesched/pfs-relative-value-files/rvu23a
- US Centers for Medicare and Medicaid Services. RVU23a Medicare Physician Fee Schedule rates effective January 1, 2024, through March 8, 2024. Accessed on April 3, 2025. https://www.cms.gov/medicare/payment/fee-schedules/physician/pfs-relative-value-files/rvu24a
- Kenamond MC, Mourad WF, Randall ME, Kaushal A. No oncology patient left behind: challenges and solutions in rural radiation oncology. Lancet Reg Health Am. 2022;13:100289. doi:10.1016/j.lana.2022.100289
- Mattocks KM, Kroll-Desrosiers A, Kinney R, Elwy AR, Cunningham KJ, Mengeling MA. Understanding VA’s use of and relationships with community care providers under the MISSION Act. Med Care. 2021;59(Suppl 3):S252-S258. doi:10.1097/MLR.0000000000001545
- Hanks GE, Dunlap K. A comparison of the cost of various treatment methods for early cancer of the prostate. Int J Radiat Oncol Biol Phys. 1986;12(10):1879-1881. doi:10.1016/0360-3016(86)90334-2
- American Society of Radiation Oncology. Radiation oncology case rate program (ROCR). Accessed April 3, 2025. https://www.astro.org/advocacy/key-issues-8f3e5a3b76643265ee93287d79c4fc40/rocr
William Kissick’s description of health care’s iron triangle in 1994 still resonates. Access, quality, and cost will always come at the expense of the others.1 In 2018, Congress passed the VA MISSION Act, allowing patients to pursue community care options for extended waits (> 28 days) or longer distance drive times of > 60 minutes for specialty care services, such as radiation oncology. According to Albanese et al, the VA MISSION Act sought to address gaps in care for veterans living in rural and underserved areas.2 The Veterans Health Administration (VHA) continues to increase community care spending, with a 13.8% increase in fiscal year 2024 and an expected cost of > $40 billion for 2025.3 One could argue this pays for access for remote patients and quality when services are unavailable, making it a direct application of the iron triangle.
The VA MISSION Act also bolstered the expansion of existing community care department staff to expediently facilitate and coordinate care and payments.2 Cost management and monitoring have become critical in predicting future staff requirements, maintaining functionality, and ensuring patients receive optimal care. The VHA purchases care through partner networks and defines these bundled health care services as standard episodes of care (SEOCs), which are “clinically related health care services for a specific unique illness or medical condition… over a defined period of time.”4 Medicare publishes its rates quarterly, and outpatient procedure pricing is readily available online.5 Along these same lines, the US Department of Veterans Affairs (VA) publishes a current list of available procedures and associated Current Procedure Technology (CPT) codes that are covered under its VA fee schedule for community care.
Unique challenges persist when using this system to accurately account for radiation oncology expenditures. This study was based on the current practices at the Richard L. Roudebush VA Medical Center (RLRVAMC), a large 1a hospital. A detailed analysis reveals the contemporaneous cost of radiation oncology cancer care from October 1, 2021, through February 1, 2024, highlights the challenges in SEOC definition and duration, communication issues between RLRVAMC and purchase partners, inconsistencies in billing, erroneous payments, and difficulty of cost categorization.
METHODS
Community care radiation oncology-related costs were examined from October 1, 2021, to February 1, 2024 for RLRVAMC, 6 months prior to billing data extraction. Figure 1 shows a simple radiation oncology patient pathway with consultation or visit, simulation and planning, and treatment, with codes used to check billing. It illustrates the expected relationships between the VHA (radiation oncology, primary, and specialty care) and community care (clinicians and radiation oncology treatment sites).
VHA standard operating procedures for a patient requesting community-based radiation oncology care require a board-certified radiation oncologist at RLRVAMC to review and approve the outside care request. Community care radiation oncology consultation data were accessed from the VA Corporate Data Warehouse (CDW) using Pyramid Analytics (V25.2). Nurses, physicians, and community care staff can add comments, forward consultations to other services, and mark them as complete or discontinued, when appropriate. Consultations not completed within 91 days are automatically discontinued. All community care requests from 2018 through 2024 were extracted; analysis began April 1, 2021, 6 months prior to the cost evaluation date of October 1, 2021.
An approved consultation is reviewed for eligibility by a nurse in the community care department and assigned an authorization number (a VA prefix followed by 12 digits). Billing codes are approved and organized by the community care networks, and all procedure codes should be captured and labeled under this number. The VAMC Community Care department obtains initial correspondence from the treating clinicians. Subsequent records from the treating radiation oncologist are expected to be scanned into the electronic health record and made accessible via the VA Joint Legacy Viewer (JLV) and Computerized Patient Record System (CPRS).
Radiation Oncology SEOC
The start date of the radiation oncology SEOC is determined by the community care nurse based on guidance established by the VA. It can be manually backdated or delayed, but current practice is to start at first visit or procedure code entry after approval from the VAMC Radiation Oncology department. Approved CPT codes from SEOC versions between October 1, 2021, and February 1, 2024, are in eAppendix 1 (available at doi:10.12788/fp.0585). These generally include 10 types of encounters, about 115 different laboratory tests, 115 imaging studies, 25 simulation and planning procedures, and 115 radiation treatment codes. The radiation oncology SEOCs during the study period had an approval duration of 180 days. Advanced Medical Cost Management Solutions software (AMCMS) is the VHA data analytics platform for community care medical service costs. AMCMS includes all individual CPT codes billed by specific radiation oncology SEOC versions. Data are refreshed monthly, and all charges were extracted on September 12, 2024, > 6 months after the final evaluated service date to allow for complete billing returns.6
Radiation Oncology-Specific Costs
The VA Close to Me (CTM) program was used to find 84 specific radiation oncology CPT codes, nearly all within the 77.XXX or G6.XXX series, which included all radiation oncology-specific (ROS) codes (except visits accrued during consultation and return appointments). ROS costs are those that could not be performed by any other service and include procedures related to radiation oncology simulation, treatment planning, treatment delivery (with or without image guidance), and physician or physicist management. All ROS costs should be included in a patient’s radiation oncology SEOC. Other costs that may accompany operating room or brachytherapy administration did not follow a 77.XXX or G6.XXX pattern but were included in total radiation therapy operating costs.
Data obtained from AMCMS and CTM included patient name and identifier; CPT billed amount; CPT paid amount; dates of service; number of claims; International Classification of Diseases, Tenth Revision (ICD) diagnosis; and VA authorization numbers. Only CTM listed code modifiers. Only items categorized as paid were included in the analysis. Charges associated with discontinued consultations that had accrued costs also were included. Codes that were not directly related to ROS were separately characterized as other and further subcategorized.
Deep Dive Categorization
All scanned documents tagged to the community consultation were accessed and evaluated for completeness by a radiation oncologist (RS). The presence or absence of consultation notes and treatment summaries was evaluated based on necessity (ie, not needed for continuation of care or treatment was not given). In the absence of a specific completion summary or follow-up note detailing the treatment modality, number of fractions, and treatment sites, available documentation, including clinical notes and billing information, was used. Radical or curative therapies were identified as courses expected to eradicate disease, including stereotactic ablative radiotherapy to the brain, lung, liver, and other organs. Palliative therapies included whole-brain radiotherapy or other low-dose treatments. If the patient received the intended course, this was categorized as full. If incomplete, it was considered partial.
Billing Deviations
The complete document review allowed for close evaluation of paid therapy and identification of gaps in billing (eg, charges not found in extracted data that should have occurred) for external beam radiotherapy patients. Conversely, extra charges, such as an additional weekly treatment management charge (CPT code 77427), would be noted. Patients were expected to have the number of treatments specified in the summary, a clinical treatment planning code, and weekly treatment management notes from physicians and physicists every 5 fractions. Consultations and follow-up visits were expected to have 1 visit code; CPT codes 99205 and 99215, respectively, were used to estimate costs in their absence.
Costs were based on Medicare rates as of January 1 of the year in which they were accrued. 7-10 Duplicates were charges with the same code, date, billed quantity, and paid amounts for a given patient. These would always be considered erroneous. Medicare treatment costs for procedures such as intensity modulated radiotherapy (CPT code 77385 or 77386) are available on the Medicare website. When reviewing locality deviations for 77427, there was a maximum of 33% increase in Medicare rates. Therefore, for treatment codes, one would expect the range to be at least the Medicare rate and maximally 33% higher. These rates are negotiated with insurance companies, but this range was used for the purpose of reviewing and adjusting large data sets.
RESULTS
Since 2018, > 500 community care consults have been placed by radiation oncology for treatment in the community, with more following implementation of the VA MISSION Act. Use of radiation oncology community care services annually increased during the study period for this facility (Table 1, Figure 2). Of the 325 community care consults placed from October 1, 2021, to February 1, 2024, 248 radiation oncology SEOCs were recorded with charges for 181 patients (range, 1-5 SEOCs). Long drive time was the rationale for > 97% of patients directed to community care (Supplemental materials, available at doi:10.12788/fp.0585). Based on AMCMS data, $22.2 million was billed and $2.7 million was paid (20%) for 8747 CPT codes. Each community care interval cost the VA a median (range) of $5000 ($8-$168,000 (Figure 3).
After reviewing ROS charges extracted from CTM, 20 additional patients had radiation oncology charges but did not have a radiation oncology SEOC for 268 episodes of care for 201 unique patients. In addition to the 20 patients who did not have a SEOC, 42 nonradiation oncology SEOCs contained 1148 radiation oncology codes, corresponding to almost $500,000 paid. Additional charges of about $416,000, which included biologic agents (eg, durvalumab, nivolumab), procedures (eg, mastectomies), and ambulance rides were inappropriately added to radiation oncology SEOCs.
While 77% of consultations were scanned into CPRS and JLV, only 54% of completion summaries were available with an estimated $115,000 in additional costs. The total adjusted costs was about $2.9 million. Almost 37% of SEOCs were for visits only. For the 166 SEOCs where patients received any radiation treatment or planning, the median cost was $18,000. Differences in SEOC pathways are shown in Figure 4. One hundred twenty-one SEOCs (45%) followed the standard pathway, with median SEOC costs of $15,500; when corrected for radiation-specific costs, the median cost increased to $18,000. When adjusted for billing irregularities, the median cost was $20,600. Ninety-nine SEOCs (37%) were for consultation/ follow-up visits only, with a median cost of $220. When omitting shared scans and nonradiation therapy costs and correcting for billing gaps, the median cost decreased to $170. A median of $9200 was paid per patient, with $12,900 for radiation therapy-specific costs and $13,300 adjusted for billing deviations. Narrowing to the 106 patients who received full, radical courses, the median SEOC, ROS, and adjusted radiation therapy costs increased to $19,400, $22,200, and $22,900, respectively (Table 2, Figure 5). Seventy-one SEOCs (26%) had already seen a radiation oncologist before the VA radiation oncology department was aware, and 49 SEOCs (18%) had retroactive approvals (Supplemental materials available at doi:10.12788/fp.0585).
Every consultation charge was reviewed. A typical patient following the standard pathway (eAppendix 2, available at doi:10.12788/ fp.0585) exhibited a predictable pattern of consultation payment, simulation and planning, multiple radiation treatments interspersed with treatment management visits and a cone-down phase, and finishing with a follow-up visit. A less predictable case with excess CPT codes, gaps in charges, and an additional unexpected palliative course is shown in eAppendix 3 (available at doi:10.12788/fp.0585). Gaps occurred in 42% of SEOCs with missed bills costing as much as $12,000. For example, a patient with lung cancer had a treatment summary note for lung cancer after completion that showed the patient received 30 fractions of 2 Gy, a typical course. Only 10 treatment codes and 3 of 6 weekly treatment management codes were available. There was a gap of 20 volumetric modulated arc therapy treatments, 3 physics weekly status checks, 3 physician managements notes, and a computed tomography simulation charge.
Between AMCMS and CTM, 10,005 CPT codes were evaluated; 1255 (12.5%) were unique to AMCMS (either related to the radiation oncology course, such as Evaluation and Management CPT codes or “other” unrelated codes) while 1158 (11.6%) were unique to CTM. Of the 7592 CPT codes shared between AMCMS and CTM, there was a discrepancy in 135 (1.8%); all were duplicates (CTM showed double payment while AMCMS showed $0 paid). The total CPT code costs came to $3.2 million with $560,000 unique to SEOCs and $500,000 unique to CTM. Treatment codes were the most common (33%) as shown in Table 3 and accounted for 55% of the cost ($1.8 million). About 700 CPT codes were considered “other,” typically for biologic therapeutic agents (Table 4 and eAppendix 4, available at doi:10.12788/fp.0585).
DISCUSSION
The current method of reporting radiation oncology costs used by VA is insufficient and misleading. Better data are needed to summarize purchased care costs to guide decisions about community care at the VA. Investigations into whether the extra costs for quality care (ie, expensive capital equipment, specialized staff, mandatory accreditations) are worthwhile if omitted at other facilities patients choose for their health care needs. No study has defined specialty care-specific costs by evaluating billing receipts from the CDW to answer the question. Kenamond et al highlight the need for radiation oncology for rural patients.11 Drive time was cited as the reason for community care referral for 97% of veterans, many of whom lived in rural locations. Of patients with rurality information who enrolled in community care, 57% came from rural or highly rural counties, and this ratio held for those who received full curative therapies. An executive administrator relying on AMCMS reports would see a median SEOC cost of $5000, but without ROS knowledge in coding, the administrator would miss many additional costs. For example, 2 patients who each had 5 SEOCs during the evaluated period, incurred a total cost of only $1800.
Additionally, an administrator could include miscategorized costs with significant ramifications. The 2 most expensive SEOCs were not typical radiation oncology treatments. A patient undergoing radium-223 dichloride therapy incurred charges exceeding $165,000, contributing disproportionately to the overall median cost analysis; this would normally be administered by the nuclear medicine department. Immunotherapy and chemotherapy are uniformly overseen by medical oncology services, but drug administration codes were still found in radiation oncology SEOCs. A patient (whose SEOC was discontinued but accrued charges) had an electrocardiogram interpretation for $8 as the SEOC cost; 3 other SEOCs continued to incur costs after being discontinued. There were 24 empty SEOCs for patients that had consults to the community, and 2 had notes stating treatment had been delivered yet there was no ROS costs or SEOC costs. Of the 268 encounters, 43% had some sort of billing irregularities (ie, missing treatment costs) that would be unlikely for a private practice to omit; it would be much more likely that the CDW miscategorized the payment despite confirmation of the 2 retrieval systems.
It would be inadvisable to make staffing decisions or forecast costs based on current SEOC reports without specialized curation. A simple yet effective improvement to the cost attribution process would be to restrict the analysis to encounters containing primary radiation treatment codes. This targeted approach allows more accurate identification of patients actively receiving radiation oncology treatment, while excluding those seen solely for consultations or follow-up visits. Implementing this refinement leads to a substantial increase in the median payment—from $5000 to $13,000—without requiring additional coding or data processing, thereby enhancing the accuracy of cost estimates with minimal effort.
Clarifying radiation oncology service costs requires addressing the time frame and services included, given laxity and interpretation of the SEOCs. VA community care departments have streamlined the reimbursement process at the expense of medical cost organization and accuracy; 86% of VA practitioners reported that ≥ 1 potential community health care partners had refused to work with the VA because of payment delays.12 Payments are contingent on correspondence from outside practices for community work. For radiation oncology, this includes the consultation but also critical radiation-related details of treatment, which were omitted nearly half the time. SEOC approval forms have many costly laboratory tests, imaging, and procedures that have little to do with radiation oncology cancer treatments but may be used in the workup and staging process; this creates noise when calculating radiation oncology fiscal cost.
The presumption that an episode of care equates to a completed radiation therapy course is incorrect; this occurs less than half of the time. An episode often refers to a return visit, or conversely, multiple treatment courses. As the patients’ medical homes are their VHA primary care practitioners, it would be particularly challenging to care for the patients without full treatment information, especially if adverse effects from therapy were to arise. As a tertiary specialty, radiation oncology does not seek out patients and are sent consultations from medical oncology, surgical, and medical oncologic specialties. Timesensitive processes such as workup, staging, and diagnosis often occur in parallel. This analysis revealed that patients see outside radiation oncologists prior to the VA. There are ≥ 100 patients who had radiation oncology codes without a radiation oncology SEOC or community care consultation, and in many cases, the consultation was placed after the patient was seen.
Given the lack of uniformity and standardization of patient traffic, the typical and expected pathways were insufficient to find the costs. Too many opportunities for errors and incorrect categorization of costs meant a different method would be necessary. Starting at the inception of the community care consult, only 1 diagnosis code can be entered. For patients with multiple diagnoses, one would not be able to tell what was treated without chart access. Radiation oncology consults come from primary and specialty care practitioners and nurses throughout the VA. Oftentimes, the referral would be solicited by the community radiation oncology clinic, diagnosing community specialty (ie, urology for a patient with prostate cancer), or indirectly from the patient through primary care. Many cases were retroactively approved as the veteran had already been consulted by the community care radiation oncologist. If the patient is drive-time eligible, it would be unlikely that they would leave and choose to return to the VA. There is no way for a facility VA service chief or administrator to mitigate VA community costs of care, especially as shown by the miscategorization of several codes. Database challenges exacerbate the issue: 1 patient changed her first and last name during this time frame, and 2 patients had the same name but different social security numbers. In order to strictly find costs between 2 discrete timepoints, 39 (15%) SEOCs were split and incomplete, and 6 SEOCs contained charges for 2 different patients. This was corrected, and all inadvertent charges were cancelled. Only 1 ICD code is allowed per community care consultation, so an investigation is required to find costs for patients with multiple sites of disease. Additionally, 5 of the patients marked for drive time were actually patients who received Gamma Knife and brachytherapy, services not available at the VA.
Hanks et al first attempted to calculate cost of radiation oncology services. External beam prostate cancer radiotherapy at 3 suburban California centers cost $6750 ($20,503 inflation adjusted) per patient before October 1984 and $5600 ($17,010 inflation adjusted) afterwards.13 According to the American Society for Radiation Oncology, Advocacy Radiation Oncology Case Rate Program Curative radiation courses should cost $20,000 to $30,000 and palliative courses should cost $10,000 to $15,000. These costs are consistent with totals demonstrated in this analysis and similar to the inflation-adjusted Hanks et al figures. Preliminary findings suggest that radiation treatment constituted more than half of the total expenditures, with a notable $4 million increase in adjusted cost compared to the Medicare rates, indicating significant variation. Direct comparisons with Medicaid or commercial payer rates remain unexplored.
Future Directions
During the study period, 201 patients received 186 courses of radiation therapy in the community, while 1014 patients were treated in-house for a total of 833 courses. A forthcoming analysis will directly compare the cost of in-house care with that of communitybased treatment, specifically breaking down expenditure differences by diagnosis. Future research should investigate strategies to align reimbursement with quality metrics, including the potential role of tertiary accreditation in incentivizing high-value care. Additional work is also warranted to assess patient out-ofpocket expenses across care settings and to benchmark VA reimbursement against Medicare, Medicaid, and private insurance rates. In any case, with the increasing possibility of fewer fractions for treatments such as stereotactic radiotherapy or palliative care therapy, there is a clear financial incentive to treat as frequently as allowed despite equal clinical outcomes.
CONCLUSIONS
Veterans increasingly choose to receive care closer to home if the option is available. In the VA iron triangle, cost comes at the expense of access but quantifying this has proved elusive in the cost accounting model currently used at the VA.1 The inclusion of all charges loosely associated with SEOCs significantly impairs the ability to conduct meaningful cost analyses. The current VA methodology not only introduces substantial noise into the data but also leads to a marked underestimation of the true cost of care delivered in community settings. Such misrepresentation risks driving policy decisions that could inappropriately reduce or eliminate in-house radiation oncology services. Categorizing costs effectively in the VA could assist in making managerial and administrative decisions and would prevent damaging service lines based on misleading or incorrect data. A system which differentiates between patients who have received any treatment codes vs those who have not would increase accuracy.
- Kissick W. Medicine’s Dilemmas: Infinite Needs Versus Finite Resources. 1st ed. Yale University Press; 1994.
- Albanese AP, Bope ET, Sanders KM, Bowman M. The VA MISSION Act of 2018: a potential game changer for rural GME expansion and veteran health care. J Rural Health. 2020;36(1):133-136. doi:10.1111/jrh.12360
- Office of Management and Budget (US). Budget of the United States Government, Fiscal Year 2025. Washington, DC: US Government Publishing Office; 2024. Available from: US Department of Veterans Affairs FY 2025 Budget Submission: Budget in Brief.
- US Department of Veterans Affairs. Veteran care claims. Accessed April 3, 2025. https://www.va.gov/COMMUNITYCARE/revenue-ops/Veteran-Care-Claims.asp
- US Centers for Medicare and Medicaid Services. Accessed April 3, 2025. Procedure price lookup https://www.medicare.gov/procedure-price-lookup
- US Department of Veterans Affairs. WellHive -Enterprise. Accessed April 3, 2025. https://department.va.gov/privacy/wp-content/uploads/sites/5/2023/05/FY23WellHiveEnterprisePIA.pdf
- US Centers for Medicare and Medicaid Services. RVU21a physician fee schedule, January 2021 release. Accessed April 3, 2025. https://www.cms.gov/medicaremedicare-fee-service-paymentphysicianfeeschedpfs-relative-value-files/rvu21a
- US Centers for Medicare and Medicaid Services. RVU22a physician fee schedule, January 2022 release. Accessed April 3, 2025. https://www.cms.gov/medicaremedicare-fee-service-paymentphysicianfeeschedpfs-relative-value-files/rvu22a
- US Centers for Medicare and Medicaid Services. RVU23a physician fee schedule, January 2023 release. Accessed April 3, 2025. https://www.cms.gov/medicare/medicare-fee-service-payment/physicianfeesched/pfs-relative-value-files/rvu23a
- US Centers for Medicare and Medicaid Services. RVU23a Medicare Physician Fee Schedule rates effective January 1, 2024, through March 8, 2024. Accessed on April 3, 2025. https://www.cms.gov/medicare/payment/fee-schedules/physician/pfs-relative-value-files/rvu24a
- Kenamond MC, Mourad WF, Randall ME, Kaushal A. No oncology patient left behind: challenges and solutions in rural radiation oncology. Lancet Reg Health Am. 2022;13:100289. doi:10.1016/j.lana.2022.100289
- Mattocks KM, Kroll-Desrosiers A, Kinney R, Elwy AR, Cunningham KJ, Mengeling MA. Understanding VA’s use of and relationships with community care providers under the MISSION Act. Med Care. 2021;59(Suppl 3):S252-S258. doi:10.1097/MLR.0000000000001545
- Hanks GE, Dunlap K. A comparison of the cost of various treatment methods for early cancer of the prostate. Int J Radiat Oncol Biol Phys. 1986;12(10):1879-1881. doi:10.1016/0360-3016(86)90334-2
- American Society of Radiation Oncology. Radiation oncology case rate program (ROCR). Accessed April 3, 2025. https://www.astro.org/advocacy/key-issues-8f3e5a3b76643265ee93287d79c4fc40/rocr
Community Care Radiation Oncology Cost Calculations for a VA Medical Center
Community Care Radiation Oncology Cost Calculations for a VA Medical Center
Handoff Delays in Teledermatology Lengthen Timeline of Care for Veterans With Melanoma
Handoff Delays in Teledermatology Lengthen Timeline of Care for Veterans With Melanoma
Store-and-forward teledermatology (SFT) allows clinical images and information to be sent to a dermatologist for evaluation. In fiscal year (FY) 2018, 117,780 SFT consultations were completed in the Veterans Health Administration. Continued growth is expected since SFT has proven to be an effective method for improving access to face-to-face (FTF) dermatology care.1 In the same period, the US Department of Veterans Affairs (VA) Puget Sound Health Care System (VAPSHCS) completed 12,563 consultations in a mean 1.1 days from entry into episode of care (EEC), according to data reported by VA Teledermatology Program Administrator Chris Foster.
Obtaining a prompt consultation is reported to be an overwhelming advantage of using SFT.2-5 Rapid turnaround may appear to make SFT specialist care more accessible to veterans, yet this is an oversimplification. The process of delivering care (rather than consultation) through SFT is more complex than reading the images and reporting the findings. When a skin condition is identified by a primary care clinician and that person decides to request an SFT consultation, a complex set of tasks and handoffs is set into motion. A swim-lane diagram illustrates the numerous steps and handoffs that go into delivering care to a patient with a malignant melanoma on the SFT platform compared to FTF care, which requires fewer handoffs (Figure).
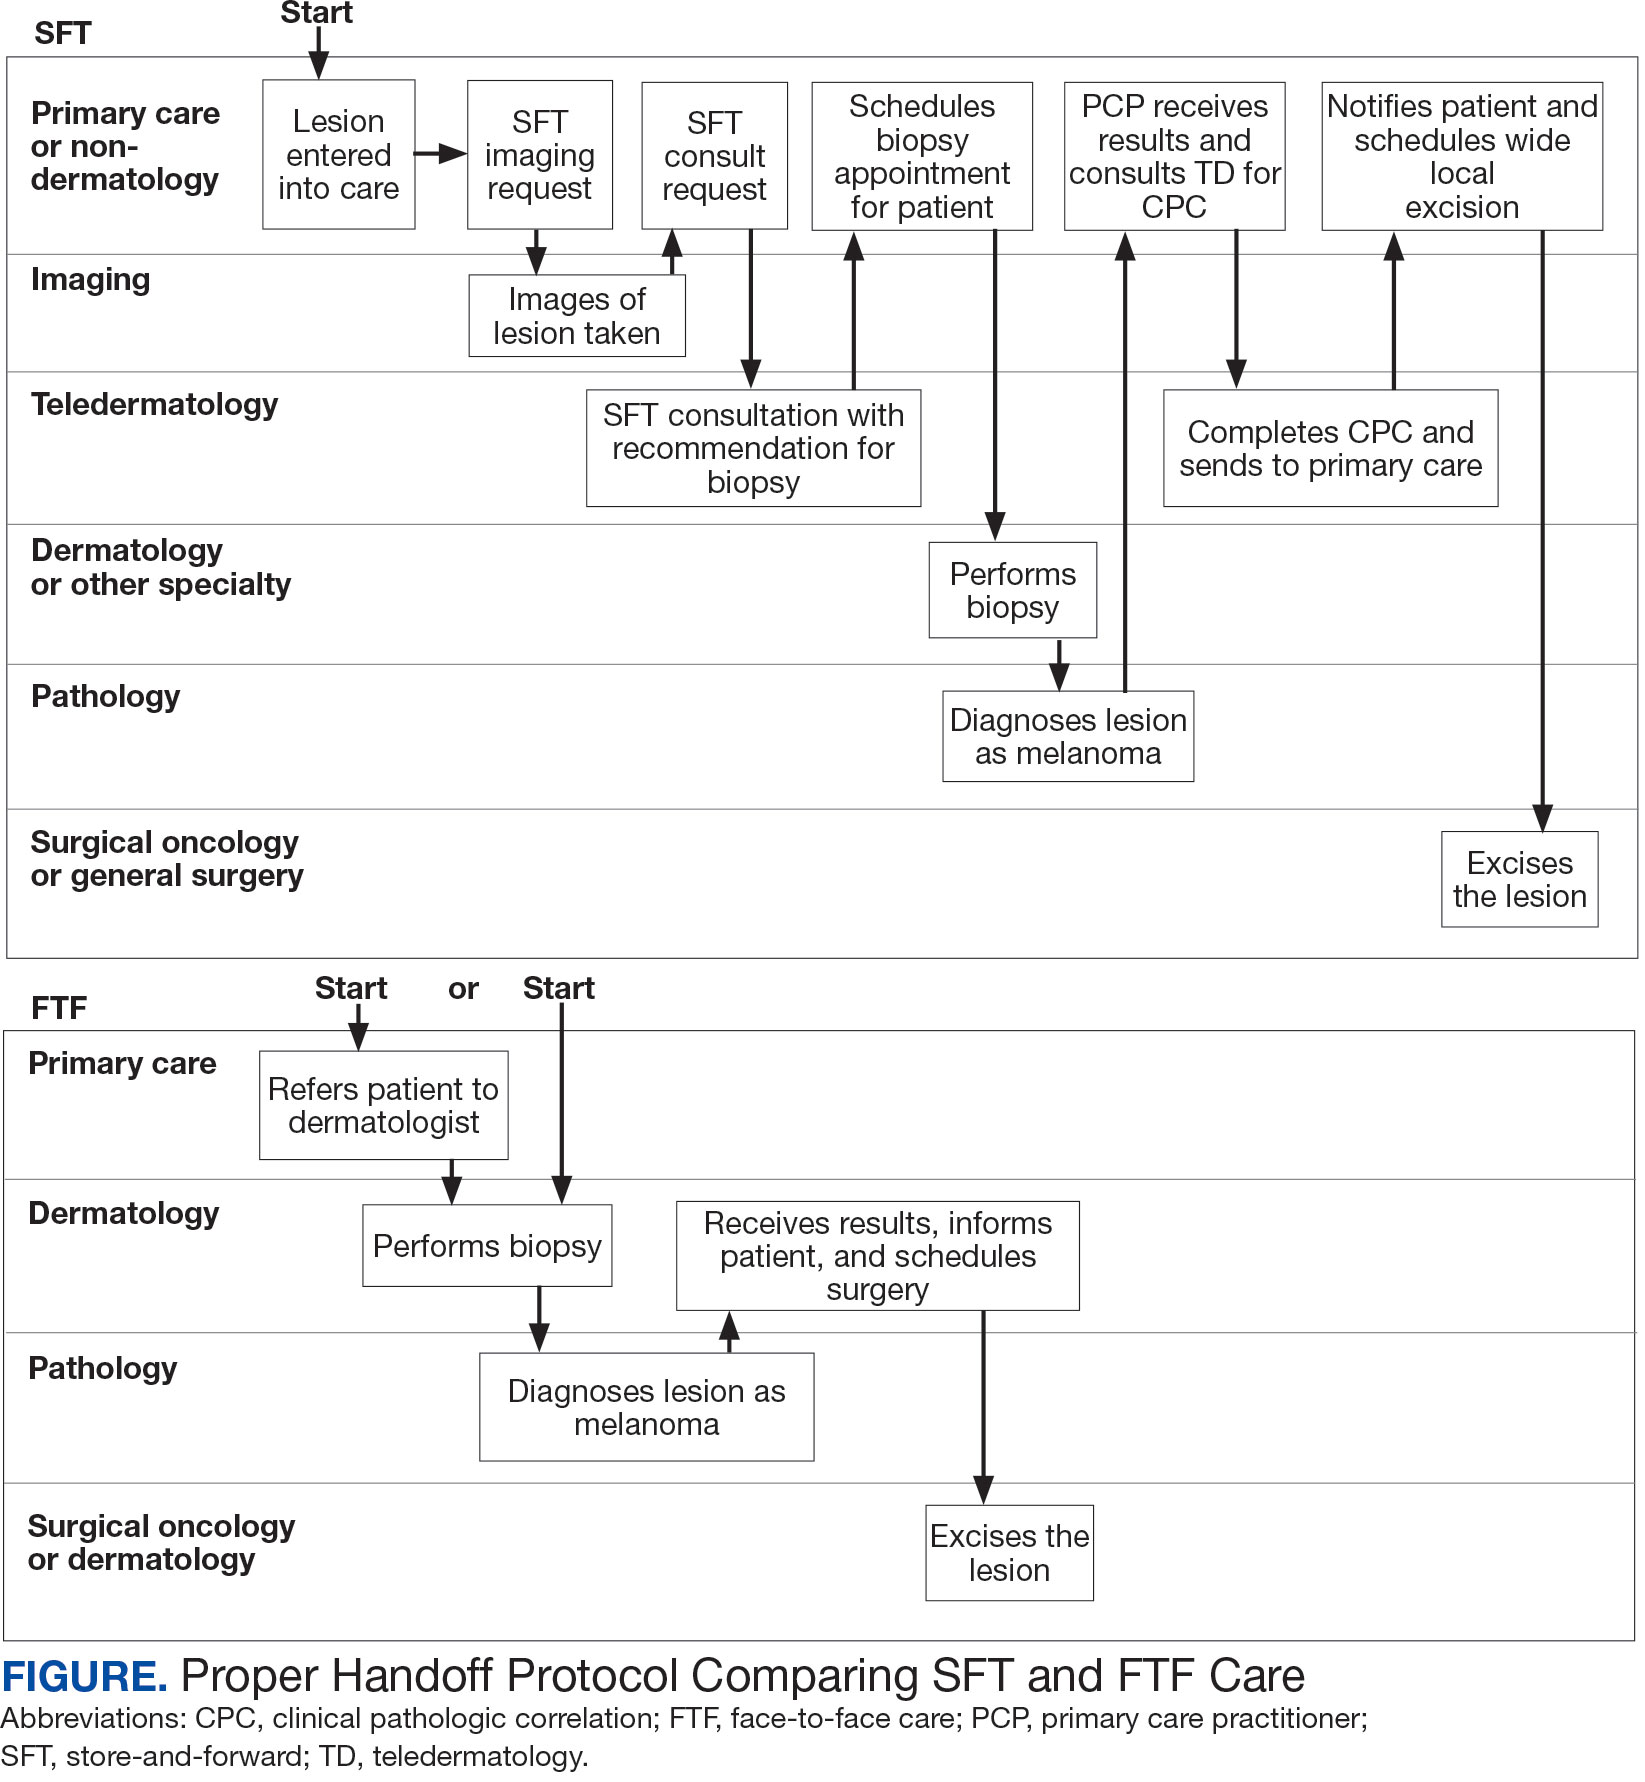
This process improvement project examined whether handoffs necessitated by SFT care lengthened the timeline of care for biopsy-proven primary cutaneous malignant melanoma. The stakes of delay in care are high. A 2018 study using the National Cancer Database found that a delay of > 30 days from biopsy to definitive excision (the date definitive surgical procedure for the condition is performed) resulted in a measurable increase in melanoma-related mortality. 6 This study sought to identify areas where the SFT timeline of care could be shortened.
Methods
This retrospective cohort study was approved by the VAPSHCS Institutional Review Board. The study drew from secondary data obtained from VistA, the VA Corporate Data Warehouse, the Veterans Integrated Service Network (VISN) 20 database, the American Academy of Dermatology Teledermatology Program database, and the VA Computerized Patient Record System.
Patients registered for ≥ 1 year at VAPSHCS with a diagnosis of primary cutaneous malignant melanoma by the Pathology service between January 1, 2006, and December 31, 2013, were included. Patients with metastatic or recurrent melanoma were excluded.
Cases were randomly selected from a melanoma database previously validated and used for another quality improvement project.7 There were initially 115 patient cases extracted from this database for both the FTF and SFT groups. Eighty-seven SFT and 107 FTF cases met inclusion criteria. To further analyze these groups, we split the FTF group into 2 subgroups: FTF dermatology (patients whose melanomas were entered into care in a dermatology clinic) and FTF primary care (patients whose melanomas were entered into care in primary care or a nondermatology setting).
The timeline of care was divided into 2 major time intervals: (1) entry into episode of care (EEC; the date a lesion was first documented in the electronic health record) to biopsy; and (2) biopsy to definitive excision. The SFT process was divided into the following intervals: EEC to imaging request (the date a clinician requested imaging); imaging request to imaging completion (the date an imager photographed a patient’s lesion); imaging completion to SFT consultation request (the date the SFT consultation was requested); SFT consultation request to consultation completion (the date an SFT reader completed the consultation request for a patient); and SFT consultation completion to biopsy. Mean and median interval lengths were compared between groups and additional analyses identified steps that may have contributed to delays in care.
To address potential bias based on access to care for rural veterans, SFT and FTF primary care cases were categorized into groups based on their location: (1) EEC and biopsy conducted at the same facility; (2) EEC and biopsy conducted at different facilities within the same health care system (main health care facility and its community-based outpatient clinics); and (3) EEC and biopsy conducted at different health care systems.
Statistics
Means, medians, and SDs were calculated in Excel. The Mann-Whitney U test was used to compare SFT medians to the FTF data and X2 test was used to compare proportions for secondary analyses.
Results
The median (mean) interval from EEC to definitive excision was 73 days (85) for SFT and 58 days (73) for FTF (P = .004) (Table). To understand this difference, the distribution of intervals from EEC to biopsy and biopsy to definitive excision were calculated. Only 38% of SFT cases were biopsied within 20 days compared to 65% of FTF cases (P < .001). The difference in time from biopsy to definitive excision distributions were not statistically significant, suggesting that the difference is actually a reflection of the differences seen in the period between EEC and biopsy.
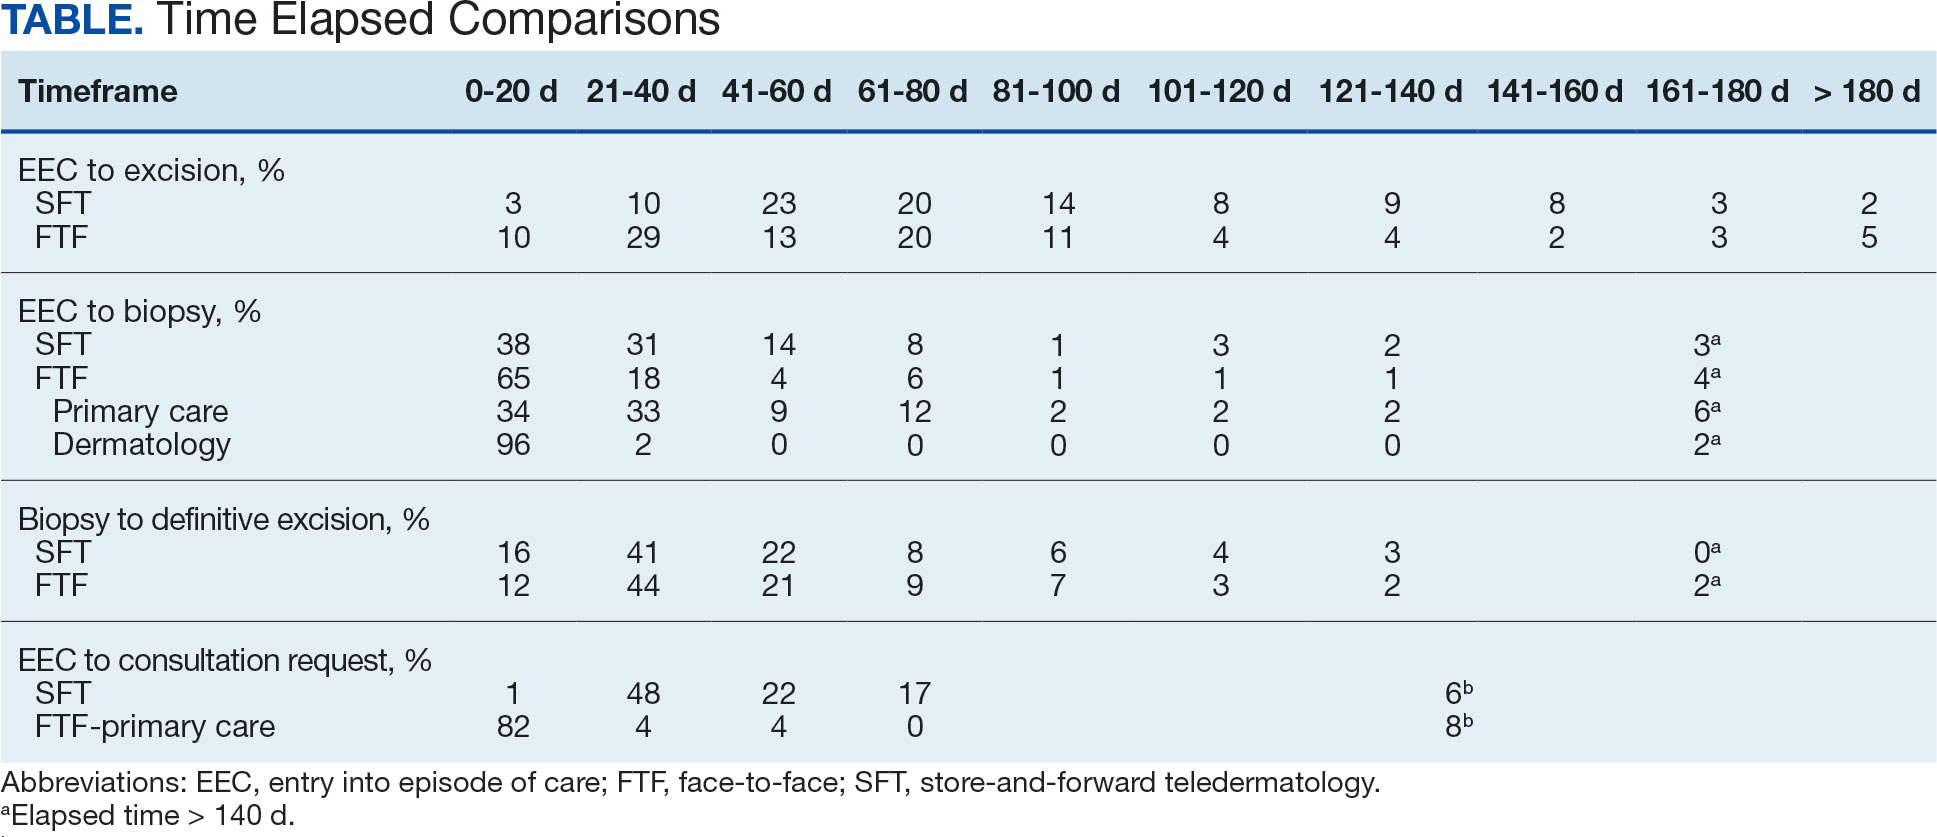
EEC and biopsy occurred at the same facility in 85% and 82% of FTF primary care and SFT cases, respectively. EEC and biopsy occurred at different facilities within the same health care system in 15% and 16% of FTF primary care and SFT cases, respectively. EEC and biopsy occurred at different health care systems in 0% and 2% of FTF primary care and SFT cases, respectively. Geographic bias did not impact results for either group of veterans.
The interval between EEC and biopsy was shorter for FTF dermatology cases than for FTF primary care cases. For FTF dermatology cases, 96% were biopsied within 20 days compared with 34% of FTF primary care cases (P < .001).
To further analyze the difference in the EEC to biopsy interval duration between SFT and FTF primary care the timeline was divided into smaller steps: EEC to imaging completion, imaging completion to SFT consult completion, and SFT consult completion to biopsy. From EEC to SFT consult completion, SFT cases took a median of 6.0 days and a mean of 12.3 days, reflecting the administrative handoffs that must occur in SFT. A total of 82% of FTF primary care cases were entered into care and consultation was requested on the same day, while this was true for only 1% of SFT cases.
Since mortality data were not collected, the frequency of in situ melanomas and invasive melanomas (pathologic stage pT1a or greater) was used as a proxy for comparing outcomes. No significant difference was found in the frequency of in situ vs invasive melanomas in the SFT and FTF dermatology groups; however, there was a much higher frequency of invasive melanomas in the FTF primary care group (P = .007).
Discussion
This study compared the time to treatment for SFT vs FTF and identified important differences. The episode of care for melanomas diagnosed by SFT was statistically significantly longer (15 days) than those diagnosed by FTF. The interval between biopsy and definitive excision was a median of 34 and 38 days, and a mean of 48 and 44 days for SFT and FTF, respectively, which were not statistically significant. The difference in the total duration of the interval between EEC and definitive excision was accounted for by the duration of the interval from EEC to biopsy. When excluding dermatology clinic cases from the FTF group, there was no difference in the interval between EEC and biopsy for SFT and FTF primary care. The handoffs in SFT accounted for a median of 6 days and mean of 12 days, a significant portion of the timeline, and is a target for process improvement. The delay necessitated by handoffs did not significantly affect the distribution of in situ and invasive melanomas in the SFT and FTF dermatology groups. This suggests that SFT may have better outcomes than FTF primary care.
There has been extensive research on the timeline from the patient initially noticing a lesion to the EEC.8-11 There is also a body of research on the timeline from biopsy to definitive excision. 6,12-16 However, there has been little research on the timeline between EEC and biopsy, which comprises a large portion of the overall timeline of both SFT care and FTF care. This study analyzed the delays that can occur in this interval. When patients first enter FTF dermatology care, this timeline is quite short because lesions are often biopsied on the same day. When patients enter into care with their primary or nondermatology clinician, there can be significant delays.
Since the stakes are high when it comes to treating melanoma, it is important to minimize the overall timeline. A 6-day median and 12-day mean were established as targets for teledermatology handoffs. Ideally, a lesion should be entered into an episode of care, imaged, and sent for consultation on the same day. To help further understand delays in administrative handoffs, we stratified the SFT cases by VISN 20 sites and spoke with an administrator at a top performing site. Between 2006 and 2013, this site had a dedicated full-time imager as well as a backup imager that ensured images were taken quickly, usually on the same day the lesion was entered into care. Unfortunately, this is not the standard at all VISN 20 sites and certainly contributes to the overall delay in care in SFT
Minimizing the timeline of care is possible, as shown by the Danish health system, which developed a fast-track referral system after recognizing the need to minimize delays between the presentation, diagnosis, and treatment of cutaneous melanomas. In Denmark, a patient who presents to a general practitioner with a suspicious lesion is referred to secondary care for excision biopsy within 6 days. Diagnosis is made within 2 weeks, and, if necessary, definitive excision is offered within 9 days of the diagnosis. This translates into a maximum 20-day EEC to biopsy timeline and maximum 29-day EEC to definitive excision timeline. Although an intervention such as this may be difficult to implement in the United States due to its size and decentralized health care system, it would, however, be more realistic within the VA due to its centralized structure. The Danish system shows that with appropriate resource allocation and strict timeframes for treatment referrals, the timeline can be minimized.17
Despite the delay in the SFT timeline, this study found no significant difference between the distribution of in situ vs invasive melanomas in FTF dermatology and SFT groups. One possible explanation for this is that SFT increases access to dermatologist care, meaning clinicians may be more willing to consult SFT for less advanced– appearing lesions.
The finding that SFT diagnosed a larger proportion of in situ melanomas than FTF primary care is consistent with the findings of Ferrándiz et al, who reported that the mean Breslow thickness was significantly lower among patients in an SFT group compared to patients in an FTF group consisting of general practitioners. 18 However, the study population was not randomized and the results may have been impacted by ascertainment bias. Ferrándiz et al hypothesized that clinicians may have a lower threshold for consulting teledermatology, resulting in lower mean Breslow thicknesses.18 Karavan et al found the opposite results, with a higher mean Breslow thickness in SFT compared to a primary care FTF group.19 The data presented here suggest that SFT has room for process improvement yet is essentially equivalent to FTF dermatology in terms of outcomes.
Limitations
The majority of patients in this study were aged > 50 years, White, and male. The results may not be representative for other populations. The study was relatively small compared to studies that looked at other aspects of the melanoma care timeline. The study was not powered to ascertain mortality, the most important metric for melanoma.
Conclusions
The episode of care was significantly longer for melanomas diagnosed by SFT than those diagnosed by FTF; however, timelines were not statistically different when FTF lesions entered into care in dermatology were excluded. A median 6-day and mean 12.3-day delay in administrative handoffs occurred at the beginning of the SFT process and is a target for process improvement. Considering the high stakes of melanoma, the SFT timeline could be reduced if EEC, imaging, and SFT consultation all happened in the same day.
- Raugi GJ, Nelson W, Miethke M, et al. Teledermatology implementation in a VHA secondary treatment facility improves access to face-to-face care. Telemed J E Health. 2016;22(1):12-17. doi:10.1089/tmj.2015.0036
- Moreno-Ramirez D, Ferrandiz L, Nieto-Garcia A, et al. Store-and-forward teledermatology in skin cancer triage: experience and evaluation of 2009 teleconsultations. Arch Dermatol. 2007;143(4):479-484. doi:10.1001/archderm.143.4.479
- Landow SM, Oh DH, Weinstock MA. Teledermatology within the Veterans Health Administration, 2002–2014. Telemed J E Health. 2015;21(10):769-773. doi:10.1089/tmj.2014.0225
- Whited JD, Hall RP, Foy ME, et al. Teledermatology’s impact on time to intervention among referrals to a dermatology consult service. Telemed J E Health. 2002;8(3):313-321. doi:10.1089/15305620260353207
- Hsiao JL, Oh DH. The impact of store-and-forward teledermatology on skin cancer diagnosis and treatment. J Am Acad Dermatol. 2008;59(2):260-267. doi:10.1016/j.jaad.2008.04.011
- Conic RZ, Cabrera CI, Khorana AA, Gastman BR. Determination of the impact of melanoma surgical timing on survival using the National Cancer Database. J Am Acad Dermatol. 2018;78(1):40-46.e7. doi:10.1016/j.jaad.2017.08.039
- Dougall B, Gendreau J, Das S, et al. Melanoma registry underreporting in the Veterans Health Administration. Fed Pract. 2016;33(suppl 5):55S-59S
- Xavier MHSB, Drummond-Lage AP, Baeta C, Rocha L, Almeida AM, Wainstein AJA. Delay in cutaneous melanoma diagnosis: sequence analyses from suspicion to diagnosis in 211 patients. Medicine (Baltimore). 2016;95(31):e4396. doi:10.1097/md.0000000000004396
- Schmid-Wendtner MH, Baumert J, Stange J, Volkenandt M. Delay in the diagnosis of cutaneous melanoma: an analysis of 233 patients. Melanoma Res. 2002;12(4):389-394. doi:10.1097/00008390-200208000-00012
- Betti, R, Vergani R, Tolomio E, Santambrogio R, Crosti C. Factors of delay in the diagnosis of melanoma. Eur J Dermatol. 2003;13(2):183-188.
- Blum A, Brand CU, Ellwanger U, et al. Awareness and early detection of cutaneous melanoma: An analysis of factors related to delay in treatment. Br J Dermatol. 1999;141(5):783-787. doi:10.1046/j.1365-2133.1999.03196.x
- Brian T, Adams B, Jameson M. Cutaneous melanoma: an audit of management timeliness against New Zealand guidelines. N Z Med J. 2017;130(1462):54-61. https://pubmed.ncbi.nlm.nih.gov/28934768
- Adamson AS, Zhou L, Baggett CD, Thomas NE, Meyer AM. Association of delays in surgery for melanoma with Insurance type. JAMA Dermatol. 2017;153(11):1106-1113. doi:https://doi.org/10.1001/jamadermatol.2017.3338
- Niehues NB, Evanson B, Smith WA, Fiore CT, Parekh P. Melanoma patient notification and treatment timelines. Dermatol Online J. 2019;25(4)13. doi:10.5070/d3254043588
- Lott JP, Narayan D, Soulos PR, Aminawung J, Gross CP. Delay of surgery for melanoma among Medicare beneficiaries. JAMA Dermatol. 2015;151(7):731-741. doi:10.1001/jamadermatol.2015.119
- Baranowski MLH, Yeung H, Chen SC, Gillespie TW, Goodman M. Factors associated with time to surgery in melanoma: an analysis of the National Cancer Database. J Am Acad Dermatol. 2019;81(4):908-916. doi:10.1016/j.jaad.2019.05.079
- Jarjis RD, Hansen LB, Matzen SH. A fast-track referral system for skin lesions suspicious of melanoma: population-based cross-sectional study from a plastic surgery center. Plast Surg Int. 2016;2016:2908917. doi:10.1155/2016/2908917
- Ferrándiz L, Ruiz-de-Casas A, Martin-Gutierrez FJ, et al. Effect of teledermatology on the prognosis of patients with cutaneous melanoma. Arch Dermatol. 2012;148(9):1025-1028. doi:10.1001/archdermatol.2012.778
- Karavan M, Compton N, Knezevich S, et al. Teledermatology in the diagnosis of melanoma. J Telemed Telecare. 2014;20(1):18-23. doi:10.1177/1357633x13517354
Store-and-forward teledermatology (SFT) allows clinical images and information to be sent to a dermatologist for evaluation. In fiscal year (FY) 2018, 117,780 SFT consultations were completed in the Veterans Health Administration. Continued growth is expected since SFT has proven to be an effective method for improving access to face-to-face (FTF) dermatology care.1 In the same period, the US Department of Veterans Affairs (VA) Puget Sound Health Care System (VAPSHCS) completed 12,563 consultations in a mean 1.1 days from entry into episode of care (EEC), according to data reported by VA Teledermatology Program Administrator Chris Foster.
Obtaining a prompt consultation is reported to be an overwhelming advantage of using SFT.2-5 Rapid turnaround may appear to make SFT specialist care more accessible to veterans, yet this is an oversimplification. The process of delivering care (rather than consultation) through SFT is more complex than reading the images and reporting the findings. When a skin condition is identified by a primary care clinician and that person decides to request an SFT consultation, a complex set of tasks and handoffs is set into motion. A swim-lane diagram illustrates the numerous steps and handoffs that go into delivering care to a patient with a malignant melanoma on the SFT platform compared to FTF care, which requires fewer handoffs (Figure).
This process improvement project examined whether handoffs necessitated by SFT care lengthened the timeline of care for biopsy-proven primary cutaneous malignant melanoma. The stakes of delay in care are high. A 2018 study using the National Cancer Database found that a delay of > 30 days from biopsy to definitive excision (the date definitive surgical procedure for the condition is performed) resulted in a measurable increase in melanoma-related mortality. 6 This study sought to identify areas where the SFT timeline of care could be shortened.
Methods
This retrospective cohort study was approved by the VAPSHCS Institutional Review Board. The study drew from secondary data obtained from VistA, the VA Corporate Data Warehouse, the Veterans Integrated Service Network (VISN) 20 database, the American Academy of Dermatology Teledermatology Program database, and the VA Computerized Patient Record System.
Patients registered for ≥ 1 year at VAPSHCS with a diagnosis of primary cutaneous malignant melanoma by the Pathology service between January 1, 2006, and December 31, 2013, were included. Patients with metastatic or recurrent melanoma were excluded.
Cases were randomly selected from a melanoma database previously validated and used for another quality improvement project.7 There were initially 115 patient cases extracted from this database for both the FTF and SFT groups. Eighty-seven SFT and 107 FTF cases met inclusion criteria. To further analyze these groups, we split the FTF group into 2 subgroups: FTF dermatology (patients whose melanomas were entered into care in a dermatology clinic) and FTF primary care (patients whose melanomas were entered into care in primary care or a nondermatology setting).
The timeline of care was divided into 2 major time intervals: (1) entry into episode of care (EEC; the date a lesion was first documented in the electronic health record) to biopsy; and (2) biopsy to definitive excision. The SFT process was divided into the following intervals: EEC to imaging request (the date a clinician requested imaging); imaging request to imaging completion (the date an imager photographed a patient’s lesion); imaging completion to SFT consultation request (the date the SFT consultation was requested); SFT consultation request to consultation completion (the date an SFT reader completed the consultation request for a patient); and SFT consultation completion to biopsy. Mean and median interval lengths were compared between groups and additional analyses identified steps that may have contributed to delays in care.
To address potential bias based on access to care for rural veterans, SFT and FTF primary care cases were categorized into groups based on their location: (1) EEC and biopsy conducted at the same facility; (2) EEC and biopsy conducted at different facilities within the same health care system (main health care facility and its community-based outpatient clinics); and (3) EEC and biopsy conducted at different health care systems.
Statistics
Means, medians, and SDs were calculated in Excel. The Mann-Whitney U test was used to compare SFT medians to the FTF data and X2 test was used to compare proportions for secondary analyses.
Results
The median (mean) interval from EEC to definitive excision was 73 days (85) for SFT and 58 days (73) for FTF (P = .004) (Table). To understand this difference, the distribution of intervals from EEC to biopsy and biopsy to definitive excision were calculated. Only 38% of SFT cases were biopsied within 20 days compared to 65% of FTF cases (P < .001). The difference in time from biopsy to definitive excision distributions were not statistically significant, suggesting that the difference is actually a reflection of the differences seen in the period between EEC and biopsy.
EEC and biopsy occurred at the same facility in 85% and 82% of FTF primary care and SFT cases, respectively. EEC and biopsy occurred at different facilities within the same health care system in 15% and 16% of FTF primary care and SFT cases, respectively. EEC and biopsy occurred at different health care systems in 0% and 2% of FTF primary care and SFT cases, respectively. Geographic bias did not impact results for either group of veterans.
The interval between EEC and biopsy was shorter for FTF dermatology cases than for FTF primary care cases. For FTF dermatology cases, 96% were biopsied within 20 days compared with 34% of FTF primary care cases (P < .001).
To further analyze the difference in the EEC to biopsy interval duration between SFT and FTF primary care the timeline was divided into smaller steps: EEC to imaging completion, imaging completion to SFT consult completion, and SFT consult completion to biopsy. From EEC to SFT consult completion, SFT cases took a median of 6.0 days and a mean of 12.3 days, reflecting the administrative handoffs that must occur in SFT. A total of 82% of FTF primary care cases were entered into care and consultation was requested on the same day, while this was true for only 1% of SFT cases.
Since mortality data were not collected, the frequency of in situ melanomas and invasive melanomas (pathologic stage pT1a or greater) was used as a proxy for comparing outcomes. No significant difference was found in the frequency of in situ vs invasive melanomas in the SFT and FTF dermatology groups; however, there was a much higher frequency of invasive melanomas in the FTF primary care group (P = .007).
Discussion
This study compared the time to treatment for SFT vs FTF and identified important differences. The episode of care for melanomas diagnosed by SFT was statistically significantly longer (15 days) than those diagnosed by FTF. The interval between biopsy and definitive excision was a median of 34 and 38 days, and a mean of 48 and 44 days for SFT and FTF, respectively, which were not statistically significant. The difference in the total duration of the interval between EEC and definitive excision was accounted for by the duration of the interval from EEC to biopsy. When excluding dermatology clinic cases from the FTF group, there was no difference in the interval between EEC and biopsy for SFT and FTF primary care. The handoffs in SFT accounted for a median of 6 days and mean of 12 days, a significant portion of the timeline, and is a target for process improvement. The delay necessitated by handoffs did not significantly affect the distribution of in situ and invasive melanomas in the SFT and FTF dermatology groups. This suggests that SFT may have better outcomes than FTF primary care.
There has been extensive research on the timeline from the patient initially noticing a lesion to the EEC.8-11 There is also a body of research on the timeline from biopsy to definitive excision. 6,12-16 However, there has been little research on the timeline between EEC and biopsy, which comprises a large portion of the overall timeline of both SFT care and FTF care. This study analyzed the delays that can occur in this interval. When patients first enter FTF dermatology care, this timeline is quite short because lesions are often biopsied on the same day. When patients enter into care with their primary or nondermatology clinician, there can be significant delays.
Since the stakes are high when it comes to treating melanoma, it is important to minimize the overall timeline. A 6-day median and 12-day mean were established as targets for teledermatology handoffs. Ideally, a lesion should be entered into an episode of care, imaged, and sent for consultation on the same day. To help further understand delays in administrative handoffs, we stratified the SFT cases by VISN 20 sites and spoke with an administrator at a top performing site. Between 2006 and 2013, this site had a dedicated full-time imager as well as a backup imager that ensured images were taken quickly, usually on the same day the lesion was entered into care. Unfortunately, this is not the standard at all VISN 20 sites and certainly contributes to the overall delay in care in SFT
Minimizing the timeline of care is possible, as shown by the Danish health system, which developed a fast-track referral system after recognizing the need to minimize delays between the presentation, diagnosis, and treatment of cutaneous melanomas. In Denmark, a patient who presents to a general practitioner with a suspicious lesion is referred to secondary care for excision biopsy within 6 days. Diagnosis is made within 2 weeks, and, if necessary, definitive excision is offered within 9 days of the diagnosis. This translates into a maximum 20-day EEC to biopsy timeline and maximum 29-day EEC to definitive excision timeline. Although an intervention such as this may be difficult to implement in the United States due to its size and decentralized health care system, it would, however, be more realistic within the VA due to its centralized structure. The Danish system shows that with appropriate resource allocation and strict timeframes for treatment referrals, the timeline can be minimized.17
Despite the delay in the SFT timeline, this study found no significant difference between the distribution of in situ vs invasive melanomas in FTF dermatology and SFT groups. One possible explanation for this is that SFT increases access to dermatologist care, meaning clinicians may be more willing to consult SFT for less advanced– appearing lesions.
The finding that SFT diagnosed a larger proportion of in situ melanomas than FTF primary care is consistent with the findings of Ferrándiz et al, who reported that the mean Breslow thickness was significantly lower among patients in an SFT group compared to patients in an FTF group consisting of general practitioners. 18 However, the study population was not randomized and the results may have been impacted by ascertainment bias. Ferrándiz et al hypothesized that clinicians may have a lower threshold for consulting teledermatology, resulting in lower mean Breslow thicknesses.18 Karavan et al found the opposite results, with a higher mean Breslow thickness in SFT compared to a primary care FTF group.19 The data presented here suggest that SFT has room for process improvement yet is essentially equivalent to FTF dermatology in terms of outcomes.
Limitations
The majority of patients in this study were aged > 50 years, White, and male. The results may not be representative for other populations. The study was relatively small compared to studies that looked at other aspects of the melanoma care timeline. The study was not powered to ascertain mortality, the most important metric for melanoma.
Conclusions
The episode of care was significantly longer for melanomas diagnosed by SFT than those diagnosed by FTF; however, timelines were not statistically different when FTF lesions entered into care in dermatology were excluded. A median 6-day and mean 12.3-day delay in administrative handoffs occurred at the beginning of the SFT process and is a target for process improvement. Considering the high stakes of melanoma, the SFT timeline could be reduced if EEC, imaging, and SFT consultation all happened in the same day.
- Raugi GJ, Nelson W, Miethke M, et al. Teledermatology implementation in a VHA secondary treatment facility improves access to face-to-face care. Telemed J E Health. 2016;22(1):12-17. doi:10.1089/tmj.2015.0036
- Moreno-Ramirez D, Ferrandiz L, Nieto-Garcia A, et al. Store-and-forward teledermatology in skin cancer triage: experience and evaluation of 2009 teleconsultations. Arch Dermatol. 2007;143(4):479-484. doi:10.1001/archderm.143.4.479
- Landow SM, Oh DH, Weinstock MA. Teledermatology within the Veterans Health Administration, 2002–2014. Telemed J E Health. 2015;21(10):769-773. doi:10.1089/tmj.2014.0225
- Whited JD, Hall RP, Foy ME, et al. Teledermatology’s impact on time to intervention among referrals to a dermatology consult service. Telemed J E Health. 2002;8(3):313-321. doi:10.1089/15305620260353207
- Hsiao JL, Oh DH. The impact of store-and-forward teledermatology on skin cancer diagnosis and treatment. J Am Acad Dermatol. 2008;59(2):260-267. doi:10.1016/j.jaad.2008.04.011
- Conic RZ, Cabrera CI, Khorana AA, Gastman BR. Determination of the impact of melanoma surgical timing on survival using the National Cancer Database. J Am Acad Dermatol. 2018;78(1):40-46.e7. doi:10.1016/j.jaad.2017.08.039
- Dougall B, Gendreau J, Das S, et al. Melanoma registry underreporting in the Veterans Health Administration. Fed Pract. 2016;33(suppl 5):55S-59S
- Xavier MHSB, Drummond-Lage AP, Baeta C, Rocha L, Almeida AM, Wainstein AJA. Delay in cutaneous melanoma diagnosis: sequence analyses from suspicion to diagnosis in 211 patients. Medicine (Baltimore). 2016;95(31):e4396. doi:10.1097/md.0000000000004396
- Schmid-Wendtner MH, Baumert J, Stange J, Volkenandt M. Delay in the diagnosis of cutaneous melanoma: an analysis of 233 patients. Melanoma Res. 2002;12(4):389-394. doi:10.1097/00008390-200208000-00012
- Betti, R, Vergani R, Tolomio E, Santambrogio R, Crosti C. Factors of delay in the diagnosis of melanoma. Eur J Dermatol. 2003;13(2):183-188.
- Blum A, Brand CU, Ellwanger U, et al. Awareness and early detection of cutaneous melanoma: An analysis of factors related to delay in treatment. Br J Dermatol. 1999;141(5):783-787. doi:10.1046/j.1365-2133.1999.03196.x
- Brian T, Adams B, Jameson M. Cutaneous melanoma: an audit of management timeliness against New Zealand guidelines. N Z Med J. 2017;130(1462):54-61. https://pubmed.ncbi.nlm.nih.gov/28934768
- Adamson AS, Zhou L, Baggett CD, Thomas NE, Meyer AM. Association of delays in surgery for melanoma with Insurance type. JAMA Dermatol. 2017;153(11):1106-1113. doi:https://doi.org/10.1001/jamadermatol.2017.3338
- Niehues NB, Evanson B, Smith WA, Fiore CT, Parekh P. Melanoma patient notification and treatment timelines. Dermatol Online J. 2019;25(4)13. doi:10.5070/d3254043588
- Lott JP, Narayan D, Soulos PR, Aminawung J, Gross CP. Delay of surgery for melanoma among Medicare beneficiaries. JAMA Dermatol. 2015;151(7):731-741. doi:10.1001/jamadermatol.2015.119
- Baranowski MLH, Yeung H, Chen SC, Gillespie TW, Goodman M. Factors associated with time to surgery in melanoma: an analysis of the National Cancer Database. J Am Acad Dermatol. 2019;81(4):908-916. doi:10.1016/j.jaad.2019.05.079
- Jarjis RD, Hansen LB, Matzen SH. A fast-track referral system for skin lesions suspicious of melanoma: population-based cross-sectional study from a plastic surgery center. Plast Surg Int. 2016;2016:2908917. doi:10.1155/2016/2908917
- Ferrándiz L, Ruiz-de-Casas A, Martin-Gutierrez FJ, et al. Effect of teledermatology on the prognosis of patients with cutaneous melanoma. Arch Dermatol. 2012;148(9):1025-1028. doi:10.1001/archdermatol.2012.778
- Karavan M, Compton N, Knezevich S, et al. Teledermatology in the diagnosis of melanoma. J Telemed Telecare. 2014;20(1):18-23. doi:10.1177/1357633x13517354
Handoff Delays in Teledermatology Lengthen Timeline of Care for Veterans With Melanoma
Handoff Delays in Teledermatology Lengthen Timeline of Care for Veterans With Melanoma

Evaluating Access to Full-Body Skin Examinations in Los Angeles County, California
Evaluating Access to Full-Body Skin Examinations in Los Angeles County, California
To the Editor:
Early skin cancer detection improves patient outcomes1; however, socioeconomic and racial disparities may impact access to dermatologic care.2 Although non-Hispanic White individuals have a high incidence of skin cancer, they experience higher melanoma-specific survival rates than non-White patients, who often receive later-stage diagnoses and experience higher mortality.2 Furthermore, racial/ ethnic minorities often face longer surgery wait times after diagnosis and have lower socioeconomic status (SES) and less favorable health insurance coverage, contributing to poorer outcomes.2,3
To examine access to full-body skin examinations (FBSEs) by board-certified dermatologists in Los Angeles (LA) County, California, we analyzed the availability of FBSEs based on racial demographics, income, and insurance type (Medicaid [Medi-Cal] vs private [Blue Cross Blue Shield (BCBS)]). Demographic data by zip code were obtained from the US Census Bureau.4 This validated metric highlights socioeconomic disparities and minimizes data gaps5,6 and was used to assess health care access among different population subgroups. Dermatologists’ contact information was obtained from the Find a Dermatologist page on the American Academy of Dermatology website and the listed phone numbers of their practice were used to contact them. Practices with board-certified dermatologists accepting new patients were included in the study; practices were not included if they had exclusive insurance plans; were pediatric, cosmetic, or research only; or were nonresponsive to calls. From August 2022 to September 2022, each practice was called twice within a 36-hour period—once by a simulated patient with Medi-Cal and once by a simulated patient with BCBS—and were asked about availability for new patient FBSE appointments and accepted insurance types. Data were analyzed using SAS software (SAS Institute Inc.).
Los Angeles County comprises 269 zip codes, of which 82 (30.5%) have dermatology practices. Of 213 total dermatologists in LA County listed on the American Academy of Dermatology website, 193 (90.6%) met preliminary criteria, and 169 (79.3%) were successfully contacted. Almost all (94.6% [160/169]) accepted new patients for FBSEs; of those, 63.1% (101/160) accepted only private insurance, 16.9% (27/160) accepted both private insurance and Medi-Cal, and 16.2% (26/160) did not accept any insurance. Racial predominance for each dermatology practice was analyzed by zip code (Table). Dermatologists included in our study were significantly more concentrated in predominantly non- Hispanic White areas of LA County vs predominantly Hispanic areas (P<.0001). Notably, the average income in predominantly non-Hispanic White zip codes ($114,757.74) was significantly higher than in predominantly Hispanic areas ($58,278.54)(P=.001)(Table).4
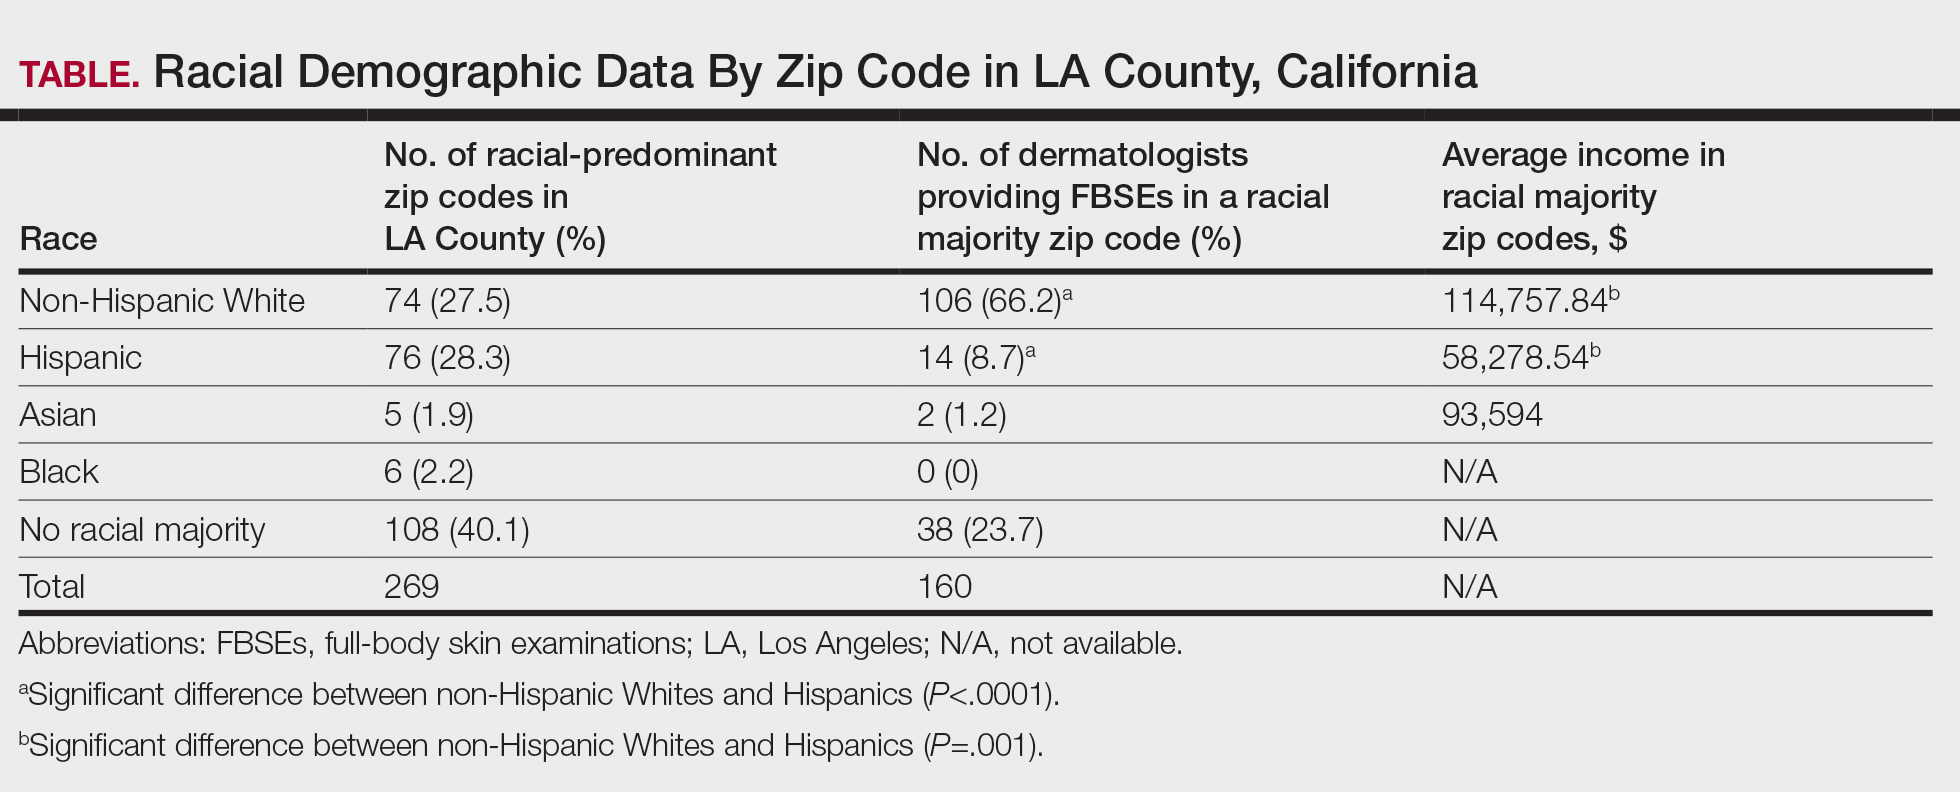
In LA County, 40.1% (108/269) of zip codes have no racial majority, 28.2% (76/269) are predominantly Hispanic, 27.5% (74/269) are predominantly non-Hispanic White, 2.2% (6/269) are predominantly Black, and 1.9% (5/269) are predominantly Asian.4 There are no dermatologists in predominantly Black zip codes, 2 in predominantly Asian zip codes, 14 in predominantly Hispanic zip codes, 38 in zip codes with no racial majority, and 106 in predominantly non-Hispanic White zip codes. There are significantly more dermatologists in predominantly non-Hispanic White zip codes compared to predominantly Hispanic zip codes (P<.0001). In LA County, the average income in predominantly Asian, non-Hispanic White, and Hispanic zip codes was $93,594, $114,757.84, and $58,278.54, respectively, in 2021.4 The average income in predominantly non-Hispanic White zip codes was significantly higher than in predominantly Hispanic zip codes (P=.001). There were no income data available for predominantly Black zip codes or zip codes with no racial majority.
The results from our study revealed potential barriers to FBSEs for racial and ethnic minorities in LA County, which supports previous research on the impact of SES, race, and insurance on access to dermatologic care.2,3 Predominantly Hispanic zip codes have significantly lower income (P<.0001) and fewer dermatologists (P=.001) compared to zip codes that are predominantly non-Hispanic White, reflecting how lower SES correlates with worse health outcomes and higher melanoma mortality. Conversely, predominantly non-Hispanic White areas with higher income have better access to dermatologists, which may contribute to the improved melanoma survival rates among White patients. Additionally, most dermatologists accept only private insurance, further highlighting the disparity in FBSE access for non-White patients across LA County. While our study focused on FBSE access, our findings may point to a wider barrier to dermatologic care, especially in zip codes with fewer dermatologists. Further studies are needed to determine whether these areas also face barriers to accessing primary care.
Our study was limited by the exclusion of nonphysician providers (eg, nurse practitioners, physician assistants), a small sample size, and lack of available economic data for predominantly Black zip codes.4 Additionally, the exclusion of practices with exclusive insurance plans (eg, Kaiser Permanente) limited the generalizability of our findings, as our results did not account for the populations served by these practices. Furthermore, our analysis did not account for variations in practice size or the proportion of care provided to patients with different insurance types, which could impact overall accessibility. Additional studies are needed to explore the impact of these factors on access to general dermatologic care and not just FBSEs.
Racial/ethnic minorities and lower SES populations face major barriers to FBSE access in LA County, such as difficulty finding a dermatologist in their area or one who accepts Medi-Cal. Addressing these disparities is crucial for improving skin cancer outcomes. Further research is needed to develop strategies to eliminate these barriers to dermatologic care, such as increasing access to teledermatology, offering mobile dermatology clinics, and improving insurance coverage.
- Chiaravalloti AJ, Laduca JR. Melanoma screening by means of complete skin exams for all patients in a dermatology practice reduces the thickness of primary melanomas at diagnosis. J Clin Aesthet Dermatol. 2014;7:18-22.
- Qian Y, Johannet P, Sawyers A, et al. The ongoing racial disparities in melanoma: an analysis of the Surveillance, Epidemiology, and End Results database (1975-2016). J Am Acad Dermatol. 2021;84:1585-1593.
- Baranowski MLH, Yeung H, Chen SC, et al. Factors associated with time to surgery in melanoma: an analysis of the National Cancer Database. J Am Acad Dermatol. 2019;81:908-916.
- United States Census Bureau. Explore census data. Accessed March 17, 2025. https://data.census.gov/all?q=los+angeles+county
- Berkowitz SA, Traore CY, Singer DE, et al. Evaluating area-based socioeconomic status indicators for monitoring disparities within health care systems: results from a primary care network. Health Serv Res. 2015;50:398-417.
- Jacobs B, Ir P, Bigdeli M, et al. Addressing access barriers to health services: an analytical framework for selecting appropriate interventions in lowincome Asian countries. Health Policy Plan. 2012;27:288-300.
To the Editor:
Early skin cancer detection improves patient outcomes1; however, socioeconomic and racial disparities may impact access to dermatologic care.2 Although non-Hispanic White individuals have a high incidence of skin cancer, they experience higher melanoma-specific survival rates than non-White patients, who often receive later-stage diagnoses and experience higher mortality.2 Furthermore, racial/ ethnic minorities often face longer surgery wait times after diagnosis and have lower socioeconomic status (SES) and less favorable health insurance coverage, contributing to poorer outcomes.2,3
To examine access to full-body skin examinations (FBSEs) by board-certified dermatologists in Los Angeles (LA) County, California, we analyzed the availability of FBSEs based on racial demographics, income, and insurance type (Medicaid [Medi-Cal] vs private [Blue Cross Blue Shield (BCBS)]). Demographic data by zip code were obtained from the US Census Bureau.4 This validated metric highlights socioeconomic disparities and minimizes data gaps5,6 and was used to assess health care access among different population subgroups. Dermatologists’ contact information was obtained from the Find a Dermatologist page on the American Academy of Dermatology website and the listed phone numbers of their practice were used to contact them. Practices with board-certified dermatologists accepting new patients were included in the study; practices were not included if they had exclusive insurance plans; were pediatric, cosmetic, or research only; or were nonresponsive to calls. From August 2022 to September 2022, each practice was called twice within a 36-hour period—once by a simulated patient with Medi-Cal and once by a simulated patient with BCBS—and were asked about availability for new patient FBSE appointments and accepted insurance types. Data were analyzed using SAS software (SAS Institute Inc.).
Los Angeles County comprises 269 zip codes, of which 82 (30.5%) have dermatology practices. Of 213 total dermatologists in LA County listed on the American Academy of Dermatology website, 193 (90.6%) met preliminary criteria, and 169 (79.3%) were successfully contacted. Almost all (94.6% [160/169]) accepted new patients for FBSEs; of those, 63.1% (101/160) accepted only private insurance, 16.9% (27/160) accepted both private insurance and Medi-Cal, and 16.2% (26/160) did not accept any insurance. Racial predominance for each dermatology practice was analyzed by zip code (Table). Dermatologists included in our study were significantly more concentrated in predominantly non- Hispanic White areas of LA County vs predominantly Hispanic areas (P<.0001). Notably, the average income in predominantly non-Hispanic White zip codes ($114,757.74) was significantly higher than in predominantly Hispanic areas ($58,278.54)(P=.001)(Table).4
In LA County, 40.1% (108/269) of zip codes have no racial majority, 28.2% (76/269) are predominantly Hispanic, 27.5% (74/269) are predominantly non-Hispanic White, 2.2% (6/269) are predominantly Black, and 1.9% (5/269) are predominantly Asian.4 There are no dermatologists in predominantly Black zip codes, 2 in predominantly Asian zip codes, 14 in predominantly Hispanic zip codes, 38 in zip codes with no racial majority, and 106 in predominantly non-Hispanic White zip codes. There are significantly more dermatologists in predominantly non-Hispanic White zip codes compared to predominantly Hispanic zip codes (P<.0001). In LA County, the average income in predominantly Asian, non-Hispanic White, and Hispanic zip codes was $93,594, $114,757.84, and $58,278.54, respectively, in 2021.4 The average income in predominantly non-Hispanic White zip codes was significantly higher than in predominantly Hispanic zip codes (P=.001). There were no income data available for predominantly Black zip codes or zip codes with no racial majority.
The results from our study revealed potential barriers to FBSEs for racial and ethnic minorities in LA County, which supports previous research on the impact of SES, race, and insurance on access to dermatologic care.2,3 Predominantly Hispanic zip codes have significantly lower income (P<.0001) and fewer dermatologists (P=.001) compared to zip codes that are predominantly non-Hispanic White, reflecting how lower SES correlates with worse health outcomes and higher melanoma mortality. Conversely, predominantly non-Hispanic White areas with higher income have better access to dermatologists, which may contribute to the improved melanoma survival rates among White patients. Additionally, most dermatologists accept only private insurance, further highlighting the disparity in FBSE access for non-White patients across LA County. While our study focused on FBSE access, our findings may point to a wider barrier to dermatologic care, especially in zip codes with fewer dermatologists. Further studies are needed to determine whether these areas also face barriers to accessing primary care.
Our study was limited by the exclusion of nonphysician providers (eg, nurse practitioners, physician assistants), a small sample size, and lack of available economic data for predominantly Black zip codes.4 Additionally, the exclusion of practices with exclusive insurance plans (eg, Kaiser Permanente) limited the generalizability of our findings, as our results did not account for the populations served by these practices. Furthermore, our analysis did not account for variations in practice size or the proportion of care provided to patients with different insurance types, which could impact overall accessibility. Additional studies are needed to explore the impact of these factors on access to general dermatologic care and not just FBSEs.
Racial/ethnic minorities and lower SES populations face major barriers to FBSE access in LA County, such as difficulty finding a dermatologist in their area or one who accepts Medi-Cal. Addressing these disparities is crucial for improving skin cancer outcomes. Further research is needed to develop strategies to eliminate these barriers to dermatologic care, such as increasing access to teledermatology, offering mobile dermatology clinics, and improving insurance coverage.
- Chiaravalloti AJ, Laduca JR. Melanoma screening by means of complete skin exams for all patients in a dermatology practice reduces the thickness of primary melanomas at diagnosis. J Clin Aesthet Dermatol. 2014;7:18-22.
- Qian Y, Johannet P, Sawyers A, et al. The ongoing racial disparities in melanoma: an analysis of the Surveillance, Epidemiology, and End Results database (1975-2016). J Am Acad Dermatol. 2021;84:1585-1593.
- Baranowski MLH, Yeung H, Chen SC, et al. Factors associated with time to surgery in melanoma: an analysis of the National Cancer Database. J Am Acad Dermatol. 2019;81:908-916.
- United States Census Bureau. Explore census data. Accessed March 17, 2025. https://data.census.gov/all?q=los+angeles+county
- Berkowitz SA, Traore CY, Singer DE, et al. Evaluating area-based socioeconomic status indicators for monitoring disparities within health care systems: results from a primary care network. Health Serv Res. 2015;50:398-417.
- Jacobs B, Ir P, Bigdeli M, et al. Addressing access barriers to health services: an analytical framework for selecting appropriate interventions in lowincome Asian countries. Health Policy Plan. 2012;27:288-300.
Evaluating Access to Full-Body Skin Examinations in Los Angeles County, California
Evaluating Access to Full-Body Skin Examinations in Los Angeles County, California
PRACTICE POINTS
- Socioeconomic and racial disparities impact access to full-body skin examinations (FBSEs) in Los Angeles County.
- Most dermatologists included in this study were accepting new patients for a FBSE.
- There are significantly more dermatologists in predominantly non-Hispanic White zip codes than in predominantly Hispanic zip codes in Los Angeles County.
Clinical Accuracy of Skin Cancer Diagnosis: Investigation of Keratinocyte Carcinoma Mismatch Rates
Clinical Accuracy of Skin Cancer Diagnosis: Investigation of Keratinocyte Carcinoma Mismatch Rates
To the Editor:
The incidence of nonmelanoma skin cancer (NMSC) is rapidly increasing worldwide. Due to its highly curable nature when treated early, accurate diagnosis is the cornerstone to good patient outcomes.1 Accurate diagnosis of skin cancer and subsequent treatment decisions rely heavily on the congruence between clinical observations and histopathologic assessments. Clinical misdiagnosis of a malignant lesion can lead to delayed and suboptimal treatment, which may contribute to serious complications such as metastasis or even mortality. In this study, data from clinically diagnosed basal cell carcinomas (BCCs) and squamous cell carcinomas (SCCs) were compared to their identified histopathologic subtype classifications. The accuracy of the clinical diagnosis of these NMSCs was assessed by determining the rate of misdiagnosis and the respective positive predictive value (PPV).
A retrospective review of medical records from a private dermatology practice in Lubbock, Texas, was conducted to identify patients diagnosed with NMSC from January 1, 2017, through December 31, 2021. A total of 11,229 NMSCs were diagnosed and treated in 5877 patients. Of the NMSCs diagnosed, 11,145 were identified as keratinocyte carcinomas and were classified as BCCs or SCCs. The accuracy of the clinical diagnoses was determined by comparison to the histologic subtype identified via biopsy of the lesion. Although the use of a dermatoscope during the clinical encounter was not formally recorded, reports from the examining dermatologists indicated it was not used in the majority of cases.
If a lesion was clinically diagnosed as a BCC but was identified as a subtype of SCC on histology (or vice versa), the lesion was considered to be mismatched. The number of mismatched lesions and the mismatch rate for each lesion type/subtype is recorded in the Table. Of the total 11,145 keratinocyte carcinomas included in our study, there was an overall 10.63% mismatch rate, with 1185 of the malignancies having a differing clinical diagnosis (eg, BCC vs SCC) from the histologic findings. The clinical mismatch rate was notably higher for SCC compared to BCC (15.83% vs 7.03%, respectively).
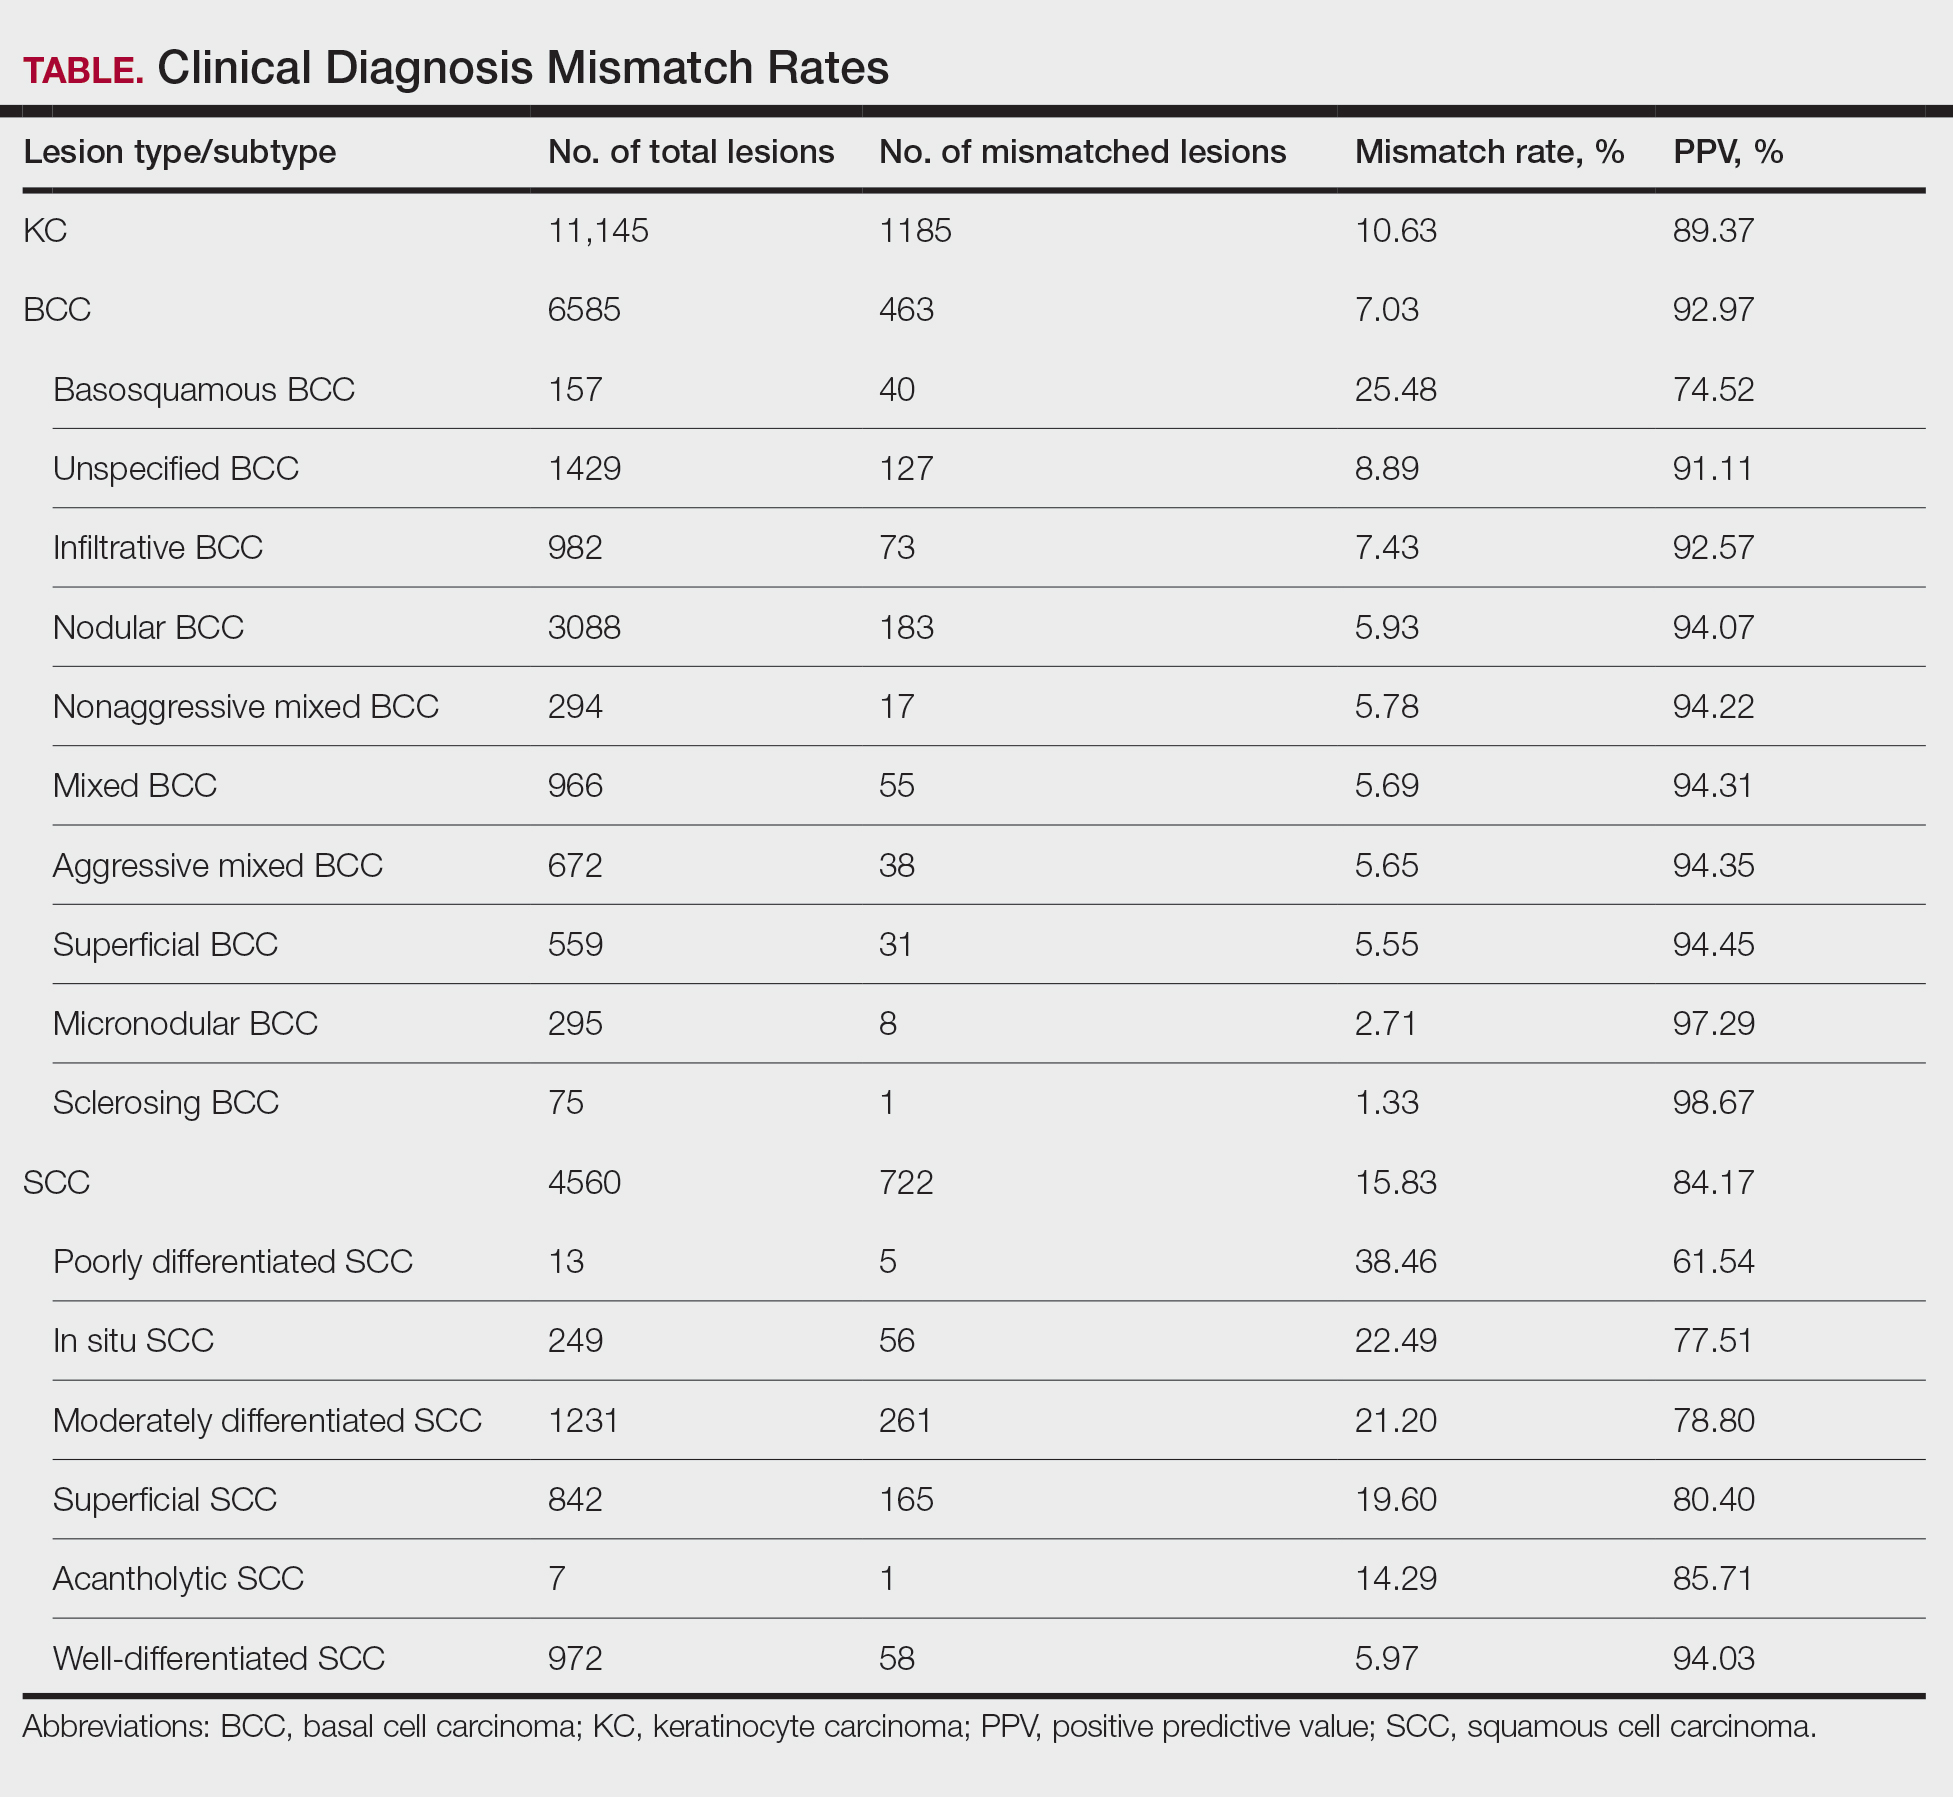
The Table provides a breakdown of the BCC subtypes identified by histology with their computed mismatch rate and PPV. It is worth clarifying that lesions classified as more than one BCC subtype per the histologic findings were diagnosed as mixed BCC; these were further classified as mixed-aggressive BCC (if at least one aggressive BCC subtype was present) and mixed nonaggressive BCC (if no aggressive BCC subtype was present). Overall, BCCs were less likely to be misdiagnosed, with an average PPV of 92.97% compared to 84.17% for SCCs. Basosquamous BCC was the BCC subtype with the highest mismatch rate (25.48%), while sclerosing BCC has the lowest overall mismatch rate (1.33%). The most common malignancy was BCC, with nodular BCC being the most common subtype.
The Table also breaks down the SCC subtypes, reporting the most commonly misdiagnosed of any BCC or SCC subtype to be poorly differentiated SCC (mismatch rate, 38.46%). The lowest mismatch rate of the SCC subtypes was 5.97% for well-differentiated SCC.
There was an overall PPV of 89.37% in clinically evaluated malignancies and their respective histologic subtypes. Basal cell carcinoma had a lower overall mismatch rate of 7.03% compared to 15.83% in SCC. The most common misdiagnosis was attributed to poorly differentiated SCC (mismatch rate, 38.46%), while the least common misdiagnosed malignancy was sclerosing BCC (1.33%). The high mismatch rate of poorly differentiated SCC may be due to its diverging presentation from a typical SCC as a flat lesion with the absence of scaling, keratin, or bleeding, leading to the misdiagnosis of BCC.2
Accurate clinical diagnosis of NMSCs is the basis for further evaluation and treatment that should ensue in a timely manner; however, accurately identifying BCCs vs SCCs solely based on clinical examination can be challenging due to variable manifestations and overlapping features. Basal cell carcinoma commonly presents as a shiny pink/flesh-colored nodule, macule, or patch with surface telangiectasia, sometimes appearing with ulceration or crusting.3 Alternatively, SCC typically appears as a firm, sharply demarcated, red nodule with a thick overlying scale.4 Definitive diagnoses can be difficult upon clinical examination since these features can be shared between the 2 subtypes. To aid in these uncertainties, a growing number of clinicians are implementing the use of dermoscopy in their everyday practice.
Dermoscopy is an extremely useful tool in improving the diagnostic accuracy of skin cancers compared to examination with the naked eye, as it provides detailed visualization of specific structures and patterns in skin cancer lesions.5 The dermoscopic appearance of BCC is characterized by pearly blue-gray or translucent globules with arborizing vessels, spoke-wheel structures, and leaflike areas.5,6 Conversely, dermoscopic features of SCC may include a milky-red globule with a scaly, sharply demarcated, crusted lesion with polymorphous vasculature, sometimes resembling a persistent sore or nonhealing wound.4,5 Though the use of dermoscopy can aid in diagnosis upon initial examination, certain factors such as trauma, ulceration, and previous treatments that distorted the lesion’s architecture may lead to misdiagnosis. Furthermore, the distinct vascular patterns found in BCC and SCC may be mistaken for each other and therefore lead to misdiagnosis upon examination.7 Other variables that may complicate diagnosis include the location of the lesion, its size, and the presence of other skin conditions or nearby lesions.
The primary limitation of the current study was the limited scope of the data, as they were derived from patients seen at one private dermatology practice, preventing the generalizability of our findings. However, our results show trends similar to those observed in other studies analyzing the clinical accuracy of skin cancer diagnoses, with higher PPVs for BCC compared to SCC. A study by Ahnlide and Bjellerup8 was based in a hospital dermatology department and demonstrated a PPV of 85.5% for BCC compared to 92.97% in our study; for SCC, the PPV was 67.3% compared to 84.17% in our study. In another study by Heal et al,9 data were collected from an Australian registry that included records of all histologically confirmed skin cancers from December 1996 to October 1999 from 202 general practitioners and 42 specialists, including 1 dermatologist. The PPVs for BCC and SCC were 72.7% and 49.4%, respectively. Although our results indicated higher PPVs compared to these 2 studies, some of the discrepancies can be accounted for by the differences in clinical setting as well as the lack of expertise of nondermatologist physicians in identifying skin malignancies in the study by Heal et al.9
The current study was further limited by the lack of data quantifying the number of lesions clinically suspected to be malignant but found to be histologically benign. It is typical for clinicians to have a low threshold to biopsy a suspicious lesion with atypical features (eg, rapid evolution and growth, bleeding, crusting). Furthermore, the identification of risk factors in the patient’s medical and family history (eg, exposure to radiation, personal or family history of skin cancers) can heavily influence a clinician’s decision to biopsy a lesion with an atypical appearance.10 Many benign lesions are biopsied to avoid missing a diagnosis of malignancy. Consequently, our results suggest a high degree of clinical misdiagnosis of BCCs and SCCs. Obtaining data on the number of lesions suspected to be BCC or SCC that were found to be histologically benign would be a valuable addition to our study, as it would provide a measurable insight into the sensitivity of clinicians’ decision-making to identify a lesion as suspicious and warranting biopsy.
While clinical diagnosis plays a vital role in identifying suspected NMSCs such as BCC and SCC, its accuracy can be limited even with the use of dermoscopy. Overall, our data have shown a high rate of diagnostic accuracy upon suspicion of malignancy, but the different variables that affect clinical presentation promote histologic diagnosis to prevail as the gold standard.
- Seyed Ahadi M, Firooz A, Rahimi H, et al. Clinical diagnosis has a high negative predictive value in evaluation of malignant skin lesions. Dermatol Res Pract. 2021;2021:6618990. doi:10.1155/2021/6618990
- Lallas A, Pyne J, Kyrgidis A, et al. The clinical and dermoscopic features of invasive cutaneous squamous cell carcinoma depend on the histopathological grade of differentiation. Br J Dermatol. 2015;172:1308- 1315. doi:10.1111/bjd.13510
- McDaniel B, Badri T, Steele RB. Basal cell carcinoma. September 19, 2022. In: StatPearls. StatPearls Publishing; 2023.
- Suárez AL, Louis P, Kitts J, et al. Clinical and dermoscopic features of combined cutaneous squamous cell carcinoma (SCC)/neuroendocrine [Merkel cell] carcinoma (MCC). J Am Acad Dermatol. 2015;73:968-975. doi:10.1016/j.jaad.2015.08.041
- Wolner ZJ, Yélamos O, Liopyris K, et al. Enhancing skin cancer diagnosis with dermoscopy. Dermatol Clin. 2017;35:417-437. doi:10.1016/j.det.2017.06.003
- Reiter O, Mimouni I, Dusza S, et al. Dermoscopic features of basal cell carcinoma and its subtypes: a systematic review. J Am Acad Dermatol. 2021;85:653-664. doi:10.1016/j.jaad.2019.11.008
- Pruneda C, Ramesh M, Hope L, et al. Nonmelanoma skin cancers: diagnostic accuracy of midlevel providers versus dermatologists. The Dermatologist. March 2023. Accessed March 18, 2025. https://www.hmpgloballearningnetwork.com/site/thederm/feature-story/nonmelanoma-skin-cancers-diagnostic-accuracy-midlevel-providers-vs
- Ahnlide I, Bjellerup M. Accuracy of clinical skin tumour diagnosis in a dermatological setting. Acta Derm Venereol. 2013;93:305-308. doi:10.2340/00015555-1560
- Heal CF, Raasch BA, Buettner PG, et al. Accuracy of clinical diagnosis of skin lesions. Br J Dermatol. 2008;159:661-668.
- Fu S, Kim S, Wasko C. Dermatological guide for primary care physicians: full body skin checks, skin cancer detection, and patient education on self-skin checks and sun protection. Proc (Bayl Univ Med Cent). 2024;37:647-654. doi:10.1080/08998280.2024.2351751
To the Editor:
The incidence of nonmelanoma skin cancer (NMSC) is rapidly increasing worldwide. Due to its highly curable nature when treated early, accurate diagnosis is the cornerstone to good patient outcomes.1 Accurate diagnosis of skin cancer and subsequent treatment decisions rely heavily on the congruence between clinical observations and histopathologic assessments. Clinical misdiagnosis of a malignant lesion can lead to delayed and suboptimal treatment, which may contribute to serious complications such as metastasis or even mortality. In this study, data from clinically diagnosed basal cell carcinomas (BCCs) and squamous cell carcinomas (SCCs) were compared to their identified histopathologic subtype classifications. The accuracy of the clinical diagnosis of these NMSCs was assessed by determining the rate of misdiagnosis and the respective positive predictive value (PPV).
A retrospective review of medical records from a private dermatology practice in Lubbock, Texas, was conducted to identify patients diagnosed with NMSC from January 1, 2017, through December 31, 2021. A total of 11,229 NMSCs were diagnosed and treated in 5877 patients. Of the NMSCs diagnosed, 11,145 were identified as keratinocyte carcinomas and were classified as BCCs or SCCs. The accuracy of the clinical diagnoses was determined by comparison to the histologic subtype identified via biopsy of the lesion. Although the use of a dermatoscope during the clinical encounter was not formally recorded, reports from the examining dermatologists indicated it was not used in the majority of cases.
If a lesion was clinically diagnosed as a BCC but was identified as a subtype of SCC on histology (or vice versa), the lesion was considered to be mismatched. The number of mismatched lesions and the mismatch rate for each lesion type/subtype is recorded in the Table. Of the total 11,145 keratinocyte carcinomas included in our study, there was an overall 10.63% mismatch rate, with 1185 of the malignancies having a differing clinical diagnosis (eg, BCC vs SCC) from the histologic findings. The clinical mismatch rate was notably higher for SCC compared to BCC (15.83% vs 7.03%, respectively).
The Table provides a breakdown of the BCC subtypes identified by histology with their computed mismatch rate and PPV. It is worth clarifying that lesions classified as more than one BCC subtype per the histologic findings were diagnosed as mixed BCC; these were further classified as mixed-aggressive BCC (if at least one aggressive BCC subtype was present) and mixed nonaggressive BCC (if no aggressive BCC subtype was present). Overall, BCCs were less likely to be misdiagnosed, with an average PPV of 92.97% compared to 84.17% for SCCs. Basosquamous BCC was the BCC subtype with the highest mismatch rate (25.48%), while sclerosing BCC has the lowest overall mismatch rate (1.33%). The most common malignancy was BCC, with nodular BCC being the most common subtype.
The Table also breaks down the SCC subtypes, reporting the most commonly misdiagnosed of any BCC or SCC subtype to be poorly differentiated SCC (mismatch rate, 38.46%). The lowest mismatch rate of the SCC subtypes was 5.97% for well-differentiated SCC.
There was an overall PPV of 89.37% in clinically evaluated malignancies and their respective histologic subtypes. Basal cell carcinoma had a lower overall mismatch rate of 7.03% compared to 15.83% in SCC. The most common misdiagnosis was attributed to poorly differentiated SCC (mismatch rate, 38.46%), while the least common misdiagnosed malignancy was sclerosing BCC (1.33%). The high mismatch rate of poorly differentiated SCC may be due to its diverging presentation from a typical SCC as a flat lesion with the absence of scaling, keratin, or bleeding, leading to the misdiagnosis of BCC.2
Accurate clinical diagnosis of NMSCs is the basis for further evaluation and treatment that should ensue in a timely manner; however, accurately identifying BCCs vs SCCs solely based on clinical examination can be challenging due to variable manifestations and overlapping features. Basal cell carcinoma commonly presents as a shiny pink/flesh-colored nodule, macule, or patch with surface telangiectasia, sometimes appearing with ulceration or crusting.3 Alternatively, SCC typically appears as a firm, sharply demarcated, red nodule with a thick overlying scale.4 Definitive diagnoses can be difficult upon clinical examination since these features can be shared between the 2 subtypes. To aid in these uncertainties, a growing number of clinicians are implementing the use of dermoscopy in their everyday practice.
Dermoscopy is an extremely useful tool in improving the diagnostic accuracy of skin cancers compared to examination with the naked eye, as it provides detailed visualization of specific structures and patterns in skin cancer lesions.5 The dermoscopic appearance of BCC is characterized by pearly blue-gray or translucent globules with arborizing vessels, spoke-wheel structures, and leaflike areas.5,6 Conversely, dermoscopic features of SCC may include a milky-red globule with a scaly, sharply demarcated, crusted lesion with polymorphous vasculature, sometimes resembling a persistent sore or nonhealing wound.4,5 Though the use of dermoscopy can aid in diagnosis upon initial examination, certain factors such as trauma, ulceration, and previous treatments that distorted the lesion’s architecture may lead to misdiagnosis. Furthermore, the distinct vascular patterns found in BCC and SCC may be mistaken for each other and therefore lead to misdiagnosis upon examination.7 Other variables that may complicate diagnosis include the location of the lesion, its size, and the presence of other skin conditions or nearby lesions.
The primary limitation of the current study was the limited scope of the data, as they were derived from patients seen at one private dermatology practice, preventing the generalizability of our findings. However, our results show trends similar to those observed in other studies analyzing the clinical accuracy of skin cancer diagnoses, with higher PPVs for BCC compared to SCC. A study by Ahnlide and Bjellerup8 was based in a hospital dermatology department and demonstrated a PPV of 85.5% for BCC compared to 92.97% in our study; for SCC, the PPV was 67.3% compared to 84.17% in our study. In another study by Heal et al,9 data were collected from an Australian registry that included records of all histologically confirmed skin cancers from December 1996 to October 1999 from 202 general practitioners and 42 specialists, including 1 dermatologist. The PPVs for BCC and SCC were 72.7% and 49.4%, respectively. Although our results indicated higher PPVs compared to these 2 studies, some of the discrepancies can be accounted for by the differences in clinical setting as well as the lack of expertise of nondermatologist physicians in identifying skin malignancies in the study by Heal et al.9
The current study was further limited by the lack of data quantifying the number of lesions clinically suspected to be malignant but found to be histologically benign. It is typical for clinicians to have a low threshold to biopsy a suspicious lesion with atypical features (eg, rapid evolution and growth, bleeding, crusting). Furthermore, the identification of risk factors in the patient’s medical and family history (eg, exposure to radiation, personal or family history of skin cancers) can heavily influence a clinician’s decision to biopsy a lesion with an atypical appearance.10 Many benign lesions are biopsied to avoid missing a diagnosis of malignancy. Consequently, our results suggest a high degree of clinical misdiagnosis of BCCs and SCCs. Obtaining data on the number of lesions suspected to be BCC or SCC that were found to be histologically benign would be a valuable addition to our study, as it would provide a measurable insight into the sensitivity of clinicians’ decision-making to identify a lesion as suspicious and warranting biopsy.
While clinical diagnosis plays a vital role in identifying suspected NMSCs such as BCC and SCC, its accuracy can be limited even with the use of dermoscopy. Overall, our data have shown a high rate of diagnostic accuracy upon suspicion of malignancy, but the different variables that affect clinical presentation promote histologic diagnosis to prevail as the gold standard.
- Seyed Ahadi M, Firooz A, Rahimi H, et al. Clinical diagnosis has a high negative predictive value in evaluation of malignant skin lesions. Dermatol Res Pract. 2021;2021:6618990. doi:10.1155/2021/6618990
- Lallas A, Pyne J, Kyrgidis A, et al. The clinical and dermoscopic features of invasive cutaneous squamous cell carcinoma depend on the histopathological grade of differentiation. Br J Dermatol. 2015;172:1308- 1315. doi:10.1111/bjd.13510
- McDaniel B, Badri T, Steele RB. Basal cell carcinoma. September 19, 2022. In: StatPearls. StatPearls Publishing; 2023.
- Suárez AL, Louis P, Kitts J, et al. Clinical and dermoscopic features of combined cutaneous squamous cell carcinoma (SCC)/neuroendocrine [Merkel cell] carcinoma (MCC). J Am Acad Dermatol. 2015;73:968-975. doi:10.1016/j.jaad.2015.08.041
- Wolner ZJ, Yélamos O, Liopyris K, et al. Enhancing skin cancer diagnosis with dermoscopy. Dermatol Clin. 2017;35:417-437. doi:10.1016/j.det.2017.06.003
- Reiter O, Mimouni I, Dusza S, et al. Dermoscopic features of basal cell carcinoma and its subtypes: a systematic review. J Am Acad Dermatol. 2021;85:653-664. doi:10.1016/j.jaad.2019.11.008
- Pruneda C, Ramesh M, Hope L, et al. Nonmelanoma skin cancers: diagnostic accuracy of midlevel providers versus dermatologists. The Dermatologist. March 2023. Accessed March 18, 2025. https://www.hmpgloballearningnetwork.com/site/thederm/feature-story/nonmelanoma-skin-cancers-diagnostic-accuracy-midlevel-providers-vs
- Ahnlide I, Bjellerup M. Accuracy of clinical skin tumour diagnosis in a dermatological setting. Acta Derm Venereol. 2013;93:305-308. doi:10.2340/00015555-1560
- Heal CF, Raasch BA, Buettner PG, et al. Accuracy of clinical diagnosis of skin lesions. Br J Dermatol. 2008;159:661-668.
- Fu S, Kim S, Wasko C. Dermatological guide for primary care physicians: full body skin checks, skin cancer detection, and patient education on self-skin checks and sun protection. Proc (Bayl Univ Med Cent). 2024;37:647-654. doi:10.1080/08998280.2024.2351751
Clinical Accuracy of Skin Cancer Diagnosis: Investigation of Keratinocyte Carcinoma Mismatch Rates
Clinical Accuracy of Skin Cancer Diagnosis: Investigation of Keratinocyte Carcinoma Mismatch Rates
PRACTICE POINTS
- Malignant lesions may be misdiagnosed when assessments are guided by clinical features that align with typical presentations of other lesion types, potentially leading to diagnostic errors among experienced clinicians.
- Although dermoscopy is a beneficial tool in examining potential skin cancers, clinical observations should not bypass the gold standard of histopathologic examination.
Exploring the Relationship Between Psoriasis and Mobility Among US Adults
Exploring the Relationship Between Psoriasis and Mobility Among US Adults
To the Editor:
Psoriasis is a chronic inflammatory condition that affects individuals in various extracutaneous ways.1 Prior studies have documented a decrease in exercise intensity among patients with psoriasis2; however, few studies have specifically investigated baseline mobility in this population. Baseline mobility denotes an individual’s fundamental ability to walk or move around without assistance of any kind. Impaired mobility—when baseline mobility is compromised—is an aspect of the wider diversity, equity, and inclusion framework that underscores the significance of recognizing challenges and promoting inclusive measures, both at the point of care and in research.3 study sought to analyze the relationship between psoriasis and baseline mobility among US adults (aged 45 to 80 years) utilizing the latest data from the National Health and Nutrition Examination Survey (NHANES) database for psoriasis.4 We used three 2-year cycles of NHANES data to create a 2009-2014 dataset.
The overall NHANES response rate among adults aged 45 to 80 years between 2009 and 2014 was 67.9%. Patients were categorized as having impaired mobility if they responded “yes” to the following question: “Because of a health problem, do you have difficulty walking without using any special equipment?” Psoriasis status was assessed by the following question: “Have you ever been told by a doctor or other health professional that you had psoriasis?” Multivariable logistic regression analyses were performed using Stata/SE 18.0 software (StataCorp LLC) to assess the relationship between psoriasis and impaired mobility. Age, income, education, sex, race, tobacco use, diabetes status, body mass index, and arthritis status were controlled for in our models.
Our analysis initially included 9982 participants; 14 did not respond to questions assessing psoriasis and impaired mobility and were excluded. The prevalence of impaired mobility in patients with psoriasis was 17.1% compared with 10.9% among those without psoriasis (Table 1). There was a significant association between psoriasis and impaired mobility among patients aged 45 to 80 years after adjusting for potential confounding variables (adjusted odds ratio [AOR], 1.54; 95% CI, 1.04- 2.29; P=.032)(Table 2). Analyses of subgroups yielded no statistically significant results.
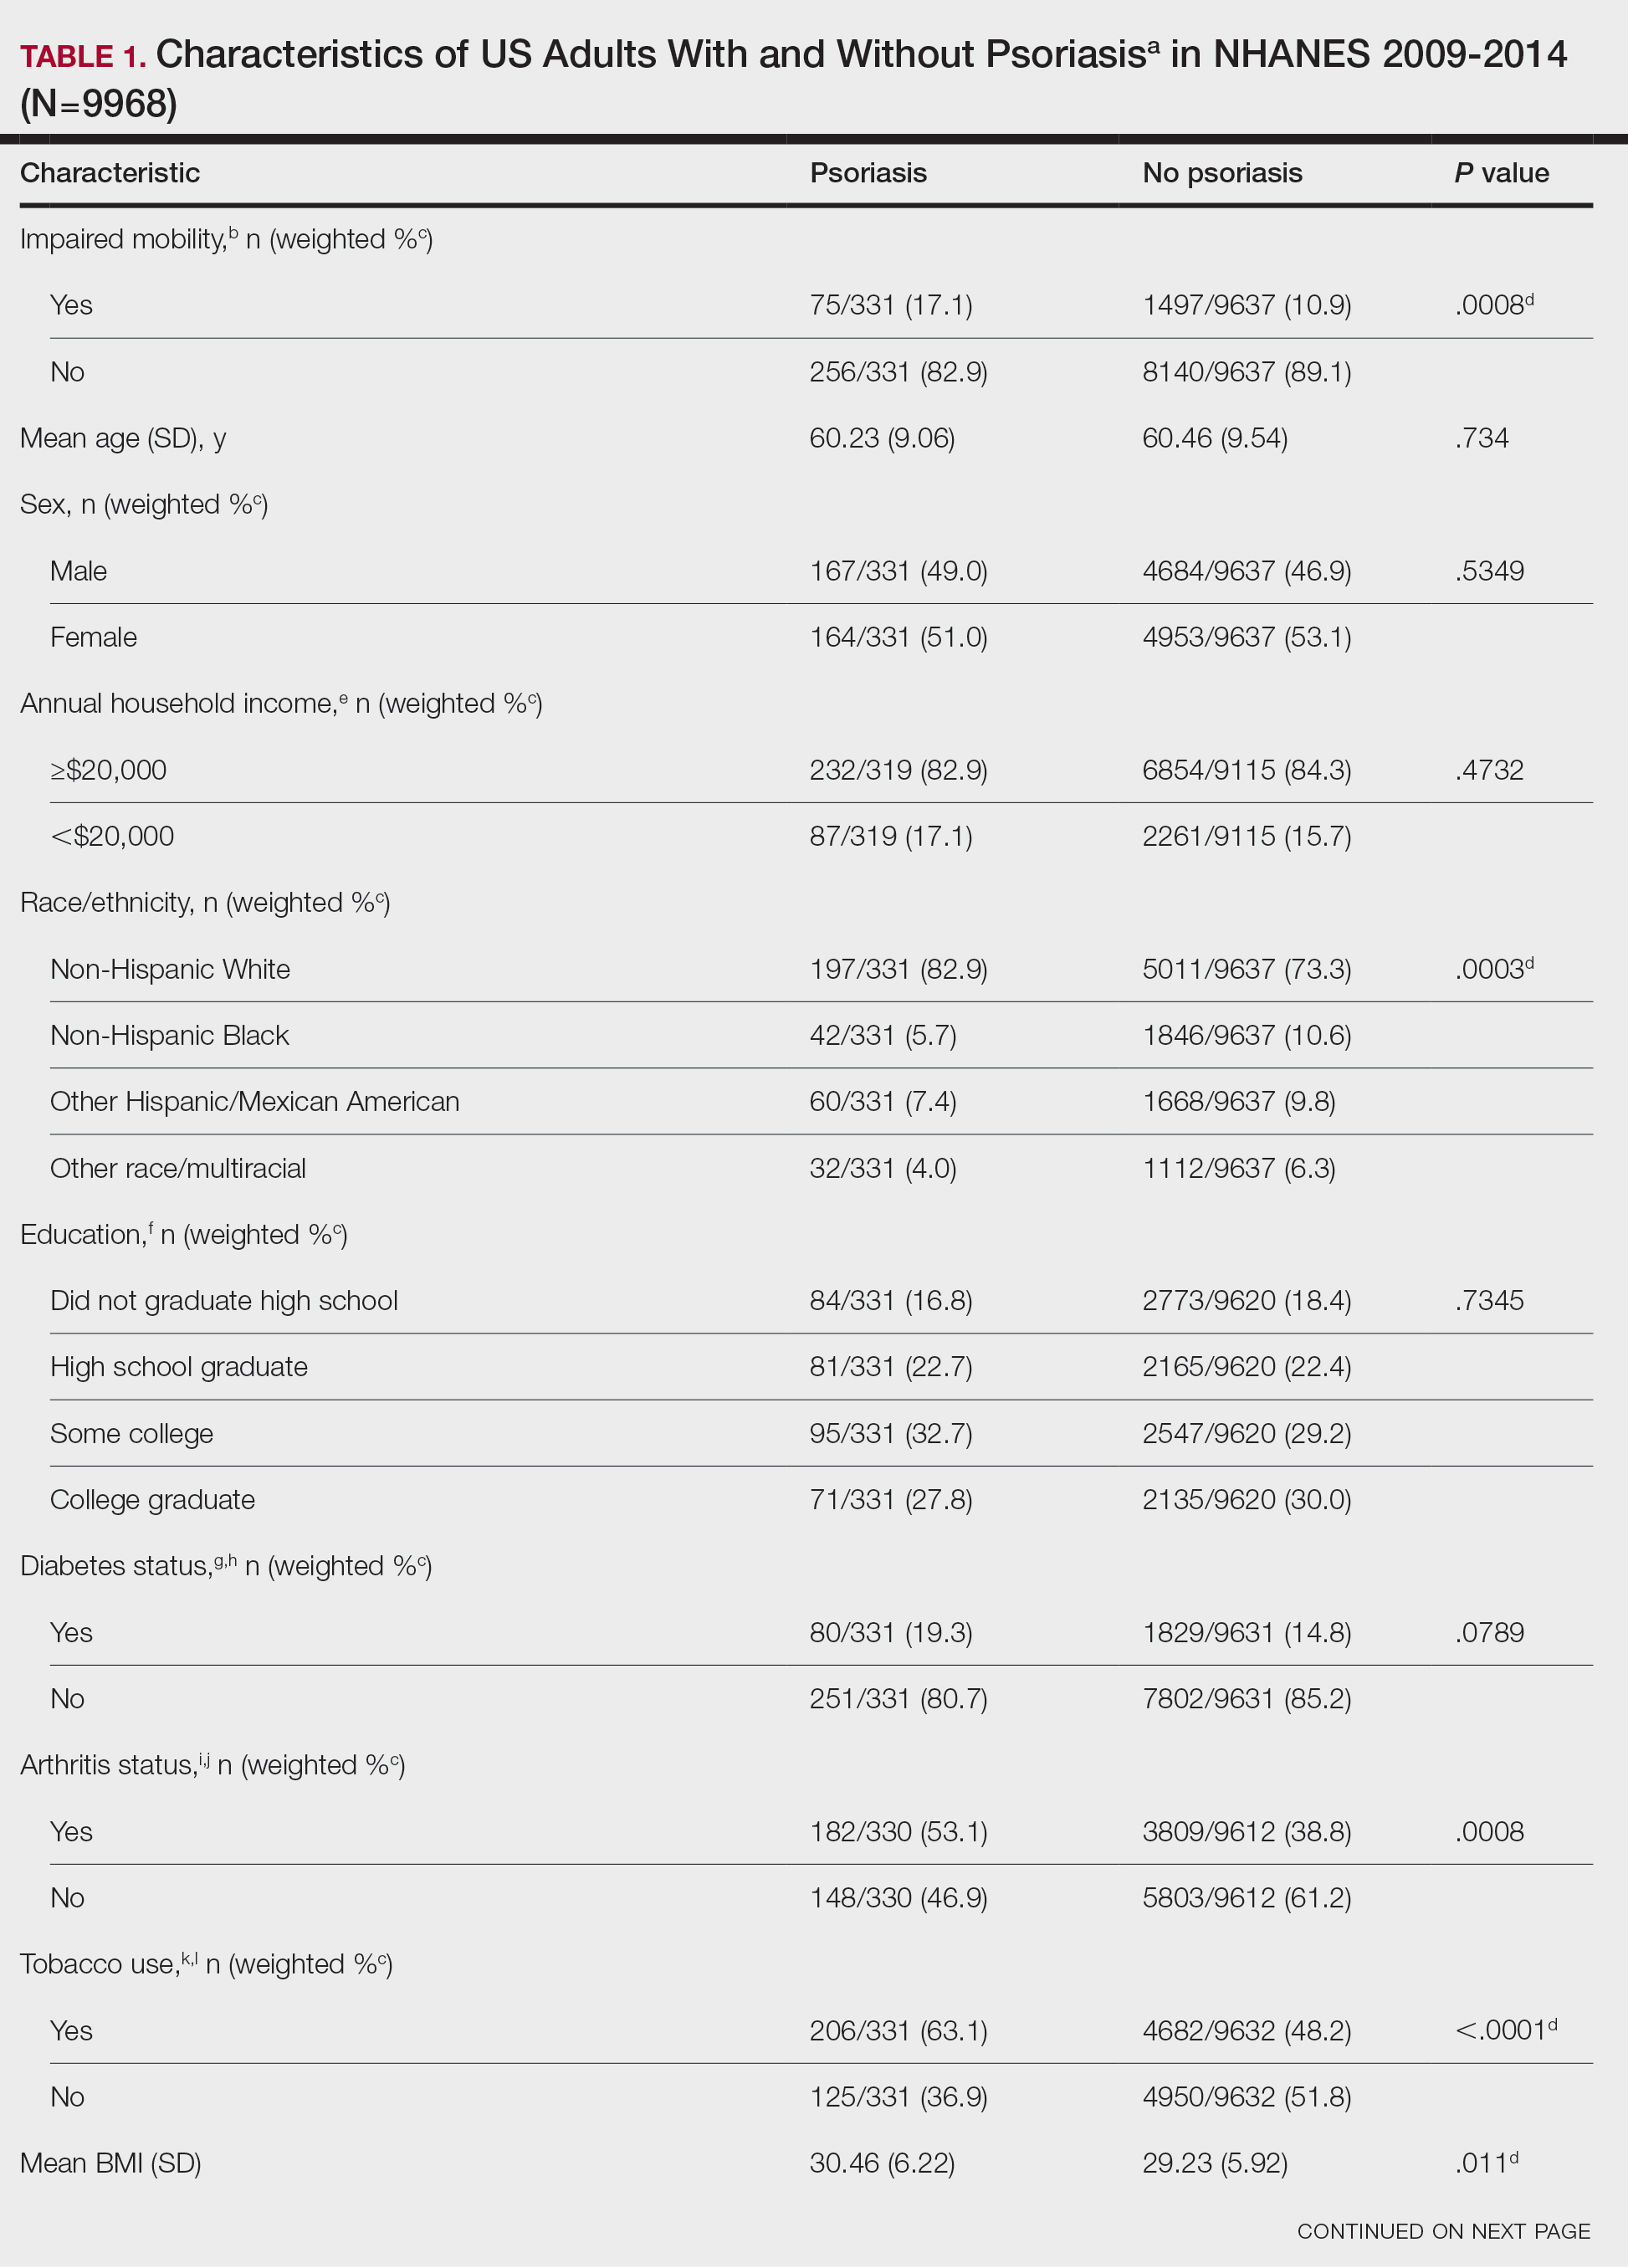
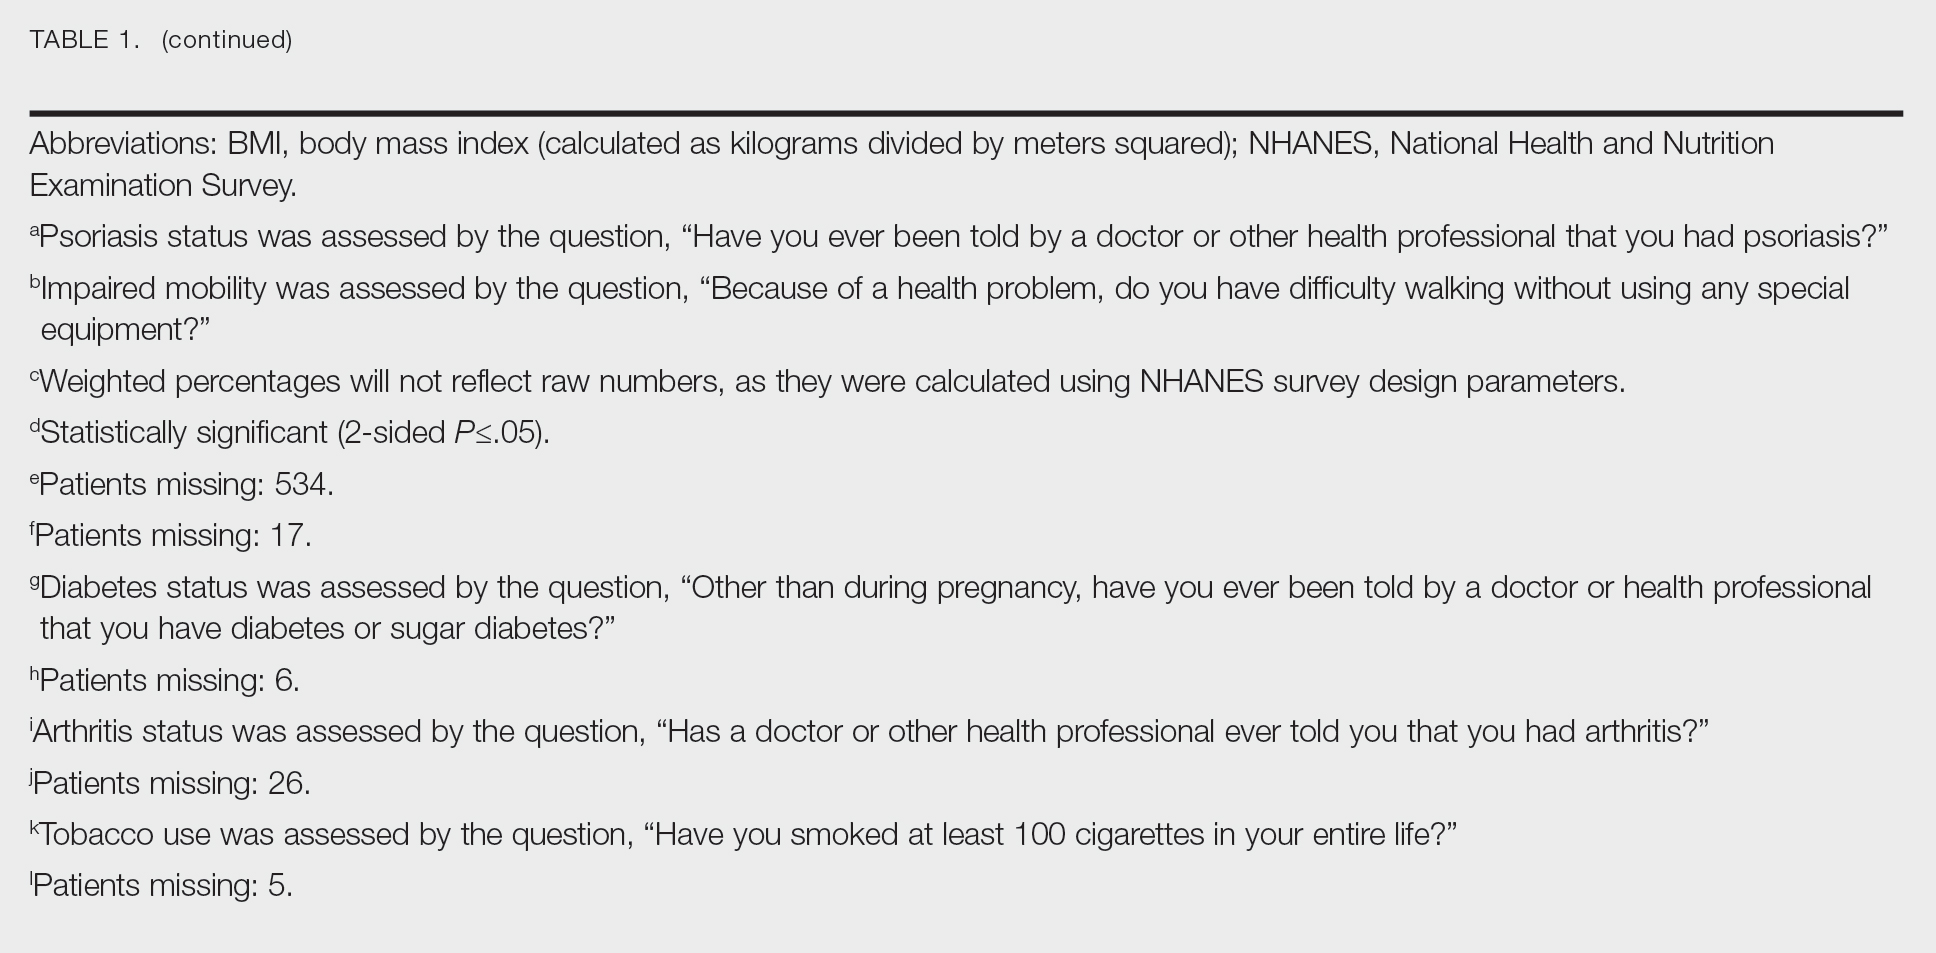
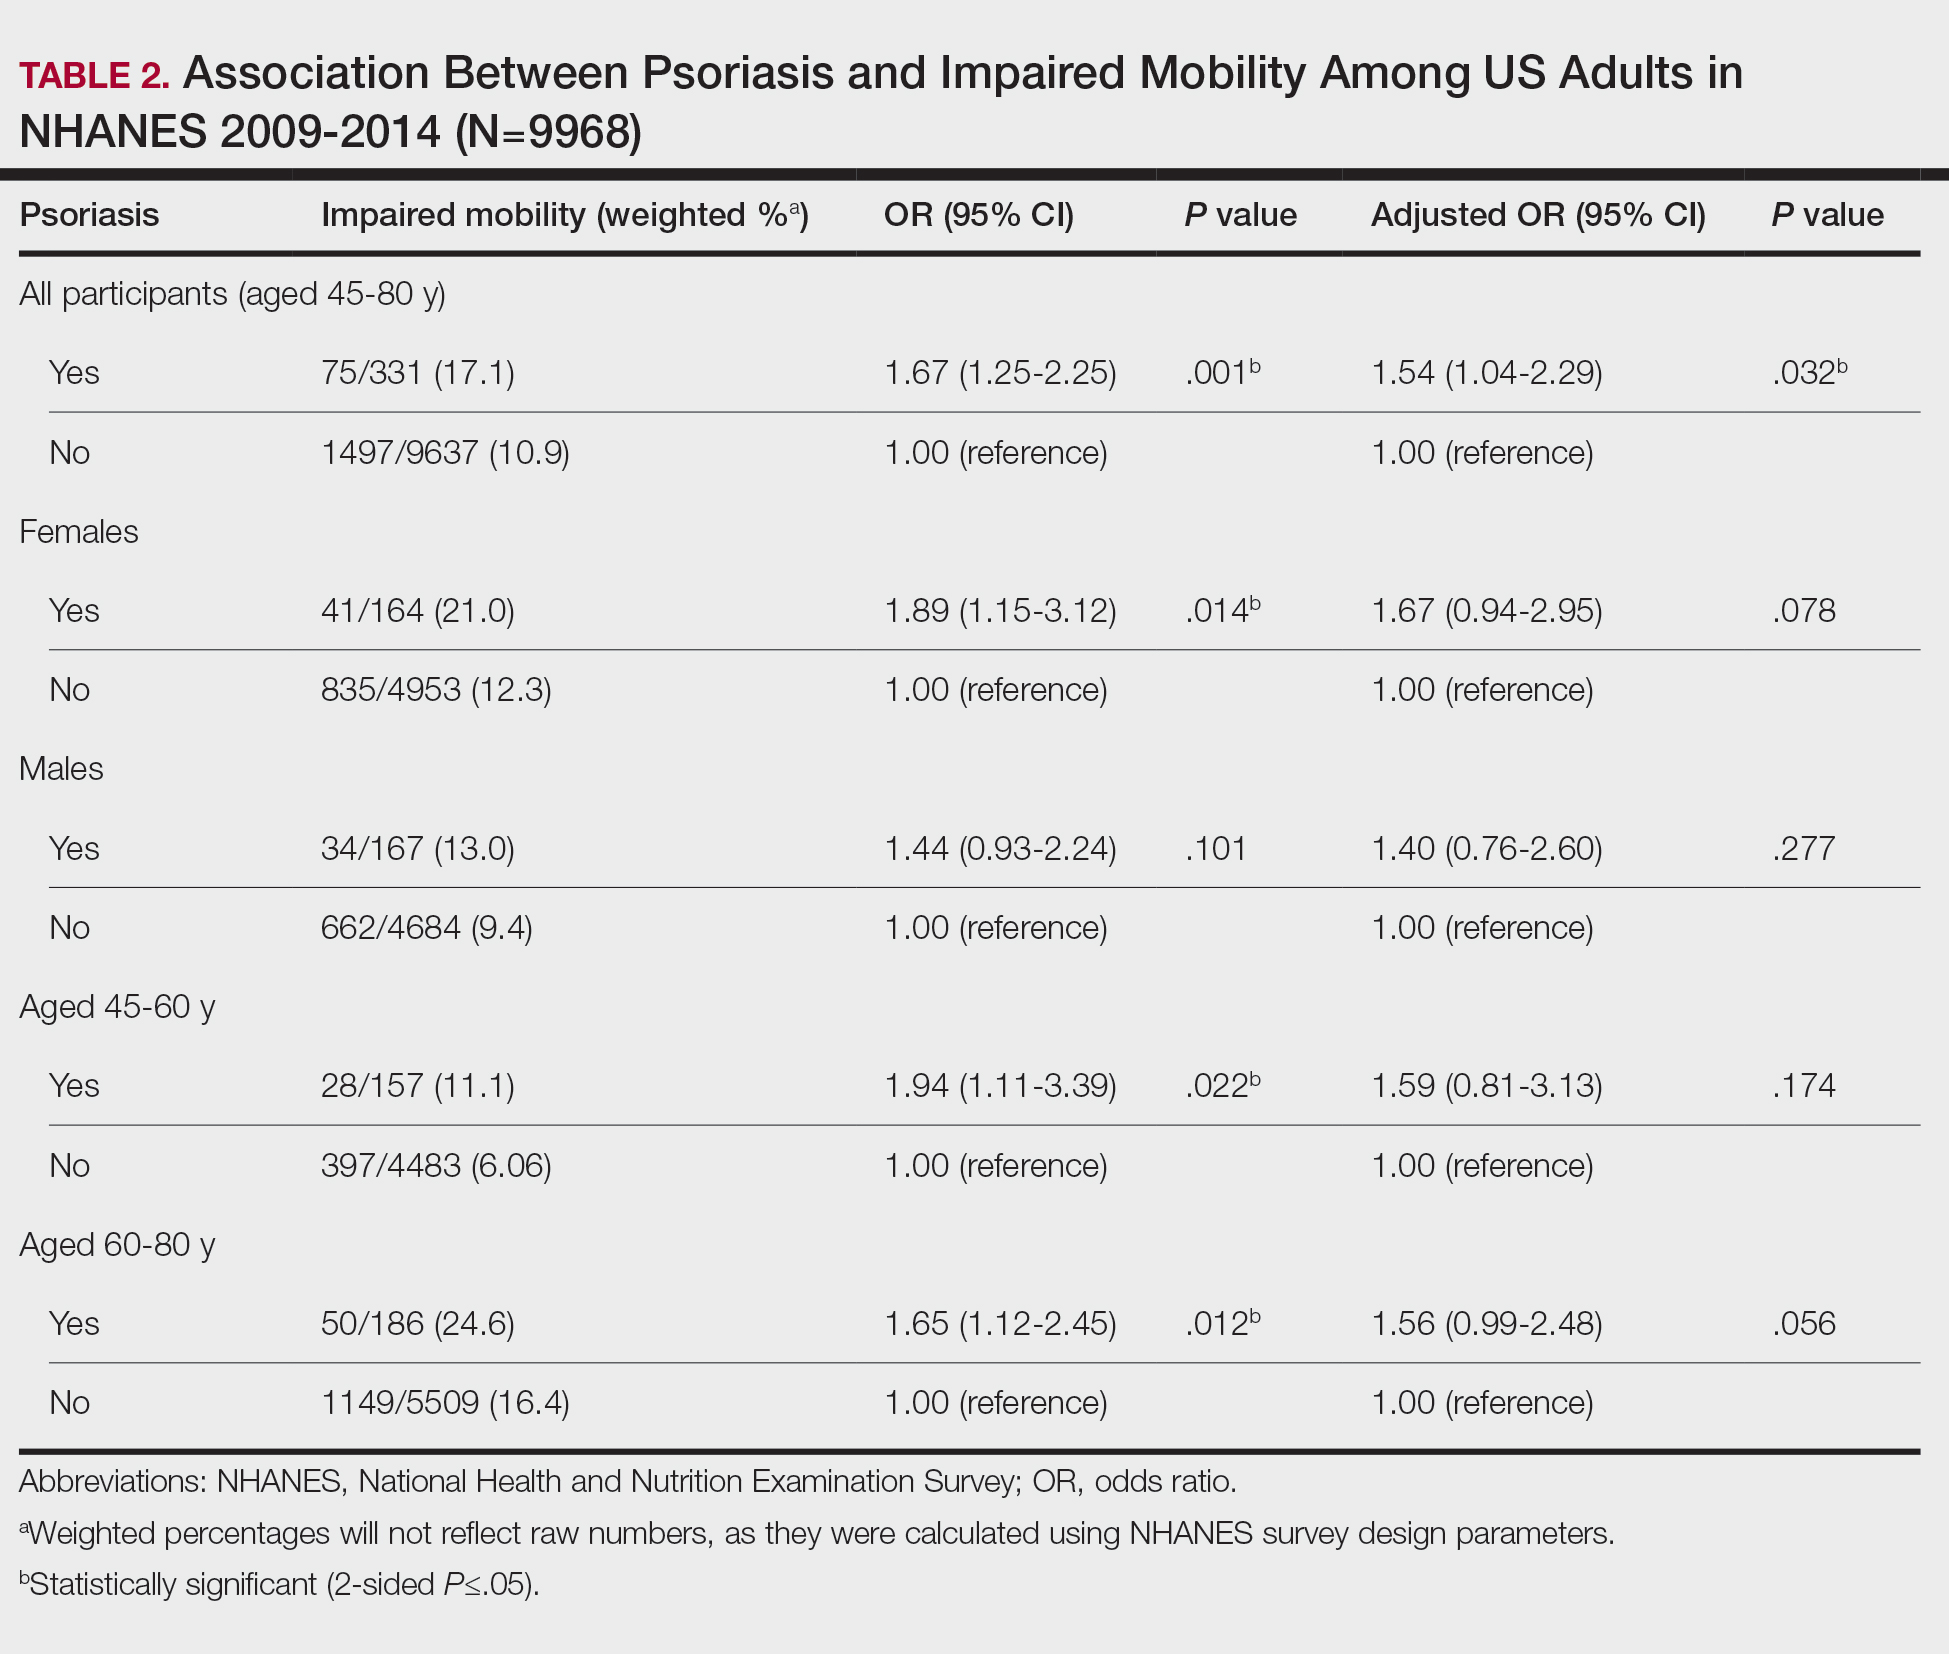
Our study demonstrated a statistically significant difference in mobility between individuals with psoriasis compared with the general population, which remained significant when controlling for arthritis, obesity, and diabetes (P=.032). This may be the result of several influences. First, the location of the psoriasis may impact mobility. Plantar psoriasis—a manifestation on the soles of the feet—can cause discomfort and pain, which can hinder walking and standing.5 Second, a study by Lasselin et al6 found that systemic inflammation contributes to mobility impairment through alterations in gait and posture, which suggests that the inflammatory processes inherent in psoriasis could intrinsically modify walking speed and stride, potentially exacerbating mobility difficulties independent of other comorbid conditions. These findings suggest that psoriasis may disproportionately affect individuals with impaired mobility, independent of comorbid arthritis, obesity, and diabetes.
These findings have broad implications for diversity, equity, and inclusion. They should prompt us to consider the practical challenges faced by this patient population and the ways that we can address barriers to care. Offering telehealth appointments, making primary care referrals for impaired mobility workups, and advising patients of direct-to-home delivery of prescriptions are good places to start.
Limitations to our study include the lack of specificity in the survey question, self-reporting bias, and the inability to control for the psoriasis location. Further investigations are warranted in large, representative US adult populations to assess the implications of impaired mobility in patients with psoriasis.
- Elmets CA, Leonardi CL, Davis DMR, et al. Joint AAD-NPF guidelines of care for the management and treatment of psoriasis with awareness and attention to comorbidities. J Am Acad Dermatol. 2019;80:1073-1113. doi: 10.1016/j.jaad.2018.11.058
- Zheng Q, Sun XY, Miao X, et al. Association between physical activity and risk of prevalent psoriasis: A MOOSE-compliant meta-analysis. Medicine (Baltimore). 2018;97:e11394. doi: 10.1097 /MD.0000000000011394
- Mullin AE, Coe IR, Gooden EA, et al. Inclusion, diversity, equity, and accessibility: from organizational responsibility to leadership competency. Healthc Manage Forum. 2021;34311-315. doi: 10.1177/08404704211038232
- Centers for Disease Control and Prevention. National Health and Nutrition Examination Survey. NHANES questionnaires, datasets, and related documentation. Accessed October 21, 2023. https://wwwn.cdc.gov/nchs/nhanes/
- Romani M, Biela G, Farr K, et al. Plantar psoriasis: a review of the literature. Clin Podiatr Med Surg. 2021;38:541-552. doi: 10.1016 /j.cpm.2021.06.009
- Lasselin J, Sundelin T, Wayne PM, et al. Biological motion during inflammation in humans. Brain Behav Immun. 2020;84:147-153. doi: 10.1016/j.bbi.2019.11.019
To the Editor:
Psoriasis is a chronic inflammatory condition that affects individuals in various extracutaneous ways.1 Prior studies have documented a decrease in exercise intensity among patients with psoriasis2; however, few studies have specifically investigated baseline mobility in this population. Baseline mobility denotes an individual’s fundamental ability to walk or move around without assistance of any kind. Impaired mobility—when baseline mobility is compromised—is an aspect of the wider diversity, equity, and inclusion framework that underscores the significance of recognizing challenges and promoting inclusive measures, both at the point of care and in research.3 study sought to analyze the relationship between psoriasis and baseline mobility among US adults (aged 45 to 80 years) utilizing the latest data from the National Health and Nutrition Examination Survey (NHANES) database for psoriasis.4 We used three 2-year cycles of NHANES data to create a 2009-2014 dataset.
The overall NHANES response rate among adults aged 45 to 80 years between 2009 and 2014 was 67.9%. Patients were categorized as having impaired mobility if they responded “yes” to the following question: “Because of a health problem, do you have difficulty walking without using any special equipment?” Psoriasis status was assessed by the following question: “Have you ever been told by a doctor or other health professional that you had psoriasis?” Multivariable logistic regression analyses were performed using Stata/SE 18.0 software (StataCorp LLC) to assess the relationship between psoriasis and impaired mobility. Age, income, education, sex, race, tobacco use, diabetes status, body mass index, and arthritis status were controlled for in our models.
Our analysis initially included 9982 participants; 14 did not respond to questions assessing psoriasis and impaired mobility and were excluded. The prevalence of impaired mobility in patients with psoriasis was 17.1% compared with 10.9% among those without psoriasis (Table 1). There was a significant association between psoriasis and impaired mobility among patients aged 45 to 80 years after adjusting for potential confounding variables (adjusted odds ratio [AOR], 1.54; 95% CI, 1.04- 2.29; P=.032)(Table 2). Analyses of subgroups yielded no statistically significant results.
Our study demonstrated a statistically significant difference in mobility between individuals with psoriasis compared with the general population, which remained significant when controlling for arthritis, obesity, and diabetes (P=.032). This may be the result of several influences. First, the location of the psoriasis may impact mobility. Plantar psoriasis—a manifestation on the soles of the feet—can cause discomfort and pain, which can hinder walking and standing.5 Second, a study by Lasselin et al6 found that systemic inflammation contributes to mobility impairment through alterations in gait and posture, which suggests that the inflammatory processes inherent in psoriasis could intrinsically modify walking speed and stride, potentially exacerbating mobility difficulties independent of other comorbid conditions. These findings suggest that psoriasis may disproportionately affect individuals with impaired mobility, independent of comorbid arthritis, obesity, and diabetes.
These findings have broad implications for diversity, equity, and inclusion. They should prompt us to consider the practical challenges faced by this patient population and the ways that we can address barriers to care. Offering telehealth appointments, making primary care referrals for impaired mobility workups, and advising patients of direct-to-home delivery of prescriptions are good places to start.
Limitations to our study include the lack of specificity in the survey question, self-reporting bias, and the inability to control for the psoriasis location. Further investigations are warranted in large, representative US adult populations to assess the implications of impaired mobility in patients with psoriasis.
- Elmets CA, Leonardi CL, Davis DMR, et al. Joint AAD-NPF guidelines of care for the management and treatment of psoriasis with awareness and attention to comorbidities. J Am Acad Dermatol. 2019;80:1073-1113. doi: 10.1016/j.jaad.2018.11.058
- Zheng Q, Sun XY, Miao X, et al. Association between physical activity and risk of prevalent psoriasis: A MOOSE-compliant meta-analysis. Medicine (Baltimore). 2018;97:e11394. doi: 10.1097 /MD.0000000000011394
- Mullin AE, Coe IR, Gooden EA, et al. Inclusion, diversity, equity, and accessibility: from organizational responsibility to leadership competency. Healthc Manage Forum. 2021;34311-315. doi: 10.1177/08404704211038232
- Centers for Disease Control and Prevention. National Health and Nutrition Examination Survey. NHANES questionnaires, datasets, and related documentation. Accessed October 21, 2023. https://wwwn.cdc.gov/nchs/nhanes/
- Romani M, Biela G, Farr K, et al. Plantar psoriasis: a review of the literature. Clin Podiatr Med Surg. 2021;38:541-552. doi: 10.1016 /j.cpm.2021.06.009
- Lasselin J, Sundelin T, Wayne PM, et al. Biological motion during inflammation in humans. Brain Behav Immun. 2020;84:147-153. doi: 10.1016/j.bbi.2019.11.019
Exploring the Relationship Between Psoriasis and Mobility Among US Adults
Exploring the Relationship Between Psoriasis and Mobility Among US Adults
PRACTICE POINTS
- Mobility issues are more common in patients who have psoriasis than in those who do not.
- It is important to assess patients with psoriasis for mobility issues regardless of age or comorbid conditions such as arthritis, obesity, and diabetes.
- Dermatologists can help patients with psoriasis and impaired mobility overcome potential barriers to care by incorporating telehealth services into their practices and informing patients of direct-to-home delivery of prescriptions.
Dermatologists’ Perspectives Toward Disability Assessment: A Nationwide Survey Report
Dermatologists’ Perspectives Toward Disability Assessment: A Nationwide Survey Report
To the Editor:
Cutaneous medical conditions can have a substantial impact on patients’ functioning and quality of life. Many patients with severe skin disease are eligible to receive disability assistance that can provide them with essential income and health care. Previous research has highlighted disability assessment as one of the most important ways physicians can help mitigate the health consequences of poverty.1 Dermatologists can play an important role in the disability assessment process by documenting the facts associated with patients’ skin conditions.
Although skin conditions have a relatively high prevalence, they remain underrepresented in disability claims. Between 1997 and 2004, occupational skin diseases accounted for 12% to 17% of nonfatal work-related illnesses; however, during that same period, skin conditions comprised only 0.21% of disability claims in the United States.2,3 Historically, there has been hesitancy among dermatologists to complete disability paperwork; a 1976 survey of dermatologists cited extensive paperwork, “troublesome patients,” and fee schedule issues as reasons.4 The lack of training regarding disability assessment in medical school and residency also has been noted.5
To characterize modern attitudes toward disability assessments, we conducted a survey of dermatologists across the United States. Our study was reviewed and declared exempt by the institutional review board of the Lundquist Institute for Biomedical Innovation at Harbor-UCLA Medical Center (Torrance, California)(approval #18CR-32242-01). Using convenience sampling, we emailed dermatologists from the Association of Professors of Dermatology and dermatology state societies in all 50 states inviting them to participate in our voluntary and anonymous survey, which was administered using SurveyMonkey. The use of all society mailing lists was approved by the respective owners. The 15-question survey included multiple choice, Likert scale, and free response sections. Summary and descriptive statistics were used to describe respondent demographics and identify any patterns in responses.
For each Likert-based question, participants ranked their degree of agreement with a statement as: 1=strongly disagree, 2=somewhat disagree, 3=neither agree nor disagree/neutral, 4=somewhat agree, and 5=strongly agree. The mean response and standard deviation were reported for each Likert scale prompt. Preplanned 1-sample t testing was used to analyze Likert scale data, in which the mean response for each prompt was compared to a baseline response of 3 (neutral). A P value <.05 was considered statistically significant. Statistical analyses were performed using SPSS Statistics for MacOS, version 27 (IBM).
Seventy-eight dermatologists agreed to participate, and 70 completed the survey, for a response rate of 89.7% (Table 1). The dermatologists we surveyed practiced in a variety of clinical settings, including academic public hospitals (46.2% [36/78]), academic private hospitals (33.3% [26/78]), and private practices (32.1% [25/78]), and 60.3% (47/78) reported providing disability documentation at some point. Most of the respondents (64.3% [45/70]) did not perform assessments in an average month (Table 2). Medical assessment documentation was provided most frequently for workers’ compensation (50.0% [35/70]), private insurance (27.1% [19/70]), and Social Security Disability Insurance (25.7% [18/70]). Dermatologists overwhelmingly reported no formal training for disability assessment in medical school (94.3% [66/70]), residency (97.1% [68/70]), or clinical practice (81.4% [57/70]).


In the Likert scale prompts, respondents agreed that they were uncertain of their role in disability assessment (mean response, 3.6; P<.001). Moreover, they were uncomfortable providing assessments (mean response, 3.5; P<.001) and felt that they did not have sufficient time to perform them (mean response, 3.6; P<.001). Dermatologists disagreed that they received adequate compensation for performing assessments (mean response, 2.2; P<.001) and felt that they did not have enough time to participate in assessments (mean response, 3.6; P<.001). Respondents generally did not feel distrustful of patients seeking disability assessment (mean response, 2.8; P=.043). Dermatologists neither agreed nor disagreed when asked if they thought that physicians can determine disability status (mean response, 3.2; P=.118). The details of the Likert scale responses are described in Table 3. Respondents also were uncertain as to which dermatologic conditions were eligible for disability. When asked to select which conditions from a list of 10 were eligible per the Social Security Administration listing of disability impairments, only 15.4% (12/70) of respondents correctly identified that all the conditions qualified; these included ichthyosis, pemphigus vulgaris, allergic contact dermatitis, hidradenitis suppurativa, systemic lupus erythematosus, chromoblastomycosis, xeroderma pigmentosum, burns, malignant melanoma, and scleroderma.6

In the free-response prompts, respondents frequently described extensive paperwork, inadequate time, and lack of reimbursement as barriers to providing documentation. Often, dermatologists found that the forms were not well matched to the skin conditions they were evaluating and rather had a musculoskeletal focus. Multiple individuals commented on the challenge in assessing the percentage of disability and functional/psychosocial impairment in skin conditions. One respondent noted that workers’ compensation forms ask if the patient is “…permanent and stationary…for most conditions this has no meaning in dermatology.” Some felt hesitant to provide documentation because they had insufficient patient history, especially regarding employment, and opted to defer to primary care providers who might be more familiar with the full patient history.
A dermatologist described their perspective as follows:
“…As a specialist I feel that I don’t have a complete look into all the factors that could contribute to a patient[’]s need to go on disability, and I don’t have experience with filling out disability requests. That being said, if a patient[’]s request for disability was due to a skin disease that I know way more about than [a] primary care [physician] would, I would do the disability assessment.”
Another respondent noted the complexity in “establishing causality” for workers’ compensation. Another dermatologist reported,
“The most frequent challenging situation I encounter is being asked to evaluate for maximum medical improvement after patch testing. If the patient is not fully avoiding contact allergens either at home or at work, then I typically document that they are not at [maximum medical improvement]. The reality is that most frequently it is due to exposure to allergens at home so the line between what is a legitimate worker’s comp[ensation] issue and what is a home life choice is blurry.”
Nevertheless, respondents expressed interest in learning more about disability assessment procedures. Summary guides, lectures, and prefilled paperwork were the most popular initiatives that respondents agreed would be beneficial toward becoming educated regarding disability assessment (78.6%, 58.6%, and 58.6%, respectively)(Table 2). One respondent noted that “previous [internal medicine] history help[ed]” them in performing cutaneous disability assessments.
As with any survey, our study did have some inherent limitations. Only a relatively small sample size was willing to complete the survey. There was a predominance of respondents from California (34.6% [27/78]), as well as those practicing for less than 15 years (58.9% [46/78])(Figure). This could limit generalizability to the national population of dermatologists. In addition, there was potential for recall bias and errors in responding given the self-reported nature of the study. Different individuals may interpret the Likert scale options in various ways, which could skew results unintentionally. However, the survey was largely qualitative in nature, making it a legitimate tool for answering our research questions. Moreover, we were able to hear the perspectives of dermatologists across diverse practice settings, with free response prompts to increase the depth of the survey.
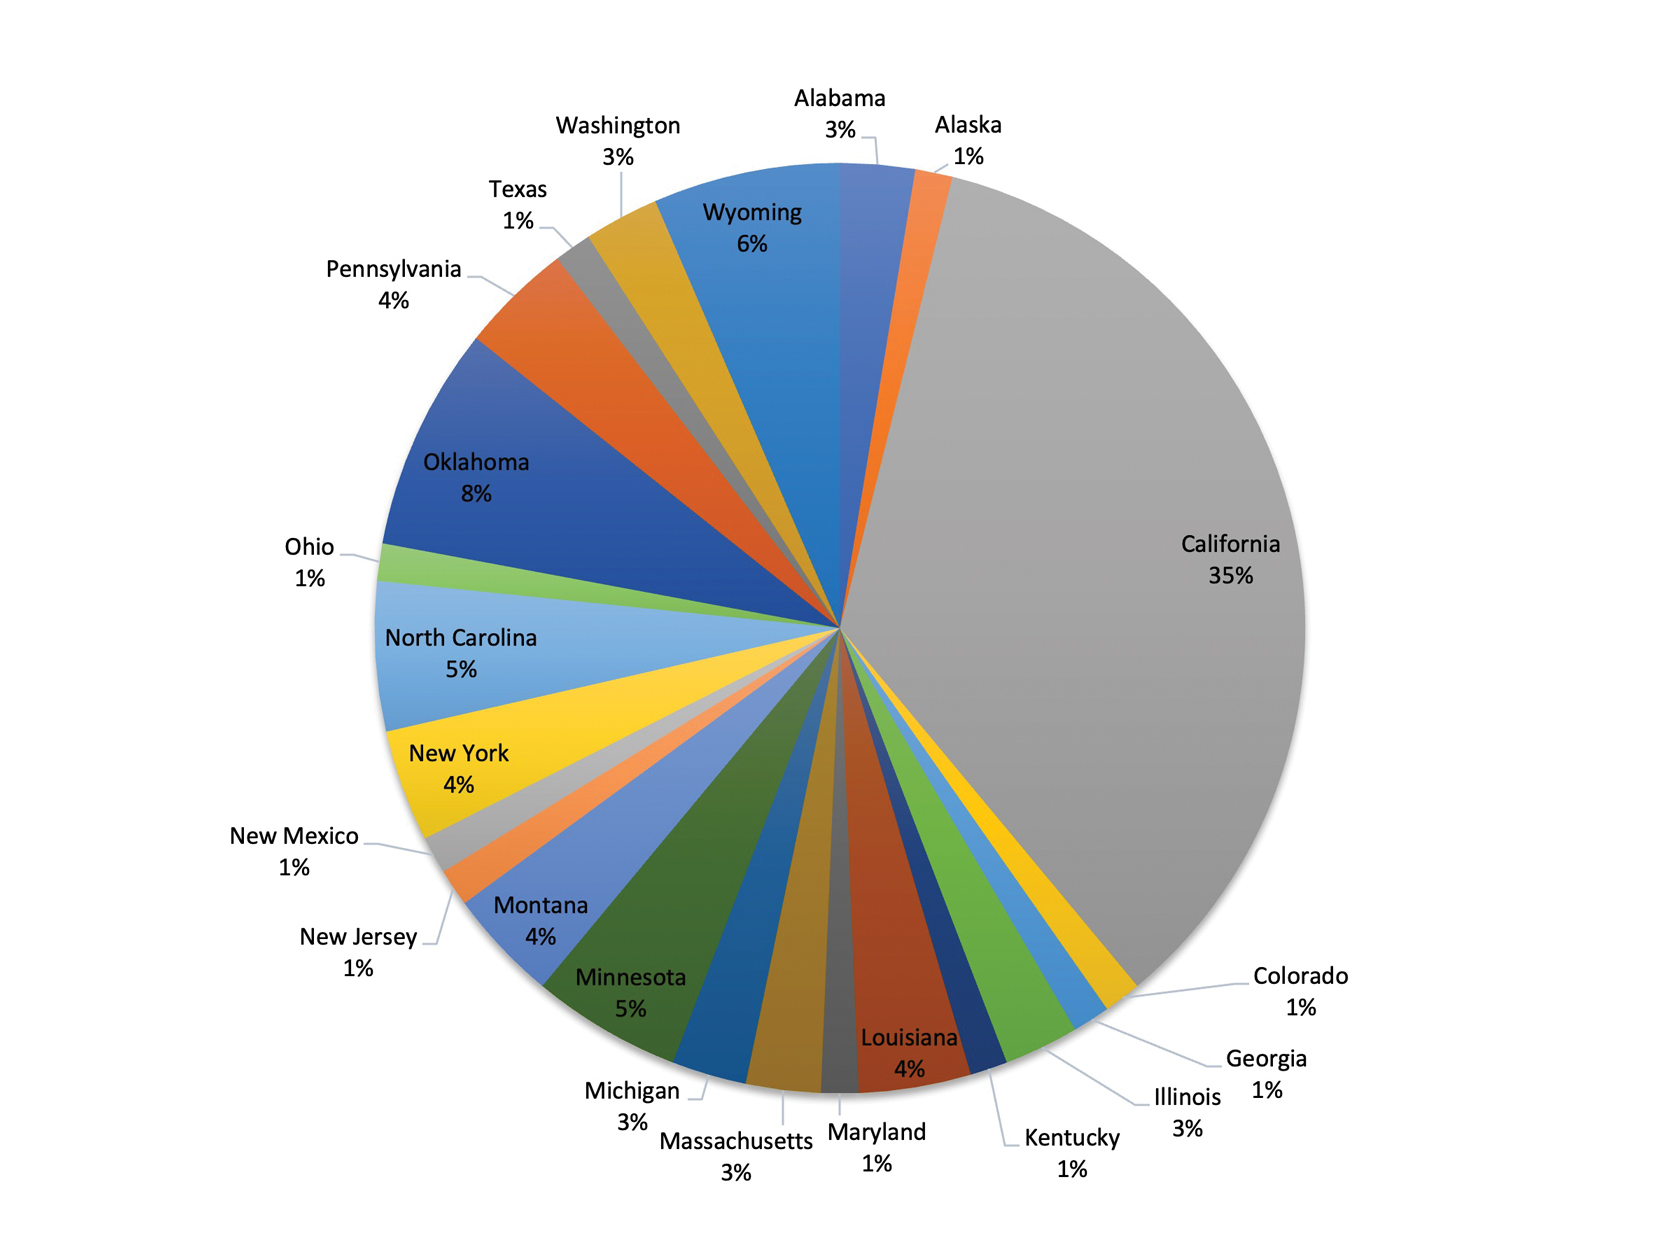
Almost 50 years later, our survey echoes common themes from Adams’ 1976 survey.4 Inadequate compensation, limited time, and burdensome paperwork all continue to hinder dermatologists’ ability to perform disability assessments. Our participants frequently commented that the current disability forms are not congruent with the nature of skin conditions, making it challenging to accurately document the facts.
Moreover, respondents felt uncertain in their role in disability assessment and occasionally noted distrust of patients or insufficient patient history as barriers to completing assessments. They also were unsure if physicians can grant disability status. This is a common misconception among physicians that leads to discomfort in helping with disability assessment.7 The role of physicians in disability assessment is to document the facts of a patient’s illness, not to determine whether they are eligible for benefits. We discovered uncertainty in our respondents’ ability to identify conditions eligible for disability, highlighting an area in need of greater education for physicians.
Despite these obstacles, respondents were interested in learning more about disability assessment and highlighted several practical approaches that could help them better perform this task. As skin specialists, dermatologists are the best-equipped physicians to assess cutaneous conditions and should play a greater role in performing disability assessments, which could be achieved through increased educational initiatives and individual physician motivation.7 We call for greater collaboration and reflection on the importance of disability assistance among dermatologists to increase participation in the disability-assessment process.
- O’Connell JJ, Zevin BD, Quick PD, et al. Documenting disability: simple strategies for medical providers. Health Care for the Homeless Clinicians’ Network. September 2007. Accessed March 31, 2025. https://nhchc.org/wp-content/uploads/2019/08/DocumentingDisability2007.pdf
- US Bureau of Labor Statistics. Injuries, illnesses, and fatalities. Accessed March 31, 2025. https://www.bls.gov/iif/
- Meseguer J. Outcome variation in the Social Security Disability Insurance Program: the role of primary diagnoses. Soc Secur Bull. 2013;73:39-75.
- Adams RM. Attitudes of California dermatologists toward Worker’s Compensation: results of a survey. West J Med. 1976;125:169-175.
- Talmage J, Melhorn J, Hyman M. AMA Guides to the Evaluation of Work Ability and Return to Work. 2nd ed. American Medical Association; 2011.
- Social Security Administration. Disability evaluation under Social Security. 8.00 skin disorders - adult. March 31, 2025. https://www.ssa.gov/disability/professionals/bluebook/8.00-Skin-Adult.htm
- Dawson J, Smogorzewski J. Demystifying disability assessments for dermatologists—a call to action. JAMA Dermatol. 2021;157:903-904. doi:10.1001/jamadermatol.2021.1767
To the Editor:
Cutaneous medical conditions can have a substantial impact on patients’ functioning and quality of life. Many patients with severe skin disease are eligible to receive disability assistance that can provide them with essential income and health care. Previous research has highlighted disability assessment as one of the most important ways physicians can help mitigate the health consequences of poverty.1 Dermatologists can play an important role in the disability assessment process by documenting the facts associated with patients’ skin conditions.
Although skin conditions have a relatively high prevalence, they remain underrepresented in disability claims. Between 1997 and 2004, occupational skin diseases accounted for 12% to 17% of nonfatal work-related illnesses; however, during that same period, skin conditions comprised only 0.21% of disability claims in the United States.2,3 Historically, there has been hesitancy among dermatologists to complete disability paperwork; a 1976 survey of dermatologists cited extensive paperwork, “troublesome patients,” and fee schedule issues as reasons.4 The lack of training regarding disability assessment in medical school and residency also has been noted.5
To characterize modern attitudes toward disability assessments, we conducted a survey of dermatologists across the United States. Our study was reviewed and declared exempt by the institutional review board of the Lundquist Institute for Biomedical Innovation at Harbor-UCLA Medical Center (Torrance, California)(approval #18CR-32242-01). Using convenience sampling, we emailed dermatologists from the Association of Professors of Dermatology and dermatology state societies in all 50 states inviting them to participate in our voluntary and anonymous survey, which was administered using SurveyMonkey. The use of all society mailing lists was approved by the respective owners. The 15-question survey included multiple choice, Likert scale, and free response sections. Summary and descriptive statistics were used to describe respondent demographics and identify any patterns in responses.
For each Likert-based question, participants ranked their degree of agreement with a statement as: 1=strongly disagree, 2=somewhat disagree, 3=neither agree nor disagree/neutral, 4=somewhat agree, and 5=strongly agree. The mean response and standard deviation were reported for each Likert scale prompt. Preplanned 1-sample t testing was used to analyze Likert scale data, in which the mean response for each prompt was compared to a baseline response of 3 (neutral). A P value <.05 was considered statistically significant. Statistical analyses were performed using SPSS Statistics for MacOS, version 27 (IBM).
Seventy-eight dermatologists agreed to participate, and 70 completed the survey, for a response rate of 89.7% (Table 1). The dermatologists we surveyed practiced in a variety of clinical settings, including academic public hospitals (46.2% [36/78]), academic private hospitals (33.3% [26/78]), and private practices (32.1% [25/78]), and 60.3% (47/78) reported providing disability documentation at some point. Most of the respondents (64.3% [45/70]) did not perform assessments in an average month (Table 2). Medical assessment documentation was provided most frequently for workers’ compensation (50.0% [35/70]), private insurance (27.1% [19/70]), and Social Security Disability Insurance (25.7% [18/70]). Dermatologists overwhelmingly reported no formal training for disability assessment in medical school (94.3% [66/70]), residency (97.1% [68/70]), or clinical practice (81.4% [57/70]).
In the Likert scale prompts, respondents agreed that they were uncertain of their role in disability assessment (mean response, 3.6; P<.001). Moreover, they were uncomfortable providing assessments (mean response, 3.5; P<.001) and felt that they did not have sufficient time to perform them (mean response, 3.6; P<.001). Dermatologists disagreed that they received adequate compensation for performing assessments (mean response, 2.2; P<.001) and felt that they did not have enough time to participate in assessments (mean response, 3.6; P<.001). Respondents generally did not feel distrustful of patients seeking disability assessment (mean response, 2.8; P=.043). Dermatologists neither agreed nor disagreed when asked if they thought that physicians can determine disability status (mean response, 3.2; P=.118). The details of the Likert scale responses are described in Table 3. Respondents also were uncertain as to which dermatologic conditions were eligible for disability. When asked to select which conditions from a list of 10 were eligible per the Social Security Administration listing of disability impairments, only 15.4% (12/70) of respondents correctly identified that all the conditions qualified; these included ichthyosis, pemphigus vulgaris, allergic contact dermatitis, hidradenitis suppurativa, systemic lupus erythematosus, chromoblastomycosis, xeroderma pigmentosum, burns, malignant melanoma, and scleroderma.6
In the free-response prompts, respondents frequently described extensive paperwork, inadequate time, and lack of reimbursement as barriers to providing documentation. Often, dermatologists found that the forms were not well matched to the skin conditions they were evaluating and rather had a musculoskeletal focus. Multiple individuals commented on the challenge in assessing the percentage of disability and functional/psychosocial impairment in skin conditions. One respondent noted that workers’ compensation forms ask if the patient is “…permanent and stationary…for most conditions this has no meaning in dermatology.” Some felt hesitant to provide documentation because they had insufficient patient history, especially regarding employment, and opted to defer to primary care providers who might be more familiar with the full patient history.
A dermatologist described their perspective as follows:
“…As a specialist I feel that I don’t have a complete look into all the factors that could contribute to a patient[’]s need to go on disability, and I don’t have experience with filling out disability requests. That being said, if a patient[’]s request for disability was due to a skin disease that I know way more about than [a] primary care [physician] would, I would do the disability assessment.”
Another respondent noted the complexity in “establishing causality” for workers’ compensation. Another dermatologist reported,
“The most frequent challenging situation I encounter is being asked to evaluate for maximum medical improvement after patch testing. If the patient is not fully avoiding contact allergens either at home or at work, then I typically document that they are not at [maximum medical improvement]. The reality is that most frequently it is due to exposure to allergens at home so the line between what is a legitimate worker’s comp[ensation] issue and what is a home life choice is blurry.”
Nevertheless, respondents expressed interest in learning more about disability assessment procedures. Summary guides, lectures, and prefilled paperwork were the most popular initiatives that respondents agreed would be beneficial toward becoming educated regarding disability assessment (78.6%, 58.6%, and 58.6%, respectively)(Table 2). One respondent noted that “previous [internal medicine] history help[ed]” them in performing cutaneous disability assessments.
As with any survey, our study did have some inherent limitations. Only a relatively small sample size was willing to complete the survey. There was a predominance of respondents from California (34.6% [27/78]), as well as those practicing for less than 15 years (58.9% [46/78])(Figure). This could limit generalizability to the national population of dermatologists. In addition, there was potential for recall bias and errors in responding given the self-reported nature of the study. Different individuals may interpret the Likert scale options in various ways, which could skew results unintentionally. However, the survey was largely qualitative in nature, making it a legitimate tool for answering our research questions. Moreover, we were able to hear the perspectives of dermatologists across diverse practice settings, with free response prompts to increase the depth of the survey.
Almost 50 years later, our survey echoes common themes from Adams’ 1976 survey.4 Inadequate compensation, limited time, and burdensome paperwork all continue to hinder dermatologists’ ability to perform disability assessments. Our participants frequently commented that the current disability forms are not congruent with the nature of skin conditions, making it challenging to accurately document the facts.
Moreover, respondents felt uncertain in their role in disability assessment and occasionally noted distrust of patients or insufficient patient history as barriers to completing assessments. They also were unsure if physicians can grant disability status. This is a common misconception among physicians that leads to discomfort in helping with disability assessment.7 The role of physicians in disability assessment is to document the facts of a patient’s illness, not to determine whether they are eligible for benefits. We discovered uncertainty in our respondents’ ability to identify conditions eligible for disability, highlighting an area in need of greater education for physicians.
Despite these obstacles, respondents were interested in learning more about disability assessment and highlighted several practical approaches that could help them better perform this task. As skin specialists, dermatologists are the best-equipped physicians to assess cutaneous conditions and should play a greater role in performing disability assessments, which could be achieved through increased educational initiatives and individual physician motivation.7 We call for greater collaboration and reflection on the importance of disability assistance among dermatologists to increase participation in the disability-assessment process.
- O’Connell JJ, Zevin BD, Quick PD, et al. Documenting disability: simple strategies for medical providers. Health Care for the Homeless Clinicians’ Network. September 2007. Accessed March 31, 2025. https://nhchc.org/wp-content/uploads/2019/08/DocumentingDisability2007.pdf
- US Bureau of Labor Statistics. Injuries, illnesses, and fatalities. Accessed March 31, 2025. https://www.bls.gov/iif/
- Meseguer J. Outcome variation in the Social Security Disability Insurance Program: the role of primary diagnoses. Soc Secur Bull. 2013;73:39-75.
- Adams RM. Attitudes of California dermatologists toward Worker’s Compensation: results of a survey. West J Med. 1976;125:169-175.
- Talmage J, Melhorn J, Hyman M. AMA Guides to the Evaluation of Work Ability and Return to Work. 2nd ed. American Medical Association; 2011.
- Social Security Administration. Disability evaluation under Social Security. 8.00 skin disorders - adult. March 31, 2025. https://www.ssa.gov/disability/professionals/bluebook/8.00-Skin-Adult.htm
- Dawson J, Smogorzewski J. Demystifying disability assessments for dermatologists—a call to action. JAMA Dermatol. 2021;157:903-904. doi:10.1001/jamadermatol.2021.1767
Dermatologists’ Perspectives Toward Disability Assessment: A Nationwide Survey Report
Dermatologists’ Perspectives Toward Disability Assessment: A Nationwide Survey Report
PRACTICE POINTS
- As experts in skin conditions, dermatologists are most qualified to assist with disability assessment for dermatologic concerns.
- There are several barriers to dermatologists participating in the disability assessment process, including lack of time, compensation, and education on the subject.
- Many dermatologists may be interested in learning more about disability assessment, and education could be provided in the form of summary guides, lectures, and prefilled paperwork.
Analysis of Errors in the Management of Cutaneous Disorders
Analysis of Errors in the Management of Cutaneous Disorders
Humans are inherently prone to errors. The extent and consequences of medical errors were documented in the 2000 publication of To Err is Human: Building a Safer Health System.1 Published research on medical errors in dermatology has emphasized the heuristic issues involved in diagnosis,2-6 essentially approaching the “why?” and “how?” of such errors. By contrast, the current study aimed to elucidate the “what?”—what are the dermatologic conditions most prone to diagnostic and/or management errors? One study published in 1987 approached this question by analyzing patterns of errors for dermatologic conditions in patients referred for specialty care by primary care physicians.7 The current study aimed to update and expand on the findings of this 1987 report by comparing more recent data on the errors made by providers and patients regarding skin conditions.
Methods
Data were collected prospectively from March 18, 2021, through July 25, 2023. Prospective data were obtained by recording the nature of errors noted for all patients seen by a board-certified dermatologist (R.J.P.) during routine outpatient practice in Norfolk, Virginia. This practice is limited to medical dermatology and accepts patients of any age from any referral source, with or without medical insurance. Retrospective data were obtained by review of electronic medical records for all patients seen by the same board-certified dermatologist from June 5, 2020, through March 12, 2021, who previously had been seen by an outside provider or were self-referred. In this study, the term diagnosis is used to describe providers’ explicit or imputed conclusions as to the nature of a dermatosis, and the term interpretation is used to describe patients' conclusions about their own condition. For this study, the patients’ self-made interpretations of their dermatoses were deemed to be correct when they agreed with those made by the dermatologist using standard clinicopathologic criteria supplemented by rapid bedside diagnostic techniques, as detailed in the 1987 study.7
Cases in which diagnostic or therapeutic errors were noted were entered into a spreadsheet that excluded patients’ names or other identifiers. For each noted case of diagnostic or therapeutic error, the following data were entered: patient’s age and sex; the name of the incorrect diagnosis, interpretation, or treatment; and the name of the correct (missed) diagnosis, along with the source of the error (provider or patient). Provider diagnoses were determined from medical records or patient statements or were imputed from the generally accepted indications for prescribed treatments. A provider was deemed to be any practitioner with prescriptive authority. Patients’ interpretations of their conditions were determined by patient statements or were imputed based on the indications for treatments being used. A treatment error was recorded when a diagnosis or interpretation was deemed to be correct, but treatment was deemed to be inappropriate. The same dermatologist (R.J.P) made all determinations as to the nature of the errors and their source.
Diagnostic errors were determined in several situations: (1) if the interpretation made by the patient of their dermatosis differed from the correct diagnosis in the absence of any additional diagnostic documentation, the correct diagnosis was scored as a missed diagnosis and the incorrect interpretation was scored as such; (2) if the provider’s diagnosis in the patient’s medical record differed from the correct diagnosis, both the correct (missed) and incorrect diagnoses were recorded; and (3) if the indication(s) of the medication(s) prescribed by the provider or used by the patient for their condition differed from the correct diagnosis, an imputed diagnosis based on this indication was scored as the incorrect diagnosis and the correct (missed) diagnosis was recorded; for example, an error would be entered into the spreadsheet for a patient using terbinafine cream for what was actually psoriasis. For a medication with multiple active agents, an error would be entered into the spreadsheet only if none of its indications matched the correct diagnosis; for example, if the patient had been prescribed a betamethasone/clotrimazole product, no error would be scored if the correct diagnosis was a steroid-responsive dermatosis, dermatophytosis, candidiasis, or tinea versicolor. For a single medication with multiple indications, no error would be recorded if the correct diagnosis was any of these indications; for example, in a patient who had been prescribed topical ketoconazole, no error would be scored if the correct diagnosis was dermatophytosis, candidiasis, tinea versicolor, or seborrheic dermatitis. Additionally, no error would be recorded if the correct diagnosis was uncertain at the time of initial patient evaluation or during chart review.
Standard spreadsheet functions and the pandas package8 from the Python programming language9 were used to extract relevant data from the spreadsheet (Tables 1-4).


Results
A total of 446 patient visits (182 males, 264 females) were included in the study, in which a total of 486 errors were found in the combined prospective and retrospective portions of the study. These errors involved 1.4% of all patient visits for the study period—specifically, all in routine practice as well as all patient records retrospectively reviewed. The age of the patients ranged from 4 to 95 years; the mean age was 51.5 years for males and 50.8 years for females.
The study results are outlined in Tables 1 through 4. To minimize the amount of data provided with no appreciable effect on the results, cases in which an incorrect or missed diagnosis/interpretation occurred only once (ie, unique case errors) were excluded from the tables. Tables 1 and 2 indicate the numbers and types of incorrect and missed diagnoses.
In the combined patient and provider cases, there were 434 instances in which provider diagnoses and patient interpretations were incorrect, 320 (73.7%) of which involved infectious disorders. By contrast, of the 413 instances of provider and patient missed diagnoses 289 (70.0%) were inflammatory dermatoses. The pattern was similar for patients’ incorrect interpretations compared to the incorrect diagnoses of the medical providers. Patients incorrectly interpreted their dermatoses as infectious in 79.5% (101/127) of cases. Similarly, providers incorrectly diagnosed their patients’ dermatoses as infectious in 75.4% (211/280) of cases (Table 3). For patients’ missed diagnoses, 70.7% (82/116) involved inflammatory dermatoses. For providers’ missed diagnoses, 63.9% (179/280) involved inflammatory dermatoses (Table 4).
Treatment errors in the context of correct diagnoses were uncommon. Fifteen (3.4%) such cases were noted in the 446 error-containing patient visits. In 4 (26.7%) of the 15 cases, potent topical corticosteroids were used long term on inappropriate cutaneous sites (eg, genital, facial, or intertriginous areas). Another 4 (26.7%) cases involved fungal infections: nystatin used for tinea versicolor in 1 case and for dermatophytosis in another, widespread dermatophytosis treated topically, and use of a nonindicated topical antifungal for onychomycosis. Other examples involved inadequate dosing of systemic corticosteroids for extensive acute contact dermatitis, psoriasis treated with systemic corticosteroids, inadequate dosing of medication for seborrheic dermatitis, and treatment with valacyclovir based solely on serologic testing.
Comment
The results of our study indicate that errors in management of cutaneous disorders are overwhelmingly diagnostic in nature, while treatment errors appear to be unusual when the correct diagnosis is made. Both the current study and the 1987 study indicated a notable tendency of providers to incorrectly diagnose infectious disorders and to miss the diagnosis of inflammatory dermatoses.7 The current study extends this finding to include patients’ interpretive errors.
It is notable that many of the incorrect and missed diagnoses can be confirmed or ruled out by rapid bedside techniques, namely potassium hydroxide (KOH) preparation for dermatophytes, candidiasis, and tinea versicolor; wet preparation for scabies and pediculosis; Tzanck preparation for herpes simplex and herpes zoster; and crush preparation for molluscum contagiosum. Notably, 57.8% (281/486) of cases in which error was noted involved disorders for which the use of one of these bedside diagnostic tests could have correctly established a diagnosis or ruled out an incorrect one; thus in an ideal world in which these tests were performed perfectly in all appropriate cases, more than half of the errors detected in this study could have been avoided. Dermatophytosis was involved in 35.8% (174/486) of the error-containing patient encounters in this study; therefore, if only the KOH preparation is considered, more than one-third of all errors documented in this study could have been avoided. Unfortunately, surveys have suggested that among dermatologists in the United States and some other countries, KOH preparations are used infrequently.10-12
Certain limitations were inherent to this study. The data were derived from a single dermatology practice by one physician in one geographic region over a short period of time. These factors may limit the generalizability of the results. Although the goal was to identify all errors made for the patients seen, some errors likely were missed due to incomplete patient history or inaccurate medication listings. There is no absolute way to determine if the diagnoses or the treatments deemed correct by the dermatologist were, in fact, correct. For cases in which a patient’s interpretation or a provider’s diagnosis was imputed from the indication(s) associated with the medication(s) being used, one cannot exclude the possibility that a medication was used appropriately for a nonlabeled or nonstandard indication. The designation of treatment errors may be subject to different interpretations by different clinicians. Despite these limitations, it is likely that the results of this study can be extrapolated to reasonably similar dermatology practices. The apparently persistent and consistent tendency of clinicians to incorrectly diagnose infectious dermatoses and to miss inflammatory conditions has implications for teaching of medical dermatology in the academic and clinical settings. In particular, given that dermatophytosis is the diagnosis involved in the highest number of errors, special emphasis should be placed on this infection in clinician education.
Acknowledgement—The authors would like to acknowledge the essential contributions to this study by Urvi Jain (Virginia Beach, Virginia), particularly for analysis and interpretation of data and for suggestions to improve the manuscript.
- Institute of Medicine (US) Committee on Quality of Health Care in America. To Err is Human: Building a Safer Health System. Kohn LT, Corrigan JM, Donaldson MS, eds. National Academies Press; 2000.
- Lowenstein EJ, Sidlow R, Ko CJ. Visual perception, cognition, and error in dermatologic diagnosis: diagnosis and error. J Am Acad Dermatol. 2019;81:1237-1245.
- Ko CJ, Braverman I, Sidlow R, et al. Visual perception, cognition, and error in dermatologic diagnosis: key cognitive principles. J Am Acad Dermatol. 2019;81:1227-1234.
- Lowenstein EJ. Dermatology and its unique diagnostic heuristics. J Am Acad Dermatol. 2018;78:1239-1240.
- Elston DM. Cognitive bias and medical errors. J Am Acad Dermatol. 2019;81:1249.
- Costa Filho GB, Moura AS, Brandão PR, et al. Effects of deliberate reflection on diagnostic accuracy, confidence and diagnostic calibration in dermatology. Perspect Med Educ. 2019;8:230-236.
- Pariser RJ, Pariser DM. Primary physicians’ errors in handling cutaneous disorders. J Am Acad Dermatol. 1987;17:239-245.
- van Rossum G, Drake FL Jr. Python Reference Manual. Centrum voor Wiskunde en Informatica; 1995.
- The pandas development team. pandas-dev/pandas: Pandas. Zenodo. February 2020. doi:10.5281/zenodo.3509134
- Murphy EC, Friedman AJ. Use of in-office preparations by dermatologists for the diagnosis of cutaneous fungal infections. J Drugs Dermatol. 2019;18:798-802.
- Dhafiri MA, Alhamed AS, Aljughayman MA. Use of potassium hydroxide in dermatology daily practice: a local study from Saudi Arabia. Cureus. 2022;14:E30612. doi:10.7759/cureus .30612.eCollection
- Chandler JD, Yamamoto R, Hay RJ. Use of direct microscopy to diagnose superficial mycoses: a survey of UK dermatology practice. Br J Dermatol. 2023;189:480-481.
Humans are inherently prone to errors. The extent and consequences of medical errors were documented in the 2000 publication of To Err is Human: Building a Safer Health System.1 Published research on medical errors in dermatology has emphasized the heuristic issues involved in diagnosis,2-6 essentially approaching the “why?” and “how?” of such errors. By contrast, the current study aimed to elucidate the “what?”—what are the dermatologic conditions most prone to diagnostic and/or management errors? One study published in 1987 approached this question by analyzing patterns of errors for dermatologic conditions in patients referred for specialty care by primary care physicians.7 The current study aimed to update and expand on the findings of this 1987 report by comparing more recent data on the errors made by providers and patients regarding skin conditions.
Methods
Data were collected prospectively from March 18, 2021, through July 25, 2023. Prospective data were obtained by recording the nature of errors noted for all patients seen by a board-certified dermatologist (R.J.P.) during routine outpatient practice in Norfolk, Virginia. This practice is limited to medical dermatology and accepts patients of any age from any referral source, with or without medical insurance. Retrospective data were obtained by review of electronic medical records for all patients seen by the same board-certified dermatologist from June 5, 2020, through March 12, 2021, who previously had been seen by an outside provider or were self-referred. In this study, the term diagnosis is used to describe providers’ explicit or imputed conclusions as to the nature of a dermatosis, and the term interpretation is used to describe patients' conclusions about their own condition. For this study, the patients’ self-made interpretations of their dermatoses were deemed to be correct when they agreed with those made by the dermatologist using standard clinicopathologic criteria supplemented by rapid bedside diagnostic techniques, as detailed in the 1987 study.7
Cases in which diagnostic or therapeutic errors were noted were entered into a spreadsheet that excluded patients’ names or other identifiers. For each noted case of diagnostic or therapeutic error, the following data were entered: patient’s age and sex; the name of the incorrect diagnosis, interpretation, or treatment; and the name of the correct (missed) diagnosis, along with the source of the error (provider or patient). Provider diagnoses were determined from medical records or patient statements or were imputed from the generally accepted indications for prescribed treatments. A provider was deemed to be any practitioner with prescriptive authority. Patients’ interpretations of their conditions were determined by patient statements or were imputed based on the indications for treatments being used. A treatment error was recorded when a diagnosis or interpretation was deemed to be correct, but treatment was deemed to be inappropriate. The same dermatologist (R.J.P) made all determinations as to the nature of the errors and their source.
Diagnostic errors were determined in several situations: (1) if the interpretation made by the patient of their dermatosis differed from the correct diagnosis in the absence of any additional diagnostic documentation, the correct diagnosis was scored as a missed diagnosis and the incorrect interpretation was scored as such; (2) if the provider’s diagnosis in the patient’s medical record differed from the correct diagnosis, both the correct (missed) and incorrect diagnoses were recorded; and (3) if the indication(s) of the medication(s) prescribed by the provider or used by the patient for their condition differed from the correct diagnosis, an imputed diagnosis based on this indication was scored as the incorrect diagnosis and the correct (missed) diagnosis was recorded; for example, an error would be entered into the spreadsheet for a patient using terbinafine cream for what was actually psoriasis. For a medication with multiple active agents, an error would be entered into the spreadsheet only if none of its indications matched the correct diagnosis; for example, if the patient had been prescribed a betamethasone/clotrimazole product, no error would be scored if the correct diagnosis was a steroid-responsive dermatosis, dermatophytosis, candidiasis, or tinea versicolor. For a single medication with multiple indications, no error would be recorded if the correct diagnosis was any of these indications; for example, in a patient who had been prescribed topical ketoconazole, no error would be scored if the correct diagnosis was dermatophytosis, candidiasis, tinea versicolor, or seborrheic dermatitis. Additionally, no error would be recorded if the correct diagnosis was uncertain at the time of initial patient evaluation or during chart review.
Standard spreadsheet functions and the pandas package8 from the Python programming language9 were used to extract relevant data from the spreadsheet (Tables 1-4).
Results
A total of 446 patient visits (182 males, 264 females) were included in the study, in which a total of 486 errors were found in the combined prospective and retrospective portions of the study. These errors involved 1.4% of all patient visits for the study period—specifically, all in routine practice as well as all patient records retrospectively reviewed. The age of the patients ranged from 4 to 95 years; the mean age was 51.5 years for males and 50.8 years for females.
The study results are outlined in Tables 1 through 4. To minimize the amount of data provided with no appreciable effect on the results, cases in which an incorrect or missed diagnosis/interpretation occurred only once (ie, unique case errors) were excluded from the tables. Tables 1 and 2 indicate the numbers and types of incorrect and missed diagnoses.
In the combined patient and provider cases, there were 434 instances in which provider diagnoses and patient interpretations were incorrect, 320 (73.7%) of which involved infectious disorders. By contrast, of the 413 instances of provider and patient missed diagnoses 289 (70.0%) were inflammatory dermatoses. The pattern was similar for patients’ incorrect interpretations compared to the incorrect diagnoses of the medical providers. Patients incorrectly interpreted their dermatoses as infectious in 79.5% (101/127) of cases. Similarly, providers incorrectly diagnosed their patients’ dermatoses as infectious in 75.4% (211/280) of cases (Table 3). For patients’ missed diagnoses, 70.7% (82/116) involved inflammatory dermatoses. For providers’ missed diagnoses, 63.9% (179/280) involved inflammatory dermatoses (Table 4).
Treatment errors in the context of correct diagnoses were uncommon. Fifteen (3.4%) such cases were noted in the 446 error-containing patient visits. In 4 (26.7%) of the 15 cases, potent topical corticosteroids were used long term on inappropriate cutaneous sites (eg, genital, facial, or intertriginous areas). Another 4 (26.7%) cases involved fungal infections: nystatin used for tinea versicolor in 1 case and for dermatophytosis in another, widespread dermatophytosis treated topically, and use of a nonindicated topical antifungal for onychomycosis. Other examples involved inadequate dosing of systemic corticosteroids for extensive acute contact dermatitis, psoriasis treated with systemic corticosteroids, inadequate dosing of medication for seborrheic dermatitis, and treatment with valacyclovir based solely on serologic testing.
Comment
The results of our study indicate that errors in management of cutaneous disorders are overwhelmingly diagnostic in nature, while treatment errors appear to be unusual when the correct diagnosis is made. Both the current study and the 1987 study indicated a notable tendency of providers to incorrectly diagnose infectious disorders and to miss the diagnosis of inflammatory dermatoses.7 The current study extends this finding to include patients’ interpretive errors.
It is notable that many of the incorrect and missed diagnoses can be confirmed or ruled out by rapid bedside techniques, namely potassium hydroxide (KOH) preparation for dermatophytes, candidiasis, and tinea versicolor; wet preparation for scabies and pediculosis; Tzanck preparation for herpes simplex and herpes zoster; and crush preparation for molluscum contagiosum. Notably, 57.8% (281/486) of cases in which error was noted involved disorders for which the use of one of these bedside diagnostic tests could have correctly established a diagnosis or ruled out an incorrect one; thus in an ideal world in which these tests were performed perfectly in all appropriate cases, more than half of the errors detected in this study could have been avoided. Dermatophytosis was involved in 35.8% (174/486) of the error-containing patient encounters in this study; therefore, if only the KOH preparation is considered, more than one-third of all errors documented in this study could have been avoided. Unfortunately, surveys have suggested that among dermatologists in the United States and some other countries, KOH preparations are used infrequently.10-12
Certain limitations were inherent to this study. The data were derived from a single dermatology practice by one physician in one geographic region over a short period of time. These factors may limit the generalizability of the results. Although the goal was to identify all errors made for the patients seen, some errors likely were missed due to incomplete patient history or inaccurate medication listings. There is no absolute way to determine if the diagnoses or the treatments deemed correct by the dermatologist were, in fact, correct. For cases in which a patient’s interpretation or a provider’s diagnosis was imputed from the indication(s) associated with the medication(s) being used, one cannot exclude the possibility that a medication was used appropriately for a nonlabeled or nonstandard indication. The designation of treatment errors may be subject to different interpretations by different clinicians. Despite these limitations, it is likely that the results of this study can be extrapolated to reasonably similar dermatology practices. The apparently persistent and consistent tendency of clinicians to incorrectly diagnose infectious dermatoses and to miss inflammatory conditions has implications for teaching of medical dermatology in the academic and clinical settings. In particular, given that dermatophytosis is the diagnosis involved in the highest number of errors, special emphasis should be placed on this infection in clinician education.
Acknowledgement—The authors would like to acknowledge the essential contributions to this study by Urvi Jain (Virginia Beach, Virginia), particularly for analysis and interpretation of data and for suggestions to improve the manuscript.
- Institute of Medicine (US) Committee on Quality of Health Care in America. To Err is Human: Building a Safer Health System. Kohn LT, Corrigan JM, Donaldson MS, eds. National Academies Press; 2000.
- Lowenstein EJ, Sidlow R, Ko CJ. Visual perception, cognition, and error in dermatologic diagnosis: diagnosis and error. J Am Acad Dermatol. 2019;81:1237-1245.
- Ko CJ, Braverman I, Sidlow R, et al. Visual perception, cognition, and error in dermatologic diagnosis: key cognitive principles. J Am Acad Dermatol. 2019;81:1227-1234.
- Lowenstein EJ. Dermatology and its unique diagnostic heuristics. J Am Acad Dermatol. 2018;78:1239-1240.
- Elston DM. Cognitive bias and medical errors. J Am Acad Dermatol. 2019;81:1249.
- Costa Filho GB, Moura AS, Brandão PR, et al. Effects of deliberate reflection on diagnostic accuracy, confidence and diagnostic calibration in dermatology. Perspect Med Educ. 2019;8:230-236.
- Pariser RJ, Pariser DM. Primary physicians’ errors in handling cutaneous disorders. J Am Acad Dermatol. 1987;17:239-245.
- van Rossum G, Drake FL Jr. Python Reference Manual. Centrum voor Wiskunde en Informatica; 1995.
- The pandas development team. pandas-dev/pandas: Pandas. Zenodo. February 2020. doi:10.5281/zenodo.3509134
- Murphy EC, Friedman AJ. Use of in-office preparations by dermatologists for the diagnosis of cutaneous fungal infections. J Drugs Dermatol. 2019;18:798-802.
- Dhafiri MA, Alhamed AS, Aljughayman MA. Use of potassium hydroxide in dermatology daily practice: a local study from Saudi Arabia. Cureus. 2022;14:E30612. doi:10.7759/cureus .30612.eCollection
- Chandler JD, Yamamoto R, Hay RJ. Use of direct microscopy to diagnose superficial mycoses: a survey of UK dermatology practice. Br J Dermatol. 2023;189:480-481.
Analysis of Errors in the Management of Cutaneous Disorders
Analysis of Errors in the Management of Cutaneous Disorders
PRACTICE POINTS
- Errors in the management of cutaneous disorders predominantly are due to misdiagnosis rather than treatment oversights.
- There is a tendency among medical providers to incorrectly diagnose dermatoses as infectious disorders and to miss the diagnosis of inflammatory dermatoses.
- A similar pattern of errors occurs for patients’ interpretations of their own skin conditions.
- Use of available rapid bedside diagnostic techniques can reduce the likelihood of errors made by medical providers.