User login
Health care resource utilization leading to a diagnosis of soft tissue sarcoma
Introduction
Soft tissue sarcomas (STS) are a heterogeneous group of cancerous tumors, comprised of more than 50 histological subtypes that develop from soft tissues of the body (eg, fat, muscles, nerve tissue, deep skin tissue, visceral nonepithelial tissue). Due to many factors, not limited to the heterogeneity of this set of diseases and lack of screening tests, reaching a diagnosis of STS is challenging for the general practitioner as well as for the oncologist. Sarcomas may present with nonspecific and often indolent symptomology, depending on the specific histological subtype. According to the American Cancer Society, the signs and symptoms of a sarcoma include a new or growing lump, worsening abdominal pain, blood in stool or vomit, and black stools (due to abdominal bleeding).1 Unfortunately, these symptoms could be indicative of any number of other health conditions and are nonspecific to sarcoma.
As with many cancers, the early detection of disease when it may be completely resected could lead to a cure, whereas diagnosis when the disease is no longer amenable to surgery will impact patient survival. Among all forms of STS, early diagnosis when the patient has only localized disease is associated with an 80.8% five-year survival rate, which decreases to 16.4% for patients whose disease has already metastasized to other parts of the body at the time of diagnosis.2
Previous work has evaluated the relationship between duration of symptoms that may lead to a diagnosis of sarcoma and cancer outcomes. A retrospective analysis of a cohort of adults with bone or STS found no correlation between patient recall of duration of prediagnosis symptoms and survival or metastatic disease at diagnosis.3,4 Little other research was identified that examined the challenges of identifying a potential sarcoma. Despite the gap in knowledge, advocacy and patient-centered organizations emphasize the risk of delayed diagnosis and report high levels of stress and frustration among patients by the time an accurate diagnosis is obtained.5 The objective of this study was to quantify the health care experience and misdiagnoses that occurred prior to a sarcoma diagnosis compared to a cohort of matched controls.
Methods
A retrospective observational database study was conducted using detailed resource utilization and cost data from the Truven MarketScan claims database. Truven MarketScan® is a HIPAA-compliant, fully integrated patient-level database containing inpatient, outpatient, drug, lab, health risk assessment, and benefit design information from commercial and Medicare supplemental insurance plans. Additionally, the Health and Productivity Management (HPM) database, containing workplace absence, short-term disability, long-term disability, and worker’s compensation data, is linked at the individual patient level. The linkage of the claims and HPM database was used for this study.
Patients were eligible for inclusion in the cohort of a sarcoma if they had at least two ICD-9 codes of 171.x on two different days between July 1, 2004, and March 30, 2014. The date of the first eligible code was considered the index date. Patients were required to have at least 6 months of health care plan enrollment prior to the first eligible ICD-9 code to allow for prediagnosis activity to be identified in the database. Patients were also required to be 18 years of age or older on the first eligible ICD-9 code date. Patients were excluded who had evidence suggesting a diagnosis of osteosarcoma, Kaposi’s sarcoma, or gastrointestinal stromal tumors (treatment with methotrexate, ICD-9 codes of 176.x, 171.x, or 238.1), a history of any cancer before the eligible sarcoma ICD-9 code, or history of systemic anticancer therapy during the 6-month pre-index period. All patients meeting eligibility criteria were included in the matching algorithm to identify the control cohort.
The matched control cohort was required to have at least the same duration of follow-up at the case level as the matched sarcoma patient, could not have any evidence of any malignancy at any time in the database, nor could have received any systemic anticancer therapy at any time. Controls were randomly selected from the more than 100 million individual patient cases in the MarketScan database to be matched to the eligible sarcoma patient cohort exactly on age, geographic region of residence, health insurance plan type, gender, noncancer comorbid conditions (measured by Charlson Comorbidity Index items), and employment status. All factors were exact matched at the sarcoma cohort index diagnosis date. In the case of missing variables, patients were matched on missingness (eg, a case with missing employment status would be matched to a control with missing employment status).
The eligible time period for the index date of the possible sarcoma cohort and matched controls was between July 1, 2004, and March 30, 2014, which allowed for a minimum of 1-year follow-up through the end of the database available at the time of analysis.
All ICD-9 diagnostic and procedure codes present in the matched 6-month time period pre-index diagnosis were compared to explore factors that may be more likely to be present in the sarcoma cohort compared to matched controls. Univariate analysis was conducted for each prediagnosis variable. Analyses were conducted using T test for continuous variables, and Chi-square or Fisher’s exact test was used for categorical variables.
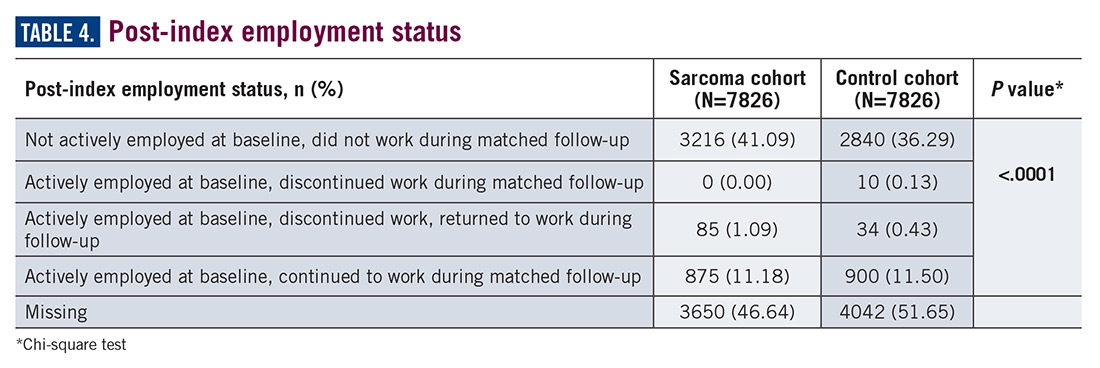
Number of physician visits, inpatient hospital stays, surgical procedures, and emergency room visits were compared between those in the sarcoma cohort and matched controls during the matched 6-month pre-index period. The post-index diagnosis employment status was also compared between groups using the HPM database. Comparisons between the sarcoma cohort and control cohort were made among the actively employed patients at baseline related to the proportion of patients who continued active employment, the proportion who permanently discontinued work, and the proportion who initially discontinued work and then returned to work at a later time. No adjustments were made for multiple comparisons.
Results
A total of 7826 controls were each matched to patients in the sarcoma cohort. The baseline characteristics of the study cohorts are provided in Table 1. 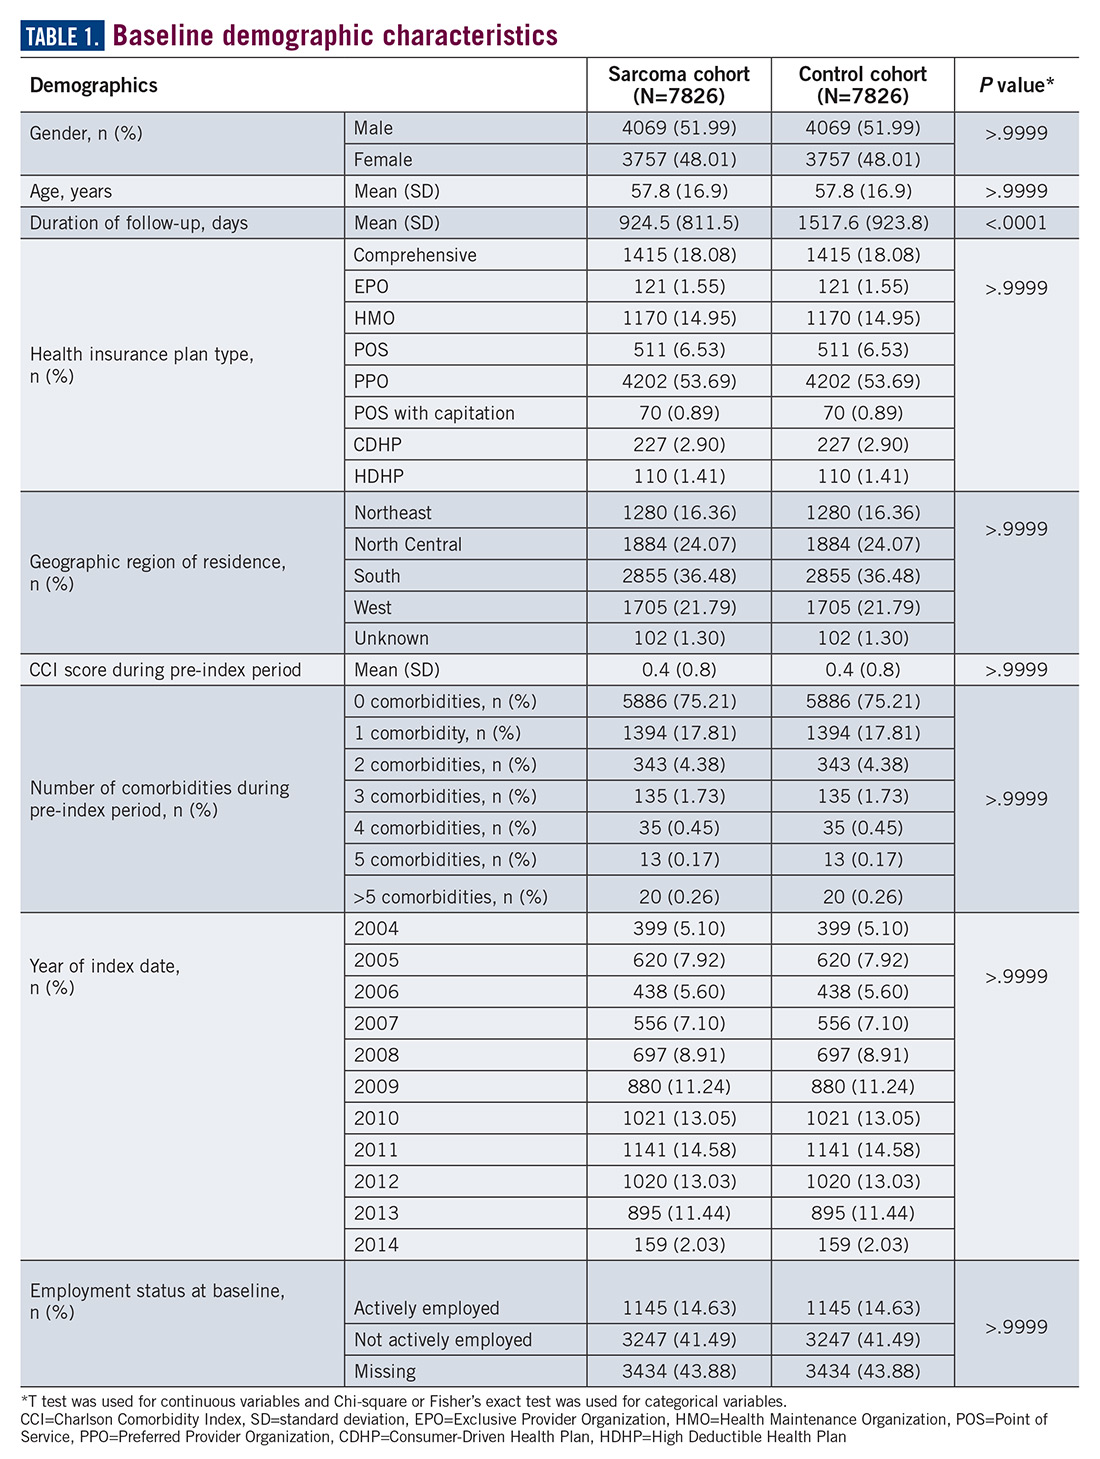
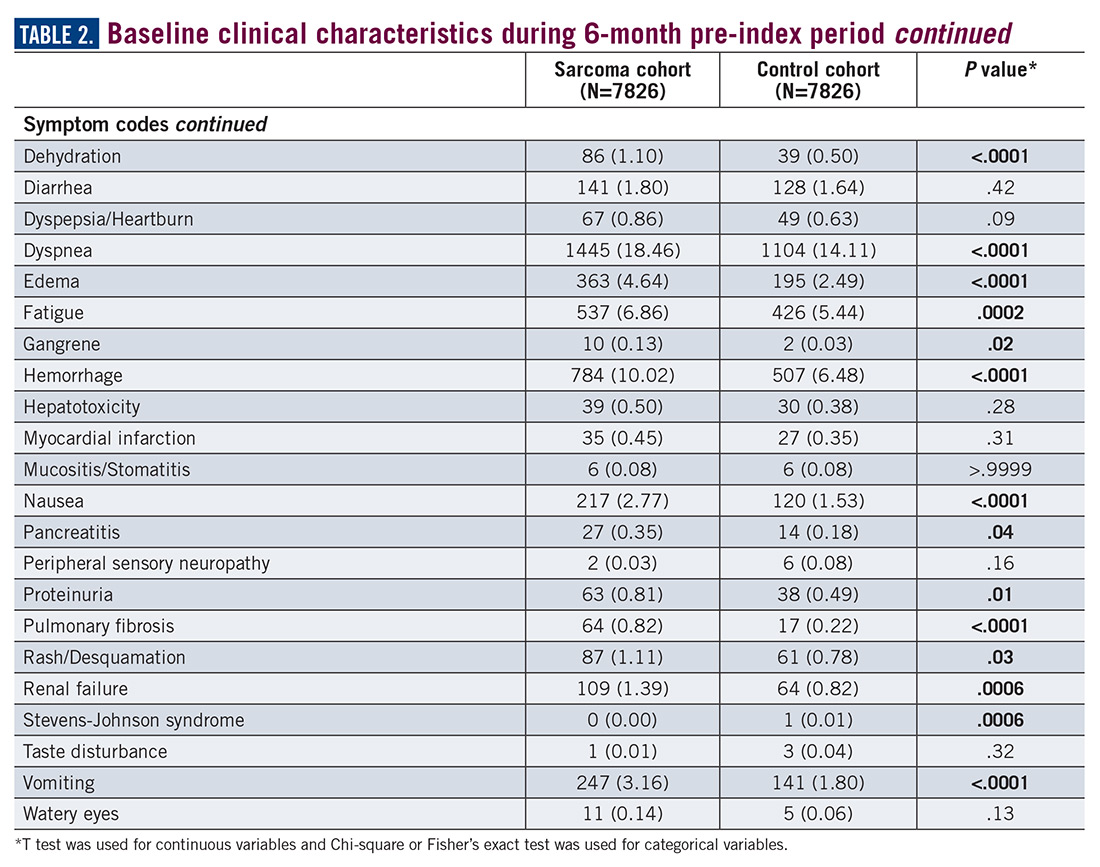
During the 6-month period before the sarcoma diagnosis (prediagnosis period), patients had significantly greater frequency of diagnoses identified than controls for uncertain neoplasms, limb pain, and hypertension (all P<.001, Table 2). 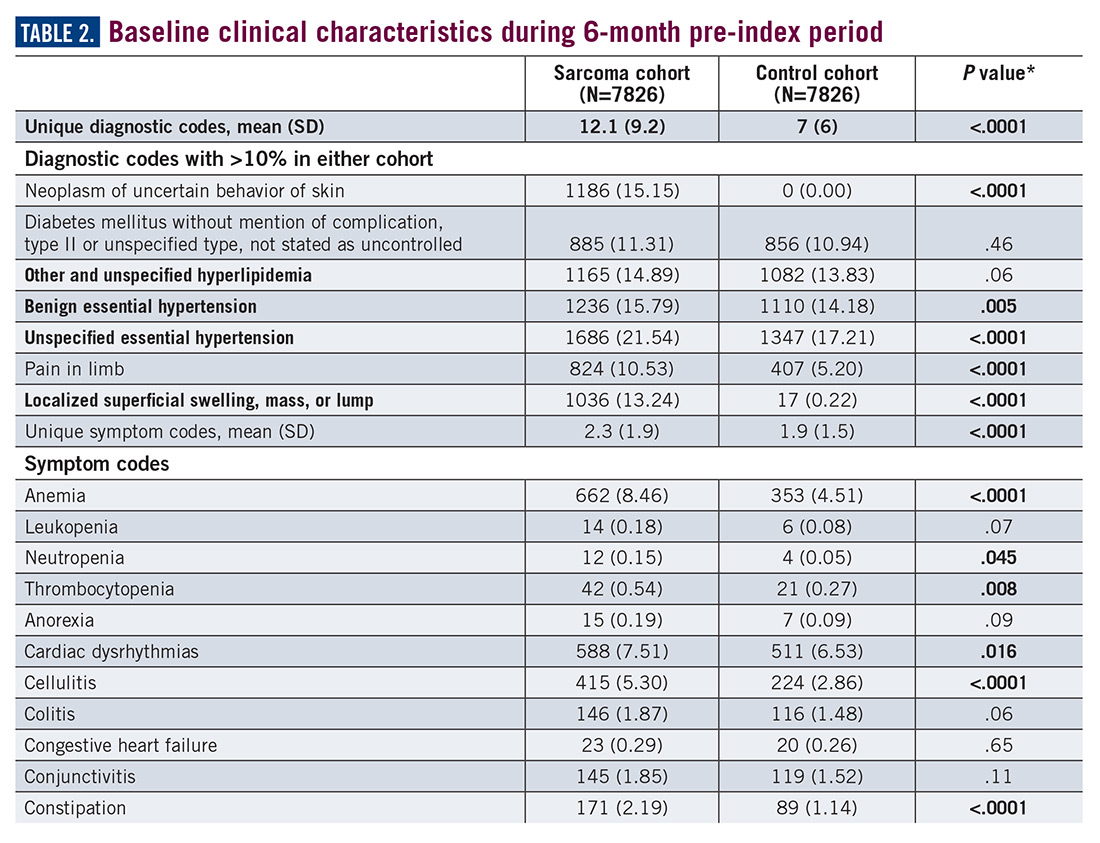
Similarly, the majority of health care resource utilization factors evaluated showed statistically higher health care use among patients later suspected of having sarcoma than matched controls (Table 3). 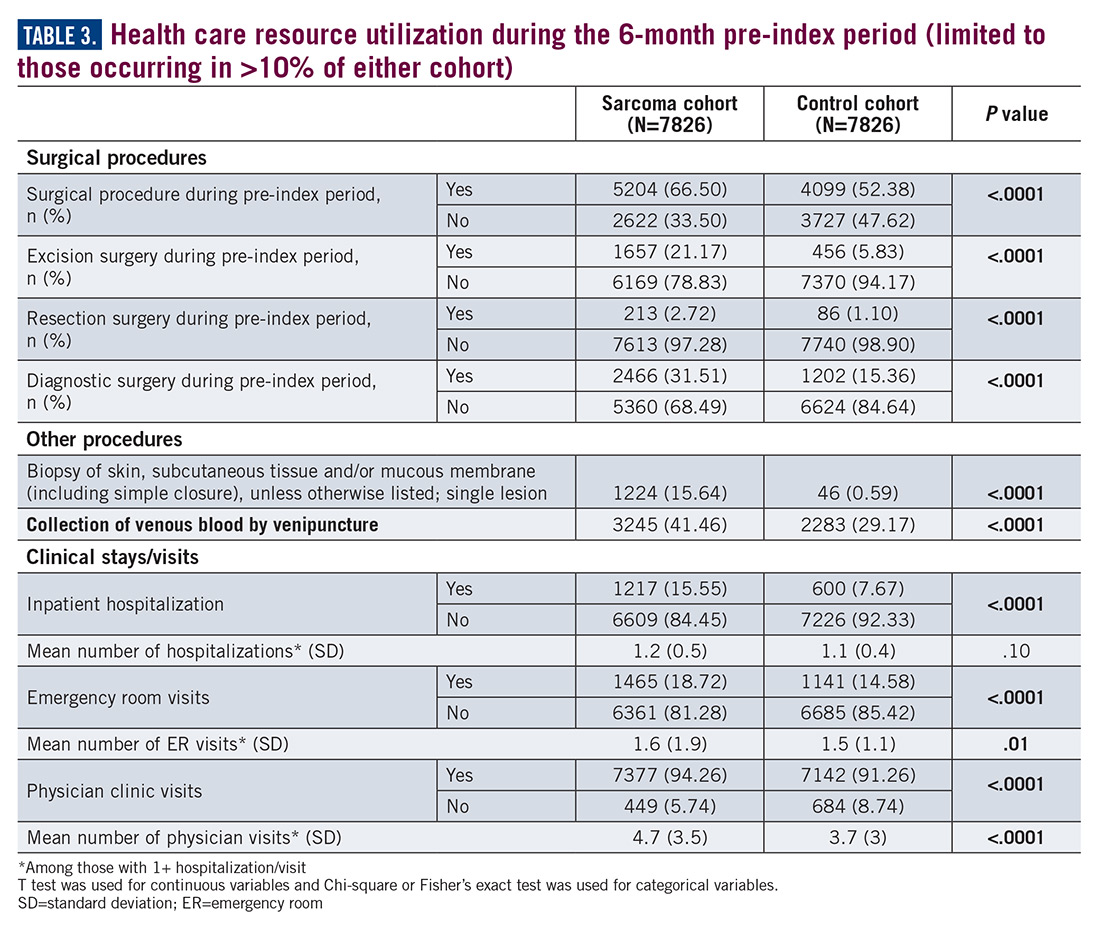
Employment status was missing for 44% of the cohort at baseline and approximately half the cohort during follow-up (Table 4).
Discussion
The symptoms experienced by patients that were recorded in claims were significantly higher across multiple categories than matched controls. However, the rates were relatively low, demonstrating the wide variability in the presentation of sarcoma. Patients had a variety of recorded problems, not limited to a lump or pain, but including hematologic, gastric, and cardiac concerns, that differed from those who had no suspected sarcoma. These factors highlight the challenges that may be facing patients who have an undetected sarcoma.
An expected finding was the difference in duration of follow-up between cohorts. This could be due to longer survival of those without a sarcoma diagnosis or due to insurance changes among those who had a sarcoma diagnosis. The absence of death data did not allow for further exploration of this finding within this study. Future research may wish to identify more comprehensive datasets to allow for the objective evaluation of the differences in time to diagnosis and stage of disease and survival, which would be the ultimate goal in order to develop potential strategies to improve patient outcomes.
This study was limited in that the sarcoma diagnosis could not be verified in a clinical record due to the de-identified nature of the claims data used for this study. Prior work has shown that the ICD coding for sarcoma is incomplete6,7; therefore it is likely there are many other patients in the claims dataset who had a suspected sarcoma but who did not have a 171.x code recorded. Hence, this study is limited to a comparison of a cohort for whom the provider specified a sarcoma code in their billing records. While there are gaps in the ability to identify the entire population of sarcoma patients, the patients with ICD codes used in this study are likely true sarcoma cases. Prior work has demonstrated that the presence of these codes accurately reflects a true sarcoma diagnosis.7 However, given the concerns with ICD coding, two sarcoma codes were required on unique days to reduce the risk of single rule-out codes or data entry error. Patients diagnosed with sarcoma demonstrate significantly greater health care resource use across variables as matched controls during the 6-month period leading to diagnosis, supporting the observations within advocacy and patient reports of the challenges faced during the process to reach an accurate diagnosis. This work may provide the initial basis for the development of strategies to more rapidly identify a potential sarcoma. Future research could also evaluate more than 6 months prior to diagnosis, to quantify the duration of time during which these differences versus controls may exist. Additionally, the cost of care may be of interest to future research to better quantify the burden of misdiagnosis on the health care system.
Acknowledgement
The authors would like to acknowledge Yun Fang, MS, for her support in the SAS coding for the analysis of this study.
Corresponding Author
Lisa M. Hess, PhD, Eli Lilly and Company. [email protected]
Disclosures
No funding was received or exchanged in the conceptualization, conduct, data collection, analysis, interpretation, or writing related to this study. This unfunded study was conducted by employees of Eli Lilly and Company.
1. ACS. Signs and Symptoms of Soft Tissue Sarcomas. 2018. https://www.cancer.org/cancer/soft-tissue-sarcoma/detection-diagnosis-staging/signs-symptoms.html. Accessed September 27, 2018.
2. SEER. Cancer Stat Facts: Soft Tissue including Heart Cancer. National Cancer Institute Surveillance, Epidemiology, and End Results Program; 2018. https://seer.cancer.gov/statfacts/html/soft.html. Accessed February 20, 2019.
3. Rougraff BT, Davis K, Lawrence J. Does length of symptoms before diagnosis of sarcoma affect patient survival? Clin Orthop Relat Res. 2007;462:181-189.
4. Rougraff BT, Lawrence J, Davis K. Length of symptoms before referral: prognostic variable for high-grade soft tissue sarcoma? Clin Orthop Relat Res. 2012;470(3):706-711.
5. LSSI. Liddy Shriver Sarcoma Initiative. Sarcoma: A diagnosis of patience. http://sarcomahelp.org/articles/patience.html. Accessed September 20, 2018.
6. Hess LM, Zhu EY, Sugihara T, Fang Y, Collins N, Nicol S. Challenges with use of the International Classification of Disease Coding (ICD-9-CM/ICD-10-CM) for soft tissue sarcoma. Perspect Health Inf Manage. 2019;16 (Spring). eCollection 2019.
7. Lyu HG, Stein LA, Saadat LV, Phicil SN, Haider A, Raut CP. Assessment of the accuracy of disease coding among patients diagnosed with sarcoma. JAMA Oncol. 2018;4(9):1293-1295.
Introduction
Soft tissue sarcomas (STS) are a heterogeneous group of cancerous tumors, comprised of more than 50 histological subtypes that develop from soft tissues of the body (eg, fat, muscles, nerve tissue, deep skin tissue, visceral nonepithelial tissue). Due to many factors, not limited to the heterogeneity of this set of diseases and lack of screening tests, reaching a diagnosis of STS is challenging for the general practitioner as well as for the oncologist. Sarcomas may present with nonspecific and often indolent symptomology, depending on the specific histological subtype. According to the American Cancer Society, the signs and symptoms of a sarcoma include a new or growing lump, worsening abdominal pain, blood in stool or vomit, and black stools (due to abdominal bleeding).1 Unfortunately, these symptoms could be indicative of any number of other health conditions and are nonspecific to sarcoma.
As with many cancers, the early detection of disease when it may be completely resected could lead to a cure, whereas diagnosis when the disease is no longer amenable to surgery will impact patient survival. Among all forms of STS, early diagnosis when the patient has only localized disease is associated with an 80.8% five-year survival rate, which decreases to 16.4% for patients whose disease has already metastasized to other parts of the body at the time of diagnosis.2
Previous work has evaluated the relationship between duration of symptoms that may lead to a diagnosis of sarcoma and cancer outcomes. A retrospective analysis of a cohort of adults with bone or STS found no correlation between patient recall of duration of prediagnosis symptoms and survival or metastatic disease at diagnosis.3,4 Little other research was identified that examined the challenges of identifying a potential sarcoma. Despite the gap in knowledge, advocacy and patient-centered organizations emphasize the risk of delayed diagnosis and report high levels of stress and frustration among patients by the time an accurate diagnosis is obtained.5 The objective of this study was to quantify the health care experience and misdiagnoses that occurred prior to a sarcoma diagnosis compared to a cohort of matched controls.
Methods
A retrospective observational database study was conducted using detailed resource utilization and cost data from the Truven MarketScan claims database. Truven MarketScan® is a HIPAA-compliant, fully integrated patient-level database containing inpatient, outpatient, drug, lab, health risk assessment, and benefit design information from commercial and Medicare supplemental insurance plans. Additionally, the Health and Productivity Management (HPM) database, containing workplace absence, short-term disability, long-term disability, and worker’s compensation data, is linked at the individual patient level. The linkage of the claims and HPM database was used for this study.
Patients were eligible for inclusion in the cohort of a sarcoma if they had at least two ICD-9 codes of 171.x on two different days between July 1, 2004, and March 30, 2014. The date of the first eligible code was considered the index date. Patients were required to have at least 6 months of health care plan enrollment prior to the first eligible ICD-9 code to allow for prediagnosis activity to be identified in the database. Patients were also required to be 18 years of age or older on the first eligible ICD-9 code date. Patients were excluded who had evidence suggesting a diagnosis of osteosarcoma, Kaposi’s sarcoma, or gastrointestinal stromal tumors (treatment with methotrexate, ICD-9 codes of 176.x, 171.x, or 238.1), a history of any cancer before the eligible sarcoma ICD-9 code, or history of systemic anticancer therapy during the 6-month pre-index period. All patients meeting eligibility criteria were included in the matching algorithm to identify the control cohort.
The matched control cohort was required to have at least the same duration of follow-up at the case level as the matched sarcoma patient, could not have any evidence of any malignancy at any time in the database, nor could have received any systemic anticancer therapy at any time. Controls were randomly selected from the more than 100 million individual patient cases in the MarketScan database to be matched to the eligible sarcoma patient cohort exactly on age, geographic region of residence, health insurance plan type, gender, noncancer comorbid conditions (measured by Charlson Comorbidity Index items), and employment status. All factors were exact matched at the sarcoma cohort index diagnosis date. In the case of missing variables, patients were matched on missingness (eg, a case with missing employment status would be matched to a control with missing employment status).
The eligible time period for the index date of the possible sarcoma cohort and matched controls was between July 1, 2004, and March 30, 2014, which allowed for a minimum of 1-year follow-up through the end of the database available at the time of analysis.
All ICD-9 diagnostic and procedure codes present in the matched 6-month time period pre-index diagnosis were compared to explore factors that may be more likely to be present in the sarcoma cohort compared to matched controls. Univariate analysis was conducted for each prediagnosis variable. Analyses were conducted using T test for continuous variables, and Chi-square or Fisher’s exact test was used for categorical variables.
Number of physician visits, inpatient hospital stays, surgical procedures, and emergency room visits were compared between those in the sarcoma cohort and matched controls during the matched 6-month pre-index period. The post-index diagnosis employment status was also compared between groups using the HPM database. Comparisons between the sarcoma cohort and control cohort were made among the actively employed patients at baseline related to the proportion of patients who continued active employment, the proportion who permanently discontinued work, and the proportion who initially discontinued work and then returned to work at a later time. No adjustments were made for multiple comparisons.
Results
A total of 7826 controls were each matched to patients in the sarcoma cohort. The baseline characteristics of the study cohorts are provided in Table 1.
During the 6-month period before the sarcoma diagnosis (prediagnosis period), patients had significantly greater frequency of diagnoses identified than controls for uncertain neoplasms, limb pain, and hypertension (all P<.001, Table 2).
Similarly, the majority of health care resource utilization factors evaluated showed statistically higher health care use among patients later suspected of having sarcoma than matched controls (Table 3).
Employment status was missing for 44% of the cohort at baseline and approximately half the cohort during follow-up (Table 4).
Discussion
The symptoms experienced by patients that were recorded in claims were significantly higher across multiple categories than matched controls. However, the rates were relatively low, demonstrating the wide variability in the presentation of sarcoma. Patients had a variety of recorded problems, not limited to a lump or pain, but including hematologic, gastric, and cardiac concerns, that differed from those who had no suspected sarcoma. These factors highlight the challenges that may be facing patients who have an undetected sarcoma.
An expected finding was the difference in duration of follow-up between cohorts. This could be due to longer survival of those without a sarcoma diagnosis or due to insurance changes among those who had a sarcoma diagnosis. The absence of death data did not allow for further exploration of this finding within this study. Future research may wish to identify more comprehensive datasets to allow for the objective evaluation of the differences in time to diagnosis and stage of disease and survival, which would be the ultimate goal in order to develop potential strategies to improve patient outcomes.
This study was limited in that the sarcoma diagnosis could not be verified in a clinical record due to the de-identified nature of the claims data used for this study. Prior work has shown that the ICD coding for sarcoma is incomplete6,7; therefore it is likely there are many other patients in the claims dataset who had a suspected sarcoma but who did not have a 171.x code recorded. Hence, this study is limited to a comparison of a cohort for whom the provider specified a sarcoma code in their billing records. While there are gaps in the ability to identify the entire population of sarcoma patients, the patients with ICD codes used in this study are likely true sarcoma cases. Prior work has demonstrated that the presence of these codes accurately reflects a true sarcoma diagnosis.7 However, given the concerns with ICD coding, two sarcoma codes were required on unique days to reduce the risk of single rule-out codes or data entry error. Patients diagnosed with sarcoma demonstrate significantly greater health care resource use across variables as matched controls during the 6-month period leading to diagnosis, supporting the observations within advocacy and patient reports of the challenges faced during the process to reach an accurate diagnosis. This work may provide the initial basis for the development of strategies to more rapidly identify a potential sarcoma. Future research could also evaluate more than 6 months prior to diagnosis, to quantify the duration of time during which these differences versus controls may exist. Additionally, the cost of care may be of interest to future research to better quantify the burden of misdiagnosis on the health care system.
Acknowledgement
The authors would like to acknowledge Yun Fang, MS, for her support in the SAS coding for the analysis of this study.
Corresponding Author
Lisa M. Hess, PhD, Eli Lilly and Company. [email protected]
Disclosures
No funding was received or exchanged in the conceptualization, conduct, data collection, analysis, interpretation, or writing related to this study. This unfunded study was conducted by employees of Eli Lilly and Company.
1. ACS. Signs and Symptoms of Soft Tissue Sarcomas. 2018. https://www.cancer.org/cancer/soft-tissue-sarcoma/detection-diagnosis-staging/signs-symptoms.html. Accessed September 27, 2018.
2. SEER. Cancer Stat Facts: Soft Tissue including Heart Cancer. National Cancer Institute Surveillance, Epidemiology, and End Results Program; 2018. https://seer.cancer.gov/statfacts/html/soft.html. Accessed February 20, 2019.
3. Rougraff BT, Davis K, Lawrence J. Does length of symptoms before diagnosis of sarcoma affect patient survival? Clin Orthop Relat Res. 2007;462:181-189.
4. Rougraff BT, Lawrence J, Davis K. Length of symptoms before referral: prognostic variable for high-grade soft tissue sarcoma? Clin Orthop Relat Res. 2012;470(3):706-711.
5. LSSI. Liddy Shriver Sarcoma Initiative. Sarcoma: A diagnosis of patience. http://sarcomahelp.org/articles/patience.html. Accessed September 20, 2018.
6. Hess LM, Zhu EY, Sugihara T, Fang Y, Collins N, Nicol S. Challenges with use of the International Classification of Disease Coding (ICD-9-CM/ICD-10-CM) for soft tissue sarcoma. Perspect Health Inf Manage. 2019;16 (Spring). eCollection 2019.
7. Lyu HG, Stein LA, Saadat LV, Phicil SN, Haider A, Raut CP. Assessment of the accuracy of disease coding among patients diagnosed with sarcoma. JAMA Oncol. 2018;4(9):1293-1295.
Abstract
Introduction: The challenges of diagnosing soft tissue sarcoma are not well studied; however, the heterogeneity of its presentation would suggest that patients may experience a complex journey in the health care system prior to reaching an accurate diagnosis. This study was designed to evaluate the diagnoses, procedures, and health care resource utilization of patients with soft tissue sarcoma compared to a matched healthy control cohort.
Methods: Patients in the sarcoma cohort were identified in claims data by the presence of diagnosis codes for soft tissue sarcoma. Controls were matched using exact methods on demographic, employment, and insurance variables at the date of the index sarcoma diagnosis. Health care resource utilization and diagnosis and procedure codes were compared between the cohorts during the prediagnosis period (6 months prior to the index and matched date). T test was used for continuous variables and Chi-square or Fisher’s exact test was used for categorical variables.
Results: A total of 7826 sarcoma patients were matched to 7826 controls on demographic, employment, and insurance variables. Diagnoses of uncertain neoplasms, limb pain, and hypertension, as well as anemia, neutropenia, thrombocytopenia, cardiac dysrhythmia, cellulitis, constipation, dehydration, diarrhea, dyspnea, edema, fatigue, gangrene, hemorrhage, nausea, pancreatitis, proteinuria, pulmonary fibrosis, rash, renal failure, vomiting, and watery eyes were significantly greater in the sarcoma cohort versus controls (all P <.05). The majority of health care resource utilization evaluated showed statistically higher utilization in the sarcoma cohort versus matched controls.
Conclusions: Sarcoma patients had many health conditions and diagnoses that significantly differed from controls during the 6-month period prior to diagnosis. These data provide initial evidence regarding the quantity and frequency of additional health care resources used and symptoms experienced leading to the diagnosis of sarcoma.
Key words: sarcoma, diagnosis, health care resource utilization, health care economics
Current State of Hepatitis C Care in the VA
VA Hepatitis C Treatment Progress
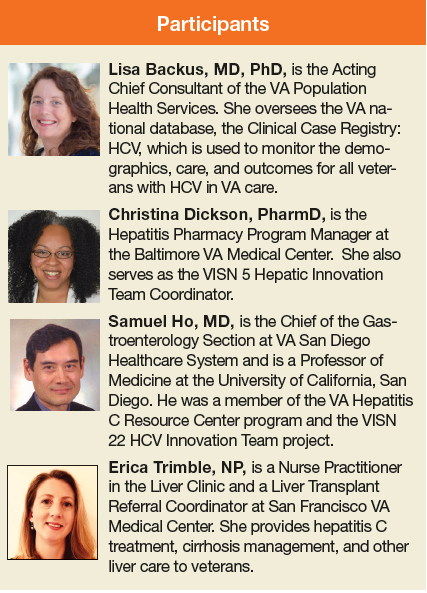
Lisa Backus, MD. For a long time the US Department of Veterans Affairs (VA) has approached hepatitis C virus (HCV) care in a comprehensive way. We have done extensive screening to look for people with HCV infection. Even before birth cohort testing was recommended by the Centers for Disease Control and Prevention (CDC), the VA had aggressive HCV screening programs.
From the VA Corporate Data Warehouse, we know that the VA has screened more than 80% of people who are in the 1945 to 1965 birth cohort in VA care. Over time, HCV prevalence has been dropping in screened veterans and by extension in those who remain to be screened. Based on internal modeling, the VA estimates that only 6,000 to 7,000 veterans in the 1945 to 1965 birth cohort remain to be found if we could somehow screen everyone in that group.
On the treatment side, the VA has provided an unparalleled amount of care. In data from the Clinical Case Registry: HCV, as of February 2018 the VA has started more than 104,000 veterans on direct-acting antiviral (DAA) treatment. When the DAAs first became available, we estimated that there were about 165,000 people who were HCV viremic and who needed to be treated. By the end of January 2018, that number was down to about 35,000 people. The VA has done an unbelievably good job of finding people, getting them into care, and treating them.
Samuel Ho, MD. I agree with Dr. Backus. The VA has done an excellent job over the past few years in treating a very significant proportion of our patients with HCV. In addition to the extensive screening efforts, I want to emphasize that going back to about the year 2000, the VA has been very active in supporting the establishment of HCV clinics within every VA medical center to identify and engage patients in treatment. At that time, of course, the treatment was with pegylated interferon and ribavirin, which was very challenging. The VA support consisted of funding 4 hepatitis C Resource Centers (HCRCs) nationwide, which were located in Minneapolis, Portland/Seattle, New Haven, and San Francisco.
The HCRCs reached out to every VA facility in the country, developed networks of health care providers (HCPs), trained them, and educated them regarding the HCV treatments and strategies to engage patients in care, especially the large numbers with comorbidities, such as psychiatric problems and substance use disorders. This highly engaged network of local HCV clinic providers was set up and running and was well poised to take advantage of the interferon-free DAAs when they became available in late 2013 and early 2014. With the continuing leadership of David Ross, MD, and many others at the national level, the VA then supported the development of HCV Innovation Teams in every VISN that continued the efforts to support local quality improvement initiatives related to HCV care.
That being said, the VA still has challenges. There are a significant number of people who have barriers to receiving treatment. For example, here at the VA San Diego Healthcare System, Dr. John Dever and our other colleagues looked at 481 patients who were high priority to get started on HCV treatment, because they were all believed to be a high risk for cirrhosis due to their Fibrosis-4 (FIB4) scores and other characteristics.1
We really worked hard on that group, and of the ones who were eligible for treatment, 30% were either unwilling or unable to engage in care over a yearlong follow-up with multiple attempts at outreach. In comparison with patients who became engaged or were engaged in care, these nonengaged patients were significantly more likely to be homeless, have other comorbidities, or active alcohol and/or drug use. Not surprisingly, they had obvious barriers to engaging in care.
Further efforts need to be made to focus on these patients, maybe with innovative ideas and strategies for outreach to get them into treatment or to bring treatment to them. I’m not sure exactly as to what the best approach would be. There is ongoing research in that regard, but it still is a challenge.
Erica Trimble, NP. Our experience at VA San Francisco Health Care System is similar. If we actively reach out to veterans already engaged in primary care, we can usually engage them in the liver clinic as well. However, there are quite a number of veterans who engage regularly with HUD-VASH (US Department of House and Urban Development-VA Supportive Housing program) and other homeless veteran services but have no primary or specialty care engagement. These veterans are very difficult to reach.
We are collaborating with HUD-VASH social workers to see if there are more creative ways to connect with these veterans. Some of the ideas include having liver providers visit veteran housing locations, having HUD-VASH social workers convey messages to difficult-to-reach veterans, and problem-solving specific transportation issues that present barriers to care.
Christina Dickson, PharmD. At the VA Maryland Health Care System Baltimore VA Medical Center, we hear from veterans in our education classes about the various myths that are still out there in the community about HCV. Some of these myths are the reason that veterans may avoid seeking treatment or even attending the HCV clinic appointments. Some veterans say they didn’t come in previously because they thought they would need a liver biopsy or because their doctor told them they had to be completely sober in order to be considered for treatment. These can be major deterrents that keep patients away despite our outreach efforts. In addition to miseducation in the community, there also is still a reluctance to talk about HCV and the risk factors. Many patients don’t want to discuss their history or are concerned about their partners finding out, so they instead choose to ignore it altogether. The negative stigma of HCV is still present even in some of our HCPs.
Just as VA San Francisco is working to engage its homeless population, we are looking to work with mental health and substance abuse programs. More and more is being written about the importance of working with such teams and even colocating the HCV clinic with their services. For example, in Baltimore, the methadone clinic is 2 floors above our clinic. Some of the remaining viremic patients will go to the methadone clinic in the morning and then leave despite having an appointment just 2 floors down. Offering HCV services at the same time, in the same area may help to engage veterans to consider their liver health.
Ms. Trimble. VA San Francisco has been fortunate to have the assistance of our opiate replacement clinic staff as well; this is particularly helpful since many veterans visit the opiate replacement clinic daily for medications and know the staff there very well. The staff facilitate communication with the liver clinic, execute warm handoffs to the liver clinic, and provide daily dispensing of hepatitis C medications for a number of veterans who have more difficulty with medication adherence. It has worked very well.
Dr. Ho. I think what you both are pointing out is very important—these patients require teamwork. A multidisciplinary group of HCPs working together in a collaborative, integrated care model has been demonstrated to significantly improve HCV engagement, care, and treatment in these highly comorbid patients.2 Whenever we can work together and build teams and recruit other HCPs in these other clinics, it will really pay off.
Dr. Backus. At VA Palo Alto Health Care System, we also run a program integrated with our 28-day and 90-day residential rehabilitation programs. We realized that those residential treatment programs were a place to reach people who we were having difficulties starting treatment. It was a perfect situation because if you were there for 28 days, we could nearly guarantee that at the very least the patient was going to get 28 days of medications. Particularly now with some of the shorter treatment courses, we only have to get a patient to take another 28 days, which is very doable. Clearly, for the people who are in 90-day programs, the full 8-week or 12-week course of treatment could be completed during the rehabilitation. In addition, we started out at a good place because the programs already screened automatically for HCV on admission to the program, so it was easy to identify people who had HCV.
Ms. Trimble. Specialty Care Access Network-Extension for Community Healthcare Outcomes (SCAN-ECHO) also can help with outreach. Alexander Monto, MD, and Helen Yee, PharmD, conduct weekly SCAN-ECHO video telehealth conferences with outlying HCPs from other clinics. The outlying HCPs submit cases for hepatitis C treatment consideration; then they take the recommendations from their discussion with Dr. Monto and Dr. Yee but lead the treatment with their patients.
Over time, with this ongoing mentoring, the participating providers have gained a lot of expertise in hepatitis C and serve as a local resource for their clinics. One of the clinics is in Eureka, California, which is nearly 300 miles away. In contrast, the other main clinic that participates is the downtown clinic. It serves the most urban and difficult-to-reach patients. The familiarity and rapport that the downtown clinic providers have with their patients allow them to more effectively engage patients for treatment initiation and follow-up.
Dr. Dickson. Our catchment area includes West Virginia, and we do telehealth for one of the sites, which has a number of 20-year-old and 30-year-old patients. In this slightly different population it is again a challenge getting and keeping them engaged as they go through the pretreatment evaluation. Some say that there may be a benefit to getting them on treatment as quickly as possible so that they don’t have time to disengage. The age difference brings about different barriers. We have to think outside the box on how to reach out to these patients. They work, they have kids, and they don’t feel ill right now. And many are active injection drug users. Trying to get them engaged in health care in general and on HCV treatment is the next big challenge.
Health Care Provider Education
Dr. Dickson. When we reach out to viremic veterans who’ve never been to our clinic, we will sometimes find comments such as, “patient not interested” or “patient still drinking” or no comment at all in the electronic health record primary care notes. So we began to focus our HCV education not only on veterans but also the providers. Some HCPs don’t consider the benefits of referring patients to the clinic for at least the opportunity to receive education on HCV, learning if there is any scarring on their liver, and learning about their options for treatment should they choose to proceed. We are continuing to meet with HCPs in all areas to let them know what’s offered in the HCV clinics. In addition, we have found that direct contact from our HCV clinic to veterans who were not interested is very successful. We get a chance to show that the VA cares and explain what our clinic offers and find that they are more than willing to arrange an appointment with us.
Ms. Trimble. I agree. We have successfully treated many veterans who are still using alcohol or drugs, and the VA supports considering any patient for treatment regardless of substance use; however, not all providers are aware of this. One of the other main education points for patients and providers is that they need not have severe liver disease to be considered for treatment. In the past, typically only patients with moderate to advanced liver fibrosis were considered for treatment, but this approach has changed in the past couple years.
Dr. Ho. I would agree that there still is a need to educate HCPs who may have had a presentation or read something on HCV a year or 2 ago. It’s now possible to treat almost all patients with HCV. It really has been fantastic, but not everyone is aware of it right now. That means we need to continue to be active with our colleagues and get them on the team. It is very helpful to increase enthusiasm if we can publicize new data and information coming out about the success in the VA of these DAA regimens.
Dr. Backus. There was a time when the DAAs first came out and the prices were higher and there was concern about the funding. At that time, we were treating only people with more advanced liver disease. Now we are treating everyone regardless of how advanced their liver disease is, but occasionally at VA Palo Alto I’ve run into providers who say, “The patient didn’t have cirrhosis, so I didn’t refer.” Education still needs to happen. It can be a little confusing because there was a time when we were not treating everyone. Now we are, and we have to make sure to get out this message.
Dr. Dickson. For patients with unstable comorbidities, HCPs may make the choice against HCV treatment. In the Baltimore clinic, we have case managers who will work with such patients and get to know them very well. Many times we do more than just cure their HCV. We also help them with their other conditions because we see them so often, such as helping with their pill boxes and encouraging them since they can see their liver enzymes getting better. There is a lot to be said for case management, the hands-on contact, and the concern that we can show these veterans. It helps not just the HCV but also their blood pressure and cholesterol are now controlled. We hear so many thanks from the veterans that come through our program. It might have taken a lot of work to get them to treatment, but in the end, they’re better overall.
Next Steps in HCV Care
Dr. Backus. The most pressing next step is becoming really creative and integrative about how to reach the more difficult-to-treat patients with comorbidities and reach the less-engaged populations. It is probably going to take some change in the models of care. For example, we are going to have to set up a clinic that is colocated in an opioid replacement therapy clinic or in the rehabilitation program. HCV care is going to have to evolve.
I think there is another issue that Dr. Dickson pointed out. Although it is small and really only occurs in some regions, there is a young population of people with HCV. Some of the models of care that we have used may not work with this population, and we have to recognize that this will be an ongoing issue. Care for these patients will look different. For example, clinics may need to provide child care for this younger population.
Cancer is another important issue. Many of these people have cirrhosis, and even if we cure their HCV, we have to remain cognizant that they still have cirrhosis and potentially need screening for hepatocellular carcinoma. They also may need care for their cirrhosis or counseling about ongoing alcohol use, because even though their HCV was cured, continued alcohol use is not good for their cirrhosis.
Those 3 issues are still in the immediate future of HCV care in the VA. The World Health Organization has a goal for eliminating HCV. One could hope that maybe we could get there; it may be possible through screening, treatment, and prevention strategies. If we are lucky, we could put ourselves out of a job. I don’t see that happening, but it’s a hope.
Ms. Trimble. Are we seeing the same trend in new infections in young injection drug using veterans that are being seen in the nonveteran population nationally?
Dr. Backus. We have looked at this quite closely. The CDC came out with a report recently that showed a substantial increase in HCV cases in people aged 20 to 39 years. At the VA, we have not seen that uptick. The VA rates of new infections or new diagnosis of infections in peopled aged 20 to 39 years are pretty stable. The VA screening rates in people who were born after 1965 is in the high 70% range—nearly as high as in the cohort of people born between 1945 and 1965. As a result, the VA has excellent internal data about the incidence of infections in younger populations. In the VA, we are not seeing this sort of massive increase in incidence in younger populations. Definitely, there are new young injection drug users in the VA who are contracting HCV but not what the CDC is reporting in other parts of the country.4
Ms. Trimble. That’s really interesting.
Dr. Ho. Part of that has been the fact that if you’re a VA patient, you had to have been engaged at some point with the VA with access to its extensive psychiatric mental health and substance use disorder treatment infrastructure. I wonder if the availability of these services is a factor that can be protecting our patients from this recent upsurge in injection drug use.
Dr. Dickson. For our VISN, we do have smaller sites with a number of their remaining viremic veterans in this young cohort who are indeed proving to be a challenge to link to care in the HCV clinics. We continue to brainstorm ideas to determine and overcome their barriers to treatment. The VA is excellent at connecting all of us nationwide, so we look forward to hearing from other sites in a similar situation on how they are overcoming this challenge. Because when you look outside the VA, many are wondering what to do and how to engage these patients.
Dr. Backus. One of the amazing things about HCV treatment is how effective it has been. Traditionally the real-world effectiveness for medications is not nearly as good as the clinical trial efficacy. Clinical trials have extra resources, specially trained doctors and nurses, and tend to recruit engaged and cooperative patients. Often, there has been a stepdown between the clinical efficacy from the trials and what we see in the real world. A pleasant surprise about DAA treatment at the VA is that the clinical effectiveness we see in the real world almost matches the amazing results seen in clinical trials. That also has been critical to the success that we are seeing. The medications are powerful, and even outside the settings of a clinical trial, they work incredibly well.
Dr. Ho. I agree. You, Dr. Backus, along with Pam Belperio, PharmD, George Ioannou MD, MS, and other VA researchers have done excellent work in documenting the real-world effectiveness of these medications in the VA system. It was surprising but not unexpected.5-7 It is due to the VA’s excellent clinical infrastructure and that it provides an integrated system for caring for these patients. It is a measure of that success.
Dr. Dickson. The multidisciplinary teams are a major part of that. I don’t think we could care and support the veterans that we have, especially the challenging ones, the ones who are resistant, without having nursing, social work, mental health, and pharmacy involved. It’s just a huge team effort. That is what I love about caring for patients at the VA—it’s always been supportive of the multidisciplinary aspect of looking at this disease.
Click here to read the digital edition.
1. Dever JB, Ducom JH, Ma A, et al. Engagement in care of high-risk hepatitis C patients with interferon-free direct-acting antiviral therapies. Dig Dis Sci. 2017;62(6):1472-1479.
2. Bajis S, Dore GJ, Hajarizadeh B, Cunningham EB, Maher L, Grebely J. Interventions to enhance testing, linkage to care and treatment uptake for hepatitis C virus infection among people who inject drugs: A systematic review. Int J Drug Policy. 2017;47:34-46.
3. Groessl EJ, Liu L, Sklar M, Ho SB. HCV integrated care: a randomized trial to increase treatment initiation and SVR with direct acting antivirals. Int J Hepatol. 2017;2017:5834182.
4. Centers for Disease Control and Prevention. Table 4.1. Reported cases of acute hepatitis C, nationally and by state and jurisdiction—United States, 2011-2015. https://www.cdc.gov/hepatitis/statistics/2015surveillance/index.htm#tabs-6-1. Updated June 19, 2017. Accessed March 5, 2018.
5. Backus LI, Belperio PS, Shahoumian TA, Loomis TP, Mole LA. Comparative effectiveness of ledipasvir/sofosbuvir ± ribavirin vs. ombitasvir/paritaprevir/ritonavir + dasabuvir ± ribavirin in 6961 genotype 1 patients treated in routine medical practice. Aliment Pharmacol Ther. 2016;44(4):400-410.
6. Backus LI, Belperio PS, Shahoumian TA, Loomis TP, Mole LA. Real-world effectiveness of ledipasvir/sofosbuvir in 4,365 treatment-naive, genotype 1 hepatitis C-infected patients. Hepatology. 2016;64(2):405-414.
7. Ioannou GN, Beste LA, Chang MF, et al. Effectiveness of sofosbuvir, ledipasvir/sofosbuvir, or paritaprevir/ritonavir/ombitasvir and dasabuvir regimens for treatment of patients with hepatitis C in the Veterans Affairs national health care system. Gastroenterology. 2016;151(3):457-471.e5.
Author disclosures
The authors report no actual or potential conflicts of interest with regard to this article.
Disclaimer
The opinions expressed herein are those of the authors and do not necessarily reflect those of Federal Practitioner, Frontline Medical Communications Inc., the US Government, or any of its agencies. This article may discuss unlabeled or investigational use of certain drugs. Please review the complete prescribing information for specific drugs or drug combinations—including indications, contraindications, warnings, and adverse effects—before administering pharmacologic therapy to patients.
VA Hepatitis C Treatment Progress
Lisa Backus, MD. For a long time the US Department of Veterans Affairs (VA) has approached hepatitis C virus (HCV) care in a comprehensive way. We have done extensive screening to look for people with HCV infection. Even before birth cohort testing was recommended by the Centers for Disease Control and Prevention (CDC), the VA had aggressive HCV screening programs.
From the VA Corporate Data Warehouse, we know that the VA has screened more than 80% of people who are in the 1945 to 1965 birth cohort in VA care. Over time, HCV prevalence has been dropping in screened veterans and by extension in those who remain to be screened. Based on internal modeling, the VA estimates that only 6,000 to 7,000 veterans in the 1945 to 1965 birth cohort remain to be found if we could somehow screen everyone in that group.
On the treatment side, the VA has provided an unparalleled amount of care. In data from the Clinical Case Registry: HCV, as of February 2018 the VA has started more than 104,000 veterans on direct-acting antiviral (DAA) treatment. When the DAAs first became available, we estimated that there were about 165,000 people who were HCV viremic and who needed to be treated. By the end of January 2018, that number was down to about 35,000 people. The VA has done an unbelievably good job of finding people, getting them into care, and treating them.
Samuel Ho, MD. I agree with Dr. Backus. The VA has done an excellent job over the past few years in treating a very significant proportion of our patients with HCV. In addition to the extensive screening efforts, I want to emphasize that going back to about the year 2000, the VA has been very active in supporting the establishment of HCV clinics within every VA medical center to identify and engage patients in treatment. At that time, of course, the treatment was with pegylated interferon and ribavirin, which was very challenging. The VA support consisted of funding 4 hepatitis C Resource Centers (HCRCs) nationwide, which were located in Minneapolis, Portland/Seattle, New Haven, and San Francisco.
The HCRCs reached out to every VA facility in the country, developed networks of health care providers (HCPs), trained them, and educated them regarding the HCV treatments and strategies to engage patients in care, especially the large numbers with comorbidities, such as psychiatric problems and substance use disorders. This highly engaged network of local HCV clinic providers was set up and running and was well poised to take advantage of the interferon-free DAAs when they became available in late 2013 and early 2014. With the continuing leadership of David Ross, MD, and many others at the national level, the VA then supported the development of HCV Innovation Teams in every VISN that continued the efforts to support local quality improvement initiatives related to HCV care.
That being said, the VA still has challenges. There are a significant number of people who have barriers to receiving treatment. For example, here at the VA San Diego Healthcare System, Dr. John Dever and our other colleagues looked at 481 patients who were high priority to get started on HCV treatment, because they were all believed to be a high risk for cirrhosis due to their Fibrosis-4 (FIB4) scores and other characteristics.1
We really worked hard on that group, and of the ones who were eligible for treatment, 30% were either unwilling or unable to engage in care over a yearlong follow-up with multiple attempts at outreach. In comparison with patients who became engaged or were engaged in care, these nonengaged patients were significantly more likely to be homeless, have other comorbidities, or active alcohol and/or drug use. Not surprisingly, they had obvious barriers to engaging in care.
Further efforts need to be made to focus on these patients, maybe with innovative ideas and strategies for outreach to get them into treatment or to bring treatment to them. I’m not sure exactly as to what the best approach would be. There is ongoing research in that regard, but it still is a challenge.
Erica Trimble, NP. Our experience at VA San Francisco Health Care System is similar. If we actively reach out to veterans already engaged in primary care, we can usually engage them in the liver clinic as well. However, there are quite a number of veterans who engage regularly with HUD-VASH (US Department of House and Urban Development-VA Supportive Housing program) and other homeless veteran services but have no primary or specialty care engagement. These veterans are very difficult to reach.
We are collaborating with HUD-VASH social workers to see if there are more creative ways to connect with these veterans. Some of the ideas include having liver providers visit veteran housing locations, having HUD-VASH social workers convey messages to difficult-to-reach veterans, and problem-solving specific transportation issues that present barriers to care.
Christina Dickson, PharmD. At the VA Maryland Health Care System Baltimore VA Medical Center, we hear from veterans in our education classes about the various myths that are still out there in the community about HCV. Some of these myths are the reason that veterans may avoid seeking treatment or even attending the HCV clinic appointments. Some veterans say they didn’t come in previously because they thought they would need a liver biopsy or because their doctor told them they had to be completely sober in order to be considered for treatment. These can be major deterrents that keep patients away despite our outreach efforts. In addition to miseducation in the community, there also is still a reluctance to talk about HCV and the risk factors. Many patients don’t want to discuss their history or are concerned about their partners finding out, so they instead choose to ignore it altogether. The negative stigma of HCV is still present even in some of our HCPs.
Just as VA San Francisco is working to engage its homeless population, we are looking to work with mental health and substance abuse programs. More and more is being written about the importance of working with such teams and even colocating the HCV clinic with their services. For example, in Baltimore, the methadone clinic is 2 floors above our clinic. Some of the remaining viremic patients will go to the methadone clinic in the morning and then leave despite having an appointment just 2 floors down. Offering HCV services at the same time, in the same area may help to engage veterans to consider their liver health.
Ms. Trimble. VA San Francisco has been fortunate to have the assistance of our opiate replacement clinic staff as well; this is particularly helpful since many veterans visit the opiate replacement clinic daily for medications and know the staff there very well. The staff facilitate communication with the liver clinic, execute warm handoffs to the liver clinic, and provide daily dispensing of hepatitis C medications for a number of veterans who have more difficulty with medication adherence. It has worked very well.
Dr. Ho. I think what you both are pointing out is very important—these patients require teamwork. A multidisciplinary group of HCPs working together in a collaborative, integrated care model has been demonstrated to significantly improve HCV engagement, care, and treatment in these highly comorbid patients.2 Whenever we can work together and build teams and recruit other HCPs in these other clinics, it will really pay off.
Dr. Backus. At VA Palo Alto Health Care System, we also run a program integrated with our 28-day and 90-day residential rehabilitation programs. We realized that those residential treatment programs were a place to reach people who we were having difficulties starting treatment. It was a perfect situation because if you were there for 28 days, we could nearly guarantee that at the very least the patient was going to get 28 days of medications. Particularly now with some of the shorter treatment courses, we only have to get a patient to take another 28 days, which is very doable. Clearly, for the people who are in 90-day programs, the full 8-week or 12-week course of treatment could be completed during the rehabilitation. In addition, we started out at a good place because the programs already screened automatically for HCV on admission to the program, so it was easy to identify people who had HCV.
Ms. Trimble. Specialty Care Access Network-Extension for Community Healthcare Outcomes (SCAN-ECHO) also can help with outreach. Alexander Monto, MD, and Helen Yee, PharmD, conduct weekly SCAN-ECHO video telehealth conferences with outlying HCPs from other clinics. The outlying HCPs submit cases for hepatitis C treatment consideration; then they take the recommendations from their discussion with Dr. Monto and Dr. Yee but lead the treatment with their patients.
Over time, with this ongoing mentoring, the participating providers have gained a lot of expertise in hepatitis C and serve as a local resource for their clinics. One of the clinics is in Eureka, California, which is nearly 300 miles away. In contrast, the other main clinic that participates is the downtown clinic. It serves the most urban and difficult-to-reach patients. The familiarity and rapport that the downtown clinic providers have with their patients allow them to more effectively engage patients for treatment initiation and follow-up.
Dr. Dickson. Our catchment area includes West Virginia, and we do telehealth for one of the sites, which has a number of 20-year-old and 30-year-old patients. In this slightly different population it is again a challenge getting and keeping them engaged as they go through the pretreatment evaluation. Some say that there may be a benefit to getting them on treatment as quickly as possible so that they don’t have time to disengage. The age difference brings about different barriers. We have to think outside the box on how to reach out to these patients. They work, they have kids, and they don’t feel ill right now. And many are active injection drug users. Trying to get them engaged in health care in general and on HCV treatment is the next big challenge.
Health Care Provider Education
Dr. Dickson. When we reach out to viremic veterans who’ve never been to our clinic, we will sometimes find comments such as, “patient not interested” or “patient still drinking” or no comment at all in the electronic health record primary care notes. So we began to focus our HCV education not only on veterans but also the providers. Some HCPs don’t consider the benefits of referring patients to the clinic for at least the opportunity to receive education on HCV, learning if there is any scarring on their liver, and learning about their options for treatment should they choose to proceed. We are continuing to meet with HCPs in all areas to let them know what’s offered in the HCV clinics. In addition, we have found that direct contact from our HCV clinic to veterans who were not interested is very successful. We get a chance to show that the VA cares and explain what our clinic offers and find that they are more than willing to arrange an appointment with us.
Ms. Trimble. I agree. We have successfully treated many veterans who are still using alcohol or drugs, and the VA supports considering any patient for treatment regardless of substance use; however, not all providers are aware of this. One of the other main education points for patients and providers is that they need not have severe liver disease to be considered for treatment. In the past, typically only patients with moderate to advanced liver fibrosis were considered for treatment, but this approach has changed in the past couple years.
Dr. Ho. I would agree that there still is a need to educate HCPs who may have had a presentation or read something on HCV a year or 2 ago. It’s now possible to treat almost all patients with HCV. It really has been fantastic, but not everyone is aware of it right now. That means we need to continue to be active with our colleagues and get them on the team. It is very helpful to increase enthusiasm if we can publicize new data and information coming out about the success in the VA of these DAA regimens.
Dr. Backus. There was a time when the DAAs first came out and the prices were higher and there was concern about the funding. At that time, we were treating only people with more advanced liver disease. Now we are treating everyone regardless of how advanced their liver disease is, but occasionally at VA Palo Alto I’ve run into providers who say, “The patient didn’t have cirrhosis, so I didn’t refer.” Education still needs to happen. It can be a little confusing because there was a time when we were not treating everyone. Now we are, and we have to make sure to get out this message.
Dr. Dickson. For patients with unstable comorbidities, HCPs may make the choice against HCV treatment. In the Baltimore clinic, we have case managers who will work with such patients and get to know them very well. Many times we do more than just cure their HCV. We also help them with their other conditions because we see them so often, such as helping with their pill boxes and encouraging them since they can see their liver enzymes getting better. There is a lot to be said for case management, the hands-on contact, and the concern that we can show these veterans. It helps not just the HCV but also their blood pressure and cholesterol are now controlled. We hear so many thanks from the veterans that come through our program. It might have taken a lot of work to get them to treatment, but in the end, they’re better overall.
Next Steps in HCV Care
Dr. Backus. The most pressing next step is becoming really creative and integrative about how to reach the more difficult-to-treat patients with comorbidities and reach the less-engaged populations. It is probably going to take some change in the models of care. For example, we are going to have to set up a clinic that is colocated in an opioid replacement therapy clinic or in the rehabilitation program. HCV care is going to have to evolve.
I think there is another issue that Dr. Dickson pointed out. Although it is small and really only occurs in some regions, there is a young population of people with HCV. Some of the models of care that we have used may not work with this population, and we have to recognize that this will be an ongoing issue. Care for these patients will look different. For example, clinics may need to provide child care for this younger population.
Cancer is another important issue. Many of these people have cirrhosis, and even if we cure their HCV, we have to remain cognizant that they still have cirrhosis and potentially need screening for hepatocellular carcinoma. They also may need care for their cirrhosis or counseling about ongoing alcohol use, because even though their HCV was cured, continued alcohol use is not good for their cirrhosis.
Those 3 issues are still in the immediate future of HCV care in the VA. The World Health Organization has a goal for eliminating HCV. One could hope that maybe we could get there; it may be possible through screening, treatment, and prevention strategies. If we are lucky, we could put ourselves out of a job. I don’t see that happening, but it’s a hope.
Ms. Trimble. Are we seeing the same trend in new infections in young injection drug using veterans that are being seen in the nonveteran population nationally?
Dr. Backus. We have looked at this quite closely. The CDC came out with a report recently that showed a substantial increase in HCV cases in people aged 20 to 39 years. At the VA, we have not seen that uptick. The VA rates of new infections or new diagnosis of infections in peopled aged 20 to 39 years are pretty stable. The VA screening rates in people who were born after 1965 is in the high 70% range—nearly as high as in the cohort of people born between 1945 and 1965. As a result, the VA has excellent internal data about the incidence of infections in younger populations. In the VA, we are not seeing this sort of massive increase in incidence in younger populations. Definitely, there are new young injection drug users in the VA who are contracting HCV but not what the CDC is reporting in other parts of the country.4
Ms. Trimble. That’s really interesting.
Dr. Ho. Part of that has been the fact that if you’re a VA patient, you had to have been engaged at some point with the VA with access to its extensive psychiatric mental health and substance use disorder treatment infrastructure. I wonder if the availability of these services is a factor that can be protecting our patients from this recent upsurge in injection drug use.
Dr. Dickson. For our VISN, we do have smaller sites with a number of their remaining viremic veterans in this young cohort who are indeed proving to be a challenge to link to care in the HCV clinics. We continue to brainstorm ideas to determine and overcome their barriers to treatment. The VA is excellent at connecting all of us nationwide, so we look forward to hearing from other sites in a similar situation on how they are overcoming this challenge. Because when you look outside the VA, many are wondering what to do and how to engage these patients.
Dr. Backus. One of the amazing things about HCV treatment is how effective it has been. Traditionally the real-world effectiveness for medications is not nearly as good as the clinical trial efficacy. Clinical trials have extra resources, specially trained doctors and nurses, and tend to recruit engaged and cooperative patients. Often, there has been a stepdown between the clinical efficacy from the trials and what we see in the real world. A pleasant surprise about DAA treatment at the VA is that the clinical effectiveness we see in the real world almost matches the amazing results seen in clinical trials. That also has been critical to the success that we are seeing. The medications are powerful, and even outside the settings of a clinical trial, they work incredibly well.
Dr. Ho. I agree. You, Dr. Backus, along with Pam Belperio, PharmD, George Ioannou MD, MS, and other VA researchers have done excellent work in documenting the real-world effectiveness of these medications in the VA system. It was surprising but not unexpected.5-7 It is due to the VA’s excellent clinical infrastructure and that it provides an integrated system for caring for these patients. It is a measure of that success.
Dr. Dickson. The multidisciplinary teams are a major part of that. I don’t think we could care and support the veterans that we have, especially the challenging ones, the ones who are resistant, without having nursing, social work, mental health, and pharmacy involved. It’s just a huge team effort. That is what I love about caring for patients at the VA—it’s always been supportive of the multidisciplinary aspect of looking at this disease.
Click here to read the digital edition.
1. Dever JB, Ducom JH, Ma A, et al. Engagement in care of high-risk hepatitis C patients with interferon-free direct-acting antiviral therapies. Dig Dis Sci. 2017;62(6):1472-1479.
2. Bajis S, Dore GJ, Hajarizadeh B, Cunningham EB, Maher L, Grebely J. Interventions to enhance testing, linkage to care and treatment uptake for hepatitis C virus infection among people who inject drugs: A systematic review. Int J Drug Policy. 2017;47:34-46.
3. Groessl EJ, Liu L, Sklar M, Ho SB. HCV integrated care: a randomized trial to increase treatment initiation and SVR with direct acting antivirals. Int J Hepatol. 2017;2017:5834182.
4. Centers for Disease Control and Prevention. Table 4.1. Reported cases of acute hepatitis C, nationally and by state and jurisdiction—United States, 2011-2015. https://www.cdc.gov/hepatitis/statistics/2015surveillance/index.htm#tabs-6-1. Updated June 19, 2017. Accessed March 5, 2018.
5. Backus LI, Belperio PS, Shahoumian TA, Loomis TP, Mole LA. Comparative effectiveness of ledipasvir/sofosbuvir ± ribavirin vs. ombitasvir/paritaprevir/ritonavir + dasabuvir ± ribavirin in 6961 genotype 1 patients treated in routine medical practice. Aliment Pharmacol Ther. 2016;44(4):400-410.
6. Backus LI, Belperio PS, Shahoumian TA, Loomis TP, Mole LA. Real-world effectiveness of ledipasvir/sofosbuvir in 4,365 treatment-naive, genotype 1 hepatitis C-infected patients. Hepatology. 2016;64(2):405-414.
7. Ioannou GN, Beste LA, Chang MF, et al. Effectiveness of sofosbuvir, ledipasvir/sofosbuvir, or paritaprevir/ritonavir/ombitasvir and dasabuvir regimens for treatment of patients with hepatitis C in the Veterans Affairs national health care system. Gastroenterology. 2016;151(3):457-471.e5.
Frequently Hospitalized Patients’ Perceptions of Factors Contributing to High Hospital Use
In recent years, hospitals have made considerable efforts to improve transitions of care, in part due to financial incentives from the Medicare Hospital Readmission Reduction Program (HRRP).1 Initially focusing on three medical conditions, the HRRP has been associated with significant reductions in readmission rates.2 Importantly, a small proportion of patients accounts for a very large proportion of hospital readmissions and hospital use.3,4 Frequently hospitalized patients often have multiple chronic conditions and unique needs which may not be met by conventional approaches to healthcare delivery, including those influenced by the HRRP.4-6 In light of this challenge, some hospitals have developed programs specifically focused on frequently hospitalized patients. A recent systematic review of these programs found relatively few studies of high quality, providing only limited insight in designing interventions to support this population.7 Moreover, no studies appear to have incorporated the patients’ perspectives into the design or adaptation of the model. Members of our research team developed and implemented the Complex High Admission Management Program (CHAMP) in January 2016 to address the needs of frequently hospitalized patients in our hospital. To enhance CHAMP and inform the design of programs serving similar populations in other health systems, we sought to identify factors associated with the onset and continuation of high hospital use. Our research question was, from the patients’ perspective, what factors contribute to patients’ becoming and continuing to be high users of hospital care.
METHODS
Setting, Study Design, and Participants
This qualitative study took place at Northwestern Memorial Hospital (NMH), an 894-bed urban academic hospital located in Chicago, Illinois. Between December 2016 and September 2017, we recruited adult patients admitted to the general medicine services. Eligible participants were identified with the assistance of a daily Northwestern Medicine Electronic Data Warehouse (EDW) search and included patients with two unplanned 30-day inpatient readmissions to NMH within the prior 12 months, in addition to one or more of the following criteria: (1) at least one readmission in the last six months; (2) a referral from one of the patient’s medical providers; or (3) at least three observation visits. We excluded patients whose preferred language was not English and those disoriented to person, place, or time. Considering NMH data showing that approximately one-third of high-utilizer patients have sickle cell disease, we used purposive sampling with the goal to compare findings within and between two groups of participants; those with and those without sickle cell disease. Our study was deemed exempt by the Northwestern University Institutional Review Board.
Participant Enrollment and Data Collection
We created an interview guide based on the research team’s experience with this population, a literature review, and our research question (See Appendix).8,9 A research coordinator approached eligible participants during their hospital stay. The coordinator explained the study to eligible participants and obtained verbal consent for participation. The research coordinator then conducted one-on-one semi-structured interviews. Interviews were audio recorded for subsequent transcription and coding. Each interview lasted approximately 45 minutes. Participants were compensated with a $20 gift card for their time.
Analysis
Digital audio recordings from interviews were transcribed verbatim, deidentified, and analyzed using an iterative inductive team-based approach to coding.10 In our first cycle coding, all coders (KJO, SF, MMC, LO, KAC) independently reviewed and coded three transcripts using descriptive coding and subcoding to generate a preliminary codebook with code definitions.10,11 Following the meetings to compare and compile our initial coding, each researcher then independently recoded the three transcripts with the developed codebook. The researchers met again to triangulate perspectives and reach a consensus on the final codebook. Using multiple coders is a standard process to control for subjective bias that one coder could bring to the coding process.12 Following this meeting, the coders split into two teams of two (KJO, SF, and MMC, LO) to complete the coding of the remaining transcripts. Each team member independently coded the assigned transcripts and reconciled their codes with their counterpart; any discrepancies were resolved through discussion. Using this strategy, every transcript was coded by at least two team members. Our second coding cycle utilized pattern coding and involved identifying consistency both within and between transcripts; discovering associations between codes.10,11,13 Constant comparison was used to compare responses among all participants, as well as between sickle-cell and nonsickle-cell participants.13,14 Following team coding and reconciling, the analyses were presented to a broader research team for additional feedback and critique. All analyses were conducted using Dedoose version 8.0.35 (Los Angeles, California). Participant recruitment, interviews, and analysis of the transcripts continued until no new codes emerged and thematic saturation was achieved.
RESULTS
Participant Characteristics
Overall, we invited 34 patients to be interviewed; 26 consented and completed interviews (76.5%). Six (17.6%) patients declined participation, one (2.9%) was unable to complete the interview before hospital discharge, and one (2.9%) was excluded due to disorientation. Demographic characteristics of the 26 participants are shown in Table 1.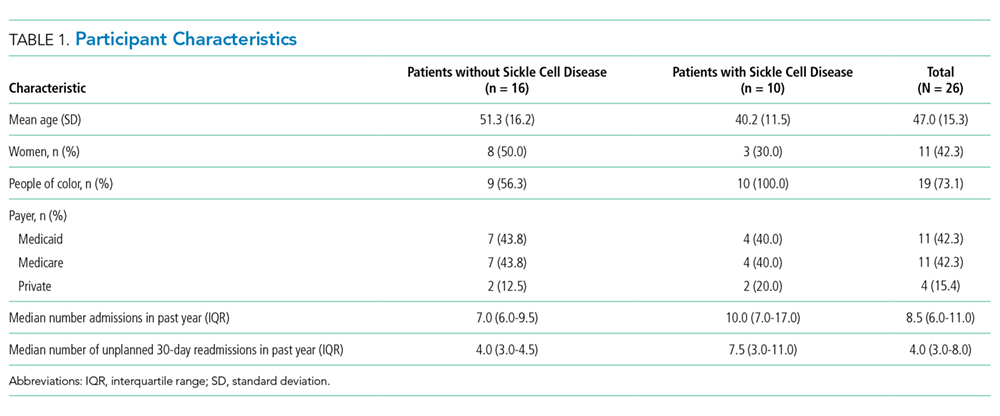
Four main themes emerged from our analysis. Table 2 summarizes these themes, subthemes, and provides representative quotes.
Major Medical Problem(s) are Universal, but High Hospital Use Varies in Onset
Not surprisingly, all participants described having at least one major medical problem. Some participants, such as those with genetic disorders, had experienced periods of high hospital use throughout their entire lifetime, while other participants experienced an onset of high hospital use as an adult after being previously healthy. Though most participants with genetic disorders had sickle cell anemia; one had a rare genetic disorder which caused chronic gastrointestinal symptoms. Participants typically described having a significant medical condition as well as other medical problems or complications from past surgery. Some participants described having a major medical problem which did not require frequent hospitalization until a complication or other medical problem arose, suggesting these new issues pushed them over a threshold beyond which self-management at home was less successful.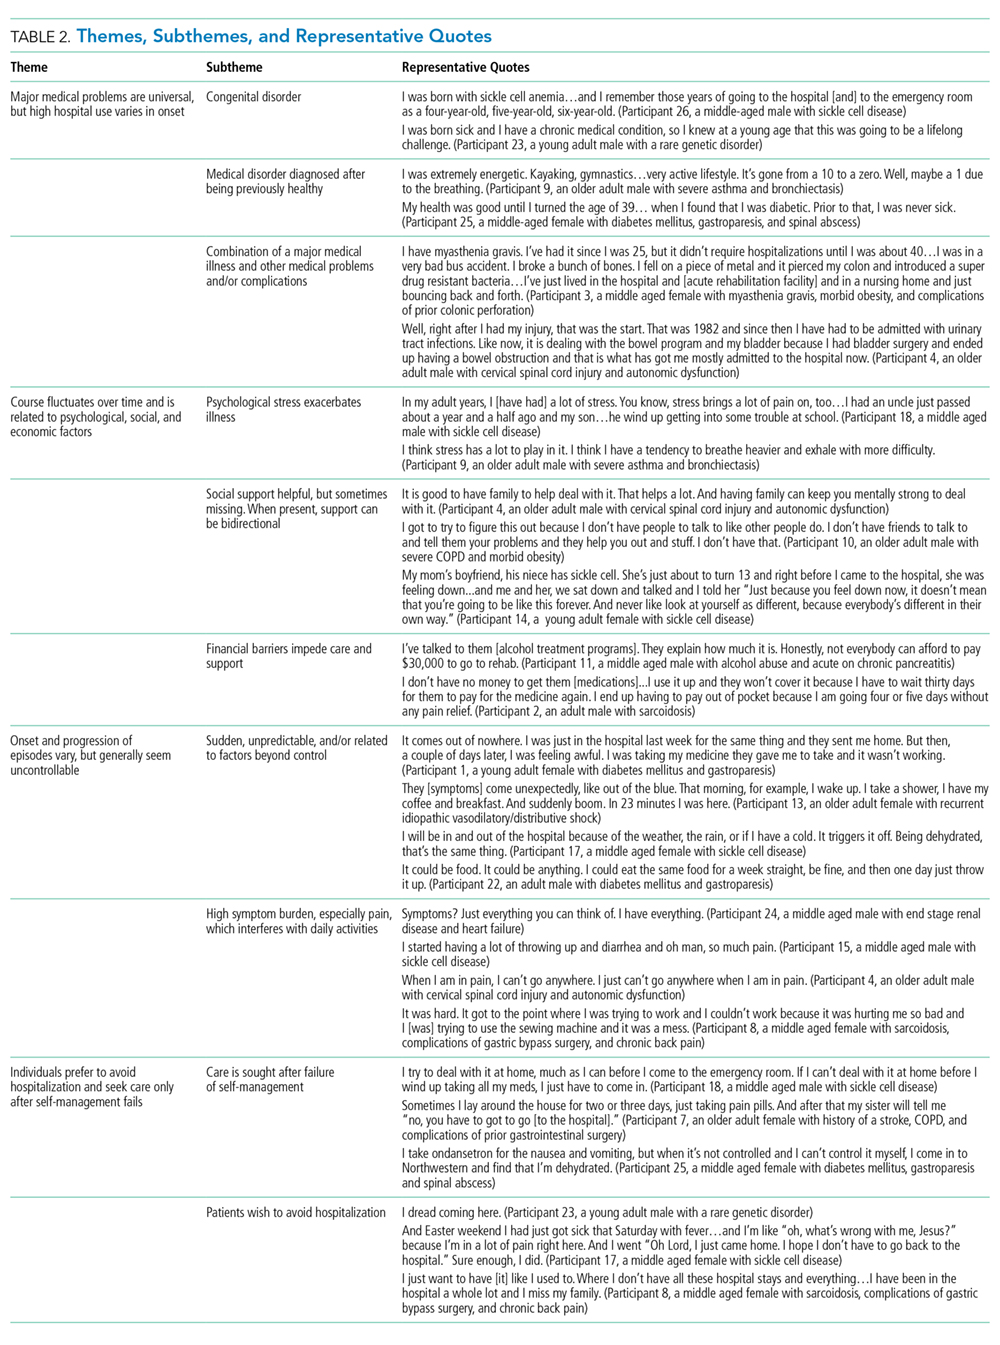
Course Fluctuates over Time and is Related to Psychological, Social, and Economic Factors
Participants identified psychological stress, social support, and financial constraints as factors which influence the course of their illness over time. Deaths in the family, breakups, and concerns about other family members were mentioned as specific forms of psychological stress and directly linked by participants to worsening of symptoms. Social support was present for most, but not all, participants, with no appreciable difference based on whether the participant had sickle cell disease. Social support was generally perceived as helpful, and several participants indicated a benefit to their own health when providing social support to others. Financial pressures also served as stressors and often impeded care due to lack of access to medications, other treatments, and housing.
Onset and Progression of Episodes Vary, but Generally Seem Uncontrollable
Regarding the onset of illness episodes, some participants described the sudden, unpredictable onset of symptoms, others described a more gradual onset which allowed them to attempt self-management. Regardless of the timing, episodes of illness were often perceived as spontaneous or triggered by factors outside of the participant’s control. Several participants, especially those with sickle cell disease, mentioned a relationship between their symptoms and the weather. Participants also noted the inconsistency in factors which may trigger an episode (ie, sometimes the factor exacerbated symptoms, while other times it did not). Participants also described having a high symptom burden with significant limitations in activities of daily living during episodes of illness. Pain was a very common component of symptoms regardless of whether or not the participant had sickle cell disease.
Individuals Seek Care after Self-Management Fails and Prefer to Avoid Hospitalization
Participants tried to control their symptoms with medications and typically sought care only when it was clear that this approach was not working, or they ran out of medications. This finding was consistent across both groups of participants (ie, those with and those without sickle cell disease). Many participants described very strong preferences not to come to the hospital; no participant described being in the hospital as a favorable or positive experience. Some participants mentioned that they had spent major holidays in the hospital and that they missed their family. No participant had a desire to come to the hospital.
DISCUSSION
In this study of frequently hospitalized patients, we found four major themes that illuminate patient perspectives about factors that contribute to high hospital use. While some of our findings corroborate those of previous studies, other emerging patterns were novel. Herein, we summarize key findings, provide context, and describe implications for the design of models of care for frequently hospitalized patients.
Similar to the findings of previous quantitative research, participants in our study described having a significant medical condition and typically had multiple medical conditions or complications.4-6 Importantly, some participants described having a major medical problem which did not require frequent hospitalization until another medical problem or complication arose. This finding suggests that there may be an opportunity to identify patients with significant medical problems who are at elevated risk before the onset of high hospital use. Early identification of these high-risk patients could allow for the provision of additional support to prevent potential complications or address other factors which may contribute to the need for frequent hospitalization.
Participants in our study directly linked psychological stress to fluctuations in their course of illness. Previous research by Mautner and colleagues queried participants about childhood experiences and early life stressors and reported that early life instabilities and traumas were prevalent among patients with high levels of emergency and hospital-based healthcare utilization.15 Our participants identified more recent traumatic events (eg, the death of a loved one and breakups) when reflecting on factors contributing to illness exacerbations; early life trauma did not emerge as an identified contributor. Of note, unlike Mautner et al., we did not ask participants to reflect on childhood determinants of disease and illness specifically. Our findings suggest that psychological stress contributes to illness exacerbation, even for those patients without other significant psychiatric conditions (eg, depressive disorder, schizophrenia). Incorporating mental health professionals into programs for this patient population may improve health by teaching specific coping strategies, including cognitive-behavioral therapy for an acute stress disorder.16,17
Social support was also a factor related to illness fluctuations over time. Notably, several participants indicated a benefit to their own health when providing social support to others, suggesting a role for peer support that may be reciprocally beneficial. This approach is supported by the literature. Williams and colleagues found that patients with sickle cell anemia experienced symptom improvement with peer support;18 while Johnson and colleagues recently reported a reduction in readmissions to acute care with the use of peer support for patients with severe mental illness.19
Financial constraints impeded care for some patients and served as a barrier to accessing medications, other treatments, and housing. Similar to the findings of prior quantitative research, our frequently hospitalized patients had a high proportion of patients with Medicaid and low proportion with private insurance, suggesting low socioeconomic status.9,20 We did not formally collect data on income or economic status. Interestingly, prior qualitative studies have not identified financial constraints as a major theme, though this may be explained by differences in study populations and the overall objectives of the studies.15,21 Importantly, the overwhelming majority of programs for frequently hospitalized patients identified in a recent systematic review included social workers.7 Our findings support the need to address financial constraints and the use of social workers in models of care for frequently hospitalized patients.
Many participants in our study felt that the factors contributing to exacerbations of illness were either inconsistent in their effect or out of their control. These findings have similarities to those from a qualitative study by Liu and colleagues in which they interviewed 20 “hospital-dependent” patients over 65 years of age.21 Though not explicitly focused on factors contributing to exacerbations, participants in their study felt that hospitalizations were generally inevitable. In our study, participants with sickle cell disease often identified changes in the weather as contributing to illness exacerbations. The relationship between weather and sickle cell disease remains incompletely understood, with an inconsistent association found in prior studies.22
Participants in our study strongly desired to avoid hospitalization and typically sought hospital care when symptoms could not be controlled at home. This finding is in contrast to that from the study by Liu and colleagues where they found that hospital-dependent patients over 65 years had favorable perspectives of hospitalization because they felt safer and more secure in the hospital.21 Our participants were younger than those from the study by Liu and colleagues, had a high symptom burden, and may have been more concerned about control of those symptoms than the risk for clinical deterioration. Programs should aim to strengthen their support of patients’ self-management efforts early in the episode of illness and potentially offer home visits or a day hospital to avoid hospitalization. A recent systematic review found evidence that alternatives to inpatient care (eg, hospital-at-home) for low risk medical patients can achieve comparable outcomes at lower costs.23 Similarly, some health systems have implemented day hospitals to treat low risk patients with uncomplicated sickle cell pain.24,25
The heavy symptom burden experienced by participants in our study is notable. Pain was especially common. Programs may wish to partner with palliative care and addiction specialists to balance symptom relief with the simultaneous need to address comorbid substance and opioid use disorders when they are present.4,9
Our study has several limitations. First, participants were recruited from the medicine service at a single academic hospital using criteria we developed to identify frequently hospitalized patients. Populations differ across hospitals and definitions of frequently hospitalized patients vary, limiting the generalizability of our findings. Second, we excluded patients whose preferred language was not English, as well as those disoriented to person, place, or time. It is possible that factors contributing to high hospital use differ for non-English speaking patients and those with cognitive deficits.
CONCLUSION
In this qualitative study, we identified factors associated with the onset and continuation of high hospital use. Emergent themes pointed to factors which influence patients’ onset of high hospital use, fluctuations in their illness over time, and triggers to seek care during an illness episode. These findings represent an important contribution to the literature because they allow patients’ perspectives to be incorporated into the design and adaptation of programs serving similar populations in other health systems. Programs that integrate patients’ perspectives into their design are likely to be better prepared to address patients’ needs and improve patient outcomes.
Acknowledgments
The authors thank the participants for their time and willingness to share their stories. The authors also thank Claire A. Knoten PhD and Erin Lambers PhD, former research team members who helped in the initial stages of the study.
Disclosures
The authors have nothing to disclose.
Funding
This project was funded by Northwestern Memorial Hospital and the Northwestern Medical Group.
1. Centers for Medicare & Medicaid Services. Readmissions Reduction Program. http://www.cms.gov/Medicare/Medicare-Fee-for-Service-Payment/AcuteInpatientPPS/Readmissions-Reduction-Program.html. Accessed September 17, 2018.
2. Wasfy JH, Zigler CM, Choirat C, Wang Y, Dominici F, Yeh RW. Readmission rates after passage of the hospital readmissions reduction program: a pre-post analysis. Ann Intern Med. 2016;166(5):324-331. https://doi.org/10.7326/m16-0185.
3. Blumenthal D, Chernof B, Fulmer T, Lumpkin J, Selberg J. Caring for high-need, high-cost patients-an urgent priority. N Engl J Med. 2016;375(10):909-911. https://doi.org/10.1056/nejmp1608511.
4. Szekendi MK, Williams MV, Carrier D, Hensley L, Thomas S, Cerese J. The characteristics of patients frequently admitted to academic medical centers in the United States. J Hosp Med. 2015;10(9):563-568. https://doi.org/10.1002/jhm.2375.
5. Dastidar JG, Jiang M. Characterization, categorization, and 5-year mortality of medicine high utilizer inpatients. J Palliat Care. 2018;33(3):167-174. https://doi.org/10.1177/0825859718769095.
6. Mudge AM, Kasper K, Clair A, et al. Recurrent readmissions in medical patients: a prospective study. J Hosp Med. 2010;6(2):61-67. https://doi.org/10.1002/jhm.811.
7. Goodwin A, Henschen BL, Odwyer LC, Nichols N, Oleary KJ. Interventions for frequently hospitalized patients and their effect on outcomes: a systematic review. J Hosp Med. 2018;13(12):853-859. https://doi.org/10.12788/jhm.3090.
8. Gelberg L, Andersen RM, Leake BD. The behavioral model for vulnerable populations: application to medical care use and outcomes for homeless people. Health Serv Res. 2000;34(6):1273-1302. PubMed
9. Rinehart DJ, Oronce C, Durfee MJ, et al. Identifying subgroups of adult superutilizers in an urban safety-net system using latent class analysis. Med Care. 2018;56(1):e1-e9. https://doi.org/10.1097/mlr.0000000000000628.
10. Miles MB, Huberman M, Saldana J. Qualitative Data Analysis. 3rd ed. Thousand Oaks, California: SAGE Publications; 2014.
11. Saldana J. The Coding Manual for Qualitative Researchers. Thousand Oaks, California: SAGE publications; 2013.
12. Lincoln YS, Guba EG. Naturalistic Inquiry. 1 ed. Beverly Hills, California: SAGE Publications; 1985.
13. Kolb SM. Grounded theory and the constant comparative method: valid research strategies for educators. J Emerging Trends Educ Res Policy Stud. 2012;3(1):83-86.
14. Glasser BG, Strauss AL. The Discovery of Grounded Theory: Strategies for Qualitative Research. New York: Taylor and Francis Group; 2017.
15. Mautner DB, Pang H, Brenner JC, et al. Generating hypotheses about care needs of high utilizers: lessons from patient interviews. Popul Health Manag. 2013;16(Suppl 1):S26-S33. https://doi.org/10.1089/pop.2013.0033.
16. Carpenter JK, Andrews LA, Witcraft SM, Powers MB, Smits JAJ, Hofmann SG. Cognitive behavioral therapy for anxiety and related disorders: a meta-analysis of randomized placebo-controlled trials. Depres Anxiety. 2018;35(6):502-514. https://doi.org/10.1002/da.22728.
17. Roberts NP, Kitchiner NJ, Kenardy J, Bisson JI. Systematic review and meta-analysis of multiple-session early interventions following traumatic events. Am J Psychiatry. 2009;166(3):293-301. https://doi.org/10.1176/appi.ajp.2008.08040590.
18. Williams H, Tanabe P. Sickle cell disease: a review of nonpharmacological approaches for pain. J Pain Symptom Manag. 2016;51(2):163-177. doi: 10.1016/j.jpainsymman.2015.10.017.
19. Johnson S, Lamb D, Marston L, et al. Peer-supported self-management for people discharged from a mental health crisis team: a randomised controlled trial. Lancet. 2018;392(10145):409-418.https://doi.org/10.1016/s0140-6736(18)31470-3.
20. Mercer T, Bae J, Kipnes J, Velazquez M, Thomas S, Setji N. The highest utilizers of care: individualized care plans to coordinate care, improve healthcare service utilization, and reduce costs at an academic tertiary care center. J Hosp Med. 2015;10(7):419-424. https://doi.org/10.1002/jhm.2351.
21. Liu T, Kiwak E, Tinetti ME. Perceptions of hospital-dependent patients on their needs for hospitalization. J Hosp Med. 2017;12(6):450-453. https://doi.org/10.12788/jhm.2756.
22. Piel FB, Steinberg MH, Rees DC. Sickle cell disease. N Engl J Med. 2017;376(16):1561-1573. https://doi.org/10.1056/nejmra1510865.
23. Conley J, O’Brien CW, Leff BA, Bolen S, Zulman D. Alternative strategies to inpatient hospitalization for acute medical conditions: a systematic review. JAMA Intern Med. 2016;176(11):1693-1702. https://doi.org/10.1001/jamainternmed.2016.5974.
24. Adewoye AH, Nolan V, McMahon L, Ma Q, Steinberg MH. Effectiveness of a dedicated day hospital for management of acute sickle cell pain. Haematologica. 2007;92(6):854-855. https://doi.org/10.3324/haematol.10757.
25. Benjamin LJ, Swinson GI, Nagel RL. Sickle cell anemia day hospital: an approach for the management of uncomplicated painful crises. Blood. 2000;95(4):1130-1136. PubMed
In recent years, hospitals have made considerable efforts to improve transitions of care, in part due to financial incentives from the Medicare Hospital Readmission Reduction Program (HRRP).1 Initially focusing on three medical conditions, the HRRP has been associated with significant reductions in readmission rates.2 Importantly, a small proportion of patients accounts for a very large proportion of hospital readmissions and hospital use.3,4 Frequently hospitalized patients often have multiple chronic conditions and unique needs which may not be met by conventional approaches to healthcare delivery, including those influenced by the HRRP.4-6 In light of this challenge, some hospitals have developed programs specifically focused on frequently hospitalized patients. A recent systematic review of these programs found relatively few studies of high quality, providing only limited insight in designing interventions to support this population.7 Moreover, no studies appear to have incorporated the patients’ perspectives into the design or adaptation of the model. Members of our research team developed and implemented the Complex High Admission Management Program (CHAMP) in January 2016 to address the needs of frequently hospitalized patients in our hospital. To enhance CHAMP and inform the design of programs serving similar populations in other health systems, we sought to identify factors associated with the onset and continuation of high hospital use. Our research question was, from the patients’ perspective, what factors contribute to patients’ becoming and continuing to be high users of hospital care.
METHODS
Setting, Study Design, and Participants
This qualitative study took place at Northwestern Memorial Hospital (NMH), an 894-bed urban academic hospital located in Chicago, Illinois. Between December 2016 and September 2017, we recruited adult patients admitted to the general medicine services. Eligible participants were identified with the assistance of a daily Northwestern Medicine Electronic Data Warehouse (EDW) search and included patients with two unplanned 30-day inpatient readmissions to NMH within the prior 12 months, in addition to one or more of the following criteria: (1) at least one readmission in the last six months; (2) a referral from one of the patient’s medical providers; or (3) at least three observation visits. We excluded patients whose preferred language was not English and those disoriented to person, place, or time. Considering NMH data showing that approximately one-third of high-utilizer patients have sickle cell disease, we used purposive sampling with the goal to compare findings within and between two groups of participants; those with and those without sickle cell disease. Our study was deemed exempt by the Northwestern University Institutional Review Board.
Participant Enrollment and Data Collection
We created an interview guide based on the research team’s experience with this population, a literature review, and our research question (See Appendix).8,9 A research coordinator approached eligible participants during their hospital stay. The coordinator explained the study to eligible participants and obtained verbal consent for participation. The research coordinator then conducted one-on-one semi-structured interviews. Interviews were audio recorded for subsequent transcription and coding. Each interview lasted approximately 45 minutes. Participants were compensated with a $20 gift card for their time.
Analysis
Digital audio recordings from interviews were transcribed verbatim, deidentified, and analyzed using an iterative inductive team-based approach to coding.10 In our first cycle coding, all coders (KJO, SF, MMC, LO, KAC) independently reviewed and coded three transcripts using descriptive coding and subcoding to generate a preliminary codebook with code definitions.10,11 Following the meetings to compare and compile our initial coding, each researcher then independently recoded the three transcripts with the developed codebook. The researchers met again to triangulate perspectives and reach a consensus on the final codebook. Using multiple coders is a standard process to control for subjective bias that one coder could bring to the coding process.12 Following this meeting, the coders split into two teams of two (KJO, SF, and MMC, LO) to complete the coding of the remaining transcripts. Each team member independently coded the assigned transcripts and reconciled their codes with their counterpart; any discrepancies were resolved through discussion. Using this strategy, every transcript was coded by at least two team members. Our second coding cycle utilized pattern coding and involved identifying consistency both within and between transcripts; discovering associations between codes.10,11,13 Constant comparison was used to compare responses among all participants, as well as between sickle-cell and nonsickle-cell participants.13,14 Following team coding and reconciling, the analyses were presented to a broader research team for additional feedback and critique. All analyses were conducted using Dedoose version 8.0.35 (Los Angeles, California). Participant recruitment, interviews, and analysis of the transcripts continued until no new codes emerged and thematic saturation was achieved.
RESULTS
Participant Characteristics
Overall, we invited 34 patients to be interviewed; 26 consented and completed interviews (76.5%). Six (17.6%) patients declined participation, one (2.9%) was unable to complete the interview before hospital discharge, and one (2.9%) was excluded due to disorientation. Demographic characteristics of the 26 participants are shown in Table 1.
Four main themes emerged from our analysis. Table 2 summarizes these themes, subthemes, and provides representative quotes.
Major Medical Problem(s) are Universal, but High Hospital Use Varies in Onset
Not surprisingly, all participants described having at least one major medical problem. Some participants, such as those with genetic disorders, had experienced periods of high hospital use throughout their entire lifetime, while other participants experienced an onset of high hospital use as an adult after being previously healthy. Though most participants with genetic disorders had sickle cell anemia; one had a rare genetic disorder which caused chronic gastrointestinal symptoms. Participants typically described having a significant medical condition as well as other medical problems or complications from past surgery. Some participants described having a major medical problem which did not require frequent hospitalization until a complication or other medical problem arose, suggesting these new issues pushed them over a threshold beyond which self-management at home was less successful.
Course Fluctuates over Time and is Related to Psychological, Social, and Economic Factors
Participants identified psychological stress, social support, and financial constraints as factors which influence the course of their illness over time. Deaths in the family, breakups, and concerns about other family members were mentioned as specific forms of psychological stress and directly linked by participants to worsening of symptoms. Social support was present for most, but not all, participants, with no appreciable difference based on whether the participant had sickle cell disease. Social support was generally perceived as helpful, and several participants indicated a benefit to their own health when providing social support to others. Financial pressures also served as stressors and often impeded care due to lack of access to medications, other treatments, and housing.
Onset and Progression of Episodes Vary, but Generally Seem Uncontrollable
Regarding the onset of illness episodes, some participants described the sudden, unpredictable onset of symptoms, others described a more gradual onset which allowed them to attempt self-management. Regardless of the timing, episodes of illness were often perceived as spontaneous or triggered by factors outside of the participant’s control. Several participants, especially those with sickle cell disease, mentioned a relationship between their symptoms and the weather. Participants also noted the inconsistency in factors which may trigger an episode (ie, sometimes the factor exacerbated symptoms, while other times it did not). Participants also described having a high symptom burden with significant limitations in activities of daily living during episodes of illness. Pain was a very common component of symptoms regardless of whether or not the participant had sickle cell disease.
Individuals Seek Care after Self-Management Fails and Prefer to Avoid Hospitalization
Participants tried to control their symptoms with medications and typically sought care only when it was clear that this approach was not working, or they ran out of medications. This finding was consistent across both groups of participants (ie, those with and those without sickle cell disease). Many participants described very strong preferences not to come to the hospital; no participant described being in the hospital as a favorable or positive experience. Some participants mentioned that they had spent major holidays in the hospital and that they missed their family. No participant had a desire to come to the hospital.
DISCUSSION
In this study of frequently hospitalized patients, we found four major themes that illuminate patient perspectives about factors that contribute to high hospital use. While some of our findings corroborate those of previous studies, other emerging patterns were novel. Herein, we summarize key findings, provide context, and describe implications for the design of models of care for frequently hospitalized patients.
Similar to the findings of previous quantitative research, participants in our study described having a significant medical condition and typically had multiple medical conditions or complications.4-6 Importantly, some participants described having a major medical problem which did not require frequent hospitalization until another medical problem or complication arose. This finding suggests that there may be an opportunity to identify patients with significant medical problems who are at elevated risk before the onset of high hospital use. Early identification of these high-risk patients could allow for the provision of additional support to prevent potential complications or address other factors which may contribute to the need for frequent hospitalization.
Participants in our study directly linked psychological stress to fluctuations in their course of illness. Previous research by Mautner and colleagues queried participants about childhood experiences and early life stressors and reported that early life instabilities and traumas were prevalent among patients with high levels of emergency and hospital-based healthcare utilization.15 Our participants identified more recent traumatic events (eg, the death of a loved one and breakups) when reflecting on factors contributing to illness exacerbations; early life trauma did not emerge as an identified contributor. Of note, unlike Mautner et al., we did not ask participants to reflect on childhood determinants of disease and illness specifically. Our findings suggest that psychological stress contributes to illness exacerbation, even for those patients without other significant psychiatric conditions (eg, depressive disorder, schizophrenia). Incorporating mental health professionals into programs for this patient population may improve health by teaching specific coping strategies, including cognitive-behavioral therapy for an acute stress disorder.16,17
Social support was also a factor related to illness fluctuations over time. Notably, several participants indicated a benefit to their own health when providing social support to others, suggesting a role for peer support that may be reciprocally beneficial. This approach is supported by the literature. Williams and colleagues found that patients with sickle cell anemia experienced symptom improvement with peer support;18 while Johnson and colleagues recently reported a reduction in readmissions to acute care with the use of peer support for patients with severe mental illness.19
Financial constraints impeded care for some patients and served as a barrier to accessing medications, other treatments, and housing. Similar to the findings of prior quantitative research, our frequently hospitalized patients had a high proportion of patients with Medicaid and low proportion with private insurance, suggesting low socioeconomic status.9,20 We did not formally collect data on income or economic status. Interestingly, prior qualitative studies have not identified financial constraints as a major theme, though this may be explained by differences in study populations and the overall objectives of the studies.15,21 Importantly, the overwhelming majority of programs for frequently hospitalized patients identified in a recent systematic review included social workers.7 Our findings support the need to address financial constraints and the use of social workers in models of care for frequently hospitalized patients.
Many participants in our study felt that the factors contributing to exacerbations of illness were either inconsistent in their effect or out of their control. These findings have similarities to those from a qualitative study by Liu and colleagues in which they interviewed 20 “hospital-dependent” patients over 65 years of age.21 Though not explicitly focused on factors contributing to exacerbations, participants in their study felt that hospitalizations were generally inevitable. In our study, participants with sickle cell disease often identified changes in the weather as contributing to illness exacerbations. The relationship between weather and sickle cell disease remains incompletely understood, with an inconsistent association found in prior studies.22
Participants in our study strongly desired to avoid hospitalization and typically sought hospital care when symptoms could not be controlled at home. This finding is in contrast to that from the study by Liu and colleagues where they found that hospital-dependent patients over 65 years had favorable perspectives of hospitalization because they felt safer and more secure in the hospital.21 Our participants were younger than those from the study by Liu and colleagues, had a high symptom burden, and may have been more concerned about control of those symptoms than the risk for clinical deterioration. Programs should aim to strengthen their support of patients’ self-management efforts early in the episode of illness and potentially offer home visits or a day hospital to avoid hospitalization. A recent systematic review found evidence that alternatives to inpatient care (eg, hospital-at-home) for low risk medical patients can achieve comparable outcomes at lower costs.23 Similarly, some health systems have implemented day hospitals to treat low risk patients with uncomplicated sickle cell pain.24,25
The heavy symptom burden experienced by participants in our study is notable. Pain was especially common. Programs may wish to partner with palliative care and addiction specialists to balance symptom relief with the simultaneous need to address comorbid substance and opioid use disorders when they are present.4,9
Our study has several limitations. First, participants were recruited from the medicine service at a single academic hospital using criteria we developed to identify frequently hospitalized patients. Populations differ across hospitals and definitions of frequently hospitalized patients vary, limiting the generalizability of our findings. Second, we excluded patients whose preferred language was not English, as well as those disoriented to person, place, or time. It is possible that factors contributing to high hospital use differ for non-English speaking patients and those with cognitive deficits.
CONCLUSION
In this qualitative study, we identified factors associated with the onset and continuation of high hospital use. Emergent themes pointed to factors which influence patients’ onset of high hospital use, fluctuations in their illness over time, and triggers to seek care during an illness episode. These findings represent an important contribution to the literature because they allow patients’ perspectives to be incorporated into the design and adaptation of programs serving similar populations in other health systems. Programs that integrate patients’ perspectives into their design are likely to be better prepared to address patients’ needs and improve patient outcomes.
Acknowledgments
The authors thank the participants for their time and willingness to share their stories. The authors also thank Claire A. Knoten PhD and Erin Lambers PhD, former research team members who helped in the initial stages of the study.
Disclosures
The authors have nothing to disclose.
Funding
This project was funded by Northwestern Memorial Hospital and the Northwestern Medical Group.
1. Centers for Medicare & Medicaid Services. Readmissions Reduction Program. http://www.cms.gov/Medicare/Medicare-Fee-for-Service-Payment/AcuteInpatientPPS/Readmissions-Reduction-Program.html. Accessed September 17, 2018.
2. Wasfy JH, Zigler CM, Choirat C, Wang Y, Dominici F, Yeh RW. Readmission rates after passage of the hospital readmissions reduction program: a pre-post analysis. Ann Intern Med. 2016;166(5):324-331. https://doi.org/10.7326/m16-0185.
3. Blumenthal D, Chernof B, Fulmer T, Lumpkin J, Selberg J. Caring for high-need, high-cost patients-an urgent priority. N Engl J Med. 2016;375(10):909-911. https://doi.org/10.1056/nejmp1608511.
4. Szekendi MK, Williams MV, Carrier D, Hensley L, Thomas S, Cerese J. The characteristics of patients frequently admitted to academic medical centers in the United States. J Hosp Med. 2015;10(9):563-568. https://doi.org/10.1002/jhm.2375.
5. Dastidar JG, Jiang M. Characterization, categorization, and 5-year mortality of medicine high utilizer inpatients. J Palliat Care. 2018;33(3):167-174. https://doi.org/10.1177/0825859718769095.
6. Mudge AM, Kasper K, Clair A, et al. Recurrent readmissions in medical patients: a prospective study. J Hosp Med. 2010;6(2):61-67. https://doi.org/10.1002/jhm.811.
7. Goodwin A, Henschen BL, Odwyer LC, Nichols N, Oleary KJ. Interventions for frequently hospitalized patients and their effect on outcomes: a systematic review. J Hosp Med. 2018;13(12):853-859. https://doi.org/10.12788/jhm.3090.
8. Gelberg L, Andersen RM, Leake BD. The behavioral model for vulnerable populations: application to medical care use and outcomes for homeless people. Health Serv Res. 2000;34(6):1273-1302. PubMed
9. Rinehart DJ, Oronce C, Durfee MJ, et al. Identifying subgroups of adult superutilizers in an urban safety-net system using latent class analysis. Med Care. 2018;56(1):e1-e9. https://doi.org/10.1097/mlr.0000000000000628.
10. Miles MB, Huberman M, Saldana J. Qualitative Data Analysis. 3rd ed. Thousand Oaks, California: SAGE Publications; 2014.
11. Saldana J. The Coding Manual for Qualitative Researchers. Thousand Oaks, California: SAGE publications; 2013.
12. Lincoln YS, Guba EG. Naturalistic Inquiry. 1 ed. Beverly Hills, California: SAGE Publications; 1985.
13. Kolb SM. Grounded theory and the constant comparative method: valid research strategies for educators. J Emerging Trends Educ Res Policy Stud. 2012;3(1):83-86.
14. Glasser BG, Strauss AL. The Discovery of Grounded Theory: Strategies for Qualitative Research. New York: Taylor and Francis Group; 2017.
15. Mautner DB, Pang H, Brenner JC, et al. Generating hypotheses about care needs of high utilizers: lessons from patient interviews. Popul Health Manag. 2013;16(Suppl 1):S26-S33. https://doi.org/10.1089/pop.2013.0033.
16. Carpenter JK, Andrews LA, Witcraft SM, Powers MB, Smits JAJ, Hofmann SG. Cognitive behavioral therapy for anxiety and related disorders: a meta-analysis of randomized placebo-controlled trials. Depres Anxiety. 2018;35(6):502-514. https://doi.org/10.1002/da.22728.
17. Roberts NP, Kitchiner NJ, Kenardy J, Bisson JI. Systematic review and meta-analysis of multiple-session early interventions following traumatic events. Am J Psychiatry. 2009;166(3):293-301. https://doi.org/10.1176/appi.ajp.2008.08040590.
18. Williams H, Tanabe P. Sickle cell disease: a review of nonpharmacological approaches for pain. J Pain Symptom Manag. 2016;51(2):163-177. doi: 10.1016/j.jpainsymman.2015.10.017.
19. Johnson S, Lamb D, Marston L, et al. Peer-supported self-management for people discharged from a mental health crisis team: a randomised controlled trial. Lancet. 2018;392(10145):409-418.https://doi.org/10.1016/s0140-6736(18)31470-3.
20. Mercer T, Bae J, Kipnes J, Velazquez M, Thomas S, Setji N. The highest utilizers of care: individualized care plans to coordinate care, improve healthcare service utilization, and reduce costs at an academic tertiary care center. J Hosp Med. 2015;10(7):419-424. https://doi.org/10.1002/jhm.2351.
21. Liu T, Kiwak E, Tinetti ME. Perceptions of hospital-dependent patients on their needs for hospitalization. J Hosp Med. 2017;12(6):450-453. https://doi.org/10.12788/jhm.2756.
22. Piel FB, Steinberg MH, Rees DC. Sickle cell disease. N Engl J Med. 2017;376(16):1561-1573. https://doi.org/10.1056/nejmra1510865.
23. Conley J, O’Brien CW, Leff BA, Bolen S, Zulman D. Alternative strategies to inpatient hospitalization for acute medical conditions: a systematic review. JAMA Intern Med. 2016;176(11):1693-1702. https://doi.org/10.1001/jamainternmed.2016.5974.
24. Adewoye AH, Nolan V, McMahon L, Ma Q, Steinberg MH. Effectiveness of a dedicated day hospital for management of acute sickle cell pain. Haematologica. 2007;92(6):854-855. https://doi.org/10.3324/haematol.10757.
25. Benjamin LJ, Swinson GI, Nagel RL. Sickle cell anemia day hospital: an approach for the management of uncomplicated painful crises. Blood. 2000;95(4):1130-1136. PubMed
© 2019 Society of Hospital Medicine
An Advanced Practice Provider Clinical Fellowship as a Pipeline to Staffing a Hospitalist Program
There is an increasing utilization of advanced practice providers (APPs) in the delivery of healthcare in the United States.1,2 As of 2016, there were 157, 025 nurse practitioners (NPs) and 102,084 physician assistants (PAs) with a projected growth rate of 6.8% and 4.3%, respectively, which exceeds the physician growth rate of 1.1%.2 This increased growth rate has been attributed to the expectation that APPs can enhance the quality of physician care, relieve physician shortages, and reduce service costs, as APPs are less expensive to hire than physicians.3,4 Hospital medicine is the fastest growing medical field in the United States, and approximately 83% of hospitalist groups around the country utilize APPs; however, the demand for hospitalists continues to exceed the supply, and this has led to increased utilization of APPs in hospital medicine.5-10
APPs receive very limited inpatient training and there is wide variation in their clinical abilities after graduation.11 This is an issue that has become exacerbated in recent years by a change in the training process for PAs. Before 2005, PA programs were typically two to three years long and required the same prerequisite courses as medical schools.11 PA students completed more than 2,000 hours of clinical rotations and then had to pass the Physician Assistant National Certifying Exam before they could practice.12 Traditionally, PA programs typically attracted students with prior healthcare experience.11 In 2005, PA programs began transitioning from bachelor’s degrees to requiring a master’s level degree for completion of the programs. This has shifted the demographics of the students matriculating to younger students with little-to-no prior healthcare experience; moreover, these fresh graduates lack exposure to hospital medicine.11
NPs usually gain clinical experience working as registered nurses (RNs) for two or more years prior to entry into the NP program. NP programs for baccalaureate-prepared RNs vary in length from two to three years.2 There is an acute care focus for NPs in training; however, there is no standardized training or licensure to ensure that hospital medicine competencies are met.13-15 Some studies have shown that a lack of structured support has been found to affect NP role transition negatively during the first year of practice,16 and graduating NPs have indicated that they needed more out of their clinical education in terms of content, clinical experience, and competency testing.17
Hiring new APP graduates as hospitalists requires a longer and more rigorous onboarding process. On‐the‐job training in hospital medicine for new APP graduates can take as long as six to 12 months in order for them to acquire the basic skill set necessary to adequately manage hospitalized patients.15 This extended onboarding is costly because the APPs are receiving a full hospitalist salary, yet they are not functioning at full capacity. Ideally, there should be an intermediary training step between graduation and employment as hospitalist APPs. Studies have shown that APPs are interested in formal postgraduate hospital medicine training, even if it means having a lower stipend during the first year after graduating from their NP or PA program.9,15,18
The growing need for hospitalists, driven by residency work-hour reform, increased age and complexity of patients, and the need to improve the quality of inpatient care while simultaneously reducing waste, has contributed to the increasing utilization of and need for highly qualified APPs in hospital medicine.11,19,20 We established a fellowship to train APPs. The goal of this study was to determine if an APP fellowship is a cost-effective pipeline for filling vacancies within a hospitalist program.
METHODS
Design and Setting
Johns Hopkins Bayview Medical Center (JHBMC) is a 440 bed hospital in Baltimore Maryland. The hospitalist group was started in 1996 with one physician seeing approximately 500 discharges a year. Over the last 20 years, the group has grown and is now its own division with 57 providers, including 42 physicians, 11 APPs, and four APP fellows. The hospitalist division manages ~7,000 discharges a year, which corresponds to approximately 60% of admissions to general medicine. Hospitalist APPs help staff general medicine by working alongside doctors and admitting patients during the day and night. The APPs also staff the pulmonary step down unit with a pulmonary attending and the chemical dependency unit with an internal medicine addiction specialist.
The growth of the division of hospital medicine at JHBMC is a result of increasing volumes and reduced residency duty hours. The increasing full time equivalents (FTEs) resulted in a need for APPs; however, vacancies went unfilled for an average of 35 weeks due to the time it took to post open positions, interview applicants, and hire applicants through the credentialing process. Further, it took as long as 22 to 34 weeks for a new hire to work independently. The APP vacancies and onboarding resulted in increased costs to the division incurred by physician moonlighting to cover open shifts. The hourly physician moonlighting rate at JHBMC is $150. All costs were calculated on the basis of a 40-hour work week. We performed a pre- and postanalysis of outcomes of interest between January 2009 and June 2018. This study was exempt from institutional review board review.
Intervention
In 2014, a one year APP clinical fellowship in hospital medicine was started. The fellows evaluate and manage patients working one-on-one with an experienced hospitalist faculty member. The program consists of 80% clinical experience in the inpatient setting and 20% didactic instruction (Table 1). Up to four fellows are accepted each year and are eligible for hire after training if vacancies exist. The program is cost neutral and was financed by downsizing, through attrition, two physician FTEs. Four APP fellows’ salaries are the equivalent of two entry-level hospitalist physicians’ salaries at JHBMC. The annual salary for an APP fellow is $69,000.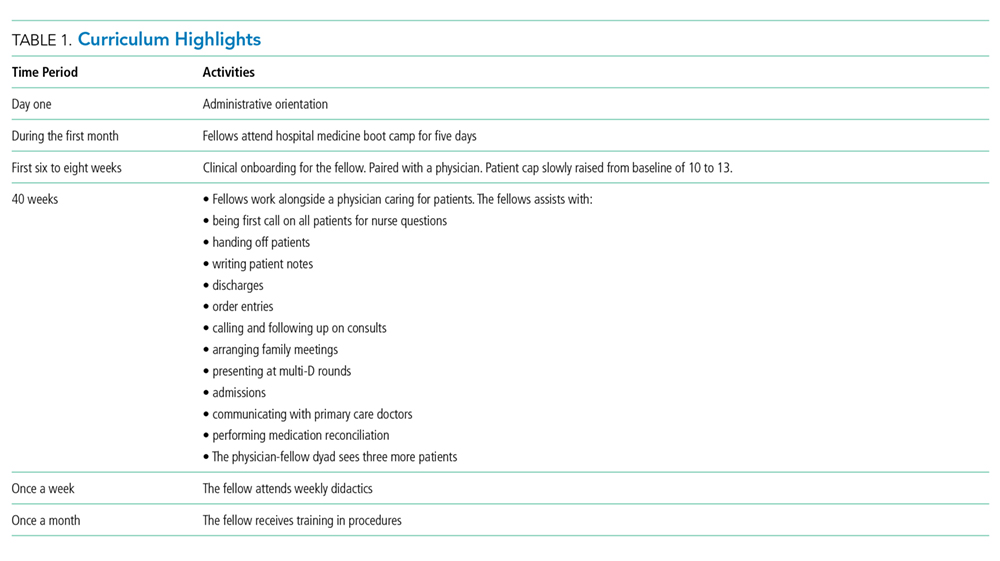
Downsizing by two physician FTEs meant that one less doctor was scheduled every day. The patient load previously seen by that one doctor (10 patients) was absorbed by the MD–APP fellow dyads. Paired with a fellow, each physician sees a higher cap of 13 patients, and it takes six weeks for the fellows to ramp-up to this patient load. When the fellow first starts, the team sees 10 patients. Every two weeks, the pair’s census increases by one patient to the cap of 13. Collectively, the four APP fellow–MD dyads make it possible for four physicians to see an additional 12 patients. The two extra patients absorbed by the service per day results in a net increase in capacity of up to 730 patient encounters a year.
Outcomes and Analysis
Our main outcomes of interest were duration of onboarding and cost incurred by the division to (1) staff the service during a vacancy and (2) onboard new hires. Secondary outcomes included duration of vacancy and total time spent with the group. We collected basic demographic data on participants, including, age, gender, and race. Demographics and outcomes of interest were compared pre- (2009-2013) and post- (2014-2018) initiation of the APP clinical fellowship using the chi-square test, the t-test for normally distributed data, and the Wilcoxon rank-sum for nonnormally distributed data, as appropriate. The normality of the data distribution was tested using the Shapiro-Wilk W test. Two-tailed P values less than .05 were considered to be statistically significant. Results were analyzed using Stata/MP version 13.0 (StataCorp Inc, College Station, Texas).
RESULTS
Twelve fellows have been recruited, and of these, 10 have graduated. Two chose to leave the program prior to completion. Of the 10 fellows that have graduated, six have been hired into our group, one was hired within our facility, and three were hired as hospitalists at other institutions. The median time from APP school graduation to hire was also not different between the two groups (10.5 vs 3.9 months, P = .069). In addition, the total time that the new APP hires spent with the group was nonstatistically significantly different between the two periods (17.9 vs 18.3 months, P = .735). Both the mean duration of onboarding and the cost to the division were significantly reduced after implementation of the program (25.4 vs 11.0 weeks, P = .017 and $361,714 vs $66,000, P = .004; Table 2).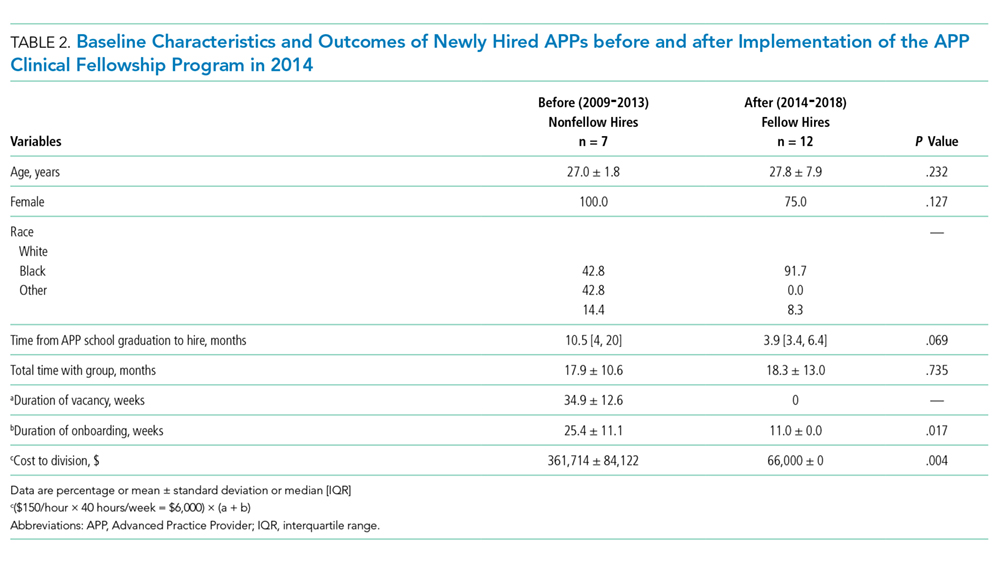
The yearly cost of an APP vacancy and onboarding is incurred by doctor moonlighting costs (at the rate of $150 per hour) to cover open shifts. The mean duration of vacancies and onboarding each year was 34.9 and 25.4 weeks, respectively, before the fellowship. The yearly cost of onboarding, after the establishment of the fellowship, is a maximum of $66,000, derived from physician moonlighting to cover the six-week ramp-up at the very beginning of the fellowship and the five weeks of orientation to the pulmonary and chemical dependency units after the fellowship (Table 3).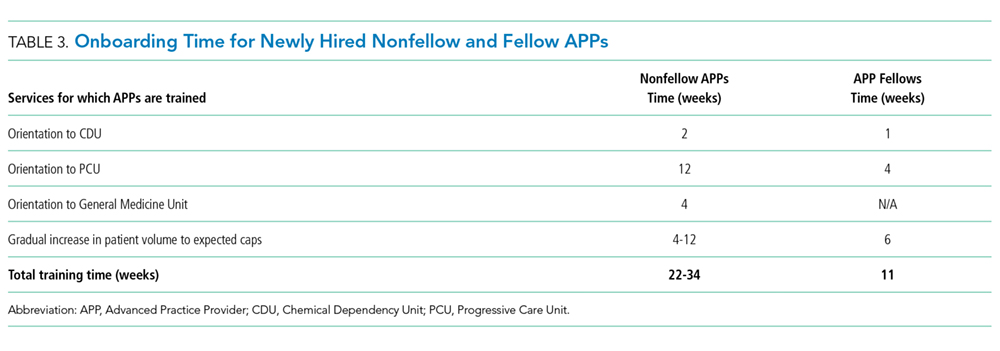
DISCUSSION
Our APP clinical fellowship in hospital medicine at JHBMC has produced several benefits. First, the fellowship has become a pipeline for filling APP vacancies within our division. We have been able to hire for four consecutive years from the fellowship. Second, the ready availability of high-functioning and efficient APP hospitalists has cut down on the onboarding time for our new APP hires. Many new APP graduates lack confidence in caring for complex hospitalized patients. Following our 12-month clinical fellowship, our matriculated fellows are able to practice at the top of their license immediately and confidently. Third, the reduced vacancy and shortened onboarding periods have reduced costs to the division. Fourth, the fellowship has created additional teaching avenues for the faculty. The medicine units at JHBMC are comprised of hospitalist and internal medicine residency services. The hospitalists spend the majority of their clinical time in direct patient care; however, they rotate on the residency service for two weeks out of the year. The majority of physicians welcome the chance to teach more, and partnering with an APP fellow provides that opportunity.
As we have developed and grown this program, the one great challenge has been what to do with graduating fellows when we cannot hire them. Fortunately, the market for highly qualified, well trained APPs is strong, and every one of the fellows that we could not hire within our group has been able to find a position either within our facility or outside our institution. To facilitate this process, program directors and recruiters are invited to meet with the fellows toward the end of their fellowship to share employment opportunities with them.
Our study has limitations. First, had the $276,000 from the attrition of two physicians been used to hire nonfellow APPs under the old model, then the costs of the two models would have been similar, but this was simply not possible because the positions could not be filled. Second, this is a single-site experience, and our findings may not be generalizable, particularly those pertaining to remuneration. Third, our study was underpowered to detect small but important differences in characteristics of APPs, especially time from graduation to hire, before and after the implementation of our fellowship. Further research comparing various programs both in structure and outcomes—such as fellows’ readiness for practice, costs, duration of vacancies, and provider satisfaction—are an important next step.
We have developed a pool of applicants within our division to fill vacancies left by turnover from senior NPs and PAs. This program has reduced costs and improved the joy of practice for both doctors and APPs. As the need for highly qualified NPs and PAs in hospital medicine continues to grow, we may see more APP fellowships in hospital medicine in the United States.
Acknowledgments
The authors thank the advanced practice providers who have helped us grow and refine our fellowship.
Disclosures
The authors have nothing to disclose
1. Martsoff G, Nguyen P, Freund D, Poghosyan L. What we know about postgraduate nurse practitioner residency and fellowship programs. J Nurse Pract. 2017;13(7):482-487. doi: 10.1016/j.nurpra.2017.05.013.
2. Auerbach D, Staiger D, Buerhaus P. Growing ranks of advanced practice clinicians-implications for the physician workforce. N Engl J Med. 2018;378(25):2358-2360. doi: 10.1056/NEJMp1801869. PubMed
3. Laurant M, Harmsen M, Wollersheim H, Grol R, Faber M, Sibbald B. The
impact of nonphysician clinicians: do they improve the quality and cost-effectiveness
of health care services? Med Care Res Rev. 2009;66(6 Suppl):36S-89S. doi: 10.1177/1077558709346277. PubMed
4. Auerbach DI. Will the NP workforce grow in the future? New forecasts and
implications for healthcare delivery. Med Care. 2012;50(7):606-610. doi:
10.1097/MLR.0b013e318249d6e7. PubMed
5. Kisuule F, Howell E. Hospital medicine beyond the United States. Int J Gen
Med. 2018;11:65-71. doi: 10.2147/IJGM.S151275. PubMed
6. Wachter RM, Goldman L. Zero to 50, 000-The 20th anniversary of the hospitalist.
N Engl J Med. 2016;375(11):1009-1011. doi: 10.1056/NEJMp1607958. PubMed
7. Conrad, K and Valovska T. The current state of hospital medicine: trends in
compensation, practice patterns, advanced practice providers, malpractice,
and career satisfaction. In: Conrad K, ed. Clinical Approaches to Hospital
Medicine. Cham, Springer; 2017:259-270.
8. Bryant SE. Filling the gaps: preparing nurse practitioners for hospitalist
practice. J Am Assoc Nurse Pract. 2018;30(1):4-9. doi: 10.1097/
JXX.0000000000000008. PubMed
9. Sharma P, Brooks M, Roomiany P, Verma L, Criscione-Schreiber, L. Physician
assistant student training for the inpatient setting: a needs assessment. J Physician
Assist Educ. 2017;28(4):189-195. doi: 10.1097/JPA.0000000000000174. PubMed
10. Society of Hospital Medicine. 2016 State of Hospital Medicine Report. Available
at: https://www.hospitalmedicine.org/about/press-releases/shm-releases-
2016-state-of-hospital-medicine-report/. Accessed July 17, 2018.
11. Will KK, Budavari AI, Wilkens JA, Mishari K, Hartsell ZC. A Hospitalist postgraduate
training program for physician assistants. J Hosp Med. 2010;5(2):94-
8. doi: 10.1002/jhm.619. PubMed
12. Naqvi, S. Is it time for Physician Assistant (PA)/Nurse Practitioner (NP) Hospital
Medicine Residency Training. Available at: http://medicine2.missouri.e.,-
du/jahm/wp-content/uploads/2017/03/Is-it-time-for-PANP-Hospital-Medicine-
Residency-Training-Final.pdf. Accessed July 17, 2018.
13. Scheurer D, Cardin T. The Role of NPs and PAs in Hospital Medicine Programs.
From July, 2017 The Hospitalist. Available at: https://www.the-hospitalist.
org/hospitalist/article/142565/leadership-training/role-nps-and-pashospital-
medicine-programs. Accessed July 17, 2018.
14. Furfari K , Rosenthal L, Tad-y D, Wolfe B, Glasheen J. Nurse practitioners as
inpatinet providers: a hospital medicine fellowship program. J Nurse Pract.
2014;10(6):425-429. doi: 10.1016/j.nurpra.2014.03.022.
15. Taylor D, Broyhill B, Burris A, Wilcox M. A strategic approach for developing
an advanced practice workforce: from postgraduate transition-to-practice
fellowship programs and beyond. Nurs Adm Q. 2017;41(1):11-19. doi:
10.1097/NAQ.0000000000000198. PubMed
16. Barnes H. Exploring the factors that influence nurse practitioners role transition.
J Nurse Pract. 2015;11(2):178-183. doi: 10.1016/j.nurpra.2014.11.004. PubMed
17. Hart MA, Macnee LC. How well are nurse practitioners prepared for practice:
results of a 2004 questionnaire study. J Am Acad Nurse Pract. 2007;19(1):35-
42. doi: 10.1111/j.1745-7599.2006.00191.x PubMed
18. Torok H, Lackner C, Landis R, Wright S. Learning needs of physician assistants
working in hospital medicine. J Hosp Med. 2012;7(3):190-194. doi:
10.1002/jhm.1001. PubMed
19. Kisuule F, Howell E. Hospitalists and their impact on quality, patient safety,
and satisfaction. Obstet Gynecol Clin N Am. 2015;42(3):433-446. doi:
10.1016/j.ogc.2015.05.003. PubMed
20. Ford, W, Britting L. Nonphysician Providers in the hospitalist model: a prescription
for change and a warning about unintended side effects. J Hosp
Med. 2010;5(2):99-102. doi: 10.1002/jhm.556. PubMed
There is an increasing utilization of advanced practice providers (APPs) in the delivery of healthcare in the United States.1,2 As of 2016, there were 157, 025 nurse practitioners (NPs) and 102,084 physician assistants (PAs) with a projected growth rate of 6.8% and 4.3%, respectively, which exceeds the physician growth rate of 1.1%.2 This increased growth rate has been attributed to the expectation that APPs can enhance the quality of physician care, relieve physician shortages, and reduce service costs, as APPs are less expensive to hire than physicians.3,4 Hospital medicine is the fastest growing medical field in the United States, and approximately 83% of hospitalist groups around the country utilize APPs; however, the demand for hospitalists continues to exceed the supply, and this has led to increased utilization of APPs in hospital medicine.5-10
APPs receive very limited inpatient training and there is wide variation in their clinical abilities after graduation.11 This is an issue that has become exacerbated in recent years by a change in the training process for PAs. Before 2005, PA programs were typically two to three years long and required the same prerequisite courses as medical schools.11 PA students completed more than 2,000 hours of clinical rotations and then had to pass the Physician Assistant National Certifying Exam before they could practice.12 Traditionally, PA programs typically attracted students with prior healthcare experience.11 In 2005, PA programs began transitioning from bachelor’s degrees to requiring a master’s level degree for completion of the programs. This has shifted the demographics of the students matriculating to younger students with little-to-no prior healthcare experience; moreover, these fresh graduates lack exposure to hospital medicine.11
NPs usually gain clinical experience working as registered nurses (RNs) for two or more years prior to entry into the NP program. NP programs for baccalaureate-prepared RNs vary in length from two to three years.2 There is an acute care focus for NPs in training; however, there is no standardized training or licensure to ensure that hospital medicine competencies are met.13-15 Some studies have shown that a lack of structured support has been found to affect NP role transition negatively during the first year of practice,16 and graduating NPs have indicated that they needed more out of their clinical education in terms of content, clinical experience, and competency testing.17
Hiring new APP graduates as hospitalists requires a longer and more rigorous onboarding process. On‐the‐job training in hospital medicine for new APP graduates can take as long as six to 12 months in order for them to acquire the basic skill set necessary to adequately manage hospitalized patients.15 This extended onboarding is costly because the APPs are receiving a full hospitalist salary, yet they are not functioning at full capacity. Ideally, there should be an intermediary training step between graduation and employment as hospitalist APPs. Studies have shown that APPs are interested in formal postgraduate hospital medicine training, even if it means having a lower stipend during the first year after graduating from their NP or PA program.9,15,18
The growing need for hospitalists, driven by residency work-hour reform, increased age and complexity of patients, and the need to improve the quality of inpatient care while simultaneously reducing waste, has contributed to the increasing utilization of and need for highly qualified APPs in hospital medicine.11,19,20 We established a fellowship to train APPs. The goal of this study was to determine if an APP fellowship is a cost-effective pipeline for filling vacancies within a hospitalist program.
METHODS
Design and Setting
Johns Hopkins Bayview Medical Center (JHBMC) is a 440 bed hospital in Baltimore Maryland. The hospitalist group was started in 1996 with one physician seeing approximately 500 discharges a year. Over the last 20 years, the group has grown and is now its own division with 57 providers, including 42 physicians, 11 APPs, and four APP fellows. The hospitalist division manages ~7,000 discharges a year, which corresponds to approximately 60% of admissions to general medicine. Hospitalist APPs help staff general medicine by working alongside doctors and admitting patients during the day and night. The APPs also staff the pulmonary step down unit with a pulmonary attending and the chemical dependency unit with an internal medicine addiction specialist.
The growth of the division of hospital medicine at JHBMC is a result of increasing volumes and reduced residency duty hours. The increasing full time equivalents (FTEs) resulted in a need for APPs; however, vacancies went unfilled for an average of 35 weeks due to the time it took to post open positions, interview applicants, and hire applicants through the credentialing process. Further, it took as long as 22 to 34 weeks for a new hire to work independently. The APP vacancies and onboarding resulted in increased costs to the division incurred by physician moonlighting to cover open shifts. The hourly physician moonlighting rate at JHBMC is $150. All costs were calculated on the basis of a 40-hour work week. We performed a pre- and postanalysis of outcomes of interest between January 2009 and June 2018. This study was exempt from institutional review board review.
Intervention
In 2014, a one year APP clinical fellowship in hospital medicine was started. The fellows evaluate and manage patients working one-on-one with an experienced hospitalist faculty member. The program consists of 80% clinical experience in the inpatient setting and 20% didactic instruction (Table 1). Up to four fellows are accepted each year and are eligible for hire after training if vacancies exist. The program is cost neutral and was financed by downsizing, through attrition, two physician FTEs. Four APP fellows’ salaries are the equivalent of two entry-level hospitalist physicians’ salaries at JHBMC. The annual salary for an APP fellow is $69,000.
Downsizing by two physician FTEs meant that one less doctor was scheduled every day. The patient load previously seen by that one doctor (10 patients) was absorbed by the MD–APP fellow dyads. Paired with a fellow, each physician sees a higher cap of 13 patients, and it takes six weeks for the fellows to ramp-up to this patient load. When the fellow first starts, the team sees 10 patients. Every two weeks, the pair’s census increases by one patient to the cap of 13. Collectively, the four APP fellow–MD dyads make it possible for four physicians to see an additional 12 patients. The two extra patients absorbed by the service per day results in a net increase in capacity of up to 730 patient encounters a year.
Outcomes and Analysis
Our main outcomes of interest were duration of onboarding and cost incurred by the division to (1) staff the service during a vacancy and (2) onboard new hires. Secondary outcomes included duration of vacancy and total time spent with the group. We collected basic demographic data on participants, including, age, gender, and race. Demographics and outcomes of interest were compared pre- (2009-2013) and post- (2014-2018) initiation of the APP clinical fellowship using the chi-square test, the t-test for normally distributed data, and the Wilcoxon rank-sum for nonnormally distributed data, as appropriate. The normality of the data distribution was tested using the Shapiro-Wilk W test. Two-tailed P values less than .05 were considered to be statistically significant. Results were analyzed using Stata/MP version 13.0 (StataCorp Inc, College Station, Texas).
RESULTS
Twelve fellows have been recruited, and of these, 10 have graduated. Two chose to leave the program prior to completion. Of the 10 fellows that have graduated, six have been hired into our group, one was hired within our facility, and three were hired as hospitalists at other institutions. The median time from APP school graduation to hire was also not different between the two groups (10.5 vs 3.9 months, P = .069). In addition, the total time that the new APP hires spent with the group was nonstatistically significantly different between the two periods (17.9 vs 18.3 months, P = .735). Both the mean duration of onboarding and the cost to the division were significantly reduced after implementation of the program (25.4 vs 11.0 weeks, P = .017 and $361,714 vs $66,000, P = .004; Table 2).
The yearly cost of an APP vacancy and onboarding is incurred by doctor moonlighting costs (at the rate of $150 per hour) to cover open shifts. The mean duration of vacancies and onboarding each year was 34.9 and 25.4 weeks, respectively, before the fellowship. The yearly cost of onboarding, after the establishment of the fellowship, is a maximum of $66,000, derived from physician moonlighting to cover the six-week ramp-up at the very beginning of the fellowship and the five weeks of orientation to the pulmonary and chemical dependency units after the fellowship (Table 3).
DISCUSSION
Our APP clinical fellowship in hospital medicine at JHBMC has produced several benefits. First, the fellowship has become a pipeline for filling APP vacancies within our division. We have been able to hire for four consecutive years from the fellowship. Second, the ready availability of high-functioning and efficient APP hospitalists has cut down on the onboarding time for our new APP hires. Many new APP graduates lack confidence in caring for complex hospitalized patients. Following our 12-month clinical fellowship, our matriculated fellows are able to practice at the top of their license immediately and confidently. Third, the reduced vacancy and shortened onboarding periods have reduced costs to the division. Fourth, the fellowship has created additional teaching avenues for the faculty. The medicine units at JHBMC are comprised of hospitalist and internal medicine residency services. The hospitalists spend the majority of their clinical time in direct patient care; however, they rotate on the residency service for two weeks out of the year. The majority of physicians welcome the chance to teach more, and partnering with an APP fellow provides that opportunity.
As we have developed and grown this program, the one great challenge has been what to do with graduating fellows when we cannot hire them. Fortunately, the market for highly qualified, well trained APPs is strong, and every one of the fellows that we could not hire within our group has been able to find a position either within our facility or outside our institution. To facilitate this process, program directors and recruiters are invited to meet with the fellows toward the end of their fellowship to share employment opportunities with them.
Our study has limitations. First, had the $276,000 from the attrition of two physicians been used to hire nonfellow APPs under the old model, then the costs of the two models would have been similar, but this was simply not possible because the positions could not be filled. Second, this is a single-site experience, and our findings may not be generalizable, particularly those pertaining to remuneration. Third, our study was underpowered to detect small but important differences in characteristics of APPs, especially time from graduation to hire, before and after the implementation of our fellowship. Further research comparing various programs both in structure and outcomes—such as fellows’ readiness for practice, costs, duration of vacancies, and provider satisfaction—are an important next step.
We have developed a pool of applicants within our division to fill vacancies left by turnover from senior NPs and PAs. This program has reduced costs and improved the joy of practice for both doctors and APPs. As the need for highly qualified NPs and PAs in hospital medicine continues to grow, we may see more APP fellowships in hospital medicine in the United States.
Acknowledgments
The authors thank the advanced practice providers who have helped us grow and refine our fellowship.
Disclosures
The authors have nothing to disclose
1. Martsoff G, Nguyen P, Freund D, Poghosyan L. What we know about postgraduate nurse practitioner residency and fellowship programs. J Nurse Pract. 2017;13(7):482-487. doi: 10.1016/j.nurpra.2017.05.013.
2. Auerbach D, Staiger D, Buerhaus P. Growing ranks of advanced practice clinicians-implications for the physician workforce. N Engl J Med. 2018;378(25):2358-2360. doi: 10.1056/NEJMp1801869. PubMed
3. Laurant M, Harmsen M, Wollersheim H, Grol R, Faber M, Sibbald B. The
impact of nonphysician clinicians: do they improve the quality and cost-effectiveness
of health care services? Med Care Res Rev. 2009;66(6 Suppl):36S-89S. doi: 10.1177/1077558709346277. PubMed
4. Auerbach DI. Will the NP workforce grow in the future? New forecasts and
implications for healthcare delivery. Med Care. 2012;50(7):606-610. doi:
10.1097/MLR.0b013e318249d6e7. PubMed
5. Kisuule F, Howell E. Hospital medicine beyond the United States. Int J Gen
Med. 2018;11:65-71. doi: 10.2147/IJGM.S151275. PubMed
6. Wachter RM, Goldman L. Zero to 50, 000-The 20th anniversary of the hospitalist.
N Engl J Med. 2016;375(11):1009-1011. doi: 10.1056/NEJMp1607958. PubMed
7. Conrad, K and Valovska T. The current state of hospital medicine: trends in
compensation, practice patterns, advanced practice providers, malpractice,
and career satisfaction. In: Conrad K, ed. Clinical Approaches to Hospital
Medicine. Cham, Springer; 2017:259-270.
8. Bryant SE. Filling the gaps: preparing nurse practitioners for hospitalist
practice. J Am Assoc Nurse Pract. 2018;30(1):4-9. doi: 10.1097/
JXX.0000000000000008. PubMed
9. Sharma P, Brooks M, Roomiany P, Verma L, Criscione-Schreiber, L. Physician
assistant student training for the inpatient setting: a needs assessment. J Physician
Assist Educ. 2017;28(4):189-195. doi: 10.1097/JPA.0000000000000174. PubMed
10. Society of Hospital Medicine. 2016 State of Hospital Medicine Report. Available
at: https://www.hospitalmedicine.org/about/press-releases/shm-releases-
2016-state-of-hospital-medicine-report/. Accessed July 17, 2018.
11. Will KK, Budavari AI, Wilkens JA, Mishari K, Hartsell ZC. A Hospitalist postgraduate
training program for physician assistants. J Hosp Med. 2010;5(2):94-
8. doi: 10.1002/jhm.619. PubMed
12. Naqvi, S. Is it time for Physician Assistant (PA)/Nurse Practitioner (NP) Hospital
Medicine Residency Training. Available at: http://medicine2.missouri.e.,-
du/jahm/wp-content/uploads/2017/03/Is-it-time-for-PANP-Hospital-Medicine-
Residency-Training-Final.pdf. Accessed July 17, 2018.
13. Scheurer D, Cardin T. The Role of NPs and PAs in Hospital Medicine Programs.
From July, 2017 The Hospitalist. Available at: https://www.the-hospitalist.
org/hospitalist/article/142565/leadership-training/role-nps-and-pashospital-
medicine-programs. Accessed July 17, 2018.
14. Furfari K , Rosenthal L, Tad-y D, Wolfe B, Glasheen J. Nurse practitioners as
inpatinet providers: a hospital medicine fellowship program. J Nurse Pract.
2014;10(6):425-429. doi: 10.1016/j.nurpra.2014.03.022.
15. Taylor D, Broyhill B, Burris A, Wilcox M. A strategic approach for developing
an advanced practice workforce: from postgraduate transition-to-practice
fellowship programs and beyond. Nurs Adm Q. 2017;41(1):11-19. doi:
10.1097/NAQ.0000000000000198. PubMed
16. Barnes H. Exploring the factors that influence nurse practitioners role transition.
J Nurse Pract. 2015;11(2):178-183. doi: 10.1016/j.nurpra.2014.11.004. PubMed
17. Hart MA, Macnee LC. How well are nurse practitioners prepared for practice:
results of a 2004 questionnaire study. J Am Acad Nurse Pract. 2007;19(1):35-
42. doi: 10.1111/j.1745-7599.2006.00191.x PubMed
18. Torok H, Lackner C, Landis R, Wright S. Learning needs of physician assistants
working in hospital medicine. J Hosp Med. 2012;7(3):190-194. doi:
10.1002/jhm.1001. PubMed
19. Kisuule F, Howell E. Hospitalists and their impact on quality, patient safety,
and satisfaction. Obstet Gynecol Clin N Am. 2015;42(3):433-446. doi:
10.1016/j.ogc.2015.05.003. PubMed
20. Ford, W, Britting L. Nonphysician Providers in the hospitalist model: a prescription
for change and a warning about unintended side effects. J Hosp
Med. 2010;5(2):99-102. doi: 10.1002/jhm.556. PubMed
© 2019 Society of Hospital Medicine
Integrating Care for Patients With Chronic Liver Disease and Mental Health and Substance Use Disorders (FULL)
Chronic liver disease (CLD) encompasses a spectrum of common diseases associated with high morbidity and mortality. In 2010, cirrhosis, or advanced-stage CLD, was the eighth leading cause of death in the U.S., accounting for about 49,500 deaths.1 The leading causes of CLD are hepatitis C virus (HCV), which affects about 3.6 million people in the US; nonalcoholic fatty liver disease (NAFLD), which has been increasing in prevalence in up to 75% of CLD cases; and alcohol misuse.2,3 Substance use disorders (SUDs) are a common cause of CLD. About one-third of cirrhosis cases can be attributed to alcohol use, and there is a strong association between IV drug use and HCV. Individual studies point to the high prevalence of mental health disorders (MHDs) among patients with CLD.4-19 It is clear that mental health disorders and SUDs impact outcomes for patients with CLD such that addressing these co-occurring disorders is critical to caring for this population.
An integrated or multidisciplinary approach to medical care attempts to coordinate the delivery of health and social care to patients with complex disease and comorbidities.20 Integrated care models have been shown to positively impact outcomes in many chronic diseases. For example, in patients with heart failure, multidisciplinary interventions such as home visits, remote physiologic monitoring, telehealth, telephone follow-up, or a hospital/clinic team-based intervention have been shown to reduce both hospital admissions and all-cause mortality.21 Similarly, there have been studies in patients with CLD exploring integrated care models. Although individual studies have assessed outcomes associated with various MHDs/SUDs among patients with different etiologies of liver disease, this review assesses the role of integrated care models for patients with CLD and MHDs/SUDs across etiologies.
Methods
A search of the PubMed database was conducted in November 2016 with the following keywords: “liver disease” and “mental health,” “liver disease” and “depression,” “liver disease” and “integrated care,” “substance use” and “liver disease,” “integrated care” and “hepatitis,” “integrated care” and “cirrhosis,” “integrated care” and “advanced liver disease,” and “integrated care” and “alcoholic liver disease” or “nonalcoholic fatty liver disease.” Articles covered a range of study types, including qualitative and quantitative analyses as well as other systematic reviews on focused topics within the area of interest. The authors reviewed the abstracts for eligibility criteria, which included topics focused on the study of mental health or substance use aspects and/or integrated mental health/substance use care for liver diseases (across etiologies and stages), published from January 2004 to November 2016, written in English, and focused on an adult population. Five members of the research team reviewed abstracts and eliminated any that did not meet the eligibility criteria.
A total of 636 records were screened and 378 were excluded based on abstract relevance to the stated topics as well as eligibility criteria. Following this review, full articles (N = 263) were reviewed by at least 2 members of the research team. For both levels of review, articles were removed for the criteria above and additional exclusion criteria: editorial style articles, duplicates, transplant focus, or primarily focused on health-related quality of life (QOL) not specific to MHDs. Although many articles fit more than one exclusion criteria, an article was removed once it met one exclusion criteria. After individual assessment by members of the research team, 71 articles were kept in the review. The team identified 14 additional articles that contributed to the topic but were not located through the original database search. The final analysis included 85 articles that fell into 3 key areas: (1) prevalence of comorbid MHD/SUD in liver disease; (2) associations between MHD/SUD and disease progression/management; and (3) the use of integrated care models in patients with CLD.
Results
In general, depression and anxiety were common among patients with CLD regardless of etiology.5 Across VA and non-VA studies, depressive disorders were found in one-third to two-thirds of patients with CLD and anxiety disorders in about one-third of patients with CLD. 5,7,8,10,15,16, 22-25Results of the studies that assess the prevalence of MHDs in patients with CLD are shown in Table 1.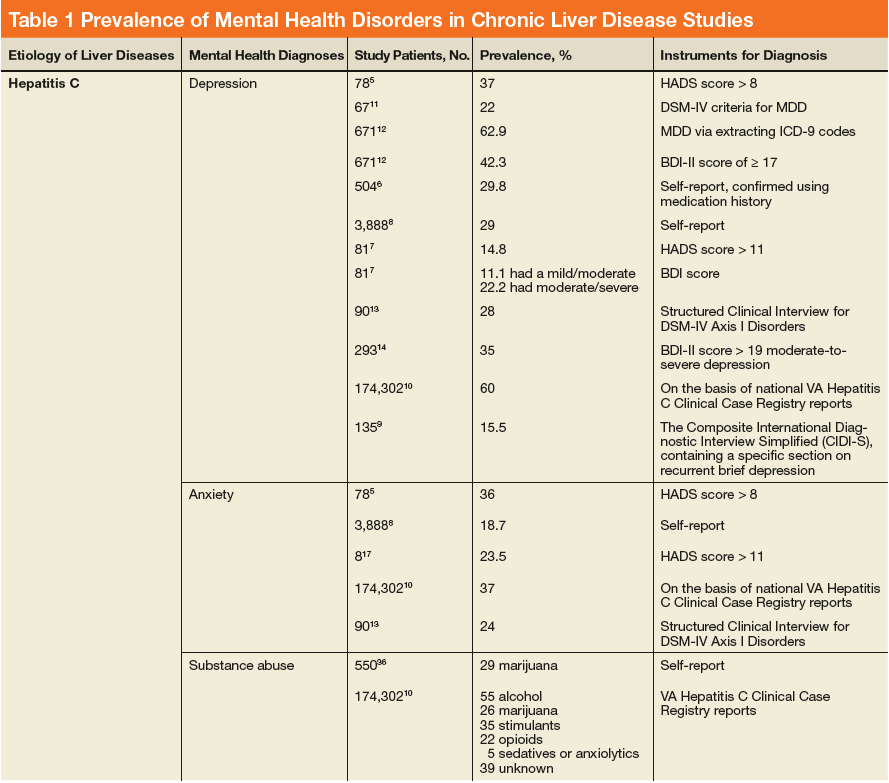
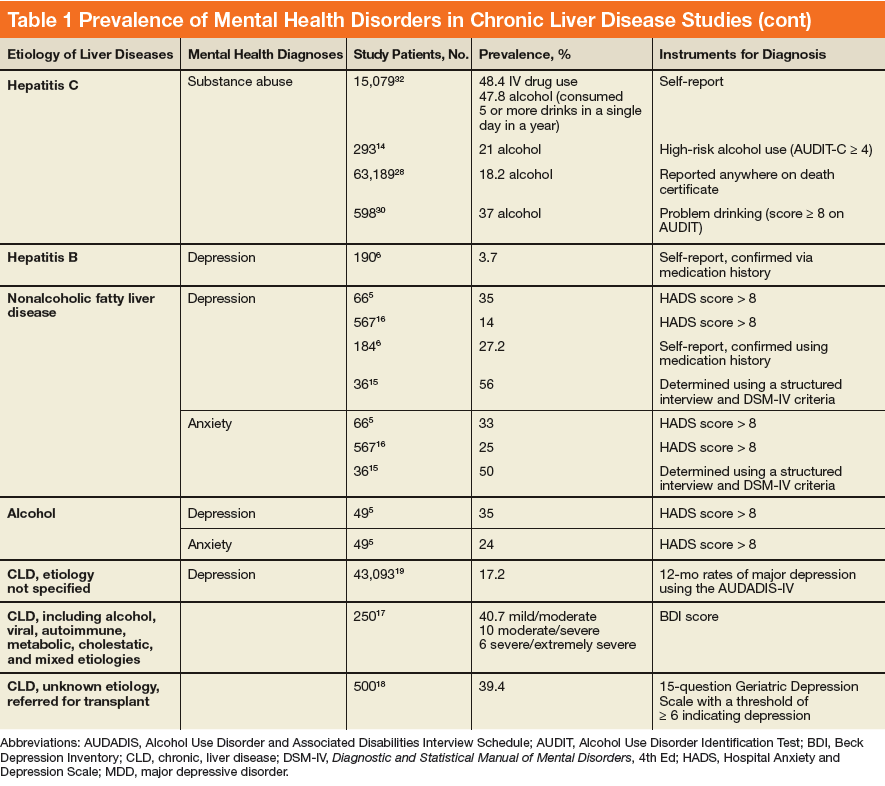
MHDs and SUDs in Patients With CLD
Mental health symptoms have been associated with the severity of liver disease in some but not all studies.17,18,26 Mental health disorders also may have more dire consequences in this population. In a national survey of adults, 1.6% of patients with depression were found to have liver disease. Among this group with depression, suicide attempts were 3-fold higher among patients with CLD vs patients without CLD.19
Substance use disorders (including alcohol) are common among patients with CLD. This has been best studied in the context of patients with HCV.22, 27-32 For example among patients with HCV, the prevalence of injection drug use (IDU) was 48% to 65%, and the prevalence of marijuana use was 29%.33-36 In a report of 174,302 veterans with HCV receiving VA care, the following SUDs were reported as diagnosis in this patient population: alcohol, 55%; cannabis, 26%; stimulants, 35%; opioids, 22%; sedatives or anxiolytics, 5%; and other drug use, 39%.10
Both Non-VA and VA studies have found overlap between HCV and alcohol-related liver disease with a number of patients with HCV using alcohol and a number of patients with alcohol-related liver disease having a past history of IDU and HCV.37,38 Across VA and non-VA studies, patients with HIV/HCV co-infection have been found to have particularly high rates of MHDs and SUDs. One VA retrospective cohort study of 18,349 HIV-infected patients noted 37% were seropositive for HCV as well.39-41 These patients with HIV/HCV infection when compared with patients with only HIV infection were more likely to have a diagnosis of mental health illness (76.1% vs 63.1%), depression (56.6% vs 45.6%), alcohol abuse (64.2% vs 30.1%), substance abuse (68.0% vs 25.7%), and hard drug use (62.9% vs 20.6%).42 Patients with CLD and ongoing alcohol use have been found to have increased mental health symptoms compared with patients without ongoing alcohol use.17 Thus MHDs and SUDs are common and often coexist among patients with CLD.
MHDs Impact Patient Outcomes
Mental health disorders can affect how providers care for patients. In the past, for example, in both VA and non-VA studies, patients were often excluded from interferon-based HCV treatments due to MHDs.22,35,43-45 These exclusions included psychiatric issues (35%), alcohol abuse (31%), drug abuse (9%), or > 1 of these reasons (26%).46 Depression also has been associated with decreased care seeking by patients. Patients with cirrhosis and depression often do not seek medical care due to perceived stigma.47 Nearly one-fifth of patients with HCV in one study reported that they did not share information about their disease with others to avoid being stigmatized.48 Other studies have noted similar difficulty with patients’ seeking HCV treatment, advances in medications notwithstanding.49-52
Depression among patients with cirrhosis has been associated with reduced QOL, worsened cognitive function, increased mortality, and frailty.18,53,54 Psychiatric symptoms have been associated with disability and pain among patients with cirrhosis and with weight gain among patients with NAFLD.5,55 Mental health symptoms also predicted lower work productivity in patients with HCV.8 Histologic changes in the liver have been described among patients with psychiatric disorders, although the mechanism is not well understood.15,16
Although not a focus of this review, it is well established that MHDs are associated with increased substance use. Since there is a well-established connection between alcohol and adverse liver-related outcomes regardless of etiology of liver disease, mental health is thus indirectly linked to poor liver outcomes through this mechanism.37,38,56-67
Integrated Care in Liver Disease
Although there are no set guidelines on how to approach patients with liver disease and MHD/SUD comorbidities, integrated care approaches that include attention to both CLD and psychiatric needs seem promising. Integrated care models have been recommended by several authors specifically for patients with HCV and co-occurring MHDs and SUDs.4,33,42,43,45,68-72 Various integrated care models for CLD and psychiatric comorbidities have been studied and are detailed in Table 2. 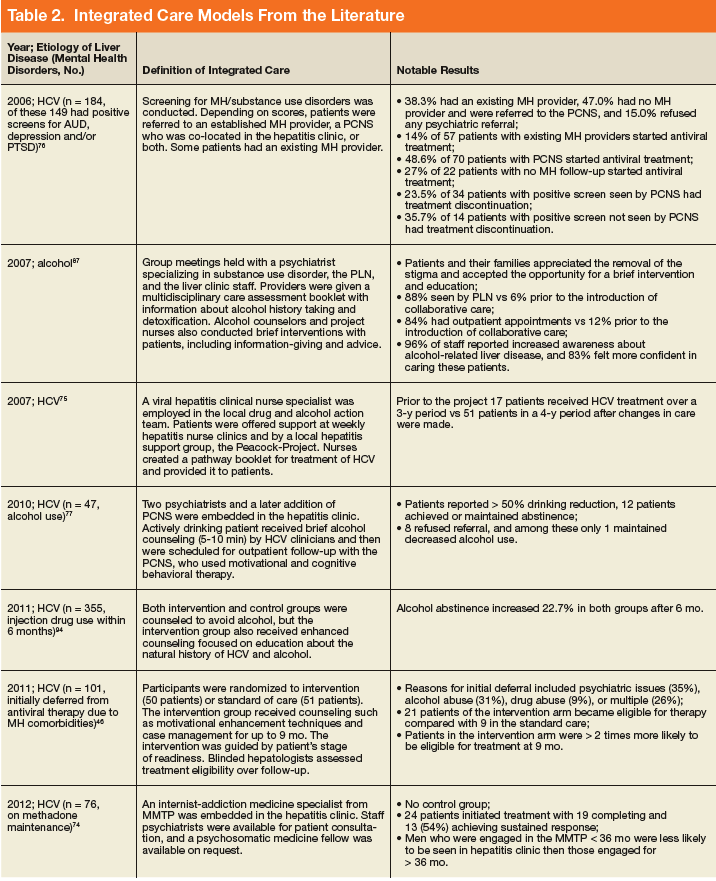
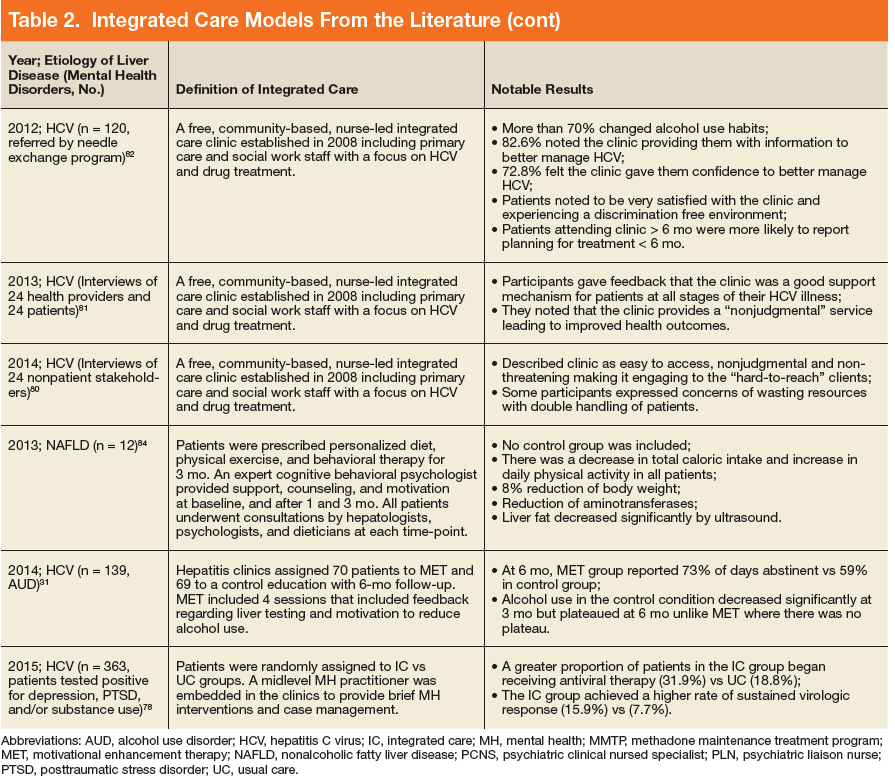
The most well described models of integrated care in CLD have been used for patients with HCV as noted in prior reviews.22,34,49,73 These studies included liver care integrated with substance abuse clinics/specialists, mental health professionals, and/or case managers. Outcomes that have been assessed include adherence, HCV treatment completion, HCV treatment eligibility/initiation, and reduction in alcohol use.31,46, 74-77 A large randomized controlled trial (RCT) comparing integrated care with usual care found that integrated care, including collaborative consultation with mental health providers and case managers, was associated with increased antiviral treatment and sustained virologic response (SVR).50,78 One study of integrated care in the era of direct-acting antiviral treatment for HCV found that twice as many veterans initiated treatment with integrated care (with case management and a mental health provider) as opposed to usual care. In this integrated care model, mental health providers provided ongoing brief psychological interventions designed to address the specific risk factors identified at screening, facilitated treatment, and served as a regular contact.79 Overall, integrating mental health care and HCV care has resulted in increased adherence, increased treatment eligibility/initiation, treatment completion, higher rates of SVR, and reduction in alcohol use.31,46,74-77
In addition to positive medical outcomes with integrated care models, patients and providers generally have favorable impressions of the clinics using an integrated care approach. For example, multiple qualitative studies of the Hepatitis C Community Clinic in New Zealand have described that patients and providers have positive feelings about integrated care models for HCV.80-82 Another study evaluating integrated care at 4 hepatitis clinics in British Columbia, Canada found that clients overall valued the clinic and viewed it favorably; however, they identified several areas for continued improvement, including communication and time spent with clients, follow-up and access to care, as well as education on coping and managing their disease.83
Beyond HCV, other patients with CLD could benefit from integrated care approaches. Given the association of psychiatric symptoms with weight outcomes among patients with NAFLD, integrating behavioral support has been recommended.55 Multidisciplinary care has been trialed in patients with NAFLD. One model included behavioral therapy with psychological counseling, motivation for lifestyle changes, and support by a trained expert cognitive behavioral psychologist. Although this study did not include a control group, the patients in the study experienced an 8% weight reduction, reduction in aminotransferases, and decreased hepatic steatosis by ultrasound.84
Integrated care also has been advocated for patients with alcohol-related liver disease. One study recommended creating a personalized framework to support self-management for this population.85 Another study assessed patients with alcohol-related cirrhosis and hepatic encephalopathy and recommended integrating individual coping strategies and support into liver care for this group of patients.86
A United Kingdom study of multidisciplinary care that included a team of gastroenterologists, psychiatrists, and a psychiatric liaison nurse, found improved accessibility to care and patient/family satisfaction using this model. Outpatient appointments were offered to 84% of patients after collaborative care was introduced as opposed to 12% previously. Patients and family members reported that this approach decreased the stigma of mental health care, allowing patients to be more open to intervention and education in this setting.87 A systematic review of patients with alcohol-related CLD found that among 5 RCTs with 1,945 cumulative patients, integrated care was associated with increased short-term abstinence but not sustained abstinence.88 Thus integrated care has been used most in patients with HCV-related CLD, but growing evidence supports its use for patients with other etiologies of CLD, including NAFLD and alcohol.
Discussion
This review found that MHDs are common among patients with CLD and that there is an association between the worsening of liver disease outcomes for patients with comorbid mental health and substance use diagnoses as well as an association of poor MHD/SUD outcomes among patients with CLD (eg, increased suicide attempts among those with comorbid CLD and depression). These data synthesis support screening for MHDs in patients with CLD and providing integrated or multidisciplinary care where possible. Integrated care provides both mental health and CLD care in a combined setting. Integrated care models have been associated with improved health outcomes in patients with CLD and psychiatric comorbidities, including increased adherence, increased HCV treatment eligibility; initiation, and completion; higher rates of HCV treatment cure; reduction in alcohol use; and increased weight loss among patients with NAFLD.
Integrated care is becoming the standard of care for patients with CLD in many countries with national medical care systems. Scotland, for example, initiated an HCV action plan that included mental health and social care. It reported a reduced incidence of HCV infection among patients with a history of IDU, increased treatment initiation, and increased HCV testing with this approach.89 Multidisciplinary care is a class 1 level B recommendation for HCV care in Canada, meaning that it is the highest class of evidence and is supported by at least 1 randomized or multiple nonrandomized studies.90 Similarly, the US Department of Health and Human Services has developed a “National Viral Hepatitis Action Plan” with more than 20 participating federal agencies. The plan highlights the importance of integrating public health and clinical services to successfully improve viral hepatitis care, prevention, and treatment across the US.
The content of the integrated care interventions has been variable. Models with the highest success of liver disease outcomes in this study seem to have screened patients for MHDs and/or SUDs and then used trained professionals to address these issues while also focusing on liver care. An approach that includes evidence-based treatments or intervention for MHDs/SUDs is likely preferable to nonspecific support or information giving. However, it is notable that even minimal interventions (eg, providing informational materials) have been associated with improved outcomes in CLD. The actual implementation of integrated care for MHDs/SUDs into liver care likely has to be tailored to the context and available resources.
One study proposed several models of integrated care that can be adapted to the available resources of a given clinical practice setting. These included fully integrated models where services are colocated, collaborative practice models in which there is a strong relationship between providers in hepatology and mental health and SUD clinics, and then hybrid models that integrate/colocate when possible and collaborate when colocation isn’t available. Although the fully integrated care model likely is the most ideal, any multidisciplinary approach has the potential to decrease barriers and increase access to treatment.91
Another study used modeling to develop an integrated care framework for vulnerable veterans with HCV that incorporated both implementation factors (eg, research evidence, clinical experience, facilitation, and leadership) based on the Promoting Action on Research Implementation in Health Services framework and patients’ factors from the Andersen Behavioral Model (eg, geography and finances) to form a hybrid framework for this population.92
Limitations
There are several notable limitations of this review. Although the review focused on depression, anxiety, and SUDs, given the high prevalence of these disorders, other MHDs are also common among patients with CLD and were not addressed. For example, veterans with HCV also commonly had posttraumatic stress disorder, bipolar disorder, and schizophrenia.10 Further investigation should focus on these disorders and their impacts. Additionally, the authors did not specifically search for alcohol-related care in the search terms. This review also did not address nonpsychiatric types of integrated care, which could be the focus of future reviews. Despite these limitations, this review provides support for the use of integrated care in the context of CLD and co-occurring MHDs and SUDs.
Conclusion
Several studies support integrated care for patients with liver disease and co-occurring psychiatric disorders. There are multiple integrated care models in place, although they have largely been used in patients with HCV. More studies are needed to assess the role of integrated mental health care in other populations of patients with CLD. There is an abundance of research supporting the role of integrated care in improving health outcomes across many chronic diseases, including implementation of mental health into primary care in large health care systems like the VA health care system.93 Health care systems should work toward alignment of resources to meet these needs in specialty care settings, such as liver disease care in order optimize both liver disease and MHD/SUD outcomes for these patients.
Click here to read the digital edition.
1. Murray CJ, Atkinson C, Bhalla K, et al; US Burden of Disease Collaborators. The state of US health, 1990-2010: burden of diseases, injuries, and risk factors. JAMA. 2013;310(6):591-608.
2. Davis GL, Alter MJ, El-Serag H, Poynard T, Jennings LW. Aging of hepatitis C virus (HCV)-infected persons in the United States: a multiple cohort model of HCV prevalence and disease progression. Gastroenterology. 2010;138(2):513-521.e1-e6.
3. Younossi ZM, Stepanova M, Afendy M, et al. Changes in the prevalence of the most common causes of chronic liver diseases in the United States from 1988 to 2008. Clin Gastroenterol Hepatol. 2011;9(6):524-530.e1; quiz e60.
4. Neuman MG, Monteiro M, Rehm J. Drug interactions between psychoactive substances and antiretroviral therapy in individuals infected with human immunodeficiency and hepatitis viruses. Subst Use Misuse. 2006;41(10-12):1395-1463.
5. Rogal SS, Bielefeldt K, Wasan AD, et al. Inflammation, psychiatric symptoms, and opioid use are associated with pain and disability in patients with cirrhosis. Clin Gastroenterol Hepatol. 2015;13(5):1009-1016.
6. Weinstein AA, Kallman Price J, Stepanova M, et al. Depression in patients with nonalcoholic fatty liver disease and chronic viral hepatitis B and C. Psychosomatics. 2011;52(2):127-132.
7. Erim Y, Tagay S, Beckmann M, et al. Depression and protective factors of mental health in people with hepatitis C: a questionnaire survey. Int J Nurs Stud. 2010;47(3):342-349.
8. Younossi I, Weinstein A, Stepanova M, Hunt S, Younossi ZM. Mental and emotional impairment in patients with hepatitis C is related to lower work productivity. Psychosomatics. 2016;57(1):82-88.
9. Carta MG, Angst J, Moro MF, et al. Association of chronic hepatitis C with recurrent brief depression. J Affect Disord. 2012;141(2-3):361-366.
10. Beste LA, Ioannou GN. Prevalence and treatment of chronic hepatitis C virus infection in the US Department of Veterans Affairs. Epidemiol Rev. 2015;37(1):131-143.
11. Birerdinc A, Afendy A, Stepanova M, Younossi I, Baranova A, Younossi ZM. Gene expression profiles associated with depression in patients with chronic hepatitis C (CH-C). Brain Behav. 2012;2(5):525-531.
12. Patterson AL, Morasco BJ, Fuller BE, Indest DW, Loftis JM, Hauser P. Screening for depression in patients with hepatitis C using the Beck Depression Inventory-II: do somatic symptoms compromise validity? Gen Hosp Psychiatry. 2011;33(4):354-362.
13. Golden J, O’Dwyer AM, Conroy RM. Depression and anxiety in patients with hepatitis C: prevalence, detection rates and risk factors. Gen Hosp Psychiatry. 2005;27(6):431-438.
14. Fireman M, Indest DW, Blackwell A, Whitehead AJ, Hauser P. Addressing tri-morbidity (hepatitis C, psychiatric disorders, and substance use): the importance of routine mental health screening as a component of a comanagement model of care. Clin Infect Dis. 2005;40(suppl 5):S286-S291.
15. Elwing JE, Lustman PJ, Wang HL, Clouse RE. Depression, anxiety, and nonalcoholic steatohepatitis. Psychosom Med. 2006;68(4):563-569.
16. Youssef NA, Abdelmalek MF, Binks M, et al. Associations of depression, anxiety and antidepressants with histological severity of nonalcoholic fatty liver disease. Liver Int. 2013;33(7):1062-1070.
17. Bianchi G, Marchesini G, Nicolino F, et al. Psychological status and depression in patients with liver cirrhosis. Dig Liver Dis. 2005;37(8):593-600.
18. Cron DC, Friedman JF, Winder GS, et al. Depression and frailty in patients with end-stage liver disease referred for transplant evaluation. Am J Transplant. 2016;16(6):1805-1811.
19. Le Strat Y, Le Foll B, Dubertret C. Major depression and suicide attempts in patients with liver disease in the United States. Liver Int. 2015;35(7):1910-1916.
20. Lemmens LC, Molema CC, Versnel N, Baan CA, de Bruin SR. Integrated care programs for patients with psychological comorbidity: a systematic review and meta-analysis. J Psychosom Res. 2015;79(6):580-594.
21. Holland R, Battersby J, Harvey I, Lenaghan E, Smith J, Hay L. Systematic review of multidisciplinary interventions in heart failure. Heart. 2005;91(7):899-906.
22. Ho SB, Groessl E, Dollarhide A, Robinson S, Kravetz D, Dieperink E. Management of chronic hepatitis C in veterans: the potential of integrated care models. Am J Gastroenterol. 2008;103(7):1810-1823.
23. Adinolfi LE, Nevola R, Lus G, et al. Chronic hepatitis C virus infection and neurological and psychiatric disorders: an overview. World J Gastroenterol. 2015;21(8):2269-2280.
24. Lee K, Otgonsuren M, Younoszai Z, Mir HM, Younossi ZM. Association of chronic liver disease with depression: a population-based study. Psychosomatics. 2013;54(1):52-59.
25. Rosenthal E, Cacoub P. Extrahepatic manifestations in chronic hepatitis C virus carriers. Lupus. 2015;24(4-5):469-482.
26. Duan Z, Kong Y, Zhang J, Guo H. Psychological comorbidities in Chinese patients with acute-on-chronic liver failure. Gen Hosp Psychiatry. 2012;34(3):276-281.
27. Cariello R, Federico A, Sapone A, et al. Intestinal permeability in patients with chronic liver diseases: its relationship with the aetiology and the entity of liver damage. Dig Liver Dis. 2010;42(3):200-204.
28. Wise M, Finelli L, Sorvillo F. Prognostic factors associated with hepatitis C disease: a case-control study utilizing U.S. multiple-cause-of-death data. Public Health Rep. 2010;125(3):414-422.
29. Wurst FM, Dürsteler-MacFarland KM, Auwaerter V, et al. Assessment of alcohol use among methadone maintenance patients by direct ethanol metabolites and self-reports. Alcohol Clin Exp Res. 2008;32(9):1552-1557.
30. Campbell JV, Hagan H, Latka MH, et al; The STRIVE Project. High prevalence of alcohol use among hepatitis C virus antibody positive injection drug users in three US cities. Drug Alcohol Depend. 2006;81(3):259-265.
31. Dieperink E, Fuller B, Isenhart C, et al. Efficacy of motivational enhancement therapy on alcohol use disorders in patients with chronic hepatitis C: a randomized controlled trial. Addiction. 2014;109(11):1869-1877.
32. Armstrong GL, Wasley A, Simard EP, McQuillan GM, Kuhnert WL, Alter MJ. The prevalence of hepatitis C virus infection in the United States, 1999 through 2002. Ann Intern Med. 2006;144(10):705-714
33. Arain A, Robaeys G. Eligibility of persons who inject drugs for treatment of hepatitis C virus infection. World J Gastroenterol. 2014;20(36):12722-12733.
34. North CS, Hong BA, Kerr T. Hepatitis C and substance use: new treatments and novel approaches. Curr Opin Psychiatry. 2012;25(3):206-212.
35. Coffin PO, Reynolds A. Ending hepatitis C in the United States: the role of screening. Hepat Med. 2014;6:79-87.
36. Liu T, Howell GT, Turner L, Corace K, Garber G, Cooper C. Marijuana use in hepatitis C infection does not affect liver biopsy histology or treatment outcomes. Can J Gastroenterol Hepatol. 2014;28(7):381-384.
37. Kamal A, Cheung R. Positive CAGE screen correlates with cirrhosis in veterans with chronic hepatitis C. Dig Dis Sci. 2007;52(10):2564-2569.
38. Fuster D, Sanvisens A, Bolao F, et al. Impact of hepatitis C virus infection on the risk of death of alcohol-dependent patients. J Viral Hepat. 2015;22(1):18-24.
39. Klein MB, Rollet KC, Saeed S, et al; Canadian HIV-HCV Cohort Investigators. HIV and hepatitis C virus coinfection in Canada: challenges and opportunities for reducing preventable morbidity and mortality. HIV Med. 2013;14(1):10-20.
40. Weiss JJ, Gorman JM. Psychiatric behavioral aspects of comanagement of hepatitis C virus and HIV. Curr HIV/AIDS Rep. 2006;3(4):176-181.
41. Goulet JL, Fultz SL, McGinnis KA, Justice AC. Relative prevalence of comorbidities and treatment contraindications in HIV-mono-infected and HIV/HCV-co-infected veterans. AIDS. 2005;19(suppl 3):S99-S105.
42. Backus LI, Boothroyd D, Deyton LR. HIV, hepatitis C and HIV/hepatitis C virus co-infection in vulnerable populations. AIDS. 2005;19(suppl 3):S13-S19.
43. Mehta SH, Genberg BL, Astemborski J, et al. Limited uptake of hepatitis C treatment among injection drug users. J Community Health. 2008;33(3):126-133.
44. Gidding HF, Law MG, Amin J, et al; ACHOS Investigator Team. Predictors of deferral of treatment for hepatitis C infection in Australian clinics. Med J Aust. 2011;194(8):398-402.
45. Chainuvati S, Khalid SK, Kancir S, et al. Comparison of hepatitis C treatment patterns in patients with and without psychiatric and/or substance use disorders. J Viral Hepat. 2006;13(4):235-241.
46. Evon DM, Simpson K, Kixmiller S, et al. A randomized controlled trial of an integrated care intervention to increase eligibility for chronic hepatitis C treatment. Am J Gastroenterol. 2011; 106(10):1777-1786.
47. Vaughn-Sandler V, Sherman C, Aronsohn A, Volk ML. Consequences of perceived stigma among patients with cirrhosis. Dig Dis Sci. 2014;59(3):681-686.
48. Blasiole JA, Shinkunas L, Labrecque DR, Arnold RM, Zickmund SL. Mental and physical symptoms associated with lower social support for patients with hepatitis C. World J Gastroenterol. 2006;12(29):4665-4672.
49. Bruggmann P, Litwin AH. Models of care for the management of hepatitis C virus among people who inject drugs: one size does not fit all. Clin Infect Dis. 2013;57(suppl 2):S56-S61.
50. Groessl EJ, Sklar M, Cheung RC, Bräu N, Ho SB. Increasing antiviral treatment through integrated hepatitis C care: a randomized multicenter trial. Contemp Clin Trials. 2013;35(2):97-107.
51. Alavi M, Grebely J, Micallef M, et al; Enhancing Treatment for Hepatitis C in Opioid Substitution Settings (ETHOS) Study Group. Assessment and treatment of hepatitis C virus infection among people who inject drugs in the opioid substitution setting: ETHOS study. Clin Infect Dis. 2013;57(suppl 2):S62-S69.
52. Evon DM, Golin CE, Fried MW, Keefe FJ. Chronic hepatitis C and antiviral treatment regimens: where can psychology contribute? J Consult Clin Psychol. 2013;81(2):361-374.
53. Mullish BH, Kabir MS, Thursz MR, Dhar A. Review article: depression and the use of antidepressants in patients with chronic liver disease or liver transplantation. Aliment Pharmacol Ther. 2014;40(8):880-892.
54. Stewart CA, Enders FT, Mitchell MM, Felmlee-Devine D, Smith GE. The cognitive profile of depressed patients with cirrhosis. Prim Care Companion CNS Disord. 2011;13(3):pii. PCC.10m01090
55. Stewart KE, Haller DL, Sargeant C, Levenson JL, Puri P, Sanyal AJ. Readiness for behaviour change in non-alcoholic fatty liver disease: implications for multidisciplinary care models. Liver Int. 2015;35(3):936-943.
56. Hutchinson SJ, Bird SM, Goldberg DJ. Influence of alcohol on the progression of hepatitis C virus infection: a meta-analysis. Clin Gastroenterol Hepatol. 2005;3(11):1150-1159.
57. Chaudhry AA, Sulkowski MS, Chander G, Moore RD. Hazardous drinking is associated with an elevated aspartate aminotransferase to platelet ratio index in an urban HIV-infected clinical cohort. HIV Med. 2009;10(3):133-142.
58. McMahon BJ, Bruden D, Bruce MG, et al. Adverse outcomes in Alaska natives who recovered from or have chronic hepatitis C infection. Gastroenterology. 2010;138(3):922-931.e1.
59. Anand BS, Thornby J. Alcohol has no effect on hepatitis C virus replication: a meta-analysis. Gut. 2005;54(10):1468-1472.
60. Au DH, Kivlahan DR, Bryson CL, Blough D, Bradley KA. Alcohol screening scores and risk of hospitalizations for GI conditions in men. Alcohol Clin Exp Res. 2007;31(3):443-451.
61. Orman ES, Odena G, Bataller R. Alcoholic liver disease: pathogenesis, management, and novel targets for therapy. J Gastroenterol Hepatol. 2013;28(suppl 1):77-84.
62. Liu J, Lewohl JM, Harris RA, Dodd PR, Mayfield RD. Altered gene expression profiles in the frontal cortex of cirrhotic alcoholics. Alcohol Clin Exp Res. 2007;31(9):1460-1466.
63. Barve S, Kapoor R, Moghe A, et al. Focus on the liver: alcohol use, highly active antiretroviral therapy, and liver disease in HIV-infected patients. Alcohol Res Health. 2010;33(3):229-236.
64. Trimble G, Zheng L, Mishra A, Kalwaney S, Mir HM, Younossi ZM. Mortality associated with alcohol-related liver disease. Aliment Pharmacol Ther. 2013;38(6):596-602.
65. Loomba R, Yang HI, Su J, Brenner D, Iloeje U, Chen CJ. Obesity and alcohol synergize to increase the risk of incident hepatocellular carcinoma in men. Clin Gastroenterol Hepatol. 2010;8(10):891-898.e1-e2.
66. Zakhari S, Li TK. Determinants of alcohol use and abuse: impact of quantity and frequency patterns on liver disease. Hepatology. 2007;46(6):2032-2039.
67. Lim JK, Tate JP, Fultz SL, et al. Relationship between alcohol use categories and noninvasive markers of advanced hepatic fibrosis in HIV-infected, chronic hepatitis C virus-infected, and uninfected patients. Clin Infect Dis. 2014;58(10):1449-1458.
68. Kanwal F, White DL, Tavakoli-Tabasi S, et al. Many patients with interleukin 28B genotypes associated with response to therapy are ineligible for treatment because of comorbidities. Clin Gastroenterol Hepatol. 2014;12(2):327-333.e1.
69. Mehta SH, Thomas DL, Sulkowski MS, Safaein M, Vlahov D, Strathdee SA. A framework for understanding factors that affect access and utilization of treatment for hepatitis C virus infection among HCV-mono-infected and HIV/HCV-co-infected injection drug users. AIDS. 2005;19(suppl 3):S179-S189.
70. McLaren M, Garber G, Cooper C. Barriers to hepatitis C virus treatment in a Canadian HIV-hepatitis C virus coinfection tertiary care clinic. Can J Gastroenterol. 2008;22(2):133-137.
71. Treloar C, Rance J, Dore GJ, Grebely J; ETHOS Study Group. Barriers and facilitators for assessment and treatment of hepatitis C virus infection in the opioid substitution treatment setting: insights from the ETHOS study. J Viral Hepat. 2014;21(8):560-567.
72. Treloar C, Rance J, Grebely J, Dore GJ. Client and staff experiences of a co-located service for hepatitis C care in opioid substitution treatment settings in New South Wales, Australia. Drug Alcohol Depend. 2013;133(2):529-534.
73. Edlin BR, Kresina TF, Raymond DB, et al. Overcoming barriers to prevention, care, and treatment of hepatitis C in illicit drug users. Clin Infect Dis. 2005;40(suppl 5):S276-S285.
74. Martinez AD, Dimova R, Marks KM, et al. Integrated internist—addiction medicine— hepatology model for hepatitis C management for individuals on methadone maintenance. J Viral Hepat. 2012;19(1):47-54.
75. Fahey S. Developing a nursing service for patients with hepatitis C. Nurs Stand. 2007;21(43):35-40.
76. Knott A, Dieperink E, Willenbring ML, et al. Integrated psychiatric/medical care in a chronic hepatitis C clinic: effect on antiviral treatment evaluation and outcomes. Am J Gastroenterol. 2006;101(10):2254-2262.
77. Dieperink E, Ho SB, Heit S, Durfee JM, Thuras P, Willenbring ML. Significant reductions in drinking following brief alcohol treatment provided in a hepatitis C clinic. Psychosomatics. 2010;51(2):149-156.
78. Ho SB, Bräu N, Cheung R, et al. Integrated care increases treatment and improves outcomes of patients with chronic hepatitis C virus infection and psychiatric illness or substance abuse. Clin Gastroenterol Hepatol. 2015;13(11):2005-2014.e1-e3.
79. Groessl EJ, Liu L, Sklar M, Ho SB. HCV integrated care: a randomized trial to increase treatment initiation and SVR with direct acting antivirals. Int J Hepatol. 2017;2017:5834182.
80. Treloar C, Gray R, Brener L. A piece of the jigsaw of primary care: health professional perceptions of an integrated care model of hepatitis C management in the community. J Prim Health Care. 2014;6(2):129-134.
81. Brener L, Gray R, Cama EJ, Treloar C. “Makes you wanna do treatment”: benefits of a hepatitis C specialist clinic to clients in Christchurch, New Zealand. Health Soc Care Community. 2013;21(2):216-223.
82. Horwitz R, Brener L, Treloar C. Evaluation of an integrated care service facility for people living with hepatitis C in New Zealand. Int J Integr Care. 2012;12(Spec Ed Integrated Care Pathways):e229.
83. Christianson TM, Moralejo D. Assessing the quality of care in a regional integrated viral hepatitis clinic in British Columbia: a cross-sectional study. Gastroenterol Nurs. 2009;32(5):315-324.
84. Scaglioni F, Marino M, Ciccia S, et al. Short-term multidisciplinary non-pharmacological intervention is effective in reducing liver fat content assessed non-invasively in patients with nonalcoholic fatty liver disease (NAFLD). Clin Res Hepatol Gastroenterol. 2013;37(4):353-358.
85. Lau-Walker M, Presky J, Webzell I, Murrells T, Heaton N. Patients with alcohol-related liver disease—beliefs about their illness and factors that influence their self-management. J Adv Nurs. 2016;72(1):173-185.
86. Mikkelsen MR, Hendriksen C, Schiødt FV, Rydahl-Hansen S. Coping and rehabilitation in alcoholic liver disease patients after hepatic encephalopathy—in interaction with professionals and relatives. J Clin Nurs. 2015;24(23-24):3627-3637.
87. Moriarty KJ, Platt H, Crompton S, et al. Collaborative care for alcohol-related liver disease. Clin Med (Lond). 2007;7(2):125-128.
88. Khan A, Tansel A, White DL, et al. Efficacy of psychosocial interventions in inducing and maintaining alcohol abstinence in patients with chronic liver disease: a systematic review. Clin Gastroenterol Hepatol. 2016;14(2):191-202.e1-e4;quiz e20.
89. Wylie L, Hutchinson S, Liddell D, Rowan N. The successful implementation of Scotland’s Hepatitis C Action Plan: what can other European stakeholders learn from the experience? A Scottish voluntary sector perspective. BMC Infect Dis. 2014;14(suppl 6):S7.
90. Hull M, Shafran S, Wong A, et al. CIHR Canadian HIV trials network coinfection and concurrent diseases core research group: 2016 updated Canadian HIV/hepatitis C adult guidelines for management and treatment. Can J Infect Dis Med Microbiol. 2016;2016:4385643.
91. Bonner JE, Barritt AS 4th, Fried MW, Evon DM. Time to rethink antiviral treatment for hepatitis C in patients with coexisting mental health/substance abuse issues. Dig Dis Sci. 2012;57(6):1469-1474.
92. Rongey C, Asch S, Knight SJ. Access to care for vulnerable veterans with hepatitis C: a hybrid conceptual framework and a case study to guide translation. Transl Behav Med. 2011;1(4):644-651.
93. Zeiss AM, Karlin BE. Integrating mental health and primary care services in the Department of Veterans Affairs health care system. J Clin Psychol Med Settings. 2008;15(1):73-78.
94. Drumright LN, Hagan H, Thomas DL, et al. Predictors and effects of alcohol use on liver function among young HCV-infected injection drug users in a behavioral intervention. J Hepatol. 2011;55(1):45-52.
Chronic liver disease (CLD) encompasses a spectrum of common diseases associated with high morbidity and mortality. In 2010, cirrhosis, or advanced-stage CLD, was the eighth leading cause of death in the U.S., accounting for about 49,500 deaths.1 The leading causes of CLD are hepatitis C virus (HCV), which affects about 3.6 million people in the US; nonalcoholic fatty liver disease (NAFLD), which has been increasing in prevalence in up to 75% of CLD cases; and alcohol misuse.2,3 Substance use disorders (SUDs) are a common cause of CLD. About one-third of cirrhosis cases can be attributed to alcohol use, and there is a strong association between IV drug use and HCV. Individual studies point to the high prevalence of mental health disorders (MHDs) among patients with CLD.4-19 It is clear that mental health disorders and SUDs impact outcomes for patients with CLD such that addressing these co-occurring disorders is critical to caring for this population.
An integrated or multidisciplinary approach to medical care attempts to coordinate the delivery of health and social care to patients with complex disease and comorbidities.20 Integrated care models have been shown to positively impact outcomes in many chronic diseases. For example, in patients with heart failure, multidisciplinary interventions such as home visits, remote physiologic monitoring, telehealth, telephone follow-up, or a hospital/clinic team-based intervention have been shown to reduce both hospital admissions and all-cause mortality.21 Similarly, there have been studies in patients with CLD exploring integrated care models. Although individual studies have assessed outcomes associated with various MHDs/SUDs among patients with different etiologies of liver disease, this review assesses the role of integrated care models for patients with CLD and MHDs/SUDs across etiologies.
Methods
A search of the PubMed database was conducted in November 2016 with the following keywords: “liver disease” and “mental health,” “liver disease” and “depression,” “liver disease” and “integrated care,” “substance use” and “liver disease,” “integrated care” and “hepatitis,” “integrated care” and “cirrhosis,” “integrated care” and “advanced liver disease,” and “integrated care” and “alcoholic liver disease” or “nonalcoholic fatty liver disease.” Articles covered a range of study types, including qualitative and quantitative analyses as well as other systematic reviews on focused topics within the area of interest. The authors reviewed the abstracts for eligibility criteria, which included topics focused on the study of mental health or substance use aspects and/or integrated mental health/substance use care for liver diseases (across etiologies and stages), published from January 2004 to November 2016, written in English, and focused on an adult population. Five members of the research team reviewed abstracts and eliminated any that did not meet the eligibility criteria.
A total of 636 records were screened and 378 were excluded based on abstract relevance to the stated topics as well as eligibility criteria. Following this review, full articles (N = 263) were reviewed by at least 2 members of the research team. For both levels of review, articles were removed for the criteria above and additional exclusion criteria: editorial style articles, duplicates, transplant focus, or primarily focused on health-related quality of life (QOL) not specific to MHDs. Although many articles fit more than one exclusion criteria, an article was removed once it met one exclusion criteria. After individual assessment by members of the research team, 71 articles were kept in the review. The team identified 14 additional articles that contributed to the topic but were not located through the original database search. The final analysis included 85 articles that fell into 3 key areas: (1) prevalence of comorbid MHD/SUD in liver disease; (2) associations between MHD/SUD and disease progression/management; and (3) the use of integrated care models in patients with CLD.
Results
In general, depression and anxiety were common among patients with CLD regardless of etiology.5 Across VA and non-VA studies, depressive disorders were found in one-third to two-thirds of patients with CLD and anxiety disorders in about one-third of patients with CLD. 5,7,8,10,15,16, 22-25Results of the studies that assess the prevalence of MHDs in patients with CLD are shown in Table 1.
MHDs and SUDs in Patients With CLD
Mental health symptoms have been associated with the severity of liver disease in some but not all studies.17,18,26 Mental health disorders also may have more dire consequences in this population. In a national survey of adults, 1.6% of patients with depression were found to have liver disease. Among this group with depression, suicide attempts were 3-fold higher among patients with CLD vs patients without CLD.19
Substance use disorders (including alcohol) are common among patients with CLD. This has been best studied in the context of patients with HCV.22, 27-32 For example among patients with HCV, the prevalence of injection drug use (IDU) was 48% to 65%, and the prevalence of marijuana use was 29%.33-36 In a report of 174,302 veterans with HCV receiving VA care, the following SUDs were reported as diagnosis in this patient population: alcohol, 55%; cannabis, 26%; stimulants, 35%; opioids, 22%; sedatives or anxiolytics, 5%; and other drug use, 39%.10
Both Non-VA and VA studies have found overlap between HCV and alcohol-related liver disease with a number of patients with HCV using alcohol and a number of patients with alcohol-related liver disease having a past history of IDU and HCV.37,38 Across VA and non-VA studies, patients with HIV/HCV co-infection have been found to have particularly high rates of MHDs and SUDs. One VA retrospective cohort study of 18,349 HIV-infected patients noted 37% were seropositive for HCV as well.39-41 These patients with HIV/HCV infection when compared with patients with only HIV infection were more likely to have a diagnosis of mental health illness (76.1% vs 63.1%), depression (56.6% vs 45.6%), alcohol abuse (64.2% vs 30.1%), substance abuse (68.0% vs 25.7%), and hard drug use (62.9% vs 20.6%).42 Patients with CLD and ongoing alcohol use have been found to have increased mental health symptoms compared with patients without ongoing alcohol use.17 Thus MHDs and SUDs are common and often coexist among patients with CLD.
MHDs Impact Patient Outcomes
Mental health disorders can affect how providers care for patients. In the past, for example, in both VA and non-VA studies, patients were often excluded from interferon-based HCV treatments due to MHDs.22,35,43-45 These exclusions included psychiatric issues (35%), alcohol abuse (31%), drug abuse (9%), or > 1 of these reasons (26%).46 Depression also has been associated with decreased care seeking by patients. Patients with cirrhosis and depression often do not seek medical care due to perceived stigma.47 Nearly one-fifth of patients with HCV in one study reported that they did not share information about their disease with others to avoid being stigmatized.48 Other studies have noted similar difficulty with patients’ seeking HCV treatment, advances in medications notwithstanding.49-52
Depression among patients with cirrhosis has been associated with reduced QOL, worsened cognitive function, increased mortality, and frailty.18,53,54 Psychiatric symptoms have been associated with disability and pain among patients with cirrhosis and with weight gain among patients with NAFLD.5,55 Mental health symptoms also predicted lower work productivity in patients with HCV.8 Histologic changes in the liver have been described among patients with psychiatric disorders, although the mechanism is not well understood.15,16
Although not a focus of this review, it is well established that MHDs are associated with increased substance use. Since there is a well-established connection between alcohol and adverse liver-related outcomes regardless of etiology of liver disease, mental health is thus indirectly linked to poor liver outcomes through this mechanism.37,38,56-67
Integrated Care in Liver Disease
Although there are no set guidelines on how to approach patients with liver disease and MHD/SUD comorbidities, integrated care approaches that include attention to both CLD and psychiatric needs seem promising. Integrated care models have been recommended by several authors specifically for patients with HCV and co-occurring MHDs and SUDs.4,33,42,43,45,68-72 Various integrated care models for CLD and psychiatric comorbidities have been studied and are detailed in Table 2.
The most well described models of integrated care in CLD have been used for patients with HCV as noted in prior reviews.22,34,49,73 These studies included liver care integrated with substance abuse clinics/specialists, mental health professionals, and/or case managers. Outcomes that have been assessed include adherence, HCV treatment completion, HCV treatment eligibility/initiation, and reduction in alcohol use.31,46, 74-77 A large randomized controlled trial (RCT) comparing integrated care with usual care found that integrated care, including collaborative consultation with mental health providers and case managers, was associated with increased antiviral treatment and sustained virologic response (SVR).50,78 One study of integrated care in the era of direct-acting antiviral treatment for HCV found that twice as many veterans initiated treatment with integrated care (with case management and a mental health provider) as opposed to usual care. In this integrated care model, mental health providers provided ongoing brief psychological interventions designed to address the specific risk factors identified at screening, facilitated treatment, and served as a regular contact.79 Overall, integrating mental health care and HCV care has resulted in increased adherence, increased treatment eligibility/initiation, treatment completion, higher rates of SVR, and reduction in alcohol use.31,46,74-77
In addition to positive medical outcomes with integrated care models, patients and providers generally have favorable impressions of the clinics using an integrated care approach. For example, multiple qualitative studies of the Hepatitis C Community Clinic in New Zealand have described that patients and providers have positive feelings about integrated care models for HCV.80-82 Another study evaluating integrated care at 4 hepatitis clinics in British Columbia, Canada found that clients overall valued the clinic and viewed it favorably; however, they identified several areas for continued improvement, including communication and time spent with clients, follow-up and access to care, as well as education on coping and managing their disease.83
Beyond HCV, other patients with CLD could benefit from integrated care approaches. Given the association of psychiatric symptoms with weight outcomes among patients with NAFLD, integrating behavioral support has been recommended.55 Multidisciplinary care has been trialed in patients with NAFLD. One model included behavioral therapy with psychological counseling, motivation for lifestyle changes, and support by a trained expert cognitive behavioral psychologist. Although this study did not include a control group, the patients in the study experienced an 8% weight reduction, reduction in aminotransferases, and decreased hepatic steatosis by ultrasound.84
Integrated care also has been advocated for patients with alcohol-related liver disease. One study recommended creating a personalized framework to support self-management for this population.85 Another study assessed patients with alcohol-related cirrhosis and hepatic encephalopathy and recommended integrating individual coping strategies and support into liver care for this group of patients.86
A United Kingdom study of multidisciplinary care that included a team of gastroenterologists, psychiatrists, and a psychiatric liaison nurse, found improved accessibility to care and patient/family satisfaction using this model. Outpatient appointments were offered to 84% of patients after collaborative care was introduced as opposed to 12% previously. Patients and family members reported that this approach decreased the stigma of mental health care, allowing patients to be more open to intervention and education in this setting.87 A systematic review of patients with alcohol-related CLD found that among 5 RCTs with 1,945 cumulative patients, integrated care was associated with increased short-term abstinence but not sustained abstinence.88 Thus integrated care has been used most in patients with HCV-related CLD, but growing evidence supports its use for patients with other etiologies of CLD, including NAFLD and alcohol.
Discussion
This review found that MHDs are common among patients with CLD and that there is an association between the worsening of liver disease outcomes for patients with comorbid mental health and substance use diagnoses as well as an association of poor MHD/SUD outcomes among patients with CLD (eg, increased suicide attempts among those with comorbid CLD and depression). These data synthesis support screening for MHDs in patients with CLD and providing integrated or multidisciplinary care where possible. Integrated care provides both mental health and CLD care in a combined setting. Integrated care models have been associated with improved health outcomes in patients with CLD and psychiatric comorbidities, including increased adherence, increased HCV treatment eligibility; initiation, and completion; higher rates of HCV treatment cure; reduction in alcohol use; and increased weight loss among patients with NAFLD.
Integrated care is becoming the standard of care for patients with CLD in many countries with national medical care systems. Scotland, for example, initiated an HCV action plan that included mental health and social care. It reported a reduced incidence of HCV infection among patients with a history of IDU, increased treatment initiation, and increased HCV testing with this approach.89 Multidisciplinary care is a class 1 level B recommendation for HCV care in Canada, meaning that it is the highest class of evidence and is supported by at least 1 randomized or multiple nonrandomized studies.90 Similarly, the US Department of Health and Human Services has developed a “National Viral Hepatitis Action Plan” with more than 20 participating federal agencies. The plan highlights the importance of integrating public health and clinical services to successfully improve viral hepatitis care, prevention, and treatment across the US.
The content of the integrated care interventions has been variable. Models with the highest success of liver disease outcomes in this study seem to have screened patients for MHDs and/or SUDs and then used trained professionals to address these issues while also focusing on liver care. An approach that includes evidence-based treatments or intervention for MHDs/SUDs is likely preferable to nonspecific support or information giving. However, it is notable that even minimal interventions (eg, providing informational materials) have been associated with improved outcomes in CLD. The actual implementation of integrated care for MHDs/SUDs into liver care likely has to be tailored to the context and available resources.
One study proposed several models of integrated care that can be adapted to the available resources of a given clinical practice setting. These included fully integrated models where services are colocated, collaborative practice models in which there is a strong relationship between providers in hepatology and mental health and SUD clinics, and then hybrid models that integrate/colocate when possible and collaborate when colocation isn’t available. Although the fully integrated care model likely is the most ideal, any multidisciplinary approach has the potential to decrease barriers and increase access to treatment.91
Another study used modeling to develop an integrated care framework for vulnerable veterans with HCV that incorporated both implementation factors (eg, research evidence, clinical experience, facilitation, and leadership) based on the Promoting Action on Research Implementation in Health Services framework and patients’ factors from the Andersen Behavioral Model (eg, geography and finances) to form a hybrid framework for this population.92
Limitations
There are several notable limitations of this review. Although the review focused on depression, anxiety, and SUDs, given the high prevalence of these disorders, other MHDs are also common among patients with CLD and were not addressed. For example, veterans with HCV also commonly had posttraumatic stress disorder, bipolar disorder, and schizophrenia.10 Further investigation should focus on these disorders and their impacts. Additionally, the authors did not specifically search for alcohol-related care in the search terms. This review also did not address nonpsychiatric types of integrated care, which could be the focus of future reviews. Despite these limitations, this review provides support for the use of integrated care in the context of CLD and co-occurring MHDs and SUDs.
Conclusion
Several studies support integrated care for patients with liver disease and co-occurring psychiatric disorders. There are multiple integrated care models in place, although they have largely been used in patients with HCV. More studies are needed to assess the role of integrated mental health care in other populations of patients with CLD. There is an abundance of research supporting the role of integrated care in improving health outcomes across many chronic diseases, including implementation of mental health into primary care in large health care systems like the VA health care system.93 Health care systems should work toward alignment of resources to meet these needs in specialty care settings, such as liver disease care in order optimize both liver disease and MHD/SUD outcomes for these patients.
Click here to read the digital edition.
1. Murray CJ, Atkinson C, Bhalla K, et al; US Burden of Disease Collaborators. The state of US health, 1990-2010: burden of diseases, injuries, and risk factors. JAMA. 2013;310(6):591-608.
2. Davis GL, Alter MJ, El-Serag H, Poynard T, Jennings LW. Aging of hepatitis C virus (HCV)-infected persons in the United States: a multiple cohort model of HCV prevalence and disease progression. Gastroenterology. 2010;138(2):513-521.e1-e6.
3. Younossi ZM, Stepanova M, Afendy M, et al. Changes in the prevalence of the most common causes of chronic liver diseases in the United States from 1988 to 2008. Clin Gastroenterol Hepatol. 2011;9(6):524-530.e1; quiz e60.
4. Neuman MG, Monteiro M, Rehm J. Drug interactions between psychoactive substances and antiretroviral therapy in individuals infected with human immunodeficiency and hepatitis viruses. Subst Use Misuse. 2006;41(10-12):1395-1463.
5. Rogal SS, Bielefeldt K, Wasan AD, et al. Inflammation, psychiatric symptoms, and opioid use are associated with pain and disability in patients with cirrhosis. Clin Gastroenterol Hepatol. 2015;13(5):1009-1016.
6. Weinstein AA, Kallman Price J, Stepanova M, et al. Depression in patients with nonalcoholic fatty liver disease and chronic viral hepatitis B and C. Psychosomatics. 2011;52(2):127-132.
7. Erim Y, Tagay S, Beckmann M, et al. Depression and protective factors of mental health in people with hepatitis C: a questionnaire survey. Int J Nurs Stud. 2010;47(3):342-349.
8. Younossi I, Weinstein A, Stepanova M, Hunt S, Younossi ZM. Mental and emotional impairment in patients with hepatitis C is related to lower work productivity. Psychosomatics. 2016;57(1):82-88.
9. Carta MG, Angst J, Moro MF, et al. Association of chronic hepatitis C with recurrent brief depression. J Affect Disord. 2012;141(2-3):361-366.
10. Beste LA, Ioannou GN. Prevalence and treatment of chronic hepatitis C virus infection in the US Department of Veterans Affairs. Epidemiol Rev. 2015;37(1):131-143.
11. Birerdinc A, Afendy A, Stepanova M, Younossi I, Baranova A, Younossi ZM. Gene expression profiles associated with depression in patients with chronic hepatitis C (CH-C). Brain Behav. 2012;2(5):525-531.
12. Patterson AL, Morasco BJ, Fuller BE, Indest DW, Loftis JM, Hauser P. Screening for depression in patients with hepatitis C using the Beck Depression Inventory-II: do somatic symptoms compromise validity? Gen Hosp Psychiatry. 2011;33(4):354-362.
13. Golden J, O’Dwyer AM, Conroy RM. Depression and anxiety in patients with hepatitis C: prevalence, detection rates and risk factors. Gen Hosp Psychiatry. 2005;27(6):431-438.
14. Fireman M, Indest DW, Blackwell A, Whitehead AJ, Hauser P. Addressing tri-morbidity (hepatitis C, psychiatric disorders, and substance use): the importance of routine mental health screening as a component of a comanagement model of care. Clin Infect Dis. 2005;40(suppl 5):S286-S291.
15. Elwing JE, Lustman PJ, Wang HL, Clouse RE. Depression, anxiety, and nonalcoholic steatohepatitis. Psychosom Med. 2006;68(4):563-569.
16. Youssef NA, Abdelmalek MF, Binks M, et al. Associations of depression, anxiety and antidepressants with histological severity of nonalcoholic fatty liver disease. Liver Int. 2013;33(7):1062-1070.
17. Bianchi G, Marchesini G, Nicolino F, et al. Psychological status and depression in patients with liver cirrhosis. Dig Liver Dis. 2005;37(8):593-600.
18. Cron DC, Friedman JF, Winder GS, et al. Depression and frailty in patients with end-stage liver disease referred for transplant evaluation. Am J Transplant. 2016;16(6):1805-1811.
19. Le Strat Y, Le Foll B, Dubertret C. Major depression and suicide attempts in patients with liver disease in the United States. Liver Int. 2015;35(7):1910-1916.
20. Lemmens LC, Molema CC, Versnel N, Baan CA, de Bruin SR. Integrated care programs for patients with psychological comorbidity: a systematic review and meta-analysis. J Psychosom Res. 2015;79(6):580-594.
21. Holland R, Battersby J, Harvey I, Lenaghan E, Smith J, Hay L. Systematic review of multidisciplinary interventions in heart failure. Heart. 2005;91(7):899-906.
22. Ho SB, Groessl E, Dollarhide A, Robinson S, Kravetz D, Dieperink E. Management of chronic hepatitis C in veterans: the potential of integrated care models. Am J Gastroenterol. 2008;103(7):1810-1823.
23. Adinolfi LE, Nevola R, Lus G, et al. Chronic hepatitis C virus infection and neurological and psychiatric disorders: an overview. World J Gastroenterol. 2015;21(8):2269-2280.
24. Lee K, Otgonsuren M, Younoszai Z, Mir HM, Younossi ZM. Association of chronic liver disease with depression: a population-based study. Psychosomatics. 2013;54(1):52-59.
25. Rosenthal E, Cacoub P. Extrahepatic manifestations in chronic hepatitis C virus carriers. Lupus. 2015;24(4-5):469-482.
26. Duan Z, Kong Y, Zhang J, Guo H. Psychological comorbidities in Chinese patients with acute-on-chronic liver failure. Gen Hosp Psychiatry. 2012;34(3):276-281.
27. Cariello R, Federico A, Sapone A, et al. Intestinal permeability in patients with chronic liver diseases: its relationship with the aetiology and the entity of liver damage. Dig Liver Dis. 2010;42(3):200-204.
28. Wise M, Finelli L, Sorvillo F. Prognostic factors associated with hepatitis C disease: a case-control study utilizing U.S. multiple-cause-of-death data. Public Health Rep. 2010;125(3):414-422.
29. Wurst FM, Dürsteler-MacFarland KM, Auwaerter V, et al. Assessment of alcohol use among methadone maintenance patients by direct ethanol metabolites and self-reports. Alcohol Clin Exp Res. 2008;32(9):1552-1557.
30. Campbell JV, Hagan H, Latka MH, et al; The STRIVE Project. High prevalence of alcohol use among hepatitis C virus antibody positive injection drug users in three US cities. Drug Alcohol Depend. 2006;81(3):259-265.
31. Dieperink E, Fuller B, Isenhart C, et al. Efficacy of motivational enhancement therapy on alcohol use disorders in patients with chronic hepatitis C: a randomized controlled trial. Addiction. 2014;109(11):1869-1877.
32. Armstrong GL, Wasley A, Simard EP, McQuillan GM, Kuhnert WL, Alter MJ. The prevalence of hepatitis C virus infection in the United States, 1999 through 2002. Ann Intern Med. 2006;144(10):705-714
33. Arain A, Robaeys G. Eligibility of persons who inject drugs for treatment of hepatitis C virus infection. World J Gastroenterol. 2014;20(36):12722-12733.
34. North CS, Hong BA, Kerr T. Hepatitis C and substance use: new treatments and novel approaches. Curr Opin Psychiatry. 2012;25(3):206-212.
35. Coffin PO, Reynolds A. Ending hepatitis C in the United States: the role of screening. Hepat Med. 2014;6:79-87.
36. Liu T, Howell GT, Turner L, Corace K, Garber G, Cooper C. Marijuana use in hepatitis C infection does not affect liver biopsy histology or treatment outcomes. Can J Gastroenterol Hepatol. 2014;28(7):381-384.
37. Kamal A, Cheung R. Positive CAGE screen correlates with cirrhosis in veterans with chronic hepatitis C. Dig Dis Sci. 2007;52(10):2564-2569.
38. Fuster D, Sanvisens A, Bolao F, et al. Impact of hepatitis C virus infection on the risk of death of alcohol-dependent patients. J Viral Hepat. 2015;22(1):18-24.
39. Klein MB, Rollet KC, Saeed S, et al; Canadian HIV-HCV Cohort Investigators. HIV and hepatitis C virus coinfection in Canada: challenges and opportunities for reducing preventable morbidity and mortality. HIV Med. 2013;14(1):10-20.
40. Weiss JJ, Gorman JM. Psychiatric behavioral aspects of comanagement of hepatitis C virus and HIV. Curr HIV/AIDS Rep. 2006;3(4):176-181.
41. Goulet JL, Fultz SL, McGinnis KA, Justice AC. Relative prevalence of comorbidities and treatment contraindications in HIV-mono-infected and HIV/HCV-co-infected veterans. AIDS. 2005;19(suppl 3):S99-S105.
42. Backus LI, Boothroyd D, Deyton LR. HIV, hepatitis C and HIV/hepatitis C virus co-infection in vulnerable populations. AIDS. 2005;19(suppl 3):S13-S19.
43. Mehta SH, Genberg BL, Astemborski J, et al. Limited uptake of hepatitis C treatment among injection drug users. J Community Health. 2008;33(3):126-133.
44. Gidding HF, Law MG, Amin J, et al; ACHOS Investigator Team. Predictors of deferral of treatment for hepatitis C infection in Australian clinics. Med J Aust. 2011;194(8):398-402.
45. Chainuvati S, Khalid SK, Kancir S, et al. Comparison of hepatitis C treatment patterns in patients with and without psychiatric and/or substance use disorders. J Viral Hepat. 2006;13(4):235-241.
46. Evon DM, Simpson K, Kixmiller S, et al. A randomized controlled trial of an integrated care intervention to increase eligibility for chronic hepatitis C treatment. Am J Gastroenterol. 2011; 106(10):1777-1786.
47. Vaughn-Sandler V, Sherman C, Aronsohn A, Volk ML. Consequences of perceived stigma among patients with cirrhosis. Dig Dis Sci. 2014;59(3):681-686.
48. Blasiole JA, Shinkunas L, Labrecque DR, Arnold RM, Zickmund SL. Mental and physical symptoms associated with lower social support for patients with hepatitis C. World J Gastroenterol. 2006;12(29):4665-4672.
49. Bruggmann P, Litwin AH. Models of care for the management of hepatitis C virus among people who inject drugs: one size does not fit all. Clin Infect Dis. 2013;57(suppl 2):S56-S61.
50. Groessl EJ, Sklar M, Cheung RC, Bräu N, Ho SB. Increasing antiviral treatment through integrated hepatitis C care: a randomized multicenter trial. Contemp Clin Trials. 2013;35(2):97-107.
51. Alavi M, Grebely J, Micallef M, et al; Enhancing Treatment for Hepatitis C in Opioid Substitution Settings (ETHOS) Study Group. Assessment and treatment of hepatitis C virus infection among people who inject drugs in the opioid substitution setting: ETHOS study. Clin Infect Dis. 2013;57(suppl 2):S62-S69.
52. Evon DM, Golin CE, Fried MW, Keefe FJ. Chronic hepatitis C and antiviral treatment regimens: where can psychology contribute? J Consult Clin Psychol. 2013;81(2):361-374.
53. Mullish BH, Kabir MS, Thursz MR, Dhar A. Review article: depression and the use of antidepressants in patients with chronic liver disease or liver transplantation. Aliment Pharmacol Ther. 2014;40(8):880-892.
54. Stewart CA, Enders FT, Mitchell MM, Felmlee-Devine D, Smith GE. The cognitive profile of depressed patients with cirrhosis. Prim Care Companion CNS Disord. 2011;13(3):pii. PCC.10m01090
55. Stewart KE, Haller DL, Sargeant C, Levenson JL, Puri P, Sanyal AJ. Readiness for behaviour change in non-alcoholic fatty liver disease: implications for multidisciplinary care models. Liver Int. 2015;35(3):936-943.
56. Hutchinson SJ, Bird SM, Goldberg DJ. Influence of alcohol on the progression of hepatitis C virus infection: a meta-analysis. Clin Gastroenterol Hepatol. 2005;3(11):1150-1159.
57. Chaudhry AA, Sulkowski MS, Chander G, Moore RD. Hazardous drinking is associated with an elevated aspartate aminotransferase to platelet ratio index in an urban HIV-infected clinical cohort. HIV Med. 2009;10(3):133-142.
58. McMahon BJ, Bruden D, Bruce MG, et al. Adverse outcomes in Alaska natives who recovered from or have chronic hepatitis C infection. Gastroenterology. 2010;138(3):922-931.e1.
59. Anand BS, Thornby J. Alcohol has no effect on hepatitis C virus replication: a meta-analysis. Gut. 2005;54(10):1468-1472.
60. Au DH, Kivlahan DR, Bryson CL, Blough D, Bradley KA. Alcohol screening scores and risk of hospitalizations for GI conditions in men. Alcohol Clin Exp Res. 2007;31(3):443-451.
61. Orman ES, Odena G, Bataller R. Alcoholic liver disease: pathogenesis, management, and novel targets for therapy. J Gastroenterol Hepatol. 2013;28(suppl 1):77-84.
62. Liu J, Lewohl JM, Harris RA, Dodd PR, Mayfield RD. Altered gene expression profiles in the frontal cortex of cirrhotic alcoholics. Alcohol Clin Exp Res. 2007;31(9):1460-1466.
63. Barve S, Kapoor R, Moghe A, et al. Focus on the liver: alcohol use, highly active antiretroviral therapy, and liver disease in HIV-infected patients. Alcohol Res Health. 2010;33(3):229-236.
64. Trimble G, Zheng L, Mishra A, Kalwaney S, Mir HM, Younossi ZM. Mortality associated with alcohol-related liver disease. Aliment Pharmacol Ther. 2013;38(6):596-602.
65. Loomba R, Yang HI, Su J, Brenner D, Iloeje U, Chen CJ. Obesity and alcohol synergize to increase the risk of incident hepatocellular carcinoma in men. Clin Gastroenterol Hepatol. 2010;8(10):891-898.e1-e2.
66. Zakhari S, Li TK. Determinants of alcohol use and abuse: impact of quantity and frequency patterns on liver disease. Hepatology. 2007;46(6):2032-2039.
67. Lim JK, Tate JP, Fultz SL, et al. Relationship between alcohol use categories and noninvasive markers of advanced hepatic fibrosis in HIV-infected, chronic hepatitis C virus-infected, and uninfected patients. Clin Infect Dis. 2014;58(10):1449-1458.
68. Kanwal F, White DL, Tavakoli-Tabasi S, et al. Many patients with interleukin 28B genotypes associated with response to therapy are ineligible for treatment because of comorbidities. Clin Gastroenterol Hepatol. 2014;12(2):327-333.e1.
69. Mehta SH, Thomas DL, Sulkowski MS, Safaein M, Vlahov D, Strathdee SA. A framework for understanding factors that affect access and utilization of treatment for hepatitis C virus infection among HCV-mono-infected and HIV/HCV-co-infected injection drug users. AIDS. 2005;19(suppl 3):S179-S189.
70. McLaren M, Garber G, Cooper C. Barriers to hepatitis C virus treatment in a Canadian HIV-hepatitis C virus coinfection tertiary care clinic. Can J Gastroenterol. 2008;22(2):133-137.
71. Treloar C, Rance J, Dore GJ, Grebely J; ETHOS Study Group. Barriers and facilitators for assessment and treatment of hepatitis C virus infection in the opioid substitution treatment setting: insights from the ETHOS study. J Viral Hepat. 2014;21(8):560-567.
72. Treloar C, Rance J, Grebely J, Dore GJ. Client and staff experiences of a co-located service for hepatitis C care in opioid substitution treatment settings in New South Wales, Australia. Drug Alcohol Depend. 2013;133(2):529-534.
73. Edlin BR, Kresina TF, Raymond DB, et al. Overcoming barriers to prevention, care, and treatment of hepatitis C in illicit drug users. Clin Infect Dis. 2005;40(suppl 5):S276-S285.
74. Martinez AD, Dimova R, Marks KM, et al. Integrated internist—addiction medicine— hepatology model for hepatitis C management for individuals on methadone maintenance. J Viral Hepat. 2012;19(1):47-54.
75. Fahey S. Developing a nursing service for patients with hepatitis C. Nurs Stand. 2007;21(43):35-40.
76. Knott A, Dieperink E, Willenbring ML, et al. Integrated psychiatric/medical care in a chronic hepatitis C clinic: effect on antiviral treatment evaluation and outcomes. Am J Gastroenterol. 2006;101(10):2254-2262.
77. Dieperink E, Ho SB, Heit S, Durfee JM, Thuras P, Willenbring ML. Significant reductions in drinking following brief alcohol treatment provided in a hepatitis C clinic. Psychosomatics. 2010;51(2):149-156.
78. Ho SB, Bräu N, Cheung R, et al. Integrated care increases treatment and improves outcomes of patients with chronic hepatitis C virus infection and psychiatric illness or substance abuse. Clin Gastroenterol Hepatol. 2015;13(11):2005-2014.e1-e3.
79. Groessl EJ, Liu L, Sklar M, Ho SB. HCV integrated care: a randomized trial to increase treatment initiation and SVR with direct acting antivirals. Int J Hepatol. 2017;2017:5834182.
80. Treloar C, Gray R, Brener L. A piece of the jigsaw of primary care: health professional perceptions of an integrated care model of hepatitis C management in the community. J Prim Health Care. 2014;6(2):129-134.
81. Brener L, Gray R, Cama EJ, Treloar C. “Makes you wanna do treatment”: benefits of a hepatitis C specialist clinic to clients in Christchurch, New Zealand. Health Soc Care Community. 2013;21(2):216-223.
82. Horwitz R, Brener L, Treloar C. Evaluation of an integrated care service facility for people living with hepatitis C in New Zealand. Int J Integr Care. 2012;12(Spec Ed Integrated Care Pathways):e229.
83. Christianson TM, Moralejo D. Assessing the quality of care in a regional integrated viral hepatitis clinic in British Columbia: a cross-sectional study. Gastroenterol Nurs. 2009;32(5):315-324.
84. Scaglioni F, Marino M, Ciccia S, et al. Short-term multidisciplinary non-pharmacological intervention is effective in reducing liver fat content assessed non-invasively in patients with nonalcoholic fatty liver disease (NAFLD). Clin Res Hepatol Gastroenterol. 2013;37(4):353-358.
85. Lau-Walker M, Presky J, Webzell I, Murrells T, Heaton N. Patients with alcohol-related liver disease—beliefs about their illness and factors that influence their self-management. J Adv Nurs. 2016;72(1):173-185.
86. Mikkelsen MR, Hendriksen C, Schiødt FV, Rydahl-Hansen S. Coping and rehabilitation in alcoholic liver disease patients after hepatic encephalopathy—in interaction with professionals and relatives. J Clin Nurs. 2015;24(23-24):3627-3637.
87. Moriarty KJ, Platt H, Crompton S, et al. Collaborative care for alcohol-related liver disease. Clin Med (Lond). 2007;7(2):125-128.
88. Khan A, Tansel A, White DL, et al. Efficacy of psychosocial interventions in inducing and maintaining alcohol abstinence in patients with chronic liver disease: a systematic review. Clin Gastroenterol Hepatol. 2016;14(2):191-202.e1-e4;quiz e20.
89. Wylie L, Hutchinson S, Liddell D, Rowan N. The successful implementation of Scotland’s Hepatitis C Action Plan: what can other European stakeholders learn from the experience? A Scottish voluntary sector perspective. BMC Infect Dis. 2014;14(suppl 6):S7.
90. Hull M, Shafran S, Wong A, et al. CIHR Canadian HIV trials network coinfection and concurrent diseases core research group: 2016 updated Canadian HIV/hepatitis C adult guidelines for management and treatment. Can J Infect Dis Med Microbiol. 2016;2016:4385643.
91. Bonner JE, Barritt AS 4th, Fried MW, Evon DM. Time to rethink antiviral treatment for hepatitis C in patients with coexisting mental health/substance abuse issues. Dig Dis Sci. 2012;57(6):1469-1474.
92. Rongey C, Asch S, Knight SJ. Access to care for vulnerable veterans with hepatitis C: a hybrid conceptual framework and a case study to guide translation. Transl Behav Med. 2011;1(4):644-651.
93. Zeiss AM, Karlin BE. Integrating mental health and primary care services in the Department of Veterans Affairs health care system. J Clin Psychol Med Settings. 2008;15(1):73-78.
94. Drumright LN, Hagan H, Thomas DL, et al. Predictors and effects of alcohol use on liver function among young HCV-infected injection drug users in a behavioral intervention. J Hepatol. 2011;55(1):45-52.
Hepatitis A Virus Prevention and Vaccination Within and Outside the VHA in Light of Recent Outbreaks (FULL)
Hepatitis A virus (HAV) can result in acute infection characterized by fatigue, nausea, jaundice (yellowing of the skin) and, rarely, acute liver failure and death.1,2 In the US, HAV yearly incidence (per 100,000) has decreased from 11.7 cases in 1996 to 0.4 cases in 2015, largely due to the 2006 recommendations from the Centers for Disease Control and Prevention (CDC) that all infants receive HAV vaccination.3,4
In 2017, multiple HAV outbreaks occurred in Arizona, California, Colorado, Kentucky, Michigan, and Utah with infections concentrated among those who were homeless, used illicit drugs (both injection and noninjection), or had close contact with these groups (Table 1).5-7 
In response, the CDC has recommended the administration of HAV vaccine or immune globulin (IG) as postexposure prophylaxis (PEP) to people in high-risk groups including unvaccinated individuals exposed to HAV within the prior 2 weeks.5 While the Veterans Health Administration (VHA) in the Department of Veteran’s Affairs (VA) has not noted a significant increase in the number of reported HAV infections, there have been cases of hospitalization within the VA health care system due to HAV in at least 2 of the outbreak areas. The VA facilities in outbreak areas are responding by supporting county disease-control measures that include ensuring handwashing stations and vaccinations for high-risk, in-care populations and employees in direct contact with patients at high risk for HAV.
This review provides information on HAV transmission and clinical manifestations, guidelines on the prevention of HAV infection, and baseline data on current HAV susceptibility and immunization rates in the VHA.
Transmission and Clinical Manifestations
Hepatitis A virus is primarily transmitted by ingestion of small amounts of infected stool (ie, fecal-oral route) via direct person-to-person contact or through exposure to contaminated food or water.9,10 Groups at high risk of HAV infection include those in direct contact with HAV-infected individuals, users of injection or non-injection drugs, men who have sex with men (MSM), travelers to high-risk countries, individuals with clotting disorders, and those who work with nonhuman primates.11 Individuals who are homeless are susceptible to HAV due to poor sanitary conditions, and MSM are at increased risk of HAV acquisition via exposure to infected stool during sexual activity.
Complications of acute HAV infection, including fulminant liver failure and death, are more common among patients infected with hepatitis B virus (HBV) or hepatitis C virus (HCV).12,13 While infection with HIV does not independently increase the risk of HAV acquisition, about 75% of new HIV infections in the US are among MSM or IV drug users who are at increased risk of HAV infection.14 In addition, duration of HAV viremia and resulting HAV transmissibility may be increased in HIV-infected individuals.15-17
After infection, HAV remains asymptomatic (the incubation period) for an average of 28 days with a range of 15 to 50 days.18,19 Most children younger than 6 years remain asymptomatic while older children and adults typically experience symptoms including fever, fatigue, poor appetite, abdominal pain, dark urine, clay-colored stools, and jaundice.2,20,21 Symptoms typically last less than 2 months but can persist or relapse for up to 6 months in 10% to 15% of symptomatic individuals.22,23 Those with HAV infection are capable of viral transmission from the beginning of the incubation period until about a week after jaundice appears.24 Unlike HBV and HCV, HAV does not cause chronic infection.
Fulminant liver failure, characterized by encephalopathy, jaundice, and elevated international normalized ratio (INR), occurs in < 1% of HAV infections and is more common in those with underlying liver disease and older individuals.13,25-27 In one retrospective review of fulminant liver failure from HAV infection, about half of the patients required liver transplantation or died within 3 weeks of presentation.12
Other than supportive care, there are no specific treatments for acute HAV infection. However, the CDC recommends that healthy individuals aged between 1 and 40 years with known or suspected exposure to HAV within the prior 2 weeks receive 1 dose of a single-antigen HAV vaccination. The CDC also recommends that recently exposed individuals aged < 1 year or > 40 years, or patients who are immunocompromised, have chronic liver disease (CLD), or are allergic to HAV vaccine or a vaccine component should receive a single IG injection. In addition, the CDC recommends that health care providers report all cases of acute HAV to state and local health departments.28
In patients with typical symptoms of acute viral hepatitis (eg, headache, fever, malaise, anorexia, nausea, vomiting, abdominal pain, and diarrhea) and either jaundice or elevated serum aminotransferase levels, confirmation of HAV infection is required with either a positive serologic test for immunoglobulin M (IgM) anti-HAV antibody or an epidemiologic link (eg, recent household or close contact) to a person with laboratory-confirmed HAV.5 Serum IgM anti-HAV antibodies are first detectable when symptoms begin and remain detectable for about 3 to 6 months.29,30 Serum immunoglobulin G (IgG) anti-HAV antibodies, which provide lifelong protection against reinfection, appear as symptoms improve and persist indefinitely.31,32 Therefore, the presence of anti-HAV IgG and the absence of anti-HAV IgM is indicative of immunity to HAV via past infection or vaccination.
HAV Prevention in The VHA
The mainstay of HAV prevention is vaccination with 2 doses of inactivated, single-antigen hepatitis A vaccine or 3 doses of combination (HAV and HBV) vaccine.11 Both single antigen and combination HAV vaccines are safe in immunocompromised and pregnant patients.33-39 The HAV vaccination results in 100% anti-HAV IgG seropositivity among healthy individuals, although immunogenicity might be lower for those who are immunocompromised or with CLD.31,40-47 The VHA recommends HAV immunization, unless contraindicated, for previously unvaccinated 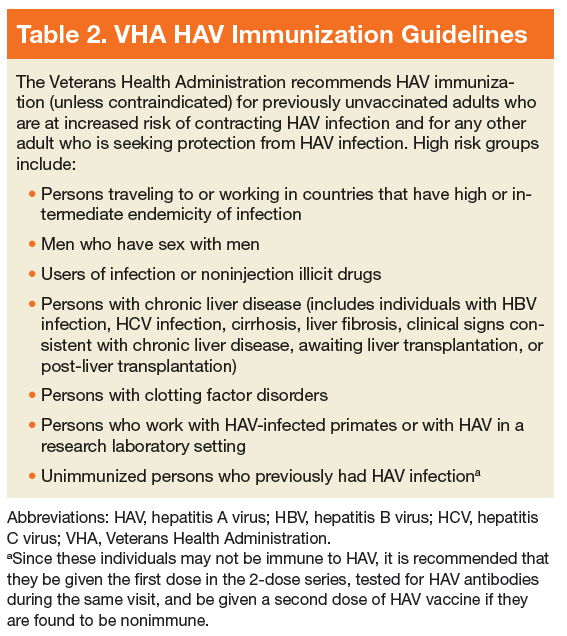
In addition to vaccination, addressing risk factors for HAV infection and its complications could reduce the burden of disease. For instance, recent outbreaks highlight that homeless individuals and users of injection and noninjection drugs are particularly vulnerable to infections transmitted via fecal-oral contamination. Broad strategies to address homelessness and related sanitation concerns are needed to help reduce the likelihood of future HAV outbreaks.49 Specific measures to combat HAV include providing access to clean water, adequate hygiene, and clean needles for people who inject drugs.11 Hepatitis A virus can be destroyed by heating food to ≥ 185 °F for at least 1 minute, chlorinating contaminated water, or cleaning contaminated surfaces with a solution of household bleach and water.50 Moreover, it is important to identify and treat risk factors for complications of HAV infection. This includes identifying individuals with HCV and ensuring that they are immune to HAV, given data that HCV-infected individuals are at increased risk of fulminant hepatic failure from HAV.12,13
Active-duty service members have long been considered at higher risk of HAV infections due to deployments in endemic areas and exposure to contaminated food and water.51,52 Shortly after the FDA approved HAV vaccination in 1995, the Department of Defense (DoD) mandated screening and HAV immunization for all incoming active-duty service members and those deployed to areas of high endemicity.53 However, US veterans who were discharged before the adoption of universal HAV vaccination remain at increased risk for HAV infection, particularly given the high prevalence of CLD, homelessness, and substance use disord
Methods
A cross-sectional analysis of veterans in VA care from June 1, 2016 to June 1, 2017 was performed to determine national rates of HAV susceptibility among patients with HCV exposure, homelessness, SUD, or HIV infection. The definitions of homelessness, SUD (alcohol, cannabis, opioid, sedatives, hallucinogens, inhalants, stimulants, or tobacco), and HIV infection were based on the presence of appropriate ICD-9 or ICD-10 codes. History of HCV exposure was based on a positive HCV antibody test. Presence of HAV vaccination was determined based on CPT codes for administration of the single-antigen HAV vaccination or combination HAV/HBV vaccination.
While HIV infection is not independently considered an indication for HAV vaccination, the authors included this group given its high proportion of patients with other risk factors, including MSM and IV drug use. All data were obtained from the VA Corporate Data Warehouse (CDW), a comprehensive national repository of all laboratory, diagnosis, and prescription results (including vaccines) within the VHA since 1999.
Hepatitis A virus nonsusceptibility was defined as (1) documented receipt of HAV vaccination within the VHA; (2) anti-HAV IgG antibody testing within the VHA; or (3) active-duty service after October 1997. It was considered likely that patients who received HAV testing either showed evidence of HAV immunity (eg, positive anti-HAV IgG) or were anti-HAV IgG negative and subsequently immunized. Therefore, patients with anti-HAV IgG antibody testing were counted presumptively as nonsusceptible. The DoD implemented a universal HAV vaccination policy in 1995, therefore, 1997 was chosen as a time at which the military’s universal HAV vaccination campaign was likely to have achieved near 100% vaccination coverage of active-duty military.
Results
The cohort included 5,896,451 patients in VA care, including 381,628 (6.5%) who were homeless, 455,344 (7.7%) with SUD, 225,889 (3.8%) with a lifetime history of positive HCV antibody (indicating past HCV exposure), and 29,166 (0.5%) with HIV infection. 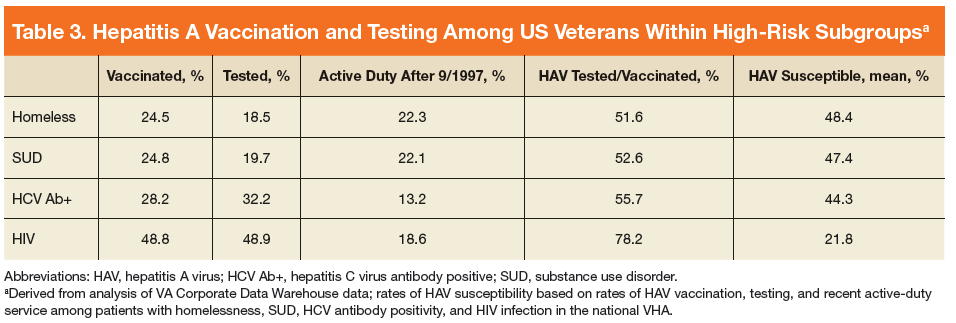
There was wide geographic variability in rates of HAV susceptibility (Figure 1). 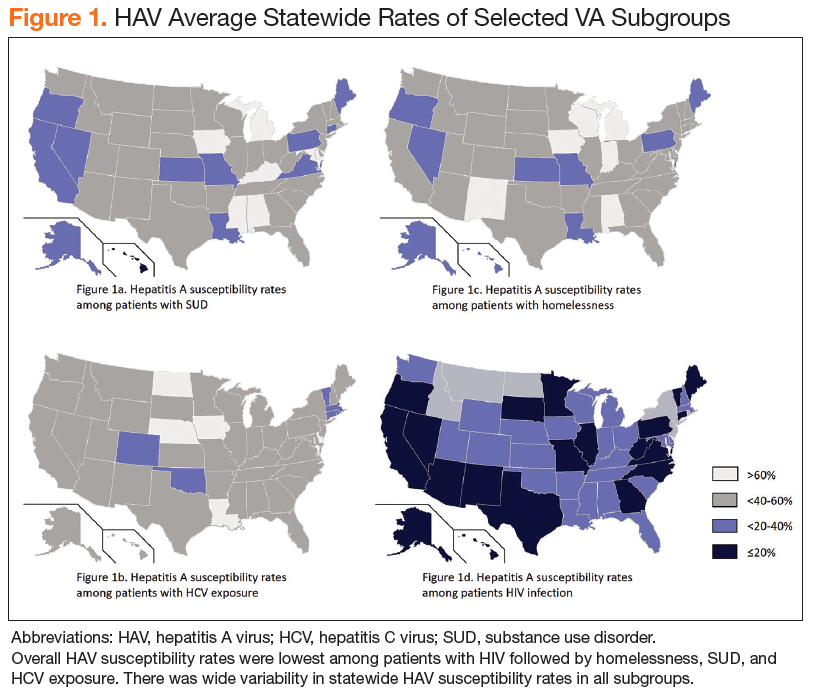
Discussion
Widespread HAV vaccination has decreased the incidence of HAV infection in the US dramatically. Nevertheless, recent outbreaks demonstrate that substantial population susceptibility and associated risk for HAV-related morbidity and mortality remains, particularly in high-risk populations. Although the VHA has not experienced a significant increase in acute HAV infections to date, this cross-sectional analysis highlights that a large proportion of VA patients in traditionally high-risk groups remain susceptible to HAV infection.
Strengths
Strengths of this analysis include a current reflection of HAV susceptibility within the national VHA, thus informing HAV testing and vaccination strategies. This study also involves a very large cohort, which is possible because the VHA is the largest integrated healthcare system in the US. Lastly, because the VHA uses electronic medical records, there was nearly complete capture of HAV vaccinations and testing obtained through the VHA.
Limitations
This cross-sectional analysis has several potential limitations. First, findings may not be generalizable outside the VHA. In addition, determination of homelessness, substance abuse, and HIV infection were based on ICD-9 and ICD-10 codes, which have been used in previous studies but may be subject to misclassification. The authors deliberately included all patients with positive HCV antibody testing to include those with current or prior risk factors for HAV acquisition. This population does not reflect patients with HCV viremia who received HAV testing or vaccination. Lastly, misattribution of HAV susceptibility could have occurred if patients with negative HAV IgG results were not vaccinated or if patients previously received HAV vaccination outside the VHA.
Conclusion
To mitigate the risk of future HAV outbreaks, continued efforts should be made to increase vaccination among high-risk groups, improve awareness of additional prevention measures, and address risk factors for HAV acquisition, particularly in areas with active outbreaks. Further study is suggested to identify geographic areas with large caseloads of at-risk patients and to highlight best practices utilized by VHA facilities that achieved high vaccine coverage rates. Recommended approaches likely will need to include efforts to improve hygiene and reduce risks for HAV exposure associated with SUD and homelessness.
Click here to read the digital edition.
1. Kemmer NM, Miskovsky EP. Hepatitis A. Infect Dis Clin North Am. 2000;14(3):605-615.
2. Tong MJ, el-Farra NS, Grew MI. Clinical manifestations of hepatitis A: recent experience in a community teaching hospital. J Infect Dis. 1995;171(suppl 1):S15-S18.
3. Murphy TV, Denniston MM, Hill HA, et al. Progress toward eliminating hepatitis a disease in the United States. MMWR Suppl. 2016;65(1):29-41.
4. Centers for Disease Control and Prevention. Viral hepatitis surveillance, United States, 2015. https://www.cdc.gov/hepatitis/statistics/2015surveillance/pdfs/2015HepSurveillanceRpt.pdf. Published 2015. Accessed February 12, 2018.
5. Centers for Disease Control and Prevention. 2017 – Outbreaks of hepatitis A in multiple states among people who are homeless and people who use drugs. https://www.cdc.gov/hepatitis/outbreaks/2017March-HepatitisA.htm. Updated February 7, 2018. Accessed February 12, 2018.
6. Hepatitis A cases more than double in 2017; if you’re at risk, get vaccinated [press release]. https://www.colorado.gov/pacific/cdphe/news/hep-a-cases-doubled. Published August 30,2017. Accessed February 12, 2018.
7. Alltucker K. Hepatitis A outbreak spread to Maricopa County homeless from San Diego, officials say. Azcentral website. October 7, 2017. https://www.azcentral.com/story/news/local /arizona-health/2017/10/07/hepatitis-outbreak-spread-maricopa-county-homeless-san-diego-officials-say/740185001/. Accessed February 12, 2018.
8. Savage RD, Rosella LC, Brown KA, Khan K, Crowcroft NS. Underreporting of hepatitis A in non-endemic countries: a systematic review and meta-analysis. BMC Infect Dis. 2016;16:281.
9. Purcell RH, Wong DC, Shapiro M. Relative infectivity of hepatitis A virus by the oral and intravenous routes in 2 species of nonhuman primates. J Infect Dis. 2002;185(11):1668-1671.
10. Tassopoulos NC, Papaevangelou GJ, Ticehurst JR, Purcell RH. Fecal excretion of Greek strains of hepatitis A virus in patients with hepatitis A and in experimentally infected chimpanzees. J Infect Dis. 1986;154(2):231-237.
11. Centers for Disease Control and Prevention. Hepatitis A questions and answers for health professionals. https://www.cdc.gov/hepatitis/hav/havfaq.htm. Updated November 8, 2017. Accessed February 12, 2018.
12. Taylor RM, Davern T, Munoz S, et al; US Acute Liver Failure Study Group. Fulminant hepatitis A virus infection in the United States: Incidence, prognosis, and outcomes. Hepatology. 2006;44(6):1589-1597.
13. Vento S, Garofano T, Renzini C, et al. Fulminant hepatitis associated with hepatitis A virus superinfection in patients with chronic hepatitis C. N Engl J Med. 1998;338(5):286-290.
14. Singh S, Johnson AS, McCray E, Hall HI. CDC - HIV incidence, prevalence and undiagnosed infections in men who have sex with men - HIV incidence decreased among all transmission categories except MSM. Conference on Retroviruses and Opportunistic Infections (CROI); February 13-16,2017; Seattle, WA. http://www .natap.org/2017/CROI/croi_116.htm. Accessed February 12, 2018.
15. Fonquernie L, Meynard JL, Charrois A, Delamare C, Meyohas MC, Frottier J. Occurrence of acute hepatitis A in patients infected with human immunodeficiency virus. Clin Infect Dis. 2001;32(2):297-299.
16. Ida S, Tachikawa N, Nakajima A, et al. Influence of human immunodeficiency virus type 1 infection on acute hepatitis A virus infection. Clin Infect Dis. 2002;34(3):379-385.
17. Costa-Mattioli M, Allavena C, Poirier AS, Billaudel S, Raffi F, Ferré V. Prolonged hepatitis A infection in an HIV-1 seropositive patient. J Med Virol. 2002;68(1):7-11.
18. Neefe JR, Gellis SS, Stokes J Jr. Homologous serum hepatitis and infectious (epidemic) hepatitis; studies in volunteers bearing on immunological and other characteristics of the etiological agents. Am J Med. 1946;1:3-22.
19. Krugman S, Giles JP, Hammond J. Infectious hepatitis. Evidence for two distinctive clinical, epidemiological, and immunological types of infection. JAMA. 1967;200(5):365-373.
20. Hadler SC, Webster HM, Erben JJ, Swanson JE, Maynard JE. Hepatitis A in day-care centers. A community-wide assessment. N Engl J Med. 1980;302(22):1222-1227.
21. Lednar WM, Lemon SM, Kirkpatrick JW, Redfield RR, Fields ML, Kelley PW. Frequency of illness associated with epidemic hepatitis A virus infections in adults. Am J Epidemiol. 1985;122(2):226-233.
22. Gordon SC, Reddy KR, Schiff L, Schiff ER. Prolonged intrahepatic cholestasis secondary to acute hepatitis A. Ann Intern Med. 1984;101(5):635-637.
23. Schiff ER. Atypical clinical manifestations of hepatitis A. Vaccine. 1992;10(suppl 1):S18-S20.
24. Richardson M, Elliman D, Maguire H, Simpson J, Nicoll A. Evidence base of incubation periods, periods of infectiousness and exclusion policies for the control of communicable diseases in schools and preschools. Pediatr Infect Dis J. 2001;20(4):380-391.
25. Willner IR, Uhl MD, Howard SC, Williams EQ, Riely CA, Waters B. Serious hepatitis A: an analysis of patients hospitalized during an urban epidemic in the United States. Ann Intern Med. 1998;128(2):111-114.
26. Rezende G, Roque-Afonso AM, Samuel D, et al. Viral and clinical factors associated with the fulminant course of hepatitis A infection. Hepatology. 2003;38(3):613-618.
27. Lemon SM. Type A viral hepatitis. New developments in an old disease. N Engl J Med. 1985;313(17):1059-1067.
28. Centers for Disease Control and Prevention. Guidelines for viral hepatitis surveillance and case management. https://www.cdc.gov/hepatitis/statistics/surveillance guidelines.htm. Updated May 31, 2015. Accessed February 8, 2018.
29. Kao HW, Ashcavai M, Redeker AG. The persistence of hepatitis A IgM antibody after acute clinical hepatitis A. Hepatology. 1984;4(5):933-936.
30. Liaw YF, Yang CY, Chu CM, Huang MJ. Appearance and persistence of hepatitis A IgM antibody in acute clinical hepatitis A observed in an outbreak. Infection. 1986;14(4):156-158.
31. Plumb ID, Bulkow LR, Bruce MG, et al. Persistence of antibody to Hepatitis A virus 20 years after receipt of Hepatitis A vaccine in Alaska. J Viral Hepat. 2017;24(7):608-612.
32. Koff RS. Clinical manifestations and diagnosis of hepatitis A virus infection. Vaccine. 1992;10 (suppl 1):S15-S17.
33. Clemens R, Safary A, Hepburn A, Roche C, Stanbury WJ, André FE. Clinical experience with an inactivated hepatitis A vaccine. J Infect Dis. 1995;171(suppl 1):S44-S49.
34. Ambrosch F, André FE, Delem A, et al. Simultaneous vaccination against hepatitis A and B: results of a controlled study. Vaccine. 1992;10(suppl 1):S142-S145.
35. Gil A, González A, Dal-Ré R, Calero JR. Interference assessment of yellow fever vaccine with the immune response to a single-dose inactivated hepatitis A vaccine (1440 EL.U.). A controlled study in adults. Vaccine. 1996;14(11):1028-1030.
36. Jong EC, Kaplan KM, Eves KA, Taddeo CA, Lakkis HD, Kuter BJ. An open randomized study of inactivated hepatitis A vaccine administered concomitantly with typhoid fever and yellow fever vaccines. J Travel Med. 2002;9(2):66-70.
37. Nolan T, Bernstein H, Blatter MM, et al. Immunogenicity and safety of an inactivated hepatitis A vaccine administered concomitantly with diphtheria-tetanus-acellular pertussis and haemophilus influenzae type B vaccines to children less than 2 years of age. Pediatrics. 2006;118(3):e602-e609.
38. Usonis V, Meriste S, Bakasenas V, et al. Immunogenicity and safety of a combined hepatitis A and B vaccine administered concomitantly with either a measles-mumps-rubella or a diphtheria-tetanus-acellular pertussis-inactivated poliomyelitis vaccine mixed with a Haemophilus influenzae type b conjugate vaccine in infants aged 12-18 months. Vaccine. 2005;23(20):2602-2606.
39. Moro PL, Museru OI, Niu M, Lewis P, Broder K. Reports to the Vaccine Adverse Event Reporting System after hepatitis A and hepatitis AB vaccines in pregnant women. Am J Obstet Gynecol. 2014;210(6):561.e1-561.e-6.
40. André FE, D’Hondt E, Delem A, Safary A. Clinical assessment of the safety and efficacy of an inactivated hepatitis A vaccine: rationale and summary of findings. Vaccine. 1992;10(suppl 1):S160-S168.
41. Just M, Berger R. Reactogenicity and immunogenicity of inactivated hepatitis A vaccines. Vaccine. 1992;10(suppl 1):S110-S113.
42. McMahon BJ, Williams J, Bulkow L, et al. Immunogenicity of an inactivated hepatitis A vaccine in Alaska Native children and Native and non-Native adults. J Infect Dis. 1995;171(3):676-679.
43. Balcarek KB, Bagley MR, Pass RF, Schiff ER, Krause DS. Safety and immunogenicity of an inactivated hepatitis A vaccine in preschool children. J Infect Dis. 1995;171(suppl 1):S70-S72.
44. Bell BP, Negus S, Fiore AE, et al. Immunogenicity of an inactivated hepatitis A vaccine in infants and young children. Pediatr Infect Dis J. 2007;26(2):116-122.
45. Arguedas MR, Johnson A, Eloubeidi MA, Fallon MB. Immunogenicity of hepatitis A vaccination in decompensated cirrhotic patients. Hepatology. 2001;34(1):28-31.
46. Overton ET, Nurutdinova D, Sungkanuparph S, Seyfried W, Groger RK, Powderly WG. Predictors of immunity after hepatitis A vaccination in HIV-infected persons. J Viral Hepat. 2007;14(3):189-193.
47. Askling HH, Rombo L, van Vollenhoven R, et al. Hepatitis A vaccine for immunosuppressed patients with rheumatoid arthritis: a prospective, open-label, multi-centre study. Travel Med Infect Dis. 2014;12(2):134-142.
48. US Department of Veterans Affairs. VHA national hepatitis A immunization guidelines. http://vaww.prevention.va.gov/CPS/Hepatitis_A_Immunization.asp. Nonpublic document. Source not verified.
49. Kushel M. Hepatitis A outbreak in California - addressing the root cause. N Engl J Med. 2018;378(3):211-213.
50. Millard J, Appleton H, Parry JV. Studies on heat inactivation of hepatitis A virus with special reference to shellfish. Part 1. Procedures for infection and recovery of virus from laboratory-maintained cockles. Epidemiol Infect. 1987;98(3):397-414.
51. Hoke CH, Jr., Binn LN, Egan JE, et al. Hepatitis A in the US Army: epidemiology and vaccine development. Vaccine. 1992;10(suppl 1):S75-S79.
52. Dooley DP. History of U.S. military contributions to the study of viral hepatitis. Mil Med. 2005;170(suppl 4):71-76.
53. Grabenstein JD, Pittman PR, Greenwood JT, Engler RJ. Immunization to protect the US Armed Forces: heritage, current practice, and prospects. Epidemiol Rev. 2006;28:3-26.
54. Beste LA, Leipertz SL, Green PK, Dominitz JA, Ross D, Ioannou GN. Trends in burden of cirrhosis and hepatocellular carcinoma by underlying liver disease in US veterans, 2001-2013. Gastroenterology. 2015;149(6):1471-1482.e1475; quiz e17-e18.
55. Fargo J, Metraux S, Byrne T, et al. Prevalence and risk of homelessness among US veterans. Prev Chronic Dis. 2012;9:E45.
56. Teeters JB, Lancaster CL, Brown DG, Back SE. Substance use disorders in military veterans: prevalence and treatment challenges. Subst Abuse Rehabil. 2017;8:69-77.
Hepatitis A virus (HAV) can result in acute infection characterized by fatigue, nausea, jaundice (yellowing of the skin) and, rarely, acute liver failure and death.1,2 In the US, HAV yearly incidence (per 100,000) has decreased from 11.7 cases in 1996 to 0.4 cases in 2015, largely due to the 2006 recommendations from the Centers for Disease Control and Prevention (CDC) that all infants receive HAV vaccination.3,4
In 2017, multiple HAV outbreaks occurred in Arizona, California, Colorado, Kentucky, Michigan, and Utah with infections concentrated among those who were homeless, used illicit drugs (both injection and noninjection), or had close contact with these groups (Table 1).5-7
In response, the CDC has recommended the administration of HAV vaccine or immune globulin (IG) as postexposure prophylaxis (PEP) to people in high-risk groups including unvaccinated individuals exposed to HAV within the prior 2 weeks.5 While the Veterans Health Administration (VHA) in the Department of Veteran’s Affairs (VA) has not noted a significant increase in the number of reported HAV infections, there have been cases of hospitalization within the VA health care system due to HAV in at least 2 of the outbreak areas. The VA facilities in outbreak areas are responding by supporting county disease-control measures that include ensuring handwashing stations and vaccinations for high-risk, in-care populations and employees in direct contact with patients at high risk for HAV.
This review provides information on HAV transmission and clinical manifestations, guidelines on the prevention of HAV infection, and baseline data on current HAV susceptibility and immunization rates in the VHA.
Transmission and Clinical Manifestations
Hepatitis A virus is primarily transmitted by ingestion of small amounts of infected stool (ie, fecal-oral route) via direct person-to-person contact or through exposure to contaminated food or water.9,10 Groups at high risk of HAV infection include those in direct contact with HAV-infected individuals, users of injection or non-injection drugs, men who have sex with men (MSM), travelers to high-risk countries, individuals with clotting disorders, and those who work with nonhuman primates.11 Individuals who are homeless are susceptible to HAV due to poor sanitary conditions, and MSM are at increased risk of HAV acquisition via exposure to infected stool during sexual activity.
Complications of acute HAV infection, including fulminant liver failure and death, are more common among patients infected with hepatitis B virus (HBV) or hepatitis C virus (HCV).12,13 While infection with HIV does not independently increase the risk of HAV acquisition, about 75% of new HIV infections in the US are among MSM or IV drug users who are at increased risk of HAV infection.14 In addition, duration of HAV viremia and resulting HAV transmissibility may be increased in HIV-infected individuals.15-17
After infection, HAV remains asymptomatic (the incubation period) for an average of 28 days with a range of 15 to 50 days.18,19 Most children younger than 6 years remain asymptomatic while older children and adults typically experience symptoms including fever, fatigue, poor appetite, abdominal pain, dark urine, clay-colored stools, and jaundice.2,20,21 Symptoms typically last less than 2 months but can persist or relapse for up to 6 months in 10% to 15% of symptomatic individuals.22,23 Those with HAV infection are capable of viral transmission from the beginning of the incubation period until about a week after jaundice appears.24 Unlike HBV and HCV, HAV does not cause chronic infection.
Fulminant liver failure, characterized by encephalopathy, jaundice, and elevated international normalized ratio (INR), occurs in < 1% of HAV infections and is more common in those with underlying liver disease and older individuals.13,25-27 In one retrospective review of fulminant liver failure from HAV infection, about half of the patients required liver transplantation or died within 3 weeks of presentation.12
Other than supportive care, there are no specific treatments for acute HAV infection. However, the CDC recommends that healthy individuals aged between 1 and 40 years with known or suspected exposure to HAV within the prior 2 weeks receive 1 dose of a single-antigen HAV vaccination. The CDC also recommends that recently exposed individuals aged < 1 year or > 40 years, or patients who are immunocompromised, have chronic liver disease (CLD), or are allergic to HAV vaccine or a vaccine component should receive a single IG injection. In addition, the CDC recommends that health care providers report all cases of acute HAV to state and local health departments.28
In patients with typical symptoms of acute viral hepatitis (eg, headache, fever, malaise, anorexia, nausea, vomiting, abdominal pain, and diarrhea) and either jaundice or elevated serum aminotransferase levels, confirmation of HAV infection is required with either a positive serologic test for immunoglobulin M (IgM) anti-HAV antibody or an epidemiologic link (eg, recent household or close contact) to a person with laboratory-confirmed HAV.5 Serum IgM anti-HAV antibodies are first detectable when symptoms begin and remain detectable for about 3 to 6 months.29,30 Serum immunoglobulin G (IgG) anti-HAV antibodies, which provide lifelong protection against reinfection, appear as symptoms improve and persist indefinitely.31,32 Therefore, the presence of anti-HAV IgG and the absence of anti-HAV IgM is indicative of immunity to HAV via past infection or vaccination.
HAV Prevention in The VHA
The mainstay of HAV prevention is vaccination with 2 doses of inactivated, single-antigen hepatitis A vaccine or 3 doses of combination (HAV and HBV) vaccine.11 Both single antigen and combination HAV vaccines are safe in immunocompromised and pregnant patients.33-39 The HAV vaccination results in 100% anti-HAV IgG seropositivity among healthy individuals, although immunogenicity might be lower for those who are immunocompromised or with CLD.31,40-47 The VHA recommends HAV immunization, unless contraindicated, for previously unvaccinated
In addition to vaccination, addressing risk factors for HAV infection and its complications could reduce the burden of disease. For instance, recent outbreaks highlight that homeless individuals and users of injection and noninjection drugs are particularly vulnerable to infections transmitted via fecal-oral contamination. Broad strategies to address homelessness and related sanitation concerns are needed to help reduce the likelihood of future HAV outbreaks.49 Specific measures to combat HAV include providing access to clean water, adequate hygiene, and clean needles for people who inject drugs.11 Hepatitis A virus can be destroyed by heating food to ≥ 185 °F for at least 1 minute, chlorinating contaminated water, or cleaning contaminated surfaces with a solution of household bleach and water.50 Moreover, it is important to identify and treat risk factors for complications of HAV infection. This includes identifying individuals with HCV and ensuring that they are immune to HAV, given data that HCV-infected individuals are at increased risk of fulminant hepatic failure from HAV.12,13
Active-duty service members have long been considered at higher risk of HAV infections due to deployments in endemic areas and exposure to contaminated food and water.51,52 Shortly after the FDA approved HAV vaccination in 1995, the Department of Defense (DoD) mandated screening and HAV immunization for all incoming active-duty service members and those deployed to areas of high endemicity.53 However, US veterans who were discharged before the adoption of universal HAV vaccination remain at increased risk for HAV infection, particularly given the high prevalence of CLD, homelessness, and substance use disord
Methods
A cross-sectional analysis of veterans in VA care from June 1, 2016 to June 1, 2017 was performed to determine national rates of HAV susceptibility among patients with HCV exposure, homelessness, SUD, or HIV infection. The definitions of homelessness, SUD (alcohol, cannabis, opioid, sedatives, hallucinogens, inhalants, stimulants, or tobacco), and HIV infection were based on the presence of appropriate ICD-9 or ICD-10 codes. History of HCV exposure was based on a positive HCV antibody test. Presence of HAV vaccination was determined based on CPT codes for administration of the single-antigen HAV vaccination or combination HAV/HBV vaccination.
While HIV infection is not independently considered an indication for HAV vaccination, the authors included this group given its high proportion of patients with other risk factors, including MSM and IV drug use. All data were obtained from the VA Corporate Data Warehouse (CDW), a comprehensive national repository of all laboratory, diagnosis, and prescription results (including vaccines) within the VHA since 1999.
Hepatitis A virus nonsusceptibility was defined as (1) documented receipt of HAV vaccination within the VHA; (2) anti-HAV IgG antibody testing within the VHA; or (3) active-duty service after October 1997. It was considered likely that patients who received HAV testing either showed evidence of HAV immunity (eg, positive anti-HAV IgG) or were anti-HAV IgG negative and subsequently immunized. Therefore, patients with anti-HAV IgG antibody testing were counted presumptively as nonsusceptible. The DoD implemented a universal HAV vaccination policy in 1995, therefore, 1997 was chosen as a time at which the military’s universal HAV vaccination campaign was likely to have achieved near 100% vaccination coverage of active-duty military.
Results
The cohort included 5,896,451 patients in VA care, including 381,628 (6.5%) who were homeless, 455,344 (7.7%) with SUD, 225,889 (3.8%) with a lifetime history of positive HCV antibody (indicating past HCV exposure), and 29,166 (0.5%) with HIV infection.
There was wide geographic variability in rates of HAV susceptibility (Figure 1).
Discussion
Widespread HAV vaccination has decreased the incidence of HAV infection in the US dramatically. Nevertheless, recent outbreaks demonstrate that substantial population susceptibility and associated risk for HAV-related morbidity and mortality remains, particularly in high-risk populations. Although the VHA has not experienced a significant increase in acute HAV infections to date, this cross-sectional analysis highlights that a large proportion of VA patients in traditionally high-risk groups remain susceptible to HAV infection.
Strengths
Strengths of this analysis include a current reflection of HAV susceptibility within the national VHA, thus informing HAV testing and vaccination strategies. This study also involves a very large cohort, which is possible because the VHA is the largest integrated healthcare system in the US. Lastly, because the VHA uses electronic medical records, there was nearly complete capture of HAV vaccinations and testing obtained through the VHA.
Limitations
This cross-sectional analysis has several potential limitations. First, findings may not be generalizable outside the VHA. In addition, determination of homelessness, substance abuse, and HIV infection were based on ICD-9 and ICD-10 codes, which have been used in previous studies but may be subject to misclassification. The authors deliberately included all patients with positive HCV antibody testing to include those with current or prior risk factors for HAV acquisition. This population does not reflect patients with HCV viremia who received HAV testing or vaccination. Lastly, misattribution of HAV susceptibility could have occurred if patients with negative HAV IgG results were not vaccinated or if patients previously received HAV vaccination outside the VHA.
Conclusion
To mitigate the risk of future HAV outbreaks, continued efforts should be made to increase vaccination among high-risk groups, improve awareness of additional prevention measures, and address risk factors for HAV acquisition, particularly in areas with active outbreaks. Further study is suggested to identify geographic areas with large caseloads of at-risk patients and to highlight best practices utilized by VHA facilities that achieved high vaccine coverage rates. Recommended approaches likely will need to include efforts to improve hygiene and reduce risks for HAV exposure associated with SUD and homelessness.
Click here to read the digital edition.
1. Kemmer NM, Miskovsky EP. Hepatitis A. Infect Dis Clin North Am. 2000;14(3):605-615.
2. Tong MJ, el-Farra NS, Grew MI. Clinical manifestations of hepatitis A: recent experience in a community teaching hospital. J Infect Dis. 1995;171(suppl 1):S15-S18.
3. Murphy TV, Denniston MM, Hill HA, et al. Progress toward eliminating hepatitis a disease in the United States. MMWR Suppl. 2016;65(1):29-41.
4. Centers for Disease Control and Prevention. Viral hepatitis surveillance, United States, 2015. https://www.cdc.gov/hepatitis/statistics/2015surveillance/pdfs/2015HepSurveillanceRpt.pdf. Published 2015. Accessed February 12, 2018.
5. Centers for Disease Control and Prevention. 2017 – Outbreaks of hepatitis A in multiple states among people who are homeless and people who use drugs. https://www.cdc.gov/hepatitis/outbreaks/2017March-HepatitisA.htm. Updated February 7, 2018. Accessed February 12, 2018.
6. Hepatitis A cases more than double in 2017; if you’re at risk, get vaccinated [press release]. https://www.colorado.gov/pacific/cdphe/news/hep-a-cases-doubled. Published August 30,2017. Accessed February 12, 2018.
7. Alltucker K. Hepatitis A outbreak spread to Maricopa County homeless from San Diego, officials say. Azcentral website. October 7, 2017. https://www.azcentral.com/story/news/local /arizona-health/2017/10/07/hepatitis-outbreak-spread-maricopa-county-homeless-san-diego-officials-say/740185001/. Accessed February 12, 2018.
8. Savage RD, Rosella LC, Brown KA, Khan K, Crowcroft NS. Underreporting of hepatitis A in non-endemic countries: a systematic review and meta-analysis. BMC Infect Dis. 2016;16:281.
9. Purcell RH, Wong DC, Shapiro M. Relative infectivity of hepatitis A virus by the oral and intravenous routes in 2 species of nonhuman primates. J Infect Dis. 2002;185(11):1668-1671.
10. Tassopoulos NC, Papaevangelou GJ, Ticehurst JR, Purcell RH. Fecal excretion of Greek strains of hepatitis A virus in patients with hepatitis A and in experimentally infected chimpanzees. J Infect Dis. 1986;154(2):231-237.
11. Centers for Disease Control and Prevention. Hepatitis A questions and answers for health professionals. https://www.cdc.gov/hepatitis/hav/havfaq.htm. Updated November 8, 2017. Accessed February 12, 2018.
12. Taylor RM, Davern T, Munoz S, et al; US Acute Liver Failure Study Group. Fulminant hepatitis A virus infection in the United States: Incidence, prognosis, and outcomes. Hepatology. 2006;44(6):1589-1597.
13. Vento S, Garofano T, Renzini C, et al. Fulminant hepatitis associated with hepatitis A virus superinfection in patients with chronic hepatitis C. N Engl J Med. 1998;338(5):286-290.
14. Singh S, Johnson AS, McCray E, Hall HI. CDC - HIV incidence, prevalence and undiagnosed infections in men who have sex with men - HIV incidence decreased among all transmission categories except MSM. Conference on Retroviruses and Opportunistic Infections (CROI); February 13-16,2017; Seattle, WA. http://www .natap.org/2017/CROI/croi_116.htm. Accessed February 12, 2018.
15. Fonquernie L, Meynard JL, Charrois A, Delamare C, Meyohas MC, Frottier J. Occurrence of acute hepatitis A in patients infected with human immunodeficiency virus. Clin Infect Dis. 2001;32(2):297-299.
16. Ida S, Tachikawa N, Nakajima A, et al. Influence of human immunodeficiency virus type 1 infection on acute hepatitis A virus infection. Clin Infect Dis. 2002;34(3):379-385.
17. Costa-Mattioli M, Allavena C, Poirier AS, Billaudel S, Raffi F, Ferré V. Prolonged hepatitis A infection in an HIV-1 seropositive patient. J Med Virol. 2002;68(1):7-11.
18. Neefe JR, Gellis SS, Stokes J Jr. Homologous serum hepatitis and infectious (epidemic) hepatitis; studies in volunteers bearing on immunological and other characteristics of the etiological agents. Am J Med. 1946;1:3-22.
19. Krugman S, Giles JP, Hammond J. Infectious hepatitis. Evidence for two distinctive clinical, epidemiological, and immunological types of infection. JAMA. 1967;200(5):365-373.
20. Hadler SC, Webster HM, Erben JJ, Swanson JE, Maynard JE. Hepatitis A in day-care centers. A community-wide assessment. N Engl J Med. 1980;302(22):1222-1227.
21. Lednar WM, Lemon SM, Kirkpatrick JW, Redfield RR, Fields ML, Kelley PW. Frequency of illness associated with epidemic hepatitis A virus infections in adults. Am J Epidemiol. 1985;122(2):226-233.
22. Gordon SC, Reddy KR, Schiff L, Schiff ER. Prolonged intrahepatic cholestasis secondary to acute hepatitis A. Ann Intern Med. 1984;101(5):635-637.
23. Schiff ER. Atypical clinical manifestations of hepatitis A. Vaccine. 1992;10(suppl 1):S18-S20.
24. Richardson M, Elliman D, Maguire H, Simpson J, Nicoll A. Evidence base of incubation periods, periods of infectiousness and exclusion policies for the control of communicable diseases in schools and preschools. Pediatr Infect Dis J. 2001;20(4):380-391.
25. Willner IR, Uhl MD, Howard SC, Williams EQ, Riely CA, Waters B. Serious hepatitis A: an analysis of patients hospitalized during an urban epidemic in the United States. Ann Intern Med. 1998;128(2):111-114.
26. Rezende G, Roque-Afonso AM, Samuel D, et al. Viral and clinical factors associated with the fulminant course of hepatitis A infection. Hepatology. 2003;38(3):613-618.
27. Lemon SM. Type A viral hepatitis. New developments in an old disease. N Engl J Med. 1985;313(17):1059-1067.
28. Centers for Disease Control and Prevention. Guidelines for viral hepatitis surveillance and case management. https://www.cdc.gov/hepatitis/statistics/surveillance guidelines.htm. Updated May 31, 2015. Accessed February 8, 2018.
29. Kao HW, Ashcavai M, Redeker AG. The persistence of hepatitis A IgM antibody after acute clinical hepatitis A. Hepatology. 1984;4(5):933-936.
30. Liaw YF, Yang CY, Chu CM, Huang MJ. Appearance and persistence of hepatitis A IgM antibody in acute clinical hepatitis A observed in an outbreak. Infection. 1986;14(4):156-158.
31. Plumb ID, Bulkow LR, Bruce MG, et al. Persistence of antibody to Hepatitis A virus 20 years after receipt of Hepatitis A vaccine in Alaska. J Viral Hepat. 2017;24(7):608-612.
32. Koff RS. Clinical manifestations and diagnosis of hepatitis A virus infection. Vaccine. 1992;10 (suppl 1):S15-S17.
33. Clemens R, Safary A, Hepburn A, Roche C, Stanbury WJ, André FE. Clinical experience with an inactivated hepatitis A vaccine. J Infect Dis. 1995;171(suppl 1):S44-S49.
34. Ambrosch F, André FE, Delem A, et al. Simultaneous vaccination against hepatitis A and B: results of a controlled study. Vaccine. 1992;10(suppl 1):S142-S145.
35. Gil A, González A, Dal-Ré R, Calero JR. Interference assessment of yellow fever vaccine with the immune response to a single-dose inactivated hepatitis A vaccine (1440 EL.U.). A controlled study in adults. Vaccine. 1996;14(11):1028-1030.
36. Jong EC, Kaplan KM, Eves KA, Taddeo CA, Lakkis HD, Kuter BJ. An open randomized study of inactivated hepatitis A vaccine administered concomitantly with typhoid fever and yellow fever vaccines. J Travel Med. 2002;9(2):66-70.
37. Nolan T, Bernstein H, Blatter MM, et al. Immunogenicity and safety of an inactivated hepatitis A vaccine administered concomitantly with diphtheria-tetanus-acellular pertussis and haemophilus influenzae type B vaccines to children less than 2 years of age. Pediatrics. 2006;118(3):e602-e609.
38. Usonis V, Meriste S, Bakasenas V, et al. Immunogenicity and safety of a combined hepatitis A and B vaccine administered concomitantly with either a measles-mumps-rubella or a diphtheria-tetanus-acellular pertussis-inactivated poliomyelitis vaccine mixed with a Haemophilus influenzae type b conjugate vaccine in infants aged 12-18 months. Vaccine. 2005;23(20):2602-2606.
39. Moro PL, Museru OI, Niu M, Lewis P, Broder K. Reports to the Vaccine Adverse Event Reporting System after hepatitis A and hepatitis AB vaccines in pregnant women. Am J Obstet Gynecol. 2014;210(6):561.e1-561.e-6.
40. André FE, D’Hondt E, Delem A, Safary A. Clinical assessment of the safety and efficacy of an inactivated hepatitis A vaccine: rationale and summary of findings. Vaccine. 1992;10(suppl 1):S160-S168.
41. Just M, Berger R. Reactogenicity and immunogenicity of inactivated hepatitis A vaccines. Vaccine. 1992;10(suppl 1):S110-S113.
42. McMahon BJ, Williams J, Bulkow L, et al. Immunogenicity of an inactivated hepatitis A vaccine in Alaska Native children and Native and non-Native adults. J Infect Dis. 1995;171(3):676-679.
43. Balcarek KB, Bagley MR, Pass RF, Schiff ER, Krause DS. Safety and immunogenicity of an inactivated hepatitis A vaccine in preschool children. J Infect Dis. 1995;171(suppl 1):S70-S72.
44. Bell BP, Negus S, Fiore AE, et al. Immunogenicity of an inactivated hepatitis A vaccine in infants and young children. Pediatr Infect Dis J. 2007;26(2):116-122.
45. Arguedas MR, Johnson A, Eloubeidi MA, Fallon MB. Immunogenicity of hepatitis A vaccination in decompensated cirrhotic patients. Hepatology. 2001;34(1):28-31.
46. Overton ET, Nurutdinova D, Sungkanuparph S, Seyfried W, Groger RK, Powderly WG. Predictors of immunity after hepatitis A vaccination in HIV-infected persons. J Viral Hepat. 2007;14(3):189-193.
47. Askling HH, Rombo L, van Vollenhoven R, et al. Hepatitis A vaccine for immunosuppressed patients with rheumatoid arthritis: a prospective, open-label, multi-centre study. Travel Med Infect Dis. 2014;12(2):134-142.
48. US Department of Veterans Affairs. VHA national hepatitis A immunization guidelines. http://vaww.prevention.va.gov/CPS/Hepatitis_A_Immunization.asp. Nonpublic document. Source not verified.
49. Kushel M. Hepatitis A outbreak in California - addressing the root cause. N Engl J Med. 2018;378(3):211-213.
50. Millard J, Appleton H, Parry JV. Studies on heat inactivation of hepatitis A virus with special reference to shellfish. Part 1. Procedures for infection and recovery of virus from laboratory-maintained cockles. Epidemiol Infect. 1987;98(3):397-414.
51. Hoke CH, Jr., Binn LN, Egan JE, et al. Hepatitis A in the US Army: epidemiology and vaccine development. Vaccine. 1992;10(suppl 1):S75-S79.
52. Dooley DP. History of U.S. military contributions to the study of viral hepatitis. Mil Med. 2005;170(suppl 4):71-76.
53. Grabenstein JD, Pittman PR, Greenwood JT, Engler RJ. Immunization to protect the US Armed Forces: heritage, current practice, and prospects. Epidemiol Rev. 2006;28:3-26.
54. Beste LA, Leipertz SL, Green PK, Dominitz JA, Ross D, Ioannou GN. Trends in burden of cirrhosis and hepatocellular carcinoma by underlying liver disease in US veterans, 2001-2013. Gastroenterology. 2015;149(6):1471-1482.e1475; quiz e17-e18.
55. Fargo J, Metraux S, Byrne T, et al. Prevalence and risk of homelessness among US veterans. Prev Chronic Dis. 2012;9:E45.
56. Teeters JB, Lancaster CL, Brown DG, Back SE. Substance use disorders in military veterans: prevalence and treatment challenges. Subst Abuse Rehabil. 2017;8:69-77.
Necrotizing Infection of the Upper Extremity: A Veterans Affairs Medical Center Experience (2008-2017)
Necrotizing infection of the extremity is a rare but potentially lethal diagnosis with a mortality rate in the range of 17% to 35%.1-4 The plastic surgery service at the Malcom Randall Veterans Affairs Medical Center (MRVAMC) treats all hand emergencies, including upper extremity infection, in the North Florida/South Georgia Veterans Heath System. There has been a well-coordinated emergency hand care system in place for several years that includes specialty templates on the electronic health record, pre-existing urgent clinic appointments, and single service surgical specialty care.5 This facilitates a fluid line of communication between primary care, emergency department (ED) providers, and surgical specialties. The objective of the study was to evaluate our identification, treatment, and outcome of these serious infections.
Methods
The MRVAMC Institutional Review Board approved a retrospective review of necrotizing infection of the upper extremity treated at the facility by the plastic surgery service. Surgical cases over a 9-year period (June 5, 2008-June 5, 2017) were identified by CPT (current procedural technology) codes for amputation and/or debridement of the upper extremity. The charts were reviewed for evidence of necrotizing infection by clinical description or pathology report. The patients’ age, sex, etiology, comorbidities from their problem list, vitals, and laboratory results were recorded upon arrival at the hospital. Time from presentation to surgery, treatment, and outcomes were recorded.
Results
Ten patients were treated for necrotizing infection of the upper extremity over a 9-year period; all were men with an average age of 64 years. Etiologies included nail biting, “bug bites,” crush injuries, burns, suspected IV drug use, and unknown. Nine of 10 patients had diabetes mellitus (DM). Most did not show evidence of hemodynamic instability on hospital arrival (Table). One patient was hypotensive with a mean arterial blood pressure < 65 mm Hg, 2 had heart rates > 100 beats/min, 1 patient had a temperature > 38° C, and 7 had elevated white blood cell (WBC) counts ranging from 11 to 24 k/cmm. Two undiagnosed patients with DM (patients 1 and 8) expressed no complaints of pain and presented with blood glucose > 450 mg/dL with hemoglobin A1c levels > 12%.
Infectious disease and critical care services were involved in the treatment of several cases when requested. A computed tomography (CT) scan was used in 2 of the patients (patients 1 and 4) to assist in the diagnosis (Figure 1). 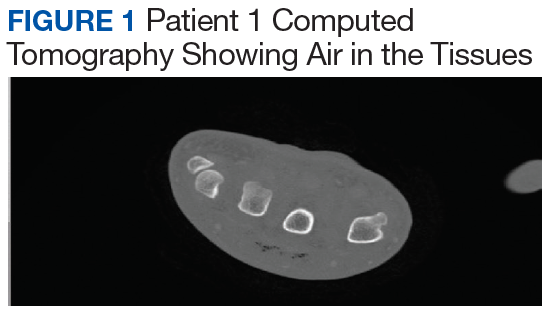
Seven patients out of 10 were treated with surgery within 24 hours on hospital arrival. The severity of the pathology was not initially recognized in 2 of the patients earlier in the review. A third patient resisted surgical treatment until the second hospital day. Four patients had from 1 to 3 digital amputations, 2 patients had wrist disarticulations, and 1 had a distal forearm amputation. 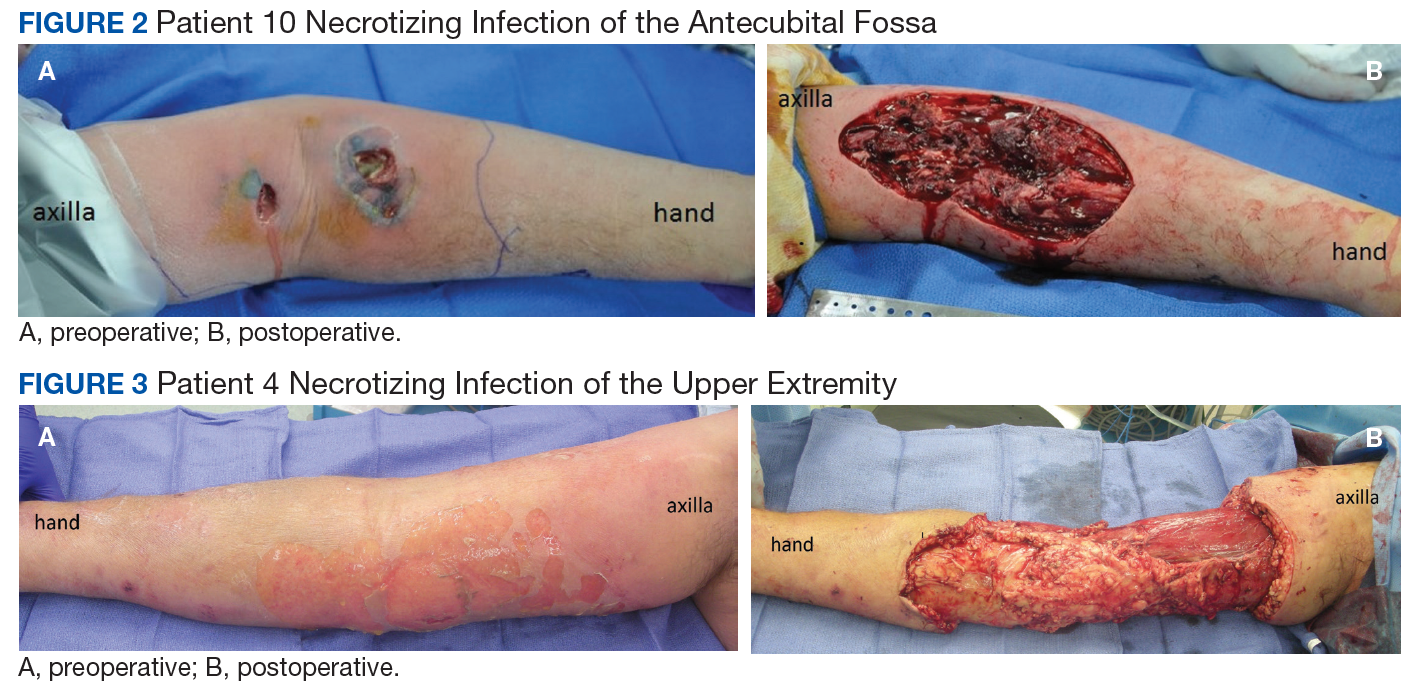
Antibiotics were managed by critical care, hospitalist, or infectious disease services and adjusted once final cultures were returned (Table). 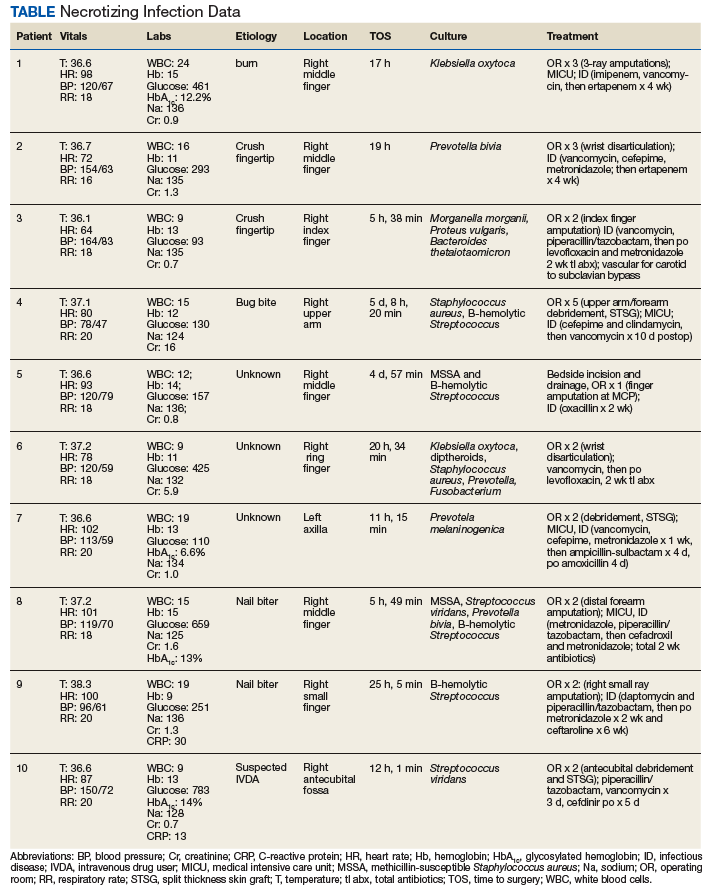
Discussion
Necrotizing infection of the upper extremity is a rare pathology with a substantial risk of amputation and mortality that requires a high index of suspicion and expeditious referral to a hand surgeon. It is well accepted that the key to survival is prompt surgical debridement of all necrotic tissue, ideally within 24 hours of hospital arrival.2-4,6 Death is usually secondary to sepsis.3 The classic presentation of pain out of proportion to exam, hypotension, erythema, skin necrosis, elevated WBC count, and fever may not be present and can delay diagnosis.1-4,6
DM is the most common comorbidity, and reviews have found the disease occurs more often in males, both which are consistent with our study.1-3 Diabetic infections have been found to be more likely to present as necrotizing infection than are nondiabetic infections and be at a higher risk for amputation.7 The patients with the wrist disarticulations and forearm amputation had DM. A minor trauma can be a portal for infection, which can be monomicrobial or polymicrobial.1,4 Once the diagnosis is suspected, prompt resuscitation, surgical debridement, IV antibiotics, and early intensive care are lifesaving. Hyperbaric oxygen is not available at MRVAMC and was not pursued as a transfer request due to its controversial benefit.6
There were no perioperative 30-day mortalities over a 9-year period in patients identified as having necrotizing infection of the upper extremity. This is attributed to an aggressive and well-coordinated, multisystem approach involving emergency, surgical, anesthesia, intensive care, and infectious disease services.
The hand trauma triage system in place at MRVAMC was started in 2008 and presented at the 38th Annual VA Surgeons Meeting in New Haven, Connecticut. The process starts at the level of the ED, urgent care or primary care provider and facilitates rapid access to subspecialty care by reducing unnecessary phone calls and appointment wait times.
All hand emergencies are covered by the plastic surgery service rather than the traditional split coverage between orthopedics and plastic surgery. This provides consistency and continuity for the patients and staff. The electronic health record consult template gives specific instructions to contact the on-call plastic surgeon. The resident/fellow gets called if patient is in-house, and faculty is called if the patient is outside the main hospital. The requesting provider gets instructions on treatment and follow-up. Clinic profiles have appointments reserved for urgent consults during the first hour so that patients can be sent to pre-anesthesia clinic or hand therapy, depending on the diagnosis. This triage system increased our hand trauma volume by a multiple of 6 between 2008 and 2012 but cut the appointment wait time > 1 week by half, as a percentage of consults, and did not significantly increase after-hour use of the operating room. The number of faculty and trainees stayed the same.
We did find that speed to diagnosis for necrotizing infection is an area that can be improved on with a higher clinical suspicion. There is a learning curve to the diagnosis and treatment, which can be prolonged when the index cases do not present themselves often and the patients do not appear in distress. This argues for consistency in hand-specific trauma coverage. The patients were most often initially seen by the resident and examined by a faculty member within hours. There were 4 different plastic surgery faculty involved in these cases, and they all included resident participation before, during, and after surgery. Debridement consists of wide local excision to bleeding tissue. Author review of the operative notes found the numbers of trips to the operating room for debridement can be reduced as the surgeon becomes more confident in the diagnosis and management, resulting in less “whittling” and a more definitive debridement, resulting in a faster recovery.
The LRINEC (Laboratory Risk Indicator for Necrotizing Fasciitis) is a tool that helps to distinguish necrotizing infection from other forms of soft tissue infection by using a point system for laboratory values that include C-reactive protein (CRP), white blood count, hemoglobin, sodium, creatinine, and glucose values.8 We do not routinely request CRP results, but 1 of the 2 patients (patient 9) who had the full complement of laboratory tests would have met high-risk criteria. The diagnostic accuracy of this tool has been questioned9; however, the authors welcome any method that can rapidly and noninvasively assist in getting the patient proper attention.
The patients were not seen for long-term follow-up, but some did return to the main hospital or clinic for other pathology and were pleased to show off their grip strength after a 3-ray amputation (patient 1) and aesthetics after upper arm and forearm debridement and skin graft reconstruction (patient 4, Figure 4). 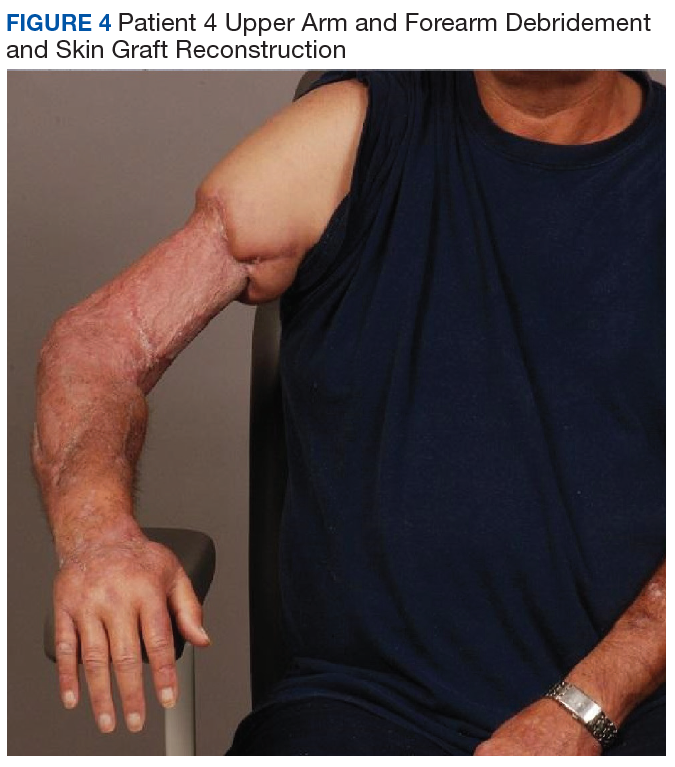
A single-ray amputation can be expected to result in a loss of grip and pinch strength, about 43.3% and 33.6%, respectively; however, given the alternative of further loss of life or limb, this was considered a reasonable trade-off.10 One wrist disarticulation and the forearm amputation were seen by amputee clinic for prosthetic fitting many months after the amputations once the wounds were healed and edema had subsided.
Conclusion
A well-coordinated multidisciplinary effort was the key to successful identification and treatment of this serious life- and limb-threatening infection at our institution. We did identify room for improvement in making an earlier diagnosis and performing a more aggressive first debridement.
Acknowledgments
This project is the result of work supported with resources and use of facilities at the Malcom Randall VA Medical Center in Gainesville, Florida.
1. Angoules AG, Kontakis G, Drakoulakis E, Vrentzos G, Granick MS, Giannoudis PV. Necrotizing fasciitis of upper and lower limb: a systemic review. Injury. 2007;38(suppl 5):S19-S26.
2. Chauhan A, Wigton MD, Palmer BA. Necrotizing fasciitis. J Hand Surg Am. 2014;39(8):1598-1601.
3. Cheng NC, SU YM, Kuo YS, Tai HC, Tang YB. Factors affecting the mortality of necrotizing fasciitis involving the upper extremities. Surg Today. 2008;38(12):1108-1113.
4. Sunderland IR, Friedrich JB. Predictors of mortality and limb loss in necrotizing soft tissue infections of the upper extremity. J Hand Surg Am. 2009;34(10):1900-1901.
5. Coady-Fariborzian L, McGreane A. Comparison of hand emergency triage before and after specialty templates (2007 vs 2012). Hand (N Y). 2015;10(2):215-220.
6. Stevens D, Bryant A. Necrotizing soft-tissue infections. N Engl J Med. 2017;377(23):2253-2265.
7. Sharma K, Pan D, Friedman J, Yu JL, Mull A, Moore AM. Quantifying the effect of diabetes on surgical hand and forearm infections. J Hand Surg Am. 2018;43(2):105-114.
8. Wong CH, Khin LW, Heng KS, Tan KC, Low CO. The LRINEC (Laboratory Risk Indicator for Necrotizing Fasciitis) score: a tool for distinguishing necrotizing fasciitis from other soft tissue infections. Crit Care Med. 2004;32(7):1535-1541.
9. Fernando SM, Tran A, Cheng W, et al. Necrotizing soft tissue infection: diagnostic accuracy of physical examination, imaging, and LRINEC score: a systematic review and meta-analysis. Ann Surg. 2019;269(1):58-65. 10. Bhat AK, Acharya AM, Narayanakurup JK, Kumar B, Nagpal PS, Kamath A. Functional and cosmetic outcome of single-digit ray amputation in hand. Musculoskelet Surg. 2017;101(3):275-281.
Necrotizing infection of the extremity is a rare but potentially lethal diagnosis with a mortality rate in the range of 17% to 35%.1-4 The plastic surgery service at the Malcom Randall Veterans Affairs Medical Center (MRVAMC) treats all hand emergencies, including upper extremity infection, in the North Florida/South Georgia Veterans Heath System. There has been a well-coordinated emergency hand care system in place for several years that includes specialty templates on the electronic health record, pre-existing urgent clinic appointments, and single service surgical specialty care.5 This facilitates a fluid line of communication between primary care, emergency department (ED) providers, and surgical specialties. The objective of the study was to evaluate our identification, treatment, and outcome of these serious infections.
Methods
The MRVAMC Institutional Review Board approved a retrospective review of necrotizing infection of the upper extremity treated at the facility by the plastic surgery service. Surgical cases over a 9-year period (June 5, 2008-June 5, 2017) were identified by CPT (current procedural technology) codes for amputation and/or debridement of the upper extremity. The charts were reviewed for evidence of necrotizing infection by clinical description or pathology report. The patients’ age, sex, etiology, comorbidities from their problem list, vitals, and laboratory results were recorded upon arrival at the hospital. Time from presentation to surgery, treatment, and outcomes were recorded.
Results
Ten patients were treated for necrotizing infection of the upper extremity over a 9-year period; all were men with an average age of 64 years. Etiologies included nail biting, “bug bites,” crush injuries, burns, suspected IV drug use, and unknown. Nine of 10 patients had diabetes mellitus (DM). Most did not show evidence of hemodynamic instability on hospital arrival (Table). One patient was hypotensive with a mean arterial blood pressure < 65 mm Hg, 2 had heart rates > 100 beats/min, 1 patient had a temperature > 38° C, and 7 had elevated white blood cell (WBC) counts ranging from 11 to 24 k/cmm. Two undiagnosed patients with DM (patients 1 and 8) expressed no complaints of pain and presented with blood glucose > 450 mg/dL with hemoglobin A1c levels > 12%.
Infectious disease and critical care services were involved in the treatment of several cases when requested. A computed tomography (CT) scan was used in 2 of the patients (patients 1 and 4) to assist in the diagnosis (Figure 1).
Seven patients out of 10 were treated with surgery within 24 hours on hospital arrival. The severity of the pathology was not initially recognized in 2 of the patients earlier in the review. A third patient resisted surgical treatment until the second hospital day. Four patients had from 1 to 3 digital amputations, 2 patients had wrist disarticulations, and 1 had a distal forearm amputation.
Antibiotics were managed by critical care, hospitalist, or infectious disease services and adjusted once final cultures were returned (Table).
Discussion
Necrotizing infection of the upper extremity is a rare pathology with a substantial risk of amputation and mortality that requires a high index of suspicion and expeditious referral to a hand surgeon. It is well accepted that the key to survival is prompt surgical debridement of all necrotic tissue, ideally within 24 hours of hospital arrival.2-4,6 Death is usually secondary to sepsis.3 The classic presentation of pain out of proportion to exam, hypotension, erythema, skin necrosis, elevated WBC count, and fever may not be present and can delay diagnosis.1-4,6
DM is the most common comorbidity, and reviews have found the disease occurs more often in males, both which are consistent with our study.1-3 Diabetic infections have been found to be more likely to present as necrotizing infection than are nondiabetic infections and be at a higher risk for amputation.7 The patients with the wrist disarticulations and forearm amputation had DM. A minor trauma can be a portal for infection, which can be monomicrobial or polymicrobial.1,4 Once the diagnosis is suspected, prompt resuscitation, surgical debridement, IV antibiotics, and early intensive care are lifesaving. Hyperbaric oxygen is not available at MRVAMC and was not pursued as a transfer request due to its controversial benefit.6
There were no perioperative 30-day mortalities over a 9-year period in patients identified as having necrotizing infection of the upper extremity. This is attributed to an aggressive and well-coordinated, multisystem approach involving emergency, surgical, anesthesia, intensive care, and infectious disease services.
The hand trauma triage system in place at MRVAMC was started in 2008 and presented at the 38th Annual VA Surgeons Meeting in New Haven, Connecticut. The process starts at the level of the ED, urgent care or primary care provider and facilitates rapid access to subspecialty care by reducing unnecessary phone calls and appointment wait times.
All hand emergencies are covered by the plastic surgery service rather than the traditional split coverage between orthopedics and plastic surgery. This provides consistency and continuity for the patients and staff. The electronic health record consult template gives specific instructions to contact the on-call plastic surgeon. The resident/fellow gets called if patient is in-house, and faculty is called if the patient is outside the main hospital. The requesting provider gets instructions on treatment and follow-up. Clinic profiles have appointments reserved for urgent consults during the first hour so that patients can be sent to pre-anesthesia clinic or hand therapy, depending on the diagnosis. This triage system increased our hand trauma volume by a multiple of 6 between 2008 and 2012 but cut the appointment wait time > 1 week by half, as a percentage of consults, and did not significantly increase after-hour use of the operating room. The number of faculty and trainees stayed the same.
We did find that speed to diagnosis for necrotizing infection is an area that can be improved on with a higher clinical suspicion. There is a learning curve to the diagnosis and treatment, which can be prolonged when the index cases do not present themselves often and the patients do not appear in distress. This argues for consistency in hand-specific trauma coverage. The patients were most often initially seen by the resident and examined by a faculty member within hours. There were 4 different plastic surgery faculty involved in these cases, and they all included resident participation before, during, and after surgery. Debridement consists of wide local excision to bleeding tissue. Author review of the operative notes found the numbers of trips to the operating room for debridement can be reduced as the surgeon becomes more confident in the diagnosis and management, resulting in less “whittling” and a more definitive debridement, resulting in a faster recovery.
The LRINEC (Laboratory Risk Indicator for Necrotizing Fasciitis) is a tool that helps to distinguish necrotizing infection from other forms of soft tissue infection by using a point system for laboratory values that include C-reactive protein (CRP), white blood count, hemoglobin, sodium, creatinine, and glucose values.8 We do not routinely request CRP results, but 1 of the 2 patients (patient 9) who had the full complement of laboratory tests would have met high-risk criteria. The diagnostic accuracy of this tool has been questioned9; however, the authors welcome any method that can rapidly and noninvasively assist in getting the patient proper attention.
The patients were not seen for long-term follow-up, but some did return to the main hospital or clinic for other pathology and were pleased to show off their grip strength after a 3-ray amputation (patient 1) and aesthetics after upper arm and forearm debridement and skin graft reconstruction (patient 4, Figure 4).
A single-ray amputation can be expected to result in a loss of grip and pinch strength, about 43.3% and 33.6%, respectively; however, given the alternative of further loss of life or limb, this was considered a reasonable trade-off.10 One wrist disarticulation and the forearm amputation were seen by amputee clinic for prosthetic fitting many months after the amputations once the wounds were healed and edema had subsided.
Conclusion
A well-coordinated multidisciplinary effort was the key to successful identification and treatment of this serious life- and limb-threatening infection at our institution. We did identify room for improvement in making an earlier diagnosis and performing a more aggressive first debridement.
Acknowledgments
This project is the result of work supported with resources and use of facilities at the Malcom Randall VA Medical Center in Gainesville, Florida.
1. Angoules AG, Kontakis G, Drakoulakis E, Vrentzos G, Granick MS, Giannoudis PV. Necrotizing fasciitis of upper and lower limb: a systemic review. Injury. 2007;38(suppl 5):S19-S26.
2. Chauhan A, Wigton MD, Palmer BA. Necrotizing fasciitis. J Hand Surg Am. 2014;39(8):1598-1601.
3. Cheng NC, SU YM, Kuo YS, Tai HC, Tang YB. Factors affecting the mortality of necrotizing fasciitis involving the upper extremities. Surg Today. 2008;38(12):1108-1113.
4. Sunderland IR, Friedrich JB. Predictors of mortality and limb loss in necrotizing soft tissue infections of the upper extremity. J Hand Surg Am. 2009;34(10):1900-1901.
5. Coady-Fariborzian L, McGreane A. Comparison of hand emergency triage before and after specialty templates (2007 vs 2012). Hand (N Y). 2015;10(2):215-220.
6. Stevens D, Bryant A. Necrotizing soft-tissue infections. N Engl J Med. 2017;377(23):2253-2265.
7. Sharma K, Pan D, Friedman J, Yu JL, Mull A, Moore AM. Quantifying the effect of diabetes on surgical hand and forearm infections. J Hand Surg Am. 2018;43(2):105-114.
8. Wong CH, Khin LW, Heng KS, Tan KC, Low CO. The LRINEC (Laboratory Risk Indicator for Necrotizing Fasciitis) score: a tool for distinguishing necrotizing fasciitis from other soft tissue infections. Crit Care Med. 2004;32(7):1535-1541.
9. Fernando SM, Tran A, Cheng W, et al. Necrotizing soft tissue infection: diagnostic accuracy of physical examination, imaging, and LRINEC score: a systematic review and meta-analysis. Ann Surg. 2019;269(1):58-65. 10. Bhat AK, Acharya AM, Narayanakurup JK, Kumar B, Nagpal PS, Kamath A. Functional and cosmetic outcome of single-digit ray amputation in hand. Musculoskelet Surg. 2017;101(3):275-281.
Effects of Insomnia and Depression on CPAP Adherence in a Military Population
Continuous positive airway pressure therapy (CPAP) is the first-line treatment for obstructive sleep apnea (OSA) recommended by the American College of Physicians and the American Academy of Sleep Medicine.1,2 CPAP reduces the apnea hypopnea index (AHI), improves oxyhemoglobin desaturation, and reduces cortical arousals associated with apneic/hypopneic events.3 Despite being an effective treatment for OSA, a significant limitation of CPAP is treatment adherence. Factors associated with CPAP adherence include disease and patient characteristics, perceived self-efficacy, treatment titration procedure, device technology factors, adverse effects, and psychosocial factors.4
Recent studies suggest that insomnia and depression may be associated with OSA. According to a review by Luyster and colleagues, insomnia is present in 39% to 58% of patients with OSA.5 Since OSA may disturb sleep by the number of nightly awakenings, OSA may cause or worsen insomnia. Furthermore, insomnia may exacerbate sleep apnea thus impeding the effectiveness of sleep apnea treatment.
In some studies, the presence of insomnia symptoms prior to initiating CPAP treatment has been found to be associated with reduced CPAP adherence. For example, in 2010, Wickwire and colleagues found that there was a negative association with the average nightly minutes of CPAP use for those patients with OSA that reported symptoms of sleep maintenance insomnia.6 This was not found for those patients with OSA who reported symptoms of sleep onset insomnia or reported no insomnia at all. In another study by Pieh and colleagues, self-reported insomnia symptoms were predictive of CPAP adherence (defined as < 4 hours use/night) at a 6-month follow-up.7 However, results from a separate study indicated that insomnia was not associated with 6-month CPAP adherence.8
Depressive symptoms are commonly reported by patients with OSA, and higher rates of depressive symptomatology in patients with OSA have been observed in a number of prevalence studies when compared with the general population.9,10 Between 15% and 56% of patients with OSA are diagnosed with a depressive disorder compared with 6.6% of the general population.11 OSA may be causally related with depression or coexist as a separate disorder. Apnea severity has been shown to exacerbate depressive symptoms, and treatment with CPAP can improve depressive symptoms.12,13 Unfortunately, depression has been found to reduce CPAP adherence. For example, Law and colleagues found that depression was independently associated with poorer adherence during home-based auto-PAP titration.14 Furthermore, in a study by Gurlanick and colleagues, depressive symptoms were independently associated with reduced CPAP adherence in surgical patients with OSA.15
To the best of our knowledge, the combined impact of both insomnia and depression on CPAP adherence has not been investigated. In military populations this may be especially important as CPAP adherence has been reported to be worse in military patients with posttraumatic stress disorder (PTSD) and other psychiatric disorders, and there are increasing rates of insomnia and OSA in the military.16,17 We hypothesize that active-duty and retired military patients with self-reported insomnia and depression will have reduced short and long-term CPAP adherence.
Methods
This is a retrospective cohort study that reviewed charts of active-duty and retired military members diagnosed with OSA by the Sleep Medicine Clinic at Naval Medical Center San Diego in California using a home sleep test (HST). The HSTs were interpreted by board-certified physicians in sleep medicine. Prior to the HST, all patients completed a sleep questionnaire that included self-reports of daytime sleepiness, using the Epworth Sleepiness Scale (ESS), depression using the Center for Epidemiologic Studies Depression Scale (CES-D) and insomnia using the Insomnia Severity Index (ISI).
The study population included active-duty and veteran patients diagnosed with OSA who chose treatment with a CPAP and attended the sleep clinic’s OSA educational class, which discussed the diagnosis and treatment of OSA. Inclusion criteria were patients aged > 18 years and diagnosed with OSA at the Naval Medical Center San Diego sleep lab between June 2014 and June 2015.
The study population was stratified into 4 groups: (1) those with OSA but no self-reported depression or insomnia; (2) those with OSA and self-reported depression but no insomnia; (3) those with OSA and insomnia but no depression; and (4) those with OSA and self-reported depression and insomnia. Charts were excluded from the review if there were incomplete data or if the patient selected an alternative treatment for OSA, such as an oral appliance. A total of 120 charts were included in the final review. This study was approved by the Naval Medical Center San Diego Institutional Review Board.
Data Collection
Data collected included the individual’s age, sex, minimum oxygen saturation during sleep, body mass index (BMI), height, weight, ESS score at time of diagnosis, date of HST, and date of attendance at the clinic’s OSA group treatment class. Diagnosis of OSA was based on the patient’s ≥ 5 AHI. OSA severity was divided into mild (AHI 5-14), moderate (AHI 15-29), or severe (AHI ≥ 30). A patient with a CES-D score > 14 was considered to have clinically significant depression, and a patient with an ISI score of > 14 was considered to have clinically significant insomnia. ISI is a reliable and valid instrument to quantify perceived insomnia severity.18 The CES-D was used only as an indicator of symptoms relating to depression, not to clinically diagnose depression. It also has been used extensively to investigate levels of depression without a psychiatric diagnosis.19
Follow-up CPAP adherence was collected at 3- and 12-month intervals after the date of the patient’s OSA treatment group class and included AHI, median pressure setting, median days used, average time used per night, and percentage of days used for more than 4 hours for the previous 30 days. Data were obtained through Sleep Data and ResMed websites, which receive patient adherence data directly from the patient’s CPAP device. Patients were considered to be adherent with CPAP usage based on the Medicare definition: Use of the CPAP device > 4 hours per night for at least 70% of nights during a 30-day period). The 3-month time frame was used as a short interval because that is when patients are seen in the pulmonary clinic for their initial follow-up appointment. Patients are seen again at 12 months because durable medical equipment supplies must be reordered after 12 months, which requires a patient visit.
Statistical Analysis
Linear regression methods were used to characterize any potential relationships between the predictor variables and the target outcome variables associated with CPAP adherence at 3 and 12 months. Scatterplots were produced to assess whether linear structure was sufficient to characterize any detectable relationships, or whether there existed more complex, nonlinear relationships. The best-fitting linear regression line was examined in relation to the confidence bands of the corresponding LOESS line to determine whether a more complicated model structure was needed to capture the relationship.
Standard tests of assumptions required for these methods were also carried out: QQ plots of residuals to test for normality, the Durbin-Watson test for independence of residuals, and the nonconstant variance score test for heteroskedasticity (ie, Breusch-Pagan test). The results of these assumptions tests are reported only in cases in which the assumptions were revealed to be untenable. In cases in which suspicious outlying observations may have biased analyses, robust versions of the corresponding models were constructed. In no cases did the resulting conclusions change; only the results of the original analysis are reported. All analyses were carried out in R (R Foundation, r-project.org). Statistical significance was defined as P < .05.
Results
Our study population was predominately male (90%) with a median age of 41 years (range 22-65) and BMI of 29.8 (range 7.7-57.2)(Table 1). 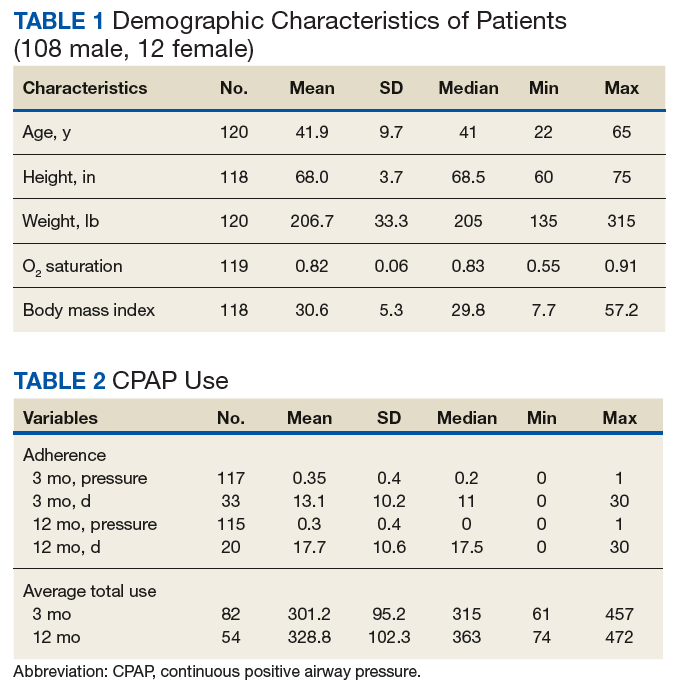
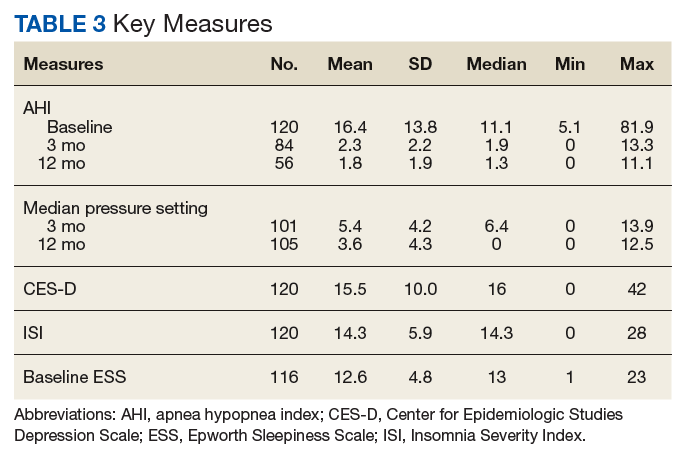
Predictors of CPAP Adherence
OSA severity, as measured by the AHI, was the only promising predictor of CPAP use at 3 months (b, 2.128; t80, 2.854; P = .005; adjusted R2, 0.081). The severity of self-reported daytime sleepiness prior to a diagnosis of OSA, as measured by the ESS, did not predict 3-month CPAP adherence (b, 0.688; t77, 0.300; P = .765; adjusted R2, -0.012). Self-reported depression as measured by the CES-D also did not predict CPAP use at 3 months (b, -0.078; t80, -0.014; P = .941; adjusted R2, -0.012). Similarly, self-reported insomnia, as measured by the ISI, did not predict 3-month CPAP adherence (b, 1.765; t80, 0.939; P = .350; adjusted R2, -0.001). Furthermore, a model that incorporated both depression and insomnia proved no better at accounting for variation in 3-month CPAP use (R2, -0.012). Demographic variables, such as age, sex, or BMI did not predict 3-month CPAP adherence (all Ps > .20). Finally, median CPAP pressure approached statistical significance as a predictor of 3-month CPAP adherence (b, 9.493; t66, 1.881; P = .064; adjusted R2, 0.037) (Figure 1). 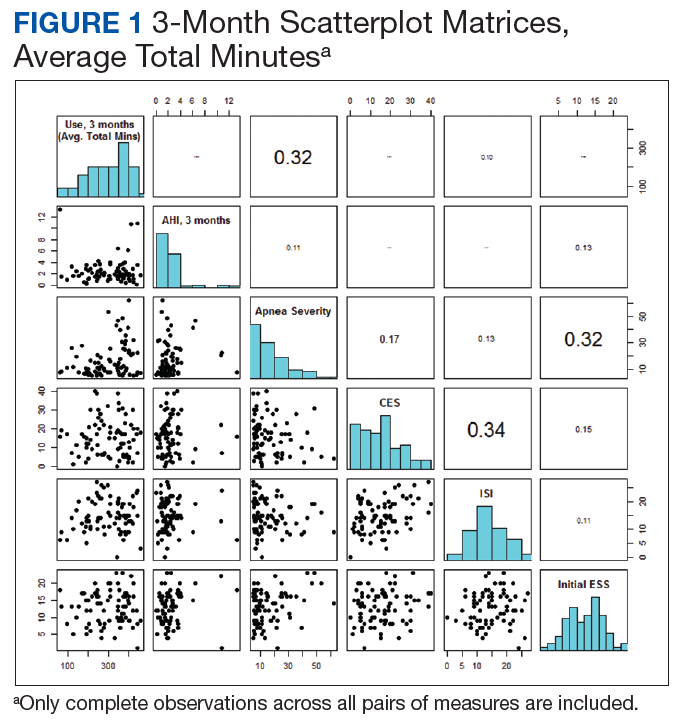
CPAP Use at 12 months
The results for CPAP use at 12 months mirrored the results for 3 months with one main exception: OSA severity, as measured by the AHI, did not predict CPAP use at 12 months (b, 1.158; t52, 1.245; P = .219; adjusted R2, 0.010). Neither adding a quadratic predictor nor log transforming the AHI values produced a better model (R2, -0.0007 vs R2, 0.0089, respectively). The severity of self-reported daytime sleepiness, as measured by the ESS, did not predict 12-month CPAP adherence (b, -2.201; t50, -0.752; P = .456; adjusted R2 = -0.0086). Self-reported depression as measured by the CES-D also did not predict CPAP use at 12 months (b, 0.034, t52, 0.022; P = .983; adjusted R2, -0.092). Self-reported insomnia, as measured by the ISI, also did not predict 12-month CPAP adherence (b, 1.765; t80, 0.939; P = .350; adjusted R2 = -0.001). Furthermore, a model that incorporated both depression and insomnia proved no better at accounting for variation in 12-month CPAP use, (R2, -0.0298). 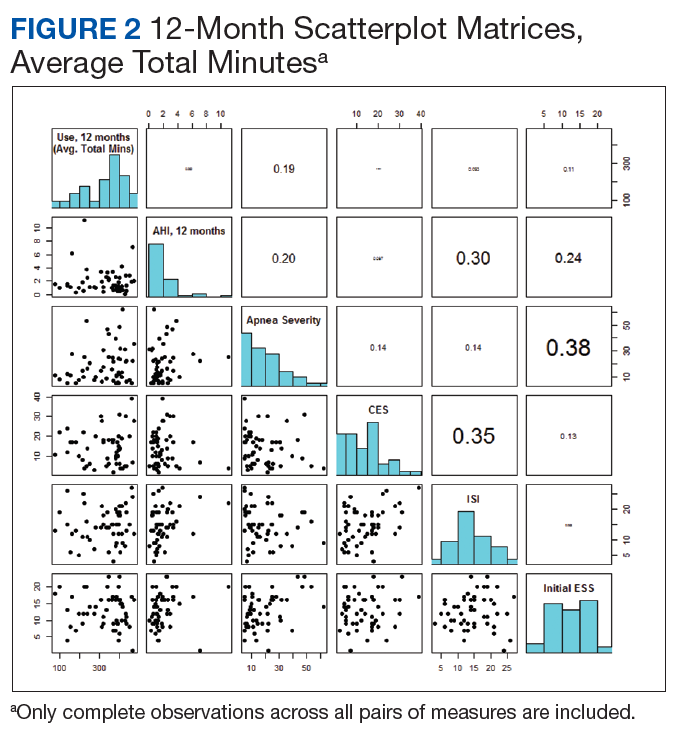
Discussion
Our study did not provide evidence that self-reported depressive and insomnia symptoms, as measured by the CES-D and ISI, can serve as useful predictors of short and long-term CPAP adherence in a sample of active-duty and retired military. OSA severity, as measured by the AHI, was the only promising predictor of CPAP adherence at 3 months.
Insomnia has been shown to improve with the use of CPAP. In a pilot study, Krakow and colleagues investigated the use of CPAP, oral appliances, or bilateral turbinectomy on patients with OSA and chronic insomnia.20 Objective measures of insomnia improved with 1 night of CPAP titration. Björnsdóttir and colleagues evaluated the long-term effects of positive airway pressure (PAP) treatment on 705 adults with middle insomnia.21 They found after 2 years of PAP treatment combined with cognitive behavioral therapy for insomnia, patients had reduced symptoms of middle insomnia. It is possible that persistent insomnia is associated with more severe OSA which was not studied in our population.22
As reported in other studies, it is possible that patients with depressive symptoms can improve with CPAP use, suggesting that depression and CPAP use are not totally unrelated. Edwards and colleagues studied the impact of CPAP on depressive symptoms in men and woman. They found that depressive symptoms are common in OSA and markedly improve with CPAP.23 Bopparaju and colleagues found a high prevalence of anxiety and depression in patients with OSA but did not influence CPAP adherence.24
The results of this study differ from some previous findings where depression was found to predict CPAP adherence.10 This may be due in part to differences in the type of instrument used to assess depression. Wells and colleagues found that baseline depressive symptoms did not correlate with CPAP adherence and that patients with greater CPAP adherence had improvement in OSA and depressive symptoms.25 Furthermore, patients with residual OSA symptoms using CPAP had more depressive symptoms, suggesting that it is the improvement in OSA symptoms that may be correlated with the improvement in depressive symptoms. Although soldiers with PTSD may have reduced CPAP adherence, use of CPAP is associated with improvement in PTSD symptoms.11,26
Limitations
This study had several limitations, including a small sample size. Study patients were also from a single institution, and the majority of patients had mild-to-moderate OSA. A multicenter prospective study with a larger sample size that included more severe patients with OSA may have shown different results. The participants in this study were limited to members from the active-duty and retired military population. The findings in this population may not be transferrable to the general public. Another study limitation was that the ISI and the CES-D were only administered prior to the initiation of CPAP. If the CES-D and ISI were administered at the 3- and 12-month follow-up visits, we could determine whether short and long-term CPAP improved these symptoms or whether there was no association between CPAP adherence with insomnia and depressive symptoms. Another limitation is that we did not have access to information about potential PTSD symptomatology, which has been associated with reduced CPAP adherence and is more common in a military and veteran population.11
Conclusion
This study found little evidence that symptoms of depression and insomnia are useful predictors of CPAP adherence, in either short- or long-term use, in an active-duty and retired military sample. Although these were not found to be predictors of CPAP adherence, further research will be necessary to determine whether CPAP adherence improves symptoms of depression and insomnia in military and veteran populations. Apnea severity did predict CPAP adherence in the short term, but not for any length of time beyond 3 months. More research is needed to explore strategies to improve CPAP adherence in military populations.
1. Qaseem A, Holty JE, Owens DK, Dallas P, Starkey M, Shekelle P; Clinical Guidelines Committee of the American College of Physicians. Management of obstructive sleep apnea in adults: a clinical practice guideline from the American College of Physicians. Ann Intern Med. 2013;159(7):471-483.
2. Epstein LJ, Kristo D, Strollo PJ, et al; Adult Obstructive Sleep Apnea Task Force of the American Academy of Sleep Medicine. Clinical guideline for the evaluation, management and long-term care of obstructive sleep apnea in adults. J Clin Sleep Med. 2009;5(3):263-276.
3. Gay P, Weaver T, Loube D, Iber C; Positive Airway Pressure Task Force; Standards of Practice Committee; American Academy of Sleep Medicine. Evaluation of positive airway pressure treatment for sleep-related breathing disorders in adults. Sleep. 2006;29(3):381-401.
4. Sawyer AM, Gooneratne NS, Marcus CL, Ofer D, Richards KC, Weaver T. A systematic review of CPAP adherence across age groups: clinical and empiric insights for developing CPAP adherence interventions. Sleep Med Rev. 2011;15(6):343-356.
5. Luyster FS; Buysse DJ; Strollo PJ. Comorbid insomnia and obstructive sleep apnea: challenges for clinical practice and research. J Clin Sleep Med. 2010;6(2):196-204.
6. Wickwire EM, Smith MT, Birnbaum S, Collop NA. Sleep maintenance insomnia complaints predict poor CPAP adherence: a clinical case series. Sleep Med. 2010;11(8):772-776
7. Pieh C, Bach M, Popp R, et al. Insomnia symptoms influence CPAP compliance. Sleep Breath. 2013;17(1):99-104.
8. Nguyên XL, Chaskalovic J, Rakotonanahary D, Fleury B. Insomnia symptoms and CPAP compliance in OSAS patients: a descriptive study using data mining methods. Sleep Med. 2010;11(8):777-784.
9. Yilmaz E, Sedky K, Bennett DS. The relationship between depressive symptoms and obstructive sleep apnea in pediatric populations: a meta-analysis. J Clin Sleep Med. 2013;9(11):1213-1220.
10. Chen YH, Keller JK, Kang JH, Hsieh HJ, Lin HC. Obstructive sleep apnea and the subsequent risk of depressive disorder: a population-based follow-up study. J Clin Sleep Med. 2013;9(5):417-423.
11. Kessler RC, Berglund P, Demler O, et al; National Comorbidity Survey Replication. The epidemiology of major depressive disorder: results from the National Comorbidity Survey Replication (NCS-R). JAMA. 2003:289(23):3095-3105
12. Harris M, Glozier N, Ratnavadivel R, Grunstein RR. Obstructive sleep apnea and depression. Sleep Med Rev. 2009;13(6):437-444.
13. Schwartz D, Kohler W, Karatinos G. Symptoms of depression in individuals with obstructive sleep apnea may be amendable to treatment with continuous positive airway pressure. Chest. 2005;128(3):1304-1309
14. Law M, Naughton M, Ho S, Roebuck T, Dabscheck E. Depression may reduce adherence during CPAP titration trial. J Clin Sleep Med. 2014;10(2):163-169.
15. Guralnick AS, Pant M, Minhaj M, Sweitzer BJ, Mokhlesi B. CPAP adherence in patients with newly diagnosed obstructive sleep apnea prior to elective surgery. J Clin Sleep Med. 2012;8(5):501-506
16. Collen JF, Lettieri CJ, Hoffman M. The impact of posttraumatic stress disorder on CPAP adherence in patients with obstructive sleep apnea. J Clin Sleep Med. 2012;8(6):667-672.
17. Caldwell A, Knapik JJ, Lieberman HR. Trends and factors associated with insomnia and sleep apnea in all United States military service members from 2005 to 2014. J Sleep Res. 2017;26(5):665-670.
18. Bastien CH, Vallières A, Morin CM. Validation of the Insomnia Severity Index as an outcome measure for insomnia research. Sleep Med. 2001;2(4):297-307.
19. Radloff LS. The CES-D scale: a self-report depression scale for research in the general population. Appl Psychological Measurement. 1977;1(3):385-401.
20. Krakow B, Melendrez D, Lee SA, Warner TD, Clark JO, Sklar D. Refractory insomnia and sleep-disordered breathing: a pilot study. Sleep Breath. 2004;8(1):15-29.
21. Björnsdóttir E, Janson C, Sigurdsson JF, et al. Symptoms of insomnia among patients with obstructive sleep apnea before and after two years of positive airway pressure treatment. Sleep. 2013;36(12):1901-1909.
22. Glidewell RN, Renn BN, Roby E, Orr WC. Predictors and patterns of insomnia symptoms in OSA before and after PAP therapy. Sleep Med. 2014;15(8):899-905.
23. Edwards C, Mukherjee S, Simpson L, Palmer LJ, Almeida OP, Hillman DR. Depressive symptoms before and after treatment of obstructive sleep apnea in men and women. J Clin Sleep Med. 2015;11(9):1029-1038.
24. Bopparaju S, Casturi L, Guntupalli B, Surani S, Subramanian S. Anxiety and depression in obstructive sleep apnea: Effect of CPAP therapy and influence on CPAP compliance. Presented at: American College of Chest Physicians Annual Meeting, October 31-November 05, 2009; San Diego, CA. Chest. 2009;136(4, meeting abstracts):71S.
25. Wells RD, Freedland KE, Carney RM, Duntley SP, Stepanski EJ. Adherence, reports of benefits, and depression among patients treated with continuous positive airway pressure. Psychosom Med. 2007;69(5):449-454.
26. Orr JE, Smales C, Alexander TH, et al. Treatment of OSA with CPAP is associated with improvement in PTSD symptoms among veterans. J Clin Sleep Med. 2017;13(1):57-63.
Continuous positive airway pressure therapy (CPAP) is the first-line treatment for obstructive sleep apnea (OSA) recommended by the American College of Physicians and the American Academy of Sleep Medicine.1,2 CPAP reduces the apnea hypopnea index (AHI), improves oxyhemoglobin desaturation, and reduces cortical arousals associated with apneic/hypopneic events.3 Despite being an effective treatment for OSA, a significant limitation of CPAP is treatment adherence. Factors associated with CPAP adherence include disease and patient characteristics, perceived self-efficacy, treatment titration procedure, device technology factors, adverse effects, and psychosocial factors.4
Recent studies suggest that insomnia and depression may be associated with OSA. According to a review by Luyster and colleagues, insomnia is present in 39% to 58% of patients with OSA.5 Since OSA may disturb sleep by the number of nightly awakenings, OSA may cause or worsen insomnia. Furthermore, insomnia may exacerbate sleep apnea thus impeding the effectiveness of sleep apnea treatment.
In some studies, the presence of insomnia symptoms prior to initiating CPAP treatment has been found to be associated with reduced CPAP adherence. For example, in 2010, Wickwire and colleagues found that there was a negative association with the average nightly minutes of CPAP use for those patients with OSA that reported symptoms of sleep maintenance insomnia.6 This was not found for those patients with OSA who reported symptoms of sleep onset insomnia or reported no insomnia at all. In another study by Pieh and colleagues, self-reported insomnia symptoms were predictive of CPAP adherence (defined as < 4 hours use/night) at a 6-month follow-up.7 However, results from a separate study indicated that insomnia was not associated with 6-month CPAP adherence.8
Depressive symptoms are commonly reported by patients with OSA, and higher rates of depressive symptomatology in patients with OSA have been observed in a number of prevalence studies when compared with the general population.9,10 Between 15% and 56% of patients with OSA are diagnosed with a depressive disorder compared with 6.6% of the general population.11 OSA may be causally related with depression or coexist as a separate disorder. Apnea severity has been shown to exacerbate depressive symptoms, and treatment with CPAP can improve depressive symptoms.12,13 Unfortunately, depression has been found to reduce CPAP adherence. For example, Law and colleagues found that depression was independently associated with poorer adherence during home-based auto-PAP titration.14 Furthermore, in a study by Gurlanick and colleagues, depressive symptoms were independently associated with reduced CPAP adherence in surgical patients with OSA.15
To the best of our knowledge, the combined impact of both insomnia and depression on CPAP adherence has not been investigated. In military populations this may be especially important as CPAP adherence has been reported to be worse in military patients with posttraumatic stress disorder (PTSD) and other psychiatric disorders, and there are increasing rates of insomnia and OSA in the military.16,17 We hypothesize that active-duty and retired military patients with self-reported insomnia and depression will have reduced short and long-term CPAP adherence.
Methods
This is a retrospective cohort study that reviewed charts of active-duty and retired military members diagnosed with OSA by the Sleep Medicine Clinic at Naval Medical Center San Diego in California using a home sleep test (HST). The HSTs were interpreted by board-certified physicians in sleep medicine. Prior to the HST, all patients completed a sleep questionnaire that included self-reports of daytime sleepiness, using the Epworth Sleepiness Scale (ESS), depression using the Center for Epidemiologic Studies Depression Scale (CES-D) and insomnia using the Insomnia Severity Index (ISI).
The study population included active-duty and veteran patients diagnosed with OSA who chose treatment with a CPAP and attended the sleep clinic’s OSA educational class, which discussed the diagnosis and treatment of OSA. Inclusion criteria were patients aged > 18 years and diagnosed with OSA at the Naval Medical Center San Diego sleep lab between June 2014 and June 2015.
The study population was stratified into 4 groups: (1) those with OSA but no self-reported depression or insomnia; (2) those with OSA and self-reported depression but no insomnia; (3) those with OSA and insomnia but no depression; and (4) those with OSA and self-reported depression and insomnia. Charts were excluded from the review if there were incomplete data or if the patient selected an alternative treatment for OSA, such as an oral appliance. A total of 120 charts were included in the final review. This study was approved by the Naval Medical Center San Diego Institutional Review Board.
Data Collection
Data collected included the individual’s age, sex, minimum oxygen saturation during sleep, body mass index (BMI), height, weight, ESS score at time of diagnosis, date of HST, and date of attendance at the clinic’s OSA group treatment class. Diagnosis of OSA was based on the patient’s ≥ 5 AHI. OSA severity was divided into mild (AHI 5-14), moderate (AHI 15-29), or severe (AHI ≥ 30). A patient with a CES-D score > 14 was considered to have clinically significant depression, and a patient with an ISI score of > 14 was considered to have clinically significant insomnia. ISI is a reliable and valid instrument to quantify perceived insomnia severity.18 The CES-D was used only as an indicator of symptoms relating to depression, not to clinically diagnose depression. It also has been used extensively to investigate levels of depression without a psychiatric diagnosis.19
Follow-up CPAP adherence was collected at 3- and 12-month intervals after the date of the patient’s OSA treatment group class and included AHI, median pressure setting, median days used, average time used per night, and percentage of days used for more than 4 hours for the previous 30 days. Data were obtained through Sleep Data and ResMed websites, which receive patient adherence data directly from the patient’s CPAP device. Patients were considered to be adherent with CPAP usage based on the Medicare definition: Use of the CPAP device > 4 hours per night for at least 70% of nights during a 30-day period). The 3-month time frame was used as a short interval because that is when patients are seen in the pulmonary clinic for their initial follow-up appointment. Patients are seen again at 12 months because durable medical equipment supplies must be reordered after 12 months, which requires a patient visit.
Statistical Analysis
Linear regression methods were used to characterize any potential relationships between the predictor variables and the target outcome variables associated with CPAP adherence at 3 and 12 months. Scatterplots were produced to assess whether linear structure was sufficient to characterize any detectable relationships, or whether there existed more complex, nonlinear relationships. The best-fitting linear regression line was examined in relation to the confidence bands of the corresponding LOESS line to determine whether a more complicated model structure was needed to capture the relationship.
Standard tests of assumptions required for these methods were also carried out: QQ plots of residuals to test for normality, the Durbin-Watson test for independence of residuals, and the nonconstant variance score test for heteroskedasticity (ie, Breusch-Pagan test). The results of these assumptions tests are reported only in cases in which the assumptions were revealed to be untenable. In cases in which suspicious outlying observations may have biased analyses, robust versions of the corresponding models were constructed. In no cases did the resulting conclusions change; only the results of the original analysis are reported. All analyses were carried out in R (R Foundation, r-project.org). Statistical significance was defined as P < .05.
Results
Our study population was predominately male (90%) with a median age of 41 years (range 22-65) and BMI of 29.8 (range 7.7-57.2)(Table 1).
Predictors of CPAP Adherence
OSA severity, as measured by the AHI, was the only promising predictor of CPAP use at 3 months (b, 2.128; t80, 2.854; P = .005; adjusted R2, 0.081). The severity of self-reported daytime sleepiness prior to a diagnosis of OSA, as measured by the ESS, did not predict 3-month CPAP adherence (b, 0.688; t77, 0.300; P = .765; adjusted R2, -0.012). Self-reported depression as measured by the CES-D also did not predict CPAP use at 3 months (b, -0.078; t80, -0.014; P = .941; adjusted R2, -0.012). Similarly, self-reported insomnia, as measured by the ISI, did not predict 3-month CPAP adherence (b, 1.765; t80, 0.939; P = .350; adjusted R2, -0.001). Furthermore, a model that incorporated both depression and insomnia proved no better at accounting for variation in 3-month CPAP use (R2, -0.012). Demographic variables, such as age, sex, or BMI did not predict 3-month CPAP adherence (all Ps > .20). Finally, median CPAP pressure approached statistical significance as a predictor of 3-month CPAP adherence (b, 9.493; t66, 1.881; P = .064; adjusted R2, 0.037) (Figure 1).
CPAP Use at 12 months
The results for CPAP use at 12 months mirrored the results for 3 months with one main exception: OSA severity, as measured by the AHI, did not predict CPAP use at 12 months (b, 1.158; t52, 1.245; P = .219; adjusted R2, 0.010). Neither adding a quadratic predictor nor log transforming the AHI values produced a better model (R2, -0.0007 vs R2, 0.0089, respectively). The severity of self-reported daytime sleepiness, as measured by the ESS, did not predict 12-month CPAP adherence (b, -2.201; t50, -0.752; P = .456; adjusted R2 = -0.0086). Self-reported depression as measured by the CES-D also did not predict CPAP use at 12 months (b, 0.034, t52, 0.022; P = .983; adjusted R2, -0.092). Self-reported insomnia, as measured by the ISI, also did not predict 12-month CPAP adherence (b, 1.765; t80, 0.939; P = .350; adjusted R2 = -0.001). Furthermore, a model that incorporated both depression and insomnia proved no better at accounting for variation in 12-month CPAP use, (R2, -0.0298).
Discussion
Our study did not provide evidence that self-reported depressive and insomnia symptoms, as measured by the CES-D and ISI, can serve as useful predictors of short and long-term CPAP adherence in a sample of active-duty and retired military. OSA severity, as measured by the AHI, was the only promising predictor of CPAP adherence at 3 months.
Insomnia has been shown to improve with the use of CPAP. In a pilot study, Krakow and colleagues investigated the use of CPAP, oral appliances, or bilateral turbinectomy on patients with OSA and chronic insomnia.20 Objective measures of insomnia improved with 1 night of CPAP titration. Björnsdóttir and colleagues evaluated the long-term effects of positive airway pressure (PAP) treatment on 705 adults with middle insomnia.21 They found after 2 years of PAP treatment combined with cognitive behavioral therapy for insomnia, patients had reduced symptoms of middle insomnia. It is possible that persistent insomnia is associated with more severe OSA which was not studied in our population.22
As reported in other studies, it is possible that patients with depressive symptoms can improve with CPAP use, suggesting that depression and CPAP use are not totally unrelated. Edwards and colleagues studied the impact of CPAP on depressive symptoms in men and woman. They found that depressive symptoms are common in OSA and markedly improve with CPAP.23 Bopparaju and colleagues found a high prevalence of anxiety and depression in patients with OSA but did not influence CPAP adherence.24
The results of this study differ from some previous findings where depression was found to predict CPAP adherence.10 This may be due in part to differences in the type of instrument used to assess depression. Wells and colleagues found that baseline depressive symptoms did not correlate with CPAP adherence and that patients with greater CPAP adherence had improvement in OSA and depressive symptoms.25 Furthermore, patients with residual OSA symptoms using CPAP had more depressive symptoms, suggesting that it is the improvement in OSA symptoms that may be correlated with the improvement in depressive symptoms. Although soldiers with PTSD may have reduced CPAP adherence, use of CPAP is associated with improvement in PTSD symptoms.11,26
Limitations
This study had several limitations, including a small sample size. Study patients were also from a single institution, and the majority of patients had mild-to-moderate OSA. A multicenter prospective study with a larger sample size that included more severe patients with OSA may have shown different results. The participants in this study were limited to members from the active-duty and retired military population. The findings in this population may not be transferrable to the general public. Another study limitation was that the ISI and the CES-D were only administered prior to the initiation of CPAP. If the CES-D and ISI were administered at the 3- and 12-month follow-up visits, we could determine whether short and long-term CPAP improved these symptoms or whether there was no association between CPAP adherence with insomnia and depressive symptoms. Another limitation is that we did not have access to information about potential PTSD symptomatology, which has been associated with reduced CPAP adherence and is more common in a military and veteran population.11
Conclusion
This study found little evidence that symptoms of depression and insomnia are useful predictors of CPAP adherence, in either short- or long-term use, in an active-duty and retired military sample. Although these were not found to be predictors of CPAP adherence, further research will be necessary to determine whether CPAP adherence improves symptoms of depression and insomnia in military and veteran populations. Apnea severity did predict CPAP adherence in the short term, but not for any length of time beyond 3 months. More research is needed to explore strategies to improve CPAP adherence in military populations.
1. Qaseem A, Holty JE, Owens DK, Dallas P, Starkey M, Shekelle P; Clinical Guidelines Committee of the American College of Physicians. Management of obstructive sleep apnea in adults: a clinical practice guideline from the American College of Physicians. Ann Intern Med. 2013;159(7):471-483.
2. Epstein LJ, Kristo D, Strollo PJ, et al; Adult Obstructive Sleep Apnea Task Force of the American Academy of Sleep Medicine. Clinical guideline for the evaluation, management and long-term care of obstructive sleep apnea in adults. J Clin Sleep Med. 2009;5(3):263-276.
3. Gay P, Weaver T, Loube D, Iber C; Positive Airway Pressure Task Force; Standards of Practice Committee; American Academy of Sleep Medicine. Evaluation of positive airway pressure treatment for sleep-related breathing disorders in adults. Sleep. 2006;29(3):381-401.
4. Sawyer AM, Gooneratne NS, Marcus CL, Ofer D, Richards KC, Weaver T. A systematic review of CPAP adherence across age groups: clinical and empiric insights for developing CPAP adherence interventions. Sleep Med Rev. 2011;15(6):343-356.
5. Luyster FS; Buysse DJ; Strollo PJ. Comorbid insomnia and obstructive sleep apnea: challenges for clinical practice and research. J Clin Sleep Med. 2010;6(2):196-204.
6. Wickwire EM, Smith MT, Birnbaum S, Collop NA. Sleep maintenance insomnia complaints predict poor CPAP adherence: a clinical case series. Sleep Med. 2010;11(8):772-776
7. Pieh C, Bach M, Popp R, et al. Insomnia symptoms influence CPAP compliance. Sleep Breath. 2013;17(1):99-104.
8. Nguyên XL, Chaskalovic J, Rakotonanahary D, Fleury B. Insomnia symptoms and CPAP compliance in OSAS patients: a descriptive study using data mining methods. Sleep Med. 2010;11(8):777-784.
9. Yilmaz E, Sedky K, Bennett DS. The relationship between depressive symptoms and obstructive sleep apnea in pediatric populations: a meta-analysis. J Clin Sleep Med. 2013;9(11):1213-1220.
10. Chen YH, Keller JK, Kang JH, Hsieh HJ, Lin HC. Obstructive sleep apnea and the subsequent risk of depressive disorder: a population-based follow-up study. J Clin Sleep Med. 2013;9(5):417-423.
11. Kessler RC, Berglund P, Demler O, et al; National Comorbidity Survey Replication. The epidemiology of major depressive disorder: results from the National Comorbidity Survey Replication (NCS-R). JAMA. 2003:289(23):3095-3105
12. Harris M, Glozier N, Ratnavadivel R, Grunstein RR. Obstructive sleep apnea and depression. Sleep Med Rev. 2009;13(6):437-444.
13. Schwartz D, Kohler W, Karatinos G. Symptoms of depression in individuals with obstructive sleep apnea may be amendable to treatment with continuous positive airway pressure. Chest. 2005;128(3):1304-1309
14. Law M, Naughton M, Ho S, Roebuck T, Dabscheck E. Depression may reduce adherence during CPAP titration trial. J Clin Sleep Med. 2014;10(2):163-169.
15. Guralnick AS, Pant M, Minhaj M, Sweitzer BJ, Mokhlesi B. CPAP adherence in patients with newly diagnosed obstructive sleep apnea prior to elective surgery. J Clin Sleep Med. 2012;8(5):501-506
16. Collen JF, Lettieri CJ, Hoffman M. The impact of posttraumatic stress disorder on CPAP adherence in patients with obstructive sleep apnea. J Clin Sleep Med. 2012;8(6):667-672.
17. Caldwell A, Knapik JJ, Lieberman HR. Trends and factors associated with insomnia and sleep apnea in all United States military service members from 2005 to 2014. J Sleep Res. 2017;26(5):665-670.
18. Bastien CH, Vallières A, Morin CM. Validation of the Insomnia Severity Index as an outcome measure for insomnia research. Sleep Med. 2001;2(4):297-307.
19. Radloff LS. The CES-D scale: a self-report depression scale for research in the general population. Appl Psychological Measurement. 1977;1(3):385-401.
20. Krakow B, Melendrez D, Lee SA, Warner TD, Clark JO, Sklar D. Refractory insomnia and sleep-disordered breathing: a pilot study. Sleep Breath. 2004;8(1):15-29.
21. Björnsdóttir E, Janson C, Sigurdsson JF, et al. Symptoms of insomnia among patients with obstructive sleep apnea before and after two years of positive airway pressure treatment. Sleep. 2013;36(12):1901-1909.
22. Glidewell RN, Renn BN, Roby E, Orr WC. Predictors and patterns of insomnia symptoms in OSA before and after PAP therapy. Sleep Med. 2014;15(8):899-905.
23. Edwards C, Mukherjee S, Simpson L, Palmer LJ, Almeida OP, Hillman DR. Depressive symptoms before and after treatment of obstructive sleep apnea in men and women. J Clin Sleep Med. 2015;11(9):1029-1038.
24. Bopparaju S, Casturi L, Guntupalli B, Surani S, Subramanian S. Anxiety and depression in obstructive sleep apnea: Effect of CPAP therapy and influence on CPAP compliance. Presented at: American College of Chest Physicians Annual Meeting, October 31-November 05, 2009; San Diego, CA. Chest. 2009;136(4, meeting abstracts):71S.
25. Wells RD, Freedland KE, Carney RM, Duntley SP, Stepanski EJ. Adherence, reports of benefits, and depression among patients treated with continuous positive airway pressure. Psychosom Med. 2007;69(5):449-454.
26. Orr JE, Smales C, Alexander TH, et al. Treatment of OSA with CPAP is associated with improvement in PTSD symptoms among veterans. J Clin Sleep Med. 2017;13(1):57-63.
Trends in VA Telerehabilitation Patients and Encounters Over Time and by Rurality
Historically, the Veterans Health Administration (VHA) has excelled at improving veterans’ access to health care and enhancing foundational services, such as prosthetics and other veteran-centric services, and this continues to be the VHA’s top priority.1 Travel distance and time are often barriers to accessing health care for many veterans.2-11 For veterans with disabilities who must overcome additional physical, cognitive, and emotional obstacles to access vital rehabilitation services, these geographic obstacles are magnified. Further compounding the challenge is that rehabilitation therapies frequently require multiple encounters. Telerehabilitation is a promising solution for veterans in need of rehabilitation to regain optimal functioning. This alternative mode of service delivery can help veterans overcome geographic access barriers by delivering health care directly to veterans in their homes or nearby community-based outpatient clinics.12,13
A growing body of evidence supports telerehabilitation. In a 2017 systematic review and meta-analysis, Cottrell and colleagues reviewed and analyzed data from 13 studies that met their inclusion criteria; specifically, their meta-analytic sample comprised adults aged ≥ 18 years presenting with any diagnosed primary musculoskeletal condition; treatment interventions via a real-time telerehabilitation medium, trials that had a comparison group with the same condition; provided clinical outcomes data, and included published randomized and nonrandomized controlled trials.14 Based on their aggregated results, they concluded that real-time telerehabilitation was effective in improving physical function (standardized mean difference [SMD], 0.63; 95% CI, 0.92-2.33; I2, 93%), and reducing pain (SMD, 0.66; 95% CI, −0.27- .60; I2, 96%) in patients with any diagnosed primary musculoskeletal condition.14
Two other systematic reviews conducted by Pietrzak and colleagues and Agostini and colleagues also demonstrated the clinical effectiveness of telerehabilitation.15,16 Clinical effectiveness was defined as changes in health, functional status, and satisfaction with the telerehabilitation services delivered. The studies examined in the review included those that provided online self-management and education in addition to exercise via teleconferencing in real time.
Pietrzak and colleagues found that Internet-based osteoarthritis self-management interventions significantly improved 4 of 6 health status measures reviewed (ie, pain, fatigue, activity limitation, health distress, disability, and self‐reported global health).15 User acceptance and satisfaction were high (≥ 70% satisfied) in all studies meeting the inclusion criteria.
Agostini and colleagues found that telerehabilitation was more effective than other modes of delivering rehabilitation to regain motor function in cardiac (SMD, 0.24; 95% CI, 0.04-0.43) and total knee arthroplasty (Timed Up and Go test: SMD, −5.17; 95% CI, −9.79- −0.55) patients.16 Some evidence from VHA and non-VHA studies also support the use of telerehabilitation to reduce health care costs,17-19 improve treatment adherence,12,20 and enhance patient physical, cognitive and mobility function, as well as patient satisfaction and health-related quality of life.13,21-24
Since the first recorded use of telehealth in 1959, the application of technology to deliver health care, including rehabilitation services, has increased exponentially.14 In fiscal year (FY) 2017 alone, the VA provided > 2 million episodes of care for > 700,000 veterans using telehealth services.2
Although the process for accessing telerehabilitation may vary throughout the VA, typically a few common factors make a veteran eligible for this mode of rehabilitation care delivery: Veterans must meet criteria for a specific program (eg, amputation, occupational therapy, and physical therapy) and receive VA care from a VA medical facility or clinic that offers telehealth services. Care providers must believe that the veteran would benefit from telerehabilitation (eg, limited mobility and long-distance travel to the facility) and that they would be able to receive an appropriate consult. The veteran must meet the following requirements: (1) willingness to consent to a visit via telehealth; (2) access to required equipment/e-mail; and (3) a caregiver to assist if they are unable to complete a visit independently.
In this article, we provide an overview of the growth of telerehabilitation in the VHA. Data are presented for specific telerehabilitation programs over time and by rurality.
Methods
The VHA Support Service Center works with VHA program offices and field users to provide field-focused business, clinical, and special topic reports. An online portal provides access to these customizable reports organized as data cubes, which represent data dimensions (ie, clinic type) and measures (ie, number of unique patients). For this study, we used the Connected Care, Telehealth, Call Centers Clinical Video Telehealth/Store and Forward Telehealth data cube clinical stop codes to identify the numbers of telerehabilitation veteran users and encounters across time. The following telerehabilitation clinic-stop codes were selected: 197 (polytrauma/traumatic brain injury [TBI]–individuals), 201 (Physical Medicine and Rehabilitation [PM&R] Service), 205 (physical therapy), 206 (occupational therapy), 211 (PM&R amputation clinic), 418 (amputation clinic), 214 (kinesiotherapy), and 240 (PM&R assistive technology clinic). Data for total unique patients served and the total number of encounters were extracted at the national level and by rurality from FY 2012 to FY 2017, providing the past 5 years of VHA telerehabilitation data.
It is important to note that in FY 2015, the VHA changed its definition of rurality to a rural-urban commuting areas (RUCA)-based system (www.ruralhealth.va.gov/rural-definition.asp). Prior to FY 2015, the VHA used the US Census Bureau (CB) urbanized area definitions. According to CB, an urbanized area contains a central city and surrounding area that totals > 50,000 in population. It also includes places outside of urbanized areas with populations > 2,500. Rural areas are defined as all other areas. VHA added a third category, highly rural, which is defined as areas that had < 7 people per square mile. In the RUCA system, each census tract defined by the CB is given a score. The VHA definitions are as follows:
- Urban (U)—census tracts with RUCA scores of 1.0 or 1.1. These tracts are determined by the CB as being in an urban core and having the majority of their workers commute within that same core (1.0). If 30% to 49% commute to an even larger urban core, then the code is 1.1;
- Rural (R)—all tracts not receiving scores in the urban or highly rural tiers; and
- Highly rural (H)—tracts with a RUCA score of 10.0. These are the most remote occupied land areas. Less than 10% of workers travel to CB-defined urbanized areas or urban clusters.
In addition, VHA recently added an “I” category to complement “U,” “R,” and “H.” The “I” value is assigned to veterans living on the US insular islands (ie, territories): Guam, American Samoa, Northern Marianas, and US Virgin Islands. For the analysis by rurality in this study, we excluded veterans living in the insular islands and those of unknown rurality (< 1.0% of patients and encounters). Further, because the numbers of highly rural veterans were relatively small (< 2% of patients and encounters), the rural and highly rural categories were combined and compared with urban-dwelling veterans.
Results
Overall, the workload for telerehabilitation nearly quadrupled over the 5-year period (Table 1 and Figure 1). 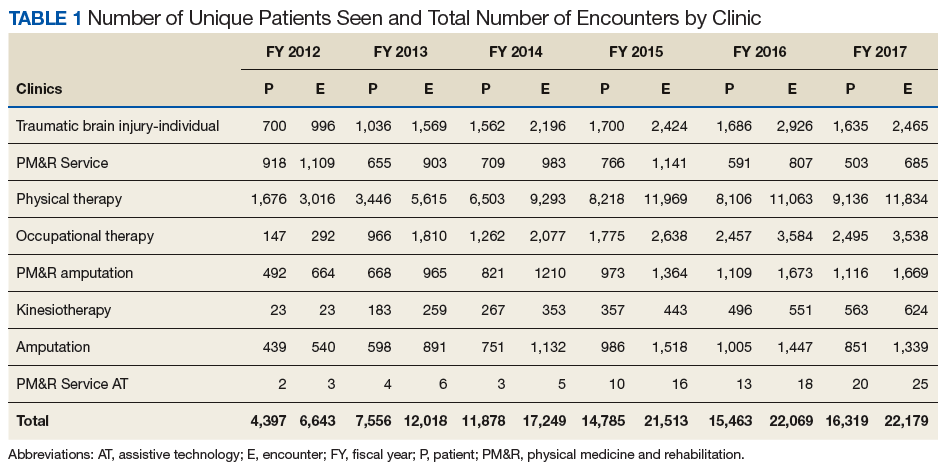
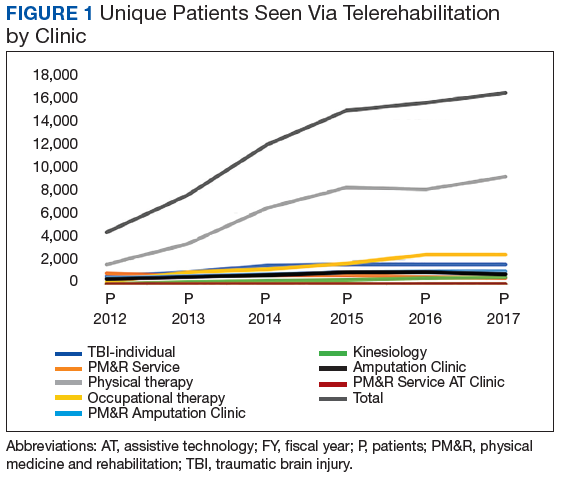
Interesting trends were seen by clinic type. Some clinics increased substantially, whereas others showed only moderate increases, and in 1 case (PM&R Service), a decrease. For example, there is significant growth in the number of patients and encounters involving physical therapy through telerehabilitation. This telerehabilitation clinic increased its workload from 1,676 patients with 3,016 encounters in FY 2012 to 9,136 patients with 11,834 encounters in FY 2017, accounting for 62.6% of total growth in patients and 56.8% of total growth in encounters.
Other clinics showing substantial growth over time included occupational therapy and polytrauma/TBI-individual secondary evaluation. Kinesiotherapy telerehabilitation was almost nonexistent in the VHA during FY 2012, with only 23 patients having 23 encounters. By FY 2017, there were 563 patients with 624 kinesiotherapy telerehabilitation encounters, equating to staggering increases in 5 years: 2,348% for patients and 2,613% for encounters. Similarly, the Physical Medicine and Rehabilitation Assistive Technology clinics had very low numbers in FY 2012 (patients, 2; encounters, 3) and increased over time; albeit, at a slow rate.
Trends by Rurality
Trends by rural location of patients and encounters must be interpreted with caution because of the changing rural definition between FY 2014 and FY 2015 (Tables 2 and 3; Figures 3 and 4). 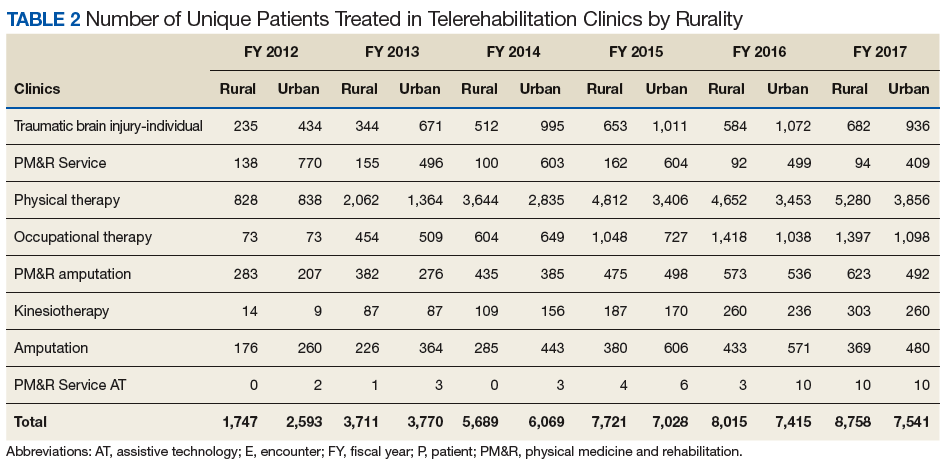
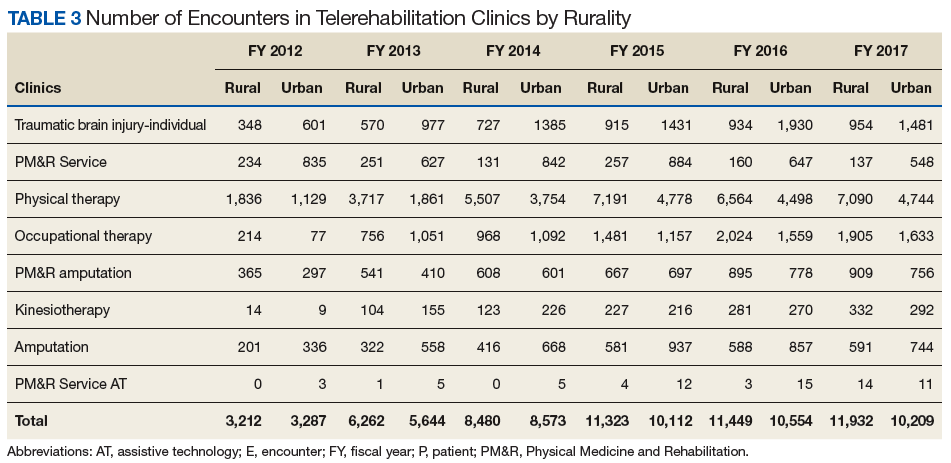
The increased total number of patients seen between FY 2012 and FY 2014 (old definition) was 225% for rural veterans vs 134% for urban veterans. Between FY 2015 and FY 2017 (new definition), the increase was lower for both groups (rural, 13.4%; urban, 7.3%), but rural veterans still increased at a higher rate than did urban dwellers. 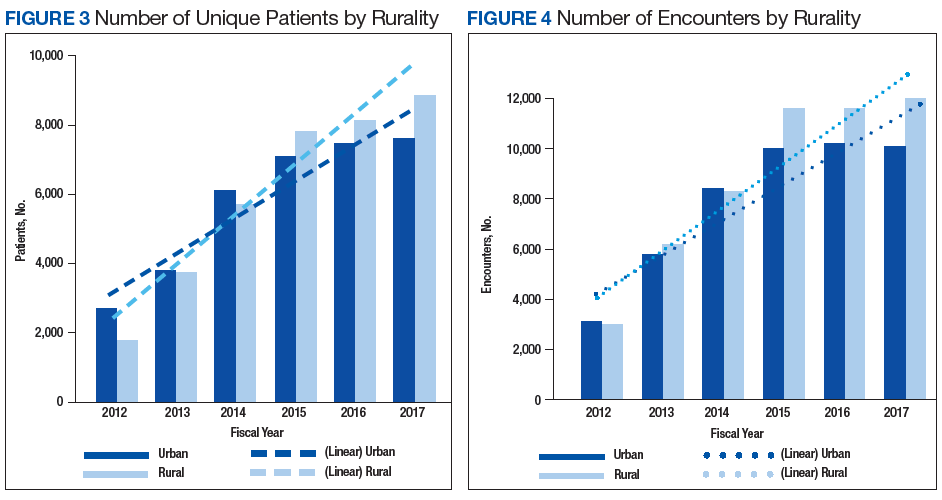
Discussion
Our primary aim was to provide data on the growth of telerehabilitation in the VHA over the past 5 years. Our secondary aim was to examine growth in the use of telerehabilitation by rurality. Specifically, we provided an overview of telerehabilitation growth in terms of unique patients and overall encounters in the VHA by rurality from FY 2012 to FY 2014 and FY 2015 to FY 2017 using the following programs: Polytrauma/TBI, PM&R Service, physical therapy, occupational therapy, PM&R amputation clinic, amputation clinic, kinesiotherapy, and PM&R assistive technology clinic. Our findings demonstrated a noteworthy increase in telerehabilitation encounters and unique patients over time for these programs. These findings were consistent with the overall trend of continued growth and expansion of telehealth within the VHA.
Our findings reveal an upward trend in the total number of rural encounters and rural unique patients despite the change in the VA’s definition of rurality in FY 2015. To our knowledge, urban and rural use of telerehabilitation has not been examined previously. Under both definitions of rurality, encounters and unique patients show an important increase over time, and by year-end 2017, more than half of all patients and encounters were attributed to rural patients (53.7% and 53.9%, respectively). Indeed, the upward trend may have been more pronounced if the rural definition had not changed in FY 2015. Our early VHA stroke patients study on the difference between rural-urban patients and taxonomies showed that the RUCA definition was more likely to reduce the number of rural patients by 8.5% than the early definition used by the VHA.26
It is notable that although the use of tele-delivery of rehabilitation has continually increased, the rate of this increase was steeper from FY 2012 to FY 2014 than FY 2015 to FY 2017. For the programs under consideration in this study, the total number of rural patients/encounters increased throughout the observed periods. However, urban patients and encounters increased through FY 2016 and experienced a slight decrease in FY 2017.
The appearance of a slower rate of increase may be due to a rapid initial rate of increase through early adopters and “crossing the diffusion chasm,” a well-documented process of slower diffusion between the time of invention to penetration that often characterizes the spread of successful telehealth innovations
With an emphasis on increasing access to rehabilitation services, the VHA can expect to see a continuing increase in both the number and the percentage of telerehabilitation rural patients and encounters. The VHA has several telerehabilitation initiatives underway through the VHA’s Physical Medicine and Rehabilitation Telerehabilitation Enterprise Wide Initiative (TREWI) and Rural Veterans Telerehabilitation Initiative. These projects demonstrate the feasibility of this delivery approach and facilitate integration of this modality in clinical workflows. However, to sustain these efforts, facilities will need more infrastructure and personnel resources dedicated to the delivery of services.
In an ongoing evaluation of the TREWI, several factors seem to influence the uptake of the VHA Office of Rural Health TREWI programs. These factors are the presence or absence of a local site champion; the quality of hospital leadership support; the quality of past relationships between telerehabilitation sending sites and receiving sites; barriers to getting a telehealth service agreement in place; the availability of space; administrative know-how on setting up clinics appropriately; time involved to bring on staff; contracting issues; equipment availability and installation; cultural issues in embracing technologic innovation; training burden; hassle factors; and limited funds. Although early adopters may be able to negotiate and push through many of the barriers associated with the diffusion of telerehabilitation, the numerous barriers may slow its larger systemwide diffusion.
Telerehabilitation is a promising mode to deliver care to rural veterans who otherwise may not have access to this type of specialty care. Therefore, the identification of elements that foster telerehabilitation growth in future investigations can assist policy makers and key stakeholders in optimally leveraging program resources for maximal productivity. Future studies investigating the drivers of increases in telerehabilitation growth by rurality are warranted. Furthermore, more research is needed to examine telerehabilitation growth quality of care outcomes (eg, patient and provider satisfaction) to ensure that care is not only timely and accessible, but of high quality.
Conclusion
Disparities between rural and urban veterans compel a mode of expanding delivery of care. The VHA has embraced the use of telehealth modalities to extend its reach of rehabilitation services to veterans with disability and rehabilitation needs. Growth in telerehabilitation rural patient encounters increases access to rehabilitative care, reduces patient and caregiver travel burden, and helps ensure treatment adherence. Telerehabilitation utilization (unique patients and total encounters) is growing more rapidly for rural veterans than for their urban counterparts. Overall, telerehabilitation is filling a gap for rural veterans, as well as veterans in general with challenges in accessibility to health care. In order to make full use of the telerehabilitation services across its health care system, VA health care facilities may need to expand their effort in telerehabilitation dissemination and education among providers and veterans, particularly among providers who are less familiar with telerehabilitation services and among veterans who live in rural or highly rural areas and need special rehabilitation care.
1. Shane L. What’s in the VA secretary’s 10-point plan to reform his department? https://rebootcamp.militarytimes.com/news/pentagon-congress/2017/02/28/what-s-in-the-va-secretary-s-10-point-plan-to-reform-his-department. Published February 28, 2017. Accessed November 21, 2018.
2. Burgess JF, DeFiore DA. The effect of distance to a VA facility on the choice and level of utilization of VA outpatient services. Soc Science Med. 1994;39(1):95-104.
3. LaVela SL, Smith B, Weaver FM, Miskevics SA. Geographical proximity and health care utilization in veterans with SCI&D in the USA. Soc Science Med. 2004;59:2387-2399.
4. Piette JD, Moos RH. The influence of distance on ambulatory care use, death, and readmission following a myocardial infarction. Health Serv Res. 1996;31(5):573-591.
5. Schmitt SK, Phibbs CS, Piette JD. The influence of distance on utilization of outpatient mental health aftercare following inpatient substance abuse treatment. Addictive Behav. 2003;28(6):1183-1192.
6. Fortney JC, Booth BM, Blow FC, Bunn JY. The effects of travel barriers and age on the utilization of alcoholism treatment aftercare. Am J Drug Alcohol Abuse. 1995;21(3):391-406.
7. McCarthy JF, Blow FC, Valenstein M, et al. Veterans Affairs Health System and mental health treatment retention among patients with serious mental illness: evaluating accessibility and availability barriers. Health Serv Res. 2007;42(3):1042-1060.
8. Mooney C, Zwanziger J, Phibbs CS, Schmitt S. Is travel distance a barrier to veterans’ use of VA hospitals for medical surgical care? Soc Sci Med. 2000;50(12):1743-1755.
9. Friedman SA, Frayne SM, Berg E, et al. Travel time and attrition from VHA care among women veterans: how far is too far? Med Care. 2015;53(4)(suppl 1):S15-S22.
10. Buzza C, Ono SS, Turvey C, et al. Distance is relative: unpacking a principal barrier in rural healthcare. J Gen Intern Med. 2011;26(suppl 2):648-654.
11. Goins RT, Williams KA, Carter MW, Spencer SM, Solovieva T. Perceived barriers to health care access among rural older adults: a qualitative study. J Rural Health. 2005;21(3):206-213.
12. Kairy D, Lehoux P, Vincent C, Visintin M. A systematic review of clinical outcomes, clinical process, healthcare utilization and costs associated with telerehabilitation. Disabil Rehabil. 2009;31(6):427-447.
13. McCue M, Fairman A, Pramuka M. Enhancing quality of life through telerehabilitation. Phys Med Rehabil Clin N Am. 2010;21(1):195-205.
14. Cottrell MA, Galea OA, O’Leary SP, Hill AJ, Russell TG. Real-time telerehabilitation for the treatment of musculoskeletal conditions is effective and comparable to standard practice: a systematic review and meta-analysis. Clin Rehabil. 2017;31(5):625-638.
15. Pietrzak E, Cotea C, Pullman S, Nasveld P. Self-management and rehabilitation in osteoarthritis: is there a place for internet-based interventions? Telemed J E Health. 2013;19(10):800-805.
16. Agostini M, Moja L, Banzi R, et al. Telerehabilitation and recovery of motor function: a systematic review and meta-analysis. J Telemed Telecare. 2015;21(4):202-213.
17. Kortke H, Stromeyer H, Zittermann A, et al. New East-Westfalian Postoperative Therapy Concept: A telemedicine guide for the study of ambulatory rehabilitation of patients after cardiac surgery. Telemed J E-Health. 2006;12(4):475-483.
18. Tousignant M, Boissy P, Corriveau H, Moffet H. In home telerehabilitation for older adults after discharge from an acute hospital or rehabilitation unit: A proof-of- concept study and costs estimation. Disabil Rehabil Assist Technol. 2006;1(4):209-216.
19. Sanford JA, Griffiths PC, Richardson P, et al. The effects of in-home rehabilitation on task self-efficacy in mobility-impaired adults: a randomized clinical trial. J Am Geriatr Soc. 2006;54(11):1641-1648.
20. Nakamura K, Takano T, Akao C. The effectiveness of videophones in home healthcare for the elderly. Med Care. 1999;37(2):117-125.
21. Levy CE, Silverman E, Jia H, Geiss M, Omura D. Effects of physical therapy delivery via home video telerehabilitation on functional and health-related quality of life outcomes. J Rehabil Res Dev. 2015;52(3):361-370.
22. Guilfoyle C, Wootton R, Hassall S, et al. User satisfaction with allied health services delivered to residential facilities via videoconferencing. J Telemed Telecare. 2003;9(1):S52-S54.23. Mair F, Whitten P. Systematic review of studies of patient satisfaction with telemedicine. BMJ. 2000;320(7248):1517-1520.
24. Williams T L, May C R, Esmail A. Limitations of patient satisfaction studies in telehealthcare: a systematic review of the literature. Telemed J E-Health. 2001;7(4):293-316.
25. US Department of Veterans Affairs, Office of Telehealth Services. http://vaww.telehealth.va.gov/quality/data/index.asp. Accessed June 1, 2018. [Nonpublic document; source not verified.]
26. Jia H, Cowper D, Tang Y, et al. Post-acute stroke rehabilitation utilization: Are there difference between rural-urban patients and taxonomies? J Rural Health. 2012;28(3):242-247.
27. Cho S, Mathiassen L, Gallivan M. Crossing the chasm: from adoption to diffusion of a telehealth innovation. In: León G, Bernardos AM, Casar JR, Kautz K, De Gross JI, eds. Open IT-Based Innovation: Moving Towards Cooperative IT Transfer and Knowledge Diffusion. Boston, MA: Springer; 2008.
28. Broderick A, Lindeman D. Scaling telehealth programs: lessons from early adopters. https://www.commonwealthfund.org/publications/case-study/2013/jan/scaling-telehealth-programs-lessons-early-adopters. Published January 2013. Accessed June 1, 2018.
Historically, the Veterans Health Administration (VHA) has excelled at improving veterans’ access to health care and enhancing foundational services, such as prosthetics and other veteran-centric services, and this continues to be the VHA’s top priority.1 Travel distance and time are often barriers to accessing health care for many veterans.2-11 For veterans with disabilities who must overcome additional physical, cognitive, and emotional obstacles to access vital rehabilitation services, these geographic obstacles are magnified. Further compounding the challenge is that rehabilitation therapies frequently require multiple encounters. Telerehabilitation is a promising solution for veterans in need of rehabilitation to regain optimal functioning. This alternative mode of service delivery can help veterans overcome geographic access barriers by delivering health care directly to veterans in their homes or nearby community-based outpatient clinics.12,13
A growing body of evidence supports telerehabilitation. In a 2017 systematic review and meta-analysis, Cottrell and colleagues reviewed and analyzed data from 13 studies that met their inclusion criteria; specifically, their meta-analytic sample comprised adults aged ≥ 18 years presenting with any diagnosed primary musculoskeletal condition; treatment interventions via a real-time telerehabilitation medium, trials that had a comparison group with the same condition; provided clinical outcomes data, and included published randomized and nonrandomized controlled trials.14 Based on their aggregated results, they concluded that real-time telerehabilitation was effective in improving physical function (standardized mean difference [SMD], 0.63; 95% CI, 0.92-2.33; I2, 93%), and reducing pain (SMD, 0.66; 95% CI, −0.27- .60; I2, 96%) in patients with any diagnosed primary musculoskeletal condition.14
Two other systematic reviews conducted by Pietrzak and colleagues and Agostini and colleagues also demonstrated the clinical effectiveness of telerehabilitation.15,16 Clinical effectiveness was defined as changes in health, functional status, and satisfaction with the telerehabilitation services delivered. The studies examined in the review included those that provided online self-management and education in addition to exercise via teleconferencing in real time.
Pietrzak and colleagues found that Internet-based osteoarthritis self-management interventions significantly improved 4 of 6 health status measures reviewed (ie, pain, fatigue, activity limitation, health distress, disability, and self‐reported global health).15 User acceptance and satisfaction were high (≥ 70% satisfied) in all studies meeting the inclusion criteria.
Agostini and colleagues found that telerehabilitation was more effective than other modes of delivering rehabilitation to regain motor function in cardiac (SMD, 0.24; 95% CI, 0.04-0.43) and total knee arthroplasty (Timed Up and Go test: SMD, −5.17; 95% CI, −9.79- −0.55) patients.16 Some evidence from VHA and non-VHA studies also support the use of telerehabilitation to reduce health care costs,17-19 improve treatment adherence,12,20 and enhance patient physical, cognitive and mobility function, as well as patient satisfaction and health-related quality of life.13,21-24
Since the first recorded use of telehealth in 1959, the application of technology to deliver health care, including rehabilitation services, has increased exponentially.14 In fiscal year (FY) 2017 alone, the VA provided > 2 million episodes of care for > 700,000 veterans using telehealth services.2
Although the process for accessing telerehabilitation may vary throughout the VA, typically a few common factors make a veteran eligible for this mode of rehabilitation care delivery: Veterans must meet criteria for a specific program (eg, amputation, occupational therapy, and physical therapy) and receive VA care from a VA medical facility or clinic that offers telehealth services. Care providers must believe that the veteran would benefit from telerehabilitation (eg, limited mobility and long-distance travel to the facility) and that they would be able to receive an appropriate consult. The veteran must meet the following requirements: (1) willingness to consent to a visit via telehealth; (2) access to required equipment/e-mail; and (3) a caregiver to assist if they are unable to complete a visit independently.
In this article, we provide an overview of the growth of telerehabilitation in the VHA. Data are presented for specific telerehabilitation programs over time and by rurality.
Methods
The VHA Support Service Center works with VHA program offices and field users to provide field-focused business, clinical, and special topic reports. An online portal provides access to these customizable reports organized as data cubes, which represent data dimensions (ie, clinic type) and measures (ie, number of unique patients). For this study, we used the Connected Care, Telehealth, Call Centers Clinical Video Telehealth/Store and Forward Telehealth data cube clinical stop codes to identify the numbers of telerehabilitation veteran users and encounters across time. The following telerehabilitation clinic-stop codes were selected: 197 (polytrauma/traumatic brain injury [TBI]–individuals), 201 (Physical Medicine and Rehabilitation [PM&R] Service), 205 (physical therapy), 206 (occupational therapy), 211 (PM&R amputation clinic), 418 (amputation clinic), 214 (kinesiotherapy), and 240 (PM&R assistive technology clinic). Data for total unique patients served and the total number of encounters were extracted at the national level and by rurality from FY 2012 to FY 2017, providing the past 5 years of VHA telerehabilitation data.
It is important to note that in FY 2015, the VHA changed its definition of rurality to a rural-urban commuting areas (RUCA)-based system (www.ruralhealth.va.gov/rural-definition.asp). Prior to FY 2015, the VHA used the US Census Bureau (CB) urbanized area definitions. According to CB, an urbanized area contains a central city and surrounding area that totals > 50,000 in population. It also includes places outside of urbanized areas with populations > 2,500. Rural areas are defined as all other areas. VHA added a third category, highly rural, which is defined as areas that had < 7 people per square mile. In the RUCA system, each census tract defined by the CB is given a score. The VHA definitions are as follows:
- Urban (U)—census tracts with RUCA scores of 1.0 or 1.1. These tracts are determined by the CB as being in an urban core and having the majority of their workers commute within that same core (1.0). If 30% to 49% commute to an even larger urban core, then the code is 1.1;
- Rural (R)—all tracts not receiving scores in the urban or highly rural tiers; and
- Highly rural (H)—tracts with a RUCA score of 10.0. These are the most remote occupied land areas. Less than 10% of workers travel to CB-defined urbanized areas or urban clusters.
In addition, VHA recently added an “I” category to complement “U,” “R,” and “H.” The “I” value is assigned to veterans living on the US insular islands (ie, territories): Guam, American Samoa, Northern Marianas, and US Virgin Islands. For the analysis by rurality in this study, we excluded veterans living in the insular islands and those of unknown rurality (< 1.0% of patients and encounters). Further, because the numbers of highly rural veterans were relatively small (< 2% of patients and encounters), the rural and highly rural categories were combined and compared with urban-dwelling veterans.
Results
Overall, the workload for telerehabilitation nearly quadrupled over the 5-year period (Table 1 and Figure 1).
Interesting trends were seen by clinic type. Some clinics increased substantially, whereas others showed only moderate increases, and in 1 case (PM&R Service), a decrease. For example, there is significant growth in the number of patients and encounters involving physical therapy through telerehabilitation. This telerehabilitation clinic increased its workload from 1,676 patients with 3,016 encounters in FY 2012 to 9,136 patients with 11,834 encounters in FY 2017, accounting for 62.6% of total growth in patients and 56.8% of total growth in encounters.
Other clinics showing substantial growth over time included occupational therapy and polytrauma/TBI-individual secondary evaluation. Kinesiotherapy telerehabilitation was almost nonexistent in the VHA during FY 2012, with only 23 patients having 23 encounters. By FY 2017, there were 563 patients with 624 kinesiotherapy telerehabilitation encounters, equating to staggering increases in 5 years: 2,348% for patients and 2,613% for encounters. Similarly, the Physical Medicine and Rehabilitation Assistive Technology clinics had very low numbers in FY 2012 (patients, 2; encounters, 3) and increased over time; albeit, at a slow rate.
Trends by Rurality
Trends by rural location of patients and encounters must be interpreted with caution because of the changing rural definition between FY 2014 and FY 2015 (Tables 2 and 3; Figures 3 and 4).
The increased total number of patients seen between FY 2012 and FY 2014 (old definition) was 225% for rural veterans vs 134% for urban veterans. Between FY 2015 and FY 2017 (new definition), the increase was lower for both groups (rural, 13.4%; urban, 7.3%), but rural veterans still increased at a higher rate than did urban dwellers.
Discussion
Our primary aim was to provide data on the growth of telerehabilitation in the VHA over the past 5 years. Our secondary aim was to examine growth in the use of telerehabilitation by rurality. Specifically, we provided an overview of telerehabilitation growth in terms of unique patients and overall encounters in the VHA by rurality from FY 2012 to FY 2014 and FY 2015 to FY 2017 using the following programs: Polytrauma/TBI, PM&R Service, physical therapy, occupational therapy, PM&R amputation clinic, amputation clinic, kinesiotherapy, and PM&R assistive technology clinic. Our findings demonstrated a noteworthy increase in telerehabilitation encounters and unique patients over time for these programs. These findings were consistent with the overall trend of continued growth and expansion of telehealth within the VHA.
Our findings reveal an upward trend in the total number of rural encounters and rural unique patients despite the change in the VA’s definition of rurality in FY 2015. To our knowledge, urban and rural use of telerehabilitation has not been examined previously. Under both definitions of rurality, encounters and unique patients show an important increase over time, and by year-end 2017, more than half of all patients and encounters were attributed to rural patients (53.7% and 53.9%, respectively). Indeed, the upward trend may have been more pronounced if the rural definition had not changed in FY 2015. Our early VHA stroke patients study on the difference between rural-urban patients and taxonomies showed that the RUCA definition was more likely to reduce the number of rural patients by 8.5% than the early definition used by the VHA.26
It is notable that although the use of tele-delivery of rehabilitation has continually increased, the rate of this increase was steeper from FY 2012 to FY 2014 than FY 2015 to FY 2017. For the programs under consideration in this study, the total number of rural patients/encounters increased throughout the observed periods. However, urban patients and encounters increased through FY 2016 and experienced a slight decrease in FY 2017.
The appearance of a slower rate of increase may be due to a rapid initial rate of increase through early adopters and “crossing the diffusion chasm,” a well-documented process of slower diffusion between the time of invention to penetration that often characterizes the spread of successful telehealth innovations
With an emphasis on increasing access to rehabilitation services, the VHA can expect to see a continuing increase in both the number and the percentage of telerehabilitation rural patients and encounters. The VHA has several telerehabilitation initiatives underway through the VHA’s Physical Medicine and Rehabilitation Telerehabilitation Enterprise Wide Initiative (TREWI) and Rural Veterans Telerehabilitation Initiative. These projects demonstrate the feasibility of this delivery approach and facilitate integration of this modality in clinical workflows. However, to sustain these efforts, facilities will need more infrastructure and personnel resources dedicated to the delivery of services.
In an ongoing evaluation of the TREWI, several factors seem to influence the uptake of the VHA Office of Rural Health TREWI programs. These factors are the presence or absence of a local site champion; the quality of hospital leadership support; the quality of past relationships between telerehabilitation sending sites and receiving sites; barriers to getting a telehealth service agreement in place; the availability of space; administrative know-how on setting up clinics appropriately; time involved to bring on staff; contracting issues; equipment availability and installation; cultural issues in embracing technologic innovation; training burden; hassle factors; and limited funds. Although early adopters may be able to negotiate and push through many of the barriers associated with the diffusion of telerehabilitation, the numerous barriers may slow its larger systemwide diffusion.
Telerehabilitation is a promising mode to deliver care to rural veterans who otherwise may not have access to this type of specialty care. Therefore, the identification of elements that foster telerehabilitation growth in future investigations can assist policy makers and key stakeholders in optimally leveraging program resources for maximal productivity. Future studies investigating the drivers of increases in telerehabilitation growth by rurality are warranted. Furthermore, more research is needed to examine telerehabilitation growth quality of care outcomes (eg, patient and provider satisfaction) to ensure that care is not only timely and accessible, but of high quality.
Conclusion
Disparities between rural and urban veterans compel a mode of expanding delivery of care. The VHA has embraced the use of telehealth modalities to extend its reach of rehabilitation services to veterans with disability and rehabilitation needs. Growth in telerehabilitation rural patient encounters increases access to rehabilitative care, reduces patient and caregiver travel burden, and helps ensure treatment adherence. Telerehabilitation utilization (unique patients and total encounters) is growing more rapidly for rural veterans than for their urban counterparts. Overall, telerehabilitation is filling a gap for rural veterans, as well as veterans in general with challenges in accessibility to health care. In order to make full use of the telerehabilitation services across its health care system, VA health care facilities may need to expand their effort in telerehabilitation dissemination and education among providers and veterans, particularly among providers who are less familiar with telerehabilitation services and among veterans who live in rural or highly rural areas and need special rehabilitation care.
1. Shane L. What’s in the VA secretary’s 10-point plan to reform his department? https://rebootcamp.militarytimes.com/news/pentagon-congress/2017/02/28/what-s-in-the-va-secretary-s-10-point-plan-to-reform-his-department. Published February 28, 2017. Accessed November 21, 2018.
2. Burgess JF, DeFiore DA. The effect of distance to a VA facility on the choice and level of utilization of VA outpatient services. Soc Science Med. 1994;39(1):95-104.
3. LaVela SL, Smith B, Weaver FM, Miskevics SA. Geographical proximity and health care utilization in veterans with SCI&D in the USA. Soc Science Med. 2004;59:2387-2399.
4. Piette JD, Moos RH. The influence of distance on ambulatory care use, death, and readmission following a myocardial infarction. Health Serv Res. 1996;31(5):573-591.
5. Schmitt SK, Phibbs CS, Piette JD. The influence of distance on utilization of outpatient mental health aftercare following inpatient substance abuse treatment. Addictive Behav. 2003;28(6):1183-1192.
6. Fortney JC, Booth BM, Blow FC, Bunn JY. The effects of travel barriers and age on the utilization of alcoholism treatment aftercare. Am J Drug Alcohol Abuse. 1995;21(3):391-406.
7. McCarthy JF, Blow FC, Valenstein M, et al. Veterans Affairs Health System and mental health treatment retention among patients with serious mental illness: evaluating accessibility and availability barriers. Health Serv Res. 2007;42(3):1042-1060.
8. Mooney C, Zwanziger J, Phibbs CS, Schmitt S. Is travel distance a barrier to veterans’ use of VA hospitals for medical surgical care? Soc Sci Med. 2000;50(12):1743-1755.
9. Friedman SA, Frayne SM, Berg E, et al. Travel time and attrition from VHA care among women veterans: how far is too far? Med Care. 2015;53(4)(suppl 1):S15-S22.
10. Buzza C, Ono SS, Turvey C, et al. Distance is relative: unpacking a principal barrier in rural healthcare. J Gen Intern Med. 2011;26(suppl 2):648-654.
11. Goins RT, Williams KA, Carter MW, Spencer SM, Solovieva T. Perceived barriers to health care access among rural older adults: a qualitative study. J Rural Health. 2005;21(3):206-213.
12. Kairy D, Lehoux P, Vincent C, Visintin M. A systematic review of clinical outcomes, clinical process, healthcare utilization and costs associated with telerehabilitation. Disabil Rehabil. 2009;31(6):427-447.
13. McCue M, Fairman A, Pramuka M. Enhancing quality of life through telerehabilitation. Phys Med Rehabil Clin N Am. 2010;21(1):195-205.
14. Cottrell MA, Galea OA, O’Leary SP, Hill AJ, Russell TG. Real-time telerehabilitation for the treatment of musculoskeletal conditions is effective and comparable to standard practice: a systematic review and meta-analysis. Clin Rehabil. 2017;31(5):625-638.
15. Pietrzak E, Cotea C, Pullman S, Nasveld P. Self-management and rehabilitation in osteoarthritis: is there a place for internet-based interventions? Telemed J E Health. 2013;19(10):800-805.
16. Agostini M, Moja L, Banzi R, et al. Telerehabilitation and recovery of motor function: a systematic review and meta-analysis. J Telemed Telecare. 2015;21(4):202-213.
17. Kortke H, Stromeyer H, Zittermann A, et al. New East-Westfalian Postoperative Therapy Concept: A telemedicine guide for the study of ambulatory rehabilitation of patients after cardiac surgery. Telemed J E-Health. 2006;12(4):475-483.
18. Tousignant M, Boissy P, Corriveau H, Moffet H. In home telerehabilitation for older adults after discharge from an acute hospital or rehabilitation unit: A proof-of- concept study and costs estimation. Disabil Rehabil Assist Technol. 2006;1(4):209-216.
19. Sanford JA, Griffiths PC, Richardson P, et al. The effects of in-home rehabilitation on task self-efficacy in mobility-impaired adults: a randomized clinical trial. J Am Geriatr Soc. 2006;54(11):1641-1648.
20. Nakamura K, Takano T, Akao C. The effectiveness of videophones in home healthcare for the elderly. Med Care. 1999;37(2):117-125.
21. Levy CE, Silverman E, Jia H, Geiss M, Omura D. Effects of physical therapy delivery via home video telerehabilitation on functional and health-related quality of life outcomes. J Rehabil Res Dev. 2015;52(3):361-370.
22. Guilfoyle C, Wootton R, Hassall S, et al. User satisfaction with allied health services delivered to residential facilities via videoconferencing. J Telemed Telecare. 2003;9(1):S52-S54.23. Mair F, Whitten P. Systematic review of studies of patient satisfaction with telemedicine. BMJ. 2000;320(7248):1517-1520.
24. Williams T L, May C R, Esmail A. Limitations of patient satisfaction studies in telehealthcare: a systematic review of the literature. Telemed J E-Health. 2001;7(4):293-316.
25. US Department of Veterans Affairs, Office of Telehealth Services. http://vaww.telehealth.va.gov/quality/data/index.asp. Accessed June 1, 2018. [Nonpublic document; source not verified.]
26. Jia H, Cowper D, Tang Y, et al. Post-acute stroke rehabilitation utilization: Are there difference between rural-urban patients and taxonomies? J Rural Health. 2012;28(3):242-247.
27. Cho S, Mathiassen L, Gallivan M. Crossing the chasm: from adoption to diffusion of a telehealth innovation. In: León G, Bernardos AM, Casar JR, Kautz K, De Gross JI, eds. Open IT-Based Innovation: Moving Towards Cooperative IT Transfer and Knowledge Diffusion. Boston, MA: Springer; 2008.
28. Broderick A, Lindeman D. Scaling telehealth programs: lessons from early adopters. https://www.commonwealthfund.org/publications/case-study/2013/jan/scaling-telehealth-programs-lessons-early-adopters. Published January 2013. Accessed June 1, 2018.