User login
Evaluation of the American Academy of Orthopaedic Surgeons Appropriate Use Criteria for the Nonarthroplasty Treatment of Knee Osteoarthritis in Veterans
Knee osteoarthritis (OA) affects almost 9.3 million adults in the US and accounts for $27 billion in annual health care expenses.1,2 Due to the increasing cost of health care and an aging population, there has been renewed interest in establishing criteria for nonarthroplasty treatment of knee OA.
In 2013, using the RAND/UCLA Appropriateness method, the American Academy of Orthopaedic Surgeons (AAOS) developed an appropriate use criteria (AUC) for nonarthroplasty management of primary OA of the knee, based on orthopaedic literature and expert opinion.3 Interventions such as activity modification, weight loss, prescribed physical therapy, nonsteroidal anti-inflammatory drugs, tramadol, prescribed oral or transcutaneous opioids, acetaminophen, intra-articular corticosteroids, hinged or unloading knee braces, arthroscopic partial menisectomy or loose body removal, and realignment osteotomy were assessed. An algorithm was developed for 576 patients scenarios that incorporated patient-specific, prognostic/predictor variables to assign designations of “appropriate,” “may be appropriate,” or “rarely appropriate,” to treatment interventions.4,5 An online version of the algorithm (orthoguidelines.org) is available for physicians and surgeons to judge appropriateness of nonarthroplasty treatments; however, it is not intended to mandate candidacy for treatment or intervention.
Clinical evaluation of the AAOS AUC is necessary to determine how treatment recommendations correlate with current practice. A recent examination of the AAOS Appropriateness System for Surgical Management of Knee OA found that prognostic/predictor variables, such as patient age, OA severity, and pattern of knee OA involvement were more heavily weighted when determining arthroplasty appropriateness than was pain severity or functional loss.6 Furthermore, non-AAOS AUC prognostic/predictor variables, such as race and gender, have been linked to disparities in utilization of knee OA interventions.7-9 Such disparities can be costly not just from a patient perceptive, but also employer and societal perspectives.10
The Department of Veterans Affairs (VA) health care system represents a model of equal-access-to care system in the US that is ideal for examination of issues about health care utilization and any disparities within the AAOS AUC model and has previously been used to assess utilization of total knee arthroplasty.9 The aim of this study was to characterize utilization of the AAOS AUC for nonarthroplasty treatment of knee OA in a VA patient population. We asked the following questions: (1) What variables are predictive of receiving a greater number of AAOS AUC evaluated nonarthroplasty treatments? (2) What variables are predictive of receiving “rarely appropriate” AAOS AUC evaluated nonarthroplasty treatment? (3) What factors are predictive of duration of nonarthroplasty care until total knee arthroplasty (TKA)?
Methods
The institutional review board at the Louis Stokes Cleveland VA Medical Center in Ohio approved a retrospective chart review of nonarthroplasty treatments utilized by patients presenting to its orthopaedic section who subsequently underwent knee arthroplasty between 2013 and 2016. Eligibility criteria included patients aged ≥ 30 years with a diagnosis of unilateral or bilateral primary knee OA. Patients with posttraumatic OA, inflammatory arthritis, and a history of infectious arthritis or Charcot arthropathy of the knee were excluded. Patients with a body mass index (BMI) > 40 or a hemoglobin A1c > 8.0 at presentation were excluded as nonarthroplasty care was the recommended course of treatment above these thresholds.
Data collected included race, gender, duration of nonarthroplasty treatment, BMI, and Kellgren-Lawrence classification of knee OA at time of presentation for symptomatic knee OA.11 All AAOS AUC-evaluated nonarthroplasty treatments utilized prior to arthroplasty intervention also were recorded (Table 1). 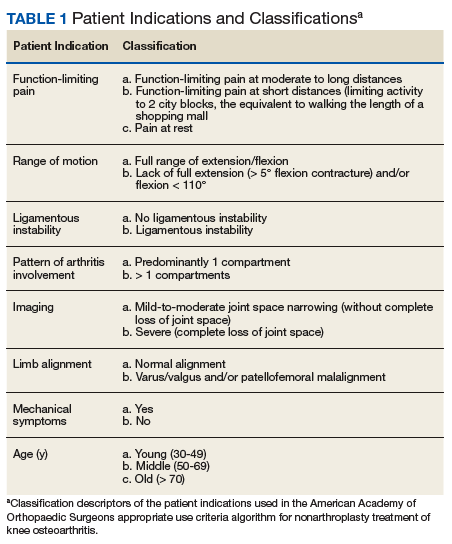
Statistical Analysis
Statistical analysis was completed with GraphPad Software Prism 7.0a (La Jolla, CA) and Mathworks MatLab R2016b software (Natick, MA). Univariate analysis with Student t tests with Welch corrections in the setting of unequal variance, Mann-Whitney nonparametric tests, and Fisher exact test were generated in the appropriate setting. Multivariable analyses also were conducted. For continuous outcomes, stepwise multiple linear regression was used to generate predictive models; for binary outcomes, binomial logistic regression was used.
Factors analyzed in regression modeling for the total number of AAOS AUC evaluated nonarthroplasty treatments utilized and the likelihood of receiving a rarely appropriate treatment included gender, race, function-limiting pain, range of motion (ROM), ligamentous instability, arthritis pattern, limb alignment, mechanical symptoms, BMI, age, and Kellgren-Lawrence grade. Factors analyzed in timing of TKA included the above variables plus the total number of AUC interventions, whether the patient received an inappropriate intervention, and average appropriateness of the interventions received. Residual analysis with Cook’s distance was used to identify outliers in regression. Observations with Cook’s distance > 3 times the mean Cook’s distance were identified as potential outliers, and models were adjusted accordingly. All statistical analyses were 2-tailed. Statistical significance was set to P ≤ .05 for all outputs.
Results
In the study, 97.8% of participants identified as male, and the mean age was 62.8 years (Table 3). 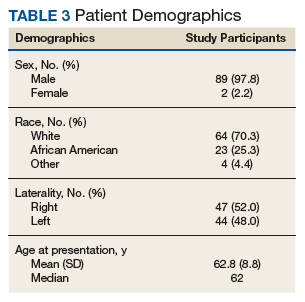
Appropriate Use Criteria Interventions
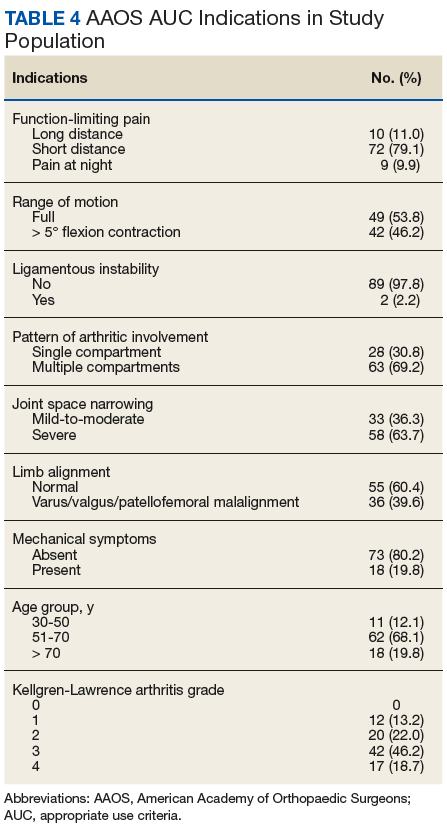
Patients received a mean of 5.2 AAOS AUC evaluated interventions before undergoing arthroplasty management at a mean of 32.3 months (range 2-181 months) from initial presentation. The majority of these interventions were classified as either appropriate or may be appropriate, according to the AUC definitions (95.1%). Self-management and physical therapy programs were widely utilized (100% and 90.1%, respectively), with all use of these interventions classified as appropriate.
Hinged or unloader knee braces were utilized in about half the study patients; this intervention was classified as rarely appropriate in 4.4% of these patients. Medical therapy was also widely used, with all use of NSAIDs, acetaminophen, and tramadol classified as appropriate or may be appropriate. Oral or transcutaneous opioid medications were prescribed in 14.3% of patients, with 92.3% of this use classified as rarely appropriate. Although the opioid medication prescribing provider was not specifically evaluated, there were no instances in which the orthopaedic service provided an oral or transcutaneous opioid prescriptions. Procedural interventions, with the exception of corticosteroid injections, were uncommon; no patient received realignment osteotomy, and only 12.1% of patients underwent arthroscopy. The use of arthroscopy was deemed rarely appropriate in 72.7% of these cases.
Factors Associated With AAOS AUC Intervention Use
There was no difference in the number of AAOS AUC evaluated interventions received based on BMI (mean [SD] BMI < 35, 5.2 [1.0] vs BMI ≥ 35, 5.3 [1.1], P = .49), age (mean [SD] aged < 60 years, 5.4 [1.0] vs aged ≥ 60 years, 5.1 [1.2], P = .23), or Kellgren-Lawrence arthritic grade (mean [SD] grade ≤ 2, 5.5 [1.0] vs grade > 2, 5.1 [1.1], P = .06). These variables also were not associated with receiving a rarely appropriate intervention (mean [SD] BMI < 35, 0.27 [0.5] vs BMI > 35, 0.2 [0.4], P = .81; aged > 60 years, 0.3 [0.5] vs aged < 60 years, 0.2 [0.4], P = .26; Kellgren-Lawrence grade < 2, 0.4 [0.6] vs grade > 2, 0.2 [0.4], P = .1).
Regression modeling to predict total number of AAOS AUC evaluated interventions received produced a significant model (R2 = 0.111, P = .006). The presence of ligamentous instability (β coefficient, -1.61) and the absence of mechanical symptoms (β coefficient, -0.67) were negative predictors of number of AUC interventions received. Variance inflation factors were 1.014 and 1.012, respectively. Likewise, regression modeling to identify factors predictive of receiving a rarely appropriate intervention also produced a significant model (pseudo R2= 0.06, P = .025), with lower Kellgren-Lawrence grade the only significant predictor of receiving a rarely appropriate intervention (odds ratio [OR] 0.54; 95% CI, 0.42 -0.72, per unit increase).
Timing from presentation to arthroplasty intervention was also evaluated. Age was a negative predictor (β coefficient -1.61), while positive predictors were reduced ROM (β coefficient 15.72) and having more AUC interventions (β coefficient 7.31) (model R2= 0.29, P = < .001). Age was the most significant predictor. Variance inflations factors were 1.02, 1.01, and 1.03, respectively. Receiving a rarely appropriate intervention was not associated with TKA timing.
Discussion
This single-center retrospective study examined the utilization of AAOS AUC-evaluated nonarthroplasty interventions for symptomatic knee OA prior to TKA. The aims of this study were to validate the AAOS AUC in a clinical setting and identify predictors of AAOS AUC utilization. In particular, this study focused on the number of interventions utilized prior to knee arthroplasty, whether interventions receiving a designation of rarely appropriate were used, and the duration of nonarthroplasty treatment.
Patients with knee instability used fewer total AAOS AUC evaluated interventions prior to TKA. Subjective instability has been reported as high as 27% in patients with OA and has been associated with fear of falling, poor balance confidence, activity limitations, and lower Western Ontario and McMaster Universities Osteoarthritis Index (WOMAC) physical function scores.12 However, it has not been found to correlate with knee laxity.13 Nevertheless, significant functional impairment with the risk of falling may reduce the number of nonarthroplasty interventions attempted. On the other hand, the presence of mechanical symptoms resulted in greater utilization of nonarthroplasty interventions. This is likely due to the greater utilization of arthroscopic partial menisectomy or loose body removal in this group of patients. Despite its inclusion as an AAOS AUC evaluated intervention, arthroscopy remains a contentious treatment for symptomatic knee pain in the setting of OA.14,15
For every unit decrease in Kellgren-Lawrence OA grade, patients were 54% more likely to receive a rarely appropriate intervention prior to knee arthroplasty. This is supported by the recent literature examining the AAOS AUC for surgical management of knee OA. Riddle and colleagues developed a classification tree to determine the contributions of various prognostic variables in final classifications of the 864 clinical vignettes used to develop the appropriateness algorithm and found that OA severity was strongly favored, with only 4 of the 432 vignettes with severe knee OA judged as rarely appropriate for surgical intervention.6
Our findings, too, may be explained by an AAOS AUC system that too heavily weighs radiographic severity of knee OA, resulting in more frequent rarely appropriate interventions in patients with less severe arthritis, including nonarthroplasty treatments. It is likely that rarely appropriate interventions were attempted in this subset of our study cohort based on patient’s subjective symptoms and functional status, both of which have been shown to be discordant with radiographic severity of knee OA.16
Oral or transcutaneous prescribed opioid medications were the most frequent intervention that received a rarely appropriate designation. Patients with preoperative opioid use undergoing TKA have been shown to have a greater risk for postoperative complications and longer hospital stay, particularly those patients aged < 75 years. Younger age, use of more interventions, and decreased knee ROM at presentation were predictive of longer duration of nonarthroplasty treatment. The use of more AAOS AUC evaluated interventions in these patients suggests that the AAOS AUC model may effectively be used to manage symptomatic OA, increasing the time from presentation to knee arthroplasty.
Interestingly, the use of rarely appropriate interventions did not affect TKA timing, as would be expected in a clinically effective nonarthroplasty treatment model. The reasons for rarely appropriate nonsurgical interventions are complex and require further investigation. One possible explanation is that decreased ROM was a marker for mechanical symptoms that necessitated additional intervention in the form of knee arthroscopy, delaying time to TKA.
Limitations
There are several limitations of this study. First, the small sample size (N = 90) requires acknowledgment; however, this limitation reflects the difficulty in following patients for years prior to an operative intervention. Second, the study population consists of veterans using the VA system and may not be reflective of the general population, differing with respect to gender, racial, and socioeconomic factors. Nevertheless, studies examining TKA utilization found, aside from racial and ethnic variability, patient gender and age do not affect arthroplasty utilization rate in the VA system.17
Additional limitations stem from the retrospective nature of this study. While the Computerized Patient Record System and centralized care of the VA system allows for review of all physical therapy consultations, orthotic consultations, and medications within the VA system, any treatments and intervention delivered by non-VA providers were not captured. Furthermore, the ability to assess for confounding variables limiting the prescription of certain medications, such as chronic kidney disease with NSAIDs or liver disease with acetaminophen, was limited by our study design.
Although our study suffers from selection bias with respect to examination of nonarthroplasty treatment in patients who have ultimately undergone TKA, we feel that this subset of patients with symptomatic knee OA represents the majority of patients evaluated for knee OA by orthopaedic surgeons in the clinic setting. It should be noted that although realignment osteotomies were sometimes indicated as appropriate by AAOS AUC model in our study population, this intervention was never performed due to patient and surgeon preference. Additionally, although it is not an AAOS AUC evaluated intervention, viscosupplementation was sporadically used during the study period; however, it is now off formulary at the investigation institution.
Conclusion
Our study suggests that patients without knee instability use more nonarthroplasty treatments over a longer period before TKA, and those patients with less severe knee OA are at risk of receiving an intervention judged to be rarely appropriate by the AAOS AUC. Such interventions do not affect timing of TKA. Nonarthroplasty care should be individualized to patients’ needs, and the decision to proceed with arthroplasty should be considered only after exhausting appropriate conservative measures. We recommend that providers use the AAOS AUC, especially when treating younger patients with less severe knee OA, particularly if considering opiate therapy or knee arthroscopy.
Acknowledgments
The authors would like to acknowledge Patrick Getty, MD, for his surgical care of some of the study patients. This material is the result of work supported with resources and the use of facilities at the Louis Stokes Cleveland VA Medical Center in Ohio.
1. Cross M, Smith E, Hoy D, et al. The global burden of hip and knee osteoarthritis: estimates from the Global Burden of Disease 2010 study. Ann Rheum Dis. 2014;73(7):1323-1330.
2. Losina E, Walensky RP, Kessler CL, et al. Cost-effectiveness of total knee arthroplasty in the United States: patient risk and hospital volume. Arch Intern Med. 2009;169(12):1113-1121; discussion 1121-1122.
3. Members of the Writing, Review, and Voting Panels of the AUC on the Non-Arthroplasty Treatment of Osteoarthritis of the Knee, Sanders JO, Heggeness MH, Murray J, Pezold R, Donnelly P. The American Academy of Orthopaedic Surgeons Appropriate Use Criteria on the Non-Arthroplasty Treatment of Osteoarthritis of the Knee. J Bone Joint Surg Am. 2014;96(14):1220-1221.
4. Sanders JO, Murray J, Gross L. Non-arthroplasty treatment of osteoarthritis of the knee. J Am Acad Orthop Surg. 2014;22(4):256-260.
5. Yates AJ Jr, McGrory BJ, Starz TW, Vincent KR, McCardel B, Golightly YM. AAOS appropriate use criteria: optimizing the non-arthroplasty management of osteoarthritis of the knee. J Am Acad Orthop Surg. 2014;22(4):261-267.
6. Riddle DL, Perera RA. Appropriateness and total knee arthroplasty: an examination of the American Academy of Orthopaedic Surgeons appropriateness rating system. Osteoarthritis Cartilage. 2017;25(12):1994-1998.
7. Morgan RC Jr, Slover J. Breakout session: ethnic and racial disparities in joint arthroplasty. Clin Orthop Relat Res. 2011;469(7):1886-1890.
8. O’Connor MI, Hooten EG. Breakout session: gender disparities in knee osteoarthritis and TKA. Clin Orthop Relat Res. 2011;469(7):1883-1885.
9. Ibrahim SA. Racial and ethnic disparities in hip and knee joint replacement: a review of research in the Veterans Affairs Health Care System. J Am Acad Orthop Surg. 2007;15(suppl 1):S87-S94.
10. Karmarkar TD, Maurer A, Parks ML, et al. A fresh perspective on a familiar problem: examining disparities in knee osteoarthritis using a Markov model. Med Care. 2017;55(12):993-1000.
11. Kohn MD, Sassoon AA, Fernando ND. Classifications in brief: Kellgren-Lawrence Classification of Osteoarthritis. Clin Orthop Relat Res. 2016;474(8):1886-1893.
12. Nguyen U, Felson DT, Niu J, et al. The impact of knee instability with and without buckling on balance confidence, fear of falling and physical function: the Multicenter Osteoarthritis Study. Osteoarthritis Cartilage. 2014;22(4):527-534.
13. Schmitt LC, Fitzgerald GK, Reisman AS, Rudolph KS. Instability, laxity, and physical function in patients with medial knee osteoarthritis. Phys Ther. 2008;88(12):1506-1516.
14. Laupattarakasem W, Laopaiboon M, Laupattarakasem P, Sumananont C. Arthroscopic debridement for knee osteoarthritis. Cochrane Database Syst Rev. 2008;(1):CD005118.
15. Lamplot JD, Brophy RH. The role for arthroscopic partial meniscectomy in knees with degenerative changes: a systematic review. Bone Joint J. 2016;98-B(7):934-938.
16. Whittle R, Jordan KP, Thomas E, Peat G. Average symptom trajectories following incident radiographic knee osteoarthritis: data from the Osteoarthritis Initiative. RMD Open. 2016;2(2):e000281.
17. Jones A, Kwoh CK, Kelley ME, Ibrahim SA. Racial disparity in knee arthroplasty utilization in the Veterans Health Administration. Arthritis Rheum. 2005;53(6):979-981.
Knee osteoarthritis (OA) affects almost 9.3 million adults in the US and accounts for $27 billion in annual health care expenses.1,2 Due to the increasing cost of health care and an aging population, there has been renewed interest in establishing criteria for nonarthroplasty treatment of knee OA.
In 2013, using the RAND/UCLA Appropriateness method, the American Academy of Orthopaedic Surgeons (AAOS) developed an appropriate use criteria (AUC) for nonarthroplasty management of primary OA of the knee, based on orthopaedic literature and expert opinion.3 Interventions such as activity modification, weight loss, prescribed physical therapy, nonsteroidal anti-inflammatory drugs, tramadol, prescribed oral or transcutaneous opioids, acetaminophen, intra-articular corticosteroids, hinged or unloading knee braces, arthroscopic partial menisectomy or loose body removal, and realignment osteotomy were assessed. An algorithm was developed for 576 patients scenarios that incorporated patient-specific, prognostic/predictor variables to assign designations of “appropriate,” “may be appropriate,” or “rarely appropriate,” to treatment interventions.4,5 An online version of the algorithm (orthoguidelines.org) is available for physicians and surgeons to judge appropriateness of nonarthroplasty treatments; however, it is not intended to mandate candidacy for treatment or intervention.
Clinical evaluation of the AAOS AUC is necessary to determine how treatment recommendations correlate with current practice. A recent examination of the AAOS Appropriateness System for Surgical Management of Knee OA found that prognostic/predictor variables, such as patient age, OA severity, and pattern of knee OA involvement were more heavily weighted when determining arthroplasty appropriateness than was pain severity or functional loss.6 Furthermore, non-AAOS AUC prognostic/predictor variables, such as race and gender, have been linked to disparities in utilization of knee OA interventions.7-9 Such disparities can be costly not just from a patient perceptive, but also employer and societal perspectives.10
The Department of Veterans Affairs (VA) health care system represents a model of equal-access-to care system in the US that is ideal for examination of issues about health care utilization and any disparities within the AAOS AUC model and has previously been used to assess utilization of total knee arthroplasty.9 The aim of this study was to characterize utilization of the AAOS AUC for nonarthroplasty treatment of knee OA in a VA patient population. We asked the following questions: (1) What variables are predictive of receiving a greater number of AAOS AUC evaluated nonarthroplasty treatments? (2) What variables are predictive of receiving “rarely appropriate” AAOS AUC evaluated nonarthroplasty treatment? (3) What factors are predictive of duration of nonarthroplasty care until total knee arthroplasty (TKA)?
Methods
The institutional review board at the Louis Stokes Cleveland VA Medical Center in Ohio approved a retrospective chart review of nonarthroplasty treatments utilized by patients presenting to its orthopaedic section who subsequently underwent knee arthroplasty between 2013 and 2016. Eligibility criteria included patients aged ≥ 30 years with a diagnosis of unilateral or bilateral primary knee OA. Patients with posttraumatic OA, inflammatory arthritis, and a history of infectious arthritis or Charcot arthropathy of the knee were excluded. Patients with a body mass index (BMI) > 40 or a hemoglobin A1c > 8.0 at presentation were excluded as nonarthroplasty care was the recommended course of treatment above these thresholds.
Data collected included race, gender, duration of nonarthroplasty treatment, BMI, and Kellgren-Lawrence classification of knee OA at time of presentation for symptomatic knee OA.11 All AAOS AUC-evaluated nonarthroplasty treatments utilized prior to arthroplasty intervention also were recorded (Table 1).
Statistical Analysis
Statistical analysis was completed with GraphPad Software Prism 7.0a (La Jolla, CA) and Mathworks MatLab R2016b software (Natick, MA). Univariate analysis with Student t tests with Welch corrections in the setting of unequal variance, Mann-Whitney nonparametric tests, and Fisher exact test were generated in the appropriate setting. Multivariable analyses also were conducted. For continuous outcomes, stepwise multiple linear regression was used to generate predictive models; for binary outcomes, binomial logistic regression was used.
Factors analyzed in regression modeling for the total number of AAOS AUC evaluated nonarthroplasty treatments utilized and the likelihood of receiving a rarely appropriate treatment included gender, race, function-limiting pain, range of motion (ROM), ligamentous instability, arthritis pattern, limb alignment, mechanical symptoms, BMI, age, and Kellgren-Lawrence grade. Factors analyzed in timing of TKA included the above variables plus the total number of AUC interventions, whether the patient received an inappropriate intervention, and average appropriateness of the interventions received. Residual analysis with Cook’s distance was used to identify outliers in regression. Observations with Cook’s distance > 3 times the mean Cook’s distance were identified as potential outliers, and models were adjusted accordingly. All statistical analyses were 2-tailed. Statistical significance was set to P ≤ .05 for all outputs.
Results
In the study, 97.8% of participants identified as male, and the mean age was 62.8 years (Table 3).
Appropriate Use Criteria Interventions
Patients received a mean of 5.2 AAOS AUC evaluated interventions before undergoing arthroplasty management at a mean of 32.3 months (range 2-181 months) from initial presentation. The majority of these interventions were classified as either appropriate or may be appropriate, according to the AUC definitions (95.1%). Self-management and physical therapy programs were widely utilized (100% and 90.1%, respectively), with all use of these interventions classified as appropriate.
Hinged or unloader knee braces were utilized in about half the study patients; this intervention was classified as rarely appropriate in 4.4% of these patients. Medical therapy was also widely used, with all use of NSAIDs, acetaminophen, and tramadol classified as appropriate or may be appropriate. Oral or transcutaneous opioid medications were prescribed in 14.3% of patients, with 92.3% of this use classified as rarely appropriate. Although the opioid medication prescribing provider was not specifically evaluated, there were no instances in which the orthopaedic service provided an oral or transcutaneous opioid prescriptions. Procedural interventions, with the exception of corticosteroid injections, were uncommon; no patient received realignment osteotomy, and only 12.1% of patients underwent arthroscopy. The use of arthroscopy was deemed rarely appropriate in 72.7% of these cases.
Factors Associated With AAOS AUC Intervention Use
There was no difference in the number of AAOS AUC evaluated interventions received based on BMI (mean [SD] BMI < 35, 5.2 [1.0] vs BMI ≥ 35, 5.3 [1.1], P = .49), age (mean [SD] aged < 60 years, 5.4 [1.0] vs aged ≥ 60 years, 5.1 [1.2], P = .23), or Kellgren-Lawrence arthritic grade (mean [SD] grade ≤ 2, 5.5 [1.0] vs grade > 2, 5.1 [1.1], P = .06). These variables also were not associated with receiving a rarely appropriate intervention (mean [SD] BMI < 35, 0.27 [0.5] vs BMI > 35, 0.2 [0.4], P = .81; aged > 60 years, 0.3 [0.5] vs aged < 60 years, 0.2 [0.4], P = .26; Kellgren-Lawrence grade < 2, 0.4 [0.6] vs grade > 2, 0.2 [0.4], P = .1).
Regression modeling to predict total number of AAOS AUC evaluated interventions received produced a significant model (R2 = 0.111, P = .006). The presence of ligamentous instability (β coefficient, -1.61) and the absence of mechanical symptoms (β coefficient, -0.67) were negative predictors of number of AUC interventions received. Variance inflation factors were 1.014 and 1.012, respectively. Likewise, regression modeling to identify factors predictive of receiving a rarely appropriate intervention also produced a significant model (pseudo R2= 0.06, P = .025), with lower Kellgren-Lawrence grade the only significant predictor of receiving a rarely appropriate intervention (odds ratio [OR] 0.54; 95% CI, 0.42 -0.72, per unit increase).
Timing from presentation to arthroplasty intervention was also evaluated. Age was a negative predictor (β coefficient -1.61), while positive predictors were reduced ROM (β coefficient 15.72) and having more AUC interventions (β coefficient 7.31) (model R2= 0.29, P = < .001). Age was the most significant predictor. Variance inflations factors were 1.02, 1.01, and 1.03, respectively. Receiving a rarely appropriate intervention was not associated with TKA timing.
Discussion
This single-center retrospective study examined the utilization of AAOS AUC-evaluated nonarthroplasty interventions for symptomatic knee OA prior to TKA. The aims of this study were to validate the AAOS AUC in a clinical setting and identify predictors of AAOS AUC utilization. In particular, this study focused on the number of interventions utilized prior to knee arthroplasty, whether interventions receiving a designation of rarely appropriate were used, and the duration of nonarthroplasty treatment.
Patients with knee instability used fewer total AAOS AUC evaluated interventions prior to TKA. Subjective instability has been reported as high as 27% in patients with OA and has been associated with fear of falling, poor balance confidence, activity limitations, and lower Western Ontario and McMaster Universities Osteoarthritis Index (WOMAC) physical function scores.12 However, it has not been found to correlate with knee laxity.13 Nevertheless, significant functional impairment with the risk of falling may reduce the number of nonarthroplasty interventions attempted. On the other hand, the presence of mechanical symptoms resulted in greater utilization of nonarthroplasty interventions. This is likely due to the greater utilization of arthroscopic partial menisectomy or loose body removal in this group of patients. Despite its inclusion as an AAOS AUC evaluated intervention, arthroscopy remains a contentious treatment for symptomatic knee pain in the setting of OA.14,15
For every unit decrease in Kellgren-Lawrence OA grade, patients were 54% more likely to receive a rarely appropriate intervention prior to knee arthroplasty. This is supported by the recent literature examining the AAOS AUC for surgical management of knee OA. Riddle and colleagues developed a classification tree to determine the contributions of various prognostic variables in final classifications of the 864 clinical vignettes used to develop the appropriateness algorithm and found that OA severity was strongly favored, with only 4 of the 432 vignettes with severe knee OA judged as rarely appropriate for surgical intervention.6
Our findings, too, may be explained by an AAOS AUC system that too heavily weighs radiographic severity of knee OA, resulting in more frequent rarely appropriate interventions in patients with less severe arthritis, including nonarthroplasty treatments. It is likely that rarely appropriate interventions were attempted in this subset of our study cohort based on patient’s subjective symptoms and functional status, both of which have been shown to be discordant with radiographic severity of knee OA.16
Oral or transcutaneous prescribed opioid medications were the most frequent intervention that received a rarely appropriate designation. Patients with preoperative opioid use undergoing TKA have been shown to have a greater risk for postoperative complications and longer hospital stay, particularly those patients aged < 75 years. Younger age, use of more interventions, and decreased knee ROM at presentation were predictive of longer duration of nonarthroplasty treatment. The use of more AAOS AUC evaluated interventions in these patients suggests that the AAOS AUC model may effectively be used to manage symptomatic OA, increasing the time from presentation to knee arthroplasty.
Interestingly, the use of rarely appropriate interventions did not affect TKA timing, as would be expected in a clinically effective nonarthroplasty treatment model. The reasons for rarely appropriate nonsurgical interventions are complex and require further investigation. One possible explanation is that decreased ROM was a marker for mechanical symptoms that necessitated additional intervention in the form of knee arthroscopy, delaying time to TKA.
Limitations
There are several limitations of this study. First, the small sample size (N = 90) requires acknowledgment; however, this limitation reflects the difficulty in following patients for years prior to an operative intervention. Second, the study population consists of veterans using the VA system and may not be reflective of the general population, differing with respect to gender, racial, and socioeconomic factors. Nevertheless, studies examining TKA utilization found, aside from racial and ethnic variability, patient gender and age do not affect arthroplasty utilization rate in the VA system.17
Additional limitations stem from the retrospective nature of this study. While the Computerized Patient Record System and centralized care of the VA system allows for review of all physical therapy consultations, orthotic consultations, and medications within the VA system, any treatments and intervention delivered by non-VA providers were not captured. Furthermore, the ability to assess for confounding variables limiting the prescription of certain medications, such as chronic kidney disease with NSAIDs or liver disease with acetaminophen, was limited by our study design.
Although our study suffers from selection bias with respect to examination of nonarthroplasty treatment in patients who have ultimately undergone TKA, we feel that this subset of patients with symptomatic knee OA represents the majority of patients evaluated for knee OA by orthopaedic surgeons in the clinic setting. It should be noted that although realignment osteotomies were sometimes indicated as appropriate by AAOS AUC model in our study population, this intervention was never performed due to patient and surgeon preference. Additionally, although it is not an AAOS AUC evaluated intervention, viscosupplementation was sporadically used during the study period; however, it is now off formulary at the investigation institution.
Conclusion
Our study suggests that patients without knee instability use more nonarthroplasty treatments over a longer period before TKA, and those patients with less severe knee OA are at risk of receiving an intervention judged to be rarely appropriate by the AAOS AUC. Such interventions do not affect timing of TKA. Nonarthroplasty care should be individualized to patients’ needs, and the decision to proceed with arthroplasty should be considered only after exhausting appropriate conservative measures. We recommend that providers use the AAOS AUC, especially when treating younger patients with less severe knee OA, particularly if considering opiate therapy or knee arthroscopy.
Acknowledgments
The authors would like to acknowledge Patrick Getty, MD, for his surgical care of some of the study patients. This material is the result of work supported with resources and the use of facilities at the Louis Stokes Cleveland VA Medical Center in Ohio.
1. Cross M, Smith E, Hoy D, et al. The global burden of hip and knee osteoarthritis: estimates from the Global Burden of Disease 2010 study. Ann Rheum Dis. 2014;73(7):1323-1330.
2. Losina E, Walensky RP, Kessler CL, et al. Cost-effectiveness of total knee arthroplasty in the United States: patient risk and hospital volume. Arch Intern Med. 2009;169(12):1113-1121; discussion 1121-1122.
3. Members of the Writing, Review, and Voting Panels of the AUC on the Non-Arthroplasty Treatment of Osteoarthritis of the Knee, Sanders JO, Heggeness MH, Murray J, Pezold R, Donnelly P. The American Academy of Orthopaedic Surgeons Appropriate Use Criteria on the Non-Arthroplasty Treatment of Osteoarthritis of the Knee. J Bone Joint Surg Am. 2014;96(14):1220-1221.
4. Sanders JO, Murray J, Gross L. Non-arthroplasty treatment of osteoarthritis of the knee. J Am Acad Orthop Surg. 2014;22(4):256-260.
5. Yates AJ Jr, McGrory BJ, Starz TW, Vincent KR, McCardel B, Golightly YM. AAOS appropriate use criteria: optimizing the non-arthroplasty management of osteoarthritis of the knee. J Am Acad Orthop Surg. 2014;22(4):261-267.
6. Riddle DL, Perera RA. Appropriateness and total knee arthroplasty: an examination of the American Academy of Orthopaedic Surgeons appropriateness rating system. Osteoarthritis Cartilage. 2017;25(12):1994-1998.
7. Morgan RC Jr, Slover J. Breakout session: ethnic and racial disparities in joint arthroplasty. Clin Orthop Relat Res. 2011;469(7):1886-1890.
8. O’Connor MI, Hooten EG. Breakout session: gender disparities in knee osteoarthritis and TKA. Clin Orthop Relat Res. 2011;469(7):1883-1885.
9. Ibrahim SA. Racial and ethnic disparities in hip and knee joint replacement: a review of research in the Veterans Affairs Health Care System. J Am Acad Orthop Surg. 2007;15(suppl 1):S87-S94.
10. Karmarkar TD, Maurer A, Parks ML, et al. A fresh perspective on a familiar problem: examining disparities in knee osteoarthritis using a Markov model. Med Care. 2017;55(12):993-1000.
11. Kohn MD, Sassoon AA, Fernando ND. Classifications in brief: Kellgren-Lawrence Classification of Osteoarthritis. Clin Orthop Relat Res. 2016;474(8):1886-1893.
12. Nguyen U, Felson DT, Niu J, et al. The impact of knee instability with and without buckling on balance confidence, fear of falling and physical function: the Multicenter Osteoarthritis Study. Osteoarthritis Cartilage. 2014;22(4):527-534.
13. Schmitt LC, Fitzgerald GK, Reisman AS, Rudolph KS. Instability, laxity, and physical function in patients with medial knee osteoarthritis. Phys Ther. 2008;88(12):1506-1516.
14. Laupattarakasem W, Laopaiboon M, Laupattarakasem P, Sumananont C. Arthroscopic debridement for knee osteoarthritis. Cochrane Database Syst Rev. 2008;(1):CD005118.
15. Lamplot JD, Brophy RH. The role for arthroscopic partial meniscectomy in knees with degenerative changes: a systematic review. Bone Joint J. 2016;98-B(7):934-938.
16. Whittle R, Jordan KP, Thomas E, Peat G. Average symptom trajectories following incident radiographic knee osteoarthritis: data from the Osteoarthritis Initiative. RMD Open. 2016;2(2):e000281.
17. Jones A, Kwoh CK, Kelley ME, Ibrahim SA. Racial disparity in knee arthroplasty utilization in the Veterans Health Administration. Arthritis Rheum. 2005;53(6):979-981.
Accessibility and Uptake of Pre-Exposure Prophylaxis for HIV Prevention in the VHA (FULL)
Despite important advances in treatment and prevention over the past 30 years, HIV remains a significant public health concern in the US, with nearly 40,000 new HIV infections. annually.1 Among the estimated 1.1 million Americans currently living with HIV, 1 in 8 remains undiagnosed, and only half (49%) are virally suppressed.2 Although data demonstrate that viral suppression virtually eliminates the risk of transmission among people living with HIV, pre-exposure prophylaxis (PrEP) for HIV remains an integral part of a coordinated effort to reduce transmission. Uptake of PrEP is particularly vital considering the large percentage of people in the US living with HIV who are not virally suppressed because they have not started, are unable to stay on HIV antiretroviral treatment, or have not been diagnosed.
The Department of Veterans Affairs (VA) is the largest single provider of care to HIV-infected individuals in the US, with more than 28,000 veterans in care with HIV in 2016 (data from the VA National HIV Clinical Registry Reports, written communication from Population Health Service, Office of Patient Care Services, January 2018).
The only FDA-approved medication for HIV pre-exposure prophylaxis is tenofovir disoproxil fumarate/emtricitabine (TDF/FTC), a fixed-dose combination of 2 antiretroviral medications that are also used to treat HIV. Its efficacy has been proven among numerous populations at risk for HIV, including those with sexual and injection drug use risk factors.4,5 Use of TDF/FTC for PrEP has been available at the VA since its July 2012 FDA approval. In May 2014, the US Public Health Service (PHS) and the US Department of Health and Human Services released the first comprehensive clinical practice guidelines for PrEP. Soon after, in September 2014, the VA released more formal guidance on the use of TDF/FTC for HIV PrEP as outlined by the PHS.6 Similar to patterns outside the VA, PrEP uptake across the Veterans Health Administration (VHA) has been modest and variable.
A recent VHA analysis of the variability in PrEP uptake identified about 1,600 patients who had been prescribed PrEP in the VA as of June 2017 among about 6 million veterans in care. Across VA medical facilities, the absolute number of PrEP initiations ranged from 0 to 109 with the maximum PrEP initiation rate at 146.4/100,000 veterans in care. Eight facilities did not initiate a single PrEP prescription over the 5-year period. This study presents strategicefforts undertaken by the VA to increase access to and uptake of PrEP across the health care system and to decrease disparities in HIV prevention care.
VA National Pr EP Working Group
In the beginning of 2017, the HIV, Hepatitis, and Related Conditions (HHRC) programs within the VHA Office of Specialty Care Services convened a national working group to better measure and address the gaps in PrEP usage across the health care system. This multidisciplinary PrEP Working Group was composed of more than 40 members with expertise in HIV clinical care and PrEP, including physicians, clinical pharmacists, advanced practice registered nurses (APRNs), physician assistants (PAs), social workers, psychologists, implementation scientists, and representatives from other VA programs with a relevant programmatic or policy interest in PrEP.
Implementation Targets
The National PrEP Working Group identified increased PrEP uptake across the VHA system as the primary implementation target with a specific focus on increasing PrEP use in primary care clinics and among those at highest risk. As noted earlier, overall uptake of PrEP across VHA medical facilities has been modest; however, new PrEP initiations have increased in each 12-month period since FDA approval (Figure 1).
To rapidly understand barriers to accessing PrEP, the National PrEP Working Group developed and deployed an informal survey to HIV clinicians at all VA facilities, with nearly half responding (n = 68). These frontline providers identified several important and common barriers inhibiting PrEP uptake, including knowledge gaps among providers without infectious diseases training
Patient adherence was not identified by providers as a significant barrier to PrEP uptake in this informal survey. A recent analysis of adherence among a national cohort of veterans on HIV PrEP in VA care between July 2012 and June 2016 found that adherence in the first year of PrEP was high with some differences detected by age, race, and gender.8
As an initial step in addressing these identified barriers to prescribing PrEP in the VHA, the National PrEP Working Group developed several provider education materials, trainings, and support tools to impact the overarching goal, and identified implementation targets of increasing access outside of primary care and among noninfectious disease and nonphysician clinicians, ensuring high-quality PrEP care in all settings, and targeting PrEP uptake to at-risk populations (Table). 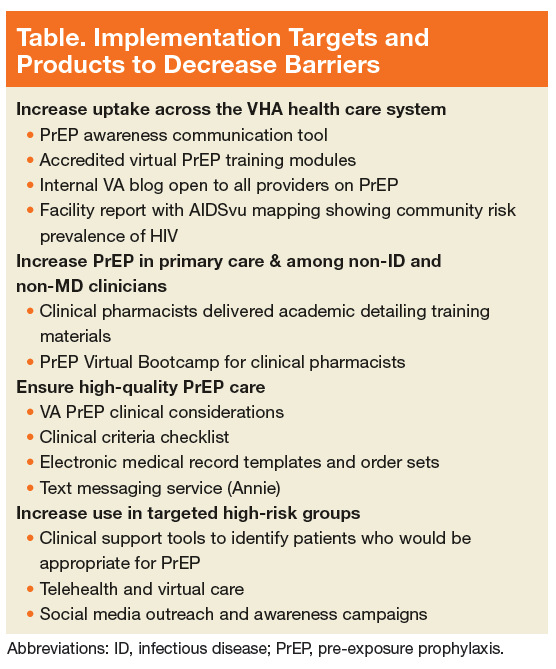
Increasing PrEP Use in Primary Care and Women’s Health Clinics
As of June 2017, physicians (staff, interns, residents, and fellows) accounted for more than three-quarters of VA PrEP index prescriptions. Among staff physicians, infectious diseases specialists initiated 67% of all prescriptions. Clinical pharmacists prescribed only 6%; APRNs and PAs prescribed 16% of initiations. This is unsurprising, as the field survey identified lack of awareness and specific training on PrEP care among providers without infectious diseases training as a common barrier.
The VA is the largest US employer of nurses, including more than 5,500 APRNs. In December 2016, the VA granted full practice authority to APRNs across the health care system, regardless of state restrictions in most cases.9
In 2015, the VA employed about 7,700 clinical pharmacists, 3,200 of whom had an active SOP that allowed for prescribing authority. In fiscal year 2015, clinical pharmacists were responsible for at least 20% of all hepatitis C virus (HCV) prescriptions and 69% of prescriptions for anticoagulants across the system.10 Clinical pharmacists are increasingly recognized for their extensive contributions to increasing access to treatment in the VA across a broad spectrum of clinical issues. With this infrastructure and expertise, clinical pharmacists also are well positioned to expand their scope to include PrEP.
To that end, the National PrEP Working Group worked closely with clinical pharmacists in the field and from the VA Academic Detailing Service (ADS) within the VA Pharmacy Benefits Management Services office. The ADS supports the development of scholarly, balanced, evidence-based educational tools and information for frontline VA providers using one-on-one social marketing techniques to impact specific clinical targets. These interventions are delivered by clinical pharmacists to empower VA clinicians and promote evidence-based clinical care to help reduce variability in practice across the system.11 An ADS module for PrEP has been developed and will be available in 2018 across the VHA to facilities participating in the ADS.
A virtual accredited training program on prescribing PrEP and monitoring patients on PrEP designed for clinical pharmacists will be delivered early in 2018 to complement these materials and will be open to all prescribers interested in learning more about PrEP. By offering a complement of training and clinical support tools, most of which are detailed in other sections of this article, the National PrEP Working Group is creating educational opportunities that are accessible in a variety of different formats to decrease knowledge barriers over PrEP prescribing and build over time a broader pool of VA clinicians trained in PrEP care.
Ensuring High-Quality PrEP Care
One system-level concern about expanding PrEP to providers without infectious diseases training is the quality of follow-up care. In order to aid noninfectious diseases clinicians, and nonphysician providers who are not as familiar with PrEP, several clinical support tools have been created, including (1) VA’s Clinical Considerations for PrEP to Prevent HIV Infection, which is aligned with CDC clinical guidance12; (2) a PrEP clinical criterion check list; (3) clinical support tools, such as prepopulated electronic health record (EHR) templates and order menus to facilitate PrEP prescribing and monitoring in busy primary care clinical settings; and (4) PrEP-specific texts in the Annie App, an automated text-messaging application developed by the VA Office of Connected Care, which supports medication adherence, appointment attendance, vitals tracking, and education.13
Available evidence indicates that there is potential for disparities in PrEP effectiveness in the VA related to varying medication adherence. Analysis of pharmacy refill records found that adherence with TDF/FTC was high in the first year after PrEP initiation (median proportion of days covered in the first year was 74%), but adherence was lower among veterans in VA care who were African American, women, and/or under age 45 years.8 This highlights the importance of enhanced services, such as Annie, to support PrEP adherence in at-risk groups as well as monitoring of HIV risk factors to ensure PrEP is still indicated.
Targeting PrEP Uptake for High-Risk Veterans
Although the VA’s overarching goal is to increase access to and uptake of PrEP across the VHA, it also is important to direct resources to those at greatest risk of acquiring HIV infection. The National PrEP Working Group has focused on the following critical implementation issues in the VA’s strategic approach to HIV prevention, with a specific focus on the geographic disparities between PrEP uptake and HIV risk across the VHA as well as disparities based on rurality, race/ethnicity, and gender.
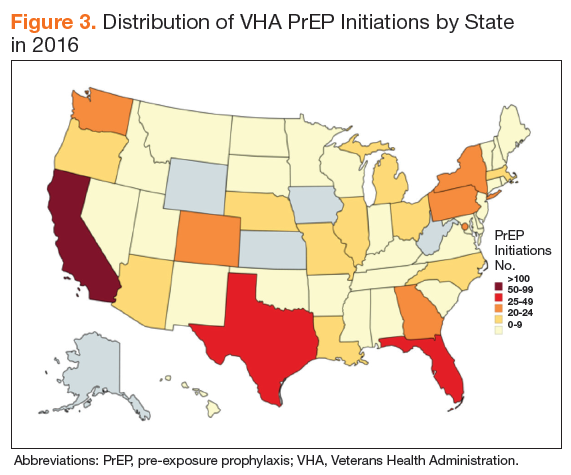
The majority of the VHA patient population is male (91% in 2016).14 A VHA analysis of PrEP initiations in the VA indicates that in June 2017, 97% of veterans in VA care receiving PrEP were male, 69% were white, 88% resided in urban areas, and the average age was 41.6 years. An analysis of PrEP initiation in the VA indicates that current PrEP uptake is clustered in a few geographic areas and that some areas with high HIV incidence had low uptake.15 States with the highest risk of HIV infection are in the Southeast, followed by parts of the West, Midwest, and Northeast (Figure 2).16,17 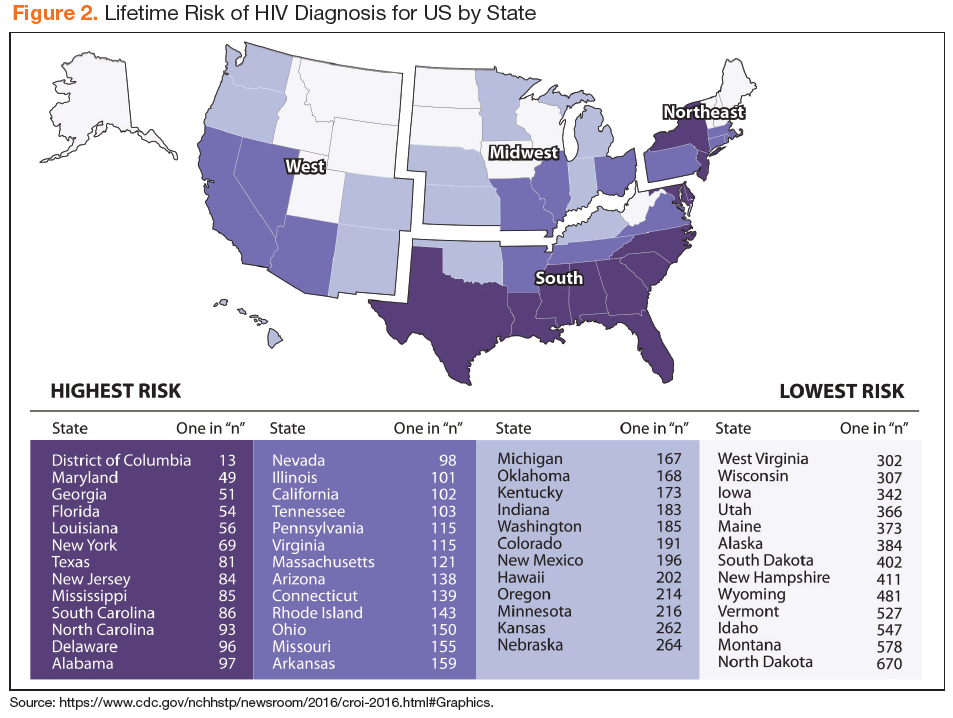
Rural areas are increasingly impacted by the HIV epidemic in the US, but access to PrEP is often limited in rural communities.19 Several rural counties in the Southeastern US now have rates of new HIV infection comparable with those historically seen in only the largest cities.1 In addition, recent outbreaks of HIV and hepatitis C virus infection related to needle sharing highlight the need for HIV prevention programs in rural areas impacted by the opioid epidemic.20
About 1 in 4 veterans overall—and 16% of veterans in care who are HIV-positive—reside in rural areas, but only 4.3% of veterans who had initiated PrEP through 2017 resided in rural areas.21,22 In order to address the need to improve access to PrEP in many rural-serving VHA facilities, the PrEP Working Group has emphasized the increased utilization of virtual care (telehealth, Annie App, the Virtual Medical Room) and broadening the pool of available PrEP prescribers to include noninfectious diseases physicians, pharmacists, and APRNs.
Important racial and ethnic disparities also exist in PrEP access nationally. For example, in the US as a whole, African American MSM, followed by Latino MSM continue to be at highest risk for HIV infection.1 In 2015, 45% of all new HIV infections in the US were among African Americans, 26% of whom were women and 58% identified as gay or bisexual.23 A recent analysis of US retail pharmacies that dispensed FTC/TDF analyzed the racial demographics of PrEP uptake and found that the majority of PrEP initiations were among whites (74%), followed by Hispanics (12%) and African Americans (10%); and females of all races made up 20.7%.24 The VA is performing better than these national averages. Of the 688 PrEP prescriptions in the VA in 2016, 64% of recipients identified themselves as white and 23% as African American. Hispanic ethnicity was reported by 13%.
There are several limitations to identifying a specific implementation target for PrEP across the VA system, including the challenge of accurately identifying the population at risk via the EHR or clinical informatics tools. For example, strong risk factors for HIV acquisition include IV drug use, receptive anal intercourse without a condom, and needlesticks.
Behaviors that pose lower risk, such as vaginal intercourse or insertive anal intercourse could contribute to a higher overall lifetime risk if these behaviors occur frequently.25 Behavioral risk factors are not well captured in the VA EHR, making it difficult to identify potential PrEP candidates through population health tools. Additionally, stigma and discrimination may make it difficult for a patient to disclose to their clinician and for a clinician to inquire into behavioral risk factors. The criminalization of HIV-related risk behaviors in some states also may complicate the identification of potential PrEP candidates.26,27 These issues contribute to the challenges that providers face in screening for HIV risk and that patients face in disclosing their personal risk.
To address these regional, rural, and ethnic disparities and enhance the identification of potential PrEP recipients, the National PrEP Working Group is developing a suite of tools to support frontline providers in identifying potential PrEP recipients and expanding care to those at highest risk and who may be more difficult to reach due to rurality, concerns about stigma, or other issues. 
- Clinical support tools to identify potential PrEP recipients, such as a clinical reminder that identifies patients at high risk for HIV based on diagnosis codes, and a PrEP clinical dashboard;
- A telehealth protocol for PrEP care and promotion of the VA Virtual Medical Room, which allows providers to video conference with patients in their home; and
- Social media outreach and awareness campaigns targeted at veterans to increase PrEP awareness are being shared through VA Facebook and Twitter accounts, blog posts, and www.hiv.va.gov posts (Figure 4).
Implementation Strategy & Evaluation
During the calendar year 2017, the PrEP Working Group met monthly and in smaller subcommittees to develop the strategic plan, products, and tools described earlier. On World AIDS Day, a virtual live meeting on PrEP was made available to all providers across the system and will be made available for continuing education training through the VA online employee education system. During 2018, the primary focus of the PrEP Working Group will be the continued development and refinement of provider education materials, clinical tools, and data tracking as well as increasing veteran outreach through social media and other awareness campaigns planned throughout the year.
Annual assessment of PrEP uptake will evaluate progress on the primary implementation target and areas of clinical practice: (1) increase number of PrEP prescriptions overall; (2) ensure PrEP is prescribed at all VA facilities; (3) increase preciptions by noninfectious diseases provider; (4) increase prescriptions by clinical pharmacists and APRNs; (5) monitor quality of care, including by discipline/practice setting; (6) increase PrEP prescriptions in facilities in endemic areas; and (7) increase the proportion of PrEP prescriptions for veterans of color.
In 2019 and 2020, additional targeted intervention and outreach plans will be developed for sites with difficulty meeting implementation targets. Sites in highly HIV-endemic areas will be a priority, and outreach will be designed to assist in the identification of facility-level barriers to PrEP use.
Conclusion
HIV remains an important public health issue in the US and among veterans in VA care, and prevention is a critical component to combat the epidemic. The VHA is the largest single provider of HIV care in the US with facilities and community-based outpatient clinics in all states and US territories.
The VA seems to be performing better in terms of the proportion of PrEP uptake among racial groups at highest risk for HIV compared with a US sample from retail pharmacies, which may be, in part, driven by the cost of PrEP and follow-up sexually transmitted infection testing.24 However, a considerable gap remain in VHA PrEP uptake among populations at highest risk for HIV in the US.
With the investment of a National PrEP Working Group, the VA is charting a course to augment its HIV prevention services to exceed the US nationally. The National PrEP Working Group will continue to develop specific, measurable, and impactful targets guided by state-of-the-art scientific evidence and surveillance data and a suite of educational and clinical resources designed to assist frontline providers, facilities, and patients in meeting clearly defined implementation targets.
Click here to read the digital edition.
1. Centers for Disease Control and Prevention. HIV surveillance report, 2016; Vol 28. https://www.cdc.gov/hiv/pdf/library/reports/surveillance/cdc-hiv-surveillance -report-2016-vol-28.pdf. Published November 2017. Accessed February 12, 2018.
2. Centers for Disease Control and Prevention. HIV continuum of care, US, 2014, overall and by age, race/ethnicity, transmission route and sex. https://www.cdc .gov/nchhstp/newsroom/2017/HIV-Continuum-of-Care.html. Updated September 12, 2017. Accessed February 12, 2018.
3. Branson BM, Handsfield HH, Lampe MA, et al; Centers for Disease Control and Prevention (CDC). Revised recommendations for HIV testing of adults, adolescents, and pregnant women in health-care settings. MMWR Recomm Rep. 2006;55(RR-14):1-17.
4. US Food and Drug Administration. FDA approves first medication to reduce HIV risk [press release]. https://aidsinfo.nih.gov/news/1254/fda-approves-first-drug -for-reducing-the-risk-of-sexually-acquired-hiv-infection. Published July 12, 2012. Accessed February 14, 2018.
5. Fonner VA, Dalglish SL, Kennedy CE, et al. Effectiveness and safety of oral HIV preexposure prophylaxis for all populations. AIDS. 2016;30(12):1973-1983.
6. Centers for Disease Control and Prevention, US Public Health Service. Preexposure prophylaxis for the prevention of HIV infection in the United States—2014: a clinical practice guideline. http://www.cdc.gov/hiv/pdf/PrEPguidelines2014.pdf. Published 2014. Accessed February 12, 2018.
7. Smith DK, Mendoza MC, Stryker JE, Rose CE. PrEP awareness and attitudes in a national survey of primary care clinicians in the United States, 2009-2015. PLoS One. 2016;11(6):e0156592.
8. Van Epps P, Maier M, Lund B, et al. Medication adherence in a nationwide cohort of veterans initiating pre-exposure prophylaxis (PrEP) to prevent HIV infection. J Acquir Immune Defic Syndr. 2018;77(3):272-278.
9. US Department of Veterans Affairs. 38 CFR Part 17, RIN 2900-AP44. Advance Practice Registered Nurses. Federal Register, Rules and Regulations. 81(240) December 14, 2016
10. Ourth H, Groppi J, Morreale AP, Quicci-Roberts K. Clinical pharmacist prescribing activities in the Veterans Health Administration. Am J Health Syst Pharm. 2016;73(18):1406-1415.
11. US Department of Veterans Affairs, Pharmacy Benefits Management Academic Detailing Service. VA academic detailing implementation guide. https://www.pbm.va.gov/PBM/AcademicDetailingService/Documents/VA_Academic_Detailing_Implementation_Guide.pdf. Published September 2016. Accessed February 12, 2018.
12. Veterans Health Administration US Department of Veterans Affairs, Veterans Health Administration, Office of Specialty Services, HIV, Hepatitis, and Related Conditions Programs. Pre-exposure prophylaxis (PrEP) to prevent HIV infection: clinical considerations from the Department of Veterans Affairs National HIV Program. https://www.hiv.va.gov/pdf/PrEP-considerations.pdf. Published September 2016. Accessed January 4, 2018.
13. US Department of Veterans Affairs, VA Mobile Health. Annie app for clinicians. https://mobile.va.gov/app/annie-app-clinicians. Published September 2016. Accessed January 4, 2018.
14. US Department of Veterans Affairs, National Center for Veterans Analysis and Statistics. VA utilization profile FY 2016. https://www.va.gov/vetdata/docs/Quickfacts/VA_Utilization_Profile.pdf. Published . November 2017. Accessed March 5, 2018.
15. Van Epps P. Pre-exposure prophylaxis for HIV prevention: the use and effectiveness of PrEP in the Veterans Health Administration (VHA). Abstract presented at: Infectious Diseases Week 2016; October 26-30, 2016; New Orleans, LA. https://idsa.confex.com/idsa/2016/webprogram/Paper60122.html. Accessed February 12, 2018.
16. Centers for Disease Control and Prevention. 2016 conference on retroviruses and opportunistic infections, lifetime risk of HIV diagnosis by state: https://www.cdc .gov/nchhstp/newsroom/images/2016/CROI_lifetime_risk_state.jpg. Published February 24, 2016. Accessed February 12, 2018.
17. Elopre L, Kudroff K, Westfall AO, Overton ET, Mugavero MJ. Brief report: the right people, right places, and right practices: disparities in PrEP access among African American men, women, and MSM in the Deep South. J Acquir Immune Defic Syndr. 2017;74(1):56-59.
18. Wu H, Mendoza MC, Huang YA, Hayes T, Smith DK, Hoover KW. Uptake of HIV preexposure prophylaxis among commercially insured persons-United States, 2010-2014. Clin Infect Dis. 2017;64(2):144-149.
19. Schafer KR, Albrecht H, Dillingham R, et al. The continuum of HIV care in rural communities in the United States and Canada: what is known and future research directions. J Acquir Immune Defic Syndr. 2017;75(1):355-344.
20. Conrad C, Bradley HM, Broz D, et al; Centers for Disease Control and Prevention (CDC). community outbreak of hiv infection linked to injection drug use of oxymorphone—Indiana, 2015. MMWR Morb Mortal Wkly Rep. 2015;64(16):443-444.
21. Ohl ME, Richardson K, Kaboli P, Perencevich E, Vaughan-Sarrazin M. Geographic access and use of infectious diseases specialty and general primary care services by veterans with HIV infection: implications for telehealth and shared care programs. J Rural Health. 2014;30(4):412-421.
22. US Department of Veterans Affairs, Office of Rural Health. Rural veterans’ health care challenges. https://www.ruralhealth.va.gov/aboutus/ruralvets.asp. Updated February 9, 2018. Accessed on February 12, 2018.
23. Centers for Disease Control and Prevention. HIV among African Americans. https://www.cdc.gov/hiv/group/racialethnic/africanamericans/index.html. Updated February 9, 2018. Accessed on February 12, 2018.
24. Bush S, Magnuson D, Rawlings K, et al. Racial characteristics of FTC/TDF for pre-exposure prophylaxis (PrEP) users in the US. Paper presented at: ASM Microbe Conference 2016; June 16-20, 2016; Boston, MA.
25. Centers for Disease Control and Prevention. HIV risk behaviors. https://www.cdc .gov/hiv/pdf/risk/estimates/cdc-hiv-risk-behaviors.pdf. Published December 2015. Accessed on February 12, 2018.
26. Lehman JS, Carr MH, Nichol AJ, et al. Prevalence and public health implications of state laws that criminalize potential HIV exposure in the United States. AIDS Behav. 2014;18(6):997-1006.
27. US Department of Justice, Civil Rights Division. Best practices guide to reform HIV-specific criminal laws to align with scientifically-supported factors. https://www.hivlawandpolicy.org/sites/default/files/DOj-HIV-Criminal-Law-Best-Practices-Guide.pdf. March 2014. Accessed on February 12, 2018.
28. Backus L, Czarnogorski M, Yip G, et al. HIV care continuum applied to the US Department of Veterans Affairs: HIV virologic outcomes in an integrated health care system. J Acquir Immune Defic Syndr. 2015;69(4):474-480.
Despite important advances in treatment and prevention over the past 30 years, HIV remains a significant public health concern in the US, with nearly 40,000 new HIV infections. annually.1 Among the estimated 1.1 million Americans currently living with HIV, 1 in 8 remains undiagnosed, and only half (49%) are virally suppressed.2 Although data demonstrate that viral suppression virtually eliminates the risk of transmission among people living with HIV, pre-exposure prophylaxis (PrEP) for HIV remains an integral part of a coordinated effort to reduce transmission. Uptake of PrEP is particularly vital considering the large percentage of people in the US living with HIV who are not virally suppressed because they have not started, are unable to stay on HIV antiretroviral treatment, or have not been diagnosed.
The Department of Veterans Affairs (VA) is the largest single provider of care to HIV-infected individuals in the US, with more than 28,000 veterans in care with HIV in 2016 (data from the VA National HIV Clinical Registry Reports, written communication from Population Health Service, Office of Patient Care Services, January 2018).
The only FDA-approved medication for HIV pre-exposure prophylaxis is tenofovir disoproxil fumarate/emtricitabine (TDF/FTC), a fixed-dose combination of 2 antiretroviral medications that are also used to treat HIV. Its efficacy has been proven among numerous populations at risk for HIV, including those with sexual and injection drug use risk factors.4,5 Use of TDF/FTC for PrEP has been available at the VA since its July 2012 FDA approval. In May 2014, the US Public Health Service (PHS) and the US Department of Health and Human Services released the first comprehensive clinical practice guidelines for PrEP. Soon after, in September 2014, the VA released more formal guidance on the use of TDF/FTC for HIV PrEP as outlined by the PHS.6 Similar to patterns outside the VA, PrEP uptake across the Veterans Health Administration (VHA) has been modest and variable.
A recent VHA analysis of the variability in PrEP uptake identified about 1,600 patients who had been prescribed PrEP in the VA as of June 2017 among about 6 million veterans in care. Across VA medical facilities, the absolute number of PrEP initiations ranged from 0 to 109 with the maximum PrEP initiation rate at 146.4/100,000 veterans in care. Eight facilities did not initiate a single PrEP prescription over the 5-year period. This study presents strategicefforts undertaken by the VA to increase access to and uptake of PrEP across the health care system and to decrease disparities in HIV prevention care.
VA National Pr EP Working Group
In the beginning of 2017, the HIV, Hepatitis, and Related Conditions (HHRC) programs within the VHA Office of Specialty Care Services convened a national working group to better measure and address the gaps in PrEP usage across the health care system. This multidisciplinary PrEP Working Group was composed of more than 40 members with expertise in HIV clinical care and PrEP, including physicians, clinical pharmacists, advanced practice registered nurses (APRNs), physician assistants (PAs), social workers, psychologists, implementation scientists, and representatives from other VA programs with a relevant programmatic or policy interest in PrEP.
Implementation Targets
The National PrEP Working Group identified increased PrEP uptake across the VHA system as the primary implementation target with a specific focus on increasing PrEP use in primary care clinics and among those at highest risk. As noted earlier, overall uptake of PrEP across VHA medical facilities has been modest; however, new PrEP initiations have increased in each 12-month period since FDA approval (Figure 1).
To rapidly understand barriers to accessing PrEP, the National PrEP Working Group developed and deployed an informal survey to HIV clinicians at all VA facilities, with nearly half responding (n = 68). These frontline providers identified several important and common barriers inhibiting PrEP uptake, including knowledge gaps among providers without infectious diseases training
Patient adherence was not identified by providers as a significant barrier to PrEP uptake in this informal survey. A recent analysis of adherence among a national cohort of veterans on HIV PrEP in VA care between July 2012 and June 2016 found that adherence in the first year of PrEP was high with some differences detected by age, race, and gender.8
As an initial step in addressing these identified barriers to prescribing PrEP in the VHA, the National PrEP Working Group developed several provider education materials, trainings, and support tools to impact the overarching goal, and identified implementation targets of increasing access outside of primary care and among noninfectious disease and nonphysician clinicians, ensuring high-quality PrEP care in all settings, and targeting PrEP uptake to at-risk populations (Table).
Increasing PrEP Use in Primary Care and Women’s Health Clinics
As of June 2017, physicians (staff, interns, residents, and fellows) accounted for more than three-quarters of VA PrEP index prescriptions. Among staff physicians, infectious diseases specialists initiated 67% of all prescriptions. Clinical pharmacists prescribed only 6%; APRNs and PAs prescribed 16% of initiations. This is unsurprising, as the field survey identified lack of awareness and specific training on PrEP care among providers without infectious diseases training as a common barrier.
The VA is the largest US employer of nurses, including more than 5,500 APRNs. In December 2016, the VA granted full practice authority to APRNs across the health care system, regardless of state restrictions in most cases.9
In 2015, the VA employed about 7,700 clinical pharmacists, 3,200 of whom had an active SOP that allowed for prescribing authority. In fiscal year 2015, clinical pharmacists were responsible for at least 20% of all hepatitis C virus (HCV) prescriptions and 69% of prescriptions for anticoagulants across the system.10 Clinical pharmacists are increasingly recognized for their extensive contributions to increasing access to treatment in the VA across a broad spectrum of clinical issues. With this infrastructure and expertise, clinical pharmacists also are well positioned to expand their scope to include PrEP.
To that end, the National PrEP Working Group worked closely with clinical pharmacists in the field and from the VA Academic Detailing Service (ADS) within the VA Pharmacy Benefits Management Services office. The ADS supports the development of scholarly, balanced, evidence-based educational tools and information for frontline VA providers using one-on-one social marketing techniques to impact specific clinical targets. These interventions are delivered by clinical pharmacists to empower VA clinicians and promote evidence-based clinical care to help reduce variability in practice across the system.11 An ADS module for PrEP has been developed and will be available in 2018 across the VHA to facilities participating in the ADS.
A virtual accredited training program on prescribing PrEP and monitoring patients on PrEP designed for clinical pharmacists will be delivered early in 2018 to complement these materials and will be open to all prescribers interested in learning more about PrEP. By offering a complement of training and clinical support tools, most of which are detailed in other sections of this article, the National PrEP Working Group is creating educational opportunities that are accessible in a variety of different formats to decrease knowledge barriers over PrEP prescribing and build over time a broader pool of VA clinicians trained in PrEP care.
Ensuring High-Quality PrEP Care
One system-level concern about expanding PrEP to providers without infectious diseases training is the quality of follow-up care. In order to aid noninfectious diseases clinicians, and nonphysician providers who are not as familiar with PrEP, several clinical support tools have been created, including (1) VA’s Clinical Considerations for PrEP to Prevent HIV Infection, which is aligned with CDC clinical guidance12; (2) a PrEP clinical criterion check list; (3) clinical support tools, such as prepopulated electronic health record (EHR) templates and order menus to facilitate PrEP prescribing and monitoring in busy primary care clinical settings; and (4) PrEP-specific texts in the Annie App, an automated text-messaging application developed by the VA Office of Connected Care, which supports medication adherence, appointment attendance, vitals tracking, and education.13
Available evidence indicates that there is potential for disparities in PrEP effectiveness in the VA related to varying medication adherence. Analysis of pharmacy refill records found that adherence with TDF/FTC was high in the first year after PrEP initiation (median proportion of days covered in the first year was 74%), but adherence was lower among veterans in VA care who were African American, women, and/or under age 45 years.8 This highlights the importance of enhanced services, such as Annie, to support PrEP adherence in at-risk groups as well as monitoring of HIV risk factors to ensure PrEP is still indicated.
Targeting PrEP Uptake for High-Risk Veterans
Although the VA’s overarching goal is to increase access to and uptake of PrEP across the VHA, it also is important to direct resources to those at greatest risk of acquiring HIV infection. The National PrEP Working Group has focused on the following critical implementation issues in the VA’s strategic approach to HIV prevention, with a specific focus on the geographic disparities between PrEP uptake and HIV risk across the VHA as well as disparities based on rurality, race/ethnicity, and gender.
The majority of the VHA patient population is male (91% in 2016).14 A VHA analysis of PrEP initiations in the VA indicates that in June 2017, 97% of veterans in VA care receiving PrEP were male, 69% were white, 88% resided in urban areas, and the average age was 41.6 years. An analysis of PrEP initiation in the VA indicates that current PrEP uptake is clustered in a few geographic areas and that some areas with high HIV incidence had low uptake.15 States with the highest risk of HIV infection are in the Southeast, followed by parts of the West, Midwest, and Northeast (Figure 2).16,17
Rural areas are increasingly impacted by the HIV epidemic in the US, but access to PrEP is often limited in rural communities.19 Several rural counties in the Southeastern US now have rates of new HIV infection comparable with those historically seen in only the largest cities.1 In addition, recent outbreaks of HIV and hepatitis C virus infection related to needle sharing highlight the need for HIV prevention programs in rural areas impacted by the opioid epidemic.20
About 1 in 4 veterans overall—and 16% of veterans in care who are HIV-positive—reside in rural areas, but only 4.3% of veterans who had initiated PrEP through 2017 resided in rural areas.21,22 In order to address the need to improve access to PrEP in many rural-serving VHA facilities, the PrEP Working Group has emphasized the increased utilization of virtual care (telehealth, Annie App, the Virtual Medical Room) and broadening the pool of available PrEP prescribers to include noninfectious diseases physicians, pharmacists, and APRNs.
Important racial and ethnic disparities also exist in PrEP access nationally. For example, in the US as a whole, African American MSM, followed by Latino MSM continue to be at highest risk for HIV infection.1 In 2015, 45% of all new HIV infections in the US were among African Americans, 26% of whom were women and 58% identified as gay or bisexual.23 A recent analysis of US retail pharmacies that dispensed FTC/TDF analyzed the racial demographics of PrEP uptake and found that the majority of PrEP initiations were among whites (74%), followed by Hispanics (12%) and African Americans (10%); and females of all races made up 20.7%.24 The VA is performing better than these national averages. Of the 688 PrEP prescriptions in the VA in 2016, 64% of recipients identified themselves as white and 23% as African American. Hispanic ethnicity was reported by 13%.
There are several limitations to identifying a specific implementation target for PrEP across the VA system, including the challenge of accurately identifying the population at risk via the EHR or clinical informatics tools. For example, strong risk factors for HIV acquisition include IV drug use, receptive anal intercourse without a condom, and needlesticks.
Behaviors that pose lower risk, such as vaginal intercourse or insertive anal intercourse could contribute to a higher overall lifetime risk if these behaviors occur frequently.25 Behavioral risk factors are not well captured in the VA EHR, making it difficult to identify potential PrEP candidates through population health tools. Additionally, stigma and discrimination may make it difficult for a patient to disclose to their clinician and for a clinician to inquire into behavioral risk factors. The criminalization of HIV-related risk behaviors in some states also may complicate the identification of potential PrEP candidates.26,27 These issues contribute to the challenges that providers face in screening for HIV risk and that patients face in disclosing their personal risk.
To address these regional, rural, and ethnic disparities and enhance the identification of potential PrEP recipients, the National PrEP Working Group is developing a suite of tools to support frontline providers in identifying potential PrEP recipients and expanding care to those at highest risk and who may be more difficult to reach due to rurality, concerns about stigma, or other issues.
- Clinical support tools to identify potential PrEP recipients, such as a clinical reminder that identifies patients at high risk for HIV based on diagnosis codes, and a PrEP clinical dashboard;
- A telehealth protocol for PrEP care and promotion of the VA Virtual Medical Room, which allows providers to video conference with patients in their home; and
- Social media outreach and awareness campaigns targeted at veterans to increase PrEP awareness are being shared through VA Facebook and Twitter accounts, blog posts, and www.hiv.va.gov posts (Figure 4).
Implementation Strategy & Evaluation
During the calendar year 2017, the PrEP Working Group met monthly and in smaller subcommittees to develop the strategic plan, products, and tools described earlier. On World AIDS Day, a virtual live meeting on PrEP was made available to all providers across the system and will be made available for continuing education training through the VA online employee education system. During 2018, the primary focus of the PrEP Working Group will be the continued development and refinement of provider education materials, clinical tools, and data tracking as well as increasing veteran outreach through social media and other awareness campaigns planned throughout the year.
Annual assessment of PrEP uptake will evaluate progress on the primary implementation target and areas of clinical practice: (1) increase number of PrEP prescriptions overall; (2) ensure PrEP is prescribed at all VA facilities; (3) increase preciptions by noninfectious diseases provider; (4) increase prescriptions by clinical pharmacists and APRNs; (5) monitor quality of care, including by discipline/practice setting; (6) increase PrEP prescriptions in facilities in endemic areas; and (7) increase the proportion of PrEP prescriptions for veterans of color.
In 2019 and 2020, additional targeted intervention and outreach plans will be developed for sites with difficulty meeting implementation targets. Sites in highly HIV-endemic areas will be a priority, and outreach will be designed to assist in the identification of facility-level barriers to PrEP use.
Conclusion
HIV remains an important public health issue in the US and among veterans in VA care, and prevention is a critical component to combat the epidemic. The VHA is the largest single provider of HIV care in the US with facilities and community-based outpatient clinics in all states and US territories.
The VA seems to be performing better in terms of the proportion of PrEP uptake among racial groups at highest risk for HIV compared with a US sample from retail pharmacies, which may be, in part, driven by the cost of PrEP and follow-up sexually transmitted infection testing.24 However, a considerable gap remain in VHA PrEP uptake among populations at highest risk for HIV in the US.
With the investment of a National PrEP Working Group, the VA is charting a course to augment its HIV prevention services to exceed the US nationally. The National PrEP Working Group will continue to develop specific, measurable, and impactful targets guided by state-of-the-art scientific evidence and surveillance data and a suite of educational and clinical resources designed to assist frontline providers, facilities, and patients in meeting clearly defined implementation targets.
Click here to read the digital edition.
1. Centers for Disease Control and Prevention. HIV surveillance report, 2016; Vol 28. https://www.cdc.gov/hiv/pdf/library/reports/surveillance/cdc-hiv-surveillance -report-2016-vol-28.pdf. Published November 2017. Accessed February 12, 2018.
2. Centers for Disease Control and Prevention. HIV continuum of care, US, 2014, overall and by age, race/ethnicity, transmission route and sex. https://www.cdc .gov/nchhstp/newsroom/2017/HIV-Continuum-of-Care.html. Updated September 12, 2017. Accessed February 12, 2018.
3. Branson BM, Handsfield HH, Lampe MA, et al; Centers for Disease Control and Prevention (CDC). Revised recommendations for HIV testing of adults, adolescents, and pregnant women in health-care settings. MMWR Recomm Rep. 2006;55(RR-14):1-17.
4. US Food and Drug Administration. FDA approves first medication to reduce HIV risk [press release]. https://aidsinfo.nih.gov/news/1254/fda-approves-first-drug -for-reducing-the-risk-of-sexually-acquired-hiv-infection. Published July 12, 2012. Accessed February 14, 2018.
5. Fonner VA, Dalglish SL, Kennedy CE, et al. Effectiveness and safety of oral HIV preexposure prophylaxis for all populations. AIDS. 2016;30(12):1973-1983.
6. Centers for Disease Control and Prevention, US Public Health Service. Preexposure prophylaxis for the prevention of HIV infection in the United States—2014: a clinical practice guideline. http://www.cdc.gov/hiv/pdf/PrEPguidelines2014.pdf. Published 2014. Accessed February 12, 2018.
7. Smith DK, Mendoza MC, Stryker JE, Rose CE. PrEP awareness and attitudes in a national survey of primary care clinicians in the United States, 2009-2015. PLoS One. 2016;11(6):e0156592.
8. Van Epps P, Maier M, Lund B, et al. Medication adherence in a nationwide cohort of veterans initiating pre-exposure prophylaxis (PrEP) to prevent HIV infection. J Acquir Immune Defic Syndr. 2018;77(3):272-278.
9. US Department of Veterans Affairs. 38 CFR Part 17, RIN 2900-AP44. Advance Practice Registered Nurses. Federal Register, Rules and Regulations. 81(240) December 14, 2016
10. Ourth H, Groppi J, Morreale AP, Quicci-Roberts K. Clinical pharmacist prescribing activities in the Veterans Health Administration. Am J Health Syst Pharm. 2016;73(18):1406-1415.
11. US Department of Veterans Affairs, Pharmacy Benefits Management Academic Detailing Service. VA academic detailing implementation guide. https://www.pbm.va.gov/PBM/AcademicDetailingService/Documents/VA_Academic_Detailing_Implementation_Guide.pdf. Published September 2016. Accessed February 12, 2018.
12. Veterans Health Administration US Department of Veterans Affairs, Veterans Health Administration, Office of Specialty Services, HIV, Hepatitis, and Related Conditions Programs. Pre-exposure prophylaxis (PrEP) to prevent HIV infection: clinical considerations from the Department of Veterans Affairs National HIV Program. https://www.hiv.va.gov/pdf/PrEP-considerations.pdf. Published September 2016. Accessed January 4, 2018.
13. US Department of Veterans Affairs, VA Mobile Health. Annie app for clinicians. https://mobile.va.gov/app/annie-app-clinicians. Published September 2016. Accessed January 4, 2018.
14. US Department of Veterans Affairs, National Center for Veterans Analysis and Statistics. VA utilization profile FY 2016. https://www.va.gov/vetdata/docs/Quickfacts/VA_Utilization_Profile.pdf. Published . November 2017. Accessed March 5, 2018.
15. Van Epps P. Pre-exposure prophylaxis for HIV prevention: the use and effectiveness of PrEP in the Veterans Health Administration (VHA). Abstract presented at: Infectious Diseases Week 2016; October 26-30, 2016; New Orleans, LA. https://idsa.confex.com/idsa/2016/webprogram/Paper60122.html. Accessed February 12, 2018.
16. Centers for Disease Control and Prevention. 2016 conference on retroviruses and opportunistic infections, lifetime risk of HIV diagnosis by state: https://www.cdc .gov/nchhstp/newsroom/images/2016/CROI_lifetime_risk_state.jpg. Published February 24, 2016. Accessed February 12, 2018.
17. Elopre L, Kudroff K, Westfall AO, Overton ET, Mugavero MJ. Brief report: the right people, right places, and right practices: disparities in PrEP access among African American men, women, and MSM in the Deep South. J Acquir Immune Defic Syndr. 2017;74(1):56-59.
18. Wu H, Mendoza MC, Huang YA, Hayes T, Smith DK, Hoover KW. Uptake of HIV preexposure prophylaxis among commercially insured persons-United States, 2010-2014. Clin Infect Dis. 2017;64(2):144-149.
19. Schafer KR, Albrecht H, Dillingham R, et al. The continuum of HIV care in rural communities in the United States and Canada: what is known and future research directions. J Acquir Immune Defic Syndr. 2017;75(1):355-344.
20. Conrad C, Bradley HM, Broz D, et al; Centers for Disease Control and Prevention (CDC). community outbreak of hiv infection linked to injection drug use of oxymorphone—Indiana, 2015. MMWR Morb Mortal Wkly Rep. 2015;64(16):443-444.
21. Ohl ME, Richardson K, Kaboli P, Perencevich E, Vaughan-Sarrazin M. Geographic access and use of infectious diseases specialty and general primary care services by veterans with HIV infection: implications for telehealth and shared care programs. J Rural Health. 2014;30(4):412-421.
22. US Department of Veterans Affairs, Office of Rural Health. Rural veterans’ health care challenges. https://www.ruralhealth.va.gov/aboutus/ruralvets.asp. Updated February 9, 2018. Accessed on February 12, 2018.
23. Centers for Disease Control and Prevention. HIV among African Americans. https://www.cdc.gov/hiv/group/racialethnic/africanamericans/index.html. Updated February 9, 2018. Accessed on February 12, 2018.
24. Bush S, Magnuson D, Rawlings K, et al. Racial characteristics of FTC/TDF for pre-exposure prophylaxis (PrEP) users in the US. Paper presented at: ASM Microbe Conference 2016; June 16-20, 2016; Boston, MA.
25. Centers for Disease Control and Prevention. HIV risk behaviors. https://www.cdc .gov/hiv/pdf/risk/estimates/cdc-hiv-risk-behaviors.pdf. Published December 2015. Accessed on February 12, 2018.
26. Lehman JS, Carr MH, Nichol AJ, et al. Prevalence and public health implications of state laws that criminalize potential HIV exposure in the United States. AIDS Behav. 2014;18(6):997-1006.
27. US Department of Justice, Civil Rights Division. Best practices guide to reform HIV-specific criminal laws to align with scientifically-supported factors. https://www.hivlawandpolicy.org/sites/default/files/DOj-HIV-Criminal-Law-Best-Practices-Guide.pdf. March 2014. Accessed on February 12, 2018.
28. Backus L, Czarnogorski M, Yip G, et al. HIV care continuum applied to the US Department of Veterans Affairs: HIV virologic outcomes in an integrated health care system. J Acquir Immune Defic Syndr. 2015;69(4):474-480.
Risk for Appendicitis, Cholecystitis, or Diverticulitis in Patients With Psoriasis
Psoriasis is a chronic skin condition affecting approximately 2% to 3% of the population.1,2 Beyond cutaneous manifestations, psoriasis is a systemic inflammatory state that is associated with an increased risk for cardiovascular disease, including obesity,3,4 type 2 diabetes mellitus,5,6 hypertension,5 dyslipidemia,3,7 metabolic syndrome,7 atherosclerosis,8 peripheral vascular disease,9 coronary artery calcification,10 myocardial infarction,11-13 stroke,9,14 and cardiac death.15,16
Psoriasis also has been associated with inflammatory bowel disease (IBD), possibly because of similar autoimmune mechanisms in the pathogenesis of both diseases.17,18 However, there is no literature regarding the risk for acute gastrointestinal pathologies such as appendicitis, cholecystitis, or diverticulitis in patients with psoriasis.
The primary objective of this study was to examine if patients with psoriasis are at increased risk for appendicitis, cholecystitis, or diverticulitis compared to the general population. The secondary objective was to determine if patients with severe psoriasis (ie, patients treated with phototherapy or systemic therapy) are at a higher risk for these conditions compared to patients with mild psoriasis.
Methods
Patients and Tools
A descriptive, population-based cohort study design with controls from a matched cohort was used to ascertain the effect of psoriasis status on patients’ risk for appendicitis, cholecystitis, or diverticulitis. Our cohort was selected using administrative data from Kaiser Permanente Southern California (KPSC) during the study period (January 1, 2004, through December 31, 2016).
Kaiser Permanente Southern California is a large integrated health maintenance organization that includes approximately 4 million patients as of December 31, 2016, and includes roughly 20% of the region’s population. The geographic area served extends from Bakersfield in the lower California Central Valley to San Diego on the border with Mexico. Membership demographics, socioeconomic status, and ethnicity composition are representative of California.
Patients were included if they had a diagnosis of psoriasis (International Classification of Diseases, Ninth Revision, Clinical Modification [ICD-9-CM] code 696.1; International Classification of Diseases, Tenth Revision, Clinical Modification [ICD-10-CM] codes L40.0, L40.4, L40.8, or L40.9) for at least 3 visits between January 1, 2004, and December 31, 2016. Patients were not excluded if they also had a diagnosis of psoriatic arthritis (ICD-9-CM code 696.0; ICD-10-CM code L40.5x). Patients also must have been continuously enrolled for at least 1 year before and 1 year after the index date, which was defined as the date of the third psoriasis diagnosis.
Each patient with psoriasis was assigned to 1 of 2 cohorts: (1) severe psoriasis: patients who received UVB phototherapy, psoralen plus UVA phototherapy, methotrexate, acitretin, cyclosporine, apremilast, etanercept, adalimumab, infliximab, ustekinumab, efalizumab, alefacept, secukinumab, or ixekizumab during the study period; and (2) mild psoriasis: patients who had a diagnosis of psoriasis who did not receive one of these therapies during the study period.
Patients were excluded if they had a history of appendicitis, cholecystitis, or diverticulitis at any time before the index date. Only patients older than 18 years were included.
Patients with psoriasis were frequency matched (1:5) with healthy patients, also from the KPSC network. Individuals were matched by age, sex, and ethnicity.
Statistical Analysis
Baseline characteristics were described with means and SD for continuous variables as well as percentages for categorical variables. Chi-square tests for categorical variables and the Mann-Whitney U Test for continuous variables were used to compare the patients’ characteristics by psoriasis status. Cox proportional hazards regression models were used to examine the risk for appendicitis, cholecystitis, or diverticulitis among patients with and without psoriasis and among patients with mild and severe psoriasis. Proportionality assumption was validated using Pearson product moment correlation between the scaled Schoenfeld residuals and log transformed time for each covariate.
Results were presented as crude (unadjusted) hazard ratios (HRs) and adjusted HRs, where confounding factors (ie, age, sex, ethnicity, body mass index [BMI], alcohol use, smoking status, income, education, and membership length) were adjusted. All tests were performed with SAS EG 5.1 and R software. P<.05 was considered statistically significant. Results are reported with the 95% confidence interval (CI), when appropriate.
Results
A total of 1,690,214 KPSC patients were eligible for the study; 10,307 (0.6%) met diagnostic and inclusion criteria for the psoriasis cohort. Patients with psoriasis had a significantly higher mean BMI (29.9 vs 28.7; P<.0001) as well as higher mean rates of alcohol use (56% vs 53%; P<.0001) and smoking (47% vs 38%; P<.01) compared to controls. Psoriasis patients had a shorter average duration of membership within the Kaiser network (P=.0001) compared to controls.
A total of 7416 patients met criteria for mild psoriasis and 2891 patients met criteria for severe psoriasis (eTable). Patients with severe psoriasis were significantly younger and had significantly higher mean BMI compared to patients with mild psoriasis (P<.0001 and P=.0001, respectively). No significant difference in rates of alcohol or tobacco use was detected among patients with mild and severe psoriasis.
Appendicitis
The prevalence of appendicitis was not significantly different between patients with and without psoriasis or between patients with mild and severe psoriasis, though the incidence rate was slightly higher among patients with psoriasis (0.80 per 1000 patient-years compared to 0.62 per 1000 patient-years among patients without psoriasis)(Table 1). However, there was not a significant difference in risk for appendicitis between healthy patients, patients with severe psoriasis, and patients with mild psoriasis after adjusting for potential confounding factors (Table 2). Interestingly, patients with severe psoriasis who had a diagnosis of appendicitis had a significantly shorter time to diagnosis of appendicitis compared to patients with mild psoriasis (7.4 years vs 8.1 years; P<.0001).
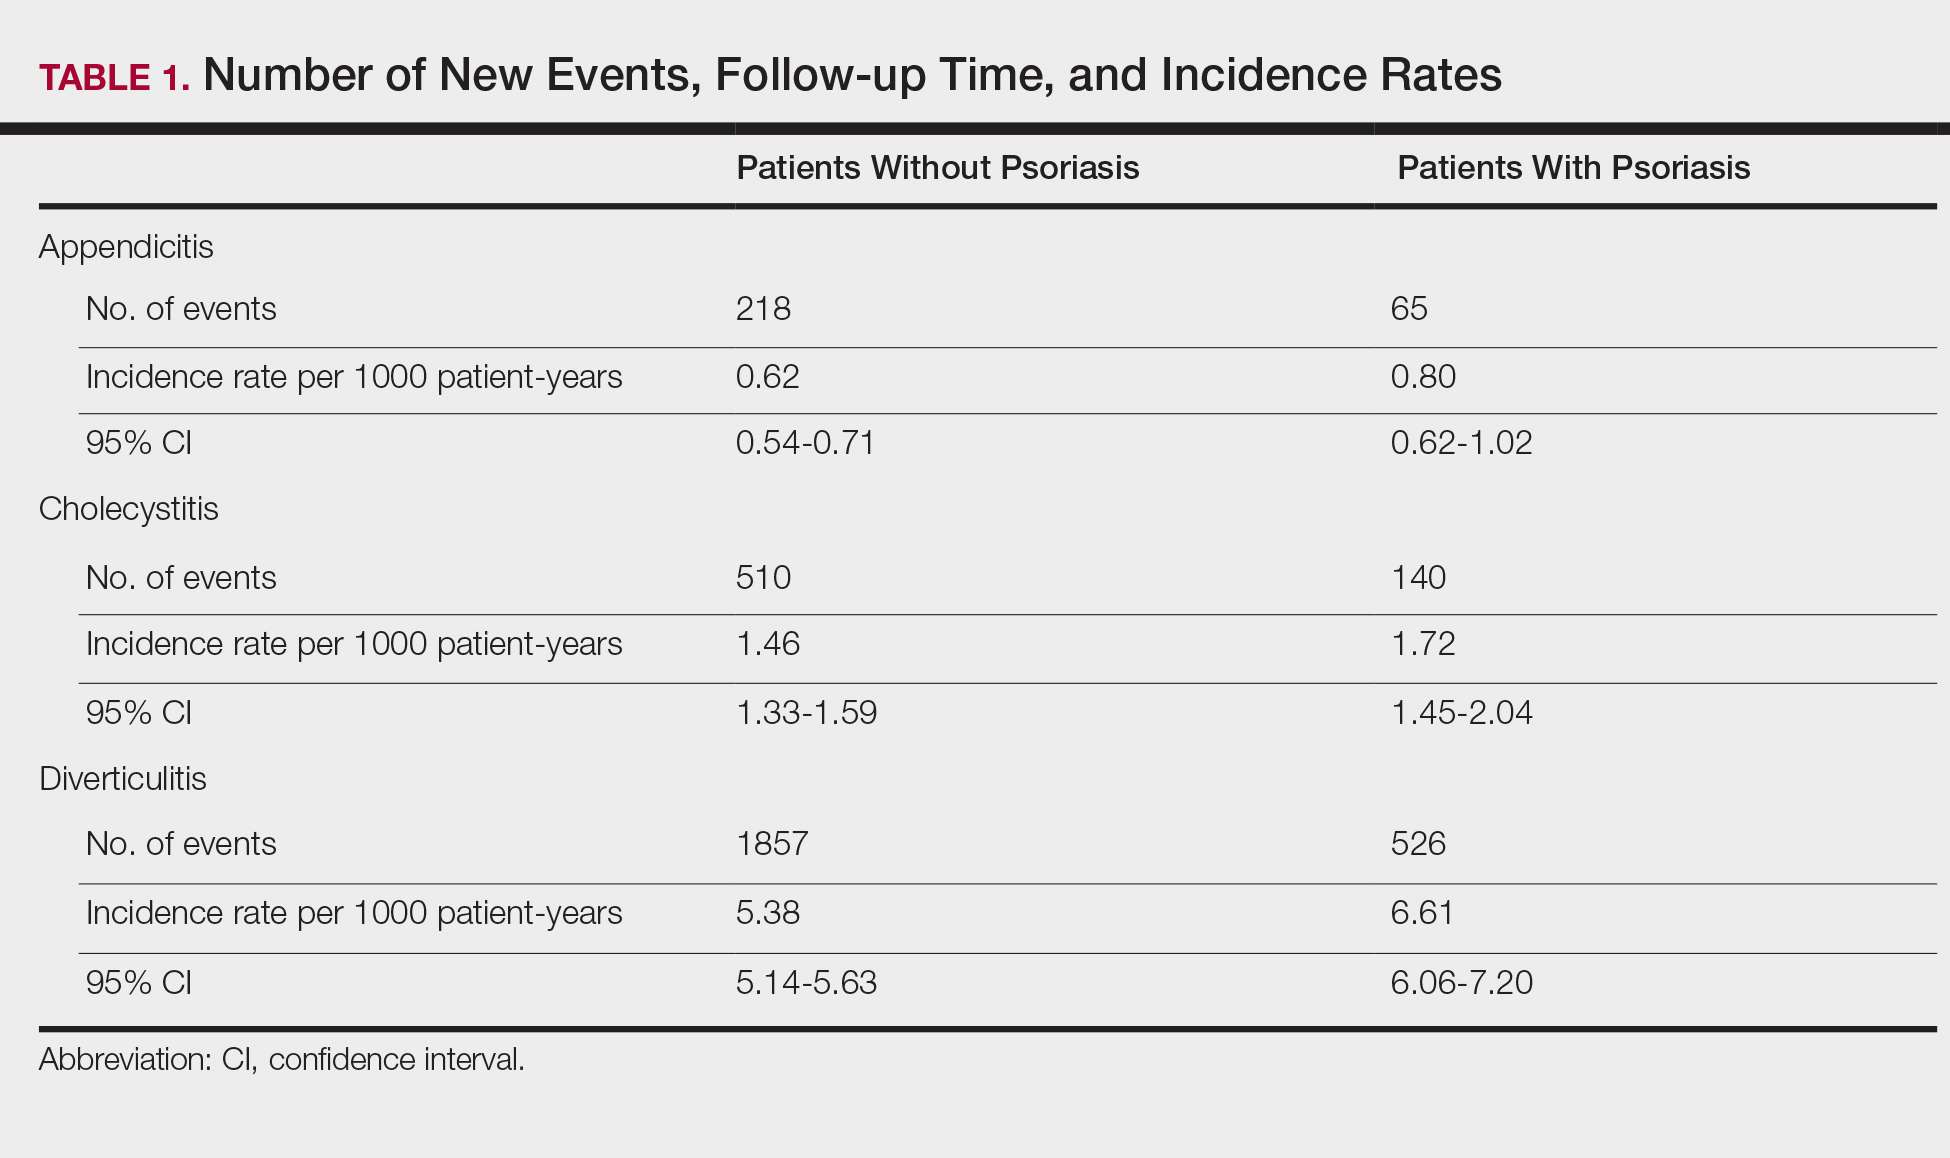
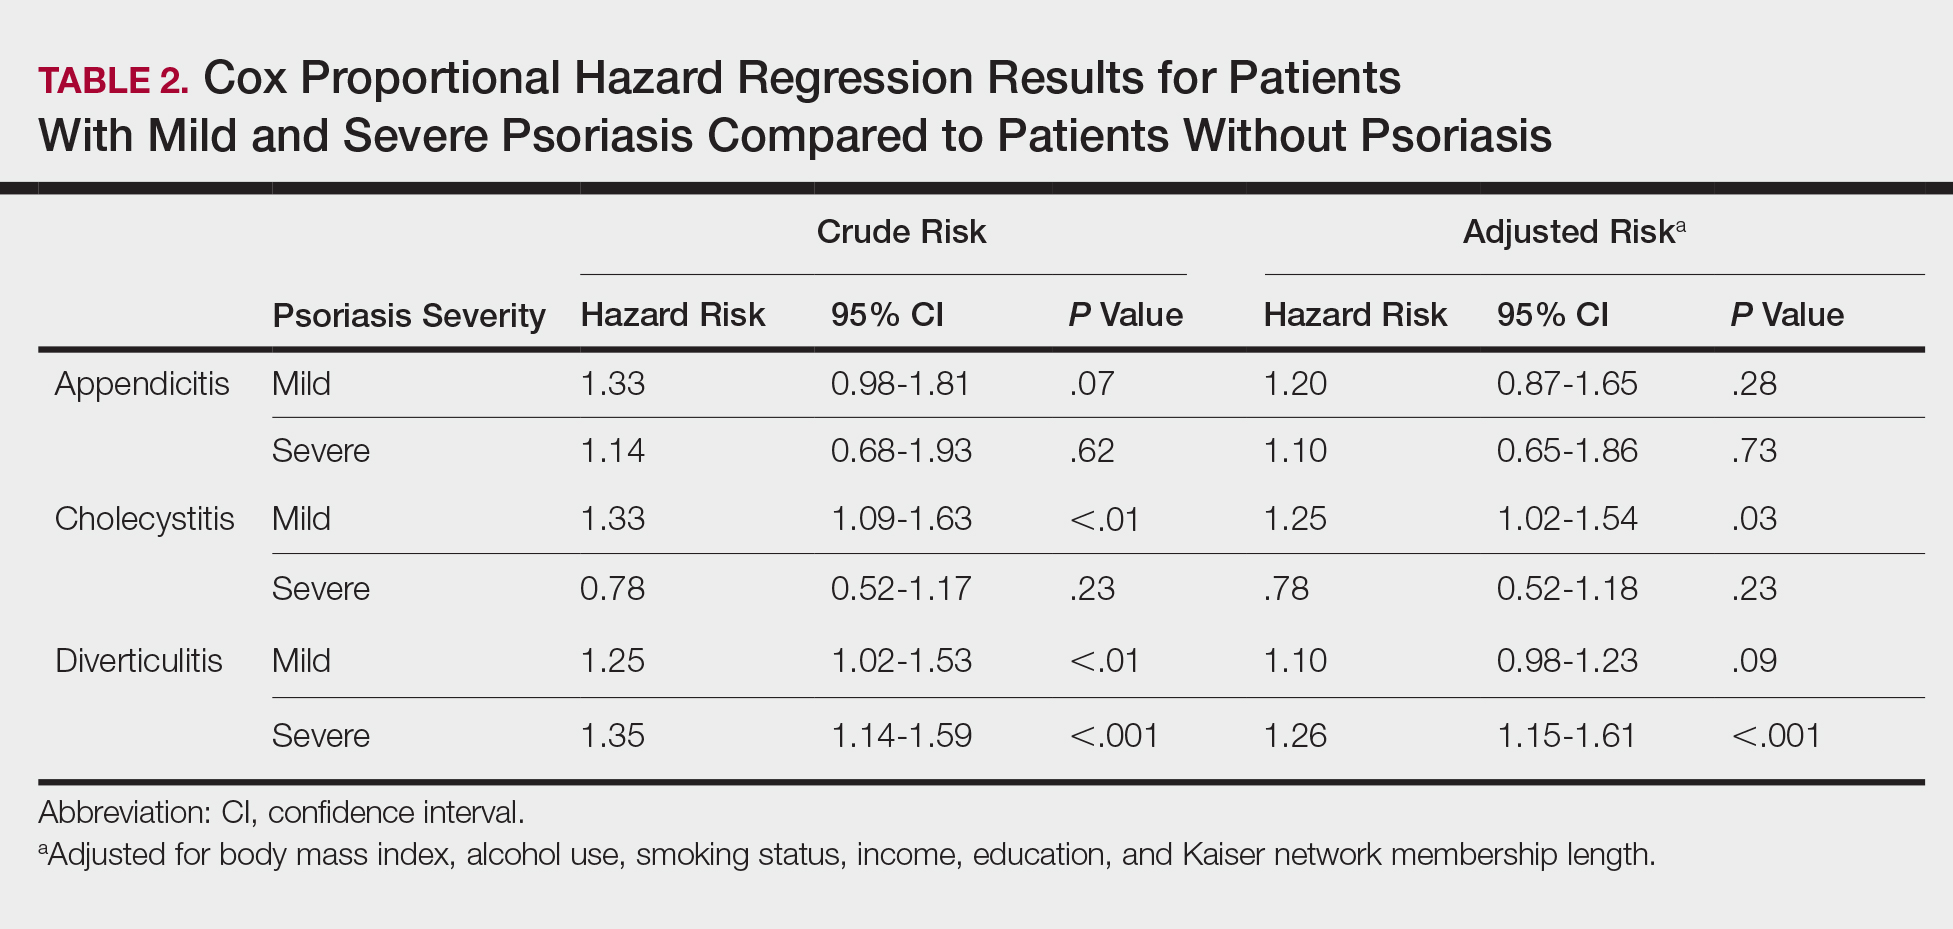
Cholecystitis
Psoriasis patients also did not have an increased prevalence of cholecystitis compared to healthy patients. However, patients with severe psoriasis had a significantly higher prevalence of cholecystitis compared to patients with mild psoriasis (P=.0038). Overall, patients with psoriasis had a slightly higher incidence rate (1.72 per 1000 patient-years) compared to healthy patients (1.46 per 1000 patient-years). Moreover, the time to diagnosis of cholecystitis was significantly shorter for patients with severe psoriasis than for patients with mild psoriasis (7.4 years vs 8.1 years; P<.0001). Mild psoriasis was associated with a significantly increased risk (HR, 1.33; 95% CI, 1.09-1.63; P<.01) for cholecystitis compared to individuals without psoriasis in both the crude and adjusted models (Table 2). There was no difference between mild psoriasis patients and severe psoriasis patients in risk for cholecystitis.
Diverticulitis
Patients with psoriasis had a significantly greater prevalence of diverticulitis compared to the control cohort (5.1% vs 4.2%; P<.0001). There was no difference in prevalence between the severe psoriasis group and the mild psoriasis group (P=.96), but the time to diagnosis of diverticulitis was shorter in the severe psoriasis group than in the mild psoriasis group (7.2 years vs 7.9 years; P<.0001). Psoriasis patients had an incidence rate of diverticulitis of 6.61 per 1000 patient-years compared to 5.38 per 1000 patient-years in the control group. Psoriasis conferred a higher risk for diverticulitis in both the crude and adjusted models (HR, 1.23; 95% CI, 1.11-1.35 [P<.001] and HR, 1.16; 95% CI, 1.05-1.29; [P<.01], respectively)(Table 3); however, when stratified by disease severity, only patients with severe psoriasis were found to be at higher risk (HR, 1.26; 95% CI, 1.15-1.61; P<.001 for the adjusted model).
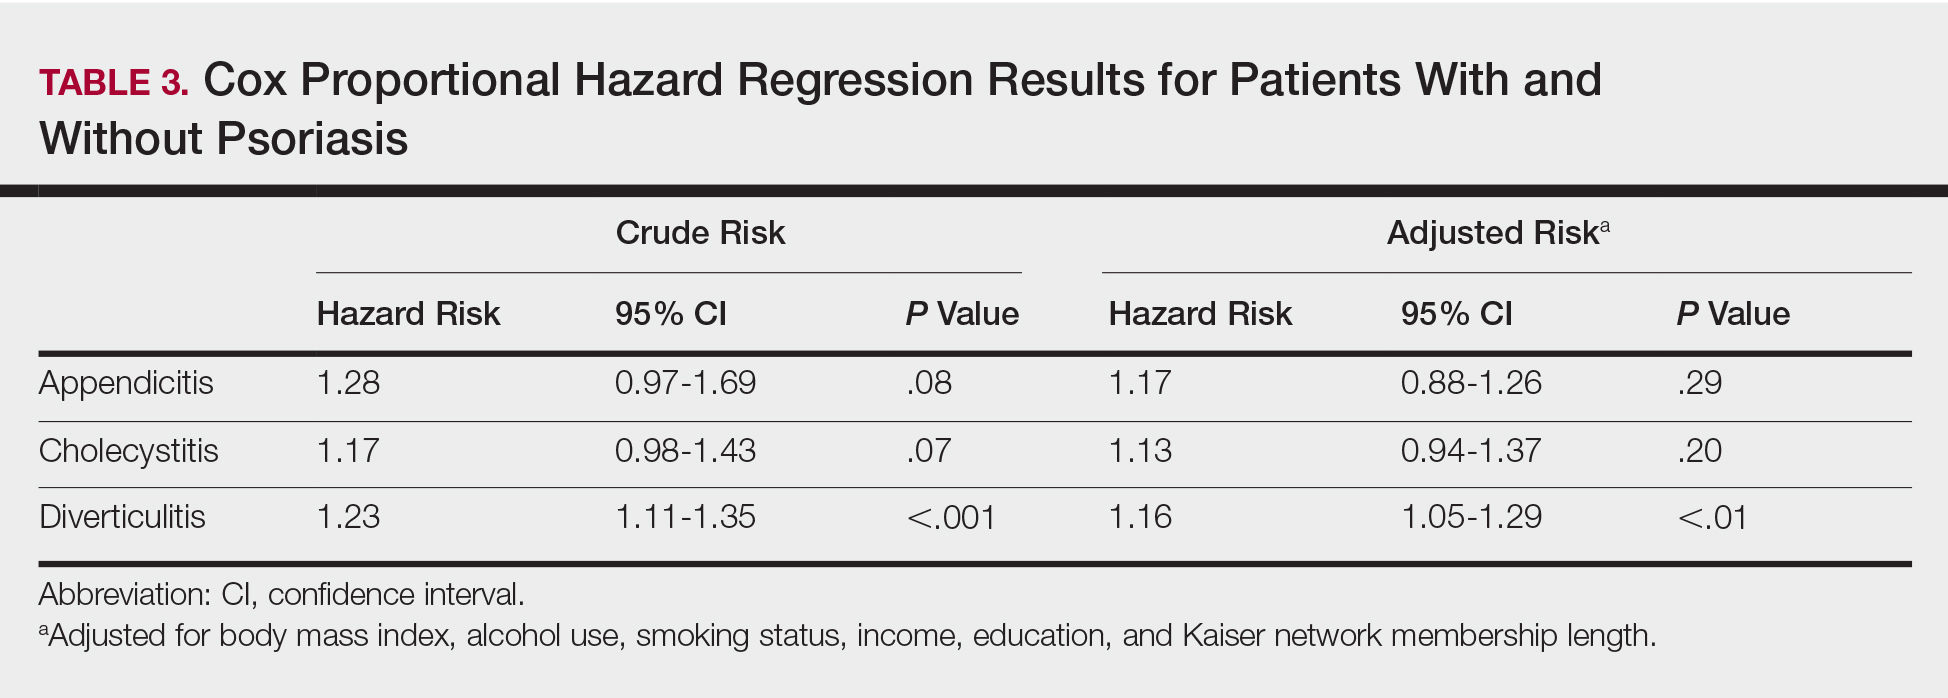
Comment
The objective of this study was to examine the background risks for specific gastrointestinal pathologies in a large cohort of patients with psoriasis compared to the general population. After adjusting for measured confounders, patients with severe psoriasis had a significantly higher risk of diverticulitis compared to the general population. Although more patients with severe psoriasis developed appendicitis or cholecystitis, the difference was not significant.
The pathogenesis of diverticulosis and diverticulitis has been thought to be related to increased intracolonic pressure and decreased dietary fiber intake, leading to formation of diverticula in the colon.19 Our study did not correct for differences in diet between the 2 groups, making it a possible confounding variable. Studies evaluating dietary habits of psoriatic patients have found that adult males with psoriasis might consume less fiber compared to healthy patients,20 and psoriasis patients also might consume less whole-grain fiber.21 Furthermore, fiber deficiency also might affect gut flora, causing low-grade chronic inflammation,18 which also has been supported by response to anti-inflammatory medications such as mesalazine.22 Given the autoimmune association between psoriasis and IBD, it is possible that psoriasis also might create an environment of chronic inflammation in the gut, predisposing patients with psoriasis to diverticulitis. However, further research is needed to better evaluate this possibility.
Our study also does not address any potential effects on outcomes of specific treatments for psoriasis. Brandl et al23 found that patients on immunosuppressive therapy for autoimmune diseases had longer hospital and intensive care unit stays, higher rates of emergency operations, and higher mortality while hospitalized. Because our results suggest that patients with severe psoriasis, who are therefore more likely to require treatment with an immunomodulator, are at higher risk for diverticulitis, these patients also might be at risk for poorer outcomes.
There is no literature evaluating the relationship between psoriasis and appendicitis. Our study found a slightly lower incidence rate compared to the national trend (9.38 per 10,000 patient-years in the United States in 2008) in both healthy patients and psoriasis patients.24 Of note, this statistic includes children, whereas our study did not, which might in part account for the lower rate. However, Cheluvappa et al25 hypothesized a relationship between appendicitis and subsequent appendectomy at a young age and protection against IBD. They also found that the mechanism for protection involves downregulation of the helper T cell (TH17) pathway,25 which also has been found to play a role in psoriasis pathogenesis.26,27 Although our results suggest that the risk for appendicitis is not increased for patients with psoriasis, further research might be able to determine if appendicitis and subsequent appendectomy also can offer protection against development of psoriasis.
We found that patients with severe psoriasis had a higher incidence rate of cholecystitis compared to patients with mild psoriasis. Egeberg et al28 found an increased risk for cholelithiasis among patients with psoriasis, which may contribute to a higher rate of cholecystitis. Although both acute and chronic cholecystitis were incorporated in this study, a Russian study found that chronic cholecystitis may be a predictor of progression of psoriasis.29 Moreover, patients with severe psoriasis had a shorter duration to diagnosis of cholecystitis than patients with mild psoriasis. It is possible that patients with severe psoriasis are in a state of greater chronic inflammation than those with mild psoriasis, and therefore, when combined with other risk factors for cholecystitis, may progress to disease more quickly. Alternatively, this finding could be treatment related, as there have been reported cases of cholecystitis related to etanercept use in patients treated for psoriasis and juvenile polyarticular rheumatoid arthritis.30,31 The relationship is not yet well defined, however, and further research is necessary to evaluate this association.
Study Strengths
Key strengths of this study include the large sample size and diversity of the patient population. Kaiser Permanente Southern California membership generally is representative of the broader community, making our results fairly generalizable to populations with health insurance. Use of a matched control cohort allows the results to be more specific to the disease of interest, and the population-based design minimizes bias.
Study Limitations
This study has several limitations. Although the cohorts were categorized based on type of treatment received, exact therapies were not specified. As a retrospective study, it is difficult to control for potential confounding variables that are not included in the electronic medical record. The results of this study also demonstrated significantly shorter durations to diagnosis of all 3 conditions, indicating that surveillance bias may be present.
Conclusion
Patients with psoriasis may be at an increased risk for diverticulitis compared to patients without psoriasis, which could be due to the chronic inflammatory state induced by psoriasis. Therefore, it may be beneficial for clinicians to evaluate psoriasis patients for other risk factors for diverticulitis and subsequently provide counseling to these patients to minimize their risk for diverticulitis. Psoriasis patients do not appear to be at an increased risk for appendicitis or cholecystitis compared to controls; however, further research is needed for confirmation.
- Parisi R, Symmons DP, Griffiths CE, et al; Identification and Management of Psoriasis and Associated ComorbidiTy (IMPACT) project team. Global epidemiology of psoriasis: a systematic review of incidence and prevalence. J Invest Dermatol. 2013;133:377-385.
- Channual J, Wu JJ, Dann FJ. Effects of tumor necrosis factor-α blockade on metabolic syndrome in psoriasis and psoriatic arthritis and additional lessons learned from rheumatoid arthritis. Dermatol Ther. 2009;22:61-73.
- Koebnick C, Black MH, Smith N, et al. The association of psoriasis and elevated blood lipids in overweight and obese children. J Pediatr. 2011;159:577-583.
- Herron MD, Hinckley M, Hoffman MS, et al. Impact of obesity and smoking on psoriasis presentation and management. Arch Dermatol. 2005;141:1527-1534.
- Qureshi AA, Choi HK, Setty AR, et al. Psoriasis and the risk of diabetes and hypertension: a prospective study of US female nurses. Arch Dermatol. 2009;145:379-382.
- Shapiro J, Cohen AD, David M, et al. The association between psoriasis, diabetes mellitus, and atherosclerosis in Israel: a case-control study. J Am Acad Dermatol. 2007;56:629-634.
- Love TJ, Qureshi AA, Karlson EW, et al. Prevalence of the metabolic syndrome in psoriasis: results from the National Health and Nutrition Examination Survey, 2003-2006. Arch Dermatol. 2011;147:419-424.
- El-Mongy S, Fathy H, Abdelaziz A, et al. Subclinical atherosclerosis in patients with chronic psoriasis: a potential association. J Eur Acad Dermatol Venereol. 2010;24:661-666.
- Prodanovich S, Kirsner RS, Kravetz JD, et al. Association of psoriasis with coronary artery, cerebrovascular, and peripheral vascular diseases and mortality. Arch Dermatol. 2009;145:700-703.
- Ludwig RJ, Herzog C, Rostock A, et al. Psoriasis: a possible risk factor for development of coronary artery calcification. Br J Dermatol. 2007;156:271-276.
- Kaye JA, Li L, Jick SS. Incidence of risk factors for myocardial infarction and other vascular diseases in patients with psoriasis. Br J Dermatol. 2008;159:895-902.
- Kimball AB, Robinson D Jr, Wu Y, et al. Cardiovascular disease and risk factors among psoriasis patients in two US healthcare databases, 2001-2002. Dermatology. 2008;217:27-37.
- Gelfand JM, Neimann AL, Shin DB, et al. Risk of myocardial infarction in patients with psoriasis. JAMA. 2006;296:1735-1741.
- Gelfand JM, Dommasch ED, Shin DB, et al. The risk of stroke in patients with psoriasis. J Invest Dermatol. 2009;129:2411-2418.
- Mehta NN, Azfar RS, Shin DB, et al. Patients with severe psoriasis are at increased risk of cardiovascular mortality: cohort study using the General Practice Research Database. Eur Heart J. 2010;31:1000-1006.
- Abuabara K, Azfar RS, Shin DB, et al. Cause-specific mortality in patients with severe psoriasis: a population-based cohort study in the United Kingdom. Br J Dermatol. 2010;163:586-592.
- Christophers E. Comorbidities in psoriasis. Clin Dermatol. 2007;25:529-534.
- Wu JJ, Nguyen TU, Poon KY, et al. The association of psoriasis with autoimmune diseases. J Am Acad Dermatol. 2012;67:924-930.
- Floch MH, Bina I. The natural history of diverticulitis: fact and theory. Clin Gastroenterol. 2004;38(5, suppl 1):S2-S7.
- Barrea L, Macchia PE, Tarantino G, et al. Nutrition: a key environmental dietary factor in clinical severity and cardio-metabolic risk in psoriatic male patients evaluated by 7-day food-frequency questionnaire. J Transl Med. 2015;13:303.
- Afifi L, Danesh MJ, Lee KM, et al. Dietary behaviors in psoriasis: patient-reported outcomes from a U.S. National Survey. Dermatol Ther (Heidelb). 2017;7:227-242.
- Matrana MR, Margolin DA. Epidemiology and pathophysiology of diverticular disease. Clin Colon Rectal Surg. 2009;22:141-146.
- Brandl A, Kratzer T, Kafka-Ritsch R, et al. Diverticulitis in immunosuppressed patients: a fatal outcome requiring a new approach? Can J Surg. 2016;59:254-261.
- Buckius MT, McGrath B, Monk J, et al. Changing epidemiology of acute appendicitis in the United States: study period 1993-2008. J Surg Res. 2012;175:185-190.
- Cheluvappa R, Luo AS, Grimm MC. T helper type 17 pathway suppression by appendicitis and appendectomy protects against colitis. Clin Exp Immunol. 2014;175:316-322.
- Lynde CW, Poulin Y, Vender R, et al. Interleukin 17A: toward a new understanding of psoriasis pathogenesis. J Am Acad Dermatol. 2014;71:141-150.
- Arican O, Aral M, Sasmaz S, et al. Serum levels of TNF-α, IFN-γ, IL6, IL-8, IL-12, IL-17, and IL-18 in patients with active psoriasis and correlation with disease severity. Mediators Inflamm. 2005:2005;273-279.
- Egeberg A, Anderson YMF, Gislason GH, et al. Gallstone risk in adult patients with atopic dermatitis and psoriasis: possible effect of overweight and obesity. Acta Derm Venereol. 2017;97:627-631.
- Smirnova SV, Barilo AA, Smolnikova MV. Hepatobiliary system diseases as the predictors of psoriasis progression [in Russian]. Vestn Ross Akad Med Nauk. 2016:102-108.
- Bagel J, Lynde C, Tyring S, et al. Moderate to severe plaque psoriasis with scalp involvement: a randomized, double-blind, placebo-controlled study of etanercept. J Am Acad Dermatol. 2012;67:86-92.
- Foeldvari I, Krüger E, Schneider T. Acute, non-obstructive, sterile cholecystitis associated with etanercept and infliximab for the treatment of juvenile polyarticular rheumatoid arthritis. Ann Rheum Dis. 2003;62:908-909.
Psoriasis is a chronic skin condition affecting approximately 2% to 3% of the population.1,2 Beyond cutaneous manifestations, psoriasis is a systemic inflammatory state that is associated with an increased risk for cardiovascular disease, including obesity,3,4 type 2 diabetes mellitus,5,6 hypertension,5 dyslipidemia,3,7 metabolic syndrome,7 atherosclerosis,8 peripheral vascular disease,9 coronary artery calcification,10 myocardial infarction,11-13 stroke,9,14 and cardiac death.15,16
Psoriasis also has been associated with inflammatory bowel disease (IBD), possibly because of similar autoimmune mechanisms in the pathogenesis of both diseases.17,18 However, there is no literature regarding the risk for acute gastrointestinal pathologies such as appendicitis, cholecystitis, or diverticulitis in patients with psoriasis.
The primary objective of this study was to examine if patients with psoriasis are at increased risk for appendicitis, cholecystitis, or diverticulitis compared to the general population. The secondary objective was to determine if patients with severe psoriasis (ie, patients treated with phototherapy or systemic therapy) are at a higher risk for these conditions compared to patients with mild psoriasis.
Methods
Patients and Tools
A descriptive, population-based cohort study design with controls from a matched cohort was used to ascertain the effect of psoriasis status on patients’ risk for appendicitis, cholecystitis, or diverticulitis. Our cohort was selected using administrative data from Kaiser Permanente Southern California (KPSC) during the study period (January 1, 2004, through December 31, 2016).
Kaiser Permanente Southern California is a large integrated health maintenance organization that includes approximately 4 million patients as of December 31, 2016, and includes roughly 20% of the region’s population. The geographic area served extends from Bakersfield in the lower California Central Valley to San Diego on the border with Mexico. Membership demographics, socioeconomic status, and ethnicity composition are representative of California.
Patients were included if they had a diagnosis of psoriasis (International Classification of Diseases, Ninth Revision, Clinical Modification [ICD-9-CM] code 696.1; International Classification of Diseases, Tenth Revision, Clinical Modification [ICD-10-CM] codes L40.0, L40.4, L40.8, or L40.9) for at least 3 visits between January 1, 2004, and December 31, 2016. Patients were not excluded if they also had a diagnosis of psoriatic arthritis (ICD-9-CM code 696.0; ICD-10-CM code L40.5x). Patients also must have been continuously enrolled for at least 1 year before and 1 year after the index date, which was defined as the date of the third psoriasis diagnosis.
Each patient with psoriasis was assigned to 1 of 2 cohorts: (1) severe psoriasis: patients who received UVB phototherapy, psoralen plus UVA phototherapy, methotrexate, acitretin, cyclosporine, apremilast, etanercept, adalimumab, infliximab, ustekinumab, efalizumab, alefacept, secukinumab, or ixekizumab during the study period; and (2) mild psoriasis: patients who had a diagnosis of psoriasis who did not receive one of these therapies during the study period.
Patients were excluded if they had a history of appendicitis, cholecystitis, or diverticulitis at any time before the index date. Only patients older than 18 years were included.
Patients with psoriasis were frequency matched (1:5) with healthy patients, also from the KPSC network. Individuals were matched by age, sex, and ethnicity.
Statistical Analysis
Baseline characteristics were described with means and SD for continuous variables as well as percentages for categorical variables. Chi-square tests for categorical variables and the Mann-Whitney U Test for continuous variables were used to compare the patients’ characteristics by psoriasis status. Cox proportional hazards regression models were used to examine the risk for appendicitis, cholecystitis, or diverticulitis among patients with and without psoriasis and among patients with mild and severe psoriasis. Proportionality assumption was validated using Pearson product moment correlation between the scaled Schoenfeld residuals and log transformed time for each covariate.
Results were presented as crude (unadjusted) hazard ratios (HRs) and adjusted HRs, where confounding factors (ie, age, sex, ethnicity, body mass index [BMI], alcohol use, smoking status, income, education, and membership length) were adjusted. All tests were performed with SAS EG 5.1 and R software. P<.05 was considered statistically significant. Results are reported with the 95% confidence interval (CI), when appropriate.
Results
A total of 1,690,214 KPSC patients were eligible for the study; 10,307 (0.6%) met diagnostic and inclusion criteria for the psoriasis cohort. Patients with psoriasis had a significantly higher mean BMI (29.9 vs 28.7; P<.0001) as well as higher mean rates of alcohol use (56% vs 53%; P<.0001) and smoking (47% vs 38%; P<.01) compared to controls. Psoriasis patients had a shorter average duration of membership within the Kaiser network (P=.0001) compared to controls.
A total of 7416 patients met criteria for mild psoriasis and 2891 patients met criteria for severe psoriasis (eTable). Patients with severe psoriasis were significantly younger and had significantly higher mean BMI compared to patients with mild psoriasis (P<.0001 and P=.0001, respectively). No significant difference in rates of alcohol or tobacco use was detected among patients with mild and severe psoriasis.
Appendicitis
The prevalence of appendicitis was not significantly different between patients with and without psoriasis or between patients with mild and severe psoriasis, though the incidence rate was slightly higher among patients with psoriasis (0.80 per 1000 patient-years compared to 0.62 per 1000 patient-years among patients without psoriasis)(Table 1). However, there was not a significant difference in risk for appendicitis between healthy patients, patients with severe psoriasis, and patients with mild psoriasis after adjusting for potential confounding factors (Table 2). Interestingly, patients with severe psoriasis who had a diagnosis of appendicitis had a significantly shorter time to diagnosis of appendicitis compared to patients with mild psoriasis (7.4 years vs 8.1 years; P<.0001).
Cholecystitis
Psoriasis patients also did not have an increased prevalence of cholecystitis compared to healthy patients. However, patients with severe psoriasis had a significantly higher prevalence of cholecystitis compared to patients with mild psoriasis (P=.0038). Overall, patients with psoriasis had a slightly higher incidence rate (1.72 per 1000 patient-years) compared to healthy patients (1.46 per 1000 patient-years). Moreover, the time to diagnosis of cholecystitis was significantly shorter for patients with severe psoriasis than for patients with mild psoriasis (7.4 years vs 8.1 years; P<.0001). Mild psoriasis was associated with a significantly increased risk (HR, 1.33; 95% CI, 1.09-1.63; P<.01) for cholecystitis compared to individuals without psoriasis in both the crude and adjusted models (Table 2). There was no difference between mild psoriasis patients and severe psoriasis patients in risk for cholecystitis.
Diverticulitis
Patients with psoriasis had a significantly greater prevalence of diverticulitis compared to the control cohort (5.1% vs 4.2%; P<.0001). There was no difference in prevalence between the severe psoriasis group and the mild psoriasis group (P=.96), but the time to diagnosis of diverticulitis was shorter in the severe psoriasis group than in the mild psoriasis group (7.2 years vs 7.9 years; P<.0001). Psoriasis patients had an incidence rate of diverticulitis of 6.61 per 1000 patient-years compared to 5.38 per 1000 patient-years in the control group. Psoriasis conferred a higher risk for diverticulitis in both the crude and adjusted models (HR, 1.23; 95% CI, 1.11-1.35 [P<.001] and HR, 1.16; 95% CI, 1.05-1.29; [P<.01], respectively)(Table 3); however, when stratified by disease severity, only patients with severe psoriasis were found to be at higher risk (HR, 1.26; 95% CI, 1.15-1.61; P<.001 for the adjusted model).
Comment
The objective of this study was to examine the background risks for specific gastrointestinal pathologies in a large cohort of patients with psoriasis compared to the general population. After adjusting for measured confounders, patients with severe psoriasis had a significantly higher risk of diverticulitis compared to the general population. Although more patients with severe psoriasis developed appendicitis or cholecystitis, the difference was not significant.
The pathogenesis of diverticulosis and diverticulitis has been thought to be related to increased intracolonic pressure and decreased dietary fiber intake, leading to formation of diverticula in the colon.19 Our study did not correct for differences in diet between the 2 groups, making it a possible confounding variable. Studies evaluating dietary habits of psoriatic patients have found that adult males with psoriasis might consume less fiber compared to healthy patients,20 and psoriasis patients also might consume less whole-grain fiber.21 Furthermore, fiber deficiency also might affect gut flora, causing low-grade chronic inflammation,18 which also has been supported by response to anti-inflammatory medications such as mesalazine.22 Given the autoimmune association between psoriasis and IBD, it is possible that psoriasis also might create an environment of chronic inflammation in the gut, predisposing patients with psoriasis to diverticulitis. However, further research is needed to better evaluate this possibility.
Our study also does not address any potential effects on outcomes of specific treatments for psoriasis. Brandl et al23 found that patients on immunosuppressive therapy for autoimmune diseases had longer hospital and intensive care unit stays, higher rates of emergency operations, and higher mortality while hospitalized. Because our results suggest that patients with severe psoriasis, who are therefore more likely to require treatment with an immunomodulator, are at higher risk for diverticulitis, these patients also might be at risk for poorer outcomes.
There is no literature evaluating the relationship between psoriasis and appendicitis. Our study found a slightly lower incidence rate compared to the national trend (9.38 per 10,000 patient-years in the United States in 2008) in both healthy patients and psoriasis patients.24 Of note, this statistic includes children, whereas our study did not, which might in part account for the lower rate. However, Cheluvappa et al25 hypothesized a relationship between appendicitis and subsequent appendectomy at a young age and protection against IBD. They also found that the mechanism for protection involves downregulation of the helper T cell (TH17) pathway,25 which also has been found to play a role in psoriasis pathogenesis.26,27 Although our results suggest that the risk for appendicitis is not increased for patients with psoriasis, further research might be able to determine if appendicitis and subsequent appendectomy also can offer protection against development of psoriasis.
We found that patients with severe psoriasis had a higher incidence rate of cholecystitis compared to patients with mild psoriasis. Egeberg et al28 found an increased risk for cholelithiasis among patients with psoriasis, which may contribute to a higher rate of cholecystitis. Although both acute and chronic cholecystitis were incorporated in this study, a Russian study found that chronic cholecystitis may be a predictor of progression of psoriasis.29 Moreover, patients with severe psoriasis had a shorter duration to diagnosis of cholecystitis than patients with mild psoriasis. It is possible that patients with severe psoriasis are in a state of greater chronic inflammation than those with mild psoriasis, and therefore, when combined with other risk factors for cholecystitis, may progress to disease more quickly. Alternatively, this finding could be treatment related, as there have been reported cases of cholecystitis related to etanercept use in patients treated for psoriasis and juvenile polyarticular rheumatoid arthritis.30,31 The relationship is not yet well defined, however, and further research is necessary to evaluate this association.
Study Strengths
Key strengths of this study include the large sample size and diversity of the patient population. Kaiser Permanente Southern California membership generally is representative of the broader community, making our results fairly generalizable to populations with health insurance. Use of a matched control cohort allows the results to be more specific to the disease of interest, and the population-based design minimizes bias.
Study Limitations
This study has several limitations. Although the cohorts were categorized based on type of treatment received, exact therapies were not specified. As a retrospective study, it is difficult to control for potential confounding variables that are not included in the electronic medical record. The results of this study also demonstrated significantly shorter durations to diagnosis of all 3 conditions, indicating that surveillance bias may be present.
Conclusion
Patients with psoriasis may be at an increased risk for diverticulitis compared to patients without psoriasis, which could be due to the chronic inflammatory state induced by psoriasis. Therefore, it may be beneficial for clinicians to evaluate psoriasis patients for other risk factors for diverticulitis and subsequently provide counseling to these patients to minimize their risk for diverticulitis. Psoriasis patients do not appear to be at an increased risk for appendicitis or cholecystitis compared to controls; however, further research is needed for confirmation.
- Parisi R, Symmons DP, Griffiths CE, et al; Identification and Management of Psoriasis and Associated ComorbidiTy (IMPACT) project team. Global epidemiology of psoriasis: a systematic review of incidence and prevalence. J Invest Dermatol. 2013;133:377-385.
- Channual J, Wu JJ, Dann FJ. Effects of tumor necrosis factor-α blockade on metabolic syndrome in psoriasis and psoriatic arthritis and additional lessons learned from rheumatoid arthritis. Dermatol Ther. 2009;22:61-73.
- Koebnick C, Black MH, Smith N, et al. The association of psoriasis and elevated blood lipids in overweight and obese children. J Pediatr. 2011;159:577-583.
- Herron MD, Hinckley M, Hoffman MS, et al. Impact of obesity and smoking on psoriasis presentation and management. Arch Dermatol. 2005;141:1527-1534.
- Qureshi AA, Choi HK, Setty AR, et al. Psoriasis and the risk of diabetes and hypertension: a prospective study of US female nurses. Arch Dermatol. 2009;145:379-382.
- Shapiro J, Cohen AD, David M, et al. The association between psoriasis, diabetes mellitus, and atherosclerosis in Israel: a case-control study. J Am Acad Dermatol. 2007;56:629-634.
- Love TJ, Qureshi AA, Karlson EW, et al. Prevalence of the metabolic syndrome in psoriasis: results from the National Health and Nutrition Examination Survey, 2003-2006. Arch Dermatol. 2011;147:419-424.
- El-Mongy S, Fathy H, Abdelaziz A, et al. Subclinical atherosclerosis in patients with chronic psoriasis: a potential association. J Eur Acad Dermatol Venereol. 2010;24:661-666.
- Prodanovich S, Kirsner RS, Kravetz JD, et al. Association of psoriasis with coronary artery, cerebrovascular, and peripheral vascular diseases and mortality. Arch Dermatol. 2009;145:700-703.
- Ludwig RJ, Herzog C, Rostock A, et al. Psoriasis: a possible risk factor for development of coronary artery calcification. Br J Dermatol. 2007;156:271-276.
- Kaye JA, Li L, Jick SS. Incidence of risk factors for myocardial infarction and other vascular diseases in patients with psoriasis. Br J Dermatol. 2008;159:895-902.
- Kimball AB, Robinson D Jr, Wu Y, et al. Cardiovascular disease and risk factors among psoriasis patients in two US healthcare databases, 2001-2002. Dermatology. 2008;217:27-37.
- Gelfand JM, Neimann AL, Shin DB, et al. Risk of myocardial infarction in patients with psoriasis. JAMA. 2006;296:1735-1741.
- Gelfand JM, Dommasch ED, Shin DB, et al. The risk of stroke in patients with psoriasis. J Invest Dermatol. 2009;129:2411-2418.
- Mehta NN, Azfar RS, Shin DB, et al. Patients with severe psoriasis are at increased risk of cardiovascular mortality: cohort study using the General Practice Research Database. Eur Heart J. 2010;31:1000-1006.
- Abuabara K, Azfar RS, Shin DB, et al. Cause-specific mortality in patients with severe psoriasis: a population-based cohort study in the United Kingdom. Br J Dermatol. 2010;163:586-592.
- Christophers E. Comorbidities in psoriasis. Clin Dermatol. 2007;25:529-534.
- Wu JJ, Nguyen TU, Poon KY, et al. The association of psoriasis with autoimmune diseases. J Am Acad Dermatol. 2012;67:924-930.
- Floch MH, Bina I. The natural history of diverticulitis: fact and theory. Clin Gastroenterol. 2004;38(5, suppl 1):S2-S7.
- Barrea L, Macchia PE, Tarantino G, et al. Nutrition: a key environmental dietary factor in clinical severity and cardio-metabolic risk in psoriatic male patients evaluated by 7-day food-frequency questionnaire. J Transl Med. 2015;13:303.
- Afifi L, Danesh MJ, Lee KM, et al. Dietary behaviors in psoriasis: patient-reported outcomes from a U.S. National Survey. Dermatol Ther (Heidelb). 2017;7:227-242.
- Matrana MR, Margolin DA. Epidemiology and pathophysiology of diverticular disease. Clin Colon Rectal Surg. 2009;22:141-146.
- Brandl A, Kratzer T, Kafka-Ritsch R, et al. Diverticulitis in immunosuppressed patients: a fatal outcome requiring a new approach? Can J Surg. 2016;59:254-261.
- Buckius MT, McGrath B, Monk J, et al. Changing epidemiology of acute appendicitis in the United States: study period 1993-2008. J Surg Res. 2012;175:185-190.
- Cheluvappa R, Luo AS, Grimm MC. T helper type 17 pathway suppression by appendicitis and appendectomy protects against colitis. Clin Exp Immunol. 2014;175:316-322.
- Lynde CW, Poulin Y, Vender R, et al. Interleukin 17A: toward a new understanding of psoriasis pathogenesis. J Am Acad Dermatol. 2014;71:141-150.
- Arican O, Aral M, Sasmaz S, et al. Serum levels of TNF-α, IFN-γ, IL6, IL-8, IL-12, IL-17, and IL-18 in patients with active psoriasis and correlation with disease severity. Mediators Inflamm. 2005:2005;273-279.
- Egeberg A, Anderson YMF, Gislason GH, et al. Gallstone risk in adult patients with atopic dermatitis and psoriasis: possible effect of overweight and obesity. Acta Derm Venereol. 2017;97:627-631.
- Smirnova SV, Barilo AA, Smolnikova MV. Hepatobiliary system diseases as the predictors of psoriasis progression [in Russian]. Vestn Ross Akad Med Nauk. 2016:102-108.
- Bagel J, Lynde C, Tyring S, et al. Moderate to severe plaque psoriasis with scalp involvement: a randomized, double-blind, placebo-controlled study of etanercept. J Am Acad Dermatol. 2012;67:86-92.
- Foeldvari I, Krüger E, Schneider T. Acute, non-obstructive, sterile cholecystitis associated with etanercept and infliximab for the treatment of juvenile polyarticular rheumatoid arthritis. Ann Rheum Dis. 2003;62:908-909.
Practice Points
- Patients with psoriasis may have elevated risk of diverticulitis compared to healthy patients. However, psoriasis patients do not appear to have increased risk of appendicitis or cholecystitis.
- Clinicians treating psoriasis patients should consider assessing for other risk factors of diverticulitis at regular intervals.

Beyond Reporting Early Warning Score Sensitivity: The Temporal Relationship and Clinical Relevance of “True Positive” Alerts that Precede Critical Deterioration
Patients at risk for clinical deterioration in the inpatient setting may not be identified efficiently or effectively by health care providers. Early warning systems that link clinical observations to rapid response mechanisms (such as medical emergency teams) have the potential to improve outcomes, but rigorous studies are lacking.1 The pediatric Rothman Index (pRI) is an automated early warning system sold by the company PeraHealth that is integrated with the electronic health record. The system incorporates vital signs, labs, and nursing assessments from existing electronic health record data to provide a single numeric score that generates alerts based on low absolute scores and acute decreases in score (low scores indicate high mortality risk).2 Automated alerts or rules based on the pRI score are meant to bring important changes in clinical status to the attention of clinicians.
Adverse outcomes (eg, unplanned intensive care unit [ICU] transfers and mortality) are associated with low pRI scores, and scores appear to decline prior to such events.2 However, the limitation of this and other studies evaluating the sensitivity of early warning systems3-6 is that the generated alerts are assigned “true positive” status if they precede clinical deterioration, regardless of whether or not they provide meaningful information to the clinicians caring for the patients. There are two potential critiques of this approach. First, the alert may have preceded a deterioration event but may not have been clinically relevant (eg, an alert triggered by a finding unrelated to the patient’s acute health status, such as a scar that was newly documented as an abnormal skin finding and as a result led to a worsening in the pRI). Second, even if the preceding alert demonstrated clinical relevance to a deterioration event, the clinicians at the bedside may have been aware of the patient’s deterioration for hours and have already escalated care. In this situation, the alert would simply confirm what the clinician already knew.
To better understand the relationship between early warning system acuity alerts and clinical practice, we examined a cohort of hospitalized patients who experienced a critical deterioration event (CDE)7 and who would have triggered a preceding pRI alert. We evaluated the clinical relationship of the alert to the CDE (ie, whether the alert reflected physiologic changes related to a CDE or was instead an artifact of documentation) and identified whether the alert would have preceded evidence that clinicians recognized deterioration or escalated care.
METHODS
Patients and Setting
This retrospective cross-sectional study was performed at Children’s Hospital of Philadelphia (CHOP), a freestanding children’s hospital with 546 beds. Eligible patients were hospitalized on nonintensive care, noncardiology, surgical wards between January 1, 2013, and December 31, 2013. The CHOP Institutional Review Board (IRB) approved the study with waivers of consent and assent. A HIPAA Business Associate Agreement and an IRB Reliance Agreement were in place with PeraHealth to permit data transfer.
Definition of Critical Deterioration Events
Critical deterioration events (CDEs) were defined according to an existing, validated measure7 as unplanned transfers to the ICU with continuous or bilevel positive airway pressure, tracheal intubation, and/or vasopressor infusion in the 12 hours after transfer. At CHOP, all unplanned ICU transfers are routed through the hospital’s rapid response or code blue teams, so these patients were identified using an existing database managed by the CHOP Resuscitation Committee. In the database, the elements of CDEs are entered as part of ongoing quality improvement activities. The time of CDE was defined as the time of the rapid response call precipitating unplanned transfer to the ICU.
The Pediatric Rothman Index
The pRI is an automated acuity score that has been validated in hospitalized pediatric patients.2 The pRI is calculated using existing variables from the electronic health record, including manually entered vital signs, laboratory values, cardiac rhythm, and nursing assessments of organ systems. The weights assigned to continuous variables are a function of deviation from the norm.2,8 (See Supplement 1 for a complete list of variables.)
The pRI is integrated with the electronic health record and automatically generates a score each time a new data observation becomes available. Changes in score over time and low absolute scores generate a graduated series of alerts ranging from medium to very high acuity. This analysis used PeraHealth’s standard pRI alerts. Medium acuity alerts occurred when the pRI score decreased by ≥30% in 24 hours. A high acuity alert occurred when the pRI score decreased by ≥40% in 6 hours. A very high acuity alert occurred when the pRI absolute score was ≤ 30.
Development of the Source Dataset
In 2014, CHOP shared one year of clinical data with PeraHealth as part of the process of deciding whether or not to implement the pRI. The pRI algorithm retrospectively generated scores and acuity alerts for all CHOP patients who experienced CDEs between January 1, 2013, and December 31, 2013. The pRI algorithm was not active in the hospital environment during this time period; the scores and acuity alerts were not visible to clinicians. This dataset was provided to the investigators at CHOP to conduct this project.
Data Collection
Pediatric intensive care nurses trained in clinical research data abstraction from the CHOP Critical Care Center for Evidence and Outcomes performed the chart review for this study. Chart abstraction comparisons were completed on the first 15 charts to ensure interrater reliability, and additional quality assurance checks were performed on intermittent charts to ensure consistency and definition adherence. We managed all data using Research Electronic Data Capture.9
To study the value of alerts labeled as “true positives,” we restricted the dataset to CDEs in which acuity alert(s) within the prior 72 hours would have been triggered if the pRI had been in clinical use at the time.
To identify the clinical relationship between pRI and CDE, we reviewed each chart with the goal of determining whether the preceding acuity alerts were clinically associated with the etiology of the CDE. We determined the etiology of the CDE by reviewing the cause(s) identified in the note written by rapid response or code blue team responders or by the admitting clinical team after transfer to the ICU. We then used a tool provided by PeraHealth to identify the specific score components that led to worsening pRI. If the score components that worsened were (a) consistent with a clinical change as opposed to a documentation artifact and (b) an organ system change that was plausibly related to the CDE etiology, we concluded that the alert was clinically related to the etiology of the CDE.
We defined documentation artifacts as instances in nursing documentation in which a finding unrelated to the patient’s acute health status, such as a scar, was newly documented as abnormal and led to worsening pRI. Any cases in which the clinical relevance was unclear underwent review by additional members of the team
To determine the temporal relationship among pRI, CDE, and clinician awareness or action, we then sought to systematically determine whether the preceding acuity alerts preceded documented evidence of clinicians recognizing deterioration or escalation of care. We made the a priori decision that acuity alerts that occurred more than 24 hours prior to a deterioration event had questionable clinical actionability. Therefore, we restricted this next analysis to CDEs with acuity alerts during the 24 hours prior to a CDE. We reviewed time-stamped progress notes written by clinicians in the 24 hours period prior to the time of the CDE and identified whether the notes reflected an adverse change in patient status or a clinical intervention. We then compared the times of these notes with the times of the alerts and CDEs. Given that documentation of change in clinical status often occurs after clinical intervention, we also reviewed new orders placed in the 24 hours prior to each CDE to determine escalation of care. We identified the following orders as reflective of escalation of care independent of specific disease process: administration of intravenous fluid bolus, blood product, steroid, or antibiotic, increased respiratory support, new imaging studies, and new laboratory studies. We then compared the time of each order with the time of the alert and CDE.
RESULTS
During the study period, 73 events met the CDE criteria and had a pRI alert during admission. Of the 73 events, 50 would have triggered at least one pRI alert in the 72-hour period leading up to the CDE (sensitivity 68%). Of the 50 events, 39 generated pRI alerts in the 24 hours leading up to the event, and 11 others generated pRI alerts between 24 and 72 hours prior to the event but did not generate any alerts during the 24 hours leading up to the event (Figure).
Patient Characteristics
The 50 CDEs labeled as true positives occurred in 46 unique patients. Table 1 displays the event characteristics.
Acuity Alerts
A total of 79 pRI alerts preceded the 50 CDEs. Of these acuity alerts, 44 (56%) were medium acuity alerts, 17 (22%) were high acuity alerts, and 18 (23%) were very high acuity alerts. Of the 50 CDEs that would have triggered pRI alerts, 33 (66%) would have triggered a single acuity alert and 17 (34%) would have triggered multiple acuity alerts.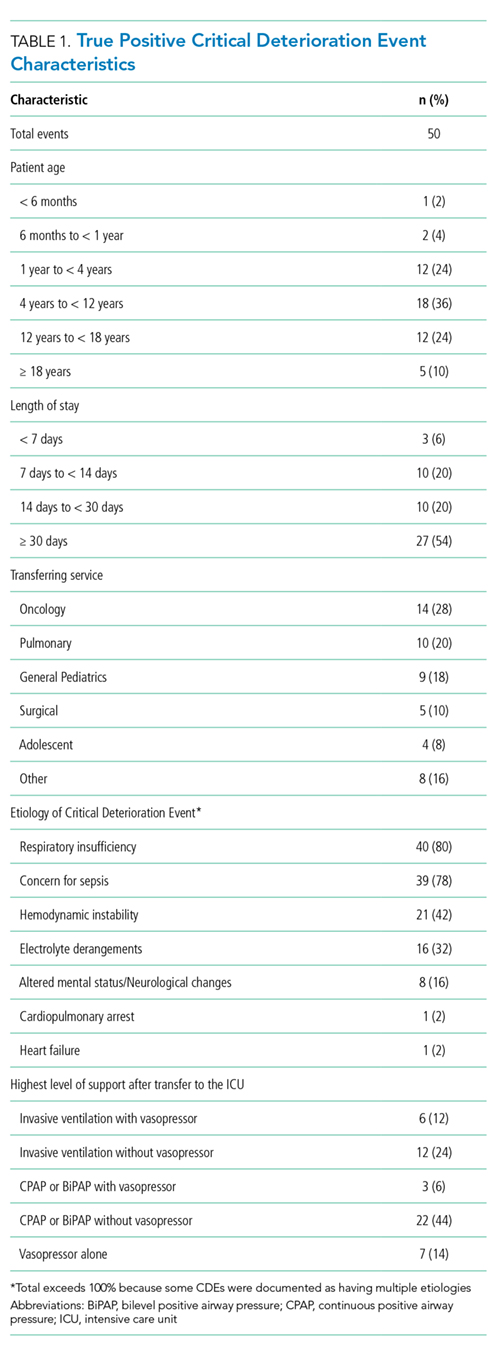
Of the 50 CDEs, 39 (78%) had a preceding acuity alert within 24 hours prior to the CDE. In these cases, the alert preceded the CDE by a median of 3.1 hours (interquartile range of 0.7 to 10.3 hours).
We assessed the score components that caused each alert to trigger. All of the vital sign and laboratory components were assessed as clinically related to the CDE’s etiology. By contrast, about half of nursing assessment components were assessed as clinically related to the etiology of the CDE (Table 2). Abnormal cardiac, respiratory, and neurologic assessments were most frequently assessed as clinically relevant.
Escalation Orders
To determine whether the pRI alert would have preceded the earliest documented treatment efforts, we restricted evaluation to the 39 CDEs that had at least one alert in the 24-hour window prior to the CDE. When we reviewed escalation orders placed by clinicians, we found that in 26 cases (67%), the first clinician order reflecting escalation of care would have preceded the first pRI alert within the 24-hour period prior to the CDE. In 13 cases (33%), the first pRI alert would have preceded the first escalation order placed by the clinician. The first pRI alert and the first escalation order would have occurred within the same 1-hour period in 6 of these cases.
Provider Notes
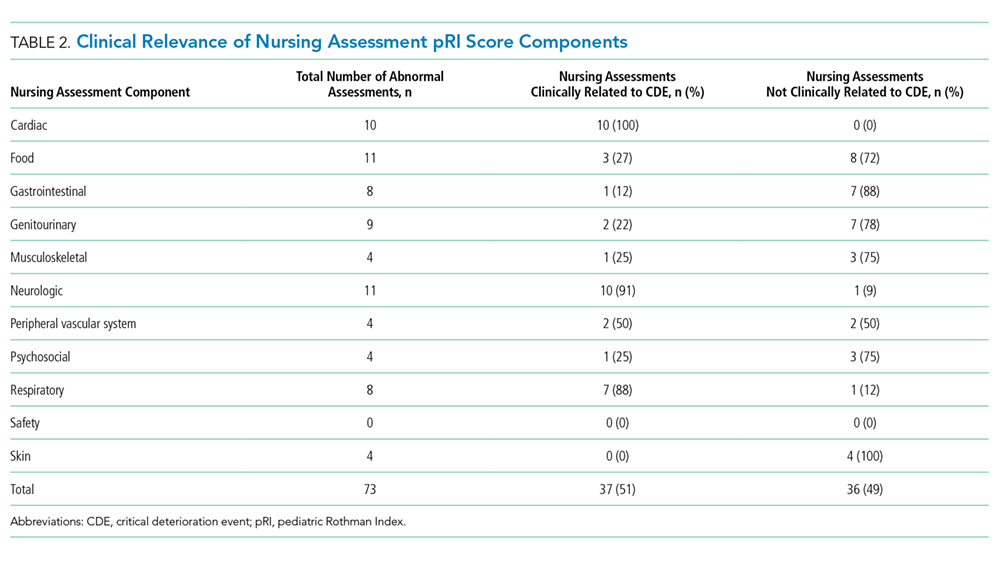
Temporal Relationships
In Supplement 2, we present the proportion of CDEs in which the order or note preceded the pRI alert for each abnormal organ system.
The Figure shows the temporal relationships among escalation orders, clinician notes, and acuity alerts for the 39 CDEs with one or more alerts in the 24 hours leading up to the event. In 21 cases (54%), both an escalation order and a note preceded the first acuity alert. In 14 cases (36%), either an escalation order or a note preceded the first acuity alert. In four cases (10%), the alert preceded any documented evidence that clinicians had recognized deterioration or escalating care.
DISCUSSION
The main finding of this study is that 90% of CDE events that generated “true positive” pRI alerts had evidence suggesting that clinicians had already recognized deterioration and/or were already escalating care before most pRI alerts would have been triggered.
The impacts of early warning scores on patient safety outcomes are not well established. In a recent 21-hospital cluster randomized trial of the BedsidePEWS, a pediatric early warning score system, investigators found that implementing the system does not significantly decrease all-cause mortality in hospitalized children, although hospitals using the BedsidePEWS have low rates of significant CDEs.10 In other studies, early warning scores were often coimplemented with rapid response teams, and separating the incremental benefit of the scoring tool from the availability of a rapid response team is usually not possible.11
Therefore, the benefits of early warning scores are often inferred based on their test characteristics (eg, sensitivity and positive predictive value).12 Sensitivity, which is the proportion of patients who deteriorated and also triggered the early warning score within a reasonable time window preceding the event, is an important consideration when deciding whether an early warning score is worth implementing. A challenging follow-up question that goes beyond sensitivity is how often an early warning score adds new knowledge by identifying patients on a path toward deterioration who were not yet recognized. This study is the first to address that follow-up question. Our results revealed that the score appeared to precede evidence of clinician recognition of deterioration in 10% of CDEs. In some patients, the alert could have contributed to a detection of deterioration that was not previously evident. In the portion of CDEs in which the alert and escalation order or note occurred within the same one-hour window, the alert could have been used as confirmation of clinical suspicion. Notably, we did not evaluate the 16 cases in which a CDE preceded any pRI alert because we chose to focus on “true positive” cases in which pRI alerts preceded CDEs. These events could have had timely recognition by clinicians that we did not capture, so these results may provide an overestimation of CDEs in which the pRI preceded clinician recognition.
Prior work has described a range of mechanisms by which early warning scores can impact patient safety.13 The results of this study suggest limited incremental benefit for the pRI to alert physicians and nurses to new concerning changes at this hospital, although the benefits to low-resourced community hospitals that care for children may be great. The pRI score may also serve as evidence that empowers nurses to overcome barriers to further escalate care, even if the process of escalation has already begun. In addition to empowering nurses, the score may support trainees and clinicians with varying levels of pediatric expertise in the decision to escalate care. Evaluating these potential benefits would require prospective study.
We used the pRI alerts as they were already defined by PeraHealth for CHOP, and different alert thresholds may change score performance. Our study did not identify additional variables to improve score performance, but they can be investigated in future research.
This study had several limitations. First, this work is a single-center study with highly skilled pediatric providers, a mature rapid response system, and low rates of cardiopulmonary arrest outside ICUs. Therefore, the results that we obtained were not immediately generalizable. In a community environment with nurses and physicians who are less experienced in caring for ill children, an early warning score with high sensitivity may be beneficial in ensuring patient safety.
Second, by using escalation orders and notes from the patient chart, we did not capture all the undocumented ways in which clinicians demonstrate awareness of deterioration. For example, a resident may alert the attending on service or a team may informally request consultation with a specialist. We also gave equal weight to escalation orders and clinician notes as evidence of recognition of deterioration. It could be that either orders or notes more closely correlated with clinician awareness.
Finally, the data were from 2013. Although the score components have not changed, efforts to standardize nursing assessments may have altered the performance of the score in the intervening years.
CONCLUSIONS
In most patients who had a CDE at a large freestanding children’s hospital, escalation orders or documented changes in patient status would have occurred before a pRI alert. However, in a minority of patients, the alert could have contributed to the detection of deterioration that was not previously evident.
Disclosures
The authors have nothing to disclose
Funding
The study was supported by funds from the Department of Biomedical and Health Informatics at Children’s Hospital of Philadelphia. PeraHealth, the company that sells the Rothman Index software, provided a service to the investigators but no funding. They applied their proprietary scoring algorithm to the data from Children’s Hospital of Philadelphia to generate alerts retrospectively. This service was provided free of charge in 2014 during the time period when Children’s Hospital of Philadelphia was considering purchasing and implementing PeraHealth software, which it subsequently did. We did not receive any funding for the study from PeraHealth. PeraHealth personnel did not influence the study design, the interpretation of data, the writing of the report, or the decision to submit the article for publication.
1. Alam N, Hobbelink EL, van Tienhoven AJ, van de Ven PM, Jansma EP, Nanayakkara PWB. The impact of the use of the Early Warning Score (EWS) on patient outcomes: a systematic review. Resuscitation. 2014;85(5):587-594. doi: 10.1016/j.resuscitation.2014.01.013. PubMed
2. Rothman MJ, Tepas JJ, Nowalk AJ, et al. Development and validation of a continuously age-adjusted measure of patient condition for hospitalized children using the electronic medical record. J Biomed Inform. 2017;66 (Supplement C):180-193. doi: 10.1016/j.jbi.2016.12.013. PubMed
3. Akre M, Finkelstein M, Erickson M, Liu M, Vanderbilt L, Billman G. Sensitivity of the pediatric early warning score to identify patient deterioration. Pediatrics. 2010;125(4):e763-e769. doi: 10.1542/peds.2009-0338. PubMed
4. Seiger N, Maconochie I, Oostenbrink R, Moll HA. Validity of different pediatric early warning scores in the emergency department. Pediatrics. 2013;132(4):e841-e850. doi: 10.1542/peds.2012-3594. PubMed
5. Parshuram CS, Hutchison J, Middaugh K. Development and initial validation of the Bedside Paediatric Early Warning System score. Crit Care Lond Engl. 2009;13(4):R135. doi: 10.1186/cc7998. PubMed
6. Hollis RH, Graham LA, Lazenby JP, et al. A role for the early warning score in early identification of critical postoperative complications. Ann Surg. 2016;263(5):918-923. doi: 10.1097/SLA.0000000000001514. PubMed
7. Bonafide CP, Roberts KE, Priestley MA, et al. Development of a pragmatic measure for evaluating and optimizing rapid response systems. Pediatrics. 2012;129(4):e874-e881. doi: 10.1542/peds.2011-2784. PubMed
8. Rothman MJ, Rothman SI, Beals J. Development and validation of a continuous measure of patient condition using the electronic medical record. J Biomed Inform. 2013;46(5):837-848. doi: 10.1016/j.jbi.2013.06.011. PubMed
9. Harris PA, Taylor R, Thielke R, Payne J, Gonzalez N, Conde JG. Research Electronic Data Capture (REDCap) - A metadata-driven methodology and workflow process for providing translational research informatics support. J Biomed Inform. 2009;42(2):377-381. doi: 10.1016/j.jbi.2008.08.010. PubMed
10. Parshuram CS, Dryden-Palmer K, Farrell C, et al. Effect of a pediatric early warning system on all-cause mortality in hospitalized pediatric patients: the EPOCH randomized clinical trial. JAMA. 2018;319(10):1002-1012. doi: 10.1001/jama.2018.0948. PubMed
11. Bonafide CP, Localio AR, Roberts KE, Nadkarni VM, Weirich CM, Keren R. Impact of rapid response system implementation on critical deterioration events in children. JAMA Pediatr. 2014;168(1):25-33. doi: 10.1001/jamapediatrics.2013.3266. PubMed
12. Romero-Brufau S, Huddleston JM, Escobar GJ, Liebow M. Why the C-statistic is not informative to evaluate early warning scores and what metrics to use. Crit Care. 2015;19:285. doi: 10.1186/s13054-015-0999-1. PubMed
13. Bonafide CP, Roberts KE, Weirich CM, et al. Beyond statistical prediction: qualitative evaluation of the mechanisms by which pediatric early warning scores impact patient safety. J Hosp Med. 2013;8(5):248-253. doi: 10.1002/jhm.2026. PubMed
Patients at risk for clinical deterioration in the inpatient setting may not be identified efficiently or effectively by health care providers. Early warning systems that link clinical observations to rapid response mechanisms (such as medical emergency teams) have the potential to improve outcomes, but rigorous studies are lacking.1 The pediatric Rothman Index (pRI) is an automated early warning system sold by the company PeraHealth that is integrated with the electronic health record. The system incorporates vital signs, labs, and nursing assessments from existing electronic health record data to provide a single numeric score that generates alerts based on low absolute scores and acute decreases in score (low scores indicate high mortality risk).2 Automated alerts or rules based on the pRI score are meant to bring important changes in clinical status to the attention of clinicians.
Adverse outcomes (eg, unplanned intensive care unit [ICU] transfers and mortality) are associated with low pRI scores, and scores appear to decline prior to such events.2 However, the limitation of this and other studies evaluating the sensitivity of early warning systems3-6 is that the generated alerts are assigned “true positive” status if they precede clinical deterioration, regardless of whether or not they provide meaningful information to the clinicians caring for the patients. There are two potential critiques of this approach. First, the alert may have preceded a deterioration event but may not have been clinically relevant (eg, an alert triggered by a finding unrelated to the patient’s acute health status, such as a scar that was newly documented as an abnormal skin finding and as a result led to a worsening in the pRI). Second, even if the preceding alert demonstrated clinical relevance to a deterioration event, the clinicians at the bedside may have been aware of the patient’s deterioration for hours and have already escalated care. In this situation, the alert would simply confirm what the clinician already knew.
To better understand the relationship between early warning system acuity alerts and clinical practice, we examined a cohort of hospitalized patients who experienced a critical deterioration event (CDE)7 and who would have triggered a preceding pRI alert. We evaluated the clinical relationship of the alert to the CDE (ie, whether the alert reflected physiologic changes related to a CDE or was instead an artifact of documentation) and identified whether the alert would have preceded evidence that clinicians recognized deterioration or escalated care.
METHODS
Patients and Setting
This retrospective cross-sectional study was performed at Children’s Hospital of Philadelphia (CHOP), a freestanding children’s hospital with 546 beds. Eligible patients were hospitalized on nonintensive care, noncardiology, surgical wards between January 1, 2013, and December 31, 2013. The CHOP Institutional Review Board (IRB) approved the study with waivers of consent and assent. A HIPAA Business Associate Agreement and an IRB Reliance Agreement were in place with PeraHealth to permit data transfer.
Definition of Critical Deterioration Events
Critical deterioration events (CDEs) were defined according to an existing, validated measure7 as unplanned transfers to the ICU with continuous or bilevel positive airway pressure, tracheal intubation, and/or vasopressor infusion in the 12 hours after transfer. At CHOP, all unplanned ICU transfers are routed through the hospital’s rapid response or code blue teams, so these patients were identified using an existing database managed by the CHOP Resuscitation Committee. In the database, the elements of CDEs are entered as part of ongoing quality improvement activities. The time of CDE was defined as the time of the rapid response call precipitating unplanned transfer to the ICU.
The Pediatric Rothman Index
The pRI is an automated acuity score that has been validated in hospitalized pediatric patients.2 The pRI is calculated using existing variables from the electronic health record, including manually entered vital signs, laboratory values, cardiac rhythm, and nursing assessments of organ systems. The weights assigned to continuous variables are a function of deviation from the norm.2,8 (See Supplement 1 for a complete list of variables.)
The pRI is integrated with the electronic health record and automatically generates a score each time a new data observation becomes available. Changes in score over time and low absolute scores generate a graduated series of alerts ranging from medium to very high acuity. This analysis used PeraHealth’s standard pRI alerts. Medium acuity alerts occurred when the pRI score decreased by ≥30% in 24 hours. A high acuity alert occurred when the pRI score decreased by ≥40% in 6 hours. A very high acuity alert occurred when the pRI absolute score was ≤ 30.
Development of the Source Dataset
In 2014, CHOP shared one year of clinical data with PeraHealth as part of the process of deciding whether or not to implement the pRI. The pRI algorithm retrospectively generated scores and acuity alerts for all CHOP patients who experienced CDEs between January 1, 2013, and December 31, 2013. The pRI algorithm was not active in the hospital environment during this time period; the scores and acuity alerts were not visible to clinicians. This dataset was provided to the investigators at CHOP to conduct this project.
Data Collection
Pediatric intensive care nurses trained in clinical research data abstraction from the CHOP Critical Care Center for Evidence and Outcomes performed the chart review for this study. Chart abstraction comparisons were completed on the first 15 charts to ensure interrater reliability, and additional quality assurance checks were performed on intermittent charts to ensure consistency and definition adherence. We managed all data using Research Electronic Data Capture.9
To study the value of alerts labeled as “true positives,” we restricted the dataset to CDEs in which acuity alert(s) within the prior 72 hours would have been triggered if the pRI had been in clinical use at the time.
To identify the clinical relationship between pRI and CDE, we reviewed each chart with the goal of determining whether the preceding acuity alerts were clinically associated with the etiology of the CDE. We determined the etiology of the CDE by reviewing the cause(s) identified in the note written by rapid response or code blue team responders or by the admitting clinical team after transfer to the ICU. We then used a tool provided by PeraHealth to identify the specific score components that led to worsening pRI. If the score components that worsened were (a) consistent with a clinical change as opposed to a documentation artifact and (b) an organ system change that was plausibly related to the CDE etiology, we concluded that the alert was clinically related to the etiology of the CDE.
We defined documentation artifacts as instances in nursing documentation in which a finding unrelated to the patient’s acute health status, such as a scar, was newly documented as abnormal and led to worsening pRI. Any cases in which the clinical relevance was unclear underwent review by additional members of the team
To determine the temporal relationship among pRI, CDE, and clinician awareness or action, we then sought to systematically determine whether the preceding acuity alerts preceded documented evidence of clinicians recognizing deterioration or escalation of care. We made the a priori decision that acuity alerts that occurred more than 24 hours prior to a deterioration event had questionable clinical actionability. Therefore, we restricted this next analysis to CDEs with acuity alerts during the 24 hours prior to a CDE. We reviewed time-stamped progress notes written by clinicians in the 24 hours period prior to the time of the CDE and identified whether the notes reflected an adverse change in patient status or a clinical intervention. We then compared the times of these notes with the times of the alerts and CDEs. Given that documentation of change in clinical status often occurs after clinical intervention, we also reviewed new orders placed in the 24 hours prior to each CDE to determine escalation of care. We identified the following orders as reflective of escalation of care independent of specific disease process: administration of intravenous fluid bolus, blood product, steroid, or antibiotic, increased respiratory support, new imaging studies, and new laboratory studies. We then compared the time of each order with the time of the alert and CDE.
RESULTS
During the study period, 73 events met the CDE criteria and had a pRI alert during admission. Of the 73 events, 50 would have triggered at least one pRI alert in the 72-hour period leading up to the CDE (sensitivity 68%). Of the 50 events, 39 generated pRI alerts in the 24 hours leading up to the event, and 11 others generated pRI alerts between 24 and 72 hours prior to the event but did not generate any alerts during the 24 hours leading up to the event (Figure).
Patient Characteristics
The 50 CDEs labeled as true positives occurred in 46 unique patients. Table 1 displays the event characteristics.
Acuity Alerts
A total of 79 pRI alerts preceded the 50 CDEs. Of these acuity alerts, 44 (56%) were medium acuity alerts, 17 (22%) were high acuity alerts, and 18 (23%) were very high acuity alerts. Of the 50 CDEs that would have triggered pRI alerts, 33 (66%) would have triggered a single acuity alert and 17 (34%) would have triggered multiple acuity alerts.
Of the 50 CDEs, 39 (78%) had a preceding acuity alert within 24 hours prior to the CDE. In these cases, the alert preceded the CDE by a median of 3.1 hours (interquartile range of 0.7 to 10.3 hours).
We assessed the score components that caused each alert to trigger. All of the vital sign and laboratory components were assessed as clinically related to the CDE’s etiology. By contrast, about half of nursing assessment components were assessed as clinically related to the etiology of the CDE (Table 2). Abnormal cardiac, respiratory, and neurologic assessments were most frequently assessed as clinically relevant.
Escalation Orders
To determine whether the pRI alert would have preceded the earliest documented treatment efforts, we restricted evaluation to the 39 CDEs that had at least one alert in the 24-hour window prior to the CDE. When we reviewed escalation orders placed by clinicians, we found that in 26 cases (67%), the first clinician order reflecting escalation of care would have preceded the first pRI alert within the 24-hour period prior to the CDE. In 13 cases (33%), the first pRI alert would have preceded the first escalation order placed by the clinician. The first pRI alert and the first escalation order would have occurred within the same 1-hour period in 6 of these cases.
Provider Notes
Temporal Relationships
In Supplement 2, we present the proportion of CDEs in which the order or note preceded the pRI alert for each abnormal organ system.
The Figure shows the temporal relationships among escalation orders, clinician notes, and acuity alerts for the 39 CDEs with one or more alerts in the 24 hours leading up to the event. In 21 cases (54%), both an escalation order and a note preceded the first acuity alert. In 14 cases (36%), either an escalation order or a note preceded the first acuity alert. In four cases (10%), the alert preceded any documented evidence that clinicians had recognized deterioration or escalating care.
DISCUSSION
The main finding of this study is that 90% of CDE events that generated “true positive” pRI alerts had evidence suggesting that clinicians had already recognized deterioration and/or were already escalating care before most pRI alerts would have been triggered.
The impacts of early warning scores on patient safety outcomes are not well established. In a recent 21-hospital cluster randomized trial of the BedsidePEWS, a pediatric early warning score system, investigators found that implementing the system does not significantly decrease all-cause mortality in hospitalized children, although hospitals using the BedsidePEWS have low rates of significant CDEs.10 In other studies, early warning scores were often coimplemented with rapid response teams, and separating the incremental benefit of the scoring tool from the availability of a rapid response team is usually not possible.11
Therefore, the benefits of early warning scores are often inferred based on their test characteristics (eg, sensitivity and positive predictive value).12 Sensitivity, which is the proportion of patients who deteriorated and also triggered the early warning score within a reasonable time window preceding the event, is an important consideration when deciding whether an early warning score is worth implementing. A challenging follow-up question that goes beyond sensitivity is how often an early warning score adds new knowledge by identifying patients on a path toward deterioration who were not yet recognized. This study is the first to address that follow-up question. Our results revealed that the score appeared to precede evidence of clinician recognition of deterioration in 10% of CDEs. In some patients, the alert could have contributed to a detection of deterioration that was not previously evident. In the portion of CDEs in which the alert and escalation order or note occurred within the same one-hour window, the alert could have been used as confirmation of clinical suspicion. Notably, we did not evaluate the 16 cases in which a CDE preceded any pRI alert because we chose to focus on “true positive” cases in which pRI alerts preceded CDEs. These events could have had timely recognition by clinicians that we did not capture, so these results may provide an overestimation of CDEs in which the pRI preceded clinician recognition.
Prior work has described a range of mechanisms by which early warning scores can impact patient safety.13 The results of this study suggest limited incremental benefit for the pRI to alert physicians and nurses to new concerning changes at this hospital, although the benefits to low-resourced community hospitals that care for children may be great. The pRI score may also serve as evidence that empowers nurses to overcome barriers to further escalate care, even if the process of escalation has already begun. In addition to empowering nurses, the score may support trainees and clinicians with varying levels of pediatric expertise in the decision to escalate care. Evaluating these potential benefits would require prospective study.
We used the pRI alerts as they were already defined by PeraHealth for CHOP, and different alert thresholds may change score performance. Our study did not identify additional variables to improve score performance, but they can be investigated in future research.
This study had several limitations. First, this work is a single-center study with highly skilled pediatric providers, a mature rapid response system, and low rates of cardiopulmonary arrest outside ICUs. Therefore, the results that we obtained were not immediately generalizable. In a community environment with nurses and physicians who are less experienced in caring for ill children, an early warning score with high sensitivity may be beneficial in ensuring patient safety.
Second, by using escalation orders and notes from the patient chart, we did not capture all the undocumented ways in which clinicians demonstrate awareness of deterioration. For example, a resident may alert the attending on service or a team may informally request consultation with a specialist. We also gave equal weight to escalation orders and clinician notes as evidence of recognition of deterioration. It could be that either orders or notes more closely correlated with clinician awareness.
Finally, the data were from 2013. Although the score components have not changed, efforts to standardize nursing assessments may have altered the performance of the score in the intervening years.
CONCLUSIONS
In most patients who had a CDE at a large freestanding children’s hospital, escalation orders or documented changes in patient status would have occurred before a pRI alert. However, in a minority of patients, the alert could have contributed to the detection of deterioration that was not previously evident.
Disclosures
The authors have nothing to disclose
Funding
The study was supported by funds from the Department of Biomedical and Health Informatics at Children’s Hospital of Philadelphia. PeraHealth, the company that sells the Rothman Index software, provided a service to the investigators but no funding. They applied their proprietary scoring algorithm to the data from Children’s Hospital of Philadelphia to generate alerts retrospectively. This service was provided free of charge in 2014 during the time period when Children’s Hospital of Philadelphia was considering purchasing and implementing PeraHealth software, which it subsequently did. We did not receive any funding for the study from PeraHealth. PeraHealth personnel did not influence the study design, the interpretation of data, the writing of the report, or the decision to submit the article for publication.
1. Alam N, Hobbelink EL, van Tienhoven AJ, van de Ven PM, Jansma EP, Nanayakkara PWB. The impact of the use of the Early Warning Score (EWS) on patient outcomes: a systematic review. Resuscitation. 2014;85(5):587-594. doi: 10.1016/j.resuscitation.2014.01.013. PubMed
2. Rothman MJ, Tepas JJ, Nowalk AJ, et al. Development and validation of a continuously age-adjusted measure of patient condition for hospitalized children using the electronic medical record. J Biomed Inform. 2017;66 (Supplement C):180-193. doi: 10.1016/j.jbi.2016.12.013. PubMed
3. Akre M, Finkelstein M, Erickson M, Liu M, Vanderbilt L, Billman G. Sensitivity of the pediatric early warning score to identify patient deterioration. Pediatrics. 2010;125(4):e763-e769. doi: 10.1542/peds.2009-0338. PubMed
4. Seiger N, Maconochie I, Oostenbrink R, Moll HA. Validity of different pediatric early warning scores in the emergency department. Pediatrics. 2013;132(4):e841-e850. doi: 10.1542/peds.2012-3594. PubMed
5. Parshuram CS, Hutchison J, Middaugh K. Development and initial validation of the Bedside Paediatric Early Warning System score. Crit Care Lond Engl. 2009;13(4):R135. doi: 10.1186/cc7998. PubMed
6. Hollis RH, Graham LA, Lazenby JP, et al. A role for the early warning score in early identification of critical postoperative complications. Ann Surg. 2016;263(5):918-923. doi: 10.1097/SLA.0000000000001514. PubMed
7. Bonafide CP, Roberts KE, Priestley MA, et al. Development of a pragmatic measure for evaluating and optimizing rapid response systems. Pediatrics. 2012;129(4):e874-e881. doi: 10.1542/peds.2011-2784. PubMed
8. Rothman MJ, Rothman SI, Beals J. Development and validation of a continuous measure of patient condition using the electronic medical record. J Biomed Inform. 2013;46(5):837-848. doi: 10.1016/j.jbi.2013.06.011. PubMed
9. Harris PA, Taylor R, Thielke R, Payne J, Gonzalez N, Conde JG. Research Electronic Data Capture (REDCap) - A metadata-driven methodology and workflow process for providing translational research informatics support. J Biomed Inform. 2009;42(2):377-381. doi: 10.1016/j.jbi.2008.08.010. PubMed
10. Parshuram CS, Dryden-Palmer K, Farrell C, et al. Effect of a pediatric early warning system on all-cause mortality in hospitalized pediatric patients: the EPOCH randomized clinical trial. JAMA. 2018;319(10):1002-1012. doi: 10.1001/jama.2018.0948. PubMed
11. Bonafide CP, Localio AR, Roberts KE, Nadkarni VM, Weirich CM, Keren R. Impact of rapid response system implementation on critical deterioration events in children. JAMA Pediatr. 2014;168(1):25-33. doi: 10.1001/jamapediatrics.2013.3266. PubMed
12. Romero-Brufau S, Huddleston JM, Escobar GJ, Liebow M. Why the C-statistic is not informative to evaluate early warning scores and what metrics to use. Crit Care. 2015;19:285. doi: 10.1186/s13054-015-0999-1. PubMed
13. Bonafide CP, Roberts KE, Weirich CM, et al. Beyond statistical prediction: qualitative evaluation of the mechanisms by which pediatric early warning scores impact patient safety. J Hosp Med. 2013;8(5):248-253. doi: 10.1002/jhm.2026. PubMed
© 2018 Society of Hospital Medicine.
Assess Before Rx: Reducing the Overtreatment of Asymptomatic Blood Pressure Elevation in the Inpatient Setting
With the presence of hypertension in 25% of patients admitted to the hospital,1 its proper management is imperative. A hypertensive crisis is a severe elevation of blood pressure, defined as systolic ≥180 mm Hg and/or diastolic ≥120 mm Hg. It is further classified as either a hypertensive emergency which includes the presence of end-organ damage,2 or hypertensive urgency, defined as asymptomatic blood pressure elevation.3 Although hypertensive emergencies account for only 1%-2% of patients with hypertension,4 they are associated with a high one-year mortality rate (>79%).5 Hypertensive emergency requires immediate reduction of blood pressure with IV antihypertensive drugs to limit organ damage. In contrast, as per national guidelines, inpatient management of hypertensive urgency requires gradual reductions of blood pressure over hours to days using oral antihypertensives.2 It is also recommended that alternative etiologies, such as anxiety or pain, be considered before treatment is initiated.1
Clinicians often inappropriately treat asymptomatic hypertension in the inpatient setting,6,7 using intravenous (IV) antihypertensive medications despite evidence showing potential harm.5,8 This can lead to unpredictable reductions in blood pressure.7,9 A recent retrospective analysis demonstrated that 32.6% of patients had a blood pressure reduction greater than 25% after the use of an IV antihypertensive.7 Reductions greater than 25% lead to shifts in autoregulation, which may result in patient harm, such as hypotension, decreased renal perfusion, and stroke.9 IV medications are also more expensive than oral agents, due to the additional cost of administration.
Although overtreatment of asymptomatic hypertension with IV antihypertensive medications is common,7 initiatives to address this in inpatient settings are lacking in the literature. The aim of this quality improvement initiative was to reduce unnecessary IV antihypertensive treatment for hypertensive urgency in the inpatient setting.
METHODS
Setting
An interdisciplinary quality improvement intervention was initiated on two inpatient medicine units at an urban, 1,134-bed tertiary medical center affiliated with the Icahn School of Medicine at Mount Sinai. Members of the Mount Sinai High Value Care Committee and the Student High Value Care Initiative10 developed this project. The intervention was implemented in stages from March 2017 to February 2018. It targeted nurses, housestaff, nurse practitioners, and attendings on general medical teaching and nonteaching services. The components of the intervention included education, a treatment algorithm, audit and feedback, and electronic medical record (EMR) change. This project was submitted to the Quality Committee in the Department of Medicine and determined to be a quality improvement project rather than research and thus, an IRB submission was not required.
Treatment Algorithm and Education
A clinical algorithm was designed with nursing and cardiology representatives to provide guidance for nurses regarding the best practice for evaluation of inpatient hypertension, focusing on assessing patients before recommending treatment (“Assess Before Rx”; Figure 1). Educational sessions reinforcing the clinical algorithm were held monthly at nursing huddles. These involved an introduction session providing the background and purpose of the project, with follow-up sessions including interactive mock cases on the assessment of hypertensive urgency.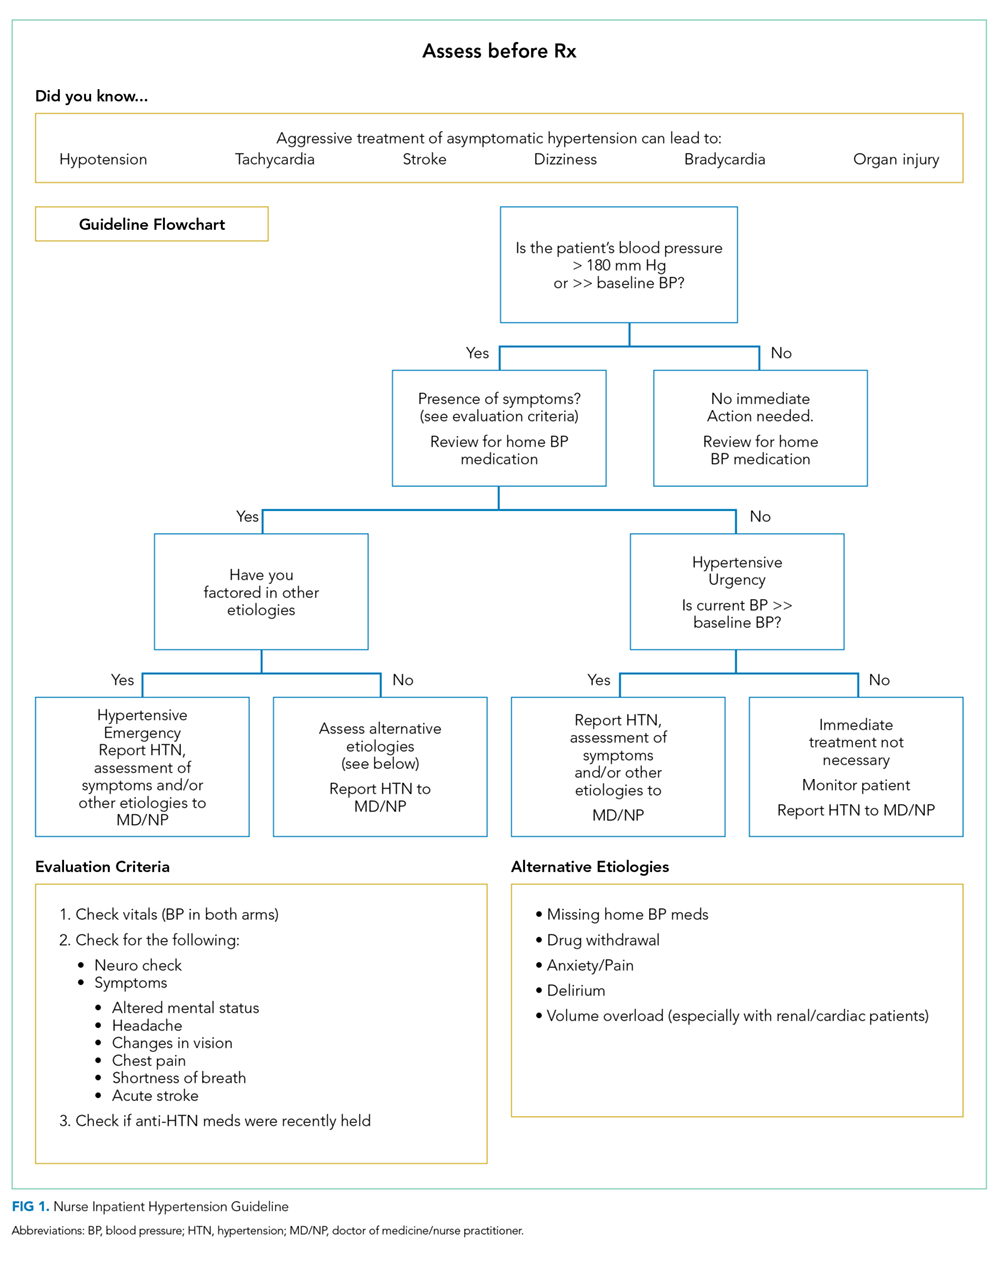
A second treatment algorithm was designed, with housestaff and cardiology input, to provide guidance for the internal medicine housestaff and nurse practitioners. It utilized a similar approach regarding identification, evaluation, and assessment of alternate etiologies but included more detailed treatment recommendations with a table outlining the oral medications used for hypertensive urgency (Figure 2). The flowchart and table were uploaded to an existing mobile application used by housestaff and nurse practitioners for quick access. The mobile application is frequently used by housestaff and contains many clinical resources. Additionally, e-mails including the purpose of the project and the treatment algorithm were sent to rotating housestaff at the start of each new medicine rotation.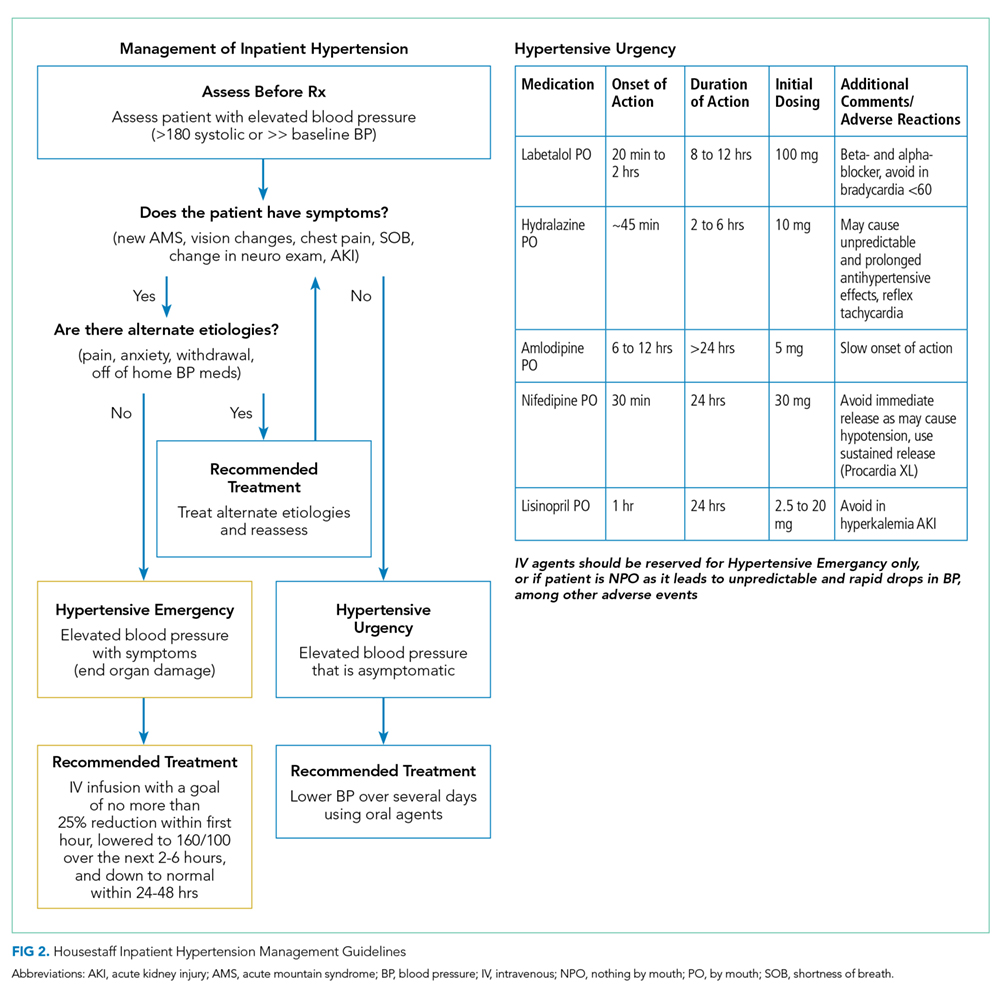
Audit and Feedback
Monthly feedback was e-mailed to the nurses, which reinforced the goals and provided positive feedback on outcomes with an announcement of the “Nurse of the Month.” The winners were selected based on the most accurate and appropriate documentation of their assessments determined through retrospective chart review.
Targeted e-mail feedback was also sent to providers who ordered IV antihypertensives without the appropriate indication. The e-mails included the medical record number, date and time of the order, any alternate etiologies that were documented, and any adverse events that occurred as a result of the medication.
Systems Change: Electronic Medical Record Orders
EMR advisory warnings were placed on IV antihypertensive orders of labetalol and hydralazine. The alerts served to nonintrusively remind providers to assess for symptoms before placing the order to ensure that the order was appropriate.
Data Collection and Assessment
Seven-month preintervention (January-July 2016) and 12-month postintervention (March 2017-February 2018) data were compared. The months prior to intervention were excluded to account for project development and educational lag. Data were obtained from EMR utilization reports of one-time orders of IV labetalol and hydralazine, and retrospective chart review. Patients who were pregnant, less than 18 years of age, or postoperative were excluded. Orders were designated as inappropriate if there was no evidence of hypertensive emergency through documentation in progress notes, or if the patient was able to take oral medication (not NPO). Adverse events were defined as a blood pressure drop of more than 25%, a change in the heart rate by more than 20 beats per minute, or the need for IV fluids, based on previous studies.7 Although decreased blood pressure is not necessarily dangerous in and of itself, adverse events arising from blood pressure decreasing too rapidly from IV antihypertensives are well documented.9,11 The presence of alternate etiologies of high blood pressure that were documented in progress notes, including pain, anxiety, agitation, and holding of home blood pressure medications, were recorded. The numbers of inappropriate orders pre- and postintervention were compared. Confounding factors of patient age and length of stay (LOS) were compared pre- and postintervention in order to rule out other factors to which the intervention’s effect could be attributed.
For this study, orders were reported on the standardized form of orders per 1,000 patient days. This was calculated as the number of orders divided by the total number of patient days from the two medicine units. For the univariate analysis, pre- and postintervention orders were compared for the different order categories using a t-test. Results were considered statistically significant at P < .05. Data analysis was conducted using SAS v. 9.4 (SAS Institute, Cary, North Carolina).
Additionally, a cost analysis was performed to estimate the hospital-wide annual cost of inappropriate orders. The analysis used the cost per dose12 and included nurse-time derived from the median salary of those on our units. The hospital-wide cost was extrapolated to estimate the potential annual savings for the institution.
RESULTS
A total of 260 one-time orders of IV antihypertensives were analyzed in this study, 127 in the seven-month preintervention period and 133 in the 12-month postintervention period. The majority, 67.3% (n = 175), were labetalol orders. Inappropriate orders (ie, neither NPO nor hypertensive emergency) decreased from 8.3 to 3.3 orders per 1,000 patient days (P = .0099; Figure 3).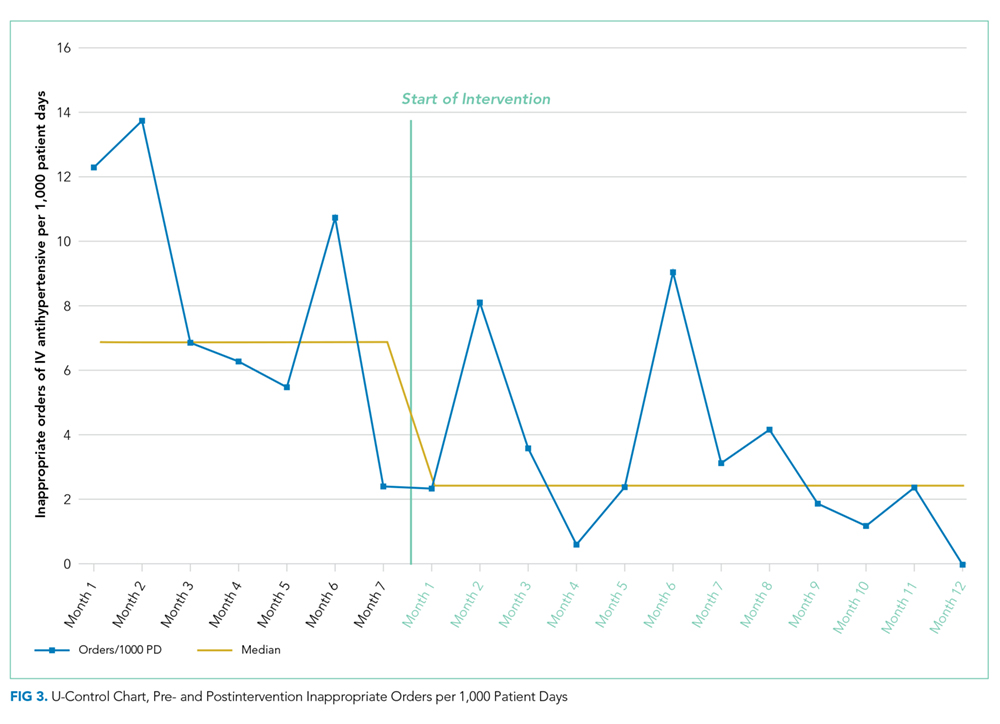
In total, there were 86 adverse events (33.1%), the majority of which (94.2%, n = 81) were a >25% decrease in blood pressure (Table 1). The number of adverse events per 1,000 patient days decreased from 4.4 in the preintervention period to 1.9 postintervention, P = .0112. Of the inappropriate orders, adverse events decreased from 3.7 to 0.8 per 1,000 patient days, P = .0072. Overall, there were 76 orders (29.2%) with documented alternate etiologies. The number of orders per 1,000 patient days with an alternate etiology decreased from 4.7 in the preintervention period to 1.2 postintervention, P =.0044 (Table 2). Descriptive analysis of patient characteristics pre-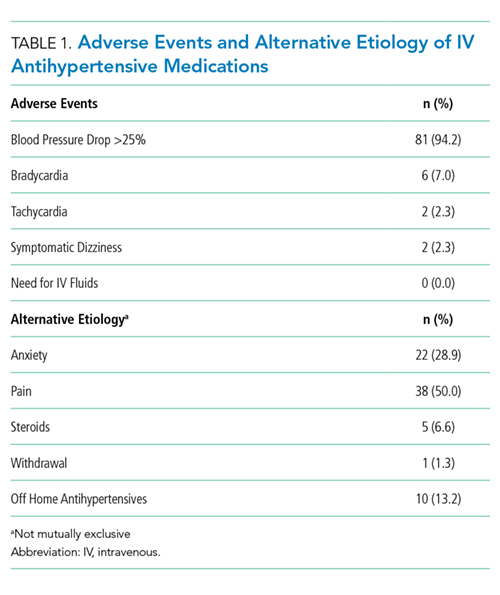
Cost analysis estimated a $17,890 annual hospital-wide cost for unnecessary IV antihypertensive medications before the intervention. The estimate was calculated using the number of orders on the two medical units observed during the seven-month preintervention period, extrapolated to a 12-month period and to the total number of 15 medical units in the hospital. The intervention on the two studied medical units themselves led to an estimated $1,421 cost reduction (59.6%). Had the intervention been implemented hospital-wide with similar results, the resulting cost reduction would have amounted to $10,662.
DISCUSSION
Our initiative successfully demonstrated a significant reduction of 60% in inappropriate one-time orders of IV antihypertensives per 1,000 patient days. Accordingly, the number of adverse events per 1,000 patient days decreased by 57%. There was also a decrease in the number and percentage of IV orders with documented alternate etiologies. We hypothesize that this was due to nurses and physicians assessing and treating these conditions prior to treating hypertension in the intervention period, consequently avoiding an IV order.
The goal of the intervention was to have nurses assess for end-organ damage and alternate etiologies and include this information on their assessment provided to the physician, which would result in appropriate treatment of elevated blood pressure. By performing an interdisciplinary intervention, we addressed the knowledge deficit of both nurses and physicians, improved the triage of elevated blood pressure, and likely decreased the number of pages to providers.
To our knowledge, this is the first intervention addressing the inpatient overuse of IV antihypertensive medications for the treatment of asymptomatic hypertension. Additionally, this study bolsters prior evidence that the use of IV antihypertensives in asymptomatic patients leads to a large number of adverse events.7 A third of patients in the preintervention period had documented alternate etiologies of their blood pressure elevation, highlighting the need to assess and potentially treat these causes prior to treating blood pressure itself.
Reducing unnecessary treatment of asymptomatic blood pressure elevation is challenging. Evidence shows that both clinicians and patients overestimate the benefits and underestimate the harms of medical interventions.13,14 This unfortunately leads to unjustified enthusiasm for medical treatments, which can worsen outcomes.15 Additionally, there may be a lack of knowledge of the guidelines, as well as the amount of time required in the full assessment of hypertensive urgency, that creates a culture of “treating the number.”
Changing physician behavior is difficult.16 However, active forms of continuing education and multifaceted interventions, such as ours, are most effective.17 Our message focused on patient safety and harm reduction, addressed clinicians’ safety concerns, and included stories of real cases where this overuse led to adverse events—all of which are encouraged in order to facilitate clinician engagement.18
There were limitations to this study. Only blood pressure elevations associated with an IV antihypertensive order and not all blood pressure elevations meeting the criteria for hypertensive urgency in general were examined. Additionally, our documentation of symptoms of hypertensive emergency and alternate etiologies was based only on documentation in the medical record. Ideally, we would have liked to conduct an interrupted time series analysis to assess the effect of the intervention over time; however, there were not enough orders of IV antihypertensives to perform such an analysis.
CONCLUSION
Treatment of asymptomatic blood pressure with IV antihypertensive medications can lead to patient harm. To reduce inappropriate treatment, our Student High Value Care team set out to challenge this common practice. Our interdisciplinary intervention successfully reduced unnecessary IV antihypertensive treatment. This may serve as a model for other institutions.
Disclosures
There are no relevant conflicts of interest to disclose for any authors.
1. Herzog E, Frankenberger O, Aziz E, et al. A novel pathway for the management of hypertension for hospitalized patients. Crit Pathw Cardiol. 2007;6(4):150-160. doi: 10.1097/HPC.0b013e318160c3a7. PubMed
2. Whelton PK, Carey RM, Aronow WS, et al. 2017 ACC/AHA/AAPA/ABC/ACPM/AGS/APhA/ASH/ASPC/NMA/PCNA guideline for the prevention, detection, evaluation, and management of high blood pressure in adults: a report of the American College of Cardiology/American Heart Association Task Force on clinical practice guidelines. Hypertension. 2018;71(6):e13-e115. doi: 10.1161/HYP.0000000000000065. PubMed
3. Mancia G, Fagard R, Narkiewicz K, et al. 2013 ESH/ESC guidelines for the management of arterial hypertension: the Task Force for the Management of Arterial Hypertension of the European Society of Hypertension (ESH) and of the European Society of Cardiology (ESC). Eur Heart J. 2013;34(28):2159-2219. doi: 10.1093/eurheartj/eht151. PubMed
4. Global status report on noncommunicable diseases 2010. Geneva, Switzerland: World Health Organization; 2011. 3.
5. Weder AB, Erickson S. Treatment of hypertension in the inpatient setting: use of intravenous labetalol and hydralazine. J Clin Hypertens (Greenwich). 2010;12(1):29-33. doi: 10.1111/j.1751-7176.2009.00196.x. PubMed
6. James PA, Oparil S, Carter BL, et al. 2014 evidence-based guideline for the management of high blood pressure in adults: report from the panel members appointed to the Eighth Joint National Committee (JNC 8). JAMA. 2014;311(5):507-520. doi: 10.1001/jama.2013.284427. PubMed
7. Lipari M, Moser LR, Petrovitch EA, Farber M, Flack JM. As-needed intravenous antihypertensive therapy and blood pressure control. J Hosp Med. 2016;11(3):193-198. doi: 10.1002/jhm.2510. PubMed
8. Patel KK, Young L, Howell EH, et al. Characteristics and outcomes of patients presenting with hypertensive urgency in the office setting. JAMA Intern Med. 2016;176(7):981-988. doi: 10.1001/jamainternmed.2016.1509. PubMed
9. Ipek E, Oktay AA, Krim SR. Hypertensive crisis: an update on clinical approach and management. Curr Opin Cardiol. 2017;32(4):397-406. doi: 10.1097/HCO.0000000000000398. PubMed
10. Cho HC, Dunn A, Di Capua J, Lee IT, Makhni S, Korenstein DR. Student high value care committee: a model for student-led implementation [abstract 286]. J Hosp Med. 2017. PubMed
11. Yang JY, Chiu S, Krouss M. Overtreatment of asymptomatic hypertension-urgency is not an emergency: a teachable moment. JAMA Intern Med. 2018;178(5):704-705. doi: 10.1001/jamainternmed.2018.0126. PubMed
12. Malesker MA, Hilleman DE. Intravenous labetalol compared with intravenous nicardipine in the management of hypertension in critically ill patients. J Crit Care. 2012;27(5):528 e527-514. doi: 10.1016/j.jcrc.2011.12.005. PubMed
13. Hoffmann TC, Del Mar C. Clinicians’ expectations of the benefits and harms of treatments, screening, and tests: a systematic review. JAMA Intern Med. 2017;177(3):407-419. doi: 10.1001/jamainternmed.2016.8254. PubMed
14. Hoffmann TC, Del Mar C. Patients’ expectations of the benefits and harms of treatments, screening, and tests: a systematic review. JAMA Intern Med. 2015;175(2):274-286. doi: 10.1001/jamainternmed.2014.6016. PubMed
15. Casarett D. The science of choosing wisely--overcoming the therapeutic illusion. N Engl J Med. 2016;374(13):1203-1205. doi: 10.1056/NEJMp1516803. PubMed
16. Wilensky G. Changing physician behavior is harder than we thought. JAMA. 2016;316(1):21-22. doi: 10.1001/jama.2016.8019. PubMed
17. Mostofian F, Ruban C, Simunovic N, Bhandari M. Changing physician behavior: what works? Am J Manag Care. 2015;21(1):75-84.
18. Pasik S, Korenstein D, Israilov S, Cho HJ. Engagement in eliminating overuse: the argument for safety and beyond. J Patient Saf. 2018. doi: 10.1097/PTS.0000000000000487. PubMed
With the presence of hypertension in 25% of patients admitted to the hospital,1 its proper management is imperative. A hypertensive crisis is a severe elevation of blood pressure, defined as systolic ≥180 mm Hg and/or diastolic ≥120 mm Hg. It is further classified as either a hypertensive emergency which includes the presence of end-organ damage,2 or hypertensive urgency, defined as asymptomatic blood pressure elevation.3 Although hypertensive emergencies account for only 1%-2% of patients with hypertension,4 they are associated with a high one-year mortality rate (>79%).5 Hypertensive emergency requires immediate reduction of blood pressure with IV antihypertensive drugs to limit organ damage. In contrast, as per national guidelines, inpatient management of hypertensive urgency requires gradual reductions of blood pressure over hours to days using oral antihypertensives.2 It is also recommended that alternative etiologies, such as anxiety or pain, be considered before treatment is initiated.1
Clinicians often inappropriately treat asymptomatic hypertension in the inpatient setting,6,7 using intravenous (IV) antihypertensive medications despite evidence showing potential harm.5,8 This can lead to unpredictable reductions in blood pressure.7,9 A recent retrospective analysis demonstrated that 32.6% of patients had a blood pressure reduction greater than 25% after the use of an IV antihypertensive.7 Reductions greater than 25% lead to shifts in autoregulation, which may result in patient harm, such as hypotension, decreased renal perfusion, and stroke.9 IV medications are also more expensive than oral agents, due to the additional cost of administration.
Although overtreatment of asymptomatic hypertension with IV antihypertensive medications is common,7 initiatives to address this in inpatient settings are lacking in the literature. The aim of this quality improvement initiative was to reduce unnecessary IV antihypertensive treatment for hypertensive urgency in the inpatient setting.
METHODS
Setting
An interdisciplinary quality improvement intervention was initiated on two inpatient medicine units at an urban, 1,134-bed tertiary medical center affiliated with the Icahn School of Medicine at Mount Sinai. Members of the Mount Sinai High Value Care Committee and the Student High Value Care Initiative10 developed this project. The intervention was implemented in stages from March 2017 to February 2018. It targeted nurses, housestaff, nurse practitioners, and attendings on general medical teaching and nonteaching services. The components of the intervention included education, a treatment algorithm, audit and feedback, and electronic medical record (EMR) change. This project was submitted to the Quality Committee in the Department of Medicine and determined to be a quality improvement project rather than research and thus, an IRB submission was not required.
Treatment Algorithm and Education
A clinical algorithm was designed with nursing and cardiology representatives to provide guidance for nurses regarding the best practice for evaluation of inpatient hypertension, focusing on assessing patients before recommending treatment (“Assess Before Rx”; Figure 1). Educational sessions reinforcing the clinical algorithm were held monthly at nursing huddles. These involved an introduction session providing the background and purpose of the project, with follow-up sessions including interactive mock cases on the assessment of hypertensive urgency.
A second treatment algorithm was designed, with housestaff and cardiology input, to provide guidance for the internal medicine housestaff and nurse practitioners. It utilized a similar approach regarding identification, evaluation, and assessment of alternate etiologies but included more detailed treatment recommendations with a table outlining the oral medications used for hypertensive urgency (Figure 2). The flowchart and table were uploaded to an existing mobile application used by housestaff and nurse practitioners for quick access. The mobile application is frequently used by housestaff and contains many clinical resources. Additionally, e-mails including the purpose of the project and the treatment algorithm were sent to rotating housestaff at the start of each new medicine rotation.
Audit and Feedback
Monthly feedback was e-mailed to the nurses, which reinforced the goals and provided positive feedback on outcomes with an announcement of the “Nurse of the Month.” The winners were selected based on the most accurate and appropriate documentation of their assessments determined through retrospective chart review.
Targeted e-mail feedback was also sent to providers who ordered IV antihypertensives without the appropriate indication. The e-mails included the medical record number, date and time of the order, any alternate etiologies that were documented, and any adverse events that occurred as a result of the medication.
Systems Change: Electronic Medical Record Orders
EMR advisory warnings were placed on IV antihypertensive orders of labetalol and hydralazine. The alerts served to nonintrusively remind providers to assess for symptoms before placing the order to ensure that the order was appropriate.
Data Collection and Assessment
Seven-month preintervention (January-July 2016) and 12-month postintervention (March 2017-February 2018) data were compared. The months prior to intervention were excluded to account for project development and educational lag. Data were obtained from EMR utilization reports of one-time orders of IV labetalol and hydralazine, and retrospective chart review. Patients who were pregnant, less than 18 years of age, or postoperative were excluded. Orders were designated as inappropriate if there was no evidence of hypertensive emergency through documentation in progress notes, or if the patient was able to take oral medication (not NPO). Adverse events were defined as a blood pressure drop of more than 25%, a change in the heart rate by more than 20 beats per minute, or the need for IV fluids, based on previous studies.7 Although decreased blood pressure is not necessarily dangerous in and of itself, adverse events arising from blood pressure decreasing too rapidly from IV antihypertensives are well documented.9,11 The presence of alternate etiologies of high blood pressure that were documented in progress notes, including pain, anxiety, agitation, and holding of home blood pressure medications, were recorded. The numbers of inappropriate orders pre- and postintervention were compared. Confounding factors of patient age and length of stay (LOS) were compared pre- and postintervention in order to rule out other factors to which the intervention’s effect could be attributed.
For this study, orders were reported on the standardized form of orders per 1,000 patient days. This was calculated as the number of orders divided by the total number of patient days from the two medicine units. For the univariate analysis, pre- and postintervention orders were compared for the different order categories using a t-test. Results were considered statistically significant at P < .05. Data analysis was conducted using SAS v. 9.4 (SAS Institute, Cary, North Carolina).
Additionally, a cost analysis was performed to estimate the hospital-wide annual cost of inappropriate orders. The analysis used the cost per dose12 and included nurse-time derived from the median salary of those on our units. The hospital-wide cost was extrapolated to estimate the potential annual savings for the institution.
RESULTS
A total of 260 one-time orders of IV antihypertensives were analyzed in this study, 127 in the seven-month preintervention period and 133 in the 12-month postintervention period. The majority, 67.3% (n = 175), were labetalol orders. Inappropriate orders (ie, neither NPO nor hypertensive emergency) decreased from 8.3 to 3.3 orders per 1,000 patient days (P = .0099; Figure 3).
In total, there were 86 adverse events (33.1%), the majority of which (94.2%, n = 81) were a >25% decrease in blood pressure (Table 1). The number of adverse events per 1,000 patient days decreased from 4.4 in the preintervention period to 1.9 postintervention, P = .0112. Of the inappropriate orders, adverse events decreased from 3.7 to 0.8 per 1,000 patient days, P = .0072. Overall, there were 76 orders (29.2%) with documented alternate etiologies. The number of orders per 1,000 patient days with an alternate etiology decreased from 4.7 in the preintervention period to 1.2 postintervention, P =.0044 (Table 2). Descriptive analysis of patient characteristics pre-
Cost analysis estimated a $17,890 annual hospital-wide cost for unnecessary IV antihypertensive medications before the intervention. The estimate was calculated using the number of orders on the two medical units observed during the seven-month preintervention period, extrapolated to a 12-month period and to the total number of 15 medical units in the hospital. The intervention on the two studied medical units themselves led to an estimated $1,421 cost reduction (59.6%). Had the intervention been implemented hospital-wide with similar results, the resulting cost reduction would have amounted to $10,662.
DISCUSSION
Our initiative successfully demonstrated a significant reduction of 60% in inappropriate one-time orders of IV antihypertensives per 1,000 patient days. Accordingly, the number of adverse events per 1,000 patient days decreased by 57%. There was also a decrease in the number and percentage of IV orders with documented alternate etiologies. We hypothesize that this was due to nurses and physicians assessing and treating these conditions prior to treating hypertension in the intervention period, consequently avoiding an IV order.
The goal of the intervention was to have nurses assess for end-organ damage and alternate etiologies and include this information on their assessment provided to the physician, which would result in appropriate treatment of elevated blood pressure. By performing an interdisciplinary intervention, we addressed the knowledge deficit of both nurses and physicians, improved the triage of elevated blood pressure, and likely decreased the number of pages to providers.
To our knowledge, this is the first intervention addressing the inpatient overuse of IV antihypertensive medications for the treatment of asymptomatic hypertension. Additionally, this study bolsters prior evidence that the use of IV antihypertensives in asymptomatic patients leads to a large number of adverse events.7 A third of patients in the preintervention period had documented alternate etiologies of their blood pressure elevation, highlighting the need to assess and potentially treat these causes prior to treating blood pressure itself.
Reducing unnecessary treatment of asymptomatic blood pressure elevation is challenging. Evidence shows that both clinicians and patients overestimate the benefits and underestimate the harms of medical interventions.13,14 This unfortunately leads to unjustified enthusiasm for medical treatments, which can worsen outcomes.15 Additionally, there may be a lack of knowledge of the guidelines, as well as the amount of time required in the full assessment of hypertensive urgency, that creates a culture of “treating the number.”
Changing physician behavior is difficult.16 However, active forms of continuing education and multifaceted interventions, such as ours, are most effective.17 Our message focused on patient safety and harm reduction, addressed clinicians’ safety concerns, and included stories of real cases where this overuse led to adverse events—all of which are encouraged in order to facilitate clinician engagement.18
There were limitations to this study. Only blood pressure elevations associated with an IV antihypertensive order and not all blood pressure elevations meeting the criteria for hypertensive urgency in general were examined. Additionally, our documentation of symptoms of hypertensive emergency and alternate etiologies was based only on documentation in the medical record. Ideally, we would have liked to conduct an interrupted time series analysis to assess the effect of the intervention over time; however, there were not enough orders of IV antihypertensives to perform such an analysis.
CONCLUSION
Treatment of asymptomatic blood pressure with IV antihypertensive medications can lead to patient harm. To reduce inappropriate treatment, our Student High Value Care team set out to challenge this common practice. Our interdisciplinary intervention successfully reduced unnecessary IV antihypertensive treatment. This may serve as a model for other institutions.
Disclosures
There are no relevant conflicts of interest to disclose for any authors.
1. Herzog E, Frankenberger O, Aziz E, et al. A novel pathway for the management of hypertension for hospitalized patients. Crit Pathw Cardiol. 2007;6(4):150-160. doi: 10.1097/HPC.0b013e318160c3a7. PubMed
2. Whelton PK, Carey RM, Aronow WS, et al. 2017 ACC/AHA/AAPA/ABC/ACPM/AGS/APhA/ASH/ASPC/NMA/PCNA guideline for the prevention, detection, evaluation, and management of high blood pressure in adults: a report of the American College of Cardiology/American Heart Association Task Force on clinical practice guidelines. Hypertension. 2018;71(6):e13-e115. doi: 10.1161/HYP.0000000000000065. PubMed
3. Mancia G, Fagard R, Narkiewicz K, et al. 2013 ESH/ESC guidelines for the management of arterial hypertension: the Task Force for the Management of Arterial Hypertension of the European Society of Hypertension (ESH) and of the European Society of Cardiology (ESC). Eur Heart J. 2013;34(28):2159-2219. doi: 10.1093/eurheartj/eht151. PubMed
4. Global status report on noncommunicable diseases 2010. Geneva, Switzerland: World Health Organization; 2011. 3.
5. Weder AB, Erickson S. Treatment of hypertension in the inpatient setting: use of intravenous labetalol and hydralazine. J Clin Hypertens (Greenwich). 2010;12(1):29-33. doi: 10.1111/j.1751-7176.2009.00196.x. PubMed
6. James PA, Oparil S, Carter BL, et al. 2014 evidence-based guideline for the management of high blood pressure in adults: report from the panel members appointed to the Eighth Joint National Committee (JNC 8). JAMA. 2014;311(5):507-520. doi: 10.1001/jama.2013.284427. PubMed
7. Lipari M, Moser LR, Petrovitch EA, Farber M, Flack JM. As-needed intravenous antihypertensive therapy and blood pressure control. J Hosp Med. 2016;11(3):193-198. doi: 10.1002/jhm.2510. PubMed
8. Patel KK, Young L, Howell EH, et al. Characteristics and outcomes of patients presenting with hypertensive urgency in the office setting. JAMA Intern Med. 2016;176(7):981-988. doi: 10.1001/jamainternmed.2016.1509. PubMed
9. Ipek E, Oktay AA, Krim SR. Hypertensive crisis: an update on clinical approach and management. Curr Opin Cardiol. 2017;32(4):397-406. doi: 10.1097/HCO.0000000000000398. PubMed
10. Cho HC, Dunn A, Di Capua J, Lee IT, Makhni S, Korenstein DR. Student high value care committee: a model for student-led implementation [abstract 286]. J Hosp Med. 2017. PubMed
11. Yang JY, Chiu S, Krouss M. Overtreatment of asymptomatic hypertension-urgency is not an emergency: a teachable moment. JAMA Intern Med. 2018;178(5):704-705. doi: 10.1001/jamainternmed.2018.0126. PubMed
12. Malesker MA, Hilleman DE. Intravenous labetalol compared with intravenous nicardipine in the management of hypertension in critically ill patients. J Crit Care. 2012;27(5):528 e527-514. doi: 10.1016/j.jcrc.2011.12.005. PubMed
13. Hoffmann TC, Del Mar C. Clinicians’ expectations of the benefits and harms of treatments, screening, and tests: a systematic review. JAMA Intern Med. 2017;177(3):407-419. doi: 10.1001/jamainternmed.2016.8254. PubMed
14. Hoffmann TC, Del Mar C. Patients’ expectations of the benefits and harms of treatments, screening, and tests: a systematic review. JAMA Intern Med. 2015;175(2):274-286. doi: 10.1001/jamainternmed.2014.6016. PubMed
15. Casarett D. The science of choosing wisely--overcoming the therapeutic illusion. N Engl J Med. 2016;374(13):1203-1205. doi: 10.1056/NEJMp1516803. PubMed
16. Wilensky G. Changing physician behavior is harder than we thought. JAMA. 2016;316(1):21-22. doi: 10.1001/jama.2016.8019. PubMed
17. Mostofian F, Ruban C, Simunovic N, Bhandari M. Changing physician behavior: what works? Am J Manag Care. 2015;21(1):75-84.
18. Pasik S, Korenstein D, Israilov S, Cho HJ. Engagement in eliminating overuse: the argument for safety and beyond. J Patient Saf. 2018. doi: 10.1097/PTS.0000000000000487. PubMed
© 2019 Society of Hospital Medicine
Reducing Unnecessary Treatment of Asymptomatic Elevated Blood Pressure with Intravenous Medications on the General Internal Medicine Wards: A Quality Improvement Initiative
Elevated blood pressure (BP) is common among hospitalized adults, with prevalence estimates between 50% and 70%.1 Many factors can cause or exacerbate BP elevations in the setting of acute illness, such as pain, anxiety, medication withdrawal, and volume status, among others.2 While there are clear evidence-based recommendations for treating hypertension (HTN) in the ambulatory setting,3 guidelines for the management of elevated BP in the hospital are lacking.4,5
Hypertensive crises are generally recognized as warranting rapid reduction in BP;6-8 however, these represent the minority of cases.9,10 Far more common in the hospital are patients with asymptomatic elevated BP, a population for which there is no high-quality evidence and no guidelines supporting the use of intravenous (IV) antihypertensives.11,12 Treatment with such medications has been associated with highly variable clinical responses13-15 and may result in adverse events, such as hypotension.10
To date, only a small number of studies have investigated the treatment of asymptomatic elevated BP among hospitalized adults.10,13-15 These have suggested that IV antihypertensives are utilized frequently in this setting, often for only modestly elevated BPs; however, the studies have tended to be small, not racially diverse, and limited to noncritically ill patients. Furthermore, while it is generally accepted that reducing the use of IV antihypertensives among asymptomatic patients would have no adverse impact, to our knowledge there have been no published studies which have instituted such an initiative while measuring balancing outcomes.
The purpose of this study was to further the existing literature by defining the prevalence and effects of IV antihypertensive medication utilization among a medically complex, multiracial population of asymptomatic medical inpatients using a large electronic dataset and to evaluate the impact of a division-wide, two-tiered quality improvement (QI) initiative on the rates of IV antihypertensive utilization and patient outcomes.
METHODS
Setting
The study was conducted at the University of California, San Francisco (UCSF), an 800-bed tertiary care, academic medical center. It was approved by the UCSF Institutional Review Board. General medicine patients at UCSF are distributed between teaching and direct-care (hospitalist) services. The intensive care unit (ICU) is “open,” meaning the medicine service acts as the primary team for all nonsurgical ICU patients. This study included all adult general medicine patients admitted to UCSF Medical Center between January 1, 2017 and March 1, 2018, including those in the ICU.
Study Population and Data Collection
The UCSF Medical Center uses the electronic health record (EHR) Epic (Epic 2017, Epic Systems Corporation, Verona, Wisconsin) for all clinical care. We obtained computerized EHR data from Clarity, the relational database that stores Epic’s inpatient data in thousands of tables, including orders, medications, laboratory and radiology results, vital signs, patient demographics, and notes. We identified all adult patients hospitalized on the general medicine service with ≥1 episode of elevated BP (>160/90 mm Hg) at any point during their hospitalization who were not on a vasopressor medication at the time of the vital sign recording.
We further identified all instances in which either IV labetalol or hydralazine were administered to these patients. These two agents were chosen because they are the only IV antihypertensives used commonly at our institution for the treatment of asymptomatic elevated BP among internal medicine patients. Only those orders placed by a general medicine provider or reconciled by a general medicine provider upon transfer from another service were included. For each medication administration timestamp, we collected vital signs before and after the administration, along with the ordering provider and the clinical indication that was documented in the electronic order. To determine if a medication was administered with concern for end-organ injury, we also extracted orders that could serve as a proxy for the provider’s clinical assessment—namely electrocardiograms, serum troponins, chest x-rays, and computerized tomography scans of the head—which were placed in the one hour preceding or 15 minutes following administration of an IV antihypertensive medication.
To assess for comorbid conditions, including a preexisting diagnosis of HTN, we collected International Classification of Diseases (ICD)-9/10 diagnosis codes. Further, we also extracted All Patient Refined Diagnosis-Related Group (APR-DRG) weights, which are a standardized measure of illness severity based on relative resource consumption during hospitalization.16,17
Patients were categorized as having either “symptomatic” or “asymptomatic” elevated BP. We defined symptomatic elevated BP as having received treatment with an IV medication with provider concern for end-organ injury, as defined above. We further identified all patients in which tight BP control may be clinically indicated on the basis of the presence of any of the following ICD-9/10 diagnosis codes at the time of hospital discharge: myocardial infarction, ischemic stroke, intracranial hemorrhage, subarachnoid hemorrhage, subdural hematoma, aortic dissection, hypertensive emergency, or hypertensive encephalopathy. All patients with symptomatic elevated BP or any of the above ICD-9/10 diagnoses were excluded from the analysis, since administration of IV antihypertensive medications would plausibly be warranted in these clinical scenarios.
The encounter numbers from the dataset were used to link to patient demographic data, which included age, sex, race, ethnicity, primary language, and insurance status. Finally, we identified all instances of rapid response calls, ICU transfers, and code blues (cardiopulmonary arrests) for each patient in the dataset.
Blood Pressure Measurements
BP data were collected from invasive BP (IBP) monitoring devices and noninvasive BP cuffs. For patients with BP measurements recorded concomitantly from both IBP (ie, arterial lines) in addition to noninvasive BP cuffs, the arterial line reading was favored. All systolic BP (SBP) readings >240 mm Hg from arterial lines were excluded, as this has previously been described as the upper physiologic limit for IBP readings.18
Primary Outcome
The primary outcome for the study was the proportion of patients treated with IV antihypertensive medications (labetalol or hydralazine). Using aggregate data, we calculated the number of patients who were treated at least once with an IV antihypertensive in a given month (numerator), divided by the number of patients with ≥1 episode of asymptomatic elevated BP that month (denominator). The denominator was considered to be the population of patients “at risk” of being treated with IV antihypertensive medications. For patients with multiple admissions during the study period, each admission was considered separately. These results are displayed in the upper portion of the run chart (Figure).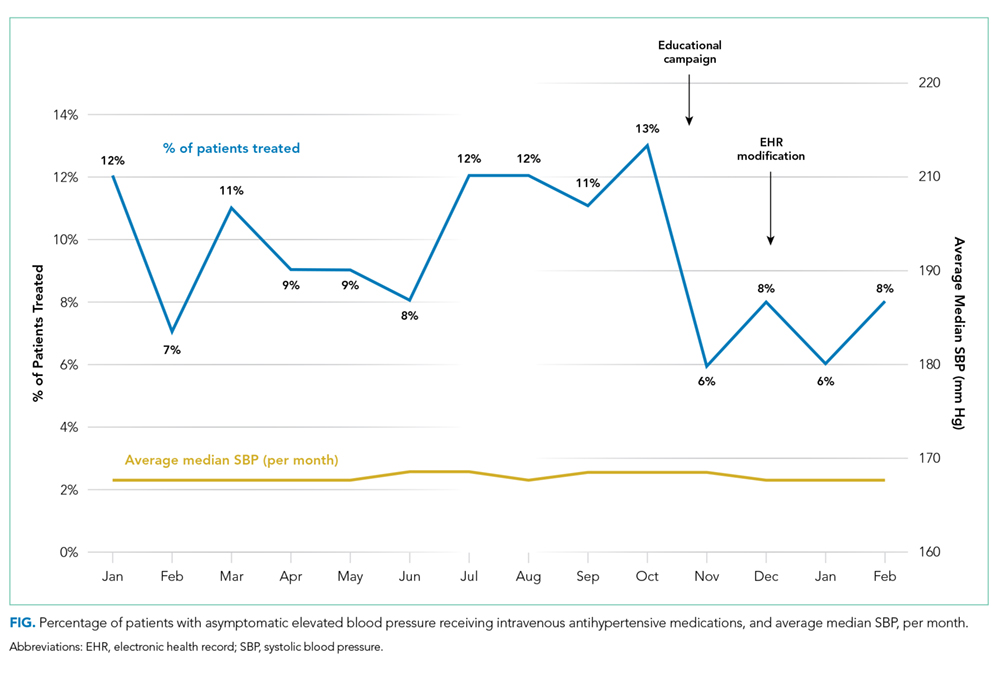
Secondary Outcomes
To investigate blood pressure trends over time, we analyzed BP in three ways. First, we analyzed the median SBP for the entire population. Second, to determine clinical responses to IV antihypertensive medications among patients receiving treatment, we calculated the population medians for the pretreatment SBP, the change in SBP from pretreatment baseline, and the posttreatment SBP. Third, we calculated the average median SBP on a monthly basis for the duration of the study. This was achieved by calculating the median value of all SBPs for an individual patient, then averaging across all patients in a given month. The average monthly median SBPs are displayed in the lower portion of the Figure.
To investigate whether the intervention was associated with negative patient outcomes, the proportions of several balancing outcomes were compared between pre- and postintervention periods, including ICU transfers, rapid response calls, and code blues (cardiopulmonary arrests).
Development and Implementation of an Intervention to Reduce Excessive IV Antihypertensive Use
After establishing the baseline prevalence of IV antihypertensive medication use at our institution, we developed a QI initiative with the goal of reducing IV antihypertensive medication utilization by the general medicine service for the treatment of asymptomatic patients. We hypothesized that potential contributors to overutilization might include lack of education, provider/nursing discomfort, and a system designed to mandate provider notification for even modestly elevated BPs. The QI initiative, which took place between October 2017 and December 2017, was designed to address these potential contributors and was comprised of a division-wide, two-tiered, bundled intervention. Our choice of a two-tiered approach was based on the fact that successful culture change is challenging, along with the existing evidence that multifaceted QI interventions are more often successful than single-tiered approaches.19
The first tier of the initiative included an educational campaign referred to colloquially as “NoIVForHighBP,” which targeted residents, hospitalists, and nursing staff. The campaign consisted of a series of presentations, best practice updates, handouts, and posters displayed prominently in shared workspaces. The educational content focused on alternative approaches to the management of asymptomatic elevated BP in the hospital, such as identification and treatment of pain, anxiety, volume overload, or other contributing factors (see supplemental materials). These educational outreaches occurred periodically between October 4, 2017 and November 20, 2017, with the bulk of the educational efforts taking place during November. Therefore, November 1, 2017 was designated the start date for the intervention period.
The second tier of the intervention included the liberalization of the EHR BP notification parameters on the standard inpatient admission order set from >160/90 mm Hg to >180/90 mm Hg. This change took effect on 12/6/2017. The decision to modify the BP notification parameters was based on the hypothesis that mandatory notifications for modestly elevated BPs may prompt providers to reflexively order IV antihypertensive medications, especially during times of cross-coverage or high clinical workload.
Statistical Analysis
All statistical analyses were performed using Stata software version 15 (StataCorp. 2017. Stata Statistical Software: Release 15. College Station, Texas: StataCorp LLC). Baseline patient characteristics were compared using nonparametric tests of significance. Population median SBPs were compared between pre- and postintervention periods using Mood’s Median Test, which was selected because the data were distributed nonnormally, and variances between samples were unequal.
Among patients treated with IV antihypertensive medications, we compared the proportion of pretreatment SBPs falling into each of three specified ranges (SBP <180 mm Hg, SBP 180-199 mm Hg, and SBP >200 mm Hg) between baseline and intervention periods using chi-squared tests.
Using aggregate data, we compared the unadjusted proportion of patients treated with IV antihypertensive medications between pre- and postintervention periods using a chi-squared test. Next, using patient-level data, a logistic regression analysis was performed to examine the association between receipt of IV antihypertensive medications and time (dichotomized between pre- and postintervention periods) while adjusting for age, sex, race, ethnicity, primary language, insurance status, preexisting HTN, length of stay, and APR-DRG weight.
Rates of balancing outcomes were compared using chi-squared tests. A logistic regression analysis using patient-level data was also performed to investigate the association between each of these outcomes and the intervention period (pre vs post) while adjusting for age, sex, race, ethnicity, primary language, insurance status, preexisting HTN, length of stay, and APR-DRG weight.
RESULTS
Baseline Period
We identified 2,306 patients with ≥1 episode of asymptomatic elevated BP during the 10-month preintervention period. Patients on average experienced 9 episodes of elevated BP per hospitalization, representing 21,207 potential opportunities for treatment. Baseline characteristics are summarized in Table 1. In general, this represents an older population that was medically complex and multiracial.
Of these patients, 251 (11%) received IV hydralazine and/or labetalol at least once during their hospitalization, with a total of 597 doses administered. Among those treated, a median of 2 doses were given per patient (IQR: 1-4), 64% of which were hydralazine. The majority (380 [64%]) were ordered on an “as needed” basis, while 217 (36%) were administered as a one-time dose. Three-quarters of all doses were ordered by the teaching service (456 [76%]), with the remaining 24% ordered by the direct-care (hospitalist) service.
During the baseline period among patients receiving IV antihypertensive medications, the median SBP of the population prior to treatment was 187 mm Hg (IQR 177-199; Table 2). Treatment was initiated in 30% of patients for an SBP <180 mm Hg and in 75% for an SBP <200 mm Hg. The median time to follow-up BP check was 34 minutes (IQR 15-58). The median decrement in SBP was 20 mm Hg (IQR 5-37); however, the response to treatment was highly variable, with 2% of patients experiencing no change and 14% experiencing an increase in SBP. Seventy-nine patients (14%) had a decrement in SBP >25% following treatment.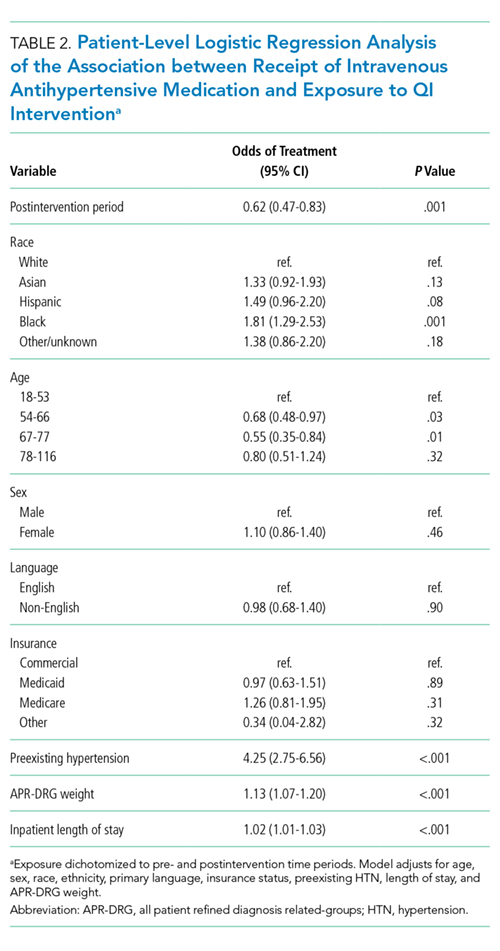
Description of Quality Improvement Results
Following the QI initiative, a total of 934 patients experienced 9,743 episodes of asymptomatic elevated blood pressure over a 4-month period (November 1, 2017 to February 28, 2018). As shown in Table 1, patients in the postintervention period had a slightly higher median age (67 [IQR 55-80] vs 69 [IQR 57-83]; P = .01), a higher median APR-DRG weight (1.34 [IQR 0.99-1.77] vs 1.48 [1.00-1.82]; P < .001), and a longer median length of stay (4.6 [2.8-8.0] days vs 5.1 [2.9-9.2] days; P = .004). There was also a higher proportion of nonEnglish speakers, fewer Black patients, and a lower proportion of preexisting HTN, in the postintervention period.
Of the 934 patients with ≥1 episode of asymptomatic elevated BP, 70 (7%) were treated with IV antihypertensive medications, with a total of 196 doses administered. The proportion of patients treated per month during the postintervention period ranged from 6% to 8%, which was the lowest of the entire study period and below the baseline average of 10% (Figure).
In a patient-level logistic regression pre-post analysis adjusting for age, sex, race, ethnicity, primary language, insurance status, preexisting HTN, length of stay, and APR-DRG weight, patients admitted to the general medicine service during the postintervention period had 38% lower odds of receiving IV antihypertensive medications than those admitted during the baseline period (OR = 0.62; 95% CI 0.47-0.83; P = .001). In this adjusted model, the following factors were independently associated with increased odds of receiving treatment: APR-DRG weight (OR 1.13; 95% CI 1.07-1.20; P < .001), Black race (OR 1.81; 95% CI 1.29-2.53; P = .001), length of stay (OR 1.02; 95% CI 1.01-1.03; P < .001), and preexisting HTN (OR 4.25; 95% CI 2.75-6.56; P < .001). Older age was associated with lower odds of treatment (Table 2).
Among patients who received treatment, there were no differences between pre- and postintervention periods in the proportion of pretreatment SBP <180 mm Hg (29% vs 32%; P = .40), 180-199 mm Hg (47% vs 40%; P = .10), or >200 mm Hg (25% vs 28%; P = .31; Table 3).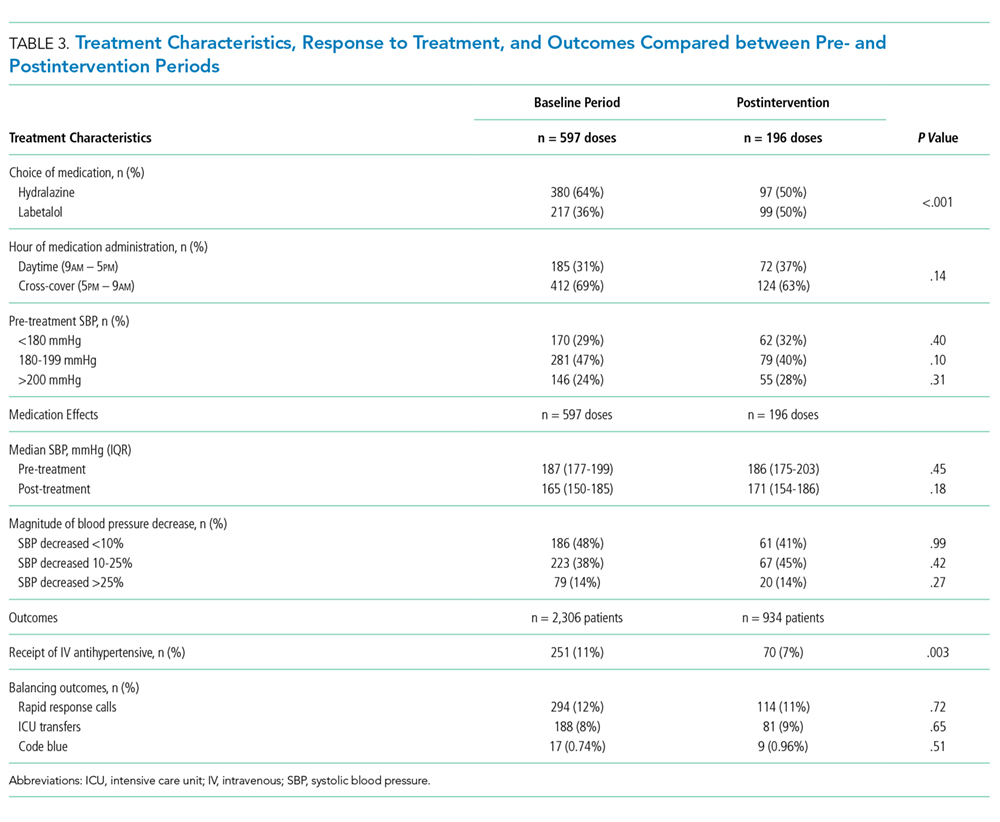
Population-level median SBP was similar between pre- and postintervention periods (167 mm Hg vs 168 mm Hg, P = .78), as were unadjusted rates of rapid response calls, ICU transfers, and code blues (Table 3). After adjustment for baseline characteristics and illness severity at the patient level, the odds of rapid response calls (OR 0.84; 95% CI 0.65-1.10; P = .21) and ICU transfers (OR 1.01; 95% CI 0.75-1.38; P = .93) did not differ between pre- and postintervention periods. A regression model was not fit for cardiopulmonary arrests due to the low absolute number of events.
CONCLUSIONS
Our results suggest that treatment of asymptomatic elevated BP using IV antihypertensive medications is common practice at our institution. We found that treatment is often initiated for only modestly elevated BPs and that the clinical response to these medications is highly variable. In the baseline period, one in seven patients experienced a decrement in BP >25% following treatment, which could potentially cause harm.11 There is no evidence, neither are there any consensus guidelines, to support the rapid reduction of BP among asymptomatic patients, making this a potential valuable opportunity for reducing unnecessary treatment, minimizing waste, and avoiding harm.
While there are a few previously published studies with similar results, we add to the existing literature by studying a larger population of more than 3,000 total patients, which was uniquely multiracial, including a high proportion of non-English speakers. Furthermore, our cohort included patients in the ICU, which is reflected in the higher-than-average APR-DRG weights. Despite being critically ill, these patients arguably still do not warrant aggressive treatment of elevated BP when asymptomatic. By excluding symptomatic BP elevations using surrogate markers for end-organ damage in addition to discharge diagnosis codes indicative of conditions in which tight BP control may be warranted, we were able to study a more critically ill patient population. We were also able to describe which baseline patient characteristics convey higher adjusted odds of receiving treatment, such as preexisting HTN, younger age, illness severity, and black race.
Perhaps most significantly, our study is the first to demonstrate an effective QI intervention aimed at reducing unnecessary utilization of IV antihypertensives. We found that this can feasibly be accomplished through a combination of educational efforts and systems changes, which could easily be replicated at other institutions. While the absolute reduction in the number of patients receiving treatment was modest, if these findings were to be widely accepted and resulted in a wide-spread change in culture, there would be a potential for greater impact.
Despite the reduction in the proportion of patients receiving IV antihypertensive medications, we found no change in the median SBP compared with the baseline period, which seems to support that the intervention was well tolerated. We also found no difference in the number of ICU transfers, rapid response calls, and cardiopulmonary arrests between groups. While these findings are both reassuring, it is impossible to draw definitive conclusions about safety given the small absolute number of patients having received treatment in each group. Fortunately, current guidelines and literature support the safety of such an intervention, as there is no existing evidence to suggest that failing to rapidly lower BP among asymptomatic patients is potentially harmful.11
There are several limitations to our study. First, by utilizing a large electronic dataset, the quality of our analyses was reliant on the accuracy of the recorded EHR data. Second, in the absence of a controlled trial or control group, we cannot say definitively that our QI initiative was the direct cause of the improved rates of IV antihypertensive utilization, though the effect did persist after adjusting for baseline characteristics in patient-level models. Third, our follow-up period was relatively short, with fewer than half as many patients as in the preintervention period. This is an important limitation, since the impact of QI interventions often diminishes over time. We plan to continually monitor IV antihypertensive use, feed those data back to our group, and revitalize educational efforts should rates begin to rise. Fourth, we were unable to directly measure which patients had true end-organ injury and instead used orders placed around the time of medication administration as a surrogate marker. While this is an imperfect measure, we feel that in cases where a provider was concerned enough to even test for end-organ injury, the use of IV antihypertensives was likely justified and was therefore appropriately excluded from the analysis. Lastly, we were limited in our ability to describe associations with true clinical outcomes, such as stroke or myocardial infarction, which could theoretically be propagated by either the use or the avoidance of IV antihypertensive medications. Fortunately, based on clinical guidelines and existing evidence, there is no reason to believe that reducing IV antihypertensive use would result in increased rates of these outcomes.
Our study reaffirms the fact that overutilization of IV antihypertensive medications among asymptomatic hospitalized patients is pervasive across hospital systems. This represents a potential target for a concerted change in culture, which we have demonstrated can be feasibly accomplished through education and systems changes.
Disclosures
Dr. Auerbach has current or pending grants from the CDC, PCORI, and FDA that are unrelated to this research manuscript. He also receives royalties from UpToDate, and received an honorarium for being editor of JHM. Dr. Jacobs received a $1,000 Resident/Fellow Travel Grant from the Society of Hospital Medicine to support the cost of travel to SHM, where he presented this research as a poster in 2018. Dr. Prasad receives money from EpiExcellence, LLC for consultation, which is unrelated to this research manuscript. All other authors have nothing to disclose.
1. Axon RN, Cousineau L, Egan BM. Prevalence and management of hypertension in the inpatient setting: A systematic review. J Hosp Med. 2011;6(7):417-422. doi: 10.1002/jhm.804. PubMed
2. Herzog E, Frankenberger O, Aziz E, et al. A novel pathway for the management of ypertension for hospitalized patients. Crit Pathw Cardiol. 2007;6(4):150-160. doi: 10.1097/HPC.0b013e318160c3a7. PubMed
3. James PA, Oparil S, Carter BL, et al. 2014 evidence-based guideline for the management of high blood pressure in adults: report from the panel members appointed to the eighth Joint National Committee (JNC 8). JAMA. 2014;311(5):507-520. doi: 10.1001/jama.2013.284427. PubMed
4. Weder AB. Treating acute hypertension in the hospital: A lacuna in the guidelines [editorial]. Hypertension. 2011;57(1):18-20. PubMed
5. Axon RN, Turner M, Buckley R. An update on inpatient hypertension management. Curr Cardiol Rep. 2015;17(11):94. doi: 10.1007/s11886-015-0648-y. PubMed
6. Marik PE, Rivera R. Hypertensive emergencies: an update. Curr Opin Crit Care. 2011;17(6):569-580. doi:10.1097/MCC.0b013e32834cd31d. PubMed
7. Cherney D, Straus S. Management of patients with hypertensive urgencies and emergencies: a systematic review of the literature. J Gen Intern Med. 2002;17(12):937-945. doi: 10.1046/j.1525-1497.2002.20389.x. PubMed
8. Padilla Ramos A, Varon J. Current and newer agents for hypertensive emergencies. Curr Hypertens Rep. 2014;16(7):450. doi: 10.1007/s11906-014-0450-z. PubMed
9. Whitworth JA, World Health Organization, International Society of Hypertension Writing Group. 2003 World Health Organization (WHO)/International Society of Hypertension (ISH) statement on management of hypertension. J Hypertens. 2003;21(11):1983-1992. doi: 10.1097/01.hjh.0000084751.37215.d2. PubMed
10. Campbell P, Baker WL, Bendel SD, White WB. Intravenous hydralazine for blood pressure management in the hospitalized patient: its use is often unjustified. J Am Soc Hypertens. 2011;5(6):473-477. doi: 10.1016/j.jash.2011.07.002. PubMed
11. Chobanian AV, Bakris GL, Black HR, et al. The Seventh Report of the Joint National Committee on Prevention, Detection, Evaluation, and Treatment of High Blood Pressure: the JNC 7 report. JAMA. 2003;289(19):2560-2572. doi: 10.1001/jama.289.19.2560. PubMed
12. Gauer R. Severe asymptomatic hypertension: Evaluation and treatment. Am Fam Physician. 2017;95(8):492-500. PubMed
13. Lipari M, Moser LR, Petrovitch EA, Farber M, Flack JM. As-needed intravenous antihypertensive therapy and blood pressure control: Antihypertensive Therapy and BP Control. J Hosp Med. 2016;11(3):193-198. doi: 10.1002/jhm.2510. PubMed
14. Gaynor MF, Wright GC, Vondracek S. Retrospective review of the use of as-needed hydralazine and labetalol for the treatment of acute hypertension in hospitalized medicine patients. Ther Adv Cardiovasc Dis. 2017;12(1):7-15. doi: 10.1177/1753944717746613. PubMed
15. Weder AB, Erickson S. Treatment of hypertension in the inpatient setting: Use of intravenous labetalol and hydralazine. J Clin Hypertens. 2010;12(1):29-33. doi: 10.1111/j.1751-7176.2009.00196.x. PubMed
16. Averill RF, Goldfield N, Hughes, JS, et al. All Patient Refined Diagnosis Related Groups (APR-DRGs) Version 20.0: Methodology Overview. Clinical Research and Documentation Departments of 3M Health Information Systems, Wallingford, Connecticut and Murray, Utah, 2003. https://www.hcup-us.ahrq.gov/. Accessed February 19, 2018.
17. Iezzoni LI, Ash AS, Shwartz M, Daley J, Hughes JS, Mackiernan YD. Predicting who dies depends on how severity is measured: Implications for evaluating patient outcomes. Ann Intern Med. 1995;123(10):763-770. PubMed
18. Romagnoli S, Ricci Z, Quattrone D, et al. Accuracy of invasive arterial pressure monitoring in cardiovascular patients: an observational study. Crit Care. 2014;18(6):644. doi: 10.1186/s13054-014-0644-4. PubMed
19. Shojania K, Grimshaw JM. Evidence-based quality improvement: The state of the science. Health Aff (Millwood). 2005;24(1):138-150. doi: 10.1377/hlthaff.24.1.138. PubMed
Elevated blood pressure (BP) is common among hospitalized adults, with prevalence estimates between 50% and 70%.1 Many factors can cause or exacerbate BP elevations in the setting of acute illness, such as pain, anxiety, medication withdrawal, and volume status, among others.2 While there are clear evidence-based recommendations for treating hypertension (HTN) in the ambulatory setting,3 guidelines for the management of elevated BP in the hospital are lacking.4,5
Hypertensive crises are generally recognized as warranting rapid reduction in BP;6-8 however, these represent the minority of cases.9,10 Far more common in the hospital are patients with asymptomatic elevated BP, a population for which there is no high-quality evidence and no guidelines supporting the use of intravenous (IV) antihypertensives.11,12 Treatment with such medications has been associated with highly variable clinical responses13-15 and may result in adverse events, such as hypotension.10
To date, only a small number of studies have investigated the treatment of asymptomatic elevated BP among hospitalized adults.10,13-15 These have suggested that IV antihypertensives are utilized frequently in this setting, often for only modestly elevated BPs; however, the studies have tended to be small, not racially diverse, and limited to noncritically ill patients. Furthermore, while it is generally accepted that reducing the use of IV antihypertensives among asymptomatic patients would have no adverse impact, to our knowledge there have been no published studies which have instituted such an initiative while measuring balancing outcomes.
The purpose of this study was to further the existing literature by defining the prevalence and effects of IV antihypertensive medication utilization among a medically complex, multiracial population of asymptomatic medical inpatients using a large electronic dataset and to evaluate the impact of a division-wide, two-tiered quality improvement (QI) initiative on the rates of IV antihypertensive utilization and patient outcomes.
METHODS
Setting
The study was conducted at the University of California, San Francisco (UCSF), an 800-bed tertiary care, academic medical center. It was approved by the UCSF Institutional Review Board. General medicine patients at UCSF are distributed between teaching and direct-care (hospitalist) services. The intensive care unit (ICU) is “open,” meaning the medicine service acts as the primary team for all nonsurgical ICU patients. This study included all adult general medicine patients admitted to UCSF Medical Center between January 1, 2017 and March 1, 2018, including those in the ICU.
Study Population and Data Collection
The UCSF Medical Center uses the electronic health record (EHR) Epic (Epic 2017, Epic Systems Corporation, Verona, Wisconsin) for all clinical care. We obtained computerized EHR data from Clarity, the relational database that stores Epic’s inpatient data in thousands of tables, including orders, medications, laboratory and radiology results, vital signs, patient demographics, and notes. We identified all adult patients hospitalized on the general medicine service with ≥1 episode of elevated BP (>160/90 mm Hg) at any point during their hospitalization who were not on a vasopressor medication at the time of the vital sign recording.
We further identified all instances in which either IV labetalol or hydralazine were administered to these patients. These two agents were chosen because they are the only IV antihypertensives used commonly at our institution for the treatment of asymptomatic elevated BP among internal medicine patients. Only those orders placed by a general medicine provider or reconciled by a general medicine provider upon transfer from another service were included. For each medication administration timestamp, we collected vital signs before and after the administration, along with the ordering provider and the clinical indication that was documented in the electronic order. To determine if a medication was administered with concern for end-organ injury, we also extracted orders that could serve as a proxy for the provider’s clinical assessment—namely electrocardiograms, serum troponins, chest x-rays, and computerized tomography scans of the head—which were placed in the one hour preceding or 15 minutes following administration of an IV antihypertensive medication.
To assess for comorbid conditions, including a preexisting diagnosis of HTN, we collected International Classification of Diseases (ICD)-9/10 diagnosis codes. Further, we also extracted All Patient Refined Diagnosis-Related Group (APR-DRG) weights, which are a standardized measure of illness severity based on relative resource consumption during hospitalization.16,17
Patients were categorized as having either “symptomatic” or “asymptomatic” elevated BP. We defined symptomatic elevated BP as having received treatment with an IV medication with provider concern for end-organ injury, as defined above. We further identified all patients in which tight BP control may be clinically indicated on the basis of the presence of any of the following ICD-9/10 diagnosis codes at the time of hospital discharge: myocardial infarction, ischemic stroke, intracranial hemorrhage, subarachnoid hemorrhage, subdural hematoma, aortic dissection, hypertensive emergency, or hypertensive encephalopathy. All patients with symptomatic elevated BP or any of the above ICD-9/10 diagnoses were excluded from the analysis, since administration of IV antihypertensive medications would plausibly be warranted in these clinical scenarios.
The encounter numbers from the dataset were used to link to patient demographic data, which included age, sex, race, ethnicity, primary language, and insurance status. Finally, we identified all instances of rapid response calls, ICU transfers, and code blues (cardiopulmonary arrests) for each patient in the dataset.
Blood Pressure Measurements
BP data were collected from invasive BP (IBP) monitoring devices and noninvasive BP cuffs. For patients with BP measurements recorded concomitantly from both IBP (ie, arterial lines) in addition to noninvasive BP cuffs, the arterial line reading was favored. All systolic BP (SBP) readings >240 mm Hg from arterial lines were excluded, as this has previously been described as the upper physiologic limit for IBP readings.18
Primary Outcome
The primary outcome for the study was the proportion of patients treated with IV antihypertensive medications (labetalol or hydralazine). Using aggregate data, we calculated the number of patients who were treated at least once with an IV antihypertensive in a given month (numerator), divided by the number of patients with ≥1 episode of asymptomatic elevated BP that month (denominator). The denominator was considered to be the population of patients “at risk” of being treated with IV antihypertensive medications. For patients with multiple admissions during the study period, each admission was considered separately. These results are displayed in the upper portion of the run chart (Figure).
Secondary Outcomes
To investigate blood pressure trends over time, we analyzed BP in three ways. First, we analyzed the median SBP for the entire population. Second, to determine clinical responses to IV antihypertensive medications among patients receiving treatment, we calculated the population medians for the pretreatment SBP, the change in SBP from pretreatment baseline, and the posttreatment SBP. Third, we calculated the average median SBP on a monthly basis for the duration of the study. This was achieved by calculating the median value of all SBPs for an individual patient, then averaging across all patients in a given month. The average monthly median SBPs are displayed in the lower portion of the Figure.
To investigate whether the intervention was associated with negative patient outcomes, the proportions of several balancing outcomes were compared between pre- and postintervention periods, including ICU transfers, rapid response calls, and code blues (cardiopulmonary arrests).
Development and Implementation of an Intervention to Reduce Excessive IV Antihypertensive Use
After establishing the baseline prevalence of IV antihypertensive medication use at our institution, we developed a QI initiative with the goal of reducing IV antihypertensive medication utilization by the general medicine service for the treatment of asymptomatic patients. We hypothesized that potential contributors to overutilization might include lack of education, provider/nursing discomfort, and a system designed to mandate provider notification for even modestly elevated BPs. The QI initiative, which took place between October 2017 and December 2017, was designed to address these potential contributors and was comprised of a division-wide, two-tiered, bundled intervention. Our choice of a two-tiered approach was based on the fact that successful culture change is challenging, along with the existing evidence that multifaceted QI interventions are more often successful than single-tiered approaches.19
The first tier of the initiative included an educational campaign referred to colloquially as “NoIVForHighBP,” which targeted residents, hospitalists, and nursing staff. The campaign consisted of a series of presentations, best practice updates, handouts, and posters displayed prominently in shared workspaces. The educational content focused on alternative approaches to the management of asymptomatic elevated BP in the hospital, such as identification and treatment of pain, anxiety, volume overload, or other contributing factors (see supplemental materials). These educational outreaches occurred periodically between October 4, 2017 and November 20, 2017, with the bulk of the educational efforts taking place during November. Therefore, November 1, 2017 was designated the start date for the intervention period.
The second tier of the intervention included the liberalization of the EHR BP notification parameters on the standard inpatient admission order set from >160/90 mm Hg to >180/90 mm Hg. This change took effect on 12/6/2017. The decision to modify the BP notification parameters was based on the hypothesis that mandatory notifications for modestly elevated BPs may prompt providers to reflexively order IV antihypertensive medications, especially during times of cross-coverage or high clinical workload.
Statistical Analysis
All statistical analyses were performed using Stata software version 15 (StataCorp. 2017. Stata Statistical Software: Release 15. College Station, Texas: StataCorp LLC). Baseline patient characteristics were compared using nonparametric tests of significance. Population median SBPs were compared between pre- and postintervention periods using Mood’s Median Test, which was selected because the data were distributed nonnormally, and variances between samples were unequal.
Among patients treated with IV antihypertensive medications, we compared the proportion of pretreatment SBPs falling into each of three specified ranges (SBP <180 mm Hg, SBP 180-199 mm Hg, and SBP >200 mm Hg) between baseline and intervention periods using chi-squared tests.
Using aggregate data, we compared the unadjusted proportion of patients treated with IV antihypertensive medications between pre- and postintervention periods using a chi-squared test. Next, using patient-level data, a logistic regression analysis was performed to examine the association between receipt of IV antihypertensive medications and time (dichotomized between pre- and postintervention periods) while adjusting for age, sex, race, ethnicity, primary language, insurance status, preexisting HTN, length of stay, and APR-DRG weight.
Rates of balancing outcomes were compared using chi-squared tests. A logistic regression analysis using patient-level data was also performed to investigate the association between each of these outcomes and the intervention period (pre vs post) while adjusting for age, sex, race, ethnicity, primary language, insurance status, preexisting HTN, length of stay, and APR-DRG weight.
RESULTS
Baseline Period
We identified 2,306 patients with ≥1 episode of asymptomatic elevated BP during the 10-month preintervention period. Patients on average experienced 9 episodes of elevated BP per hospitalization, representing 21,207 potential opportunities for treatment. Baseline characteristics are summarized in Table 1. In general, this represents an older population that was medically complex and multiracial.
Of these patients, 251 (11%) received IV hydralazine and/or labetalol at least once during their hospitalization, with a total of 597 doses administered. Among those treated, a median of 2 doses were given per patient (IQR: 1-4), 64% of which were hydralazine. The majority (380 [64%]) were ordered on an “as needed” basis, while 217 (36%) were administered as a one-time dose. Three-quarters of all doses were ordered by the teaching service (456 [76%]), with the remaining 24% ordered by the direct-care (hospitalist) service.
During the baseline period among patients receiving IV antihypertensive medications, the median SBP of the population prior to treatment was 187 mm Hg (IQR 177-199; Table 2). Treatment was initiated in 30% of patients for an SBP <180 mm Hg and in 75% for an SBP <200 mm Hg. The median time to follow-up BP check was 34 minutes (IQR 15-58). The median decrement in SBP was 20 mm Hg (IQR 5-37); however, the response to treatment was highly variable, with 2% of patients experiencing no change and 14% experiencing an increase in SBP. Seventy-nine patients (14%) had a decrement in SBP >25% following treatment.
Description of Quality Improvement Results
Following the QI initiative, a total of 934 patients experienced 9,743 episodes of asymptomatic elevated blood pressure over a 4-month period (November 1, 2017 to February 28, 2018). As shown in Table 1, patients in the postintervention period had a slightly higher median age (67 [IQR 55-80] vs 69 [IQR 57-83]; P = .01), a higher median APR-DRG weight (1.34 [IQR 0.99-1.77] vs 1.48 [1.00-1.82]; P < .001), and a longer median length of stay (4.6 [2.8-8.0] days vs 5.1 [2.9-9.2] days; P = .004). There was also a higher proportion of nonEnglish speakers, fewer Black patients, and a lower proportion of preexisting HTN, in the postintervention period.
Of the 934 patients with ≥1 episode of asymptomatic elevated BP, 70 (7%) were treated with IV antihypertensive medications, with a total of 196 doses administered. The proportion of patients treated per month during the postintervention period ranged from 6% to 8%, which was the lowest of the entire study period and below the baseline average of 10% (Figure).
In a patient-level logistic regression pre-post analysis adjusting for age, sex, race, ethnicity, primary language, insurance status, preexisting HTN, length of stay, and APR-DRG weight, patients admitted to the general medicine service during the postintervention period had 38% lower odds of receiving IV antihypertensive medications than those admitted during the baseline period (OR = 0.62; 95% CI 0.47-0.83; P = .001). In this adjusted model, the following factors were independently associated with increased odds of receiving treatment: APR-DRG weight (OR 1.13; 95% CI 1.07-1.20; P < .001), Black race (OR 1.81; 95% CI 1.29-2.53; P = .001), length of stay (OR 1.02; 95% CI 1.01-1.03; P < .001), and preexisting HTN (OR 4.25; 95% CI 2.75-6.56; P < .001). Older age was associated with lower odds of treatment (Table 2).
Among patients who received treatment, there were no differences between pre- and postintervention periods in the proportion of pretreatment SBP <180 mm Hg (29% vs 32%; P = .40), 180-199 mm Hg (47% vs 40%; P = .10), or >200 mm Hg (25% vs 28%; P = .31; Table 3).
Population-level median SBP was similar between pre- and postintervention periods (167 mm Hg vs 168 mm Hg, P = .78), as were unadjusted rates of rapid response calls, ICU transfers, and code blues (Table 3). After adjustment for baseline characteristics and illness severity at the patient level, the odds of rapid response calls (OR 0.84; 95% CI 0.65-1.10; P = .21) and ICU transfers (OR 1.01; 95% CI 0.75-1.38; P = .93) did not differ between pre- and postintervention periods. A regression model was not fit for cardiopulmonary arrests due to the low absolute number of events.
CONCLUSIONS
Our results suggest that treatment of asymptomatic elevated BP using IV antihypertensive medications is common practice at our institution. We found that treatment is often initiated for only modestly elevated BPs and that the clinical response to these medications is highly variable. In the baseline period, one in seven patients experienced a decrement in BP >25% following treatment, which could potentially cause harm.11 There is no evidence, neither are there any consensus guidelines, to support the rapid reduction of BP among asymptomatic patients, making this a potential valuable opportunity for reducing unnecessary treatment, minimizing waste, and avoiding harm.
While there are a few previously published studies with similar results, we add to the existing literature by studying a larger population of more than 3,000 total patients, which was uniquely multiracial, including a high proportion of non-English speakers. Furthermore, our cohort included patients in the ICU, which is reflected in the higher-than-average APR-DRG weights. Despite being critically ill, these patients arguably still do not warrant aggressive treatment of elevated BP when asymptomatic. By excluding symptomatic BP elevations using surrogate markers for end-organ damage in addition to discharge diagnosis codes indicative of conditions in which tight BP control may be warranted, we were able to study a more critically ill patient population. We were also able to describe which baseline patient characteristics convey higher adjusted odds of receiving treatment, such as preexisting HTN, younger age, illness severity, and black race.
Perhaps most significantly, our study is the first to demonstrate an effective QI intervention aimed at reducing unnecessary utilization of IV antihypertensives. We found that this can feasibly be accomplished through a combination of educational efforts and systems changes, which could easily be replicated at other institutions. While the absolute reduction in the number of patients receiving treatment was modest, if these findings were to be widely accepted and resulted in a wide-spread change in culture, there would be a potential for greater impact.
Despite the reduction in the proportion of patients receiving IV antihypertensive medications, we found no change in the median SBP compared with the baseline period, which seems to support that the intervention was well tolerated. We also found no difference in the number of ICU transfers, rapid response calls, and cardiopulmonary arrests between groups. While these findings are both reassuring, it is impossible to draw definitive conclusions about safety given the small absolute number of patients having received treatment in each group. Fortunately, current guidelines and literature support the safety of such an intervention, as there is no existing evidence to suggest that failing to rapidly lower BP among asymptomatic patients is potentially harmful.11
There are several limitations to our study. First, by utilizing a large electronic dataset, the quality of our analyses was reliant on the accuracy of the recorded EHR data. Second, in the absence of a controlled trial or control group, we cannot say definitively that our QI initiative was the direct cause of the improved rates of IV antihypertensive utilization, though the effect did persist after adjusting for baseline characteristics in patient-level models. Third, our follow-up period was relatively short, with fewer than half as many patients as in the preintervention period. This is an important limitation, since the impact of QI interventions often diminishes over time. We plan to continually monitor IV antihypertensive use, feed those data back to our group, and revitalize educational efforts should rates begin to rise. Fourth, we were unable to directly measure which patients had true end-organ injury and instead used orders placed around the time of medication administration as a surrogate marker. While this is an imperfect measure, we feel that in cases where a provider was concerned enough to even test for end-organ injury, the use of IV antihypertensives was likely justified and was therefore appropriately excluded from the analysis. Lastly, we were limited in our ability to describe associations with true clinical outcomes, such as stroke or myocardial infarction, which could theoretically be propagated by either the use or the avoidance of IV antihypertensive medications. Fortunately, based on clinical guidelines and existing evidence, there is no reason to believe that reducing IV antihypertensive use would result in increased rates of these outcomes.
Our study reaffirms the fact that overutilization of IV antihypertensive medications among asymptomatic hospitalized patients is pervasive across hospital systems. This represents a potential target for a concerted change in culture, which we have demonstrated can be feasibly accomplished through education and systems changes.
Disclosures
Dr. Auerbach has current or pending grants from the CDC, PCORI, and FDA that are unrelated to this research manuscript. He also receives royalties from UpToDate, and received an honorarium for being editor of JHM. Dr. Jacobs received a $1,000 Resident/Fellow Travel Grant from the Society of Hospital Medicine to support the cost of travel to SHM, where he presented this research as a poster in 2018. Dr. Prasad receives money from EpiExcellence, LLC for consultation, which is unrelated to this research manuscript. All other authors have nothing to disclose.
1. Axon RN, Cousineau L, Egan BM. Prevalence and management of hypertension in the inpatient setting: A systematic review. J Hosp Med. 2011;6(7):417-422. doi: 10.1002/jhm.804. PubMed
2. Herzog E, Frankenberger O, Aziz E, et al. A novel pathway for the management of ypertension for hospitalized patients. Crit Pathw Cardiol. 2007;6(4):150-160. doi: 10.1097/HPC.0b013e318160c3a7. PubMed
3. James PA, Oparil S, Carter BL, et al. 2014 evidence-based guideline for the management of high blood pressure in adults: report from the panel members appointed to the eighth Joint National Committee (JNC 8). JAMA. 2014;311(5):507-520. doi: 10.1001/jama.2013.284427. PubMed
4. Weder AB. Treating acute hypertension in the hospital: A lacuna in the guidelines [editorial]. Hypertension. 2011;57(1):18-20. PubMed
5. Axon RN, Turner M, Buckley R. An update on inpatient hypertension management. Curr Cardiol Rep. 2015;17(11):94. doi: 10.1007/s11886-015-0648-y. PubMed
6. Marik PE, Rivera R. Hypertensive emergencies: an update. Curr Opin Crit Care. 2011;17(6):569-580. doi:10.1097/MCC.0b013e32834cd31d. PubMed
7. Cherney D, Straus S. Management of patients with hypertensive urgencies and emergencies: a systematic review of the literature. J Gen Intern Med. 2002;17(12):937-945. doi: 10.1046/j.1525-1497.2002.20389.x. PubMed
8. Padilla Ramos A, Varon J. Current and newer agents for hypertensive emergencies. Curr Hypertens Rep. 2014;16(7):450. doi: 10.1007/s11906-014-0450-z. PubMed
9. Whitworth JA, World Health Organization, International Society of Hypertension Writing Group. 2003 World Health Organization (WHO)/International Society of Hypertension (ISH) statement on management of hypertension. J Hypertens. 2003;21(11):1983-1992. doi: 10.1097/01.hjh.0000084751.37215.d2. PubMed
10. Campbell P, Baker WL, Bendel SD, White WB. Intravenous hydralazine for blood pressure management in the hospitalized patient: its use is often unjustified. J Am Soc Hypertens. 2011;5(6):473-477. doi: 10.1016/j.jash.2011.07.002. PubMed
11. Chobanian AV, Bakris GL, Black HR, et al. The Seventh Report of the Joint National Committee on Prevention, Detection, Evaluation, and Treatment of High Blood Pressure: the JNC 7 report. JAMA. 2003;289(19):2560-2572. doi: 10.1001/jama.289.19.2560. PubMed
12. Gauer R. Severe asymptomatic hypertension: Evaluation and treatment. Am Fam Physician. 2017;95(8):492-500. PubMed
13. Lipari M, Moser LR, Petrovitch EA, Farber M, Flack JM. As-needed intravenous antihypertensive therapy and blood pressure control: Antihypertensive Therapy and BP Control. J Hosp Med. 2016;11(3):193-198. doi: 10.1002/jhm.2510. PubMed
14. Gaynor MF, Wright GC, Vondracek S. Retrospective review of the use of as-needed hydralazine and labetalol for the treatment of acute hypertension in hospitalized medicine patients. Ther Adv Cardiovasc Dis. 2017;12(1):7-15. doi: 10.1177/1753944717746613. PubMed
15. Weder AB, Erickson S. Treatment of hypertension in the inpatient setting: Use of intravenous labetalol and hydralazine. J Clin Hypertens. 2010;12(1):29-33. doi: 10.1111/j.1751-7176.2009.00196.x. PubMed
16. Averill RF, Goldfield N, Hughes, JS, et al. All Patient Refined Diagnosis Related Groups (APR-DRGs) Version 20.0: Methodology Overview. Clinical Research and Documentation Departments of 3M Health Information Systems, Wallingford, Connecticut and Murray, Utah, 2003. https://www.hcup-us.ahrq.gov/. Accessed February 19, 2018.
17. Iezzoni LI, Ash AS, Shwartz M, Daley J, Hughes JS, Mackiernan YD. Predicting who dies depends on how severity is measured: Implications for evaluating patient outcomes. Ann Intern Med. 1995;123(10):763-770. PubMed
18. Romagnoli S, Ricci Z, Quattrone D, et al. Accuracy of invasive arterial pressure monitoring in cardiovascular patients: an observational study. Crit Care. 2014;18(6):644. doi: 10.1186/s13054-014-0644-4. PubMed
19. Shojania K, Grimshaw JM. Evidence-based quality improvement: The state of the science. Health Aff (Millwood). 2005;24(1):138-150. doi: 10.1377/hlthaff.24.1.138. PubMed
© 2019 Society of Hospital Medicine
Frontal Fibrosing Alopecia Demographics: A Survey of 29 Patients
Frontal fibrosing alopecia (FFA) is a form of lymphocytic cicatricial alopecia that presents as frontotemporal hairline recession, typically in postmenopausal women.1 The condition is considered to be a variant of lichen planopilaris (LPP) due to its similar histologic appearance.2 Loss of eyebrow1-11 and body5-11 hair also is commonly present in FFA, and histologic findings are identical to those for hair loss on the scalp,8,9 suggesting that FFA may be a form of generalized alopecia.
The pathogenesis of FFA is unknown, but several etiologies have been postulated. Some suggest that as a variant of LPP, FFA is a hair-specific autoimmune disorder characterized by a T cell–mediated immune reaction against epithelial hair follicle stem cells, leading to fibrosis and depletion of hair regeneration potential.12 In support of this theory, FFA has been associated with other autoimmune diseases including hypothyroidism,6,8,13-16 mucocutaneous lichen planus,8,15,17 vitiligo,15,18 Sjögren syndrome,19 and lichen sclerosus et atrophicus.15,20 Another hypothesis suggests that the proandrogenic state in postmenopausal women may be related to the disease process.1 This hypothesis is supported by the reported success of antiandrogen therapy with 5α-reductase inhibitors (5α-RIs) in stabilizing FFA.3-5,7 Finally, genetic16,21 and environmental factors related to smoking and socioeconomic status5 also have been postulated to be risk factors for FFA. A variety of treatments have shown varying success, including topical and intralesional corticosteroids, hydroxychloroquine, immunomodulators, antibiotics, and 5α-RIs.1,3-6,8,15,17,22 However, FFA is considered to be relatively difficult to treat and commonly progresses regardless of treatment before spontaneously stabilizing.2-4,6,8,10
Since its discovery in 1994,1 FFA has become increasingly prevalent, comprising 17% of new referrals for hair loss in one study (N=57).6 Although growing recognition of the condition likely plays a role in its increasing presentation, other unidentified factors may contribute to its expanding incidence. In this report, we describe the demographics, clinical features, and disease progression of 29 cases of FFA treated within our division using a series of surveys and chart reviews.
Methods
Upon receiving approval for the project from the institutional review board, we identified 29 patients who met the criteria for diagnosis of FFA through a chart review of all patients being treated for hair loss by clinics within the Washington University Division of Dermatology (St. Louis, Missouri). Diagnostic criteria for FFA included scarring alopecia in the frontotemporal distribution with associated perifollicular erythema or papules and, if performed, a scalp biopsy of the involved area of alopecia showing lymphocytic cicatricial alopecia, compatible with LPP. The diagnosis was confirmed by biopsy in 18 patients (62%), while the remainder of the diagnoses were made clinically. Most biopsy specimens were diagnosed by board-certified dermatopathologists at Washington University, with the remainder diagnosed by outside pathologists if the patient was initially diagnosed at another institution.
Patients meeting criteria for FFA were mailed a study consent form, as well as a 2-page survey to assess demographics, clinical features of hair loss, medical histories, social and family histories, and treatments utilized. After receiving consent from patients, survey results were collected and summarized. If there was any need for clarification of answers, follow-up questions were conducted via email prior to any data analysis that was performed.
For analysis of treatment response, patients were asked what treatments they had utilized and about the progression of their hair loss. Patients reporting stabilization of hair loss or hair regrowth were classified as treatment responsive. Patients who underwent multiple treatments were included in the analyses for each of those treatments. Physician records for treatment response were not correlated with patient responses due to inconsistent documentation, care received outside of our medical system, and prolonged or loss to follow-up. Physician-reported data were only used to identify qualifying patients and their biopsy results, as described above.
Results
Patient Demographic
Between October 2013 and May 2014, 29 patients with FFA were recruited into the study. Patients were diagnosed between January 2006 and December 2013. There were 28 female patients (97%) and 1 male patient (3%). The average age of disease onset was 55.4 years (range, 29–75 years). Twenty-five patients (86%) self-identified as non-Hispanic white, 3 patients (10%) as Asian, and 1 patient (3%) as black. Patients also appeared to be a more affluent group than the general St. Louis County population, with a median household income between $75,000 and $100,000. In comparison, the median household income reported in St. Louis County from 2008 to 2012 was $58,485.23 The patient population was primarily composed of nonsmokers, with 22 (76%) patients who had never smoked, 6 (21%) who were present smokers, and 1 (3%) smoked in the past. These results were comparable to the reported number of female smokers in Missouri.24
Clinicopathologic Features
The clinical features of FFA are described in Table 1. All patients had frontotemporal recession of the hairline with some degree of scarring and perifollicular erythema (Figure 1). Most patients also reported hair loss at other sites, including 25 patients (86%) with eyebrow hair loss, 18 (62%) with limb hair loss, 11 (38%) with axillary hair loss, 11 (38%) with pubic hair loss, and 1 (3%) with eyelash hair loss. Patients also frequently reported inflammatory symptoms, including 19 patients (66%) with itching, 18 (62%) with redness, 3 (10%) with pain, 2 (7%) with papular lesions, and 1 (3%) with sores and erosions on the skin. Regarding progression of hair loss over time, 16 patients (55%) reported stabilization of hair loss, 11 (38%) reported progressive hair loss, and 2 (7%) reported some hair regrowth. Thirteen patients (45%) identified some inciting event that they believed to have triggered the disease. Ten patients (35%) identified stress as the inciting event, and 5 patients (17%) specifically referred to health-related stressors, including hip-replacement surgery, new diagnoses of systemic diseases, starting new medications, and stopping hormone replacement therapy. Furthermore, 2 (7%) patients reported exposure to chemicals and pesticides as suspected triggers.

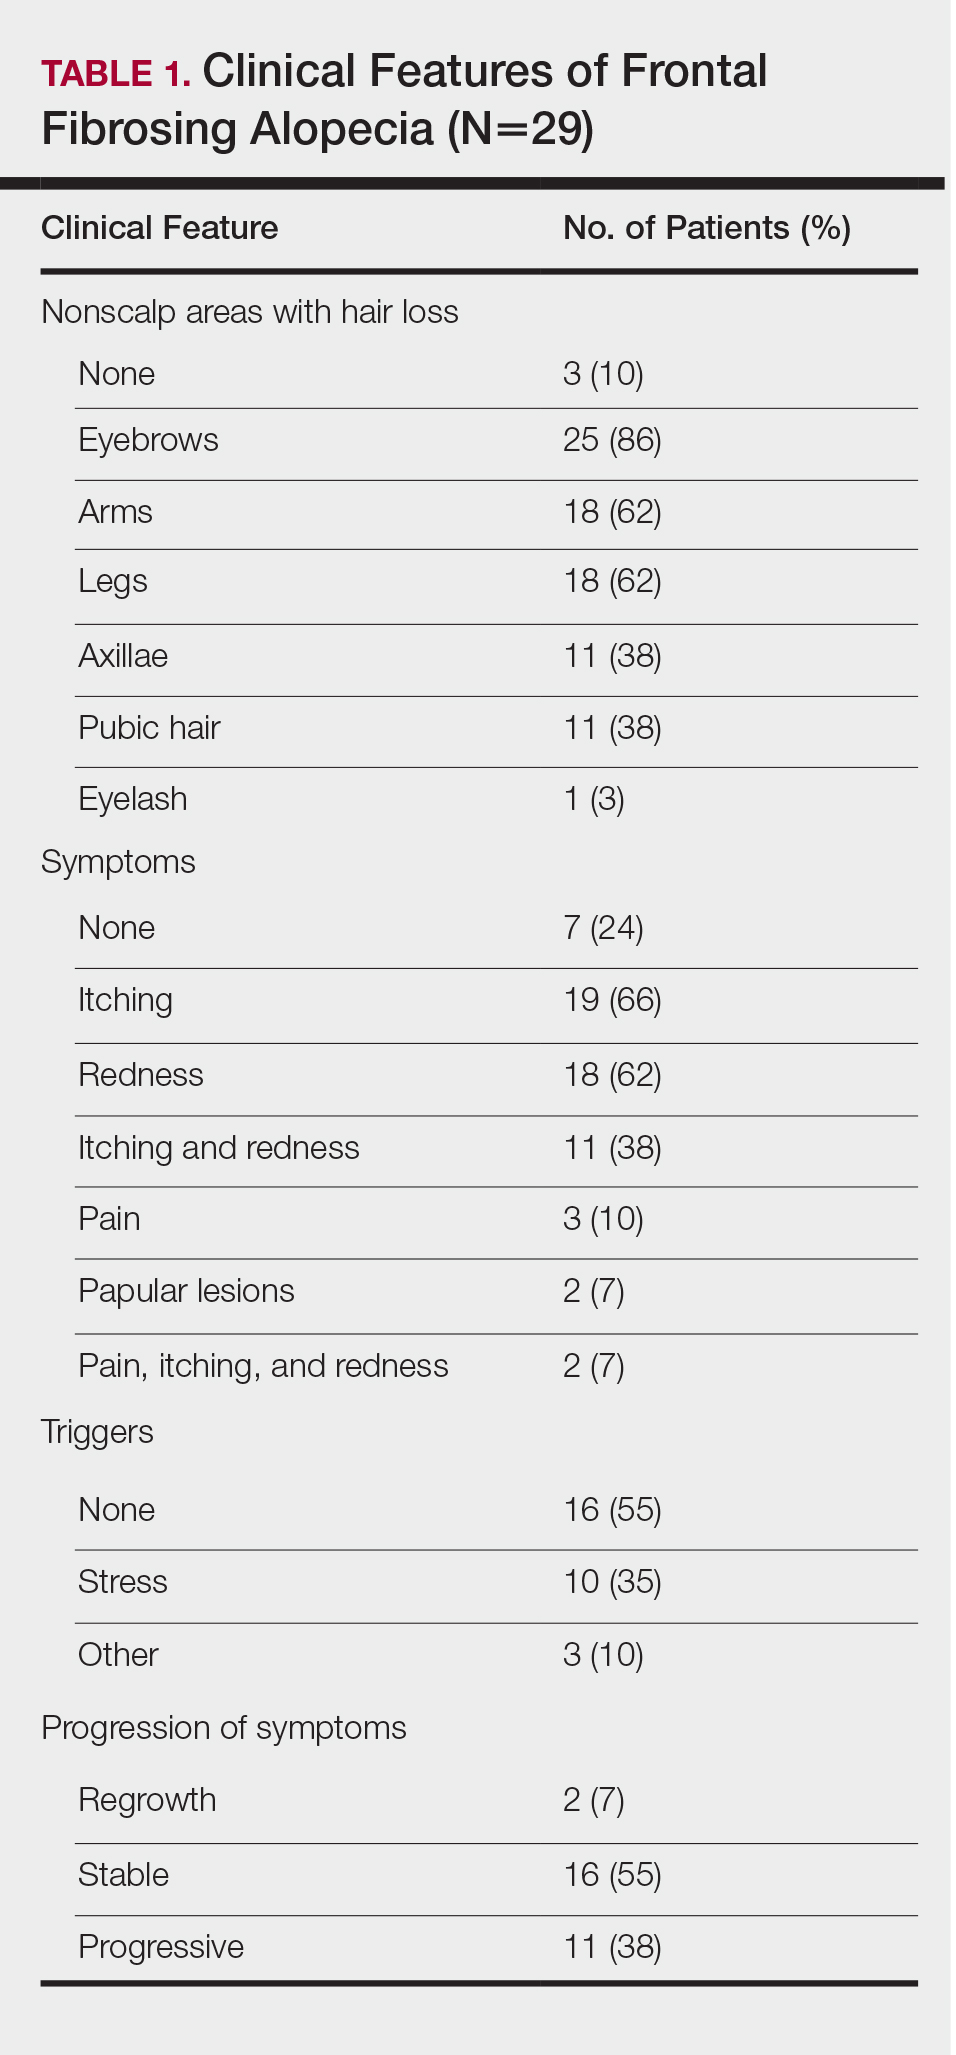
Typical biopsy results showed a perifollicular lymphocytic infiltrate and fibrosis surrounding the infundibulum and isthmus of hair follicles (Figure 2). There were associated vacuolar changes in the basal layer and scattered dyskeratosis throughout the follicular epithelium. As the disease progressed to end-stage scarring, there was marked reduction in the number of hair follicles, which were replaced by fibrous tracts, and a disappearance of the previous inflammatory infiltrate.

Medical History
Of the 26 female patients who provided data about menopause status at time of disease onset, 16 (62%) were postmenopausal, 5 (19%) were menopausal, and 5 (19%) were premenopausal. Of the 28 female patients in the study, 8 (29%) had a history of hysterectomy and 2 (7%) also had surgically induced menopause through bilateral surgical oophorectomy. Twenty-four patients (86%) had a childbearing history, with an average of 2.3 children. Twelve patients (43%) reported use of hormone replacement therapy after menopause. Twelve patients (43%) also reported a history of oral contraceptive use.
Table 2 describes the comorbidities of all 29 patients. A history of autoimmune disease was prominent, found in 16 patients (55%). Thirteen patients (45%) reported thyroid disease, including 10 patients (35%) with hypothyroidism. Additionally, 8 patients (28%) had a history of mucocutaneous lichen planus, 2 (7%) of psoriasis/psoriatic arthritis, 1 (3%) of vitiligo, 1 (3%) of systemic lupus erythematosus, 1 (3%) of iritis, 1 (3%) of Sjögren syndrome, and 1 (3%) of ulcerative colitis. Six patients (21%) also reported a history of breast cancer.
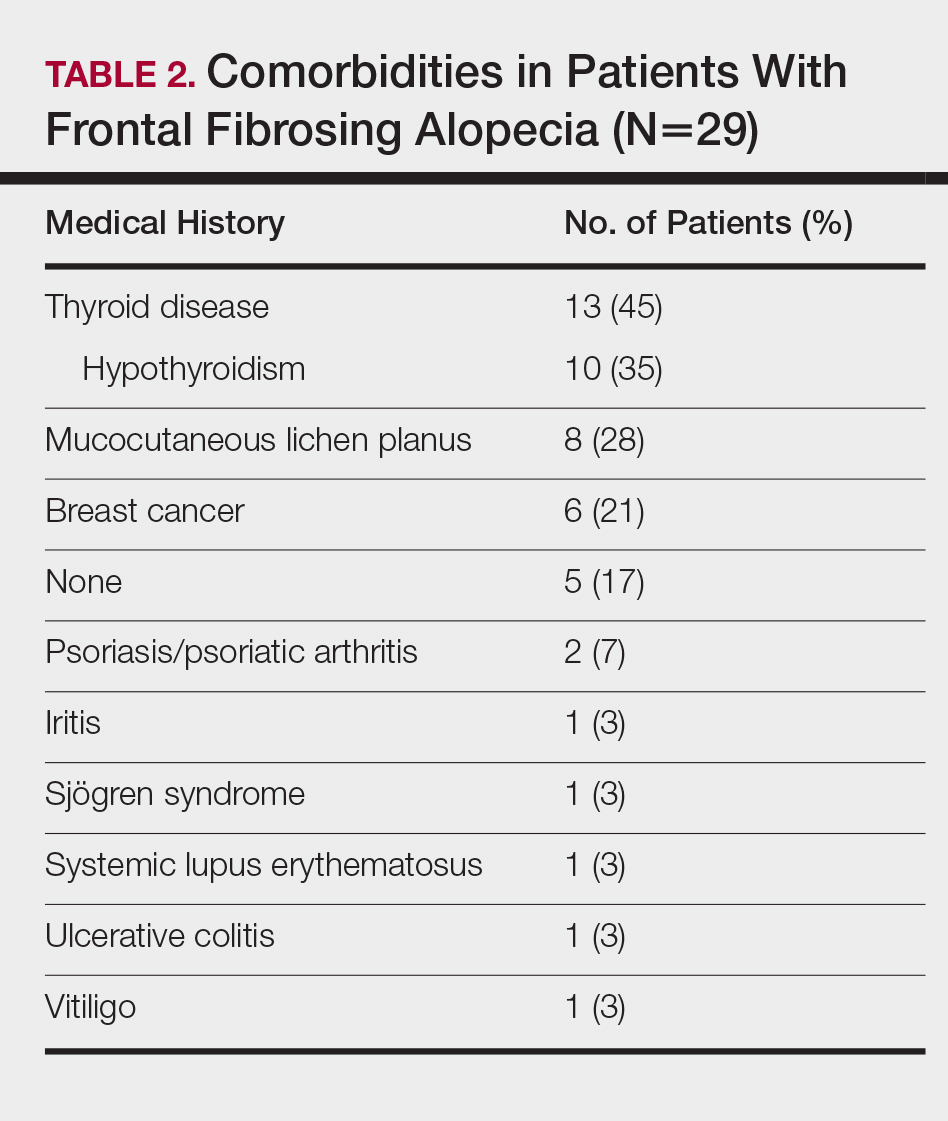
A dental history was obtained in 24 patients. All 24 patients reported having some dental implant or filling placed. Twenty-four patients (100%) had a history of metal amalgam implants, 8 (33%) had gold alloy implants, 4 (17%) had composite resin implants, and 3 (13%) had porcelain implants. Two patients had metal amalgam implants that had since been replaced by nonmetal implants. Both patients reported no change in their clinical conditions with removal of the metal implants. Six of 8 patients (75%) with mucocutaneous lichen planus reported having dental implants. Of them, all 6 patients (100%) reported having metal amalgam implants, and 3 patients (50%) additionally reported having gold alloy implants.
Treatments
On average, patients were treated with 3 different therapies for FFA (range, 0–14). The treatments utilized are listed in Table 3, and responses to treatments are summarized in Table 4. Topical steroids were the most popular treatment modality and were used by 21 patients (72%). Approximately half of those patients reported treatment response with stabilization of hair loss or regrowth (n=11; 52%). Hydroxychloroquine was the second most commonly used modality (16 patients [55%]), with 10 of those patients (63%) reporting treatment response. Intralesional steroids were used in 11 patients (38%), with a treatment response in 36% (4/11) of those patients. Topical pimecrolimus and tacrolimus were used by 6 patients (21%), with 5 of those patients (83%) reporting treatment response. UVB excimer laser therapy was used on 3 patients (10%) with 100% treatment response.
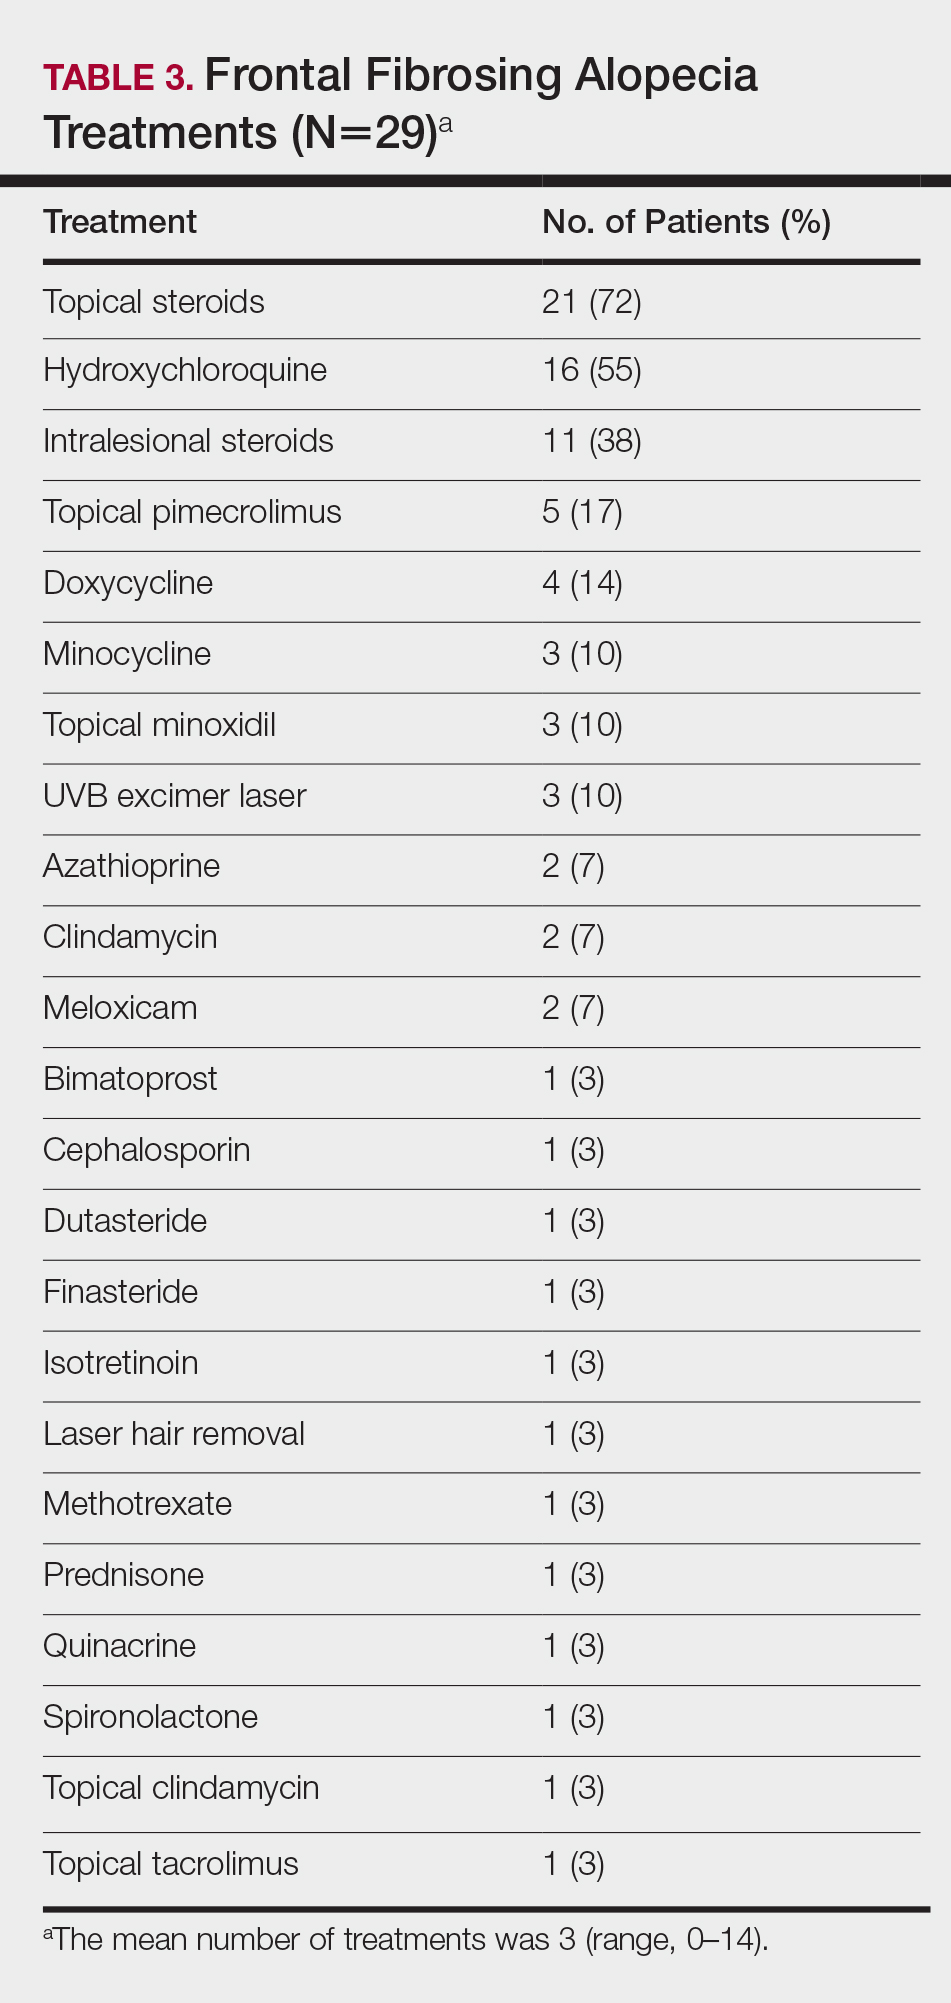
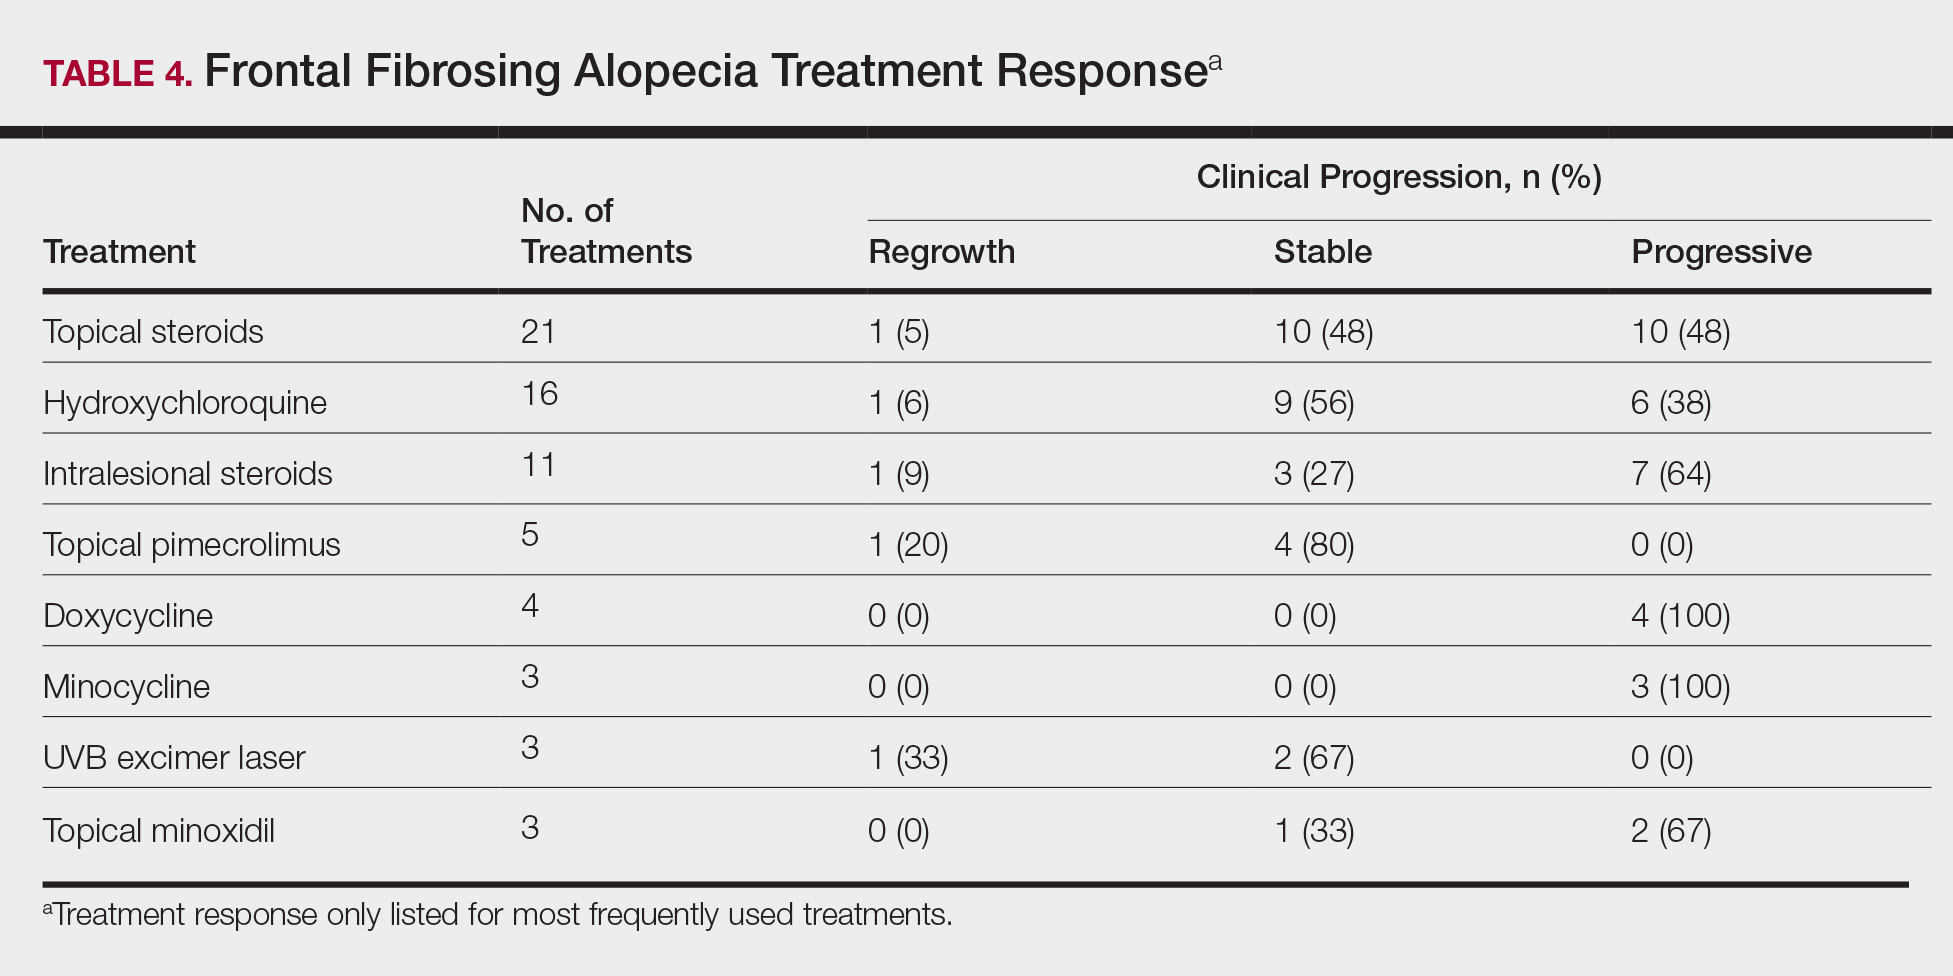
Treatments with little or no treatment response to hair loss include doxycycline, minocycline, and topical minoxidil. Seven patients (24%) were treated with doxycycline or minocycline, all of whom reported no clinical response. Topical minoxidil was used by 3 patients (10%), with only 1 patient (33%) reporting stabilization of hair loss but no regrowth of hair. 5α-reductase inhibitors such as finasteride and dutasteride were only used by 1 patient (3%), who reported no treatment response. Other treatments that were rarely used include meloxicam (n=2), azathioprine (n=2), oral clindamycin (n=2), bimatoprost (n=1), quinacrine (n=1), cephalosporin (n=1), prednisone (n=1), isotretinoin (n=1), methotrexate (n=1), spironolactone (n=1), topical clindamycin (n=1), and laser hair removal (n=1). Of these, only meloxicam and quinacrine were anecdotally associated with stabilization of hair loss, while the rest of the treatments were associated with progressive hair loss despite therapy.
Comment
Frontal fibrosing alopecia is a form of cicatricial alopecia considered to be a clinical subset of LPP. Although the pathogeneses of both diseases are poorly understood, LPP is the better-studied model and is generally considered to be an autoimmune disease specific to the hair follicle, involving a cell-mediated inflammatory response to epithelial hair follicle stem cells.12 In support of this hypothesis, FFA and LPP have been frequently associated with autoimmune diseases, particularly with hypothyroidism.6,13-15 We found that 55% of our patients had a history of autoimmune disease, including 35% with hypothyroidism, 28% with mucocutaneous lichen planus, 7% with psoriasis, 3% with vitiligo, 3% with systemic lupus erythematosus, 3% with iritis, 3% with Sjögren syndrome, and 3% with ulcerative colitis. The link between FFA and hypothyroidism has been the best studied, with a large study by Atanskova Mesinkovska et al14 finding that 34% of 166 patients with LPP and FFA have some kind of thyroid disease and 29% have hypothyroidism. Fron
Although FFA has been classically described to affect postmenopausal women, recent studies have consistently identified that premenopausal women4-6,8,16,17 and men14,16 also can be affected by the condition. In our patient cohort, there was 1 male patient (3%), and a substantial number of the female patients were premenopausal (19%) and menopausal (19%) at the time of disease onset. Most of the patients studied were white; Asian and black patients were a consistent minority across FFA studies,5,13-16,25 highlighting the importance of screening for FFA in all demographics.
In our study, FFA patients also appeared to be more affluent than the general population and were predominantly nonsmokers (76%). These statistics are consistent with the United Kingdom population studied by MacDonald et al,6 which demonstrated a higher socioeconomic status and higher incidence of nonsmoking in their cases of FFA. Another large retrospective study of FFA patients in Spain found that 87% of their FFA cases (N=355) were nonsmokers, though they did not note a difference from the general unaffected population.15 In our study, we replicated these trends, finding an above average affluence level and a high but not statistically significant incidence of nonsmokers. Although it is not clear how socioeconomic status or smoking factors into the pathology of FFA, these studies may show a general trend in the environmental demographics of the disease.
Clinically, patients with FFA typically present with hair loss of the scalp as well as other sites. The eyebrows are the most common site to be affected outside of the scalp, affecting 86% of our patients, whereas eyelashes are the least commonly affected, presenting in only 3% of our patients. Body hair loss also is common, with almost two-thirds of our cohort reporting hair loss on the limbs and more than one-third reporting loss of axillary and pubic hair. These findings are consistent with those of other studies.3-6,8,13,15 Eyelash loss, body hair loss, and facial papules have been found to be associated with more severe forms of FFA,15 though we did not investigate these forms in our study. Inflammatory symptoms are common, with pruritus affecting 66% of our patients and pain affecting 10% of patients, consistent with the published literature.3,13,15,17
Multiple studies have shown that female FFA patients have a higher incidence of hysterectomies in their medical history.5,8,15 This observation has been used to further support the hypothesis that a change in sex hormone balance may trigger the initial onset of disease.5,8,15 A considerable number of the female patients in our study had also undergone hysterectomies (29%). Only 2 patients (7%) underwent premature surgical menopause through bilateral removal of the ovaries, and neither of these patients had abnormally early onset of FFA (age at onset, 52 and 65 years). Many patients in our study also reported a history of pharmacologic manipulation of sex hormones with hormone replacement therapy (43%) and oral contraceptive use (43%). However, patients with FFA have not been identified to have abnormal hormone levels compared to unaffected postmenopausal women.1 Additionally, the disease does not exclusively affect androgen-dependent hair, as indicated by the high prevalence of eyebrow hair loss. We hypothesize that the link between increased prevalence of hysterectomy and FFA is not due to hormonal changes but rather from the stresses related to the hysterectomy or associated conditions that required the surgery. In our study, 35% of patients identified stress as the inciting event prior to their onset of hair loss, with 17% specifically referring to health-related stress such as surgery or new diagnoses as the cause. Although this pattern is purely observational, it is valuable to consider that stress could contribute to the initial onset of FFA as with alopecia areata.26
A dental history was obtained in 24 patients to explore the possibility of FFA as a manifestation of contact allergy secondary to exposure to metal dental implants. Contact allergies to metal amalgam and gold alloy dental implants/fillings frequently have been described as presenting as oral lichen planus in the literature.27-34 Given the histologic overlap between oral lichen planus and LPP/FFA, it is worth exploring the possibility that LPP and FFA are other manifestations of contact allergic response. In our study, 100% of the patients who provided a dental history had metal amalgam implants and 33% had gold alloy implants. It is an interesting observation, but it should be noted that none of the patients in our study had undergone patch testing for contact allergies to the metals in their dental implants, and further studies are required to explore this hypothesis.
Frontal fibrosing alopecia is a difficult condition to treat. In our study, patients tried an average of 3 different treatments, the most common being topical steroids (72%), hydroxychloroquine (55%), and intralesional steroids (38%).
A PubMed search of articles indexed for MEDLINE using the terms randomized control trial and frontal fibrosing alopecia yielded no randomized controlled trials that have been performed to demonstrate the most efficacious treatments of FFA. However, one systematic review of 114 patients found 5α-RIs, antimalarials, and intralesional corticosteroids to yield the best responses in treating FFA.22 Another large, multicenter, retrospective study of 355 patients also demonstrated that 5α-RIs and intralesional corticosteroids minimized hair loss most effectively across treatment modalities.15 One treatment that was not discussed in either study but was utilized in ours was the UVB excimer laser, which has been demonstrated to induce T-cell apoptosis and decrease inflammation in psoriasis but has been infrequently studied in the use of FFA or LPP. In one study of 13 patients with LPP, excimer laser treatment was successful in reducing inflammatory symptoms and improving hair loss.35 Our results reaffirm that laser therapy could be considered more frequently as a treatment of FFA.
This study is subject to several limitations. The study size was comprised of a relatively small number of patients with the condition. Additionally, only one-third of patients contacted agreed to participate in the study, and therefore the responses received may not be completely representative of all FFA patients. With a retrospective study, there is potential for recall bias in the data that are collected. Physician chart correlation to patient responses could not be reliably performed due to inconsistent documentation, care received outside our medical system, and prolonged or loss to follow-up. Another concern is that not all diagnoses of FFA in this study were biopsy confirmed. In one patient with systemic lupus erythematous who declined biopsy, it cannot be confirmed that her etiology of scarring alopecia was FFA rather than discoid lupus erythematous. Finally, because patients were treated with multiple medications, often concurrently, it was difficult to parse out which medications were efficacious and which were not. Despite these limitations, the findings in the study add to the growing literature about a rare but increasingly prevalent presentation.
Conclusion
Frontal fibrosing alopecia is a condition that predominantly affects white postmenopausal women but should not be overlooked in other demographics; higher socioeconomic status and nonsmoking are consistent with cases of FFA worldwide. Alopecia frequently involves other body hair, particularly the eyebrows, and is commonly associated with pruritus and pain. Many patients can identify an inciting event, usually stress, a health crisis, or new external exposures that they believe to have triggered the event. Consistent with data about LPP, FFA is frequently associated with autoimmune conditions, particularly hypothyroidism. A substantial portion of patients with FFA have had metal amalgam or gold alloy dental implants placed, though no patch testing was done to confirm that these patients have a contact allergy to these metals. Treatment for the condition is difficult, but topical and intralesional steroids, hydroxychloroquine, calcineurin inhibitors, and excimer laser therapy are efficacious in a large proportion of patients. Nevertheless, further research through prospective randomized trials is necessary to determine the best treatment modalities for FFA. Frontal fibrosing alopecia is a scarring form of hair loss that causes substantial emotional distress; therefore, it is critical to continue to investigate its etiology and treatments to improve patient care.
- Kossard S. Postmenopausal frontal fibrosing alopecia: scarring alopecia in a pattern distribution. Arch Dermatol. 1994;130:770-774.
- Kossard S, Lee MS, Wilkinson B. Postmenopausal frontal fibrosing alopecia: a frontal variant of lichen planopilaris. J Am Acad Dermatol. 1997;36:59-66.
- Tosti A, Piraccini BM, Iorizzo M, et al. Frontal fibrosing alopecia in postmenopausal women. J Am Acad Dermatol. 2005;52:55-60.
- Moreno-Ramírez D, Camacho Martínez F. Frontal fibrosing alopecia: a survey in 16 patients. J Eur Acad Dermatol Venereol. 2005;19:700-705.
- Ladizinski B, Bazakas A, Selim MA, et al. Frontal fibrosing alopecia: a retrospective review of 19 patients seen at Duke University. J Am Acad Dermatol. 2013;68:749-755.
- MacDonald A, Clark C, Holmes S. Frontal fibrosing alopecia: a review of 60 cases. J Am Acad Dermatol. 2012;67:955-961.
- Georgala S, Katoulis AC, Befon A, et al. Treatment of postmenopausal frontal fibrosing alopecia with oral dutasteride. J Am Acad Dermatol. 2009;61:157-158.
- Tan KT, Messenger AG. Frontal fibrosing alopecia: clinical presentations and prognosis. Br J Dermatol. 2009;160:75-79.
- Chew AL, Bashir SJ, Wain EM, et al. Expanding the spectrum of frontal fibrosing alopecia: a unifying concept. J Am Acad Dermatol. 2010;63:653-660.
- Miteva M, Camacho I, Romanelli P, et al. Acute hair loss on the limbs in frontal fibrosing alopecia: a clinicopathological study of two cases. Br J Dermatol. 2010;163:426-428.
- Abbas O, Chedraoui A, Ghosn S. Frontal fibrosing alopecia presenting with components of Piccardi-Lassueur-Graham-Little syndrome. J Am Acad Dermatol. 2007;57(2 suppl):S15-S18.
- Harries MJ, Meyer K, Chaudhry I, et al. Lichen planopilaris is characterized by immune privilege collapse of the hair follicle’s epithelial stem cell niche. J Pathol. 2013;231:236-247.
- Dlova NC, Jordaan HF, Skenjane A, et al. Frontal fibrosing alopecia: a clinical review of 20 black patients from South Africa. Br J Dermatol. 2013;169:939-941.
- Atanaskova Mesinkovska N, Brankov N, Piliang M, et al. Association of lichen planopilaris with thyroid disease: a retrospective case-control study. J Am Acad Dermatol. 2014;70:889-892.
- Vañó-Galván S, Molina-Ruiz AM, Serrano-Falcón C, et al. Frontal fibrosing alopecia: a multicenter review of 355 patients. J Am Acad Dermatol. 2014;70:670-678.
- Dlova N, Goh CL, Tosti A. Familial frontal fibrosing alopecia. Br J Dermatol. 2013;168:220-222.
- Samrao A, Chew AL, Price V. Frontal fibrosing alopecia: a clinical review of 36 patients. Br J Dermatol. 2010;163:1296-1300.
- Miteva M, Aber C, Torres F, et al. Frontal fibrosing alopecia occurring on scalp vitiligo: report of four cases. Br J Dermatol. 2011;165:445-447.
- Sato M, Saga K, Takahashi H. Postmenopausal frontal fibrosing alopecia in a Japanese woman with Sjögren’s syndrome. J Dermatol. 2008;35:729-731.
- Feldmann R, Harms M, Saurat JH. Postmenopausal frontal fibrosing alopecia. Hautarzt. 1996;47:533-536.
- Junqueira Ribeiro Pereira AF, Vincenzi C, Tosti A. Frontal fibrosing alopecia in two sisters. Br J Dermatol. 2010;162:1154-1155.
- Rácz E, Gho C, Moorman PW, et al. Treatment of frontal fibrosing alopecia and lichen planopilaris: a systematic review. J Eur Acad Dermatol Venereol. 2013;27:1461-1470.
- QuickFacts: St. Louis County, Missouri. United States Census Bureau website. https://www.census.gov/quickfacts/fact/table/stlouiscountymissouri/PST045217. Accessed February 6, 2019.
- State tobacco activities tracking and evaluation (STATE) system. State highlights. Centers for Disease Control and Prevention website. https://nccd.cdc.gov/STATESystem/rdPage.aspx?rdReport=OSH_STATE.Highlights. Accessed February 6, 2019.
- Miteva M, Whiting D, Harries M, et al. Frontal fibrosing alopecia in black patients. Br J Dermatol. 2012;167:208-210.
- Willemsen R, Vanderlinden J, Roseeuw D, et al. Increased history of childhood and lifetime traumatic events among adults with alopecia areata. J Am Acad Dermatol. 2009;60:388-393.
- Segura-Egea JJ, Bullón-Fernández P. Lichenoid reaction associated to amalgam restoration. Med Oral Patol Oral Cir Bucal. 2004;9:421-424.
- Laeijendecker R, van Joost T. Oral manifestations of gold allergy. J Am Acad Dermatol. 1994;30:205-209.
- Marcusson JA. Contact allergies to nickel sulfate, gold sodium thiosulfate and palladium chloride in patients claiming side-effects from dental alloy components. Contact Dermatitis. 1996;34:320-323.
- Nordlind K, Lidén S. Patch test reactions to metal salts in patients with oral mucosal lesions associated with amalgam restorations. Contact Dermatitis. 1992;27:157-160.
- Koch P, Bahmer FA. Oral lichenoid lesions, mercury hypersensitivity and combined hypersensitivity to mercury and other metals: histologically-proven reproduction of the reaction by patch testing with metal salts. Contact Dermatitis. 1995;33:323-328.
- Laine J, Kalimo K, Happonen RP. Contact allergy to dental restorative materials in patients with oral lichenoid lesions. Contact Dermatitis. 1997;36:141-146.
- Yiannias JA, el-Azhary RA, Hand JH, et al. Relevant contact sensitivities in patients with the diagnosis of oral lichen planus. J Am Acad Dermatol. 2000;42:177-182.
- Scalf LA, Fowler JF Jr, Morgan KW, et al. Dental metal allergy in patients with oral, cutaneous, and genital lichenoid reactions. Am J Contact Dermat. 2001;12:146-150.
- Navarini AA, Kolios AG, Prinz-Vavricka BM, et al. Low-dose excimer 308-nm laser for treatment of lichen planopilaris. Arch Dermatol. 2011;147:1325-1326.
Frontal fibrosing alopecia (FFA) is a form of lymphocytic cicatricial alopecia that presents as frontotemporal hairline recession, typically in postmenopausal women.1 The condition is considered to be a variant of lichen planopilaris (LPP) due to its similar histologic appearance.2 Loss of eyebrow1-11 and body5-11 hair also is commonly present in FFA, and histologic findings are identical to those for hair loss on the scalp,8,9 suggesting that FFA may be a form of generalized alopecia.
The pathogenesis of FFA is unknown, but several etiologies have been postulated. Some suggest that as a variant of LPP, FFA is a hair-specific autoimmune disorder characterized by a T cell–mediated immune reaction against epithelial hair follicle stem cells, leading to fibrosis and depletion of hair regeneration potential.12 In support of this theory, FFA has been associated with other autoimmune diseases including hypothyroidism,6,8,13-16 mucocutaneous lichen planus,8,15,17 vitiligo,15,18 Sjögren syndrome,19 and lichen sclerosus et atrophicus.15,20 Another hypothesis suggests that the proandrogenic state in postmenopausal women may be related to the disease process.1 This hypothesis is supported by the reported success of antiandrogen therapy with 5α-reductase inhibitors (5α-RIs) in stabilizing FFA.3-5,7 Finally, genetic16,21 and environmental factors related to smoking and socioeconomic status5 also have been postulated to be risk factors for FFA. A variety of treatments have shown varying success, including topical and intralesional corticosteroids, hydroxychloroquine, immunomodulators, antibiotics, and 5α-RIs.1,3-6,8,15,17,22 However, FFA is considered to be relatively difficult to treat and commonly progresses regardless of treatment before spontaneously stabilizing.2-4,6,8,10
Since its discovery in 1994,1 FFA has become increasingly prevalent, comprising 17% of new referrals for hair loss in one study (N=57).6 Although growing recognition of the condition likely plays a role in its increasing presentation, other unidentified factors may contribute to its expanding incidence. In this report, we describe the demographics, clinical features, and disease progression of 29 cases of FFA treated within our division using a series of surveys and chart reviews.
Methods
Upon receiving approval for the project from the institutional review board, we identified 29 patients who met the criteria for diagnosis of FFA through a chart review of all patients being treated for hair loss by clinics within the Washington University Division of Dermatology (St. Louis, Missouri). Diagnostic criteria for FFA included scarring alopecia in the frontotemporal distribution with associated perifollicular erythema or papules and, if performed, a scalp biopsy of the involved area of alopecia showing lymphocytic cicatricial alopecia, compatible with LPP. The diagnosis was confirmed by biopsy in 18 patients (62%), while the remainder of the diagnoses were made clinically. Most biopsy specimens were diagnosed by board-certified dermatopathologists at Washington University, with the remainder diagnosed by outside pathologists if the patient was initially diagnosed at another institution.
Patients meeting criteria for FFA were mailed a study consent form, as well as a 2-page survey to assess demographics, clinical features of hair loss, medical histories, social and family histories, and treatments utilized. After receiving consent from patients, survey results were collected and summarized. If there was any need for clarification of answers, follow-up questions were conducted via email prior to any data analysis that was performed.
For analysis of treatment response, patients were asked what treatments they had utilized and about the progression of their hair loss. Patients reporting stabilization of hair loss or hair regrowth were classified as treatment responsive. Patients who underwent multiple treatments were included in the analyses for each of those treatments. Physician records for treatment response were not correlated with patient responses due to inconsistent documentation, care received outside of our medical system, and prolonged or loss to follow-up. Physician-reported data were only used to identify qualifying patients and their biopsy results, as described above.
Results
Patient Demographic
Between October 2013 and May 2014, 29 patients with FFA were recruited into the study. Patients were diagnosed between January 2006 and December 2013. There were 28 female patients (97%) and 1 male patient (3%). The average age of disease onset was 55.4 years (range, 29–75 years). Twenty-five patients (86%) self-identified as non-Hispanic white, 3 patients (10%) as Asian, and 1 patient (3%) as black. Patients also appeared to be a more affluent group than the general St. Louis County population, with a median household income between $75,000 and $100,000. In comparison, the median household income reported in St. Louis County from 2008 to 2012 was $58,485.23 The patient population was primarily composed of nonsmokers, with 22 (76%) patients who had never smoked, 6 (21%) who were present smokers, and 1 (3%) smoked in the past. These results were comparable to the reported number of female smokers in Missouri.24
Clinicopathologic Features
The clinical features of FFA are described in Table 1. All patients had frontotemporal recession of the hairline with some degree of scarring and perifollicular erythema (Figure 1). Most patients also reported hair loss at other sites, including 25 patients (86%) with eyebrow hair loss, 18 (62%) with limb hair loss, 11 (38%) with axillary hair loss, 11 (38%) with pubic hair loss, and 1 (3%) with eyelash hair loss. Patients also frequently reported inflammatory symptoms, including 19 patients (66%) with itching, 18 (62%) with redness, 3 (10%) with pain, 2 (7%) with papular lesions, and 1 (3%) with sores and erosions on the skin. Regarding progression of hair loss over time, 16 patients (55%) reported stabilization of hair loss, 11 (38%) reported progressive hair loss, and 2 (7%) reported some hair regrowth. Thirteen patients (45%) identified some inciting event that they believed to have triggered the disease. Ten patients (35%) identified stress as the inciting event, and 5 patients (17%) specifically referred to health-related stressors, including hip-replacement surgery, new diagnoses of systemic diseases, starting new medications, and stopping hormone replacement therapy. Furthermore, 2 (7%) patients reported exposure to chemicals and pesticides as suspected triggers.
Typical biopsy results showed a perifollicular lymphocytic infiltrate and fibrosis surrounding the infundibulum and isthmus of hair follicles (Figure 2). There were associated vacuolar changes in the basal layer and scattered dyskeratosis throughout the follicular epithelium. As the disease progressed to end-stage scarring, there was marked reduction in the number of hair follicles, which were replaced by fibrous tracts, and a disappearance of the previous inflammatory infiltrate.
Medical History
Of the 26 female patients who provided data about menopause status at time of disease onset, 16 (62%) were postmenopausal, 5 (19%) were menopausal, and 5 (19%) were premenopausal. Of the 28 female patients in the study, 8 (29%) had a history of hysterectomy and 2 (7%) also had surgically induced menopause through bilateral surgical oophorectomy. Twenty-four patients (86%) had a childbearing history, with an average of 2.3 children. Twelve patients (43%) reported use of hormone replacement therapy after menopause. Twelve patients (43%) also reported a history of oral contraceptive use.
Table 2 describes the comorbidities of all 29 patients. A history of autoimmune disease was prominent, found in 16 patients (55%). Thirteen patients (45%) reported thyroid disease, including 10 patients (35%) with hypothyroidism. Additionally, 8 patients (28%) had a history of mucocutaneous lichen planus, 2 (7%) of psoriasis/psoriatic arthritis, 1 (3%) of vitiligo, 1 (3%) of systemic lupus erythematosus, 1 (3%) of iritis, 1 (3%) of Sjögren syndrome, and 1 (3%) of ulcerative colitis. Six patients (21%) also reported a history of breast cancer.
A dental history was obtained in 24 patients. All 24 patients reported having some dental implant or filling placed. Twenty-four patients (100%) had a history of metal amalgam implants, 8 (33%) had gold alloy implants, 4 (17%) had composite resin implants, and 3 (13%) had porcelain implants. Two patients had metal amalgam implants that had since been replaced by nonmetal implants. Both patients reported no change in their clinical conditions with removal of the metal implants. Six of 8 patients (75%) with mucocutaneous lichen planus reported having dental implants. Of them, all 6 patients (100%) reported having metal amalgam implants, and 3 patients (50%) additionally reported having gold alloy implants.
Treatments
On average, patients were treated with 3 different therapies for FFA (range, 0–14). The treatments utilized are listed in Table 3, and responses to treatments are summarized in Table 4. Topical steroids were the most popular treatment modality and were used by 21 patients (72%). Approximately half of those patients reported treatment response with stabilization of hair loss or regrowth (n=11; 52%). Hydroxychloroquine was the second most commonly used modality (16 patients [55%]), with 10 of those patients (63%) reporting treatment response. Intralesional steroids were used in 11 patients (38%), with a treatment response in 36% (4/11) of those patients. Topical pimecrolimus and tacrolimus were used by 6 patients (21%), with 5 of those patients (83%) reporting treatment response. UVB excimer laser therapy was used on 3 patients (10%) with 100% treatment response.
Treatments with little or no treatment response to hair loss include doxycycline, minocycline, and topical minoxidil. Seven patients (24%) were treated with doxycycline or minocycline, all of whom reported no clinical response. Topical minoxidil was used by 3 patients (10%), with only 1 patient (33%) reporting stabilization of hair loss but no regrowth of hair. 5α-reductase inhibitors such as finasteride and dutasteride were only used by 1 patient (3%), who reported no treatment response. Other treatments that were rarely used include meloxicam (n=2), azathioprine (n=2), oral clindamycin (n=2), bimatoprost (n=1), quinacrine (n=1), cephalosporin (n=1), prednisone (n=1), isotretinoin (n=1), methotrexate (n=1), spironolactone (n=1), topical clindamycin (n=1), and laser hair removal (n=1). Of these, only meloxicam and quinacrine were anecdotally associated with stabilization of hair loss, while the rest of the treatments were associated with progressive hair loss despite therapy.
Comment
Frontal fibrosing alopecia is a form of cicatricial alopecia considered to be a clinical subset of LPP. Although the pathogeneses of both diseases are poorly understood, LPP is the better-studied model and is generally considered to be an autoimmune disease specific to the hair follicle, involving a cell-mediated inflammatory response to epithelial hair follicle stem cells.12 In support of this hypothesis, FFA and LPP have been frequently associated with autoimmune diseases, particularly with hypothyroidism.6,13-15 We found that 55% of our patients had a history of autoimmune disease, including 35% with hypothyroidism, 28% with mucocutaneous lichen planus, 7% with psoriasis, 3% with vitiligo, 3% with systemic lupus erythematosus, 3% with iritis, 3% with Sjögren syndrome, and 3% with ulcerative colitis. The link between FFA and hypothyroidism has been the best studied, with a large study by Atanskova Mesinkovska et al14 finding that 34% of 166 patients with LPP and FFA have some kind of thyroid disease and 29% have hypothyroidism. Fron
Although FFA has been classically described to affect postmenopausal women, recent studies have consistently identified that premenopausal women4-6,8,16,17 and men14,16 also can be affected by the condition. In our patient cohort, there was 1 male patient (3%), and a substantial number of the female patients were premenopausal (19%) and menopausal (19%) at the time of disease onset. Most of the patients studied were white; Asian and black patients were a consistent minority across FFA studies,5,13-16,25 highlighting the importance of screening for FFA in all demographics.
In our study, FFA patients also appeared to be more affluent than the general population and were predominantly nonsmokers (76%). These statistics are consistent with the United Kingdom population studied by MacDonald et al,6 which demonstrated a higher socioeconomic status and higher incidence of nonsmoking in their cases of FFA. Another large retrospective study of FFA patients in Spain found that 87% of their FFA cases (N=355) were nonsmokers, though they did not note a difference from the general unaffected population.15 In our study, we replicated these trends, finding an above average affluence level and a high but not statistically significant incidence of nonsmokers. Although it is not clear how socioeconomic status or smoking factors into the pathology of FFA, these studies may show a general trend in the environmental demographics of the disease.
Clinically, patients with FFA typically present with hair loss of the scalp as well as other sites. The eyebrows are the most common site to be affected outside of the scalp, affecting 86% of our patients, whereas eyelashes are the least commonly affected, presenting in only 3% of our patients. Body hair loss also is common, with almost two-thirds of our cohort reporting hair loss on the limbs and more than one-third reporting loss of axillary and pubic hair. These findings are consistent with those of other studies.3-6,8,13,15 Eyelash loss, body hair loss, and facial papules have been found to be associated with more severe forms of FFA,15 though we did not investigate these forms in our study. Inflammatory symptoms are common, with pruritus affecting 66% of our patients and pain affecting 10% of patients, consistent with the published literature.3,13,15,17
Multiple studies have shown that female FFA patients have a higher incidence of hysterectomies in their medical history.5,8,15 This observation has been used to further support the hypothesis that a change in sex hormone balance may trigger the initial onset of disease.5,8,15 A considerable number of the female patients in our study had also undergone hysterectomies (29%). Only 2 patients (7%) underwent premature surgical menopause through bilateral removal of the ovaries, and neither of these patients had abnormally early onset of FFA (age at onset, 52 and 65 years). Many patients in our study also reported a history of pharmacologic manipulation of sex hormones with hormone replacement therapy (43%) and oral contraceptive use (43%). However, patients with FFA have not been identified to have abnormal hormone levels compared to unaffected postmenopausal women.1 Additionally, the disease does not exclusively affect androgen-dependent hair, as indicated by the high prevalence of eyebrow hair loss. We hypothesize that the link between increased prevalence of hysterectomy and FFA is not due to hormonal changes but rather from the stresses related to the hysterectomy or associated conditions that required the surgery. In our study, 35% of patients identified stress as the inciting event prior to their onset of hair loss, with 17% specifically referring to health-related stress such as surgery or new diagnoses as the cause. Although this pattern is purely observational, it is valuable to consider that stress could contribute to the initial onset of FFA as with alopecia areata.26
A dental history was obtained in 24 patients to explore the possibility of FFA as a manifestation of contact allergy secondary to exposure to metal dental implants. Contact allergies to metal amalgam and gold alloy dental implants/fillings frequently have been described as presenting as oral lichen planus in the literature.27-34 Given the histologic overlap between oral lichen planus and LPP/FFA, it is worth exploring the possibility that LPP and FFA are other manifestations of contact allergic response. In our study, 100% of the patients who provided a dental history had metal amalgam implants and 33% had gold alloy implants. It is an interesting observation, but it should be noted that none of the patients in our study had undergone patch testing for contact allergies to the metals in their dental implants, and further studies are required to explore this hypothesis.
Frontal fibrosing alopecia is a difficult condition to treat. In our study, patients tried an average of 3 different treatments, the most common being topical steroids (72%), hydroxychloroquine (55%), and intralesional steroids (38%).
A PubMed search of articles indexed for MEDLINE using the terms randomized control trial and frontal fibrosing alopecia yielded no randomized controlled trials that have been performed to demonstrate the most efficacious treatments of FFA. However, one systematic review of 114 patients found 5α-RIs, antimalarials, and intralesional corticosteroids to yield the best responses in treating FFA.22 Another large, multicenter, retrospective study of 355 patients also demonstrated that 5α-RIs and intralesional corticosteroids minimized hair loss most effectively across treatment modalities.15 One treatment that was not discussed in either study but was utilized in ours was the UVB excimer laser, which has been demonstrated to induce T-cell apoptosis and decrease inflammation in psoriasis but has been infrequently studied in the use of FFA or LPP. In one study of 13 patients with LPP, excimer laser treatment was successful in reducing inflammatory symptoms and improving hair loss.35 Our results reaffirm that laser therapy could be considered more frequently as a treatment of FFA.
This study is subject to several limitations. The study size was comprised of a relatively small number of patients with the condition. Additionally, only one-third of patients contacted agreed to participate in the study, and therefore the responses received may not be completely representative of all FFA patients. With a retrospective study, there is potential for recall bias in the data that are collected. Physician chart correlation to patient responses could not be reliably performed due to inconsistent documentation, care received outside our medical system, and prolonged or loss to follow-up. Another concern is that not all diagnoses of FFA in this study were biopsy confirmed. In one patient with systemic lupus erythematous who declined biopsy, it cannot be confirmed that her etiology of scarring alopecia was FFA rather than discoid lupus erythematous. Finally, because patients were treated with multiple medications, often concurrently, it was difficult to parse out which medications were efficacious and which were not. Despite these limitations, the findings in the study add to the growing literature about a rare but increasingly prevalent presentation.
Conclusion
Frontal fibrosing alopecia is a condition that predominantly affects white postmenopausal women but should not be overlooked in other demographics; higher socioeconomic status and nonsmoking are consistent with cases of FFA worldwide. Alopecia frequently involves other body hair, particularly the eyebrows, and is commonly associated with pruritus and pain. Many patients can identify an inciting event, usually stress, a health crisis, or new external exposures that they believe to have triggered the event. Consistent with data about LPP, FFA is frequently associated with autoimmune conditions, particularly hypothyroidism. A substantial portion of patients with FFA have had metal amalgam or gold alloy dental implants placed, though no patch testing was done to confirm that these patients have a contact allergy to these metals. Treatment for the condition is difficult, but topical and intralesional steroids, hydroxychloroquine, calcineurin inhibitors, and excimer laser therapy are efficacious in a large proportion of patients. Nevertheless, further research through prospective randomized trials is necessary to determine the best treatment modalities for FFA. Frontal fibrosing alopecia is a scarring form of hair loss that causes substantial emotional distress; therefore, it is critical to continue to investigate its etiology and treatments to improve patient care.
- Kossard S. Postmenopausal frontal fibrosing alopecia: scarring alopecia in a pattern distribution. Arch Dermatol. 1994;130:770-774.
- Kossard S, Lee MS, Wilkinson B. Postmenopausal frontal fibrosing alopecia: a frontal variant of lichen planopilaris. J Am Acad Dermatol. 1997;36:59-66.
- Tosti A, Piraccini BM, Iorizzo M, et al. Frontal fibrosing alopecia in postmenopausal women. J Am Acad Dermatol. 2005;52:55-60.
- Moreno-Ramírez D, Camacho Martínez F. Frontal fibrosing alopecia: a survey in 16 patients. J Eur Acad Dermatol Venereol. 2005;19:700-705.
- Ladizinski B, Bazakas A, Selim MA, et al. Frontal fibrosing alopecia: a retrospective review of 19 patients seen at Duke University. J Am Acad Dermatol. 2013;68:749-755.
- MacDonald A, Clark C, Holmes S. Frontal fibrosing alopecia: a review of 60 cases. J Am Acad Dermatol. 2012;67:955-961.
- Georgala S, Katoulis AC, Befon A, et al. Treatment of postmenopausal frontal fibrosing alopecia with oral dutasteride. J Am Acad Dermatol. 2009;61:157-158.
- Tan KT, Messenger AG. Frontal fibrosing alopecia: clinical presentations and prognosis. Br J Dermatol. 2009;160:75-79.
- Chew AL, Bashir SJ, Wain EM, et al. Expanding the spectrum of frontal fibrosing alopecia: a unifying concept. J Am Acad Dermatol. 2010;63:653-660.
- Miteva M, Camacho I, Romanelli P, et al. Acute hair loss on the limbs in frontal fibrosing alopecia: a clinicopathological study of two cases. Br J Dermatol. 2010;163:426-428.
- Abbas O, Chedraoui A, Ghosn S. Frontal fibrosing alopecia presenting with components of Piccardi-Lassueur-Graham-Little syndrome. J Am Acad Dermatol. 2007;57(2 suppl):S15-S18.
- Harries MJ, Meyer K, Chaudhry I, et al. Lichen planopilaris is characterized by immune privilege collapse of the hair follicle’s epithelial stem cell niche. J Pathol. 2013;231:236-247.
- Dlova NC, Jordaan HF, Skenjane A, et al. Frontal fibrosing alopecia: a clinical review of 20 black patients from South Africa. Br J Dermatol. 2013;169:939-941.
- Atanaskova Mesinkovska N, Brankov N, Piliang M, et al. Association of lichen planopilaris with thyroid disease: a retrospective case-control study. J Am Acad Dermatol. 2014;70:889-892.
- Vañó-Galván S, Molina-Ruiz AM, Serrano-Falcón C, et al. Frontal fibrosing alopecia: a multicenter review of 355 patients. J Am Acad Dermatol. 2014;70:670-678.
- Dlova N, Goh CL, Tosti A. Familial frontal fibrosing alopecia. Br J Dermatol. 2013;168:220-222.
- Samrao A, Chew AL, Price V. Frontal fibrosing alopecia: a clinical review of 36 patients. Br J Dermatol. 2010;163:1296-1300.
- Miteva M, Aber C, Torres F, et al. Frontal fibrosing alopecia occurring on scalp vitiligo: report of four cases. Br J Dermatol. 2011;165:445-447.
- Sato M, Saga K, Takahashi H. Postmenopausal frontal fibrosing alopecia in a Japanese woman with Sjögren’s syndrome. J Dermatol. 2008;35:729-731.
- Feldmann R, Harms M, Saurat JH. Postmenopausal frontal fibrosing alopecia. Hautarzt. 1996;47:533-536.
- Junqueira Ribeiro Pereira AF, Vincenzi C, Tosti A. Frontal fibrosing alopecia in two sisters. Br J Dermatol. 2010;162:1154-1155.
- Rácz E, Gho C, Moorman PW, et al. Treatment of frontal fibrosing alopecia and lichen planopilaris: a systematic review. J Eur Acad Dermatol Venereol. 2013;27:1461-1470.
- QuickFacts: St. Louis County, Missouri. United States Census Bureau website. https://www.census.gov/quickfacts/fact/table/stlouiscountymissouri/PST045217. Accessed February 6, 2019.
- State tobacco activities tracking and evaluation (STATE) system. State highlights. Centers for Disease Control and Prevention website. https://nccd.cdc.gov/STATESystem/rdPage.aspx?rdReport=OSH_STATE.Highlights. Accessed February 6, 2019.
- Miteva M, Whiting D, Harries M, et al. Frontal fibrosing alopecia in black patients. Br J Dermatol. 2012;167:208-210.
- Willemsen R, Vanderlinden J, Roseeuw D, et al. Increased history of childhood and lifetime traumatic events among adults with alopecia areata. J Am Acad Dermatol. 2009;60:388-393.
- Segura-Egea JJ, Bullón-Fernández P. Lichenoid reaction associated to amalgam restoration. Med Oral Patol Oral Cir Bucal. 2004;9:421-424.
- Laeijendecker R, van Joost T. Oral manifestations of gold allergy. J Am Acad Dermatol. 1994;30:205-209.
- Marcusson JA. Contact allergies to nickel sulfate, gold sodium thiosulfate and palladium chloride in patients claiming side-effects from dental alloy components. Contact Dermatitis. 1996;34:320-323.
- Nordlind K, Lidén S. Patch test reactions to metal salts in patients with oral mucosal lesions associated with amalgam restorations. Contact Dermatitis. 1992;27:157-160.
- Koch P, Bahmer FA. Oral lichenoid lesions, mercury hypersensitivity and combined hypersensitivity to mercury and other metals: histologically-proven reproduction of the reaction by patch testing with metal salts. Contact Dermatitis. 1995;33:323-328.
- Laine J, Kalimo K, Happonen RP. Contact allergy to dental restorative materials in patients with oral lichenoid lesions. Contact Dermatitis. 1997;36:141-146.
- Yiannias JA, el-Azhary RA, Hand JH, et al. Relevant contact sensitivities in patients with the diagnosis of oral lichen planus. J Am Acad Dermatol. 2000;42:177-182.
- Scalf LA, Fowler JF Jr, Morgan KW, et al. Dental metal allergy in patients with oral, cutaneous, and genital lichenoid reactions. Am J Contact Dermat. 2001;12:146-150.
- Navarini AA, Kolios AG, Prinz-Vavricka BM, et al. Low-dose excimer 308-nm laser for treatment of lichen planopilaris. Arch Dermatol. 2011;147:1325-1326.
Practice Points
- Frontal fibrosing alopecia (FFA) may be associated with other autoimmune conditions, and patients should be screened accordingly.
- The most efficacious treatments for FFA include topical and intralesional steroids, hydroxychloroquine, calcineurin inhibitors, and excimer laser therapy.
- A stressful precipitating event or metal dental implants/fillings are 2 possible environmental triggers for this condition.

Increasing Mobility via In-hospital Ambulation Protocol Delivered by Mobility Technicians: A Pilot Randomized Controlled Trial
Individuals aged 65 years and over represent 13% of the United States population and account for nearly 40% of hospital discharges.1 Bedrest hastens the functional decline of older patients2-5 and is associated with risk of serious complications, such as falls, delirium, venous thrombosis, and skin breakdown.6,7 Ambulation is widely recognized as important for improving hospital outcomes.8-10 Observational studies suggest that increases of 600 steps per day are associated with shortened length of hospital stay.9 However, randomized trials of assisted ambulation have not demonstrated consistent benefit.11-14 As a result, usual care at most hospitals in the United States does not include assisted ambulation. Even when ambulation is ordered, execution of the orders is inconsistent.15-17
Studies have demonstrated the benefits of various exercise protocols for older patients in rehabilitation facilities,18,19 medical intensive care units,20 and medical and surgical wards.13,18,21 These interventions are usually nursing centered; however, assisting patients with ambulation multiple times per day may be a burdensome addition to the myriad responsibilities of nurses.19,22,23 In fact, ambulation orders are the most frequently overlooked nursing task.24
We designed a graded protocol of assisted ambulation implemented by a dedicated patient care nursing assistant (PCNA) multiple times daily to increase patient mobility. The objective of this study was to assess the feasibility and effectiveness of such an intervention for older inpatients. We hypothesized that the intervention would prove feasible and improve hospital outcomes, including less need for inpatient rehabilitation and shorter length of stay.
METHODS
We conducted a single-blind randomized controlled trial of patients aged ≥60 years and admitted as medical inpatients to the Cleveland Clinic Main Campus, a tertiary care center with over 1,440 inpatient beds. The consent form and study protocol were approved by the Cleveland Clinic Institutional Review Board, and the study was registered with ClinicalTrials.gov (NCT02757131).
Patients
All patients who were admitted to study wards for a medical illness and evaluated by Physical Therapy (PT) were eligible for the study. PT evaluations were ordered by the medical team if deemed necessary on the basis of factors, such as age, estimated mobility, and concerns raised by the ancillary staff. All patients who were expected to be discharged to a skilled nursing facility placement or who required home PT received a PT evaluation. Assessment of mobility was documented via Activity Measure for Postacute Care Inpatient Basic Mobility “six-clicks” short form, hereafter abbreviated as “six-clicks.” Based on past experience, patients with scores <16 rarely go home (<20% of the time), and those with scores >20 usually go home regardless of ambulation. Therefore, only patients with scores of 16-20 were invited to participate in the study. Although patients who were not evaluated by PT might also benefit from the intervention, we required a six-clicks score to assess eligibility. The exclusion criteria included anticipated remaining length of stay less than three days, admission under observation status, admission to the intensive care unit (ICU,) patients receiving comfort care measures, and patients with medical conditions precluding ambulation, such as decompensated heart failure or unstable angina.
Randomization
Patients were randomized to “usual care” or “mobility technician” after baseline evaluation using a computerized system. A block randomization scheme with a size of four was used to ensure an approximately equal number of patients per group.
Intervention
Patients randomized to the intervention group were asked to participate in the ambulation protocol outlined by the PT three times daily under the supervision of the mobility technician. The protocol involved four exercise levels (sitting, standing, walking, and stairs), which were implemented depending on the patient’s physical capacity. The mobility technicians, who were PCNAs, were trained by the PT team. PCNAs have no specific degrees or certification. They are taught safe handling techniques during their job orientation, so they already had an understanding of how to transfer and assist a patient with ambulation. The mobility technician training consisted of one four-hour session run by the PT team in the physical therapy department and the nursing unit. The training included safe handling practices and basic mobility, such as transfers from bed to chair, bed to standing, walking with assistance, and walking independently with equipment such as cane, rolling walker, and walking belt. All instruction was demonstrated by the trainer, and the mobility technician was then able to practice. The mobility technician then shadowed the trainer and practiced the techniques under supervision. Competency was assessed by the trainer.
The cohort of patients randomized to “usual care” was not seen by the mobility technicians but was not otherwise restricted in nursing’s baseline ability to execute recommendations placed by the PT team. Compliance with the recommendations is highly variable and dependent on patient acuity during the shift, staffing issues, and competing duties. Cleveland Clinic promotes a “culture of mobility,” and nurses are encouraged to get patients out of bed and assist with ambulation.
Study Instruments—Measures of Mobility
The six-clicks instrument is a tool for measuring basic mobility. It was adapted from the Activity Measures for Post-Acute Care (AM-PAC) instrument.25 Although initially created for self-report in the post-acute care setting, six-clicks has been validated for use by PTs in the acute care setting26 and is currently in use at more than 1,000 US hospitals. Cleveland Clinic PTs have used this measure for routine evaluation since 2011. The instrument has high interrater reliability and can predict discharge disposition.27-29
Each patient was provided with a tracking device (Fitbit) attached at the wrist to record daily steps for measuring mobility. The use of Fitbit has been validated in ambulatory and inpatient settings.30 The device produces step counts within 3% of the observed step count for most patients but may undercount steps in patients with very slow gait.31 The device was provided to each enrollee and collected at discharge.
Variables
Demographic information, comorbid diagnoses, and discharge destination were extracted from the electronic medical record. Information on prehospitalization physical activity level was obtained from the initial PT assessment. Falls were tracked through the safety event reporting system.
Outcomes
The primary outcomes were discharge disposition and hospital length of stay. The secondary outcomes included average steps per day, change in six-clicks score from admission to discharge, inpatient mortality, admission to ICU, falls, deep vein thrombosis, pulmonary embolism, or pneumonia, and readmission within 30 days.
Statistical Analysis
Patient characteristics were summarized as means and standard deviations or medians and interquartile ranges for continuous variables and as frequencies and percentages for categorical variables. The t-test or Wilcoxon rank sum test was applied to compare continuous characteristics between the intervention and control groups. Chi-squared test or Fisher’s exact test was applied to compare categorical characteristics. Given its skewed distribution, the length of stay was log-transformed and compared between the two groups using Student’s t-test. Chi-squared test was used to compare categorical outcomes. The analysis of final six-clicks scores was adjusted for baseline scores, and the least-square estimates are provided. A linear mixed effects model was used to compare the number of daily steps taken because each participant had multiple steps measured. Results were adjusted for prehospital activity. In addition to comparing the total steps taken by each group, we determined the proportion of patients who exceeded a particular threshold by taking the average number of steps per day for all subjects and relating it to home discharge using the Receiver Operating Characteristics (ROC) curve. An optimal cut-off was determined to maximize the Youden index. We also compared the proportion of patients who exceeded 900 steps because this value was previously reported as an important threshold.32 All analyses were conducted using intention-to-treat principles. We also conducted a per-protocol analysis in which we limited the intervention group to those who received at least one assisted ambulation session. A dose-response analysis was also performed, in which patients were categorized as not receiving the therapy, receiving sessions on one or two days, or receiving them on more than two days.
All analyses were conducted using R-studio (Boston, MA). Statistical significance was defined as a P-value < .05. Given that this is a pilot study, the results were not adjusted for multiple comparisons.
RESULTS
Characteristics of patients in the intervention and control groups are shown in Table 1. The patients were mostly white and female, with an average age in the mid-70s (range 61-98). All measures evaluated were not significantly different between the intervention and control groups. However, more patients in the intervention group had a prehospital activity level classified as independent.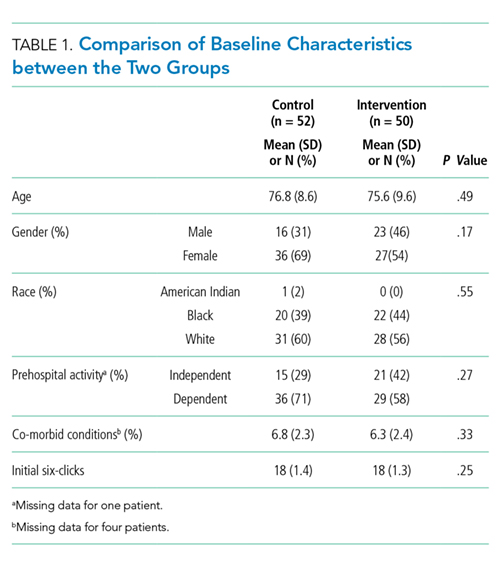
Table 2 demonstrates the feasibility of the intervention. Of patients randomized to the intervention group, 74% were ambulated at least once. Once enrolled, the patients successfully participated in assisted ambulation for about two-thirds of their hospital stay. However, the intervention was delivered for only one-third of the total length of stay because most patients were not enrolled on admission. On average, the mobility technicians made 11 attempts to ambulate each patient and 56% of these attempts were successful. The proportion of unsuccessful attempts did not change over the course of the study. The reasons for unsuccessful attempts included patient refusal (n = 102) or unavailability (n = 68), mobility technicians running out of time (n = 2), and other (n = 12).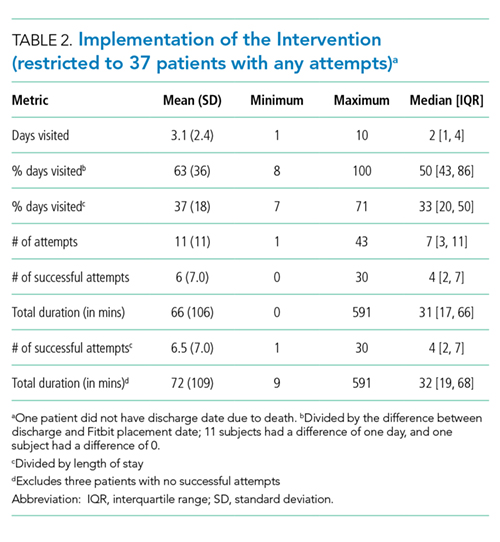
Initially, the mobility technicians were not available on weekends. In addition, they were often reassigned to other duties by their nurse managers, who were dealing with staffing shortages. As the study progressed, we were able to secure the mobility technicians to work seven days per week and to convince the nurse managers that their role should be protected. Consequently, the median number [IQR] of successful attempts increased from 1.5 [0, 2] in the first two months to 3 [0, 5] in the next three months and finally to 5 [1.5, 13] in the final months (P < .002). The median visit duration was 10 minutes, with an interquartile range of 6-15 minutes.
In the intention-to-treat analysis, patients in the intervention group took close to 50% more steps than did the control patients. After adjustment for prehospital activity level, the difference was not statistically significant. The intervention also did not significantly affect the length of stay or discharge disposition (Table 3). In the per protocol analysis, the difference in the step count was significant, even after adjustment. The six-clicks score also significantly increased.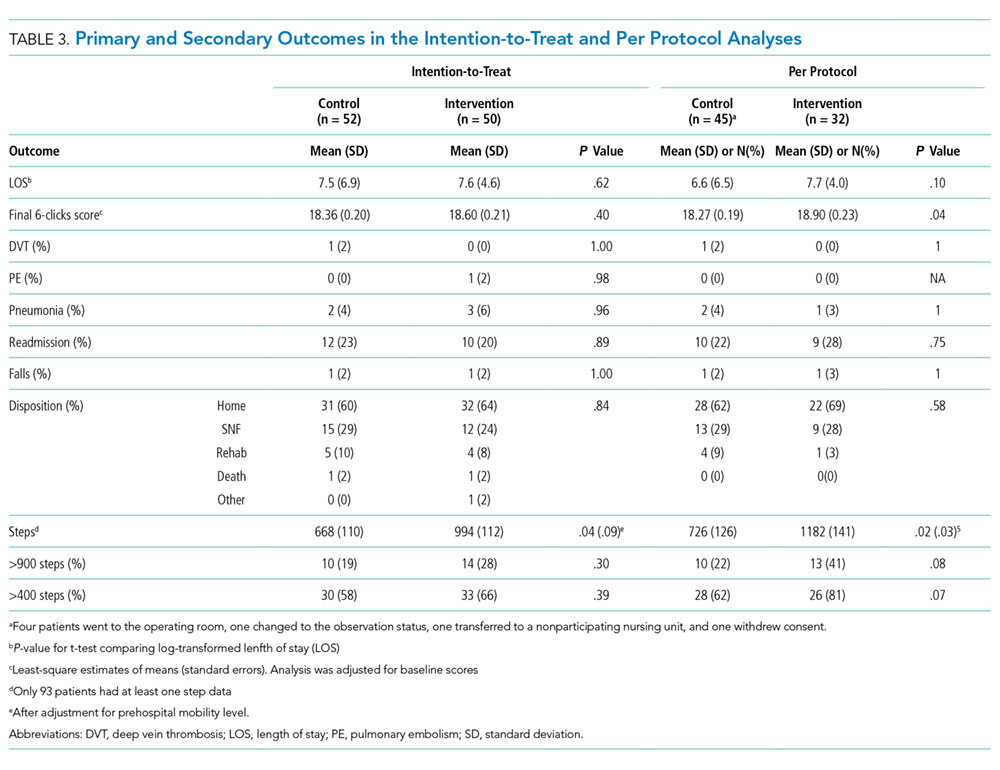
To assess for dose response, we compared outcomes among patients who received no intervention, those who received two or fewer days of intervention, and those who received more than two days of intervention (Table 4). The length of stay was significantly longer in patients with more than two days of intervention, likely reflecting greater opportunities for exposure to the intervention. The longer intervention time significantly increased the six-clicks score.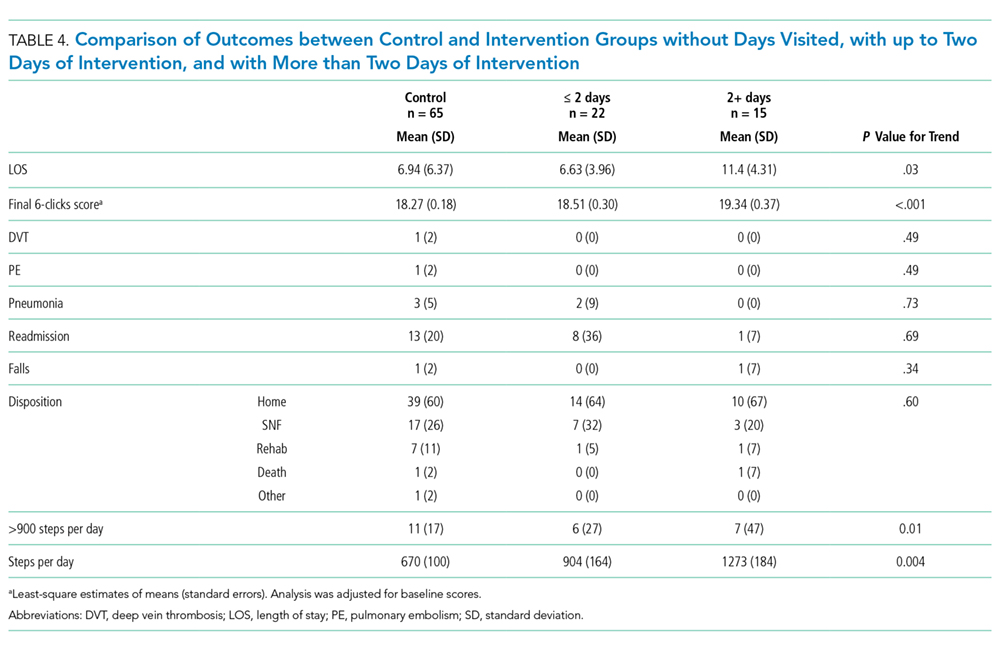
We examined the relationship between steps achieved and discharge disposition. Patients who achieved at least 900 steps more often went home than those who did not (79% vs. 56%, P < .05). The ROC for the model of discharge disposition using steps taken as the only predictor had an area under the curve of 0.67, with optimal discrimination at 411 steps. At a threshold of 400 steps, the model had a sensitivity of 75.9% and a specificity of 51.4%. Patients achieving 400 steps were more likely to go home than those who did not achieve that goal (71% vs. 46%, P =.01). More patients in the intervention group achieved the 900 step goal (28% vs. 19%, P = .30) and the 400 step goal (66% vs. 58%, P = .39), but neither association reached statistical significance.
DISCUSSION
In this pilot study conducted with older medical inpatients, we found that assisted ambulation provided by a dedicated mobility technician was feasible and increased the number of steps taken by patients. Not all patients in the treatment group received the intervention partly due to the fact that the program initially did not include weekends and the mobility technicians were sometimes redirected to other nursing duties. Both issues were addressed during the course of the study. In the per protocol analysis, the intervention increased the average six-clicks score and there was a nonsignificant reduction in the percentage of patients discharged to a rehabilitation facility.
A range of hospital-based mobility interventions have been described. Several of which were complex multidisciplinary interventions that included a mobility component. The compliance rates have ranged from 82% to 93.7%,12,13 although a systematic review noted that many studies do not provide this level of information.11 Interventions were carried out by nursing staff and PT with support from family members and social workers.33-35 Ambulation-specific programs have also relied on nurses and PT13,14,36 and, occasionally, on research assistants to implement assisted ambulation protocols.12,37 A recent study that employed research assistants to deliver inhospital ambulation reported achieving 51.3% of intended walks.37
In contradistinction to previous studies, we created a new role, employing PCNAs as dedicated mobility technicians. We did this for two reasons. First, the approach is less expensive than deploying registered nurses or PTs to ambulate patients and therefore more likely to be adopted by hospitals, especially if it can decrease the cost of an episode of care by avoiding subsequent inpatient rehabilitation. Mobility technicians have no degree or certification requirements and are therefore paid less than nurses or physical therapists. Second, by having a single responsibility, mobility technicians were more likely to engage in their task than nurses, who have competing responsibilities. However, when nurse staffing was short, nurse managers were tempted to recall the PCNAs for other nursing duties. It took time before PCNAs and supervisors prioritized this new responsibility. When they did, the number of attempted walks increased substantially, but the percentage of successful attempts remained constant at 56%, highlighting the difficulty of getting hospitalized patients to walk.
On average, patients who received the intervention engaged in 72 minutes of additional physical activity and averaged 990 steps per day. Observational data suggest patients accrue about 1,100 steps in the day before discharge, with older patients accruing closer to 900.21 One study found that older patients with fewer than 900 steps per day were likely to experience a functional decline.32 We also found that patients who achieved at least 900 steps were more likely to go home. However, we found that a lower threshold, namely, 400 steps, offered better discrimination between patients who go home and those who do not. Future prospective studies are needed to establish the appropriate goal for exercise interventions. A lower step goal could dramatically enhance the efficiency of the intervention.
A Cochrane review found that pooled analysis of multidisciplinary interventions that included exercise, often in the form of walking, achieved a small but significant increase in the proportion of patients discharged to home (RR 1.08, 95%CI 1.03 to 1.14).11 We found no significant change in the discharge disposition, but our study was underpowered for this endpoint. The six-clicks score showed a small but significant change in the per protocol analysis. The six-clicks score has been shown to correlate with discharge disposition,28,29 and an improvement in the score suggests that discharge disposition may be influenced.
The intervention may also not have been implemented for long enough. On average, visits were achieved for one-third of the hospital stay partly because of the delay in PT evaluation, which we required for eligibility. In practice, PT evaluation can occur just a few days before the anticipated discharge. We observed a dose dependent response among patients in the intervention group, suggesting that earlier intervention could be more effective. Earlier intervention might be achieved if the MT performed the six-clicks on potentially eligible patients.
The effects of hospitalization on mobility may be the most pronounced in the long term; one study found that 40% of hospitalized older patients manifested new ADL or IADL disability three months after discharge compared with 31% at discharge.7 Hospital-based mobility interventions may continue to affect subjects’ independence for weeks or months. In one RCT, an inpatient ambulation intervention improved mobility in the community one month after discharge.37 A hospital-based exercise program that included ambulation achieved better functional outcomes one month later.13 One RCT that combined inpatient exercise with outpatient care coordination also decreased readmission rates.34 We found that the intervention did not affect readmission.
This pilot study has several limitations. The sample size was small, and the findings need to be replicated in a larger randomized controlled trial. This is particularly important because the two study arms were not balanced in terms of their prehospital activity. After adjustment for prehospital activity, the differences in the step count in the intention-to-treat analysis were no longer significant. As we adjusted the intervention to hospital workflow, the intervention changed over time. The intention-to-treat analysis may therefore underestimate the effect of the intervention. This work provides a basis for future trial. Finally, discharge disposition depends on a complex interplay of factors, including social factors and preferences, which may not be affected by a mobility intervention.
In summary, an inhospital mobility protocol of attempting ambulation delivered by dedicated mobility technicians three times daily successfully increased the daily step counts and mobility scores of the patients. Studies with a larger sample size are needed to determine whether the proposed approach can affect length of hospital stay, discharge disposition, and overall cost of an episode of care.
Disclosures
Mary Stilphen reports consulting for CreCare and Adeo, which license and distribute AM-PAC short forms, including 6 clicks. All other authors report no conflicts of interest.
Funding
This study was supported by a Research Program Committee grant from the Cleveland Clinic.
1. National Center for Health Statistics. National Hospital Discharge Survey. 2010. PubMed
2. Corcoran PJ. Use it or lose it--the hazards of bed rest and inactivity. West J Med. 1991;154(5):536-538. PubMed
3. Gillick MR, Serrell NA, Gillick LS. Adverse consequences of hospitalization in the elderly. Soc Sci Med. 1982;16(10):1033-1038. doi: 10.1016/0277-9536(82)90175-7. PubMed
4. Hirsch CH, Sommers L, Olsen A, Mullen L, Winograd CH. The natural history of functional morbidity in hospitalized older patients. J Am Geriatr Soc. 1990;38(12):1296-1303. doi: 10.1111/j.1532-5415.1990.tb03451.x. PubMed
5. Zisberg A, Shadmi E, Sinoff G, Gur-Yaish N, Srulovici E, Admi H. Low mobility during hospitalization and functional decline in older adults. J Am Geriatr Soc. 2011;59(2):266-273. doi: 10.1111/j.1532-5415.2010.03276.x. PubMed
6. Heit JA, Silverstein MD, Mohr DN, Petterson TM, O’Fallon WM, Melton LJ, 3rd. Risk factors for deep vein thrombosis and pulmonary embolism: A population-based case-control study. Arch Intern Med. 2000;160(6):809-815. doi: 10.1067/mob.2001.107919. PubMed
7. Sager MA, Franke T, Inouye SK, et al. Functional outcomes of acute medical illness and hospitalization in older persons. Arch Intern Med. 1996;156(6):645-652. doi: 10.1001/archinte.1996.00440060067008. PubMed
8. Campbell AJ, Borrie MJ, Spears GF. Risk factors for falls in a community-based prospective study of people 70 years and older. J Gerontol. 1989;44(4):M112-M117. doi: 10.1093/geronj/44.4.M112. PubMed
9. Fisher SR, Kuo YF, Graham JE, Ottenbacher KJ, Ostir GV. Early ambulation and length of stay in older adults hospitalized for acute illness. Arch Intern Med. 2010;170(21):1942-1943. doi: 0.1001/archinternmed.2010.422. PubMed
10. Graf C. Functional decline in hospitalized older adults. Am J Nurs. 2006;106(1):58-67, quiz 67-58. PubMed
11. de Morton NA, Keating JL, Jeffs K. Exercise for acutely hospitalised older medical patients. Cochrane Database Syst Rev. 2007(1):CD005955. doi: 10.1002/14651858.CD005955. PubMed
12. Jones CT, Lowe AJ, MacGregor L, Brand CA, Tweddle N, Russell DM. A randomised controlled trial of an exercise intervention to reduce functional decline and health service utilisation in the hospitalised elderly. Australas J Ageing. 2006;25(3):126-133. doi: 10.1111/j.1741-6612.2006.00167.x.
13. Siebens H, Aronow H, Edwards D, Ghasemi Z. A randomized controlled trial of exercise to improve outcomes of acute hospitalization in older adults. J Am Geriatr Soc. 2000;48(12):1545-1552. doi: 10.1111/j.1532-5415.2000.tb03862.x. PubMed
14. Mundy LM, Leet TL, Darst K, Schnitzler MA, Dunagan WC. Early mobilization of patients hospitalized with community-acquired pneumonia. Chest. 2003;124(3):883-889. doi: 10.1378/chest.124.3.883. PubMed
15. Brown CJ, Redden DT, Flood KL, Allman RM. The underrecognized epidemic of low mobility during hospitalization of older adults. J Am Geriatr Soc. 2009;57(9):1660-1665. doi: 10.1111/j.1532-5415.2009.02393.x. PubMed
16. Callen BL, Mahoney JE, Grieves CB, Wells TJ, Enloe M. Frequency of hallway ambulation by hospitalized older adults on medical units of an academic hospital. Geriatr Nurs. 2004;25(4):212-217. doi: 10.1016/j.gerinurse.2004.06.016. PubMed
17. Fisher SR, Goodwin JS, Protas EJ, et al. Ambulatory activity of older adults hospitalized with acute medical illness. J Am Geriatr Soc. 2011;59(1):91-95. doi: 10.1111/j.1532-5415.2010.03202.x. PubMed
18. McVey LJ, Becker PM, Saltz CC, Feussner JR, Cohen HJ. Effect of a geriatric consultation team on functional status of elderly hospitalized patients: A randomized, controlled clinical trial. Ann Intern Med. 1989;110(1):79-84. doi: PubMed
19. Said CM, Morris ME, Woodward M, Churilov L, Bernhardt J. Enhancing physical activity in older adults receiving hospital based rehabilitation: A phase II feasibility study. BMC Geriatr. 2012;12:26. doi: 10.1186/1471-2318-12-26. PubMed
20. Timmerman RA. A mobility protocol for critically ill adults. Dimens Crit Care Nurs. 2007;26(5):175-179; quiz 180-171. doi: 10.1097/01.DCC.0000286816.40570.da. PubMed
21. Sallis R, Roddy-Sturm Y, Chijioke E, et al. Stepping toward discharge: Level of ambulation in hospitalized patients. J Hosp Med. 2015;10(6):384-389. doi: 10.1002/jhm.2343. PubMed
22. Inouye SK, Wagner DR, Acampora D, Horwitz RI, Cooney LM, Jr., Tinetii ME. A controlled trial of a nursing-centered intervention in hospitalized elderly medical patients: The yale geriatric care program. J Am Geriatr Soc. 1993;41(12):1353-1360. doi: 10.1111/j.1532-5415.1993.tb06487.x. PubMed
23. Kalisch BJ, Landstrom GL, Hinshaw AS. Missed nursing care: A concept analysis. J Adv Nurs. 2009;65(7):1509-1517. doi: 10.1111/j.1365-2648.2009.05027.x. PubMed
24. Kalisch BJ, Tschannen D, Lee H, Friese CR. Hospital variation in missed nursing care. Am J Med Qual. 2011;26(4):291-299. doi: 10.1177/1062860610395929. PubMed
25. Haley SM, Coster WJ, Andres PL, et al. Activity outcome measurement for postacute care. Med Care. 2004;42(1 Suppl):I49-161. doi: 10.1097/01.mlr.0000103520.43902.6c. PubMed
26. Jette DU, Stilphen M, Ranganathan VK, Passek SD, Frost FS, Jette AM. Validity of the AM-PAC “6-Clicks” inpatient daily activity and basic mobility short forms. Phys Ther. 2014;94(3):379-391. doi: 10.2522/ptj.20130199. PubMed
27. Jette DU, Stilphen M, Ranganathan VK, Passek S, Frost FS, Jette AM. Interrater reliability of AM-PAC 6-Clicks” basic mobility and daily activity short forms. Phys Ther. 2015;95(5):758-766. doi: 10.2522/ptj.20140174. PubMed
28. Jette DU, Stilphen M, Ranganathan VK, Passek SD, Frost FS, Jette AM. AM-PAC “6-Clicks” functional assessment scores predict acute care hospital discharge destination. Phys Ther. 2014;94(9):1252-1261. doi: 10.2522/ptj.20130359. PubMed
29. Menendez ME, Schumacher CS, Ring D, Freiberg AA, Rubash HE, Kwon YM. Does “6-Clicks” day 1 postoperative mobility score predict discharge disposition after total hip and knee arthroplasties? J Arthroplasty. 2016;31(9):1916-1920. doi: 10.1016/j.arth.2016.02.017. PubMed
30. Feehan LM, Geldman J, Sayre EC, et al. Accuracy of fitbit devices: Systematic review and narrative syntheses of quantitative data. JMIR Mhealth Uhealth. 2018;6(8):e10527-e10527. doi: 10.2196/10527. PubMed
31. Treacy D, Hassett L, Schurr K, Chagpar S, Paul SS, Sherrington C. Validity of different activity monitors to count steps in an inpatient rehabilitation setting. Phys Ther. 2017;97(5):581-588. doi: 10.1093/ptj/pzx010. PubMed
32. Agmon M, Zisberg A, Gil E, Rand D, Gur-Yaish N, Azriel M. Association between 900 steps a day and functional decline in older hospitalized patients. JAMA Intern Med. 2017;177(2):272-274. doi: 10.1001/jamainternmed.2016.7266. PubMed
33. Counsell SR, Holder CM, Liebenauer LL, et al. Effects of a multicomponent intervention on functional outcomes and process of care in hospitalized older patients: a randomized controlled trial of Acute Care for Elders (ACE) in a community hospital. J Am Geriatr Soc. 2000;48(12):1572-1581. doi: 10.1111/j.1532-5415.2000.tb03866.x. PubMed
34. Courtney M, Edwards H, Chang A, Parker A, Finlayson K, Hamilton K. Fewer emergency readmissions and better quality of life for older adults at risk of hospital readmission: a randomized controlled trial to determine the effectiveness of a 24-week exercise and telephone follow-up program. J Am Geriatr Soc. 2009;57(3):395-402. doi: 10.1111/j.1532-5415.2009.02138.x. PubMed
35. Landefeld CS, Palmer RM, Kresevic DM, Fortinsky RH, Kowal J. A randomized trial of care in a hospital medical unit especially designed to improve the functional outcomes of acutely ill older patients. N Engl J Med. 1995;332(20):1338-1344. doi: 10.1056/NEJM199505183322006. PubMed
36. Hoyer EH, Friedman M, Lavezza A, et al. Promoting mobility and reducing length of stay in hospitalized general medicine patients: A quality-improvement project. J Hosp Med. 2016;11(5):341-347. doi: 10.1002/jhm.2546. PubMed
37. Brown CJ, Foley KT, Lowman JD, Jr., et al. comparison of posthospitalization function and community mobility in hospital mobility program and usual care patients: a randomized clinical trial. JAMA Intern Med. 2016;176(7):921-927. doi: 10.1001/jamainternmed.2016.1870. PubMed
Individuals aged 65 years and over represent 13% of the United States population and account for nearly 40% of hospital discharges.1 Bedrest hastens the functional decline of older patients2-5 and is associated with risk of serious complications, such as falls, delirium, venous thrombosis, and skin breakdown.6,7 Ambulation is widely recognized as important for improving hospital outcomes.8-10 Observational studies suggest that increases of 600 steps per day are associated with shortened length of hospital stay.9 However, randomized trials of assisted ambulation have not demonstrated consistent benefit.11-14 As a result, usual care at most hospitals in the United States does not include assisted ambulation. Even when ambulation is ordered, execution of the orders is inconsistent.15-17
Studies have demonstrated the benefits of various exercise protocols for older patients in rehabilitation facilities,18,19 medical intensive care units,20 and medical and surgical wards.13,18,21 These interventions are usually nursing centered; however, assisting patients with ambulation multiple times per day may be a burdensome addition to the myriad responsibilities of nurses.19,22,23 In fact, ambulation orders are the most frequently overlooked nursing task.24
We designed a graded protocol of assisted ambulation implemented by a dedicated patient care nursing assistant (PCNA) multiple times daily to increase patient mobility. The objective of this study was to assess the feasibility and effectiveness of such an intervention for older inpatients. We hypothesized that the intervention would prove feasible and improve hospital outcomes, including less need for inpatient rehabilitation and shorter length of stay.
METHODS
We conducted a single-blind randomized controlled trial of patients aged ≥60 years and admitted as medical inpatients to the Cleveland Clinic Main Campus, a tertiary care center with over 1,440 inpatient beds. The consent form and study protocol were approved by the Cleveland Clinic Institutional Review Board, and the study was registered with ClinicalTrials.gov (NCT02757131).
Patients
All patients who were admitted to study wards for a medical illness and evaluated by Physical Therapy (PT) were eligible for the study. PT evaluations were ordered by the medical team if deemed necessary on the basis of factors, such as age, estimated mobility, and concerns raised by the ancillary staff. All patients who were expected to be discharged to a skilled nursing facility placement or who required home PT received a PT evaluation. Assessment of mobility was documented via Activity Measure for Postacute Care Inpatient Basic Mobility “six-clicks” short form, hereafter abbreviated as “six-clicks.” Based on past experience, patients with scores <16 rarely go home (<20% of the time), and those with scores >20 usually go home regardless of ambulation. Therefore, only patients with scores of 16-20 were invited to participate in the study. Although patients who were not evaluated by PT might also benefit from the intervention, we required a six-clicks score to assess eligibility. The exclusion criteria included anticipated remaining length of stay less than three days, admission under observation status, admission to the intensive care unit (ICU,) patients receiving comfort care measures, and patients with medical conditions precluding ambulation, such as decompensated heart failure or unstable angina.
Randomization
Patients were randomized to “usual care” or “mobility technician” after baseline evaluation using a computerized system. A block randomization scheme with a size of four was used to ensure an approximately equal number of patients per group.
Intervention
Patients randomized to the intervention group were asked to participate in the ambulation protocol outlined by the PT three times daily under the supervision of the mobility technician. The protocol involved four exercise levels (sitting, standing, walking, and stairs), which were implemented depending on the patient’s physical capacity. The mobility technicians, who were PCNAs, were trained by the PT team. PCNAs have no specific degrees or certification. They are taught safe handling techniques during their job orientation, so they already had an understanding of how to transfer and assist a patient with ambulation. The mobility technician training consisted of one four-hour session run by the PT team in the physical therapy department and the nursing unit. The training included safe handling practices and basic mobility, such as transfers from bed to chair, bed to standing, walking with assistance, and walking independently with equipment such as cane, rolling walker, and walking belt. All instruction was demonstrated by the trainer, and the mobility technician was then able to practice. The mobility technician then shadowed the trainer and practiced the techniques under supervision. Competency was assessed by the trainer.
The cohort of patients randomized to “usual care” was not seen by the mobility technicians but was not otherwise restricted in nursing’s baseline ability to execute recommendations placed by the PT team. Compliance with the recommendations is highly variable and dependent on patient acuity during the shift, staffing issues, and competing duties. Cleveland Clinic promotes a “culture of mobility,” and nurses are encouraged to get patients out of bed and assist with ambulation.
Study Instruments—Measures of Mobility
The six-clicks instrument is a tool for measuring basic mobility. It was adapted from the Activity Measures for Post-Acute Care (AM-PAC) instrument.25 Although initially created for self-report in the post-acute care setting, six-clicks has been validated for use by PTs in the acute care setting26 and is currently in use at more than 1,000 US hospitals. Cleveland Clinic PTs have used this measure for routine evaluation since 2011. The instrument has high interrater reliability and can predict discharge disposition.27-29
Each patient was provided with a tracking device (Fitbit) attached at the wrist to record daily steps for measuring mobility. The use of Fitbit has been validated in ambulatory and inpatient settings.30 The device produces step counts within 3% of the observed step count for most patients but may undercount steps in patients with very slow gait.31 The device was provided to each enrollee and collected at discharge.
Variables
Demographic information, comorbid diagnoses, and discharge destination were extracted from the electronic medical record. Information on prehospitalization physical activity level was obtained from the initial PT assessment. Falls were tracked through the safety event reporting system.
Outcomes
The primary outcomes were discharge disposition and hospital length of stay. The secondary outcomes included average steps per day, change in six-clicks score from admission to discharge, inpatient mortality, admission to ICU, falls, deep vein thrombosis, pulmonary embolism, or pneumonia, and readmission within 30 days.
Statistical Analysis
Patient characteristics were summarized as means and standard deviations or medians and interquartile ranges for continuous variables and as frequencies and percentages for categorical variables. The t-test or Wilcoxon rank sum test was applied to compare continuous characteristics between the intervention and control groups. Chi-squared test or Fisher’s exact test was applied to compare categorical characteristics. Given its skewed distribution, the length of stay was log-transformed and compared between the two groups using Student’s t-test. Chi-squared test was used to compare categorical outcomes. The analysis of final six-clicks scores was adjusted for baseline scores, and the least-square estimates are provided. A linear mixed effects model was used to compare the number of daily steps taken because each participant had multiple steps measured. Results were adjusted for prehospital activity. In addition to comparing the total steps taken by each group, we determined the proportion of patients who exceeded a particular threshold by taking the average number of steps per day for all subjects and relating it to home discharge using the Receiver Operating Characteristics (ROC) curve. An optimal cut-off was determined to maximize the Youden index. We also compared the proportion of patients who exceeded 900 steps because this value was previously reported as an important threshold.32 All analyses were conducted using intention-to-treat principles. We also conducted a per-protocol analysis in which we limited the intervention group to those who received at least one assisted ambulation session. A dose-response analysis was also performed, in which patients were categorized as not receiving the therapy, receiving sessions on one or two days, or receiving them on more than two days.
All analyses were conducted using R-studio (Boston, MA). Statistical significance was defined as a P-value < .05. Given that this is a pilot study, the results were not adjusted for multiple comparisons.
RESULTS
Characteristics of patients in the intervention and control groups are shown in Table 1. The patients were mostly white and female, with an average age in the mid-70s (range 61-98). All measures evaluated were not significantly different between the intervention and control groups. However, more patients in the intervention group had a prehospital activity level classified as independent.
Table 2 demonstrates the feasibility of the intervention. Of patients randomized to the intervention group, 74% were ambulated at least once. Once enrolled, the patients successfully participated in assisted ambulation for about two-thirds of their hospital stay. However, the intervention was delivered for only one-third of the total length of stay because most patients were not enrolled on admission. On average, the mobility technicians made 11 attempts to ambulate each patient and 56% of these attempts were successful. The proportion of unsuccessful attempts did not change over the course of the study. The reasons for unsuccessful attempts included patient refusal (n = 102) or unavailability (n = 68), mobility technicians running out of time (n = 2), and other (n = 12).
Initially, the mobility technicians were not available on weekends. In addition, they were often reassigned to other duties by their nurse managers, who were dealing with staffing shortages. As the study progressed, we were able to secure the mobility technicians to work seven days per week and to convince the nurse managers that their role should be protected. Consequently, the median number [IQR] of successful attempts increased from 1.5 [0, 2] in the first two months to 3 [0, 5] in the next three months and finally to 5 [1.5, 13] in the final months (P < .002). The median visit duration was 10 minutes, with an interquartile range of 6-15 minutes.
In the intention-to-treat analysis, patients in the intervention group took close to 50% more steps than did the control patients. After adjustment for prehospital activity level, the difference was not statistically significant. The intervention also did not significantly affect the length of stay or discharge disposition (Table 3). In the per protocol analysis, the difference in the step count was significant, even after adjustment. The six-clicks score also significantly increased.
To assess for dose response, we compared outcomes among patients who received no intervention, those who received two or fewer days of intervention, and those who received more than two days of intervention (Table 4). The length of stay was significantly longer in patients with more than two days of intervention, likely reflecting greater opportunities for exposure to the intervention. The longer intervention time significantly increased the six-clicks score.
We examined the relationship between steps achieved and discharge disposition. Patients who achieved at least 900 steps more often went home than those who did not (79% vs. 56%, P < .05). The ROC for the model of discharge disposition using steps taken as the only predictor had an area under the curve of 0.67, with optimal discrimination at 411 steps. At a threshold of 400 steps, the model had a sensitivity of 75.9% and a specificity of 51.4%. Patients achieving 400 steps were more likely to go home than those who did not achieve that goal (71% vs. 46%, P =.01). More patients in the intervention group achieved the 900 step goal (28% vs. 19%, P = .30) and the 400 step goal (66% vs. 58%, P = .39), but neither association reached statistical significance.
DISCUSSION
In this pilot study conducted with older medical inpatients, we found that assisted ambulation provided by a dedicated mobility technician was feasible and increased the number of steps taken by patients. Not all patients in the treatment group received the intervention partly due to the fact that the program initially did not include weekends and the mobility technicians were sometimes redirected to other nursing duties. Both issues were addressed during the course of the study. In the per protocol analysis, the intervention increased the average six-clicks score and there was a nonsignificant reduction in the percentage of patients discharged to a rehabilitation facility.
A range of hospital-based mobility interventions have been described. Several of which were complex multidisciplinary interventions that included a mobility component. The compliance rates have ranged from 82% to 93.7%,12,13 although a systematic review noted that many studies do not provide this level of information.11 Interventions were carried out by nursing staff and PT with support from family members and social workers.33-35 Ambulation-specific programs have also relied on nurses and PT13,14,36 and, occasionally, on research assistants to implement assisted ambulation protocols.12,37 A recent study that employed research assistants to deliver inhospital ambulation reported achieving 51.3% of intended walks.37
In contradistinction to previous studies, we created a new role, employing PCNAs as dedicated mobility technicians. We did this for two reasons. First, the approach is less expensive than deploying registered nurses or PTs to ambulate patients and therefore more likely to be adopted by hospitals, especially if it can decrease the cost of an episode of care by avoiding subsequent inpatient rehabilitation. Mobility technicians have no degree or certification requirements and are therefore paid less than nurses or physical therapists. Second, by having a single responsibility, mobility technicians were more likely to engage in their task than nurses, who have competing responsibilities. However, when nurse staffing was short, nurse managers were tempted to recall the PCNAs for other nursing duties. It took time before PCNAs and supervisors prioritized this new responsibility. When they did, the number of attempted walks increased substantially, but the percentage of successful attempts remained constant at 56%, highlighting the difficulty of getting hospitalized patients to walk.
On average, patients who received the intervention engaged in 72 minutes of additional physical activity and averaged 990 steps per day. Observational data suggest patients accrue about 1,100 steps in the day before discharge, with older patients accruing closer to 900.21 One study found that older patients with fewer than 900 steps per day were likely to experience a functional decline.32 We also found that patients who achieved at least 900 steps were more likely to go home. However, we found that a lower threshold, namely, 400 steps, offered better discrimination between patients who go home and those who do not. Future prospective studies are needed to establish the appropriate goal for exercise interventions. A lower step goal could dramatically enhance the efficiency of the intervention.
A Cochrane review found that pooled analysis of multidisciplinary interventions that included exercise, often in the form of walking, achieved a small but significant increase in the proportion of patients discharged to home (RR 1.08, 95%CI 1.03 to 1.14).11 We found no significant change in the discharge disposition, but our study was underpowered for this endpoint. The six-clicks score showed a small but significant change in the per protocol analysis. The six-clicks score has been shown to correlate with discharge disposition,28,29 and an improvement in the score suggests that discharge disposition may be influenced.
The intervention may also not have been implemented for long enough. On average, visits were achieved for one-third of the hospital stay partly because of the delay in PT evaluation, which we required for eligibility. In practice, PT evaluation can occur just a few days before the anticipated discharge. We observed a dose dependent response among patients in the intervention group, suggesting that earlier intervention could be more effective. Earlier intervention might be achieved if the MT performed the six-clicks on potentially eligible patients.
The effects of hospitalization on mobility may be the most pronounced in the long term; one study found that 40% of hospitalized older patients manifested new ADL or IADL disability three months after discharge compared with 31% at discharge.7 Hospital-based mobility interventions may continue to affect subjects’ independence for weeks or months. In one RCT, an inpatient ambulation intervention improved mobility in the community one month after discharge.37 A hospital-based exercise program that included ambulation achieved better functional outcomes one month later.13 One RCT that combined inpatient exercise with outpatient care coordination also decreased readmission rates.34 We found that the intervention did not affect readmission.
This pilot study has several limitations. The sample size was small, and the findings need to be replicated in a larger randomized controlled trial. This is particularly important because the two study arms were not balanced in terms of their prehospital activity. After adjustment for prehospital activity, the differences in the step count in the intention-to-treat analysis were no longer significant. As we adjusted the intervention to hospital workflow, the intervention changed over time. The intention-to-treat analysis may therefore underestimate the effect of the intervention. This work provides a basis for future trial. Finally, discharge disposition depends on a complex interplay of factors, including social factors and preferences, which may not be affected by a mobility intervention.
In summary, an inhospital mobility protocol of attempting ambulation delivered by dedicated mobility technicians three times daily successfully increased the daily step counts and mobility scores of the patients. Studies with a larger sample size are needed to determine whether the proposed approach can affect length of hospital stay, discharge disposition, and overall cost of an episode of care.
Disclosures
Mary Stilphen reports consulting for CreCare and Adeo, which license and distribute AM-PAC short forms, including 6 clicks. All other authors report no conflicts of interest.
Funding
This study was supported by a Research Program Committee grant from the Cleveland Clinic.
1. National Center for Health Statistics. National Hospital Discharge Survey. 2010. PubMed
2. Corcoran PJ. Use it or lose it--the hazards of bed rest and inactivity. West J Med. 1991;154(5):536-538. PubMed
3. Gillick MR, Serrell NA, Gillick LS. Adverse consequences of hospitalization in the elderly. Soc Sci Med. 1982;16(10):1033-1038. doi: 10.1016/0277-9536(82)90175-7. PubMed
4. Hirsch CH, Sommers L, Olsen A, Mullen L, Winograd CH. The natural history of functional morbidity in hospitalized older patients. J Am Geriatr Soc. 1990;38(12):1296-1303. doi: 10.1111/j.1532-5415.1990.tb03451.x. PubMed
5. Zisberg A, Shadmi E, Sinoff G, Gur-Yaish N, Srulovici E, Admi H. Low mobility during hospitalization and functional decline in older adults. J Am Geriatr Soc. 2011;59(2):266-273. doi: 10.1111/j.1532-5415.2010.03276.x. PubMed
6. Heit JA, Silverstein MD, Mohr DN, Petterson TM, O’Fallon WM, Melton LJ, 3rd. Risk factors for deep vein thrombosis and pulmonary embolism: A population-based case-control study. Arch Intern Med. 2000;160(6):809-815. doi: 10.1067/mob.2001.107919. PubMed
7. Sager MA, Franke T, Inouye SK, et al. Functional outcomes of acute medical illness and hospitalization in older persons. Arch Intern Med. 1996;156(6):645-652. doi: 10.1001/archinte.1996.00440060067008. PubMed
8. Campbell AJ, Borrie MJ, Spears GF. Risk factors for falls in a community-based prospective study of people 70 years and older. J Gerontol. 1989;44(4):M112-M117. doi: 10.1093/geronj/44.4.M112. PubMed
9. Fisher SR, Kuo YF, Graham JE, Ottenbacher KJ, Ostir GV. Early ambulation and length of stay in older adults hospitalized for acute illness. Arch Intern Med. 2010;170(21):1942-1943. doi: 0.1001/archinternmed.2010.422. PubMed
10. Graf C. Functional decline in hospitalized older adults. Am J Nurs. 2006;106(1):58-67, quiz 67-58. PubMed
11. de Morton NA, Keating JL, Jeffs K. Exercise for acutely hospitalised older medical patients. Cochrane Database Syst Rev. 2007(1):CD005955. doi: 10.1002/14651858.CD005955. PubMed
12. Jones CT, Lowe AJ, MacGregor L, Brand CA, Tweddle N, Russell DM. A randomised controlled trial of an exercise intervention to reduce functional decline and health service utilisation in the hospitalised elderly. Australas J Ageing. 2006;25(3):126-133. doi: 10.1111/j.1741-6612.2006.00167.x.
13. Siebens H, Aronow H, Edwards D, Ghasemi Z. A randomized controlled trial of exercise to improve outcomes of acute hospitalization in older adults. J Am Geriatr Soc. 2000;48(12):1545-1552. doi: 10.1111/j.1532-5415.2000.tb03862.x. PubMed
14. Mundy LM, Leet TL, Darst K, Schnitzler MA, Dunagan WC. Early mobilization of patients hospitalized with community-acquired pneumonia. Chest. 2003;124(3):883-889. doi: 10.1378/chest.124.3.883. PubMed
15. Brown CJ, Redden DT, Flood KL, Allman RM. The underrecognized epidemic of low mobility during hospitalization of older adults. J Am Geriatr Soc. 2009;57(9):1660-1665. doi: 10.1111/j.1532-5415.2009.02393.x. PubMed
16. Callen BL, Mahoney JE, Grieves CB, Wells TJ, Enloe M. Frequency of hallway ambulation by hospitalized older adults on medical units of an academic hospital. Geriatr Nurs. 2004;25(4):212-217. doi: 10.1016/j.gerinurse.2004.06.016. PubMed
17. Fisher SR, Goodwin JS, Protas EJ, et al. Ambulatory activity of older adults hospitalized with acute medical illness. J Am Geriatr Soc. 2011;59(1):91-95. doi: 10.1111/j.1532-5415.2010.03202.x. PubMed
18. McVey LJ, Becker PM, Saltz CC, Feussner JR, Cohen HJ. Effect of a geriatric consultation team on functional status of elderly hospitalized patients: A randomized, controlled clinical trial. Ann Intern Med. 1989;110(1):79-84. doi: PubMed
19. Said CM, Morris ME, Woodward M, Churilov L, Bernhardt J. Enhancing physical activity in older adults receiving hospital based rehabilitation: A phase II feasibility study. BMC Geriatr. 2012;12:26. doi: 10.1186/1471-2318-12-26. PubMed
20. Timmerman RA. A mobility protocol for critically ill adults. Dimens Crit Care Nurs. 2007;26(5):175-179; quiz 180-171. doi: 10.1097/01.DCC.0000286816.40570.da. PubMed
21. Sallis R, Roddy-Sturm Y, Chijioke E, et al. Stepping toward discharge: Level of ambulation in hospitalized patients. J Hosp Med. 2015;10(6):384-389. doi: 10.1002/jhm.2343. PubMed
22. Inouye SK, Wagner DR, Acampora D, Horwitz RI, Cooney LM, Jr., Tinetii ME. A controlled trial of a nursing-centered intervention in hospitalized elderly medical patients: The yale geriatric care program. J Am Geriatr Soc. 1993;41(12):1353-1360. doi: 10.1111/j.1532-5415.1993.tb06487.x. PubMed
23. Kalisch BJ, Landstrom GL, Hinshaw AS. Missed nursing care: A concept analysis. J Adv Nurs. 2009;65(7):1509-1517. doi: 10.1111/j.1365-2648.2009.05027.x. PubMed
24. Kalisch BJ, Tschannen D, Lee H, Friese CR. Hospital variation in missed nursing care. Am J Med Qual. 2011;26(4):291-299. doi: 10.1177/1062860610395929. PubMed
25. Haley SM, Coster WJ, Andres PL, et al. Activity outcome measurement for postacute care. Med Care. 2004;42(1 Suppl):I49-161. doi: 10.1097/01.mlr.0000103520.43902.6c. PubMed
26. Jette DU, Stilphen M, Ranganathan VK, Passek SD, Frost FS, Jette AM. Validity of the AM-PAC “6-Clicks” inpatient daily activity and basic mobility short forms. Phys Ther. 2014;94(3):379-391. doi: 10.2522/ptj.20130199. PubMed
27. Jette DU, Stilphen M, Ranganathan VK, Passek S, Frost FS, Jette AM. Interrater reliability of AM-PAC 6-Clicks” basic mobility and daily activity short forms. Phys Ther. 2015;95(5):758-766. doi: 10.2522/ptj.20140174. PubMed
28. Jette DU, Stilphen M, Ranganathan VK, Passek SD, Frost FS, Jette AM. AM-PAC “6-Clicks” functional assessment scores predict acute care hospital discharge destination. Phys Ther. 2014;94(9):1252-1261. doi: 10.2522/ptj.20130359. PubMed
29. Menendez ME, Schumacher CS, Ring D, Freiberg AA, Rubash HE, Kwon YM. Does “6-Clicks” day 1 postoperative mobility score predict discharge disposition after total hip and knee arthroplasties? J Arthroplasty. 2016;31(9):1916-1920. doi: 10.1016/j.arth.2016.02.017. PubMed
30. Feehan LM, Geldman J, Sayre EC, et al. Accuracy of fitbit devices: Systematic review and narrative syntheses of quantitative data. JMIR Mhealth Uhealth. 2018;6(8):e10527-e10527. doi: 10.2196/10527. PubMed
31. Treacy D, Hassett L, Schurr K, Chagpar S, Paul SS, Sherrington C. Validity of different activity monitors to count steps in an inpatient rehabilitation setting. Phys Ther. 2017;97(5):581-588. doi: 10.1093/ptj/pzx010. PubMed
32. Agmon M, Zisberg A, Gil E, Rand D, Gur-Yaish N, Azriel M. Association between 900 steps a day and functional decline in older hospitalized patients. JAMA Intern Med. 2017;177(2):272-274. doi: 10.1001/jamainternmed.2016.7266. PubMed
33. Counsell SR, Holder CM, Liebenauer LL, et al. Effects of a multicomponent intervention on functional outcomes and process of care in hospitalized older patients: a randomized controlled trial of Acute Care for Elders (ACE) in a community hospital. J Am Geriatr Soc. 2000;48(12):1572-1581. doi: 10.1111/j.1532-5415.2000.tb03866.x. PubMed
34. Courtney M, Edwards H, Chang A, Parker A, Finlayson K, Hamilton K. Fewer emergency readmissions and better quality of life for older adults at risk of hospital readmission: a randomized controlled trial to determine the effectiveness of a 24-week exercise and telephone follow-up program. J Am Geriatr Soc. 2009;57(3):395-402. doi: 10.1111/j.1532-5415.2009.02138.x. PubMed
35. Landefeld CS, Palmer RM, Kresevic DM, Fortinsky RH, Kowal J. A randomized trial of care in a hospital medical unit especially designed to improve the functional outcomes of acutely ill older patients. N Engl J Med. 1995;332(20):1338-1344. doi: 10.1056/NEJM199505183322006. PubMed
36. Hoyer EH, Friedman M, Lavezza A, et al. Promoting mobility and reducing length of stay in hospitalized general medicine patients: A quality-improvement project. J Hosp Med. 2016;11(5):341-347. doi: 10.1002/jhm.2546. PubMed
37. Brown CJ, Foley KT, Lowman JD, Jr., et al. comparison of posthospitalization function and community mobility in hospital mobility program and usual care patients: a randomized clinical trial. JAMA Intern Med. 2016;176(7):921-927. doi: 10.1001/jamainternmed.2016.1870. PubMed
© 2019 Society of Hospital Medicine
Examining the Utility of 30-day Readmission Rates and Hospital Profiling in the Veterans Health Administration
Using methodology created by the Centers for Medicare & Medicaid Services (CMS), the Department of Veterans Affairs (VA) calculates and reports hospital performance measures for several key conditions, including acute myocardial infarction (AMI), heart failure (HF), and pneumonia.1 These measures are designed to benchmark individual hospitals against how average hospitals perform when caring for a similar case-mix index. Because readmissions to the hospital within 30-days of discharge are common and costly, this metric has garnered extensive attention in recent years.
To summarize the 30-day readmission metric, the VA utilizes the Strategic Analytics for Improvement and Learning (SAIL) system to present internally its findings to VA practitioners and leadership.2 The VA provides these data as a means to drive quality improvement and allow for comparison of individual hospitals’ performance across measures throughout the VA healthcare system. Since 2010, the VA began using and publicly reporting the CMS-derived 30-day Risk-Stratified Readmission Rate (RSRR) on the Hospital Compare website.3 Similar to CMS, the VA uses three years of combined data so that patients, providers, and other stakeholders can compare individual hospitals’ performance across these measures.1 In response to this, hospitals and healthcare organizations have implemented quality improvement and large-scale programmatic interventions in an attempt to improve quality around readmissions.4-6 A recent assessment on how hospitals within the Medicare fee-for-service program have responded to such reporting found large degrees of variability, with more than half of the participating institutions facing penalties due to greater-than-expected readmission rates.5 Although the VA utilizes the same CMS-derived model in its assessments and reporting, the variability and distribution around this metric are not publicly reported—thus making it difficult to ascertain how individual VA hospitals compare with one another. Without such information, individual facilities may not know how to benchmark the quality of their care to others, nor would the VA recognize which interventions addressing readmissions are working, and which are not. Although previous assessments of interinstitutional variance have been performed in Medicare populations,7 a focused analysis of such variance within the VA has yet to be performed.
In this study, we performed a multiyear assessment of the CMS-derived 30-day RSRR metric for AMI, HF, and pneumonia as a useful measure to drive VA quality improvement or distinguish VA facility performance based on its ability to detect interfacility variability.
METHODS
Data Source
We used VA administrative and Medicare claims data from 2010 to 2012. After identifying index hospitalizations to VA hospitals, we obtained patients’ respective inpatient Medicare claims data from the Medicare Provider Analysis and Review (MedPAR) and Outpatient files. All Medicare records were linked to VA records via scrambled Social Security numbers and were provided by the VA Information Resource Center. This study was approved by the San Francisco VA Medical Center Institutional Review Board.
Study Sample
Our cohort consisted of hospitalized VA beneficiary and Medicare fee-for-service patients who were aged ≥65 years and admitted to and discharged from a VA acute care center with a primary discharge diagnosis of AMI, HF, or pneumonia. These comorbidities were chosen as they are publicly reported and frequently used for interfacility comparisons. Because studies have found that inclusion of secondary payer data (ie, CMS data) may affect hospital-profiling outcomes, we included Medicare data on all available patients.8 We excluded hospitalizations that resulted in a transfer to another acute care facility and those admitted to observation status at their index admission. To ensure a full year of data for risk adjustment, beneficiaries were included only if they were enrolled in Medicare for 12 months prior to and including the date of the index admission.
Index hospitalizations were first identified using VA-only inpatient data similar to methods outlined by the CMS and endorsed by the National Quality Forum for Hospital Profiling.9 An index hospitalization was defined as an acute inpatient discharge between 2010 and 2012 in which the principal diagnosis was AMI, HF, or pneumonia. We excluded in-hospital deaths, discharges against medical advice, and--for the AMI cohort only--discharges on the same day as admission. Patients may have multiple admissions per year, but only admissions after 30 days of discharge from an index admission were eligible to be included as an additional index admission.
Outcomes
A readmission was defined as any unplanned rehospitalization to either non-VA or VA acute care facilities for any cause within 30 days of discharge from the index hospitalization. Readmissions to observation status or nonacute or rehabilitation units, such as skilled nursing facilities, were not included. Planned readmissions for elective procedures, such as elective chemotherapy and revascularization following an AMI index admission, were not considered as an outcome event.
Risk Standardization for 30-day Readmission
Using approaches developed by CMS,10-12 we calculated hospital-specific 30-day RSRRs for each VA. Briefly, the RSRR is a ratio of the number of predicted readmissions within 30 days of discharge to the expected number of readmissions within 30 days of hospital discharge, multiplied by the national unadjusted 30-day readmission rate. This measure calculates hospital-specific RSRRs using hierarchical logistic regression models, which account for clustering of patients within hospitals and risk-adjusting for differences in case-mix, during the assessed time periods.13 This approach simultaneously models two levels (patient and hospital) to account for the variance in patient outcomes within and between hospitals.14 At the patient level, the model uses the log odds of readmissions as the dependent variable and age and selected comorbidities as the independent variables. The second level models the hospital-specific intercepts. According to CMS guidelines, the analysis was limited to facilities with at least 25 patient admissions annually for each condition. All readmissions were attributed to the hospital that initially discharged the patient to a nonacute setting.
Analysis
We examined and reported the distribution of patient and clinical characteristics at the hospital level. For each condition, we determined the number of hospitals that had a sufficient number of admissions (n ≥ 25) to be included in the analyses. We calculated the mean, median, and interquartile range for the observed unadjusted readmission rates across all included hospitals.
Similar to methods used by CMS, we used one year of data in the VA to assess hospital quality and variation in facility performance. First, we calculated the 30-day RSRRs using one year (2012) of data. To assess how variability changed with higher facility volume (ie, more years included in the analysis), we also calculated the 30-day RSRRs using two and three years of data. For this, we identified and quantified the number of hospitals whose RSRRs were calculated as being above or below the national VA average (mean ± 95% CI). Specifically, we calculated the number and percentage of hospitals that were classified as either above (+95% CI) or below the national average (−95% CI) using data from all three time periods. All analyses were conducted using SAS Enterprise Guide, Version 7.1. The SAS statistical packages made available by the CMS Measure Team were used to calculate RSRRs.
RESULTS
Patient Characteristics
Patients were predominantly older males (98.3%). Among those hospitalized for AMI, most of them had a history of previous coronary artery bypass graft (CABG) (69.1%), acute coronary syndrome (ACS; 66.2%), or documented coronary atherosclerosis (89.8%). Similarly, patients admitted for HF had high rates of CABG (71.3%) and HF (94.6%), in addition to cardiac arrhythmias (69.3%) and diabetes (60.8%). Patients admitted with a diagnosis of pneumonia had high rates of CABG (61.9%), chronic obstructive pulmonary disease (COPD; 58.1%), and previous diagnosis of pneumonia (78.8%; Table 1). Patient characteristics for two and three years of data are presented in Supplementary Table 1.
VA Hospitals with Sufficient Volume to Be Included in Profiling Assessments
There were 146 acute-care hospitals in the VA. In 2012, 56 (38%) VA hospitals had at least 25 admissions for AMI, 102 (70%) hospitals had at least 25 admissions for CHF, and 106 (73%) hospitals had at least 25 admissions for pneumonia (Table 1) and therefore qualified for analysis based on CMS criteria for 30-day RSRR calculation. The study sample included 3,571 patients with AMI, 10,609 patients with CHF, and 10,191 patients with pneumonia.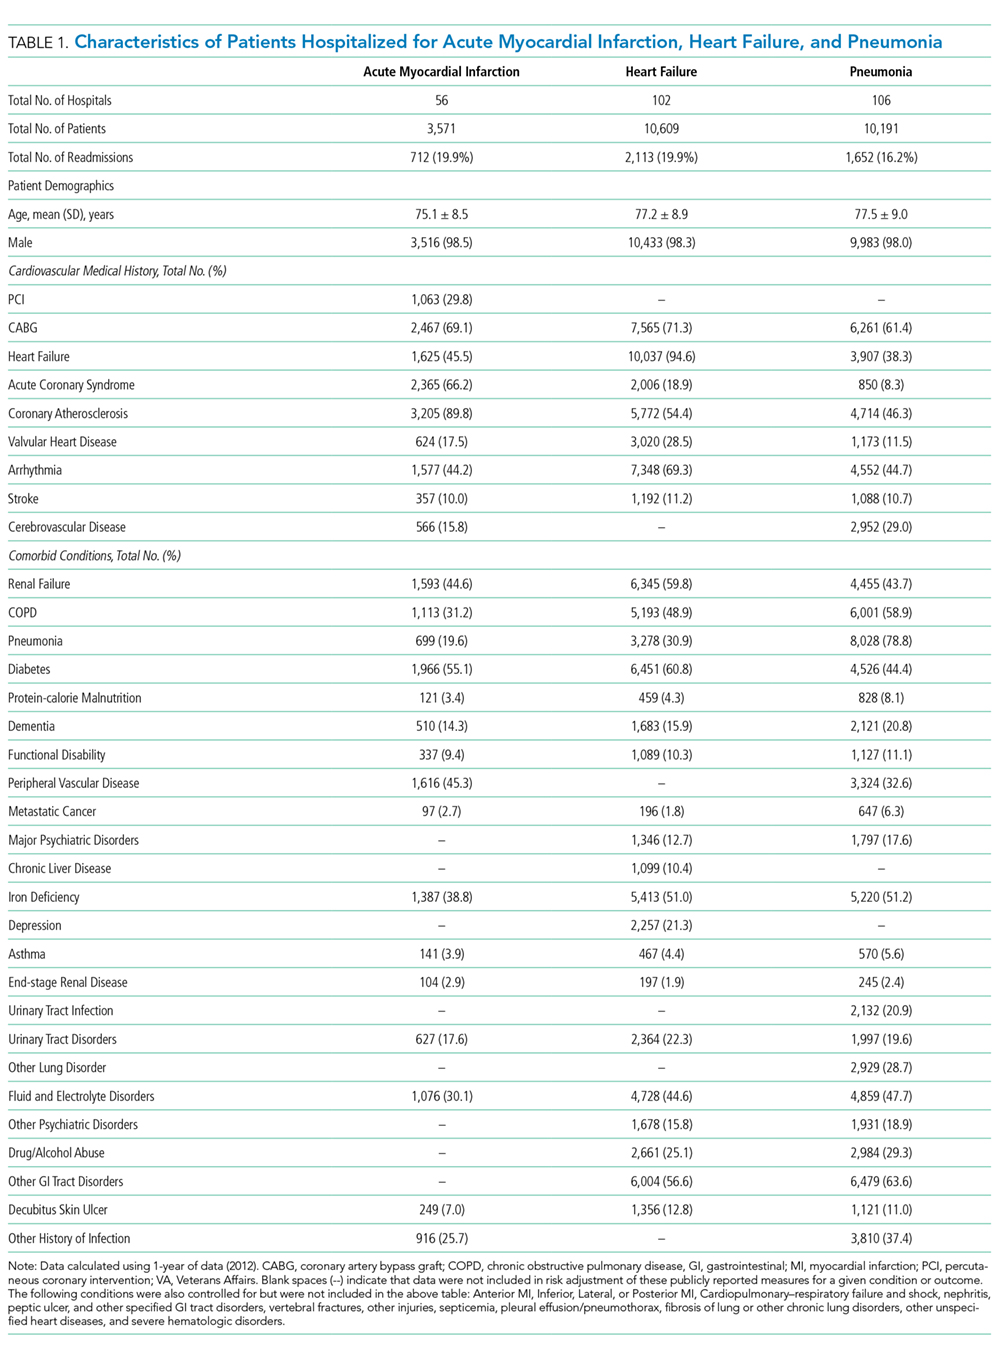
30-Day Readmission Rates
The mean observed readmission rates in 2012 were 20% (95% CI 19%-21%) among patients admitted for AMI, 20% (95% CI 19%-20%) for patients admitted with CHF, and 15% (95% CI 15%-16%) for patients admitted with pneumonia. No significant variation from these rates was noted following risk standardization across hospitals (Table 2). Observed and risk-standardized rates were also calculated for two and three years of data (Supplementary Table 2) but were not found to be grossly different when utilizing a single year of data.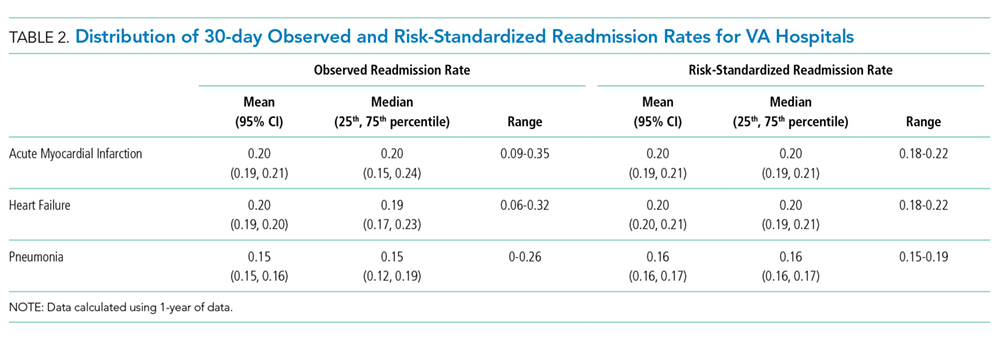
In 2012, two hospitals (2%) exhibited HF RSRRs worse than the national average (+95% CI), whereas no hospital demonstrated worse-than-average rates (+95% CI) for AMI or pneumonia (Table 3, Figure 1). Similarly, in 2012, only three hospitals had RSRRs better than the national average (−95% CI) for HF and pneumonia.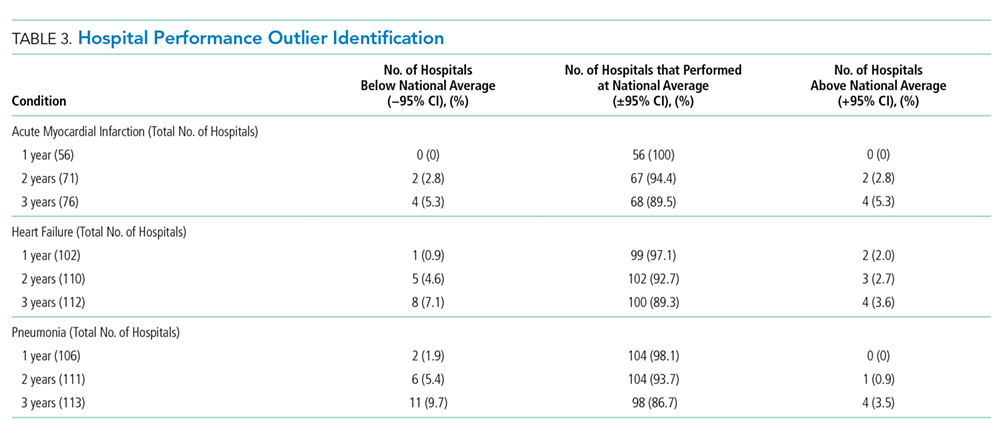
We combined data from three years to increase the volume of admissions per hospital. Even after combining three years of data across all three conditions, only four hospitals (range: 3.5%-5.3%) had RSRRs worse than the national average (+95% CI). However, four (5.3%), eight (7.1%), and 11 (9.7%) VA hospitals had RSRRs better than the national average (−95% CI).
DISCUSSION
We found that the CMS-derived 30-day risk-stratified readmission metric for AMI, HF, and pneumonia showed little variation among VA hospitals. The lack of institutional 30-day readmission volume appears to be a fundamental limitation that subsequently requires multiple years of data to make this metric clinically meaningful. As the largest integrated healthcare system in the United States, the VA relies upon and makes large-scale programmatic decisions based on such performance data. The inability to detect meaningful interhospital variation in a timely manner suggests that the CMS-derived 30-day RSRR may not be a sensitive metric to distinguish facility performance or drive quality improvement initiatives within the VA.
First, we found it notable that among the 146 VA medical centers available for analysis,15 between 38% and 77% of hospitals qualified for evaluation when using CMS-based participation criteria—which excludes institutions with fewer than 25 episodes per year. Although this low degree of qualification for profiling was most dramatic when using one year of data (range: 38%-72%), we noted that it did not dramatically improve when we combined three years of data (range: 52%-77%). These findings act to highlight the population and systems differences between CMS and VA populations16 and further support the idea that CMS-derived models may not be optimized for use in the VA healthcare system.
Our findings are particularly relevant within the VA given the quarterly rate with which these data are reported within the VA SAIL scorecard.2 The VA designed SAIL for internal benchmarking to spotlight successful strategies of top performing institutions and promote high-quality, value-based care. Using one year of data, the minimum required to utilize CMS models, showed that quarterly feedback (ie, three months of data) may not be informative or useful given that few hospitals are able to differentiate themselves from the mean (±95% CI). Although the capacity to distinguish between high and low performers does improve by combining hospital admissions over three years, this is not a reasonable timeline for institutions to wait for quality comparisons. Furthermore, although the VA does present its data on CMS’s Hospital Compare website using three years of combined data, the variability and distribution of such results are not supplied.3
This lack of discriminability raises concerns about the ability to compare hospital performance between low- and high-volume institutions. Although these models function well in CMS settings with large patient volumes in which greater variability exists,5 they lose their capacity to discriminate when applied to low-volume settings such as the VA. Given that several hospitals in the US are small community hospitals with low patient volumes,17 this issue probably occurs in other non-VA settings. Although our study focuses on the VA, others have been able to compare VA and non-VA settings’ variation and distribution. For example, Nuti et al. explored the differences in 30-day RSRRs among hospitalized patients with AMI, HF, and pneumonia and similarly showed little variation, narrow distributions, and few outliers in the VA setting compared to those in the non-VA setting. For small patient volume institutions, including the VA, a focus on high-volume services, outcomes, and measures (ie, blood pressure control, medication reconciliation, etc.) may offer more discriminability between high- and low-performing facilities. For example, Patel et al. found that VA process measures in patients with HF (ie, beta-blocker and ACE-inhibitor use) can be used as valid quality measures as they exhibited consistent reliability over time and validity with adjusted mortality rates, whereas the 30-day RSRR did not.18
Our findings may have substantial financial, resource, and policy implications. Automatically developing and reporting measures created for the Medicare program in the VA may not be a good use of VA resources. In addition, facilities may react to these reported outcomes and expend local resources and finances to implement interventions to improve on a performance outcome whose measure is statistically no different than the vast majority of its comparators. Such events have been highlighted in the public media and have pointed to the fact that small changes in quality, or statistical errors themselves, can have large ramifications within the VA’s hospital rating system.19
These findings may also add to the discussion on whether public reporting of health and quality outcomes improves patient care. Since the CMS began public reporting on RSRRs in 2009, these rates have fallen for all three examined conditions (AMI, HF, and pneumonia),7,20,21 in addition to several other health outcomes.17 Although recent studies have suggested that these decreased rates have been driven by the CMS-sponsored Hospital Readmissions Reduction Program (HRRP),22 others have suggested that these findings are consistent with ongoing secular trends toward decreased readmissions and may not be completely explained by public reporting alone.23 Moreover, prior work has also found that readmissions may be strongly impacted by factors external to the hospital setting, such as patients’ social demographics (ie, household income, social isolation), that are not currently captured in risk-prediction models.24 Given the small variability we see in our data, public reporting within the VA is probably not beneficial, as only a small number of facilities are outliers based on RSRR.
Our study has several limitations. First, although we adapted the CMS model to the VA, we did not include gender in the model because >99% of all patient admissions were male. Second, we assessed only three medical conditions that were being tracked by both CMS and VA during this time period, and these outcomes may not be representative of other aspects of care and cannot be generalized to other medical conditions. Finally, more contemporary data could lead to differing results – though we note that no large-scale structural or policy changes addressing readmission rates have been implemented within the VA since our study period.
The results of this study suggest that the CMS-derived 30-day risk-stratified readmission metric for AMI, HF, and pneumonia may not have the capacity to properly detect interfacility variance and thus may not be an optimal quality indicator within the VA. As the VA and other healthcare systems continually strive to improve the quality of care they provide, they will require more accurate and timely metrics for which to index their performance.
Disclosures
The authors have nothing to disclose
1. Medicare C for, Baltimore MS 7500 SB, Usa M. VA Data. https://www.cms.gov/Medicare/Quality-Initiatives-Patient-Assessment-Instruments/HospitalQualityInits/VA-Data.html. Published October 19, 2016. Accessed July 15, 2018.
2. Strategic Analytics for Improvement and Learning (SAIL) - Quality of Care. https://www.va.gov/QUALITYOFCARE/measure-up/Strategic_Analytics_for_Improvement_and_Learning_SAIL.asp. Accessed July 15, 2018.
3. Snapshot. https://www.cms.gov/Medicare/Quality-Initiatives-Patient-Assessment-Instruments/HospitalQualityInits/VA-Data.html. Accessed September 10, 2018.
4. Bradley EH, Curry L, Horwitz LI, et al. Hospital strategies associated with 30-day readmission rates for patients with heart failure. Circ Cardiovasc Qual Outcomes. 2013;6(4):444-450. doi: 10.1161/CIRCOUTCOMES.111.000101. PubMed
5. Desai NR, Ross JS, Kwon JY, et al. Association between hospital penalty status under the hospital readmission reduction program and readmission rates for target and nontarget conditions. JAMA. 2016;316(24):2647-2656. doi: 10.1001/jama.2016.18533. PubMed
6. McIlvennan CK, Eapen ZJ, Allen LA. Hospital readmissions reduction program. Circulation. 2015;131(20):1796-1803. doi: 10.1161/CIRCULATIONAHA.114.010270. PubMed
7. Suter LG, Li S-X, Grady JN, et al. National patterns of risk-standardized mortality and readmission after hospitalization for acute myocardial infarction, heart failure, and pneumonia: update on publicly reported outcomes measures based on the 2013 release. J Gen Intern Med. 2014;29(10):1333-1340. doi: 10.1007/s11606-014-2862-5. PubMed
8. O’Brien WJ, Chen Q, Mull HJ, et al. What is the value of adding Medicare data in estimating VA hospital readmission rates? Health Serv Res. 2015;50(1):40-57. doi: 10.1111/1475-6773.12207. PubMed
9. NQF: All-Cause Admissions and Readmissions 2015-2017 Technical Report. https://www.qualityforum.org/Publications/2017/04/All-Cause_Admissions_and_Readmissions_2015-2017_Technical_Report.aspx. Accessed August 2, 2018.
10. Keenan PS, Normand S-LT, Lin Z, et al. An administrative claims measure suitable for profiling hospital performance on the basis of 30-day all-cause readmission rates among patients with heart failure. Circ Cardiovasc Qual Outcomes. 2008;1(1):29-37. doi: 10.1161/CIRCOUTCOMES.108.802686. PubMed
11. Krumholz HM, Lin Z, Drye EE, et al. An administrative claims measure suitable for profiling hospital performance based on 30-day all-cause readmission rates among patients with acute myocardial infarction. Circ Cardiovasc Qual Outcomes. 2011;4(2):243-252. doi: 10.1161/CIRCOUTCOMES.110.957498. PubMed
12. Lindenauer PK, Normand S-LT, Drye EE, et al. Development, validation, and results of a measure of 30-day readmission following hospitalization for pneumonia. J Hosp Med. 2011;6(3):142-150. doi: 10.1002/jhm.890. PubMed
13. Medicare C for, Baltimore MS 7500 SB, Usa M. OutcomeMeasures. https://www.cms.gov/Medicare/Quality-Initiatives-Patient-Assessment-Instruments/HospitalQualityInits/OutcomeMeasures.html. Published October 13, 2017. Accessed July 19, 2018.
14. Nuti SV, Qin L, Rumsfeld JS, et al. Association of admission to Veterans Affairs hospitals vs non-Veterans Affairs hospitals with mortality and readmission rates among older hospitalized with acute myocardial infarction, heart failure, or pneumonia. JAMA. 2016;315(6):582-592. doi: 10.1001/jama.2016.0278. PubMed
15. Solutions VW. Veterans Health Administration - Locations. https://www.va.gov/directory/guide/division.asp?dnum=1. Accessed September 13, 2018.
16. Duan-Porter W (Denise), Martinson BC, Taylor B, et al. Evidence Review: Social Determinants of Health for Veterans. Washington (DC): Department of Veterans Affairs (US); 2017. http://www.ncbi.nlm.nih.gov/books/NBK488134/. Accessed June 13, 2018.
17. Fast Facts on U.S. Hospitals, 2018 | AHA. American Hospital Association. https://www.aha.org/statistics/fast-facts-us-hospitals. Accessed September 5, 2018.
18. Patel J, Sandhu A, Parizo J, Moayedi Y, Fonarow GC, Heidenreich PA. Validity of performance and outcome measures for heart failure. Circ Heart Fail. 2018;11(9):e005035. PubMed
19. Philipps D. Canceled Operations. Unsterile Tools. The V.A. Gave This Hospital 5 Stars. The New York Times. https://www.nytimes.com/2018/11/01/us/veterans-hospitals-rating-system-star.html. Published November 3, 2018. Accessed November 19, 2018.
20. DeVore AD, Hammill BG, Hardy NC, Eapen ZJ, Peterson ED, Hernandez AF. Has public reporting of hospital readmission rates affected patient outcomes?: Analysis of Medicare claims data. J Am Coll Cardiol. 2016;67(8):963-972. doi: 10.1016/j.jacc.2015.12.037. PubMed
21. Wasfy JH, Zigler CM, Choirat C, Wang Y, Dominici F, Yeh RW. Readmission rates after passage of the hospital readmissions reduction program: a pre-post analysis. Ann Intern Med. 2017;166(5):324-331. doi: 10.7326/M16-0185. PubMed
22. Medicare C for, Baltimore MS 7500 SB, Usa M. Hospital Readmission Reduction Program. https://www.cms.gov/Medicare/Quality-Initiatives-Patient-Assessment-Instruments/Value-Based-Programs/HRRP/Hospital-Readmission-Reduction-Program.html. Published March 26, 2018. Accessed July 19, 2018.
23. Radford MJ. Does public reporting improve care? J Am Coll Cardiol. 2016;67(8):973-975. doi: 10.1016/j.jacc.2015.12.038. PubMed
24. Barnett ML, Hsu J, McWilliams JM. Patient characteristics and differences in hospital readmission rates. JAMA Intern Med. 2015;175(11):1803-1812. doi: 10.1001/jamainternmed.2015.4660. PubMed
Using methodology created by the Centers for Medicare & Medicaid Services (CMS), the Department of Veterans Affairs (VA) calculates and reports hospital performance measures for several key conditions, including acute myocardial infarction (AMI), heart failure (HF), and pneumonia.1 These measures are designed to benchmark individual hospitals against how average hospitals perform when caring for a similar case-mix index. Because readmissions to the hospital within 30-days of discharge are common and costly, this metric has garnered extensive attention in recent years.
To summarize the 30-day readmission metric, the VA utilizes the Strategic Analytics for Improvement and Learning (SAIL) system to present internally its findings to VA practitioners and leadership.2 The VA provides these data as a means to drive quality improvement and allow for comparison of individual hospitals’ performance across measures throughout the VA healthcare system. Since 2010, the VA began using and publicly reporting the CMS-derived 30-day Risk-Stratified Readmission Rate (RSRR) on the Hospital Compare website.3 Similar to CMS, the VA uses three years of combined data so that patients, providers, and other stakeholders can compare individual hospitals’ performance across these measures.1 In response to this, hospitals and healthcare organizations have implemented quality improvement and large-scale programmatic interventions in an attempt to improve quality around readmissions.4-6 A recent assessment on how hospitals within the Medicare fee-for-service program have responded to such reporting found large degrees of variability, with more than half of the participating institutions facing penalties due to greater-than-expected readmission rates.5 Although the VA utilizes the same CMS-derived model in its assessments and reporting, the variability and distribution around this metric are not publicly reported—thus making it difficult to ascertain how individual VA hospitals compare with one another. Without such information, individual facilities may not know how to benchmark the quality of their care to others, nor would the VA recognize which interventions addressing readmissions are working, and which are not. Although previous assessments of interinstitutional variance have been performed in Medicare populations,7 a focused analysis of such variance within the VA has yet to be performed.
In this study, we performed a multiyear assessment of the CMS-derived 30-day RSRR metric for AMI, HF, and pneumonia as a useful measure to drive VA quality improvement or distinguish VA facility performance based on its ability to detect interfacility variability.
METHODS
Data Source
We used VA administrative and Medicare claims data from 2010 to 2012. After identifying index hospitalizations to VA hospitals, we obtained patients’ respective inpatient Medicare claims data from the Medicare Provider Analysis and Review (MedPAR) and Outpatient files. All Medicare records were linked to VA records via scrambled Social Security numbers and were provided by the VA Information Resource Center. This study was approved by the San Francisco VA Medical Center Institutional Review Board.
Study Sample
Our cohort consisted of hospitalized VA beneficiary and Medicare fee-for-service patients who were aged ≥65 years and admitted to and discharged from a VA acute care center with a primary discharge diagnosis of AMI, HF, or pneumonia. These comorbidities were chosen as they are publicly reported and frequently used for interfacility comparisons. Because studies have found that inclusion of secondary payer data (ie, CMS data) may affect hospital-profiling outcomes, we included Medicare data on all available patients.8 We excluded hospitalizations that resulted in a transfer to another acute care facility and those admitted to observation status at their index admission. To ensure a full year of data for risk adjustment, beneficiaries were included only if they were enrolled in Medicare for 12 months prior to and including the date of the index admission.
Index hospitalizations were first identified using VA-only inpatient data similar to methods outlined by the CMS and endorsed by the National Quality Forum for Hospital Profiling.9 An index hospitalization was defined as an acute inpatient discharge between 2010 and 2012 in which the principal diagnosis was AMI, HF, or pneumonia. We excluded in-hospital deaths, discharges against medical advice, and--for the AMI cohort only--discharges on the same day as admission. Patients may have multiple admissions per year, but only admissions after 30 days of discharge from an index admission were eligible to be included as an additional index admission.
Outcomes
A readmission was defined as any unplanned rehospitalization to either non-VA or VA acute care facilities for any cause within 30 days of discharge from the index hospitalization. Readmissions to observation status or nonacute or rehabilitation units, such as skilled nursing facilities, were not included. Planned readmissions for elective procedures, such as elective chemotherapy and revascularization following an AMI index admission, were not considered as an outcome event.
Risk Standardization for 30-day Readmission
Using approaches developed by CMS,10-12 we calculated hospital-specific 30-day RSRRs for each VA. Briefly, the RSRR is a ratio of the number of predicted readmissions within 30 days of discharge to the expected number of readmissions within 30 days of hospital discharge, multiplied by the national unadjusted 30-day readmission rate. This measure calculates hospital-specific RSRRs using hierarchical logistic regression models, which account for clustering of patients within hospitals and risk-adjusting for differences in case-mix, during the assessed time periods.13 This approach simultaneously models two levels (patient and hospital) to account for the variance in patient outcomes within and between hospitals.14 At the patient level, the model uses the log odds of readmissions as the dependent variable and age and selected comorbidities as the independent variables. The second level models the hospital-specific intercepts. According to CMS guidelines, the analysis was limited to facilities with at least 25 patient admissions annually for each condition. All readmissions were attributed to the hospital that initially discharged the patient to a nonacute setting.
Analysis
We examined and reported the distribution of patient and clinical characteristics at the hospital level. For each condition, we determined the number of hospitals that had a sufficient number of admissions (n ≥ 25) to be included in the analyses. We calculated the mean, median, and interquartile range for the observed unadjusted readmission rates across all included hospitals.
Similar to methods used by CMS, we used one year of data in the VA to assess hospital quality and variation in facility performance. First, we calculated the 30-day RSRRs using one year (2012) of data. To assess how variability changed with higher facility volume (ie, more years included in the analysis), we also calculated the 30-day RSRRs using two and three years of data. For this, we identified and quantified the number of hospitals whose RSRRs were calculated as being above or below the national VA average (mean ± 95% CI). Specifically, we calculated the number and percentage of hospitals that were classified as either above (+95% CI) or below the national average (−95% CI) using data from all three time periods. All analyses were conducted using SAS Enterprise Guide, Version 7.1. The SAS statistical packages made available by the CMS Measure Team were used to calculate RSRRs.
RESULTS
Patient Characteristics
Patients were predominantly older males (98.3%). Among those hospitalized for AMI, most of them had a history of previous coronary artery bypass graft (CABG) (69.1%), acute coronary syndrome (ACS; 66.2%), or documented coronary atherosclerosis (89.8%). Similarly, patients admitted for HF had high rates of CABG (71.3%) and HF (94.6%), in addition to cardiac arrhythmias (69.3%) and diabetes (60.8%). Patients admitted with a diagnosis of pneumonia had high rates of CABG (61.9%), chronic obstructive pulmonary disease (COPD; 58.1%), and previous diagnosis of pneumonia (78.8%; Table 1). Patient characteristics for two and three years of data are presented in Supplementary Table 1.
VA Hospitals with Sufficient Volume to Be Included in Profiling Assessments
There were 146 acute-care hospitals in the VA. In 2012, 56 (38%) VA hospitals had at least 25 admissions for AMI, 102 (70%) hospitals had at least 25 admissions for CHF, and 106 (73%) hospitals had at least 25 admissions for pneumonia (Table 1) and therefore qualified for analysis based on CMS criteria for 30-day RSRR calculation. The study sample included 3,571 patients with AMI, 10,609 patients with CHF, and 10,191 patients with pneumonia.
30-Day Readmission Rates
The mean observed readmission rates in 2012 were 20% (95% CI 19%-21%) among patients admitted for AMI, 20% (95% CI 19%-20%) for patients admitted with CHF, and 15% (95% CI 15%-16%) for patients admitted with pneumonia. No significant variation from these rates was noted following risk standardization across hospitals (Table 2). Observed and risk-standardized rates were also calculated for two and three years of data (Supplementary Table 2) but were not found to be grossly different when utilizing a single year of data.
In 2012, two hospitals (2%) exhibited HF RSRRs worse than the national average (+95% CI), whereas no hospital demonstrated worse-than-average rates (+95% CI) for AMI or pneumonia (Table 3, Figure 1). Similarly, in 2012, only three hospitals had RSRRs better than the national average (−95% CI) for HF and pneumonia.
We combined data from three years to increase the volume of admissions per hospital. Even after combining three years of data across all three conditions, only four hospitals (range: 3.5%-5.3%) had RSRRs worse than the national average (+95% CI). However, four (5.3%), eight (7.1%), and 11 (9.7%) VA hospitals had RSRRs better than the national average (−95% CI).
DISCUSSION
We found that the CMS-derived 30-day risk-stratified readmission metric for AMI, HF, and pneumonia showed little variation among VA hospitals. The lack of institutional 30-day readmission volume appears to be a fundamental limitation that subsequently requires multiple years of data to make this metric clinically meaningful. As the largest integrated healthcare system in the United States, the VA relies upon and makes large-scale programmatic decisions based on such performance data. The inability to detect meaningful interhospital variation in a timely manner suggests that the CMS-derived 30-day RSRR may not be a sensitive metric to distinguish facility performance or drive quality improvement initiatives within the VA.
First, we found it notable that among the 146 VA medical centers available for analysis,15 between 38% and 77% of hospitals qualified for evaluation when using CMS-based participation criteria—which excludes institutions with fewer than 25 episodes per year. Although this low degree of qualification for profiling was most dramatic when using one year of data (range: 38%-72%), we noted that it did not dramatically improve when we combined three years of data (range: 52%-77%). These findings act to highlight the population and systems differences between CMS and VA populations16 and further support the idea that CMS-derived models may not be optimized for use in the VA healthcare system.
Our findings are particularly relevant within the VA given the quarterly rate with which these data are reported within the VA SAIL scorecard.2 The VA designed SAIL for internal benchmarking to spotlight successful strategies of top performing institutions and promote high-quality, value-based care. Using one year of data, the minimum required to utilize CMS models, showed that quarterly feedback (ie, three months of data) may not be informative or useful given that few hospitals are able to differentiate themselves from the mean (±95% CI). Although the capacity to distinguish between high and low performers does improve by combining hospital admissions over three years, this is not a reasonable timeline for institutions to wait for quality comparisons. Furthermore, although the VA does present its data on CMS’s Hospital Compare website using three years of combined data, the variability and distribution of such results are not supplied.3
This lack of discriminability raises concerns about the ability to compare hospital performance between low- and high-volume institutions. Although these models function well in CMS settings with large patient volumes in which greater variability exists,5 they lose their capacity to discriminate when applied to low-volume settings such as the VA. Given that several hospitals in the US are small community hospitals with low patient volumes,17 this issue probably occurs in other non-VA settings. Although our study focuses on the VA, others have been able to compare VA and non-VA settings’ variation and distribution. For example, Nuti et al. explored the differences in 30-day RSRRs among hospitalized patients with AMI, HF, and pneumonia and similarly showed little variation, narrow distributions, and few outliers in the VA setting compared to those in the non-VA setting. For small patient volume institutions, including the VA, a focus on high-volume services, outcomes, and measures (ie, blood pressure control, medication reconciliation, etc.) may offer more discriminability between high- and low-performing facilities. For example, Patel et al. found that VA process measures in patients with HF (ie, beta-blocker and ACE-inhibitor use) can be used as valid quality measures as they exhibited consistent reliability over time and validity with adjusted mortality rates, whereas the 30-day RSRR did not.18
Our findings may have substantial financial, resource, and policy implications. Automatically developing and reporting measures created for the Medicare program in the VA may not be a good use of VA resources. In addition, facilities may react to these reported outcomes and expend local resources and finances to implement interventions to improve on a performance outcome whose measure is statistically no different than the vast majority of its comparators. Such events have been highlighted in the public media and have pointed to the fact that small changes in quality, or statistical errors themselves, can have large ramifications within the VA’s hospital rating system.19
These findings may also add to the discussion on whether public reporting of health and quality outcomes improves patient care. Since the CMS began public reporting on RSRRs in 2009, these rates have fallen for all three examined conditions (AMI, HF, and pneumonia),7,20,21 in addition to several other health outcomes.17 Although recent studies have suggested that these decreased rates have been driven by the CMS-sponsored Hospital Readmissions Reduction Program (HRRP),22 others have suggested that these findings are consistent with ongoing secular trends toward decreased readmissions and may not be completely explained by public reporting alone.23 Moreover, prior work has also found that readmissions may be strongly impacted by factors external to the hospital setting, such as patients’ social demographics (ie, household income, social isolation), that are not currently captured in risk-prediction models.24 Given the small variability we see in our data, public reporting within the VA is probably not beneficial, as only a small number of facilities are outliers based on RSRR.
Our study has several limitations. First, although we adapted the CMS model to the VA, we did not include gender in the model because >99% of all patient admissions were male. Second, we assessed only three medical conditions that were being tracked by both CMS and VA during this time period, and these outcomes may not be representative of other aspects of care and cannot be generalized to other medical conditions. Finally, more contemporary data could lead to differing results – though we note that no large-scale structural or policy changes addressing readmission rates have been implemented within the VA since our study period.
The results of this study suggest that the CMS-derived 30-day risk-stratified readmission metric for AMI, HF, and pneumonia may not have the capacity to properly detect interfacility variance and thus may not be an optimal quality indicator within the VA. As the VA and other healthcare systems continually strive to improve the quality of care they provide, they will require more accurate and timely metrics for which to index their performance.
Disclosures
The authors have nothing to disclose
1. Medicare C for, Baltimore MS 7500 SB, Usa M. VA Data. https://www.cms.gov/Medicare/Quality-Initiatives-Patient-Assessment-Instruments/HospitalQualityInits/VA-Data.html. Published October 19, 2016. Accessed July 15, 2018.
2. Strategic Analytics for Improvement and Learning (SAIL) - Quality of Care. https://www.va.gov/QUALITYOFCARE/measure-up/Strategic_Analytics_for_Improvement_and_Learning_SAIL.asp. Accessed July 15, 2018.
3. Snapshot. https://www.cms.gov/Medicare/Quality-Initiatives-Patient-Assessment-Instruments/HospitalQualityInits/VA-Data.html. Accessed September 10, 2018.
4. Bradley EH, Curry L, Horwitz LI, et al. Hospital strategies associated with 30-day readmission rates for patients with heart failure. Circ Cardiovasc Qual Outcomes. 2013;6(4):444-450. doi: 10.1161/CIRCOUTCOMES.111.000101. PubMed
5. Desai NR, Ross JS, Kwon JY, et al. Association between hospital penalty status under the hospital readmission reduction program and readmission rates for target and nontarget conditions. JAMA. 2016;316(24):2647-2656. doi: 10.1001/jama.2016.18533. PubMed
6. McIlvennan CK, Eapen ZJ, Allen LA. Hospital readmissions reduction program. Circulation. 2015;131(20):1796-1803. doi: 10.1161/CIRCULATIONAHA.114.010270. PubMed
7. Suter LG, Li S-X, Grady JN, et al. National patterns of risk-standardized mortality and readmission after hospitalization for acute myocardial infarction, heart failure, and pneumonia: update on publicly reported outcomes measures based on the 2013 release. J Gen Intern Med. 2014;29(10):1333-1340. doi: 10.1007/s11606-014-2862-5. PubMed
8. O’Brien WJ, Chen Q, Mull HJ, et al. What is the value of adding Medicare data in estimating VA hospital readmission rates? Health Serv Res. 2015;50(1):40-57. doi: 10.1111/1475-6773.12207. PubMed
9. NQF: All-Cause Admissions and Readmissions 2015-2017 Technical Report. https://www.qualityforum.org/Publications/2017/04/All-Cause_Admissions_and_Readmissions_2015-2017_Technical_Report.aspx. Accessed August 2, 2018.
10. Keenan PS, Normand S-LT, Lin Z, et al. An administrative claims measure suitable for profiling hospital performance on the basis of 30-day all-cause readmission rates among patients with heart failure. Circ Cardiovasc Qual Outcomes. 2008;1(1):29-37. doi: 10.1161/CIRCOUTCOMES.108.802686. PubMed
11. Krumholz HM, Lin Z, Drye EE, et al. An administrative claims measure suitable for profiling hospital performance based on 30-day all-cause readmission rates among patients with acute myocardial infarction. Circ Cardiovasc Qual Outcomes. 2011;4(2):243-252. doi: 10.1161/CIRCOUTCOMES.110.957498. PubMed
12. Lindenauer PK, Normand S-LT, Drye EE, et al. Development, validation, and results of a measure of 30-day readmission following hospitalization for pneumonia. J Hosp Med. 2011;6(3):142-150. doi: 10.1002/jhm.890. PubMed
13. Medicare C for, Baltimore MS 7500 SB, Usa M. OutcomeMeasures. https://www.cms.gov/Medicare/Quality-Initiatives-Patient-Assessment-Instruments/HospitalQualityInits/OutcomeMeasures.html. Published October 13, 2017. Accessed July 19, 2018.
14. Nuti SV, Qin L, Rumsfeld JS, et al. Association of admission to Veterans Affairs hospitals vs non-Veterans Affairs hospitals with mortality and readmission rates among older hospitalized with acute myocardial infarction, heart failure, or pneumonia. JAMA. 2016;315(6):582-592. doi: 10.1001/jama.2016.0278. PubMed
15. Solutions VW. Veterans Health Administration - Locations. https://www.va.gov/directory/guide/division.asp?dnum=1. Accessed September 13, 2018.
16. Duan-Porter W (Denise), Martinson BC, Taylor B, et al. Evidence Review: Social Determinants of Health for Veterans. Washington (DC): Department of Veterans Affairs (US); 2017. http://www.ncbi.nlm.nih.gov/books/NBK488134/. Accessed June 13, 2018.
17. Fast Facts on U.S. Hospitals, 2018 | AHA. American Hospital Association. https://www.aha.org/statistics/fast-facts-us-hospitals. Accessed September 5, 2018.
18. Patel J, Sandhu A, Parizo J, Moayedi Y, Fonarow GC, Heidenreich PA. Validity of performance and outcome measures for heart failure. Circ Heart Fail. 2018;11(9):e005035. PubMed
19. Philipps D. Canceled Operations. Unsterile Tools. The V.A. Gave This Hospital 5 Stars. The New York Times. https://www.nytimes.com/2018/11/01/us/veterans-hospitals-rating-system-star.html. Published November 3, 2018. Accessed November 19, 2018.
20. DeVore AD, Hammill BG, Hardy NC, Eapen ZJ, Peterson ED, Hernandez AF. Has public reporting of hospital readmission rates affected patient outcomes?: Analysis of Medicare claims data. J Am Coll Cardiol. 2016;67(8):963-972. doi: 10.1016/j.jacc.2015.12.037. PubMed
21. Wasfy JH, Zigler CM, Choirat C, Wang Y, Dominici F, Yeh RW. Readmission rates after passage of the hospital readmissions reduction program: a pre-post analysis. Ann Intern Med. 2017;166(5):324-331. doi: 10.7326/M16-0185. PubMed
22. Medicare C for, Baltimore MS 7500 SB, Usa M. Hospital Readmission Reduction Program. https://www.cms.gov/Medicare/Quality-Initiatives-Patient-Assessment-Instruments/Value-Based-Programs/HRRP/Hospital-Readmission-Reduction-Program.html. Published March 26, 2018. Accessed July 19, 2018.
23. Radford MJ. Does public reporting improve care? J Am Coll Cardiol. 2016;67(8):973-975. doi: 10.1016/j.jacc.2015.12.038. PubMed
24. Barnett ML, Hsu J, McWilliams JM. Patient characteristics and differences in hospital readmission rates. JAMA Intern Med. 2015;175(11):1803-1812. doi: 10.1001/jamainternmed.2015.4660. PubMed
© 2019 Society of Hospital Medicine