User login
The Effect of Insurance Type on Patient Access to Ankle Fracture Care Under the Affordable Care Act
ABSTRACT
The purpose of this study is to assess the effect of insurance type (Medicaid, Medicare, private insurance) on the ability for patients with operative ankle fractures to access orthopedic traumatologists. The research team called 245 board-certified orthopedic surgeons specializing in orthopedic trauma within 8 representative states. The caller requested an appointment for their fictitious mother in order to be evaluated for an ankle fracture which was previously evaluated by her primary care physician and believed to require surgery. Each office was called 3 times to assess the response for each insurance type. For each call, information was documented regarding whether the patient was able to receive an appointment and the barriers the patient confronted to receive an appointment. Overall, 35.7% of offices scheduled an appointment for a patient with Medicaid, in comparison to 81.4%and 88.6% for Medicare and BlueCross, respectively (P < .0001). Medicaid patients confronted more barriers for receiving appointments. There was no statistically significant difference in access for Medicaid patients in states that had expanded Medicaid eligibility vs states that had not expanded Medicaid. Medicaid reimbursement for open reduction and internal fixation of an ankle fracture did not significantly correlate with appointment success rates or wait times. Despite the passage of the Affordable Care Act, patients with Medicaid have reduced access to orthopedic surgeons and more complex barriers to receiving appointments. A more robust strategy for increasing care-access for patients with Medicaid would be more equitable.
Continue to: In 2010, the Patient Protection and Affordable Care Act...
In 2010, the Patient Protection and Affordable Care Act (PPACA) expanded the eligibility criteria for Medicaid to all individuals with an income up to 138% of the poverty level.1 A Supreme Court ruling stated that the decision to expand Medicaid was to be decided by individual states.2 Currently, 31 states have chosen to expand Medicaid eligibility to their residents.2 This expansion has allowed an additional 11.7 million people to enroll in Medicaid and the Children’s Health Insurance Program by May 2015.3-5
Even with the passage of the PPACA, Medicaid patients seeking specialty orthopedic care have experienced more barriers to accessing care than Medicare or commercially-insured patients.2,6-10 One major cited reason is Medicaid’s low reimbursement, which may discourage physicians from open panel participation in Medicaid.11,12
A common fundamental teaching for orthopedic traumatologists is the notion that they should be available to treat all injuries regardless of the patient’s ability to pay.13 This has resulted in both trauma centers and trauma surgeons becoming financially challenged due to the higher proportion of Medicaid and uninsured trauma patients and lower Medicaid reimbursement levels.14,15
This study focuses on the effect of different types of insurance (Medicaid, Medicare, or commercial insurance) on the ability of patients to obtain care for operative ankle fractures. The purpose of this study is to evaluate, in the context of the PPACA, patient access to orthopedic surgeons for operative ankle fractures based on insurance-type. We hypothesized that patients with Medicaid would face a greater volume of obstacles when seeking appointments for an ankle fracture, even after the PPACA.
Continue to: MATERIALS AND METHODS...
MATERIALS AND METHODS
The study population included board-certified orthopedic surgeons who belonged to the Orthopaedic Trauma Association (OTA) from 8 representative states; 4 states with expanded Medicaid eligibility (California, Massachusetts, New York, Ohio) and 4 states without expanded Medicaid eligibility (Florida, North Carolina, Georgia, Texas). These states were selected due to their ability to represent diverse healthcare marketplaces throughout the country. Using the OTA website’s “Find a Surgeon” search tool,16 we created a list of surgeons for each state and matched each surgeon with a random number. The list of surgeons was ordered according to the value of the surgeon’s associated random number, and surgeons were called in ascending order. We excluded disconnected or inaccurate numbers from the calling list. Surgeons who did not manage ankle fractures were removed from the dataset. Approximately 30 orthopedic trauma surgeons per state were contacted.
Each office was called to make an appointment for the caller’s mother. Every surgeon’s office was specifically asked if the surgeon would accept the patient to be evaluated for an ankle fracture that occurred out-of-state. The caller had a standardized protocol to limit intra- and inter-office variations (Appendix). The scenario involved a request to be evaluated for an unstable ankle fracture, with the patient having Medicaid, Medicare, or BlueCross insurance. The scenario required 3 separate calls to the same surgeon in order to obtain data regarding each insurance-type. The calls were separated by at least 1 week to avoid caller recognition by the surgeon’s office.
Appendix
Scenario
1. Date of Birth: Medicaid–2/07/55; BlueCross PPO–2/09/55; Medicare–7/31/45.
2. Ankle fracture evaluated by primary care physician 1 or 2 days ago
3. Not seen previously by your clinic or hospital, she would be a new patient
4. Asked how early she could be scheduled for an appointment
5. Script:
“I’m calling for my mother who injured her ankle a few days ago. Her family doctor took an X-ray and believes she has a fracture and needs surgery. Is Dr. X accepting new patients for evaluation and treatment of ankle fractures?” If YES →
“I was wondering if you take Medicaid/Medicare/BlueCross plan?” If YES →
“When is your soonest available appointment?”
The date of each phone call and date of appointment, if provided, were recorded. If the office did not give an appointment, we asked for reasons why. If an appointment was denied for a patient with Medicaid, we asked for a referral to another office that accepted Medicaid. We considered barriers to obtaining an initial appointment, such as requiring a referral from a primary care physician (PCP), as an unsuccessful attempt at making an appointment. We determined the waiting period for an appointment by calculating the time between the date of the call and the date of the appointment. Appointments were not scheduled to ensure that actual patients were not disadvantaged. For both appointment success rates and waiting periods, we stratified the data into 2 groups: states with expanded Medicaid eligibility (California, Massachusetts, New York, Ohio) and states without expanded Medicaid eligibility (Florida, North Carolina, Georgia, Texas).
We obtained Medicaid reimbursement rates for open reduction and internal fixation of an ankle fracture by querying each state’s reimbursement rate using Current Procedural Terminology code 27822.
Chi-square test or Fisher’s exact test was used to analyze acceptance rate differences based on the patient’s type of insurance. To compare the waiting periods for an appointment, we used an independent samples t-test after applying natural log-transformation, as the data was not normally distributed. We performed logistic regression analysis to detect whether reimbursement was a significant predictor of successfully making an appointment for patients, and a linear regression analysis was used to evaluate whether reimbursement predicted waiting periods. Unless otherwise stated, all statistical testing was performed two-tailed at an alpha-level of 0.05.
This study was approved by the Institutional Review Board of Yale University School of Medicine (HIC No. 1363).
Continue to: RESULTS...
RESULTS
In total, 350 offices were contacted across 8 states (4 states with and 4 states without expanded Medicaid eligibility) of which we identified 245 orthopedic surgeons who would surgically treat ankle fractures. The 245 surgeons’ offices were called 3 times for each separate insurance-type.
Table 1. Appointment Success Rate
| Medicaid | Medicare | Private |
All states |
|
| |
Yes (%) | 100 (35.7) | 228 (81.4) | 248 (88.6) |
No (%) | 180 (64.3) | 52 (18.60 | 32 (11.4) |
P-valuea |
| 0.0001 | 0.0001 |
States with expanded Medicaid eligibility |
|
|
|
Yes (%) | 55 (39.6) | 116 (83.5) | 124 (89.2) |
No (%) | 84 (60.4) | 23 (16.5) | 15 (10.8) |
P-valuea |
| 0.0001 | 0.0001 |
States without expanded Medicaid eligibility |
|
|
|
Yes (%) | 45 (31.9) | 112 (79.4) | 124 (87.9) |
No (%) | 96 (68.1) | 29 (20.6) | 17 (12.1) |
P-valuea |
| 0.0001 | 0.0001 |
aComparison to Medicaid.
The overall rate of successfully being offered an appointment with Medicaid was 35.7%, 81.4% for Medicare, and 88.6% for BlueCross (Table 1). For states with expanded Medicaid eligibility, the success rate for obtaining an appointment was 39.6%, 83.5%, and 89.2% for Medicaid, Medicare, and BlueCross, respectively. For states without expanded Medicaid eligibility, the success rate for obtaining an appointment was 31.9% for Medicaid, 79.4% for Medicare, and 87.9% for BlueCross. In all cases, the success rate for obtaining an appointment was significantly lower for Medicaid, compared to Medicare (P < .0001) or BlueCross (P < .0001). Medicaid appointment success rate was 39.6% in expanded states vs 31.9% in non-expanded states, however, the difference was not statistically significant (Table 2).
Table 2. Medicaid Appointment Success Rate in Expanded Vs Non-Expanded States
| Expanded states | Non-expanded states | P-value |
Yes (%) | 55 (39.6) | 45 (31.9) | .181 |
No (%) | 84 (60.4) | 96 (68.1) |
|
In 43.7% of occasions, patients with Medicaid did not have their insurance accepted, compared to 7.3% for Medicare and 0% for BlueCross. The majority of offices which did not accept Medicaid were not able to refer patients to another surgeon who would accept Medicaid. The requirement to have a primary care referral was the second most common reason for Medicaid patients not obtaining an appointment. No Medicare (10.4% vs 0.0%, P < .0001) or BlueCross (10.4% vs 0.0%, P < .0001) patients experienced this requirement (Table 3). There was no difference found between the percent of Medicaid patients who were required to have referrals in states with and without expanded Medicaid eligibility (Table 4).
Table 3. Referral Rate
| Medicaid | Medicare | Private |
All states |
|
|
|
Yes (%) | 29 (10.4) | 0 (0) | 0 (0) |
No (%) | 251 (89.6) | 280 (100) | 280 (100) |
P-valuea |
| 0.0001 | 0.0001 |
States with expanded Medicaid eligibility |
|
|
|
Yes (%) | 12 (8.6) | 0 (0) | 0 (0) |
No (%) | 127 (91.4) | 139 (100) | 139 (100) |
P-valuea |
| 0.0001 | 0.0001 |
States without expanded Medicaid eligibility |
|
|
|
Yes (%) | 17 (12.1) | 0 (0) | 0 (0) |
No (%) | 124 (87.9) | 141 (100) | 141 (100) |
P-valuea |
| 0.0001 | 0.0001 |
aComparison to Medicaid.
Table 4. Medicaid Referral Rates in Expanded Vs Non-Expanded States
| Expanded states | Non-expanded states | P-value |
Yes (%) | 12 (9.7) | 17 (14.0) | .35 |
No (%) | 127 (91.4) | 124 (87.9) |
|
Reimbursements for ankle fracture varied across states (Table 5). For Medicaid, Georgia paid the highest reimbursement ($1049.95) and Florida paid the lowest ($469.44). Logistic and linear regression analysis did not demonstrate a significant relationship between reimbursement and appointment success rate or waiting periods.
Table 5. Medicaid Reimbursements for Ankle Fracture Repair (CPT and HCPCS 27822) in 2014
State | Medicaid reimbursement |
Californiaa | $785.55 |
Texas | $678.95 |
Florida | $469.44 |
Ohioa | $617.08 |
New Yorka | $500.02 |
North Carolina | $621.63 |
Massachusettsa | $627.94 |
Georgia | $1,049.95 |
Average | $668.82 |
aStates with expanded Medicaid eligibility.
Abbreviations: CPT, Current Procedural Terminology; HCPCS, Healthcare Common Procedure Coding System.
Waiting periods (Table 6) varied significantly by the type of insurance (7.3 days for Medicaid, 6.0 days for Medicare, and 6.0 days for BlueCross; P = .002). For states with expanded Medicaid eligibility, waiting periods varied significantly by insurance (7.7 days for Medicaid, 6.2 days for Medicare, P = .003; and 6.1 days for BlueCross, P = .01). Waiting periods did not vary significantly for states without expanded Medicaid. Additionally, waiting periods did not differ significantly when comparing between states with and without Medicaid expansion.
Table 6. Waiting Period (Days) by Insurance Type.
| Medicaid | Medicare | Private |
Comparison by Insurance Type |
|
|
|
All states |
|
|
|
Waiting period | 7.3 | 6.0 | 6.0 |
P-value |
| 0.002 | 0.002 |
States with expanded Medicaid eligibility |
|
|
|
Waiting period | 7.7 | 6.2 | 6.1 |
P-value |
| 0.003 | 0.01 |
States without expanded Medicaid eligibility |
|
|
|
Waiting period | 6.9 | 5.9 | 5.9 |
P-value |
| 0.15 | 0.15 |
Comparison by Medicaid Expansion |
|
|
|
States with expanded Medicaid eligibility | 7.7 | 6.2 | 6.1 |
States without expanded Medicaid eligibility | 6.9 | 5.9 | 5.9 |
P-value | 0.17 | 0.13 | 0.07 |
Continue to: DISCUSSION...
DISCUSSION
This study assessed how insurance type (Medicaid, Medicare, and BlueCross) affects patient access to orthopedic trauma surgeons in 8 geographically representative states. We selected unstable ankle fractures as they are basic fractures treated by nearly all trauma surgeons and should often be surgically treated to prevent serious long-term consequences. Our hypothesis stated that despite the passage of the PPACA, patients with Medicaid would have reduced access to care. As the PPACA has changed the healthcare marketplace by increasing the number of Medicaid enrollees, it is important to ensure that patient access to care improves.
This nationwide survey of orthopedic trauma surgeons demonstrates that Medicaid patients experience added barriers to care that ultimately results in lower rates of successfully obtaining care. This is consistent with other investigations which have assessed Medicaid patient healthcare access.6,8,10,17-19 This study did not demonstrate a statistically significant difference between Medicaid patients’ ability to obtain appointments in states with expanded Medicaid eligibility vs in states without expanded Medicaid eligibility (39.6% vs 31.9%, P < .18); this has been demonstrated in the literature.6
A barrier that was unique to Medicaid patients was the requirement to have a PCP referral (Table 3). A PCP referral was not a barrier to receiving an appointment for patients with Medicare or BlueCross. One reason to explain why Medicaid patients may be required to have PCP referrals is due to their increased medical complexity, extra documentation requirements, and low reimbursement.4 Patients who have obtained a PCP referral may be characterized as being more medically compliant.
It is important to note that the Medicaid policies for 4 states included in this study (Massachusetts, North Carolina, Texas, and New York) required a PCP referral in order to see a specialist. However, we found that many orthopedic trauma practices in these states scheduled appointments for Medicaid patients without a PCP referral, suggesting that the decision depended on individual policy. In addition, the majority of offices within these states cited that they simply did not accept Medicaid as an insurance policy, and not that they required a referral.
Our regression analysis did not find a significant relationship between being able to successfully obtain an appointment to be evaluated for an ankle fracture and reimbursement rates for Medicaid. Although studies have stressed the importance of Medicaid reimbursements on physician participation, this result is consistent with previous studies regarding carpal tunnel release and total ankle replacements.17,19 Long20 suggested that although reimbursements may help, additional strategies for promoting Medicaid acceptance may be needed, including: lowering the costs of participating in Medicaid by simplifying administrative processes, speeding up reimbursement, and reducing the costs associated with caring for those patients.
Continue to: Previous studies have demonstrated...
Previous studies have demonstrated that more physicians may accept Medicaid if reimbursements increased.4,12 Given the high percentage of trauma patients with Medicaid as their primary insurance or whom are emergently enrolled in Medicaid by hospital systems, it is concerning that the PPACA is reducing payments under the Medicare and Medicaid Disproportionate Share Hospital programs which provide hospitals for uncompensated care given to low-income and uninsured patients.21 Trauma centers generally operate at a deficit due to the higher proportion of Medicaid and uninsured patients.14 This is currently worsened by additional federal funding cuts for supporting trauma service’s humane mission.21
This study has several limitations. While the study evaluated access to care in 8 representative states, a thorough nationwide survey would be more representative. Some results may have become statistically significant if we had performed the study with a larger sample size. In addition, we were unable to control for many factors which could impact appointment wait times, such as physician call schedules and vacations. Socioeconomic factors can influence a patient’s ability to attend an appointment, such as transportation costs, time off from work, and childcare availability. In addition, this study did not assess access for the uninsured, who are predominantly the working poor who cannot afford health insurance, even with federal and state subsidies.
The authors apologize for inconveniencing these offices, however, data collection could not be achieved in a better manner. We hope that the value of this study compensates any inconvenience.
CONCLUSION
Overall, our results demonstrate that despite the ratification of the PPACA, Medicaid patients are confronted with more barriers to accessing care by comparison to patients with Medicare and BlueCross insurance. Medicaid patients have worse baseline health22 and are at an increased risk of complications. These disparities are thought to be due to decreased healthcare access,23,24 as well as socioeconomic challenges. Interventions, such as increasing Medicaid’s reimbursement levels, reducing burdensome administrative responsibilities, and establishing partnerships between trauma centers and trauma surgeons, may enable underinsured patients to be appropriately cared for.
This paper will be judged for the Resident Writer’s Award.
1. Blumenthal D, Collins SR. Health care coverage under the affordable care act--a progress report. N Engl J Med. 2014;371(3):275-281. doi:10.1056/NEJMhpr1405667.
2. Sommers BD. Health care reform's unfinished work--remaining barriers to coverage and access. N Engl J Med. 2015;373(25):2395-2397. doi:10.1056/NEJMp1509462.
3. US Department of Health and Human Services. Centers for Medicare & Medicaid Services. Medicaid & CHIP: February 2015 monthly applications, eligibility determinations and enrollment report. https://www.medicaid.gov/medicaid/program-information/downloads/medicaid-and-chip-february-2015-application-eligibility-and-enrollment-data.pdf. Published May 1, 2015. Accessed May 2015.
4. Iglehart JK, Sommers BD. Medicaid at 50--from welfare program to nation's largest health insurer. N Engl J Med. 2015;372(22):2152-2159. doi:10.1056/NEJMhpr1500791.
5. Kaiser Family Foundation. Medicaid moving forward. http://kff.org/medicaid/fact-sheet/the-medicaid-program-at-a-glance-update/. Updated 2014. Accessed October 10, 2014.
6. Kim CY, Wiznia DH, Hsiang WR, Pelker RR. The effect of insurance type on patient access to knee arthroplasty and revision under the affordable care act. J Arthroplasty. 2015;30(9):1498-1501. doi:10.1016/j.arth.2015.03.015.
7. Draeger RW, Patterson BM, Olsson EC, Schaffer A, Patterson JM. The influence of patient insurance status on access to outpatient orthopedic care for flexor tendon lacerations. J Hand Surg Am. 2014;39(3):527-533. doi:10.1016/j.jhsa.2013.10.031.
8. Patterson BM, Spang JT, Draeger RW, Olsson EC, Creighton RA, Kamath GV. Access to outpatient care for adult rotator cuff patients with private insurance versus Medicaid in North Carolina. J Shoulder Elbow Surg. 2013;22(12):1623-1627. doi:10.1016/j.jse.2013.07.051.
9. Patterson BM, Draeger RW, Olsson EC, Spang JT, Lin FC, Kamath GV. A regional assessment of medicaid access to outpatient orthopaedic care: the influence of population density and proximity to academic medical centers on patient access. J Bone Joint Surg Am. 2014;96(18):e156. doi:10.2106/JBJS.M.01188.
10. Schwarzkopf R, Phan D, Hoang M, Ross S, Mukamel D. Do patients with income-based insurance have access to total joint arthroplasty? J Arthroplasty. 2014;29(6):1083-1086. doi:10.1016/j.arth.2013.11.022.
11. Decker SL. In 2011 nearly one-third of physicians said they would not accept new Medicaid patients, but rising fees may help. Health Aff (Millwood). 2012;31(8):1673-1679 doi:10.1377/hlthaff.2012.0294.
12. Perloff JD, Kletke P, Fossett JW. Which physicians limit their Medicaid participation, and why. Health Serv Res. 1995;30(1):7-26.
13. Althausen PL. Building a successful trauma practice in a community setting. J Orthop Trauma. 2011;25 Suppl 3:S113-S117. doi:10.1097/BOT.0b013e318237bcce.
14. Greenberg S, Mir HR, Jahangir AA, Mehta S, Sethi MK. Impacting policy change for orthopaedic trauma. J Orthop Trauma. 2014;28 Suppl 10:S14-S16. doi:10.1097/BOT.0000000000000216.
15. Wiznia DH, Averbukh L, Kim CY, Goel A, Leslie MP. Motorcycle helmets: The economic burden of an incomplete helmet law to medical care in the state of Connecticut. Conn Med. 2015;79(8):453-459.
16. Orthopaedic Trauma Association. Find a surgeon. https://online.ota.org/otassa/otacenssafindasurgeon.query_page. Updated 2015. Accessed July, 2015.
17. Kim CY, Wiznia DH, Roth AS, Walls RJ, Pelker RR. Survey of patient insurance status on access to specialty foot and ankle care under the affordable care act. Foot Ankle Int. 2016;37(7):776-781. doi:1071100716642015.
18. Patterson BM, Draeger RW, Olsson EC, Spang JT, Lin FC, Kamath GV. A regional assessment of Medicaid access to outpatient orthopaedic care: the influence of population density and proximity to academic medical centers on patient access. J Bone Joint Surg Am. 2014;96(18):e156. doi:10.2106/JBJS.M.01188.
19. Kim CY, Wiznia DH, Wang Y, et al. The effect of insurance type on patient access to carpal tunnel release under the affordable care act. J Hand Surg Am. 2016;41(4):503-509.e1. doi:S0363-5023(16)00104-0.
20. Long SK. Physicians may need more than higher reimbursements to expand Medicaid participation: findings from Washington state. Health Aff (Millwood). 2013;32(9):1560-1567. doi:10.1377/hlthaff.2012.1010.
21. Issar NM, Jahangir AA. The affordable care act and orthopaedic trauma. J Orthop Trauma. 2014;28 Suppl 10:S5-S7. doi:10.1097/BOT.0000000000000211.
22. Hahn B, Flood AB. No insurance, public insurance, and private insurance: do these options contribute to differences in general health? J Health Care Poor Underserved. 1995;6(1):41-59.
23. Hinman A, Bozic KJ. Impact of payer type on resource utilization, outcomes and access to care in total hip arthroplasty. J Arthroplasty. 2008;23(6 Suppl 1):9-14. doi:10.1016/j.arth.2008.05.010.
24. Schoenfeld AJ, Tipirneni R, Nelson JH, Carpenter JE, Iwashyna TJ. The influence of race and ethnicity on complications and mortality after orthopedic surgery: A systematic review of the literature. Med Care. 2014;52(9):842-851. doi:10.1097/MLR.0000000000000177.
ABSTRACT
The purpose of this study is to assess the effect of insurance type (Medicaid, Medicare, private insurance) on the ability for patients with operative ankle fractures to access orthopedic traumatologists. The research team called 245 board-certified orthopedic surgeons specializing in orthopedic trauma within 8 representative states. The caller requested an appointment for their fictitious mother in order to be evaluated for an ankle fracture which was previously evaluated by her primary care physician and believed to require surgery. Each office was called 3 times to assess the response for each insurance type. For each call, information was documented regarding whether the patient was able to receive an appointment and the barriers the patient confronted to receive an appointment. Overall, 35.7% of offices scheduled an appointment for a patient with Medicaid, in comparison to 81.4%and 88.6% for Medicare and BlueCross, respectively (P < .0001). Medicaid patients confronted more barriers for receiving appointments. There was no statistically significant difference in access for Medicaid patients in states that had expanded Medicaid eligibility vs states that had not expanded Medicaid. Medicaid reimbursement for open reduction and internal fixation of an ankle fracture did not significantly correlate with appointment success rates or wait times. Despite the passage of the Affordable Care Act, patients with Medicaid have reduced access to orthopedic surgeons and more complex barriers to receiving appointments. A more robust strategy for increasing care-access for patients with Medicaid would be more equitable.
Continue to: In 2010, the Patient Protection and Affordable Care Act...
In 2010, the Patient Protection and Affordable Care Act (PPACA) expanded the eligibility criteria for Medicaid to all individuals with an income up to 138% of the poverty level.1 A Supreme Court ruling stated that the decision to expand Medicaid was to be decided by individual states.2 Currently, 31 states have chosen to expand Medicaid eligibility to their residents.2 This expansion has allowed an additional 11.7 million people to enroll in Medicaid and the Children’s Health Insurance Program by May 2015.3-5
Even with the passage of the PPACA, Medicaid patients seeking specialty orthopedic care have experienced more barriers to accessing care than Medicare or commercially-insured patients.2,6-10 One major cited reason is Medicaid’s low reimbursement, which may discourage physicians from open panel participation in Medicaid.11,12
A common fundamental teaching for orthopedic traumatologists is the notion that they should be available to treat all injuries regardless of the patient’s ability to pay.13 This has resulted in both trauma centers and trauma surgeons becoming financially challenged due to the higher proportion of Medicaid and uninsured trauma patients and lower Medicaid reimbursement levels.14,15
This study focuses on the effect of different types of insurance (Medicaid, Medicare, or commercial insurance) on the ability of patients to obtain care for operative ankle fractures. The purpose of this study is to evaluate, in the context of the PPACA, patient access to orthopedic surgeons for operative ankle fractures based on insurance-type. We hypothesized that patients with Medicaid would face a greater volume of obstacles when seeking appointments for an ankle fracture, even after the PPACA.
Continue to: MATERIALS AND METHODS...
MATERIALS AND METHODS
The study population included board-certified orthopedic surgeons who belonged to the Orthopaedic Trauma Association (OTA) from 8 representative states; 4 states with expanded Medicaid eligibility (California, Massachusetts, New York, Ohio) and 4 states without expanded Medicaid eligibility (Florida, North Carolina, Georgia, Texas). These states were selected due to their ability to represent diverse healthcare marketplaces throughout the country. Using the OTA website’s “Find a Surgeon” search tool,16 we created a list of surgeons for each state and matched each surgeon with a random number. The list of surgeons was ordered according to the value of the surgeon’s associated random number, and surgeons were called in ascending order. We excluded disconnected or inaccurate numbers from the calling list. Surgeons who did not manage ankle fractures were removed from the dataset. Approximately 30 orthopedic trauma surgeons per state were contacted.
Each office was called to make an appointment for the caller’s mother. Every surgeon’s office was specifically asked if the surgeon would accept the patient to be evaluated for an ankle fracture that occurred out-of-state. The caller had a standardized protocol to limit intra- and inter-office variations (Appendix). The scenario involved a request to be evaluated for an unstable ankle fracture, with the patient having Medicaid, Medicare, or BlueCross insurance. The scenario required 3 separate calls to the same surgeon in order to obtain data regarding each insurance-type. The calls were separated by at least 1 week to avoid caller recognition by the surgeon’s office.
Appendix
Scenario
1. Date of Birth: Medicaid–2/07/55; BlueCross PPO–2/09/55; Medicare–7/31/45.
2. Ankle fracture evaluated by primary care physician 1 or 2 days ago
3. Not seen previously by your clinic or hospital, she would be a new patient
4. Asked how early she could be scheduled for an appointment
5. Script:
“I’m calling for my mother who injured her ankle a few days ago. Her family doctor took an X-ray and believes she has a fracture and needs surgery. Is Dr. X accepting new patients for evaluation and treatment of ankle fractures?” If YES →
“I was wondering if you take Medicaid/Medicare/BlueCross plan?” If YES →
“When is your soonest available appointment?”
The date of each phone call and date of appointment, if provided, were recorded. If the office did not give an appointment, we asked for reasons why. If an appointment was denied for a patient with Medicaid, we asked for a referral to another office that accepted Medicaid. We considered barriers to obtaining an initial appointment, such as requiring a referral from a primary care physician (PCP), as an unsuccessful attempt at making an appointment. We determined the waiting period for an appointment by calculating the time between the date of the call and the date of the appointment. Appointments were not scheduled to ensure that actual patients were not disadvantaged. For both appointment success rates and waiting periods, we stratified the data into 2 groups: states with expanded Medicaid eligibility (California, Massachusetts, New York, Ohio) and states without expanded Medicaid eligibility (Florida, North Carolina, Georgia, Texas).
We obtained Medicaid reimbursement rates for open reduction and internal fixation of an ankle fracture by querying each state’s reimbursement rate using Current Procedural Terminology code 27822.
Chi-square test or Fisher’s exact test was used to analyze acceptance rate differences based on the patient’s type of insurance. To compare the waiting periods for an appointment, we used an independent samples t-test after applying natural log-transformation, as the data was not normally distributed. We performed logistic regression analysis to detect whether reimbursement was a significant predictor of successfully making an appointment for patients, and a linear regression analysis was used to evaluate whether reimbursement predicted waiting periods. Unless otherwise stated, all statistical testing was performed two-tailed at an alpha-level of 0.05.
This study was approved by the Institutional Review Board of Yale University School of Medicine (HIC No. 1363).
Continue to: RESULTS...
RESULTS
In total, 350 offices were contacted across 8 states (4 states with and 4 states without expanded Medicaid eligibility) of which we identified 245 orthopedic surgeons who would surgically treat ankle fractures. The 245 surgeons’ offices were called 3 times for each separate insurance-type.
Table 1. Appointment Success Rate
| Medicaid | Medicare | Private |
All states |
|
| |
Yes (%) | 100 (35.7) | 228 (81.4) | 248 (88.6) |
No (%) | 180 (64.3) | 52 (18.60 | 32 (11.4) |
P-valuea |
| 0.0001 | 0.0001 |
States with expanded Medicaid eligibility |
|
|
|
Yes (%) | 55 (39.6) | 116 (83.5) | 124 (89.2) |
No (%) | 84 (60.4) | 23 (16.5) | 15 (10.8) |
P-valuea |
| 0.0001 | 0.0001 |
States without expanded Medicaid eligibility |
|
|
|
Yes (%) | 45 (31.9) | 112 (79.4) | 124 (87.9) |
No (%) | 96 (68.1) | 29 (20.6) | 17 (12.1) |
P-valuea |
| 0.0001 | 0.0001 |
aComparison to Medicaid.
The overall rate of successfully being offered an appointment with Medicaid was 35.7%, 81.4% for Medicare, and 88.6% for BlueCross (Table 1). For states with expanded Medicaid eligibility, the success rate for obtaining an appointment was 39.6%, 83.5%, and 89.2% for Medicaid, Medicare, and BlueCross, respectively. For states without expanded Medicaid eligibility, the success rate for obtaining an appointment was 31.9% for Medicaid, 79.4% for Medicare, and 87.9% for BlueCross. In all cases, the success rate for obtaining an appointment was significantly lower for Medicaid, compared to Medicare (P < .0001) or BlueCross (P < .0001). Medicaid appointment success rate was 39.6% in expanded states vs 31.9% in non-expanded states, however, the difference was not statistically significant (Table 2).
Table 2. Medicaid Appointment Success Rate in Expanded Vs Non-Expanded States
| Expanded states | Non-expanded states | P-value |
Yes (%) | 55 (39.6) | 45 (31.9) | .181 |
No (%) | 84 (60.4) | 96 (68.1) |
|
In 43.7% of occasions, patients with Medicaid did not have their insurance accepted, compared to 7.3% for Medicare and 0% for BlueCross. The majority of offices which did not accept Medicaid were not able to refer patients to another surgeon who would accept Medicaid. The requirement to have a primary care referral was the second most common reason for Medicaid patients not obtaining an appointment. No Medicare (10.4% vs 0.0%, P < .0001) or BlueCross (10.4% vs 0.0%, P < .0001) patients experienced this requirement (Table 3). There was no difference found between the percent of Medicaid patients who were required to have referrals in states with and without expanded Medicaid eligibility (Table 4).
Table 3. Referral Rate
| Medicaid | Medicare | Private |
All states |
|
|
|
Yes (%) | 29 (10.4) | 0 (0) | 0 (0) |
No (%) | 251 (89.6) | 280 (100) | 280 (100) |
P-valuea |
| 0.0001 | 0.0001 |
States with expanded Medicaid eligibility |
|
|
|
Yes (%) | 12 (8.6) | 0 (0) | 0 (0) |
No (%) | 127 (91.4) | 139 (100) | 139 (100) |
P-valuea |
| 0.0001 | 0.0001 |
States without expanded Medicaid eligibility |
|
|
|
Yes (%) | 17 (12.1) | 0 (0) | 0 (0) |
No (%) | 124 (87.9) | 141 (100) | 141 (100) |
P-valuea |
| 0.0001 | 0.0001 |
aComparison to Medicaid.
Table 4. Medicaid Referral Rates in Expanded Vs Non-Expanded States
| Expanded states | Non-expanded states | P-value |
Yes (%) | 12 (9.7) | 17 (14.0) | .35 |
No (%) | 127 (91.4) | 124 (87.9) |
|
Reimbursements for ankle fracture varied across states (Table 5). For Medicaid, Georgia paid the highest reimbursement ($1049.95) and Florida paid the lowest ($469.44). Logistic and linear regression analysis did not demonstrate a significant relationship between reimbursement and appointment success rate or waiting periods.
Table 5. Medicaid Reimbursements for Ankle Fracture Repair (CPT and HCPCS 27822) in 2014
State | Medicaid reimbursement |
Californiaa | $785.55 |
Texas | $678.95 |
Florida | $469.44 |
Ohioa | $617.08 |
New Yorka | $500.02 |
North Carolina | $621.63 |
Massachusettsa | $627.94 |
Georgia | $1,049.95 |
Average | $668.82 |
aStates with expanded Medicaid eligibility.
Abbreviations: CPT, Current Procedural Terminology; HCPCS, Healthcare Common Procedure Coding System.
Waiting periods (Table 6) varied significantly by the type of insurance (7.3 days for Medicaid, 6.0 days for Medicare, and 6.0 days for BlueCross; P = .002). For states with expanded Medicaid eligibility, waiting periods varied significantly by insurance (7.7 days for Medicaid, 6.2 days for Medicare, P = .003; and 6.1 days for BlueCross, P = .01). Waiting periods did not vary significantly for states without expanded Medicaid. Additionally, waiting periods did not differ significantly when comparing between states with and without Medicaid expansion.
Table 6. Waiting Period (Days) by Insurance Type.
| Medicaid | Medicare | Private |
Comparison by Insurance Type |
|
|
|
All states |
|
|
|
Waiting period | 7.3 | 6.0 | 6.0 |
P-value |
| 0.002 | 0.002 |
States with expanded Medicaid eligibility |
|
|
|
Waiting period | 7.7 | 6.2 | 6.1 |
P-value |
| 0.003 | 0.01 |
States without expanded Medicaid eligibility |
|
|
|
Waiting period | 6.9 | 5.9 | 5.9 |
P-value |
| 0.15 | 0.15 |
Comparison by Medicaid Expansion |
|
|
|
States with expanded Medicaid eligibility | 7.7 | 6.2 | 6.1 |
States without expanded Medicaid eligibility | 6.9 | 5.9 | 5.9 |
P-value | 0.17 | 0.13 | 0.07 |
Continue to: DISCUSSION...
DISCUSSION
This study assessed how insurance type (Medicaid, Medicare, and BlueCross) affects patient access to orthopedic trauma surgeons in 8 geographically representative states. We selected unstable ankle fractures as they are basic fractures treated by nearly all trauma surgeons and should often be surgically treated to prevent serious long-term consequences. Our hypothesis stated that despite the passage of the PPACA, patients with Medicaid would have reduced access to care. As the PPACA has changed the healthcare marketplace by increasing the number of Medicaid enrollees, it is important to ensure that patient access to care improves.
This nationwide survey of orthopedic trauma surgeons demonstrates that Medicaid patients experience added barriers to care that ultimately results in lower rates of successfully obtaining care. This is consistent with other investigations which have assessed Medicaid patient healthcare access.6,8,10,17-19 This study did not demonstrate a statistically significant difference between Medicaid patients’ ability to obtain appointments in states with expanded Medicaid eligibility vs in states without expanded Medicaid eligibility (39.6% vs 31.9%, P < .18); this has been demonstrated in the literature.6
A barrier that was unique to Medicaid patients was the requirement to have a PCP referral (Table 3). A PCP referral was not a barrier to receiving an appointment for patients with Medicare or BlueCross. One reason to explain why Medicaid patients may be required to have PCP referrals is due to their increased medical complexity, extra documentation requirements, and low reimbursement.4 Patients who have obtained a PCP referral may be characterized as being more medically compliant.
It is important to note that the Medicaid policies for 4 states included in this study (Massachusetts, North Carolina, Texas, and New York) required a PCP referral in order to see a specialist. However, we found that many orthopedic trauma practices in these states scheduled appointments for Medicaid patients without a PCP referral, suggesting that the decision depended on individual policy. In addition, the majority of offices within these states cited that they simply did not accept Medicaid as an insurance policy, and not that they required a referral.
Our regression analysis did not find a significant relationship between being able to successfully obtain an appointment to be evaluated for an ankle fracture and reimbursement rates for Medicaid. Although studies have stressed the importance of Medicaid reimbursements on physician participation, this result is consistent with previous studies regarding carpal tunnel release and total ankle replacements.17,19 Long20 suggested that although reimbursements may help, additional strategies for promoting Medicaid acceptance may be needed, including: lowering the costs of participating in Medicaid by simplifying administrative processes, speeding up reimbursement, and reducing the costs associated with caring for those patients.
Continue to: Previous studies have demonstrated...
Previous studies have demonstrated that more physicians may accept Medicaid if reimbursements increased.4,12 Given the high percentage of trauma patients with Medicaid as their primary insurance or whom are emergently enrolled in Medicaid by hospital systems, it is concerning that the PPACA is reducing payments under the Medicare and Medicaid Disproportionate Share Hospital programs which provide hospitals for uncompensated care given to low-income and uninsured patients.21 Trauma centers generally operate at a deficit due to the higher proportion of Medicaid and uninsured patients.14 This is currently worsened by additional federal funding cuts for supporting trauma service’s humane mission.21
This study has several limitations. While the study evaluated access to care in 8 representative states, a thorough nationwide survey would be more representative. Some results may have become statistically significant if we had performed the study with a larger sample size. In addition, we were unable to control for many factors which could impact appointment wait times, such as physician call schedules and vacations. Socioeconomic factors can influence a patient’s ability to attend an appointment, such as transportation costs, time off from work, and childcare availability. In addition, this study did not assess access for the uninsured, who are predominantly the working poor who cannot afford health insurance, even with federal and state subsidies.
The authors apologize for inconveniencing these offices, however, data collection could not be achieved in a better manner. We hope that the value of this study compensates any inconvenience.
CONCLUSION
Overall, our results demonstrate that despite the ratification of the PPACA, Medicaid patients are confronted with more barriers to accessing care by comparison to patients with Medicare and BlueCross insurance. Medicaid patients have worse baseline health22 and are at an increased risk of complications. These disparities are thought to be due to decreased healthcare access,23,24 as well as socioeconomic challenges. Interventions, such as increasing Medicaid’s reimbursement levels, reducing burdensome administrative responsibilities, and establishing partnerships between trauma centers and trauma surgeons, may enable underinsured patients to be appropriately cared for.
This paper will be judged for the Resident Writer’s Award.
1. Blumenthal D, Collins SR. Health care coverage under the affordable care act--a progress report. N Engl J Med. 2014;371(3):275-281. doi:10.1056/NEJMhpr1405667.
2. Sommers BD. Health care reform's unfinished work--remaining barriers to coverage and access. N Engl J Med. 2015;373(25):2395-2397. doi:10.1056/NEJMp1509462.
3. US Department of Health and Human Services. Centers for Medicare & Medicaid Services. Medicaid & CHIP: February 2015 monthly applications, eligibility determinations and enrollment report. https://www.medicaid.gov/medicaid/program-information/downloads/medicaid-and-chip-february-2015-application-eligibility-and-enrollment-data.pdf. Published May 1, 2015. Accessed May 2015.
4. Iglehart JK, Sommers BD. Medicaid at 50--from welfare program to nation's largest health insurer. N Engl J Med. 2015;372(22):2152-2159. doi:10.1056/NEJMhpr1500791.
5. Kaiser Family Foundation. Medicaid moving forward. http://kff.org/medicaid/fact-sheet/the-medicaid-program-at-a-glance-update/. Updated 2014. Accessed October 10, 2014.
6. Kim CY, Wiznia DH, Hsiang WR, Pelker RR. The effect of insurance type on patient access to knee arthroplasty and revision under the affordable care act. J Arthroplasty. 2015;30(9):1498-1501. doi:10.1016/j.arth.2015.03.015.
7. Draeger RW, Patterson BM, Olsson EC, Schaffer A, Patterson JM. The influence of patient insurance status on access to outpatient orthopedic care for flexor tendon lacerations. J Hand Surg Am. 2014;39(3):527-533. doi:10.1016/j.jhsa.2013.10.031.
8. Patterson BM, Spang JT, Draeger RW, Olsson EC, Creighton RA, Kamath GV. Access to outpatient care for adult rotator cuff patients with private insurance versus Medicaid in North Carolina. J Shoulder Elbow Surg. 2013;22(12):1623-1627. doi:10.1016/j.jse.2013.07.051.
9. Patterson BM, Draeger RW, Olsson EC, Spang JT, Lin FC, Kamath GV. A regional assessment of medicaid access to outpatient orthopaedic care: the influence of population density and proximity to academic medical centers on patient access. J Bone Joint Surg Am. 2014;96(18):e156. doi:10.2106/JBJS.M.01188.
10. Schwarzkopf R, Phan D, Hoang M, Ross S, Mukamel D. Do patients with income-based insurance have access to total joint arthroplasty? J Arthroplasty. 2014;29(6):1083-1086. doi:10.1016/j.arth.2013.11.022.
11. Decker SL. In 2011 nearly one-third of physicians said they would not accept new Medicaid patients, but rising fees may help. Health Aff (Millwood). 2012;31(8):1673-1679 doi:10.1377/hlthaff.2012.0294.
12. Perloff JD, Kletke P, Fossett JW. Which physicians limit their Medicaid participation, and why. Health Serv Res. 1995;30(1):7-26.
13. Althausen PL. Building a successful trauma practice in a community setting. J Orthop Trauma. 2011;25 Suppl 3:S113-S117. doi:10.1097/BOT.0b013e318237bcce.
14. Greenberg S, Mir HR, Jahangir AA, Mehta S, Sethi MK. Impacting policy change for orthopaedic trauma. J Orthop Trauma. 2014;28 Suppl 10:S14-S16. doi:10.1097/BOT.0000000000000216.
15. Wiznia DH, Averbukh L, Kim CY, Goel A, Leslie MP. Motorcycle helmets: The economic burden of an incomplete helmet law to medical care in the state of Connecticut. Conn Med. 2015;79(8):453-459.
16. Orthopaedic Trauma Association. Find a surgeon. https://online.ota.org/otassa/otacenssafindasurgeon.query_page. Updated 2015. Accessed July, 2015.
17. Kim CY, Wiznia DH, Roth AS, Walls RJ, Pelker RR. Survey of patient insurance status on access to specialty foot and ankle care under the affordable care act. Foot Ankle Int. 2016;37(7):776-781. doi:1071100716642015.
18. Patterson BM, Draeger RW, Olsson EC, Spang JT, Lin FC, Kamath GV. A regional assessment of Medicaid access to outpatient orthopaedic care: the influence of population density and proximity to academic medical centers on patient access. J Bone Joint Surg Am. 2014;96(18):e156. doi:10.2106/JBJS.M.01188.
19. Kim CY, Wiznia DH, Wang Y, et al. The effect of insurance type on patient access to carpal tunnel release under the affordable care act. J Hand Surg Am. 2016;41(4):503-509.e1. doi:S0363-5023(16)00104-0.
20. Long SK. Physicians may need more than higher reimbursements to expand Medicaid participation: findings from Washington state. Health Aff (Millwood). 2013;32(9):1560-1567. doi:10.1377/hlthaff.2012.1010.
21. Issar NM, Jahangir AA. The affordable care act and orthopaedic trauma. J Orthop Trauma. 2014;28 Suppl 10:S5-S7. doi:10.1097/BOT.0000000000000211.
22. Hahn B, Flood AB. No insurance, public insurance, and private insurance: do these options contribute to differences in general health? J Health Care Poor Underserved. 1995;6(1):41-59.
23. Hinman A, Bozic KJ. Impact of payer type on resource utilization, outcomes and access to care in total hip arthroplasty. J Arthroplasty. 2008;23(6 Suppl 1):9-14. doi:10.1016/j.arth.2008.05.010.
24. Schoenfeld AJ, Tipirneni R, Nelson JH, Carpenter JE, Iwashyna TJ. The influence of race and ethnicity on complications and mortality after orthopedic surgery: A systematic review of the literature. Med Care. 2014;52(9):842-851. doi:10.1097/MLR.0000000000000177.
TAKE-HOME POINTS
- One method in which the PPACA increased the number of individuals with health insurance coverage was by expanding Medicaid eligibility requirements.
- Despite this, Medicaid patients confronted more barriers to accessing care.
- The overall rate of successfully being offered an appointment with Medicaid was 35.7%, 81.4% for Medicare, and 88.6% for BlueCross. Patients with Medicaid also confronted longer appointment wait times.
- The disparity in access for this operative trauma scenario suggests that patients with Medicaid are likely to be excluded from the practice of their choice and may need to make considerably more effort to secure an appointment.
- Ultimately, Medicaid patients may have access to care through federally funded community health centers and public and non-profit safety net hospitals, which generally care for more uninsured and Medicaid patient populations.
Improved Transitional Care Through an Innovative Hospitalist Model: Expanding Clinician Practice From Acute to Subacute Care
Hospitalist physician rotations between acute inpatient hospitals and subacute care facilities with dedicated time in each environment may foster quality improvement and educational opportunities.
Care transitions between hospitals and skilled nursing facilities (SNFs) are a vulnerable time for patients. The current health care climate of decreasing hospital length of stay, readmission penalties, and increasing patient complexity has made hospital care transitions an important safety concern. Suboptimal transitions across clinical settings can result in adverse events, inadequately controlled comorbidities, deficient patient and caregiver preparation for discharge, medication errors, relocation stress, and overall increased morbidity and mortality.1,2 Such care transitions also may generate unnecessary spending, including avoidable readmissions, emergency department utilization, and duplicative laboratory and imaging studies. Approximately 23% of patients admitted to SNFs are readmitted to acute care hospitals within 30 days, and these patients have increased mortality rates in risk-adjusted analyses. 3,4
Compounding the magnitude of this risk and vulnerability is the significant growth in the number of patients discharged to SNFs over the past 30 years. In 2013, more than 20% of Medicare patients discharged from acute care hospitals were destined for SNFs.5,6 Paradoxically, despite the increasing need for SNF providers, there is a shortage of clinicians with training in geriatrics or nursing home care.7 The result is a growing need to identify organizational systems to optimize physician practice in these settings, enhance quality of care, especially around transitions, and increase educational training opportunities in SNFs for future practitioners.
Many SNFs today are staffed by physicians and other licensed clinicians whose exclusive practice location is the nursing facility or possibly several such facilities. This prevailing model of care can isolate the physicians, depriving them of interaction with clinicians in other specialties, and can contribute to burnout.8 This model does not lend itself to academic scholarship, quality improvement (QI), and student or resident training, as each of these endeavors depends on interprofessional collaboration as well as access to an academic medical center with additional resources.9
Few studies have described innovative hospitalist rotation models from acute to subacute care. The Cleveland Clinic implemented the Connected Care model where hospital-employed physicians and advanced practice professionals integrated into postacute care and reduced the 30-day hospital readmission rate from SNFs from 28% to 22%.10 Goth and colleagues performed a comparative effectiveness trial between a postacute care hospitalist (PACH) model and a community-based physician model of nursing home care. They found that the institution of a PACH model in a nursing home was associated with a significant increase in laboratory costs, nonsignificant reduction in medication errors and pharmacy costs, and no improvement in fall rates.11 The conclusion was that the PACH model may lead to greater clinician involvement and that the potential decrease in pharmacy costs and medications errors may offset the costs associated with additional laboratory testing. Overall, there has been a lack of studies on the impact of these hospitalist rotation models from acute to subacute care on educational programs, QI activities, and the interprofessional environment.
To achieve a system in which physicians in a SNF can excel in these areas, Veterans Affairs Boston Healthcare System (VABHS) adopted a staffing model in which academic hospitalist physicians rotate between the inpatient hospital and subacute settings. This report describes the model structure, the varying roles of the physicians, and early indicators of its positive effects on educational programs, QI activities, and the interprofessional environment.
Methods
The VABHS consists of a 159-bed acute care hospital in West Roxbury, Massachusetts; and a 110-bed SNF in Brockton, Massachusetts, with 3 units: a 65-bed transitional care unit (TCU), a 30-bed long-term care unit, and a 15-bed palliative care/hospice unit. The majority of patients admitted to the SNF are transferred from the acute care hospital in West Roxbury and other regional hospitals. Prior to 2015, the TCU was staffed with full-time clinicians who exclusively practiced in the SNF.
In the new staffing model, 6 hospitalist physicians divide their clinical time between the acute care hospital’s inpatient medical service and the TCU. The hospitalists come from varied backgrounds in terms of years in practice and advanced training (Table 1). 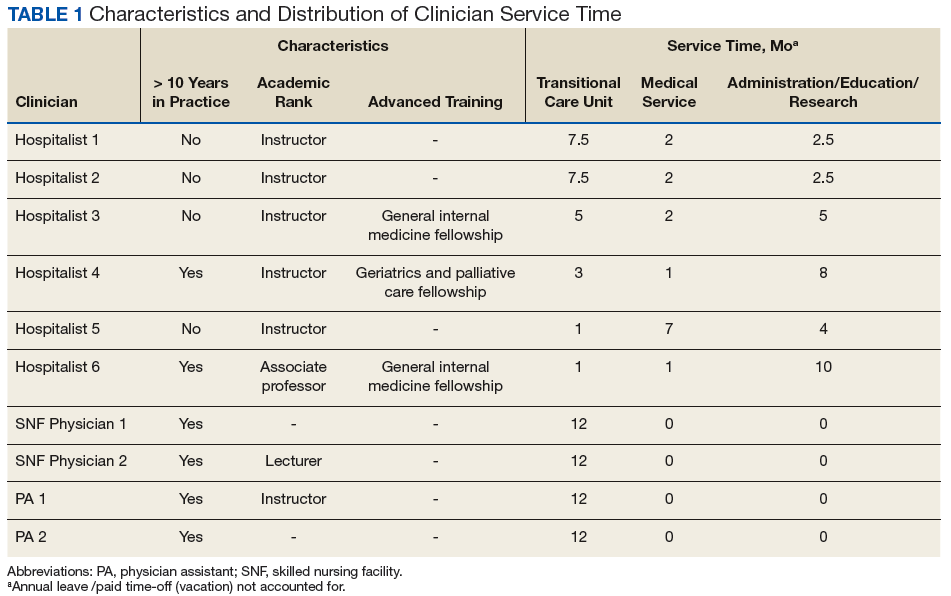
The amount of nonclinical (protected) time and clinical time on the acute inpatient service and the TCU varies for each physician. For example, a physician serves as principal investigator for several major research grants and has a hospital-wide administrative leadership role; as a result, the principal investigator has fewer months of clinical responsibility. Physicians are expected to use the protected time for scholarship, educational program development and teaching, QI, and administrative responsibilities. The VABHS leadership determines the amount of protected time based on individualized benchmarks for research, education, and administrative responsibilities that follow VA national and local institutional guidelines. These metrics and time allocations are negotiated at the time of recruitment and then are reviewed annually.
The TCU also is staffed with 4 full-time clinicians (2 physicians and 2 physician assistants) who provide additional continuity of care. The new hospitalist staffing model only required an approximate 10% increase in TCU clinical staffing full-time equivalents. Patients and admissions are divided equally among clinicians on service (census per clinician 12-15 patients), with redistribution of patients at times of transition from clinical to nonclinical time. Blocks of clinical time are scheduled for greater than 2 weeks at a time to preserve continuity. In addition, the new staffing model allocates assignment of clinical responsibilities that allows for clinicians to take leave without resultant shortages in clinical coverage.
To facilitate communication among physicians serving in the acute inpatient facility and the TCU, leaders of both of these programs meet monthly and ad hoc to review the transitions of care between the 2 settings. The description of this model and its assessment have been reviewed and deemed exempt from oversight by the VA Boston Healthcare System Research and Development Committee.
Results
Since the implementation of this staffing model in 2015, the system has grown considerably in the breadth and depth of educational programming, QI, and systems redesign in the TCU and, more broadly, in the SNF. The TCU, which previously had limited training opportunities, has experienced marked expansion of educational offerings. It is now a site for core general medicine rotations for first-year psychiatry residents and physician assistant students. The TCU also has expanded as a clinical site for transitions-in-care internal medicine resident curricula and electives, as well as a clinical site for a geriatrics fellowship.
A hospitalist developed and implemented a 4-week interprofessional curriculum for all clinical trainees and students, which occurs continuously. The curriculum includes a monthly academic conference and 12 didactic lectures and is taught by 16 interprofessional faculty from the TCU and the Palliative Care/Hospice Unit, including medicine, geriatric and palliative care physicians, physician assistants, social workers, physical and occupational therapists, pharmacists, and a geriatric psychologist. The goal of the curriculum is to provide learners the knowledge, attitudes, and skills necessary to perform effective, efficient, and safe transfers between clinical settings as well as education in transitional care. In addition, using a team of interprofessional faculty, the curriculum develops the interprofessional competencies of teamwork and communication. The curriculum also has provided a significant opportunity for interprofessional collaboration among faculty who have volunteered their teaching time in the development and teaching of the curriculum, with potential for improved clinical staff knowledge of other disciplines.
Quality improvement and system redesign projects in care transitions also have expanded (Table 2). 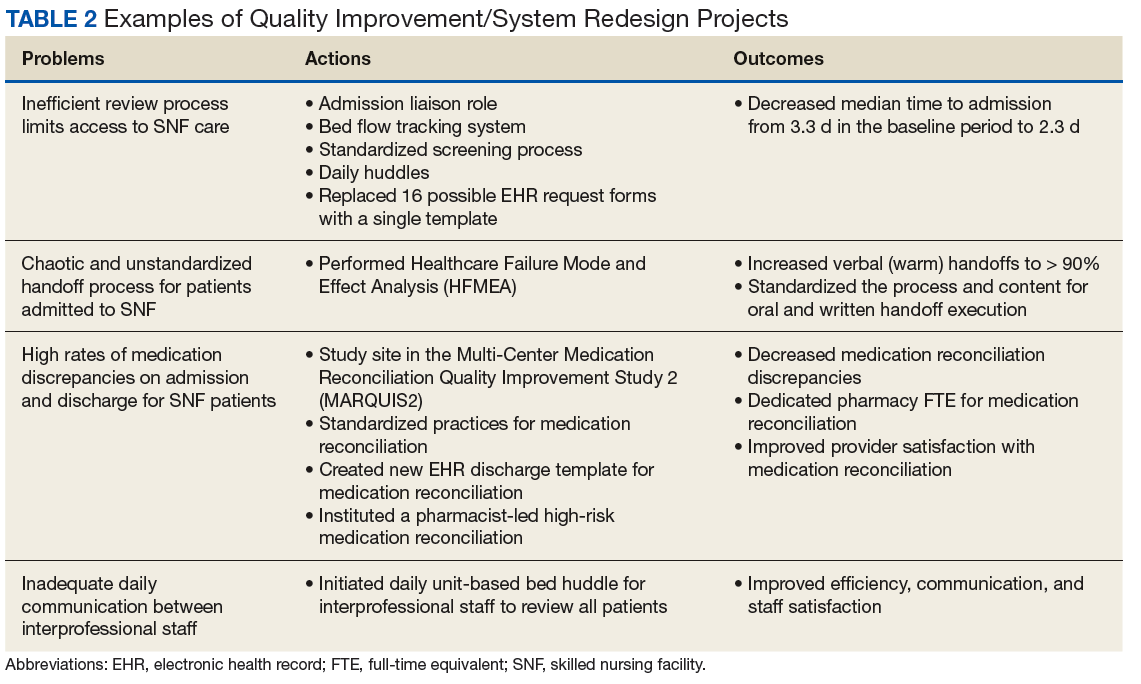
Early assessment indicates that the new staffing model is having positive effects on the clinical environment of the TCU. A survey was conducted of a convenience sample of all physicians, nurse managers, social workers, and other members of the clinical team in the TCU (N=24)(Table 3), with response categories ranging on a Likert scale from 1 (very negative) to 5 (very positive). 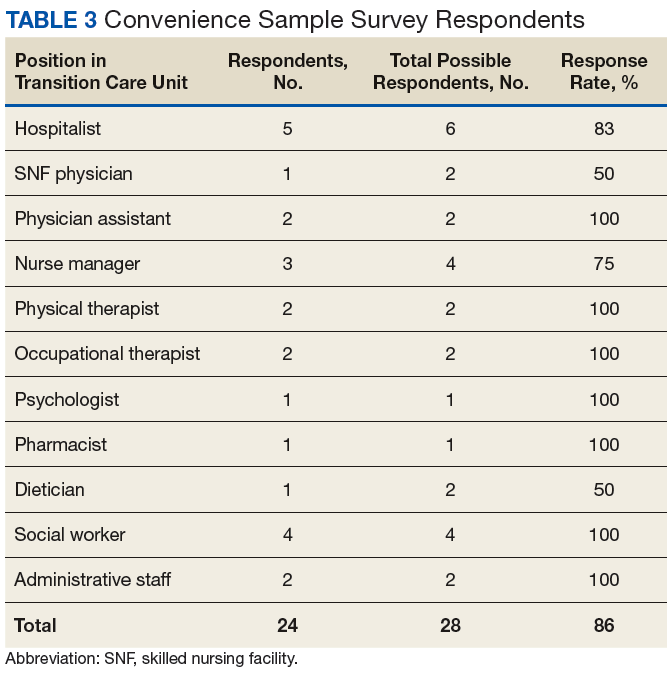
Although not rigorously analyzed using qualitative research methods, comments from respondents have consistently indicated that this staffing model increases the transfer of clinical and logistical knowledge among staff members working in the acute inpatient facility and the TCU. 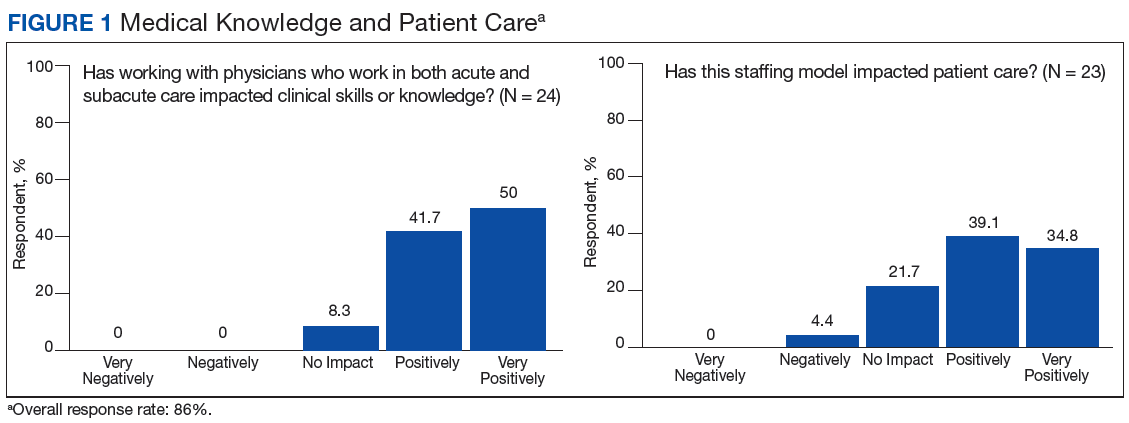
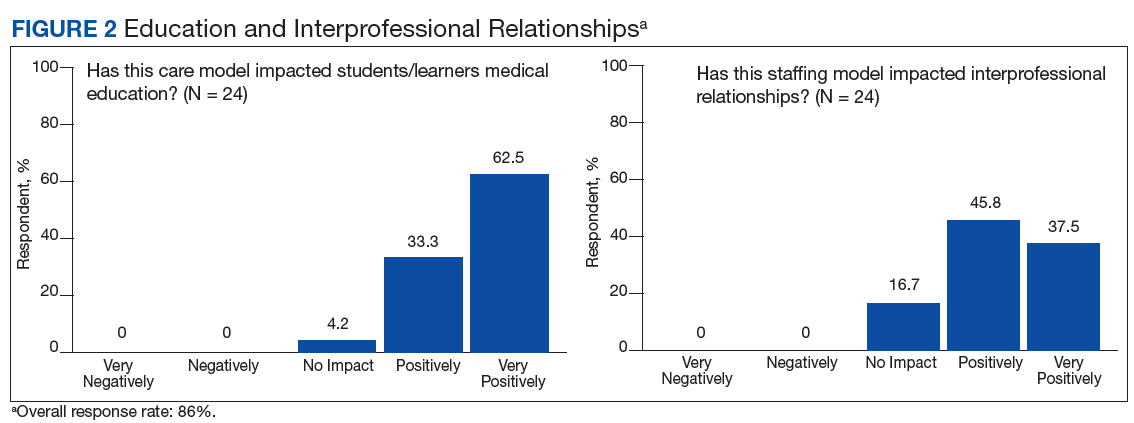
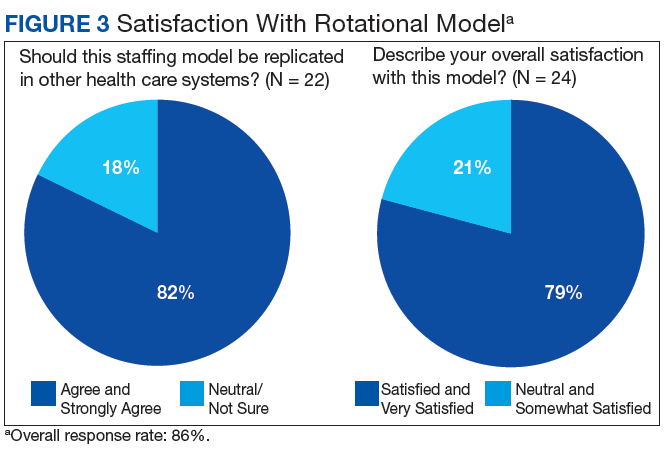
Discussion
With greater numbers of increasingly complex patients transitioning from the hospital to SNF, health care systems need to expand the capacity of their skilled nursing systems, not only to provide clinical care, but also to support QI and medical education. The VABHS developed a physician staffing model with the goal of enriching physician practice and enhancing QI and educational opportunities in its SNF. The model offers an opportunity to improve transitions in care as physicians gain a greater knowledge of both the hospital and subacute clinical settings. This hospitalist rotation model may improve the knowledge necessary for caring for patients moving across care settings, as well as improve communication between settings. It also has served as a foundation for systematic innovation in QI and education at this institution. Clinical staff in the transitional care setting have reported positive effects of this model on clinical skills and patient care, educational opportunities, as well as a desire for replication in other health care systems.
The potential generalizability of this model requires careful consideration. The VABHS is a tertiary care integrated health care system, enabling physicians to work in multiple clinical settings. Other settings may not have the staffing or clinical volume to sustain such a model. In addition, this model may increase discontinuity in patient care as hospitalists move between acute and subacute settings and nonclinical roles. This loss of continuity may be a greater concern in the SNF setting, as the inpatient hospitalist model generally involves high provider turnover as shift work. Our survey included nurse managers, and not floor nurses due to survey administration limitations, and feedback may not have captured a comprehensive view from CLC staff. Moreover, some of the perceived positive impacts also may be related to professional and personal attributes of the physicians rather than the actual model of care. In addition, the survey response rate was 86%. However, the nature of the improvement work (focused on care transitions) and educational opportunities (interprofessional care) would likely not occur had the physicians been based in one clinical setting.
Other new physician staffing models have been designed to improve the continuity between the hospital, subacute, and outpatient settings. For example, the University of Chicago Comprehensive Care model pairs patients with trained hospitalists who provide both inpatient and outpatient care, thereby optimizing continuity between these settings.14 At CareMore Health System, high-risk patients also are paired with hospitalists, referred to as “extensivists,” who lead care teams that follow patients between settings and provide acute, postacute, and outpatient care.15 In these models, a single physician takes responsibility for the patient throughout transitions of care and through various care settings. Both models have shown reduction in hospital readmissions. One concern with such models is that the treatment teams need to coexist in the various settings of care, and the ability to impact and create systematic change within each environment is limited. This may limit QI, educational opportunities, and system level impact within each environment of care.
In comparison, the “transitionalist” model proposed here features hospitalist physicians rotating between the acute inpatient hospital and subacute care with dedicated time in each environment. This innovative organizational structure may enhance physician practice and enrich QI and educational opportunities in SNFs. Further evaluation will include the impact on quality metrics of patient care and patient satisfaction, as this model has the potential to influence quality, cost, and overall health outcomes.
Acknowledgments
We would like to thank Shivani Jindal, Matthew Russell, Matthew Ronan, Juman Hijab, Wei Shen, Sandra Vilbrun-Bruno, and Jack Earnshaw for their significant contributions to this staffing model. We would also like to thank Paul Conlin, Jay Orlander, and the leadership team of Veterans Affairs Boston Healthcare System for supporting this staffing model.
1. Forster AJ, Murff HJ, Peterson JF, Gandhi TK, Bates DW. Adverse drug events occurring following hospital discharge. J Gen Intern Med. 2005;20(4):317-323.
2. Murtaugh CM, Litke A. Transitions through postacute and long-term care settings: patterns of use and outcomes for a national cohort of elders. Med Care. 2002;40(3):227-236.
3. Burke RE, Whitfield EA, Hittle D, et al. Hospital readmission from post-acute care facilities: risk factors, timing, and outcomes. J Am Med Dir Assoc. 2016;17(3):249-255.
4. Mor V, Intrator O, Feng Z, Grabowski DC. The revolving door of rehospitalization from skilled nursing facilities. Health Aff (Millwood). 2010;29(1):57-64.
5. Tian W. An all-payer view of hospital discharge to postacute care, 2013: Statistical Brief #205. https://www.hcup-us.ahrq.gov/reports/statbriefs/sb205-Hospital-Discharge-Postacute-Care.jsp. Published May 2016. Accessed August 13, 2018.
6. Barnett ML, Grabowski DC, Mehrotra A. Home-to-home time–measuring what matters to patients and payers. N Engl J Med. 2017;377(1):4-6.
7. Golden AG, Silverman MA, Mintzer MJ. Is geriatric medicine terminally ill? Ann Intern Med. 2012;156(9):654-656.
8. Nazir A, Smalbrugge M, Moser A, et al. The prevalence of burnout among nursing home physicians: an international perspective. J Am Med Dir Assoc. 2018;19(1):86-88.
9. Coleman EA, Berenson RA. Lost in transition: challenges and opportunities for improving the quality of transitional care. Ann Intern Med. 2004;141(7):533-536.
10. Kim LD, Kou L, Hu B, Gorodeski EZ, Rothberg MB. Impact of a connected care model on 30-day readmission rates from skilled nursing facilities. J Hosp Med. 2017;12(4):238-244.
11. Gloth MF, Gloth MJ. A comparative effectiveness trial between a post-acute care hospitalist model and a community-based physician model of nursing home care. J Am Med Dir Assoc. 2011;12(5):384-386.
12. Baughman AW, Cain G, Ruopp MD, et al. Improving access to care by admission process redesign in a veterans affairs skilled nursing facility. Jt Comm J Qual Patient Saf. 2018;44(8):454-462.
13. Mixon A, Smith GR, Dalal A et al. The Multi-Center Medication Reconciliation Quality Improvement Study 2 (MARQUIS2): methods and implementation. Abstract 248. Present at: Society of Hospital Medicine Annual Meeting; 2018 Apr 8 – 11, 2018; Orlando, FL. https://www.shmabstracts.com/abstract/the-multi-center-medication-reconciliation-quality-improvement-study-2-marquis2-methods-and-implementation. Accessed August 13, 2018.
14. Meltzer DO, Ruhnke GW. Redesigning care for patients at increased hospitalization risk: the comprehensive care physician model. Health Aff (Millwood). 2014;33(5):770-777.
15. Powers BW, Milstein A, Jain SH. Delivery models for high-risk older patients: back to the future? JAMA. 2016;315(1):23-24.
Hospitalist physician rotations between acute inpatient hospitals and subacute care facilities with dedicated time in each environment may foster quality improvement and educational opportunities.
Hospitalist physician rotations between acute inpatient hospitals and subacute care facilities with dedicated time in each environment may foster quality improvement and educational opportunities.
Care transitions between hospitals and skilled nursing facilities (SNFs) are a vulnerable time for patients. The current health care climate of decreasing hospital length of stay, readmission penalties, and increasing patient complexity has made hospital care transitions an important safety concern. Suboptimal transitions across clinical settings can result in adverse events, inadequately controlled comorbidities, deficient patient and caregiver preparation for discharge, medication errors, relocation stress, and overall increased morbidity and mortality.1,2 Such care transitions also may generate unnecessary spending, including avoidable readmissions, emergency department utilization, and duplicative laboratory and imaging studies. Approximately 23% of patients admitted to SNFs are readmitted to acute care hospitals within 30 days, and these patients have increased mortality rates in risk-adjusted analyses. 3,4
Compounding the magnitude of this risk and vulnerability is the significant growth in the number of patients discharged to SNFs over the past 30 years. In 2013, more than 20% of Medicare patients discharged from acute care hospitals were destined for SNFs.5,6 Paradoxically, despite the increasing need for SNF providers, there is a shortage of clinicians with training in geriatrics or nursing home care.7 The result is a growing need to identify organizational systems to optimize physician practice in these settings, enhance quality of care, especially around transitions, and increase educational training opportunities in SNFs for future practitioners.
Many SNFs today are staffed by physicians and other licensed clinicians whose exclusive practice location is the nursing facility or possibly several such facilities. This prevailing model of care can isolate the physicians, depriving them of interaction with clinicians in other specialties, and can contribute to burnout.8 This model does not lend itself to academic scholarship, quality improvement (QI), and student or resident training, as each of these endeavors depends on interprofessional collaboration as well as access to an academic medical center with additional resources.9
Few studies have described innovative hospitalist rotation models from acute to subacute care. The Cleveland Clinic implemented the Connected Care model where hospital-employed physicians and advanced practice professionals integrated into postacute care and reduced the 30-day hospital readmission rate from SNFs from 28% to 22%.10 Goth and colleagues performed a comparative effectiveness trial between a postacute care hospitalist (PACH) model and a community-based physician model of nursing home care. They found that the institution of a PACH model in a nursing home was associated with a significant increase in laboratory costs, nonsignificant reduction in medication errors and pharmacy costs, and no improvement in fall rates.11 The conclusion was that the PACH model may lead to greater clinician involvement and that the potential decrease in pharmacy costs and medications errors may offset the costs associated with additional laboratory testing. Overall, there has been a lack of studies on the impact of these hospitalist rotation models from acute to subacute care on educational programs, QI activities, and the interprofessional environment.
To achieve a system in which physicians in a SNF can excel in these areas, Veterans Affairs Boston Healthcare System (VABHS) adopted a staffing model in which academic hospitalist physicians rotate between the inpatient hospital and subacute settings. This report describes the model structure, the varying roles of the physicians, and early indicators of its positive effects on educational programs, QI activities, and the interprofessional environment.
Methods
The VABHS consists of a 159-bed acute care hospital in West Roxbury, Massachusetts; and a 110-bed SNF in Brockton, Massachusetts, with 3 units: a 65-bed transitional care unit (TCU), a 30-bed long-term care unit, and a 15-bed palliative care/hospice unit. The majority of patients admitted to the SNF are transferred from the acute care hospital in West Roxbury and other regional hospitals. Prior to 2015, the TCU was staffed with full-time clinicians who exclusively practiced in the SNF.
In the new staffing model, 6 hospitalist physicians divide their clinical time between the acute care hospital’s inpatient medical service and the TCU. The hospitalists come from varied backgrounds in terms of years in practice and advanced training (Table 1).
The amount of nonclinical (protected) time and clinical time on the acute inpatient service and the TCU varies for each physician. For example, a physician serves as principal investigator for several major research grants and has a hospital-wide administrative leadership role; as a result, the principal investigator has fewer months of clinical responsibility. Physicians are expected to use the protected time for scholarship, educational program development and teaching, QI, and administrative responsibilities. The VABHS leadership determines the amount of protected time based on individualized benchmarks for research, education, and administrative responsibilities that follow VA national and local institutional guidelines. These metrics and time allocations are negotiated at the time of recruitment and then are reviewed annually.
The TCU also is staffed with 4 full-time clinicians (2 physicians and 2 physician assistants) who provide additional continuity of care. The new hospitalist staffing model only required an approximate 10% increase in TCU clinical staffing full-time equivalents. Patients and admissions are divided equally among clinicians on service (census per clinician 12-15 patients), with redistribution of patients at times of transition from clinical to nonclinical time. Blocks of clinical time are scheduled for greater than 2 weeks at a time to preserve continuity. In addition, the new staffing model allocates assignment of clinical responsibilities that allows for clinicians to take leave without resultant shortages in clinical coverage.
To facilitate communication among physicians serving in the acute inpatient facility and the TCU, leaders of both of these programs meet monthly and ad hoc to review the transitions of care between the 2 settings. The description of this model and its assessment have been reviewed and deemed exempt from oversight by the VA Boston Healthcare System Research and Development Committee.
Results
Since the implementation of this staffing model in 2015, the system has grown considerably in the breadth and depth of educational programming, QI, and systems redesign in the TCU and, more broadly, in the SNF. The TCU, which previously had limited training opportunities, has experienced marked expansion of educational offerings. It is now a site for core general medicine rotations for first-year psychiatry residents and physician assistant students. The TCU also has expanded as a clinical site for transitions-in-care internal medicine resident curricula and electives, as well as a clinical site for a geriatrics fellowship.
A hospitalist developed and implemented a 4-week interprofessional curriculum for all clinical trainees and students, which occurs continuously. The curriculum includes a monthly academic conference and 12 didactic lectures and is taught by 16 interprofessional faculty from the TCU and the Palliative Care/Hospice Unit, including medicine, geriatric and palliative care physicians, physician assistants, social workers, physical and occupational therapists, pharmacists, and a geriatric psychologist. The goal of the curriculum is to provide learners the knowledge, attitudes, and skills necessary to perform effective, efficient, and safe transfers between clinical settings as well as education in transitional care. In addition, using a team of interprofessional faculty, the curriculum develops the interprofessional competencies of teamwork and communication. The curriculum also has provided a significant opportunity for interprofessional collaboration among faculty who have volunteered their teaching time in the development and teaching of the curriculum, with potential for improved clinical staff knowledge of other disciplines.
Quality improvement and system redesign projects in care transitions also have expanded (Table 2).
Early assessment indicates that the new staffing model is having positive effects on the clinical environment of the TCU. A survey was conducted of a convenience sample of all physicians, nurse managers, social workers, and other members of the clinical team in the TCU (N=24)(Table 3), with response categories ranging on a Likert scale from 1 (very negative) to 5 (very positive).
Although not rigorously analyzed using qualitative research methods, comments from respondents have consistently indicated that this staffing model increases the transfer of clinical and logistical knowledge among staff members working in the acute inpatient facility and the TCU.
Discussion
With greater numbers of increasingly complex patients transitioning from the hospital to SNF, health care systems need to expand the capacity of their skilled nursing systems, not only to provide clinical care, but also to support QI and medical education. The VABHS developed a physician staffing model with the goal of enriching physician practice and enhancing QI and educational opportunities in its SNF. The model offers an opportunity to improve transitions in care as physicians gain a greater knowledge of both the hospital and subacute clinical settings. This hospitalist rotation model may improve the knowledge necessary for caring for patients moving across care settings, as well as improve communication between settings. It also has served as a foundation for systematic innovation in QI and education at this institution. Clinical staff in the transitional care setting have reported positive effects of this model on clinical skills and patient care, educational opportunities, as well as a desire for replication in other health care systems.
The potential generalizability of this model requires careful consideration. The VABHS is a tertiary care integrated health care system, enabling physicians to work in multiple clinical settings. Other settings may not have the staffing or clinical volume to sustain such a model. In addition, this model may increase discontinuity in patient care as hospitalists move between acute and subacute settings and nonclinical roles. This loss of continuity may be a greater concern in the SNF setting, as the inpatient hospitalist model generally involves high provider turnover as shift work. Our survey included nurse managers, and not floor nurses due to survey administration limitations, and feedback may not have captured a comprehensive view from CLC staff. Moreover, some of the perceived positive impacts also may be related to professional and personal attributes of the physicians rather than the actual model of care. In addition, the survey response rate was 86%. However, the nature of the improvement work (focused on care transitions) and educational opportunities (interprofessional care) would likely not occur had the physicians been based in one clinical setting.
Other new physician staffing models have been designed to improve the continuity between the hospital, subacute, and outpatient settings. For example, the University of Chicago Comprehensive Care model pairs patients with trained hospitalists who provide both inpatient and outpatient care, thereby optimizing continuity between these settings.14 At CareMore Health System, high-risk patients also are paired with hospitalists, referred to as “extensivists,” who lead care teams that follow patients between settings and provide acute, postacute, and outpatient care.15 In these models, a single physician takes responsibility for the patient throughout transitions of care and through various care settings. Both models have shown reduction in hospital readmissions. One concern with such models is that the treatment teams need to coexist in the various settings of care, and the ability to impact and create systematic change within each environment is limited. This may limit QI, educational opportunities, and system level impact within each environment of care.
In comparison, the “transitionalist” model proposed here features hospitalist physicians rotating between the acute inpatient hospital and subacute care with dedicated time in each environment. This innovative organizational structure may enhance physician practice and enrich QI and educational opportunities in SNFs. Further evaluation will include the impact on quality metrics of patient care and patient satisfaction, as this model has the potential to influence quality, cost, and overall health outcomes.
Acknowledgments
We would like to thank Shivani Jindal, Matthew Russell, Matthew Ronan, Juman Hijab, Wei Shen, Sandra Vilbrun-Bruno, and Jack Earnshaw for their significant contributions to this staffing model. We would also like to thank Paul Conlin, Jay Orlander, and the leadership team of Veterans Affairs Boston Healthcare System for supporting this staffing model.
1. Forster AJ, Murff HJ, Peterson JF, Gandhi TK, Bates DW. Adverse drug events occurring following hospital discharge. J Gen Intern Med. 2005;20(4):317-323.
2. Murtaugh CM, Litke A. Transitions through postacute and long-term care settings: patterns of use and outcomes for a national cohort of elders. Med Care. 2002;40(3):227-236.
3. Burke RE, Whitfield EA, Hittle D, et al. Hospital readmission from post-acute care facilities: risk factors, timing, and outcomes. J Am Med Dir Assoc. 2016;17(3):249-255.
4. Mor V, Intrator O, Feng Z, Grabowski DC. The revolving door of rehospitalization from skilled nursing facilities. Health Aff (Millwood). 2010;29(1):57-64.
5. Tian W. An all-payer view of hospital discharge to postacute care, 2013: Statistical Brief #205. https://www.hcup-us.ahrq.gov/reports/statbriefs/sb205-Hospital-Discharge-Postacute-Care.jsp. Published May 2016. Accessed August 13, 2018.
6. Barnett ML, Grabowski DC, Mehrotra A. Home-to-home time–measuring what matters to patients and payers. N Engl J Med. 2017;377(1):4-6.
7. Golden AG, Silverman MA, Mintzer MJ. Is geriatric medicine terminally ill? Ann Intern Med. 2012;156(9):654-656.
8. Nazir A, Smalbrugge M, Moser A, et al. The prevalence of burnout among nursing home physicians: an international perspective. J Am Med Dir Assoc. 2018;19(1):86-88.
9. Coleman EA, Berenson RA. Lost in transition: challenges and opportunities for improving the quality of transitional care. Ann Intern Med. 2004;141(7):533-536.
10. Kim LD, Kou L, Hu B, Gorodeski EZ, Rothberg MB. Impact of a connected care model on 30-day readmission rates from skilled nursing facilities. J Hosp Med. 2017;12(4):238-244.
11. Gloth MF, Gloth MJ. A comparative effectiveness trial between a post-acute care hospitalist model and a community-based physician model of nursing home care. J Am Med Dir Assoc. 2011;12(5):384-386.
12. Baughman AW, Cain G, Ruopp MD, et al. Improving access to care by admission process redesign in a veterans affairs skilled nursing facility. Jt Comm J Qual Patient Saf. 2018;44(8):454-462.
13. Mixon A, Smith GR, Dalal A et al. The Multi-Center Medication Reconciliation Quality Improvement Study 2 (MARQUIS2): methods and implementation. Abstract 248. Present at: Society of Hospital Medicine Annual Meeting; 2018 Apr 8 – 11, 2018; Orlando, FL. https://www.shmabstracts.com/abstract/the-multi-center-medication-reconciliation-quality-improvement-study-2-marquis2-methods-and-implementation. Accessed August 13, 2018.
14. Meltzer DO, Ruhnke GW. Redesigning care for patients at increased hospitalization risk: the comprehensive care physician model. Health Aff (Millwood). 2014;33(5):770-777.
15. Powers BW, Milstein A, Jain SH. Delivery models for high-risk older patients: back to the future? JAMA. 2016;315(1):23-24.
Time-to-Surgery for Definitive Fixation of Hip Fractures: A Look at Outcomes Based Upon Delay
ABSTRACT
The morbidity and mortality after hip fracture in the elderly are influenced by non-modifiable comorbidities. Time-to-surgery is a modifiable factor that may play a role in postoperative morbidity. This study investigates the outcomes and complications in the elderly hip fracture surgery as a function of time-to-surgery.
Using the American College of Surgeons-National Surgical Quality Improvement Program data from 2011 to 2012, a study population was generated using the Current Procedural Terminology codes for percutaneous or open treatment of femoral neck fractures (27235, 27236) and fixation with a screw and side plate or intramedullary fixation (27244, 27245) for peritrochanteric fractures. Three time-to-surgery groups (<24 hours to surgical intervention, 24-48 hours, and >48 hours) were created and matched for surgery type, sex, age, and American Society of Anesthesiologists class. Time-to-surgery was then studied for its effect on the post-surgical outcomes using the adjusted regression modeling.
A study population of 6036 hip fractures was created, and 2012 patients were assigned to each matched time-to-surgery group. The unadjusted models showed that the earlier surgical intervention groups (<24 hours and 24-48 hours) exhibited a lower overall complication rate (P = .034) compared with the group waiting for surgery >48 hours. The unadjusted mortality rates increased with delay to surgical intervention (P = .039). Time-to-surgery caused no effect on the return to the operating room rate (P = .554) nor readmission rate (P = .285). Compared with other time-to-surgeries, the time-to-surgery of >48 hours was associated with prolonged total hospital length of stay (10.9 days) (P < .001) and a longer surgery-to-discharge time (hazard ratio, 95% confidence interval: 0.74, 0.69-0.79) (P < .001). Adjusted analyses showed no time-to-surgery related difference in complications (P = .143) but presented an increase in the total length of stay (P < .001) and surgery-to-discharge time (P < .001).
Timeliness of surgical intervention in a comorbidity-adjusted population of elderly hip fracture patients causes no effect on the overall complications, readmissions, nor 30-day mortality. However, time-to-surgery of >48 hours is associated with costly increase in the total length of stay, including an increased post-surgery-to-discharge time.
Continue to: Despite the best efforts to optimize surgical care...
Despite the best efforts to optimize surgical care and postoperative rehabilitation following hip fracture, elderly patients feature alarmingly high in-hospital and 1-year mortality rates of 4.35% to 9.2%1-4 and 36%,5 respectively. Those who survive are unlikely to return to independent living, with only 17% of the patients following hip fracture being able to walk independently 6 months postoperatively, and 12% being able to climb stairs6. Possibly, these poor outcomes reflect a preoperative medical comorbidity burden rather than a measure of medical or surgical quality. Given the absence of consensus regarding optimal time-to-surgery, treating physicians often opt to delay surgical intervention for the purposes of medically optimizing highly comorbid patients without significant data to suggest clinical benefit of such practice.
Numerous investigators have attempted to identify the modifiable risk factors for complication after surgical care of elderly hip fracture patients. However, consensus guidelines of care are missing. This condition is largely due to the difficulties in effectively modifying preoperative demographic and medical comorbidities on a semi-urgent basis. However, timeliness to surgery is one area for study that the care team can affect. Although time-to-surgery is dependent on multiple factors, including time of presentation, day of week of admission, difficulties with scheduling, and administrative delays, the care team plays a role in hastening or retarding time-to-surgery. Several studies have considered various time cut-offs (24, 48, 72, and 120 hours) to define early intervention, but none have defined a specific role for early or delayed surgery. Several investigators have discovered a positive association between delayed time-to-surgery and mortality;4,8-14 however, the most rigorously conducted studies that stringently control for preoperative comorbidities and demographics conclude that variance in time-to-surgery causes no effect on the in-hospital or 1-year mortality risk.1-3,15-18
Other investigators have shown that with early surgical intervention for hip fracture, patients experience shorter hospital stays,1,3,16,17,19-22 less days in pain,19 decreased risk of decubitus ulcers,15,17,19,22 and an increased likelihood of independence following fracture,22-25 regardless of preoperative medical status. Despite this evidence of improved outcomes with early surgery, 40% to 54% of hip fracture patients in the United States experience surgical delays of more than 24 to 48 hours. Additionally, with the recent (2013) national estimates of cost per day spent in the hospital falling between $1791 to $2289,26 minimizing the days spent in the hospital would likely lead to significant cost-savings, presuming no adverse effect on health-related outcomes. To this end, we hypothesize that the value (outcomes per associated cost)7 of hip fracture surgical care can be positively influenced by minimizing surgical wait-times. We assessed the effect of early surgical intervention, within 24 or 48 hours of presentation, on 30-day mortality, postoperative morbidity, hospital length of stay, and readmission rates in a comorbidity-adjusted population from a nationally representative cohort.
Continue to: METHODS AND MATERIALS...
METHODS AND MATERIALS
This study used the data from the American College of Surgeon-National Surgical Quality Improvement Program (ACS-NSQIP) database. With over 258 participating hospitals, this database has been widely used to identify national trends in various surgical specialties.27-34 The database includes information from participants in 43 states with hospitals ranging from rural community hospitals to large academic centers. Each site employs surgical clinical reviewers who are rigorously trained to collect data through chart review and discussion with the treating surgeon and/or patient,35 allowing for the use of robust and quality data with proven inter-rater reliability.36,37
Using the 2011 to 2012 NSQIP database, we used primary Current Procedural Terminology codes to identify all patients who underwent percutaneous (27235) or open (27236) fixation of femoral neck fractures; and fixation with a screw and side plate (27244) or intramedullary fixation (27245) for peritrochanteric fractures. The sample was divided into 3 time-to-surgery groups (<24 hours from presentation to surgery, 24-48 hours, and >48 hours) which were matched for fracture type (femoral neck or peritrochanteric), sex, age (under 75 years or ≥75 years), and American Society of Anesthesiologists (ASA) class used as a surrogate for severity of medical infirmary. The subjects were randomly matched 1:1:1 to create 3 statistically equivalent time-to-surgery groups using Proc SurveySelect (SAS version 9.2, SAS Institute).
Generalized linear models using logit link function for binary variables and identity link function for normally distributed characteristics were used to compare the 3 time-to-surgery groups. Descriptive statistics are presented as counts and percentages or least-square means with standard deviations. Preoperative lab values that were not normally distributed were log transformed and presented in their original scales with median values and 25th to 75th percentiles. Outcomes were similarly modeled.
Total hospital stay was modeled with a negative binomial distribution. Proportional hazards models were used to model the time from operating room (OR) to discharge, censoring patients who died before discharge, with results presented as hazard ratios (HR) and 95% confidence intervals (CI) (Figure). The assumption of the proportional hazards was tested using a Wald test. Using this model, a HR of <1 denotes a longer postoperative hospital stay, as a longer hospital stay decreases the “risk” for discharge.
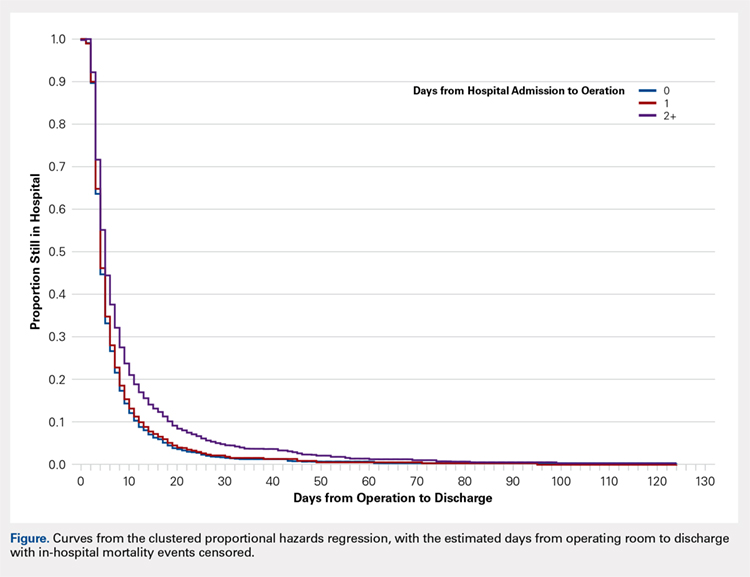
All models were adjusted for confounders, including race, body mass index (BMI), hypertension, chronic obstructive pulmonary disease, cancer, bleeding disorders, transfusion within 72 hours before surgery, preoperative levels of creatinine, platelet count, white blood cells (WBCs), hematocrit anesthesia type, and wound infection. These covariates were selected based upon their observed relationship to the studied outcomes and time-to-surgery groups, and were evaluated across the models for all outcomes for consistency and clarity. All statistical analyses were run at a type I error rate of 5% and performed in SAS version 9.2 software.
Continue to: RESULTS...
RESULTS
A study population of 6036 hip fractures was identified and divided into 3 groups of 2012 subjects each based upon time-to-surgery. The groups were successfully matched for surgery type, age (≥75 years old), gender, and ASA class. In each group, 594 of the 2012 (29.5%) patients were male, 1525 (75.8%) were ≥75 years of age, 9 (.5%) were ASA Class I, 269 (13.4%) were ASA Class II, 1424 (70.8%) were ASA class III, and 309 (15.4%) were ASA class IV.
Significant differences in preoperative comorbidity burden and preoperative lab values were identified between the 3 cohorts. Increased time-to-surgery was associated with differences in race (P < .001), elevated BMI (P = .010), higher rates of congestive heart failure (P < .001), hypertension medication (P = .020), bleeding disorders (P < .001), blood transfusion within 72 hours of surgery (P < .001), and systemic sepsis (P = .001). Delay to surgery was also associated with lower preoperative sodium (P = .005), blood urea nitrogen (P = .013), serum WBC (P < .001), hematocrit (P < .001), and platelets (P < .001) (Table 1).
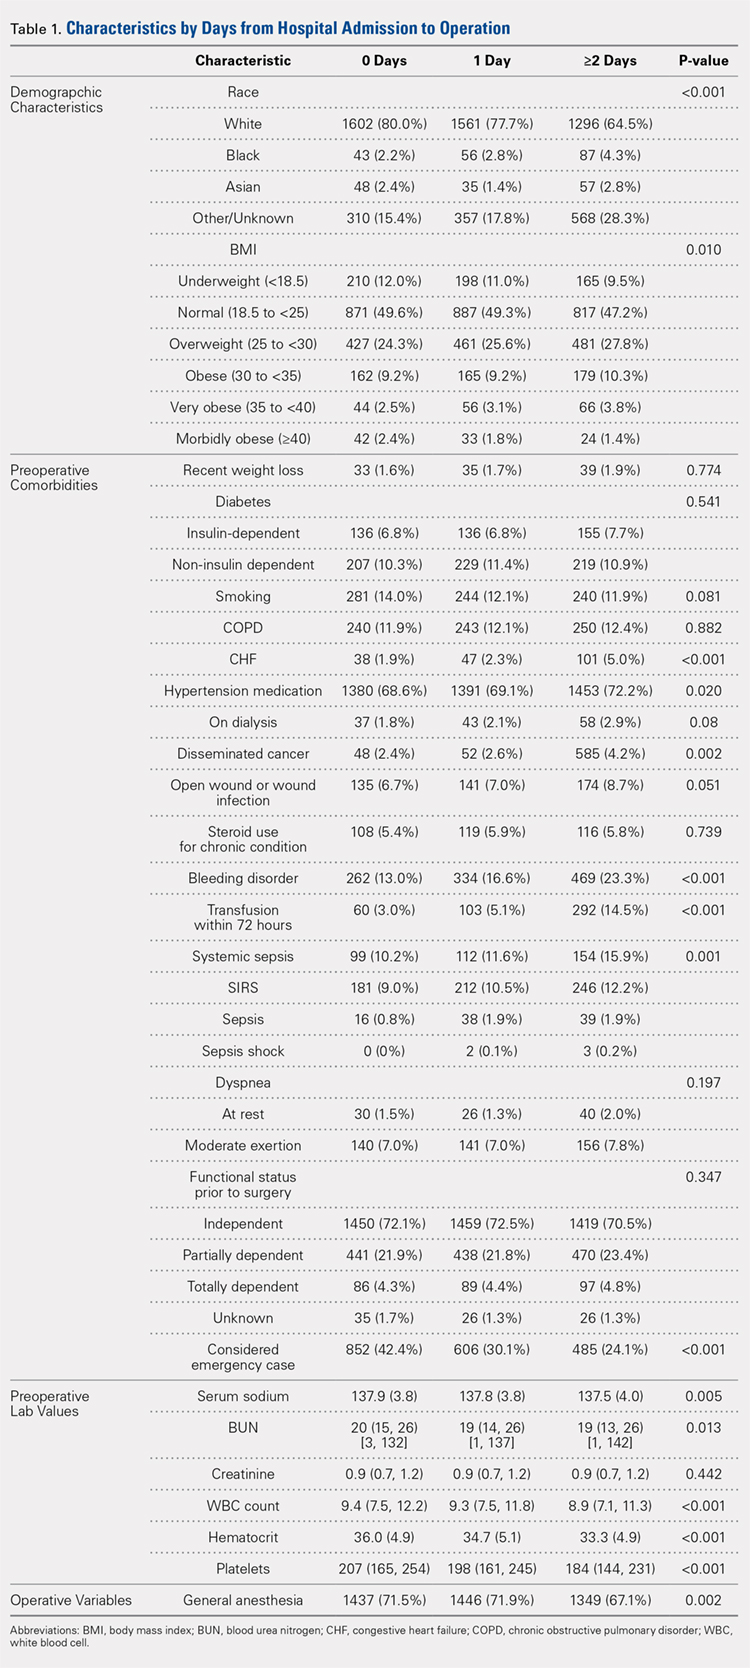
The unadjusted analyses revealed no association between time-to-surgery and return to OR (P = .554) nor readmission (P = .285). However, increasing time-to-surgery was associated with an increase in overall complications (P = .034), total length of hospital stay (P < .001), and 30-day mortality (P = .039) (Table 2).
Table 2. Estimated Event Rates from Matched Cohorts (Unadjusted)
| Time From Presentation to Definitive Fixation | |||
Outcomes | <24 hours | 24-48 hours | >48 hours | P-value |
Overall complication rate | 15.30% | 15.30% | 17.90% | 0.034 |
Total length of stay | 5.4 | 6.7 | 10.9 | <0.001 |
(mean days, 95% confidence interval) | (5.2, 5.7) | (6.5, 7.0) | (10.3, 11.5) | |
Time from OR to discharge | -ref- | 0.96 | 0.74 | <0.001 |
(Hazard ratio) | (0.90,1.02) | (0.69, 0.79) | ||
Return to OR | 2.40% | 2.40% | 2.00% | 0.554 |
Readmission | 9.60% | 8.40% | 8.30% | 0.285 |
30-day mortality rate | 5.80% | 5.30% | 7.20% | 0.039 |
Abbreviation: OR, operating room.
The adjusted analysis controlling for preoperative demographic and comorbidity variables revealed trends toward the increased overall complications and 30-day mortality with increased time-to-surgery; these trends showed no statistical significance (P = .143 and P = .08). No statistical relationship was observed between return to OR nor readmission and time-to-surgery. Increasing time-to-surgery remained significantly associated with the increased total length of hospital stay (P < .001). The adjusted analysis also revealed that the delay of >48 hours in time-to-surgery resulted in a longer surgery-to-discharge time (P < .001) (Table 3). No evidence of violation of the proportional hazards assumption was observed in the unadjusted nor adjusted clustered proportional hazards models (Wald test, P = .27 and P = .25, respectively).
Table 3. Estimated Event Rates from Matched Cohorts (Adjusteda)
| Time from Presentation to Definitive Fixation | |||
Outcomes | <24 hours | 24-48 hours | >48 hours | P-value |
Overall complication rate | 11.70% | 10.70% | 12.60% | 0.143 |
Total length of stay | 4.2 | 5.1 | 7.6 | <0.001 |
(mean days, 95% confidence interval) | (4.0, 4.5) | (4.8, 5.5) | (7.1, 8.3) | |
Time from OR to discharge | -ref- | 1.03 | 0.87 | <0.001 |
(Hazard ratio) | (0.97, 1.09) | (0.81, 0.92) | ||
Return to OR | 2.10% | 2.10% | 1.60% | 0.541 |
Readmission | 7.20% | 6.40% | 6.00% | 0.304 |
30-day mortality rate | 4.20% | 3.70% | 5.20% | 0.08 |
aModel adjusted for race, hypertension medication, cancer, bleeding disorders, transfusion within 72 hours before surgery, emergency status, wound infection, anesthesia type (general), body mass index (18.5-25), history of chronic obstructive pulmonary disease, and preoperative levels of creatinine, platelet count, white blood cell count, and hematocrit.
Continue to: DISCUSSION...
DISCUSSION
Previous research has demonstrated an association between age,3,4,25 comorbidity burden,1,3,25 gender,3,4 and ASA class4,18,21 with outcomes following hip fractures and serves as the basis of our matched analysis statistical methodology in assessing the effect of time-to-surgery on the outcome following hip fracture surgery. Prior investigators have also established the positive correlation between increased preoperative comorbidity burden and delay in time-to-surgery.10,15 This finding was confirmed in our unadjusted comparison of 3 time-to-surgery groups. However, prior investigations have not established a clear association between time-to-surgical intervention and postoperative morbidity and mortality.1,15,16,18,20,38 This study utilized a nationally representative dataset known for its data integrity and from which 6036 patients with surgically treated hip fractures, matched for surgery type, age, gender, and ASA class (a surrogate for severity of medical infirmary), were studied using adjusted regression modeling to afford an isolated statistical assessment of the effect of time-to-surgery on outcomes following hip fracture surgery.
Despite a large sample size and rigorous statistical methodology, for many outcome measures, our results show no support for the early or late operative intervention following hip fracture. We found no difference in 30-day mortality, readmission rate, nor total complication rate between the 3 time-to-surgery cohorts. This result indicates that the care of elderly patients following hip fracture is inherently complicated and that perioperative complication risk is probably only modestly modifiable by best medical practices, including optimizing time from clinical presentation to surgery.
As expected, patients who experienced longer delays from presentation to surgery were on average, more comorbid and more likely to yield abnormal preoperative lab values. However, in the adjusted analysis, delay in time-to-surgery, presumably for medical management, was not found to be associated with improved outcomes. In the same adjusted analysis, we uniquely identified that in the patients whose surgeries were delayed for more than 48 hours, the time from surgery-to-discharge was significantly increased. As a result, these patients spent extra days in the hospital both preoperatively and postoperatively, but without any corollary improvement in the outcomes.
Continue to: Recent estimates of the cost of hospital admission...
Recent estimates of the cost of hospital admission is approximated nationally at $2000/day.26 Although our data fail to support the formal cost-analysis of the effect of time-to-surgery in hip fracture care, a simple value-based analysis indicates that quality is preserved (no difference in outcome), whereas costly hospital days are eliminated with earlier surgery. The value in elderly hip fracture care. defined as the outcomes relative to the costs,7 is ultimately optimized by earlier time-to-surgery.
Although using a large, multi-institutional database is advantageous for finding population-based trends that are representative of a large cohort, using the ACS-NSQIP database features its limitations. Our analysis was limited to the defined scope of NSQIP and nature of the injury, whereas root cause for delay was not available for study. We were unable to identify which patients were delayed for administrative reasons or surgical convenience and which were delayed for medical optimization. Participation in the ACS-NSQIP database is voluntary, and no randomized hospital sampling was conducted. Participating hospitals were de-identified in the database. As expected, we were unable to identify the specific institution-based hip fracture protocols that may affect the outcomes following treatment for these fractures. Further, socioeconomic information and payer-status are unavailable for the study. Additionally, observations are limited to 30 days postoperative, and we cannot comment on longer-term outcomes. Finally, discharge disposition and functional outcome data are not represented, and we were unable to correlate time-to-surgery and functional recovery. However, previous studies have established that delay in time-to-surgery following hip fractures is negatively correlated with functional outcomes.22-25
Nevertheless, the ACS-NSQIP database remains one of the largest American surgical databases available, and includes care centers from nearly every state with variable demographics including rural, urban, and academic centers. The ACS performs broad-based inter-rater reliability audits on every participating site and has found an overall disagreement rate of only 1.8%. As such, although discrepancies exist between the complete patient chart and the data entered, the data found in the ACS-NSQIP database are reliable and considered a valid source of study.34,35 The large sample size, quality of data collection, wide geographic representation, and varied hospital types within the dataset possibly make our findings relevant in the majority of American healthcare settings.
CONCLUSION
This study demonstrates an associated increased length of hospital stay, including the increased time from surgery-to-discharge, in patients with hip fractures whose surgical intervention is delayed for >48 hours after presentation. Given the prior evidence that early surgical intervention improves the functional outcomes and the current evidence that surgical delay for any cause increases costly hospital length of stay without corollary improvement in the outcomes, a value-based assessment of hip fracture care argues for early surgical intervention whenever possible. Our findings should inform physician, institution, and policy maker value-based decision making regarding the best practices in geriatric hip fracture care.
1. Vidán MT, Sánchez E, Gracia Y, Marañón E, Vaquero J, Serra JA. Causes and effects of surgical delay in patients with hip fracture: a cohort study. Ann Intern Med. 2011;155(4):226-233. doi:10.7326/0003-4819-155-4-201108160-00006.
2. Verbeek DO, Ponsen KJ, Goslings JC, Heetveld MJ. Effect of surgical delay on outcome in hip fracture patients: a retrospective multivariate analysis of 192 patients. Int Orthop. 2008;32(1):13-18. doi:10.1007/s00264-006-0290-9.
3. Lefaivre KA, Macadam SA, Davidson DJ, Gandhi R, Chan H, Broekhuyse HM. Length of stay, mortality, morbidity and delay to surgery in hip fractures. J Bone Joint Surg Br. 2009;91(7):922-927. doi:10.1302/0301-620X.91B7.22446.
4. Uzoigwe CE, Burnand HG, Cheesman CL, Aghedo DO, Faizi M, Middleton RG. Early and ultra-early surgery in hip fracture patients improves survival. Injury. 2013;44(6):726-729. doi:10.1016/j.injury.2012.08.025.
5. Zuckerman JD. Hip fracture. N Engl J Med. 1996;334(23):1519-1525. doi:10.1056/NEJM199606063342307.
6. Marottoli RA, Berkman LF, Cooney LM Jr. Decline in physical function following hip fracture. J Am Geriatr Soc. 1992;40(9):861-866. doi:10.1111/j.1532-5415.1992.tb01980.x.
7. Porter ME. What is value in health care? N Engl J Med. 2010;363(26):2477-2481. doi:10.1056/NEJMp1011024.
8. Radcliff TA, Henderson WG, Stoner TJ, Khuri SF, Dohm M, Hutt E. Patient risk factors, operative care, and outcomes among older community-dwelling male veterans with hip fracture. J Bone Joint Surg Am. 2008;90(1):34-42. doi:10.2106/JBJS.G.00065.
9. Novack V, Jotkowitz A, Etzion O, Porath A. Does delay in surgery after hip fracture lead to worse outcomes? A multicenter survey. Int J Qual Health Care. 2007;19(3):170-176. doi:10.1093/intqhc/mzm003.
10. Weller I, Wai EK, Jaglal S, Kreder HJ. The effect of hospital type and surgical delay on mortality after surgery for hip fracture. J Bone Joint Surg Br. 2005;87(3):361-366. doi:10.1302/0301-620X.87B3.15300.
11. Moran CG, Wenn RT, Sikand M, Taylor AM. Early mortality after hip fracture: is delay before surgery important? J Bone Joint Surg Am. 2005;87(3):483-489. doi:10.2106/JBJS.D.01796.
12. Holt G, Smith R, Duncan K, McKeown DW. Does delay to theatre for medical reasons affect the peri-operative mortality in patients with a fracture of the hip? J Bone Joint Surg Br. 2010;92(6):835-841. doi:10.1302/0301-620X.92B6.24463.
13. Pioli G, Lauretani F, Davoli ML, et al. Older people with hip fracture and IADL disability require earlier surgery. J Gerontol A Biol Sci Med Sci. 2012;67(11):1272-1277. doi:10.1093/gerona/gls097.
14. Mackenzie DG, Wild S, Muir R. Mortality associated with delay in operation after hip fracture: Scottish data provide additional information. BMJ. 2006;332(7549):1093. doi:10.1136/bmj.332.7549.1093.
15. Grimes JP, Gregory PM, Noveck H, Butler MS, Carson JL. The effects of time-to-surgery on mortality and morbidity in patients following hip fracture. Am J Med. 2002;112(9):702-709. doi:10.1016/S0002-9343(02)01119-1.
16. Majumdar SR, Beaupre LA, Johnston DW, Dick DA, Cinats JG, Jiang HX. Lack of association between mortality and timing of surgical fixation in elderly patients with hip fracture: results of a retrospective population-based cohort study. Med Care. 2006;44(6):552-559. doi:10.1097/01.mlr.0000215812.13720.2e.
17. Hommel A, Ulander K, Bjorkelund KB, Norrman PO, Wingstrand H, Thorngren KG. Influence of optimised treatment of people with hip fracture on time to operation, length of hospital stay, reoperations and mortality within 1 year. Injury. 2008;39(10):1164-1174. doi:10.1016/j.injury.2008.01.048.
18. Rae HC, Harris IA, McEvoy L, Todorova T. Delay to surgery and mortality after hip fracture. ANZ J Surg. 2007;77(10):889-891. doi:10.1111/j.1445-2197.2007.04267.x.
19. Orosz GM, Magaziner J, Hannan EL, et al. Association of timing of surgery for hip fracture and patient outcomes. JAMA. 2004;291(14):1738-1743. doi:10.1001/jama.291.14.1738.
20. Bergeron E, Lavoie A, Moore L, et al. Is the delay to surgery for isolated hip fracture predictive of outcome in efficient systems? J Trauma. 2006;60(4):753-757. doi:10.1097/01.ta.0000214649.53190.2a.
21. Siegmeth AW, Gurusamy K, Parker MJ. Delay to surgery prolongs hospital stay in patients with fractures of the proximal femur. J Bone Joint Surg Br. 2005;87(8):1123-1126. doi:10.1302/0301-620X.87B8.16357.
22. Al-Ani AN, Samuelsson B, Tidermark J, et al. Early operation on patients with a hip fracture improved the ability to return to independent living. A prospective study of 850 patients. J Bone Joint Surg Am. 2008;90(7):1436-1442. doi:10.2106/JBJS.G.00890.
23. Hoenig H, Rubenstein LV, Sloane R, Horner R, Kahn K. What is the role of timing in the surgical and rehabilitative care of community-dwelling older persons with acute hip fracture? Arch Intern Med. 1997;157(5):513-520.
24. Doruk H, Mas MR, Yildiz C, Sonmez A, Kýrdemir V. The effect of the timing of hip fracture surgery on the activity of daily living and mortality in elderly. Arch Gerontol Geriatr. 2004;39(2):179-185. doi:10.1016/j.archger.2004.03.004.
25. Yonezawa T, Yamazaki K, Atsumi T, Obara S. Influence of the timing of surgery on mortality and activity of hip fracture in elderly patients. J Orthop Sci Off J Jpn Orthop Assoc. 2009;14(5):566-573. doi:10.1007/s00776-009-1380-5.
26. Henry J Kaiser Family Foundation. Hospital adjusted expenses per inpatient day by ownership. https://www.kff.org/health-costs/state-indicator/expenses-per-inpatient-day-by-ownership/?currentTimeframe=0&sortModel=%7B%22colId%22:%22Location%22,%22sort%22:%22asc%22%7D. Accessed March 14, 2013.
27. Belmont PJ Jr, Davey S, Orr JD, Ochoa LM, Bader JO, Schoenfeld AJ. Risk factors for 30-day postoperative complications and mortality after below-knee amputation: a study of 2,911 patients from the national surgical quality improvement program. J Am Coll Surg. 2011;213(3):370-378. doi:10.1016/j.jamcollsurg.2011.05.019.
28. Davis SS Jr, Husain FA, Lin E, Nandipati KC, Perez S, Sweeney JF. Resident participation in index laparoscopic general surgical cases: impact of the learning environment on surgical outcomes. J Am Coll Surg. 2013;216(1):96-104. doi:10.1016/j.jamcollsurg.2012.08.014.
29. Gart MS, Smetona JT, Hanwright PJ, et al. Autologous options for postmastectomy breast reconstruction: a comparison of outcomes based on the American College of Surgeons National Surgical Quality Improvement Program. J Am Coll Surg. 2013;216(2):229-238. doi:10.1016/j.jamcollsurg.2012.11.003.
30. Greenblatt DY, Rajamanickam V, Pugely AJ, Heise CP, Foley EF, Kennedy GD. Short-term outcomes after laparoscopic-assisted proctectomy for rectal cancer: results from the ACS NSQIP. J Am Coll Surg. 2011;212(5):844-854. doi:10.1016/j.jamcollsurg.2011.01.005.
31. Pugely AJ, Martin CT, Gao Y, Mendoza-Lattes S, Callaghan JJ. Differences in short-term complications between spinal and general anesthesia for primary total knee arthroplasty. J Bone Joint Surg Am. 2013;95(3):193-199. doi:10.2106/JBJS.K.01682.
32. Rao RD. Risk factors for complications and mortality after spine surgery assessed with the NSQIP database: where do we go from here? Commentary on an article by Andrew J Schoenfeld, MD, et al.: "Risk factors for immediate postoperative complications and mortality following spine surgery: a study of 3475 patients from the National Surgical Quality Improvement Program". J Bone Joint Surg Am. 2011;93(17):e101:(101-102). doi:10.2106/JBJS.K.00786.
33. Schilling PL, Hallstrom BR, Birkmeyer JD, Carpenter JE. Prioritizing perioperative quality improvement in orthopaedic surgery. J Bone Joint Surg Am. 2010;92(9):1884-1889. doi:10.2106/JBJS.I.00735.
34. Tsilimparis N, Perez S, Dayama A, Ricotta JJ 2nd. Age-stratified results from 20,095 aortoiliac aneurysm repairs: should we approach octogenarians and nonagenarians differently? J Am Coll Surg. 2012;215(5):690-701. doi:10.1016/j.jamcollsurg.2012.06.411.
35. ACS National Surgical Quality Improvement Program. American College of Surgeons Web site. https://www.facs.org/quality-programs/acs-nsqip?. Accessed March 14, 2013.
36. Henderson WG, Daley J. Design and statistical methodology of the National Surgical Quality Improvement Program: why is it what it is? Am J Surg. 2009;198(5 Suppl):S19-S27. doi:10.1016/j.amjsurg.2009.07.025.
37. Shiloach M, Frencher SK Jr, Steeger JE, et al. Toward robust information: data quality and inter-rater reliability in the American College of Surgeons National Surgical Quality Improvement Program. J Am Coll Surg. 2010;210(1):6-16. doi:10.1016/j.jamcollsurg.2009.09.031.
38. Khan SK, Kalra S, Khanna A, Thiruvengada MM, Parker MJ. Timing of surgery for hip fractures: a systematic review of 52 published studies involving 291,413 patients. Injury. 2009;40(7):692-697. doi:10.1016/j.injury.2009.01.010.
ABSTRACT
The morbidity and mortality after hip fracture in the elderly are influenced by non-modifiable comorbidities. Time-to-surgery is a modifiable factor that may play a role in postoperative morbidity. This study investigates the outcomes and complications in the elderly hip fracture surgery as a function of time-to-surgery.
Using the American College of Surgeons-National Surgical Quality Improvement Program data from 2011 to 2012, a study population was generated using the Current Procedural Terminology codes for percutaneous or open treatment of femoral neck fractures (27235, 27236) and fixation with a screw and side plate or intramedullary fixation (27244, 27245) for peritrochanteric fractures. Three time-to-surgery groups (<24 hours to surgical intervention, 24-48 hours, and >48 hours) were created and matched for surgery type, sex, age, and American Society of Anesthesiologists class. Time-to-surgery was then studied for its effect on the post-surgical outcomes using the adjusted regression modeling.
A study population of 6036 hip fractures was created, and 2012 patients were assigned to each matched time-to-surgery group. The unadjusted models showed that the earlier surgical intervention groups (<24 hours and 24-48 hours) exhibited a lower overall complication rate (P = .034) compared with the group waiting for surgery >48 hours. The unadjusted mortality rates increased with delay to surgical intervention (P = .039). Time-to-surgery caused no effect on the return to the operating room rate (P = .554) nor readmission rate (P = .285). Compared with other time-to-surgeries, the time-to-surgery of >48 hours was associated with prolonged total hospital length of stay (10.9 days) (P < .001) and a longer surgery-to-discharge time (hazard ratio, 95% confidence interval: 0.74, 0.69-0.79) (P < .001). Adjusted analyses showed no time-to-surgery related difference in complications (P = .143) but presented an increase in the total length of stay (P < .001) and surgery-to-discharge time (P < .001).
Timeliness of surgical intervention in a comorbidity-adjusted population of elderly hip fracture patients causes no effect on the overall complications, readmissions, nor 30-day mortality. However, time-to-surgery of >48 hours is associated with costly increase in the total length of stay, including an increased post-surgery-to-discharge time.
Continue to: Despite the best efforts to optimize surgical care...
Despite the best efforts to optimize surgical care and postoperative rehabilitation following hip fracture, elderly patients feature alarmingly high in-hospital and 1-year mortality rates of 4.35% to 9.2%1-4 and 36%,5 respectively. Those who survive are unlikely to return to independent living, with only 17% of the patients following hip fracture being able to walk independently 6 months postoperatively, and 12% being able to climb stairs6. Possibly, these poor outcomes reflect a preoperative medical comorbidity burden rather than a measure of medical or surgical quality. Given the absence of consensus regarding optimal time-to-surgery, treating physicians often opt to delay surgical intervention for the purposes of medically optimizing highly comorbid patients without significant data to suggest clinical benefit of such practice.
Numerous investigators have attempted to identify the modifiable risk factors for complication after surgical care of elderly hip fracture patients. However, consensus guidelines of care are missing. This condition is largely due to the difficulties in effectively modifying preoperative demographic and medical comorbidities on a semi-urgent basis. However, timeliness to surgery is one area for study that the care team can affect. Although time-to-surgery is dependent on multiple factors, including time of presentation, day of week of admission, difficulties with scheduling, and administrative delays, the care team plays a role in hastening or retarding time-to-surgery. Several studies have considered various time cut-offs (24, 48, 72, and 120 hours) to define early intervention, but none have defined a specific role for early or delayed surgery. Several investigators have discovered a positive association between delayed time-to-surgery and mortality;4,8-14 however, the most rigorously conducted studies that stringently control for preoperative comorbidities and demographics conclude that variance in time-to-surgery causes no effect on the in-hospital or 1-year mortality risk.1-3,15-18
Other investigators have shown that with early surgical intervention for hip fracture, patients experience shorter hospital stays,1,3,16,17,19-22 less days in pain,19 decreased risk of decubitus ulcers,15,17,19,22 and an increased likelihood of independence following fracture,22-25 regardless of preoperative medical status. Despite this evidence of improved outcomes with early surgery, 40% to 54% of hip fracture patients in the United States experience surgical delays of more than 24 to 48 hours. Additionally, with the recent (2013) national estimates of cost per day spent in the hospital falling between $1791 to $2289,26 minimizing the days spent in the hospital would likely lead to significant cost-savings, presuming no adverse effect on health-related outcomes. To this end, we hypothesize that the value (outcomes per associated cost)7 of hip fracture surgical care can be positively influenced by minimizing surgical wait-times. We assessed the effect of early surgical intervention, within 24 or 48 hours of presentation, on 30-day mortality, postoperative morbidity, hospital length of stay, and readmission rates in a comorbidity-adjusted population from a nationally representative cohort.
Continue to: METHODS AND MATERIALS...
METHODS AND MATERIALS
This study used the data from the American College of Surgeon-National Surgical Quality Improvement Program (ACS-NSQIP) database. With over 258 participating hospitals, this database has been widely used to identify national trends in various surgical specialties.27-34 The database includes information from participants in 43 states with hospitals ranging from rural community hospitals to large academic centers. Each site employs surgical clinical reviewers who are rigorously trained to collect data through chart review and discussion with the treating surgeon and/or patient,35 allowing for the use of robust and quality data with proven inter-rater reliability.36,37
Using the 2011 to 2012 NSQIP database, we used primary Current Procedural Terminology codes to identify all patients who underwent percutaneous (27235) or open (27236) fixation of femoral neck fractures; and fixation with a screw and side plate (27244) or intramedullary fixation (27245) for peritrochanteric fractures. The sample was divided into 3 time-to-surgery groups (<24 hours from presentation to surgery, 24-48 hours, and >48 hours) which were matched for fracture type (femoral neck or peritrochanteric), sex, age (under 75 years or ≥75 years), and American Society of Anesthesiologists (ASA) class used as a surrogate for severity of medical infirmary. The subjects were randomly matched 1:1:1 to create 3 statistically equivalent time-to-surgery groups using Proc SurveySelect (SAS version 9.2, SAS Institute).
Generalized linear models using logit link function for binary variables and identity link function for normally distributed characteristics were used to compare the 3 time-to-surgery groups. Descriptive statistics are presented as counts and percentages or least-square means with standard deviations. Preoperative lab values that were not normally distributed were log transformed and presented in their original scales with median values and 25th to 75th percentiles. Outcomes were similarly modeled.
Total hospital stay was modeled with a negative binomial distribution. Proportional hazards models were used to model the time from operating room (OR) to discharge, censoring patients who died before discharge, with results presented as hazard ratios (HR) and 95% confidence intervals (CI) (Figure). The assumption of the proportional hazards was tested using a Wald test. Using this model, a HR of <1 denotes a longer postoperative hospital stay, as a longer hospital stay decreases the “risk” for discharge.
All models were adjusted for confounders, including race, body mass index (BMI), hypertension, chronic obstructive pulmonary disease, cancer, bleeding disorders, transfusion within 72 hours before surgery, preoperative levels of creatinine, platelet count, white blood cells (WBCs), hematocrit anesthesia type, and wound infection. These covariates were selected based upon their observed relationship to the studied outcomes and time-to-surgery groups, and were evaluated across the models for all outcomes for consistency and clarity. All statistical analyses were run at a type I error rate of 5% and performed in SAS version 9.2 software.
Continue to: RESULTS...
RESULTS
A study population of 6036 hip fractures was identified and divided into 3 groups of 2012 subjects each based upon time-to-surgery. The groups were successfully matched for surgery type, age (≥75 years old), gender, and ASA class. In each group, 594 of the 2012 (29.5%) patients were male, 1525 (75.8%) were ≥75 years of age, 9 (.5%) were ASA Class I, 269 (13.4%) were ASA Class II, 1424 (70.8%) were ASA class III, and 309 (15.4%) were ASA class IV.
Significant differences in preoperative comorbidity burden and preoperative lab values were identified between the 3 cohorts. Increased time-to-surgery was associated with differences in race (P < .001), elevated BMI (P = .010), higher rates of congestive heart failure (P < .001), hypertension medication (P = .020), bleeding disorders (P < .001), blood transfusion within 72 hours of surgery (P < .001), and systemic sepsis (P = .001). Delay to surgery was also associated with lower preoperative sodium (P = .005), blood urea nitrogen (P = .013), serum WBC (P < .001), hematocrit (P < .001), and platelets (P < .001) (Table 1).
The unadjusted analyses revealed no association between time-to-surgery and return to OR (P = .554) nor readmission (P = .285). However, increasing time-to-surgery was associated with an increase in overall complications (P = .034), total length of hospital stay (P < .001), and 30-day mortality (P = .039) (Table 2).
Table 2. Estimated Event Rates from Matched Cohorts (Unadjusted)
| Time From Presentation to Definitive Fixation | |||
Outcomes | <24 hours | 24-48 hours | >48 hours | P-value |
Overall complication rate | 15.30% | 15.30% | 17.90% | 0.034 |
Total length of stay | 5.4 | 6.7 | 10.9 | <0.001 |
(mean days, 95% confidence interval) | (5.2, 5.7) | (6.5, 7.0) | (10.3, 11.5) | |
Time from OR to discharge | -ref- | 0.96 | 0.74 | <0.001 |
(Hazard ratio) | (0.90,1.02) | (0.69, 0.79) | ||
Return to OR | 2.40% | 2.40% | 2.00% | 0.554 |
Readmission | 9.60% | 8.40% | 8.30% | 0.285 |
30-day mortality rate | 5.80% | 5.30% | 7.20% | 0.039 |
Abbreviation: OR, operating room.
The adjusted analysis controlling for preoperative demographic and comorbidity variables revealed trends toward the increased overall complications and 30-day mortality with increased time-to-surgery; these trends showed no statistical significance (P = .143 and P = .08). No statistical relationship was observed between return to OR nor readmission and time-to-surgery. Increasing time-to-surgery remained significantly associated with the increased total length of hospital stay (P < .001). The adjusted analysis also revealed that the delay of >48 hours in time-to-surgery resulted in a longer surgery-to-discharge time (P < .001) (Table 3). No evidence of violation of the proportional hazards assumption was observed in the unadjusted nor adjusted clustered proportional hazards models (Wald test, P = .27 and P = .25, respectively).
Table 3. Estimated Event Rates from Matched Cohorts (Adjusteda)
| Time from Presentation to Definitive Fixation | |||
Outcomes | <24 hours | 24-48 hours | >48 hours | P-value |
Overall complication rate | 11.70% | 10.70% | 12.60% | 0.143 |
Total length of stay | 4.2 | 5.1 | 7.6 | <0.001 |
(mean days, 95% confidence interval) | (4.0, 4.5) | (4.8, 5.5) | (7.1, 8.3) | |
Time from OR to discharge | -ref- | 1.03 | 0.87 | <0.001 |
(Hazard ratio) | (0.97, 1.09) | (0.81, 0.92) | ||
Return to OR | 2.10% | 2.10% | 1.60% | 0.541 |
Readmission | 7.20% | 6.40% | 6.00% | 0.304 |
30-day mortality rate | 4.20% | 3.70% | 5.20% | 0.08 |
aModel adjusted for race, hypertension medication, cancer, bleeding disorders, transfusion within 72 hours before surgery, emergency status, wound infection, anesthesia type (general), body mass index (18.5-25), history of chronic obstructive pulmonary disease, and preoperative levels of creatinine, platelet count, white blood cell count, and hematocrit.
Continue to: DISCUSSION...
DISCUSSION
Previous research has demonstrated an association between age,3,4,25 comorbidity burden,1,3,25 gender,3,4 and ASA class4,18,21 with outcomes following hip fractures and serves as the basis of our matched analysis statistical methodology in assessing the effect of time-to-surgery on the outcome following hip fracture surgery. Prior investigators have also established the positive correlation between increased preoperative comorbidity burden and delay in time-to-surgery.10,15 This finding was confirmed in our unadjusted comparison of 3 time-to-surgery groups. However, prior investigations have not established a clear association between time-to-surgical intervention and postoperative morbidity and mortality.1,15,16,18,20,38 This study utilized a nationally representative dataset known for its data integrity and from which 6036 patients with surgically treated hip fractures, matched for surgery type, age, gender, and ASA class (a surrogate for severity of medical infirmary), were studied using adjusted regression modeling to afford an isolated statistical assessment of the effect of time-to-surgery on outcomes following hip fracture surgery.
Despite a large sample size and rigorous statistical methodology, for many outcome measures, our results show no support for the early or late operative intervention following hip fracture. We found no difference in 30-day mortality, readmission rate, nor total complication rate between the 3 time-to-surgery cohorts. This result indicates that the care of elderly patients following hip fracture is inherently complicated and that perioperative complication risk is probably only modestly modifiable by best medical practices, including optimizing time from clinical presentation to surgery.
As expected, patients who experienced longer delays from presentation to surgery were on average, more comorbid and more likely to yield abnormal preoperative lab values. However, in the adjusted analysis, delay in time-to-surgery, presumably for medical management, was not found to be associated with improved outcomes. In the same adjusted analysis, we uniquely identified that in the patients whose surgeries were delayed for more than 48 hours, the time from surgery-to-discharge was significantly increased. As a result, these patients spent extra days in the hospital both preoperatively and postoperatively, but without any corollary improvement in the outcomes.
Continue to: Recent estimates of the cost of hospital admission...
Recent estimates of the cost of hospital admission is approximated nationally at $2000/day.26 Although our data fail to support the formal cost-analysis of the effect of time-to-surgery in hip fracture care, a simple value-based analysis indicates that quality is preserved (no difference in outcome), whereas costly hospital days are eliminated with earlier surgery. The value in elderly hip fracture care. defined as the outcomes relative to the costs,7 is ultimately optimized by earlier time-to-surgery.
Although using a large, multi-institutional database is advantageous for finding population-based trends that are representative of a large cohort, using the ACS-NSQIP database features its limitations. Our analysis was limited to the defined scope of NSQIP and nature of the injury, whereas root cause for delay was not available for study. We were unable to identify which patients were delayed for administrative reasons or surgical convenience and which were delayed for medical optimization. Participation in the ACS-NSQIP database is voluntary, and no randomized hospital sampling was conducted. Participating hospitals were de-identified in the database. As expected, we were unable to identify the specific institution-based hip fracture protocols that may affect the outcomes following treatment for these fractures. Further, socioeconomic information and payer-status are unavailable for the study. Additionally, observations are limited to 30 days postoperative, and we cannot comment on longer-term outcomes. Finally, discharge disposition and functional outcome data are not represented, and we were unable to correlate time-to-surgery and functional recovery. However, previous studies have established that delay in time-to-surgery following hip fractures is negatively correlated with functional outcomes.22-25
Nevertheless, the ACS-NSQIP database remains one of the largest American surgical databases available, and includes care centers from nearly every state with variable demographics including rural, urban, and academic centers. The ACS performs broad-based inter-rater reliability audits on every participating site and has found an overall disagreement rate of only 1.8%. As such, although discrepancies exist between the complete patient chart and the data entered, the data found in the ACS-NSQIP database are reliable and considered a valid source of study.34,35 The large sample size, quality of data collection, wide geographic representation, and varied hospital types within the dataset possibly make our findings relevant in the majority of American healthcare settings.
CONCLUSION
This study demonstrates an associated increased length of hospital stay, including the increased time from surgery-to-discharge, in patients with hip fractures whose surgical intervention is delayed for >48 hours after presentation. Given the prior evidence that early surgical intervention improves the functional outcomes and the current evidence that surgical delay for any cause increases costly hospital length of stay without corollary improvement in the outcomes, a value-based assessment of hip fracture care argues for early surgical intervention whenever possible. Our findings should inform physician, institution, and policy maker value-based decision making regarding the best practices in geriatric hip fracture care.
1. Vidán MT, Sánchez E, Gracia Y, Marañón E, Vaquero J, Serra JA. Causes and effects of surgical delay in patients with hip fracture: a cohort study. Ann Intern Med. 2011;155(4):226-233. doi:10.7326/0003-4819-155-4-201108160-00006.
2. Verbeek DO, Ponsen KJ, Goslings JC, Heetveld MJ. Effect of surgical delay on outcome in hip fracture patients: a retrospective multivariate analysis of 192 patients. Int Orthop. 2008;32(1):13-18. doi:10.1007/s00264-006-0290-9.
3. Lefaivre KA, Macadam SA, Davidson DJ, Gandhi R, Chan H, Broekhuyse HM. Length of stay, mortality, morbidity and delay to surgery in hip fractures. J Bone Joint Surg Br. 2009;91(7):922-927. doi:10.1302/0301-620X.91B7.22446.
4. Uzoigwe CE, Burnand HG, Cheesman CL, Aghedo DO, Faizi M, Middleton RG. Early and ultra-early surgery in hip fracture patients improves survival. Injury. 2013;44(6):726-729. doi:10.1016/j.injury.2012.08.025.
5. Zuckerman JD. Hip fracture. N Engl J Med. 1996;334(23):1519-1525. doi:10.1056/NEJM199606063342307.
6. Marottoli RA, Berkman LF, Cooney LM Jr. Decline in physical function following hip fracture. J Am Geriatr Soc. 1992;40(9):861-866. doi:10.1111/j.1532-5415.1992.tb01980.x.
7. Porter ME. What is value in health care? N Engl J Med. 2010;363(26):2477-2481. doi:10.1056/NEJMp1011024.
8. Radcliff TA, Henderson WG, Stoner TJ, Khuri SF, Dohm M, Hutt E. Patient risk factors, operative care, and outcomes among older community-dwelling male veterans with hip fracture. J Bone Joint Surg Am. 2008;90(1):34-42. doi:10.2106/JBJS.G.00065.
9. Novack V, Jotkowitz A, Etzion O, Porath A. Does delay in surgery after hip fracture lead to worse outcomes? A multicenter survey. Int J Qual Health Care. 2007;19(3):170-176. doi:10.1093/intqhc/mzm003.
10. Weller I, Wai EK, Jaglal S, Kreder HJ. The effect of hospital type and surgical delay on mortality after surgery for hip fracture. J Bone Joint Surg Br. 2005;87(3):361-366. doi:10.1302/0301-620X.87B3.15300.
11. Moran CG, Wenn RT, Sikand M, Taylor AM. Early mortality after hip fracture: is delay before surgery important? J Bone Joint Surg Am. 2005;87(3):483-489. doi:10.2106/JBJS.D.01796.
12. Holt G, Smith R, Duncan K, McKeown DW. Does delay to theatre for medical reasons affect the peri-operative mortality in patients with a fracture of the hip? J Bone Joint Surg Br. 2010;92(6):835-841. doi:10.1302/0301-620X.92B6.24463.
13. Pioli G, Lauretani F, Davoli ML, et al. Older people with hip fracture and IADL disability require earlier surgery. J Gerontol A Biol Sci Med Sci. 2012;67(11):1272-1277. doi:10.1093/gerona/gls097.
14. Mackenzie DG, Wild S, Muir R. Mortality associated with delay in operation after hip fracture: Scottish data provide additional information. BMJ. 2006;332(7549):1093. doi:10.1136/bmj.332.7549.1093.
15. Grimes JP, Gregory PM, Noveck H, Butler MS, Carson JL. The effects of time-to-surgery on mortality and morbidity in patients following hip fracture. Am J Med. 2002;112(9):702-709. doi:10.1016/S0002-9343(02)01119-1.
16. Majumdar SR, Beaupre LA, Johnston DW, Dick DA, Cinats JG, Jiang HX. Lack of association between mortality and timing of surgical fixation in elderly patients with hip fracture: results of a retrospective population-based cohort study. Med Care. 2006;44(6):552-559. doi:10.1097/01.mlr.0000215812.13720.2e.
17. Hommel A, Ulander K, Bjorkelund KB, Norrman PO, Wingstrand H, Thorngren KG. Influence of optimised treatment of people with hip fracture on time to operation, length of hospital stay, reoperations and mortality within 1 year. Injury. 2008;39(10):1164-1174. doi:10.1016/j.injury.2008.01.048.
18. Rae HC, Harris IA, McEvoy L, Todorova T. Delay to surgery and mortality after hip fracture. ANZ J Surg. 2007;77(10):889-891. doi:10.1111/j.1445-2197.2007.04267.x.
19. Orosz GM, Magaziner J, Hannan EL, et al. Association of timing of surgery for hip fracture and patient outcomes. JAMA. 2004;291(14):1738-1743. doi:10.1001/jama.291.14.1738.
20. Bergeron E, Lavoie A, Moore L, et al. Is the delay to surgery for isolated hip fracture predictive of outcome in efficient systems? J Trauma. 2006;60(4):753-757. doi:10.1097/01.ta.0000214649.53190.2a.
21. Siegmeth AW, Gurusamy K, Parker MJ. Delay to surgery prolongs hospital stay in patients with fractures of the proximal femur. J Bone Joint Surg Br. 2005;87(8):1123-1126. doi:10.1302/0301-620X.87B8.16357.
22. Al-Ani AN, Samuelsson B, Tidermark J, et al. Early operation on patients with a hip fracture improved the ability to return to independent living. A prospective study of 850 patients. J Bone Joint Surg Am. 2008;90(7):1436-1442. doi:10.2106/JBJS.G.00890.
23. Hoenig H, Rubenstein LV, Sloane R, Horner R, Kahn K. What is the role of timing in the surgical and rehabilitative care of community-dwelling older persons with acute hip fracture? Arch Intern Med. 1997;157(5):513-520.
24. Doruk H, Mas MR, Yildiz C, Sonmez A, Kýrdemir V. The effect of the timing of hip fracture surgery on the activity of daily living and mortality in elderly. Arch Gerontol Geriatr. 2004;39(2):179-185. doi:10.1016/j.archger.2004.03.004.
25. Yonezawa T, Yamazaki K, Atsumi T, Obara S. Influence of the timing of surgery on mortality and activity of hip fracture in elderly patients. J Orthop Sci Off J Jpn Orthop Assoc. 2009;14(5):566-573. doi:10.1007/s00776-009-1380-5.
26. Henry J Kaiser Family Foundation. Hospital adjusted expenses per inpatient day by ownership. https://www.kff.org/health-costs/state-indicator/expenses-per-inpatient-day-by-ownership/?currentTimeframe=0&sortModel=%7B%22colId%22:%22Location%22,%22sort%22:%22asc%22%7D. Accessed March 14, 2013.
27. Belmont PJ Jr, Davey S, Orr JD, Ochoa LM, Bader JO, Schoenfeld AJ. Risk factors for 30-day postoperative complications and mortality after below-knee amputation: a study of 2,911 patients from the national surgical quality improvement program. J Am Coll Surg. 2011;213(3):370-378. doi:10.1016/j.jamcollsurg.2011.05.019.
28. Davis SS Jr, Husain FA, Lin E, Nandipati KC, Perez S, Sweeney JF. Resident participation in index laparoscopic general surgical cases: impact of the learning environment on surgical outcomes. J Am Coll Surg. 2013;216(1):96-104. doi:10.1016/j.jamcollsurg.2012.08.014.
29. Gart MS, Smetona JT, Hanwright PJ, et al. Autologous options for postmastectomy breast reconstruction: a comparison of outcomes based on the American College of Surgeons National Surgical Quality Improvement Program. J Am Coll Surg. 2013;216(2):229-238. doi:10.1016/j.jamcollsurg.2012.11.003.
30. Greenblatt DY, Rajamanickam V, Pugely AJ, Heise CP, Foley EF, Kennedy GD. Short-term outcomes after laparoscopic-assisted proctectomy for rectal cancer: results from the ACS NSQIP. J Am Coll Surg. 2011;212(5):844-854. doi:10.1016/j.jamcollsurg.2011.01.005.
31. Pugely AJ, Martin CT, Gao Y, Mendoza-Lattes S, Callaghan JJ. Differences in short-term complications between spinal and general anesthesia for primary total knee arthroplasty. J Bone Joint Surg Am. 2013;95(3):193-199. doi:10.2106/JBJS.K.01682.
32. Rao RD. Risk factors for complications and mortality after spine surgery assessed with the NSQIP database: where do we go from here? Commentary on an article by Andrew J Schoenfeld, MD, et al.: "Risk factors for immediate postoperative complications and mortality following spine surgery: a study of 3475 patients from the National Surgical Quality Improvement Program". J Bone Joint Surg Am. 2011;93(17):e101:(101-102). doi:10.2106/JBJS.K.00786.
33. Schilling PL, Hallstrom BR, Birkmeyer JD, Carpenter JE. Prioritizing perioperative quality improvement in orthopaedic surgery. J Bone Joint Surg Am. 2010;92(9):1884-1889. doi:10.2106/JBJS.I.00735.
34. Tsilimparis N, Perez S, Dayama A, Ricotta JJ 2nd. Age-stratified results from 20,095 aortoiliac aneurysm repairs: should we approach octogenarians and nonagenarians differently? J Am Coll Surg. 2012;215(5):690-701. doi:10.1016/j.jamcollsurg.2012.06.411.
35. ACS National Surgical Quality Improvement Program. American College of Surgeons Web site. https://www.facs.org/quality-programs/acs-nsqip?. Accessed March 14, 2013.
36. Henderson WG, Daley J. Design and statistical methodology of the National Surgical Quality Improvement Program: why is it what it is? Am J Surg. 2009;198(5 Suppl):S19-S27. doi:10.1016/j.amjsurg.2009.07.025.
37. Shiloach M, Frencher SK Jr, Steeger JE, et al. Toward robust information: data quality and inter-rater reliability in the American College of Surgeons National Surgical Quality Improvement Program. J Am Coll Surg. 2010;210(1):6-16. doi:10.1016/j.jamcollsurg.2009.09.031.
38. Khan SK, Kalra S, Khanna A, Thiruvengada MM, Parker MJ. Timing of surgery for hip fractures: a systematic review of 52 published studies involving 291,413 patients. Injury. 2009;40(7):692-697. doi:10.1016/j.injury.2009.01.010.
TAKE-HOME POINTS
- Time-to-surgery for definitive fixation of hip fractures is a modifiable risk factor.
- This study fails to demonstrate a benefit in delaying surgery for medical optimization as there were no time-to-surgery related differences in complications (P = 1.43).
- Delay in definitive surgery results in an increase in the total length of stay (P < .001) and surgery-to-discharge time (P < .001) without an improvement in overall complications, readmission or 30-day mortality rates.
- Despite numerous investigations, there are no consensus guidelines to decrease complications and mortality rates following hip fracture surgery.
- ACS-NSQIP database is a reliable and validated database.
Reducing Benzodiazepine Prescribing in Older Veterans: A Direct-to-Consumer Educational Brochure
This quality improvement project used an educational brochure to help older veterans reduce their benzodiazepine use.
Benzodiazepines (BZDs) are among the most commonly prescribed medications. A recent study found that in 2008, more than 5% of Americans used a BZD, and the percentage was almost 9% among Americans aged ≥ 65 years.1,2 Among veterans, BZD use is even higher, in part because of the high prevalence of posttraumatic stress disorder (PTSD). One study found that more than 30% of veterans with PTSD received at least 1 BZD prescription.3 The risks associated with BZD treatment for PTSD are compounded by concurrent use of other sedatives and opioids prescribed for co-occurring chronic pain and insomnia.3
Older adults metabolize long-acting BZDs more slowly and generally have an increased sensitivity to the adverse effects (AEs) of all BZDs.4 In older adults, BZD use has been associated with cognitive decline, dementia, falls and consequent fractures, and adverse respiratory outcomes.5-12 The risk of most but not all of these AEs was increased with higher BZD dose or long-term BZD use, which this quality improvement project (QIP) defines as having at least a 60-day supply of BZD prescriptions dispensed within the past year.
Long-term BZD use increases with age. One study found that, among patients receiving a BZD, the rate of long-term BZD use was more than double in older adults (31.4%) than it was in adults aged between 18 and 35 years (14.7%).2 For these reasons, the 2012 Beers criteria of the American Geriatrics Society recommend avoiding all types of BZDs in the treatment of insomnia, agitation, or delirium in patients aged > 65 years.13 Despite this recommendation, the prevalence of BZD use in older adults remains high.14
Some innovative approaches have been developed to address the inappropriate use, including overuse and misuse, of BZDs in older adults.15 In one approach, direct-to-consumer (DTC) information is used to empower patients to collaborate with their physician to manage their health. Results from several studies suggest that providing older patients with information on BZD risks and benefits increases patient–physician interaction and thereby decreases inappropriate BZD use and improves health outcomes.4,16,17 One study found that perceptions of BZD risks increased 1 week after exposure to a DTC educational brochure (EB), with intention to discuss BZD discontinuation with their physician higher for patients who received the EB than it was for those who did not (83.1% vs 44.3%; P < .0001).16 The EMPOWER (Eliminating Medications Through Patient Ownership of End Results) cluster randomized controlled trial assessed the effectiveness of a DTC EB focused on BZD risks in older adults.17 In that seminal study, patients who received a DTC EB were more likely than were comparison patients to discontinue BZD within 6 months (27% vs 5%; risk difference, 23%; 95% CI, 14%-32%).
The Veterans Integrated Systems Network (VISN) 22 Academic Detailing Program is a pharmacy educational outreach program that uses unbiased clinical guidelines to promote physicians’ safety initiatives and align prescribing behavior with best practices.18-20 With BZD use among older veterans remaining high, the VISN 22 program initiated a clinical QIP modeled on the EMPOWER trial. Veterans in VISN 22 received the DTC EB, which included information on BZD risks and encouraged them to discuss their BZD treatment with their health care provider. VISN 22 was the first VISN in the VHA to implement the EMPOWER protocol.
As this was a QIP, all eligible veterans in VISN 22 were mailed the DTC EB, thus making it difficult to estimate the impact of the EB on BZD discontinuation in this VISN. Therefore, DTC EB efficacy was estimated by comparing BZD discontinuation between VISN 22 and VISN 21, an adjacent VISN that did not mail the DTC EB.
Methods
Two QIPs were undertaken to determine the impact of DTC EB on BZD use in older veterans in the VHA.
Quality Improvement Project 1
Design. A retrospective cohort analysis was performed. The VISN 22 catchment area, which encompasses VA facilities and clinics in southern California and southern Nevada, serves about 500,000 veterans, a substantial proportion of whom are aged ≥ 65 years. Among these older veterans are active long-term BZD users, who were defined as having ≥ 60-day supply of BZD prescriptions dispensed within the past year. Each active long-term user with a BZD prescription released within 200 days before the index date (the date the user was to meet with the prescribing physician) was mailed an EB 2 to 8 weeks in advance of the visit. Excluded from analysis were veterans with a schizophrenia, spinal cord injury, or seizure disorder diagnosis recorded in both their inpatient and outpatient medical records; veterans seen by Palliative Care within the past year; and veterans who died before analysis was completed.
Education Brochure. The EB for VISN 22 (Figure 1, see 
Patients. The sample consisted of all veterans identified as meeting the inclusion criteria and being enrolled in VISN 22. The EB was mailed once to veterans on a rolling basis from December 2014 to February 2016. Change in BZD use was analyzed only after 9 to 24 months had passed since the index appointment with the prescribing physician. This period included 12 weeks for BZD taper and then 6 months after taper.
Analysis. For each veteran, monthly mean lorazepam equivalent (LE) was calculated using as many as 12 fills before the index date. Average daily dose of LE was calculated by dividing the sum of LE from all included prescriptions by total number of days between the first fill and the index date. The BZD prescription fills were evaluated after the index date. Veterans who received at least 1 prescription after the index date but then had no BZD prescription activity in VA clinics for 3 consecutive months during the 9-month observation period were recorded as having tapered and then discontinued BZD. Veterans who had no BZD prescription activity in VA clinics after the index date and during the 9-month observation period were recorded as having discontinued BZD without tapering. For veterans who had BZD prescription activity in VA clinics after the index date and during the 9-month observation period, mean LE was calculated by dividing the total LE for BZD prescriptions after the index date by number of days from the first fill after the index date to the date of analysis.
Quality Improvement Project 2
Design. A retrospective cohort analysis using PSM was performed on a subgroup of the QIP-1 sample to evaluate the impact of EB on BZD prescribing in the VA during 2 periods: 6 to 9 months and 6 to 12 months after the index date. A secondary outcome was discontinuation 1 to 12 months after the index date. Veterans in the analysis were active long-term BZD users, had at least 1 BZD prescription released within 200 days before the index date, were aged ≥ 65 years, and had an appointment scheduled with their BZD prescriber within 2 to 8 weeks (Figure 2). 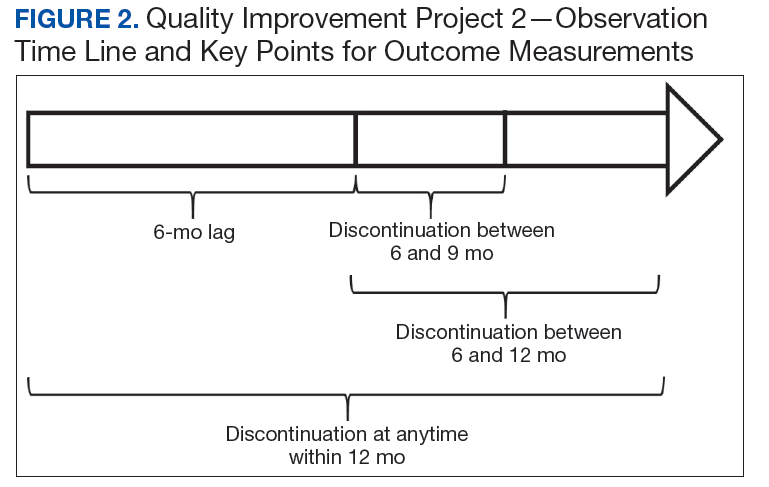
Patients. VISN 22 implemented QIP-2, a real-world application of a modified EMPOWER program, by identifying eligible veterans on a rolling basis from December 2014 to August 2015. All veterans who were identified and sent an EB during this period were included in the case group. The index date was defined as the first of the month the EB was mailed. Veterans with a pending appointment were chosen because the lead time would allow them to receive the EB and prepare to discuss it with the physician during the visit.
A comparator group was drawn from the adjacent VISN 21 catchment area, which encompasses VA facilities and clinics in Hawaii, northern California, and northern Nevada. During the observation period, VISN 21 did not mail any EBs specifically addressing BZD risks. Veterans in the comparator group had an appointment scheduled with their BZD prescribing physician within 4 weeks, were aged ≥ 65 years on the index date (first of the month before the next appointment, coinciding with the date EBs were sent to VISN 22 veterans), were active long-term BZD users, and had at least 1 BZD prescription released within 200 days before the index date. All patients were followed for up to 12 months after the index date, with BZD discontinuation recorded 9 and 12 months after the index date.
Propensity Score Matching
Propensity score (PS) was estimated with logistic regression analysis with treatment as the dependent variable and baseline characteristics as the independent variables.21,22 One-to-one matching on the PS was performed using the nearest neighbor approach without replacements. Independent variables related to outcome but unrelated to EB exposure were selected for PS development.22 These variables included year of birth; male sex; Hispanic ethnicity; annual income; service connection status; region; body mass index; Charlson Comorbidity Index category; total baseline BZD dose; and diagnosis of AIDS, nonmetastatic cancer, metastatic cancer, chronic obstructive pulmonary disease (COPD), congestive heart failure (CHF), dementia, diabetes mellitus (DM), DM with complications, gastroesophageal reflux disease (GERD), general anxiety disorder (GAD), hemiparaplegia, liver disease (mild), liver disease (moderate to severe), myocardial infarction (MI), Parkinson disease, peptic ulcer disease (PUD), psychosis, renal disease, rheumatoid arthritis (RA), or substance use disorder (SUD).
The EMPOWER cluster randomized controlled trial (RCT) demonstrated the effectiveness of EB exposure in a Canadian population of elderly patients who were long-term BZD users.17 Randomized controlled trials are the gold standard for clinical trials because they can establish causal inference.23-25 Given ethical and practical concerns, however, RCTs cannot be applied to all clinical scenarios. Although EMPOWER is reported to be an effective tool in reducing BZD use in older adults, its application in a real-world, large, integrated health care system remains untested. Observational studies are often conducted as an alternative to RCTs but are subject to selection bias because of their lack of randomization.26 Therefore, robust research methods are needed to generate unbiased estimates of the impact of an intervention on an outcome. Propensity score matching simulates an RCT by balancing the covariates across treatment groups.21,22,27 Observed patient characteristics are used to estimate PS, the probability that treatment will be received. Logistic or probit regression is used to balance the potential confounding covariates between the treatment groups.Once PSs are known, mean treatment effect can be estimated without the mean model.28 In other words, PSM methods can be used to generate an unbiased estimate of the treatment.
Propensity Score Analysis
Baseline characteristics were compared using Student t test (continuous variables) and χ2 test (discrete variables). Results are presented as means and standard deviations (continuous variables) and frequency and percentage (discrete variables).
The main outcome was BZD discontinuation 9 and 12 months after the index date. A postindex lag of 6 months was used to capture any tapering (Figure 2). Discontinuation, defined as 3 consecutive months of no BZD prescription on hand, was measured for 2 periods: 6 to 9 months and 6 to 12 months after the index date. A secondary outcome was discontinuation 1 to 12 months after the index date. An estimate was made of the difference in the proportions of BZD discontinuers who received the EB and BZD discontinuers who did not receive the EB, where mean treatment (risk difference) was presented as the absolute risk difference with a 95% CI. Standard errors and 95% CIs for the risk differences were generated with biased-corrected CIs from 1,000 bootstrap samples.
Sensitivity Analyses
Naïve multivariate logistic regression analysis was performed to evaluate the association between EB exposure and BZD discontinuation while controlling for potential confounders. Results are presented as odds ratios (ORs) and 95% CIs. Confounders identified were the same covariates used to generate the PSs.
Several analyses were performed to test the sensitivity of the methods applied using PSM by changing caliber size while maintaining the nearest neighbor approach without replacement. Linear regression analysis was performed with robust standard errors to estimate the risk difference of BZD discontinuation between EB-exposed and EB-unexposed veterans.
Statistical significance was set at P < .05. All statistical analyses were performed with Stata/SE Version 13 (College Station, TX).
Results
Quality Improvement Project 1
On a rolling basis from December 2014 to February 2016, the EB was mailed once to 3,896 VISN 22 veterans 2 to 8 weeks before a clinic appointment with their BZD prescribing physician. 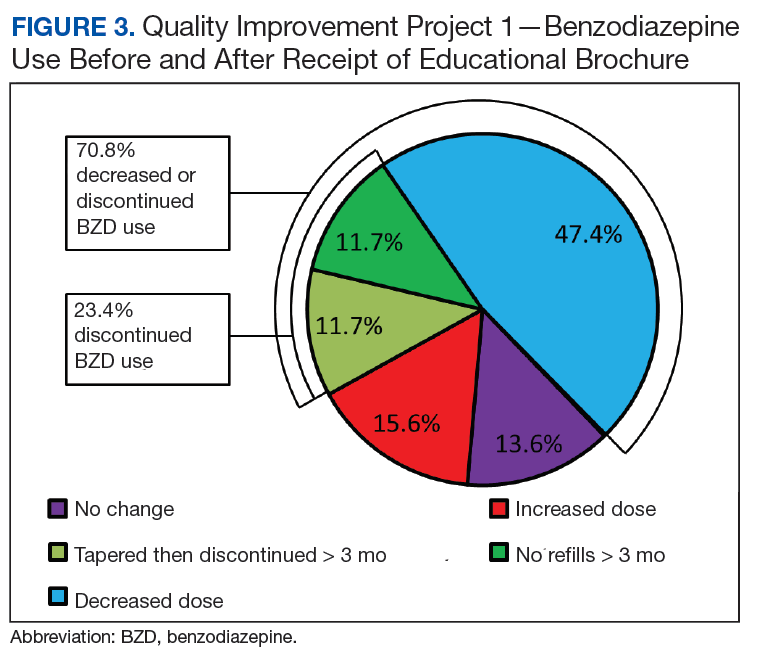

Quality Improvement Project 2
Of all the VISN 22 and VISN 21 veterans, 24,420 met the inclusion and exclusion criteria. Of these 24,420 veterans, 2,020 (8.3%) were in VISN 22 and received the EB between December 2014 and August 2015 (QIP-1), and 22,400 (91.7%) were in VISN 21 and did not receive the EB.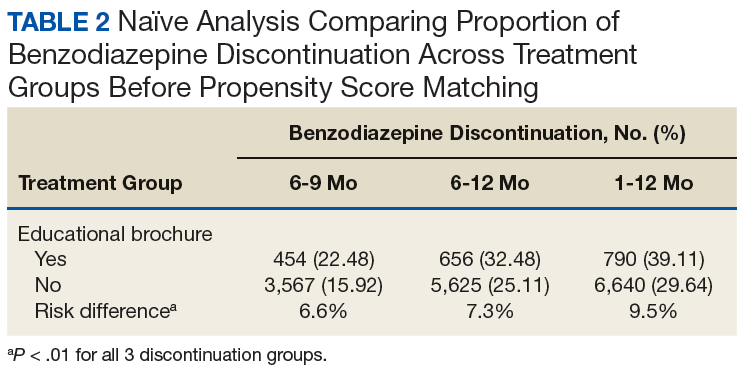
Naïve Results Before PS Matching. In the naïve analyses, a larger proportion of EB-exposed vs unexposed veterans discontinued BZD; in addition, reductions were 6.6%, 7.4%, and 9.5% larger for 6 to 9 months, 6 to 12 months, and 1 to 12 months after the index date, respectively (P < .0001 for all comparisons; Table 2). 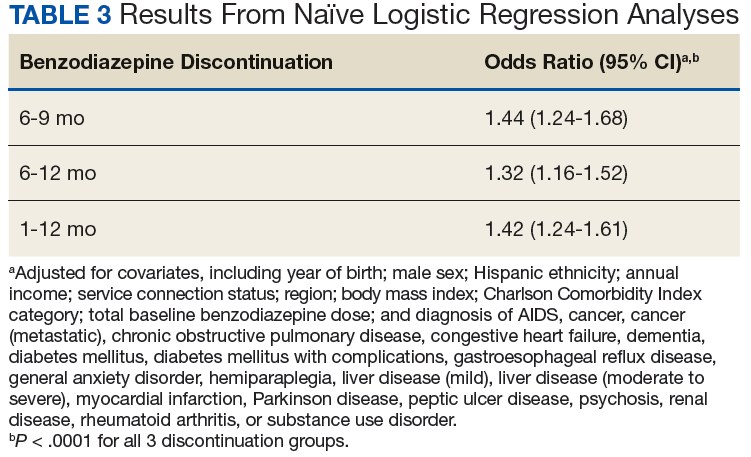
After controlling for potential confounders, the naïve logistic regression analyses found EB exposure was significantly associated with 44%, 32%, and 42% increases in the odds of BZD discontinuation for 6 to 9 months, 6 to 12 months, and 1 to 12 months after the index date, respectively (Table 3). 
Propensity Score Matching. Before matching, there were significant differences in baseline characteristics of veterans who met the inclusion and exclusion criteria, with few exceptions (eAppendices 2 and 3, ).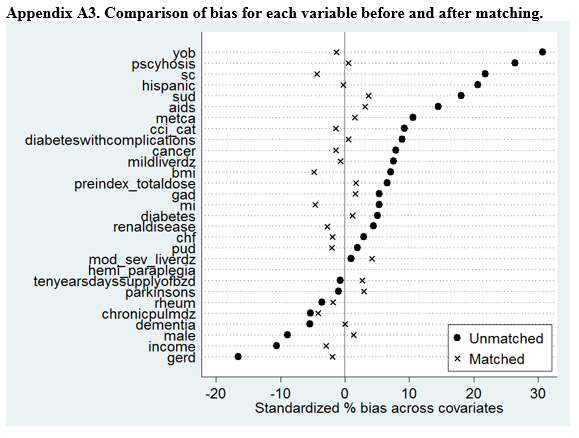
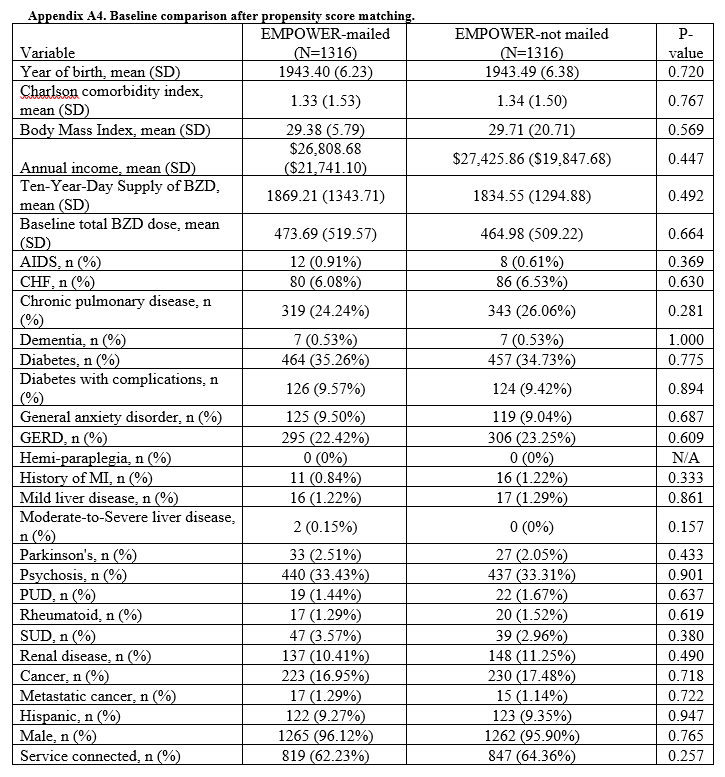
Propensity Score Matching Results. Inspection of PSs revealed good coverage across treatment groups on a histogram plot and a kernel density plot (eAppendices 5 and 6). 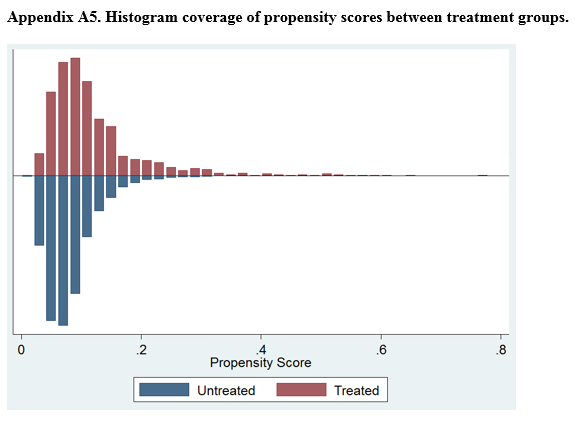
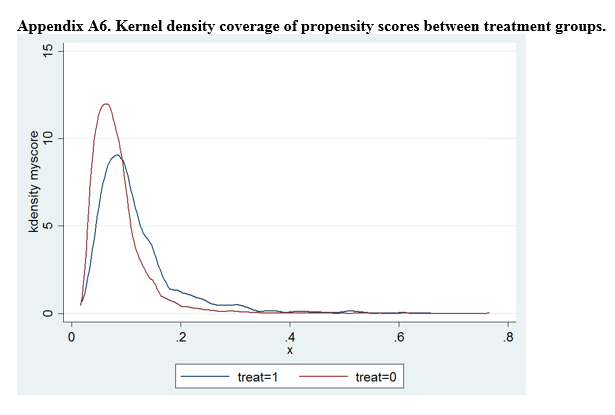

Discussion
This QIP was the first to evaluate the impact of an EMPOWER-modeled DTC EB in a large, integrated health care system in the U.S. It was also the first to demonstrate potential benefits of a DTC EB designed for older veterans who are long-term BZD users. In this QIP, which mailed the EB to 3,896 veterans, 1,847 (47.4%) decreased their BZD dose, 458 (11.7%) tapered and then discontinued BZD, and 455 (11.7%) immediately discontinued BZD. The total percentage of veterans who discontinued BZD (23.4%; 913/3,896) was similar to the 27% reported in the EMPOWER trial.17 However, the risk difference between the 1,316 EB-exposed VISN 22 veterans (QIP-1) and the 1,316 EB-unexposed VISN 21 veterans in this QIP was significantly lower than the 23% risk difference in EMPOWER (though it still demonstrated a significantly larger reduction for EB-exposed veterans).17
Given this inclusion of all qualifying veterans from the catchment area studied in this QIP, and given the ethical and practical concerns, an RCT was not possible. Therefore, PSM methods were used to balance the covariates across treatment groups and thereby simulate an RCT.21,22,27 With use of the PSM approach, findings from the descriptive analysis were confirmed and potential selection bias reduced.
Study Limitations
The less robust risk difference found in this QIP has several possible explanations. The authors’ use of a DTC EB coincided with a national VA effort to reduce older veterans’ use of BZDs and other inappropriate medications. For instance, during the study period, academic detailing was being implemented to reduce use of BZDs, particularly in combination with opioids, across VHA facilities and clinics. (Academic detailing is a pharmacy educational outreach program that uses unbiased clinical guidelines to promote physicians’ safety initiatives and align prescribing behavior with best practices.18-20) However, QIP-2 results and PS analysis of a subgroup of the original sample suggest that EB-exposed veterans were significantly more likely than were their unexposed counterparts were to discontinue BZD. To an extent, this analysis controlled for these other efforts to reduce BZD use in VHA clinics and can be considered a study strength.
Another limitation is the study design, which lacked a control group and did not consider the possibility that some facility or clinic physicians might influence others. Although the region variable was controlled for in PSM, the authors did not capture facility characteristics, including frequency of prescribing BZD and use of a protocol for enforcing the Beers criteria. Such confounders might have influenced outcomes. Unlike the EMPOWER trial,17 this QIP did not assess or exclude cognitively impaired veterans. It is reasonable to assume that these veterans might not understand some EB messages and consequently might fail to engage their physicians. Failure to initiate discussion with a physician would attenuate the impact of the EB.
Study Strengths
A strength of this QIP was its use of a DTC EB in a large, regional sample of older veterans in a real-world clinical setting. In addition, the study group (EB-exposed veterans) and the comparator group (EB-unexposed veterans) were from similar geographic areas (primarily California and Nevada).
Conclusion
Results of this study suggest that a DTC EB, designed to reduce BZD use among older veterans, was effective in helping patients lower their BZD dose and discontinue BZD. The likelihood of discontinuing BZD 9 and 12 months after the index date was significantly higher for veterans who received an EB modeled on the EMPOWER educational brochure than for a comparator group of veterans who did not receive the EB and were receiving care during the same observation period. In the future, it would be beneficial to use a design that controls for physician exposure to academic detailing focused on BZD reduction and that accounts for the cluster effects of facility practice. Despite these limitations, this QIP is the first real-world empirical example of using an EMPOWER-modeled DTC EB to decrease BZD use among older veterans. Furthermore, these results suggest that a DTC EB can be used to target other high-risk prescription drugs, such as opioids, particularly if alternative treatment options can be provided.
Acknowledgments
Dr. Hauser thanks Cathy, Anika, Katia, and Max Hauser, and Alba and Kevin Quinlan, for their support. In memory of Jirina Hauser, who died on Mother’s Day, May 14, 2017, at the age of 100.
1. Dell’osso B, Lader M. Do benzodiazepines still deserve a major role in the treatment of psychiatric disorders? A critical reappraisal. Eur Psychiatry. 2013;28(1):7-20.
2. Olfson M, King M, Schoenbaum M. Benzodiazepine use in the United States. JAMA Psychiatry. 2015;72(2):136-142.
3. Bernardy NC, Lund BC, Alexander B, Friedman MJ. Increased polysedative use in veterans with posttraumatic stress disorder. Pain Med. 2014;15(7):1083-1090.
4. Roberts KJ. Patient empowerment in the United States: a critical commentary. Health Expect. 1999;2(2):82-92.
5. Paterniti S, Dufouil C, Alpérovitch A. Long-term benzodiazepine use and cognitive decline in the elderly: the Epidemiology of Vascular Aging Study. J Clin Psychopharmacol. 2002;22(3):285-293.
6. van der Hooft CS, Schoofs MW, Ziere G, et al. Inappropriate benzodiazepine use in older adults and the risk of fracture. Br J Clin Pharmacol. 2008;66(2):276-282.
7. Zint K, Haefeli WE, Glynn RJ, Mogun H, Avorn J, Stürmer T. Impact of drug interactions, dosage, and duration of therapy on the risk of hip fracture associated with benzodiazepine use in older adults. Pharmacoepidemiol Drug Saf. 2010;19(12):1248-1255.
8. Finkle WD, Der JS, Greenland S, et al. Risk of fractures requiring hospitalization after an initial prescription for zolpidem, alprazolam, lorazepam, or diazepam in older adults. J Am Geriatr Soc. 2011;59(10):1883-1890.
9. de Gage SB, Bégaud B, Bazin F, et al. Benzodiazepine use and risk of dementia: prospective population based study. BMJ. 2012;345:e6231
10. Tannenbaum C, Paquette A, Hilmer S, Holroyd-Leduc J, Carnahan R. A systematic review of amnestic and non-amnestic mild cognitive impairment induced by anticholinergic, antihistamine, GABAergic and opioid drugs. Drugs Aging. 2012;29(8):639-658.
11. Vozoris NT, Fischer HD, Wang X, et al. Benzodiazepine drug use and adverse respiratory outcomes among older adults with chronic obstructive pulmonary disease. Eur Respir J. 2014;44(2):332-340.
12. Gomm W, von Holt K, Thomé F, et al. Regular benzodiazepine and z-substance use and risk of dementia: an analysis of German claims data. J Alzheimers Dis. 2016;54(2):801-808.
13. American Geriatrics Society 2012 Beers Criteria Update Expert Panel. American Geriatrics Society updated Beers criteria for potentially inappropriate medication use in older adults. J Am Geriatr Soc. 2012;60(4):616-631.
14. National Institutes of Health. Despite risks, benzodiazepine use highest in older people. https://www.nih.gov/news-events/news-releases/despite-risks-benzodiaze pine-use-highest-older-people. Published December 17, 2014. Accessed July 31, 2018.
15. Airagnes G, Pelissolo A, Lavallée M, Flament M, Limosin F. Benzodiazepine misuse in the elderly: risk factors, consequences, and management. Curr Psychiatry Rep. 2016;18(10):89.
16. Martin P, Tamblyn R, Ahmed S, Tannenbaum C. A drug education tool developed for older adults changes knowledge, beliefs and risk perceptions about inappropriate benzodiazepine prescriptions in the elderly. Patient Educ Couns. 2013;92(1):81-87.
17. Tannenbaum C, Martin P, Tamblyn R, Benedetti A, Ahmed S. Reduction of inappropriate benzodiazepine prescriptions among older adults through direct patient education: the EMPOWER cluster randomized trial. JAMA Intern Med. 2014;174(6):890-898.
18. Soumerai SB, Avorn J. Principles of educational outreach (‘academic detailing’) to improve clinical decision making. JAMA. 1990;263(4):549-556.
19. Fischer MA, Avorn J. Academic detailing can play a key role in assessing and implementing comparative effectiveness research findings. Health Aff (Millwood). 2012;31(10):2206-2212.
20. Wells DL, Popish S, Kay C, Torrise V, Christopher ML. VA Academic Detailing Service: implementation and lessons learned. Fed Pract. 2016;33(5):38-42.
21. Austin PC. An introduction to propensity score methods for reducing the effects of confounding in observational studies. Multivariate Behav Res. 2011;46(3):399-424.
22. Brookhart MA, Schneeweiss S, Rothman KJ, Glynn RJ, Avorn J, Stürmer T. Variable selection for propensity score models. Am J Epidemiol. 2006;163(12):1149-1156.
23. Rubin DB. Estimating causal effects of treatments in randomized and nonrandomized studies. J Ed Psych. 1974;66(5):688-701.
24. Greenland S. An introduction to instrumental variables for epidemiologists. Int J Epidemiol. 2000;29(4):722-729.
25. Cartwright N. What are randomized controlled trials good for? Philos Stud. 2010;147(1):59.
26. Kleinbaum DG, Morgenstern H, Kupper LL. Selection bias in epidemiologic studies. Am J Epidemiol. 1981;113(4):452-463.
27. Rosenbaum PR, Rubin DB. The central role of the propensity score in observational studies for causal effects. Biometrika. 1983;70(1):41-55.
28. Pirracchio R, Carone M, Rigon MR, Caruana E, Mebazaa A, Chevret S. Propensity score estimators for the average treatment effect and the average treatment effect on the treated may yield very different estimates. Stat Methods Med Res. 2016;25(5):1938-1954.
This quality improvement project used an educational brochure to help older veterans reduce their benzodiazepine use.
This quality improvement project used an educational brochure to help older veterans reduce their benzodiazepine use.
Benzodiazepines (BZDs) are among the most commonly prescribed medications. A recent study found that in 2008, more than 5% of Americans used a BZD, and the percentage was almost 9% among Americans aged ≥ 65 years.1,2 Among veterans, BZD use is even higher, in part because of the high prevalence of posttraumatic stress disorder (PTSD). One study found that more than 30% of veterans with PTSD received at least 1 BZD prescription.3 The risks associated with BZD treatment for PTSD are compounded by concurrent use of other sedatives and opioids prescribed for co-occurring chronic pain and insomnia.3
Older adults metabolize long-acting BZDs more slowly and generally have an increased sensitivity to the adverse effects (AEs) of all BZDs.4 In older adults, BZD use has been associated with cognitive decline, dementia, falls and consequent fractures, and adverse respiratory outcomes.5-12 The risk of most but not all of these AEs was increased with higher BZD dose or long-term BZD use, which this quality improvement project (QIP) defines as having at least a 60-day supply of BZD prescriptions dispensed within the past year.
Long-term BZD use increases with age. One study found that, among patients receiving a BZD, the rate of long-term BZD use was more than double in older adults (31.4%) than it was in adults aged between 18 and 35 years (14.7%).2 For these reasons, the 2012 Beers criteria of the American Geriatrics Society recommend avoiding all types of BZDs in the treatment of insomnia, agitation, or delirium in patients aged > 65 years.13 Despite this recommendation, the prevalence of BZD use in older adults remains high.14
Some innovative approaches have been developed to address the inappropriate use, including overuse and misuse, of BZDs in older adults.15 In one approach, direct-to-consumer (DTC) information is used to empower patients to collaborate with their physician to manage their health. Results from several studies suggest that providing older patients with information on BZD risks and benefits increases patient–physician interaction and thereby decreases inappropriate BZD use and improves health outcomes.4,16,17 One study found that perceptions of BZD risks increased 1 week after exposure to a DTC educational brochure (EB), with intention to discuss BZD discontinuation with their physician higher for patients who received the EB than it was for those who did not (83.1% vs 44.3%; P < .0001).16 The EMPOWER (Eliminating Medications Through Patient Ownership of End Results) cluster randomized controlled trial assessed the effectiveness of a DTC EB focused on BZD risks in older adults.17 In that seminal study, patients who received a DTC EB were more likely than were comparison patients to discontinue BZD within 6 months (27% vs 5%; risk difference, 23%; 95% CI, 14%-32%).
The Veterans Integrated Systems Network (VISN) 22 Academic Detailing Program is a pharmacy educational outreach program that uses unbiased clinical guidelines to promote physicians’ safety initiatives and align prescribing behavior with best practices.18-20 With BZD use among older veterans remaining high, the VISN 22 program initiated a clinical QIP modeled on the EMPOWER trial. Veterans in VISN 22 received the DTC EB, which included information on BZD risks and encouraged them to discuss their BZD treatment with their health care provider. VISN 22 was the first VISN in the VHA to implement the EMPOWER protocol.
As this was a QIP, all eligible veterans in VISN 22 were mailed the DTC EB, thus making it difficult to estimate the impact of the EB on BZD discontinuation in this VISN. Therefore, DTC EB efficacy was estimated by comparing BZD discontinuation between VISN 22 and VISN 21, an adjacent VISN that did not mail the DTC EB.
Methods
Two QIPs were undertaken to determine the impact of DTC EB on BZD use in older veterans in the VHA.
Quality Improvement Project 1
Design. A retrospective cohort analysis was performed. The VISN 22 catchment area, which encompasses VA facilities and clinics in southern California and southern Nevada, serves about 500,000 veterans, a substantial proportion of whom are aged ≥ 65 years. Among these older veterans are active long-term BZD users, who were defined as having ≥ 60-day supply of BZD prescriptions dispensed within the past year. Each active long-term user with a BZD prescription released within 200 days before the index date (the date the user was to meet with the prescribing physician) was mailed an EB 2 to 8 weeks in advance of the visit. Excluded from analysis were veterans with a schizophrenia, spinal cord injury, or seizure disorder diagnosis recorded in both their inpatient and outpatient medical records; veterans seen by Palliative Care within the past year; and veterans who died before analysis was completed.
Education Brochure. The EB for VISN 22 (Figure 1, see
Patients. The sample consisted of all veterans identified as meeting the inclusion criteria and being enrolled in VISN 22. The EB was mailed once to veterans on a rolling basis from December 2014 to February 2016. Change in BZD use was analyzed only after 9 to 24 months had passed since the index appointment with the prescribing physician. This period included 12 weeks for BZD taper and then 6 months after taper.
Analysis. For each veteran, monthly mean lorazepam equivalent (LE) was calculated using as many as 12 fills before the index date. Average daily dose of LE was calculated by dividing the sum of LE from all included prescriptions by total number of days between the first fill and the index date. The BZD prescription fills were evaluated after the index date. Veterans who received at least 1 prescription after the index date but then had no BZD prescription activity in VA clinics for 3 consecutive months during the 9-month observation period were recorded as having tapered and then discontinued BZD. Veterans who had no BZD prescription activity in VA clinics after the index date and during the 9-month observation period were recorded as having discontinued BZD without tapering. For veterans who had BZD prescription activity in VA clinics after the index date and during the 9-month observation period, mean LE was calculated by dividing the total LE for BZD prescriptions after the index date by number of days from the first fill after the index date to the date of analysis.
Quality Improvement Project 2
Design. A retrospective cohort analysis using PSM was performed on a subgroup of the QIP-1 sample to evaluate the impact of EB on BZD prescribing in the VA during 2 periods: 6 to 9 months and 6 to 12 months after the index date. A secondary outcome was discontinuation 1 to 12 months after the index date. Veterans in the analysis were active long-term BZD users, had at least 1 BZD prescription released within 200 days before the index date, were aged ≥ 65 years, and had an appointment scheduled with their BZD prescriber within 2 to 8 weeks (Figure 2).
Patients. VISN 22 implemented QIP-2, a real-world application of a modified EMPOWER program, by identifying eligible veterans on a rolling basis from December 2014 to August 2015. All veterans who were identified and sent an EB during this period were included in the case group. The index date was defined as the first of the month the EB was mailed. Veterans with a pending appointment were chosen because the lead time would allow them to receive the EB and prepare to discuss it with the physician during the visit.
A comparator group was drawn from the adjacent VISN 21 catchment area, which encompasses VA facilities and clinics in Hawaii, northern California, and northern Nevada. During the observation period, VISN 21 did not mail any EBs specifically addressing BZD risks. Veterans in the comparator group had an appointment scheduled with their BZD prescribing physician within 4 weeks, were aged ≥ 65 years on the index date (first of the month before the next appointment, coinciding with the date EBs were sent to VISN 22 veterans), were active long-term BZD users, and had at least 1 BZD prescription released within 200 days before the index date. All patients were followed for up to 12 months after the index date, with BZD discontinuation recorded 9 and 12 months after the index date.
Propensity Score Matching
Propensity score (PS) was estimated with logistic regression analysis with treatment as the dependent variable and baseline characteristics as the independent variables.21,22 One-to-one matching on the PS was performed using the nearest neighbor approach without replacements. Independent variables related to outcome but unrelated to EB exposure were selected for PS development.22 These variables included year of birth; male sex; Hispanic ethnicity; annual income; service connection status; region; body mass index; Charlson Comorbidity Index category; total baseline BZD dose; and diagnosis of AIDS, nonmetastatic cancer, metastatic cancer, chronic obstructive pulmonary disease (COPD), congestive heart failure (CHF), dementia, diabetes mellitus (DM), DM with complications, gastroesophageal reflux disease (GERD), general anxiety disorder (GAD), hemiparaplegia, liver disease (mild), liver disease (moderate to severe), myocardial infarction (MI), Parkinson disease, peptic ulcer disease (PUD), psychosis, renal disease, rheumatoid arthritis (RA), or substance use disorder (SUD).
The EMPOWER cluster randomized controlled trial (RCT) demonstrated the effectiveness of EB exposure in a Canadian population of elderly patients who were long-term BZD users.17 Randomized controlled trials are the gold standard for clinical trials because they can establish causal inference.23-25 Given ethical and practical concerns, however, RCTs cannot be applied to all clinical scenarios. Although EMPOWER is reported to be an effective tool in reducing BZD use in older adults, its application in a real-world, large, integrated health care system remains untested. Observational studies are often conducted as an alternative to RCTs but are subject to selection bias because of their lack of randomization.26 Therefore, robust research methods are needed to generate unbiased estimates of the impact of an intervention on an outcome. Propensity score matching simulates an RCT by balancing the covariates across treatment groups.21,22,27 Observed patient characteristics are used to estimate PS, the probability that treatment will be received. Logistic or probit regression is used to balance the potential confounding covariates between the treatment groups.Once PSs are known, mean treatment effect can be estimated without the mean model.28 In other words, PSM methods can be used to generate an unbiased estimate of the treatment.
Propensity Score Analysis
Baseline characteristics were compared using Student t test (continuous variables) and χ2 test (discrete variables). Results are presented as means and standard deviations (continuous variables) and frequency and percentage (discrete variables).
The main outcome was BZD discontinuation 9 and 12 months after the index date. A postindex lag of 6 months was used to capture any tapering (Figure 2). Discontinuation, defined as 3 consecutive months of no BZD prescription on hand, was measured for 2 periods: 6 to 9 months and 6 to 12 months after the index date. A secondary outcome was discontinuation 1 to 12 months after the index date. An estimate was made of the difference in the proportions of BZD discontinuers who received the EB and BZD discontinuers who did not receive the EB, where mean treatment (risk difference) was presented as the absolute risk difference with a 95% CI. Standard errors and 95% CIs for the risk differences were generated with biased-corrected CIs from 1,000 bootstrap samples.
Sensitivity Analyses
Naïve multivariate logistic regression analysis was performed to evaluate the association between EB exposure and BZD discontinuation while controlling for potential confounders. Results are presented as odds ratios (ORs) and 95% CIs. Confounders identified were the same covariates used to generate the PSs.
Several analyses were performed to test the sensitivity of the methods applied using PSM by changing caliber size while maintaining the nearest neighbor approach without replacement. Linear regression analysis was performed with robust standard errors to estimate the risk difference of BZD discontinuation between EB-exposed and EB-unexposed veterans.
Statistical significance was set at P < .05. All statistical analyses were performed with Stata/SE Version 13 (College Station, TX).
Results
Quality Improvement Project 1
On a rolling basis from December 2014 to February 2016, the EB was mailed once to 3,896 VISN 22 veterans 2 to 8 weeks before a clinic appointment with their BZD prescribing physician.
Quality Improvement Project 2
Of all the VISN 22 and VISN 21 veterans, 24,420 met the inclusion and exclusion criteria. Of these 24,420 veterans, 2,020 (8.3%) were in VISN 22 and received the EB between December 2014 and August 2015 (QIP-1), and 22,400 (91.7%) were in VISN 21 and did not receive the EB.
Naïve Results Before PS Matching. In the naïve analyses, a larger proportion of EB-exposed vs unexposed veterans discontinued BZD; in addition, reductions were 6.6%, 7.4%, and 9.5% larger for 6 to 9 months, 6 to 12 months, and 1 to 12 months after the index date, respectively (P < .0001 for all comparisons; Table 2).
After controlling for potential confounders, the naïve logistic regression analyses found EB exposure was significantly associated with 44%, 32%, and 42% increases in the odds of BZD discontinuation for 6 to 9 months, 6 to 12 months, and 1 to 12 months after the index date, respectively (Table 3).
Propensity Score Matching. Before matching, there were significant differences in baseline characteristics of veterans who met the inclusion and exclusion criteria, with few exceptions (eAppendices 2 and 3, ).
Propensity Score Matching Results. Inspection of PSs revealed good coverage across treatment groups on a histogram plot and a kernel density plot (eAppendices 5 and 6).
Discussion
This QIP was the first to evaluate the impact of an EMPOWER-modeled DTC EB in a large, integrated health care system in the U.S. It was also the first to demonstrate potential benefits of a DTC EB designed for older veterans who are long-term BZD users. In this QIP, which mailed the EB to 3,896 veterans, 1,847 (47.4%) decreased their BZD dose, 458 (11.7%) tapered and then discontinued BZD, and 455 (11.7%) immediately discontinued BZD. The total percentage of veterans who discontinued BZD (23.4%; 913/3,896) was similar to the 27% reported in the EMPOWER trial.17 However, the risk difference between the 1,316 EB-exposed VISN 22 veterans (QIP-1) and the 1,316 EB-unexposed VISN 21 veterans in this QIP was significantly lower than the 23% risk difference in EMPOWER (though it still demonstrated a significantly larger reduction for EB-exposed veterans).17
Given this inclusion of all qualifying veterans from the catchment area studied in this QIP, and given the ethical and practical concerns, an RCT was not possible. Therefore, PSM methods were used to balance the covariates across treatment groups and thereby simulate an RCT.21,22,27 With use of the PSM approach, findings from the descriptive analysis were confirmed and potential selection bias reduced.
Study Limitations
The less robust risk difference found in this QIP has several possible explanations. The authors’ use of a DTC EB coincided with a national VA effort to reduce older veterans’ use of BZDs and other inappropriate medications. For instance, during the study period, academic detailing was being implemented to reduce use of BZDs, particularly in combination with opioids, across VHA facilities and clinics. (Academic detailing is a pharmacy educational outreach program that uses unbiased clinical guidelines to promote physicians’ safety initiatives and align prescribing behavior with best practices.18-20) However, QIP-2 results and PS analysis of a subgroup of the original sample suggest that EB-exposed veterans were significantly more likely than were their unexposed counterparts were to discontinue BZD. To an extent, this analysis controlled for these other efforts to reduce BZD use in VHA clinics and can be considered a study strength.
Another limitation is the study design, which lacked a control group and did not consider the possibility that some facility or clinic physicians might influence others. Although the region variable was controlled for in PSM, the authors did not capture facility characteristics, including frequency of prescribing BZD and use of a protocol for enforcing the Beers criteria. Such confounders might have influenced outcomes. Unlike the EMPOWER trial,17 this QIP did not assess or exclude cognitively impaired veterans. It is reasonable to assume that these veterans might not understand some EB messages and consequently might fail to engage their physicians. Failure to initiate discussion with a physician would attenuate the impact of the EB.
Study Strengths
A strength of this QIP was its use of a DTC EB in a large, regional sample of older veterans in a real-world clinical setting. In addition, the study group (EB-exposed veterans) and the comparator group (EB-unexposed veterans) were from similar geographic areas (primarily California and Nevada).
Conclusion
Results of this study suggest that a DTC EB, designed to reduce BZD use among older veterans, was effective in helping patients lower their BZD dose and discontinue BZD. The likelihood of discontinuing BZD 9 and 12 months after the index date was significantly higher for veterans who received an EB modeled on the EMPOWER educational brochure than for a comparator group of veterans who did not receive the EB and were receiving care during the same observation period. In the future, it would be beneficial to use a design that controls for physician exposure to academic detailing focused on BZD reduction and that accounts for the cluster effects of facility practice. Despite these limitations, this QIP is the first real-world empirical example of using an EMPOWER-modeled DTC EB to decrease BZD use among older veterans. Furthermore, these results suggest that a DTC EB can be used to target other high-risk prescription drugs, such as opioids, particularly if alternative treatment options can be provided.
Acknowledgments
Dr. Hauser thanks Cathy, Anika, Katia, and Max Hauser, and Alba and Kevin Quinlan, for their support. In memory of Jirina Hauser, who died on Mother’s Day, May 14, 2017, at the age of 100.
1. Dell’osso B, Lader M. Do benzodiazepines still deserve a major role in the treatment of psychiatric disorders? A critical reappraisal. Eur Psychiatry. 2013;28(1):7-20.
2. Olfson M, King M, Schoenbaum M. Benzodiazepine use in the United States. JAMA Psychiatry. 2015;72(2):136-142.
3. Bernardy NC, Lund BC, Alexander B, Friedman MJ. Increased polysedative use in veterans with posttraumatic stress disorder. Pain Med. 2014;15(7):1083-1090.
4. Roberts KJ. Patient empowerment in the United States: a critical commentary. Health Expect. 1999;2(2):82-92.
5. Paterniti S, Dufouil C, Alpérovitch A. Long-term benzodiazepine use and cognitive decline in the elderly: the Epidemiology of Vascular Aging Study. J Clin Psychopharmacol. 2002;22(3):285-293.
6. van der Hooft CS, Schoofs MW, Ziere G, et al. Inappropriate benzodiazepine use in older adults and the risk of fracture. Br J Clin Pharmacol. 2008;66(2):276-282.
7. Zint K, Haefeli WE, Glynn RJ, Mogun H, Avorn J, Stürmer T. Impact of drug interactions, dosage, and duration of therapy on the risk of hip fracture associated with benzodiazepine use in older adults. Pharmacoepidemiol Drug Saf. 2010;19(12):1248-1255.
8. Finkle WD, Der JS, Greenland S, et al. Risk of fractures requiring hospitalization after an initial prescription for zolpidem, alprazolam, lorazepam, or diazepam in older adults. J Am Geriatr Soc. 2011;59(10):1883-1890.
9. de Gage SB, Bégaud B, Bazin F, et al. Benzodiazepine use and risk of dementia: prospective population based study. BMJ. 2012;345:e6231
10. Tannenbaum C, Paquette A, Hilmer S, Holroyd-Leduc J, Carnahan R. A systematic review of amnestic and non-amnestic mild cognitive impairment induced by anticholinergic, antihistamine, GABAergic and opioid drugs. Drugs Aging. 2012;29(8):639-658.
11. Vozoris NT, Fischer HD, Wang X, et al. Benzodiazepine drug use and adverse respiratory outcomes among older adults with chronic obstructive pulmonary disease. Eur Respir J. 2014;44(2):332-340.
12. Gomm W, von Holt K, Thomé F, et al. Regular benzodiazepine and z-substance use and risk of dementia: an analysis of German claims data. J Alzheimers Dis. 2016;54(2):801-808.
13. American Geriatrics Society 2012 Beers Criteria Update Expert Panel. American Geriatrics Society updated Beers criteria for potentially inappropriate medication use in older adults. J Am Geriatr Soc. 2012;60(4):616-631.
14. National Institutes of Health. Despite risks, benzodiazepine use highest in older people. https://www.nih.gov/news-events/news-releases/despite-risks-benzodiaze pine-use-highest-older-people. Published December 17, 2014. Accessed July 31, 2018.
15. Airagnes G, Pelissolo A, Lavallée M, Flament M, Limosin F. Benzodiazepine misuse in the elderly: risk factors, consequences, and management. Curr Psychiatry Rep. 2016;18(10):89.
16. Martin P, Tamblyn R, Ahmed S, Tannenbaum C. A drug education tool developed for older adults changes knowledge, beliefs and risk perceptions about inappropriate benzodiazepine prescriptions in the elderly. Patient Educ Couns. 2013;92(1):81-87.
17. Tannenbaum C, Martin P, Tamblyn R, Benedetti A, Ahmed S. Reduction of inappropriate benzodiazepine prescriptions among older adults through direct patient education: the EMPOWER cluster randomized trial. JAMA Intern Med. 2014;174(6):890-898.
18. Soumerai SB, Avorn J. Principles of educational outreach (‘academic detailing’) to improve clinical decision making. JAMA. 1990;263(4):549-556.
19. Fischer MA, Avorn J. Academic detailing can play a key role in assessing and implementing comparative effectiveness research findings. Health Aff (Millwood). 2012;31(10):2206-2212.
20. Wells DL, Popish S, Kay C, Torrise V, Christopher ML. VA Academic Detailing Service: implementation and lessons learned. Fed Pract. 2016;33(5):38-42.
21. Austin PC. An introduction to propensity score methods for reducing the effects of confounding in observational studies. Multivariate Behav Res. 2011;46(3):399-424.
22. Brookhart MA, Schneeweiss S, Rothman KJ, Glynn RJ, Avorn J, Stürmer T. Variable selection for propensity score models. Am J Epidemiol. 2006;163(12):1149-1156.
23. Rubin DB. Estimating causal effects of treatments in randomized and nonrandomized studies. J Ed Psych. 1974;66(5):688-701.
24. Greenland S. An introduction to instrumental variables for epidemiologists. Int J Epidemiol. 2000;29(4):722-729.
25. Cartwright N. What are randomized controlled trials good for? Philos Stud. 2010;147(1):59.
26. Kleinbaum DG, Morgenstern H, Kupper LL. Selection bias in epidemiologic studies. Am J Epidemiol. 1981;113(4):452-463.
27. Rosenbaum PR, Rubin DB. The central role of the propensity score in observational studies for causal effects. Biometrika. 1983;70(1):41-55.
28. Pirracchio R, Carone M, Rigon MR, Caruana E, Mebazaa A, Chevret S. Propensity score estimators for the average treatment effect and the average treatment effect on the treated may yield very different estimates. Stat Methods Med Res. 2016;25(5):1938-1954.
Association Between Postdischarge Emergency Department Visitation and Readmission Rates
Hospital readmissions for acute myocardial infarction (AMI), heart failure, and pneumonia have become central to quality-measurement efforts by the Centers for Medicare & Medicaid Services (CMS), which seek to improve hospital care transitions through public reporting and payment programs.1 Most current measures are limited to readmissions that require inpatient hospitalization and do not capture return visits to the emergency department (ED) that do not result in readmission but rather ED discharge. These visits may reflect important needs for acute, unscheduled care during the vulnerable posthospitalization period.2-5 While previous research has suggested that nearly 10% of patients may return to the ED following hospital discharge without readmission, the characteristics of these visits among Medicare beneficiaries and the implications for national care-coordination quality-measurement initiatives have not been explored.6,7
As the locus of acute outpatient care and the primary portal of hospital admissions and readmissions, ED visits following hospital discharge may convey meaningful information about posthospitalization care transitions.8,9 In addition, recent reviews and perspectives have highlighted the role of ED care-coordination services as interventions to reduce inpatient hospitalizations and improve care transitions,10,11 yet no empirical studies have evaluated the relationship between these unique care-coordination opportunities in the ED and care-coordination outcomes, such as hospital readmissions. As policymakers seek to develop accountability measures that capture the totality of acute, unscheduled visits following hospital discharge, describing the relationship between ED visits and readmissions will be essential to providers for benchmarking and to policymakers and payers seeking to reduce the total cost of care.12,13
Accordingly, we sought to characterize the frequency, diagnoses, and hospital-level variation in treat-and-discharge ED visitation following hospital discharge for 3 conditions for which hospital readmission is publicly reported by the CMS: AMI, heart failure, and pneumonia. We also sought to evaluate the relationship between hospital-level ED visitation following hospital discharge and publicly reported, risk-standardized readmission rates (RSRRs).
METHODS
Study Design
This study was a cross-sectional analysis of Medicare beneficiaries discharged alive following hospitalization for AMI, heart failure, and pneumonia between July 2011 and June 2012.
Selection of Participants
We used Medicare Standard Analytic Files to identify inpatient hospitalizations for each disease cohort based on principal discharge diagnoses. Each condition-specific cohort was constructed to be consistent with the CMS’s readmission measures using International Classification of Diseases, 9th Revision-Clinical Modification codes to identify AMI, heart failure, and pneumonia discharges.1 We included only patients who were enrolled in fee-for-service (FFS) Medicare parts A and B for 12 months prior to their index hospitalization to maximize the capture of diagnoses for risk adjustment. Each cohort included only patients who were discharged alive while maintaining FFS coverage for at least 30 days following hospital discharge to minimize bias in outcome ascertainment. We excluded patients who were discharged against medical advice. All contiguous admissions that were identified in a transfer chain were considered to be a single admission. Hospitals with fewer than 25 condition-specific index hospital admissions were excluded from this analysis for consistency with publicly reported measures.1
Measurements
Outcomes
We describe hospital-level, postdischarge ED visitation as the risk-standardized postdischarge ED visit rate. The general construct of this measure is consistent with those of prior studies that define postdischarge ED visitation as the proportion of index admissions followed by a treat-and-discharge ED visit without hospital readmission2,3; however, this outcome also incorporates a risk-standardization model with covariates that are identical to the risk-standardization approach that is used for readmission measurement.
We describe hospital-level readmission by calculating RSRRs consistent with CMS readmission measures, which are endorsed by the National Quality Forum and used for public reporting.15-17 Detailed technical documentation, including the SAS code used to replicate hospital-level measures of readmission, are available publicly through the CMS QualityNet portal.18
We calculated risk-standardized postdischarge ED visit rates and RSRRs as the ratio of the predicted number of postdischarge ED visits or readmissions for a hospital given its observed case mix to the expected number of postdischarge ED visits or readmissions based on the nation’s performance with that hospital’s case mix, respectively. This approach estimates a distinct risk-standardized postdischarge ED visit rate and RSRR for each hospital using hierarchical generalized linear models (HGLMs) and using a logit link with a first-level adjustment for age, sex, 29 clinical covariates for AMI, 35 clinical covariates for heart failure, and 38 clinical covariates for pneumonia. Each clinical covariate is identified based on inpatient and outpatient claims during the 12 months prior to the index hospitalization. The second level of the HGLM includes a random hospital-level intercept. This approach to measuring hospital readmissions accounts for the correlated nature of observed readmission rates within a hospital and reflects the assumption that after adjustment for patient characteristics and sampling variability, the remaining variation in postdischarge ED visit rates or readmission rates reflects hospital quality.
Analysis
In order to characterize treat-and-discharge postdischarge ED visits, we first described the clinical conditions that were evaluated during the first postdischarge ED visit. Based on the principal discharge diagnosis, ED visits were grouped into clinically meaningful categories using the Agency for Healthcare Research and Quality Clinical Classifications Software (CCS).19 We also report hospital-level variation in risk-standardized postdischarge ED visit rates for AMI, heart failure, and pneumonia.
Next, we examined the relationship between hospital characteristics and risk-standardized postdischarge ED visit rates. We linked hospital characteristics from the American Hospital Association (AHA) Annual Survey to the study dataset, including the following: safety-net status, teaching status, and urban or rural status. Consistent with prior work, hospital safety-net status was defined as a hospital Medicaid caseload greater than 1 standard deviation above the mean Medicaid caseload in the hospital’s state. Approximately 94% of the hospitals included in the 3 condition cohorts in the dataset had complete data in the 2011 AHA Annual Survey to be included in this analysis.
We evaluated the relationship between postdischarge ED visit rates and hospital readmission rates in 2 ways. First, we calculated Spearman rank correlation coefficients between hospital-level, risk-standardized postdischarge ED visit rates and RSRRs. Second, we calculated hospital-level variation in RSRRs based on the strata of risk-standardized postdischarge ED visit rates. Given the normal distribution of postdischarge ED visit rates, we grouped hospitals by quartile of postdischarge ED visit rates and 1 group for hospitals with no postdischarge ED visits.
Based on preliminary analyses indicating a relationship between hospital size, measured by condition-specific index hospitalization volume, and postdischarge treat-and-discharge ED visit rates, all descriptive statistics and correlations reported are weighted by the volume of condition-specific index hospitalizations. The study was approved by the Yale University Human Research Protection Program. All analyses were conducted using SAS 9.1 (SAS Institute Inc, Cary, NC). The analytic plan and results reported in this work are in compliance with the Strengthening the Reporting of Observational Studies in Epidemiology checklist.20
RESULTS
During the 1-year study period, we included a total of 157,035 patients who were hospitalized at 1656 hospitals for AMI, 391,209 at 3044 hospitals for heart failure, and 342,376 at 3484 hospitals for pneumonia. Details of study cohort creation are available in supplementary Table 1. After hospitalization for AMI, 14,714 patients experienced a postdischarge ED visit (8.4%) and 27,214 an inpatient readmissions (17.3%) within 30 days of discharge; 31,621 (7.6%) and 88,106 (22.5%) patients after hospitalization for heart failure and 26,681 (7.4%) and 59,352 (17.3%) patients after hospitalization for pneumonia experienced a postdischarge ED visit and an inpatient readmission within 30 days of discharge, respectively.
Postdischarge ED visits were for a wide variety of conditions, with the top 10 CCS categories comprising 44% of postdischarge ED visits following AMI hospitalizations, 44% of following heart failure hospitalizations, and 41% following pneumonia hospitalizations (supplementary Table 2). The first postdischarge ED visit was rarely for the same condition as the index hospitalization in the AMI cohort (224 visits; 1.5%) as well as the pneumonia cohort (1401 visits; 5.3%). Among patients who were originally admitted for heart failure, 10.6% of the first postdischarge ED visits were also for congestive heart failure.
We found wide hospital-level variation in postdischarge ED visit rates for each condition: AMI (median: 8.3%; 5th and 95th percentile: 2.8%-14.3%), heart failure (median: 7.3%; 5th and 95th percentile: 3.0%-13.3%), and pneumonia (median: 7.1%; 5th and 95th percentile: 2.4%-13.2%; supplementary Table 3). The variation persisted after accounting for hospital case mix, as evidenced in the supplementary Figure, which describes hospital variation in risk-standardized postdischarge ED visit rates. This variation was statistically significant (P < .001), as demonstrated by the isolated relationship between the random effect and the outcome (AMI: random effect estimate 0.0849 [95% confidence interval (CI), 0.0832 to 0.0866]; heart failure: random effect estimate 0.0796 [95% CI, 0.0784 to 0.0809]; pneumonia: random effect estimate 0.0753 [95% CI, 0.0741 to 0.0764]).
Across all 3 conditions, hospitals located in rural areas had significantly higher risk-standardized postdischarge ED visit rates than hospitals located in urban areas (10.1% vs 8.6% for AMI, 8.4% vs 7.5% for heart failure, and 8.0% vs 7.4% for pneumonia). In comparison to teaching hospitals, nonteaching hospitals had significantly higher risk-standardized postdischarge ED visit rates following hospital discharge for pneumonia (7.6% vs 7.1%). Safety-net hospitals also had higher risk-standardized postdischarge ED visitation rates following discharge for heart failure (8.4% vs 7.7%) and pneumonia (7.7% vs 7.3%). Risk-standardized postdischarge ED visit rates were higher in publicly owned hospitals than in nonprofit or privately owned hospitals for heart failure (8.0% vs 7.5% in nonprofit hospitals or 7.5% in private hospitals) and pneumonia (7.7% vs 7.4% in nonprofit hospitals and 7.3% in private hospitals; Table).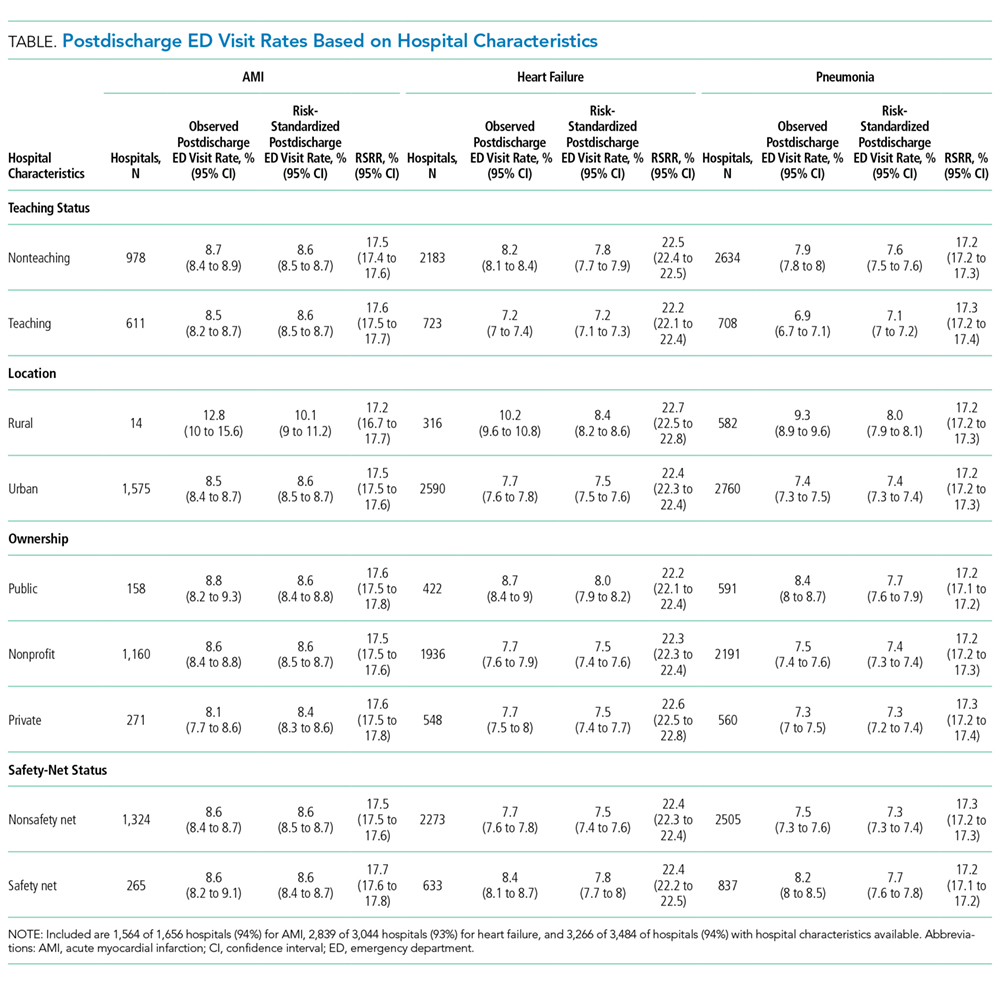
Among hospitals with RSRRs that were publicly reported by CMS, we found a moderate inverse correlation between risk-standardized postdischarge ED visit rates and hospital RSRRs for each condition: AMI (r = −0.23; 95% CI, −0.29 to −0.19), heart failure (r = −0.29; 95% CI, −0.34 to −0.27), and pneumonia (r = −0.18; 95% CI, −0.22 to −0.15; Figure).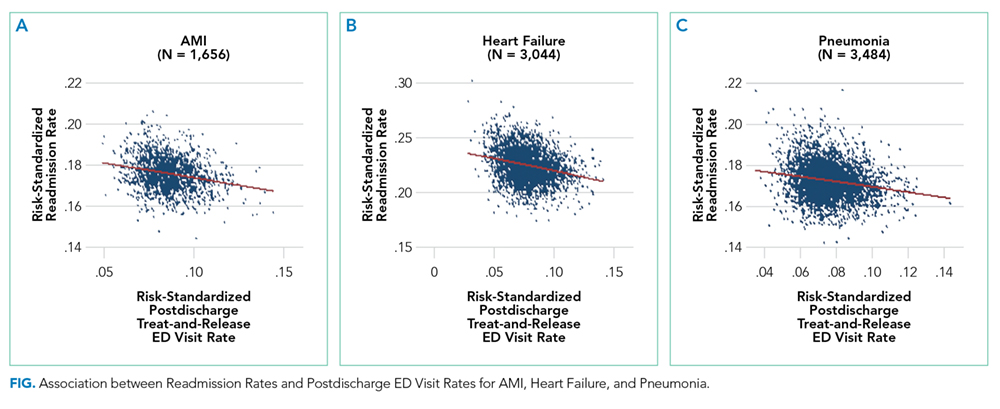
DISCUSSION
Across a national cohort of Medicare beneficiaries, we found frequent treat-and-discharge ED utilization following hospital discharge for AMI, heart failure, and pneumonia, suggesting that publicly reported readmission measures are capturing only a portion of postdischarge acute-care use. Our findings confirm prior work describing a 30-day postdischarge ED visit rate of 8% to 9% among Medicare beneficiaries for all hospitalizations in several states.3,6
We also described substantial hospital-level variation in risk-standardized ED postdischarge rates. Prior work by Vashi et al.3 demonstrated substantial variation in observed postdischarge ED visit rates and inpatient readmissions following hospital discharge between clinical conditions in a population-level study. Our work extends upon this by demonstrating hospital-level variation for 3 conditions of high volume and substantial policy importance after accounting for differences in hospital case mix. Interestingly, our work also found similar rates of postdischarge ED treat-and-discharge visitation as recent work by Sabbatini et al.23 analyzing an all-payer, adult population with any clinical condition. Taken together, these studies show the substantial volume of postdischarge acute-care utilization in the ED not captured by existing readmission measures.
We found several hospital characteristics of importance in describing variation in postdischarge ED visitation rates. Notably, hospitals located in rural areas and safety-net hospitals demonstrated higher postdischarge ED visitation rates. This may reflect a higher use of the ED as an acute, unscheduled care access point in rural communities without access to alternative acute diagnostic and treatment services.24 Similarly, safety-net hospitals may be more likely to provide unscheduled care for patients with poor access to primary care in the ED setting. Yet, consistent with prior work, our results also indicate that these differences do not result in different readmission rates.25 Regarding hospital teaching status, unlike prior work suggesting that teaching hospitals care for more safety-net Medicare beneficiaries,26 our work found opposite patterns of postdischarge ED visitation between hospital teaching and safety-net status following pneumonia hospitalization. This may reflect differences in the organization of acute care as patients with limited access to unscheduled primary and specialty care in safety-net communities utilize the ED, whereas patients in teaching-hospital communities may be able to access hospital-based clinics for care.
Contrary to the expectations of many clinicians and policymakers, we found an inverse relationship between postdischarge ED visit rates and readmission rates. While the cross-sectional design of our study cannot provide a causal explanation, these findings merit policy attention and future exploration of several hypotheses. One possible explanation for this finding is that hospitals with high postdischarge ED visit rates provide care in communities in which acute, unscheduled care is consolidated to the ED setting and thereby permits the ED to serve a gatekeeper function for scarce inpatient resources. This hypothesis may also be supported by recent interventions demonstrating that the use of ED care coordination and geriatric ED services at higher-volume EDs can reduce hospitalizations. Also, hospitals with greater ED capacity may have easier ED access and may be able to see patients earlier in their disease courses post discharge or more frequently in the ED for follow-up, therefore increasing ED visits but avoiding rehospitalization. Another possible explanation is that hospitals with lower postdischarge ED visit rates may also have a lower propensity to admit patients. Because our definition of postdischarge ED visitation did not include ED visits that result in hospitalization, hospitals with a lower propensity to admit from the ED may therefore appear to have higher ED visit rates. This explanation may be further supported by our finding that many postdischarge ED visits are for conditions that are associated with discretionary hospitalization in the ED.27 A third explanation for this finding may be that poor access to outpatient care outside the hospital setting results in higher postdischarge ED visit rates without increasing the acuity of these revisits or increasing readmission rates28; however, given the validated, risk-standardized approach to readmission measurement, this is unlikely. This is also unlikely given recent work by Sabbatini et al.23 demonstrating substantial acuity among patients who return to the ED following hospital discharge. Future work should seek to evaluate the relationship between the availability of ED care-coordination services and the specific ED, hospital, and community care-coordination activities undertaken in the ED following hospital discharge to reduce readmission rates.
This work should be interpreted within the confines of its design. First, it is possible that some of the variation detected in postdischarge ED visit rates is mediated by hospital-level variation in postdischarge observation visits that are not captured in this outcome. However, in previous work, we have demonstrated that almost one-third of hospitals have no postdischarge observation stays and that most postdischarge observation stays are for more than 24 hours, which is unlikely to reflect the intensity of care of postdischarge ED visits.27 Second, our analyses were limited to Medicare FFS beneficiaries, which may limit the generalizability of this work to other patient populations. However, this dataset did include a national cohort of Medicare beneficiaries that is identical to those included in publicly reported CMS readmission measures; therefore, these results have substantial policy relevance. Third, this work was limited to 3 conditions of high illness severity of policy focus, and future work applying similar analyses to less severe conditions may find different degrees of hospital-level variation in postdischarge outcomes that are amenable to quality improvement. Finally, we assessed the rate of treat-and-discharge ED visits only after hospital discharge; this understates the frequency of ED visits since repeat ED visits and ED visits resulting in rehospitalization are not included. However, our definition was designed to mirror the definition used to assess hospital readmissions for policy purposes and is a conservative approach.
In summary, ED visits following hospital discharge are common, as Medicare beneficiaries have 1 treat-and-discharge ED visit for every 2 readmissions within 30 days of hospital discharge. Postdischarge ED visits occur for a wide variety of conditions, with wide risk-standardized, hospital-level variation. Hospitals with the highest risk-standardized postdischarge ED visitation rates demonstrated lower RSRRs, suggesting that policymakers and researchers should further examine the role of the hospital-based ED in providing access to acute care and supporting care transitions for the vulnerable Medicare population.
Disclosure
Dr. Venkatesh received contract support from the CMS, an agency of the U.S. Department of Health & Human Services, and grant support from the Emergency Medicine Foundation’s Health Policy Research Scholar Award during the conduct of the study; and Dr. Wang, Mr. Wang, Ms. Altaf, Dr. Bernheim, and Dr. Horwitz received contract support from the CMS, an agency of the U.S. Department of Health & Human Services, during the conduct of the study.
1. Dorsey KB GJ, Desai N, Lindenauer P, et al. 2015 Condition-Specific Measures Updates and Specifications Report Hospital-Level 30-Day Risk-Standardized Readmission Measures: AMI-Version 8.0, HF-Version 8.0, Pneumonia-Version 8.0, COPD-Version 4.0, and Stroke-Version 4.0. 2015. https://www.qualitynet.org/dcs/BlobServer?blobkey=id&blobnocache=true&blobwhere=1228890435217&blobheader=multipart%2Foctet-stream&blobheadername1=Content-Disposition&blobheadervalue1=attachment%3Bfilename%3DRdmn_AMIHFPNCOPDSTK_Msr_UpdtRpt.pdf&blobcol=urldata&blobtable=MungoBlobs. Accessed on July 8, 2015.
2. Rising KL, White LF, Fernandez WG, Boutwell AE. Emergency department visits after hospital discharge: a missing part of the equation. Ann Emerg Med. 2013;62(2):145-150. PubMed
3. Vashi AA, Fox JP, Carr BG, et al. Use of hospital-based acute care among patients recently discharged from the hospital. JAMA. 2013;309(4):364-371. PubMed
4. Kocher KE, Nallamothu BK, Birkmeyer JD, Dimick JB. Emergency department visits after surgery are common for Medicare patients, suggesting opportunities to improve care. Health Aff (Millwood). 2013;32(9):1600-1607. PubMed
5. Krumholz HM. Post-hospital syndrome–an acquired, transient condition of generalized risk. N Engl J Med. 2013;368(2):100-102. PubMed
6. Baier RR, Gardner RL, Coleman EA, Jencks SF, Mor V, Gravenstein S. Shifting the dialogue from hospital readmissions to unplanned care. Am J Manag Care. 2013;19(6):450-453. PubMed
7. Schuur JD, Venkatesh AK. The growing role of emergency departments in hospital admissions. N Engl J Med. 2012;367(5):391-393. PubMed
8. Kocher KE, Dimick JB, Nallamothu BK. Changes in the source of unscheduled hospitalizations in the United States. Med Care. 2013;51(8):689-698. PubMed
9. Morganti KG, Bauhoff S, Blanchard JC, Abir M, Iyer N. The evolving role of emergency departments in the United States. Santa Monica, CA: Rand Corporation; 2013. PubMed
10. Katz EB, Carrier ER, Umscheid CA, Pines JM. Comparative effectiveness of care coordination interventions in the emergency department: a systematic review. Ann Emerg Med. 2012;60(1):12.e1-23.e1. PubMed
11. Jaquis WP, Kaplan JA, Carpenter C, et al. Transitions of Care Task Force Report. 2012. http://www.acep.org/workarea/DownloadAsset.aspx?id=91206. Accessed on January 2, 2016.
12. Horwitz LI, Wang C, Altaf FK, et al. Excess Days in Acute Care after Hospitalization for Heart Failure (Version 1.0) Final Measure Methodology Report. 2015. https://www.cms.gov/Medicare/Quality-Initiatives-Patient-Assessment-Instruments/HospitalQualityInits/Measure-Methodology.html. Accessed on January 2, 2016.
13. Horwitz LI, Wang C, Altaf FK, et al. Excess Days in Acute Care after Hospitalization for Acute Myocardial Infarction (Version 1.0) Final Measure Methodology Report. 2015. https://www.cms.gov/Medicare/Quality-Initiatives-Patient-Assessment-Instruments/HospitalQualityInits/Measure-Methodology.html. Accessed on January 2, 2016.
14. Hennessy S, Leonard CE, Freeman CP, et al. Validation of diagnostic codes for outpatient-originating sudden cardiac death and ventricular arrhythmia in Medicaid and Medicare claims data. Pharmacoepidemiol Drug Saf. 2010;19(6):555-562. PubMed
15. Krumholz H, Normand S, Keenan P, et al. Hospital 30-Day Acute Myocardial Infarction Readmission Measure Methodology. 2008. http://www.qualitynet.org/dcs/BlobServer?blobkey=id&blobnocache=true&blobwhere=1228873653724&blobheader=multipart%2Foctet-stream&blobheadername1=Content-Disposition&blobheadervalue1=attachment%3Bfilename%3DAMI_ReadmMeasMethod.pdf&blobcol=urldata&blobtable=MungoBlobs. Accessed on February 22, 2016.
16. Krumholz H, Normand S, Keenan P, et al. Hospital 30-Day Heart Failure Readmission Measure Methodology. 2008. http://69.28.93.62/wp-content/uploads/2017/01/2007-Baseline-info-on-Readmissions-krumholz.pdf. Accessed on February 22, 2016.
17. Krumholz H, Normand S, Keenan P, et al. Hospital 30-Day Pneumonia Readmission Measure Methodology. 2008. http://www.qualitynet.org/dcs/BlobServer?blobkey=id&blobnocache=true&blobwhere=1228873654295&blobheader=multipart%2Foctet-stream&blobheadername1=Content-Disposition&blobheadervalue1=attachment%3Bfilename%3DPneumo_ReadmMeasMethod.pdf&blobcol=urldata&blobtable=MungoBlobs. Accessed on February 22, 2016.
18. QualityNet. Claims-based measures: readmission measures. 2016. http://www.qualitynet.org/dcs/ContentServer?cid=1219069855273&pagename=QnetPublic%2FPage%2FQnetTier3. Accessed on December 14, 2017.
19. Agency for Healthcare Research and Quality. Clinical classifications software (CCS) for ICD-9-CM. Healthcare Cost and Utilization Project 2013; https://www.hcup-us.ahrq.gov/toolssoftware/ccs/ccs.jsp. Accessed December 14, 2017.
20. Von Elm E, Altman DG, Egger M, et al. The Strengthening the Reporting of Observational Studies in Epidemiology (STROBE) statement: guidelines for reporting observational studies. Prev Med. 2007;45(4):247-251. PubMed
21. Dharmarajan K, Hsieh AF, Lin Z, et al. Diagnoses and timing of 30-day readmissions after hospitalization for heart failure, acute myocardial infarction, or pneumonia. JAMA. 2013;309(4):355-363. PubMed
22. Venkatesh AK, Wang C, Ross JS, et al. Hospital Use of Observation Stays: Cross-Sectional Study of the Impact on Readmission Rates. Med Care. 2016;54(12):1070-1077. PubMed
23. Sabbatini AK, Kocher KE, Basu A, Hsia RY. In-hospital outcomes and costs among patients hospitalized during a return visit to the emergency department. JAMA. 2016;315(7):663-671. PubMed
24. Pitts SR, Carrier ER, Rich EC, Kellermann AL. Where Americans get acute care: increasingly, it’s not at their doctor’s office. Health Aff (Millwood). 2010;29(9):1620-1629. PubMed
25. Ross JS, Bernheim SM, Lin Z, et al. Based on key measures, care quality for Medicare enrollees at safety-net and non-safety-net hospitals was almost equal. Health Aff (Millwood). 2012;31(8):1739-1748. PubMed
26. Joynt KE, Orav EJ, Jha AK. Thirty-day readmission rates for Medicare beneficiaries by race and site of care. JAMA. 2011;305(7):675-681. PubMed
27. Venkatesh A, Wang C, Suter LG, et al. Hospital Use of Observation Stays: Cross-Sectional Study of the Impact on Readmission Rates. In: Academy Health Annual Research Meeting. San Diego, CA; 2014. PubMed
28. Pittsenbarger ZE, Thurm CW, Neuman MI, et al. Hospital-level factors associated with pediatric emergency department return visits. J Hosp Med. 2017;12(7):536-543. PubMed
Hospital readmissions for acute myocardial infarction (AMI), heart failure, and pneumonia have become central to quality-measurement efforts by the Centers for Medicare & Medicaid Services (CMS), which seek to improve hospital care transitions through public reporting and payment programs.1 Most current measures are limited to readmissions that require inpatient hospitalization and do not capture return visits to the emergency department (ED) that do not result in readmission but rather ED discharge. These visits may reflect important needs for acute, unscheduled care during the vulnerable posthospitalization period.2-5 While previous research has suggested that nearly 10% of patients may return to the ED following hospital discharge without readmission, the characteristics of these visits among Medicare beneficiaries and the implications for national care-coordination quality-measurement initiatives have not been explored.6,7
As the locus of acute outpatient care and the primary portal of hospital admissions and readmissions, ED visits following hospital discharge may convey meaningful information about posthospitalization care transitions.8,9 In addition, recent reviews and perspectives have highlighted the role of ED care-coordination services as interventions to reduce inpatient hospitalizations and improve care transitions,10,11 yet no empirical studies have evaluated the relationship between these unique care-coordination opportunities in the ED and care-coordination outcomes, such as hospital readmissions. As policymakers seek to develop accountability measures that capture the totality of acute, unscheduled visits following hospital discharge, describing the relationship between ED visits and readmissions will be essential to providers for benchmarking and to policymakers and payers seeking to reduce the total cost of care.12,13
Accordingly, we sought to characterize the frequency, diagnoses, and hospital-level variation in treat-and-discharge ED visitation following hospital discharge for 3 conditions for which hospital readmission is publicly reported by the CMS: AMI, heart failure, and pneumonia. We also sought to evaluate the relationship between hospital-level ED visitation following hospital discharge and publicly reported, risk-standardized readmission rates (RSRRs).
METHODS
Study Design
This study was a cross-sectional analysis of Medicare beneficiaries discharged alive following hospitalization for AMI, heart failure, and pneumonia between July 2011 and June 2012.
Selection of Participants
We used Medicare Standard Analytic Files to identify inpatient hospitalizations for each disease cohort based on principal discharge diagnoses. Each condition-specific cohort was constructed to be consistent with the CMS’s readmission measures using International Classification of Diseases, 9th Revision-Clinical Modification codes to identify AMI, heart failure, and pneumonia discharges.1 We included only patients who were enrolled in fee-for-service (FFS) Medicare parts A and B for 12 months prior to their index hospitalization to maximize the capture of diagnoses for risk adjustment. Each cohort included only patients who were discharged alive while maintaining FFS coverage for at least 30 days following hospital discharge to minimize bias in outcome ascertainment. We excluded patients who were discharged against medical advice. All contiguous admissions that were identified in a transfer chain were considered to be a single admission. Hospitals with fewer than 25 condition-specific index hospital admissions were excluded from this analysis for consistency with publicly reported measures.1
Measurements
Outcomes
We describe hospital-level, postdischarge ED visitation as the risk-standardized postdischarge ED visit rate. The general construct of this measure is consistent with those of prior studies that define postdischarge ED visitation as the proportion of index admissions followed by a treat-and-discharge ED visit without hospital readmission2,3; however, this outcome also incorporates a risk-standardization model with covariates that are identical to the risk-standardization approach that is used for readmission measurement.
We describe hospital-level readmission by calculating RSRRs consistent with CMS readmission measures, which are endorsed by the National Quality Forum and used for public reporting.15-17 Detailed technical documentation, including the SAS code used to replicate hospital-level measures of readmission, are available publicly through the CMS QualityNet portal.18
We calculated risk-standardized postdischarge ED visit rates and RSRRs as the ratio of the predicted number of postdischarge ED visits or readmissions for a hospital given its observed case mix to the expected number of postdischarge ED visits or readmissions based on the nation’s performance with that hospital’s case mix, respectively. This approach estimates a distinct risk-standardized postdischarge ED visit rate and RSRR for each hospital using hierarchical generalized linear models (HGLMs) and using a logit link with a first-level adjustment for age, sex, 29 clinical covariates for AMI, 35 clinical covariates for heart failure, and 38 clinical covariates for pneumonia. Each clinical covariate is identified based on inpatient and outpatient claims during the 12 months prior to the index hospitalization. The second level of the HGLM includes a random hospital-level intercept. This approach to measuring hospital readmissions accounts for the correlated nature of observed readmission rates within a hospital and reflects the assumption that after adjustment for patient characteristics and sampling variability, the remaining variation in postdischarge ED visit rates or readmission rates reflects hospital quality.
Analysis
In order to characterize treat-and-discharge postdischarge ED visits, we first described the clinical conditions that were evaluated during the first postdischarge ED visit. Based on the principal discharge diagnosis, ED visits were grouped into clinically meaningful categories using the Agency for Healthcare Research and Quality Clinical Classifications Software (CCS).19 We also report hospital-level variation in risk-standardized postdischarge ED visit rates for AMI, heart failure, and pneumonia.
Next, we examined the relationship between hospital characteristics and risk-standardized postdischarge ED visit rates. We linked hospital characteristics from the American Hospital Association (AHA) Annual Survey to the study dataset, including the following: safety-net status, teaching status, and urban or rural status. Consistent with prior work, hospital safety-net status was defined as a hospital Medicaid caseload greater than 1 standard deviation above the mean Medicaid caseload in the hospital’s state. Approximately 94% of the hospitals included in the 3 condition cohorts in the dataset had complete data in the 2011 AHA Annual Survey to be included in this analysis.
We evaluated the relationship between postdischarge ED visit rates and hospital readmission rates in 2 ways. First, we calculated Spearman rank correlation coefficients between hospital-level, risk-standardized postdischarge ED visit rates and RSRRs. Second, we calculated hospital-level variation in RSRRs based on the strata of risk-standardized postdischarge ED visit rates. Given the normal distribution of postdischarge ED visit rates, we grouped hospitals by quartile of postdischarge ED visit rates and 1 group for hospitals with no postdischarge ED visits.
Based on preliminary analyses indicating a relationship between hospital size, measured by condition-specific index hospitalization volume, and postdischarge treat-and-discharge ED visit rates, all descriptive statistics and correlations reported are weighted by the volume of condition-specific index hospitalizations. The study was approved by the Yale University Human Research Protection Program. All analyses were conducted using SAS 9.1 (SAS Institute Inc, Cary, NC). The analytic plan and results reported in this work are in compliance with the Strengthening the Reporting of Observational Studies in Epidemiology checklist.20
RESULTS
During the 1-year study period, we included a total of 157,035 patients who were hospitalized at 1656 hospitals for AMI, 391,209 at 3044 hospitals for heart failure, and 342,376 at 3484 hospitals for pneumonia. Details of study cohort creation are available in supplementary Table 1. After hospitalization for AMI, 14,714 patients experienced a postdischarge ED visit (8.4%) and 27,214 an inpatient readmissions (17.3%) within 30 days of discharge; 31,621 (7.6%) and 88,106 (22.5%) patients after hospitalization for heart failure and 26,681 (7.4%) and 59,352 (17.3%) patients after hospitalization for pneumonia experienced a postdischarge ED visit and an inpatient readmission within 30 days of discharge, respectively.
Postdischarge ED visits were for a wide variety of conditions, with the top 10 CCS categories comprising 44% of postdischarge ED visits following AMI hospitalizations, 44% of following heart failure hospitalizations, and 41% following pneumonia hospitalizations (supplementary Table 2). The first postdischarge ED visit was rarely for the same condition as the index hospitalization in the AMI cohort (224 visits; 1.5%) as well as the pneumonia cohort (1401 visits; 5.3%). Among patients who were originally admitted for heart failure, 10.6% of the first postdischarge ED visits were also for congestive heart failure.
We found wide hospital-level variation in postdischarge ED visit rates for each condition: AMI (median: 8.3%; 5th and 95th percentile: 2.8%-14.3%), heart failure (median: 7.3%; 5th and 95th percentile: 3.0%-13.3%), and pneumonia (median: 7.1%; 5th and 95th percentile: 2.4%-13.2%; supplementary Table 3). The variation persisted after accounting for hospital case mix, as evidenced in the supplementary Figure, which describes hospital variation in risk-standardized postdischarge ED visit rates. This variation was statistically significant (P < .001), as demonstrated by the isolated relationship between the random effect and the outcome (AMI: random effect estimate 0.0849 [95% confidence interval (CI), 0.0832 to 0.0866]; heart failure: random effect estimate 0.0796 [95% CI, 0.0784 to 0.0809]; pneumonia: random effect estimate 0.0753 [95% CI, 0.0741 to 0.0764]).
Across all 3 conditions, hospitals located in rural areas had significantly higher risk-standardized postdischarge ED visit rates than hospitals located in urban areas (10.1% vs 8.6% for AMI, 8.4% vs 7.5% for heart failure, and 8.0% vs 7.4% for pneumonia). In comparison to teaching hospitals, nonteaching hospitals had significantly higher risk-standardized postdischarge ED visit rates following hospital discharge for pneumonia (7.6% vs 7.1%). Safety-net hospitals also had higher risk-standardized postdischarge ED visitation rates following discharge for heart failure (8.4% vs 7.7%) and pneumonia (7.7% vs 7.3%). Risk-standardized postdischarge ED visit rates were higher in publicly owned hospitals than in nonprofit or privately owned hospitals for heart failure (8.0% vs 7.5% in nonprofit hospitals or 7.5% in private hospitals) and pneumonia (7.7% vs 7.4% in nonprofit hospitals and 7.3% in private hospitals; Table).
Among hospitals with RSRRs that were publicly reported by CMS, we found a moderate inverse correlation between risk-standardized postdischarge ED visit rates and hospital RSRRs for each condition: AMI (r = −0.23; 95% CI, −0.29 to −0.19), heart failure (r = −0.29; 95% CI, −0.34 to −0.27), and pneumonia (r = −0.18; 95% CI, −0.22 to −0.15; Figure).
DISCUSSION
Across a national cohort of Medicare beneficiaries, we found frequent treat-and-discharge ED utilization following hospital discharge for AMI, heart failure, and pneumonia, suggesting that publicly reported readmission measures are capturing only a portion of postdischarge acute-care use. Our findings confirm prior work describing a 30-day postdischarge ED visit rate of 8% to 9% among Medicare beneficiaries for all hospitalizations in several states.3,6
We also described substantial hospital-level variation in risk-standardized ED postdischarge rates. Prior work by Vashi et al.3 demonstrated substantial variation in observed postdischarge ED visit rates and inpatient readmissions following hospital discharge between clinical conditions in a population-level study. Our work extends upon this by demonstrating hospital-level variation for 3 conditions of high volume and substantial policy importance after accounting for differences in hospital case mix. Interestingly, our work also found similar rates of postdischarge ED treat-and-discharge visitation as recent work by Sabbatini et al.23 analyzing an all-payer, adult population with any clinical condition. Taken together, these studies show the substantial volume of postdischarge acute-care utilization in the ED not captured by existing readmission measures.
We found several hospital characteristics of importance in describing variation in postdischarge ED visitation rates. Notably, hospitals located in rural areas and safety-net hospitals demonstrated higher postdischarge ED visitation rates. This may reflect a higher use of the ED as an acute, unscheduled care access point in rural communities without access to alternative acute diagnostic and treatment services.24 Similarly, safety-net hospitals may be more likely to provide unscheduled care for patients with poor access to primary care in the ED setting. Yet, consistent with prior work, our results also indicate that these differences do not result in different readmission rates.25 Regarding hospital teaching status, unlike prior work suggesting that teaching hospitals care for more safety-net Medicare beneficiaries,26 our work found opposite patterns of postdischarge ED visitation between hospital teaching and safety-net status following pneumonia hospitalization. This may reflect differences in the organization of acute care as patients with limited access to unscheduled primary and specialty care in safety-net communities utilize the ED, whereas patients in teaching-hospital communities may be able to access hospital-based clinics for care.
Contrary to the expectations of many clinicians and policymakers, we found an inverse relationship between postdischarge ED visit rates and readmission rates. While the cross-sectional design of our study cannot provide a causal explanation, these findings merit policy attention and future exploration of several hypotheses. One possible explanation for this finding is that hospitals with high postdischarge ED visit rates provide care in communities in which acute, unscheduled care is consolidated to the ED setting and thereby permits the ED to serve a gatekeeper function for scarce inpatient resources. This hypothesis may also be supported by recent interventions demonstrating that the use of ED care coordination and geriatric ED services at higher-volume EDs can reduce hospitalizations. Also, hospitals with greater ED capacity may have easier ED access and may be able to see patients earlier in their disease courses post discharge or more frequently in the ED for follow-up, therefore increasing ED visits but avoiding rehospitalization. Another possible explanation is that hospitals with lower postdischarge ED visit rates may also have a lower propensity to admit patients. Because our definition of postdischarge ED visitation did not include ED visits that result in hospitalization, hospitals with a lower propensity to admit from the ED may therefore appear to have higher ED visit rates. This explanation may be further supported by our finding that many postdischarge ED visits are for conditions that are associated with discretionary hospitalization in the ED.27 A third explanation for this finding may be that poor access to outpatient care outside the hospital setting results in higher postdischarge ED visit rates without increasing the acuity of these revisits or increasing readmission rates28; however, given the validated, risk-standardized approach to readmission measurement, this is unlikely. This is also unlikely given recent work by Sabbatini et al.23 demonstrating substantial acuity among patients who return to the ED following hospital discharge. Future work should seek to evaluate the relationship between the availability of ED care-coordination services and the specific ED, hospital, and community care-coordination activities undertaken in the ED following hospital discharge to reduce readmission rates.
This work should be interpreted within the confines of its design. First, it is possible that some of the variation detected in postdischarge ED visit rates is mediated by hospital-level variation in postdischarge observation visits that are not captured in this outcome. However, in previous work, we have demonstrated that almost one-third of hospitals have no postdischarge observation stays and that most postdischarge observation stays are for more than 24 hours, which is unlikely to reflect the intensity of care of postdischarge ED visits.27 Second, our analyses were limited to Medicare FFS beneficiaries, which may limit the generalizability of this work to other patient populations. However, this dataset did include a national cohort of Medicare beneficiaries that is identical to those included in publicly reported CMS readmission measures; therefore, these results have substantial policy relevance. Third, this work was limited to 3 conditions of high illness severity of policy focus, and future work applying similar analyses to less severe conditions may find different degrees of hospital-level variation in postdischarge outcomes that are amenable to quality improvement. Finally, we assessed the rate of treat-and-discharge ED visits only after hospital discharge; this understates the frequency of ED visits since repeat ED visits and ED visits resulting in rehospitalization are not included. However, our definition was designed to mirror the definition used to assess hospital readmissions for policy purposes and is a conservative approach.
In summary, ED visits following hospital discharge are common, as Medicare beneficiaries have 1 treat-and-discharge ED visit for every 2 readmissions within 30 days of hospital discharge. Postdischarge ED visits occur for a wide variety of conditions, with wide risk-standardized, hospital-level variation. Hospitals with the highest risk-standardized postdischarge ED visitation rates demonstrated lower RSRRs, suggesting that policymakers and researchers should further examine the role of the hospital-based ED in providing access to acute care and supporting care transitions for the vulnerable Medicare population.
Disclosure
Dr. Venkatesh received contract support from the CMS, an agency of the U.S. Department of Health & Human Services, and grant support from the Emergency Medicine Foundation’s Health Policy Research Scholar Award during the conduct of the study; and Dr. Wang, Mr. Wang, Ms. Altaf, Dr. Bernheim, and Dr. Horwitz received contract support from the CMS, an agency of the U.S. Department of Health & Human Services, during the conduct of the study.
1. Dorsey KB GJ, Desai N, Lindenauer P, et al. 2015 Condition-Specific Measures Updates and Specifications Report Hospital-Level 30-Day Risk-Standardized Readmission Measures: AMI-Version 8.0, HF-Version 8.0, Pneumonia-Version 8.0, COPD-Version 4.0, and Stroke-Version 4.0. 2015. https://www.qualitynet.org/dcs/BlobServer?blobkey=id&blobnocache=true&blobwhere=1228890435217&blobheader=multipart%2Foctet-stream&blobheadername1=Content-Disposition&blobheadervalue1=attachment%3Bfilename%3DRdmn_AMIHFPNCOPDSTK_Msr_UpdtRpt.pdf&blobcol=urldata&blobtable=MungoBlobs. Accessed on July 8, 2015.
2. Rising KL, White LF, Fernandez WG, Boutwell AE. Emergency department visits after hospital discharge: a missing part of the equation. Ann Emerg Med. 2013;62(2):145-150. PubMed
3. Vashi AA, Fox JP, Carr BG, et al. Use of hospital-based acute care among patients recently discharged from the hospital. JAMA. 2013;309(4):364-371. PubMed
4. Kocher KE, Nallamothu BK, Birkmeyer JD, Dimick JB. Emergency department visits after surgery are common for Medicare patients, suggesting opportunities to improve care. Health Aff (Millwood). 2013;32(9):1600-1607. PubMed
5. Krumholz HM. Post-hospital syndrome–an acquired, transient condition of generalized risk. N Engl J Med. 2013;368(2):100-102. PubMed
6. Baier RR, Gardner RL, Coleman EA, Jencks SF, Mor V, Gravenstein S. Shifting the dialogue from hospital readmissions to unplanned care. Am J Manag Care. 2013;19(6):450-453. PubMed
7. Schuur JD, Venkatesh AK. The growing role of emergency departments in hospital admissions. N Engl J Med. 2012;367(5):391-393. PubMed
8. Kocher KE, Dimick JB, Nallamothu BK. Changes in the source of unscheduled hospitalizations in the United States. Med Care. 2013;51(8):689-698. PubMed
9. Morganti KG, Bauhoff S, Blanchard JC, Abir M, Iyer N. The evolving role of emergency departments in the United States. Santa Monica, CA: Rand Corporation; 2013. PubMed
10. Katz EB, Carrier ER, Umscheid CA, Pines JM. Comparative effectiveness of care coordination interventions in the emergency department: a systematic review. Ann Emerg Med. 2012;60(1):12.e1-23.e1. PubMed
11. Jaquis WP, Kaplan JA, Carpenter C, et al. Transitions of Care Task Force Report. 2012. http://www.acep.org/workarea/DownloadAsset.aspx?id=91206. Accessed on January 2, 2016.
12. Horwitz LI, Wang C, Altaf FK, et al. Excess Days in Acute Care after Hospitalization for Heart Failure (Version 1.0) Final Measure Methodology Report. 2015. https://www.cms.gov/Medicare/Quality-Initiatives-Patient-Assessment-Instruments/HospitalQualityInits/Measure-Methodology.html. Accessed on January 2, 2016.
13. Horwitz LI, Wang C, Altaf FK, et al. Excess Days in Acute Care after Hospitalization for Acute Myocardial Infarction (Version 1.0) Final Measure Methodology Report. 2015. https://www.cms.gov/Medicare/Quality-Initiatives-Patient-Assessment-Instruments/HospitalQualityInits/Measure-Methodology.html. Accessed on January 2, 2016.
14. Hennessy S, Leonard CE, Freeman CP, et al. Validation of diagnostic codes for outpatient-originating sudden cardiac death and ventricular arrhythmia in Medicaid and Medicare claims data. Pharmacoepidemiol Drug Saf. 2010;19(6):555-562. PubMed
15. Krumholz H, Normand S, Keenan P, et al. Hospital 30-Day Acute Myocardial Infarction Readmission Measure Methodology. 2008. http://www.qualitynet.org/dcs/BlobServer?blobkey=id&blobnocache=true&blobwhere=1228873653724&blobheader=multipart%2Foctet-stream&blobheadername1=Content-Disposition&blobheadervalue1=attachment%3Bfilename%3DAMI_ReadmMeasMethod.pdf&blobcol=urldata&blobtable=MungoBlobs. Accessed on February 22, 2016.
16. Krumholz H, Normand S, Keenan P, et al. Hospital 30-Day Heart Failure Readmission Measure Methodology. 2008. http://69.28.93.62/wp-content/uploads/2017/01/2007-Baseline-info-on-Readmissions-krumholz.pdf. Accessed on February 22, 2016.
17. Krumholz H, Normand S, Keenan P, et al. Hospital 30-Day Pneumonia Readmission Measure Methodology. 2008. http://www.qualitynet.org/dcs/BlobServer?blobkey=id&blobnocache=true&blobwhere=1228873654295&blobheader=multipart%2Foctet-stream&blobheadername1=Content-Disposition&blobheadervalue1=attachment%3Bfilename%3DPneumo_ReadmMeasMethod.pdf&blobcol=urldata&blobtable=MungoBlobs. Accessed on February 22, 2016.
18. QualityNet. Claims-based measures: readmission measures. 2016. http://www.qualitynet.org/dcs/ContentServer?cid=1219069855273&pagename=QnetPublic%2FPage%2FQnetTier3. Accessed on December 14, 2017.
19. Agency for Healthcare Research and Quality. Clinical classifications software (CCS) for ICD-9-CM. Healthcare Cost and Utilization Project 2013; https://www.hcup-us.ahrq.gov/toolssoftware/ccs/ccs.jsp. Accessed December 14, 2017.
20. Von Elm E, Altman DG, Egger M, et al. The Strengthening the Reporting of Observational Studies in Epidemiology (STROBE) statement: guidelines for reporting observational studies. Prev Med. 2007;45(4):247-251. PubMed
21. Dharmarajan K, Hsieh AF, Lin Z, et al. Diagnoses and timing of 30-day readmissions after hospitalization for heart failure, acute myocardial infarction, or pneumonia. JAMA. 2013;309(4):355-363. PubMed
22. Venkatesh AK, Wang C, Ross JS, et al. Hospital Use of Observation Stays: Cross-Sectional Study of the Impact on Readmission Rates. Med Care. 2016;54(12):1070-1077. PubMed
23. Sabbatini AK, Kocher KE, Basu A, Hsia RY. In-hospital outcomes and costs among patients hospitalized during a return visit to the emergency department. JAMA. 2016;315(7):663-671. PubMed
24. Pitts SR, Carrier ER, Rich EC, Kellermann AL. Where Americans get acute care: increasingly, it’s not at their doctor’s office. Health Aff (Millwood). 2010;29(9):1620-1629. PubMed
25. Ross JS, Bernheim SM, Lin Z, et al. Based on key measures, care quality for Medicare enrollees at safety-net and non-safety-net hospitals was almost equal. Health Aff (Millwood). 2012;31(8):1739-1748. PubMed
26. Joynt KE, Orav EJ, Jha AK. Thirty-day readmission rates for Medicare beneficiaries by race and site of care. JAMA. 2011;305(7):675-681. PubMed
27. Venkatesh A, Wang C, Suter LG, et al. Hospital Use of Observation Stays: Cross-Sectional Study of the Impact on Readmission Rates. In: Academy Health Annual Research Meeting. San Diego, CA; 2014. PubMed
28. Pittsenbarger ZE, Thurm CW, Neuman MI, et al. Hospital-level factors associated with pediatric emergency department return visits. J Hosp Med. 2017;12(7):536-543. PubMed
© 2018 Society of Hospital Medicine
The Burden of Guardianship: A Matched Cohort Study
A central tenet of modern medicine is that patients must provide fully informed consent to receive or refuse medical care offered by their clinical teams.1–4 If a patient is unable to make and communicate a choice or clearly indicate an understanding of the information presented, then he or she is considered to lack the capacity to make medical decisions and the medical team must seek consent from the patient’s surrogate decision-maker.2-7 Every U.S. state recognizes a patient’s healthcare proxy (HCP) and a court-appointed guardian as a legally recognized surrogate.8,9 Most of the states also have statutes or regulations establishing a hierarchy of legally recognized surrogate decision-makers in the absence of a HCP or a court-appointed guardian, such as spouses, adult children, parents, siblings, and grandparents.8,10 In states that do not have such a statute, hospitals develop their own institutional policies for surrogate decision-making.
However, there are important limitations on the authority of these surrogate decision-makers.10 For instance, patients may not have a family member or a friend to serve as a surrogate decision-maker, often family members cannot override a patient’s objection, even when that patient lacks decision-making capacity, and certain decisions require a guardian or a HCP.8-10 In these circumstances, the hospital must petition a court to appoint a guardian as a legally recognized surrogate decision-maker. This can be an involved family member, if one exists, or an independent, typically volunteer, guardian.11 The process of guardian appointment is complex7,11 and can range from a few days to more than a month, largely dependent on court dates and finding a volunteer guardian. Much of the process occurs during the patient’s hospital stay. This prolongation of hospitalization would be expected to increase health care costs and iatrogenic complications,12–14 but data quantifying these for patients requiring guardianship are lacking. The goal of this study was to describe the characteristics of patients who undergo the process of guardianship and measure the associated burdens. These burdens include the financial costs to the medical system, the prolonged length of stay beyond medical necessity, and the costs to the patient in the form of hospital-acquired complications. Investigating the burden of guardianship is an important first step in uncovering opportunities to improve the process. We hypothesized that patients requiring guardianship would have lengths of stay and healthcare costs that were at least as large as those for patients whose conditions required similar durations of hospitalization prior to medical clearance, in part due to iatrogenic complications that would accrue while awaiting guardian appointment.
METHODS
Setting
We conducted a retrospective matched cohort study of adult inpatients at Beth Israel Deaconess Medical Center (BIDMC), a 651-bed academic, tertiary care facility in Boston, MA. The study was approved by the BIDMC Institutional Review Board as a nonhuman subject research consistent with hospital operations.
Population
For this matched cohort study, we identified case patients as those hospitalized for any reason for whom guardianship proceedings were initiated and obtained; only the first hospitalization during which the guardianship was pursued was used. Cases were identified by obtaining the data of all patients for whom the BIDMC general counsel completed the process of guardianship between October 2014 and September 2015. At BIDMC, all the guardianship proceedings are referred to the general counsel.
To determine the postclearance experience for referred patients compared with that for other patients with similar lengths of stay up to those of the referred patients’ point of clearance, we identified up to three matched controls for each case (Supplemental Figure 1). Medical clearance was defined as the date when the patient was medically stable to be discharged from the hospital, and it was determined in an iterative manner. We identified controls as hospitalized patients admitted for any cause and matched to the cases requiring guardianship on discharging service and length of stay prior to clearance. Specifically, we identified patients on the same service as the case whose length of stay was at least as long as the length of stay of the case patient until medical clearance, as defined below. We then determined the total and the excess length of stay, defined as the duration beyond clearance for each case referred for guardianship; for controls, the ‘excess’ length of stay was the number of hospitalized days beyond the corresponding time that a matched case had been provided clearance. To account for seasonal influences and the training level of house officers, we selected the three controls whose discharge date was closest (before or after) to the discharge date of their matched case.
From legal team files, we identified 61 patients hospitalized at BIDMC for whom new guardianship was pursued to completion. Of these 61 patients, 10 could not be matched to an appropriate control and were included in descriptive analyses but not in comparisons with controls.
Covariates and Outcomes
We collected the details regarding age, gender, primary language, highest level of education, marital status, insurance status, race, date of admission, date of discharge, discharge disposition, principal diagnosis, case mix index (CMI), and discharging service from our administrative and billing data. Outcomes of interest included length of stay and total hospital charges that were collected from the same databases. We used hospital charges, rather than payments, to ensure uniformity across payers.
Chart Review
Unique to cases, a team of two medical residents (JP, RP) and a hospitalist (DR) determined the date of medical clearance and hospital-associated complications by a chart review. The date of medical clearance was then used to calculate excess length of stay, ie, the duration of stay beyond the date of medical clearance, by subtracting the time to medical clearance from the total inpatient length of stay.
We developed a novel algorithm to determine the date of medical clearance consistently (Figure 1). We first determined whether the discharge summary indicated a clear date of medical readiness for discharge. If the discharge summary was unclear, then a case management or a social work note was used. The date of medical clearance determined by the case management or the social work note was then confirmed with clinical data. The date was confirmed if there were no significant laboratory orders and major medication changes or procedures for 24 h from the date identified. If notes were also inconclusive, then the medical clearance was determined by a review of provider order entry. Medical readiness for discharge was then defined as the first day when there were no laboratory orders for 48 h and no significant medication changes, imaging studies, or microbiologic orders.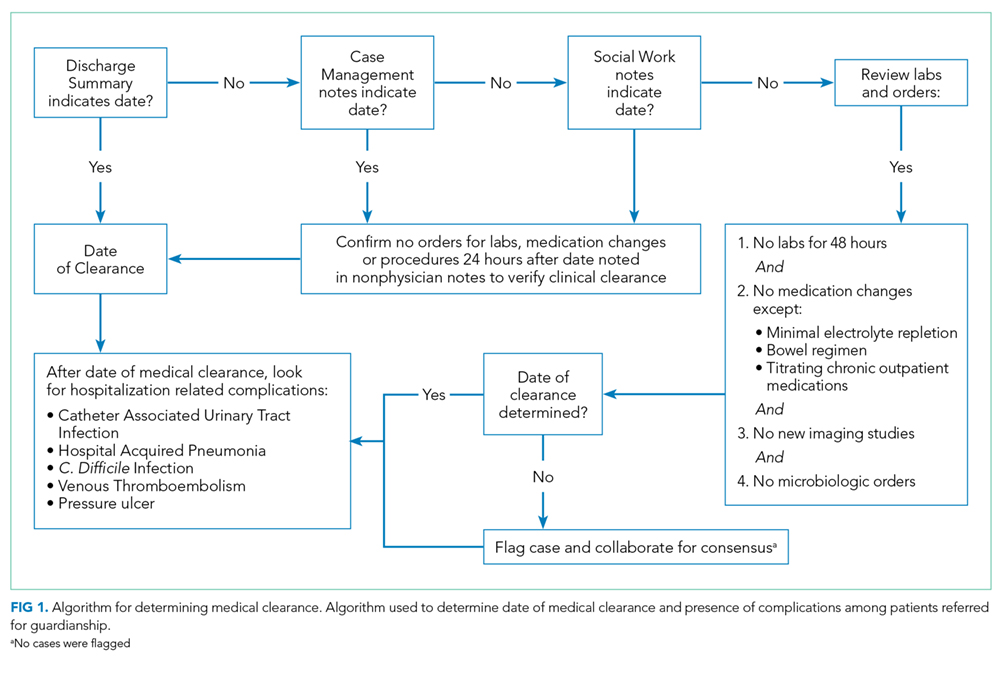
Hospital-acquired complications were determined to be related to the guardianship process if they occurred after the date of medical stability but prior to discharge. We did not investigate hospital-acquired complications among controls. Hospital-acquired complications were defined as follows:
- Catheter-associated urinary tract infection (CAUTI): active Foley catheter order and positive urine culture that resulted in antibiotic administration.
- Hospital-acquired pneumonia (HAP): chest X-ray or computed tomography (CT) scan showing a consolidation that resulted in antibiotic administration.
- Venous thromboembolism (VTE): positive venous ultrasound or CT angiography of the chest for deep venous thrombosis (DVT) or pulmonary embolism (PE).
- Decubitus ulcer: new wound care consultation for sacral decubitus ulceration.
- Clostridium difficile (C. diff) infection: positive stool polymerase chain reaction that resulted in antibiotic administration.
The algorithm for identifying the date of clearance and the presence of complications was piloted independently by three investigators (RP, JP, DR) using a single chart review and was redesigned until a consensus was obtained. The same three investigators then independently reviewed three additional charts, including all notes, laboratory results, imaging results, and orders, with complete agreement for both date of clearance and presence of complications. Two investigators (RP, JP) then individually reviewed the remaining 57 charts. Of these, 10 were selected a priori for review by both investigators for interrater reliability, with a mean difference of 0.5 days in the estimated time to clearance and complete concordance in complications. In addition, a third investigator (DR) independently reread 5 of the 57 reviewed charts, with complete concordance in both time to clearance and presence of complications with the original readings.
Statistical Analysis
SAS 9.3 was used for all analyses (SAS Institute Inc., Cary, NC, USA).
We first examined the demographic and clinical characteristics of all 61 patients who underwent guardianship proceedings. Second, we described the primary outcomes of interest–length of stay, costs, and likelihood of complications–in this series of patients with associated 95% confidence intervals.
Third, we examined the associations between guardianship and length of stay and healthcare costs using generalized estimating equations with clustering by matched set and compound symmetry. For length of stay, we specifically assessed excess length of stay (the matching variable) to avoid immortal time bias; we also examined the total length of stay. For all regression analyses, we adjusted for the following covariates: age, gender, education, marital status, race/ethnicity, CMI, insurance status, discharging service, and principal diagnosis. To maximize normality of residuals, costs were log-transformed; length of stay beyond clearance was log-transformed after addition of 1. For both outcomes, we back-transformed the regression coefficients and presented percent change between case and control patients. All reported tests are two-sided.
RESULTS
A total of 61 guardianship cases and 118 controls were included in the analysis.
General Characteristics
The characteristics of all cases prior to matching are included in Table 1. The department of internal medicine discharged the largest proportion of cases, followed by neurosurgery and neurology departments. More than 65% of cases were insured by Medicare or Medicaid. Three-quarters of cases were discharged from the hospital to another medical facility, with about half discharged to a skilled nursing facility (SNF) or a rehabilitation center and one-quarter to a long-term acute care hospital (LTACH).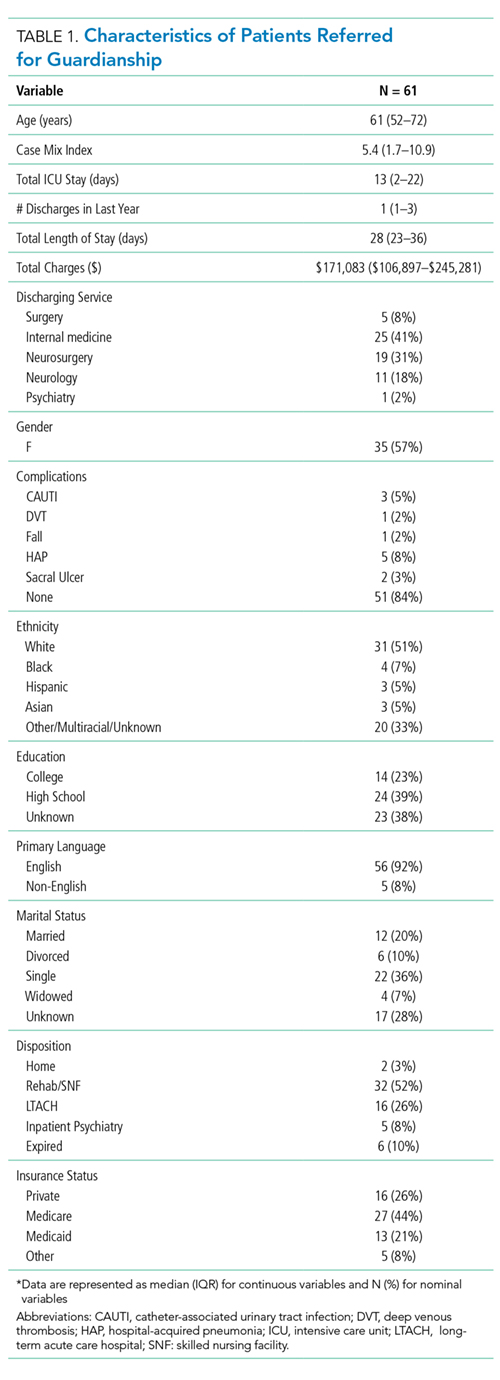
The median length of stay for patients requiring guardianship was 28 (range, 23-36) days, and the median total charges were $171,083 ($106,897-$245,281), with a total cost approximating $10.9 million for these patients. Regarding hospital-acquired complications, 10 (16%; 95% confidence interval, 8%–28%) unique cases suffered from a complication, with HAP being the most frequently (n = 5) occurring complication.
Comparison with Matched Controls
No statistically significant differences were observed between cases and controls in terms of age, primary language, highest level of education, ethnicity, insurance status, or discharging service as shown in Table 2; discharging service was a matched variable and comparable by design. However, cases tended to be less likely to be married and had a higher CMI.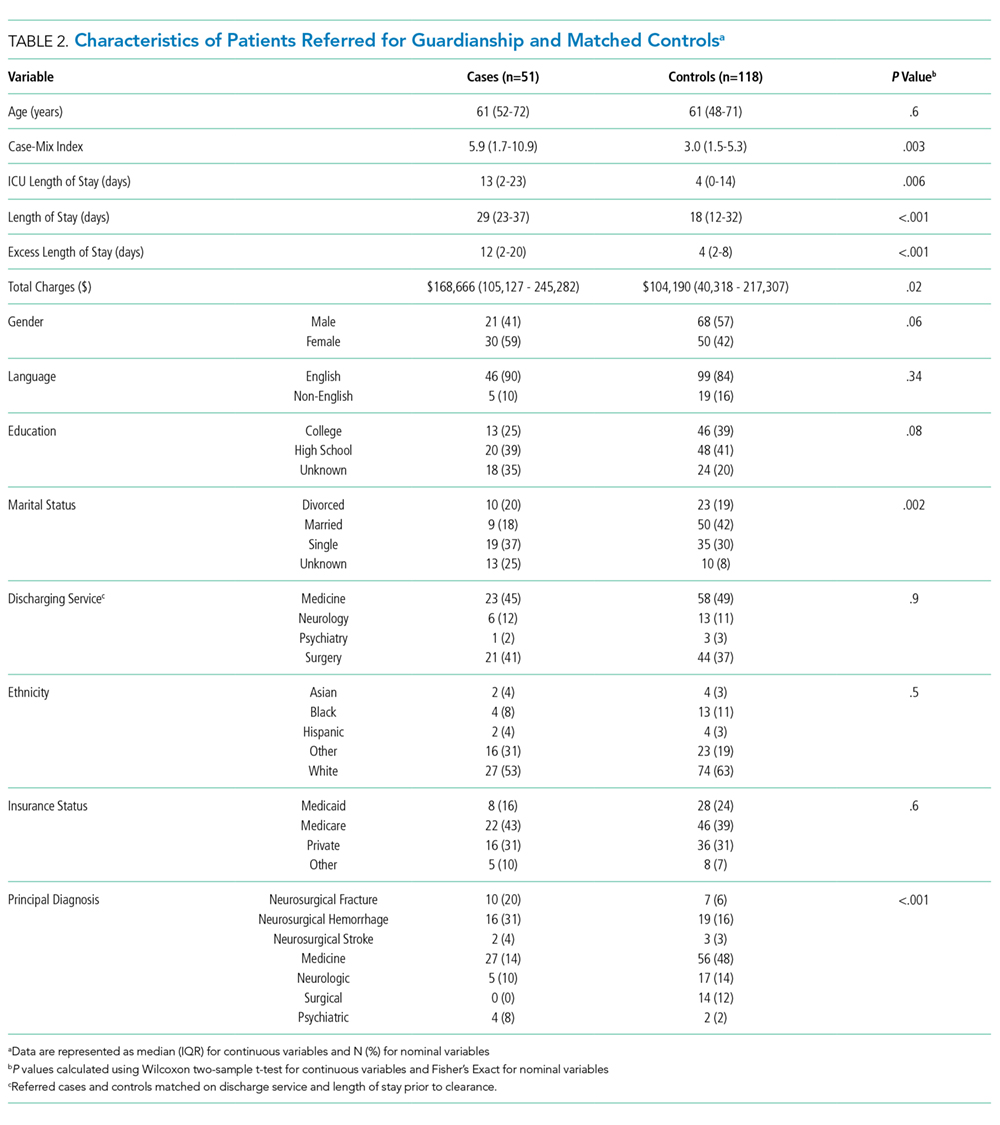
When compared with control patients in terms of similar services who stayed for at least as long as their duration to clearance, the cases had significantly longer lengths of stay compared to those of controls (29 total days compared to 18 days, P < .001; Figure 2). In addition, cases incurred significantly higher median total charges ($168,666) compared to those of controls ($104,190; P = .02).
After accounting for potential confounders, including age, gender, language, education, marital status, discharging service, ethnicity, insurance status, CMI, and principal diagnosis, guardianship was associated with 58% higher excess length of stay (P = .04, 95% CI [2%-145%]). Furthermore, guardianship was associated with 23% higher total charges (P = .02, 95% CI [4%-46%]) and 37% longer total length of stay (P = .002, 95% CI [12%-67%]).
DISCUSSION
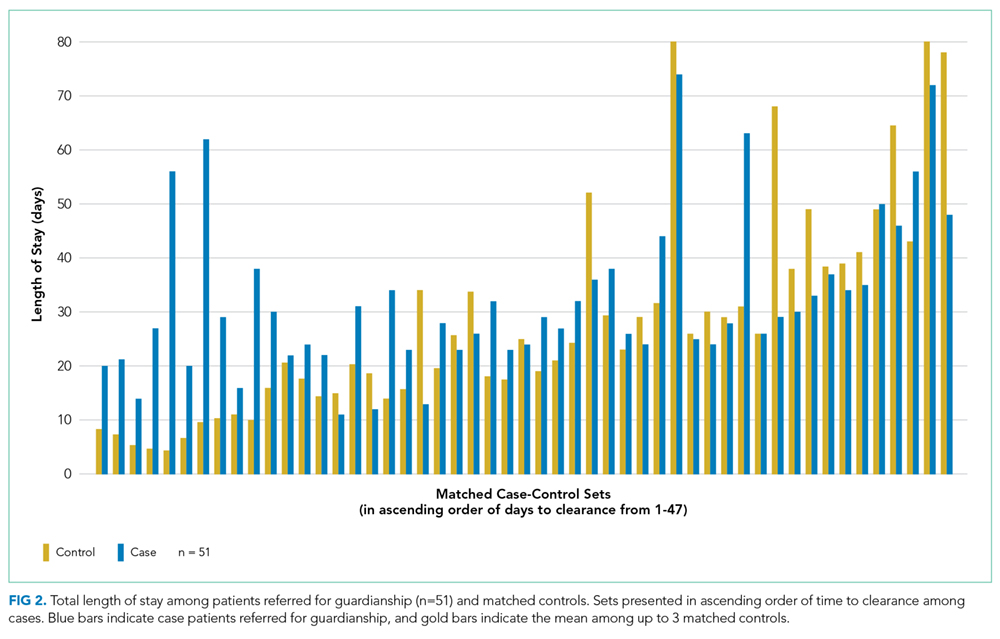
To our knowledge, this is among the first studies to investigate healthcare costs and harm to the patient in the form of hospital-associated complications as a result of guardianship proceedings. Other studies15,16 have also demonstrated excessive length of stay attributed to nonclinical factors such as guardianship, though they did not quantify the excess stay or compare guardianship cases with a matched control. One study17 demonstrated total charges of $150,000 per patient requiring guardianship, which are similar to our results. However, Chen et al. also observed an average of 27.8 medically unnecessary days, which are 16 more days than those in our study sample. This may reflect the difference in how excess days were determined, namely, statistical process control analysis in the previous study compared with a manual chart review in our study. To our knowledge, no other study has compared guardianship cases with matched controls to compare their experiences to patients with similarly prolonged stays prior to clearance.
After matching by service and the length of stay until medical clearance in each guardianship case, the subsequent length of stay was higher among cases than among controls, even after adjustment for differences in CMI and diagnosis. This suggests that the process of obtaining guardianship results in a particularly prolonged length of stay, which is presumably attributable to factors other than medical complexity or ongoing illness.
It is probable that at least two interrelated mechanisms are responsible for the particularly high costs and the long stay of patients who require guardianship. First, the process of obtaining guardianship is itself protracted in several cases, necessitating long-term admissions well beyond the point of medical stability. Second, our results suggest that longer hospital stays are apt to grow further in a feed-forward cycle due to hospital-acquired complications that develop after the date of medical clearance. Indeed, in our series, 16% of patients sustained a complication that is readily attributable to hospital care after their date of clearance, and these types of complications are likely to lengthen the stay even further.
We compared cases referred for guardianship to control patients on the same services, at similar time points, whose length of stay was at least as long as the point of medical clearance as their corresponding case patient. Because cases were hospitalized with active medical needs to at least the point of clearance, we anticipated that costs might well be lower among cases, who had no medical necessity for hospitalization at the point of clearance, compared with controls who remained hospitalized presumably for active medical needs. Counter to this hypothesis, and accounting for potentially confounding variables, undergoing a guardianship proceeding was associated with nearly 25% higher costs of patient care. This may ultimately represent a substantial burden on the healthcare system. For example, in just 1 year in our hospital, the total hospital charges reached almost $11 million for the 61 patients who underwent guardianship proceedings. Considering that 65% of the patients requiring guardianship had Medicaid or Medicare coverage, there are significant financial implications for the hospital systems and to the public.
Limitations of our study relate to its retrospective nature at a single center. Investigating guardianship cases at a single center and with a small sample size of 61 patients limits generalizability. Nevertheless, we still had enough power to detect significant differences compared with matched controls, and this study remains the largest investigation into the cost associated with guardianship to date and the only study comparing guardianship cases with matched controls. Furthermore, we did not complete chart reviews of controls, which limits direct comparisons of complications and precluded our matching on variables that required detailed review.
The retrospective design may include confounders unaccounted for in our statistical design, though we attempted to match cases with controls to account for some of these potential differences and included a broad set of covariates that included measures of comorbidity and diagnosis. To this point, we included only CMI and principal diagnosis as the measures of severity, and adjustment for CMI, which includes features of the index hospitalization itself, may represent overadjustment. However, this type of overadjustment would tend to bias toward the null hypothesis.
Investigators only completed chart reviews for cases, which limits our ability to contrast the rate of hospital-associated complications for cases with that of controls. However, the rates of CAUTI and HAP complications among our cases were notably higher than national inpatient estimates, ie, 5% and 8% compared to 0.2%18 and 0.5%-1%,19 respectively. Furthermore, we demonstrated higher total costs and total lengths of stay among guardianship patients, analyses for which the attributed date of clearance for controls was not required, and the rate of complications among the case patients was sizable despite their being formally medically cleared. In other words, regardless of whether a complication rate of 16% is “typical” for inpatients hospitalized for these durations, this suggests that persistent hospitalization after clearance does not carry a benign prognosis.
In addition, to estimate healthcare costs, we relied on total hospital charges, which are readily available and reflect, at least in part, payer costs but do not reflect true costs to the medical center. Nonetheless, charges approximately reflect costs–with some variation across cost centers–and hence provide a useful metric for comparing cases and controls. To provide context, for academic medical centers such as ours, costs are typically about half of charges.
Finally, each state has different statutes for surrogate decision-making. The results of this study reflect the Massachusetts’ experience, with no public guardianship program or hierarchy statute. That being said, while this presumably causes the need for more guardianships in Massachusetts, the mechanisms for guardianship are broadly similar nationwide and are likely to result in excessive length of stay and cost similar to those in our population, as demonstrated in studies from other states.7,15–17
Implications
At a time where medical systems are searching for opportunities to reduce the length of stay, prevent unnecessary hospitalization, and improve the quality of care, reevaluating the guardianship process is ripe with opportunity. In this single academic center, the process of guardianship was associated with 58% excess length of stay and 23% higher total hospital charges. Furthermore, one in six patients requiring guardianship suffered from hospital-associated complications.
This matched cohort study adds quantitative data demonstrating substantial burdens to the healthcare system as a result of the guardianship process and can be used as an impetus for hospital administration and legal systems to expedite the process. Potential improvements include increasing HCP form completions (which would eliminate the need to pursue guardianship for most of such patients), identifying patients who lack a legally recognized surrogate decision-maker earlier in their hospital stay (ideally upon admission), and providing resources to assist clinical teams in the completion of affidavits necessary to support the appointment of a guardian, so that paperwork can be filed with courts sooner. Further research that provides more generalizable prospective data could potentially improve the guardianship process and reduce its burden on hospitals and patients even further.
Acknowledgments
The authors express their tremendous thanks to Gail Piatkowski for her invaluable assistance in collecting administrative and billing data.
Disclosures
The authors report no conflicts of interest. The authors alone are responsible for the content and writing of the article
1. O’Neill O. Autonomy and Trust in Bioethics. Cambridge: Cambridge University Press; 2002. PubMed
2. Beauchamp T, Childress J. Principles of Biomedical Ethics. 7th ed. New York: Oxford University Press; 2013.
3. McMurray RJ, Clarke OW, Barrasso JA, et al. Decisions near the end of life. J Am Med Assoc. 1992;267(16):2229-2233.
4. American Medical Association. AMA Principles of Medical Ethics: Chapter 2 - Opinions on Consent, Communication and Decision Making.; 2016.
5. Arnold RM, Kellum J. Moral justifications for surrogate decision making in the intensive care unit: Implications and limitations. Crit Care Med. 2003;31(Supplement):S347-S353. PubMed
6. Karp N, Wood E. Incapacitated and Alone: Healthcare Decision Making for Unbefriended Older People. Am Bar Assoc Hum Rights. 2003;31(2).
7. Bandy RJ, Helft PR, Bandy RW, Torke AM. Medical decision-making during the guardianship process for incapacitated, hospitalized adults: a descriptive cohort study. J Gen Intern Med. 2010;25(10):1003-1008. PubMed
8. Wynn S. Decisions by surrogates: an overview of surrogate consent laws in the United States. Bifocal. 2014;36(1):10-14.
9. Massachusetts General Laws. Chapter 201D: Health Care Proxies. https://malegislature.gov/Laws/GeneralLaws/PartII/TitleII/Chapter201D. Published 2017. Accessed March 31, 2017.
10. American Bar Association Commision on Law and Aging. Default Surrogate Consent Statutes. Am Bar Assoc. 2016:1-17.
11. Massachusetts General Laws. Chapter 190B: Massachusetts Probate Code. https://malegislature.gov/Laws/GeneralLaws/PartII/TitleII/Chapter190B. Published 2017. Accessed March 31, 2017.
12. Rosman M, Rachminov O, Segal O, Segal G. Prolonged patients’ in-hospital waiting period after discharge eligibility is associated with increased risk of infection, morbidity and mortality: a retrospective cohort analysis. BMC Health Serv Res. 2015;15:246. PubMed
13. Majeed MU, Williams DT, Pollock R, et al. Delay in discharge and its impact on unnecessary hospital bed occupancy. 2012. PubMed
14. Nobili A, Licata G, Salerno F, et al. Polypharmacy, length of hospital stay, and in-hospital mortality among elderly patients in internal medicine wards. The REPOSI study. Eur J Clin Pharmacol. 2011;67(5):507-519. PubMed
15. Chen JJ, Finn CT, Homa K, St Onge KP, Caller TA. Discharge delays for patients requiring in-hospital guardianship: A Cohort Analysis. J Healthc Qual. 2016;38(4):235-242. PubMed
16. Chen JJ, Kwon A, Stevens Y, Finn CT. Barriers beyond clinical control affecting timely hospital discharge for a patient requiring guardianship. Psychosomatics. 2015;56(2):206-209. PubMed
17. Chen JJ, Blanchard MA, Finn CT, et al. A clinical pathway for guardianship at dartmouth-hitchcock medical center. Jt Comm J Qual Patient Saf. 2014;40(9):389-397. PubMed
18. McEachern R, Campbell Jr GD. Hospital-Acquired Pneumonia: Epidemiology, Etiology, and Treatment. Infect Dis Clin North Am. 1998;12(3):761-779. PubMed
19. Zimlichman E, Henderson D, Tamir O, et al. Health care–associated infections. JAMA Intern Med. 2013;173(22):2039. PubMed
A central tenet of modern medicine is that patients must provide fully informed consent to receive or refuse medical care offered by their clinical teams.1–4 If a patient is unable to make and communicate a choice or clearly indicate an understanding of the information presented, then he or she is considered to lack the capacity to make medical decisions and the medical team must seek consent from the patient’s surrogate decision-maker.2-7 Every U.S. state recognizes a patient’s healthcare proxy (HCP) and a court-appointed guardian as a legally recognized surrogate.8,9 Most of the states also have statutes or regulations establishing a hierarchy of legally recognized surrogate decision-makers in the absence of a HCP or a court-appointed guardian, such as spouses, adult children, parents, siblings, and grandparents.8,10 In states that do not have such a statute, hospitals develop their own institutional policies for surrogate decision-making.
However, there are important limitations on the authority of these surrogate decision-makers.10 For instance, patients may not have a family member or a friend to serve as a surrogate decision-maker, often family members cannot override a patient’s objection, even when that patient lacks decision-making capacity, and certain decisions require a guardian or a HCP.8-10 In these circumstances, the hospital must petition a court to appoint a guardian as a legally recognized surrogate decision-maker. This can be an involved family member, if one exists, or an independent, typically volunteer, guardian.11 The process of guardian appointment is complex7,11 and can range from a few days to more than a month, largely dependent on court dates and finding a volunteer guardian. Much of the process occurs during the patient’s hospital stay. This prolongation of hospitalization would be expected to increase health care costs and iatrogenic complications,12–14 but data quantifying these for patients requiring guardianship are lacking. The goal of this study was to describe the characteristics of patients who undergo the process of guardianship and measure the associated burdens. These burdens include the financial costs to the medical system, the prolonged length of stay beyond medical necessity, and the costs to the patient in the form of hospital-acquired complications. Investigating the burden of guardianship is an important first step in uncovering opportunities to improve the process. We hypothesized that patients requiring guardianship would have lengths of stay and healthcare costs that were at least as large as those for patients whose conditions required similar durations of hospitalization prior to medical clearance, in part due to iatrogenic complications that would accrue while awaiting guardian appointment.
METHODS
Setting
We conducted a retrospective matched cohort study of adult inpatients at Beth Israel Deaconess Medical Center (BIDMC), a 651-bed academic, tertiary care facility in Boston, MA. The study was approved by the BIDMC Institutional Review Board as a nonhuman subject research consistent with hospital operations.
Population
For this matched cohort study, we identified case patients as those hospitalized for any reason for whom guardianship proceedings were initiated and obtained; only the first hospitalization during which the guardianship was pursued was used. Cases were identified by obtaining the data of all patients for whom the BIDMC general counsel completed the process of guardianship between October 2014 and September 2015. At BIDMC, all the guardianship proceedings are referred to the general counsel.
To determine the postclearance experience for referred patients compared with that for other patients with similar lengths of stay up to those of the referred patients’ point of clearance, we identified up to three matched controls for each case (Supplemental Figure 1). Medical clearance was defined as the date when the patient was medically stable to be discharged from the hospital, and it was determined in an iterative manner. We identified controls as hospitalized patients admitted for any cause and matched to the cases requiring guardianship on discharging service and length of stay prior to clearance. Specifically, we identified patients on the same service as the case whose length of stay was at least as long as the length of stay of the case patient until medical clearance, as defined below. We then determined the total and the excess length of stay, defined as the duration beyond clearance for each case referred for guardianship; for controls, the ‘excess’ length of stay was the number of hospitalized days beyond the corresponding time that a matched case had been provided clearance. To account for seasonal influences and the training level of house officers, we selected the three controls whose discharge date was closest (before or after) to the discharge date of their matched case.
From legal team files, we identified 61 patients hospitalized at BIDMC for whom new guardianship was pursued to completion. Of these 61 patients, 10 could not be matched to an appropriate control and were included in descriptive analyses but not in comparisons with controls.
Covariates and Outcomes
We collected the details regarding age, gender, primary language, highest level of education, marital status, insurance status, race, date of admission, date of discharge, discharge disposition, principal diagnosis, case mix index (CMI), and discharging service from our administrative and billing data. Outcomes of interest included length of stay and total hospital charges that were collected from the same databases. We used hospital charges, rather than payments, to ensure uniformity across payers.
Chart Review
Unique to cases, a team of two medical residents (JP, RP) and a hospitalist (DR) determined the date of medical clearance and hospital-associated complications by a chart review. The date of medical clearance was then used to calculate excess length of stay, ie, the duration of stay beyond the date of medical clearance, by subtracting the time to medical clearance from the total inpatient length of stay.
We developed a novel algorithm to determine the date of medical clearance consistently (Figure 1). We first determined whether the discharge summary indicated a clear date of medical readiness for discharge. If the discharge summary was unclear, then a case management or a social work note was used. The date of medical clearance determined by the case management or the social work note was then confirmed with clinical data. The date was confirmed if there were no significant laboratory orders and major medication changes or procedures for 24 h from the date identified. If notes were also inconclusive, then the medical clearance was determined by a review of provider order entry. Medical readiness for discharge was then defined as the first day when there were no laboratory orders for 48 h and no significant medication changes, imaging studies, or microbiologic orders.
Hospital-acquired complications were determined to be related to the guardianship process if they occurred after the date of medical stability but prior to discharge. We did not investigate hospital-acquired complications among controls. Hospital-acquired complications were defined as follows:
- Catheter-associated urinary tract infection (CAUTI): active Foley catheter order and positive urine culture that resulted in antibiotic administration.
- Hospital-acquired pneumonia (HAP): chest X-ray or computed tomography (CT) scan showing a consolidation that resulted in antibiotic administration.
- Venous thromboembolism (VTE): positive venous ultrasound or CT angiography of the chest for deep venous thrombosis (DVT) or pulmonary embolism (PE).
- Decubitus ulcer: new wound care consultation for sacral decubitus ulceration.
- Clostridium difficile (C. diff) infection: positive stool polymerase chain reaction that resulted in antibiotic administration.
The algorithm for identifying the date of clearance and the presence of complications was piloted independently by three investigators (RP, JP, DR) using a single chart review and was redesigned until a consensus was obtained. The same three investigators then independently reviewed three additional charts, including all notes, laboratory results, imaging results, and orders, with complete agreement for both date of clearance and presence of complications. Two investigators (RP, JP) then individually reviewed the remaining 57 charts. Of these, 10 were selected a priori for review by both investigators for interrater reliability, with a mean difference of 0.5 days in the estimated time to clearance and complete concordance in complications. In addition, a third investigator (DR) independently reread 5 of the 57 reviewed charts, with complete concordance in both time to clearance and presence of complications with the original readings.
Statistical Analysis
SAS 9.3 was used for all analyses (SAS Institute Inc., Cary, NC, USA).
We first examined the demographic and clinical characteristics of all 61 patients who underwent guardianship proceedings. Second, we described the primary outcomes of interest–length of stay, costs, and likelihood of complications–in this series of patients with associated 95% confidence intervals.
Third, we examined the associations between guardianship and length of stay and healthcare costs using generalized estimating equations with clustering by matched set and compound symmetry. For length of stay, we specifically assessed excess length of stay (the matching variable) to avoid immortal time bias; we also examined the total length of stay. For all regression analyses, we adjusted for the following covariates: age, gender, education, marital status, race/ethnicity, CMI, insurance status, discharging service, and principal diagnosis. To maximize normality of residuals, costs were log-transformed; length of stay beyond clearance was log-transformed after addition of 1. For both outcomes, we back-transformed the regression coefficients and presented percent change between case and control patients. All reported tests are two-sided.
RESULTS
A total of 61 guardianship cases and 118 controls were included in the analysis.
General Characteristics
The characteristics of all cases prior to matching are included in Table 1. The department of internal medicine discharged the largest proportion of cases, followed by neurosurgery and neurology departments. More than 65% of cases were insured by Medicare or Medicaid. Three-quarters of cases were discharged from the hospital to another medical facility, with about half discharged to a skilled nursing facility (SNF) or a rehabilitation center and one-quarter to a long-term acute care hospital (LTACH).
The median length of stay for patients requiring guardianship was 28 (range, 23-36) days, and the median total charges were $171,083 ($106,897-$245,281), with a total cost approximating $10.9 million for these patients. Regarding hospital-acquired complications, 10 (16%; 95% confidence interval, 8%–28%) unique cases suffered from a complication, with HAP being the most frequently (n = 5) occurring complication.
Comparison with Matched Controls
No statistically significant differences were observed between cases and controls in terms of age, primary language, highest level of education, ethnicity, insurance status, or discharging service as shown in Table 2; discharging service was a matched variable and comparable by design. However, cases tended to be less likely to be married and had a higher CMI.
When compared with control patients in terms of similar services who stayed for at least as long as their duration to clearance, the cases had significantly longer lengths of stay compared to those of controls (29 total days compared to 18 days, P < .001; Figure 2). In addition, cases incurred significantly higher median total charges ($168,666) compared to those of controls ($104,190; P = .02).
After accounting for potential confounders, including age, gender, language, education, marital status, discharging service, ethnicity, insurance status, CMI, and principal diagnosis, guardianship was associated with 58% higher excess length of stay (P = .04, 95% CI [2%-145%]). Furthermore, guardianship was associated with 23% higher total charges (P = .02, 95% CI [4%-46%]) and 37% longer total length of stay (P = .002, 95% CI [12%-67%]).
DISCUSSION
To our knowledge, this is among the first studies to investigate healthcare costs and harm to the patient in the form of hospital-associated complications as a result of guardianship proceedings. Other studies15,16 have also demonstrated excessive length of stay attributed to nonclinical factors such as guardianship, though they did not quantify the excess stay or compare guardianship cases with a matched control. One study17 demonstrated total charges of $150,000 per patient requiring guardianship, which are similar to our results. However, Chen et al. also observed an average of 27.8 medically unnecessary days, which are 16 more days than those in our study sample. This may reflect the difference in how excess days were determined, namely, statistical process control analysis in the previous study compared with a manual chart review in our study. To our knowledge, no other study has compared guardianship cases with matched controls to compare their experiences to patients with similarly prolonged stays prior to clearance.
After matching by service and the length of stay until medical clearance in each guardianship case, the subsequent length of stay was higher among cases than among controls, even after adjustment for differences in CMI and diagnosis. This suggests that the process of obtaining guardianship results in a particularly prolonged length of stay, which is presumably attributable to factors other than medical complexity or ongoing illness.
It is probable that at least two interrelated mechanisms are responsible for the particularly high costs and the long stay of patients who require guardianship. First, the process of obtaining guardianship is itself protracted in several cases, necessitating long-term admissions well beyond the point of medical stability. Second, our results suggest that longer hospital stays are apt to grow further in a feed-forward cycle due to hospital-acquired complications that develop after the date of medical clearance. Indeed, in our series, 16% of patients sustained a complication that is readily attributable to hospital care after their date of clearance, and these types of complications are likely to lengthen the stay even further.
We compared cases referred for guardianship to control patients on the same services, at similar time points, whose length of stay was at least as long as the point of medical clearance as their corresponding case patient. Because cases were hospitalized with active medical needs to at least the point of clearance, we anticipated that costs might well be lower among cases, who had no medical necessity for hospitalization at the point of clearance, compared with controls who remained hospitalized presumably for active medical needs. Counter to this hypothesis, and accounting for potentially confounding variables, undergoing a guardianship proceeding was associated with nearly 25% higher costs of patient care. This may ultimately represent a substantial burden on the healthcare system. For example, in just 1 year in our hospital, the total hospital charges reached almost $11 million for the 61 patients who underwent guardianship proceedings. Considering that 65% of the patients requiring guardianship had Medicaid or Medicare coverage, there are significant financial implications for the hospital systems and to the public.
Limitations of our study relate to its retrospective nature at a single center. Investigating guardianship cases at a single center and with a small sample size of 61 patients limits generalizability. Nevertheless, we still had enough power to detect significant differences compared with matched controls, and this study remains the largest investigation into the cost associated with guardianship to date and the only study comparing guardianship cases with matched controls. Furthermore, we did not complete chart reviews of controls, which limits direct comparisons of complications and precluded our matching on variables that required detailed review.
The retrospective design may include confounders unaccounted for in our statistical design, though we attempted to match cases with controls to account for some of these potential differences and included a broad set of covariates that included measures of comorbidity and diagnosis. To this point, we included only CMI and principal diagnosis as the measures of severity, and adjustment for CMI, which includes features of the index hospitalization itself, may represent overadjustment. However, this type of overadjustment would tend to bias toward the null hypothesis.
Investigators only completed chart reviews for cases, which limits our ability to contrast the rate of hospital-associated complications for cases with that of controls. However, the rates of CAUTI and HAP complications among our cases were notably higher than national inpatient estimates, ie, 5% and 8% compared to 0.2%18 and 0.5%-1%,19 respectively. Furthermore, we demonstrated higher total costs and total lengths of stay among guardianship patients, analyses for which the attributed date of clearance for controls was not required, and the rate of complications among the case patients was sizable despite their being formally medically cleared. In other words, regardless of whether a complication rate of 16% is “typical” for inpatients hospitalized for these durations, this suggests that persistent hospitalization after clearance does not carry a benign prognosis.
In addition, to estimate healthcare costs, we relied on total hospital charges, which are readily available and reflect, at least in part, payer costs but do not reflect true costs to the medical center. Nonetheless, charges approximately reflect costs–with some variation across cost centers–and hence provide a useful metric for comparing cases and controls. To provide context, for academic medical centers such as ours, costs are typically about half of charges.
Finally, each state has different statutes for surrogate decision-making. The results of this study reflect the Massachusetts’ experience, with no public guardianship program or hierarchy statute. That being said, while this presumably causes the need for more guardianships in Massachusetts, the mechanisms for guardianship are broadly similar nationwide and are likely to result in excessive length of stay and cost similar to those in our population, as demonstrated in studies from other states.7,15–17
Implications
At a time where medical systems are searching for opportunities to reduce the length of stay, prevent unnecessary hospitalization, and improve the quality of care, reevaluating the guardianship process is ripe with opportunity. In this single academic center, the process of guardianship was associated with 58% excess length of stay and 23% higher total hospital charges. Furthermore, one in six patients requiring guardianship suffered from hospital-associated complications.
This matched cohort study adds quantitative data demonstrating substantial burdens to the healthcare system as a result of the guardianship process and can be used as an impetus for hospital administration and legal systems to expedite the process. Potential improvements include increasing HCP form completions (which would eliminate the need to pursue guardianship for most of such patients), identifying patients who lack a legally recognized surrogate decision-maker earlier in their hospital stay (ideally upon admission), and providing resources to assist clinical teams in the completion of affidavits necessary to support the appointment of a guardian, so that paperwork can be filed with courts sooner. Further research that provides more generalizable prospective data could potentially improve the guardianship process and reduce its burden on hospitals and patients even further.
Acknowledgments
The authors express their tremendous thanks to Gail Piatkowski for her invaluable assistance in collecting administrative and billing data.
Disclosures
The authors report no conflicts of interest. The authors alone are responsible for the content and writing of the article
1. O’Neill O. Autonomy and Trust in Bioethics. Cambridge: Cambridge University Press; 2002. PubMed
2. Beauchamp T, Childress J. Principles of Biomedical Ethics. 7th ed. New York: Oxford University Press; 2013.
3. McMurray RJ, Clarke OW, Barrasso JA, et al. Decisions near the end of life. J Am Med Assoc. 1992;267(16):2229-2233.
4. American Medical Association. AMA Principles of Medical Ethics: Chapter 2 - Opinions on Consent, Communication and Decision Making.; 2016.
5. Arnold RM, Kellum J. Moral justifications for surrogate decision making in the intensive care unit: Implications and limitations. Crit Care Med. 2003;31(Supplement):S347-S353. PubMed
6. Karp N, Wood E. Incapacitated and Alone: Healthcare Decision Making for Unbefriended Older People. Am Bar Assoc Hum Rights. 2003;31(2).
7. Bandy RJ, Helft PR, Bandy RW, Torke AM. Medical decision-making during the guardianship process for incapacitated, hospitalized adults: a descriptive cohort study. J Gen Intern Med. 2010;25(10):1003-1008. PubMed
8. Wynn S. Decisions by surrogates: an overview of surrogate consent laws in the United States. Bifocal. 2014;36(1):10-14.
9. Massachusetts General Laws. Chapter 201D: Health Care Proxies. https://malegislature.gov/Laws/GeneralLaws/PartII/TitleII/Chapter201D. Published 2017. Accessed March 31, 2017.
10. American Bar Association Commision on Law and Aging. Default Surrogate Consent Statutes. Am Bar Assoc. 2016:1-17.
11. Massachusetts General Laws. Chapter 190B: Massachusetts Probate Code. https://malegislature.gov/Laws/GeneralLaws/PartII/TitleII/Chapter190B. Published 2017. Accessed March 31, 2017.
12. Rosman M, Rachminov O, Segal O, Segal G. Prolonged patients’ in-hospital waiting period after discharge eligibility is associated with increased risk of infection, morbidity and mortality: a retrospective cohort analysis. BMC Health Serv Res. 2015;15:246. PubMed
13. Majeed MU, Williams DT, Pollock R, et al. Delay in discharge and its impact on unnecessary hospital bed occupancy. 2012. PubMed
14. Nobili A, Licata G, Salerno F, et al. Polypharmacy, length of hospital stay, and in-hospital mortality among elderly patients in internal medicine wards. The REPOSI study. Eur J Clin Pharmacol. 2011;67(5):507-519. PubMed
15. Chen JJ, Finn CT, Homa K, St Onge KP, Caller TA. Discharge delays for patients requiring in-hospital guardianship: A Cohort Analysis. J Healthc Qual. 2016;38(4):235-242. PubMed
16. Chen JJ, Kwon A, Stevens Y, Finn CT. Barriers beyond clinical control affecting timely hospital discharge for a patient requiring guardianship. Psychosomatics. 2015;56(2):206-209. PubMed
17. Chen JJ, Blanchard MA, Finn CT, et al. A clinical pathway for guardianship at dartmouth-hitchcock medical center. Jt Comm J Qual Patient Saf. 2014;40(9):389-397. PubMed
18. McEachern R, Campbell Jr GD. Hospital-Acquired Pneumonia: Epidemiology, Etiology, and Treatment. Infect Dis Clin North Am. 1998;12(3):761-779. PubMed
19. Zimlichman E, Henderson D, Tamir O, et al. Health care–associated infections. JAMA Intern Med. 2013;173(22):2039. PubMed
© 2018 Society of Hospital Medicine
Development of Hospitalization Resource Intensity Scores for Kids (H-RISK) and Comparison across Pediatric Populations
Hospitals are increasingly assessed comparatively in terms of costs and quality for benchmarking purposes. These comparisons can be used by patients and families to determine where to seek care, to report compliance and grant certifications by oversight organizations (eg, Leapfrog, Magnet, Joint Commission), and by payers, to determine reimbursement models and/or to assess financial penalty or bonuses for underperforming or overperforming hospitals. As these efforts can cause substantial reputational and financial consequences for hospitals, these metrics must be contextualized within the population of patients that each hospital serves.
In adult Medicare patient populations, methods have been developed to assess the relative severity of a hospital’s full complement of patients.1,2 These methods assume a relationship between severity and hospital resource intensity (ie, cost) and typically assume the form of relative weights (RWs), which are developed for clinically similar groups of patients (eg, Medicare Diagnosis Related Groups; MS-DRG) from a reference population. A RW for each MS-DRG is calculated as the average cost of patients within the group divided by the average cost for all patients in the reference population. These weights are then applied to a hospital’s discharges over a specific time period and averaged to obtain a hospital-level case-mix index (CMI). A value of 1 indicates that a hospital serves a mix of patients with similar severity (or resource intensity) to that of an “average” hospital discharge in the reference population, whereas a value of 1.2 indicates that a hospital serves a population of patients with 20% more severity than that of an “average” hospital discharge. Since 1983, the Centers for Medicare and Medicaid Services (CMS) has used RWs in their inpatient prospective payment system.3
Similar pediatric methods are less developed and necessitate special consideration as the use of existing weights may be inappropriate for a pediatric population. First, MS-DRGs were developed primarily for the Medicare population and lack sufficient granularity for pediatric populations, specifically newborns. Second, a severity stratification which incorporates important patient characteristics, such as age in pediatrics, does not exist in the MS-DRG system . Finally, although the reference populations that are used to develop MS-DRG weights do not explicitly exclude children, children typically account for approximately 15% of hospitalizations (6% excluding neonatal/maternal) and possibly feature different utilization patterns than adults with similar conditions. Thus, weights developed from a combined pediatric/adult reference population primarily reflect an adult population.
With valid pediatric RWs, stakeholders can assess a hospital’s severity mix of patients in a comparable fashion and contextualize outcome metrics. Additionally, these same weights can be used to estimate expected costs for hospitalizations or for risk adjusting various outcomes at the discharge- or hospital-level. Thus, we sought to develop hospitalization resource intensity scores for kids (H-RISK) using pediatric-specific weights and compare hospital-level CMIs across various hospital types and locations as an example of the application of this novel methodology.
METHODS
Dataset
Data for this analysis were obtained from the 2012 Healthcare Cost and Utilization Project (HCUP) Kids’ Inpatient Database (KID).4 KID is the largest publicly available all-payer inpatient administrative database in the United States and is sponsored by the Agency for Healthcare Research and Quality as part of the HCUP. The 2012 KID included a sample of approximately 3.2 million discharge records of children <21 years old from 44 states and 4,179 community, nonrehabilitation hospitals weighted for national estimates.
Hospital discharge costs were estimated from charges using cost-to-charge ratios (CCR) provided by HCUP as a supplement to the 2012 KID.5 Cost estimates associated with a specific discharge were estimated by multiplying the total charges reported in the data by the appropriate hospital-specific CCR and then adjusted for price factors beyond a hospital’s control using the area wage index also provided by HCUP as a supplement.
H-RISK and Case-Mix Index Calculations
We calculated H-RISK as pediatric-specific RWs based on version 30 of 3M’s All Patient Refined DRG (APR-DRG; 3M Health Information Systems, Salt Lake City, Utah) system as a measure of resource intensity. The APR-DRG system classifies hospital discharges into over 300 base DRGs based on demographic, diagnostic, and therapeutic characteristics. Each APR-DRG is further sub-divided into 4 subclasses of severity of illness (SOI; eg, minor, moderate, major, and extreme) to indicate the intensity of resource utilization during hospitalization. However, SOI levels for differing APR-DRGs are not comparable.
For every APR-DRG SOI combinations available in the 2012 KID, calculation of RW was based on the ratio of the mean cost for patients assigned to a particular APR-DRG SOI compared with the mean cost for all patients in the database. Inpatient costs less than $0.50 were set to missing and removed from analysis. Mortalities and discharges with missing CCR and wage index values were also excluded from analysis. We required that estimates for RWs be based on a reasonable set of data (ie, 10 or more discharges) for each APR-DRG SOI, and that estimates across the 4 SOI levels within an APR-DRG be monotonically nondecreasing (ie, as SOI level increases, weights must either be the same or increasing). Winsorized means were used as point estimates for mean cost in both the numerator and denominator of RW computation. Winsorizing refers to an analytic transformation by which the influence of outliers (eg, values beyond a certain threshold) is mitigated by replacing the value of outliers with the value of the threshold. We used the 5th and 95th percentiles as thresholds for Winsorizing our point estimates.
Winsorized point estimates failing to meet the minimum sample size of 10 or nondecreasing monotonicity requirement were modified by one of the two following methods:
- Cost data were modeled using a generalized linear model assuming an exponential distribution. Covariates in the model included APR-DRG and SOI within APR-DRG as a continuous variable. Where applicable, Winsorized estimates of the mean were replaced with modeled estimates.
- Data from an APR-DRG SOI in question were combined with other SOIs within the same APR-DRG with the closest Winsorized mean value. Once data were combined, a common Winsorized value was re-computed and values across SOIs were checked to ensure that nondecreasing monotonicity was maintained. In some APR-DRGs with sparse data, this involved combining pairs of severity levels; in others, it involved combining three or four severity levels together.
For APR-DRGs in which no discharges at any SOI were recorded in the 2012 KID, we used the Winsorized mean of all encounters with a common major diagnostic category (MDC) as the missing APR-DRG as point estimate for all 4 SOI levels.
To calculate the CMI for a set of discharges (eg, discharges at a hospital in a year), RWs were assigned to each discharge based on APR-DRG SOI designation. Consequently, all discharges from a specific APR-DRG SOI were assigned the same RW. Once RWs were assigned, CMI was calculated as the mean RW across all discharges. To compare hospital types based on acute-care hospital stays which are usually considered with the realm of pediatric care, we excluded RWs for normal newborns, defined as APR-DRG 626 (neonate birthweight of 2000–2499 g, normal newborn or neonate with other problems) and 640 (neonate birthweight >2499 g, normal newborn or neonate with other problems), and maternal hospitalizations, defined as APR-DRG 540 (cesarean delivery) and 560 (vaginal delivery), from our CMI calculations.
Statistical Methodology
Categorical variables were summarized using frequencies and percentages; continuous variables were summarized using medians and interquartile ranges. Differences between hospital
types (eg, rural, urban nonteaching, urban teaching, and
free-standing) were assessed using a Chi-square test for association for categorical variables. Differences in continuous variables including comparisons of neonatal (MDC 15) and nonneonatal discharges, and medical versus procedural discharges as defined by the APR-DRG grouper were assessed using a Kruskal–Wallis test. All analyses were performed using SAS, Version 9.4 (SAS Institute, Cary, North Carolina); P values <.05 were considered statistically significant.
This study was considered nonhuman subjects research by the Institutional Review Board of Vanderbilt University Medical Center.
RESULTS
Patient Population
Table 1 summarizes the patient characteristics for all 4 hospital types. All comparisons of patient characteristics across the four hospital types are significant (P < .001). Of the 6,675,222 weighted discharges in HCUP KID 2012, almost two-thirds were less than one year old (4,269,984). Three-quarters of those infant discharges (3,733,760) were in-hospital births. The South was the Census region with the most number of discharges (38.8%), and over half of discharges (53.2%) included patients who lived in metro areas with more than 1 million residents. Patients disproportionately originated from lower-income areas with 30.9% living in zip codes with median incomes in the first quartile.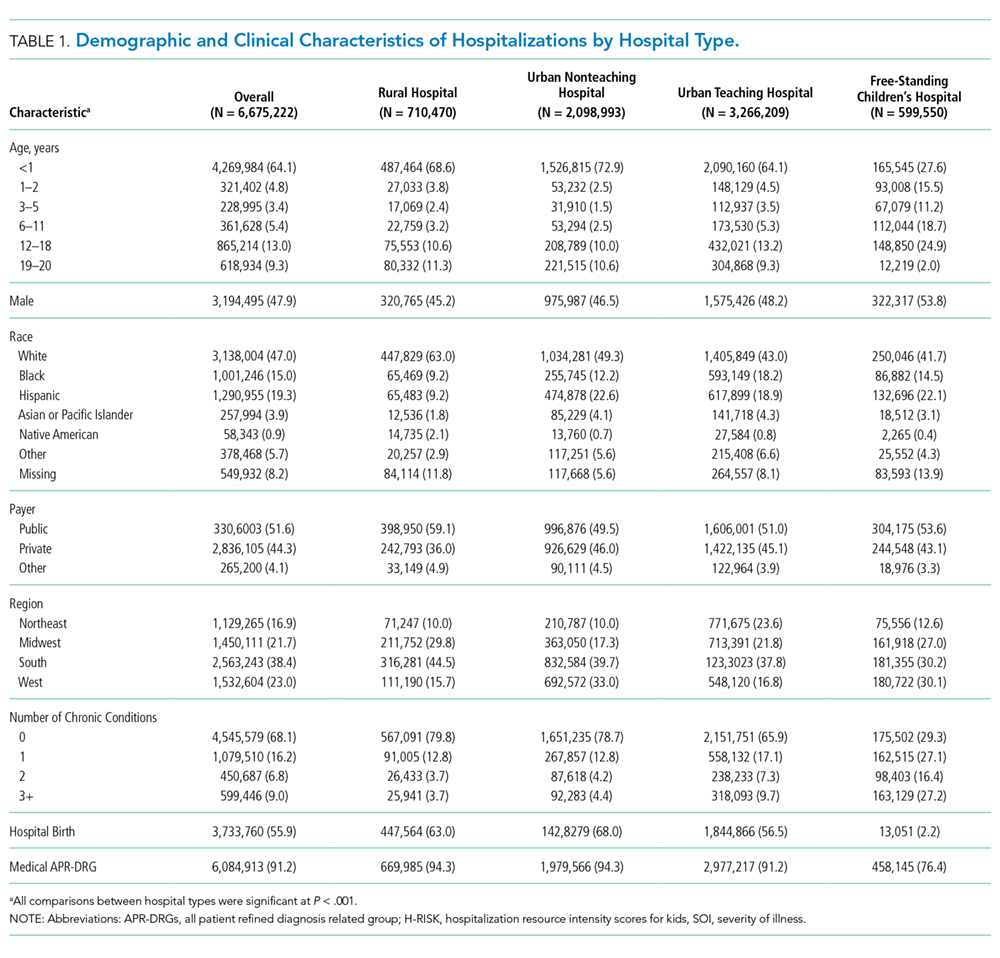
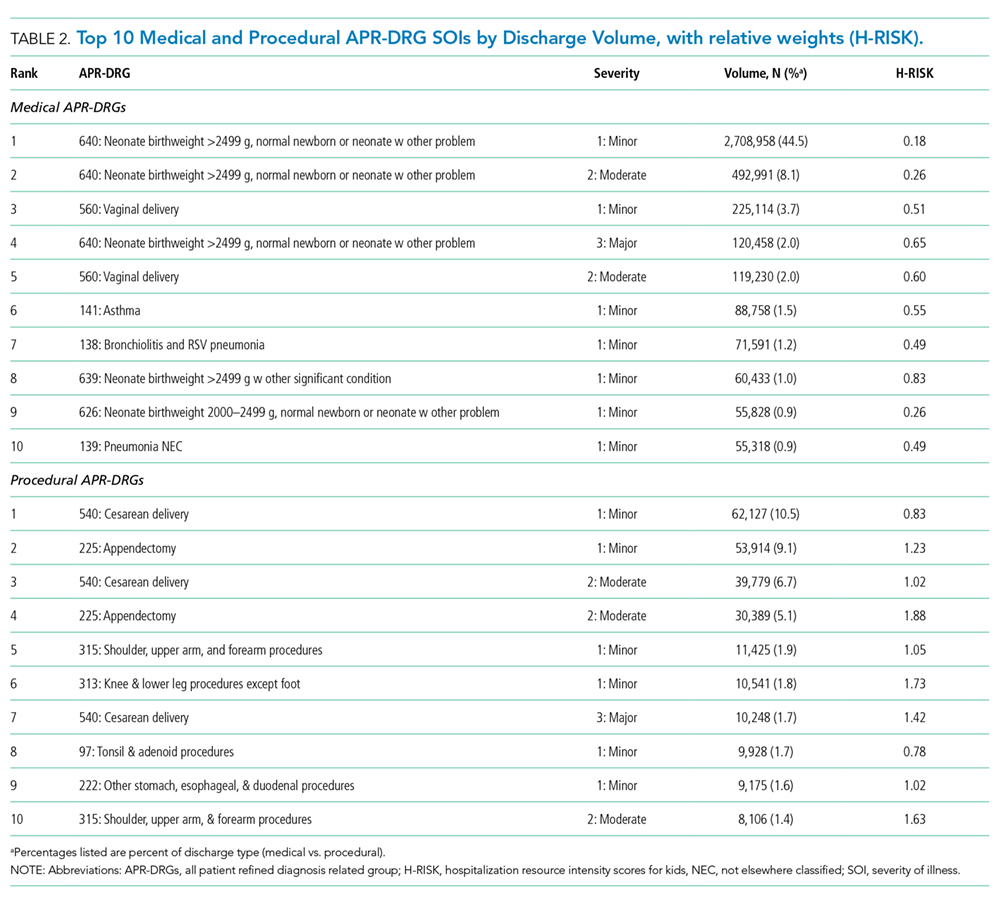
H-RISK Generation
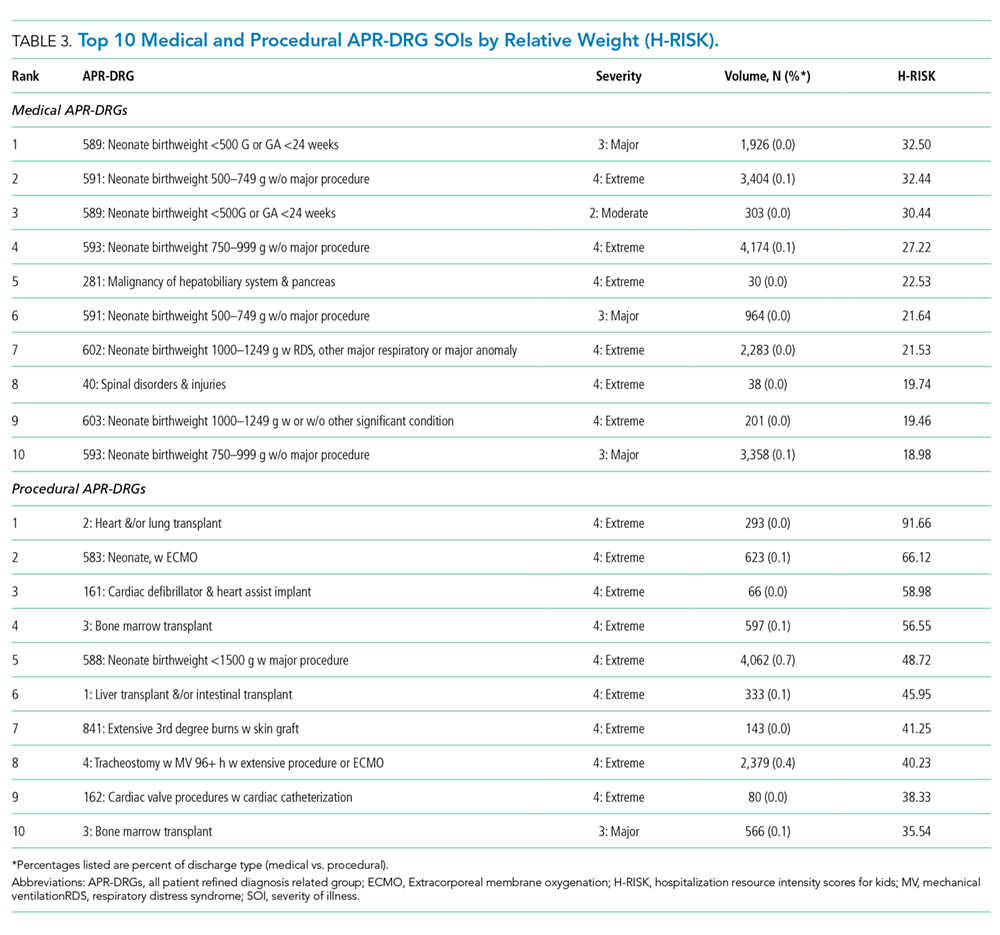
The weighted Winsorized mean cost of all discharges was $6,135 per discharge. The majority of cost-based H-RISK were higher than 1, with 1,038 (82.5%) of APR-DRG SOIs incurring an estimated cost higher than $6,135. Solid organ and bone marrow transplantations represented 4 of the 10 highest cost-based RWs for procedural APR-DRG SOIs (Table 3). Neonatal APR-DRG SOIs accounted for 8 of the 10 highest medical RWs. A list of all APR-DRG SOIs and H-RISK can be found in Appendix A.
Hospital-Level Case-Mix Index for Acute Hospitalizations
After excluding normal newborn and maternal hospitalizations, median CMI of the 3117 hospitals with at least 20 unweighted discharges was 1.0 (interquartile range [IQR]: 0.8, 1.7). CMI varied significantly across hospital types (P < .001). Free-standing children’s hospitals exhibited the highest cost-based CMI (median: 2.7, IQR: 2.2–3.1), followed by urban teaching hospitals (median: 1.8, IQR: 1.3–2.6), urban nonteaching hospitals (median: 1.1, IQR: 0.9–1.5), and rural hospitals (median: 0.9, IQR: 0.7–0.9).
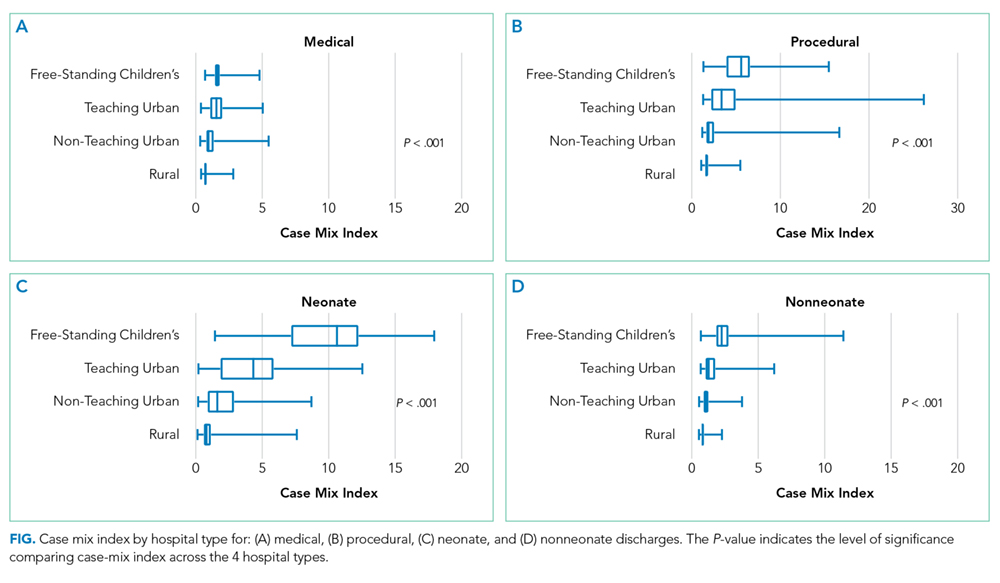
DISCUSSION
Currently, no widely available measures can compare the relative intensity of hospital care specific for inpatient pediatric populations. To meet this important need, we have developed a methodology to determine valid pediatric RWs (H-RISK) which can be used to estimate the intensity of care for applications across entire hospital patient populations and specific subpopulations. H-RISK allow calculation of CMIs for risk adjustment of various outcomes at the discharge- or hospital-level and for comparisons among hospitals and populations. Using this methodology, we demonstrated that the CMI for free-standing children’s hospitals was significantly higher than those of rural, urban, nonteaching and urban teaching hospitals for all discharges and medical or procedural subgroups.
CMS has used RWs based on DRGs since the inception of the prospective payment system in 1983. The sequence of DRGs used by CMS has purposely focused on older adult Medicare population, and CMS itself recommends applying Medicare-focused DRGs (MS-DRGs being the current iteration) only for the >65 year population.6 Nevertheless, many payers, both government and commercial, utilize MS-DRGs and their RWs for payment purposes when reimbursing children’s hospitals. The validity of using weights developed using this grouper in hospitals treating large numbers of pediatric patients and childhood illnesses has been called into question, particularly when such weights are used in reimbursement of children’s hospitals.7
Several factors contribute to the validity of a model for developing RWs. First, the system used to describe patient hospitalizations and illnesses should be appropriate to the population in question. As described above, the original DRG system and its subsequent iterations were designed to describe hospitalizations for adults >65 years of age.8, 9 Over the years, CMS DRGs incorporated rudimentary categories for neonatal and obstetrical hospitalizations. Still, the current MS-DRGs lack sufficient focus on common inpatient pediatric conditions to adequately describe pediatric hospitalizations, particularly those in free-standing children’s hospitals delivering tertiary and quaternary care. Thus, a more appropriate classification schema for developing RWs specific for pediatric hospitalization should include patients across the entire age spectrum. APR-DRGs represent one such classification system.
Once an appropriate patient classification system is selected, then the population of hospitalized patients to be used as the reference group becomes important. For a system targeting a pediatric inpatient population, a hospital discharge database representing a broad sample of pediatric hospitalizations offers the best basis for developing a system of weights applicable to different types of hospitals providing care for children. For this purpose, we selected the 2012 KID database, a nationally representative dataset containing data on newborn and pediatric discharges from the majority of states within the US. This choice assured that the RWs developed were based on and applicable to pediatric hospitalizations across the entire spectrum of SOI and resource intensity.
A number of measures of hospital performance and quality have been developed and are used by various entities, including individual hospitals, CMS, Leapfrog, Magnet, Joint Commission, and payers, for purposes ranging from benchmarking for improvement to payment models to reimbursement penalties. However, SOI of a hospital’s patient population influences not only the intensity of care that a hospital provides but also presents a potential impact on process and outcome measures. Thus, fair and appropriate measures must consider differences in SOI when comparing hospital performances. Using the weights derived in this paper, these adjustments can be possibly made at either the discharge- or hospital-level, depending on the application, and may include comparisons by hospital location, ownership, payer mix, or socioeconomic strata.
It is also common for hospitals to quantitatively express the uniqueness of services that they deliver to payers or the general public. A hospital-level CMI (derived as the average discharge weight for patients within a hospital) is one way that hospitals may differentiate themselves. This can be accomplished by considering the ratio of one hospital’s CMI to another hospital’s (or an average of a group of hospitals) as an expression of the relative intensity of services. For example, if hospital x has a CMI of 2.3, and hospital y has a CMI of 1.4, the population of children hospitalized at hospital x was 64.3% (1–2.3/1.4) more resource intensive than the children seen at hospital y.
This study should be considered in terms of several limitations. We used costs as the basis for determining intensity of service. Thus, the difference in cost structure among children’s hospitals and between children’s hospitals and other hospital types in the KID could have affected the final calculated weights. Also, the RWs calculated in this study rely on hospital discharge data. Thus, complications which were not “present on admission” and occurred during a hospitalization could have reflected poor quality of care yet still increase resource intensity as measured by total costs. Future studies should examine the potential impact of using present-on-admission diagnoses only for the APR-DRG grouping on the values of RWs. Significant variation may have existed among hospitals in resource utilization, and some hospitals may have exhibited significant overutilization of resources for the same conditions. However, as we used Winsorized means, the impact of potential outliers should have been reduced. Some APR-DRG-SOI combinations were seen mainly at children’s hospitals. Thus, cost structure and resource utilization practices of this subset of hospitals would have been the only contributors to weights for these patients. Given that the 2012 KID contained a broad representation of pediatric hospitalizations, with age 0–20 years, newborns accounted for the majority of total cases in the database. While providing a full range of pediatric weights, inclusion of these patients lowered the overall average RW. For this reason, we excluded normal newborn categories and maternal categories from analysis of CMI across hospital types and focused on acute-care hospitalizations. Lastly, as with any study relying on administrative data, there is always the possibility of coding errors or data entry errors in the reference dataset.
CONCLUSIONS
H-RISK can be used to risk adjust measures to account for severity differences across populations. These weights can also be averaged across hospitals’ patient populations to compare relative resource intensities of the patients served.
Disclosures
The authors have nothing to disclose.
1. Pettengill J, Vertrees J. Reliability and Validity in Hospital Case-Mix Measurement. Health Care Financ Rev. 1982; 4(2): 101-128. PubMed
2. Centers for Medicare & Medicaid Services. Details for title: Case Mix Index. https://www.cms.gov/Medicare/Medicare-Fee-for-Service-Payment/AcuteInpatientPPS/Acute-Inpatient-Files-for-Download-Items/CMS022630.html#. Accessed August 30, 2017.
3. Iglehart JK. Medicare begins prospective payment of hospitals. N. Engl. J. Med 1983; 308(23): 1428-1432. PubMed
4. Healthcare Cost Utilization Project. Overview of the Kids’ Inpatient Database (KID). 2017; https://www.hcup-us.ahrq.gov/kidoverview.jsp. Accessed August 30, 2017.
5. Healthcare Cost Utilization Project. Cost-to-Charge Ratio Files: 2012 Kids’ Inpatient Database (KID) User Guide. 2014; https://www.hcup-us.ahrq.gov/db/state/CCR2012KIDUserGuide.pdf. Accessed August 30, 2017.
6. Centers for Medicare & Medicaid Services. Medicare Program; Changes to the Hospital Inpatient Prospective Payment Systems and Fiscal Year 2005 Rates; Final Rule. Federal Register. 2004;69(154):48,939. PubMed
7. Muldoon JH. Structure and performance of different DRG classification systems for neonatal medicine. Pediatrics. 1999; 103(1 Suppl E): 302-318. PubMed
8. Averill R, Goldfield N, Muldoon J, Steinbeck B, Grant T. A Closer Look at All Patient Refined DRGs. J AHIMA. 2002; 73(1): 46-50. PubMed
9. Centers for Medicare & Medicaid Services. Design and development of the Diagnosis Related Group (DRG). https://www.cms.gov/ICD10Manual/version34-fullcode-cms/fullcode_cms/Design_and_development_of_the_Diagnosis_Related_Group_(DRGs)_PBL-038.pdf. Accessed December 6, 2017.
Hospitals are increasingly assessed comparatively in terms of costs and quality for benchmarking purposes. These comparisons can be used by patients and families to determine where to seek care, to report compliance and grant certifications by oversight organizations (eg, Leapfrog, Magnet, Joint Commission), and by payers, to determine reimbursement models and/or to assess financial penalty or bonuses for underperforming or overperforming hospitals. As these efforts can cause substantial reputational and financial consequences for hospitals, these metrics must be contextualized within the population of patients that each hospital serves.
In adult Medicare patient populations, methods have been developed to assess the relative severity of a hospital’s full complement of patients.1,2 These methods assume a relationship between severity and hospital resource intensity (ie, cost) and typically assume the form of relative weights (RWs), which are developed for clinically similar groups of patients (eg, Medicare Diagnosis Related Groups; MS-DRG) from a reference population. A RW for each MS-DRG is calculated as the average cost of patients within the group divided by the average cost for all patients in the reference population. These weights are then applied to a hospital’s discharges over a specific time period and averaged to obtain a hospital-level case-mix index (CMI). A value of 1 indicates that a hospital serves a mix of patients with similar severity (or resource intensity) to that of an “average” hospital discharge in the reference population, whereas a value of 1.2 indicates that a hospital serves a population of patients with 20% more severity than that of an “average” hospital discharge. Since 1983, the Centers for Medicare and Medicaid Services (CMS) has used RWs in their inpatient prospective payment system.3
Similar pediatric methods are less developed and necessitate special consideration as the use of existing weights may be inappropriate for a pediatric population. First, MS-DRGs were developed primarily for the Medicare population and lack sufficient granularity for pediatric populations, specifically newborns. Second, a severity stratification which incorporates important patient characteristics, such as age in pediatrics, does not exist in the MS-DRG system . Finally, although the reference populations that are used to develop MS-DRG weights do not explicitly exclude children, children typically account for approximately 15% of hospitalizations (6% excluding neonatal/maternal) and possibly feature different utilization patterns than adults with similar conditions. Thus, weights developed from a combined pediatric/adult reference population primarily reflect an adult population.
With valid pediatric RWs, stakeholders can assess a hospital’s severity mix of patients in a comparable fashion and contextualize outcome metrics. Additionally, these same weights can be used to estimate expected costs for hospitalizations or for risk adjusting various outcomes at the discharge- or hospital-level. Thus, we sought to develop hospitalization resource intensity scores for kids (H-RISK) using pediatric-specific weights and compare hospital-level CMIs across various hospital types and locations as an example of the application of this novel methodology.
METHODS
Dataset
Data for this analysis were obtained from the 2012 Healthcare Cost and Utilization Project (HCUP) Kids’ Inpatient Database (KID).4 KID is the largest publicly available all-payer inpatient administrative database in the United States and is sponsored by the Agency for Healthcare Research and Quality as part of the HCUP. The 2012 KID included a sample of approximately 3.2 million discharge records of children <21 years old from 44 states and 4,179 community, nonrehabilitation hospitals weighted for national estimates.
Hospital discharge costs were estimated from charges using cost-to-charge ratios (CCR) provided by HCUP as a supplement to the 2012 KID.5 Cost estimates associated with a specific discharge were estimated by multiplying the total charges reported in the data by the appropriate hospital-specific CCR and then adjusted for price factors beyond a hospital’s control using the area wage index also provided by HCUP as a supplement.
H-RISK and Case-Mix Index Calculations
We calculated H-RISK as pediatric-specific RWs based on version 30 of 3M’s All Patient Refined DRG (APR-DRG; 3M Health Information Systems, Salt Lake City, Utah) system as a measure of resource intensity. The APR-DRG system classifies hospital discharges into over 300 base DRGs based on demographic, diagnostic, and therapeutic characteristics. Each APR-DRG is further sub-divided into 4 subclasses of severity of illness (SOI; eg, minor, moderate, major, and extreme) to indicate the intensity of resource utilization during hospitalization. However, SOI levels for differing APR-DRGs are not comparable.
For every APR-DRG SOI combinations available in the 2012 KID, calculation of RW was based on the ratio of the mean cost for patients assigned to a particular APR-DRG SOI compared with the mean cost for all patients in the database. Inpatient costs less than $0.50 were set to missing and removed from analysis. Mortalities and discharges with missing CCR and wage index values were also excluded from analysis. We required that estimates for RWs be based on a reasonable set of data (ie, 10 or more discharges) for each APR-DRG SOI, and that estimates across the 4 SOI levels within an APR-DRG be monotonically nondecreasing (ie, as SOI level increases, weights must either be the same or increasing). Winsorized means were used as point estimates for mean cost in both the numerator and denominator of RW computation. Winsorizing refers to an analytic transformation by which the influence of outliers (eg, values beyond a certain threshold) is mitigated by replacing the value of outliers with the value of the threshold. We used the 5th and 95th percentiles as thresholds for Winsorizing our point estimates.
Winsorized point estimates failing to meet the minimum sample size of 10 or nondecreasing monotonicity requirement were modified by one of the two following methods:
- Cost data were modeled using a generalized linear model assuming an exponential distribution. Covariates in the model included APR-DRG and SOI within APR-DRG as a continuous variable. Where applicable, Winsorized estimates of the mean were replaced with modeled estimates.
- Data from an APR-DRG SOI in question were combined with other SOIs within the same APR-DRG with the closest Winsorized mean value. Once data were combined, a common Winsorized value was re-computed and values across SOIs were checked to ensure that nondecreasing monotonicity was maintained. In some APR-DRGs with sparse data, this involved combining pairs of severity levels; in others, it involved combining three or four severity levels together.
For APR-DRGs in which no discharges at any SOI were recorded in the 2012 KID, we used the Winsorized mean of all encounters with a common major diagnostic category (MDC) as the missing APR-DRG as point estimate for all 4 SOI levels.
To calculate the CMI for a set of discharges (eg, discharges at a hospital in a year), RWs were assigned to each discharge based on APR-DRG SOI designation. Consequently, all discharges from a specific APR-DRG SOI were assigned the same RW. Once RWs were assigned, CMI was calculated as the mean RW across all discharges. To compare hospital types based on acute-care hospital stays which are usually considered with the realm of pediatric care, we excluded RWs for normal newborns, defined as APR-DRG 626 (neonate birthweight of 2000–2499 g, normal newborn or neonate with other problems) and 640 (neonate birthweight >2499 g, normal newborn or neonate with other problems), and maternal hospitalizations, defined as APR-DRG 540 (cesarean delivery) and 560 (vaginal delivery), from our CMI calculations.
Statistical Methodology
Categorical variables were summarized using frequencies and percentages; continuous variables were summarized using medians and interquartile ranges. Differences between hospital
types (eg, rural, urban nonteaching, urban teaching, and
free-standing) were assessed using a Chi-square test for association for categorical variables. Differences in continuous variables including comparisons of neonatal (MDC 15) and nonneonatal discharges, and medical versus procedural discharges as defined by the APR-DRG grouper were assessed using a Kruskal–Wallis test. All analyses were performed using SAS, Version 9.4 (SAS Institute, Cary, North Carolina); P values <.05 were considered statistically significant.
This study was considered nonhuman subjects research by the Institutional Review Board of Vanderbilt University Medical Center.
RESULTS
Patient Population
Table 1 summarizes the patient characteristics for all 4 hospital types. All comparisons of patient characteristics across the four hospital types are significant (P < .001). Of the 6,675,222 weighted discharges in HCUP KID 2012, almost two-thirds were less than one year old (4,269,984). Three-quarters of those infant discharges (3,733,760) were in-hospital births. The South was the Census region with the most number of discharges (38.8%), and over half of discharges (53.2%) included patients who lived in metro areas with more than 1 million residents. Patients disproportionately originated from lower-income areas with 30.9% living in zip codes with median incomes in the first quartile.
H-RISK Generation
The weighted Winsorized mean cost of all discharges was $6,135 per discharge. The majority of cost-based H-RISK were higher than 1, with 1,038 (82.5%) of APR-DRG SOIs incurring an estimated cost higher than $6,135. Solid organ and bone marrow transplantations represented 4 of the 10 highest cost-based RWs for procedural APR-DRG SOIs (Table 3). Neonatal APR-DRG SOIs accounted for 8 of the 10 highest medical RWs. A list of all APR-DRG SOIs and H-RISK can be found in Appendix A.
Hospital-Level Case-Mix Index for Acute Hospitalizations
After excluding normal newborn and maternal hospitalizations, median CMI of the 3117 hospitals with at least 20 unweighted discharges was 1.0 (interquartile range [IQR]: 0.8, 1.7). CMI varied significantly across hospital types (P < .001). Free-standing children’s hospitals exhibited the highest cost-based CMI (median: 2.7, IQR: 2.2–3.1), followed by urban teaching hospitals (median: 1.8, IQR: 1.3–2.6), urban nonteaching hospitals (median: 1.1, IQR: 0.9–1.5), and rural hospitals (median: 0.9, IQR: 0.7–0.9).
DISCUSSION
Currently, no widely available measures can compare the relative intensity of hospital care specific for inpatient pediatric populations. To meet this important need, we have developed a methodology to determine valid pediatric RWs (H-RISK) which can be used to estimate the intensity of care for applications across entire hospital patient populations and specific subpopulations. H-RISK allow calculation of CMIs for risk adjustment of various outcomes at the discharge- or hospital-level and for comparisons among hospitals and populations. Using this methodology, we demonstrated that the CMI for free-standing children’s hospitals was significantly higher than those of rural, urban, nonteaching and urban teaching hospitals for all discharges and medical or procedural subgroups.
CMS has used RWs based on DRGs since the inception of the prospective payment system in 1983. The sequence of DRGs used by CMS has purposely focused on older adult Medicare population, and CMS itself recommends applying Medicare-focused DRGs (MS-DRGs being the current iteration) only for the >65 year population.6 Nevertheless, many payers, both government and commercial, utilize MS-DRGs and their RWs for payment purposes when reimbursing children’s hospitals. The validity of using weights developed using this grouper in hospitals treating large numbers of pediatric patients and childhood illnesses has been called into question, particularly when such weights are used in reimbursement of children’s hospitals.7
Several factors contribute to the validity of a model for developing RWs. First, the system used to describe patient hospitalizations and illnesses should be appropriate to the population in question. As described above, the original DRG system and its subsequent iterations were designed to describe hospitalizations for adults >65 years of age.8, 9 Over the years, CMS DRGs incorporated rudimentary categories for neonatal and obstetrical hospitalizations. Still, the current MS-DRGs lack sufficient focus on common inpatient pediatric conditions to adequately describe pediatric hospitalizations, particularly those in free-standing children’s hospitals delivering tertiary and quaternary care. Thus, a more appropriate classification schema for developing RWs specific for pediatric hospitalization should include patients across the entire age spectrum. APR-DRGs represent one such classification system.
Once an appropriate patient classification system is selected, then the population of hospitalized patients to be used as the reference group becomes important. For a system targeting a pediatric inpatient population, a hospital discharge database representing a broad sample of pediatric hospitalizations offers the best basis for developing a system of weights applicable to different types of hospitals providing care for children. For this purpose, we selected the 2012 KID database, a nationally representative dataset containing data on newborn and pediatric discharges from the majority of states within the US. This choice assured that the RWs developed were based on and applicable to pediatric hospitalizations across the entire spectrum of SOI and resource intensity.
A number of measures of hospital performance and quality have been developed and are used by various entities, including individual hospitals, CMS, Leapfrog, Magnet, Joint Commission, and payers, for purposes ranging from benchmarking for improvement to payment models to reimbursement penalties. However, SOI of a hospital’s patient population influences not only the intensity of care that a hospital provides but also presents a potential impact on process and outcome measures. Thus, fair and appropriate measures must consider differences in SOI when comparing hospital performances. Using the weights derived in this paper, these adjustments can be possibly made at either the discharge- or hospital-level, depending on the application, and may include comparisons by hospital location, ownership, payer mix, or socioeconomic strata.
It is also common for hospitals to quantitatively express the uniqueness of services that they deliver to payers or the general public. A hospital-level CMI (derived as the average discharge weight for patients within a hospital) is one way that hospitals may differentiate themselves. This can be accomplished by considering the ratio of one hospital’s CMI to another hospital’s (or an average of a group of hospitals) as an expression of the relative intensity of services. For example, if hospital x has a CMI of 2.3, and hospital y has a CMI of 1.4, the population of children hospitalized at hospital x was 64.3% (1–2.3/1.4) more resource intensive than the children seen at hospital y.
This study should be considered in terms of several limitations. We used costs as the basis for determining intensity of service. Thus, the difference in cost structure among children’s hospitals and between children’s hospitals and other hospital types in the KID could have affected the final calculated weights. Also, the RWs calculated in this study rely on hospital discharge data. Thus, complications which were not “present on admission” and occurred during a hospitalization could have reflected poor quality of care yet still increase resource intensity as measured by total costs. Future studies should examine the potential impact of using present-on-admission diagnoses only for the APR-DRG grouping on the values of RWs. Significant variation may have existed among hospitals in resource utilization, and some hospitals may have exhibited significant overutilization of resources for the same conditions. However, as we used Winsorized means, the impact of potential outliers should have been reduced. Some APR-DRG-SOI combinations were seen mainly at children’s hospitals. Thus, cost structure and resource utilization practices of this subset of hospitals would have been the only contributors to weights for these patients. Given that the 2012 KID contained a broad representation of pediatric hospitalizations, with age 0–20 years, newborns accounted for the majority of total cases in the database. While providing a full range of pediatric weights, inclusion of these patients lowered the overall average RW. For this reason, we excluded normal newborn categories and maternal categories from analysis of CMI across hospital types and focused on acute-care hospitalizations. Lastly, as with any study relying on administrative data, there is always the possibility of coding errors or data entry errors in the reference dataset.
CONCLUSIONS
H-RISK can be used to risk adjust measures to account for severity differences across populations. These weights can also be averaged across hospitals’ patient populations to compare relative resource intensities of the patients served.
Disclosures
The authors have nothing to disclose.
1. Pettengill J, Vertrees J. Reliability and Validity in Hospital Case-Mix Measurement. Health Care Financ Rev. 1982; 4(2): 101-128. PubMed
2. Centers for Medicare & Medicaid Services. Details for title: Case Mix Index. https://www.cms.gov/Medicare/Medicare-Fee-for-Service-Payment/AcuteInpatientPPS/Acute-Inpatient-Files-for-Download-Items/CMS022630.html#. Accessed August 30, 2017.
3. Iglehart JK. Medicare begins prospective payment of hospitals. N. Engl. J. Med 1983; 308(23): 1428-1432. PubMed
4. Healthcare Cost Utilization Project. Overview of the Kids’ Inpatient Database (KID). 2017; https://www.hcup-us.ahrq.gov/kidoverview.jsp. Accessed August 30, 2017.
5. Healthcare Cost Utilization Project. Cost-to-Charge Ratio Files: 2012 Kids’ Inpatient Database (KID) User Guide. 2014; https://www.hcup-us.ahrq.gov/db/state/CCR2012KIDUserGuide.pdf. Accessed August 30, 2017.
6. Centers for Medicare & Medicaid Services. Medicare Program; Changes to the Hospital Inpatient Prospective Payment Systems and Fiscal Year 2005 Rates; Final Rule. Federal Register. 2004;69(154):48,939. PubMed
7. Muldoon JH. Structure and performance of different DRG classification systems for neonatal medicine. Pediatrics. 1999; 103(1 Suppl E): 302-318. PubMed
8. Averill R, Goldfield N, Muldoon J, Steinbeck B, Grant T. A Closer Look at All Patient Refined DRGs. J AHIMA. 2002; 73(1): 46-50. PubMed
9. Centers for Medicare & Medicaid Services. Design and development of the Diagnosis Related Group (DRG). https://www.cms.gov/ICD10Manual/version34-fullcode-cms/fullcode_cms/Design_and_development_of_the_Diagnosis_Related_Group_(DRGs)_PBL-038.pdf. Accessed December 6, 2017.
© 2018 Society of Hospital Medicine
A Matter of Urgency: Reducing Clinical Text Message Interruptions During Educational Sessions
On general medical wards, effective interprofessional communication is essential for high-quality patient care. Hospitals increasingly adopt secure text-messaging systems for healthcare team members to communicate with physicians in lieu of paging.1-3 Text messages facilitate bidirectional communication4,5 and increase perceived efficiency6-8 and are thus preferred over paging by nurses and trainees. However, this novel technology unintentionally causes high volumes of interruptions.9,10 Compared to paging, sending text messages and calling smartphones are more convenient and encourage communication of issues in real time, regardless of urgency.11 Interrupting messages are often perceived as nonurgent by physicians.6,12 In particular, 73%-93% of pages or messages sent to physicians are found to be nonurgent.13-17
Pages, text messages, or calls not only interrupt day-to-day tasks on the ward6,7,10,11,17,18 but also educational sessions,18-21 which are essential to the clinical teaching unit (CTU). Interruptions reduce learning and retention22 and are disruptive to the medical learning climate.18-20,23
Internal medicine CTUs at our large urban academic hospital network utilize a smartphone-based text messaging tool for interdisciplinary communication. Nonurgent interruptions are frequent during educational seminars, which occur at our institution between 8 AM and 9 AM and 12 PM and 1 PM on weekdays.10,11,19 In a preliminary analysis at one hospital site, an average of three text messages (range 1-11), 2 calls (range 0-8), and 3 emails (range 0-13) interrupted each educational session. Physicians and nurses can disagree on the urgency of messages or calls for the purposes of patient care and workflow.6,11,12,24 Nurses have expressed a desire for guidance regarding what constitutes an urgent clinical communication.6
This project aimed to reduce nonurgent text message interruptions during educational rounds. We hypothesized that improved decision support around clinical prioritization and reminders about educational hours could reduce unnecessary interruptions.
METHODS
This study was approved by the institution’s Research Ethics Board and conducted across 8 general medical CTU teams at an academic hospital network (Sites 1 and 2). Each CTU team provides 24-hour coverage of approximately 20–28 patients. The most responsible resident from each team carries an institution-provided smartphone, which receives secure texts, phone calls, and emails from nurses, social workers, physiotherapists, speech language pathologists, dieticians, pharmacists, and other physicians. Close collaboration with the platform developer permitted changes to be made to the system when needed. Prior to our interventions, a nurse could send a text message as either an “immediate interrupt” or a “delayed interrupt” message. Messages sent via the “delayed interrupt” option would be added to a queue and would eventually lead to an interrupting message if not replied to after a defined period. Direct phone calls were reserved for especially urgent or emergent communications.
Meetings were held with physicians and nursing managers at Site 1 (August 2014) and Site 2 (January 2015) to establish consensus on the communication process and determine clinical scenarios, regardless of time of day, that warrant a phone call, an “immediate interrupt” text, or a “delayed interrupt” text. In March 2015, resident feedback led to the addition of a third option to the sender interface. This option allowed messages to be sent as “For Your Information (FYI)” only, which would not lead to an interruption. “FYI” messages (for example, to notify that an ambulance had been booked for a patient), were instead placed in an electronic message board that could be viewed by the resident through the application. This change relied upon interdisciplinary trust and a commitment from residents to ensure that “FYI” messages were reviewed regularly.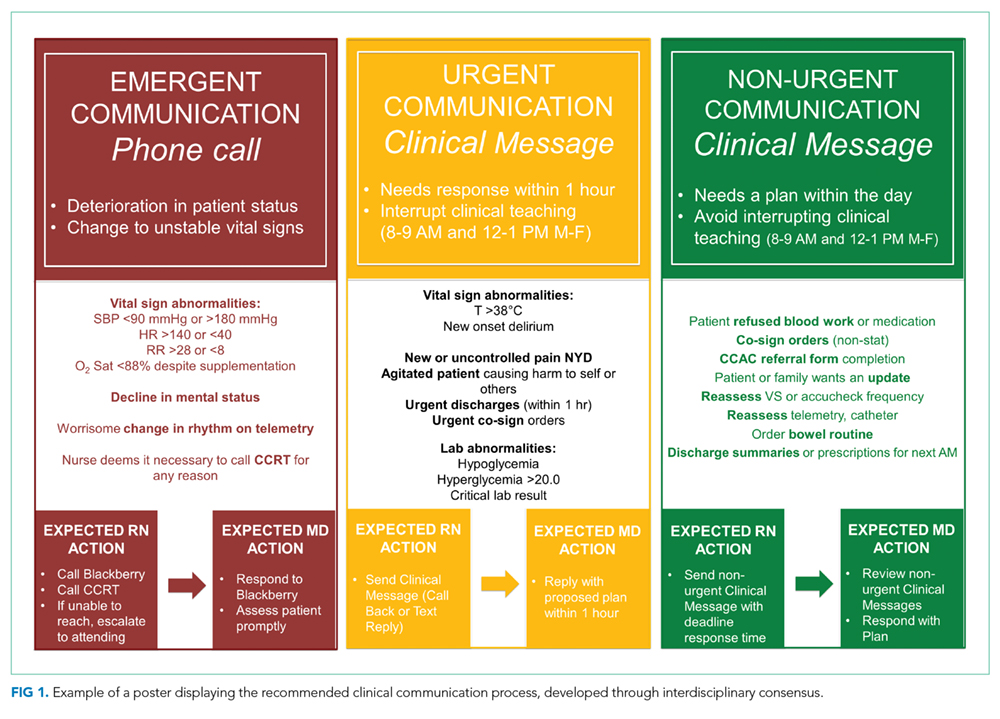
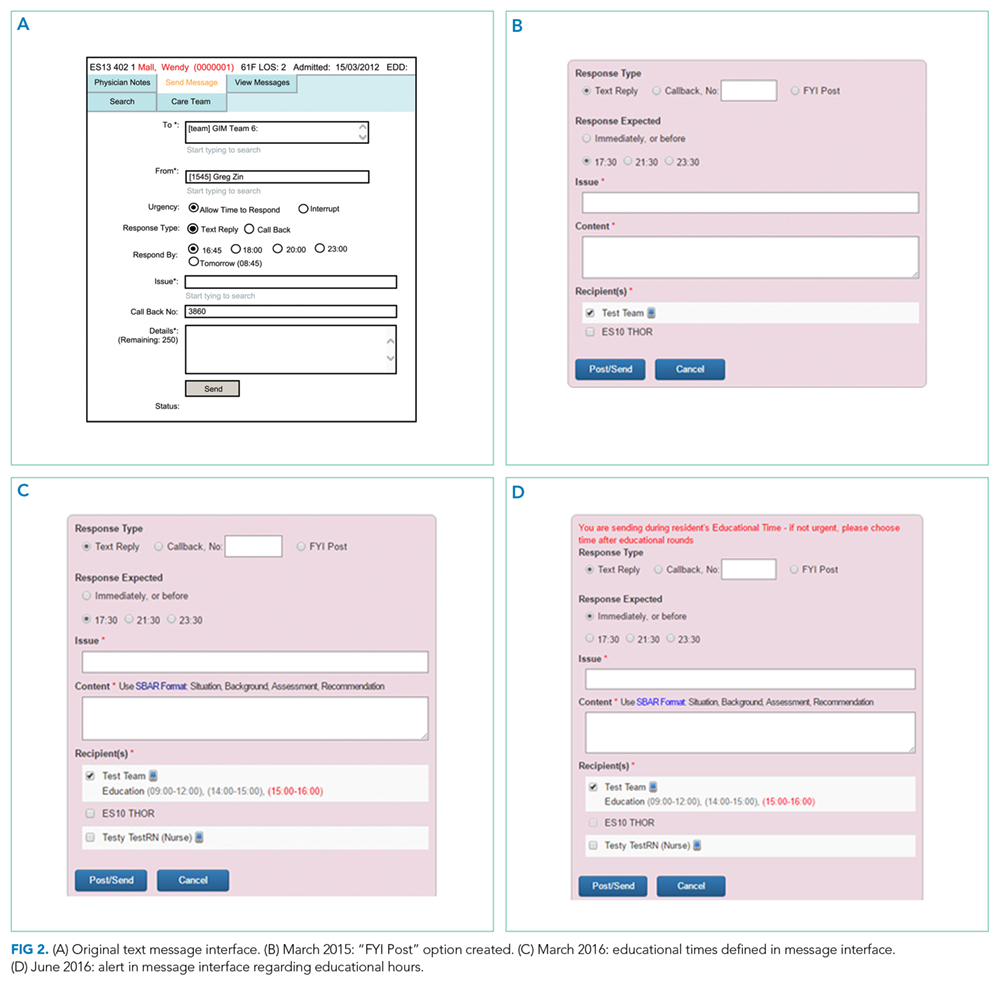
Statistical process control charts (u charts) assessed the frequency of each type of educational interruption (text, call, or email) per team on a monthly basis. The total educational interruptions per month were divided by the number of educational hours per month to account for variation in educational hours each month (for example, during holidays when educational rounds do not take place). If call logs or email data were unavailable for individual teams or time periods, then the denominator was adjusted to reflect the number of teams and educational hours in the sample for that month.
Two 4-week samples of interrupting text messages received by the 8 teams during educational hours were deidentified, analyzed, and compared in terms of content and urgency. A preintervention sample (November 17 to December 14, 2014) was compared to a postintervention sample (November 14 to December 11, 2016). Messages from the 2014 and 2016 samples were randomized, deidentified for date and time, and analyzed for urgency by 3 independent adjudicators (2 senior residents and 1 staff physician) to avoid biasing the postintervention analysis toward improvement. Messages were classified as “urgent” if the adjudicator felt a response or action was required within 1 hour. Messages not meeting these criteria were classified as “nonurgent” or “indeterminate” if the urgency of the message could not be assessed because it required further context. Fleiss kappa statistic evaluated agreement among adjudicators. Individual urgency designations were compared for each message, and discrepant rankings were addressed through repeated joint assessments. Disagreements were resolved through discussion and comparison against communication guidelines. In addition, messages reporting a “critical lab,” requiring physician notification as per institutional policy, were reclassified as “urgent.” The proportion of “nonurgent” messages sent during educational hours was compared between baseline and post-intervention periods using the Chi-square test.
“FYI” messages sent from November 14 to December 11, 2016 were audited using the same adjudication process to determine if “FYI” designations were appropriate and did not contain urgent patient care communications.
RESULTS
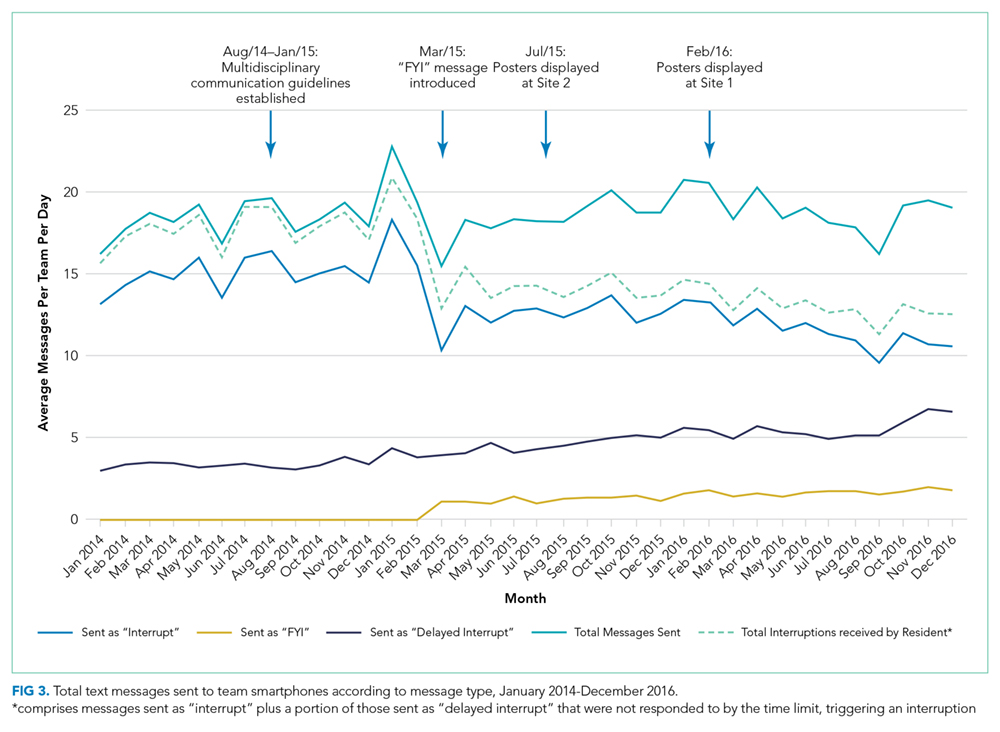

Incoming phone call logs were available from April 2015 to December 2016, with a mean of 0.62 (95% CI, 0.56 to 0.67) calls per team per educational hour, which did not change over the study period (Supplementary Figure 2). The overall number of calls to team smartphones also did not change during the measurement period. Incoming email data were available from October 2014 to December 2016, with a mean of 0.94 (95% CI, 0.88 to 1.0) emails per team per educational hour, which did not change over the study period (Supplementary Figure 3). Internal medicine service discharges, “Code Blue” announcements, and Critical Care Outreach Team consultations remained stable over the measurement period.
Independent ranking of the combined 4-week samples of educational text interruptions from 2014 and 2016 revealed an initial 3-way agreement on 257/455 (56%) messages (Fleiss Kappa 0.298, fair agreement), which increased to 405/455 (89%) messages after the first joint assessment and reached full consensus after a third joint assessment that included classifying all messages that communicated institution-defined “critical lab” values as “urgent.”
Overall, 71 (16%) messages were classified as “urgent,” 346 (76%) as “nonurgent,” and 38 (8%) as “indeterminate.” After unblinding of the message date and time, 273 text messages were received during the baseline measurement period (November 17 to December 14, 2014) and 182 messages were received during the equivalent time period 2 years later (November 14 to December 11, 2016), consistent with the reduced volume of educational interruptions observed (Figure 4). A total of 426 (94%) messages were sent by nurses, and the remaining ones were sent by pharmacists (n = 20), ward clerks (n = 3), social workers (n = 4), speech language pathologist (n = 1), or device administrator (n = 1).
The proportion of “nonurgent” messages decreased from 223/273 (82%) in 2014 to 123/182 (68%) in 2016 (P ≤ .01). Although the absolute number of urgent messages remained similar (33 in 2014 and 38 in 2016), the proportion of “urgent” messages increased from 12% to 21% of the total messages received (P = .02). Seventeen (6%) messages had indeterminate frequency in 2014 compared to 21 (11.5%) in 2016 (NS).
An audit of consecutive “FYI” messages (November 14-December 11, 2016) revealed an initial agreement in 384/431 (89%), reaching full consensus after repeated joint assessments. A total of 406 (94%) “FYI” messages were appropriately sent, while 10 (2%) represented urgent communications that should have been sent as interruptions. In 15 (4%) cases, the appropriateness of the message was indeterminate.
DISCUSSION
Sequential interventions over a 36-month period were associated with reduced nonurgent text message interruptions during educational hours. A clinical communication process was formally defined to accurately match message urgency with communication modality. A “noninterrupt” option allowed nonurgent text messages to be posted to an electronic message board, rather than causing real-time interruption, thereby reducing the overall volume of interrupting text messages. Modifying the interface to alert potential senders to protected educational hours was associated with reductions in educational interruptions. Through a blinded analysis of the text message content between 2014 and 2016, we determined that nonurgent educational interruptions were significantly reduced, and the number of urgent communications remained constant. Reduced nonurgent interruptions have the potential to improve the learning climate on the medical teaching unit during protected educational hours.
At baseline, 82% of the sampled text messages sent during educational hours across both sites were considered nonurgent. The estimated proportion of urgent messages varies in the literature (5%-34%)13-18 possibly due to center-specific methods of defining and measuring urgent messages. For example, different assessor training backgrounds, different numbers of assessors, and varying institutional policies are described.13-17 We considered an urgent message to require a response or action within 1 hour or to represent an established “critical lab value” as per the institution. The high proportion of nonurgent interruptions found in this study and other works demonstrates the widespread nature of this problem within inpatient hospital settings; this phenomenon could potentially lead to unintended consequences on efficiency and medical education.
Few other initiatives have aimed to reduce interruptions to medical trainees during educational sessions. At one center, replacing numeric pagers with alphanumeric pagers decreased the need to return pages during educational sessions but did not decrease the overall number of pages.21 Another center implemented an inbox tool that reduced daytime nonurgent numeric pages.15 Similar to our center’s previous experience,11 the total number of communications increased with the creation of the inbox tool.15 Unexpectedly, the introduction of an “FYI” option for senders in March 2015 did not increase the total number of messages.
Increasing use of text messages for communication between physicians and allied health professions has resulted in higher volumes of interruptions compared with conventional paging.6,7,9 Excessive interruptions create a “crisis mode” work climate,10 which could compromise patient safety25-27 and hamper trainees’ attainment of educational objectives.18-20,23 During educational sessions, audible text, phone call, and email interruptions disrupt all learners in addition to the resident receiving the message. The creation of the “FYI” message option in March 2015 was associated with reduced overall daily interruptions, which may improve efficiency in residents’ clinical duties17,18 and minimize multi-tasking that could lead to errors.28 However, adding a real-time notification during educational hours (March 2016, modified June 2016) exerted the greatest impact specifically on educational interruptions. Engaging physicians in the creation and ongoing modification of instant-messaging interfaces can help customize technology to meet the needs of users.15,29 Our work provides a strategy for improving communication between nurses and physicians in a teaching hospital setting, by achieving consensus on levels of urgency of different messages, providing a non-interrupting message option, and providing nurses with real-time information about educational hours.
Potential unintended consequences of the interventions require consideration. Discouraging interruptions may have reduced urgent patient care communications but were mitigated by enabling senders to ignore/override interruption warnings. We did not observe an increase in the number of overall calls to team devices, “Code Blues,” or critical care team consultations. However, we found that a very small (2%) but important group of “FYI” messages should have been sent as urgent interrupting messages, thereby underscoring the necessity for continuous feedback to senders on the clinical communication process.
Our study has limitations. Although educational interruptions can cause fragmented learning at our institution,19 the impact of reduced interruptions on the quality of educational sessions can only be inferred because we did not formally assess resident or staff physician perceptions on this outcome during the interventions. Moreover, we were unable to quantify interruptions received through personal smartphones, a frequent method of physician-physician communication.30 Phone calls are the most intrusive of interruptions but were not the focus of interventions. Future work must consider documenting perceived appropriateness of calls in real time, similar to previous studies assessing paging urgency.13,14,18 Biased ranking of message urgency was minimized by utilizing 3 independent adjudicators blinded to message date throughout the adjudication process and by applying established communication guidelines where available. Nevertheless, retrospective assessment of message urgency could be limited by a lack of clinical context, which may have been more apparent to the original sender and the recipient. Finally, at our center, a close relationship with the communication platform programmer made sequential modifications possible, while other institutions may have limited ability to make such changes. A different approach may be useful in some cases, such as modifying academic teaching times to limit interruptions.23
In a large academic center, a high number of interrupting smartphone messages cause unnecessary distractions and reduce learning during educational hours. “Nonurgent” educational interruptions were reduced through successive improvement cycles, and ultimately by modifying the program interface to alert senders of educational hours. Further reduction in interruptions and sustainability may be achieved by studying phone call interruptions and by formalizing audit and feedback of sender’s adherence to standardized clinical communication methods.
ACKNOWLEDGMENT
Dr. Wu is supported by an award from the Mak Pak Chiu and Mak-Soo Lai Hing Chair in General Internal Medicine, University of Toronto. The authors would like to acknowledge Jason Uppal for his ongoing contribution to the improvement of clinical text message communications at our institution.
Disclosures
The authors have nothing to disclose.
1. Wu R, Lo V, Morra D, et al. A smartphone-enabled communication system to improve hospital communication: usage and perceptions of medical trainees and nurses on general internal medicine wards. J Hosp Med. 2015;10(2):83-89. PubMed
2. Smith CN, Quan SD, Morra D, et al. Understanding interprofessional communication: a content analysis of email communications between doctors and nurses. Appl Clin Inform. 2012;3(1):38-51. PubMed
3. Frizzell JD, Ahmed B. Text messaging versus paging: new technology for the next generation. J Am Coll Cardiol. 2014;64(24):2703-2705. PubMed
4. Wu RC, Morra D, Quan S, et al. The use of smartphones for clinical communication on internal medicine wards. J Hosp Med. 2010;5(9):553-559. PubMed
5. Ighani F, Kapoor KG, Gibran SK, et al. A comparison of two-way text versus conventional paging systems in an academic ophthalmology department. J Med Syst. 2010;34(4):677-684. PubMed
6. Wu R, Rossos P, Quan S, et al. An evaluation of the use of smartphones to communicate between clinicians: a mixed-methods study. J Med Internet Res. 2011;13(3):e59. PubMed
7. Wu RC, Lo V, Morra D, et al. The intended and unintended consequences of communication systems on general internal medicine inpatient care delivery: a prospective observational case study of five teaching hospitals. J Am Med Inform Assoc. 2013;20(4):766-777. PubMed
8. Patel N, Siegler JE, Stromberg N, Ravitz N, Hanson CW. Perfect storm of inpatient communication needs and an innovative solution utilizing smartphones and secured messaging. Appl Clin Inform. 2016;7(3):777-789. PubMed
9. Aungst TD, Belliveau P. Leveraging mobile smart devices to improve interprofessional communications in inpatient practice setting: A literature review. J Interprof Care. 2015;29(6):570-578. PubMed
10. Vaisman A, Wu RC. Analysis of Smartphone Interruptions on Academic General Internal Medicine Wards. Frequent Interruptions may cause a ‘Crisis Mode’ Work Climate. Appl Clin Inform. 2017;8(1):1-11. PubMed
11. Quan SD, Wu RC, Rossos PG, et al. It’s not about pager replacement: an in-depth look at the interprofessional nature of communication in healthcare. J Hosp Med. 2013;8(3):137-143. PubMed
12. Quan SD, Morra D, Lau FY, et al. Perceptions of urgency: defining the gap between what physicians and nurses perceive to be an urgent issue. Int J Med Inform. 2013;82(5):378-386. PubMed
13. Katz MH, Schroeder SA. The sounds of the hospital. Paging patterns in three teaching hospitals. N Engl J Med. 1988;319(24):1585-1589. PubMed
14. Patel R, Reilly K, Old A, Naden G, Child S. Appropriate use of pagers in a New Zealand tertiary hospital. N Z Med J. 2006;119(1231):U1912. PubMed
15. Ferguson A, Aaronson B, Anuradhika A. Inbox messaging: an effective tool for minimizing non-urgent paging related interruptions in hospital medicine provider workflow. BMJ Qual Improv Rep. 2016;5(1):u215856.w7316. PubMed
16. Luxenberg A, Chan B, Khanna R, Sarkar U. Efficiency and interpretability of text paging communication for medical inpatients: A mixed-methods analysis. JAMA Intern Med. 2017;177(8):1218-1220. PubMed
17. Ly T, Korb-Wells CS, Sumpton D, Russo RR, Barnsley L. Nature and impact of interruptions on clinical workflow of medical residents in the inpatient setting. J Grad Med Educ. 2013;5(2):232-237. PubMed
18. Blum NJ, Lieu TA. Interrupted care. The effects of paging on pediatric resident activities. Am J Dis Child. 1992;146(7):806-808. PubMed
19. Wu RC, Tzanetos K, Morra D, Quan S, Lo V, Wong BM. Educational impact of using smartphones for clinical communication on general medicine: more global, less local. J Hosp Med. 2013;8(7):365-372. PubMed
20. Katz-Sidlow RJ, Ludwig A, Miller S, Sidlow R. Smartphone use during inpatient attending rounds: prevalence, patterns and potential for distraction. J Hosp Med. 2012;7(8):595-599. PubMed
21. Wong BM, Quan S, Shadowitz S, Etchells E. Implementation and evaluation of an alpha-numeric paging system on a resident inpatient teaching service. J Hosp Med. 2009;4(8):E34-E40. PubMed
22. Conard MA MR. Interest level improves learning but does not moderate the effects of interruptions: An experiment using simultaneous multitasking. Learn Individ Differ. 2014;30:112-117.
23. Zastoupil L, McIntosh A, Sopfe J, et al. Positive impact of transition from noon conference to academic half day in a pediatric residency program. Acad Pediatr. 2017;17(4):436-442. PubMed
24. Lo V, Wu RC, Morra D, Lee L, Reeves S. The use of smartphones in general and internal medicine units: a boon or a bane to the promotion of interprofessional collaboration? J Interprof Care. 2012;26(4):276-282. PubMed
25. Patterson ME, Bogart MS, Starr KR. Associations between perceived crisis mode work climate and poor information exchange within hospitals. J Hosp Med. 2015;10(3):152-159. PubMed
26. Laxmisan A, Hakimzada F, Sayan OR, Green RA, Zhang J, Patel VL. The multitasking clinician: decision-making and cognitive demand during and after team handoffs in emergency care. Int J Med Inform. 2007;76(11-12):801-811. PubMed
27. Westbrook JI, Woods A, Rob MI, Dunsmuir WT, Day RO. Association of interruptions with an increased risk and severity of medication administration errors. Arch Intern Med. 2010;170(8):683-690. PubMed
28. Collins S, Currie L, Patel V, Bakken S, Cimino JJ. Multitasking by clinicians in the context of CPOE and CIS use. Stud Health Technol Inform. 2007;129(Pt 2):958-962. PubMed
29. Huang ME. It is from mars and physicians from venus: Bridging the gap. PM R. 2017;9(5S):S19-S25. PubMed
30. Tran K, Morra D, Lo V, Quan S, Wu R. The use of smartphones on General Internal Medicine wards: A mixed methods study. Appl Clin Inform. 2014;5(3):814-823. PubMed
On general medical wards, effective interprofessional communication is essential for high-quality patient care. Hospitals increasingly adopt secure text-messaging systems for healthcare team members to communicate with physicians in lieu of paging.1-3 Text messages facilitate bidirectional communication4,5 and increase perceived efficiency6-8 and are thus preferred over paging by nurses and trainees. However, this novel technology unintentionally causes high volumes of interruptions.9,10 Compared to paging, sending text messages and calling smartphones are more convenient and encourage communication of issues in real time, regardless of urgency.11 Interrupting messages are often perceived as nonurgent by physicians.6,12 In particular, 73%-93% of pages or messages sent to physicians are found to be nonurgent.13-17
Pages, text messages, or calls not only interrupt day-to-day tasks on the ward6,7,10,11,17,18 but also educational sessions,18-21 which are essential to the clinical teaching unit (CTU). Interruptions reduce learning and retention22 and are disruptive to the medical learning climate.18-20,23
Internal medicine CTUs at our large urban academic hospital network utilize a smartphone-based text messaging tool for interdisciplinary communication. Nonurgent interruptions are frequent during educational seminars, which occur at our institution between 8 AM and 9 AM and 12 PM and 1 PM on weekdays.10,11,19 In a preliminary analysis at one hospital site, an average of three text messages (range 1-11), 2 calls (range 0-8), and 3 emails (range 0-13) interrupted each educational session. Physicians and nurses can disagree on the urgency of messages or calls for the purposes of patient care and workflow.6,11,12,24 Nurses have expressed a desire for guidance regarding what constitutes an urgent clinical communication.6
This project aimed to reduce nonurgent text message interruptions during educational rounds. We hypothesized that improved decision support around clinical prioritization and reminders about educational hours could reduce unnecessary interruptions.
METHODS
This study was approved by the institution’s Research Ethics Board and conducted across 8 general medical CTU teams at an academic hospital network (Sites 1 and 2). Each CTU team provides 24-hour coverage of approximately 20–28 patients. The most responsible resident from each team carries an institution-provided smartphone, which receives secure texts, phone calls, and emails from nurses, social workers, physiotherapists, speech language pathologists, dieticians, pharmacists, and other physicians. Close collaboration with the platform developer permitted changes to be made to the system when needed. Prior to our interventions, a nurse could send a text message as either an “immediate interrupt” or a “delayed interrupt” message. Messages sent via the “delayed interrupt” option would be added to a queue and would eventually lead to an interrupting message if not replied to after a defined period. Direct phone calls were reserved for especially urgent or emergent communications.
Meetings were held with physicians and nursing managers at Site 1 (August 2014) and Site 2 (January 2015) to establish consensus on the communication process and determine clinical scenarios, regardless of time of day, that warrant a phone call, an “immediate interrupt” text, or a “delayed interrupt” text. In March 2015, resident feedback led to the addition of a third option to the sender interface. This option allowed messages to be sent as “For Your Information (FYI)” only, which would not lead to an interruption. “FYI” messages (for example, to notify that an ambulance had been booked for a patient), were instead placed in an electronic message board that could be viewed by the resident through the application. This change relied upon interdisciplinary trust and a commitment from residents to ensure that “FYI” messages were reviewed regularly.
Statistical process control charts (u charts) assessed the frequency of each type of educational interruption (text, call, or email) per team on a monthly basis. The total educational interruptions per month were divided by the number of educational hours per month to account for variation in educational hours each month (for example, during holidays when educational rounds do not take place). If call logs or email data were unavailable for individual teams or time periods, then the denominator was adjusted to reflect the number of teams and educational hours in the sample for that month.
Two 4-week samples of interrupting text messages received by the 8 teams during educational hours were deidentified, analyzed, and compared in terms of content and urgency. A preintervention sample (November 17 to December 14, 2014) was compared to a postintervention sample (November 14 to December 11, 2016). Messages from the 2014 and 2016 samples were randomized, deidentified for date and time, and analyzed for urgency by 3 independent adjudicators (2 senior residents and 1 staff physician) to avoid biasing the postintervention analysis toward improvement. Messages were classified as “urgent” if the adjudicator felt a response or action was required within 1 hour. Messages not meeting these criteria were classified as “nonurgent” or “indeterminate” if the urgency of the message could not be assessed because it required further context. Fleiss kappa statistic evaluated agreement among adjudicators. Individual urgency designations were compared for each message, and discrepant rankings were addressed through repeated joint assessments. Disagreements were resolved through discussion and comparison against communication guidelines. In addition, messages reporting a “critical lab,” requiring physician notification as per institutional policy, were reclassified as “urgent.” The proportion of “nonurgent” messages sent during educational hours was compared between baseline and post-intervention periods using the Chi-square test.
“FYI” messages sent from November 14 to December 11, 2016 were audited using the same adjudication process to determine if “FYI” designations were appropriate and did not contain urgent patient care communications.
RESULTS
Incoming phone call logs were available from April 2015 to December 2016, with a mean of 0.62 (95% CI, 0.56 to 0.67) calls per team per educational hour, which did not change over the study period (Supplementary Figure 2). The overall number of calls to team smartphones also did not change during the measurement period. Incoming email data were available from October 2014 to December 2016, with a mean of 0.94 (95% CI, 0.88 to 1.0) emails per team per educational hour, which did not change over the study period (Supplementary Figure 3). Internal medicine service discharges, “Code Blue” announcements, and Critical Care Outreach Team consultations remained stable over the measurement period.
Independent ranking of the combined 4-week samples of educational text interruptions from 2014 and 2016 revealed an initial 3-way agreement on 257/455 (56%) messages (Fleiss Kappa 0.298, fair agreement), which increased to 405/455 (89%) messages after the first joint assessment and reached full consensus after a third joint assessment that included classifying all messages that communicated institution-defined “critical lab” values as “urgent.”
Overall, 71 (16%) messages were classified as “urgent,” 346 (76%) as “nonurgent,” and 38 (8%) as “indeterminate.” After unblinding of the message date and time, 273 text messages were received during the baseline measurement period (November 17 to December 14, 2014) and 182 messages were received during the equivalent time period 2 years later (November 14 to December 11, 2016), consistent with the reduced volume of educational interruptions observed (Figure 4). A total of 426 (94%) messages were sent by nurses, and the remaining ones were sent by pharmacists (n = 20), ward clerks (n = 3), social workers (n = 4), speech language pathologist (n = 1), or device administrator (n = 1).
The proportion of “nonurgent” messages decreased from 223/273 (82%) in 2014 to 123/182 (68%) in 2016 (P ≤ .01). Although the absolute number of urgent messages remained similar (33 in 2014 and 38 in 2016), the proportion of “urgent” messages increased from 12% to 21% of the total messages received (P = .02). Seventeen (6%) messages had indeterminate frequency in 2014 compared to 21 (11.5%) in 2016 (NS).
An audit of consecutive “FYI” messages (November 14-December 11, 2016) revealed an initial agreement in 384/431 (89%), reaching full consensus after repeated joint assessments. A total of 406 (94%) “FYI” messages were appropriately sent, while 10 (2%) represented urgent communications that should have been sent as interruptions. In 15 (4%) cases, the appropriateness of the message was indeterminate.
DISCUSSION
Sequential interventions over a 36-month period were associated with reduced nonurgent text message interruptions during educational hours. A clinical communication process was formally defined to accurately match message urgency with communication modality. A “noninterrupt” option allowed nonurgent text messages to be posted to an electronic message board, rather than causing real-time interruption, thereby reducing the overall volume of interrupting text messages. Modifying the interface to alert potential senders to protected educational hours was associated with reductions in educational interruptions. Through a blinded analysis of the text message content between 2014 and 2016, we determined that nonurgent educational interruptions were significantly reduced, and the number of urgent communications remained constant. Reduced nonurgent interruptions have the potential to improve the learning climate on the medical teaching unit during protected educational hours.
At baseline, 82% of the sampled text messages sent during educational hours across both sites were considered nonurgent. The estimated proportion of urgent messages varies in the literature (5%-34%)13-18 possibly due to center-specific methods of defining and measuring urgent messages. For example, different assessor training backgrounds, different numbers of assessors, and varying institutional policies are described.13-17 We considered an urgent message to require a response or action within 1 hour or to represent an established “critical lab value” as per the institution. The high proportion of nonurgent interruptions found in this study and other works demonstrates the widespread nature of this problem within inpatient hospital settings; this phenomenon could potentially lead to unintended consequences on efficiency and medical education.
Few other initiatives have aimed to reduce interruptions to medical trainees during educational sessions. At one center, replacing numeric pagers with alphanumeric pagers decreased the need to return pages during educational sessions but did not decrease the overall number of pages.21 Another center implemented an inbox tool that reduced daytime nonurgent numeric pages.15 Similar to our center’s previous experience,11 the total number of communications increased with the creation of the inbox tool.15 Unexpectedly, the introduction of an “FYI” option for senders in March 2015 did not increase the total number of messages.
Increasing use of text messages for communication between physicians and allied health professions has resulted in higher volumes of interruptions compared with conventional paging.6,7,9 Excessive interruptions create a “crisis mode” work climate,10 which could compromise patient safety25-27 and hamper trainees’ attainment of educational objectives.18-20,23 During educational sessions, audible text, phone call, and email interruptions disrupt all learners in addition to the resident receiving the message. The creation of the “FYI” message option in March 2015 was associated with reduced overall daily interruptions, which may improve efficiency in residents’ clinical duties17,18 and minimize multi-tasking that could lead to errors.28 However, adding a real-time notification during educational hours (March 2016, modified June 2016) exerted the greatest impact specifically on educational interruptions. Engaging physicians in the creation and ongoing modification of instant-messaging interfaces can help customize technology to meet the needs of users.15,29 Our work provides a strategy for improving communication between nurses and physicians in a teaching hospital setting, by achieving consensus on levels of urgency of different messages, providing a non-interrupting message option, and providing nurses with real-time information about educational hours.
Potential unintended consequences of the interventions require consideration. Discouraging interruptions may have reduced urgent patient care communications but were mitigated by enabling senders to ignore/override interruption warnings. We did not observe an increase in the number of overall calls to team devices, “Code Blues,” or critical care team consultations. However, we found that a very small (2%) but important group of “FYI” messages should have been sent as urgent interrupting messages, thereby underscoring the necessity for continuous feedback to senders on the clinical communication process.
Our study has limitations. Although educational interruptions can cause fragmented learning at our institution,19 the impact of reduced interruptions on the quality of educational sessions can only be inferred because we did not formally assess resident or staff physician perceptions on this outcome during the interventions. Moreover, we were unable to quantify interruptions received through personal smartphones, a frequent method of physician-physician communication.30 Phone calls are the most intrusive of interruptions but were not the focus of interventions. Future work must consider documenting perceived appropriateness of calls in real time, similar to previous studies assessing paging urgency.13,14,18 Biased ranking of message urgency was minimized by utilizing 3 independent adjudicators blinded to message date throughout the adjudication process and by applying established communication guidelines where available. Nevertheless, retrospective assessment of message urgency could be limited by a lack of clinical context, which may have been more apparent to the original sender and the recipient. Finally, at our center, a close relationship with the communication platform programmer made sequential modifications possible, while other institutions may have limited ability to make such changes. A different approach may be useful in some cases, such as modifying academic teaching times to limit interruptions.23
In a large academic center, a high number of interrupting smartphone messages cause unnecessary distractions and reduce learning during educational hours. “Nonurgent” educational interruptions were reduced through successive improvement cycles, and ultimately by modifying the program interface to alert senders of educational hours. Further reduction in interruptions and sustainability may be achieved by studying phone call interruptions and by formalizing audit and feedback of sender’s adherence to standardized clinical communication methods.
ACKNOWLEDGMENT
Dr. Wu is supported by an award from the Mak Pak Chiu and Mak-Soo Lai Hing Chair in General Internal Medicine, University of Toronto. The authors would like to acknowledge Jason Uppal for his ongoing contribution to the improvement of clinical text message communications at our institution.
Disclosures
The authors have nothing to disclose.
1. Wu R, Lo V, Morra D, et al. A smartphone-enabled communication system to improve hospital communication: usage and perceptions of medical trainees and nurses on general internal medicine wards. J Hosp Med. 2015;10(2):83-89. PubMed
2. Smith CN, Quan SD, Morra D, et al. Understanding interprofessional communication: a content analysis of email communications between doctors and nurses. Appl Clin Inform. 2012;3(1):38-51. PubMed
3. Frizzell JD, Ahmed B. Text messaging versus paging: new technology for the next generation. J Am Coll Cardiol. 2014;64(24):2703-2705. PubMed
4. Wu RC, Morra D, Quan S, et al. The use of smartphones for clinical communication on internal medicine wards. J Hosp Med. 2010;5(9):553-559. PubMed
5. Ighani F, Kapoor KG, Gibran SK, et al. A comparison of two-way text versus conventional paging systems in an academic ophthalmology department. J Med Syst. 2010;34(4):677-684. PubMed
6. Wu R, Rossos P, Quan S, et al. An evaluation of the use of smartphones to communicate between clinicians: a mixed-methods study. J Med Internet Res. 2011;13(3):e59. PubMed
7. Wu RC, Lo V, Morra D, et al. The intended and unintended consequences of communication systems on general internal medicine inpatient care delivery: a prospective observational case study of five teaching hospitals. J Am Med Inform Assoc. 2013;20(4):766-777. PubMed
8. Patel N, Siegler JE, Stromberg N, Ravitz N, Hanson CW. Perfect storm of inpatient communication needs and an innovative solution utilizing smartphones and secured messaging. Appl Clin Inform. 2016;7(3):777-789. PubMed
9. Aungst TD, Belliveau P. Leveraging mobile smart devices to improve interprofessional communications in inpatient practice setting: A literature review. J Interprof Care. 2015;29(6):570-578. PubMed
10. Vaisman A, Wu RC. Analysis of Smartphone Interruptions on Academic General Internal Medicine Wards. Frequent Interruptions may cause a ‘Crisis Mode’ Work Climate. Appl Clin Inform. 2017;8(1):1-11. PubMed
11. Quan SD, Wu RC, Rossos PG, et al. It’s not about pager replacement: an in-depth look at the interprofessional nature of communication in healthcare. J Hosp Med. 2013;8(3):137-143. PubMed
12. Quan SD, Morra D, Lau FY, et al. Perceptions of urgency: defining the gap between what physicians and nurses perceive to be an urgent issue. Int J Med Inform. 2013;82(5):378-386. PubMed
13. Katz MH, Schroeder SA. The sounds of the hospital. Paging patterns in three teaching hospitals. N Engl J Med. 1988;319(24):1585-1589. PubMed
14. Patel R, Reilly K, Old A, Naden G, Child S. Appropriate use of pagers in a New Zealand tertiary hospital. N Z Med J. 2006;119(1231):U1912. PubMed
15. Ferguson A, Aaronson B, Anuradhika A. Inbox messaging: an effective tool for minimizing non-urgent paging related interruptions in hospital medicine provider workflow. BMJ Qual Improv Rep. 2016;5(1):u215856.w7316. PubMed
16. Luxenberg A, Chan B, Khanna R, Sarkar U. Efficiency and interpretability of text paging communication for medical inpatients: A mixed-methods analysis. JAMA Intern Med. 2017;177(8):1218-1220. PubMed
17. Ly T, Korb-Wells CS, Sumpton D, Russo RR, Barnsley L. Nature and impact of interruptions on clinical workflow of medical residents in the inpatient setting. J Grad Med Educ. 2013;5(2):232-237. PubMed
18. Blum NJ, Lieu TA. Interrupted care. The effects of paging on pediatric resident activities. Am J Dis Child. 1992;146(7):806-808. PubMed
19. Wu RC, Tzanetos K, Morra D, Quan S, Lo V, Wong BM. Educational impact of using smartphones for clinical communication on general medicine: more global, less local. J Hosp Med. 2013;8(7):365-372. PubMed
20. Katz-Sidlow RJ, Ludwig A, Miller S, Sidlow R. Smartphone use during inpatient attending rounds: prevalence, patterns and potential for distraction. J Hosp Med. 2012;7(8):595-599. PubMed
21. Wong BM, Quan S, Shadowitz S, Etchells E. Implementation and evaluation of an alpha-numeric paging system on a resident inpatient teaching service. J Hosp Med. 2009;4(8):E34-E40. PubMed
22. Conard MA MR. Interest level improves learning but does not moderate the effects of interruptions: An experiment using simultaneous multitasking. Learn Individ Differ. 2014;30:112-117.
23. Zastoupil L, McIntosh A, Sopfe J, et al. Positive impact of transition from noon conference to academic half day in a pediatric residency program. Acad Pediatr. 2017;17(4):436-442. PubMed
24. Lo V, Wu RC, Morra D, Lee L, Reeves S. The use of smartphones in general and internal medicine units: a boon or a bane to the promotion of interprofessional collaboration? J Interprof Care. 2012;26(4):276-282. PubMed
25. Patterson ME, Bogart MS, Starr KR. Associations between perceived crisis mode work climate and poor information exchange within hospitals. J Hosp Med. 2015;10(3):152-159. PubMed
26. Laxmisan A, Hakimzada F, Sayan OR, Green RA, Zhang J, Patel VL. The multitasking clinician: decision-making and cognitive demand during and after team handoffs in emergency care. Int J Med Inform. 2007;76(11-12):801-811. PubMed
27. Westbrook JI, Woods A, Rob MI, Dunsmuir WT, Day RO. Association of interruptions with an increased risk and severity of medication administration errors. Arch Intern Med. 2010;170(8):683-690. PubMed
28. Collins S, Currie L, Patel V, Bakken S, Cimino JJ. Multitasking by clinicians in the context of CPOE and CIS use. Stud Health Technol Inform. 2007;129(Pt 2):958-962. PubMed
29. Huang ME. It is from mars and physicians from venus: Bridging the gap. PM R. 2017;9(5S):S19-S25. PubMed
30. Tran K, Morra D, Lo V, Quan S, Wu R. The use of smartphones on General Internal Medicine wards: A mixed methods study. Appl Clin Inform. 2014;5(3):814-823. PubMed
© 2018 Society of Hospital Medicine
Case Series Evaluating the Operative and Nonoperative Treatment of Scapular Fractures
ABSTRACT
The injury parameters and patient characteristics that affect function after scapular fracture are poorly defined. We performed a retrospective review of 594 adult patients with a minimum 12-month follow-up after scapular fracture. Functional outcomes were prospectively assessed using the American Shoulder and Elbow Surgeons (ASES) survey in 153 patients after a mean of 62 months of follow-up. The population was 78% male, and 88% had injuries caused by a high-energy event. Only 4.6% had injuries isolated to the scapula. All fractures healed primarily and the mean ASES score was 79.3, indicating minimal functional impairment. However, 7 patients (4.6%) reported severe functional deficits. Fifteen patients (9.8%) underwent open reduction and internal fixation. These patients had a better mean ASES score than those who were treated nonoperatively (92.1 vs 77.9, P = .03). When fracture types were analyzed individually, there was an advantage to surgery in fractures involving the glenoid (96.0 vs 75.7, P < .05). Concomitant chest wall injury or the presence of adjacent fractures did not affect functional outcomes. Smokers had a worse mean score (73.3 vs 84.5, P = .01), as did patients with a history of alcohol abuse (70.3 vs 83.9, P < .05). In conclusion, mean ASES scores indicated good function overall. Patients with a history of tobacco use or alcohol abuse had worse outcome scores.
Continue to: Scapular fractures occur frequently due to high-energy trauma...
Scapular fractures occur frequently due to high-energy trauma, with concomitant injuries seen in approximately 90% of cases.1-4 As a result, treatment is often surrounded by other difficult medical decisions, and factors affecting outcomes can be multifaceted. The gaps in our understanding of long-term outcomes with current treatment modalities have recently come to light, especially when it comes to determining indications for surgery.
Specifically, there is very little literature on radiographic healing and long-term shoulder function in larger samples of scapular fractures; additionally, there is evidence that some patients do not experience full functional recovery.3,5-7 Studies assessing return of function in patients treated nonoperatively have shown decreased mobility and persistence of pain.7 Some of these findings could be due to variability in surgical indications.2,4 While the majority of fractures are treated nonoperatively, the decision to operate has recently been one of debate. Prior literature has suggested highly variable measurements of angulation and extra-articular displacement at which surgery is recommended.1 For example, indications for surgery measured by the medial displacement of extra-articular fractures range from >10 mm to >20 mm;8-11 similarly, the displacement of intra-articular fractures meriting surgery ranges from >2 mm to >5 mm, depending on the author.12-16
The current debate over surgical indications for less severe scapular fractures, as well as the potential for chronic pain and stiffness calls for a thorough examination of factors affecting functional outcomes. The purpose of this study is to determine which patient factors, fracture patterns, and treatment modalities were associated with differences in healing and return of shoulder function. We hypothesized that certain aspects of the patient’s social history (tobacco, alcohol) as well as concomitant chest wall injuries may be associated with poor outcome scores and lower levels of function. We further hypothesized that glenoid fractures would affect function more than body fractures, and we did not expect to see a significant difference in outcomes between operative and nonoperative treatment.
MATERIALS AND METHODS
This study was approved by the Institutional Review Board. A registry at our level 1 trauma center was queried to identify 663 skeletally mature patients with scapular fractures between 1999 and 2011. Forty-eight patients had died prior to the study, and 21 patients had insufficient radiography and/or clinical follow-up (Figure 1). To be included, patients were required to have at least 1 year of follow-up to assess healing. Data on patient demographics, fracture classification, etiology of injury, concomitant injuries (clavicle fractures, rib fractures, pulmonary injuries), comorbidities, alcohol use, and tobacco use were collected retrospectively for the remaining 594 patients. Patients were then prospectively contacted via telephone and mail, employing 3 Internet search engines as needed, in an attempt to obtain current contact information. Three patients declined to participate, and 438 were not reachable after multiple attempts. Outcome scores for the remaining 153 patients were determined with the Modified American Shoulder and Elbow Surgeons (ASES) Shoulder Form.17 Scores were measured out of 100, with 0 to 30 representing maximally impaired, 31 to 60 representing moderately impaired, and 61 to 100 representing minimally impaired shoulder function.18 Due to the retrospective identification of the patients, no pre-injury shoulder function scores were collected. Given that many patients were unreachable, or reachable but not living in close proximity to the hospital, patients did not routinely return for re-evaluation for this study.
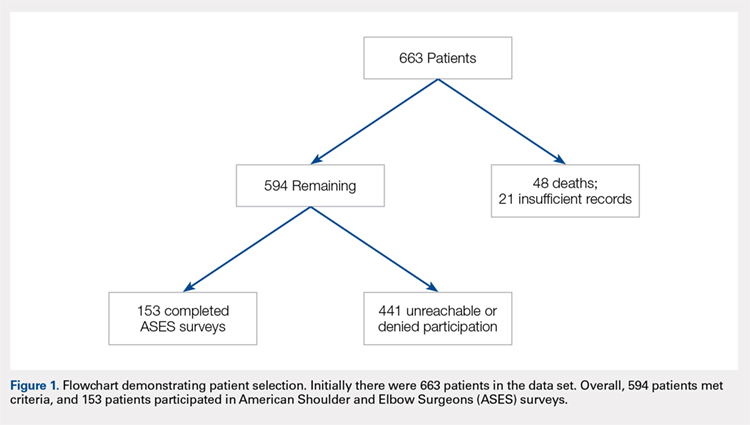
Nonoperative management consisted of sling immobilization for comfort for up to 2 weeks, during which time Codman’s exercises and elbow, forearm, wrist, and hand motion were encouraged. Active and passive shoulder mobility without restriction were also recommended progressively as tolerated. Strengthening and unrestricted lifting activities were allowed after approximately 8 to 10 weeks following the injury. Decision for surgery was at the surgeon’s discretion. Surgical indications included articular displacement and severely displaced glenoid neck fractures. Open reduction and internal fixation was performed by 1 of 4 fellowship-trained surgeons. Concomitant surgical procedures were not undertaken in the same setting. Postoperative activity consisted of sling immobilization for comfort for up to 6 weeks, during which time active and passive shoulder mobility without restriction were also recommended progressively as tolerated. Strengthening and unrestricted lifting activities were allowed after approximately 12 weeks following surgery. We considered fractures as healed if either X-rays showed healing progression to complete union or early X-rays showing signs of healing with subsequent follow-up visits indicating clinical healing (absence of pain, absence of shoulder dysfunction).
Continue to: STATISTICAL ANALYSIS...
STATISTICAL ANALYSIS
Statistical analysis was undertaken with GraphPad software. Associations were tested between positive predictive variables and functional outcomes. Variables included gender, mechanism, fracture classification, patient comorbidities, social factors, associated injuries, and type of treatment. A Mann-Whitney rank test was used to test for associations between nonparametric variables, including patient age. In all cases, P < .05 was considered significant.
RESULTS
Complete clinical and radiographic data were available for 594 patients. This included 462 men and 132 women, with a mean age of 42.8 years (range, 15-92 years). Twenty-four patients (4.0%) sustained bilateral fractures, and 31 fractures (5.0%) were open. All fractures healed primarily. A total of 153 patients completed the ASES questionnaire at a mean of 62 months after injury (Table 1). This group was similar to the entire population with respect to age, gender, and type of treatment. In all, 135 patients had been injured by a high-energy mechanism (88%), and the fracture pattern as per the Arbeitsgemeinschaft für Osteosynthesefragen/Orthopaedic Trauma Association (AO/OTA) classification consisted of 14A (no glenoid involvement) (n = 139; 91%) and 14B/C (glenoid involvement) (n = 14; 9.2%).19 The mean ASES score for our entire sample was 79.3 (minimally functionally impaired). In all, 117 patients (76%) reported minimal functional deficit (ASES, 61-100), 29 (19%) reported moderate functional deficit (ASES, 31-60), and only 7 (4.6%) reported maximum functional deficit (ASES, 0-30). Gender and age were not associated with functional outcome scores.
Table 1. Patient Demographics and Etiology of Scapula Fractures.
| n |
Gender |
|
Men | 119 (77.8%) |
Women | 34 (22.2%) |
Mechanism |
|
Motorcycle crash | 48 (31.4%) |
Motor vehicle collision | 38 (24.8%) |
Fall from stand | 14 (9.2%) |
Fall from height | 13 (8.5%) |
Pedestrian vs vehicle | 11 (7.2%) |
Crush | 7 (4.5%) |
Gunshot | 5 (3.3%) |
Other | 17 (11.1%) |
Fracture Pattern |
|
14A | 139 (88.2%) |
14B/C | 14 (11.8%) |
Fifteen patients (9.8%) were treated surgically. They had a higher mean ASES score vs non-surgically treated patients (92.1 vs 77.9; P = .03) (Table 2). However, when patients were divided into 14A and 14B/C fracture patterns, there was only a significant advantage in outcome scores for operative vs nonoperative care in the 14B/C classification (96.0 vs 75.7; P < .05); meanwhile, surgery for scapular body fractures (14A) was not associated with better outcome scores (90.2 vs 78.3; P = .14). Unfortunately, assessment of these comparisons within classification groups resulted in underpowered analyses for these small groups.
Table 2. Number of ASES Surveys Completed and Mean ASES Score for Each Treatment Type and Fracture Classification
| n | Mean ASES | Standard Error |
Surgical (total) | 15 | 92.1a | 3.5 |
Surgical 14A | 10 | 90.2 | 4.9 |
Surgical 14B/C | 5 | 96.0a | 3.2 |
Non-surgical (total) | 138 | 77.9a | 2.1 |
Nonsurgical. 14A | 129 | 78.3 | 2.2 |
Nonsurgical 14B/C | 9 | 75.7a | 6.5 |
aP < 0.05.
Abbreviation: ASES, American Shoulder and Elbow Surgeons.
Table 3 shows the ASES scores for patients with various types of associated chest and shoulder injuries. Only 7 patients (4.6%) had injuries isolated to the scapula. Thirty-three patients (22%) had associated clavicle fractures, and 102 patients (67%) sustained concomitant chest wall injuries, including rib fractures (n = 88) and pulmonary injuries (n = 71). Patients with associated chest wall injuries did not have worse mean ASES scores than those without chest wall injuries (80.9 vs 78.2; P = .49). Additionally, patients who had concomitant clavicle fractures did not report worse scores than those who did not (83.2 vs 78.6; P = .46).
Table 3. Concomitant Injuries and Mean American Shoulder and Elbow Surgeons (ASES) Scores
| n | Mean ASES | Standard Error |
Clavicle fracture | 33 (21.6%) | 83.2 | 3.6 |
No clavicle fracture | 120 (78.4%) | 78.6 | 2.2 |
Chest wall injury | 102 (66.7%) | 80.9 | 2.1 |
Rib fracture | 31 (20.3%) | 82.4 | 3.6 |
Lung Injury | 14 (9.2%) | 80.8 | 5.5 |
Rib Fracture + Lung Injury | 57 (37.3%) | 80.2 | 3.0 |
No chest wall injury | 51 (33.3%) | 78.2 | 3.8 |
Isolated scapula fracture | 7 (4.6%) | 92.4 | 6.5 |
The majority of patients were self-reported smokers (54%) and alcohol drinkers (64%) (Table 4). Aspects of social history were associated with differences in functional outcome scores. Non-smokers had a higher mean ASES score than both current smokers (84.5 vs 72.8; P = .02) and patients with any lifetime history of smoking (84.5 vs 73.3; P = .01) (Figure 2). There was no significant difference in shoulder function scores between patients identified as non-drinkers and those who reported consuming alcohol at moderate levels (83.9 vs 78.9; P = .26); however, patients who had a documented history of alcohol abuse had lower mean ASES scores than those who reported being non-drinkers (70.3 vs 83.9; P < .05).
Table 4. Substance Use and Functional Outcome Scores
| n | Mean ASES | Standard Error |
Non-smoker | 57 (46.3%) | 84.5a | 2.9 |
History of smoking | 66 (53.7%) | 73.3a | 3.0 |
Smoker | 45 (36.6%) | 72.8a | 3.8 |
Former | 21 (17.1%) | 74.6 | 5.1 |
No alcohol consumption | 46 (36.2%) | 83.9a | 3.1 |
Moderate alcohol use | 65 (51.2%) | 78.9 | 2.9 |
Alcohol abuse | 16 (12.6%) | 70.3a | 7.3 |
aP < 0.05.
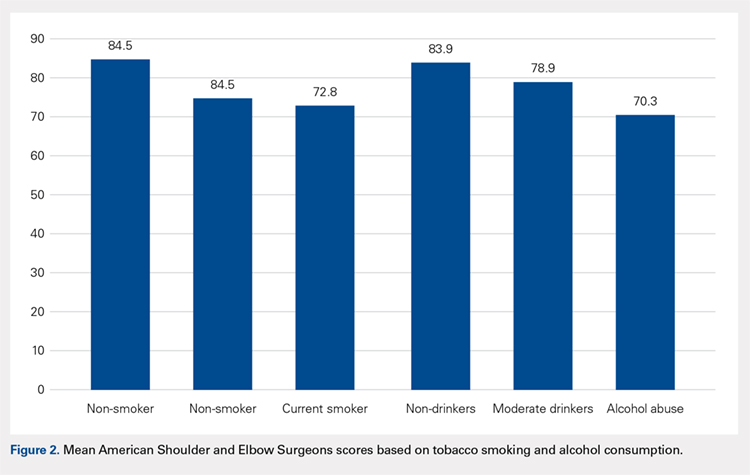
Continue to: DISCUSSION...
DISCUSSION
Patients with scapular fractures often require a complex set of treatment decisions due to high rates of concomitant injuries.2,20-22 A lack of large studies on long-term scapular function, as well as evidence that some patients treated conservatively for scapular fractures experience functional deficit and pain, inspired us to investigate the recovery process after scapular fractures through radiographs and the ASES survey.7 Further, we attempted to identify any factors that may be associated with poor functional results. Our review of long-term outcomes after scapular fractures demonstrates that they not only heal well but also have a good functional outcome in most cases. Over 95% had acceptable ASES scores, with both 14A and 14B/C having similar return of function. While both operatively and nonoperatively treated patients had scores indicating minimal functional impairment, those treated surgically had better scores overall. Surprisingly, concomitant injuries, including chest wall injuries, did not portend a worse shoulder outcome in our patients. The factors that were associated with worse outcome were tobacco use and alcohol abuse.
Beyond these findings, we attempted to comment on surgical indications, which have been highly debated.2,3 For example, the medial displacement at which studies suggest extra-articular fractures merit surgery ranges from >10 mm to >20 mm;8-11 similarly, the indication for surgery based on displacement of intra-articular fractures ranges from >2 mm to >5 mm, depending on the author.12-16 Glenoid articular fractures or neck fractures are other potential indications for operative treatment. In fact, a review of 520 scapular fractures from multiple studies found that 80% of those with glenoid involvement were treated operatively, while only 52% of those with exclusive acromion and/or coracoid involvement, and 1% of those with exclusive scapular body involvement were treated operatively.5 Some reports indicate that 14B/C fractures, especially those that are displaced or complex, show good functional outcomes and low complication rates after fixation.5,23 In this study, articular fractures of the glenoid were treated operatively more often than extra-articular fractures. We attempted to determine the impact of surgical care on functional outcomes according to fracture type, but we were limited by the small number of surgical patients when reviewing the 14A and 14B/C groups. As a whole, surgical patients had better outcomes than non-surgical patients. We believe this difference is clinically relevant and suggests a potential group of patients who may benefit from fixation. Further investigation is needed to better characterize these injuries and to develop specific recommendations.
This study yielded interesting results related to substance abuse. It has previously been shown that tobacco smoking and alcohol abuse have both been associated with poor bone health.24 Studies have suggested that exposure to nicotine and other chemical components in cigarettes can lead to delayed healing, higher rates of nonunion, and decreased mechanical strength of bone.25-29 Additionally, alcohol abuse has been associated with decreased bone mass and poor bone formation.24,30,31 Although we did not measure bone density or quantitate time of healing, this study provides added insight in that the healed fractures of smokers and patients with a history of alcohol abuse showed lower levels of shoulder function, as measured by ASES scores after similar initial injuries and similar follow-up periods. These results suggest that chemical, social, or a combination of these factors affect muscular recovery, other aspects of post-fracture recovery, and/or levels of baseline physical or mental impairment beyond those detailed in previous studies of bone health and substance abuse. For example, return to work was a scored category in the ASES survey that we used to asses the return of shoulder function, and several studies have shown that factors such as education level, coping abilities, and baseline functioning (cognitive, social, and physical) all have a significant impact on rates of return to work, independently of injury type.6,32-35 It is possible, then, that other aspects of the ASES survey are affected by factors that may be more prevalent in populations engaging in substance abuse. From both perspectives, these data highlight the importance of addressing tobacco use and alcohol abuse as a part of caring for all trauma patients, including those with scapular fractures, regardless of their high rates of radiographic healing. They also provide insight for prognosticating and setting patient expectations after scapular fractures.
Continue to: This study addressed the relationship between...
This study addressed the relationship between concomitant chest wall injuries and recovery of shoulder function after scapular fracture. Previous studies have suggested that concomitant chest wall injuries, such as rib fractures, cause more pain and may adversely impact the return of function in patients who have sustained scapular body fractures.1 These results, however, occurred in the setting of a much shorter follow-up, in which Disability of Arm, Shoulder, and Hand (DASH) surveys were distributed 6 months post-injury, 12 months post-injury, and once at last follow-up (<3 years). At our significantly later average follow-up, chest wall injuries did not portend a worse return of shoulder function, in contrast to our hypothesis. Our lack of findings of a worse return of function in patients with chest wall injuries, in light of previous literature, suggests that this association could become less distinct as the initial injury becomes more remote and has had more time to heal. Farther out from injury, patients seem to function similarly, regardless of chest wall injury history.
This study was limited by several factors. First, the surgically treated group was considerably smaller than the nonoperative group, which made drawing statistically significant comparisons between them challenging. Although there were no apparent differences between the group who completed ASES surveys and those who did not, only collecting ASES data on 153 of the 663 patients introduces a possible selection bias in this analysis. Additionally, due to the retrospective nature of this study, we were not able to ascertain the specific surgical indications used by individual surgeons. Again, the nature of this study also made it implausible to separate fractures beyond the simple 14A vs 14B/C classification. For example, we did not routinely have access to computed tomography scans to provide exact measurements of displacement, angulation, or step-off; therefore, we were unable to compare our fracture parameters to those mentioned in studies with more specific surgical indications. We also did not have information regarding pre-existing shoulder dysfunction, which could negatively affect ASES scores. Finally, accurate measures of certain social history factors can be difficult to achieve; smoking, alcohol consumption, and alcohol abuse may be subject to underreporting.
CONCLUSION
We assessed parameters that may affect return of shoulder function after scapular fracture. Our results indicate that both 14A and 14B/C fractures have similarly high rates of healing and minimal functional impairment. Patients treated operatively typically had better shoulder functional outcomes. Current or past tobacco use or alcohol abuse was associated with worse functional outcome scores. This could suggest chemical, social, or a combination of these factors affecting muscular recovery and/or greater levels of baseline functional impairment. Finally, concomitant chest wall injuries may not negatively affect shoulder outcome, contrasting with data from previous studies on the more immediate post-injury period.
1. Dimitroulias A, Molinero KG, Krenk DE, Muffly MT, Altman DT, Altman GT. Outcomes of nonoperatively treated displaced scapular body fractures. Clin Orthop Relat Res. 2011;469(5):1459-1465. doi:10.1007/s11999-010-1670-4.
2. Voleti PB, Namdari S, Mehta S. Fractures of the scapula. Adv Orthop. 2012;2012:903850. doi:10.1155/2012/903850.
3. Cole PA, Gauger EM, Schroder LK. Management of scapular fractures. J Am Acad Orthop Surg. 2012;20(3):130-141. doi:10.5435/JAAOS-20-03-130.
4. Salimi J, Khaji A, Karbakhsh M, Saadat S, Eftekhar B. Scapular fracture: lower severity and mortality. Sao Paulo Med J. 2008;126(3):186-189. doi:10.1590/S1516-31802008000300009.
5. Anavian J, Gauger EM, Schroder LK, Wijdicks CA, Cole PA. Surgical and functional outcomes After operative management of complex and displaced intra-articular glenoid fractures. J Bone Joint Surg Am. 2012;94(7):645-653. doi:10.2106/JBJS.J.00896.
6. Brenneman FD, Redelmeier DA, Boulanger BR, McLellan BA, Culhane JP. Long-term outcomes in blunt trauma: who goes back to work? J Trauma. 1997;42(5):778-781. doi:10.1097/00005373-199705000-00004.
7. Schofer MD, Sehrt AC, Timmesfeld N, Störmer S, Kortmann HR. Fractures of the scapula: long-term results after conservative treatment. Arch Orthop Trauma Surg. 2009;129(11):1511-1519. doi:10.1007/s00402-009-0855-3.
8. Ada JR, Miller ME. Scapular fractures - analysis of 113 cases. Clin Orthop Relat Res. 1991:174-180.
9. Herrera DA, Anavian J, Tarkin IS, Armitage BA, Schroder LK, Cole PA. Delayed operative management of fractures of the scapula. J Bone Joint Surg Br. 2009;91(5):619-626. doi:10.1302/0301-620X.91B5.22158.
10. Jones CB, Sietsema DL. Analysis of operative versus nonoperative treatment of displaced scapular fractures. Clin Orthop Relat Res. 2011;469(12):3379-3389. doi:10.1007/s11999-011-2016-6.
11. Khallaf F, Mikami A, Al-Akkad M. The use of surgery in displaced scapular neck fractures. Med Princ Pract. 2006;15(6):443-448. doi:10.1159/000095491.
12. Adam FF. Surgical treatment of displaced fractures of the glenoid cavity. Int Orthop. 2002;26(3):150-153. doi:10.1007/s00264-002-0342-8.
13. Kavanagh BF, Bradway JK, Cofield RH. Open reduction and internal fixation of displaced intraarticular fractures of the glenoid fossa. J Bone Joint Surg Am. 1993;75(4):479-484.
14. Leung KS, Lam TP, Poon KM. Operative treatment of displaced intra-articular glenoid fractures. Injury. 1993;24(5):324-328. doi:10.1016/0020-1383(93)90056-C.
15. Mayo KA, Benirschke SK, Mast JW. Displaced fractures of the glenoid fossa. Results of open reduction and internal fixation. Clin Orthop Relat Res. 1998:122-130. doi:10.1097/00003086-199802000-00015.
16. Schandelmaier P, Blauth M, Schneider C, Krettek C. Fractures of the glenoid treated by operation. A 5-to 23-year follow-up of 22 cases. J Bone Joint Surg Br. 2002;84(2):173-177. doi:10.1302/0301-620X.84B2.12357.
17. Beaton D, Richards RR. Assessing the reliability and responsiveness of 5 shoulder questionnaires. J Shoulder Elbow Surg. 1998;7(6):565-572. doi:10.1016/S1058-2746(98)90002-7.
18. Michener LA, McClure PW, Sennett BJ. American shoulder and elbow surgeons standardized shoulder assessment form patient self-report section: reliability, validity, and responsiveness. J Shoulder Elbow Surg. 2002;11(6):587-594. doi:10.1067/mse.2002.127096.
19. Marsh JL, Slongo TF, Agel J, et al. Fracture and dislocation classification compendium-2007 - Orthopedic Trauma Association classification. Orthop Trauma. 2007;21:S1-S133.
20. Armstrong CP, Van der Spuy J. The fractured scapula: importance and management based on a series of 62 patients. Injury. 1984;15(5):324-329. doi:10.1016/0020-1383(84)90056-1.
21. McGahan JP, Rab GT, Dublin A. Fractures of the scapula. J Trauma. 1980;20(10):880-883. doi:10.1097/00005373-198010000-00011.
22. Thompson DA, Flynn TC, Miller PW, Fischer RP. The significance of scapular fractures. J Trauma. 1985;25(10):974-977. doi:10.1097/00005373-198510000-00008.
23. Zlowodzki M, Bhandari M, Zelle BA, Kregor PJ, Cole PA. Treatment of scapula fractures: systematic review of 520 fractures in 22 case series. J Orthop Trauma. 2006;20(3):230-233. doi:10.1097/00005131-200603000-00013.
24. Fini M, Giavaresi G, Salamanna F, et al. Harmful lifestyles on orthopedic implantation surgery: a descriptive review on alcohol and tobacco use. J Bone Miner Metab. 2011;29(6):633-644. doi:10.1007/s00774-011-0309-1.
25. Donigan JA, Fredericks DC, Nepola JV, Smucker JD. The effect of transdermal nicotine on fracture healing in a rabbit model. J Orthop Trauma. 2012;26(12):724-727. doi:10.1097/BOT.0b013e318270466f.
26. Harvey EJ, Agel J, Selznick HS, Chapman JR, Henley MB. Deleterious effect of smoking on healing of open tibia-shaft fractures. Am J Orthop. 2002;31(9):518-521.
27. Hernigou J, Schuind F. Smoking as a predictor of negative outcome in diaphyseal fracture healing. Int Orthop. 2013;37(5):883-887. doi:10.1007/s00264-013-1809-5.
28. Hoogendoorn JM, van der Werken C. The adverse effects of smoking on healing of open tibial fractures. Ned Tijdschr Geneeskd. 2002;146(35):1640-1644.
29. Kyrö A, Usenius JP, Aarnio M, Kunnamo I, Avikainen V. Are smokers a risk group for delayed healing of tibial shaft fractures? Ann Chir Gynaecol. 1993;82(4):254-262.
30. Farley JR, Fitzsimmons R, Taylor AK, Jorch UM, Lau KH. Direct effects of ethanol on bone resorption and formation in vitro. Arch Biochem Biophys. 1985;238(1):305-314. doi:10.1016/0003-9861(85)90169-9.
31. Turner RT. Skeletal response to alcohol. Alcoholism Clin Exp Res. 2000;24(11):1693-1701. doi:10.1111/j.1530-0277.2000.tb01971.x.
32. MacKenzie EJ, Morris JA, Jurkovich GJ, et al. Return to work following injury: the role of economic, social, and job-related factors. Am J Public Health. 1998;88(11):1630-1637. doi:10.2105/AJPH.88.11.1630.
33. Schnyder U, Moergeli H, Klaghofer R, Sensky T, Buchi S. Does patient cognition predict time off from work after life-threatening accidents? Am J Psychiatry. 2003;160(11):2025-2031. doi:10.1176/appi.ajp.160.11.2025.
34. Soberg HL, Finset A, Bautz-Holter E, Sandvik L, Roise O. Return to work after severe multiple injuries: A multidimensional approach on status 1 and 2 years postinjury. J Trauma. 2007;62(2):471-481. doi:10.1097/TA.0b013e31802e95f4.
35. Soberg HL, Roise O, Bautz-Holter E, Finset A. Returning to work after severe multiple injuries: multidimensional functioning and the trajectory from injury to work at 5 years. J Trauma. 2011;71(2):425-434. doi:10.1097/TA.0b013e3181eff54f.
ABSTRACT
The injury parameters and patient characteristics that affect function after scapular fracture are poorly defined. We performed a retrospective review of 594 adult patients with a minimum 12-month follow-up after scapular fracture. Functional outcomes were prospectively assessed using the American Shoulder and Elbow Surgeons (ASES) survey in 153 patients after a mean of 62 months of follow-up. The population was 78% male, and 88% had injuries caused by a high-energy event. Only 4.6% had injuries isolated to the scapula. All fractures healed primarily and the mean ASES score was 79.3, indicating minimal functional impairment. However, 7 patients (4.6%) reported severe functional deficits. Fifteen patients (9.8%) underwent open reduction and internal fixation. These patients had a better mean ASES score than those who were treated nonoperatively (92.1 vs 77.9, P = .03). When fracture types were analyzed individually, there was an advantage to surgery in fractures involving the glenoid (96.0 vs 75.7, P < .05). Concomitant chest wall injury or the presence of adjacent fractures did not affect functional outcomes. Smokers had a worse mean score (73.3 vs 84.5, P = .01), as did patients with a history of alcohol abuse (70.3 vs 83.9, P < .05). In conclusion, mean ASES scores indicated good function overall. Patients with a history of tobacco use or alcohol abuse had worse outcome scores.
Continue to: Scapular fractures occur frequently due to high-energy trauma...
Scapular fractures occur frequently due to high-energy trauma, with concomitant injuries seen in approximately 90% of cases.1-4 As a result, treatment is often surrounded by other difficult medical decisions, and factors affecting outcomes can be multifaceted. The gaps in our understanding of long-term outcomes with current treatment modalities have recently come to light, especially when it comes to determining indications for surgery.
Specifically, there is very little literature on radiographic healing and long-term shoulder function in larger samples of scapular fractures; additionally, there is evidence that some patients do not experience full functional recovery.3,5-7 Studies assessing return of function in patients treated nonoperatively have shown decreased mobility and persistence of pain.7 Some of these findings could be due to variability in surgical indications.2,4 While the majority of fractures are treated nonoperatively, the decision to operate has recently been one of debate. Prior literature has suggested highly variable measurements of angulation and extra-articular displacement at which surgery is recommended.1 For example, indications for surgery measured by the medial displacement of extra-articular fractures range from >10 mm to >20 mm;8-11 similarly, the displacement of intra-articular fractures meriting surgery ranges from >2 mm to >5 mm, depending on the author.12-16
The current debate over surgical indications for less severe scapular fractures, as well as the potential for chronic pain and stiffness calls for a thorough examination of factors affecting functional outcomes. The purpose of this study is to determine which patient factors, fracture patterns, and treatment modalities were associated with differences in healing and return of shoulder function. We hypothesized that certain aspects of the patient’s social history (tobacco, alcohol) as well as concomitant chest wall injuries may be associated with poor outcome scores and lower levels of function. We further hypothesized that glenoid fractures would affect function more than body fractures, and we did not expect to see a significant difference in outcomes between operative and nonoperative treatment.
MATERIALS AND METHODS
This study was approved by the Institutional Review Board. A registry at our level 1 trauma center was queried to identify 663 skeletally mature patients with scapular fractures between 1999 and 2011. Forty-eight patients had died prior to the study, and 21 patients had insufficient radiography and/or clinical follow-up (Figure 1). To be included, patients were required to have at least 1 year of follow-up to assess healing. Data on patient demographics, fracture classification, etiology of injury, concomitant injuries (clavicle fractures, rib fractures, pulmonary injuries), comorbidities, alcohol use, and tobacco use were collected retrospectively for the remaining 594 patients. Patients were then prospectively contacted via telephone and mail, employing 3 Internet search engines as needed, in an attempt to obtain current contact information. Three patients declined to participate, and 438 were not reachable after multiple attempts. Outcome scores for the remaining 153 patients were determined with the Modified American Shoulder and Elbow Surgeons (ASES) Shoulder Form.17 Scores were measured out of 100, with 0 to 30 representing maximally impaired, 31 to 60 representing moderately impaired, and 61 to 100 representing minimally impaired shoulder function.18 Due to the retrospective identification of the patients, no pre-injury shoulder function scores were collected. Given that many patients were unreachable, or reachable but not living in close proximity to the hospital, patients did not routinely return for re-evaluation for this study.
Nonoperative management consisted of sling immobilization for comfort for up to 2 weeks, during which time Codman’s exercises and elbow, forearm, wrist, and hand motion were encouraged. Active and passive shoulder mobility without restriction were also recommended progressively as tolerated. Strengthening and unrestricted lifting activities were allowed after approximately 8 to 10 weeks following the injury. Decision for surgery was at the surgeon’s discretion. Surgical indications included articular displacement and severely displaced glenoid neck fractures. Open reduction and internal fixation was performed by 1 of 4 fellowship-trained surgeons. Concomitant surgical procedures were not undertaken in the same setting. Postoperative activity consisted of sling immobilization for comfort for up to 6 weeks, during which time active and passive shoulder mobility without restriction were also recommended progressively as tolerated. Strengthening and unrestricted lifting activities were allowed after approximately 12 weeks following surgery. We considered fractures as healed if either X-rays showed healing progression to complete union or early X-rays showing signs of healing with subsequent follow-up visits indicating clinical healing (absence of pain, absence of shoulder dysfunction).
Continue to: STATISTICAL ANALYSIS...
STATISTICAL ANALYSIS
Statistical analysis was undertaken with GraphPad software. Associations were tested between positive predictive variables and functional outcomes. Variables included gender, mechanism, fracture classification, patient comorbidities, social factors, associated injuries, and type of treatment. A Mann-Whitney rank test was used to test for associations between nonparametric variables, including patient age. In all cases, P < .05 was considered significant.
RESULTS
Complete clinical and radiographic data were available for 594 patients. This included 462 men and 132 women, with a mean age of 42.8 years (range, 15-92 years). Twenty-four patients (4.0%) sustained bilateral fractures, and 31 fractures (5.0%) were open. All fractures healed primarily. A total of 153 patients completed the ASES questionnaire at a mean of 62 months after injury (Table 1). This group was similar to the entire population with respect to age, gender, and type of treatment. In all, 135 patients had been injured by a high-energy mechanism (88%), and the fracture pattern as per the Arbeitsgemeinschaft für Osteosynthesefragen/Orthopaedic Trauma Association (AO/OTA) classification consisted of 14A (no glenoid involvement) (n = 139; 91%) and 14B/C (glenoid involvement) (n = 14; 9.2%).19 The mean ASES score for our entire sample was 79.3 (minimally functionally impaired). In all, 117 patients (76%) reported minimal functional deficit (ASES, 61-100), 29 (19%) reported moderate functional deficit (ASES, 31-60), and only 7 (4.6%) reported maximum functional deficit (ASES, 0-30). Gender and age were not associated with functional outcome scores.
Table 1. Patient Demographics and Etiology of Scapula Fractures.
| n |
Gender |
|
Men | 119 (77.8%) |
Women | 34 (22.2%) |
Mechanism |
|
Motorcycle crash | 48 (31.4%) |
Motor vehicle collision | 38 (24.8%) |
Fall from stand | 14 (9.2%) |
Fall from height | 13 (8.5%) |
Pedestrian vs vehicle | 11 (7.2%) |
Crush | 7 (4.5%) |
Gunshot | 5 (3.3%) |
Other | 17 (11.1%) |
Fracture Pattern |
|
14A | 139 (88.2%) |
14B/C | 14 (11.8%) |
Fifteen patients (9.8%) were treated surgically. They had a higher mean ASES score vs non-surgically treated patients (92.1 vs 77.9; P = .03) (Table 2). However, when patients were divided into 14A and 14B/C fracture patterns, there was only a significant advantage in outcome scores for operative vs nonoperative care in the 14B/C classification (96.0 vs 75.7; P < .05); meanwhile, surgery for scapular body fractures (14A) was not associated with better outcome scores (90.2 vs 78.3; P = .14). Unfortunately, assessment of these comparisons within classification groups resulted in underpowered analyses for these small groups.
Table 2. Number of ASES Surveys Completed and Mean ASES Score for Each Treatment Type and Fracture Classification
| n | Mean ASES | Standard Error |
Surgical (total) | 15 | 92.1a | 3.5 |
Surgical 14A | 10 | 90.2 | 4.9 |
Surgical 14B/C | 5 | 96.0a | 3.2 |
Non-surgical (total) | 138 | 77.9a | 2.1 |
Nonsurgical. 14A | 129 | 78.3 | 2.2 |
Nonsurgical 14B/C | 9 | 75.7a | 6.5 |
aP < 0.05.
Abbreviation: ASES, American Shoulder and Elbow Surgeons.
Table 3 shows the ASES scores for patients with various types of associated chest and shoulder injuries. Only 7 patients (4.6%) had injuries isolated to the scapula. Thirty-three patients (22%) had associated clavicle fractures, and 102 patients (67%) sustained concomitant chest wall injuries, including rib fractures (n = 88) and pulmonary injuries (n = 71). Patients with associated chest wall injuries did not have worse mean ASES scores than those without chest wall injuries (80.9 vs 78.2; P = .49). Additionally, patients who had concomitant clavicle fractures did not report worse scores than those who did not (83.2 vs 78.6; P = .46).
Table 3. Concomitant Injuries and Mean American Shoulder and Elbow Surgeons (ASES) Scores
| n | Mean ASES | Standard Error |
Clavicle fracture | 33 (21.6%) | 83.2 | 3.6 |
No clavicle fracture | 120 (78.4%) | 78.6 | 2.2 |
Chest wall injury | 102 (66.7%) | 80.9 | 2.1 |
Rib fracture | 31 (20.3%) | 82.4 | 3.6 |
Lung Injury | 14 (9.2%) | 80.8 | 5.5 |
Rib Fracture + Lung Injury | 57 (37.3%) | 80.2 | 3.0 |
No chest wall injury | 51 (33.3%) | 78.2 | 3.8 |
Isolated scapula fracture | 7 (4.6%) | 92.4 | 6.5 |
The majority of patients were self-reported smokers (54%) and alcohol drinkers (64%) (Table 4). Aspects of social history were associated with differences in functional outcome scores. Non-smokers had a higher mean ASES score than both current smokers (84.5 vs 72.8; P = .02) and patients with any lifetime history of smoking (84.5 vs 73.3; P = .01) (Figure 2). There was no significant difference in shoulder function scores between patients identified as non-drinkers and those who reported consuming alcohol at moderate levels (83.9 vs 78.9; P = .26); however, patients who had a documented history of alcohol abuse had lower mean ASES scores than those who reported being non-drinkers (70.3 vs 83.9; P < .05).
Table 4. Substance Use and Functional Outcome Scores
| n | Mean ASES | Standard Error |
Non-smoker | 57 (46.3%) | 84.5a | 2.9 |
History of smoking | 66 (53.7%) | 73.3a | 3.0 |
Smoker | 45 (36.6%) | 72.8a | 3.8 |
Former | 21 (17.1%) | 74.6 | 5.1 |
No alcohol consumption | 46 (36.2%) | 83.9a | 3.1 |
Moderate alcohol use | 65 (51.2%) | 78.9 | 2.9 |
Alcohol abuse | 16 (12.6%) | 70.3a | 7.3 |
aP < 0.05.
Continue to: DISCUSSION...
DISCUSSION
Patients with scapular fractures often require a complex set of treatment decisions due to high rates of concomitant injuries.2,20-22 A lack of large studies on long-term scapular function, as well as evidence that some patients treated conservatively for scapular fractures experience functional deficit and pain, inspired us to investigate the recovery process after scapular fractures through radiographs and the ASES survey.7 Further, we attempted to identify any factors that may be associated with poor functional results. Our review of long-term outcomes after scapular fractures demonstrates that they not only heal well but also have a good functional outcome in most cases. Over 95% had acceptable ASES scores, with both 14A and 14B/C having similar return of function. While both operatively and nonoperatively treated patients had scores indicating minimal functional impairment, those treated surgically had better scores overall. Surprisingly, concomitant injuries, including chest wall injuries, did not portend a worse shoulder outcome in our patients. The factors that were associated with worse outcome were tobacco use and alcohol abuse.
Beyond these findings, we attempted to comment on surgical indications, which have been highly debated.2,3 For example, the medial displacement at which studies suggest extra-articular fractures merit surgery ranges from >10 mm to >20 mm;8-11 similarly, the indication for surgery based on displacement of intra-articular fractures ranges from >2 mm to >5 mm, depending on the author.12-16 Glenoid articular fractures or neck fractures are other potential indications for operative treatment. In fact, a review of 520 scapular fractures from multiple studies found that 80% of those with glenoid involvement were treated operatively, while only 52% of those with exclusive acromion and/or coracoid involvement, and 1% of those with exclusive scapular body involvement were treated operatively.5 Some reports indicate that 14B/C fractures, especially those that are displaced or complex, show good functional outcomes and low complication rates after fixation.5,23 In this study, articular fractures of the glenoid were treated operatively more often than extra-articular fractures. We attempted to determine the impact of surgical care on functional outcomes according to fracture type, but we were limited by the small number of surgical patients when reviewing the 14A and 14B/C groups. As a whole, surgical patients had better outcomes than non-surgical patients. We believe this difference is clinically relevant and suggests a potential group of patients who may benefit from fixation. Further investigation is needed to better characterize these injuries and to develop specific recommendations.
This study yielded interesting results related to substance abuse. It has previously been shown that tobacco smoking and alcohol abuse have both been associated with poor bone health.24 Studies have suggested that exposure to nicotine and other chemical components in cigarettes can lead to delayed healing, higher rates of nonunion, and decreased mechanical strength of bone.25-29 Additionally, alcohol abuse has been associated with decreased bone mass and poor bone formation.24,30,31 Although we did not measure bone density or quantitate time of healing, this study provides added insight in that the healed fractures of smokers and patients with a history of alcohol abuse showed lower levels of shoulder function, as measured by ASES scores after similar initial injuries and similar follow-up periods. These results suggest that chemical, social, or a combination of these factors affect muscular recovery, other aspects of post-fracture recovery, and/or levels of baseline physical or mental impairment beyond those detailed in previous studies of bone health and substance abuse. For example, return to work was a scored category in the ASES survey that we used to asses the return of shoulder function, and several studies have shown that factors such as education level, coping abilities, and baseline functioning (cognitive, social, and physical) all have a significant impact on rates of return to work, independently of injury type.6,32-35 It is possible, then, that other aspects of the ASES survey are affected by factors that may be more prevalent in populations engaging in substance abuse. From both perspectives, these data highlight the importance of addressing tobacco use and alcohol abuse as a part of caring for all trauma patients, including those with scapular fractures, regardless of their high rates of radiographic healing. They also provide insight for prognosticating and setting patient expectations after scapular fractures.
Continue to: This study addressed the relationship between...
This study addressed the relationship between concomitant chest wall injuries and recovery of shoulder function after scapular fracture. Previous studies have suggested that concomitant chest wall injuries, such as rib fractures, cause more pain and may adversely impact the return of function in patients who have sustained scapular body fractures.1 These results, however, occurred in the setting of a much shorter follow-up, in which Disability of Arm, Shoulder, and Hand (DASH) surveys were distributed 6 months post-injury, 12 months post-injury, and once at last follow-up (<3 years). At our significantly later average follow-up, chest wall injuries did not portend a worse return of shoulder function, in contrast to our hypothesis. Our lack of findings of a worse return of function in patients with chest wall injuries, in light of previous literature, suggests that this association could become less distinct as the initial injury becomes more remote and has had more time to heal. Farther out from injury, patients seem to function similarly, regardless of chest wall injury history.
This study was limited by several factors. First, the surgically treated group was considerably smaller than the nonoperative group, which made drawing statistically significant comparisons between them challenging. Although there were no apparent differences between the group who completed ASES surveys and those who did not, only collecting ASES data on 153 of the 663 patients introduces a possible selection bias in this analysis. Additionally, due to the retrospective nature of this study, we were not able to ascertain the specific surgical indications used by individual surgeons. Again, the nature of this study also made it implausible to separate fractures beyond the simple 14A vs 14B/C classification. For example, we did not routinely have access to computed tomography scans to provide exact measurements of displacement, angulation, or step-off; therefore, we were unable to compare our fracture parameters to those mentioned in studies with more specific surgical indications. We also did not have information regarding pre-existing shoulder dysfunction, which could negatively affect ASES scores. Finally, accurate measures of certain social history factors can be difficult to achieve; smoking, alcohol consumption, and alcohol abuse may be subject to underreporting.
CONCLUSION
We assessed parameters that may affect return of shoulder function after scapular fracture. Our results indicate that both 14A and 14B/C fractures have similarly high rates of healing and minimal functional impairment. Patients treated operatively typically had better shoulder functional outcomes. Current or past tobacco use or alcohol abuse was associated with worse functional outcome scores. This could suggest chemical, social, or a combination of these factors affecting muscular recovery and/or greater levels of baseline functional impairment. Finally, concomitant chest wall injuries may not negatively affect shoulder outcome, contrasting with data from previous studies on the more immediate post-injury period.
1. Dimitroulias A, Molinero KG, Krenk DE, Muffly MT, Altman DT, Altman GT. Outcomes of nonoperatively treated displaced scapular body fractures. Clin Orthop Relat Res. 2011;469(5):1459-1465. doi:10.1007/s11999-010-1670-4.
2. Voleti PB, Namdari S, Mehta S. Fractures of the scapula. Adv Orthop. 2012;2012:903850. doi:10.1155/2012/903850.
3. Cole PA, Gauger EM, Schroder LK. Management of scapular fractures. J Am Acad Orthop Surg. 2012;20(3):130-141. doi:10.5435/JAAOS-20-03-130.
4. Salimi J, Khaji A, Karbakhsh M, Saadat S, Eftekhar B. Scapular fracture: lower severity and mortality. Sao Paulo Med J. 2008;126(3):186-189. doi:10.1590/S1516-31802008000300009.
5. Anavian J, Gauger EM, Schroder LK, Wijdicks CA, Cole PA. Surgical and functional outcomes After operative management of complex and displaced intra-articular glenoid fractures. J Bone Joint Surg Am. 2012;94(7):645-653. doi:10.2106/JBJS.J.00896.
6. Brenneman FD, Redelmeier DA, Boulanger BR, McLellan BA, Culhane JP. Long-term outcomes in blunt trauma: who goes back to work? J Trauma. 1997;42(5):778-781. doi:10.1097/00005373-199705000-00004.
7. Schofer MD, Sehrt AC, Timmesfeld N, Störmer S, Kortmann HR. Fractures of the scapula: long-term results after conservative treatment. Arch Orthop Trauma Surg. 2009;129(11):1511-1519. doi:10.1007/s00402-009-0855-3.
8. Ada JR, Miller ME. Scapular fractures - analysis of 113 cases. Clin Orthop Relat Res. 1991:174-180.
9. Herrera DA, Anavian J, Tarkin IS, Armitage BA, Schroder LK, Cole PA. Delayed operative management of fractures of the scapula. J Bone Joint Surg Br. 2009;91(5):619-626. doi:10.1302/0301-620X.91B5.22158.
10. Jones CB, Sietsema DL. Analysis of operative versus nonoperative treatment of displaced scapular fractures. Clin Orthop Relat Res. 2011;469(12):3379-3389. doi:10.1007/s11999-011-2016-6.
11. Khallaf F, Mikami A, Al-Akkad M. The use of surgery in displaced scapular neck fractures. Med Princ Pract. 2006;15(6):443-448. doi:10.1159/000095491.
12. Adam FF. Surgical treatment of displaced fractures of the glenoid cavity. Int Orthop. 2002;26(3):150-153. doi:10.1007/s00264-002-0342-8.
13. Kavanagh BF, Bradway JK, Cofield RH. Open reduction and internal fixation of displaced intraarticular fractures of the glenoid fossa. J Bone Joint Surg Am. 1993;75(4):479-484.
14. Leung KS, Lam TP, Poon KM. Operative treatment of displaced intra-articular glenoid fractures. Injury. 1993;24(5):324-328. doi:10.1016/0020-1383(93)90056-C.
15. Mayo KA, Benirschke SK, Mast JW. Displaced fractures of the glenoid fossa. Results of open reduction and internal fixation. Clin Orthop Relat Res. 1998:122-130. doi:10.1097/00003086-199802000-00015.
16. Schandelmaier P, Blauth M, Schneider C, Krettek C. Fractures of the glenoid treated by operation. A 5-to 23-year follow-up of 22 cases. J Bone Joint Surg Br. 2002;84(2):173-177. doi:10.1302/0301-620X.84B2.12357.
17. Beaton D, Richards RR. Assessing the reliability and responsiveness of 5 shoulder questionnaires. J Shoulder Elbow Surg. 1998;7(6):565-572. doi:10.1016/S1058-2746(98)90002-7.
18. Michener LA, McClure PW, Sennett BJ. American shoulder and elbow surgeons standardized shoulder assessment form patient self-report section: reliability, validity, and responsiveness. J Shoulder Elbow Surg. 2002;11(6):587-594. doi:10.1067/mse.2002.127096.
19. Marsh JL, Slongo TF, Agel J, et al. Fracture and dislocation classification compendium-2007 - Orthopedic Trauma Association classification. Orthop Trauma. 2007;21:S1-S133.
20. Armstrong CP, Van der Spuy J. The fractured scapula: importance and management based on a series of 62 patients. Injury. 1984;15(5):324-329. doi:10.1016/0020-1383(84)90056-1.
21. McGahan JP, Rab GT, Dublin A. Fractures of the scapula. J Trauma. 1980;20(10):880-883. doi:10.1097/00005373-198010000-00011.
22. Thompson DA, Flynn TC, Miller PW, Fischer RP. The significance of scapular fractures. J Trauma. 1985;25(10):974-977. doi:10.1097/00005373-198510000-00008.
23. Zlowodzki M, Bhandari M, Zelle BA, Kregor PJ, Cole PA. Treatment of scapula fractures: systematic review of 520 fractures in 22 case series. J Orthop Trauma. 2006;20(3):230-233. doi:10.1097/00005131-200603000-00013.
24. Fini M, Giavaresi G, Salamanna F, et al. Harmful lifestyles on orthopedic implantation surgery: a descriptive review on alcohol and tobacco use. J Bone Miner Metab. 2011;29(6):633-644. doi:10.1007/s00774-011-0309-1.
25. Donigan JA, Fredericks DC, Nepola JV, Smucker JD. The effect of transdermal nicotine on fracture healing in a rabbit model. J Orthop Trauma. 2012;26(12):724-727. doi:10.1097/BOT.0b013e318270466f.
26. Harvey EJ, Agel J, Selznick HS, Chapman JR, Henley MB. Deleterious effect of smoking on healing of open tibia-shaft fractures. Am J Orthop. 2002;31(9):518-521.
27. Hernigou J, Schuind F. Smoking as a predictor of negative outcome in diaphyseal fracture healing. Int Orthop. 2013;37(5):883-887. doi:10.1007/s00264-013-1809-5.
28. Hoogendoorn JM, van der Werken C. The adverse effects of smoking on healing of open tibial fractures. Ned Tijdschr Geneeskd. 2002;146(35):1640-1644.
29. Kyrö A, Usenius JP, Aarnio M, Kunnamo I, Avikainen V. Are smokers a risk group for delayed healing of tibial shaft fractures? Ann Chir Gynaecol. 1993;82(4):254-262.
30. Farley JR, Fitzsimmons R, Taylor AK, Jorch UM, Lau KH. Direct effects of ethanol on bone resorption and formation in vitro. Arch Biochem Biophys. 1985;238(1):305-314. doi:10.1016/0003-9861(85)90169-9.
31. Turner RT. Skeletal response to alcohol. Alcoholism Clin Exp Res. 2000;24(11):1693-1701. doi:10.1111/j.1530-0277.2000.tb01971.x.
32. MacKenzie EJ, Morris JA, Jurkovich GJ, et al. Return to work following injury: the role of economic, social, and job-related factors. Am J Public Health. 1998;88(11):1630-1637. doi:10.2105/AJPH.88.11.1630.
33. Schnyder U, Moergeli H, Klaghofer R, Sensky T, Buchi S. Does patient cognition predict time off from work after life-threatening accidents? Am J Psychiatry. 2003;160(11):2025-2031. doi:10.1176/appi.ajp.160.11.2025.
34. Soberg HL, Finset A, Bautz-Holter E, Sandvik L, Roise O. Return to work after severe multiple injuries: A multidimensional approach on status 1 and 2 years postinjury. J Trauma. 2007;62(2):471-481. doi:10.1097/TA.0b013e31802e95f4.
35. Soberg HL, Roise O, Bautz-Holter E, Finset A. Returning to work after severe multiple injuries: multidimensional functioning and the trajectory from injury to work at 5 years. J Trauma. 2011;71(2):425-434. doi:10.1097/TA.0b013e3181eff54f.
TAKE-HOME POINTS
- The majority of patients with scapula fractures are multiply-injured.
- Despite being multiply-injured, most heal with minimal functional shoulder impairment.
- While concomitant injuries do not appear to affect shoulder function scores, tobacco use and alcohol abuse are associated with worse outcomes after scapula fractures.
- Most scapula fractures can be treated successfully without surgery.
- Although patients had higher average function scores after open reduction and internal fixation, further research should be done to define indications for fixation.
Epidemiology of Existing Extensor Mechanism Pathology in Primary Anterior Cruciate Ligament Ruptures in an Active-Duty Population
ABSTRACT
The purpose of this study is to determine the prevalence of potential graft-influencing pathologies of the extensor mechanism of the knee in patients presenting with a primary anterior cruciate ligament (ACL) rupture.
We performed a retrospective review of the plain radiographs and magnetic resonance imaging (MRI) of all active-duty patients presenting with a primary ACL rupture at our institution between July 2006 and February 2009. Imaging was reviewed to determine the presence of a multipartite patella, unresolved Osgood-Schlatter’s disease, and/or radiographic evidence suggestive of patella tendinopathy.
A total of 197 patients were reviewed, including 27 females and 170 males. One patient (0.5%) had a bipartite patella and 4 patients (2%) had free-floating ossicles about the tibial tuberosity consistent with unresolved Osgood-Schlatter’s disease. A total of 15 patients (7.6%) showed MRI evidence suggestive of patella tendinopathy.
This study revealed 20 patients out of 197 (10.1%) who presented with existing extensor mechanism pathologies in radiologic studies. While preoperative imaging is routinely used to confirm clinical suspicion of ACL rupture or identify associated injuries, this study shows that it can also identify existing extensor mechanism pathologies that could ultimately influence the use of an extensor mechanism graft.
Continue to: Anterior cruciate ligament (ACL) reconstruction...
Anterior cruciate ligament (ACL) reconstruction is an extremely common procedure; in fact, an estimated 60,000 to 175,000 ACL reconstructions are performed annually in the United States.1,2 One of the most widely debated aspects of ACL reconstruction is the choice of graft. Grafts are broadly categorized into allografts and autografts. The autograft selections for ACL reconstruction include patellar bone-tendon-bone (pBTB), combined semitendinosus and gracilis hamstrings (HS), free quadriceps tendon (QT)without accompanying bone block, and quadriceps tendon-bone (qTB). Allograft choices predominantly include pBTB and HS, as well as the tibialis anterior and Achilles tendons. The pBTB autograft is traditionally considered the reference standard for ACL reconstruction.3 Recent advances in allograft processing, along with improved fixation techniques and devices, have improved results following the use of soft-tissue autografts and both bony and soft tissue allografts.4 Thus, the optimal graft choice for ACL reconstruction has become controversial in light of several studies demonstrating no significant, long-term difference in clinical and/or functional outcomes based on graft selection.5-7
Given the lack of a clear gold standard in graft selection, multiple patient factors, such as age, activity demands, and patient preference, should be taken into account when considering the choice of graft. In addition, intrinsic factors that could potentially weaken an autograft should be considered. Several extensor mechanism pathological findings that are easily visualized on either plain radiographs or magnetic resonance imaging (MRI) could potentially affect graft selection. Findings such as a multipartite patella, free ossicles about the tibial tuberosity consistent with Osgood-Schlatter’s disease, and proximal patella tendon thickening suggestive of patellar tendinopathy are easily identifiable on preoperative imaging and could exert adverse effects on pBTB, QT, and qTB autografts. The purpose of this study is to identify the prevalence of these pre-existing conditions in active-duty military patients presenting with acute ACL tears.
METHODS
A retrospective review was conducted on all active-duty patients who underwent primary ACL reconstruction at our institution from July 2006 to February 2009. A systematic review of all plain radiographs and MRIs was performed on a calibrated picture archiving and communication system workstation. Imaging review was conducted by 2 of the authors. Pertinent findings included a multipartite patella, free ossicles within the patella tendon, and hypertrophy of the proximal aspect of the patella tendon. Assessment for multipartite patella and unresolved Osgood-Schlatter's disease was made using plain radiographs with MRI for confirmation. Measurements of the patella tendon were performed on the short tau inversion recovery and T2-weighted sagittal MRI images at the point of maximal tendon width. A width of ≥7 mm was considered suggestive of patella tendinopathy based on prior studies.8-10 The prevalence of each finding was then determined based on the total number of patients.
Continue to: RESULTS...
RESULTS
A total of 197 active-duty patients, including 27 females (13.7%) and 170 males (86.3%), underwent primary ACL reconstruction during the study time period. A total of 93 right knees and 104 left knees were evaluated. The average age at presentation was 29 years (range, 19-45 years).
Of the 197 patients, only 1 was found to have a multipartite patella (prevalence, 0.5%). This 37-year-old male patient showed a right bipartite patella located in the superior-lateral aspect (Figure 1).
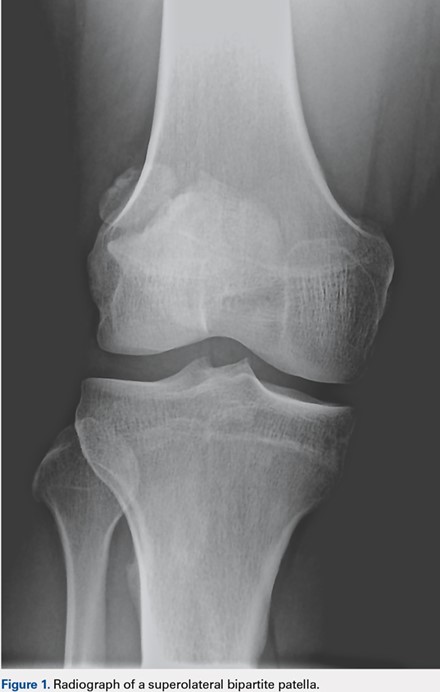
Four patients had free ossicles within the inferior patellar tendon consistent with unresolved Osgood-Schlatter’s disease (prevalence, 2.0%) (Figure 2). All 4 patients were male, which is consistent with the higher incidence of Osgood-Schlatter’s disease in males than in females. The average age of these patients was 27.5 years (range, 22-33 years).
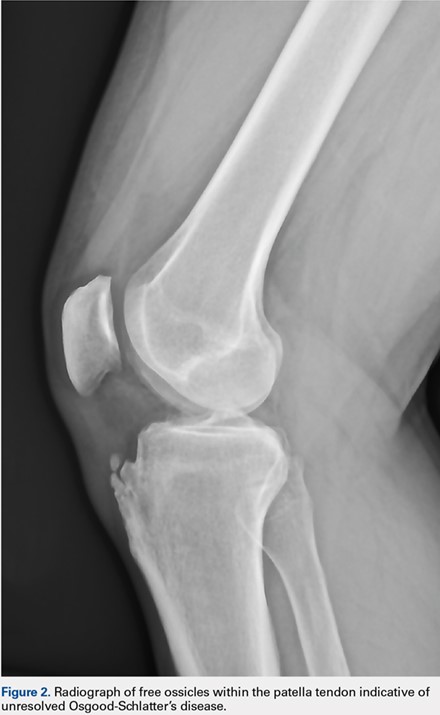
The most common extensor mechanism pathology present on preoperative imaging was proximal patella tendon thickening suggestive of patella tendinopathy. Thickening of the proximal portion of the patellar tendon was present in 15 of the 197 MRIs (prevalence, 7.6%) (Figure 3). The average width of this thickening was 8.49 mm (7.17-10.17 mm), and the average age of patients with radiographic evidence of patellar tendinopathy was 29.9 years (range, 20-43 years). Gender distribution was predominantly male (14 males, 1 female). Details of all extensor mechanism pathologies found are provided in the Table.
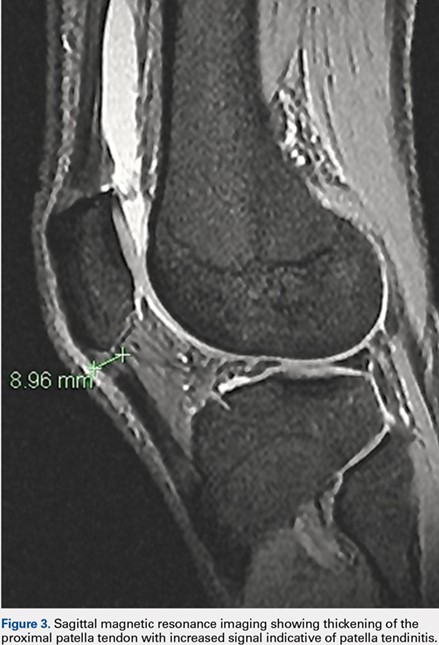
Table. Identified Extensor Mechanism Pathology
| Male | Female | Total |
Patients | 170 | 27 | 197 |
Multipartite Patella | 1 | 0 | 1 |
Osgood-Schlatter’s Disease | 4 | 0 | 4 |
Patella Tendinopathy | 14 | 1 | 15 |
|
| 20/97 (10.10%) |
|
DISCUSSION
When considering ACL reconstruction, determination of the graft type is one of the most important decisions to be made, perhaps second only to the decision to perform the surgery itself. Recent multiple, well-designed studies comparing differences among grafts have shown equivalent long-term results, leading to the lack of a universally accepted gold standard.5-7 Thus, both autograft and allograft ACL surgeries are routinely performed in the United States. Surgeons typically take into account factors such as patient age and physical demands, along with their own preferences and/or experience, when considering graft selection. A paucity of research concerning existing pathological conditions that could also influence preoperative decision-making has been observed; most reports consist only of expert opinion.11-13 Our goal is to determine the prevalence of several conditions that could potentially affect an autograft harvested from the extensor mechanism.
This study revealed an overall prevalence of 10.1% of existing extensor mechanism pathology in patients sustaining an acute ACL tear and presenting for ACL reconstruction. Only 1 (0.5%) showed evidence of a multipartite patella, which is below the reported prevalence of 0.2% to 6%.14 The presence of a multipartite patella could potentially have the most deleterious effect on a qTB autograft. Although not as commonly used as HS, QT, or pBTB autografts, some surgeons prefer a qTB autograft because of its increased surface area, bony fixation, and reported decreased donor site pain.15 A multipartite patella could complicate harvesting, disrupt the bone block, or lead to an unstable segment of the patella. These effects are of great concern since the most common location of a bipartite patella is superior-lateral and the quadriceps tendon has been shown to asymmetrically insert laterally.16 While these potential adverse effects have not been specifically studied, the availability of comparable options makes the use of a qTB autograft in the setting of a bipartite patella questionable.
Four patients (2%) revealed evidence of ossicles within the inferior patellar tendon consistent with unresolved Osgood-Schlatter’s disease. Osgood-Schlatter’s disease has been reported to occur in up to 21% of active adolescents and is historically considered a self-resolving process.17 Recent papers have reported persistent symptoms in up to 10% of patients, with a small percentage experiencing persistent free ossicles within their patella tendon on MRI.18,19 The presence of such ossicles raises concern about the integrity of the patellar tendon and questions its use as an autograft when present. This concern was published in a report with the surgeon opting to utilize an alternate graft due to the presence of unresolved Osgood-Schlatter’s disease.13
Fifteen patients (7.6%) demonstrated radiographic evidence suggestive of patella tendinopathy based on the thickness of the proximal patella tendon. Patella tendinopathy is the most common tendinopathy in skeletally mature athletes and one of the most common athletic injuries of the knee, with a reported career prevalence of 22%.20 It is described as an overuse injury due to the cumulative effect of micro trauma without an adequate healing interval. While it remains a clinical diagnosis, patellar tendinopathy often shows radiographic findings best assessed on sagittal MRIs. In general, the normal patella tendon appears as a homogenous low-intensity structure and is of uniform thickness. A tendon affected with tendinopathy typically demonstrates a focal increase in signal on T2-weighted sequences just distal to the tendon origin on the inferior pole of the patella. In addition, the patella tendon will usually demonstrate thickening, primarily in the proximal medial and posterior fibers. Patella marrow changes and indistinct tendon margins can also be present. The sensitivity and specificity of diagnosing patellar tendinopathy on MRI are 78% and 86%, respectively.20 We derived our criteria for MRI evidence suggestive of patella tendinopathy from studies by El-Khoury and colleagues,8 Johnson and colleagues,9 and Popp and colleagues.10 In a 1992 study, El-Khoury and colleagues8 compared MRI findings between a group of patients with a clinical diagnosis of patella tendonitis and a control group without knee complaints. The authors found that the average proximal patella tendon diameter in the control group was 3.7 mm while the average proximal patella tendon diameter in the patella tendinopathy group was 10.9 mm; no patella tendons in the control group were >7 mm.8 In a 1996 study, Johnson and colleagues9 determined that the most reliable MRI finding for patients with patellar tendonitis is significant thickening of the proximal patella tendon seen on the sagittal view. The average thickness in symptomatic patients was 8.5 mm (range, 5-15 mm). The average thickness in the control group was 5.5 mm. None of the control patients had a proximal tendon thickness >7 mm.9 Finally, Popp and colleagues10 reviewed the MRI of 11 knees of patients who underwent surgical débridement of chronic patellar tendonitis and reported an average proximal patella tendon thickness of 12 mm (range, 9-16 mm). We therefore used a proximal patella tendon thickness of >7 mm on the sagittal view as a radiographic finding suggestive of patella tendinopathy. No data regarding symptoms of anterior knee pain were available among our patients. Histological studies of patients with patella tendonitis have shown evidence of chronic inflammation, fibrinoid necrosis, mucoid degeneration, and synovial proliferation within the patella tendon insertion.21 Although no controlled data showing that patella tendons with a history of tendonitis are more prone to failure than those without such history when used as an autograft for ACL reconstruction, the idea of utilizing a diseased tendon for a graft is not ideal. Some surgeons question their patients regarding a history of anterior knee pain and will not use a pBTB autograft in a patient with a positive history.22
Continue to: The goal of this study is to obtain epidemiological evidence...
The goal of this study is to obtain epidemiological evidence of the prevalence of existing extensor mechanism pathologies in patients with acute ACL ruptures and determine how these pathologies may relate to the choice of graft. Out of 197 patients studied, over 10% presented with radiographic evidence of pathologies that could influence the choice of graft. This prevalence is certainly significant enough for surgeons to consider including a radiographic evaluation of the extensor mechanism in their standard ACL rupture work-up.
This study presents obvious limitations. While we report the prevalence of some extensor mechanism pathologies, no definitive evidence that recommends against the use of these autografts from these affected individuals has yet been published. In addition, our diagnosis of patella tendinopathy is based solely on MRI findings with no information regarding clinical symptoms. This limitation is a weakness as several additional studies have questioned the validity of a 7 mm proximal patella tendon thickness.23,24 Furthermore, no studies demonstrating the inferior strength of autografts with the co-existing findings described in our work have yet been performed.
CONCLUSION
We found that 10% of active-duty patients presenting for ACL reconstruction demonstrated radiographic evidence of an extensor mechanism pathology that could affect the harvesting of or integrity of select autografts. Given the recent trend of functionally equivocal results in ACL reconstructions utilizing a variety of grafts, this information could and should influence surgical recommendations for graft utilization to obtain optimal surgical results.
1. Lyman S, Koulouvaris P, Sherman S, Do H, Mandl LA, Marx RG. Epidemiology of anterior cruciate ligament reconstruction: trends, readmissions, and subsequent knee surgery. J Bone Joint Surg Am. 2009;91(10):2321-2328. doi:10.2106/JBJS.H.00539.
2. Spindler KP, Wright RW. Clinical practice. Anterior cruciate ligament tear. N Engl J Med. 2008;359(20):2135-2142. doi:10.1056/NEJMcp0804745.
3. Fu FH, Bennett CH, Lattermann CL, Ma CB. Current trends in anterior cruciate ligament reconstruction. Part 1: Biology and biomechanics of reconstruction. Am J Sports Med. 1999;27(6):821-830. doi:10.1177/03635465990270062501.
4. Mariscalco MW, Magnussen RA, Mehta D, Hewett TE, Flanigan DC, Kaeding CC. Autograft Versus nonirradiated allograft tissue for anterior cruciate ligament reconstruction: A systematic review. Am J Sports Med. 2014;42(2):492-499. doi:10.1177/0363546513497566.
5. Shaieb MD, Kan DM, Chang SK, Marumoto JM, Richardson AB. A prospective randomized comparison of patellar tendon versus semitendinosus and gracilis tendon autografts for anterior cruciate ligament reconstruction. Am J Sports Med. 2002;30(2):214-220. doi:10.1177/03635465020300021201.
6. Poehling GG, Curl WW, Lee CA, et al. Analysis of outcomes of anterior cruciate ligament repair with 5-year follow-up: Allograft versus allograft. Arthroscopy. 2005;21(7):774-785. doi:10.1016/j.arthro.2005.04.112.
7. Krych AJ, Jackson JD, Hoskin TL, Dahm DL. A meta-analysis of patellar tendon autograft versus patellar tendon allograft in anterior cruciate ligament reconstruction. Arthroscopy. 2008;24(3):292-298. doi:10.1016/j.arthro.2007.08.029.
8. El-Khoury GY, Wira RL, Berbaum KS, Pope TL, Monu JUV. MR imaging of patellar tendinitis. Radiology. 1992;184(3):849-854. doi:10.1148/radiology.184.3.1509078.
9. Johnson DP, Wakeley CJ, Watt I. Magnetic resonance imaging of patellar tendonitis. J Bone Joint Surg Br. 1996;78(3):452-457. doi:10.1302/0301-620X.78B3.0780452.
10. Popp JE, Yu JS, Kaeding CC. Recalcitrant patellar tendinitis. Magnetic resonance imaging, histologic evaluation, and surgical treatment. Am J Sports Med. 1997;25(2):218-222. doi:10.1177/036354659702500214.
11. Provencher MT, Ryu JH, Gaston T, Dewing CB. Technique: bone-patellar tendon-bone autograft ACL reconstruction in the young, active patient. J Knee Surg. 2011;24(2):83-92. doi:10.1055/s-0031-1280875.
12. Fu F, Cohen S. Current Concepts in ACL Reconstruction. Thorofare: SLACK Incorporated; 2008.
13. Cosgarea AJ, Weng MS, Andrews M. Osgood Schlatter’s disease complicating anterior cruciate ligament reconstruction. Arthroscopy. 1993;9(6):700-703. doi:10.1016/S0749-8063(05)80511-0.
14. Weckström M, Parviainen M, Pihlajamäki HK. Excision of painful bipartite patella: good long-term outcome in young adults. Clin Orthop Relat Res. 2008;466(11):2848-2855. doi:10.1007/s11999-008-0367-4.
15. Fulkerson JP, Langeland R. An alternative cruciate reconstruction graft: the central quadriceps tendon. Arthroscopy. 1995;11(2):252-254. doi:10.1016/0749-8063(95)90078-0.
16. Scully WF, Wilson DJ, Arrington ED. “Central” quadriceps tendon harvest with patellar bone plug: surgical technique revisited. Arthrosc Tech. 2013;2(4):e427-e432.
17. Kujala UM, Kvist M, Heinonen O. Osgood-Schlatter’s disease in adolescent athletes. Retrospective study of incidence and duration. Am J Sports Med. 1985;13(4):236-241. doi:10.1177/036354658501300404.
18. Pihlajamäki HK, Visuri TI. Long-term outcome after surgical treatment of unresolved Osgood-Schlatter disease in young men: surgical technique. J Bone Joint Surg Am. 2010;92(suppl 1 Pt 2):258-264. doi:10.2106/JBJS.J.00450.
19. Weiss JM, Jordan SS, Andersen JS, Lee BM, Kocher M. Surgical treatment of unresolved Osgood-Schlatter disease: ossicle resection with tibial tubercleplasty. J Pediatr Orthop. 2007;27(7):844-847. doi:10.1097/BPO.0b013e318155849b.
20. Lian OB, Engebretsen L, Bahr R. Prevalence of jumper’s knee Among elite athletes from different sports: a cross-sectional study. Am J Sports Med. 2005;33(4):561-567. doi:10.1177/0363546504270454.
21. O’Keeffe SA, Hogan BA, Eustace SJ, Kavanagh EC. Overuse injuries of the knee. Magn Reson Imaging Clin N Am. 2009;17(4):725-739, vii. doi:10.1016/j.mric.2009.06.010.
22. Martens M, Wouters P, Burssens A, Mulier JC. Patellar tendinitis: pathology and results of treatment. Acta Orthop Scand. 1982;53(3):445-450. doi:10.3109/17453678208992239.
23. Shalaby M, Almekinders LC. Patellar tendinitis: the significance of magnetic resonance imaging findings. Am J Sports Med. 1999;27(3):345-349. doi:10.1177/03635465990270031301.
24. Reiff DB, Heenan SD, Heron CW. MRI appearances of the asymptomatic patellar tendon on gradient echo imaging. Skeletal Radiol. 1995;24(2):123-126. doi:10.1007/BF00198074.
ABSTRACT
The purpose of this study is to determine the prevalence of potential graft-influencing pathologies of the extensor mechanism of the knee in patients presenting with a primary anterior cruciate ligament (ACL) rupture.
We performed a retrospective review of the plain radiographs and magnetic resonance imaging (MRI) of all active-duty patients presenting with a primary ACL rupture at our institution between July 2006 and February 2009. Imaging was reviewed to determine the presence of a multipartite patella, unresolved Osgood-Schlatter’s disease, and/or radiographic evidence suggestive of patella tendinopathy.
A total of 197 patients were reviewed, including 27 females and 170 males. One patient (0.5%) had a bipartite patella and 4 patients (2%) had free-floating ossicles about the tibial tuberosity consistent with unresolved Osgood-Schlatter’s disease. A total of 15 patients (7.6%) showed MRI evidence suggestive of patella tendinopathy.
This study revealed 20 patients out of 197 (10.1%) who presented with existing extensor mechanism pathologies in radiologic studies. While preoperative imaging is routinely used to confirm clinical suspicion of ACL rupture or identify associated injuries, this study shows that it can also identify existing extensor mechanism pathologies that could ultimately influence the use of an extensor mechanism graft.
Continue to: Anterior cruciate ligament (ACL) reconstruction...
Anterior cruciate ligament (ACL) reconstruction is an extremely common procedure; in fact, an estimated 60,000 to 175,000 ACL reconstructions are performed annually in the United States.1,2 One of the most widely debated aspects of ACL reconstruction is the choice of graft. Grafts are broadly categorized into allografts and autografts. The autograft selections for ACL reconstruction include patellar bone-tendon-bone (pBTB), combined semitendinosus and gracilis hamstrings (HS), free quadriceps tendon (QT)without accompanying bone block, and quadriceps tendon-bone (qTB). Allograft choices predominantly include pBTB and HS, as well as the tibialis anterior and Achilles tendons. The pBTB autograft is traditionally considered the reference standard for ACL reconstruction.3 Recent advances in allograft processing, along with improved fixation techniques and devices, have improved results following the use of soft-tissue autografts and both bony and soft tissue allografts.4 Thus, the optimal graft choice for ACL reconstruction has become controversial in light of several studies demonstrating no significant, long-term difference in clinical and/or functional outcomes based on graft selection.5-7
Given the lack of a clear gold standard in graft selection, multiple patient factors, such as age, activity demands, and patient preference, should be taken into account when considering the choice of graft. In addition, intrinsic factors that could potentially weaken an autograft should be considered. Several extensor mechanism pathological findings that are easily visualized on either plain radiographs or magnetic resonance imaging (MRI) could potentially affect graft selection. Findings such as a multipartite patella, free ossicles about the tibial tuberosity consistent with Osgood-Schlatter’s disease, and proximal patella tendon thickening suggestive of patellar tendinopathy are easily identifiable on preoperative imaging and could exert adverse effects on pBTB, QT, and qTB autografts. The purpose of this study is to identify the prevalence of these pre-existing conditions in active-duty military patients presenting with acute ACL tears.
METHODS
A retrospective review was conducted on all active-duty patients who underwent primary ACL reconstruction at our institution from July 2006 to February 2009. A systematic review of all plain radiographs and MRIs was performed on a calibrated picture archiving and communication system workstation. Imaging review was conducted by 2 of the authors. Pertinent findings included a multipartite patella, free ossicles within the patella tendon, and hypertrophy of the proximal aspect of the patella tendon. Assessment for multipartite patella and unresolved Osgood-Schlatter's disease was made using plain radiographs with MRI for confirmation. Measurements of the patella tendon were performed on the short tau inversion recovery and T2-weighted sagittal MRI images at the point of maximal tendon width. A width of ≥7 mm was considered suggestive of patella tendinopathy based on prior studies.8-10 The prevalence of each finding was then determined based on the total number of patients.
Continue to: RESULTS...
RESULTS
A total of 197 active-duty patients, including 27 females (13.7%) and 170 males (86.3%), underwent primary ACL reconstruction during the study time period. A total of 93 right knees and 104 left knees were evaluated. The average age at presentation was 29 years (range, 19-45 years).
Of the 197 patients, only 1 was found to have a multipartite patella (prevalence, 0.5%). This 37-year-old male patient showed a right bipartite patella located in the superior-lateral aspect (Figure 1).
Four patients had free ossicles within the inferior patellar tendon consistent with unresolved Osgood-Schlatter’s disease (prevalence, 2.0%) (Figure 2). All 4 patients were male, which is consistent with the higher incidence of Osgood-Schlatter’s disease in males than in females. The average age of these patients was 27.5 years (range, 22-33 years).
The most common extensor mechanism pathology present on preoperative imaging was proximal patella tendon thickening suggestive of patella tendinopathy. Thickening of the proximal portion of the patellar tendon was present in 15 of the 197 MRIs (prevalence, 7.6%) (Figure 3). The average width of this thickening was 8.49 mm (7.17-10.17 mm), and the average age of patients with radiographic evidence of patellar tendinopathy was 29.9 years (range, 20-43 years). Gender distribution was predominantly male (14 males, 1 female). Details of all extensor mechanism pathologies found are provided in the Table.
Table. Identified Extensor Mechanism Pathology
| Male | Female | Total |
Patients | 170 | 27 | 197 |
Multipartite Patella | 1 | 0 | 1 |
Osgood-Schlatter’s Disease | 4 | 0 | 4 |
Patella Tendinopathy | 14 | 1 | 15 |
|
| 20/97 (10.10%) |
|
DISCUSSION
When considering ACL reconstruction, determination of the graft type is one of the most important decisions to be made, perhaps second only to the decision to perform the surgery itself. Recent multiple, well-designed studies comparing differences among grafts have shown equivalent long-term results, leading to the lack of a universally accepted gold standard.5-7 Thus, both autograft and allograft ACL surgeries are routinely performed in the United States. Surgeons typically take into account factors such as patient age and physical demands, along with their own preferences and/or experience, when considering graft selection. A paucity of research concerning existing pathological conditions that could also influence preoperative decision-making has been observed; most reports consist only of expert opinion.11-13 Our goal is to determine the prevalence of several conditions that could potentially affect an autograft harvested from the extensor mechanism.
This study revealed an overall prevalence of 10.1% of existing extensor mechanism pathology in patients sustaining an acute ACL tear and presenting for ACL reconstruction. Only 1 (0.5%) showed evidence of a multipartite patella, which is below the reported prevalence of 0.2% to 6%.14 The presence of a multipartite patella could potentially have the most deleterious effect on a qTB autograft. Although not as commonly used as HS, QT, or pBTB autografts, some surgeons prefer a qTB autograft because of its increased surface area, bony fixation, and reported decreased donor site pain.15 A multipartite patella could complicate harvesting, disrupt the bone block, or lead to an unstable segment of the patella. These effects are of great concern since the most common location of a bipartite patella is superior-lateral and the quadriceps tendon has been shown to asymmetrically insert laterally.16 While these potential adverse effects have not been specifically studied, the availability of comparable options makes the use of a qTB autograft in the setting of a bipartite patella questionable.
Four patients (2%) revealed evidence of ossicles within the inferior patellar tendon consistent with unresolved Osgood-Schlatter’s disease. Osgood-Schlatter’s disease has been reported to occur in up to 21% of active adolescents and is historically considered a self-resolving process.17 Recent papers have reported persistent symptoms in up to 10% of patients, with a small percentage experiencing persistent free ossicles within their patella tendon on MRI.18,19 The presence of such ossicles raises concern about the integrity of the patellar tendon and questions its use as an autograft when present. This concern was published in a report with the surgeon opting to utilize an alternate graft due to the presence of unresolved Osgood-Schlatter’s disease.13
Fifteen patients (7.6%) demonstrated radiographic evidence suggestive of patella tendinopathy based on the thickness of the proximal patella tendon. Patella tendinopathy is the most common tendinopathy in skeletally mature athletes and one of the most common athletic injuries of the knee, with a reported career prevalence of 22%.20 It is described as an overuse injury due to the cumulative effect of micro trauma without an adequate healing interval. While it remains a clinical diagnosis, patellar tendinopathy often shows radiographic findings best assessed on sagittal MRIs. In general, the normal patella tendon appears as a homogenous low-intensity structure and is of uniform thickness. A tendon affected with tendinopathy typically demonstrates a focal increase in signal on T2-weighted sequences just distal to the tendon origin on the inferior pole of the patella. In addition, the patella tendon will usually demonstrate thickening, primarily in the proximal medial and posterior fibers. Patella marrow changes and indistinct tendon margins can also be present. The sensitivity and specificity of diagnosing patellar tendinopathy on MRI are 78% and 86%, respectively.20 We derived our criteria for MRI evidence suggestive of patella tendinopathy from studies by El-Khoury and colleagues,8 Johnson and colleagues,9 and Popp and colleagues.10 In a 1992 study, El-Khoury and colleagues8 compared MRI findings between a group of patients with a clinical diagnosis of patella tendonitis and a control group without knee complaints. The authors found that the average proximal patella tendon diameter in the control group was 3.7 mm while the average proximal patella tendon diameter in the patella tendinopathy group was 10.9 mm; no patella tendons in the control group were >7 mm.8 In a 1996 study, Johnson and colleagues9 determined that the most reliable MRI finding for patients with patellar tendonitis is significant thickening of the proximal patella tendon seen on the sagittal view. The average thickness in symptomatic patients was 8.5 mm (range, 5-15 mm). The average thickness in the control group was 5.5 mm. None of the control patients had a proximal tendon thickness >7 mm.9 Finally, Popp and colleagues10 reviewed the MRI of 11 knees of patients who underwent surgical débridement of chronic patellar tendonitis and reported an average proximal patella tendon thickness of 12 mm (range, 9-16 mm). We therefore used a proximal patella tendon thickness of >7 mm on the sagittal view as a radiographic finding suggestive of patella tendinopathy. No data regarding symptoms of anterior knee pain were available among our patients. Histological studies of patients with patella tendonitis have shown evidence of chronic inflammation, fibrinoid necrosis, mucoid degeneration, and synovial proliferation within the patella tendon insertion.21 Although no controlled data showing that patella tendons with a history of tendonitis are more prone to failure than those without such history when used as an autograft for ACL reconstruction, the idea of utilizing a diseased tendon for a graft is not ideal. Some surgeons question their patients regarding a history of anterior knee pain and will not use a pBTB autograft in a patient with a positive history.22
Continue to: The goal of this study is to obtain epidemiological evidence...
The goal of this study is to obtain epidemiological evidence of the prevalence of existing extensor mechanism pathologies in patients with acute ACL ruptures and determine how these pathologies may relate to the choice of graft. Out of 197 patients studied, over 10% presented with radiographic evidence of pathologies that could influence the choice of graft. This prevalence is certainly significant enough for surgeons to consider including a radiographic evaluation of the extensor mechanism in their standard ACL rupture work-up.
This study presents obvious limitations. While we report the prevalence of some extensor mechanism pathologies, no definitive evidence that recommends against the use of these autografts from these affected individuals has yet been published. In addition, our diagnosis of patella tendinopathy is based solely on MRI findings with no information regarding clinical symptoms. This limitation is a weakness as several additional studies have questioned the validity of a 7 mm proximal patella tendon thickness.23,24 Furthermore, no studies demonstrating the inferior strength of autografts with the co-existing findings described in our work have yet been performed.
CONCLUSION
We found that 10% of active-duty patients presenting for ACL reconstruction demonstrated radiographic evidence of an extensor mechanism pathology that could affect the harvesting of or integrity of select autografts. Given the recent trend of functionally equivocal results in ACL reconstructions utilizing a variety of grafts, this information could and should influence surgical recommendations for graft utilization to obtain optimal surgical results.
1. Lyman S, Koulouvaris P, Sherman S, Do H, Mandl LA, Marx RG. Epidemiology of anterior cruciate ligament reconstruction: trends, readmissions, and subsequent knee surgery. J Bone Joint Surg Am. 2009;91(10):2321-2328. doi:10.2106/JBJS.H.00539.
2. Spindler KP, Wright RW. Clinical practice. Anterior cruciate ligament tear. N Engl J Med. 2008;359(20):2135-2142. doi:10.1056/NEJMcp0804745.
3. Fu FH, Bennett CH, Lattermann CL, Ma CB. Current trends in anterior cruciate ligament reconstruction. Part 1: Biology and biomechanics of reconstruction. Am J Sports Med. 1999;27(6):821-830. doi:10.1177/03635465990270062501.
4. Mariscalco MW, Magnussen RA, Mehta D, Hewett TE, Flanigan DC, Kaeding CC. Autograft Versus nonirradiated allograft tissue for anterior cruciate ligament reconstruction: A systematic review. Am J Sports Med. 2014;42(2):492-499. doi:10.1177/0363546513497566.
5. Shaieb MD, Kan DM, Chang SK, Marumoto JM, Richardson AB. A prospective randomized comparison of patellar tendon versus semitendinosus and gracilis tendon autografts for anterior cruciate ligament reconstruction. Am J Sports Med. 2002;30(2):214-220. doi:10.1177/03635465020300021201.
6. Poehling GG, Curl WW, Lee CA, et al. Analysis of outcomes of anterior cruciate ligament repair with 5-year follow-up: Allograft versus allograft. Arthroscopy. 2005;21(7):774-785. doi:10.1016/j.arthro.2005.04.112.
7. Krych AJ, Jackson JD, Hoskin TL, Dahm DL. A meta-analysis of patellar tendon autograft versus patellar tendon allograft in anterior cruciate ligament reconstruction. Arthroscopy. 2008;24(3):292-298. doi:10.1016/j.arthro.2007.08.029.
8. El-Khoury GY, Wira RL, Berbaum KS, Pope TL, Monu JUV. MR imaging of patellar tendinitis. Radiology. 1992;184(3):849-854. doi:10.1148/radiology.184.3.1509078.
9. Johnson DP, Wakeley CJ, Watt I. Magnetic resonance imaging of patellar tendonitis. J Bone Joint Surg Br. 1996;78(3):452-457. doi:10.1302/0301-620X.78B3.0780452.
10. Popp JE, Yu JS, Kaeding CC. Recalcitrant patellar tendinitis. Magnetic resonance imaging, histologic evaluation, and surgical treatment. Am J Sports Med. 1997;25(2):218-222. doi:10.1177/036354659702500214.
11. Provencher MT, Ryu JH, Gaston T, Dewing CB. Technique: bone-patellar tendon-bone autograft ACL reconstruction in the young, active patient. J Knee Surg. 2011;24(2):83-92. doi:10.1055/s-0031-1280875.
12. Fu F, Cohen S. Current Concepts in ACL Reconstruction. Thorofare: SLACK Incorporated; 2008.
13. Cosgarea AJ, Weng MS, Andrews M. Osgood Schlatter’s disease complicating anterior cruciate ligament reconstruction. Arthroscopy. 1993;9(6):700-703. doi:10.1016/S0749-8063(05)80511-0.
14. Weckström M, Parviainen M, Pihlajamäki HK. Excision of painful bipartite patella: good long-term outcome in young adults. Clin Orthop Relat Res. 2008;466(11):2848-2855. doi:10.1007/s11999-008-0367-4.
15. Fulkerson JP, Langeland R. An alternative cruciate reconstruction graft: the central quadriceps tendon. Arthroscopy. 1995;11(2):252-254. doi:10.1016/0749-8063(95)90078-0.
16. Scully WF, Wilson DJ, Arrington ED. “Central” quadriceps tendon harvest with patellar bone plug: surgical technique revisited. Arthrosc Tech. 2013;2(4):e427-e432.
17. Kujala UM, Kvist M, Heinonen O. Osgood-Schlatter’s disease in adolescent athletes. Retrospective study of incidence and duration. Am J Sports Med. 1985;13(4):236-241. doi:10.1177/036354658501300404.
18. Pihlajamäki HK, Visuri TI. Long-term outcome after surgical treatment of unresolved Osgood-Schlatter disease in young men: surgical technique. J Bone Joint Surg Am. 2010;92(suppl 1 Pt 2):258-264. doi:10.2106/JBJS.J.00450.
19. Weiss JM, Jordan SS, Andersen JS, Lee BM, Kocher M. Surgical treatment of unresolved Osgood-Schlatter disease: ossicle resection with tibial tubercleplasty. J Pediatr Orthop. 2007;27(7):844-847. doi:10.1097/BPO.0b013e318155849b.
20. Lian OB, Engebretsen L, Bahr R. Prevalence of jumper’s knee Among elite athletes from different sports: a cross-sectional study. Am J Sports Med. 2005;33(4):561-567. doi:10.1177/0363546504270454.
21. O’Keeffe SA, Hogan BA, Eustace SJ, Kavanagh EC. Overuse injuries of the knee. Magn Reson Imaging Clin N Am. 2009;17(4):725-739, vii. doi:10.1016/j.mric.2009.06.010.
22. Martens M, Wouters P, Burssens A, Mulier JC. Patellar tendinitis: pathology and results of treatment. Acta Orthop Scand. 1982;53(3):445-450. doi:10.3109/17453678208992239.
23. Shalaby M, Almekinders LC. Patellar tendinitis: the significance of magnetic resonance imaging findings. Am J Sports Med. 1999;27(3):345-349. doi:10.1177/03635465990270031301.
24. Reiff DB, Heenan SD, Heron CW. MRI appearances of the asymptomatic patellar tendon on gradient echo imaging. Skeletal Radiol. 1995;24(2):123-126. doi:10.1007/BF00198074.
TAKE-HOME POINTS
- Extensor mechanism pathology is a common finding in patients with ACL injuries.
- Extensor mechanism pathology such as a multipartite patella, unresolved Osgood-Schlatter’s disease, and patella tendinopathy are easily identifiable on standard imaging.
- It is unknown what type of effect, if any, these pathologies may have on graft strength.
- The bone-patella tendon-bone and quadriceps autograft are the most likely to be affected.
- Surgeons should take into account existing extensor mechanism pathology when considering individual patient graft selection for ACL reconstruction.