User login
The In Vivo Impact of Leukocyte Injections on Normal Rat Achilles Tendons: Potential Detriment to Tendon Morphology, Cellularity, and Vascularity
ABSTRACT
In this study, we determine the in vivo effects of injecting sub-populations of leukocytes into normal rat Achilles tendons via a controlled laboratory study. Allogenic monocytes, granulocytes, or plasma were injected into 24 healthy rat Achilles tendons. Treated and contralateral un-treated control tendons then assessed for cellularity, histologic morphology, and vascularity after 7 and 14 days. Significant increases of 221% and 249% in cellularity (P = 0.014) were seen on day 14 within Achilles tendons injected with granulocytes as compared to plasma and monocytes, respectively. Also, significant improvement in morphology (P = 0.029) between days 7 and 14 was seen for the granulocyte injected Achilles tendons. Significant increases in cellularity after an injection of granulocytes, compared to monocytes and plasma, corresponds to a significant increase in inflammation within the tissue, suggesting that leukocyte-rich platelet-rich plasma (PRP) preparations are proinflammatory and potentially catabolic when injected into tendon tissue. The concentration and composition of white blood cells within PRP preparations is variable and needs to be better understood in order to optimize clinical utility of PRP injections.
Continue to: Tendinopathies are debilitating conditions...
Tendinopathies are debilitating conditions affecting patients worldwide every day. They arise most frequently from tendon overuse resulting in pathology.1 There are 2 major subtypes of tendinopathy: tendinosis and tendinitis. Tendinosis, the more common condition, is characterized by long-term, chronic degradation of tendon tissue resulting in fibrosis from infiltrating fibroblasts.2 Tendinitis, the less common condition, is characterized by an acute inflammatory response and inflammatory cell infiltrate.2 Both conditions are common, with Achilles tendinopathy affecting 11% of runners and lateral epicondylitis affecting 1% to 3% of the general population.3,4 Many sports-related overuse injuries, such as tendinopathies, go undiagnosed for extended periods of time because medical attention is avoided in order to prevent time loss from training or competing.5 These delays could be eliminated if a non-surgical option for treating tendon pathology was available.
Tendinopathies are believed to result from tendon overuse that causes micro-damage to collagen, as well as from significant changes in protein and enzyme composition within the tendon.6 The damage accumulates over time and eventually leads to chronic inflammation or fibrotic change within tendons, in both cases weakening the tendon and causing pain. Currently, accepted treatments for tendinopathies include: nonsteroidal anti-inflammatory drugs, physical therapy, ultrasound, laser-therapy, corticosteroids, glyceryl trinitrate patches, extracorporeal shock wave therapy, sclerotherapy, and surgery.7 Recently, platelet-rich plasma (PRP) therapy has emerged as a promising treatment for tendinopathies, as well as a variety of other orthopedic indications.
PRP consists of autologous blood from the patient, centrifuged to increase the amount of platelets in the sample above baseline, and subsequently injected around an affected tendon or joint.8 PRP is used to treat tendinopathy because it can supply injured tendons with blood components that aid in healing, which tendons do not receive due to poor vascularity.9 These components include growth factors, such as platelet derived growth factor (PDGF), transforming growth factor-β (TGF-β), vascular endothelial growth factor (VEGF), endothelial growth factor, and leukocytes that can stimulate an inflammatory response within the injured tissue.10 The inflammatory response from the PRP induces a more robust reconstruction and revascularization of the injured tissue, stimulating proliferation, and remodeling.11,12However, significant variability exists within the platelets, leukocytes, and growth factors that comprise PRP. This is attributed to 3 major causes. First, current commercial preparations of PRP result in differing platelet concentrations, as well as leukocyte-rich and leukocyte-poor compositions.13,14 Variability in platelet concentrations results in unreliable amounts of growth factors, including cytokines, TGF-β, PDGF, VEGF and basic fibroblast growth factor in each preparation, while leukocyte levels affect inflammation, all leading to variable effects for each preparation.15,16Second, despite sex and age of the PRP donor not being significant factors influencing variation in growth factor concentrations, the existence of an unexplained variation in concentrations of growth factors between different donors has been observed.17 Third, the selection of activating agents, bovine thrombin or calcium chloride, and their application, whether to the elbow, shoulder, or knee, produces variability.18
While the effects of platelets and growth factors in PRP have been well studied, less is known about the effects of differing cell types. Recently it was reported that the concentrations of leukocytes directly affect the outcomes of PRP injections. McCarrel and colleagues19,20 found that as the number of leukocytes increased, there was a concomitant increase in the expression of inflammatory cytokines and catabolic activity. This effect may result in inferior healing of injured tissues and is attributed to the release of pro-inflammatory cytokines such as interleukin-1β from the leukocytes.21 There is also evidence that minimizing the catabolic effect of leukocytes may be just as important to tissue healing as the maximizing anabolic effect of platelets and growth factors.22
The use of PRP has been highly disputed in recent years due to conflicting reports of its success in treating orthopedic conditions. Numerous favorable studies have shown benefit for treating chronic and acute orthopedic injuries including; rotator cuff tear repair, chronic refractory patellar tendinopathy, and chronic lateral tendinosis/epicondylitis.23-26 Concurrently, articles demonstrating no significant effects from PRP have also been published. One study claiming that PRP injections did not improve outcomes of chronic Achilles tendinopathy did not differentiate whether patients had tendinosis or tendinitis, and did not consider leukocyte concentration in their PRP preparations27 Another study that determined PRP is not beneficial to the healing of ruptured Achilles tendons after surgical repair also failed to consider the concentration of leukocytes in their PRP preparations.28 One of the difficulties in comparing these studies is their heterogeneous nature. This arises from the use of different conditions in each study that makes the studies incomparable. Variations in PRP preparations lead to different concentrations of growth factors, platelets, and leukocyte concentrations. Additionally, tendinopathy models were not specified as tendinosis and tendonitis, and models or patients were not controlled for age, sex, or comorbidities. Given that leukocyte-rich and leukocyte-poor PRP preparations are currently widely used in clinical practice, the discovery of which type of preparation is indicated in which setting is paramount to evidence-based use of this treatment modality. Due to reports suggesting that leukocytes may be detrimental to tendon healing, determining which types of leukocytes are responsible for these effects is vital. As such, the purpose of this study is to determine the in vivo effects of sub-populations of leukocytes on normal rat tendons. This study design allowed us to isolate the effects of the injections to induce a response and remove confounding effects of normal healing response to a damaged tendon and effects from the injection itself. Our hypothesis was that the injection of leukocytes would cause an inflammatory response in rat tendons, leading to catabolic outcomes.
Continue to: METHODS...
METHODS
This was a prospective, in vivo, placebo controlled, randomized animal study. The University’s Institutional Animal Care and Use Committee approved all procedures prior to initiation. Twenty-four male Sprague-Dawley rats were randomized to 3 treatment groups (n = 8): monocytes; granulocytes, and; plasma, as a negative control.
Allogenic blood from 6 additional rats was collected into K2EDTA tubes via cardiac puncture. Allogenic, as opposed to autogenic, blood is commonly used in rat models because of low immunogenic response to blood from rats of the same strain and litter.29,30 The blood was then pooled and the red cells lysed by incubation with Red Blood Cell Lysis Buffer (Roche). The samples were then sorted into fractions containing monocytes and granulocytes using fluorescence activated cell sorting (FACS) using a FACSAria (BD Biosciences). Cells were sorted using Purified PE Mouse Anti-Rat CD11b/c antibodies (BD Pharmingen) specific to monocytes, granulocytes, macrophages, dendritic cells, and microglia, APC-Cy7 Mouse Anti-Rat CD45 antibodies (BD Pharmingen) specific to all hematopoietic cells except erythrocytes, and FITC Mouse Anti-Rat CD42d antibodies (BD Pharmingen) specific to megakaryocytes and platelets. 20 μL of 0.2 mg/mL CD11b/c, 20 μL of 0.2 mg/mL CD 45, and 10 μL of 0.5 mg/mL CD42d antibodies were added to 1 mL of condensed non-red cells collected from the 6 rats and incubated at room temperature in the dark for 15 minutes. A fraction containing only platelet-poor plasma was also collected. For all treatments the injection volume was 75 μL. Rats in the monocyte group were injected with 200,000 cells in platelet-poor plasma, those in the granulocyte group were injected with 900,000 cells in platelet-poor plasma, and rats in the plasma control group received only platelet-poor plasma. The cell concentrations were based on previous studies that documented these concentrations that are found in typical leukocyte-rich PRP preparations.13
The animals were anesthetized with isoflurane gas and then injected aseptically once into their right Achilles tendon. The left Achilles tendon was used as an un-injected control, giving a total of 48 total Achilles tendons studied. At days 7 and 14 post-injection, 4 rats from each group were euthanized and the Achilles tendons were harvested.
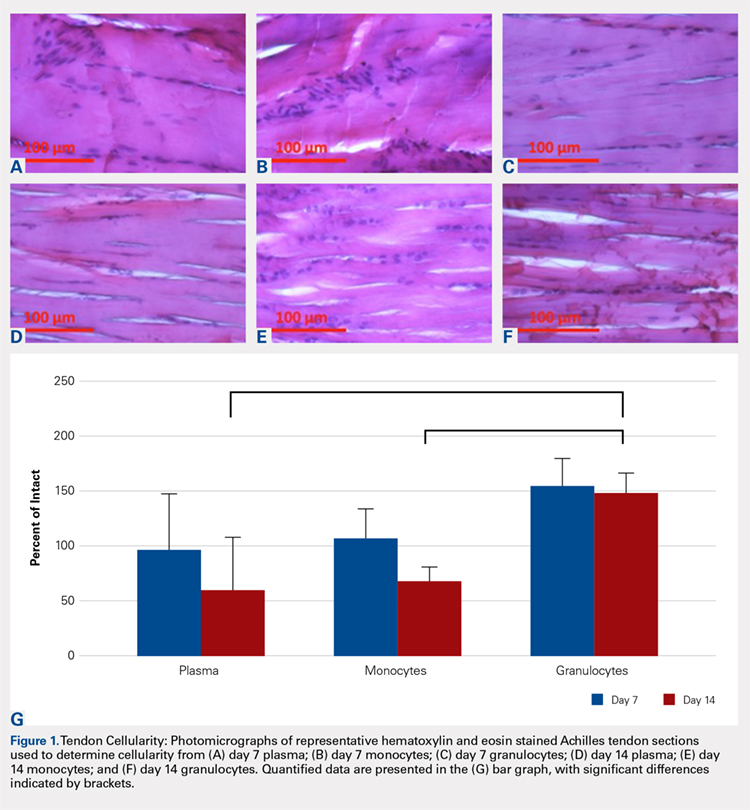
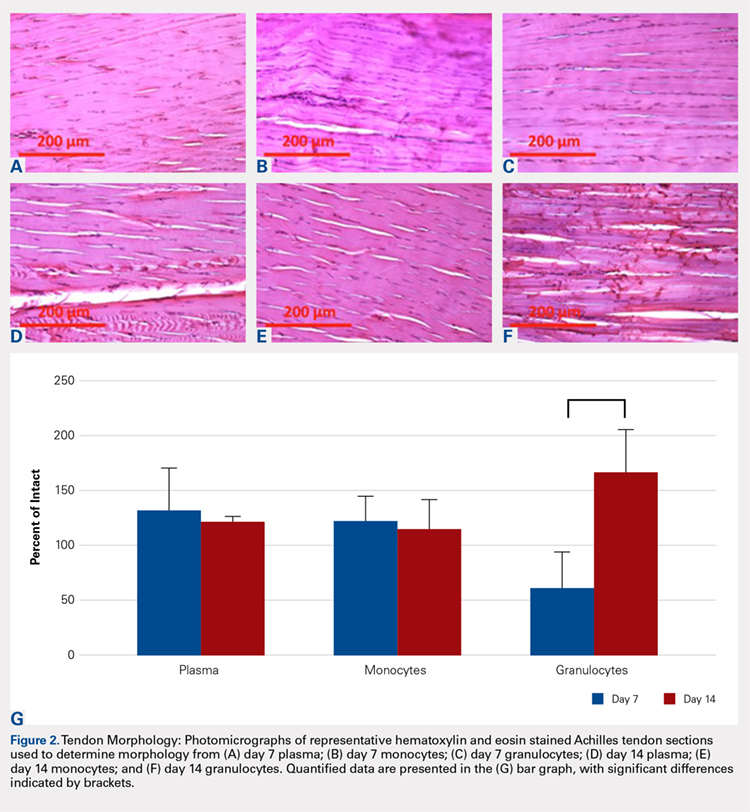
The tendons were fixed in neutral buffered formalin for 24 hours and then embedded in paraffin and sectioned sagittally at 12 μm. The tendons were then stained with hematoxylin and eosin (H&E) using standard histological protocols and examined by 3 individuals trained to assess cellularity and morphology. All samples were assigned unrecognizable numbers and randomized prior to examination by individuals. Cell counts were based on the number of nuclei present in 3 mid-tendon high-power fields (400x) per sample. Morphology was graded on a scale of 1 to 3, with 1 being a normal tendon and 3 having severe pathology with total loss of alignment and crimping on 3 low-power fields (100x) per sample (Figures 1A-1G).
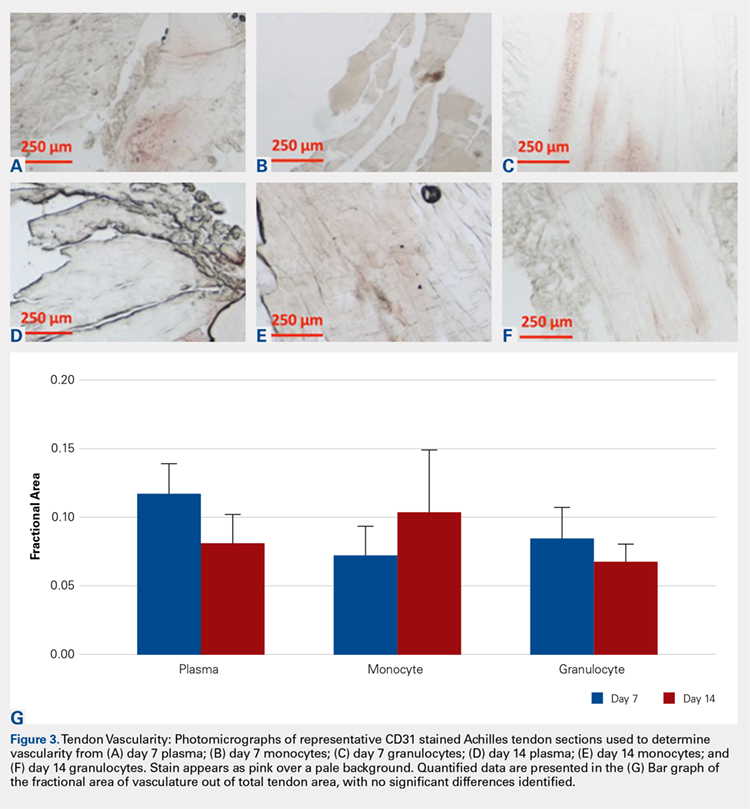
Vascularity was assessed by immunohistochemical staining using Rabbit Polyclonal Anti-CD31 antibodies (Abcam), a marker for vascular endothelial cells, using a Vectastain ABC Kit (Vector Laboratories) system and the ImmPACT AEC Peroxidase (HRP) Substrate (Vector Laboratories). Following staining, automated image analysis was performed (Bioquant). Briefly, all areas that did not contain tendon were masked. CD31 positive areas were then quantified using global thresholding. Vascularity was then calculated as ratio of CD31 positive area to total tendon area. Analyses were performed on 3 mid-tendon medium-power (200x) fields per sample.
For cellularity and morphology, the results for the injected tendons were normalized to those of their contralateral untreated controls and reported as a percentage. Results for vascularity were compared directly between treated tendons. Differences were assessed between groups at each time-point using Independent Samples Median Tests. When significant differences were identified, pairwise comparisons were performed to identify the source of the differences. All analyses were conducted using SPSS (V22, SAS Institute) with significant differences determined for values of P < 0.05.
RESULTS
No significant differences in cellularity between groups were seen at day 7 (P = 0.368) (Figures 1A-1G). However, a significant difference in cellularity between groups was seen at day 14 (P = 0.014). Pairwise tests showed there to be a significant increase in the number of cells in the tendons treated with granulocytes from 221% and 249% in cellularity (P = 0.014) on day 14, as compared to both monocytes and plasma, respectively. Morphologically, no significant differences were seen between groups at either time-point (P = 0.091 for day 7 and P = 1.000 for day 14) (Figures 2A-2G). However, a significant improvement in morphology was observed from day 7 to day 14 in the granulocyte group from 60% to 165% (P = 0.029). Finally, no differences were seen in vascularity between treatment groups at either time-point (P = 0.368 for day 7 and P = 0.535 for day 14) (Figures 3A-3G).
Continue to: DISCUSSION...
DISCUSSION
Our hypothesis that the injection of leukocytes would cause an inflammatory response in rat tendons leading to catabolic outcomes was confirmed in the granulocyte group. It should be noted that prior to the catabolic outcome, there was a transient anabolic effect in the granulocyte group during the second week. Deterioration in morphology was observed in the tendons injected with granulocytes on day 7, which subsequently recovered in the following week. We found that injecting granulocytes into normal tendons resulted in an increase in inflammatory cellularity, when compared to monocytes and plasma injections.
Limitations inherent in this study are those similar to other in vivo studies. To begin with, the results of injections into rat tendons may not be translatable to human tendons. Despite this limitation, the rat is a common model for tendon research.31 Another limitation is that this study injected healthy Achilles tendons, rather than tendons with preexisting tendinopathy. In a naturally occurring tendinopathy, there may be other factors present that interact with PRP, and this model negates the contribution of these factors. Finally, while the immunohistochemistry (IHC) and morphological data are clear, the cellularity data are not clear in identifying the type of cells that were increased by granulocyte injection. However, the cells appeared rounded, resembling inflammatory infiltrate; a common cell type seen in tendons.2 While fibroblasts are also a common infiltrate during chronic tendinopathy, they are generally flat and appear on H&E as long spindle shaped cells. Thus, we believe the increased cellularity of the tendons after granulocyte injections is representative of an increase in inflammation. The increased cellularity could be due to the increased number of cells injected into the tendon; however, our conclusions are consistent with the increased inflammation previously reported linking leukocytes to tendon inflammation.20,22,32
In terms of morphology, we hypothesized that degenerative changes would be seen in the tendons that were injected with granulocytes due to the inflammatory action of these cells. As part of the granulocyte response, neutrophils release proteases and macrophages can stimulate collagen synthesis via fibroblasts, both causing change within the extracellular matrix.33,34 Indeed, we observed a significant change in tissue morphology in the granulocyte group over the course of 14 days. As the degenerative and regenerative effects of granulocytes take time to present, this is likely what we observed to occur between day 7 and 14 after treatment. These observations are also consistent with prior observations that leukocyte-rich PRP injections can be detrimental to tendon healing, but beneficial to tissue degeneration in the setting of chronic tendonitis.20
We hypothesized that the vascularity of the tendons would be similar in all preparations. This was based on previous studies demonstrating that the lack of platelets in the platelet-poor plasma fraction is sufficient to deplete VEGF, the angiogenic agent in PRP.35 In this study, there were no observable differences in vascularity of platelet-poor plasma, monocyte, and granulocyte injections. We attribute this to the lack of VEGF in any of these preparations. The aforementioned study also showed that the lack of platelets in injection was enough to prevent the angiogenic effect of this treatment.35
Continue to: The goal of this study was...
The goal of this study was to assess the morphology, cellularity, and vascularity of normal tendons after injections of different leukocyte populations. This is clinically important because of the potential to tailor future PRP injections on a patient-by-patient basis. In patients requiring an anabolic response, leukocyte-poor PRP may be the best option. In contrast, when patient pathology requires an inflammatory response to improve healing36 or breakdown fibrotic tissue, as seen in tendinosis, leukocyte-rich PRP may be warranted. Further, properly controlled clinical studies are needed to validate these recommendations.
Limitations inherent in this study are those similar to other in vivo studies. First, the results of injections into rat tendons may not be translatable to human tendons. Despite this limitation, the rat is a common model for tendon research.31 A second limitation is that this study injected healthy Achilles tendons, rather than tendons with preexisting tendinopathy. In a naturally occurring tendinopathy, there may be other factors present that interact with PRP, and this model negates the contribution of these factors. Finally, while the IHC and morphological data show clear changes, the cellularity data are not clear in identifying the type of cells that were increased by granulocyte injection. However, the cells appeared rounded, resembling inflammatory infiltrate; a common cell type seen in tendons.2 While fibroblasts are also a common infiltrate during chronic tendinopathy, they are generally flat and appear on H&E as long spindle shaped cells. The last limitation of this study is the lack of functional mechanical testing since, clinically, healing of the tendon is also related to the strength of the tendon. Thus, we believe the increased cellularity of the tendons after granulocyte injections is representative of an increase in inflammation. Moreover, our results are consistent with the increased inflammation previously reported linking leukocytes to tendon inflammation.20,22,32 It is interesting to note that the increase in inflammation does not lead to an increase in vascularity as could be expected.
CONCLUSION
We found that the injection of leukocytes into healthy rat Achilles tendons increases inflammation, as evidenced by increased cellularity and disrupted morphology, which suggests that leukocyte-rich PRP preparations may be contraindicated in settings of acute tendonitis. However, these preparations may be useful for a specific subset of tendinopathies, including chronic tendinosis.
1. Herring SA, Nilson KL. Introduction to overuse injuries. Clin Sports Med. 1987;6(2):225-239.
2. Bass E. Tendinopathy: why the difference between tendinitis and tendinosis matters. Int J Ther Massage Bodywork. 2012;5(1):14-17.
3. James SL, Bates BT, Osternig LR. Injuries to runners. Am J Sports Med. 1978;6(2):40-50.
4. Allander E. Prevalence, incidence, and remission rates of some common rheumatic diseases or syndromes. Scand J Rheumatol. 1974;3(3):145-153.
5. Bahr R. No injuries, but plenty of pain? On the methodology for recording overuse symptoms in sports. Br J Sports Med. 2009;43(13):966-972.
6. Rees JD, Maffulli N, Cook J. Management of tendinopathy. Am J Sports Med. 2009;37(9):1855-1867.
7. Andres BM, Murrell GA. Treatment of tendinopathy: what works, what does not, and what is on the horizon. Clin Orthop Relat Res. 2008;466(7):1539-1554.
8. Hall MP, Band PA, Meislin RJ, Jazrawi LM, Cardone DA. Platelet-rich plasma: current concepts and application in sports medicine. J Am Acad Orthop Surg. 2009;17(10):602-608.
9. Smith JW. Blood Supply of Tendons. Am J Surg. 1965;109:272-276.
10. Wu PI, Diaz R, Borg-Stein J. Platelet-rich plasma. Phys Med Rehabil Clin N Am. 2016;27(4):825-853.
11. Nguyen RT, Borg-Stein J, McInnis K. Applications of platelet-rich plasma in musculoskeletal and sports medicine: an evidence-based approach. PM R. 2011;3(3):226-250.
12. Broughton G 2nd, Janis JE, Attinger CE. Wound healing: an overview. Plast Reconstr Surg. 2006;117(7 Suppl):1e-S-32e-S.
13. Mazzocca AD, McCarthy MB, Chowaniec DM, et al. Platelet-rich plasma differs according to preparation method and human variability. J Bone Joint Surg Am. 2012;94(4):308-316.
14. Mazzocca AD, McCarthy MB, Chowaniec DM, et al. The positive effects of different platelet-rich plasma methods on human muscle, bone, and tendon cells. Am J Sports Med. 2012;40(8):1742-1749.
15. Castillo TN, Pouliot MA, Kim HJ, Dragoo JL. Comparison of growth factor and platelet concentration from commercial platelet-rich plasma separation systems. Am J Sports Med. 2011;39(2):266-271.
16. Cho HS, Song IH, Park SY, Sung MC, Ahn MW, Song KE. Individual variation in growth factor concentrations in platelet-rich plasma and its influence on human mesenchymal stem cells. Korean J Lab Med. 2011;31(3):212-218.
17. Weibrich G, Kleis WK, Hafner G, Hitzler WE. Growth factor levels in platelet-rich plasma and correlations with donor age, sex, and platelet count. J Craniomaxillofac Surg. 2002;30(2):97-102.
18. Taylor DW, Petrera M, Hendry M, Theodoropoulos JS. A systematic review of the use of platelet-rich plasma in sports medicine as a new treatment for tendon and ligament injuries. Clin J Sport Med. 2011;21(4):344-352.
19. McCarrel T, Fortier L. Temporal growth factor release from platelet-rich plasma, trehalose lyophilized platelets, and bone marrow aspirate and their effect on tendon and ligament gene expression. J Orthop Res. 2009;27(8):1033-1042.
20. McCarrel TM, Minas T, Fortier LA. Optimization of leukocyte concentration in platelet-rich plasma for the treatment of tendinopathy. J Bone Joint Surg Am. 2012;94(19):e143(141-148).
21. Pillitteri D, Bassus S, Boller K, et al. Thrombin-induced interleukin 1beta synthesis in platelet suspensions: impact of contaminating leukocytes. Platelets. 2007;18(2):119-127.
22. Boswell SG, Schnabel LV, Mohammed HO, Sundman EA, Minas T, Fortier LA. Increasing platelet concentrations in leukocyte-reduced platelet-rich plasma decrease collagen gene synthesis in tendons. Am J Sports Med. 2014;42(1):42-49.
23. Mishra A, Pavelko T. Treatment of chronic elbow tendinosis with buffered platelet-rich plasma. Am J Sports Med. 2006;34(11):1774-1778.
24. Maniscalco P, Gambera D, Lunati A, et al. The "Cascade" membrane: a new PRP device for tendon ruptures. Description and case report on rotator cuff tendon. Acta Biomed. 2008;79(3):223-226.
25. Filardo G, Kon E, Della Villa S, Vincentelli F, Fornasari PM, Marcacci M. Use of platelet-rich plasma for the treatment of refractory jumper's knee. Int Orthop. 2010;34(6):909-915.
26. Peerbooms JC, Sluimer J, Bruijn DJ, Gosens T. Positive effect of an autologous platelet concentrate in lateral epicondylitis in a double-blind randomized controlled trial: platelet-rich plasma versus corticosteroid injection with a 1-year follow-up. Am J Sports Med. 2010;38(2):255-262.
27. de Vos RJ, Weir A, van Schie HT, et al. Platelet-rich plasma injection for chronic Achilles tendinopathy: a randomized controlled trial. JAMA. 2010;303(2):144-149.
28. Schepull T, Kvist J, Norrman H, Trinks M, Berlin G, Aspenberg P. Autologous platelets have no effect on the healing of human achilles tendon ruptures: a randomized single-blind study. Am J Sports Med. 2011;39(1):38-47.
29. Welsh KI, Burgos H, Batchelor JR. The immune response to allogeneic rat platelets; Ag-B antigens in matrix form lacking Ia. Eur J Immunol. 1977;7(5):267-272.
30. Xue M, Del Bigio MR. Intracortical hemorrhage injury in rats : relationship between blood fractions and brain cell death. Stroke. 2000;31(7):1721-1727.
31. Voleti PB, Buckley MR, Soslowsky LJ. Tendon healing: repair and regeneration. Annu Rev Biomed Eng. 2012;14:47-71.
32. Sundman EA, Cole BJ, Fortier LA. Growth factor and catabolic cytokine concentrations are influenced by the cellular composition of platelet-rich plasma. Am J Sports Med. 2011;39(10):2135-2140.
33. Palmgren MS, deShazo RD, Carter RM, Zimny ML, Shah SV. Mechanisms of neutrophil damage to human alveolar extracellular matrix: the role of serine and metalloproteases. J Allergy Clin Immunol. 1992;89(4):905-915.
34. Khalil N, Bereznay O, Sporn M, Greenberg AH. Macrophage production of transforming growth factor beta and fibroblast collagen synthesis in chronic pulmonary inflammation. J Exp Med. 1989;170(3):727-737.
35. Zhou Y, Zhang J, Wu H, Hogan MV, Wang JH. The differential effects of leukocyte-containing and pure platelet-rich plasma (PRP) on tendon stem/progenitor cells - implications of PRP application for the clinical treatment of tendon injuries. Stem Cell Res Ther. 2015;6:173.
36. Su B, O'Connor JP. NSAID therapy effects on healing of bone, tendon, and the enthesis. J Appl Physiol (1985). 2013;115(6):892-899.
ABSTRACT
In this study, we determine the in vivo effects of injecting sub-populations of leukocytes into normal rat Achilles tendons via a controlled laboratory study. Allogenic monocytes, granulocytes, or plasma were injected into 24 healthy rat Achilles tendons. Treated and contralateral un-treated control tendons then assessed for cellularity, histologic morphology, and vascularity after 7 and 14 days. Significant increases of 221% and 249% in cellularity (P = 0.014) were seen on day 14 within Achilles tendons injected with granulocytes as compared to plasma and monocytes, respectively. Also, significant improvement in morphology (P = 0.029) between days 7 and 14 was seen for the granulocyte injected Achilles tendons. Significant increases in cellularity after an injection of granulocytes, compared to monocytes and plasma, corresponds to a significant increase in inflammation within the tissue, suggesting that leukocyte-rich platelet-rich plasma (PRP) preparations are proinflammatory and potentially catabolic when injected into tendon tissue. The concentration and composition of white blood cells within PRP preparations is variable and needs to be better understood in order to optimize clinical utility of PRP injections.
Continue to: Tendinopathies are debilitating conditions...
Tendinopathies are debilitating conditions affecting patients worldwide every day. They arise most frequently from tendon overuse resulting in pathology.1 There are 2 major subtypes of tendinopathy: tendinosis and tendinitis. Tendinosis, the more common condition, is characterized by long-term, chronic degradation of tendon tissue resulting in fibrosis from infiltrating fibroblasts.2 Tendinitis, the less common condition, is characterized by an acute inflammatory response and inflammatory cell infiltrate.2 Both conditions are common, with Achilles tendinopathy affecting 11% of runners and lateral epicondylitis affecting 1% to 3% of the general population.3,4 Many sports-related overuse injuries, such as tendinopathies, go undiagnosed for extended periods of time because medical attention is avoided in order to prevent time loss from training or competing.5 These delays could be eliminated if a non-surgical option for treating tendon pathology was available.
Tendinopathies are believed to result from tendon overuse that causes micro-damage to collagen, as well as from significant changes in protein and enzyme composition within the tendon.6 The damage accumulates over time and eventually leads to chronic inflammation or fibrotic change within tendons, in both cases weakening the tendon and causing pain. Currently, accepted treatments for tendinopathies include: nonsteroidal anti-inflammatory drugs, physical therapy, ultrasound, laser-therapy, corticosteroids, glyceryl trinitrate patches, extracorporeal shock wave therapy, sclerotherapy, and surgery.7 Recently, platelet-rich plasma (PRP) therapy has emerged as a promising treatment for tendinopathies, as well as a variety of other orthopedic indications.
PRP consists of autologous blood from the patient, centrifuged to increase the amount of platelets in the sample above baseline, and subsequently injected around an affected tendon or joint.8 PRP is used to treat tendinopathy because it can supply injured tendons with blood components that aid in healing, which tendons do not receive due to poor vascularity.9 These components include growth factors, such as platelet derived growth factor (PDGF), transforming growth factor-β (TGF-β), vascular endothelial growth factor (VEGF), endothelial growth factor, and leukocytes that can stimulate an inflammatory response within the injured tissue.10 The inflammatory response from the PRP induces a more robust reconstruction and revascularization of the injured tissue, stimulating proliferation, and remodeling.11,12However, significant variability exists within the platelets, leukocytes, and growth factors that comprise PRP. This is attributed to 3 major causes. First, current commercial preparations of PRP result in differing platelet concentrations, as well as leukocyte-rich and leukocyte-poor compositions.13,14 Variability in platelet concentrations results in unreliable amounts of growth factors, including cytokines, TGF-β, PDGF, VEGF and basic fibroblast growth factor in each preparation, while leukocyte levels affect inflammation, all leading to variable effects for each preparation.15,16Second, despite sex and age of the PRP donor not being significant factors influencing variation in growth factor concentrations, the existence of an unexplained variation in concentrations of growth factors between different donors has been observed.17 Third, the selection of activating agents, bovine thrombin or calcium chloride, and their application, whether to the elbow, shoulder, or knee, produces variability.18
While the effects of platelets and growth factors in PRP have been well studied, less is known about the effects of differing cell types. Recently it was reported that the concentrations of leukocytes directly affect the outcomes of PRP injections. McCarrel and colleagues19,20 found that as the number of leukocytes increased, there was a concomitant increase in the expression of inflammatory cytokines and catabolic activity. This effect may result in inferior healing of injured tissues and is attributed to the release of pro-inflammatory cytokines such as interleukin-1β from the leukocytes.21 There is also evidence that minimizing the catabolic effect of leukocytes may be just as important to tissue healing as the maximizing anabolic effect of platelets and growth factors.22
The use of PRP has been highly disputed in recent years due to conflicting reports of its success in treating orthopedic conditions. Numerous favorable studies have shown benefit for treating chronic and acute orthopedic injuries including; rotator cuff tear repair, chronic refractory patellar tendinopathy, and chronic lateral tendinosis/epicondylitis.23-26 Concurrently, articles demonstrating no significant effects from PRP have also been published. One study claiming that PRP injections did not improve outcomes of chronic Achilles tendinopathy did not differentiate whether patients had tendinosis or tendinitis, and did not consider leukocyte concentration in their PRP preparations27 Another study that determined PRP is not beneficial to the healing of ruptured Achilles tendons after surgical repair also failed to consider the concentration of leukocytes in their PRP preparations.28 One of the difficulties in comparing these studies is their heterogeneous nature. This arises from the use of different conditions in each study that makes the studies incomparable. Variations in PRP preparations lead to different concentrations of growth factors, platelets, and leukocyte concentrations. Additionally, tendinopathy models were not specified as tendinosis and tendonitis, and models or patients were not controlled for age, sex, or comorbidities. Given that leukocyte-rich and leukocyte-poor PRP preparations are currently widely used in clinical practice, the discovery of which type of preparation is indicated in which setting is paramount to evidence-based use of this treatment modality. Due to reports suggesting that leukocytes may be detrimental to tendon healing, determining which types of leukocytes are responsible for these effects is vital. As such, the purpose of this study is to determine the in vivo effects of sub-populations of leukocytes on normal rat tendons. This study design allowed us to isolate the effects of the injections to induce a response and remove confounding effects of normal healing response to a damaged tendon and effects from the injection itself. Our hypothesis was that the injection of leukocytes would cause an inflammatory response in rat tendons, leading to catabolic outcomes.
Continue to: METHODS...
METHODS
This was a prospective, in vivo, placebo controlled, randomized animal study. The University’s Institutional Animal Care and Use Committee approved all procedures prior to initiation. Twenty-four male Sprague-Dawley rats were randomized to 3 treatment groups (n = 8): monocytes; granulocytes, and; plasma, as a negative control.
Allogenic blood from 6 additional rats was collected into K2EDTA tubes via cardiac puncture. Allogenic, as opposed to autogenic, blood is commonly used in rat models because of low immunogenic response to blood from rats of the same strain and litter.29,30 The blood was then pooled and the red cells lysed by incubation with Red Blood Cell Lysis Buffer (Roche). The samples were then sorted into fractions containing monocytes and granulocytes using fluorescence activated cell sorting (FACS) using a FACSAria (BD Biosciences). Cells were sorted using Purified PE Mouse Anti-Rat CD11b/c antibodies (BD Pharmingen) specific to monocytes, granulocytes, macrophages, dendritic cells, and microglia, APC-Cy7 Mouse Anti-Rat CD45 antibodies (BD Pharmingen) specific to all hematopoietic cells except erythrocytes, and FITC Mouse Anti-Rat CD42d antibodies (BD Pharmingen) specific to megakaryocytes and platelets. 20 μL of 0.2 mg/mL CD11b/c, 20 μL of 0.2 mg/mL CD 45, and 10 μL of 0.5 mg/mL CD42d antibodies were added to 1 mL of condensed non-red cells collected from the 6 rats and incubated at room temperature in the dark for 15 minutes. A fraction containing only platelet-poor plasma was also collected. For all treatments the injection volume was 75 μL. Rats in the monocyte group were injected with 200,000 cells in platelet-poor plasma, those in the granulocyte group were injected with 900,000 cells in platelet-poor plasma, and rats in the plasma control group received only platelet-poor plasma. The cell concentrations were based on previous studies that documented these concentrations that are found in typical leukocyte-rich PRP preparations.13
The animals were anesthetized with isoflurane gas and then injected aseptically once into their right Achilles tendon. The left Achilles tendon was used as an un-injected control, giving a total of 48 total Achilles tendons studied. At days 7 and 14 post-injection, 4 rats from each group were euthanized and the Achilles tendons were harvested.
The tendons were fixed in neutral buffered formalin for 24 hours and then embedded in paraffin and sectioned sagittally at 12 μm. The tendons were then stained with hematoxylin and eosin (H&E) using standard histological protocols and examined by 3 individuals trained to assess cellularity and morphology. All samples were assigned unrecognizable numbers and randomized prior to examination by individuals. Cell counts were based on the number of nuclei present in 3 mid-tendon high-power fields (400x) per sample. Morphology was graded on a scale of 1 to 3, with 1 being a normal tendon and 3 having severe pathology with total loss of alignment and crimping on 3 low-power fields (100x) per sample (Figures 1A-1G).
Vascularity was assessed by immunohistochemical staining using Rabbit Polyclonal Anti-CD31 antibodies (Abcam), a marker for vascular endothelial cells, using a Vectastain ABC Kit (Vector Laboratories) system and the ImmPACT AEC Peroxidase (HRP) Substrate (Vector Laboratories). Following staining, automated image analysis was performed (Bioquant). Briefly, all areas that did not contain tendon were masked. CD31 positive areas were then quantified using global thresholding. Vascularity was then calculated as ratio of CD31 positive area to total tendon area. Analyses were performed on 3 mid-tendon medium-power (200x) fields per sample.
For cellularity and morphology, the results for the injected tendons were normalized to those of their contralateral untreated controls and reported as a percentage. Results for vascularity were compared directly between treated tendons. Differences were assessed between groups at each time-point using Independent Samples Median Tests. When significant differences were identified, pairwise comparisons were performed to identify the source of the differences. All analyses were conducted using SPSS (V22, SAS Institute) with significant differences determined for values of P < 0.05.
RESULTS
No significant differences in cellularity between groups were seen at day 7 (P = 0.368) (Figures 1A-1G). However, a significant difference in cellularity between groups was seen at day 14 (P = 0.014). Pairwise tests showed there to be a significant increase in the number of cells in the tendons treated with granulocytes from 221% and 249% in cellularity (P = 0.014) on day 14, as compared to both monocytes and plasma, respectively. Morphologically, no significant differences were seen between groups at either time-point (P = 0.091 for day 7 and P = 1.000 for day 14) (Figures 2A-2G). However, a significant improvement in morphology was observed from day 7 to day 14 in the granulocyte group from 60% to 165% (P = 0.029). Finally, no differences were seen in vascularity between treatment groups at either time-point (P = 0.368 for day 7 and P = 0.535 for day 14) (Figures 3A-3G).
Continue to: DISCUSSION...
DISCUSSION
Our hypothesis that the injection of leukocytes would cause an inflammatory response in rat tendons leading to catabolic outcomes was confirmed in the granulocyte group. It should be noted that prior to the catabolic outcome, there was a transient anabolic effect in the granulocyte group during the second week. Deterioration in morphology was observed in the tendons injected with granulocytes on day 7, which subsequently recovered in the following week. We found that injecting granulocytes into normal tendons resulted in an increase in inflammatory cellularity, when compared to monocytes and plasma injections.
Limitations inherent in this study are those similar to other in vivo studies. To begin with, the results of injections into rat tendons may not be translatable to human tendons. Despite this limitation, the rat is a common model for tendon research.31 Another limitation is that this study injected healthy Achilles tendons, rather than tendons with preexisting tendinopathy. In a naturally occurring tendinopathy, there may be other factors present that interact with PRP, and this model negates the contribution of these factors. Finally, while the immunohistochemistry (IHC) and morphological data are clear, the cellularity data are not clear in identifying the type of cells that were increased by granulocyte injection. However, the cells appeared rounded, resembling inflammatory infiltrate; a common cell type seen in tendons.2 While fibroblasts are also a common infiltrate during chronic tendinopathy, they are generally flat and appear on H&E as long spindle shaped cells. Thus, we believe the increased cellularity of the tendons after granulocyte injections is representative of an increase in inflammation. The increased cellularity could be due to the increased number of cells injected into the tendon; however, our conclusions are consistent with the increased inflammation previously reported linking leukocytes to tendon inflammation.20,22,32
In terms of morphology, we hypothesized that degenerative changes would be seen in the tendons that were injected with granulocytes due to the inflammatory action of these cells. As part of the granulocyte response, neutrophils release proteases and macrophages can stimulate collagen synthesis via fibroblasts, both causing change within the extracellular matrix.33,34 Indeed, we observed a significant change in tissue morphology in the granulocyte group over the course of 14 days. As the degenerative and regenerative effects of granulocytes take time to present, this is likely what we observed to occur between day 7 and 14 after treatment. These observations are also consistent with prior observations that leukocyte-rich PRP injections can be detrimental to tendon healing, but beneficial to tissue degeneration in the setting of chronic tendonitis.20
We hypothesized that the vascularity of the tendons would be similar in all preparations. This was based on previous studies demonstrating that the lack of platelets in the platelet-poor plasma fraction is sufficient to deplete VEGF, the angiogenic agent in PRP.35 In this study, there were no observable differences in vascularity of platelet-poor plasma, monocyte, and granulocyte injections. We attribute this to the lack of VEGF in any of these preparations. The aforementioned study also showed that the lack of platelets in injection was enough to prevent the angiogenic effect of this treatment.35
Continue to: The goal of this study was...
The goal of this study was to assess the morphology, cellularity, and vascularity of normal tendons after injections of different leukocyte populations. This is clinically important because of the potential to tailor future PRP injections on a patient-by-patient basis. In patients requiring an anabolic response, leukocyte-poor PRP may be the best option. In contrast, when patient pathology requires an inflammatory response to improve healing36 or breakdown fibrotic tissue, as seen in tendinosis, leukocyte-rich PRP may be warranted. Further, properly controlled clinical studies are needed to validate these recommendations.
Limitations inherent in this study are those similar to other in vivo studies. First, the results of injections into rat tendons may not be translatable to human tendons. Despite this limitation, the rat is a common model for tendon research.31 A second limitation is that this study injected healthy Achilles tendons, rather than tendons with preexisting tendinopathy. In a naturally occurring tendinopathy, there may be other factors present that interact with PRP, and this model negates the contribution of these factors. Finally, while the IHC and morphological data show clear changes, the cellularity data are not clear in identifying the type of cells that were increased by granulocyte injection. However, the cells appeared rounded, resembling inflammatory infiltrate; a common cell type seen in tendons.2 While fibroblasts are also a common infiltrate during chronic tendinopathy, they are generally flat and appear on H&E as long spindle shaped cells. The last limitation of this study is the lack of functional mechanical testing since, clinically, healing of the tendon is also related to the strength of the tendon. Thus, we believe the increased cellularity of the tendons after granulocyte injections is representative of an increase in inflammation. Moreover, our results are consistent with the increased inflammation previously reported linking leukocytes to tendon inflammation.20,22,32 It is interesting to note that the increase in inflammation does not lead to an increase in vascularity as could be expected.
CONCLUSION
We found that the injection of leukocytes into healthy rat Achilles tendons increases inflammation, as evidenced by increased cellularity and disrupted morphology, which suggests that leukocyte-rich PRP preparations may be contraindicated in settings of acute tendonitis. However, these preparations may be useful for a specific subset of tendinopathies, including chronic tendinosis.
1. Herring SA, Nilson KL. Introduction to overuse injuries. Clin Sports Med. 1987;6(2):225-239.
2. Bass E. Tendinopathy: why the difference between tendinitis and tendinosis matters. Int J Ther Massage Bodywork. 2012;5(1):14-17.
3. James SL, Bates BT, Osternig LR. Injuries to runners. Am J Sports Med. 1978;6(2):40-50.
4. Allander E. Prevalence, incidence, and remission rates of some common rheumatic diseases or syndromes. Scand J Rheumatol. 1974;3(3):145-153.
5. Bahr R. No injuries, but plenty of pain? On the methodology for recording overuse symptoms in sports. Br J Sports Med. 2009;43(13):966-972.
6. Rees JD, Maffulli N, Cook J. Management of tendinopathy. Am J Sports Med. 2009;37(9):1855-1867.
7. Andres BM, Murrell GA. Treatment of tendinopathy: what works, what does not, and what is on the horizon. Clin Orthop Relat Res. 2008;466(7):1539-1554.
8. Hall MP, Band PA, Meislin RJ, Jazrawi LM, Cardone DA. Platelet-rich plasma: current concepts and application in sports medicine. J Am Acad Orthop Surg. 2009;17(10):602-608.
9. Smith JW. Blood Supply of Tendons. Am J Surg. 1965;109:272-276.
10. Wu PI, Diaz R, Borg-Stein J. Platelet-rich plasma. Phys Med Rehabil Clin N Am. 2016;27(4):825-853.
11. Nguyen RT, Borg-Stein J, McInnis K. Applications of platelet-rich plasma in musculoskeletal and sports medicine: an evidence-based approach. PM R. 2011;3(3):226-250.
12. Broughton G 2nd, Janis JE, Attinger CE. Wound healing: an overview. Plast Reconstr Surg. 2006;117(7 Suppl):1e-S-32e-S.
13. Mazzocca AD, McCarthy MB, Chowaniec DM, et al. Platelet-rich plasma differs according to preparation method and human variability. J Bone Joint Surg Am. 2012;94(4):308-316.
14. Mazzocca AD, McCarthy MB, Chowaniec DM, et al. The positive effects of different platelet-rich plasma methods on human muscle, bone, and tendon cells. Am J Sports Med. 2012;40(8):1742-1749.
15. Castillo TN, Pouliot MA, Kim HJ, Dragoo JL. Comparison of growth factor and platelet concentration from commercial platelet-rich plasma separation systems. Am J Sports Med. 2011;39(2):266-271.
16. Cho HS, Song IH, Park SY, Sung MC, Ahn MW, Song KE. Individual variation in growth factor concentrations in platelet-rich plasma and its influence on human mesenchymal stem cells. Korean J Lab Med. 2011;31(3):212-218.
17. Weibrich G, Kleis WK, Hafner G, Hitzler WE. Growth factor levels in platelet-rich plasma and correlations with donor age, sex, and platelet count. J Craniomaxillofac Surg. 2002;30(2):97-102.
18. Taylor DW, Petrera M, Hendry M, Theodoropoulos JS. A systematic review of the use of platelet-rich plasma in sports medicine as a new treatment for tendon and ligament injuries. Clin J Sport Med. 2011;21(4):344-352.
19. McCarrel T, Fortier L. Temporal growth factor release from platelet-rich plasma, trehalose lyophilized platelets, and bone marrow aspirate and their effect on tendon and ligament gene expression. J Orthop Res. 2009;27(8):1033-1042.
20. McCarrel TM, Minas T, Fortier LA. Optimization of leukocyte concentration in platelet-rich plasma for the treatment of tendinopathy. J Bone Joint Surg Am. 2012;94(19):e143(141-148).
21. Pillitteri D, Bassus S, Boller K, et al. Thrombin-induced interleukin 1beta synthesis in platelet suspensions: impact of contaminating leukocytes. Platelets. 2007;18(2):119-127.
22. Boswell SG, Schnabel LV, Mohammed HO, Sundman EA, Minas T, Fortier LA. Increasing platelet concentrations in leukocyte-reduced platelet-rich plasma decrease collagen gene synthesis in tendons. Am J Sports Med. 2014;42(1):42-49.
23. Mishra A, Pavelko T. Treatment of chronic elbow tendinosis with buffered platelet-rich plasma. Am J Sports Med. 2006;34(11):1774-1778.
24. Maniscalco P, Gambera D, Lunati A, et al. The "Cascade" membrane: a new PRP device for tendon ruptures. Description and case report on rotator cuff tendon. Acta Biomed. 2008;79(3):223-226.
25. Filardo G, Kon E, Della Villa S, Vincentelli F, Fornasari PM, Marcacci M. Use of platelet-rich plasma for the treatment of refractory jumper's knee. Int Orthop. 2010;34(6):909-915.
26. Peerbooms JC, Sluimer J, Bruijn DJ, Gosens T. Positive effect of an autologous platelet concentrate in lateral epicondylitis in a double-blind randomized controlled trial: platelet-rich plasma versus corticosteroid injection with a 1-year follow-up. Am J Sports Med. 2010;38(2):255-262.
27. de Vos RJ, Weir A, van Schie HT, et al. Platelet-rich plasma injection for chronic Achilles tendinopathy: a randomized controlled trial. JAMA. 2010;303(2):144-149.
28. Schepull T, Kvist J, Norrman H, Trinks M, Berlin G, Aspenberg P. Autologous platelets have no effect on the healing of human achilles tendon ruptures: a randomized single-blind study. Am J Sports Med. 2011;39(1):38-47.
29. Welsh KI, Burgos H, Batchelor JR. The immune response to allogeneic rat platelets; Ag-B antigens in matrix form lacking Ia. Eur J Immunol. 1977;7(5):267-272.
30. Xue M, Del Bigio MR. Intracortical hemorrhage injury in rats : relationship between blood fractions and brain cell death. Stroke. 2000;31(7):1721-1727.
31. Voleti PB, Buckley MR, Soslowsky LJ. Tendon healing: repair and regeneration. Annu Rev Biomed Eng. 2012;14:47-71.
32. Sundman EA, Cole BJ, Fortier LA. Growth factor and catabolic cytokine concentrations are influenced by the cellular composition of platelet-rich plasma. Am J Sports Med. 2011;39(10):2135-2140.
33. Palmgren MS, deShazo RD, Carter RM, Zimny ML, Shah SV. Mechanisms of neutrophil damage to human alveolar extracellular matrix: the role of serine and metalloproteases. J Allergy Clin Immunol. 1992;89(4):905-915.
34. Khalil N, Bereznay O, Sporn M, Greenberg AH. Macrophage production of transforming growth factor beta and fibroblast collagen synthesis in chronic pulmonary inflammation. J Exp Med. 1989;170(3):727-737.
35. Zhou Y, Zhang J, Wu H, Hogan MV, Wang JH. The differential effects of leukocyte-containing and pure platelet-rich plasma (PRP) on tendon stem/progenitor cells - implications of PRP application for the clinical treatment of tendon injuries. Stem Cell Res Ther. 2015;6:173.
36. Su B, O'Connor JP. NSAID therapy effects on healing of bone, tendon, and the enthesis. J Appl Physiol (1985). 2013;115(6):892-899.
TAKE-HOME POINTS
- Injection of leukocytes into healthy rat Achilles tendons increases inflammation.
- Injection of leukocytes into healthy rat Achilles tendons does not affect vascularity.
- Leukocyte-rich PRP preparations may be contraindicated in settings of acute tendonitis.
- Leukocyte-rich PRP preparations may be useful for chronic tendinosis.
- The concentration and composition of white blood cells within PRP preparations is variable and needs to be better understood in order to optimize clinical utility of PRP injections.
Does Patient Experience Predict 30-Day Readmission? A Patient-Level Analysis of HCAHPS Data
Patient experience and 30-day readmission are important measures of quality of care for hospitalized patients. Performance on both of these measures impact hospitals financially. Performance on the Hospital Consumer Assessment of Healthcare Systems and Providers (HCAHPS) survey is linked to 25% of the incentive payment under Value Based Purchasing (VBP) Program.1 Starting in 2012, the Centers for Medicare and Medicaid Services (CMS) introduced the Readmission Reduction Program, penalizing hospitals financially for excessive readmissions.2
A relationship between patient experience and readmissions has been explored at the hospital level. Studies have mostly found that higher patient experience scores are associated with lower 30-day readmission rates. In a study of the relationship between 30-day risk-standardized readmission rates for three medical conditions (acute myocardial infarction, heart failure, and pneumonia) and patient experience, the authors noted that higher experience scores for overall care and discharge planning were associated with lower readmission rates for these conditions. They also concluded that patient experience scores were more predictive of 30-day readmission than clinical performance measures. Additionally, the authors predicted that if a hospital increased its total experience scores from the 25th percentile to the 75th percentile, there would be an associated decrease in readmissions by at least 2.3% for each of these conditions.3 Practice management companies and the media have cited this finding to conclude that higher patient experience drives clinical outcomes such as 30-day readmission and that patients are often the best judges of the quality of care delivered.4,5
Other hospital-level studies have found that high 30-day readmission rates are associated with lower overall experience scores in a mixed surgical patient population; worse reports of pain control and overall care in the colorectal surgery population; lower experience scores with discharge preparedness in vascular surgery patients; and lower experience scores with physician communication, nurse communication, and discharge preparedness.6-9 A patient-level study noted higher readmissions are associated with worse experience with physician and nursing communication along with a paradoxically better experience with discharge information.10
Because these studies used an observational design, they demonstrated associations rather than causality. An alternative hypothesis is that readmitted patients complete their patient experience survey after readmission and the low experience is the result, rather than the cause, of their readmission. For patients who are readmitted, it is unclear whether there is an opportunity to complete the survey prior to readmission and whether being readmitted may impact patient perception of quality of care. Using patient-level data, we sought to assess HCAHPS patient-experience responses linked to the index admission of the patients who were readmitted in 30 days and compare it with those patients who were not readmitted during this time period. We paid particular attention to when the surveys were returned.
METHODS
Study Design
We conducted a retrospective analysis of prospectively collected 10-year HCAHPS and Press Ganey patient survey data for a single tertiary care academic hospital.
Participants
All adult patients discharged from the hospital and who responded to the routinely sent patient-experience survey were included. Surveys were sent to a random sample of 50% of the discharged patients.
The exposure group was comprised of patients who responded to the survey and were readmitted within 30 days of discharge. After subtracting 5 days from the survey receipt date for expected delays related to mail delivery time and processing time, survey response date was calculated. The exposure group was further divided into patients who responded to the survey prior to their 30-day readmission (“Pre-readmission responders”) and those that responded to the survey after their readmission (“Postreadmission responders”). A sensitivity analysis was performed by changing the number of days subtracted from the survey receipt date by 2 days in either direction. This approach did not result in any significant changes in the results.
The control group comprised patients who were not readmitted to the hospital within 30 days of discharge and who did not have an admission in the previous 30 days as well (“Not readmitted” group). An additional comparison group for exploratory analysis included patients who had experienced an admission in the prior 30 days but were not readmitted after the admission linked to the survey. These patients responded to the patient-experience surveys that were linked to their second admission in 30 days (“2nd-admission responders” group; Figure).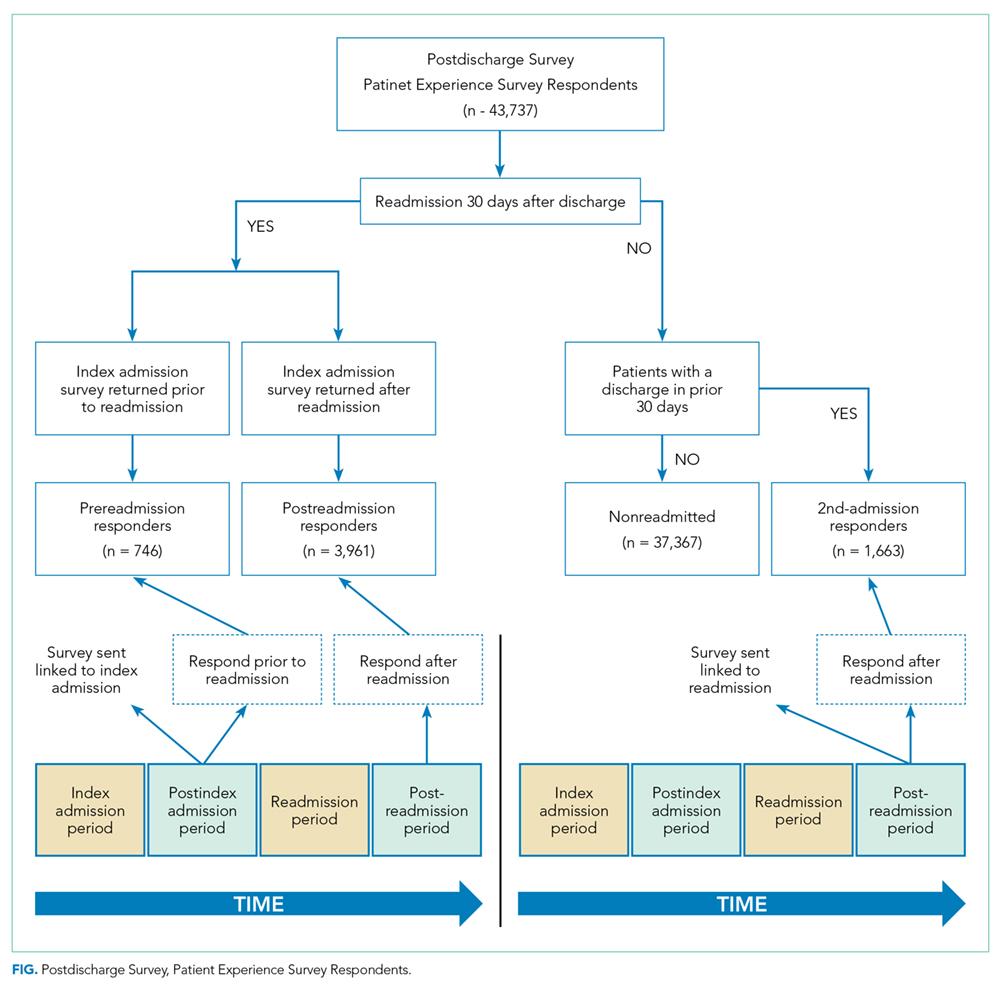
Time Periods
All survey responders from the third quarter of 2006 to the first quarter of 2016 were included in the study. Additionally, administrative data on non-responders were available from 7/2006 to 8/2012. These data were used to estimate response rates. Patient level experience and administrative data were obtained in a linked fashion for these time periods.
Instruments
Press Ganey and HCAHPS surveys were sent via mail in the same envelope. Fifty percent of the discharged patients were randomized to receive the surveys. The Press Ganey survey contained 33 items encompassing several subdomains, including room, meal, nursing, physician, ancillary staff, visitor, discharge, and overall experience.
The HCAHPS survey contained 29 CMS-mandated items, of which 21 are related to patient experience. The development, testing, and methods for administration and reporting of the HCAHPS survey have been previously described and studies using this instrument have been reported in the literature.11 Press Ganey patient satisfaction survey results have also been reported in the literature.12
Outcome Variables and Covariates
HCAHPS and Press Ganey experience survey individual item responses were the primary outcome variables of this study. Age, self-reported health status, education, primary language spoken, service line, and time taken to respond to the surveys served as the covariates. These variables are used by CMS for patient-mix adjustment and are collected on the HCAHPS survey. Additionally, the number of days to respond to the survey were included in all regression analysis to adjust for early responder effect.13-15
Statistical Analysis
“Percent top-box” scores were calculated for each survey item for patients in each group. The percent top-box scores were calculated as the percent of patients who responded “very good” for a given item on Press Ganey survey items and “always” or “definitely yes” or “yes” or “9” or “10” on HCAHPS survey items. CMS utilizes “percent top-box scores” to calculate payments under the VBP program and to report the results publicly. Numerous studies have also reported percent top-box scores for HCAHPS survey results.12
We hypothesized that whether patients complete the HCAHPS survey before or after the readmission influences their reporting of experience. To test this hypothesis, HCAHPS and Press Ganey item top-box scores of “Pre-readmission responders” and “Postreadmission responders” were compared with those of the control group using multivariate logistic regression. “Pre-readmission responders” were also compared with “Postreadmission responders”.
“2nd-admission responders” were similarly compared with the control group for an exploratory analysis. Finally, “Postreadmission responders” and “2nd-admission responders” were compared in another exploratory analysis since both these groups responded to the survey after being exposed to the readmission, even though the “Postreadmission responders” group is administratively linked to the index admission.
The Johns Hopkins Institutional Review Board approved this study.
RESULTS
There were 43,737 survey responders, among whom 4,707 were subsequently readmitted within 30 days of discharge. Among the readmitted patients who responded to the surveys linked to their index admission, only 15.8% returned the survey before readmission (pre-readmission responders’) and 84.2% returned the survey after readmission (postreadmission responders). Additionally, 1,663 patients responded to experience surveys linked to their readmission. There were 37,365 patients in the control arm (ie, patients who responded to the survey and were not readmitted within 30 days of discharge or in the prior 30 days; Figure 1). The readmission rate among survey responders was 10.6%. Among the readmitted patients, the median number of days to readmission was 10 days while the median number of days to respond to the survey for this group was 33 days. Among the nonreadmitted patients, the median number of days to return the survey was 29 days.
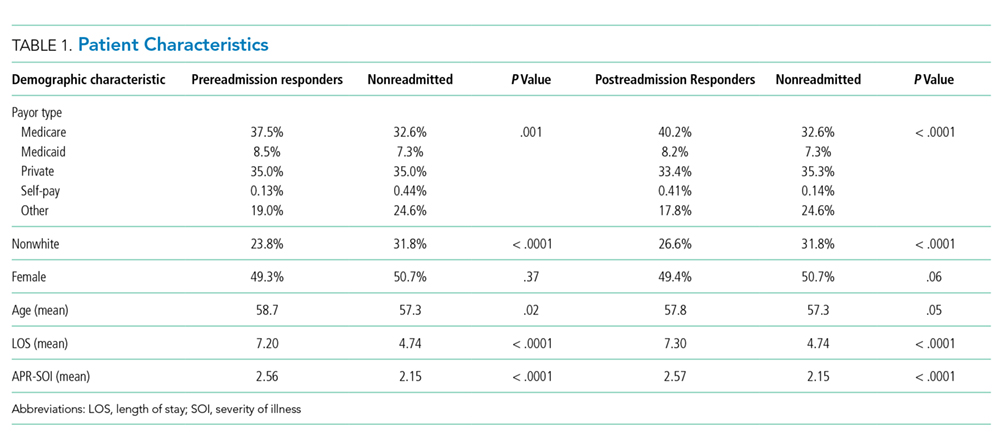

We also conducted an exploratory analysis of the postreadmission responders, comparing them with patients who received patient-experience surveys linked to their second admission in 30 days. Both of these groups were exposed to a readmission before they completed the surveys. There were no significant differences between these two groups on patient experience scores. Additionally, the patients who received the survey linked to their readmission had a broad dissatisfaction pattern on HCAHPS survey items that appeared similar to that of the postreadmission group when compared to the non-readmitted group (Table 3).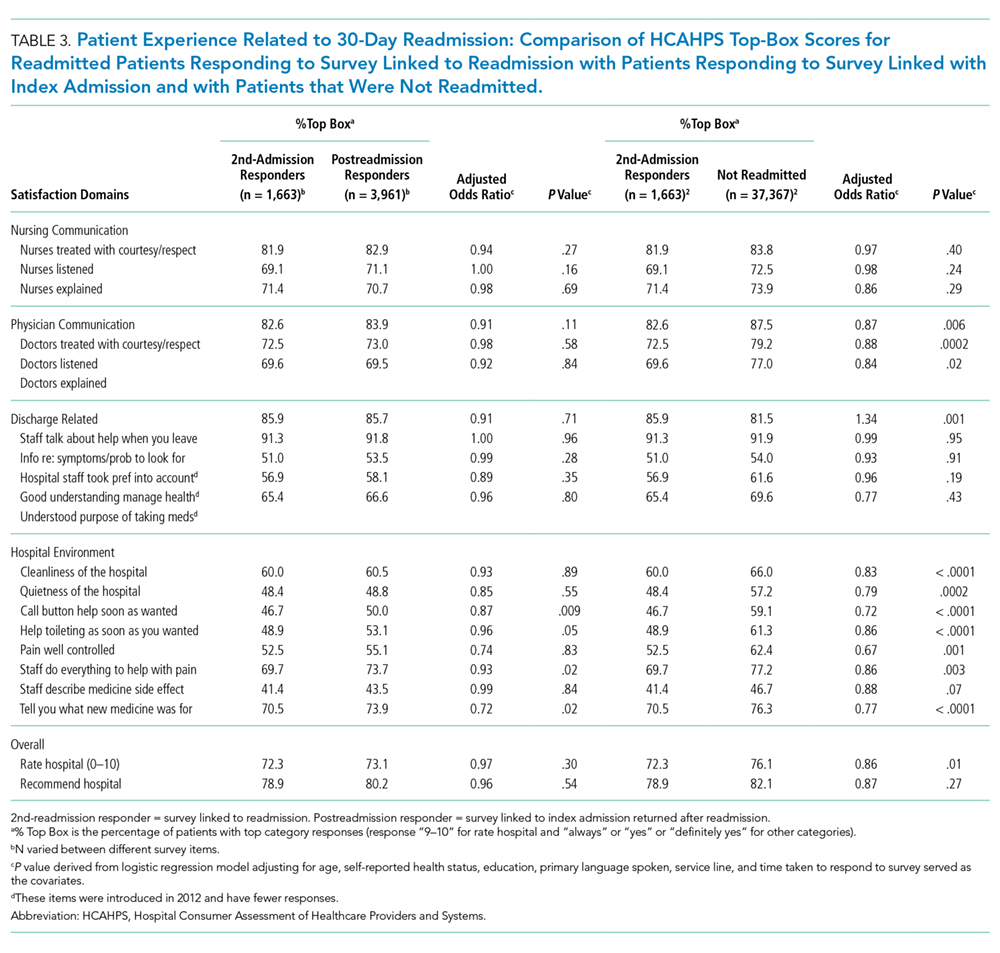
DISCUSSION
In this retrospective analysis of prospectively collected Press Ganey and HCAHPS patient-experience survey data, we found that the overwhelming majority of patients readmitted within 30 days of discharge respond to HCAHPS surveys after readmission even though the survey is sent linked to the first admission. This is not unexpected since the median time to survey response is 33 days for this group, while median time to readmission is 10 days. The dissatisfaction pattern of Postreadmission responders was similar to those who responded to the survey linked to the readmission. When a patient is readmitted prior to completing the survey, their responses appear to reflect the cumulative experience of the index admission and the readmission. The lower scores of those who respond to the survey after their readmission appear to be a driver for lower patient-experience scores related to readmissions. Overall, readmission was associated with lower scores on items in five of the nine domains used to calculate patient experience related payments under VBP.16
These findings have important implications in inferring the direction of potential causal relationship between readmissions and patient experience at the hospital level. Additionally, these patients show broad dissatisfaction with areas beyond physician communication and discharge planning. These include staff responsiveness, phlebotomy, meals, hospital cleanliness, and noise level. This pattern of dissatisfaction may represent impatience and frustration with spending additional time in the hospital environment.
Our results are consistent with findings of many of the earlier studies, but our study goes a step further by using patient-level data and incorporating survey response time in our analysis.3,7,9,10 By separating out the readmitted patients who responded to the survey prior to admission, we attempted to address the ability of patients’ perception of care to predict future readmissions. Our results do not support this idea, since pre-readmission responders had similar experience scores to non-readmitted patients. However, because of the low numbers of pre-readmission responders, the comparison lacks precision. Current HCAHPS and Press Ganey questions may lack the ability to predict future readmissions because of the timing of the survey (postdischarge) or the questions themselves.
Overall, postreadmission responders are dissatisfied with multiple domains of hospital care. Many of these survey responses may simply be related to general frustration. Alternatively, they may represent a patient population with a high degree of needs that are not as easily met by a hospital’s routine processes of care. Even though the readmission rates were 10.6% among survey responders, 14.6% of the survey responses were associated with readmissions after accounting for those who respond to surveys linked to readmission. These patients could have significant impact on cumulative experience scores.
Our study has a few limitations. First, it involves a single tertiary care academic center study, and our results may not be generalizable. Second, we did not adjust for some of the patient characteristics associated with readmissions. Patients who were admitted within 30 days are different than those not readmitted based on payor, race, length of stay, and severity of illness, and we did not adjust for these factors in our analysis. This was intentional, however. Our goal was to better understand the relationship between 30-day readmission and patient experience scores as they are used for hospital-level studies, VBP, and public reporting. For these purposes, the scores are not adjusted for factors, such as payor and length of stay. We did adjust for patient-mix adjustment factors used by CMS. Third, the response rates to the HCAHPS were low and may have biased the scores. However, HCAHPS is widely used for comparisons between hospitals has been validated, and our study results have implications with regard to comparing hospital-level performance. HCAHPS results are relevant to policy and have financial consequences.17 Fourth, our study did not directly compare whether the relationship between patient experience for the postreadmission group and nonreadmitted group was different from the relationship between the pre-readmission group and postreadmission group. It is possible that there is no difference in relationship between the groups. However, despite the small number of pre-readmission responders, these patients tended to have more favorable experience responses than those who responded after being readmitted, even after adjusting for response time. Although the P values are nonsignificant for many comparisons, the directionality of the effect is relatively consistent. Also, the vast majority of the patients fall in the postreadmission group, and these patients appear to drive the overall experience related to readmissions. Finally, since relatively few patients turned in surveys prior to readmission, we had limited power to detect a significant difference between these pre-readmission responders and nonreadmitted patients.
Our study has implications for policy makers, researchers, and providers. The HCAHPS scores of patients who are readmitted and completed the survey after being readmitted reflects their experience of both the index admission and the readmission. We did not find evidence to support that HCAHPS survey responses predict future readmissions at the patient level. Our findings do support the concept that lower readmissions rates (whether due to the patient population or processes of care that decrease readmission rates) may improve HCAHPS scores. We suggest caution in assuming that improving patient experience is likely to reduce readmission rates.
Disclosures
The authors declare no conflicts of interest.
1. Hospital value-based purchasing. https://www.cms.gov/Outreach-and-Education/Medicare-Learning-Network-MLN/MLNProducts/downloads/Hospital_VBPurchasing_Fact_Sheet_ICN907664.pdf. Accessed June 25, 2016.
2. Readmissions reduction program (HRRP). Centers for Medicare & Medicaid Services. https://www.cms.gov/medicare/medicare-fee-for-service-payment/acuteinpatientpps/readmissions-reduction-program.html. Accessed June 25, 2016.
3. Boulding W, Glickman SW, Manary MP, Schulman KA, Staelin R. Relationship between patient satisfaction with inpatient care and hospital readmission within 30 days. Am J Manag Care. 2011;17(1):41-48. PubMed
4. Buum HA, Duran-Nelson AM, Menk J, Nixon LJ. Duty-hours monitoring revisited: self-report may not be adequate. Am J Med. 2013;126(4):362-365. doi: 10.1016/j.amjmed.2012.12.003 PubMed
5. Choma NN, Vasilevskis EE, Sponsler KC, Hathaway J, Kripalani S. Effect of the ACGME 16-hour rule on efficiency and quality of care: duty hours 2.0. JAMA Int Med. 2013;173(9):819-821. doi: 10.1001/jamainternmed.2013.3014 PubMed
6. Brooke BS, Samourjian E, Sarfati MR, Nguyen TT, Greer D, Kraiss LW. RR3. Patient-reported readiness at time of discharge predicts readmission following vascular surgery. J Vasc Surg. 2015;61(6):188S. doi: 10.1016/j.jvs.2015.04.356
7. Duraes LC, Merlino J, Stocchi L, et al. 756 readmission decreases patient satisfaction in colorectal surgery. Gastroenterology. 2014;146(5):S-1029. doi: 10.1016/S0016-5085(14)63751-3
8. Mitchell JP. Association of provider communication and discharge instructions on lower readmissions. J Healthc Qual. 2015;37(1):33-40. doi: 10.1097/01.JHQ.0000460126.88382.13 PubMed
9. Tsai TC, Orav EJ, Jha AK. Patient satisfaction and quality of surgical care in US hospitals. Ann Surg. 2015;261(1):2-8. doi: 10.1097/SLA.0000000000000765 PubMed
10. Hachem F, Canar J, Fullam M, Andrew S, Hohmann S, Johnson C. The relationships between HCAHPS communication and discharge satisfaction items and hospital readmissions. Patient Exp J. 2014;1(2):71-77.
11. Irby DM, Cooke M, Lowenstein D, Richards B. The academy movement: a structural approach to reinvigorating the educational mission. Acad Med. 2004;79(8):729-736. doi: 10.1097/00001888-200408000-00003 PubMed
12. Siddiqui ZK, Zuccarelli R, Durkin N, Wu AW, Brotman DJ. Changes in patient satisfaction related to hospital renovation: experience with a new clinical building. J Hosp Med. 2015;10(3):165-171. doi: 10.1002/jhm.2297 PubMed
13. Nair BR, Coughlan JL, Hensley MJ. Student and patient perspectives on bedside teaching. Med Educ. 1997;31(5):341-346. doi: 10.1046/j.1365-2923.1997.00673.x PubMed
14. Elliott MN, Zaslavsky AM, Goldstein E, et al. Effects of survey mode, patient mix, and nonresponse on CAHPS® hospital survey scores. BMC Health Serv Res. 2009;44(2p1):501-518. doi: 10.1111/j.1475-6773.2008.00914.x PubMed
15. Saunders CL, Elliott MN, Lyratzopoulos G, Abel GA. Do differential response rates to patient surveys between organizations lead to unfair performance comparisons?: evidence from the English Cancer Patient Experience Survey. Medical care. 2016;54(1):45. doi: 10.1097/MLR.0000000000000457 PubMed
16. Sabel E, Archer J. “Medical education is the ugly duckling of the medical world” and other challenges to medical educators’ identity construction: a qualitative study. Acad Med. 2014;89(11):1474-1480. doi: 10.1097/ACM.0000000000000420 PubMed
17. O’Malley AJ, Zaslavsky AM, Elliott MN, Zaborski L, Cleary PD. Case‐Mix adjustment of the CAHPS® Hospital Survey. BMC Health Serv Res. 2005;40(6p2):2162-2181. doi: 10.1111/j.1475-6773.2005.00470.x
Patient experience and 30-day readmission are important measures of quality of care for hospitalized patients. Performance on both of these measures impact hospitals financially. Performance on the Hospital Consumer Assessment of Healthcare Systems and Providers (HCAHPS) survey is linked to 25% of the incentive payment under Value Based Purchasing (VBP) Program.1 Starting in 2012, the Centers for Medicare and Medicaid Services (CMS) introduced the Readmission Reduction Program, penalizing hospitals financially for excessive readmissions.2
A relationship between patient experience and readmissions has been explored at the hospital level. Studies have mostly found that higher patient experience scores are associated with lower 30-day readmission rates. In a study of the relationship between 30-day risk-standardized readmission rates for three medical conditions (acute myocardial infarction, heart failure, and pneumonia) and patient experience, the authors noted that higher experience scores for overall care and discharge planning were associated with lower readmission rates for these conditions. They also concluded that patient experience scores were more predictive of 30-day readmission than clinical performance measures. Additionally, the authors predicted that if a hospital increased its total experience scores from the 25th percentile to the 75th percentile, there would be an associated decrease in readmissions by at least 2.3% for each of these conditions.3 Practice management companies and the media have cited this finding to conclude that higher patient experience drives clinical outcomes such as 30-day readmission and that patients are often the best judges of the quality of care delivered.4,5
Other hospital-level studies have found that high 30-day readmission rates are associated with lower overall experience scores in a mixed surgical patient population; worse reports of pain control and overall care in the colorectal surgery population; lower experience scores with discharge preparedness in vascular surgery patients; and lower experience scores with physician communication, nurse communication, and discharge preparedness.6-9 A patient-level study noted higher readmissions are associated with worse experience with physician and nursing communication along with a paradoxically better experience with discharge information.10
Because these studies used an observational design, they demonstrated associations rather than causality. An alternative hypothesis is that readmitted patients complete their patient experience survey after readmission and the low experience is the result, rather than the cause, of their readmission. For patients who are readmitted, it is unclear whether there is an opportunity to complete the survey prior to readmission and whether being readmitted may impact patient perception of quality of care. Using patient-level data, we sought to assess HCAHPS patient-experience responses linked to the index admission of the patients who were readmitted in 30 days and compare it with those patients who were not readmitted during this time period. We paid particular attention to when the surveys were returned.
METHODS
Study Design
We conducted a retrospective analysis of prospectively collected 10-year HCAHPS and Press Ganey patient survey data for a single tertiary care academic hospital.
Participants
All adult patients discharged from the hospital and who responded to the routinely sent patient-experience survey were included. Surveys were sent to a random sample of 50% of the discharged patients.
The exposure group was comprised of patients who responded to the survey and were readmitted within 30 days of discharge. After subtracting 5 days from the survey receipt date for expected delays related to mail delivery time and processing time, survey response date was calculated. The exposure group was further divided into patients who responded to the survey prior to their 30-day readmission (“Pre-readmission responders”) and those that responded to the survey after their readmission (“Postreadmission responders”). A sensitivity analysis was performed by changing the number of days subtracted from the survey receipt date by 2 days in either direction. This approach did not result in any significant changes in the results.
The control group comprised patients who were not readmitted to the hospital within 30 days of discharge and who did not have an admission in the previous 30 days as well (“Not readmitted” group). An additional comparison group for exploratory analysis included patients who had experienced an admission in the prior 30 days but were not readmitted after the admission linked to the survey. These patients responded to the patient-experience surveys that were linked to their second admission in 30 days (“2nd-admission responders” group; Figure).
Time Periods
All survey responders from the third quarter of 2006 to the first quarter of 2016 were included in the study. Additionally, administrative data on non-responders were available from 7/2006 to 8/2012. These data were used to estimate response rates. Patient level experience and administrative data were obtained in a linked fashion for these time periods.
Instruments
Press Ganey and HCAHPS surveys were sent via mail in the same envelope. Fifty percent of the discharged patients were randomized to receive the surveys. The Press Ganey survey contained 33 items encompassing several subdomains, including room, meal, nursing, physician, ancillary staff, visitor, discharge, and overall experience.
The HCAHPS survey contained 29 CMS-mandated items, of which 21 are related to patient experience. The development, testing, and methods for administration and reporting of the HCAHPS survey have been previously described and studies using this instrument have been reported in the literature.11 Press Ganey patient satisfaction survey results have also been reported in the literature.12
Outcome Variables and Covariates
HCAHPS and Press Ganey experience survey individual item responses were the primary outcome variables of this study. Age, self-reported health status, education, primary language spoken, service line, and time taken to respond to the surveys served as the covariates. These variables are used by CMS for patient-mix adjustment and are collected on the HCAHPS survey. Additionally, the number of days to respond to the survey were included in all regression analysis to adjust for early responder effect.13-15
Statistical Analysis
“Percent top-box” scores were calculated for each survey item for patients in each group. The percent top-box scores were calculated as the percent of patients who responded “very good” for a given item on Press Ganey survey items and “always” or “definitely yes” or “yes” or “9” or “10” on HCAHPS survey items. CMS utilizes “percent top-box scores” to calculate payments under the VBP program and to report the results publicly. Numerous studies have also reported percent top-box scores for HCAHPS survey results.12
We hypothesized that whether patients complete the HCAHPS survey before or after the readmission influences their reporting of experience. To test this hypothesis, HCAHPS and Press Ganey item top-box scores of “Pre-readmission responders” and “Postreadmission responders” were compared with those of the control group using multivariate logistic regression. “Pre-readmission responders” were also compared with “Postreadmission responders”.
“2nd-admission responders” were similarly compared with the control group for an exploratory analysis. Finally, “Postreadmission responders” and “2nd-admission responders” were compared in another exploratory analysis since both these groups responded to the survey after being exposed to the readmission, even though the “Postreadmission responders” group is administratively linked to the index admission.
The Johns Hopkins Institutional Review Board approved this study.
RESULTS
There were 43,737 survey responders, among whom 4,707 were subsequently readmitted within 30 days of discharge. Among the readmitted patients who responded to the surveys linked to their index admission, only 15.8% returned the survey before readmission (pre-readmission responders’) and 84.2% returned the survey after readmission (postreadmission responders). Additionally, 1,663 patients responded to experience surveys linked to their readmission. There were 37,365 patients in the control arm (ie, patients who responded to the survey and were not readmitted within 30 days of discharge or in the prior 30 days; Figure 1). The readmission rate among survey responders was 10.6%. Among the readmitted patients, the median number of days to readmission was 10 days while the median number of days to respond to the survey for this group was 33 days. Among the nonreadmitted patients, the median number of days to return the survey was 29 days.
We also conducted an exploratory analysis of the postreadmission responders, comparing them with patients who received patient-experience surveys linked to their second admission in 30 days. Both of these groups were exposed to a readmission before they completed the surveys. There were no significant differences between these two groups on patient experience scores. Additionally, the patients who received the survey linked to their readmission had a broad dissatisfaction pattern on HCAHPS survey items that appeared similar to that of the postreadmission group when compared to the non-readmitted group (Table 3).
DISCUSSION
In this retrospective analysis of prospectively collected Press Ganey and HCAHPS patient-experience survey data, we found that the overwhelming majority of patients readmitted within 30 days of discharge respond to HCAHPS surveys after readmission even though the survey is sent linked to the first admission. This is not unexpected since the median time to survey response is 33 days for this group, while median time to readmission is 10 days. The dissatisfaction pattern of Postreadmission responders was similar to those who responded to the survey linked to the readmission. When a patient is readmitted prior to completing the survey, their responses appear to reflect the cumulative experience of the index admission and the readmission. The lower scores of those who respond to the survey after their readmission appear to be a driver for lower patient-experience scores related to readmissions. Overall, readmission was associated with lower scores on items in five of the nine domains used to calculate patient experience related payments under VBP.16
These findings have important implications in inferring the direction of potential causal relationship between readmissions and patient experience at the hospital level. Additionally, these patients show broad dissatisfaction with areas beyond physician communication and discharge planning. These include staff responsiveness, phlebotomy, meals, hospital cleanliness, and noise level. This pattern of dissatisfaction may represent impatience and frustration with spending additional time in the hospital environment.
Our results are consistent with findings of many of the earlier studies, but our study goes a step further by using patient-level data and incorporating survey response time in our analysis.3,7,9,10 By separating out the readmitted patients who responded to the survey prior to admission, we attempted to address the ability of patients’ perception of care to predict future readmissions. Our results do not support this idea, since pre-readmission responders had similar experience scores to non-readmitted patients. However, because of the low numbers of pre-readmission responders, the comparison lacks precision. Current HCAHPS and Press Ganey questions may lack the ability to predict future readmissions because of the timing of the survey (postdischarge) or the questions themselves.
Overall, postreadmission responders are dissatisfied with multiple domains of hospital care. Many of these survey responses may simply be related to general frustration. Alternatively, they may represent a patient population with a high degree of needs that are not as easily met by a hospital’s routine processes of care. Even though the readmission rates were 10.6% among survey responders, 14.6% of the survey responses were associated with readmissions after accounting for those who respond to surveys linked to readmission. These patients could have significant impact on cumulative experience scores.
Our study has a few limitations. First, it involves a single tertiary care academic center study, and our results may not be generalizable. Second, we did not adjust for some of the patient characteristics associated with readmissions. Patients who were admitted within 30 days are different than those not readmitted based on payor, race, length of stay, and severity of illness, and we did not adjust for these factors in our analysis. This was intentional, however. Our goal was to better understand the relationship between 30-day readmission and patient experience scores as they are used for hospital-level studies, VBP, and public reporting. For these purposes, the scores are not adjusted for factors, such as payor and length of stay. We did adjust for patient-mix adjustment factors used by CMS. Third, the response rates to the HCAHPS were low and may have biased the scores. However, HCAHPS is widely used for comparisons between hospitals has been validated, and our study results have implications with regard to comparing hospital-level performance. HCAHPS results are relevant to policy and have financial consequences.17 Fourth, our study did not directly compare whether the relationship between patient experience for the postreadmission group and nonreadmitted group was different from the relationship between the pre-readmission group and postreadmission group. It is possible that there is no difference in relationship between the groups. However, despite the small number of pre-readmission responders, these patients tended to have more favorable experience responses than those who responded after being readmitted, even after adjusting for response time. Although the P values are nonsignificant for many comparisons, the directionality of the effect is relatively consistent. Also, the vast majority of the patients fall in the postreadmission group, and these patients appear to drive the overall experience related to readmissions. Finally, since relatively few patients turned in surveys prior to readmission, we had limited power to detect a significant difference between these pre-readmission responders and nonreadmitted patients.
Our study has implications for policy makers, researchers, and providers. The HCAHPS scores of patients who are readmitted and completed the survey after being readmitted reflects their experience of both the index admission and the readmission. We did not find evidence to support that HCAHPS survey responses predict future readmissions at the patient level. Our findings do support the concept that lower readmissions rates (whether due to the patient population or processes of care that decrease readmission rates) may improve HCAHPS scores. We suggest caution in assuming that improving patient experience is likely to reduce readmission rates.
Disclosures
The authors declare no conflicts of interest.
1. Hospital value-based purchasing. https://www.cms.gov/Outreach-and-Education/Medicare-Learning-Network-MLN/MLNProducts/downloads/Hospital_VBPurchasing_Fact_Sheet_ICN907664.pdf. Accessed June 25, 2016.
2. Readmissions reduction program (HRRP). Centers for Medicare & Medicaid Services. https://www.cms.gov/medicare/medicare-fee-for-service-payment/acuteinpatientpps/readmissions-reduction-program.html. Accessed June 25, 2016.
3. Boulding W, Glickman SW, Manary MP, Schulman KA, Staelin R. Relationship between patient satisfaction with inpatient care and hospital readmission within 30 days. Am J Manag Care. 2011;17(1):41-48. PubMed
4. Buum HA, Duran-Nelson AM, Menk J, Nixon LJ. Duty-hours monitoring revisited: self-report may not be adequate. Am J Med. 2013;126(4):362-365. doi: 10.1016/j.amjmed.2012.12.003 PubMed
5. Choma NN, Vasilevskis EE, Sponsler KC, Hathaway J, Kripalani S. Effect of the ACGME 16-hour rule on efficiency and quality of care: duty hours 2.0. JAMA Int Med. 2013;173(9):819-821. doi: 10.1001/jamainternmed.2013.3014 PubMed
6. Brooke BS, Samourjian E, Sarfati MR, Nguyen TT, Greer D, Kraiss LW. RR3. Patient-reported readiness at time of discharge predicts readmission following vascular surgery. J Vasc Surg. 2015;61(6):188S. doi: 10.1016/j.jvs.2015.04.356
7. Duraes LC, Merlino J, Stocchi L, et al. 756 readmission decreases patient satisfaction in colorectal surgery. Gastroenterology. 2014;146(5):S-1029. doi: 10.1016/S0016-5085(14)63751-3
8. Mitchell JP. Association of provider communication and discharge instructions on lower readmissions. J Healthc Qual. 2015;37(1):33-40. doi: 10.1097/01.JHQ.0000460126.88382.13 PubMed
9. Tsai TC, Orav EJ, Jha AK. Patient satisfaction and quality of surgical care in US hospitals. Ann Surg. 2015;261(1):2-8. doi: 10.1097/SLA.0000000000000765 PubMed
10. Hachem F, Canar J, Fullam M, Andrew S, Hohmann S, Johnson C. The relationships between HCAHPS communication and discharge satisfaction items and hospital readmissions. Patient Exp J. 2014;1(2):71-77.
11. Irby DM, Cooke M, Lowenstein D, Richards B. The academy movement: a structural approach to reinvigorating the educational mission. Acad Med. 2004;79(8):729-736. doi: 10.1097/00001888-200408000-00003 PubMed
12. Siddiqui ZK, Zuccarelli R, Durkin N, Wu AW, Brotman DJ. Changes in patient satisfaction related to hospital renovation: experience with a new clinical building. J Hosp Med. 2015;10(3):165-171. doi: 10.1002/jhm.2297 PubMed
13. Nair BR, Coughlan JL, Hensley MJ. Student and patient perspectives on bedside teaching. Med Educ. 1997;31(5):341-346. doi: 10.1046/j.1365-2923.1997.00673.x PubMed
14. Elliott MN, Zaslavsky AM, Goldstein E, et al. Effects of survey mode, patient mix, and nonresponse on CAHPS® hospital survey scores. BMC Health Serv Res. 2009;44(2p1):501-518. doi: 10.1111/j.1475-6773.2008.00914.x PubMed
15. Saunders CL, Elliott MN, Lyratzopoulos G, Abel GA. Do differential response rates to patient surveys between organizations lead to unfair performance comparisons?: evidence from the English Cancer Patient Experience Survey. Medical care. 2016;54(1):45. doi: 10.1097/MLR.0000000000000457 PubMed
16. Sabel E, Archer J. “Medical education is the ugly duckling of the medical world” and other challenges to medical educators’ identity construction: a qualitative study. Acad Med. 2014;89(11):1474-1480. doi: 10.1097/ACM.0000000000000420 PubMed
17. O’Malley AJ, Zaslavsky AM, Elliott MN, Zaborski L, Cleary PD. Case‐Mix adjustment of the CAHPS® Hospital Survey. BMC Health Serv Res. 2005;40(6p2):2162-2181. doi: 10.1111/j.1475-6773.2005.00470.x
© 2018 Society of Hospital Medicine
Prospective Randomized Evaluation of Preoperative Angiotensin-Converting Enzyme Inhibition (PREOP-ACEI)
Over 7 million surgeries are performed in United States hospitals each year. Among these surgeries, approximately 85% are noncardiac, nonvascular (NCNV) procedures.1,2 Although the preoperative use of an angiotensin-converting enzyme inhibitor (ACEI) can be expected in as many as 13% of these surgeries,3 the optimal preoperative ACEI management strategy for patients undergoing NCNV surgeries is poorly understood.
High-quality evidence suggests that renin–angiotensin–aldosterone system (RAAS) inhibitors are associated with intraoperative hypotension among patients undergoing cardiac or vascular surgeries.4-6 Intraoperative hypotension increases the risk of 30-day mortality,7 and the duration of intraoperative hypotension increases the risk of end organ damage.8,9 This body of evidence suggests that withholding ACEIs prior to cardiac and vascular surgeries is safer than continuing ACEIs without interruption.
The evidence concerning perioperative management of ACEIs is inconclusive for patients undergoing NCNV procedures. Some studies comparing patients taking or not taking a RAAS inhibitor preoperatively describe negligible differences in the frequency of intraoperative hypotensive episodes or complications.3,10 Others have found an increased risk of intraoperative hypotension and associated postoperative adverse events in patients continuing RAAS inhibitors preoperatively.11,12 Current guideline discrepancies reflect the uncertainty of the evidence. The guidelines set by the American College of Cardiology and American Heart Association (ACC/AHA) suggest the uninterrupted perioperative continuation of RAAS inhibitors.13 The guidelines provided by the European Society of Cardiology and European Society of Anaesthesiology also suggest the continuation of RAAS inhibitors throughout the perioperative period for patients with systolic heart failure but recommend transient discontinuation for patients with hypertension.14
This randomized study aimed to compare the effect of two practical strategies for preoperative ACEI management on the perioperative blood pressure of patients undergoing NCNV surgery. The two strategies studied were the omission of the final preoperative ACEI dose and the uninterrupted continuation of ACEI therapy. We hypothesized that patients randomized to ACEI omission would experience intraoperative hypotensive episodes less frequently than those randomized to ACEI continuation.
METHODS
Study Design and Setting
We performed a prospective randomized controlled trial (ClinicalTrials.gov: NCT01669434). The study was carried out in a preoperative evaluation clinic and its affiliated 489-bed academic medical center. Anesthesiologists and internal medicine physicians work collaboratively in the clinic to assess more than 5,000 patients annually (one-third of the institution’s elective surgeries). Patients were randomized 1:1 in block sizes of 5 and 10 and stratified by age < 65 and ≥ 65 years to the omission or continuation of the final preoperative ACEI dose (whether that dose was scheduled for the morning of surgery or the night prior). Preoperative clinicians enrolled patients and subsequently assigned them to intervention groups on the basis of a sequentially numbered list. Patients and healthcare providers were not blinded to allocation status. Intraoperative and postoperative management was provided in accordance with usual care as decided by treatment team.
Participants
Patients who presented to the preoperative evaluation clinic between May 2015 and November 2016 and who had been taking an ACEI for at least 6 weeks were eligible for inclusion. Patients taking angiotensin receptor blockers were excluded. Enrollment was limited to patients planning NCNV surgery. Patients planning intrathoracic, major vascular, organ transplant, and oncologic surgery were excluded. Patients undergoing outpatient procedures not requiring an overnight stay in the hospital were also excluded. Patients with preoperative clinic systolic blood pressure (SBP) <90 or ≥160 or diastolic blood pressure (DBP) <60 or ≥ 95 were excluded. Patients with moderate to severe or clinically decompensated heart failure (left ventricular ejection fraction < 40% or New York Heart Association class III or IV) and those with end-stage renal disease requiring dialysis were also excluded. Patients presenting more than once during the accrual period were eligible for the initial surgery only. All participating patients provided written informed consent. This project was approved by the University of Nebraska Medical Center Institutional Review Board.
Data Collection
Baseline characteristics were recorded by study personnel at the time of enrollment. We measured serum creatinine level at the preoperative visit and on postoperative day 1. An automated anesthesia information management system was used to measure intraoperative blood pressures every three minutes. Postoperative blood pressures through discharge were measured by hospital staff per usual care. During postoperative hospitalization, we queried patients about preoperative adherence to allocation. The digital abstraction of data from the electronic medical record was supplemented by chart review when necessary.
Outcomes
The primary outcome was intraoperative hypotension defined as any SBP < 80 mm Hg occurring from the administration of the first induction agent through transfer to the postanesthesia care unit (PACU). We also examined hypotension during anesthesia induction, which we defined as the 20-minute period following the administration of the first anesthesia induction agent. Episodes of SBP < 80 were defined as being associated with vasopressor administration when any vasopressor was administered during or within 10 min of the episode.
Secondary analyses included postoperative acute kidney injury (AKI), postoperative hypotensive and hypertensive episodes, cardiac events, and mortality. When comparing postoperative day 1 creatinine levels to preoperative creatinine levels, we used the Acute Kidney Injury Network definition of AKI as an increase in creatinine of 0.3 mg/dl or 50%.15 Postoperative hypotension was defined as any SBP < 90 mm Hg and postoperative hypertension as any SBP > 180 mm Hg occurring after arrival in the PACU. Major adverse cardiac events (MACE) were defined as a composite of acute coronary syndrome, acute heart failure, or new-onset arrhythmia. Discharge from the hospital served as the study endpoint for each patient.
Analysis
Fisher’s exact test was used to compare categorical outcomes between groups. The independent sample t-test or Wilcoxon rank–sum test, as appropriate, was used to compare continuous measures. We selected Fisher’s exact test over χ2-test to produce conservative estimates. Patients were maintained in their allocated group as randomized for analytical purposes regardless of adherence to allocation. We performed all analyses using SAS version 9.4 for Windows (SAS institute, Cary, North Carolina).
We estimated that a sample size of 300 patients would achieve 80% power to detect a difference of 0.17 between the group proportions of 0.33 and 0.50 at a significance level (ɑ) of 0.05 by using a two-sided z-test with continuity correction, assuming 15% loss to follow-up. This estimate allowed for 1 interim analysis using the O’Brien-Fleming spending function truncated at three standard deviations to determine the test boundaries. The monitoring boundary P values associated with the interim analysis were .003, and the threshold P value for the final analysis was .049.
RESULTS
Study Flow
A total of 453 patients were screened for eligibility. Among these patients, 162 were excluded, and the remaining 291 patients were randomized (Figure 1). Surgery was cancelled in six patients allocated to omission and in four patients allocated to continuation arms, respectively. Moreover, three patients in the omission arm were excluded from the analysis following randomization. Specifically, one was excluded because of early discharge without overnight stay, one was excluded because of withdrawal of consent, and one was excluded because of missing primary outcome data. In addition, three cases in the continuation arm were excluded following randomization because of the preoperative (permanent) discontinuation of ACEI therapy in two cases and discharge without an overnight stay in one case. Finally, 275 patients were included in the analysis: 137 in the ACEI omission group and 138 in the ACEI continuation group. Adherence to allocation was 88% and 92% in the omission and continuation groups, respectively.
Baseline Characteristics
The demographic data of patients allocated to ACEI omission and those allocated to ACEI continuation were similar (Table 1). A large majority of patients in both groups took the ACEI lisinopril. Overall, 187 of 275 (68%) patients were taking at least 1 antihypertensive agent, most commonly a diuretic, in addition to an ACEI. SBP measured during the preoperative clinic visit averaged 136.5 mm Hg and did not differ significantly between groups (P = .84).
Surgical Variables
General anesthesia was the most commonly utilized technique, although spinal and regional anesthesia were also represented (Table 1). The majority of cases in both groups were planning for orthopedic and spinal surgery. The method of anesthesia or type of surgery between patients allocated to ACEI omission and those allocated to continuation did not differ (P = .61 and P = .45 respectively).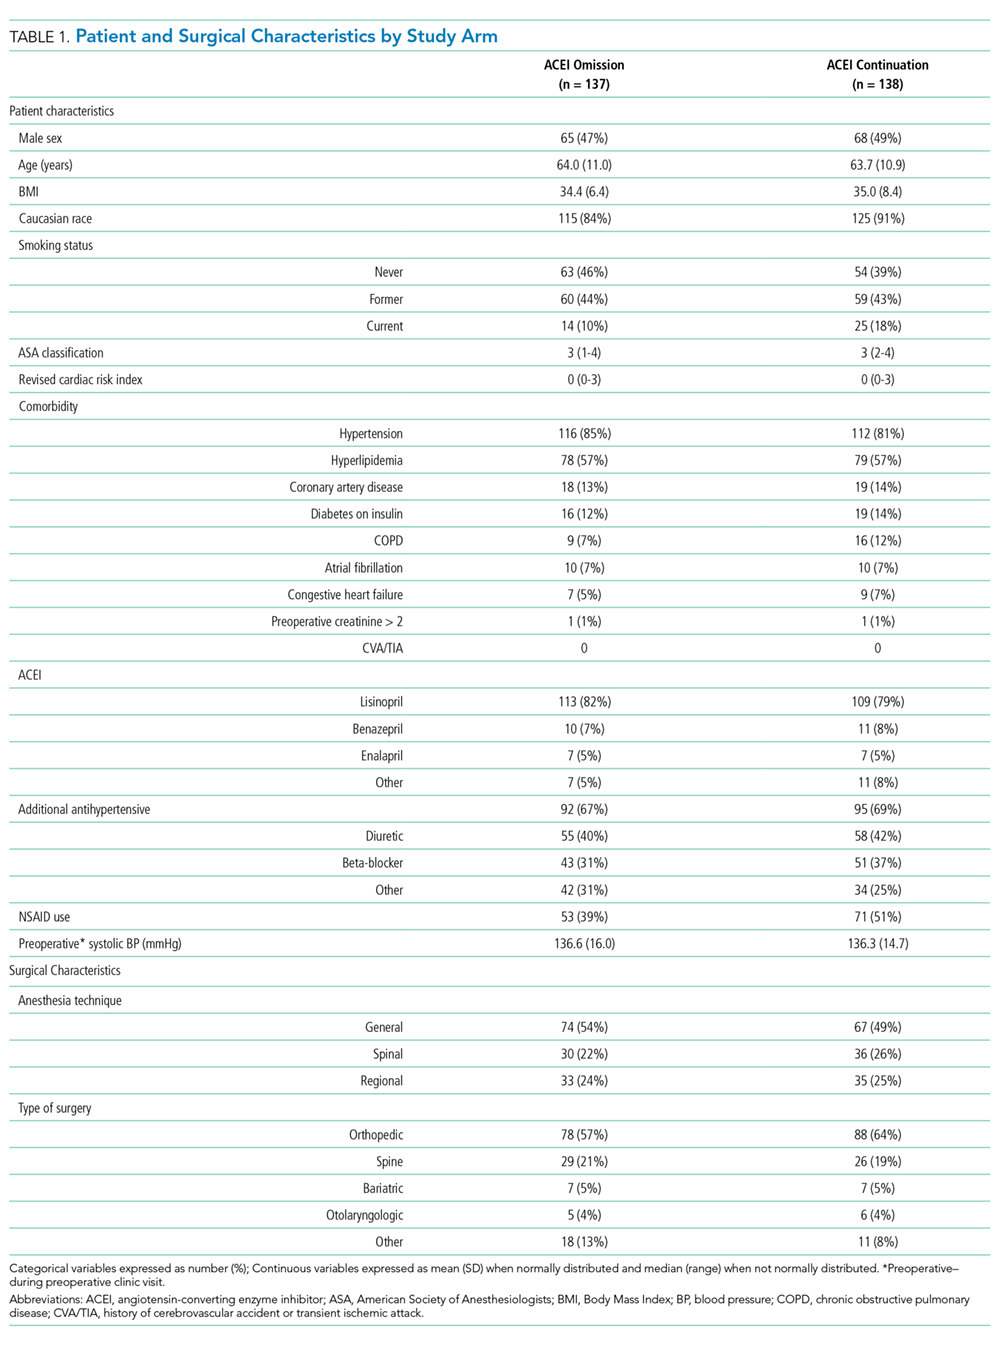
Episodes of Intraoperative Hypotension
Intraoperative SBPs are displayed in Figure 2, and hemodynamic outcomes are summarized in Table 2. Episodes of SBP < 80 mm Hg during anesthesia induction were numerically less frequent in the omission group than in the continuation group; the difference between groups, however, was not statistically significant (24 of 137 [18%] vs 38 of 138 [28%], RR: 0.64, 95% CI: 0.40 to 1.00, P = .06).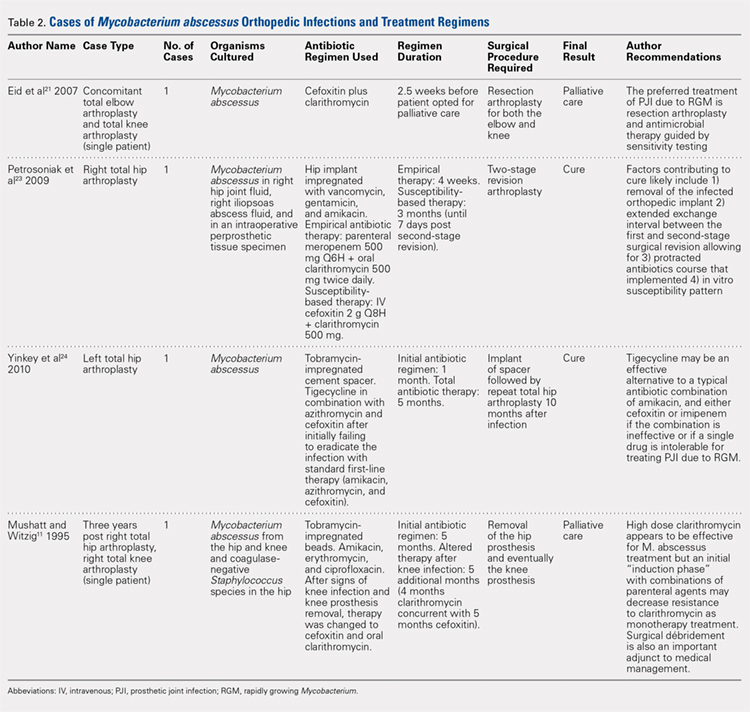
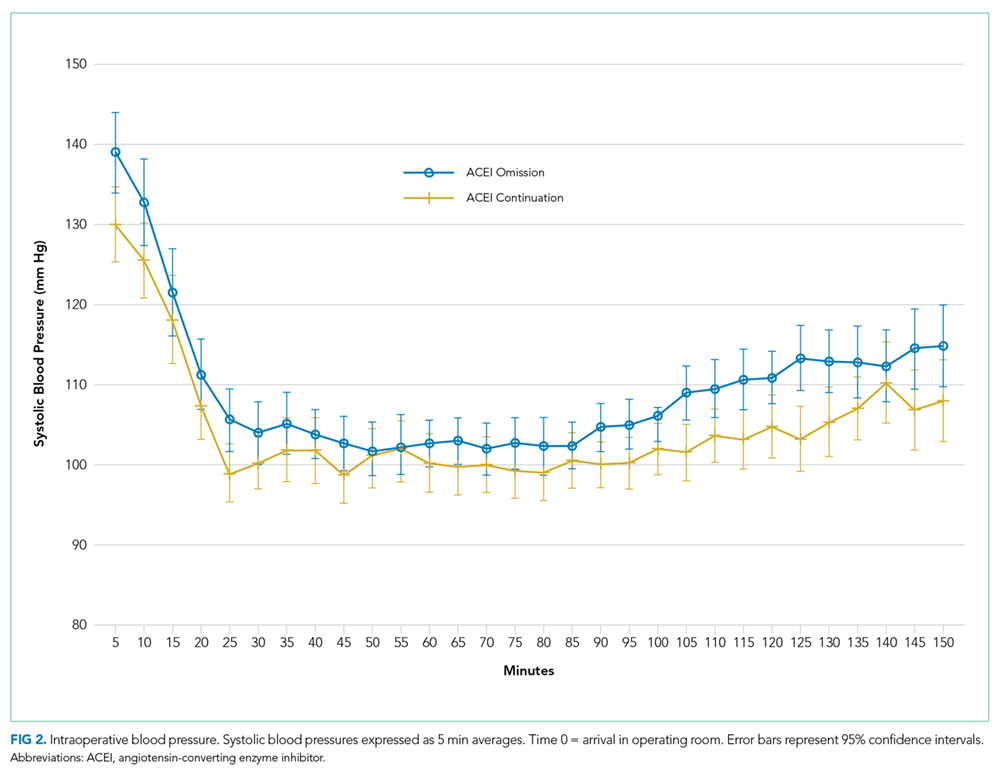
Duration of Intraoperative Hypotension
The median cumulative duration of intraoperative SBP < 80 was two minutes (range 0-41) in patients allocated to the ACEI omission group compared with seven minutes (range 0-214) in those allocated to the continuation group (P < .01). The median cumulative duration of mean arterial pressure < 55 mm Hg was also shorter in the omission group (median 0 min [range 0-39] vs 3 min [range 0-122], P < .01) than in the continuation group. The duration of surgery did not differ between groups (median 141 min [range 77-554] vs 142 min [range 57-665], P = .97).
Postoperative Outcomes
RAAS inhibitor therapy was resumed within 48 h after surgery in 122 of 137 (89%) patients allocated to the omission group and in 128 of 138 (93%) patients allocated to the continuation group (RR: 0.96, 95% CI: 0.89-1.03, P = .30).
Patients allocated to the omission group were significantly less likely to experience postoperative hypotension (15 of 137 [11%] vs 31 of 138 [22%], RR: 0.49, 95% CI: 0.28 to 0.86, P = .02) and significantly more likely to experience severe postoperative hypertension (33 of 137 [24%] vs 17 of 138 [12%], RR: 1.95, 95% CI: 1.14 to 3.34, P = .01) than those allocated to the continuation group. The occurrences of postoperative AKI (RR: 0.60, 95% CI: 0.23 to 1.60, P = .44) or MACE (RR: 4.03, 95% CI: 0.46 to 35.59, P = .21) in the omission group did not differ from the continuation group. The two groups exhibited similar PACU recovery time (mean 97.2 min) and overall hospital length of stay (mean 3.0 days) (P = .49 and P = .56 ). No episodes of inpatient mortality in either group were observed.
DISCUSSION
The omission of the final preoperative ACEI dose was associated with a significant reduction in the risk of intraoperative hypotension in patients undergoing NCNV surgery. This result confirmed our hypothesis. Coupled with the knowledge that intraoperative hypotension is associated with an increased risk of complications and mortality,7-9,16 this study favors the omission of the final preoperative ACEI dose prior to NCNV surgeries.
Our findings are in agreement with those of previous randomized studies that explored this question4,5 and help extend results from cardiac and vascular surgeries to NCNV surgeries. Previous studies on the use of RAAS inhibitors in NCNV surgeries did not employ randomization and yielded mixed results.3,10-12,17 A large single-institution study (n = 18,056) noted no difference in intraoperative blood pressure between patients taking ACEIs and a matched group of non-ACEI users.3 More recently, a subgroup analysis of the international VISION study showed that omitting RAAS inhibitors on the day of surgery reduced the risk of intraoperative hypotension.11 In that analysis, however, only a small amount of the variability in preoperative RAAS inhibitor management was explainable by modeling known factors, thus allowing for the possibility of unmeasured confounding. Our study, which minimized confounding through randomization, is the first to prospectively compare protocols for patients undergoing NCNV surgery. In contrast to previous studies, the present study was able to report the lack of difference in postoperative RAAS inhibitor administration between study groups. Postoperative RAAS inhibitor management affects complications and mortality.18,19
Our present finding that preoperative ACEI management affects postoperative hypotensive and hypertensive events conflicts with some previous findings.11,20 However, recent evidence has revealed that postoperative hypotensive episodes are associated with vascular events and mortality.11,21 In the context of that evidence, our study lends further support to the omission of the final preoperative ACEI dose. However, we did not detect any decrease in AKI, MACE, or mortality in the ACEI omission group.
This study should be considered in light of its limitations. The pragmatic nature of the study allowed for certain potential biases. Although adherence to allocation was high, the specific ACEI agent taken and the exact timing of the final dose in relation to surgery were not controlled. Anesthetic and postoperative management decisions were made by the treatment team and may have systematically varied given that the treatment team was not blinded to allocation. Furthermore, all outcome data were collected as part of routine care and may not have captured events with great fidelity. Generalizability is limited by the execution of the study at a single academic institution, the preponderance of orthopedic and spine surgeries, and by the negligible representation of ethnicities other than Caucasian. Additionally, recruitment from the preoperative evaluation clinic likely resulted in a patient group with greater comorbidity than the overall population of patients undergoing NCNV surgery. This study was powered for intraoperative hypotension and not postoperative outcomes. Our primary outcome, intraoperative hypotension, is an intermediate measure but one that has well-established associations with adverse outcomes, including mortality. One study showed that sustaining an intraoperative SBP below 70 mm Hg for longer than 5 min increased the risk of mortality from less than 1% to nearly 6%.16 A large study detected an increase in mortality associated with SBP sustained below 80 mm Hg for 10 min or longer.7 Intraoperative hypotension has also been associated with postoperative AKI and myocardial injury.8,9,12
Many of the limitations of the current study could be addressed by a large randomized controlled trial of ACEI management prior to NCNV surgeries that examines clinically important endpoints beyond intraoperative hypotension. Several specific aspects of perioperative RAAS inhibitor management also deserve further investigation. Our findings may not be generalizable to patients taking ARBs or to patients with congestive heart failure. The preoperative management of ARBs and the preoperative management of RAAS inhibitors in those with congestive heart failure are important areas of focus for future research. Lastly, our finding that preoperative ACEI management decisions can affect postoperative hypotensive and hypertensive events should be substantiated by future research, and any negative consequences of those events should be further explored.
Nonetheless, our study is the largest randomized study of preoperative RAAS inhibition published to date. More than twice as many patients were randomized in this study than in all previous randomized studies combined.4-6 To the best of our knowledge, this is also the first randomized study evaluating NCNV surgeries. Finally, our use of a practical ACEI omission protocol based on known pharmacokinetics allows for direct application to clinical practice.
CONCLUSION
Hypertension is among the most common chronic conditions encountered in patients planning surgery, and ACEIs are among the most frequently prescribed antihypertensive medications. This study showed that ACEI continuation is associated with an increased frequency and cumulative duration of intraoperative hypotension. These findings, while at odds with current ACC/AHA guidelines, align with the findings of a meta-analysis on this subject and with recent literature.3,11-13,22
Acknowledgments
The authors wish to thank Miranda M Fricke, MS, PA-C; Tiffany K Hillyard, APRN-FNP; and Barbara Sink, MPAS, PA-C who assisted in the design and conduct of patient enrollment and randomization procedures.
Disclosures
The authors have no relevant financial conflicts of interest to report.
Funding
This study was subsidized by a grant from the University of Nebraska Medical Center Research Support Fund. The funding source had no role in the design, conduct, analysis, or reporting of the study.
1. Steiner CA KZ, Moore BJ, Imshaug MC, Pickens G. Surgeries in hospital-based ambulatory surgery and hospital inpatient settings, 2014. Statistical Brief 2017; 1-18. https://www.hcup-us.ahrq.gov/reports/statbriefs/sb223-Ambulatory-Inpatient-Surgeries-2014.pdf. Accessed August 30, 2017. PubMed
2. Rate of all-listed procedures for discharges from short-stay hospitals, by procedure category and age: United States, 2010. National Hospital Discharge Survey 2010; https://www.cdc.gov/nchs/nhds/nhds_tables.htm. Accessed August 30, 2017.
3. Turan A, You J, Shiba A, Kurz A, Saager L, Sessler DI. Angiotensin converting enzyme inhibitors are not associated with respiratory complications or mortality after noncardiac surgery. Anesth Analg. 2012;114(3):552-560. doi: 10.1213/ANE.0b013e318241f6af. PubMed
4. Coriat P, Richer C, Douraki T, et al. Influence of chronic angiotensin-converting enzyme inhibition on anesthetic induction. Anesthesiology. 1994;81:299-307. PubMed
5. Pigott DW, Nagle C, Allman K, S. W, D. ER. Effect of omitting regular ACE inhibitor medication before cardiac surgery on haemodynamic variables and vasoactive drug requirements. Br J Anaesth. 1999;83:715-720. doi: 10.1093/bja/83.5.715 PubMed
6. Bertrand M, Godet G, Meersschaert K, Brun L, Salcedo E, Coriat P. Should the angiotensin II antagonists be discontinued before surgery? Anesth Analg. 2001;92:26-30. PubMed
7. Mascha EJ, Yang D, Weiss S, Sessler DI. Intraoperative mean arterial pressure variability and 30-day mortality in patients having noncardiac surgery. Anesthesiology. 2015;123(1):79-91. doi: 10.1097/ALN.0000000000000686. PubMed
8. Walsh M, Devereaux PJ, Garg AX, et al. Relationship between intraoperative mean arterial pressure and clinical outcomes after noncardiac surgery: toward an empirical definition of hypotension. Anesthesiology. 2013;119(3):507-515. doi: 10.1097/ALN.0b013e3182a10e26. PubMed
9. Salmasi V, Maheshwari K, Yang D, et al. Relationship between intraoperative hypotension, defined by either reduction from baseline or absolute thresholds, and acute kidney and myocardial injury after noncardiac surgery: a retrospective cohort analysis. Anesthesiology. 2017;126(1):47-65. doi: 10.1097/ALN.0000000000001432. PubMed
10. Comfere T, Sprung J, Kumar MM, et al. Angiotensin system inhibitors in a general surgical population. Anesth Analg. 2005;100(3):636-644. doi: 10.1213/01.ANE.0000146521.68059.A1. PubMed
11. Roshanov PS, Rochwerg B, Patel A, et al. Withholding versus continuing angiotensin-converting enzyme inhibitors or angiotensin II receptor blockers before noncardiac surgery: an analysis of the vascular events in noncardiac surgery patIents cohort evaluation prospective cohort. Anesthesiology. 2017;126(1):16-27. doi: 10.1097/ALN.0000000000001404. PubMed
12. Nielson E, Hennrikus E, Lehman E, Mets B. Angiotensin axis blockade, hypotension, and acute kidney injury in elective major orthopedic surgery. J Hosp Med. 2014;9(5):283-288. doi: 10.1002/jhm.2155. PubMed
13. Fleisher LA, Fleischmann KE, Auerbach AD, et al. 2014 ACC/AHA guideline on perioperative cardiovascular evaluation and management of patients undergoing noncardiac surgery: a report of the American College of Cardiology/American Heart Association Task Force on practice guidelines. J Am Coll Cardiol. 2014;64(22):e77-137. doi: 10.1016/j.jacc.2014.07.944. PubMed
14. Kristensen SD, Knuuti J, Saraste A, et al. 2014 ESC/ESA Guidelines on non-cardiac surgery: cardiovascular assessment and management: The Joint Task Force on non-cardiac surgery: cardiovascular assessment and management of the European Society of Cardiology (ESC) and the European Society of Anaesthesiology (ESA). Eur Heart J. 2014;35(35):2383-2431. doi: 10.1093/eurheartj/ehu282 PubMed
15. Mehta RL, Kellum JA, Shah SV, et al. Acute Kidney Injury Network: report of an initiative to improve outcomes in acute kidney injury. Crit Care. 2007;11(2):R31. doi: 10.1186/cc5713 PubMed
16. Monk TG, Bronsert MR, Henderson WG, et al. Association between intraoperative hypotension and hypertension and 30-day postoperative mortality in noncardiac surgery. Anesthesiology. 2015;123(2):307-319. doi: 10.1097/ALN.0000000000000756. PubMed
17. Kheterpal S, Khodaparast O, Shanks A, O’Reilly M, Tremper KK. Chronic angiotensin-converting enzyme inhibitor or angiotensin receptor blocker therapy combined with diuretic therapy is associated with increased episodes of hypotension in noncardiac surgery. J Cardiothorac Vasc Anesth. 2008;22(2):180-186. 10.1053/j.jvca.2007.12.020. PubMed
18. Lee SM, Takemoto S, Wallace AW. Association between withholding angiotensin receptor blockers in the early postoperative period and 30-day mortality: a cohort study of the veterans affairs healthcare system. Anesthesiology. 2015;123(2):288-306. 10.1097/ALN.0000000000000739. PubMed
19. Drenger B, Fontes ML, Miao Y, et al. Patterns of use of perioperative angiotensin-converting enzyme inhibitors in coronary artery bypass graft surgery with cardiopulmonary bypass: effects on in-hospital morbidity and mortality. Circulation. 2012;126(3):261-269. doi: 10.1161/CIRCULATIONAHA.111.059527. PubMed
20. Twersky RS, Goel V, Narayan P, Weedon J. The risk of hypertension after preoperative discontinuation of angiotensin-converting enzyme inhibitors or angiotensin receptor antagonists in ambulatory and same-day admission patients. Anesth Analg. 2014;118(5):938-944. doi: 10.1213/ANE.0000000000000076. PubMed
21. Tan TW, Eslami MH, Kalish JA, et al. The need for treatment of hemodynamic instability following carotid endarterectomy is associated with increased perioperative and 1-year morbidity and mortality. J Vasc Surg. 2014;59(1):16-24 e11-12. https://doi.org/10.1053/j.jvca.2014.12.002 PubMed
22. Rosenman DJ, McDonald FS, Ebbert JO, Erwin PJ, LaBella M, Montori VM. Clinical consequences of withholding versus administering renin-angiotensin-aldosterone system antagonists in the preoperative period. J Hosp Med. 2008;3(4):319-325. doi: 10.1002/jhm.323. PubMed
Over 7 million surgeries are performed in United States hospitals each year. Among these surgeries, approximately 85% are noncardiac, nonvascular (NCNV) procedures.1,2 Although the preoperative use of an angiotensin-converting enzyme inhibitor (ACEI) can be expected in as many as 13% of these surgeries,3 the optimal preoperative ACEI management strategy for patients undergoing NCNV surgeries is poorly understood.
High-quality evidence suggests that renin–angiotensin–aldosterone system (RAAS) inhibitors are associated with intraoperative hypotension among patients undergoing cardiac or vascular surgeries.4-6 Intraoperative hypotension increases the risk of 30-day mortality,7 and the duration of intraoperative hypotension increases the risk of end organ damage.8,9 This body of evidence suggests that withholding ACEIs prior to cardiac and vascular surgeries is safer than continuing ACEIs without interruption.
The evidence concerning perioperative management of ACEIs is inconclusive for patients undergoing NCNV procedures. Some studies comparing patients taking or not taking a RAAS inhibitor preoperatively describe negligible differences in the frequency of intraoperative hypotensive episodes or complications.3,10 Others have found an increased risk of intraoperative hypotension and associated postoperative adverse events in patients continuing RAAS inhibitors preoperatively.11,12 Current guideline discrepancies reflect the uncertainty of the evidence. The guidelines set by the American College of Cardiology and American Heart Association (ACC/AHA) suggest the uninterrupted perioperative continuation of RAAS inhibitors.13 The guidelines provided by the European Society of Cardiology and European Society of Anaesthesiology also suggest the continuation of RAAS inhibitors throughout the perioperative period for patients with systolic heart failure but recommend transient discontinuation for patients with hypertension.14
This randomized study aimed to compare the effect of two practical strategies for preoperative ACEI management on the perioperative blood pressure of patients undergoing NCNV surgery. The two strategies studied were the omission of the final preoperative ACEI dose and the uninterrupted continuation of ACEI therapy. We hypothesized that patients randomized to ACEI omission would experience intraoperative hypotensive episodes less frequently than those randomized to ACEI continuation.
METHODS
Study Design and Setting
We performed a prospective randomized controlled trial (ClinicalTrials.gov: NCT01669434). The study was carried out in a preoperative evaluation clinic and its affiliated 489-bed academic medical center. Anesthesiologists and internal medicine physicians work collaboratively in the clinic to assess more than 5,000 patients annually (one-third of the institution’s elective surgeries). Patients were randomized 1:1 in block sizes of 5 and 10 and stratified by age < 65 and ≥ 65 years to the omission or continuation of the final preoperative ACEI dose (whether that dose was scheduled for the morning of surgery or the night prior). Preoperative clinicians enrolled patients and subsequently assigned them to intervention groups on the basis of a sequentially numbered list. Patients and healthcare providers were not blinded to allocation status. Intraoperative and postoperative management was provided in accordance with usual care as decided by treatment team.
Participants
Patients who presented to the preoperative evaluation clinic between May 2015 and November 2016 and who had been taking an ACEI for at least 6 weeks were eligible for inclusion. Patients taking angiotensin receptor blockers were excluded. Enrollment was limited to patients planning NCNV surgery. Patients planning intrathoracic, major vascular, organ transplant, and oncologic surgery were excluded. Patients undergoing outpatient procedures not requiring an overnight stay in the hospital were also excluded. Patients with preoperative clinic systolic blood pressure (SBP) <90 or ≥160 or diastolic blood pressure (DBP) <60 or ≥ 95 were excluded. Patients with moderate to severe or clinically decompensated heart failure (left ventricular ejection fraction < 40% or New York Heart Association class III or IV) and those with end-stage renal disease requiring dialysis were also excluded. Patients presenting more than once during the accrual period were eligible for the initial surgery only. All participating patients provided written informed consent. This project was approved by the University of Nebraska Medical Center Institutional Review Board.
Data Collection
Baseline characteristics were recorded by study personnel at the time of enrollment. We measured serum creatinine level at the preoperative visit and on postoperative day 1. An automated anesthesia information management system was used to measure intraoperative blood pressures every three minutes. Postoperative blood pressures through discharge were measured by hospital staff per usual care. During postoperative hospitalization, we queried patients about preoperative adherence to allocation. The digital abstraction of data from the electronic medical record was supplemented by chart review when necessary.
Outcomes
The primary outcome was intraoperative hypotension defined as any SBP < 80 mm Hg occurring from the administration of the first induction agent through transfer to the postanesthesia care unit (PACU). We also examined hypotension during anesthesia induction, which we defined as the 20-minute period following the administration of the first anesthesia induction agent. Episodes of SBP < 80 were defined as being associated with vasopressor administration when any vasopressor was administered during or within 10 min of the episode.
Secondary analyses included postoperative acute kidney injury (AKI), postoperative hypotensive and hypertensive episodes, cardiac events, and mortality. When comparing postoperative day 1 creatinine levels to preoperative creatinine levels, we used the Acute Kidney Injury Network definition of AKI as an increase in creatinine of 0.3 mg/dl or 50%.15 Postoperative hypotension was defined as any SBP < 90 mm Hg and postoperative hypertension as any SBP > 180 mm Hg occurring after arrival in the PACU. Major adverse cardiac events (MACE) were defined as a composite of acute coronary syndrome, acute heart failure, or new-onset arrhythmia. Discharge from the hospital served as the study endpoint for each patient.
Analysis
Fisher’s exact test was used to compare categorical outcomes between groups. The independent sample t-test or Wilcoxon rank–sum test, as appropriate, was used to compare continuous measures. We selected Fisher’s exact test over χ2-test to produce conservative estimates. Patients were maintained in their allocated group as randomized for analytical purposes regardless of adherence to allocation. We performed all analyses using SAS version 9.4 for Windows (SAS institute, Cary, North Carolina).
We estimated that a sample size of 300 patients would achieve 80% power to detect a difference of 0.17 between the group proportions of 0.33 and 0.50 at a significance level (ɑ) of 0.05 by using a two-sided z-test with continuity correction, assuming 15% loss to follow-up. This estimate allowed for 1 interim analysis using the O’Brien-Fleming spending function truncated at three standard deviations to determine the test boundaries. The monitoring boundary P values associated with the interim analysis were .003, and the threshold P value for the final analysis was .049.
RESULTS
Study Flow
A total of 453 patients were screened for eligibility. Among these patients, 162 were excluded, and the remaining 291 patients were randomized (Figure 1). Surgery was cancelled in six patients allocated to omission and in four patients allocated to continuation arms, respectively. Moreover, three patients in the omission arm were excluded from the analysis following randomization. Specifically, one was excluded because of early discharge without overnight stay, one was excluded because of withdrawal of consent, and one was excluded because of missing primary outcome data. In addition, three cases in the continuation arm were excluded following randomization because of the preoperative (permanent) discontinuation of ACEI therapy in two cases and discharge without an overnight stay in one case. Finally, 275 patients were included in the analysis: 137 in the ACEI omission group and 138 in the ACEI continuation group. Adherence to allocation was 88% and 92% in the omission and continuation groups, respectively.
Baseline Characteristics
The demographic data of patients allocated to ACEI omission and those allocated to ACEI continuation were similar (Table 1). A large majority of patients in both groups took the ACEI lisinopril. Overall, 187 of 275 (68%) patients were taking at least 1 antihypertensive agent, most commonly a diuretic, in addition to an ACEI. SBP measured during the preoperative clinic visit averaged 136.5 mm Hg and did not differ significantly between groups (P = .84).
Surgical Variables
General anesthesia was the most commonly utilized technique, although spinal and regional anesthesia were also represented (Table 1). The majority of cases in both groups were planning for orthopedic and spinal surgery. The method of anesthesia or type of surgery between patients allocated to ACEI omission and those allocated to continuation did not differ (P = .61 and P = .45 respectively).
Episodes of Intraoperative Hypotension
Intraoperative SBPs are displayed in Figure 2, and hemodynamic outcomes are summarized in Table 2. Episodes of SBP < 80 mm Hg during anesthesia induction were numerically less frequent in the omission group than in the continuation group; the difference between groups, however, was not statistically significant (24 of 137 [18%] vs 38 of 138 [28%], RR: 0.64, 95% CI: 0.40 to 1.00, P = .06).
Duration of Intraoperative Hypotension
The median cumulative duration of intraoperative SBP < 80 was two minutes (range 0-41) in patients allocated to the ACEI omission group compared with seven minutes (range 0-214) in those allocated to the continuation group (P < .01). The median cumulative duration of mean arterial pressure < 55 mm Hg was also shorter in the omission group (median 0 min [range 0-39] vs 3 min [range 0-122], P < .01) than in the continuation group. The duration of surgery did not differ between groups (median 141 min [range 77-554] vs 142 min [range 57-665], P = .97).
Postoperative Outcomes
RAAS inhibitor therapy was resumed within 48 h after surgery in 122 of 137 (89%) patients allocated to the omission group and in 128 of 138 (93%) patients allocated to the continuation group (RR: 0.96, 95% CI: 0.89-1.03, P = .30).
Patients allocated to the omission group were significantly less likely to experience postoperative hypotension (15 of 137 [11%] vs 31 of 138 [22%], RR: 0.49, 95% CI: 0.28 to 0.86, P = .02) and significantly more likely to experience severe postoperative hypertension (33 of 137 [24%] vs 17 of 138 [12%], RR: 1.95, 95% CI: 1.14 to 3.34, P = .01) than those allocated to the continuation group. The occurrences of postoperative AKI (RR: 0.60, 95% CI: 0.23 to 1.60, P = .44) or MACE (RR: 4.03, 95% CI: 0.46 to 35.59, P = .21) in the omission group did not differ from the continuation group. The two groups exhibited similar PACU recovery time (mean 97.2 min) and overall hospital length of stay (mean 3.0 days) (P = .49 and P = .56 ). No episodes of inpatient mortality in either group were observed.
DISCUSSION
The omission of the final preoperative ACEI dose was associated with a significant reduction in the risk of intraoperative hypotension in patients undergoing NCNV surgery. This result confirmed our hypothesis. Coupled with the knowledge that intraoperative hypotension is associated with an increased risk of complications and mortality,7-9,16 this study favors the omission of the final preoperative ACEI dose prior to NCNV surgeries.
Our findings are in agreement with those of previous randomized studies that explored this question4,5 and help extend results from cardiac and vascular surgeries to NCNV surgeries. Previous studies on the use of RAAS inhibitors in NCNV surgeries did not employ randomization and yielded mixed results.3,10-12,17 A large single-institution study (n = 18,056) noted no difference in intraoperative blood pressure between patients taking ACEIs and a matched group of non-ACEI users.3 More recently, a subgroup analysis of the international VISION study showed that omitting RAAS inhibitors on the day of surgery reduced the risk of intraoperative hypotension.11 In that analysis, however, only a small amount of the variability in preoperative RAAS inhibitor management was explainable by modeling known factors, thus allowing for the possibility of unmeasured confounding. Our study, which minimized confounding through randomization, is the first to prospectively compare protocols for patients undergoing NCNV surgery. In contrast to previous studies, the present study was able to report the lack of difference in postoperative RAAS inhibitor administration between study groups. Postoperative RAAS inhibitor management affects complications and mortality.18,19
Our present finding that preoperative ACEI management affects postoperative hypotensive and hypertensive events conflicts with some previous findings.11,20 However, recent evidence has revealed that postoperative hypotensive episodes are associated with vascular events and mortality.11,21 In the context of that evidence, our study lends further support to the omission of the final preoperative ACEI dose. However, we did not detect any decrease in AKI, MACE, or mortality in the ACEI omission group.
This study should be considered in light of its limitations. The pragmatic nature of the study allowed for certain potential biases. Although adherence to allocation was high, the specific ACEI agent taken and the exact timing of the final dose in relation to surgery were not controlled. Anesthetic and postoperative management decisions were made by the treatment team and may have systematically varied given that the treatment team was not blinded to allocation. Furthermore, all outcome data were collected as part of routine care and may not have captured events with great fidelity. Generalizability is limited by the execution of the study at a single academic institution, the preponderance of orthopedic and spine surgeries, and by the negligible representation of ethnicities other than Caucasian. Additionally, recruitment from the preoperative evaluation clinic likely resulted in a patient group with greater comorbidity than the overall population of patients undergoing NCNV surgery. This study was powered for intraoperative hypotension and not postoperative outcomes. Our primary outcome, intraoperative hypotension, is an intermediate measure but one that has well-established associations with adverse outcomes, including mortality. One study showed that sustaining an intraoperative SBP below 70 mm Hg for longer than 5 min increased the risk of mortality from less than 1% to nearly 6%.16 A large study detected an increase in mortality associated with SBP sustained below 80 mm Hg for 10 min or longer.7 Intraoperative hypotension has also been associated with postoperative AKI and myocardial injury.8,9,12
Many of the limitations of the current study could be addressed by a large randomized controlled trial of ACEI management prior to NCNV surgeries that examines clinically important endpoints beyond intraoperative hypotension. Several specific aspects of perioperative RAAS inhibitor management also deserve further investigation. Our findings may not be generalizable to patients taking ARBs or to patients with congestive heart failure. The preoperative management of ARBs and the preoperative management of RAAS inhibitors in those with congestive heart failure are important areas of focus for future research. Lastly, our finding that preoperative ACEI management decisions can affect postoperative hypotensive and hypertensive events should be substantiated by future research, and any negative consequences of those events should be further explored.
Nonetheless, our study is the largest randomized study of preoperative RAAS inhibition published to date. More than twice as many patients were randomized in this study than in all previous randomized studies combined.4-6 To the best of our knowledge, this is also the first randomized study evaluating NCNV surgeries. Finally, our use of a practical ACEI omission protocol based on known pharmacokinetics allows for direct application to clinical practice.
CONCLUSION
Hypertension is among the most common chronic conditions encountered in patients planning surgery, and ACEIs are among the most frequently prescribed antihypertensive medications. This study showed that ACEI continuation is associated with an increased frequency and cumulative duration of intraoperative hypotension. These findings, while at odds with current ACC/AHA guidelines, align with the findings of a meta-analysis on this subject and with recent literature.3,11-13,22
Acknowledgments
The authors wish to thank Miranda M Fricke, MS, PA-C; Tiffany K Hillyard, APRN-FNP; and Barbara Sink, MPAS, PA-C who assisted in the design and conduct of patient enrollment and randomization procedures.
Disclosures
The authors have no relevant financial conflicts of interest to report.
Funding
This study was subsidized by a grant from the University of Nebraska Medical Center Research Support Fund. The funding source had no role in the design, conduct, analysis, or reporting of the study.
1. Steiner CA KZ, Moore BJ, Imshaug MC, Pickens G. Surgeries in hospital-based ambulatory surgery and hospital inpatient settings, 2014. Statistical Brief 2017; 1-18. https://www.hcup-us.ahrq.gov/reports/statbriefs/sb223-Ambulatory-Inpatient-Surgeries-2014.pdf. Accessed August 30, 2017. PubMed
2. Rate of all-listed procedures for discharges from short-stay hospitals, by procedure category and age: United States, 2010. National Hospital Discharge Survey 2010; https://www.cdc.gov/nchs/nhds/nhds_tables.htm. Accessed August 30, 2017.
3. Turan A, You J, Shiba A, Kurz A, Saager L, Sessler DI. Angiotensin converting enzyme inhibitors are not associated with respiratory complications or mortality after noncardiac surgery. Anesth Analg. 2012;114(3):552-560. doi: 10.1213/ANE.0b013e318241f6af. PubMed
4. Coriat P, Richer C, Douraki T, et al. Influence of chronic angiotensin-converting enzyme inhibition on anesthetic induction. Anesthesiology. 1994;81:299-307. PubMed
5. Pigott DW, Nagle C, Allman K, S. W, D. ER. Effect of omitting regular ACE inhibitor medication before cardiac surgery on haemodynamic variables and vasoactive drug requirements. Br J Anaesth. 1999;83:715-720. doi: 10.1093/bja/83.5.715 PubMed
6. Bertrand M, Godet G, Meersschaert K, Brun L, Salcedo E, Coriat P. Should the angiotensin II antagonists be discontinued before surgery? Anesth Analg. 2001;92:26-30. PubMed
7. Mascha EJ, Yang D, Weiss S, Sessler DI. Intraoperative mean arterial pressure variability and 30-day mortality in patients having noncardiac surgery. Anesthesiology. 2015;123(1):79-91. doi: 10.1097/ALN.0000000000000686. PubMed
8. Walsh M, Devereaux PJ, Garg AX, et al. Relationship between intraoperative mean arterial pressure and clinical outcomes after noncardiac surgery: toward an empirical definition of hypotension. Anesthesiology. 2013;119(3):507-515. doi: 10.1097/ALN.0b013e3182a10e26. PubMed
9. Salmasi V, Maheshwari K, Yang D, et al. Relationship between intraoperative hypotension, defined by either reduction from baseline or absolute thresholds, and acute kidney and myocardial injury after noncardiac surgery: a retrospective cohort analysis. Anesthesiology. 2017;126(1):47-65. doi: 10.1097/ALN.0000000000001432. PubMed
10. Comfere T, Sprung J, Kumar MM, et al. Angiotensin system inhibitors in a general surgical population. Anesth Analg. 2005;100(3):636-644. doi: 10.1213/01.ANE.0000146521.68059.A1. PubMed
11. Roshanov PS, Rochwerg B, Patel A, et al. Withholding versus continuing angiotensin-converting enzyme inhibitors or angiotensin II receptor blockers before noncardiac surgery: an analysis of the vascular events in noncardiac surgery patIents cohort evaluation prospective cohort. Anesthesiology. 2017;126(1):16-27. doi: 10.1097/ALN.0000000000001404. PubMed
12. Nielson E, Hennrikus E, Lehman E, Mets B. Angiotensin axis blockade, hypotension, and acute kidney injury in elective major orthopedic surgery. J Hosp Med. 2014;9(5):283-288. doi: 10.1002/jhm.2155. PubMed
13. Fleisher LA, Fleischmann KE, Auerbach AD, et al. 2014 ACC/AHA guideline on perioperative cardiovascular evaluation and management of patients undergoing noncardiac surgery: a report of the American College of Cardiology/American Heart Association Task Force on practice guidelines. J Am Coll Cardiol. 2014;64(22):e77-137. doi: 10.1016/j.jacc.2014.07.944. PubMed
14. Kristensen SD, Knuuti J, Saraste A, et al. 2014 ESC/ESA Guidelines on non-cardiac surgery: cardiovascular assessment and management: The Joint Task Force on non-cardiac surgery: cardiovascular assessment and management of the European Society of Cardiology (ESC) and the European Society of Anaesthesiology (ESA). Eur Heart J. 2014;35(35):2383-2431. doi: 10.1093/eurheartj/ehu282 PubMed
15. Mehta RL, Kellum JA, Shah SV, et al. Acute Kidney Injury Network: report of an initiative to improve outcomes in acute kidney injury. Crit Care. 2007;11(2):R31. doi: 10.1186/cc5713 PubMed
16. Monk TG, Bronsert MR, Henderson WG, et al. Association between intraoperative hypotension and hypertension and 30-day postoperative mortality in noncardiac surgery. Anesthesiology. 2015;123(2):307-319. doi: 10.1097/ALN.0000000000000756. PubMed
17. Kheterpal S, Khodaparast O, Shanks A, O’Reilly M, Tremper KK. Chronic angiotensin-converting enzyme inhibitor or angiotensin receptor blocker therapy combined with diuretic therapy is associated with increased episodes of hypotension in noncardiac surgery. J Cardiothorac Vasc Anesth. 2008;22(2):180-186. 10.1053/j.jvca.2007.12.020. PubMed
18. Lee SM, Takemoto S, Wallace AW. Association between withholding angiotensin receptor blockers in the early postoperative period and 30-day mortality: a cohort study of the veterans affairs healthcare system. Anesthesiology. 2015;123(2):288-306. 10.1097/ALN.0000000000000739. PubMed
19. Drenger B, Fontes ML, Miao Y, et al. Patterns of use of perioperative angiotensin-converting enzyme inhibitors in coronary artery bypass graft surgery with cardiopulmonary bypass: effects on in-hospital morbidity and mortality. Circulation. 2012;126(3):261-269. doi: 10.1161/CIRCULATIONAHA.111.059527. PubMed
20. Twersky RS, Goel V, Narayan P, Weedon J. The risk of hypertension after preoperative discontinuation of angiotensin-converting enzyme inhibitors or angiotensin receptor antagonists in ambulatory and same-day admission patients. Anesth Analg. 2014;118(5):938-944. doi: 10.1213/ANE.0000000000000076. PubMed
21. Tan TW, Eslami MH, Kalish JA, et al. The need for treatment of hemodynamic instability following carotid endarterectomy is associated with increased perioperative and 1-year morbidity and mortality. J Vasc Surg. 2014;59(1):16-24 e11-12. https://doi.org/10.1053/j.jvca.2014.12.002 PubMed
22. Rosenman DJ, McDonald FS, Ebbert JO, Erwin PJ, LaBella M, Montori VM. Clinical consequences of withholding versus administering renin-angiotensin-aldosterone system antagonists in the preoperative period. J Hosp Med. 2008;3(4):319-325. doi: 10.1002/jhm.323. PubMed
© 2018 Society of Hospital Medicine
Characterizing Hospitalizations for Pediatric Concussion and Trends in Care
Approximately 14% of children who sustain a concussion are admitted to the hospital,1 although admission rates reportedly vary substantially among pediatric hospitals.2 Children hospitalized for concussion may be at a higher risk for persistent postconcussive symptoms,3,4 yet little is known about this subset of children and how they are managed while in the hospital. Characterizing children hospitalized for concussion and describing the inpatient care they received will promote hypothesis generation for further inquiry into indications for admission, as well as the relationship between inpatient management and concussion recovery.
We described a cohort of children admitted to 40 pediatric hospitals primarily for concussion and detailed care delivered during hospitalization. We explored individual-level factors and their association with prolonged length of stay (LOS) and emergency department (ED) readmission. Finally, we evaluated if there had been changes in inpatient care over the 8-year study period.
PATIENTS AND METHODS
Study Design
The Institutional Review Board determined that this retrospective cohort study was exempt from review.
Data Source
The Children’s Hospital Association’s Pediatric Health Information System (PHIS) is an administrative database from pediatric hospitals located within 17 major metropolitan areas in the United States. Data include: service dates, patient demographics, payer type, diagnosis codes, resource utilization information (eg, medications), and hospital characteristics.1,5 De-identified data undergo reliability and validity checks prior to inclusion.1,5 We analyzed data from 40 of 43 hospitals that contributed inpatient data during our study period. 2 hospitals were excluded due to inconsistent data submission, and 1 removed their data.
Study Population
Data were extracted for children 0 to 17 years old who were admitted to an inpatient or observational unit between January 1, 2007 and December 31, 2014 for traumatic brain injury (TBI). Children were identified using International Classification of Diseases, Clinical Modification, Ninth Revision (ICD-9-CM) diagnosis codes that denote TBI per the Centers for Disease Control (CDC): 800.0–801.9, 803.0–804.9, 850–854.1, and 959.01.6–8 To examine inpatient care for concussion, we only retained children with a primary (ie, first) concussion-related diagnosis code (850.0–850.99) for analyses. For patients with multiple visits during our study period, only the index admission was analyzed. We refined our cohort using 2 injury scores calculated from ICD-9-CM diagnosis codes using validated ICDMAP-90 injury coding software.6,10–12 The Abbreviated Injury Scale (AIS) ranges from 1 (minor injury) to 6 (not survivable). The total Injury Severity Score (ISS) is based on 6 body regions (head/neck, face, chest, abdomen, extremity, and external) and calculated by summing the squares of the 3 worst AIS scores.13 A concussion receives a head AIS score of 2 if there is an associated loss of consciousness or a score of 1 if there is not; therefore, children were excluded if the head AIS score was >2. We also excluded children with the following features, as they may be indicative of more severe injuries that were likely the cause of admission: ISS > 6, secondary diagnosis code of skull fracture or intracranial injury, intensive care unit (ICU) or operating room (OR) charges, or a LOS > 7 days. Because some children are hospitalized for potentially abusive minor head trauma pending a safe discharge plan, we excluded children 0 to 4 years of age with child abuse, which was determined using a specific set of diagnosis codes (E960-E96820, 995.54, and 995.55) similar to previous research.14
Data Elements and Outcomes
Outcomes
Based on previous reports,1,15 a LOS ≥ 2 days distinguished a typical hospitalization from a prolonged one. ED revisit was identified when a child had a visit with a TBI-related primary diagnosis code at a PHIS hospital within 30 days of initial admission and was discharged home. We limited analyses to children discharged, as children readmitted may have had an initially missed intracranial injury.
Patient Characteristics
We examined the following patient variables: age, race, sex, presence of chronic medical condition, payer type, household income, area of residence (eg, rural versus urban), and mechanism of injury. Age was categorized to represent early childhood (0 to 4 years), school age (5 to 12 years), and adolescence (12 to 17 years). Race was grouped as white, black, or other (Asian, Pacific Islander, American Indian, and “other” per PHIS). Ethnicity was described as Hispanic/Latino or not Hispanic/Latino. Children with medical conditions lasting at least 12 months and comorbidities that may impact TBI recovery were identified using a subgrouping of ICD-9-CM codes for children with “complex chronic conditions”.16 Payer type was categorized as government, private, and self-pay. We extracted a PHIS variable representing the 2010 median household income for the child’s home zip code and categorized it into quartiles based on the Federal Poverty Level for a family of 4.17,18 Area of residence was defined using a Rural–Urban Commuting Area (RUCA) classification system19 and grouped into large urban core, suburban area, large rural town, or small rural town/isolated rural area.17 Mechanism of injury was determined using E-codes and categorized using the CDC injury framework,20 with sports-related injuries identified using a previously described set of E-codes.1 Mechanisms of injury included fall, motor vehicle collision, other motorized transport (eg, all-terrain vehicles), sports-related, struck by or against (ie, objects), and all others (eg, cyclists).
Hospital Characteristics
Hospitals were characterized by region (Northeast, Central, South, and West) and size (small <200, medium 200–400, and large >400 beds). The trauma-level accreditation was identified with Level 1 reflecting the highest possible trauma resources.
Medical Care Variables
Care variables included medications, neuroimaging, and cost of stay. Medication classes included oral non-narcotic analgesics [acetaminophen, ibuprofen, and others (aspirin, tramadol, and naproxen)], oral narcotics (codeine, oxycodone, and narcotic–non-narcotic combinations), intravenous (IV) non-narcotics (ketorolac), IV narcotics (morphine, fentanyl, and hydromorphone), antiemetics [ondansetron, metoclopramide, and phenothiazines (prochlorperazine, chlorpromazine, and promethazine)], maintenance IV fluids (dextrose with electrolytes or 0.45% sodium chloride), and resuscitation IV fluids (0.9% sodium chloride or lactated Ringer’s solution). Receipt of neuroimaging was determined if head computed tomography (CT) had been conducted at the admitting hospital. Adjusted cost of stay was calculated using a hospital-specific cost-to-charge ratio with additional adjustments using the Center for Medicare & Medicaid’s Wage Index.
Statistical Analyses
Descriptive statistics were calculated for individual, injury, and hospital, and care data elements, LOS, and ED readmissions. The number of children admitted with TBI was used as the denominator to assess the proportion of pediatric TBI admissions that were due to concussions. To identify factors associated with prolonged LOS (ie, ≥2 days) and ED readmission, we employed a mixed models approach that accounted for clustering of observations within hospitals. Independent variables included age, sex, race, ethnicity, payer type, household income, RUCA code, chronic medical condition, and injury mechanism. Models were adjusted for hospital location, size, and trauma-level accreditation. The binary distribution was specified along with a logit link function. A 2-phase process determined factors associated with each outcome. First, bivariable models were developed, followed by multivariable models that included independent variables with P values < .25 in the bivariable analysis. Backward step-wise elimination was performed, deleting variables with the highest P value one at a time. After each deletion, the percentage change in odds ratios was examined; if variable removal resulted in >10% change, the variable was retained as a potential confounder. This process was repeated until all remaining variables were significant (P < .05) with the exception of potential confounders. Finally, we examined the proportion of children receiving selected care practices annually. Descriptive and trend analyses were used to analyze adjusted median cost of stay. Analyses were performed using SAS software (Version 9.3, SAS Institute Inc., Cary, North Carolina).
RESULTS
Over 8 years, 88,526 children were admitted to 40 PHIS hospitals with a TBI-related diagnosis, among whom 13,708 had a primary diagnosis of concussion. We excluded 2,973 children with 1 or more of the following characteristics: a secondary diagnosis of intracranial injury (n = 58), head AIS score > 2 (n = 218), LOS > 7 days (n = 50), OR charges (n = 132), ICU charges (n = 1947), and ISS > 6 (n = 568). Six additional children aging 0 to 4 years were excluded due to child abuse. The remaining 10,729 children, averaging 1300 hospitalizations annually, were identified as being hospitalized primarily for concussion.
Table 1 summarizes the individual characteristics for this cohort. The average (standard deviation) age was 9.5 (5.1) years. Ethnicity was missing for 25.3% and therefore excluded from the multivariable models. Almost all children had a head AIS score of 2 (99.2%), and the majority had a total ISS ≤ 4 (73.4%). The majority of admissions were admitted to Level 1 trauma-accredited hospitals (78.7%) and medium-sized hospitals (63.9%).
The most commonly delivered medication classes were non-narcotic oral analgesics (53.7%), dextrose-containing IV fluids (45.0%), and antiemetic medications (34.1%). IV and oral narcotic use occurred in 19.7% and 10.2% of the children, respectively. Among our cohort, 16.7% received none of these medication classes. Of the 8,940 receiving medication, 32.6% received a single medication class, 29.5% received 2 classes, 20.5% 3 classes, 11.9% 4 classes, and 5.5% received 5 or more medication classes. Approximately 15% (n = 1597) received only oral medications, among whom 91.2% (n = 1457) received only non-narcotic analgesics and 3.9% (n = 63) received only oral narcotic analgesics. The majority (69.5%) received a head CT.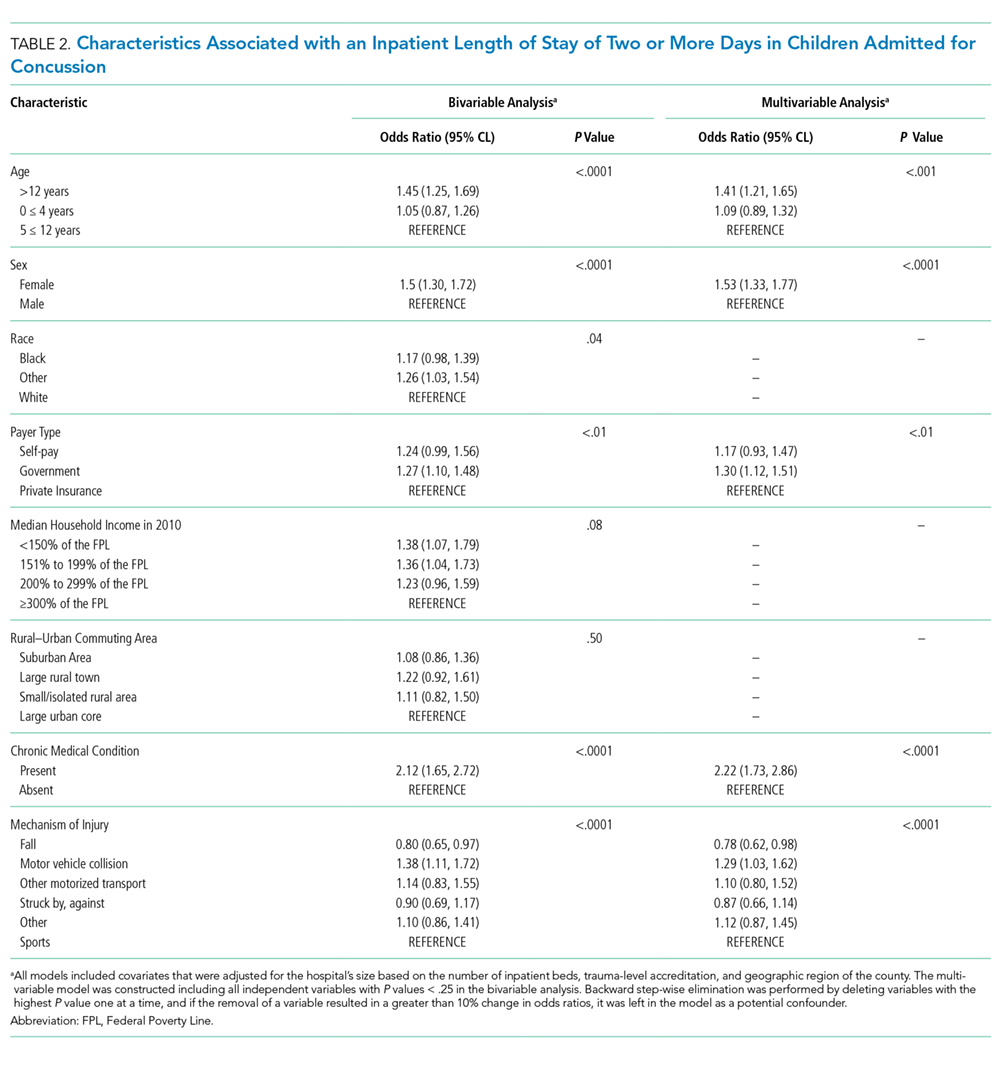
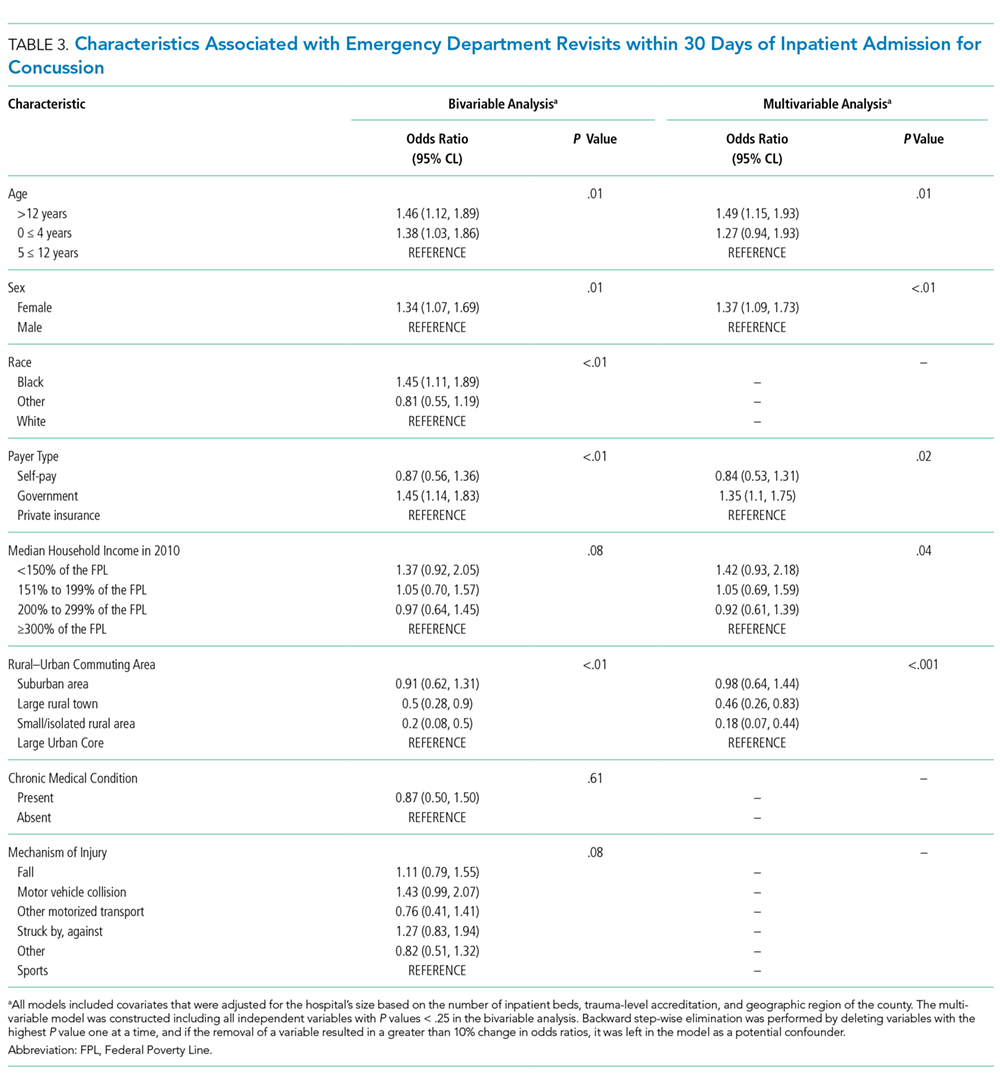
Table 4 summarizes medication administration trends over time. Oral non-narcotic administration increased significantly (slope = 0.99, P < .01) with the most pronounced change occurring in ibuprofen use (slope = 1.11, P < .001). Use of the IV non-narcotic ketorolac (slope = 0.61, P < .001) also increased significantly, as did the proportion of children receiving antiemetics (slope = 1.59, P = .001), with a substantial increase in ondansetron use (slope = 1.56, P = .001). The proportion of children receiving head CTs decreased linearly over time (slope= −1.75, P < .001), from 76.1% in 2007 to 63.7% in 2014. Median cost, adjusted for inflation, increased during our study period (P < .001) by approximately $353 each year, reaching $11,249 by 2014.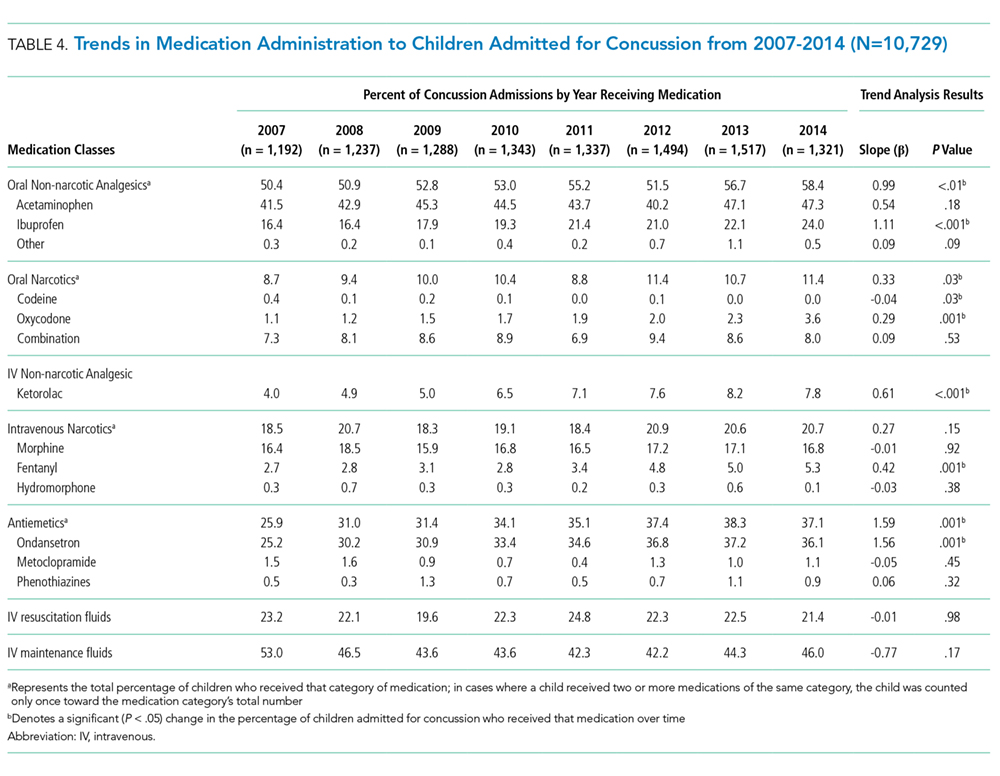
DISCUSSION
From 2007 to 2014, approximately 15% of children admitted to PHIS hospitals for TBI were admitted primarily for concussion. Since almost all children had a head AIS score of 2 and an ISS ≤ 4, our data suggest that most children had an associated loss of consciousness and that concussion was the only injury sustained, respectively. This study identified important subgroups that necessitated inpatient care but are rarely the focus of concussion research (eg, toddlers and those injured due to a motor vehicle collision). Most children (83.3%) received medications to treat common postconcussive symptoms (eg, pain and nausea), with almost half receiving 3 or more medication classes. Factors associated with the development of postconcussive syndrome (eg, female sex and adolescent age)4,21 were significantly associated with hospitalization of 2 or more days and ED revisit within 30 days of admission. In the absence of evidenced-based guidelines for inpatient concussion management, we identified significant trends in care, including increased use of specific pain [ie, oral and IV nonsteroidal anti-inflammatory drugs (NSAIDs)] and antiemetic (ie, ondansetron) medications and decreased use of head CT. Given the number of children admitted and receiving treatment for concussion symptomatology, influences on the decision to deliver specific care practices, as well as the impact and benefit of hospitalization, require closer examination.
Our study extends previous reports from the PHIS database by characterizing children admitted for concussion.1 We found that children admitted for concussion had similar characteristics to the broader population of children who sustain concussion (eg, school-aged children, male, and injured due to a fall or during sports).1,3,22 However, approximately 20% of the cohort were less than 5 years old, and less is known regarding appropriate treatment and outcomes of concussion in this age group.23 Uncertainty regarding optimal management and a young child’s inability to articulate symptoms may contribute to a physician’s decision to admit for close observation. Similar to Blinman et al., we found that a substantial proportion of children admitted with concussion were injured due to a motor vehicle collision,3 suggesting that although sports-related injuries are responsible for a significant proportion of pediatric concussions, children injured by other preventable mechanisms may also be incurring significant concussive injuries. Finally, the majority of our cohort was from an urban core, relative to a rural area, which is likely a reflection of the regionalization of trauma care, as well as variations in access to health care.
Although most children recover fully from concussion without specific interventions, 20%-30% may remain symptomatic at 1 month,3,4,21,24 and children who are hospitalized with concussion may be at higher risk for protracted symptoms. While specific individual or injury-related factors (eg, female sex, adolescent age, and injury due to motor vehicle collision) may contribute to more significant postconcussive symptoms, it is unclear how inpatient management affects recovery trajectory. Frequent sleep disruptions associated with inpatient care25 contradict current acute concussion management recommendations for physical and cognitive rest26 and could potentially impair symptom recovery. Additionally, we found widespread use of NSAIDs, although there is evidence suggesting that NSAIDs may potentially worsen concussive symptoms.26 We identified an increase in medication usage over time despite limited evidence of their effectiveness for pediatric concussion.27–29 This change may reflect improved symptom screening4,30 and/or increased awareness of specific medication safety profiles in pediatric trauma patients, especially for NSAIDs and ondansetron. Although we saw an increase in NSAID use, we did not see a proportional decrease in narcotic use. Similarly, while two-thirds of our cohort received IV medications, there is controversy about the need for IV fluids and medications for other pediatric illnesses, with research demonstrating that IV treatment may not reduce recovery time and may contribute to prolonged hospitalization and phlebitis.31,32 Thus, there is a need to understand the therapeutic effectiveness and benefits of medications and fluids on postconcussion recovery.
Neuroimaging rates for children receiving ED evaluation for concussion have been reported to be up to 60%-70%,1,22 although a more recent study spanning 2006 to 2011 found a 35-%–40% head CT rate in pediatric patients by hospital-based EDs in the United States.33 Our results appear to support decreasing head CT use over time in pediatric hospitals. Hospitalization for observation is costly1 but could decrease a child’s risk of malignancy from radiation exposure. Further work on balancing cost, risk, and shared decision-making with parents could guide decisions regarding emergent neuroimaging versus admission.
This study has limitations inherent to the use of an administrative dataset, including lack of information regarding why the child was admitted. Since the focus was to describe inpatient care of children with concussion, those discharged home from the ED were not included in this dataset. Consequently, we could not contrast the ED care of those discharged home with those who were admitted or assess trends in admission rates for concussion. Although the overall number of concussion admissions has continued to remain stable over time,1 due to a lack of prospectively collected clinical information, we are unable to determine whether observed trends in care are secondary to changes in practice or changes in concussion severity. However, there has been no research to date supporting the latter. Ethnicity was excluded due to high levels of missing data. Cost of stay was not extensively analyzed given hospital variation in designation of observational or inpatient status, which subsequently affects billing.34 Rates of neuroimaging and ED revisit may have been underestimated since children could have received care at a non-PHIS hospital. Similarly, the decrease in the proportion of children receiving neuroimaging over time may have been associated with an increase in children being transferred from a non-PHIS hospital for admission, although with increased regionalization in trauma care, we would not expect transfers of children with only concussion to have significantly increased. Finally, data were limited to the pediatric tertiary care centers participating in PHIS, thereby reducing generalizability and introducing selection bias by only including children who were able to access care at PHIS hospitals. Although the care practices we evaluated (eg, NSAIDs and head CT) are available at all hospitals, our analyses only reflect care delivered within the PHIS.
Concussion accounted for 15% of all pediatric TBI admissions during our study period. Further investigation of potential factors associated with admission and protracted recovery (eg, adolescent females needing treatment for severe symptomatology) could facilitate better understanding of how hospitalization affects recovery. Additionally, research on acute pharmacotherapies (eg, IV therapies and/or inpatient treatment until symptoms resolve) is needed to fully elucidate the acute and long-term benefits of interventions delivered to children.
ACKNOWLEDGMENTS
Colleen Mangeot: Biostatistician with extensive PHIS knowledge who contributed to database creation and statistical analysis. Yanhong (Amy) Liu: Research database programmer who developed the database, ran quality assurance measures, and cleaned all study data.
Disclosures
The authors have nothing to disclose.
Funding
This study was supported by grant R40 MC 268060102 from the Maternal and Child Health Research Program, Maternal and Child Health Bureau (Title V, Social Security Act), Health Resources and Services Administration, Department of Health and Human Services. The funding source was not involved in development of the study design; in the collection, analysis and interpretation of data; or in the writing of this report.
1. Colvin JD, Thurm C, Pate BM, Newland JG, Hall M, Meehan WP. Diagnosis and acute management of patients with concussion at children’s hospitals. Arch Dis Child. 2013;98(12):934-938. PubMed
2. Bourgeois FT, Monuteaux MC, Stack AM, Neuman MI. Variation in emergency department admission rates in US children’s hospitals. Pediatrics. 2014;134(3):539-545. PubMed
3. Blinman TA, Houseknecht E, Snyder C, Wiebe DJ, Nance ML. Postconcussive symptoms in hospitalized pediatric patients after mild traumatic brain injury. J Pediatr Surg. 2009;44(6):1223-1228. PubMed
4. Babcock L, Byczkowski T, Wade SL, Ho M, Mookerjee S, Bazarian JJ. Predicting postconcussion syndrome after mild traumatic brain injury in children and adolescents who present to the emergency department. JAMA pediatrics. 2013;167(2):156-161. PubMed
5. Conway PH, Keren R. Factors associated with variability in outcomes for children hospitalized with urinary tract infection. The Journal of pediatrics. 2009;154(6):789-796. PubMed
6. Services UDoHaH. International classification of diseases, 9th Revision, Clinical modification (ICD-9CM). Washington, DC: US Department of Health and Human Services. Public Health Service, Health Care Financing Administration 1989.
7. Marr AL, Coronado VG. Annual data submission standards. Central nervous system injury surveillance. In: US Department of Health and Human Services PHS, CDC, ed. Atlanta, GA 2001.
8. Organization WH. International classification of diseases: manual on the international statistical classification of diseases, injuries, and cause of death. In: Organization WH, ed. 9th rev. ed. Geneva, Switerland 1977.
9. Centers for Disease Control and Prevention, National Center for Injury Prevention and Control. Report to Congress on mild traumatic brain injury in the United States: steps to prevent a serious public health problem. Atlanta, GA: Centers for Disease Control and Prevention; 2003.
10. Mackenzie E, Sacco WJ. ICDMAP-90 software: user’s guide. Baltimore, Maryland: Johns Hopkins University and Tri-Analytics. 1997:1-25.
11. MacKenzie EJ, Steinwachs DM, Shankar B. Classifying trauma severity based on hospital discharge diagnoses. Validation of an ICD-9CM to AIS-85 conversion table. Med Care. 1989;27(4):412-422. PubMed
12. Fleischman RJ, Mann NC, Dai M, et al. Validating the use of ICD-9 code mapping to generate injury severity scores. J Trauma Nurs. 2017;24(1):4-14. PubMed
13. Baker SP, O’Neill B, Haddon W, Jr., Long WB. The injury severity score: a method for describing patients with multiple injuries and evaluating emergency care. The Journal of trauma. 1974;14(3):187-196. PubMed
14. Wood JN, Feudtner C, Medina SP, Luan X, Localio R, Rubin DM. Variation in occult injury screening for children with suspected abuse in selected US children’s hospitals. Pediatrics
15. Yang J, Phillips G, Xiang H, Allareddy V, Heiden E, Peek-Asa C. Hospitalisations for sport-related concussions in US children aged 5 to 18 years during 2000-2004. Br J Sports Med. 2008;42(8):664-669. PubMed
16. Feudtner C, Christakis DA, Connell FA. Pediatric deaths attributable to complex chronic conditions: a population-based study of Washington State, 1980-1997. Pediatrics. 2000;106(1):205-209. PubMed
17. Peltz A, Wu CL, White ML, et al. Characteristics of rural children admitted to pediatric hospitals. Pediatrics. 2016;137(5): e20153156. PubMed
18. Services UDoHaH. Annual update of the HHS Poverty Guidelines. Federal Register; 2016-03-14 2011.
19. Hart LG, Larson EH, Lishner DM. Rural definitions for health policy and research. Am J Public Health. 2005;95(7):1149-1155. PubMed
20. Proposed Matrix of E-code Groupings| WISQARS | Injury Center | CDC. 2016; http://www.cdc.gov/injury/wisqars/ecode_matrix.html.
21. Zemek RL, Farion KJ, Sampson M, McGahern C. Prognosticators of persistent symptoms following pediatric concussion: A systematic review. JAMA Pediatr. 2013;167(3):259-265. PubMed
22. Meehan WP, Mannix R. Pediatric concussions in United States emergency departments in the years 2002 to 2006. J Pediatr. 2010;157(6):889-893. PubMed
23. Davis GA, Purcell LK. The evaluation and management of acute concussion differs in young children. Br J Sports Med. 2014;48(2):98-101. PubMed
24. Zemek R, Barrowman N, Freedman SB, et al. Clinical risk score for persistent postconcussion symptoms among children with acute concussion in the ED. JAMA. 2016;315(10):1014-1025. PubMed
25. Hinds PS, Hockenberry M, Rai SN, et al. Nocturnal awakenings, sleep environment interruptions, and fatigue in hospitalized children with cancer. Oncol Nurs Forum. 2007;34(2):393-402. PubMed
26. Patterson ZR, Holahan MR. Understanding the neuroinflammatory response following concussion to develop treatment strategies. Front Cell Neurosci. 2012;6:58. PubMed
27. Meehan WP. Medical therapies for concussion. Clin Sports Med. 2011;30(1):115-124, ix. PubMed
28. Petraglia AL, Maroon JC, Bailes JE. From the field of play to the field of combat: a review of the pharmacological management of concussion. Neurosurgery. 2012;70(6):1520-1533. PubMed
29. Giza CC, Kutcher JS, Ashwal S, et al. Summary of evidence-based guideline update: evaluation and management of concussion in sports: Report of the Guideline Development Subcommittee of the American Academy of Neurology. Neurology. 2013;80(24):2250-2257. PubMed
30. Barlow KM, Crawford S, Stevenson A, Sandhu SS, Belanger F, Dewey D. Epidemiology of postconcussion syndrome in pediatric mild traumatic brain injury. Pediatrics. 2010;126(2):e374-e381. PubMed
31. Keren R, Shah SS, Srivastava R, et al. Comparative effectiveness of intravenous vs oral antibiotics for postdischarge treatment of acute osteomyelitis in children. JAMA Pediatr. 2015;169(2):120-128. PubMed
32. Hartling L, Bellemare S, Wiebe N, Russell K, Klassen TP, Craig W. Oral versus intravenous rehydration for treating dehydration due to gastroenteritis in children. Cochrane Database Syst Rev. 2006(3):CD004390. PubMed
34. Fieldston ES, Shah SS, Hall M, et al. Resource utilization for observation-status stays at children’s hospitals. Pediatrics. 2013;131(6):1050-1058. PubMed
33. Zonfrillo MR, Kim KH, Arbogast KB. Emergency Department Visits and Head Computed Tomography Utilization for Concussion Patients From 2006 to 2011. Acad Emerg Med. 2015;22(7):872-877. PubMed
Approximately 14% of children who sustain a concussion are admitted to the hospital,1 although admission rates reportedly vary substantially among pediatric hospitals.2 Children hospitalized for concussion may be at a higher risk for persistent postconcussive symptoms,3,4 yet little is known about this subset of children and how they are managed while in the hospital. Characterizing children hospitalized for concussion and describing the inpatient care they received will promote hypothesis generation for further inquiry into indications for admission, as well as the relationship between inpatient management and concussion recovery.
We described a cohort of children admitted to 40 pediatric hospitals primarily for concussion and detailed care delivered during hospitalization. We explored individual-level factors and their association with prolonged length of stay (LOS) and emergency department (ED) readmission. Finally, we evaluated if there had been changes in inpatient care over the 8-year study period.
PATIENTS AND METHODS
Study Design
The Institutional Review Board determined that this retrospective cohort study was exempt from review.
Data Source
The Children’s Hospital Association’s Pediatric Health Information System (PHIS) is an administrative database from pediatric hospitals located within 17 major metropolitan areas in the United States. Data include: service dates, patient demographics, payer type, diagnosis codes, resource utilization information (eg, medications), and hospital characteristics.1,5 De-identified data undergo reliability and validity checks prior to inclusion.1,5 We analyzed data from 40 of 43 hospitals that contributed inpatient data during our study period. 2 hospitals were excluded due to inconsistent data submission, and 1 removed their data.
Study Population
Data were extracted for children 0 to 17 years old who were admitted to an inpatient or observational unit between January 1, 2007 and December 31, 2014 for traumatic brain injury (TBI). Children were identified using International Classification of Diseases, Clinical Modification, Ninth Revision (ICD-9-CM) diagnosis codes that denote TBI per the Centers for Disease Control (CDC): 800.0–801.9, 803.0–804.9, 850–854.1, and 959.01.6–8 To examine inpatient care for concussion, we only retained children with a primary (ie, first) concussion-related diagnosis code (850.0–850.99) for analyses. For patients with multiple visits during our study period, only the index admission was analyzed. We refined our cohort using 2 injury scores calculated from ICD-9-CM diagnosis codes using validated ICDMAP-90 injury coding software.6,10–12 The Abbreviated Injury Scale (AIS) ranges from 1 (minor injury) to 6 (not survivable). The total Injury Severity Score (ISS) is based on 6 body regions (head/neck, face, chest, abdomen, extremity, and external) and calculated by summing the squares of the 3 worst AIS scores.13 A concussion receives a head AIS score of 2 if there is an associated loss of consciousness or a score of 1 if there is not; therefore, children were excluded if the head AIS score was >2. We also excluded children with the following features, as they may be indicative of more severe injuries that were likely the cause of admission: ISS > 6, secondary diagnosis code of skull fracture or intracranial injury, intensive care unit (ICU) or operating room (OR) charges, or a LOS > 7 days. Because some children are hospitalized for potentially abusive minor head trauma pending a safe discharge plan, we excluded children 0 to 4 years of age with child abuse, which was determined using a specific set of diagnosis codes (E960-E96820, 995.54, and 995.55) similar to previous research.14
Data Elements and Outcomes
Outcomes
Based on previous reports,1,15 a LOS ≥ 2 days distinguished a typical hospitalization from a prolonged one. ED revisit was identified when a child had a visit with a TBI-related primary diagnosis code at a PHIS hospital within 30 days of initial admission and was discharged home. We limited analyses to children discharged, as children readmitted may have had an initially missed intracranial injury.
Patient Characteristics
We examined the following patient variables: age, race, sex, presence of chronic medical condition, payer type, household income, area of residence (eg, rural versus urban), and mechanism of injury. Age was categorized to represent early childhood (0 to 4 years), school age (5 to 12 years), and adolescence (12 to 17 years). Race was grouped as white, black, or other (Asian, Pacific Islander, American Indian, and “other” per PHIS). Ethnicity was described as Hispanic/Latino or not Hispanic/Latino. Children with medical conditions lasting at least 12 months and comorbidities that may impact TBI recovery were identified using a subgrouping of ICD-9-CM codes for children with “complex chronic conditions”.16 Payer type was categorized as government, private, and self-pay. We extracted a PHIS variable representing the 2010 median household income for the child’s home zip code and categorized it into quartiles based on the Federal Poverty Level for a family of 4.17,18 Area of residence was defined using a Rural–Urban Commuting Area (RUCA) classification system19 and grouped into large urban core, suburban area, large rural town, or small rural town/isolated rural area.17 Mechanism of injury was determined using E-codes and categorized using the CDC injury framework,20 with sports-related injuries identified using a previously described set of E-codes.1 Mechanisms of injury included fall, motor vehicle collision, other motorized transport (eg, all-terrain vehicles), sports-related, struck by or against (ie, objects), and all others (eg, cyclists).
Hospital Characteristics
Hospitals were characterized by region (Northeast, Central, South, and West) and size (small <200, medium 200–400, and large >400 beds). The trauma-level accreditation was identified with Level 1 reflecting the highest possible trauma resources.
Medical Care Variables
Care variables included medications, neuroimaging, and cost of stay. Medication classes included oral non-narcotic analgesics [acetaminophen, ibuprofen, and others (aspirin, tramadol, and naproxen)], oral narcotics (codeine, oxycodone, and narcotic–non-narcotic combinations), intravenous (IV) non-narcotics (ketorolac), IV narcotics (morphine, fentanyl, and hydromorphone), antiemetics [ondansetron, metoclopramide, and phenothiazines (prochlorperazine, chlorpromazine, and promethazine)], maintenance IV fluids (dextrose with electrolytes or 0.45% sodium chloride), and resuscitation IV fluids (0.9% sodium chloride or lactated Ringer’s solution). Receipt of neuroimaging was determined if head computed tomography (CT) had been conducted at the admitting hospital. Adjusted cost of stay was calculated using a hospital-specific cost-to-charge ratio with additional adjustments using the Center for Medicare & Medicaid’s Wage Index.
Statistical Analyses
Descriptive statistics were calculated for individual, injury, and hospital, and care data elements, LOS, and ED readmissions. The number of children admitted with TBI was used as the denominator to assess the proportion of pediatric TBI admissions that were due to concussions. To identify factors associated with prolonged LOS (ie, ≥2 days) and ED readmission, we employed a mixed models approach that accounted for clustering of observations within hospitals. Independent variables included age, sex, race, ethnicity, payer type, household income, RUCA code, chronic medical condition, and injury mechanism. Models were adjusted for hospital location, size, and trauma-level accreditation. The binary distribution was specified along with a logit link function. A 2-phase process determined factors associated with each outcome. First, bivariable models were developed, followed by multivariable models that included independent variables with P values < .25 in the bivariable analysis. Backward step-wise elimination was performed, deleting variables with the highest P value one at a time. After each deletion, the percentage change in odds ratios was examined; if variable removal resulted in >10% change, the variable was retained as a potential confounder. This process was repeated until all remaining variables were significant (P < .05) with the exception of potential confounders. Finally, we examined the proportion of children receiving selected care practices annually. Descriptive and trend analyses were used to analyze adjusted median cost of stay. Analyses were performed using SAS software (Version 9.3, SAS Institute Inc., Cary, North Carolina).
RESULTS
Over 8 years, 88,526 children were admitted to 40 PHIS hospitals with a TBI-related diagnosis, among whom 13,708 had a primary diagnosis of concussion. We excluded 2,973 children with 1 or more of the following characteristics: a secondary diagnosis of intracranial injury (n = 58), head AIS score > 2 (n = 218), LOS > 7 days (n = 50), OR charges (n = 132), ICU charges (n = 1947), and ISS > 6 (n = 568). Six additional children aging 0 to 4 years were excluded due to child abuse. The remaining 10,729 children, averaging 1300 hospitalizations annually, were identified as being hospitalized primarily for concussion.
Table 1 summarizes the individual characteristics for this cohort. The average (standard deviation) age was 9.5 (5.1) years. Ethnicity was missing for 25.3% and therefore excluded from the multivariable models. Almost all children had a head AIS score of 2 (99.2%), and the majority had a total ISS ≤ 4 (73.4%). The majority of admissions were admitted to Level 1 trauma-accredited hospitals (78.7%) and medium-sized hospitals (63.9%).
The most commonly delivered medication classes were non-narcotic oral analgesics (53.7%), dextrose-containing IV fluids (45.0%), and antiemetic medications (34.1%). IV and oral narcotic use occurred in 19.7% and 10.2% of the children, respectively. Among our cohort, 16.7% received none of these medication classes. Of the 8,940 receiving medication, 32.6% received a single medication class, 29.5% received 2 classes, 20.5% 3 classes, 11.9% 4 classes, and 5.5% received 5 or more medication classes. Approximately 15% (n = 1597) received only oral medications, among whom 91.2% (n = 1457) received only non-narcotic analgesics and 3.9% (n = 63) received only oral narcotic analgesics. The majority (69.5%) received a head CT.
Table 4 summarizes medication administration trends over time. Oral non-narcotic administration increased significantly (slope = 0.99, P < .01) with the most pronounced change occurring in ibuprofen use (slope = 1.11, P < .001). Use of the IV non-narcotic ketorolac (slope = 0.61, P < .001) also increased significantly, as did the proportion of children receiving antiemetics (slope = 1.59, P = .001), with a substantial increase in ondansetron use (slope = 1.56, P = .001). The proportion of children receiving head CTs decreased linearly over time (slope= −1.75, P < .001), from 76.1% in 2007 to 63.7% in 2014. Median cost, adjusted for inflation, increased during our study period (P < .001) by approximately $353 each year, reaching $11,249 by 2014.
DISCUSSION
From 2007 to 2014, approximately 15% of children admitted to PHIS hospitals for TBI were admitted primarily for concussion. Since almost all children had a head AIS score of 2 and an ISS ≤ 4, our data suggest that most children had an associated loss of consciousness and that concussion was the only injury sustained, respectively. This study identified important subgroups that necessitated inpatient care but are rarely the focus of concussion research (eg, toddlers and those injured due to a motor vehicle collision). Most children (83.3%) received medications to treat common postconcussive symptoms (eg, pain and nausea), with almost half receiving 3 or more medication classes. Factors associated with the development of postconcussive syndrome (eg, female sex and adolescent age)4,21 were significantly associated with hospitalization of 2 or more days and ED revisit within 30 days of admission. In the absence of evidenced-based guidelines for inpatient concussion management, we identified significant trends in care, including increased use of specific pain [ie, oral and IV nonsteroidal anti-inflammatory drugs (NSAIDs)] and antiemetic (ie, ondansetron) medications and decreased use of head CT. Given the number of children admitted and receiving treatment for concussion symptomatology, influences on the decision to deliver specific care practices, as well as the impact and benefit of hospitalization, require closer examination.
Our study extends previous reports from the PHIS database by characterizing children admitted for concussion.1 We found that children admitted for concussion had similar characteristics to the broader population of children who sustain concussion (eg, school-aged children, male, and injured due to a fall or during sports).1,3,22 However, approximately 20% of the cohort were less than 5 years old, and less is known regarding appropriate treatment and outcomes of concussion in this age group.23 Uncertainty regarding optimal management and a young child’s inability to articulate symptoms may contribute to a physician’s decision to admit for close observation. Similar to Blinman et al., we found that a substantial proportion of children admitted with concussion were injured due to a motor vehicle collision,3 suggesting that although sports-related injuries are responsible for a significant proportion of pediatric concussions, children injured by other preventable mechanisms may also be incurring significant concussive injuries. Finally, the majority of our cohort was from an urban core, relative to a rural area, which is likely a reflection of the regionalization of trauma care, as well as variations in access to health care.
Although most children recover fully from concussion without specific interventions, 20%-30% may remain symptomatic at 1 month,3,4,21,24 and children who are hospitalized with concussion may be at higher risk for protracted symptoms. While specific individual or injury-related factors (eg, female sex, adolescent age, and injury due to motor vehicle collision) may contribute to more significant postconcussive symptoms, it is unclear how inpatient management affects recovery trajectory. Frequent sleep disruptions associated with inpatient care25 contradict current acute concussion management recommendations for physical and cognitive rest26 and could potentially impair symptom recovery. Additionally, we found widespread use of NSAIDs, although there is evidence suggesting that NSAIDs may potentially worsen concussive symptoms.26 We identified an increase in medication usage over time despite limited evidence of their effectiveness for pediatric concussion.27–29 This change may reflect improved symptom screening4,30 and/or increased awareness of specific medication safety profiles in pediatric trauma patients, especially for NSAIDs and ondansetron. Although we saw an increase in NSAID use, we did not see a proportional decrease in narcotic use. Similarly, while two-thirds of our cohort received IV medications, there is controversy about the need for IV fluids and medications for other pediatric illnesses, with research demonstrating that IV treatment may not reduce recovery time and may contribute to prolonged hospitalization and phlebitis.31,32 Thus, there is a need to understand the therapeutic effectiveness and benefits of medications and fluids on postconcussion recovery.
Neuroimaging rates for children receiving ED evaluation for concussion have been reported to be up to 60%-70%,1,22 although a more recent study spanning 2006 to 2011 found a 35-%–40% head CT rate in pediatric patients by hospital-based EDs in the United States.33 Our results appear to support decreasing head CT use over time in pediatric hospitals. Hospitalization for observation is costly1 but could decrease a child’s risk of malignancy from radiation exposure. Further work on balancing cost, risk, and shared decision-making with parents could guide decisions regarding emergent neuroimaging versus admission.
This study has limitations inherent to the use of an administrative dataset, including lack of information regarding why the child was admitted. Since the focus was to describe inpatient care of children with concussion, those discharged home from the ED were not included in this dataset. Consequently, we could not contrast the ED care of those discharged home with those who were admitted or assess trends in admission rates for concussion. Although the overall number of concussion admissions has continued to remain stable over time,1 due to a lack of prospectively collected clinical information, we are unable to determine whether observed trends in care are secondary to changes in practice or changes in concussion severity. However, there has been no research to date supporting the latter. Ethnicity was excluded due to high levels of missing data. Cost of stay was not extensively analyzed given hospital variation in designation of observational or inpatient status, which subsequently affects billing.34 Rates of neuroimaging and ED revisit may have been underestimated since children could have received care at a non-PHIS hospital. Similarly, the decrease in the proportion of children receiving neuroimaging over time may have been associated with an increase in children being transferred from a non-PHIS hospital for admission, although with increased regionalization in trauma care, we would not expect transfers of children with only concussion to have significantly increased. Finally, data were limited to the pediatric tertiary care centers participating in PHIS, thereby reducing generalizability and introducing selection bias by only including children who were able to access care at PHIS hospitals. Although the care practices we evaluated (eg, NSAIDs and head CT) are available at all hospitals, our analyses only reflect care delivered within the PHIS.
Concussion accounted for 15% of all pediatric TBI admissions during our study period. Further investigation of potential factors associated with admission and protracted recovery (eg, adolescent females needing treatment for severe symptomatology) could facilitate better understanding of how hospitalization affects recovery. Additionally, research on acute pharmacotherapies (eg, IV therapies and/or inpatient treatment until symptoms resolve) is needed to fully elucidate the acute and long-term benefits of interventions delivered to children.
ACKNOWLEDGMENTS
Colleen Mangeot: Biostatistician with extensive PHIS knowledge who contributed to database creation and statistical analysis. Yanhong (Amy) Liu: Research database programmer who developed the database, ran quality assurance measures, and cleaned all study data.
Disclosures
The authors have nothing to disclose.
Funding
This study was supported by grant R40 MC 268060102 from the Maternal and Child Health Research Program, Maternal and Child Health Bureau (Title V, Social Security Act), Health Resources and Services Administration, Department of Health and Human Services. The funding source was not involved in development of the study design; in the collection, analysis and interpretation of data; or in the writing of this report.
1. Colvin JD, Thurm C, Pate BM, Newland JG, Hall M, Meehan WP. Diagnosis and acute management of patients with concussion at children’s hospitals. Arch Dis Child. 2013;98(12):934-938. PubMed
2. Bourgeois FT, Monuteaux MC, Stack AM, Neuman MI. Variation in emergency department admission rates in US children’s hospitals. Pediatrics. 2014;134(3):539-545. PubMed
3. Blinman TA, Houseknecht E, Snyder C, Wiebe DJ, Nance ML. Postconcussive symptoms in hospitalized pediatric patients after mild traumatic brain injury. J Pediatr Surg. 2009;44(6):1223-1228. PubMed
4. Babcock L, Byczkowski T, Wade SL, Ho M, Mookerjee S, Bazarian JJ. Predicting postconcussion syndrome after mild traumatic brain injury in children and adolescents who present to the emergency department. JAMA pediatrics. 2013;167(2):156-161. PubMed
5. Conway PH, Keren R. Factors associated with variability in outcomes for children hospitalized with urinary tract infection. The Journal of pediatrics. 2009;154(6):789-796. PubMed
6. Services UDoHaH. International classification of diseases, 9th Revision, Clinical modification (ICD-9CM). Washington, DC: US Department of Health and Human Services. Public Health Service, Health Care Financing Administration 1989.
7. Marr AL, Coronado VG. Annual data submission standards. Central nervous system injury surveillance. In: US Department of Health and Human Services PHS, CDC, ed. Atlanta, GA 2001.
8. Organization WH. International classification of diseases: manual on the international statistical classification of diseases, injuries, and cause of death. In: Organization WH, ed. 9th rev. ed. Geneva, Switerland 1977.
9. Centers for Disease Control and Prevention, National Center for Injury Prevention and Control. Report to Congress on mild traumatic brain injury in the United States: steps to prevent a serious public health problem. Atlanta, GA: Centers for Disease Control and Prevention; 2003.
10. Mackenzie E, Sacco WJ. ICDMAP-90 software: user’s guide. Baltimore, Maryland: Johns Hopkins University and Tri-Analytics. 1997:1-25.
11. MacKenzie EJ, Steinwachs DM, Shankar B. Classifying trauma severity based on hospital discharge diagnoses. Validation of an ICD-9CM to AIS-85 conversion table. Med Care. 1989;27(4):412-422. PubMed
12. Fleischman RJ, Mann NC, Dai M, et al. Validating the use of ICD-9 code mapping to generate injury severity scores. J Trauma Nurs. 2017;24(1):4-14. PubMed
13. Baker SP, O’Neill B, Haddon W, Jr., Long WB. The injury severity score: a method for describing patients with multiple injuries and evaluating emergency care. The Journal of trauma. 1974;14(3):187-196. PubMed
14. Wood JN, Feudtner C, Medina SP, Luan X, Localio R, Rubin DM. Variation in occult injury screening for children with suspected abuse in selected US children’s hospitals. Pediatrics
15. Yang J, Phillips G, Xiang H, Allareddy V, Heiden E, Peek-Asa C. Hospitalisations for sport-related concussions in US children aged 5 to 18 years during 2000-2004. Br J Sports Med. 2008;42(8):664-669. PubMed
16. Feudtner C, Christakis DA, Connell FA. Pediatric deaths attributable to complex chronic conditions: a population-based study of Washington State, 1980-1997. Pediatrics. 2000;106(1):205-209. PubMed
17. Peltz A, Wu CL, White ML, et al. Characteristics of rural children admitted to pediatric hospitals. Pediatrics. 2016;137(5): e20153156. PubMed
18. Services UDoHaH. Annual update of the HHS Poverty Guidelines. Federal Register; 2016-03-14 2011.
19. Hart LG, Larson EH, Lishner DM. Rural definitions for health policy and research. Am J Public Health. 2005;95(7):1149-1155. PubMed
20. Proposed Matrix of E-code Groupings| WISQARS | Injury Center | CDC. 2016; http://www.cdc.gov/injury/wisqars/ecode_matrix.html.
21. Zemek RL, Farion KJ, Sampson M, McGahern C. Prognosticators of persistent symptoms following pediatric concussion: A systematic review. JAMA Pediatr. 2013;167(3):259-265. PubMed
22. Meehan WP, Mannix R. Pediatric concussions in United States emergency departments in the years 2002 to 2006. J Pediatr. 2010;157(6):889-893. PubMed
23. Davis GA, Purcell LK. The evaluation and management of acute concussion differs in young children. Br J Sports Med. 2014;48(2):98-101. PubMed
24. Zemek R, Barrowman N, Freedman SB, et al. Clinical risk score for persistent postconcussion symptoms among children with acute concussion in the ED. JAMA. 2016;315(10):1014-1025. PubMed
25. Hinds PS, Hockenberry M, Rai SN, et al. Nocturnal awakenings, sleep environment interruptions, and fatigue in hospitalized children with cancer. Oncol Nurs Forum. 2007;34(2):393-402. PubMed
26. Patterson ZR, Holahan MR. Understanding the neuroinflammatory response following concussion to develop treatment strategies. Front Cell Neurosci. 2012;6:58. PubMed
27. Meehan WP. Medical therapies for concussion. Clin Sports Med. 2011;30(1):115-124, ix. PubMed
28. Petraglia AL, Maroon JC, Bailes JE. From the field of play to the field of combat: a review of the pharmacological management of concussion. Neurosurgery. 2012;70(6):1520-1533. PubMed
29. Giza CC, Kutcher JS, Ashwal S, et al. Summary of evidence-based guideline update: evaluation and management of concussion in sports: Report of the Guideline Development Subcommittee of the American Academy of Neurology. Neurology. 2013;80(24):2250-2257. PubMed
30. Barlow KM, Crawford S, Stevenson A, Sandhu SS, Belanger F, Dewey D. Epidemiology of postconcussion syndrome in pediatric mild traumatic brain injury. Pediatrics. 2010;126(2):e374-e381. PubMed
31. Keren R, Shah SS, Srivastava R, et al. Comparative effectiveness of intravenous vs oral antibiotics for postdischarge treatment of acute osteomyelitis in children. JAMA Pediatr. 2015;169(2):120-128. PubMed
32. Hartling L, Bellemare S, Wiebe N, Russell K, Klassen TP, Craig W. Oral versus intravenous rehydration for treating dehydration due to gastroenteritis in children. Cochrane Database Syst Rev. 2006(3):CD004390. PubMed
34. Fieldston ES, Shah SS, Hall M, et al. Resource utilization for observation-status stays at children’s hospitals. Pediatrics. 2013;131(6):1050-1058. PubMed
33. Zonfrillo MR, Kim KH, Arbogast KB. Emergency Department Visits and Head Computed Tomography Utilization for Concussion Patients From 2006 to 2011. Acad Emerg Med. 2015;22(7):872-877. PubMed
© 2018 Society of Hospital Medicine
Focused Ethnography of Diagnosis in Academic Medical Centers
Diagnostic error—defined as a failure to establish an accurate and timely explanation of the patient’s health problem—is an important source of patient harm.1 Data suggest that all patients will experience at least 1 diagnostic error in their lifetime.2-4 Not surprisingly, diagnostic errors are among the leading categories of paid malpractice claims in the United States.5
Despite diagnostic errors being morbid and sometimes deadly in the hospital,6,7 little is known about how residents and learners approach diagnostic decision making. Errors in diagnosis are believed to stem from cognitive or system failures,8 with errors in cognition believed to occur due to rapid, reflexive thinking operating in the absence of a more analytical, deliberate process. System-based problems (eg, lack of expert availability, technology barriers, and access to data) have also been cited as contributors.9 However, whether and how these apply to trainees is not known.
Therefore, we conducted a focused ethnography of inpatient medicine teams (ie, attendings, residents, interns, and medical students) in 2 affiliated teaching hospitals, aiming to (a) observe the process of diagnosis by trainees and (b) identify methods to improve the diagnostic process and prevent errors.
METHODS
We designed a multimethod, focused ethnographic study to examine diagnostic decision making in hospital settings.10,11 In contrast to anthropologic ethnographies that study entire fields using open-ended questions, our study was designed to examine the process of diagnosis from the perspective of clinicians engaged in this activity.11 This approach allowed us to capture diagnostic decisions and cognitive and system-based factors in a manner currently lacking in the literature.12
Setting and Participants
Between January 2016 and May 2016, we observed the members of four inpatient internal medicine teaching teams at 2 affiliated teaching hospitals. We purposefully selected teaching teams for observation because they are the primary model of care in academic settings and we have expertise in carrying out similar studies.13,14 Teaching teams typically consisted of a medical attending (senior-level physician), 1 senior resident (a second- or third-year postgraduate trainee), two interns (a trainee in their first postgraduate year), and two to four medical students. Teams were selected at random using existing schedules and followed Monday to Friday so as to permit observation of work on call and noncall days. Owing to manpower limitations, weekend and night shifts were not observed. However, overnight events were captured during morning rounds.
Most of the teams began rounds at 8:30 AM. Typically, rounds lasted for 90–120 min and concluded with a recap (ie, “running the list”) with a review of explicit plans for patients after they had been evaluated by the attending. This discussion often occurred in the team rooms, with the attending leading the discussion with the trainees.
Data Collection
A multidisciplinary team, including clinicians (eg, physicians, nurses), nonclinicians (eg, qualitative researchers, social scientists), and healthcare engineers, conducted the observations. We observed preround activities of interns and residents before arrival of the attending (7:00 AM - 8:30 AM), followed by morning rounds with the entire team, and afternoon work that included senior residents, interns, and students.
To capture multiple aspects of the diagnostic process, we collected data using field notes modeled on components of the National Academy of Science model for diagnosis (Appendix).1,15 This model encompasses phases of the diagnostic process (eg, data gathering, integration, formulation of a working diagnosis, treatment delivery, and outcomes) and the work system (team members, organization, technology and tools, physical environment, tasks).
Focus Groups and Interviews
At the end of weekly observations, we conducted focus groups with the residents and one-on- one interviews with the attendings. Focus groups with the residents were conducted to encourage a group discussion about the diagnostic process. Separate interviews with the attendings were performed to ensure that power differentials did not influence discussions. During focus groups, we specifically asked about challenges and possible solutions to improve diagnosis. Experienced qualitative methodologists (J.F., M.H., M.Q.) used semistructured interview guides for discussions (Appendix).
Data Analysis
After aggregating and reading the data, three reviewers (V.C., S.K., S.S.) began inductive analysis by handwriting notes and initial reflective thoughts to create preliminary codes. Multiple team members then reread the original field notes and the focus group/interview data to refine the preliminary codes and develop additional codes. Next, relationships between codes were identified and used to develop key themes. Triangulation of data collected from observations and interview/focus group sessions was carried out to compare data that we surmised with data that were verbalized by the team. The developed themes were discussed as a group to ensure consistency of major findings.
Ethical and Regulatory Oversight
This study was reviewed and approved by the Institutional Review Boards at the University of Michigan Health System (HUM-00106657) and the VA Ann Arbor Healthcare System (1-2016-010040).
RESULTS
Four teaching teams (4 attendings, 4 senior residents, 9 interns, and 14 medical students) were observed over 33 distinct shifts and 168 hours. Observations included morning rounds (96 h), postround call days (52 h), and postround non-call days (20 h). Morning rounds lasted an average of 127 min (range: 48-232 min) and included an average of 9 patients (range: 4-16 patients).
Themes Regarding the Diagnostic Process
We identified the following 4 primary themes related to the diagnostic process in teaching hospitals: (1) diagnosis is a social phenomenon; (2) data necessary to make diagnoses are fragmented; (3) distractions undermine the diagnostic process; and (4) time pressures interfere with diagnostic decision making (Appendix Table 1).
(1) Diagnosis is a Social Phenomenon.
Team members viewed the process of diagnosis as a social exchange of facts, findings, and strategies within a defined structure. The opportunity to discuss impressions with others was valued as a means to share, test, and process assumptions.
“Rounds are the most important part of the process. That is where we make most decisions in a collective, collaborative way with the attending present. We bounce ideas off each other.” (Intern)
Typical of social processes, variations based on time of day and schedule were observed. For instance, during call days, learners gathered data and formed working diagnosis and treatment plans with minimal attending interaction. This separation of roles and responsibilities introduced a hierarchy within diagnosis as follows:
“The interns would not call me first; they would talk to the senior resident and then if the senior thought he should chat with me, then they would call. But for the most part, they gather information and come up with the plan.” (Attending).
The work system was suited to facilitate social interactions. For instance, designated rooms (with team members informally assigned to a computer) provided physical proximity of the resident to interns and medical students. In this space, numerous informal discussions between team members (eg, “What do you think about this test?” “I’m not sure what to do about this finding.” “Should I call a [consult] on this patient?”) were observed. Although proximity to each other was viewed as beneficial, dangers to the social nature of diagnosis in the form of anchoring (ie, a cognitive bias where emphasis is placed on the first piece of data)16 were also mentioned. Similarly, the paradox associated with social proof (ie, the pressure to assume conformity within a group) was also observed as disagreement between team members and attendings rarely occurred during observations.
“I mean, they’re the attending, right? It’s hard to argue with them when they want a test or something done. When I do push back, it’s rare that others will support me–so it’s usually me and the attending.” (Resident)
“I would push back if I think it’s really bad for the patient or could cause harm–but the truth is, it doesn’t happen much.” (Intern)
(2) Data Necessary to Make Diagnoses are Fragmented
Team members universally cited fragmentation in data delivery, retrieval, and processing as a barrier to diagnosis. Team members indicated that test results might not be looked at or acted upon in a timely manner, and participants pointed to the electronic medical record as a source of this challenge.
“Before I knew about [the app for Epic], I would literally sit on the computer to get all the information we would need on rounds. Its key to making decisions. We often say we will do something, only to find the test result doesn’t support it–and then we’re back to square 1.” (Intern)
Information used by teams came from myriad sources (eg, patients, family members, electronic records) and from various settings (eg, emergency department, patient rooms, discussions with consultants). Additionally, test results often appeared without warning. Thus, availability of information was poorly aligned with clinical duties.
“They (the lab) will call us when a blood culture is positive or something is off. That is very helpful but it often comes later in the day, when we’re done with rounds.” (Resident)
The work system was highlighted as a key contributor to data fragmentation. Peculiarities of our electronic medical record (EMR) and how data were collected, stored, or presented were described as “frustrating,” and “unsafe,” by team members. Correspondingly, we frequently observed interns asking for assistance for tasks such as ordering tests or finding information despite being “trained” to use the EMR.
“People have to learn how to filter, how to recognize the most important points and link data streams together in terms of causality. But we assume they know where to find that information. It’s actually a very hard thing to do, for both the house staff and me.” (Attending)
(3) Distractions Undermine the Diagnostic Process
Distractions often created cognitive difficulties. For example, ambient noise and interruptions from neighbors working on other teams were cited as barriers to diagnosis. In addition, we observed several team members using headphones to drown out ambient noise while working on the computer.
“I know I shouldn’t do it (wear headphones), but I have no other way of turning down the noise so I can concentrate.” (Intern)
Similarly, the unpredictable nature and the volume of pages often interrupted thinking about diagnosis.
“Sometimes the pager just goes off all the time and (after making sure its not an urgent issue), I will just ignore it for a bit, especially if I am in the middle of something. It would be great if I could finish my thought process knowing I would not be interrupted.” (Resident)
To mitigate this problem, 1 attending described how he would proactively seek out nurses caring for his patients to “head off” questions (eg, “I will renew the restraints and medications this morning,” and “Is there anything you need in terms of orders for this patient that I can take care of now?”) that might lead to pages. Another resident described his approach as follows:
“I make it a point to tell the nurses where I will be hanging out and where they can find me if they have any questions. I tell them to come talk to me rather than page me since that will be less distracting.” (Resident).
Most of the interns described documentation work such as writing admission and progress notes in negative terms (“an academic exercise,” “part of the billing activity”). However, in the context of interruptions, some described this as helpful.
“The most valuable part of the thinking process was writing the assessment and plan because that’s actually my schema for all problems. It literally is the only time where I can sit and collect my thoughts to formulate a diagnosis and plan.” (Intern)
(4) Time Pressures Interfere With Diagnostic Decision Making
All team members spoke about the challenge of finding time for diagnosis during the workday. Often, they had to skip learning sessions for this purpose.
“They tell us we should go to morning report or noon conference but when I’m running around trying to get things done. I hate having to choose between my education and doing what’s best for the patient–but that’s often what it comes down to.” (Intern)
When specifically asked whether setting aside dedicated time to specifically review and formulate diagnoses would be valuable, respondents were uniformly enthusiastic. Team members described attentional conflicts as being the worst when “cross covering” other teams on call days, as their patient load effectively doubled during this time. Of note, cross-covering occurred when teams were also on call—and thus took them away from important diagnostic activities such as data gathering or synthesis for patients they were admitting.
“If you were to ever design a system where errors were likely–this is how you would design it: take a team with little supervision, double their patient load, keep them busy with new challenging cases and then ask questions about patients they know little about.” (Resident)
DISCUSSION
Although diagnostic errors have been called “the next frontier for patient safety,”17 little is known about the process, barriers, and facilitators to diagnosis in teaching hospitals. In this focused ethnography conducted at 2 academic medical centers, we identified multiple cognitive and system-level challenges and potential strategies to improve diagnosis from trainees engaged in this activity. Key themes identified by those we observed included the social nature of diagnosis, fragmented information delivery, constant distractions and interruptions, and time pressures. In turn, these insights allow us to generate strategies that can be applied to improve the diagnostic process in teaching hospitals.
Our study underscores the importance of social interactions in diagnosis. In contrast, most of the interventions to prevent diagnostic errors target individual providers through practices such as metacognition and “thinking about thinking.”18-20 These interventions are based on Daniel Kahnemann’s work on dual thought process. Type 1 thought processes are fast, subconscious, reflexive, largely intuitive, and more vulnerable to error. In contrast, Type 2 processes are slower, deliberate, analytic, and less prone to error.21 Although an individual’s Type 2 thought capacity is limited, a major goal of cognitive interventions is to encourage Type 2 over Type 1 thinking, an approach termed “de-biasing.”22-24 Unfortunately, cognitive interventions testing such approaches have suffered mixed results–perhaps because of lack of focus on collective wisdom or group thinking, which may be key to diagnosis from our findings.9,25 In this sense, morning rounds were a social gathering used to strategize and develop care plans, but with limited time to think about diagnosis.26 Introduction of defined periods for individuals to engage in diagnostic activities such as de-biasing (ie, asking “what else could this be)27 before or after rounds may provide an opportunity for reflection and improving diagnosis. In addition, embedding tools such as diagnosis expanders and checklists within these defined time slots28,29 may prove to be useful in reflecting on diagnosis and preventing diagnostic errors.
An unexpected yet important finding from this study were the challenges posed by distractions and the physical environment. Potentially maladaptive workarounds to these interruptions included use of headphones; more productive strategies included updating nurses with plans to avert pages and creating a list of activities to ensure that key tasks were not forgotten.30,31 Applying lessons from aviation, a focused effort to limit distractions during key portions of the day, might be worth considering for diagnostic safety.32 Similarly, improving the environment in which diagnosis occurs—including creating spaces that are quiet, orderly, and optimized for thinking—may be valuable.33Our study has limitations. First, our findings are limited to direct observations; we are thus unable to comment on how unobserved aspects of care (eg, cognitive processes) might have influenced our findings. Our observations of clinical care might also have introduced a Hawthorne effect. However, because we were closely integrated with teams and conducted focus groups to corroborate our assessments, we believe that this was not the case. Second, we did not identify diagnostic errors or link processes we observed to errors. Third, our approach is limited to 2 teaching centers, thereby limiting the generalizability of findings. Relatedly, we were only able to conduct observations during weekdays; differences in weekend and night resources might affect our insights.
The cognitive and system-based barriers faced by clinicians in teaching hospitals suggest that new methods to improve diagnosis are needed. Future interventions such as defined “time-outs” for diagnosis, strategies focused on limiting distractions, and methods to improve communication between team members are novel and have parallels in other industries. As challenges to quantify diagnostic errors abound,34 improving cognitive- and system-based factors via reflection through communication, concentration, and organization is necessary to improve medical decision making in academic medical centers.
Disclosures
None declared for all coauthors.
Funding
This project was supported by grant number P30HS024385 from the Agency for Healthcare Research and Quality. The funding source played no role in study design, data acquisition, analysis or decision to report these data. Dr. Chopra is supported by a career development award from the Agency of Healthcare Research and Quality (1-K08-HS022835-01). Dr. Krein is supported by a VA Health Services Research and Development Research Career Scientist Award (RCS 11-222). Dr. Singh is partially supported by Houston VA HSR&D Center for Innovations in Quality, Effectiveness and Safety (CIN 13-413). The content is solely the responsibility of the authors and does not necessarily represent the official views of the Agency for Healthcare Research and Quality or the Department of Veterans Affairs.
1. National Academies of Sciences, Engineering, and Medicine. 2015. Improving Diagnosis in Health Care. Washington, DC: The National Academies Press. http://www.nap.edu/21794. Accessed November 1; 2016:2015. https://doi.org/10.17226/21794.
2. Schiff GD, Hasan O, Kim S, et al. Diagnostic error in medicine: analysis of 583 physician-reported errors. Arch Intern Med. 2009;169(20):1881-1887. http://dx.doi.org/10.1001/archinternmed.2009.333. PubMed
3. Sonderegger-Iseli K, Burger S, Muntwyler J, Salomon F. Diagnostic errors in three medical eras: A necropsy study. Lancet. 2000;355(9220):2027-2031. http://dx.doi.org/10.1016/S0140-6736(00)02349-7. PubMed
4. Winters B, Custer J, Galvagno SM Jr, et al. Diagnostic errors in the intensive care unit: a systematic review of autopsy studies. BMJ Qual Saf. 2012;21(11):894-902. http://dx.doi.org/10.1136/bmjqs-2012-000803. PubMed
5. Saber Tehrani AS, Lee H, Mathews SC, et al. 25-Year summary of US malpractice claims for diagnostic errors 1986-2010: an analysis from the National Practitioner Data Bank. BMJ Qual Saf. 2013;22(8):672-680. http://dx.doi.org/10.1136/bmjqs-2012-001550. PubMed
6. Graber M, Gordon R, Franklin N. Reducing diagnostic errors in medicine: what’s the goal? Acad Med. 2002;77(10):981-992. http://dx.doi.org/10.1097/00001888-200210000-00009. PubMed
7. Gupta A, Snyder A, Kachalia A, Flanders S, Saint S, Chopra V. Malpractice claims related to diagnostic errors in the hospital. BMJ Qual Saf. 2018;27(1):53-60. 10.1136/bmjqs-2017-006774. PubMed
8. van Noord I, Eikens MP, Hamersma AM, de Bruijne MC. Application of root cause analysis on malpractice claim files related to diagnostic failures. Qual Saf Health Care. 2010;19(6):e21. http://dx.doi.org/10.1136/qshc.2008.029801. PubMed
9. Croskerry P, Petrie DA, Reilly JB, Tait G. Deciding about fast and slow decisions. Acad Med. 2014;89(2):197-200. 10.1097/ACM.0000000000000121. PubMed
10. Higginbottom GM, Pillay JJ, Boadu NY. Guidance on performing focused ethnographies with an emphasis on healthcare research. Qual Rep. 2013;18(9):1-6. https://doi.org/10.7939/R35M6287P.
11. Savage J. Participative observation: standing in the shoes of others? Qual Health Res. 2000;10(3):324-339. http://dx.doi.org/10.1177/104973200129118471. PubMed
12. Patton MQ. Qualitative Research and Evaluation Methods. 3rd ed. Thousand Oaks, CA: SAGE Publications; 2002.
13. Harrod M, Weston LE, Robinson C, Tremblay A, Greenstone CL, Forman J. “It goes beyond good camaraderie”: A qualitative study of the process of becoming an interprofessional healthcare “teamlet.” J Interprof Care. 2016;30(3):295-300. http://dx.doi.org/10.3109/13561820.2015.1130028. PubMed
14. Houchens N, Harrod M, Moody S, Fowler KE, Saint S. Techniques and behaviors associated with exemplary inpatient general medicine teaching: an exploratory qualitative study. J Hosp Med. 2017;12(7):503-509. http://dx.doi.org/10.12788/jhm.2763. PubMed
15. Mulhall A. In the field: notes on observation in qualitative research. J Adv Nurs. 2003;41(3):306-313. http://dx.doi.org/10.1046/j.1365-2648.2003.02514.x. PubMed
16. Zwaan L, Monteiro S, Sherbino J, Ilgen J, Howey B, Norman G. Is bias in the eye of the beholder? A vignette study to assess recognition of cognitive biases in clinical case workups. BMJ Qual Saf. 2017;26(2):104-110. http://dx.doi.org/10.1136/bmjqs-2015-005014. PubMed
17. Singh H, Graber ML. Improving diagnosis in health care--the next imperative for patient safety. N Engl J Med. 2015;373(26):2493-2495. http://dx.doi.org/10.1056/NEJMp1512241. PubMed
18. Croskerry P. From mindless to mindful practice--cognitive bias and clinical decision making. N Engl J Med. 2013;368(26):2445-2448. http://dx.doi.org/10.1056/NEJMp1303712. PubMed
19. van den Berge K, Mamede S. Cognitive diagnostic error in internal medicine. Eur J Intern Med. 2013;24(6):525-529. http://dx.doi.org/10.1016/j.ejim.2013.03.006. PubMed
20. Norman G, Sherbino J, Dore K, et al. The etiology of diagnostic errors: A controlled trial of system 1 versus system 2 reasoning. Acad Med. 2014;89(2):277-284. 10.1097/ACM.0000000000000105 PubMed
21. Dhaliwal G. Premature closure? Not so fast. BMJ Qual Saf. 2017;26(2):87-89. http://dx.doi.org/10.1136/bmjqs-2016-005267. PubMed
22. Croskerry P, Singhal G, Mamede S. Cognitive debiasing 1: Origins of bias and theory of debiasing. BMJ Qual Saf. 2013;22(suppl 2):ii58-iiii64. http://dx.doi.org/10.1136/bmjqs-2012-001712. PubMed
23. Croskerry P, Singhal G, Mamede S. Cognitive debiasing 2: Impediments to and strategies for change. BMJ Qual Saf. 2013;22(suppl 2):ii65-iiii72. http://dx.doi.org/10.1136/bmjqs-2012-001713. PubMed
24. Reilly JB, Ogdie AR, Von Feldt JM, Myers JS. Teaching about how doctors think: a longitudinal curriculum in cognitive bias and diagnostic error for residents. BMJ Qual Saf. 2013;22(12):1044-1050. http://dx.doi.org/10.1136/bmjqs-2013-001987. PubMed
25. Schmidt HG, Mamede S, van den Berge K, van Gog T, van Saase JL, Rikers RM. Exposure to media information about a disease can cause doctors to misdiagnose similar-looking clinical cases. Acad Med. 2014;89(2):285-291. http://dx.doi.org/10.1097/ACM.0000000000000107. PubMed
26. Hess BJ, Lipner RS, Thompson V, Holmboe ES, Graber ML. Blink or think: can further reflection improve initial diagnostic impressions? Acad Med. 2015;90(1):112-118. http://dx.doi.org/10.1097/ACM.0000000000000550. PubMed
27. Lambe KA, O’Reilly G, Kelly BD, Curristan S. Dual-process cognitive interventions to enhance diagnostic reasoning: A systematic review. BMJ Qual Saf. 2016;25(10):808-820. http://dx.doi.org/10.1136/bmjqs-2015-004417. PubMed
28. Graber ML, Kissam S, Payne VL, et al. Cognitive interventions to reduce diagnostic error: a narrative review. BMJ Qual Saf. 2012;21(7):535-557. http://dx.doi.org/10.1136/bmjqs-2011-000149. PubMed
29. McDonald KM, Matesic B, Contopoulos-Ioannidis DG, et al. Patient safety strategies targeted at diagnostic errors: a systematic review. Ann Intern Med. 2013;158(5 Pt 2):381-389. http://dx.doi.org/10.7326/0003-4819-158-5-201303051-00004. PubMed
30. Wray CM, Chaudhry S, Pincavage A, et al. Resident shift handoff strategies in US internal medicine residency programs. JAMA. 2016;316(21):2273-2275. http://dx.doi.org/10.1001/jama.2016.17786. PubMed
31. Choo KJ, Arora VM, Barach P, Johnson JK, Farnan JM. How do supervising physicians decide to entrust residents with unsupervised tasks? A qualitative analysis. J Hosp Med. 2014;9(3):169-175. http://dx.doi.org/10.1002/jhm.2150. PubMed
32. Carayon P, Wood KE. Patient safety - the role of human factors and systems engineering. Stud Health Technol Inform. 2010;153:23-46.
.http://dx.doi.org/10.1001/jama.2015.13453 PubMed
34. McGlynn EA, McDonald KM, Cassel CK. Measurement is essential for improving diagnosis and reducing diagnostic error: A report from the Institute of Medicine. JAMA. 2015;314(23):2501-2502.
.http://dx.doi.org/10.1136/bmjqs-2013-001812 PubMed
33. Carayon P, Xie A, Kianfar S. Human factors and ergonomics as a patient safety practice. BMJ Qual Saf. 2014;23(3):196-205. PubMed
Diagnostic error—defined as a failure to establish an accurate and timely explanation of the patient’s health problem—is an important source of patient harm.1 Data suggest that all patients will experience at least 1 diagnostic error in their lifetime.2-4 Not surprisingly, diagnostic errors are among the leading categories of paid malpractice claims in the United States.5
Despite diagnostic errors being morbid and sometimes deadly in the hospital,6,7 little is known about how residents and learners approach diagnostic decision making. Errors in diagnosis are believed to stem from cognitive or system failures,8 with errors in cognition believed to occur due to rapid, reflexive thinking operating in the absence of a more analytical, deliberate process. System-based problems (eg, lack of expert availability, technology barriers, and access to data) have also been cited as contributors.9 However, whether and how these apply to trainees is not known.
Therefore, we conducted a focused ethnography of inpatient medicine teams (ie, attendings, residents, interns, and medical students) in 2 affiliated teaching hospitals, aiming to (a) observe the process of diagnosis by trainees and (b) identify methods to improve the diagnostic process and prevent errors.
METHODS
We designed a multimethod, focused ethnographic study to examine diagnostic decision making in hospital settings.10,11 In contrast to anthropologic ethnographies that study entire fields using open-ended questions, our study was designed to examine the process of diagnosis from the perspective of clinicians engaged in this activity.11 This approach allowed us to capture diagnostic decisions and cognitive and system-based factors in a manner currently lacking in the literature.12
Setting and Participants
Between January 2016 and May 2016, we observed the members of four inpatient internal medicine teaching teams at 2 affiliated teaching hospitals. We purposefully selected teaching teams for observation because they are the primary model of care in academic settings and we have expertise in carrying out similar studies.13,14 Teaching teams typically consisted of a medical attending (senior-level physician), 1 senior resident (a second- or third-year postgraduate trainee), two interns (a trainee in their first postgraduate year), and two to four medical students. Teams were selected at random using existing schedules and followed Monday to Friday so as to permit observation of work on call and noncall days. Owing to manpower limitations, weekend and night shifts were not observed. However, overnight events were captured during morning rounds.
Most of the teams began rounds at 8:30 AM. Typically, rounds lasted for 90–120 min and concluded with a recap (ie, “running the list”) with a review of explicit plans for patients after they had been evaluated by the attending. This discussion often occurred in the team rooms, with the attending leading the discussion with the trainees.
Data Collection
A multidisciplinary team, including clinicians (eg, physicians, nurses), nonclinicians (eg, qualitative researchers, social scientists), and healthcare engineers, conducted the observations. We observed preround activities of interns and residents before arrival of the attending (7:00 AM - 8:30 AM), followed by morning rounds with the entire team, and afternoon work that included senior residents, interns, and students.
To capture multiple aspects of the diagnostic process, we collected data using field notes modeled on components of the National Academy of Science model for diagnosis (Appendix).1,15 This model encompasses phases of the diagnostic process (eg, data gathering, integration, formulation of a working diagnosis, treatment delivery, and outcomes) and the work system (team members, organization, technology and tools, physical environment, tasks).
Focus Groups and Interviews
At the end of weekly observations, we conducted focus groups with the residents and one-on- one interviews with the attendings. Focus groups with the residents were conducted to encourage a group discussion about the diagnostic process. Separate interviews with the attendings were performed to ensure that power differentials did not influence discussions. During focus groups, we specifically asked about challenges and possible solutions to improve diagnosis. Experienced qualitative methodologists (J.F., M.H., M.Q.) used semistructured interview guides for discussions (Appendix).
Data Analysis
After aggregating and reading the data, three reviewers (V.C., S.K., S.S.) began inductive analysis by handwriting notes and initial reflective thoughts to create preliminary codes. Multiple team members then reread the original field notes and the focus group/interview data to refine the preliminary codes and develop additional codes. Next, relationships between codes were identified and used to develop key themes. Triangulation of data collected from observations and interview/focus group sessions was carried out to compare data that we surmised with data that were verbalized by the team. The developed themes were discussed as a group to ensure consistency of major findings.
Ethical and Regulatory Oversight
This study was reviewed and approved by the Institutional Review Boards at the University of Michigan Health System (HUM-00106657) and the VA Ann Arbor Healthcare System (1-2016-010040).
RESULTS
Four teaching teams (4 attendings, 4 senior residents, 9 interns, and 14 medical students) were observed over 33 distinct shifts and 168 hours. Observations included morning rounds (96 h), postround call days (52 h), and postround non-call days (20 h). Morning rounds lasted an average of 127 min (range: 48-232 min) and included an average of 9 patients (range: 4-16 patients).
Themes Regarding the Diagnostic Process
We identified the following 4 primary themes related to the diagnostic process in teaching hospitals: (1) diagnosis is a social phenomenon; (2) data necessary to make diagnoses are fragmented; (3) distractions undermine the diagnostic process; and (4) time pressures interfere with diagnostic decision making (Appendix Table 1).
(1) Diagnosis is a Social Phenomenon.
Team members viewed the process of diagnosis as a social exchange of facts, findings, and strategies within a defined structure. The opportunity to discuss impressions with others was valued as a means to share, test, and process assumptions.
“Rounds are the most important part of the process. That is where we make most decisions in a collective, collaborative way with the attending present. We bounce ideas off each other.” (Intern)
Typical of social processes, variations based on time of day and schedule were observed. For instance, during call days, learners gathered data and formed working diagnosis and treatment plans with minimal attending interaction. This separation of roles and responsibilities introduced a hierarchy within diagnosis as follows:
“The interns would not call me first; they would talk to the senior resident and then if the senior thought he should chat with me, then they would call. But for the most part, they gather information and come up with the plan.” (Attending).
The work system was suited to facilitate social interactions. For instance, designated rooms (with team members informally assigned to a computer) provided physical proximity of the resident to interns and medical students. In this space, numerous informal discussions between team members (eg, “What do you think about this test?” “I’m not sure what to do about this finding.” “Should I call a [consult] on this patient?”) were observed. Although proximity to each other was viewed as beneficial, dangers to the social nature of diagnosis in the form of anchoring (ie, a cognitive bias where emphasis is placed on the first piece of data)16 were also mentioned. Similarly, the paradox associated with social proof (ie, the pressure to assume conformity within a group) was also observed as disagreement between team members and attendings rarely occurred during observations.
“I mean, they’re the attending, right? It’s hard to argue with them when they want a test or something done. When I do push back, it’s rare that others will support me–so it’s usually me and the attending.” (Resident)
“I would push back if I think it’s really bad for the patient or could cause harm–but the truth is, it doesn’t happen much.” (Intern)
(2) Data Necessary to Make Diagnoses are Fragmented
Team members universally cited fragmentation in data delivery, retrieval, and processing as a barrier to diagnosis. Team members indicated that test results might not be looked at or acted upon in a timely manner, and participants pointed to the electronic medical record as a source of this challenge.
“Before I knew about [the app for Epic], I would literally sit on the computer to get all the information we would need on rounds. Its key to making decisions. We often say we will do something, only to find the test result doesn’t support it–and then we’re back to square 1.” (Intern)
Information used by teams came from myriad sources (eg, patients, family members, electronic records) and from various settings (eg, emergency department, patient rooms, discussions with consultants). Additionally, test results often appeared without warning. Thus, availability of information was poorly aligned with clinical duties.
“They (the lab) will call us when a blood culture is positive or something is off. That is very helpful but it often comes later in the day, when we’re done with rounds.” (Resident)
The work system was highlighted as a key contributor to data fragmentation. Peculiarities of our electronic medical record (EMR) and how data were collected, stored, or presented were described as “frustrating,” and “unsafe,” by team members. Correspondingly, we frequently observed interns asking for assistance for tasks such as ordering tests or finding information despite being “trained” to use the EMR.
“People have to learn how to filter, how to recognize the most important points and link data streams together in terms of causality. But we assume they know where to find that information. It’s actually a very hard thing to do, for both the house staff and me.” (Attending)
(3) Distractions Undermine the Diagnostic Process
Distractions often created cognitive difficulties. For example, ambient noise and interruptions from neighbors working on other teams were cited as barriers to diagnosis. In addition, we observed several team members using headphones to drown out ambient noise while working on the computer.
“I know I shouldn’t do it (wear headphones), but I have no other way of turning down the noise so I can concentrate.” (Intern)
Similarly, the unpredictable nature and the volume of pages often interrupted thinking about diagnosis.
“Sometimes the pager just goes off all the time and (after making sure its not an urgent issue), I will just ignore it for a bit, especially if I am in the middle of something. It would be great if I could finish my thought process knowing I would not be interrupted.” (Resident)
To mitigate this problem, 1 attending described how he would proactively seek out nurses caring for his patients to “head off” questions (eg, “I will renew the restraints and medications this morning,” and “Is there anything you need in terms of orders for this patient that I can take care of now?”) that might lead to pages. Another resident described his approach as follows:
“I make it a point to tell the nurses where I will be hanging out and where they can find me if they have any questions. I tell them to come talk to me rather than page me since that will be less distracting.” (Resident).
Most of the interns described documentation work such as writing admission and progress notes in negative terms (“an academic exercise,” “part of the billing activity”). However, in the context of interruptions, some described this as helpful.
“The most valuable part of the thinking process was writing the assessment and plan because that’s actually my schema for all problems. It literally is the only time where I can sit and collect my thoughts to formulate a diagnosis and plan.” (Intern)
(4) Time Pressures Interfere With Diagnostic Decision Making
All team members spoke about the challenge of finding time for diagnosis during the workday. Often, they had to skip learning sessions for this purpose.
“They tell us we should go to morning report or noon conference but when I’m running around trying to get things done. I hate having to choose between my education and doing what’s best for the patient–but that’s often what it comes down to.” (Intern)
When specifically asked whether setting aside dedicated time to specifically review and formulate diagnoses would be valuable, respondents were uniformly enthusiastic. Team members described attentional conflicts as being the worst when “cross covering” other teams on call days, as their patient load effectively doubled during this time. Of note, cross-covering occurred when teams were also on call—and thus took them away from important diagnostic activities such as data gathering or synthesis for patients they were admitting.
“If you were to ever design a system where errors were likely–this is how you would design it: take a team with little supervision, double their patient load, keep them busy with new challenging cases and then ask questions about patients they know little about.” (Resident)
DISCUSSION
Although diagnostic errors have been called “the next frontier for patient safety,”17 little is known about the process, barriers, and facilitators to diagnosis in teaching hospitals. In this focused ethnography conducted at 2 academic medical centers, we identified multiple cognitive and system-level challenges and potential strategies to improve diagnosis from trainees engaged in this activity. Key themes identified by those we observed included the social nature of diagnosis, fragmented information delivery, constant distractions and interruptions, and time pressures. In turn, these insights allow us to generate strategies that can be applied to improve the diagnostic process in teaching hospitals.
Our study underscores the importance of social interactions in diagnosis. In contrast, most of the interventions to prevent diagnostic errors target individual providers through practices such as metacognition and “thinking about thinking.”18-20 These interventions are based on Daniel Kahnemann’s work on dual thought process. Type 1 thought processes are fast, subconscious, reflexive, largely intuitive, and more vulnerable to error. In contrast, Type 2 processes are slower, deliberate, analytic, and less prone to error.21 Although an individual’s Type 2 thought capacity is limited, a major goal of cognitive interventions is to encourage Type 2 over Type 1 thinking, an approach termed “de-biasing.”22-24 Unfortunately, cognitive interventions testing such approaches have suffered mixed results–perhaps because of lack of focus on collective wisdom or group thinking, which may be key to diagnosis from our findings.9,25 In this sense, morning rounds were a social gathering used to strategize and develop care plans, but with limited time to think about diagnosis.26 Introduction of defined periods for individuals to engage in diagnostic activities such as de-biasing (ie, asking “what else could this be)27 before or after rounds may provide an opportunity for reflection and improving diagnosis. In addition, embedding tools such as diagnosis expanders and checklists within these defined time slots28,29 may prove to be useful in reflecting on diagnosis and preventing diagnostic errors.
An unexpected yet important finding from this study were the challenges posed by distractions and the physical environment. Potentially maladaptive workarounds to these interruptions included use of headphones; more productive strategies included updating nurses with plans to avert pages and creating a list of activities to ensure that key tasks were not forgotten.30,31 Applying lessons from aviation, a focused effort to limit distractions during key portions of the day, might be worth considering for diagnostic safety.32 Similarly, improving the environment in which diagnosis occurs—including creating spaces that are quiet, orderly, and optimized for thinking—may be valuable.33Our study has limitations. First, our findings are limited to direct observations; we are thus unable to comment on how unobserved aspects of care (eg, cognitive processes) might have influenced our findings. Our observations of clinical care might also have introduced a Hawthorne effect. However, because we were closely integrated with teams and conducted focus groups to corroborate our assessments, we believe that this was not the case. Second, we did not identify diagnostic errors or link processes we observed to errors. Third, our approach is limited to 2 teaching centers, thereby limiting the generalizability of findings. Relatedly, we were only able to conduct observations during weekdays; differences in weekend and night resources might affect our insights.
The cognitive and system-based barriers faced by clinicians in teaching hospitals suggest that new methods to improve diagnosis are needed. Future interventions such as defined “time-outs” for diagnosis, strategies focused on limiting distractions, and methods to improve communication between team members are novel and have parallels in other industries. As challenges to quantify diagnostic errors abound,34 improving cognitive- and system-based factors via reflection through communication, concentration, and organization is necessary to improve medical decision making in academic medical centers.
Disclosures
None declared for all coauthors.
Funding
This project was supported by grant number P30HS024385 from the Agency for Healthcare Research and Quality. The funding source played no role in study design, data acquisition, analysis or decision to report these data. Dr. Chopra is supported by a career development award from the Agency of Healthcare Research and Quality (1-K08-HS022835-01). Dr. Krein is supported by a VA Health Services Research and Development Research Career Scientist Award (RCS 11-222). Dr. Singh is partially supported by Houston VA HSR&D Center for Innovations in Quality, Effectiveness and Safety (CIN 13-413). The content is solely the responsibility of the authors and does not necessarily represent the official views of the Agency for Healthcare Research and Quality or the Department of Veterans Affairs.
1. National Academies of Sciences, Engineering, and Medicine. 2015. Improving Diagnosis in Health Care. Washington, DC: The National Academies Press. http://www.nap.edu/21794. Accessed November 1; 2016:2015. https://doi.org/10.17226/21794.
2. Schiff GD, Hasan O, Kim S, et al. Diagnostic error in medicine: analysis of 583 physician-reported errors. Arch Intern Med. 2009;169(20):1881-1887. http://dx.doi.org/10.1001/archinternmed.2009.333. PubMed
3. Sonderegger-Iseli K, Burger S, Muntwyler J, Salomon F. Diagnostic errors in three medical eras: A necropsy study. Lancet. 2000;355(9220):2027-2031. http://dx.doi.org/10.1016/S0140-6736(00)02349-7. PubMed
4. Winters B, Custer J, Galvagno SM Jr, et al. Diagnostic errors in the intensive care unit: a systematic review of autopsy studies. BMJ Qual Saf. 2012;21(11):894-902. http://dx.doi.org/10.1136/bmjqs-2012-000803. PubMed
5. Saber Tehrani AS, Lee H, Mathews SC, et al. 25-Year summary of US malpractice claims for diagnostic errors 1986-2010: an analysis from the National Practitioner Data Bank. BMJ Qual Saf. 2013;22(8):672-680. http://dx.doi.org/10.1136/bmjqs-2012-001550. PubMed
6. Graber M, Gordon R, Franklin N. Reducing diagnostic errors in medicine: what’s the goal? Acad Med. 2002;77(10):981-992. http://dx.doi.org/10.1097/00001888-200210000-00009. PubMed
7. Gupta A, Snyder A, Kachalia A, Flanders S, Saint S, Chopra V. Malpractice claims related to diagnostic errors in the hospital. BMJ Qual Saf. 2018;27(1):53-60. 10.1136/bmjqs-2017-006774. PubMed
8. van Noord I, Eikens MP, Hamersma AM, de Bruijne MC. Application of root cause analysis on malpractice claim files related to diagnostic failures. Qual Saf Health Care. 2010;19(6):e21. http://dx.doi.org/10.1136/qshc.2008.029801. PubMed
9. Croskerry P, Petrie DA, Reilly JB, Tait G. Deciding about fast and slow decisions. Acad Med. 2014;89(2):197-200. 10.1097/ACM.0000000000000121. PubMed
10. Higginbottom GM, Pillay JJ, Boadu NY. Guidance on performing focused ethnographies with an emphasis on healthcare research. Qual Rep. 2013;18(9):1-6. https://doi.org/10.7939/R35M6287P.
11. Savage J. Participative observation: standing in the shoes of others? Qual Health Res. 2000;10(3):324-339. http://dx.doi.org/10.1177/104973200129118471. PubMed
12. Patton MQ. Qualitative Research and Evaluation Methods. 3rd ed. Thousand Oaks, CA: SAGE Publications; 2002.
13. Harrod M, Weston LE, Robinson C, Tremblay A, Greenstone CL, Forman J. “It goes beyond good camaraderie”: A qualitative study of the process of becoming an interprofessional healthcare “teamlet.” J Interprof Care. 2016;30(3):295-300. http://dx.doi.org/10.3109/13561820.2015.1130028. PubMed
14. Houchens N, Harrod M, Moody S, Fowler KE, Saint S. Techniques and behaviors associated with exemplary inpatient general medicine teaching: an exploratory qualitative study. J Hosp Med. 2017;12(7):503-509. http://dx.doi.org/10.12788/jhm.2763. PubMed
15. Mulhall A. In the field: notes on observation in qualitative research. J Adv Nurs. 2003;41(3):306-313. http://dx.doi.org/10.1046/j.1365-2648.2003.02514.x. PubMed
16. Zwaan L, Monteiro S, Sherbino J, Ilgen J, Howey B, Norman G. Is bias in the eye of the beholder? A vignette study to assess recognition of cognitive biases in clinical case workups. BMJ Qual Saf. 2017;26(2):104-110. http://dx.doi.org/10.1136/bmjqs-2015-005014. PubMed
17. Singh H, Graber ML. Improving diagnosis in health care--the next imperative for patient safety. N Engl J Med. 2015;373(26):2493-2495. http://dx.doi.org/10.1056/NEJMp1512241. PubMed
18. Croskerry P. From mindless to mindful practice--cognitive bias and clinical decision making. N Engl J Med. 2013;368(26):2445-2448. http://dx.doi.org/10.1056/NEJMp1303712. PubMed
19. van den Berge K, Mamede S. Cognitive diagnostic error in internal medicine. Eur J Intern Med. 2013;24(6):525-529. http://dx.doi.org/10.1016/j.ejim.2013.03.006. PubMed
20. Norman G, Sherbino J, Dore K, et al. The etiology of diagnostic errors: A controlled trial of system 1 versus system 2 reasoning. Acad Med. 2014;89(2):277-284. 10.1097/ACM.0000000000000105 PubMed
21. Dhaliwal G. Premature closure? Not so fast. BMJ Qual Saf. 2017;26(2):87-89. http://dx.doi.org/10.1136/bmjqs-2016-005267. PubMed
22. Croskerry P, Singhal G, Mamede S. Cognitive debiasing 1: Origins of bias and theory of debiasing. BMJ Qual Saf. 2013;22(suppl 2):ii58-iiii64. http://dx.doi.org/10.1136/bmjqs-2012-001712. PubMed
23. Croskerry P, Singhal G, Mamede S. Cognitive debiasing 2: Impediments to and strategies for change. BMJ Qual Saf. 2013;22(suppl 2):ii65-iiii72. http://dx.doi.org/10.1136/bmjqs-2012-001713. PubMed
24. Reilly JB, Ogdie AR, Von Feldt JM, Myers JS. Teaching about how doctors think: a longitudinal curriculum in cognitive bias and diagnostic error for residents. BMJ Qual Saf. 2013;22(12):1044-1050. http://dx.doi.org/10.1136/bmjqs-2013-001987. PubMed
25. Schmidt HG, Mamede S, van den Berge K, van Gog T, van Saase JL, Rikers RM. Exposure to media information about a disease can cause doctors to misdiagnose similar-looking clinical cases. Acad Med. 2014;89(2):285-291. http://dx.doi.org/10.1097/ACM.0000000000000107. PubMed
26. Hess BJ, Lipner RS, Thompson V, Holmboe ES, Graber ML. Blink or think: can further reflection improve initial diagnostic impressions? Acad Med. 2015;90(1):112-118. http://dx.doi.org/10.1097/ACM.0000000000000550. PubMed
27. Lambe KA, O’Reilly G, Kelly BD, Curristan S. Dual-process cognitive interventions to enhance diagnostic reasoning: A systematic review. BMJ Qual Saf. 2016;25(10):808-820. http://dx.doi.org/10.1136/bmjqs-2015-004417. PubMed
28. Graber ML, Kissam S, Payne VL, et al. Cognitive interventions to reduce diagnostic error: a narrative review. BMJ Qual Saf. 2012;21(7):535-557. http://dx.doi.org/10.1136/bmjqs-2011-000149. PubMed
29. McDonald KM, Matesic B, Contopoulos-Ioannidis DG, et al. Patient safety strategies targeted at diagnostic errors: a systematic review. Ann Intern Med. 2013;158(5 Pt 2):381-389. http://dx.doi.org/10.7326/0003-4819-158-5-201303051-00004. PubMed
30. Wray CM, Chaudhry S, Pincavage A, et al. Resident shift handoff strategies in US internal medicine residency programs. JAMA. 2016;316(21):2273-2275. http://dx.doi.org/10.1001/jama.2016.17786. PubMed
31. Choo KJ, Arora VM, Barach P, Johnson JK, Farnan JM. How do supervising physicians decide to entrust residents with unsupervised tasks? A qualitative analysis. J Hosp Med. 2014;9(3):169-175. http://dx.doi.org/10.1002/jhm.2150. PubMed
32. Carayon P, Wood KE. Patient safety - the role of human factors and systems engineering. Stud Health Technol Inform. 2010;153:23-46.
.http://dx.doi.org/10.1001/jama.2015.13453 PubMed
34. McGlynn EA, McDonald KM, Cassel CK. Measurement is essential for improving diagnosis and reducing diagnostic error: A report from the Institute of Medicine. JAMA. 2015;314(23):2501-2502.
.http://dx.doi.org/10.1136/bmjqs-2013-001812 PubMed
33. Carayon P, Xie A, Kianfar S. Human factors and ergonomics as a patient safety practice. BMJ Qual Saf. 2014;23(3):196-205. PubMed
© 2018 Society of Hospital Medicine
Stroke Increases the Risk of All-Cause Dementia
Protecting the blood supply to the brain could reduce the risk of incident dementia.
Stroke is a strong independent risk factor for all-cause dementia, according to research published online ahead of print August 25 in Alzheimer’s & Dementia. Clinicians should incorporate stroke-prevention strategies into their health interventions to reduce patients’ risk of dementia, said the authors.
“Around a third of dementia cases are thought to be potentially preventable, though this estimate does not take into account the risk associated with stroke,” said David Llewellyn, PhD, Senior Research Fellow at University of Exeter Medical School in the United Kingdom. “Our findings indicate that this figure could be even higher and reinforce the importance of protecting the blood supply to the brain when attempting to reduce the global burden of dementia.”

Meta-Analysis of Previous Research
Stroke is a recognized risk factor for all-cause dementia, but no researchers had previously performed a meta-analysis to quantify the risk. Dr. Llewellyn and colleagues searched Medline, PsycINFO, and Embase databases for prospective studies that investigated the association between prevalent or incident stroke and incident all-cause dementia. They excluded studies that lacked a comparison group or that had a comparison group other than a stroke-free group. The investigators pooled adjusted estimates across studies using random effects meta-analysis and evaluated potential effect modifiers with meta-regression.
Dr. Llewellyn and colleagues identified 11,129 articles, 26 of which were eligible for analysis. They also included 16 studies from a previous systematic review and four studies identified through backward and forward citation searches. In all, 36 studies examined prevalent stroke (1.9 million participants), and 12 studies examined incident stroke (1.3 million participants). The studies were conducted in America, Europe, Asia, and Australia and included more than three million participants. Follow-up periods ranged from nine months to 25 years.
Stroke Affected Dementia Risk
When the researchers pooled results from 22 cohorts of participants who were cognitively normal at baseline, they found that those with prevalent stroke had a higher adjusted risk of incident dementia, compared with those without stroke (hazard ratio [HR], 1.69). Sensitivity analyses did not change the results significantly. Prevalent stroke was associated with a higher risk of incident dementia among men than among women. Sex explained 50.2% of heterogeneity between studies for prevalent stroke.
After combining the adjusted results from eight studies, Dr. Llewellyn and colleagues found that incident stroke more than doubled the risk of incident all-cause dementia, compared with no incident stroke (risk ratio [RR], 2.18). For a sensitivity analysis, the investigators excluded three studies that combined stroke with transient ischemic attack; this adjustment strengthened the association.
The study’s strengths include the investigators’ search of several major databases and their contacts with authors who provided relevant data. The analysis reflects the limitations of the original studies, however. These limitations include selective samples and differences in stroke assessment and dementia diagnosis criteria. In addition, dementia may develop years before it is diagnosed. “More detailed reporting of the interval between stroke occurrence and dementia diagnosis in future studies will help to better characterize the role of time since stroke in the risk of dementia,” said Dr. Llewellyn.
—Erik Greb
Kuz´ma E, Lourida I, Moore SF, et al. Stroke and dementia risk: a systematic review and meta-analysis. Alzheimers Dement. 2018 Aug 25 [Epub ahead of print].
Protecting the blood supply to the brain could reduce the risk of incident dementia.
Protecting the blood supply to the brain could reduce the risk of incident dementia.
Stroke is a strong independent risk factor for all-cause dementia, according to research published online ahead of print August 25 in Alzheimer’s & Dementia. Clinicians should incorporate stroke-prevention strategies into their health interventions to reduce patients’ risk of dementia, said the authors.
“Around a third of dementia cases are thought to be potentially preventable, though this estimate does not take into account the risk associated with stroke,” said David Llewellyn, PhD, Senior Research Fellow at University of Exeter Medical School in the United Kingdom. “Our findings indicate that this figure could be even higher and reinforce the importance of protecting the blood supply to the brain when attempting to reduce the global burden of dementia.”
Meta-Analysis of Previous Research
Stroke is a recognized risk factor for all-cause dementia, but no researchers had previously performed a meta-analysis to quantify the risk. Dr. Llewellyn and colleagues searched Medline, PsycINFO, and Embase databases for prospective studies that investigated the association between prevalent or incident stroke and incident all-cause dementia. They excluded studies that lacked a comparison group or that had a comparison group other than a stroke-free group. The investigators pooled adjusted estimates across studies using random effects meta-analysis and evaluated potential effect modifiers with meta-regression.
Dr. Llewellyn and colleagues identified 11,129 articles, 26 of which were eligible for analysis. They also included 16 studies from a previous systematic review and four studies identified through backward and forward citation searches. In all, 36 studies examined prevalent stroke (1.9 million participants), and 12 studies examined incident stroke (1.3 million participants). The studies were conducted in America, Europe, Asia, and Australia and included more than three million participants. Follow-up periods ranged from nine months to 25 years.
Stroke Affected Dementia Risk
When the researchers pooled results from 22 cohorts of participants who were cognitively normal at baseline, they found that those with prevalent stroke had a higher adjusted risk of incident dementia, compared with those without stroke (hazard ratio [HR], 1.69). Sensitivity analyses did not change the results significantly. Prevalent stroke was associated with a higher risk of incident dementia among men than among women. Sex explained 50.2% of heterogeneity between studies for prevalent stroke.
After combining the adjusted results from eight studies, Dr. Llewellyn and colleagues found that incident stroke more than doubled the risk of incident all-cause dementia, compared with no incident stroke (risk ratio [RR], 2.18). For a sensitivity analysis, the investigators excluded three studies that combined stroke with transient ischemic attack; this adjustment strengthened the association.
The study’s strengths include the investigators’ search of several major databases and their contacts with authors who provided relevant data. The analysis reflects the limitations of the original studies, however. These limitations include selective samples and differences in stroke assessment and dementia diagnosis criteria. In addition, dementia may develop years before it is diagnosed. “More detailed reporting of the interval between stroke occurrence and dementia diagnosis in future studies will help to better characterize the role of time since stroke in the risk of dementia,” said Dr. Llewellyn.
—Erik Greb
Kuz´ma E, Lourida I, Moore SF, et al. Stroke and dementia risk: a systematic review and meta-analysis. Alzheimers Dement. 2018 Aug 25 [Epub ahead of print].
Timing of Adverse Events Following Geriatric Hip Fracture Surgery: A Study of 19,873 Patients in the American College of Surgeons National Surgical Quality Improvement Program
ABSTRACT
This study uses a prospective surgical registry to characterize the timing of 10 postoperative adverse events following geriatric hip fracture surgery. There were 19,873 patients identified who were ≥70 years undergoing surgery for hip fracture as part of the American College of Surgeons National Surgical Quality Improvement Program (ACS-NSQIP). The median postoperative day of diagnosis (and interquartile range) for myocardial infarction was 3 (1-5), cardiac arrest requiring cardiopulmonary resuscitation 3 (0-8), stroke 3 (1-10), pneumonia 4 (2-10), pulmonary embolism 4 (2-11), urinary tract infection 7 (2-13), deep vein thrombosis 9 (4-16), sepsis 9 (4-18), mortality 11 (6-19), and surgical site infection 16 (11-22). For the earliest diagnosed adverse events, the rate of adverse events had diminished by postoperative day 30. For the later diagnosed adverse events, the rate of adverse events remained high at postoperative day 30. Findings help to enable more targeted clinical surveillance, inform patient counseling, and determine the duration of follow-up required to study specific adverse events effectively. Orthopedic surgeons should have the lowest threshold for testing for each adverse event during the time period of greatest risk.
Continue to: Geriatric hip fracture surgery is associated with...
Geriatric hip fracture surgery is associated with a higher rate of occurrence of postoperative adverse events than any other commonly performed orthopedic procedure.1-4 Indeed, the 90-day mortality rate following a geriatric hip fracture surgery may be as high as 15%2 and the 30-day morbidity rate as high as 30%.3 Furthermore, more than half of postoperative mortalities following orthopedic procedures occur after surgery for hip fracture.4 Therefore, extensive research has been conducted regarding interventions to reduce the rates of adverse events following a hip fracture surgery.5-12 For example, randomized trials have been conducted involving venous thromboembolism prophylaxis,5,6nutritional supplementation,7 delirium prevention,8-10 anemia correction,11 geriatrics consultation,9 and anesthetic technique.12
Despite these extensive research efforts, there is currently little information in the literature regarding when postoperative adverse events occur. A clear depiction of the timing of adverse events could help target clinical surveillance, inform patient counseling, and determine the duration of follow-up required for studies. The reason that the timing of adverse events has not been previously characterized may be that the sample sizes available through standard single- or multi-institutional studies may be insufficient to accurately characterize the timing of rare adverse events (eg, myocardial infarction, stroke, etc.). Moreover, although administrative datasets have become common data sources for investigation of rare postoperative adverse events,13-16 such data sources often do not contain data on the timing of diagnosis.
The American College of Surgeons National Surgical Quality Improvement Program (ACS-NSQIP) is a relatively new and growing surgical registry.1,3,13-22 The registry follows up patients undergoing surgical procedures at several hundred community and academic institutions nationwide. Unlike the administrative datasets discussed above, the ACS-NSQIP characterizes the postoperative day of diagnosis of well-defined adverse events during the first 30 postoperative days.22
In this study, data collected by the ACS-NSQIP are used to characterize the timing of 10 specific postoperative adverse events following a geriatric hip fracture surgery.
Continue to: METHODS...
METHODS
A retrospective analysis of data collected prospectively through the ACS-NSQIP was conducted. Geriatric patients who underwent hip fracture surgery during 2010 to 2013 were identified. Specific inclusion criteria were (1) International Classification of Diseases, Ninth Revision, diagnosis code 820, (2) primary Current Procedural Terminology codes 27125, 27130, 27235, 27236, 27244, or 27245, and (3) age ≥70 years.
The ACS-NSQIP captures patient demographic, comorbidity, and procedural characteristics at baseline.22 At the end of the 30-day follow-up period, the ACS-NSQIP personnel review both inpatient and outpatient charts to characterize the occurrence vs nonoccurrence of specific postoperative adverse events.22-25 When an adverse event does occur, the postoperative day of diagnosis is recorded.
For this study, the following adverse event categories were investigated: myocardial infarction, cardiac arrest requiring cardiopulmonary resuscitation, stroke, pneumonia, pulmonary embolism, urinary tract infection, deep vein thrombosis, sepsis (either with or without shock), mortality, and surgical site infection (including superficial surgical site infection, deep surgical site infection, and organ or space surgical site infection). Detailed definitions of each adverse event are provided in ACS-NSQIP materials.22
First, the 30-day incidence (and the associated 95% confidence interval) was determined for each adverse event. Second, the median postoperative day of diagnosis (and the associated interquartile range) was determined for each adverse event. Third, the postoperative length of stay was used to estimate the proportion of diagnoses occurring prior to vs following discharge for each adverse event. Finally, multivariate Cox proportional hazards models were used to identify independent risk factors for earlier occurrence of postoperative adverse events. The final models were selected using a backward stepwise process that sequentially eliminated variables with the weakest associations until all variables had P < .05.
Because the ACS-NSQIP reports timing data in calendar days, when the postoperative length of stay was equivalent to the postoperative day of diagnosis, it was not possible to ascertain whether the diagnosis occurred prior to or following discharge. For this study, when the postoperative length of stay was equivalent to the postoperative day of diagnosis, the adverse event was considered to have been diagnosed following discharge. The rationale for this is that for most of the adverse events, it was thought to be unlikely that an inpatient would be discharged before the end of the same day as an inpatient diagnosis. However, there was one exception to this rule; when the postoperative day of discharge, the postoperative length of stay, and the postoperative day of death were all equivalent, the adverse event was considered to have occurred prior to discharge. This is because when a patient dies during the initial inpatient stay, the ACS-NSQIP considers the postoperative length of stay to be equivalent to the postoperative day of death. This makes it much more likely that a diagnosis on the final hospital day had occurred in a patient who had not been discharged.
The mandatory ACS-NSQIP statement is “The American College of Surgeons National Surgical Quality Improvement Program and the hospitals participating in the ACS-NSQIP are the source of the data used herein; they have not verified and are not responsible for the statistical validity of the data analysis or the conclusions derived by the authors.”26
Continue to: RESULTS...
RESULTS
In total, 19,873 geriatric patients undergoing a hip fracture surgery were identified (Table 1). The rates of adverse events ranged from 6.7% for urinary tract infection to 0.6% for pulmonary embolism (Table 2).
Table 1. Patient Population
| Number | Percent |
Total | 19,873 | 100.0% |
Age |
|
|
70-74 years | 1852 | 9.3% |
75-79 years | 2764 | 13.9% |
80-84 years | 4328 | 21.8% |
85-89 years | 5525 | 27.8% |
≥90 years | 5404 | 27.2% |
Sex |
|
|
Male | 5359 | 27.0% |
Female | 14,514 | 73.0% |
Body mass index |
|
|
<30 kg/m2 | 17,733 | 89.2% |
≥30 kg/m2 | 2140 | 10.8% |
Functional status |
|
|
Independent | 14,348 | 72.2% |
Dependent | 5525 | 27.8% |
Diabetes | 3321 | 16.7% |
Congestive heart failure | 738 | 3.7% |
Dyspnea on exertion | 1542 | 7.8% |
Hypertension | 14,265 | 71.8% |
End-stage renal disease | 322 | 1.6% |
COPD | 2239 | 11.3% |
Current smoker | 1506 | 7.6% |
Abbreviation: COPD, chronic obstructive pulmonary disease.
Table 2. Patients with Adverse Events Diagnosed During the First 30 postoperative days (N = 19,873)
Adverse Event | Number | Percent | 95% CI |
Urinary tract infection | 1321 | 6.7% | 6.3%-7.0% |
Mortality | 1240 | 6.2% | 5.9%-6.6% |
Pneumonia | 771 | 3.9% | 3.6%-4.2% |
Sepsis | 428 | 2.2% | 2.0%-2.4% |
Myocardial infarction | 347 | 1.8% | 1.6%-1.9% |
Surgical site infection | 247 | 1.2% | 1.1%-1.4% |
Deep vein thrombosis | 199 | 1.0% | 0.9%-1.1% |
Stroke | 144 | 0.7% | 0.6%-0.8% |
Cardiac arrest | 136 | 0.7% | 0.6%-0.8% |
Pulmonary embolism | 126 | 0.6% | 0.5%-0.7% |
Abbreviation: CI, confidence interval.
Figure 1 depicts the timing of postoperative adverse events in detail in histograms and timing curves. For the earliest diagnosed adverse events, the rate of adverse events had diminished by postoperative day 30. For the later diagnosed adverse events, the rate of adverse events remained high at postoperative day 30.
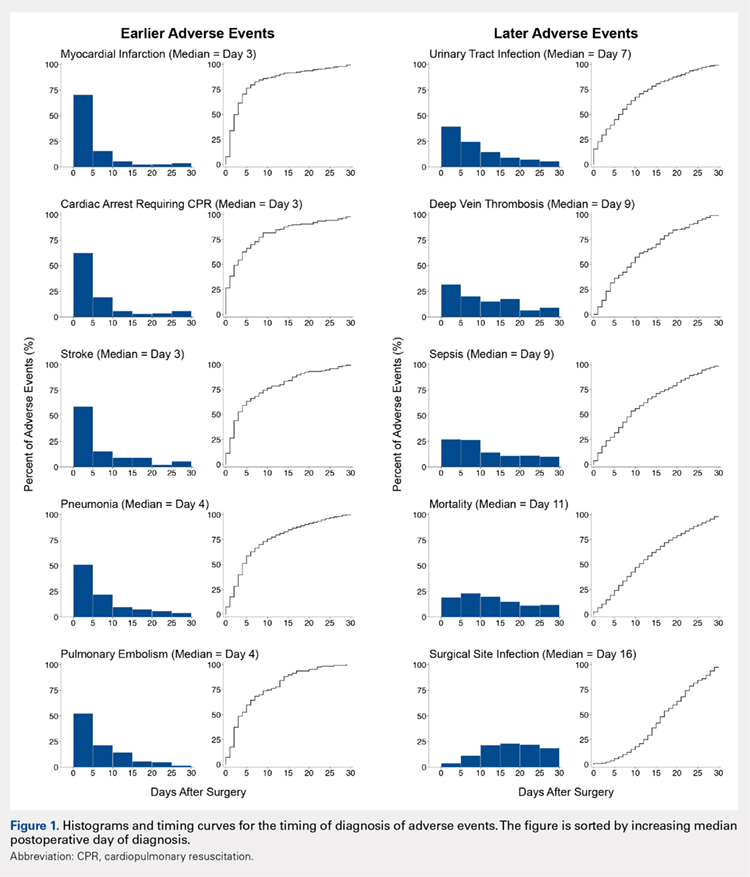
Figure 2 provides the summary statistics for adverse events diagnosed in the first 30 postoperative days. The median postoperative day of diagnosis (and the interquartile range) was 3 (1-5) for myocardial infarction, 3 (0-8) for cardiac arrest requiring cardiopulmonary resuscitation, 3 (1-10) for stroke, 4 (2-10) for pneumonia, 4 (2-11) for pulmonary embolism, 7 (2-13) for urinary tract infection, 9 (4-16) for deep vein thrombosis, 9 (4-18) for sepsis, 11 (6-19) for mortality, and 16 (11-22) for surgical site infection.
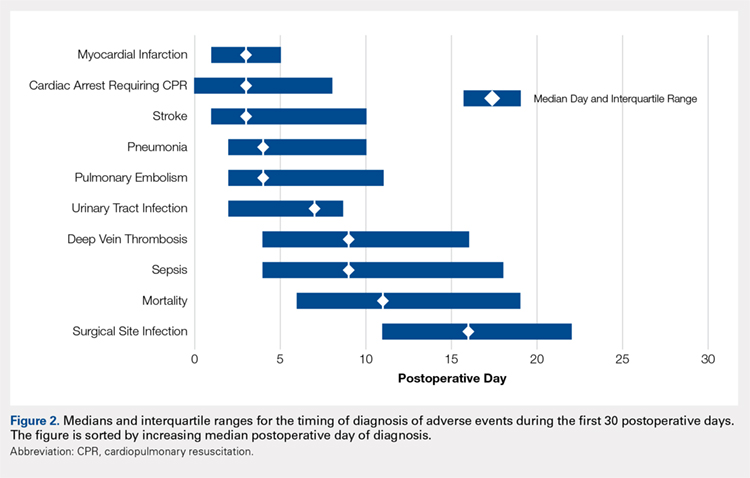
Figure 3 depicts the timing of adverse events relative to discharge. The proportions of adverse events diagnosed prior to discharge were 81.0% for myocardial infarction, 77.8% for stroke, 76.1% for cardiac arrest requiring cardiopulmonary resuscitation, 71.9% for pulmonary embolism, 71.1% for pneumonia, 58.0% for urinary tract infection, 52.1% for sepsis, 46.9% for deep vein thrombosis, 44.3% for mortality, and 27.6% for surgical site infection.
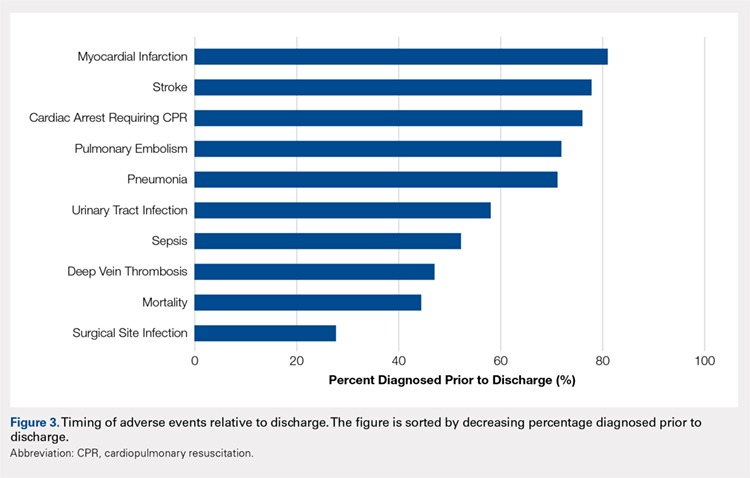
Table 3 shows the independent risk factors for earlier occurrence of adverse events. Following multivariate stepwise selection of final models, at least 1 patient characteristic was independently associated with the timing of cardiac arrest, stroke, urinary tract infection, deep vein thrombosis, and death. In contrast, no patient characteristics were independently associated with the timing of myocardial infarction, pneumonia, pulmonary embolism, sepsis, and surgical site infection.
Table 3. Timing of Diagnosis of Adverse Eventsa
Adverse events and associated baseline characteristic(s) | Median postoperative day of diagnosis with vs without baseline characteristic | P-valueb |
Cardiac arrest |
|
|
End-stage renal disease | 1 vs 3 | .005 |
Stroke |
|
|
Hypertension | 4 vs 2 | .025 |
Dependent functional status | 2 vs 4 | .027 |
Urinary tract infection |
|
|
Female sex | 6 vs 8 | .009 |
Deep vein thrombosis |
|
|
Body mass index ≥30 kg/m2 | 5 vs 10 | .015 |
Death |
|
|
End-stage renal disease | 10 vs 11 | .031 |
aBaseline characteristics that were independently associated with the timing of each adverse event were identified through a backwards stepwise selection process initially including all characteristics listed in Table 1, and sequentially excluding characteristics with the weakest associations until only characteristics with P < .05 remained. Independent associations with the timing of cardiac arrest, stroke, urinary tract infection, deep vein thrombosis, and death are shown. There were no characteristics independently associated with timing of myocardial infarction, pneumonia, pulmonary embolism, sepsis, or surgical site infection; hence, these adverse events are not listed in the table.
bFrom final Cox proportional hazards models identified through multivariate stepwise selection.
Continue to: DISCUSSION...
DISCUSSION
Adverse events are extremely common following a geriatric hip fracture surgery.1-4 Despite extensive investigation regarding methods to prevent these events,5-12 there is limited published description of the timing at which such events occur. This study used a large prospectively followed up cohort of geriatric patients undergoing a hip fracture surgery to deliver a better description of the timing of adverse events than was previously available. The findings of this study should enable more targeted clinical surveillance, inform patient counseling, and help determine the duration of follow-up required for studies on adverse events.
There was wide variability in the timing at which the different postoperative adverse events were diagnosed (Figures 1, 2). Myocardial infarction was diagnosed the earliest, with more than three-fourth of diagnoses in the first postoperative week. Other relatively early-diagnosed adverse events included cardiac arrest requiring cardiopulmonary resuscitation, stroke, pneumonia, and pulmonary embolism.
The latest-diagnosed adverse event was surgical site infection (Figures 1, 2). Surgical site infection was actually the only adverse event with a rate of diagnosis during the first week that was lower than the rate of diagnosis later in the month (as can be seen by the inflection in the timing curve for surgical site infection in Figure 1). Mortality showed a relatively consistent rate of diagnosis throughout the entire first postoperative month. Other relatively late-diagnosed postoperative events, including sepsis, deep vein thrombosis, and urinary tract infection, showed varying degrees of decreased rate of diagnosis near the end of the first postoperative month. Of note, for the later-diagnosed adverse events, the estimated median and interquartile ranges (Figure 2) were presumably quite biased toward earlier diagnosis, as the 30-day follow-up period clearly failed to capture a large proportion of later-occurring adverse events (Figure 1).
Certain risk factors were independently associated with earlier occurrence of adverse events. Perhaps most strikingly, body mass index in the obese range was associated with substantially earlier occurrence of deep vein thrombosis (median of 5 vs 10 days). This finding suggests that clinical monitoring for deep vein thrombosis should be performed earlier in patients with greater body mass index. Also notable is the earlier occurrence of cardiac arrest and death among patients with end-stage renal disease than among those without. Patients with end-stage renal disease may have a greater risk for these adverse events immediately following the cardiac stresses of surgery.27 Similarly, such patients may be more prone to early electrolyte abnormalities and arrhythmia.
Continue to: In addition to its clinical implications, this study...
In addition to its clinical implications, this study informs about the interpretation of the many studies of adverse events following hip fracture procedures that have been conducted using retrospective data. Several such studies have relied on inpatient-only administrative databases.4,13,14,28-35 As clearly demonstrated in Figure 3, for most of the commonly studied adverse events, inpatient-only databases failed to capture a large proportion of adverse events occurring in the first postoperative month. This highlights a substantial limitation of this commonly published type of study that is often not emphasized in the literature.
There has also been an increase in the publication of studies of adverse events following a hip fracture surgery using the ACS-NSQIP data.3,13,14,17,18,21 As discussed, the ACS-NSQIP provides data on 30-days of follow-up. This relatively extended follow-up is often touted as a distinct advantage. However, this study demonstrates that even the 30-day follow-up afforded by the ACS-NSQIP is limited in its ability to enable investigation of the later-occurring adverse events (Figure 1). In particular, the rate of surgical site infection shows little sign of slowing by postoperative day 30. Similarly, the rates of mortality, sepsis, deep vein thrombosis, and urinary tract infection remain substantial.
This study does have limitations. First, as discussed, the duration of follow-up is a limitation of any ACS-NSQIP-based investigation, including this study. Second, the ACS-NSQIP does not capture relevant orthopedic-specific outcomes (eg, screw cutout). In addition, it could not be determined with certainty whether adverse events occurring on the final hospital day occurred prior to or following discharge. However, only a small proportion of most of the adverse events was diagnosed on the final hospital day. Finally, the ACS-NSQIP reports on days from the operation until diagnosis of the adverse event. Although some adverse events are probably diagnosed quickly after they have occurred (eg, myocardial infarction and cardiac arrest), other adverse events may have a delayed diagnosis (eg, surgical site infection may be identified days after its initial occurrence during a follow-up examination). Therefore, it is important to note the subtle distinction between occurrence and diagnosis throughout the article. This article reports on the timing of diagnosis, not actual occurrence.
CONCLUSION
The timing of postoperative adverse events has been understudied in the past. This may be due to an inability of standard single- or multi-institutional investigations to achieve sample sizes adequate to study the less commonly occurring adverse events. Using a relatively new prospective surgical registry, this study provides a far more detailed description of the timing of adverse events following surgery than was previously available. The authors anticipate that these data can be used to inform patient counseling, target clinical surveillance, and direct clinical research. The authors chose to study the timing of postoperative adverse events following geriatric hip fracture surgery because of the high rate of adverse events associated with the procedure. However, future ACS-NSQIP studies may involve characterization of the timing of adverse events following other orthopedic and non-orthopedic procedures.
This paper will be judged for the Resident Writer’s Award.
1. Schilling PL, Hallstrom BR, Birkmeyer JD, Carpenter JE. Prioritizing perioperative quality improvement in orthopaedic surgery. J Bone Joint Surg Am. 2010;92(9):1884-1889. doi:10.2106/jbjs.i.00735.
2. Forte ML, Virnig BA, Swiontkowski MF, et al. Ninety-day mortality after intertrochanteric hip fracture: does provider volume matter? J Bone Joint Surg Am. 2010;92(4):799-806. doi:10.2106/jbjs.h.01204.
3. Pugely AJ, Martin CT, Gao Y, Klocke NF, Callaghan JJ, Marsh JL. A risk calculator for short-term morbidity and mortality after hip fracture surgery. J Orthop Trauma.2014;28(2):63-69. doi:10.1097/BOT.0b013e3182a22744.
4. Bhattacharyya T, Iorio R, Healy WL. Rate of and risk factors for acute inpatient mortality after orthopaedic surgery. J Bone Joint Surg Am. 2002;84-a(4):562-572.
5. Eriksson BI, Lassen MR. Duration of prophylaxis against venous thromboembolism with fondaparinux after hip fracture surgery: a multicenter, randomized, placebo-controlled, double-blind study. Arch Intern Med. 2003;163(11):1337-1342. doi:10.1001/archinte.163.11.1337.
6. Handoll HH, Farrar MJ, McBirnie J, Tytherleigh-Strong G, Milne AA, Gillespie WJ. Heparin, low molecular weight heparin and physical methods for preventing deep vein thrombosis and pulmonary embolism following surgery for hip fractures. Cochrane Database Syst Rev.2002;(4):Cd000305. doi:10.1002/14651858.cd000305.
7. Avenell A, Handoll HH. Nutritional supplementation for hip fracture aftercare in the elderly. Cochrane Database Syst Rev. 2004;(1):Cd001880. doi:10.1002/14651858.CD001880.pub2.
8. Marcantonio ER, Flacker JM, Wright RJ, Resnick NM. Reducing delirium after hip fracture: a randomized trial. J Am Geriatr Soc. 2001;49(5):516-522. doi:10.1046/j.1532-5415.2001.49108.x.
9. Deschodt M, Braes T, Flamaing J, et al. Preventing delirium in older adults with recent hip fracture through multidisciplinary geriatric consultation. J Am Geriatr Soc. 2012;60(4):733-739. doi:10.1111/j.1532-5415.2012.03899.x.
10. Marcantonio ER, Palihnich K, Appleton P, Davis RB. Pilot randomized trial of donepezil hydrochloride for delirium after hip fracture. J Am Geriatr Soc. 2011;59 Suppl 2:S282-S288. doi:10.1111/j.1532-5415.2011.03691.x.
11. Parker MJ. Iron supplementation for anemia after hip fracture surgery: a randomized trial of 300 patients. J Bone Joint Surg Am. 2010;92(2):265-269. doi:10.2106/jbjs.i.00883.
12. Urwin SC, Parker MJ, Griffiths R. General versus regional anaesthesia for hip fracture surgery: a meta-analysis of randomized trials. Br J Anaesth. 2000;84(4):450-455. doi:10.1093/oxfordjournals.bja.a013468.
13. Bohl DD, Basques BA, Golinvaux NS, Baumgaertner MR, Grauer JN. Nationwide Inpatient Sample and National Surgical Quality Improvement Program give different results in hip fracture studies. Clin Orthop Relat Res. 2014;472(6):1672-1680. doi:10.1007/s11999-014-3559-0.
14. Bohl DD, Grauer JN, Leopold SS. Editor's spotlight/Take 5: nationwide inpatient sample and national surgical quality improvement program give different results in hip fracture studies. Clin Orthop Relat Res. 2014;472(6):1667-1671. doi:10.1007/s11999-014-3595-9.
15. Bohl DD, Russo GS, Basques BA, et al. Variations in data collection methods between national databases affect study results: a comparison of the nationwide inpatient sample and national surgical quality improvement program databases for lumbar spine fusion procedures. J Bone Joint Surg Am. 2014;96(23):e193. doi:10.2106/jbjs.m.01490.
16. Levin PE. Apples, oranges, and national databases: commentary on an article by Daniel D. Bohl, MPH, et al.: "Variations in data collection methods between national databases affect study results: a comparison of the nationwide inpatient sample and national surgical quality improvement program databases for lumbar spine fusion procedures.” J Bone Joint Surg Am. 2014;96(23):e198. doi:10.2106/jbjs.n.00890.
17. Basques BA, Bohl DD, Golinvaux NS, Leslie MP, Baumgaertner MR, Grauer JN. Postoperative length of stay and thirty-day readmission following geriatric hip fracture: an analysis of 8,434 patients. J Orthop Trauma. 2015;29(3):e115-e120. doi:10.1097/bot.0000000000000222.
18. Golinvaux NS, Bohl DD, Basques BA, Baumgaertner MR, Grauer JN. Diabetes confers little to no increased risk of postoperative complications after hip fracture surgery in geriatric patients. Clin Orthop Relat Res. 2015;473(3):1043-1051. doi:10.1007/s11999-014-3945-7.
19. Maciejewski ML, Radcliff TA, Henderson WG, et al. Determinants of postsurgical discharge setting for male hip fracture patients. J Rehabil Res Dev. 2013;50(9):1267-1276. doi:10.1682/jrrd.2013.02.0041.
20. Molina CS, Thakore RV, Blumer A, Obremskey WT, Sethi MK. Use of the National Surgical Quality Improvement Program in orthopaedic surgery. Clin Orthop Relat Res.2015;473(5):1574-1581. doi:10.1007/s11999-014-3597-7.
21. Bohl DD, Basques BA, Golinvaux NS, Miller CP, Baumgaertner MR, Grauer JN. Extramedullary compared with intramedullary implants for intertrochanteric hip fractures: thirty-day outcomes of 4432 procedures from the ACS NSQIP database. J Bone Joint Surg Am. 2014;96(22):1871-1877. doi:10.2106/jbjs.n.00041.
22. Alosh H, Riley LH 3rd, Skolasky RL. Insurance status, geography, race, and ethnicity as predictors of anterior cervical spine surgery rates and in-hospital mortality: an examination of United States trends from 1992 to 2005. Spine (Phila Pa 1976). 2009;34(18):1956-1962. doi:10.1097/BRS.0b013e3181ab930e.
23. Cahill KS, Chi JH, Day A, Claus EB. Prevalence, complications, and hospital charges associated with use of bone-morphogenetic proteins in spinal fusion procedures. JAMA.2009;302(1):58-66. doi:10.1001/jama.2009.956.
24. Ingraham AM, Richards KE, Hall BL, Ko CY. Quality improvement in surgery: the American College of Surgeons National Surgical Quality Improvement Program approach. Adv Surg. 2010;44(1):251-267. doi:10.1016/j.yasu.2010.05.003.
25. Shiloach M, Frencher SK Jr, Steeger JE, et al. Toward robust information: data quality and inter-rater reliability in the American College of Surgeons National Surgical Quality Improvement Program. J Am Coll Surg. 2010;210(1):6-16. doi:10.1016/j.jamcollsurg.2009.09.031.
26. ACS-NSQIP. Data Use Agreement. American College of Surgeons Web site. https://www.facs.org/quality-programs/acs-nsqip/participant-use/puf-form. Accessed September 20, 2018.
27. Blacher J, Guerin AP, Pannier B, Marchais SJ, London GM. Arterial calcifications, arterial stiffness, and cardiovascular risk in end-stage renal disease. Hypertension. 2001;38(4):938-942. doi:10.1161/hy1001.096358.
28. Browne JA, Cook C, Olson SA, Bolognesi MP. Resident duty-hour reform associated with increased morbidity following hip fracture. J Bone Joint Surg Am. 2009;91(9):2079-2085. doi:10.2106/jbjs.h.01240.
29. Browne JA, Pietrobon R, Olson SA. Hip fracture outcomes: does surgeon or hospital volume really matter? J Trauma. 2009;66(3):809-814. doi:10.1097/TA.0b013e31816166bb.
30. Menendez ME, Ring D. Failure to rescue after proximal femur fracture surgery. J Orthop Trauma. 2015;29(3):e96-e102. doi:10.1097/bot.0000000000000234.
31. Nikkel LE, Fox EJ, Black KP, Davis C, Andersen L, Hollenbeak CS. Impact of comorbidities on hospitalization costs following hip fracture. J Bone Joint Surg Am. 2012;94(1):9-17. doi:10.2106/jbjs.j.01077.
32. Anderson KL, Koval KJ, Spratt KF. Hip fracture outcome: is there a “July effect”? Am J Orthop. 2009;38(12):606-611.
33. Koval KJ, Rust CL, Spratt KF. The effect of hospital setting and teaching status on outcomes after hip fracture. Am J Orthop. 2011;40(1):19-28.
34. Bacon WE. Secular trends in hip fracture occurrence and survival: age and sex differences. J Aging Health. 1996;8(4):538-553. doi:10.1177/089826439600800404.
35. Orces CH. In-hospital hip fracture mortality trends in older adults: the National Hospital Discharge Survey, 1988-2007. J Am Geriatr Soc. 2013;61(12):2248-2249. doi:10.1111/jgs.12567.
ABSTRACT
This study uses a prospective surgical registry to characterize the timing of 10 postoperative adverse events following geriatric hip fracture surgery. There were 19,873 patients identified who were ≥70 years undergoing surgery for hip fracture as part of the American College of Surgeons National Surgical Quality Improvement Program (ACS-NSQIP). The median postoperative day of diagnosis (and interquartile range) for myocardial infarction was 3 (1-5), cardiac arrest requiring cardiopulmonary resuscitation 3 (0-8), stroke 3 (1-10), pneumonia 4 (2-10), pulmonary embolism 4 (2-11), urinary tract infection 7 (2-13), deep vein thrombosis 9 (4-16), sepsis 9 (4-18), mortality 11 (6-19), and surgical site infection 16 (11-22). For the earliest diagnosed adverse events, the rate of adverse events had diminished by postoperative day 30. For the later diagnosed adverse events, the rate of adverse events remained high at postoperative day 30. Findings help to enable more targeted clinical surveillance, inform patient counseling, and determine the duration of follow-up required to study specific adverse events effectively. Orthopedic surgeons should have the lowest threshold for testing for each adverse event during the time period of greatest risk.
Continue to: Geriatric hip fracture surgery is associated with...
Geriatric hip fracture surgery is associated with a higher rate of occurrence of postoperative adverse events than any other commonly performed orthopedic procedure.1-4 Indeed, the 90-day mortality rate following a geriatric hip fracture surgery may be as high as 15%2 and the 30-day morbidity rate as high as 30%.3 Furthermore, more than half of postoperative mortalities following orthopedic procedures occur after surgery for hip fracture.4 Therefore, extensive research has been conducted regarding interventions to reduce the rates of adverse events following a hip fracture surgery.5-12 For example, randomized trials have been conducted involving venous thromboembolism prophylaxis,5,6nutritional supplementation,7 delirium prevention,8-10 anemia correction,11 geriatrics consultation,9 and anesthetic technique.12
Despite these extensive research efforts, there is currently little information in the literature regarding when postoperative adverse events occur. A clear depiction of the timing of adverse events could help target clinical surveillance, inform patient counseling, and determine the duration of follow-up required for studies. The reason that the timing of adverse events has not been previously characterized may be that the sample sizes available through standard single- or multi-institutional studies may be insufficient to accurately characterize the timing of rare adverse events (eg, myocardial infarction, stroke, etc.). Moreover, although administrative datasets have become common data sources for investigation of rare postoperative adverse events,13-16 such data sources often do not contain data on the timing of diagnosis.
The American College of Surgeons National Surgical Quality Improvement Program (ACS-NSQIP) is a relatively new and growing surgical registry.1,3,13-22 The registry follows up patients undergoing surgical procedures at several hundred community and academic institutions nationwide. Unlike the administrative datasets discussed above, the ACS-NSQIP characterizes the postoperative day of diagnosis of well-defined adverse events during the first 30 postoperative days.22
In this study, data collected by the ACS-NSQIP are used to characterize the timing of 10 specific postoperative adverse events following a geriatric hip fracture surgery.
Continue to: METHODS...
METHODS
A retrospective analysis of data collected prospectively through the ACS-NSQIP was conducted. Geriatric patients who underwent hip fracture surgery during 2010 to 2013 were identified. Specific inclusion criteria were (1) International Classification of Diseases, Ninth Revision, diagnosis code 820, (2) primary Current Procedural Terminology codes 27125, 27130, 27235, 27236, 27244, or 27245, and (3) age ≥70 years.
The ACS-NSQIP captures patient demographic, comorbidity, and procedural characteristics at baseline.22 At the end of the 30-day follow-up period, the ACS-NSQIP personnel review both inpatient and outpatient charts to characterize the occurrence vs nonoccurrence of specific postoperative adverse events.22-25 When an adverse event does occur, the postoperative day of diagnosis is recorded.
For this study, the following adverse event categories were investigated: myocardial infarction, cardiac arrest requiring cardiopulmonary resuscitation, stroke, pneumonia, pulmonary embolism, urinary tract infection, deep vein thrombosis, sepsis (either with or without shock), mortality, and surgical site infection (including superficial surgical site infection, deep surgical site infection, and organ or space surgical site infection). Detailed definitions of each adverse event are provided in ACS-NSQIP materials.22
First, the 30-day incidence (and the associated 95% confidence interval) was determined for each adverse event. Second, the median postoperative day of diagnosis (and the associated interquartile range) was determined for each adverse event. Third, the postoperative length of stay was used to estimate the proportion of diagnoses occurring prior to vs following discharge for each adverse event. Finally, multivariate Cox proportional hazards models were used to identify independent risk factors for earlier occurrence of postoperative adverse events. The final models were selected using a backward stepwise process that sequentially eliminated variables with the weakest associations until all variables had P < .05.
Because the ACS-NSQIP reports timing data in calendar days, when the postoperative length of stay was equivalent to the postoperative day of diagnosis, it was not possible to ascertain whether the diagnosis occurred prior to or following discharge. For this study, when the postoperative length of stay was equivalent to the postoperative day of diagnosis, the adverse event was considered to have been diagnosed following discharge. The rationale for this is that for most of the adverse events, it was thought to be unlikely that an inpatient would be discharged before the end of the same day as an inpatient diagnosis. However, there was one exception to this rule; when the postoperative day of discharge, the postoperative length of stay, and the postoperative day of death were all equivalent, the adverse event was considered to have occurred prior to discharge. This is because when a patient dies during the initial inpatient stay, the ACS-NSQIP considers the postoperative length of stay to be equivalent to the postoperative day of death. This makes it much more likely that a diagnosis on the final hospital day had occurred in a patient who had not been discharged.
The mandatory ACS-NSQIP statement is “The American College of Surgeons National Surgical Quality Improvement Program and the hospitals participating in the ACS-NSQIP are the source of the data used herein; they have not verified and are not responsible for the statistical validity of the data analysis or the conclusions derived by the authors.”26
Continue to: RESULTS...
RESULTS
In total, 19,873 geriatric patients undergoing a hip fracture surgery were identified (Table 1). The rates of adverse events ranged from 6.7% for urinary tract infection to 0.6% for pulmonary embolism (Table 2).
Table 1. Patient Population
| Number | Percent |
Total | 19,873 | 100.0% |
Age |
|
|
70-74 years | 1852 | 9.3% |
75-79 years | 2764 | 13.9% |
80-84 years | 4328 | 21.8% |
85-89 years | 5525 | 27.8% |
≥90 years | 5404 | 27.2% |
Sex |
|
|
Male | 5359 | 27.0% |
Female | 14,514 | 73.0% |
Body mass index |
|
|
<30 kg/m2 | 17,733 | 89.2% |
≥30 kg/m2 | 2140 | 10.8% |
Functional status |
|
|
Independent | 14,348 | 72.2% |
Dependent | 5525 | 27.8% |
Diabetes | 3321 | 16.7% |
Congestive heart failure | 738 | 3.7% |
Dyspnea on exertion | 1542 | 7.8% |
Hypertension | 14,265 | 71.8% |
End-stage renal disease | 322 | 1.6% |
COPD | 2239 | 11.3% |
Current smoker | 1506 | 7.6% |
Abbreviation: COPD, chronic obstructive pulmonary disease.
Table 2. Patients with Adverse Events Diagnosed During the First 30 postoperative days (N = 19,873)
Adverse Event | Number | Percent | 95% CI |
Urinary tract infection | 1321 | 6.7% | 6.3%-7.0% |
Mortality | 1240 | 6.2% | 5.9%-6.6% |
Pneumonia | 771 | 3.9% | 3.6%-4.2% |
Sepsis | 428 | 2.2% | 2.0%-2.4% |
Myocardial infarction | 347 | 1.8% | 1.6%-1.9% |
Surgical site infection | 247 | 1.2% | 1.1%-1.4% |
Deep vein thrombosis | 199 | 1.0% | 0.9%-1.1% |
Stroke | 144 | 0.7% | 0.6%-0.8% |
Cardiac arrest | 136 | 0.7% | 0.6%-0.8% |
Pulmonary embolism | 126 | 0.6% | 0.5%-0.7% |
Abbreviation: CI, confidence interval.
Figure 1 depicts the timing of postoperative adverse events in detail in histograms and timing curves. For the earliest diagnosed adverse events, the rate of adverse events had diminished by postoperative day 30. For the later diagnosed adverse events, the rate of adverse events remained high at postoperative day 30.
Figure 2 provides the summary statistics for adverse events diagnosed in the first 30 postoperative days. The median postoperative day of diagnosis (and the interquartile range) was 3 (1-5) for myocardial infarction, 3 (0-8) for cardiac arrest requiring cardiopulmonary resuscitation, 3 (1-10) for stroke, 4 (2-10) for pneumonia, 4 (2-11) for pulmonary embolism, 7 (2-13) for urinary tract infection, 9 (4-16) for deep vein thrombosis, 9 (4-18) for sepsis, 11 (6-19) for mortality, and 16 (11-22) for surgical site infection.
Figure 3 depicts the timing of adverse events relative to discharge. The proportions of adverse events diagnosed prior to discharge were 81.0% for myocardial infarction, 77.8% for stroke, 76.1% for cardiac arrest requiring cardiopulmonary resuscitation, 71.9% for pulmonary embolism, 71.1% for pneumonia, 58.0% for urinary tract infection, 52.1% for sepsis, 46.9% for deep vein thrombosis, 44.3% for mortality, and 27.6% for surgical site infection.
Table 3 shows the independent risk factors for earlier occurrence of adverse events. Following multivariate stepwise selection of final models, at least 1 patient characteristic was independently associated with the timing of cardiac arrest, stroke, urinary tract infection, deep vein thrombosis, and death. In contrast, no patient characteristics were independently associated with the timing of myocardial infarction, pneumonia, pulmonary embolism, sepsis, and surgical site infection.
Table 3. Timing of Diagnosis of Adverse Eventsa
Adverse events and associated baseline characteristic(s) | Median postoperative day of diagnosis with vs without baseline characteristic | P-valueb |
Cardiac arrest |
|
|
End-stage renal disease | 1 vs 3 | .005 |
Stroke |
|
|
Hypertension | 4 vs 2 | .025 |
Dependent functional status | 2 vs 4 | .027 |
Urinary tract infection |
|
|
Female sex | 6 vs 8 | .009 |
Deep vein thrombosis |
|
|
Body mass index ≥30 kg/m2 | 5 vs 10 | .015 |
Death |
|
|
End-stage renal disease | 10 vs 11 | .031 |
aBaseline characteristics that were independently associated with the timing of each adverse event were identified through a backwards stepwise selection process initially including all characteristics listed in Table 1, and sequentially excluding characteristics with the weakest associations until only characteristics with P < .05 remained. Independent associations with the timing of cardiac arrest, stroke, urinary tract infection, deep vein thrombosis, and death are shown. There were no characteristics independently associated with timing of myocardial infarction, pneumonia, pulmonary embolism, sepsis, or surgical site infection; hence, these adverse events are not listed in the table.
bFrom final Cox proportional hazards models identified through multivariate stepwise selection.
Continue to: DISCUSSION...
DISCUSSION
Adverse events are extremely common following a geriatric hip fracture surgery.1-4 Despite extensive investigation regarding methods to prevent these events,5-12 there is limited published description of the timing at which such events occur. This study used a large prospectively followed up cohort of geriatric patients undergoing a hip fracture surgery to deliver a better description of the timing of adverse events than was previously available. The findings of this study should enable more targeted clinical surveillance, inform patient counseling, and help determine the duration of follow-up required for studies on adverse events.
There was wide variability in the timing at which the different postoperative adverse events were diagnosed (Figures 1, 2). Myocardial infarction was diagnosed the earliest, with more than three-fourth of diagnoses in the first postoperative week. Other relatively early-diagnosed adverse events included cardiac arrest requiring cardiopulmonary resuscitation, stroke, pneumonia, and pulmonary embolism.
The latest-diagnosed adverse event was surgical site infection (Figures 1, 2). Surgical site infection was actually the only adverse event with a rate of diagnosis during the first week that was lower than the rate of diagnosis later in the month (as can be seen by the inflection in the timing curve for surgical site infection in Figure 1). Mortality showed a relatively consistent rate of diagnosis throughout the entire first postoperative month. Other relatively late-diagnosed postoperative events, including sepsis, deep vein thrombosis, and urinary tract infection, showed varying degrees of decreased rate of diagnosis near the end of the first postoperative month. Of note, for the later-diagnosed adverse events, the estimated median and interquartile ranges (Figure 2) were presumably quite biased toward earlier diagnosis, as the 30-day follow-up period clearly failed to capture a large proportion of later-occurring adverse events (Figure 1).
Certain risk factors were independently associated with earlier occurrence of adverse events. Perhaps most strikingly, body mass index in the obese range was associated with substantially earlier occurrence of deep vein thrombosis (median of 5 vs 10 days). This finding suggests that clinical monitoring for deep vein thrombosis should be performed earlier in patients with greater body mass index. Also notable is the earlier occurrence of cardiac arrest and death among patients with end-stage renal disease than among those without. Patients with end-stage renal disease may have a greater risk for these adverse events immediately following the cardiac stresses of surgery.27 Similarly, such patients may be more prone to early electrolyte abnormalities and arrhythmia.
Continue to: In addition to its clinical implications, this study...
In addition to its clinical implications, this study informs about the interpretation of the many studies of adverse events following hip fracture procedures that have been conducted using retrospective data. Several such studies have relied on inpatient-only administrative databases.4,13,14,28-35 As clearly demonstrated in Figure 3, for most of the commonly studied adverse events, inpatient-only databases failed to capture a large proportion of adverse events occurring in the first postoperative month. This highlights a substantial limitation of this commonly published type of study that is often not emphasized in the literature.
There has also been an increase in the publication of studies of adverse events following a hip fracture surgery using the ACS-NSQIP data.3,13,14,17,18,21 As discussed, the ACS-NSQIP provides data on 30-days of follow-up. This relatively extended follow-up is often touted as a distinct advantage. However, this study demonstrates that even the 30-day follow-up afforded by the ACS-NSQIP is limited in its ability to enable investigation of the later-occurring adverse events (Figure 1). In particular, the rate of surgical site infection shows little sign of slowing by postoperative day 30. Similarly, the rates of mortality, sepsis, deep vein thrombosis, and urinary tract infection remain substantial.
This study does have limitations. First, as discussed, the duration of follow-up is a limitation of any ACS-NSQIP-based investigation, including this study. Second, the ACS-NSQIP does not capture relevant orthopedic-specific outcomes (eg, screw cutout). In addition, it could not be determined with certainty whether adverse events occurring on the final hospital day occurred prior to or following discharge. However, only a small proportion of most of the adverse events was diagnosed on the final hospital day. Finally, the ACS-NSQIP reports on days from the operation until diagnosis of the adverse event. Although some adverse events are probably diagnosed quickly after they have occurred (eg, myocardial infarction and cardiac arrest), other adverse events may have a delayed diagnosis (eg, surgical site infection may be identified days after its initial occurrence during a follow-up examination). Therefore, it is important to note the subtle distinction between occurrence and diagnosis throughout the article. This article reports on the timing of diagnosis, not actual occurrence.
CONCLUSION
The timing of postoperative adverse events has been understudied in the past. This may be due to an inability of standard single- or multi-institutional investigations to achieve sample sizes adequate to study the less commonly occurring adverse events. Using a relatively new prospective surgical registry, this study provides a far more detailed description of the timing of adverse events following surgery than was previously available. The authors anticipate that these data can be used to inform patient counseling, target clinical surveillance, and direct clinical research. The authors chose to study the timing of postoperative adverse events following geriatric hip fracture surgery because of the high rate of adverse events associated with the procedure. However, future ACS-NSQIP studies may involve characterization of the timing of adverse events following other orthopedic and non-orthopedic procedures.
This paper will be judged for the Resident Writer’s Award.
1. Schilling PL, Hallstrom BR, Birkmeyer JD, Carpenter JE. Prioritizing perioperative quality improvement in orthopaedic surgery. J Bone Joint Surg Am. 2010;92(9):1884-1889. doi:10.2106/jbjs.i.00735.
2. Forte ML, Virnig BA, Swiontkowski MF, et al. Ninety-day mortality after intertrochanteric hip fracture: does provider volume matter? J Bone Joint Surg Am. 2010;92(4):799-806. doi:10.2106/jbjs.h.01204.
3. Pugely AJ, Martin CT, Gao Y, Klocke NF, Callaghan JJ, Marsh JL. A risk calculator for short-term morbidity and mortality after hip fracture surgery. J Orthop Trauma.2014;28(2):63-69. doi:10.1097/BOT.0b013e3182a22744.
4. Bhattacharyya T, Iorio R, Healy WL. Rate of and risk factors for acute inpatient mortality after orthopaedic surgery. J Bone Joint Surg Am. 2002;84-a(4):562-572.
5. Eriksson BI, Lassen MR. Duration of prophylaxis against venous thromboembolism with fondaparinux after hip fracture surgery: a multicenter, randomized, placebo-controlled, double-blind study. Arch Intern Med. 2003;163(11):1337-1342. doi:10.1001/archinte.163.11.1337.
6. Handoll HH, Farrar MJ, McBirnie J, Tytherleigh-Strong G, Milne AA, Gillespie WJ. Heparin, low molecular weight heparin and physical methods for preventing deep vein thrombosis and pulmonary embolism following surgery for hip fractures. Cochrane Database Syst Rev.2002;(4):Cd000305. doi:10.1002/14651858.cd000305.
7. Avenell A, Handoll HH. Nutritional supplementation for hip fracture aftercare in the elderly. Cochrane Database Syst Rev. 2004;(1):Cd001880. doi:10.1002/14651858.CD001880.pub2.
8. Marcantonio ER, Flacker JM, Wright RJ, Resnick NM. Reducing delirium after hip fracture: a randomized trial. J Am Geriatr Soc. 2001;49(5):516-522. doi:10.1046/j.1532-5415.2001.49108.x.
9. Deschodt M, Braes T, Flamaing J, et al. Preventing delirium in older adults with recent hip fracture through multidisciplinary geriatric consultation. J Am Geriatr Soc. 2012;60(4):733-739. doi:10.1111/j.1532-5415.2012.03899.x.
10. Marcantonio ER, Palihnich K, Appleton P, Davis RB. Pilot randomized trial of donepezil hydrochloride for delirium after hip fracture. J Am Geriatr Soc. 2011;59 Suppl 2:S282-S288. doi:10.1111/j.1532-5415.2011.03691.x.
11. Parker MJ. Iron supplementation for anemia after hip fracture surgery: a randomized trial of 300 patients. J Bone Joint Surg Am. 2010;92(2):265-269. doi:10.2106/jbjs.i.00883.
12. Urwin SC, Parker MJ, Griffiths R. General versus regional anaesthesia for hip fracture surgery: a meta-analysis of randomized trials. Br J Anaesth. 2000;84(4):450-455. doi:10.1093/oxfordjournals.bja.a013468.
13. Bohl DD, Basques BA, Golinvaux NS, Baumgaertner MR, Grauer JN. Nationwide Inpatient Sample and National Surgical Quality Improvement Program give different results in hip fracture studies. Clin Orthop Relat Res. 2014;472(6):1672-1680. doi:10.1007/s11999-014-3559-0.
14. Bohl DD, Grauer JN, Leopold SS. Editor's spotlight/Take 5: nationwide inpatient sample and national surgical quality improvement program give different results in hip fracture studies. Clin Orthop Relat Res. 2014;472(6):1667-1671. doi:10.1007/s11999-014-3595-9.
15. Bohl DD, Russo GS, Basques BA, et al. Variations in data collection methods between national databases affect study results: a comparison of the nationwide inpatient sample and national surgical quality improvement program databases for lumbar spine fusion procedures. J Bone Joint Surg Am. 2014;96(23):e193. doi:10.2106/jbjs.m.01490.
16. Levin PE. Apples, oranges, and national databases: commentary on an article by Daniel D. Bohl, MPH, et al.: "Variations in data collection methods between national databases affect study results: a comparison of the nationwide inpatient sample and national surgical quality improvement program databases for lumbar spine fusion procedures.” J Bone Joint Surg Am. 2014;96(23):e198. doi:10.2106/jbjs.n.00890.
17. Basques BA, Bohl DD, Golinvaux NS, Leslie MP, Baumgaertner MR, Grauer JN. Postoperative length of stay and thirty-day readmission following geriatric hip fracture: an analysis of 8,434 patients. J Orthop Trauma. 2015;29(3):e115-e120. doi:10.1097/bot.0000000000000222.
18. Golinvaux NS, Bohl DD, Basques BA, Baumgaertner MR, Grauer JN. Diabetes confers little to no increased risk of postoperative complications after hip fracture surgery in geriatric patients. Clin Orthop Relat Res. 2015;473(3):1043-1051. doi:10.1007/s11999-014-3945-7.
19. Maciejewski ML, Radcliff TA, Henderson WG, et al. Determinants of postsurgical discharge setting for male hip fracture patients. J Rehabil Res Dev. 2013;50(9):1267-1276. doi:10.1682/jrrd.2013.02.0041.
20. Molina CS, Thakore RV, Blumer A, Obremskey WT, Sethi MK. Use of the National Surgical Quality Improvement Program in orthopaedic surgery. Clin Orthop Relat Res.2015;473(5):1574-1581. doi:10.1007/s11999-014-3597-7.
21. Bohl DD, Basques BA, Golinvaux NS, Miller CP, Baumgaertner MR, Grauer JN. Extramedullary compared with intramedullary implants for intertrochanteric hip fractures: thirty-day outcomes of 4432 procedures from the ACS NSQIP database. J Bone Joint Surg Am. 2014;96(22):1871-1877. doi:10.2106/jbjs.n.00041.
22. Alosh H, Riley LH 3rd, Skolasky RL. Insurance status, geography, race, and ethnicity as predictors of anterior cervical spine surgery rates and in-hospital mortality: an examination of United States trends from 1992 to 2005. Spine (Phila Pa 1976). 2009;34(18):1956-1962. doi:10.1097/BRS.0b013e3181ab930e.
23. Cahill KS, Chi JH, Day A, Claus EB. Prevalence, complications, and hospital charges associated with use of bone-morphogenetic proteins in spinal fusion procedures. JAMA.2009;302(1):58-66. doi:10.1001/jama.2009.956.
24. Ingraham AM, Richards KE, Hall BL, Ko CY. Quality improvement in surgery: the American College of Surgeons National Surgical Quality Improvement Program approach. Adv Surg. 2010;44(1):251-267. doi:10.1016/j.yasu.2010.05.003.
25. Shiloach M, Frencher SK Jr, Steeger JE, et al. Toward robust information: data quality and inter-rater reliability in the American College of Surgeons National Surgical Quality Improvement Program. J Am Coll Surg. 2010;210(1):6-16. doi:10.1016/j.jamcollsurg.2009.09.031.
26. ACS-NSQIP. Data Use Agreement. American College of Surgeons Web site. https://www.facs.org/quality-programs/acs-nsqip/participant-use/puf-form. Accessed September 20, 2018.
27. Blacher J, Guerin AP, Pannier B, Marchais SJ, London GM. Arterial calcifications, arterial stiffness, and cardiovascular risk in end-stage renal disease. Hypertension. 2001;38(4):938-942. doi:10.1161/hy1001.096358.
28. Browne JA, Cook C, Olson SA, Bolognesi MP. Resident duty-hour reform associated with increased morbidity following hip fracture. J Bone Joint Surg Am. 2009;91(9):2079-2085. doi:10.2106/jbjs.h.01240.
29. Browne JA, Pietrobon R, Olson SA. Hip fracture outcomes: does surgeon or hospital volume really matter? J Trauma. 2009;66(3):809-814. doi:10.1097/TA.0b013e31816166bb.
30. Menendez ME, Ring D. Failure to rescue after proximal femur fracture surgery. J Orthop Trauma. 2015;29(3):e96-e102. doi:10.1097/bot.0000000000000234.
31. Nikkel LE, Fox EJ, Black KP, Davis C, Andersen L, Hollenbeak CS. Impact of comorbidities on hospitalization costs following hip fracture. J Bone Joint Surg Am. 2012;94(1):9-17. doi:10.2106/jbjs.j.01077.
32. Anderson KL, Koval KJ, Spratt KF. Hip fracture outcome: is there a “July effect”? Am J Orthop. 2009;38(12):606-611.
33. Koval KJ, Rust CL, Spratt KF. The effect of hospital setting and teaching status on outcomes after hip fracture. Am J Orthop. 2011;40(1):19-28.
34. Bacon WE. Secular trends in hip fracture occurrence and survival: age and sex differences. J Aging Health. 1996;8(4):538-553. doi:10.1177/089826439600800404.
35. Orces CH. In-hospital hip fracture mortality trends in older adults: the National Hospital Discharge Survey, 1988-2007. J Am Geriatr Soc. 2013;61(12):2248-2249. doi:10.1111/jgs.12567.
TAKE-HOME POINTS
- The median postoperative day of diagnosis for myocardial infarction was 3, 3 for cardiac arrest requiring cardiopulmonary resuscitation, 3 for stroke, 4 for pneumonia, 4 for pulmonary embolism, 7 for urinary tract infection, 9 for deep vein thrombosis, 9 for sepsis, 11 for mortality, and 16 for surgical site infection.
- For the earliest diagnosed adverse events, the rate of adverse events had diminished by postoperative day 30; however, for the later diagnosed adverse events, the rate of adverse events remained high at postoperative day 30.
- The proportions of adverse events diagnosed prior to discharge were 81.0% for myocardial infarction, 77.8% for stroke, 76.1% for cardiac arrest requiring cardiopulmonary resuscitation, 71.9% for pulmonary embolism, 71.1% for pneumonia, 58.0% for urinary tract infection, 52.1% for sepsis, 46.9% for deep vein thrombosis, 44.3% for mortality, and 27.6% for surgical site infection.
- These results facilitate targeted clinical surveillance, guide patient counseling, and inform the duration of follow-up required in research studies.
- Clinicians should have the lowest threshold for testing for each adverse event during the time period of greatest risk.
Utilization of Primary Care Physicians by Medical Residents: A Survey-Based Study
From the University of Michigan Medical School, Ann Arbor, MI.
Abstract
- Objective: Existing research has demonstrated overall low rates of residents establishing care with a primary care physician (PCP). We conducted a survey-based study to better understand chronic illness, PCP utilization, and prescription medication use patterns in resident physician populations.
- Methods: In 2017, we invited internal and family medicine trainees from a convenience sample of U.S. residency programs to participate in a survey. We compared the characteristics of residents who had established care with a PCP to those who had not.
- Results: The response rate was 45% (348/766 residents). The majority (n = 205, 59%) of respondents stated they had established care with a PCP primarily for routine preventative care (n = 159, 79%) and access in the event of an emergency (n = 132, 66%). However, 31% (n = 103) denied having had a wellness visit in over 3 years. Nearly a quarter of residents (n = 77, 23%) reported a chronic medical illness and 14% (n = 45) reported a preexisting mental health condition prior to residency. One-third (n = 111, 33%) reported taking a long-term prescription medication. Compared to residents who had not established care, those with a PCP (n = 205) more often reported a chronic condition (P < 0.001), seeing a subspecialist (P = 0.01), or taking long-term prescription medications (P < 0.001). One in 5 (n = 62,19%) respondents reported receiving prescriptions for an acute illness from an individual with whom they did not have a doctor-patient relationship.
- Conclusion: Medical residents have a substantial burden of chronic illness that may not be met through interactions with PCPs. Further understanding their medical needs and barriers to accessing care is necessary to ensure trainee well-being.
Keywords: Medical education-graduate, physician behavior, survey research, access to care.
Although internal medicine (IM) and family medicine (FM) residents must learn to provide high-quality primary care to their patients, little is known about whether they appropriately access such care themselves. Resident burnout and resilience has received attention [1,2], but there has been limited focus on understanding the burden of chronic medical and mental illness among residents. In particular, little is known about whether residents access primary care physicians (PCPs)—for either acute or chronic medical needs—and about resident self-medication practices.
Residency is often characterized by a life-changing geographic relocation. Even residents who do not relocate may still need to establish care with a new PCP due to health insurance or loss of access to a student clinic [3]. Establishing primary care with a new doctor typically requires scheduling a new patient visit, often with a wait time of several days to weeks [4,5]. Furthermore, lack of time, erratic schedules, and concerns about privacy and the stigma of being ill as a physician are barriers to establishing care [6-8]. Individuals who have not established primary care may experience delays in routine preventative health services, screening for chronic medical and mental health conditions, as well as access to care during acute illnesses [9,10]. Worse, they may engage in potentially unsafe practices, such as having colleagues write prescriptions for them, or even self-prescribing [8,11,12].
Existing research has demonstrated overall low rates of residents establishing care with a PCP [6–8,13]. However, these studies have either been limited to large academic centers or conducted outside the United States. Improving resident well-being may prove challenging without a clear understanding of current primary care utilization practices, the burden of chronic illness among residents, and patterns of prescription medication use and needs. Therefore, we conducted a survey-based study to understand primary care utilization and the burden of chronic illness among residents. We also assessed whether lack of primary care is associated with potentially risky behaviors, such as self-prescribing of medications.
Methods
Study Setting and Participants
The survey was distributed to current residents at IM and FM programs within the United States in 2017. Individual programs were recruited by directly contacting program directors or chief medical residents via email. Rather than contacting sites directly through standard templated emails, we identified programs both through personal contacts as well as the Electronic Residency Application Service list of accredited IM training programs. We elected to use this approach in order to increase response rates and to ensure that a sample representative of the trainee population was constructed. Programs were located in the Northeast, Midwest, South, and Pacific regions, and included small community-based programs and large academic centers.
Development of the Survey
The survey instrument was developed by the authors and reviewed by residents and PCPs at the University of Michigan to ensure relevance and comprehension of questions (The survey is available in the Appendix.). Once finalized, the survey was programmed into an online survey tool (Qualtrics, Provo, UT) and pilot-tested before being disseminated to the sampling frame. Data collected in the survey included: respondent’s utilization of a PCP, burden of chronic illness, long-term prescription medications, prescribing source, and demographic characteristics.

Each participating program distributed the survey to their residents through an email containing an anonymous hyperlink. The survey was available for completion for 4 weeks. We asked participating programs to send email reminders to encourage participation. Participants were given the option of receiving a $10 Amazon gift card after completion. All responses were recorded anonymously. The study received a “not regulated” status by the University of Michigan Institutional Review Board (HUM 00123888).
")
Statistical Analysis
Descriptive statistics were used to tabulate results. Respondents were encouraged, but not required, to answer all questions. Therefore, the response rate for each question was calculated using the total number of responses for that question as the denominator. Bivariable comparisons were made using Chi-squared or Fisher’s exact tests, as appropriate, for categorical data. A P value < 0.05, with 2-sided alpha, was considered statistically significant. All statistical analyses were conducted using Stata 13 SE (StataCorp, College Station, TX).

Results
Respondent Characteristics
Of the 29 programs contacted, 10 agreed to participate within the study timeframe. Of 766 potential respondents, 348 (45%) residents answered the survey (Table 1). The majority of respondents (n = 276, 82%) were from IM programs. Respondents were from all training years as follows: postgraduate year 1 residents (PGY-1, or interns; n = 130, 39%), PGY-2 residents (n = 98, 29%), PGY-3 residents (n = 93, 28%), and PGY-4 residents (n = 12, 4%). Most respondents were from the South (n = 130, 39%) and Midwest (n = 123, 37%) regions, and over half (n = 179, 54%) were female. Most respondents (n = 285, 86%) stated that they did not have children. The majority (n = 236, 71%) were completing residency in an area where they had not previously lived for more than 1 year.
Primary Care Utilization
Among the 348 respondents, 59% (n = 205) reported having established care with a PCP. An additional 6% (n = 21) had established care with an obstetrician/gynecologist for routine needs (Table 2). The 2 most common reasons for establishing care with a PCP were routine primary care needs, including contraception (n = 159, 79%), and access to a physician in the event of an acute medical need (n = 132, 66%).

Among respondents who had established care with a PCP, most (n = 188, 94%) had completed at least 1 appointment. However, among these 188 respondents, 68% (n = 127) stated that they had not made an acute visit in more than 12 months. When asked about wellness visits, almost one third of respondents (n = 103, 31%) stated that they had not been seen for a wellness visit in the past 3 years.

Burden of Chronic Illness
Most respondents (n = 223, 67%) stated that they did not have a chronic medical or mental health condition prior to residency (Table 3). However, 23% (n = 77) of respondents stated that they had been diagnosed with a chronic medical illness prior to residency, and 14% (n = 45) indicated they had been diagnosed with a mental health condition prior to residency. Almost one fifth of respondents (n = 60, 18%) reported seeing a subspecialist for a medical illness, and 33% (n = 111) reported taking a long-term prescription medication. With respect to major medical issues, the majority of residents (n = 239, 72%) denied experiencing events such as pregnancy, hospitalization, surgery, or an emergency department (ED) visit during training.
[polldaddy:10116940]
Inappropriate Prescriptions

While the majority of respondents denied writing a prescription for themselves for an acute or chronic medical condition, almost one fifth (n = 62, 19%) had received a prescription for an acute medical need from a provider outside of a clinical relationship (ie, from someone other than their PCP or specialty provider). Notably, 5% (n = 15) reported that this had occurred at least 2 or 3 times in the past 12 months (Table 4). Compared to respondents not taking long-term prescription medications, respondents who were already taking long-term prescription medications more frequently reported inappropriately receiving chronic prescriptions outside of an established clinical relationship (n = 14, 13% vs. n = 14, 6%; P = 0.05) and more often self-prescribed medications for acute needs (n = 12, 11% vs. n = 7, 3%; P = 0.005).
Comparison of Residents With and Without a PCP
Important differences were noted between residents who had a PCP versus those who did not (Table 5). For example, a higher percentage of residents with a PCP indicated they had been diagnosed with a chronic medical illness (n = 55, 28% vs. n = 22, 16%; P = 0.01) or a chronic mental health condition (n = 34, 17% vs. n = 11, 8%; P = 0.02) before residency. Additionally, a higher percentage of residents with a PCP (n = 70, 35% vs. n = 25, 18%; P = 0.001) reported experiencing medical events such as pregnancy, hospitalization, surgery, ED visit, or new diagnosis of a chronic medical illness during residency. Finally, a higher percentage of respondents with a PCP stated that they had visited a subspecialist for a medical illness (n = 44, 22% vs. n = 16,12%; P = 0.01) or were taking long-term prescription medications (n = 86, 43% vs. n = 25; 18%; P < 0.001). When comparing PGY-1 to PGY-2–PGY-4 residents, the former reported having established a medical relationship with a PCP significantly less frequently (n = 56, 43% vs. n = 142, 70%; P < 0.001).
")
Discussion
This survey-based study of medical residents across the United States suggests that a substantial proportion do not establish relationships with PCPs. Additionally, our data suggest that despite establishing care, few residents subsequently visited their PCP during training for wellness visits or routine care. Self-reported rates of chronic medical and mental health conditions were substantial in our sample. Furthermore, inappropriate self-prescription and the receipt of prescriptions outside of a medical relationship were also reported. These findings suggest that future studies that focus on the unique medical and mental health needs of physicians in training, as well as interventions to encourage care in this vulnerable period, are necessary.
 continued")
We observed that most respondents that established primary care were female trainees. Although it is impossible to know with certainty, one hypothesis behind this discrepancy is that women routinely need to access preventative care for gynecologic needs such as pap smears, contraception, and potentially pregnancy and preconception counseling [14,15]. Similarly, residents with a chronic medical or mental health condition prior to residency established care with a local PCP at a significantly greater frequency than those without such diagnoses. While selection bias cannot be excluded, this finding suggests that illness is a driving factor in establishing care. There also appears to be an association between accessing the medical system (either for prescription medications or subspecialist care) and having established care with a PCP. Collectively, these data suggest that individuals without a compelling reason to access medical services might have barriers to accessing care in the event of medical needs or may not receive routine preventative care [9,10].
In general, we found that rates of reported inappropriate prescriptions were lower than those reported in prior studies where a comparable resident population was surveyed [8,12,16]. Inclusion of multiple institutions, differences in temporality, social desirability bias, and reporting bias might have influenced our findings in this regard. Surprisingly, we found that having a PCP did not influence likelihood of inappropriate prescription receipt, perhaps suggesting that this behavior reflects some degree of universal difficulty in accessing care. Alternatively, this finding might relate to a cultural tendency to self-prescribe among resident physicians. The fact that individuals on chronic medications more often both received and wrote inappropriate prescriptions suggests this problem might be more pronounced in individuals who take medications more often, as these residents have specific needs [12]. Future studies targeting these individuals thus appear warranted.
Our study has several limitations. First, our sample size was modest and the response rate of 45% was low. However, to our knowledge, this remains among the largest survey on this topic, and our response rate is comparable to similar trainee studies [8,11,13]. Second, we designed and created a novel survey for this study. While the questions were pilot-tested with users prior to dissemination, validation of the instrument was not performed. Third, since the study population was restricted to residents in fields that participate in primary care, our findings may not be generalizable to patterns of PCP use in other specialties [6].
These limitations aside, our study has important strengths. This is the first national study of its kind with specific questions addressing primary care access and utilization, prescription medication use and related practices, and the prevalence of medical conditions among trainees. Important differences in the rates of establishing primary care between male and female respondents, first- year and senior residents, and those with and without chronic disease suggest a need to target specific resident groups (males, interns, those without pre-existing conditions) for wellness-related interventions. Such interventions could include distribution of a list of local providers to first year residents, advanced protected time for doctor’s appointments, and safeguards to ensure health information is protected from potential supervisors. Future studies should also include residents from non-primary care oriented specialties such as surgery, emergency medicine, and anesthesiology to obtain results that are more generalizable to the resident population as a whole. Additionally, the rates of inappropriate prescriptions were not insignificant and warrant further evaluation of the driving forces behind these behaviors.
Conclusion
Medical residents have a substantial burden of chronic illness that may not be met through interactions with PCPs. More research into barriers that residents face while accessing care and an assessment of interventions to facilitate their access to care is important to promote trainee well-being. Without such direction and initiative, it may prove harder for physicians to heal themselves or those for whom they provide care.
Acknowledgments: We thank Suzanne Winter, the study coordinator, for her support with editing and formatting the manuscript, Latoya Kuhn for performing the statistical analysis and creating data tables, and Dr. Namita Sachdev and Dr. Renuka Tipirneni for providing feedback on the survey instrument. We also thank the involved programs for their participation.
Corresponding author: Vineet Chopra, NCRC 2800 Plymouth Rd., Bldg 16, 432, Ann Arbor, MI 48109, [email protected].
Financial disclosures: None.
Previous presentations: Results were presented at the Annual Michigan Medicine 2017 Internal Medicine Research Symposium.
1. Kassam A, Horton J, Shoimer I, Patten S. Predictors of well-being in resident physicians: a descriptive and psychometric study. J Grad Med Educ 2015;7:70–4.
2. Shanafelt TD, Bradley KA, Wipf JE, Back AL. Burnout and self-reported patient care in an internal medicine residency program. Ann Intern Med 2002;136:358–67.
3. Burstin HR, Swartz K, O’Neil AC, et al. The effect of change of health insurance on access to care. Inquiry 1998;35:389–97.
4. Rhodes KV, Basseyn S, Friedman AB, et al. Access to primary care appointments following 2014 insurance expansions. Ann Fam Med 2017;15:107–12.
5. Polsky D, Richards M, Basseyn S, et al. Appointment availability after increases in Medicaid payments for primary care. N Engl J Med 2015;372:537–45.
6. Gupta G, Schleinitz MD, Reinert SE, McGarry KA. Resident physician preventive health behaviors and perspectives on primary care. R I Med J (2013) 2013;96:43–7.
7. Rosen IM, Christine JD, Bellini LM, Asch DA. Health and health care among housestaff in four U.S. internal medicine residency programs. J Gen Intern Med 2000;15:116-21.
8. Campbell S, Delva D. Physician do not heal thyself. Survey of personal health practices among medical residents. Can Fam Physician 2003;49:1121–7.
9. Starfield B, Shi L, Macinko J. Contribution of primary care to health systems and health. Milbank Q 2005;83(3):457-502.
10. Weissman JS, Stern R, Fielding SL, et al. Delayed access to health care: risk factors, reasons, and consequences. Ann Intern Med 1991;114:325–31.
11. Guille C, Sen S. Prescription drug use and self-prescription among training physicians. Arch Intern Med 2012;172:371–2.
12. Roberts LW, Kim JP. Informal health care practices of residents: “curbside” consultation and self-diagnosis and treatment. Acad Psychiatry 2015;39:22-30.
13. Cohen JS, Patten S. Well-being in residency training: a survey examining resident physician satisfaction both within and outside of residency training and mental health in Alberta. BMC Med Educ 2005;5:21.
14. U.S. Preventive Services Task Force. Cervical cancer: screening. https://www.uspreventiveservicestaskforce.org/Page/Document/UpdateSummaryFinal/cervical-cancer-screening. Published March 2012. Accessed August 21, 2018.
15. Health Resources and Services Administration. Women’s preventative services guidelines. https://www.hrsa.gov/womensguidelines2016/index.html. Updated October 2017. Accessed August 21, 2018.
16. Christie JD, Rosen IM, Bellini LM, et al. Prescription drug use and self-prescription among resident physicians. JAMA 1998;280(14):1253–5.
From the University of Michigan Medical School, Ann Arbor, MI.
Abstract
- Objective: Existing research has demonstrated overall low rates of residents establishing care with a primary care physician (PCP). We conducted a survey-based study to better understand chronic illness, PCP utilization, and prescription medication use patterns in resident physician populations.
- Methods: In 2017, we invited internal and family medicine trainees from a convenience sample of U.S. residency programs to participate in a survey. We compared the characteristics of residents who had established care with a PCP to those who had not.
- Results: The response rate was 45% (348/766 residents). The majority (n = 205, 59%) of respondents stated they had established care with a PCP primarily for routine preventative care (n = 159, 79%) and access in the event of an emergency (n = 132, 66%). However, 31% (n = 103) denied having had a wellness visit in over 3 years. Nearly a quarter of residents (n = 77, 23%) reported a chronic medical illness and 14% (n = 45) reported a preexisting mental health condition prior to residency. One-third (n = 111, 33%) reported taking a long-term prescription medication. Compared to residents who had not established care, those with a PCP (n = 205) more often reported a chronic condition (P < 0.001), seeing a subspecialist (P = 0.01), or taking long-term prescription medications (P < 0.001). One in 5 (n = 62,19%) respondents reported receiving prescriptions for an acute illness from an individual with whom they did not have a doctor-patient relationship.
- Conclusion: Medical residents have a substantial burden of chronic illness that may not be met through interactions with PCPs. Further understanding their medical needs and barriers to accessing care is necessary to ensure trainee well-being.
Keywords: Medical education-graduate, physician behavior, survey research, access to care.
Although internal medicine (IM) and family medicine (FM) residents must learn to provide high-quality primary care to their patients, little is known about whether they appropriately access such care themselves. Resident burnout and resilience has received attention [1,2], but there has been limited focus on understanding the burden of chronic medical and mental illness among residents. In particular, little is known about whether residents access primary care physicians (PCPs)—for either acute or chronic medical needs—and about resident self-medication practices.
Residency is often characterized by a life-changing geographic relocation. Even residents who do not relocate may still need to establish care with a new PCP due to health insurance or loss of access to a student clinic [3]. Establishing primary care with a new doctor typically requires scheduling a new patient visit, often with a wait time of several days to weeks [4,5]. Furthermore, lack of time, erratic schedules, and concerns about privacy and the stigma of being ill as a physician are barriers to establishing care [6-8]. Individuals who have not established primary care may experience delays in routine preventative health services, screening for chronic medical and mental health conditions, as well as access to care during acute illnesses [9,10]. Worse, they may engage in potentially unsafe practices, such as having colleagues write prescriptions for them, or even self-prescribing [8,11,12].
Existing research has demonstrated overall low rates of residents establishing care with a PCP [6–8,13]. However, these studies have either been limited to large academic centers or conducted outside the United States. Improving resident well-being may prove challenging without a clear understanding of current primary care utilization practices, the burden of chronic illness among residents, and patterns of prescription medication use and needs. Therefore, we conducted a survey-based study to understand primary care utilization and the burden of chronic illness among residents. We also assessed whether lack of primary care is associated with potentially risky behaviors, such as self-prescribing of medications.
Methods
Study Setting and Participants
The survey was distributed to current residents at IM and FM programs within the United States in 2017. Individual programs were recruited by directly contacting program directors or chief medical residents via email. Rather than contacting sites directly through standard templated emails, we identified programs both through personal contacts as well as the Electronic Residency Application Service list of accredited IM training programs. We elected to use this approach in order to increase response rates and to ensure that a sample representative of the trainee population was constructed. Programs were located in the Northeast, Midwest, South, and Pacific regions, and included small community-based programs and large academic centers.
Development of the Survey
The survey instrument was developed by the authors and reviewed by residents and PCPs at the University of Michigan to ensure relevance and comprehension of questions (The survey is available in the Appendix.). Once finalized, the survey was programmed into an online survey tool (Qualtrics, Provo, UT) and pilot-tested before being disseminated to the sampling frame. Data collected in the survey included: respondent’s utilization of a PCP, burden of chronic illness, long-term prescription medications, prescribing source, and demographic characteristics.
Each participating program distributed the survey to their residents through an email containing an anonymous hyperlink. The survey was available for completion for 4 weeks. We asked participating programs to send email reminders to encourage participation. Participants were given the option of receiving a $10 Amazon gift card after completion. All responses were recorded anonymously. The study received a “not regulated” status by the University of Michigan Institutional Review Board (HUM 00123888).
Statistical Analysis
Descriptive statistics were used to tabulate results. Respondents were encouraged, but not required, to answer all questions. Therefore, the response rate for each question was calculated using the total number of responses for that question as the denominator. Bivariable comparisons were made using Chi-squared or Fisher’s exact tests, as appropriate, for categorical data. A P value < 0.05, with 2-sided alpha, was considered statistically significant. All statistical analyses were conducted using Stata 13 SE (StataCorp, College Station, TX).
Results
Respondent Characteristics
Of the 29 programs contacted, 10 agreed to participate within the study timeframe. Of 766 potential respondents, 348 (45%) residents answered the survey (Table 1). The majority of respondents (n = 276, 82%) were from IM programs. Respondents were from all training years as follows: postgraduate year 1 residents (PGY-1, or interns; n = 130, 39%), PGY-2 residents (n = 98, 29%), PGY-3 residents (n = 93, 28%), and PGY-4 residents (n = 12, 4%). Most respondents were from the South (n = 130, 39%) and Midwest (n = 123, 37%) regions, and over half (n = 179, 54%) were female. Most respondents (n = 285, 86%) stated that they did not have children. The majority (n = 236, 71%) were completing residency in an area where they had not previously lived for more than 1 year.
Primary Care Utilization
Among the 348 respondents, 59% (n = 205) reported having established care with a PCP. An additional 6% (n = 21) had established care with an obstetrician/gynecologist for routine needs (Table 2). The 2 most common reasons for establishing care with a PCP were routine primary care needs, including contraception (n = 159, 79%), and access to a physician in the event of an acute medical need (n = 132, 66%).
Among respondents who had established care with a PCP, most (n = 188, 94%) had completed at least 1 appointment. However, among these 188 respondents, 68% (n = 127) stated that they had not made an acute visit in more than 12 months. When asked about wellness visits, almost one third of respondents (n = 103, 31%) stated that they had not been seen for a wellness visit in the past 3 years.
Burden of Chronic Illness
Most respondents (n = 223, 67%) stated that they did not have a chronic medical or mental health condition prior to residency (Table 3). However, 23% (n = 77) of respondents stated that they had been diagnosed with a chronic medical illness prior to residency, and 14% (n = 45) indicated they had been diagnosed with a mental health condition prior to residency. Almost one fifth of respondents (n = 60, 18%) reported seeing a subspecialist for a medical illness, and 33% (n = 111) reported taking a long-term prescription medication. With respect to major medical issues, the majority of residents (n = 239, 72%) denied experiencing events such as pregnancy, hospitalization, surgery, or an emergency department (ED) visit during training.
[polldaddy:10116940]
Inappropriate Prescriptions
While the majority of respondents denied writing a prescription for themselves for an acute or chronic medical condition, almost one fifth (n = 62, 19%) had received a prescription for an acute medical need from a provider outside of a clinical relationship (ie, from someone other than their PCP or specialty provider). Notably, 5% (n = 15) reported that this had occurred at least 2 or 3 times in the past 12 months (Table 4). Compared to respondents not taking long-term prescription medications, respondents who were already taking long-term prescription medications more frequently reported inappropriately receiving chronic prescriptions outside of an established clinical relationship (n = 14, 13% vs. n = 14, 6%; P = 0.05) and more often self-prescribed medications for acute needs (n = 12, 11% vs. n = 7, 3%; P = 0.005).
Comparison of Residents With and Without a PCP
Important differences were noted between residents who had a PCP versus those who did not (Table 5). For example, a higher percentage of residents with a PCP indicated they had been diagnosed with a chronic medical illness (n = 55, 28% vs. n = 22, 16%; P = 0.01) or a chronic mental health condition (n = 34, 17% vs. n = 11, 8%; P = 0.02) before residency. Additionally, a higher percentage of residents with a PCP (n = 70, 35% vs. n = 25, 18%; P = 0.001) reported experiencing medical events such as pregnancy, hospitalization, surgery, ED visit, or new diagnosis of a chronic medical illness during residency. Finally, a higher percentage of respondents with a PCP stated that they had visited a subspecialist for a medical illness (n = 44, 22% vs. n = 16,12%; P = 0.01) or were taking long-term prescription medications (n = 86, 43% vs. n = 25; 18%; P < 0.001). When comparing PGY-1 to PGY-2–PGY-4 residents, the former reported having established a medical relationship with a PCP significantly less frequently (n = 56, 43% vs. n = 142, 70%; P < 0.001).
Discussion
This survey-based study of medical residents across the United States suggests that a substantial proportion do not establish relationships with PCPs. Additionally, our data suggest that despite establishing care, few residents subsequently visited their PCP during training for wellness visits or routine care. Self-reported rates of chronic medical and mental health conditions were substantial in our sample. Furthermore, inappropriate self-prescription and the receipt of prescriptions outside of a medical relationship were also reported. These findings suggest that future studies that focus on the unique medical and mental health needs of physicians in training, as well as interventions to encourage care in this vulnerable period, are necessary.
We observed that most respondents that established primary care were female trainees. Although it is impossible to know with certainty, one hypothesis behind this discrepancy is that women routinely need to access preventative care for gynecologic needs such as pap smears, contraception, and potentially pregnancy and preconception counseling [14,15]. Similarly, residents with a chronic medical or mental health condition prior to residency established care with a local PCP at a significantly greater frequency than those without such diagnoses. While selection bias cannot be excluded, this finding suggests that illness is a driving factor in establishing care. There also appears to be an association between accessing the medical system (either for prescription medications or subspecialist care) and having established care with a PCP. Collectively, these data suggest that individuals without a compelling reason to access medical services might have barriers to accessing care in the event of medical needs or may not receive routine preventative care [9,10].
In general, we found that rates of reported inappropriate prescriptions were lower than those reported in prior studies where a comparable resident population was surveyed [8,12,16]. Inclusion of multiple institutions, differences in temporality, social desirability bias, and reporting bias might have influenced our findings in this regard. Surprisingly, we found that having a PCP did not influence likelihood of inappropriate prescription receipt, perhaps suggesting that this behavior reflects some degree of universal difficulty in accessing care. Alternatively, this finding might relate to a cultural tendency to self-prescribe among resident physicians. The fact that individuals on chronic medications more often both received and wrote inappropriate prescriptions suggests this problem might be more pronounced in individuals who take medications more often, as these residents have specific needs [12]. Future studies targeting these individuals thus appear warranted.
Our study has several limitations. First, our sample size was modest and the response rate of 45% was low. However, to our knowledge, this remains among the largest survey on this topic, and our response rate is comparable to similar trainee studies [8,11,13]. Second, we designed and created a novel survey for this study. While the questions were pilot-tested with users prior to dissemination, validation of the instrument was not performed. Third, since the study population was restricted to residents in fields that participate in primary care, our findings may not be generalizable to patterns of PCP use in other specialties [6].
These limitations aside, our study has important strengths. This is the first national study of its kind with specific questions addressing primary care access and utilization, prescription medication use and related practices, and the prevalence of medical conditions among trainees. Important differences in the rates of establishing primary care between male and female respondents, first- year and senior residents, and those with and without chronic disease suggest a need to target specific resident groups (males, interns, those without pre-existing conditions) for wellness-related interventions. Such interventions could include distribution of a list of local providers to first year residents, advanced protected time for doctor’s appointments, and safeguards to ensure health information is protected from potential supervisors. Future studies should also include residents from non-primary care oriented specialties such as surgery, emergency medicine, and anesthesiology to obtain results that are more generalizable to the resident population as a whole. Additionally, the rates of inappropriate prescriptions were not insignificant and warrant further evaluation of the driving forces behind these behaviors.
Conclusion
Medical residents have a substantial burden of chronic illness that may not be met through interactions with PCPs. More research into barriers that residents face while accessing care and an assessment of interventions to facilitate their access to care is important to promote trainee well-being. Without such direction and initiative, it may prove harder for physicians to heal themselves or those for whom they provide care.
Acknowledgments: We thank Suzanne Winter, the study coordinator, for her support with editing and formatting the manuscript, Latoya Kuhn for performing the statistical analysis and creating data tables, and Dr. Namita Sachdev and Dr. Renuka Tipirneni for providing feedback on the survey instrument. We also thank the involved programs for their participation.
Corresponding author: Vineet Chopra, NCRC 2800 Plymouth Rd., Bldg 16, 432, Ann Arbor, MI 48109, [email protected].
Financial disclosures: None.
Previous presentations: Results were presented at the Annual Michigan Medicine 2017 Internal Medicine Research Symposium.
1. Kassam A, Horton J, Shoimer I, Patten S. Predictors of well-being in resident physicians: a descriptive and psychometric study. J Grad Med Educ 2015;7:70–4.
2. Shanafelt TD, Bradley KA, Wipf JE, Back AL. Burnout and self-reported patient care in an internal medicine residency program. Ann Intern Med 2002;136:358–67.
3. Burstin HR, Swartz K, O’Neil AC, et al. The effect of change of health insurance on access to care. Inquiry 1998;35:389–97.
4. Rhodes KV, Basseyn S, Friedman AB, et al. Access to primary care appointments following 2014 insurance expansions. Ann Fam Med 2017;15:107–12.
5. Polsky D, Richards M, Basseyn S, et al. Appointment availability after increases in Medicaid payments for primary care. N Engl J Med 2015;372:537–45.
6. Gupta G, Schleinitz MD, Reinert SE, McGarry KA. Resident physician preventive health behaviors and perspectives on primary care. R I Med J (2013) 2013;96:43–7.
7. Rosen IM, Christine JD, Bellini LM, Asch DA. Health and health care among housestaff in four U.S. internal medicine residency programs. J Gen Intern Med 2000;15:116-21.
8. Campbell S, Delva D. Physician do not heal thyself. Survey of personal health practices among medical residents. Can Fam Physician 2003;49:1121–7.
9. Starfield B, Shi L, Macinko J. Contribution of primary care to health systems and health. Milbank Q 2005;83(3):457-502.
10. Weissman JS, Stern R, Fielding SL, et al. Delayed access to health care: risk factors, reasons, and consequences. Ann Intern Med 1991;114:325–31.
11. Guille C, Sen S. Prescription drug use and self-prescription among training physicians. Arch Intern Med 2012;172:371–2.
12. Roberts LW, Kim JP. Informal health care practices of residents: “curbside” consultation and self-diagnosis and treatment. Acad Psychiatry 2015;39:22-30.
13. Cohen JS, Patten S. Well-being in residency training: a survey examining resident physician satisfaction both within and outside of residency training and mental health in Alberta. BMC Med Educ 2005;5:21.
14. U.S. Preventive Services Task Force. Cervical cancer: screening. https://www.uspreventiveservicestaskforce.org/Page/Document/UpdateSummaryFinal/cervical-cancer-screening. Published March 2012. Accessed August 21, 2018.
15. Health Resources and Services Administration. Women’s preventative services guidelines. https://www.hrsa.gov/womensguidelines2016/index.html. Updated October 2017. Accessed August 21, 2018.
16. Christie JD, Rosen IM, Bellini LM, et al. Prescription drug use and self-prescription among resident physicians. JAMA 1998;280(14):1253–5.
The Effect of Age on the Benefits of Early Decompression for Cervical Spondylotic Myelopathy
ABSTRACT
Cervical myelopathy is the most common cause of acquired spinal cord dysfunction in people aged >55 years. Advanced age and duration of symptoms have been implicated in the literature as negative prognostic indicators for postoperative functional improvement, but very few studies have evaluated the interaction of these factors. We retrospectively reviewed 125 patients who underwent surgery for cervical myelopathy. Patients were stratified according to age greater or less than 65 years and duration of symptoms of greater or less than 12 and 24 months. Functional outcomes were assessed using the Nurick score. Simple regression and multiple regression analyses were done, controlling for sex, preoperative Nurick score, surgical approach, smoking status, diabetes status, prior surgery, number of levels fused, ethanol use, and signal change on preoperative magnetic resonance imaging. The average change in Nurick score in all patients was 1.36, with a significant difference between patients with symptoms for <24 months and those with symptoms for >24 months (1.54 vs 0.98, P = .03). Multiple regression analysis revealed that older patients had a significant difference at 24 months (1.69 vs 1.25, P = .01), whereas younger patients showed slightly lower improvement overall and a change in Nurick score at both thresholds that was statistically nonsignificant.
Continue to: Cervical spondylotic myelopathy...
Cervical spondylotic myelopathy (CSM) is the most common acquired cause of spinal cord dysfunction in people aged >55 years.1 It is a slowly progressive disorder usually caused by spinal cord compression and ischemia due to age-related changes in the spine and is characterized by neck pain, radicular arm pain, paresthesia, weakness, lower extremity hyperreflexia, and gait and balance abnormalities and may also present with bowel and bladder dysfunction. The majority of cases progress in a stepwise manner, but about 5% of cases decline rapidly, and the prognosis of nonoperative treatment is poor once the patient is truly myelopathic. The objective of surgery is to decompress the spinal cord before permanent damage has set in.2-4
Several studies have attempted to describe the prognostic significance of duration of symptoms in surgical decompression of CSM. Some studies have found that there is no association with outcomes,5-7 but most of the studies have concluded that there is an association. Several of these studies specify that duration of symptoms is significant beyond particular time points, typically of 12 months8-12 or 24 months.13,14 At least 2 review studies have found low evidence for the influence of symptom duration on postoperative outcomes.15,16
Age has also been cited as an important prognostic factor in surgical decompression of CSM by some of these same studies. Only a few studies have concluded that age itself does not affect outcomes.17-19 However, most of the studies conclude that advanced age is a significant factor. Most of these cite a cutoff of 60 years of age,14,20 65 years of age,21 or 70 years of age,10 but at least 1 study has cited a cutoff as young as 40 years of age,9 and at least 1 other has cited 50 years of age.8
Most of the available literature has evaluated the effects of age and duration of symptoms separately. However, at least 2 studies have discussed the interplay between these variables, and both found that outcomes are associated with duration of symptoms only in the elderly, defined as above either 65 or 70 years of age.5,19 This study is an attempt to clarify this relationship.
Continue to: MATERIALS AND METHODS...
MATERIALS AND METHODS
Institutional Review Board approval was obtained for this study. Informed consent was waived due to the retrospective nature of the work. The medical records of 212 patients who underwent surgery for CSM by the senior author were reviewed. All surgeries were performed at the University Hospital or the Veterans Administration (VA) between March 2005 and July 2012. CSM was diagnosed by magnetic resonance imaging (MRI) and based on the presence of upper motor signs, clonus, gait abnormalities, or difficulty with fine motor movements such as buttoning a shirt. Nurick score (Table 1) was assessed at presentation and at follow-up, and was the only outcome measure recorded in this cohort. Inclusion criteria were the diagnosis of CSM with a Nurick score, surgical intervention, and at least 2 years of follow-up. Age at presentation, sex, preoperative Nurick score, postoperative Nurick score, duration of symptoms preoperatively, duration of follow-up, procedure performed, approach (anterior vs posterior vs anterior and posterior), prior surgery, number of levels fused, diabetes status, cocaine use, ethanol use, tobacco use, signal change on preoperative MRI, and whether the patient belonged to the VA were recorded. Posterior cervical surgery was performed in patients who had ossification of the posterior longitudinal ligament, had multiple prior anterior cervical procedures, or had involvement of 3 or more levels with anatomy that would make an extensive exposure difficult. Surgeries were performed anteriorly for cases of 1- or 2-level stenosis in the absence of ossification of the posterior longitudinal ligament.
Anterior surgery was also considered in patients with 3-level disease who did not have anatomy that precluded a more extensive exposure.
Patients were stratified according to duration of symptoms by cutoffs of 12 or 24 months and according to age <65 years or >65 years. The age cutoff was chosen because this was the youngest cohort in which stratification revealed a significant difference in change in the Nurick score according to duration of symptoms, and because this age is consistent with the literature. Data were blinded, and outcomes according to duration of symptoms and age were analyzed. The analysis was conducted using simple linear regression and multiple regression.
SURGICAL TECHNIQUE
Patients were evaluated through a complete neurological examination and Nurick scores preoperatively and postoperatively at 6 weeks, 3 months, 6 months, 1 year, and annually thereafter. Decompression procedures performed included single or multilevel corpectomy, anterior decompression with strut grafting and instrumentation, posterior cervical laminoplasty, and posterior cervical laminectomy and fusion. Patients were placed in a Miami J collar (Össur) postoperatively and sent to physical and occupational therapy when able. All procedures were performed by the senior author with the assistance of residents and fellows.
RESULTS
Of the 125 patients who met all the inclusion criteria, 44 were females and 81 were males. The average follow-up duration was 30.9 months (standard deviation [SD], 13.23). The average age of all patients was 55.2 years (range, 27-89 years), and there was no difference in age according to gender (55.0 years for females vs 55.2 years for males). The average preoperative Nurick score was 2.61 (SD, 1.16), and there was no difference in preoperative Nurick score according to cutoff of duration of symptoms. Males had a higher preoperative Nurick score than females (2.73 vs 2.41, P = .12) and a longer but statistically nonsignificant duration of symptoms (25.7 vs 16.9 months, P = .1). There were 97 patients aged ≤65 years (average, 49.6 years) and 28 patients aged >65 years (average, 73.7 years). The younger cohort had a lower preoperative Nurick score than the older cohort, but this difference was not statistically significant (2.52 vs 3.0, P = .06). The younger cohort also had a longer duration of symptoms, but this difference was not significant (21.8 vs 26.2 months, P > .1). The initial analysis of the change in Nurick score in all patients according to duration of symptoms revealed an average change of 1.36 points (SD, 1.13) and a difference in postoperative change in Nurick score for the duration of symptom cutoffs of 12 and 24 months. This pattern was also present when patients were stratified according to age (Tables 2 and 3). The most common procedures performed were anterior cervical discectomy and fusion (ACDF) (58) and corpectomy (49). Data according to the procedure performed are recorded in Table 4. No significant complications were recorded. Simple regression and multiple regression analyses were undertaken to further evaluate these relationships.
Table 1. Nurick Score
0 | Signs or symptoms of nerve root involvement by no signs or symptoms of spinal cord involvement |
1 | Signs of spinal cord compression but no gait abnormalities |
2 | Gait abnormalities but no interference on employment |
3 | Gait abnormalities that prevent full time employment |
4 | Unable to walk without assistance |
5 | Wheelchair bound or bedbound |
Table 2. Change in Nurick According to Threshold of Duration of Symptoms
| <12 months | >12 months | <24 months | >24 months | Total |
Number | 58 | 67 | 85 | 40 | 125 |
Preoperative (SD) | 2.54 (1.22) | 2.70 (1.11) | 2.56 (1.19) | 2.75 (1.09) | 2.61 (1.16) |
Change (SD) | 1.59 (1.12) | 1.17 (1.11) | 1.54 (1.21) | 0.98 (0.87) | 1.36 (1.13) |
Abbreviation: SD, standard deviation.
Table 3. Change in Nurick According to Threshold of Duration of Symptoms, by Age
Age <65 Years | Age >65 Years | |||||||
Months | <12 | >12 | <24 | >24 | <12 | >12 | <24 | >24 |
Number | 49 | 48 | 69 | 28 | 9 | 19 | 16 | 12 |
Preoperative (SD) | 2.53 (1.17) | 2.5 (1.11) | 2.49 (1.17) | 2.57 (1.07) | 2.56 (1.51) | 3.2 (1.03) | 2.88 (1.31) | 3.16 (1.11) |
Change (SD) | 1.61 (1.15) | 1.04 (1.11) | 1.51 (1.22) | 0.89 (0.88) | 1.44 (1.01) | 1.53 (1.12) | 1.69 (1.2) | 1.25 (0.87) |
Abbreviation: SD, standard deviation.
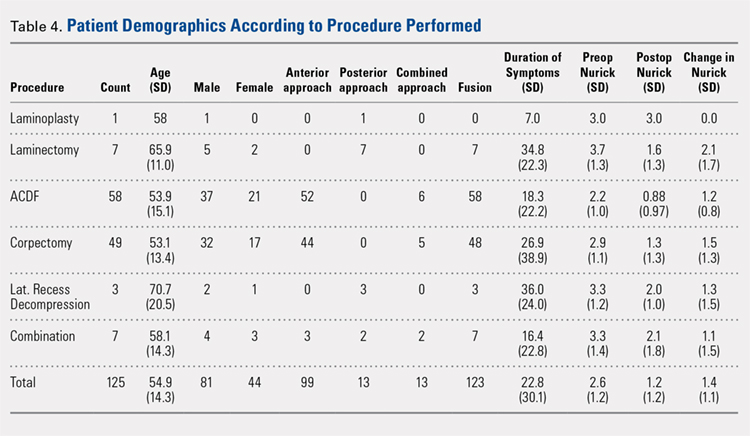
Abbreviations: ACDF, anterior cervical discectomy and fusion; SD, standard deviation.
Continue to: Simple regression analysis of data...
Simple regression analysis of data of all patients revealed a statistically significant negative relationship between duration of symptoms and postoperative change in Nurick score (P = .044). There was no relationship between duration of symptoms and preoperative Nurick score (P = .482). When stratified according to duration of preoperative symptoms by 12 or 24 months, the relationship between duration of symptoms and change in Nurick score was statistically significant for cutoffs of 12 months (P = .03) and 24 months (P = .007). There was no relationship between duration of symptoms and preoperative Nurick score for any threshold of preoperative symptom duration. When these results were stratified according to age, patients aged ≤65 years showed a statistically significant association between duration of preoperative symptoms and change in Nurick score for cutoffs of 12 months (P = .016) and 24 months (P = .019). However, patients aged >65 years did not show a statistically significant association for cutoffs of 12 or 24 months (P = .85 and .29, respectively). There was also no relationship between duration of symptoms and preoperative Nurick score for any threshold of preoperative symptom duration in either age cohort.
Multiple regression analysis of the previously described findings was undertaken to assess the influence of potential confounding variables. These included age, gender, diabetes, cocaine use, alcohol use, tobacco use, signal change on preoperative MRI, severity of myelopathy, total levels fused, prior surgery, surgical approach (anterior vs posterior), and procedure performed (Table 4). Analysis of the relationship between duration of symptoms and change in Nurick score for all patients initially revealed a statistically nonsignificant correlation (P = .22). Significant factors in this model included diabetes status and tobacco use that correlated with decreasing change in Nurick score (P = .02 and .0001, respectively) and severity of myelopathy that correlated with increasing change in Nurick score (P = .0002). Notably, combined procedures also correlated with decreasing change in Nurick score (P = .03), but the performance of individual procedures did not correlate with change in Nurick score. There was no association between duration of symptoms and preoperative Nurick score (P = .76). When stratified according to duration of symptoms of 12 or 24 months, only 24 months was found to be statistically significant (P = .03). There was no relationship between duration of symptoms and preoperative Nurick score for any threshold of symptom duration. When further stratified according to age, the younger cohort did not show a statistically significant association between duration of preoperative symptoms and change in Nurick score for either threshold of symptom duration (P = .15 and .43, respectively). Diabetes status, tobacco use, number of levels fused, severity of myelopathy, and combined procedures remained significant predictors of change in Nurick score for both thresholds of symptom duration. In contrast, the older cohort showed a statistically significant association between duration of symptoms and postoperative change in Nurick score only for a threshold of 24 months (P = .01). In contrast to the younger cohort, the only other significant predictors in this group were preoperative severity of myelopathy, anterior approach (all ACDF procedures), and signal change on preoperative MRI (P = .02, .04, and .03, respectively). There was no relationship between duration of symptoms and preoperative Nurick score for any threshold of preoperative symptom duration in either age cohort.
DISCUSSION
Several studies have attempted to describe the prognostic influence of preoperative symptom duration on surgical outcomes for CSM. Few studies suggest that duration of symptoms does not correlate with functional outcomes. For example, Naderi and colleagues6 concluded in a retrospective study of 27 patients that there is no correlation as assessed by the modified Japanese Orthopedic Association scale. Handa and colleagues5 similarly concluded in a retrospective study of 61 patients that duration of symptoms was not significant, but only in patients aged <70 years. Furlan and colleagues7 conducted a prospective study of 81 patients with a mean follow-up of 10 months and concluded that there is no association as assessed using the modified Japanese Orthopedic Association (mJOA) and Nurick score. In contrast, the majority of studies support the notion that duration of symptoms adversely affects outcomes. Several of these studies do not provide a clear cutoff beyond which outcomes are significantly affected.17-19,22
Of the studies that provide a cutoff, a fair number of studies suggest a limit of 12 months and a few suggest 24 months. In a retrospective study of 109 patients with cervical radiculopathy and 55 with cervical myelopathy, Bertalanffy and Eggert8 found that duration of symptoms beyond 12 months significantly correlated with worse outcomes as assessed by the evaluation criteria set forth by Roosen and Grote.23 Using the more common European Myelopathy Score, Heidecke and colleagues9 arrived at the same conclusion from a retrospective review of 106 patients. In a large retrospective review of 248 patients, Pumberger and colleagues11 found that patients who did not improve following surgical decompression for CSM, where improvement was defined as a reduction of at least 1 Nurick grade, had an average of 17.85 months of preoperative symptoms, whereas those who did improve had symptoms for an average of 11.21 months. In a prospective study of 98 patients, Suzuki and colleagues10 found that recovery rate of the JOA scale was significantly decreased in those with >1 year of preoperative symptoms. Both Chagas and colleagues14 and Suri and colleagues13 conducted prospective studies that revealed a significant difference in Nurick score improvement in patients with >2 years of symptoms. In reviews of the literature, both Holly and colleagues15 and Yoon and colleagues16 found a low level of evidence for the significance of symptom duration on outcomes. Similarly, Tetreault and colleagues24 found that duration of symptoms was predictive of outcomes as assessed by both mJOA and Nurick score.
Continue to: Our results in all patients showed...
Our results in all patients showed a clear difference in outcomes at the 12-month cutoff as revealed by the simple regression and a trend that reached significance at the 24-month cutoff as assessed by the multiple regression. These results are consistent with those discussed, especially those that specifically used the Nurick score. We further showed that the influence of duration of symptoms on outcomes is dependent on age. Our simple regression analysis suggested that this dependence was evident for symptom durations of 12 and 24 months only in the younger cohort. However, our multiple regression analysis showed that the effect of symptom duration on outcomes is evident only in patients aged >65 years who have had symptoms for 24 months. The stark difference in results between the simple and multiple regressions is probably due to the several potentially confounding variables that were controlled for in the multiple regression analysis. Of course, it should be noted that a statistically nonsignificant difference does not necessarily translate into a clinically nonsignificant difference.
Our results are consistent with the few studies that describe the influence of the interplay between age and duration of symptoms on postoperative outcomes in CSM. For example, Handa and colleagues5 retrospectively reviewed 61 patients who underwent expansive laminoplasty for CSM and stratified them according to age greater or less than 70 years. Compared with the younger patients, duration of symptoms in the 22 elderly patients correlated with a significant difference in outcomes as assessed by the mJOA, with a cutoff of 1 year.5 Similarly, Yamazaki and colleagues19 evaluated 64 patients who also underwent expansive laminoplasty for CSM and stratified them according to age greater or less than 65 years. Duration of symptoms in 35 elderly patients significantly correlated with outcomes as assessed by the JOA scale, such that those considered to have an excellent outcome had a mean duration of symptoms of 11.1 months compared to the 39 months of symptoms in those considered to have a fair outcome.19 In contrast to those studies, we found that 24 months rather than 12 months was significant. However, we also evaluated outcomes using the Nurick score rather than the JOA. The JOA is a more detailed instrument, and this may be the reason for the discrepancy. Nonetheless, our results are consistent with the extant literature and add to the limited number of studies that have commented on the combined interactions of symptom duration and age in postoperative outcomes for CSM.
There are several strengths and limitations to this study. One strength is the relatively large sample size of patients. However, there was an uneven distribution in the number of patients in each age cohort. Ideally, there would have been an equal number of patients in each age group. The fact that all patients were operated on by the same surgeon minimizes variability in outcomes due to surgeon skill. We also controlled for multiple variables that are known to affect CSM outcomes, but we did not have quantitative data with respect to degree of compression or cross-sectional area of the affected spinal cord, which have been described as significant variables in outcomes of CSM. Furthermore, we did not evaluate the results using several outcome measures such as the JOA in addition to the Nurick score, and this limits the comparability of our work to some of the existing literature. This study also suffers from the inherent biases and shortcomings of retrospective studies, and the fact that this was not a multicenter study may limit generalizability of the results. However, given the dearth of literature on this topic, our work adds to the literature. Further studies will be needed to more clearly elucidate this topic.
CONCLUSION
This study demonstrated that duration of symptoms may be a significant factor in the recovery of patients undergoing surgical decompression for CSM, but only in patients aged >65 years who have had symptoms for 24 months.
This paper will be judged for the Resident Writer’s Award.
1. Baptiste DC, Fehlings MG. Pathophysiology of cervical myelopathy. Spine J. 2006;6(6 Suppl.):190S-197S. doi:10.1016/j.spinee.2006.04.024.
2. Emery S. Cervical spondylotic myelopathy: diagnosis and treatment. J Am Acad Orthop Surg. 2001;9(6):376-688.
3. Matz PG, Anderson PA, Holly LT, et al. The natural history of cervical spondylotic myelopathy. J Neurosurg Spine. 2009;11(2):104-111. doi:10.3171/2009.1.SPINE08716.
4. Tracy JA, Bartleson JD. Cervical spondylotic myelopathy. Neurologist. 2010;16(3):176-187 doi:10.1097/NRL.0b013e3181da3a29.
5. Handa Y, Kubota T, Ishii H, Sato K, Tsuchida A, Arai Y. Evaluation of prognostic factors and clinical outcome in elderly patients in whom expansive laminoplasty is performed for cervical myelopathy due to multisegmental spondylotic canal stenosis. A retrospective comparison with younger patients. J Neurosurg. 2002;96(2):173-179. doi:10.3171/spi.2002.96.2.0173.
6. Naderi S, Ozgen S, Pamir MN, Ozek MM, Erzen C. Cervical spondylotic myelopathy: surgical results and factors affecting prognosis. Neurosurgery. 1998;43(1):43-49.
7. Furlan JC, Kalsi-Ryan S, Kailaya-Vasan A, Massicotte EM, Fehlings MG. Functional and clinical outcomes following surgical treatment in patients with cervical spondylotic myelopathy: a prospective study of 81 cases. J Neurosurg Spine. 2011;14(3):348-355. doi:10.3171/2010.10.SPINE091029.
8. Bertalanffy H, Eggert HR. Clinical long-term results of anterior discectomy Without fusion for treatment of cervical radiculopathy and myelopathy. Acta Neurochir. 1988;90(3-4):127-135. doi:10.1007/BF01560567.
9. Heidecke V, Rainov NG, Marx T, Burkert W. Outcome in Cloward anterior fusion for degenerative cervical spinal disease. Acta Neurochir (Wien). 2000;142(3):283-291.
10. Suzuki A, Misawa H, Simogata M, Tsutsumimoto T, Takaoka K, Nakamura H. Recovery process following cervical laminoplasty in patients with cervical compression myelopathy: prospective cohort study. Spine (Phila Pa 1976). 2009;34(26):2874-2879. doi:10.1097/BRS.0b013e3181bb0e33.
11. Pumberger M, Froemel D, Aichmair A, et al. Clinical predictors of surgical outcome in cervical spondylotic myelopathy: an analysis of 248 patients. Bone Joint J. 2013;95B(7):966-971. doi:10.1302/0301-620X.95B7.31363.
12. Saunders RL, Bernini PM, Shirreffs TG Jr, Reeves AG. Central corpectomy for cervical spondylotic myelopathy: A consecutive series with long-term follow-up evaluation. J Neurosurg. 1991;74(2):163-170. doi:10.3171/jns.1991.74.2.0163.
13. Suri A, Chabbra RP, Mehta VS, Gaikwad S, Pandey RM. Effect of intramedullary signal changes on the surgical outcome of patients with cervical spondylotic myelopathy. Spine J. 2003;3(1):33-45. doi:10.1016/S1529-9430(02)00448-5.
14. Chagas H, Domingues F, Aversa A, Vidal Fonseca AL, de Souza JM. Cervical spondylotic myelopathy: 10 years of prospective outcome analysis of anterior decompression and fusion. Surg Neurol. 2005;64 Suppl 1:S1:30-35; discussion:S1:35-36.
15. Holly LT, Matz PG, Anderson PA, et al. Clinical prognostic indicators of surgical outcome in cervical spondylotic myelopathy. J Neurosurg Spine. 2009;11(2):112-118. doi:10.3171/2009.1.SPINE08718.
16. Yoon ST, Raich A, Hashimoto RE, et al. Predictive factors affecting outcome after cervical laminoplasty. Spine (Phila Pa 1976). 2013;38(22 Suppl 1):S232-S252. doi:10.1097/BRS.0b013e3182a7eb55.
17. Ebersold M, Pare M, Quast LM. Surgical treatment for cervical spondylotic myelopathy. J Neurosurg. 1995;82(5):745-751. doi:10.3171/jns.1995.82.5.0745.
18. Tetreault LA, Kopjar B, Vaccaro A, et al. A clinical prediction model to determine outcomes in patients with cervical spondylotic myelopathy undergoing surgical treatment: data from the prospective, multi-center AOSpine North America study. J Bone Joint Surg Am. 2013;95(18):1659-1666. doi:10.2106/JBJS.L.01323.
19. Yamazaki T, Yanaka K, Sato H, Uemura K, Tsukada A, Nose T. Cervical spondylotic myelopathy: surgical results and factors affecting outcome with special reference to age differences. Neurosurgery. 2003;52(1):122-126.
20. Lee TT, Manzano GR, Green BA. Modified open-door cervical expansive laminoplasty for spondylotic myelopathy: operative technique, outcome, and predictors for gait improvement. J Neurosurg. 1997;86(1):64-68. doi:10.3171/jns.1997.86.1.0064.
21. Karpova A, Arun R, Davis AM, et al. Predictors of surgical outcome in cervical spondylotic myelopathy. Spine (Phila Pa 1976). 2013;38(5):392-400. doi:10.1097/BRS.0b013e3182715bc3.
22. Fujiwara K, Ebara YK, S, Ono K. The prognosis of surgery for cervical compression myelopathy. J Bone Joint Surg Br. 1989;71(3):393-398.
23. Roosen K, Grote W. Late results of operative treatment of cervical myelopathy. In: Grote W, Brock M, Clar HE, Klinger M, Nau HE, eds. Surgery of Cervical Myelopathy. Advances in Neurosurgery, vol 8. Heidelberg, Berlin: Springer; 1980:69-77.
24. Tetreault LA, Karpova A, Fehlings MG. Predictors of outcome in patients with degenerative cervical spondylotic myelopathy undergoing surgical treatment: results of a systematic review. Eur Spine J. 2015;24 Suppl 2:236-251. doi:10.1007/s00586-013-2658-z.
ABSTRACT
Cervical myelopathy is the most common cause of acquired spinal cord dysfunction in people aged >55 years. Advanced age and duration of symptoms have been implicated in the literature as negative prognostic indicators for postoperative functional improvement, but very few studies have evaluated the interaction of these factors. We retrospectively reviewed 125 patients who underwent surgery for cervical myelopathy. Patients were stratified according to age greater or less than 65 years and duration of symptoms of greater or less than 12 and 24 months. Functional outcomes were assessed using the Nurick score. Simple regression and multiple regression analyses were done, controlling for sex, preoperative Nurick score, surgical approach, smoking status, diabetes status, prior surgery, number of levels fused, ethanol use, and signal change on preoperative magnetic resonance imaging. The average change in Nurick score in all patients was 1.36, with a significant difference between patients with symptoms for <24 months and those with symptoms for >24 months (1.54 vs 0.98, P = .03). Multiple regression analysis revealed that older patients had a significant difference at 24 months (1.69 vs 1.25, P = .01), whereas younger patients showed slightly lower improvement overall and a change in Nurick score at both thresholds that was statistically nonsignificant.
Continue to: Cervical spondylotic myelopathy...
Cervical spondylotic myelopathy (CSM) is the most common acquired cause of spinal cord dysfunction in people aged >55 years.1 It is a slowly progressive disorder usually caused by spinal cord compression and ischemia due to age-related changes in the spine and is characterized by neck pain, radicular arm pain, paresthesia, weakness, lower extremity hyperreflexia, and gait and balance abnormalities and may also present with bowel and bladder dysfunction. The majority of cases progress in a stepwise manner, but about 5% of cases decline rapidly, and the prognosis of nonoperative treatment is poor once the patient is truly myelopathic. The objective of surgery is to decompress the spinal cord before permanent damage has set in.2-4
Several studies have attempted to describe the prognostic significance of duration of symptoms in surgical decompression of CSM. Some studies have found that there is no association with outcomes,5-7 but most of the studies have concluded that there is an association. Several of these studies specify that duration of symptoms is significant beyond particular time points, typically of 12 months8-12 or 24 months.13,14 At least 2 review studies have found low evidence for the influence of symptom duration on postoperative outcomes.15,16
Age has also been cited as an important prognostic factor in surgical decompression of CSM by some of these same studies. Only a few studies have concluded that age itself does not affect outcomes.17-19 However, most of the studies conclude that advanced age is a significant factor. Most of these cite a cutoff of 60 years of age,14,20 65 years of age,21 or 70 years of age,10 but at least 1 study has cited a cutoff as young as 40 years of age,9 and at least 1 other has cited 50 years of age.8
Most of the available literature has evaluated the effects of age and duration of symptoms separately. However, at least 2 studies have discussed the interplay between these variables, and both found that outcomes are associated with duration of symptoms only in the elderly, defined as above either 65 or 70 years of age.5,19 This study is an attempt to clarify this relationship.
Continue to: MATERIALS AND METHODS...
MATERIALS AND METHODS
Institutional Review Board approval was obtained for this study. Informed consent was waived due to the retrospective nature of the work. The medical records of 212 patients who underwent surgery for CSM by the senior author were reviewed. All surgeries were performed at the University Hospital or the Veterans Administration (VA) between March 2005 and July 2012. CSM was diagnosed by magnetic resonance imaging (MRI) and based on the presence of upper motor signs, clonus, gait abnormalities, or difficulty with fine motor movements such as buttoning a shirt. Nurick score (Table 1) was assessed at presentation and at follow-up, and was the only outcome measure recorded in this cohort. Inclusion criteria were the diagnosis of CSM with a Nurick score, surgical intervention, and at least 2 years of follow-up. Age at presentation, sex, preoperative Nurick score, postoperative Nurick score, duration of symptoms preoperatively, duration of follow-up, procedure performed, approach (anterior vs posterior vs anterior and posterior), prior surgery, number of levels fused, diabetes status, cocaine use, ethanol use, tobacco use, signal change on preoperative MRI, and whether the patient belonged to the VA were recorded. Posterior cervical surgery was performed in patients who had ossification of the posterior longitudinal ligament, had multiple prior anterior cervical procedures, or had involvement of 3 or more levels with anatomy that would make an extensive exposure difficult. Surgeries were performed anteriorly for cases of 1- or 2-level stenosis in the absence of ossification of the posterior longitudinal ligament.
Anterior surgery was also considered in patients with 3-level disease who did not have anatomy that precluded a more extensive exposure.
Patients were stratified according to duration of symptoms by cutoffs of 12 or 24 months and according to age <65 years or >65 years. The age cutoff was chosen because this was the youngest cohort in which stratification revealed a significant difference in change in the Nurick score according to duration of symptoms, and because this age is consistent with the literature. Data were blinded, and outcomes according to duration of symptoms and age were analyzed. The analysis was conducted using simple linear regression and multiple regression.
SURGICAL TECHNIQUE
Patients were evaluated through a complete neurological examination and Nurick scores preoperatively and postoperatively at 6 weeks, 3 months, 6 months, 1 year, and annually thereafter. Decompression procedures performed included single or multilevel corpectomy, anterior decompression with strut grafting and instrumentation, posterior cervical laminoplasty, and posterior cervical laminectomy and fusion. Patients were placed in a Miami J collar (Össur) postoperatively and sent to physical and occupational therapy when able. All procedures were performed by the senior author with the assistance of residents and fellows.
RESULTS
Of the 125 patients who met all the inclusion criteria, 44 were females and 81 were males. The average follow-up duration was 30.9 months (standard deviation [SD], 13.23). The average age of all patients was 55.2 years (range, 27-89 years), and there was no difference in age according to gender (55.0 years for females vs 55.2 years for males). The average preoperative Nurick score was 2.61 (SD, 1.16), and there was no difference in preoperative Nurick score according to cutoff of duration of symptoms. Males had a higher preoperative Nurick score than females (2.73 vs 2.41, P = .12) and a longer but statistically nonsignificant duration of symptoms (25.7 vs 16.9 months, P = .1). There were 97 patients aged ≤65 years (average, 49.6 years) and 28 patients aged >65 years (average, 73.7 years). The younger cohort had a lower preoperative Nurick score than the older cohort, but this difference was not statistically significant (2.52 vs 3.0, P = .06). The younger cohort also had a longer duration of symptoms, but this difference was not significant (21.8 vs 26.2 months, P > .1). The initial analysis of the change in Nurick score in all patients according to duration of symptoms revealed an average change of 1.36 points (SD, 1.13) and a difference in postoperative change in Nurick score for the duration of symptom cutoffs of 12 and 24 months. This pattern was also present when patients were stratified according to age (Tables 2 and 3). The most common procedures performed were anterior cervical discectomy and fusion (ACDF) (58) and corpectomy (49). Data according to the procedure performed are recorded in Table 4. No significant complications were recorded. Simple regression and multiple regression analyses were undertaken to further evaluate these relationships.
Table 1. Nurick Score
0 | Signs or symptoms of nerve root involvement by no signs or symptoms of spinal cord involvement |
1 | Signs of spinal cord compression but no gait abnormalities |
2 | Gait abnormalities but no interference on employment |
3 | Gait abnormalities that prevent full time employment |
4 | Unable to walk without assistance |
5 | Wheelchair bound or bedbound |
Table 2. Change in Nurick According to Threshold of Duration of Symptoms
| <12 months | >12 months | <24 months | >24 months | Total |
Number | 58 | 67 | 85 | 40 | 125 |
Preoperative (SD) | 2.54 (1.22) | 2.70 (1.11) | 2.56 (1.19) | 2.75 (1.09) | 2.61 (1.16) |
Change (SD) | 1.59 (1.12) | 1.17 (1.11) | 1.54 (1.21) | 0.98 (0.87) | 1.36 (1.13) |
Abbreviation: SD, standard deviation.
Table 3. Change in Nurick According to Threshold of Duration of Symptoms, by Age
Age <65 Years | Age >65 Years | |||||||
Months | <12 | >12 | <24 | >24 | <12 | >12 | <24 | >24 |
Number | 49 | 48 | 69 | 28 | 9 | 19 | 16 | 12 |
Preoperative (SD) | 2.53 (1.17) | 2.5 (1.11) | 2.49 (1.17) | 2.57 (1.07) | 2.56 (1.51) | 3.2 (1.03) | 2.88 (1.31) | 3.16 (1.11) |
Change (SD) | 1.61 (1.15) | 1.04 (1.11) | 1.51 (1.22) | 0.89 (0.88) | 1.44 (1.01) | 1.53 (1.12) | 1.69 (1.2) | 1.25 (0.87) |
Abbreviation: SD, standard deviation.
Abbreviations: ACDF, anterior cervical discectomy and fusion; SD, standard deviation.
Continue to: Simple regression analysis of data...
Simple regression analysis of data of all patients revealed a statistically significant negative relationship between duration of symptoms and postoperative change in Nurick score (P = .044). There was no relationship between duration of symptoms and preoperative Nurick score (P = .482). When stratified according to duration of preoperative symptoms by 12 or 24 months, the relationship between duration of symptoms and change in Nurick score was statistically significant for cutoffs of 12 months (P = .03) and 24 months (P = .007). There was no relationship between duration of symptoms and preoperative Nurick score for any threshold of preoperative symptom duration. When these results were stratified according to age, patients aged ≤65 years showed a statistically significant association between duration of preoperative symptoms and change in Nurick score for cutoffs of 12 months (P = .016) and 24 months (P = .019). However, patients aged >65 years did not show a statistically significant association for cutoffs of 12 or 24 months (P = .85 and .29, respectively). There was also no relationship between duration of symptoms and preoperative Nurick score for any threshold of preoperative symptom duration in either age cohort.
Multiple regression analysis of the previously described findings was undertaken to assess the influence of potential confounding variables. These included age, gender, diabetes, cocaine use, alcohol use, tobacco use, signal change on preoperative MRI, severity of myelopathy, total levels fused, prior surgery, surgical approach (anterior vs posterior), and procedure performed (Table 4). Analysis of the relationship between duration of symptoms and change in Nurick score for all patients initially revealed a statistically nonsignificant correlation (P = .22). Significant factors in this model included diabetes status and tobacco use that correlated with decreasing change in Nurick score (P = .02 and .0001, respectively) and severity of myelopathy that correlated with increasing change in Nurick score (P = .0002). Notably, combined procedures also correlated with decreasing change in Nurick score (P = .03), but the performance of individual procedures did not correlate with change in Nurick score. There was no association between duration of symptoms and preoperative Nurick score (P = .76). When stratified according to duration of symptoms of 12 or 24 months, only 24 months was found to be statistically significant (P = .03). There was no relationship between duration of symptoms and preoperative Nurick score for any threshold of symptom duration. When further stratified according to age, the younger cohort did not show a statistically significant association between duration of preoperative symptoms and change in Nurick score for either threshold of symptom duration (P = .15 and .43, respectively). Diabetes status, tobacco use, number of levels fused, severity of myelopathy, and combined procedures remained significant predictors of change in Nurick score for both thresholds of symptom duration. In contrast, the older cohort showed a statistically significant association between duration of symptoms and postoperative change in Nurick score only for a threshold of 24 months (P = .01). In contrast to the younger cohort, the only other significant predictors in this group were preoperative severity of myelopathy, anterior approach (all ACDF procedures), and signal change on preoperative MRI (P = .02, .04, and .03, respectively). There was no relationship between duration of symptoms and preoperative Nurick score for any threshold of preoperative symptom duration in either age cohort.
DISCUSSION
Several studies have attempted to describe the prognostic influence of preoperative symptom duration on surgical outcomes for CSM. Few studies suggest that duration of symptoms does not correlate with functional outcomes. For example, Naderi and colleagues6 concluded in a retrospective study of 27 patients that there is no correlation as assessed by the modified Japanese Orthopedic Association scale. Handa and colleagues5 similarly concluded in a retrospective study of 61 patients that duration of symptoms was not significant, but only in patients aged <70 years. Furlan and colleagues7 conducted a prospective study of 81 patients with a mean follow-up of 10 months and concluded that there is no association as assessed using the modified Japanese Orthopedic Association (mJOA) and Nurick score. In contrast, the majority of studies support the notion that duration of symptoms adversely affects outcomes. Several of these studies do not provide a clear cutoff beyond which outcomes are significantly affected.17-19,22
Of the studies that provide a cutoff, a fair number of studies suggest a limit of 12 months and a few suggest 24 months. In a retrospective study of 109 patients with cervical radiculopathy and 55 with cervical myelopathy, Bertalanffy and Eggert8 found that duration of symptoms beyond 12 months significantly correlated with worse outcomes as assessed by the evaluation criteria set forth by Roosen and Grote.23 Using the more common European Myelopathy Score, Heidecke and colleagues9 arrived at the same conclusion from a retrospective review of 106 patients. In a large retrospective review of 248 patients, Pumberger and colleagues11 found that patients who did not improve following surgical decompression for CSM, where improvement was defined as a reduction of at least 1 Nurick grade, had an average of 17.85 months of preoperative symptoms, whereas those who did improve had symptoms for an average of 11.21 months. In a prospective study of 98 patients, Suzuki and colleagues10 found that recovery rate of the JOA scale was significantly decreased in those with >1 year of preoperative symptoms. Both Chagas and colleagues14 and Suri and colleagues13 conducted prospective studies that revealed a significant difference in Nurick score improvement in patients with >2 years of symptoms. In reviews of the literature, both Holly and colleagues15 and Yoon and colleagues16 found a low level of evidence for the significance of symptom duration on outcomes. Similarly, Tetreault and colleagues24 found that duration of symptoms was predictive of outcomes as assessed by both mJOA and Nurick score.
Continue to: Our results in all patients showed...
Our results in all patients showed a clear difference in outcomes at the 12-month cutoff as revealed by the simple regression and a trend that reached significance at the 24-month cutoff as assessed by the multiple regression. These results are consistent with those discussed, especially those that specifically used the Nurick score. We further showed that the influence of duration of symptoms on outcomes is dependent on age. Our simple regression analysis suggested that this dependence was evident for symptom durations of 12 and 24 months only in the younger cohort. However, our multiple regression analysis showed that the effect of symptom duration on outcomes is evident only in patients aged >65 years who have had symptoms for 24 months. The stark difference in results between the simple and multiple regressions is probably due to the several potentially confounding variables that were controlled for in the multiple regression analysis. Of course, it should be noted that a statistically nonsignificant difference does not necessarily translate into a clinically nonsignificant difference.
Our results are consistent with the few studies that describe the influence of the interplay between age and duration of symptoms on postoperative outcomes in CSM. For example, Handa and colleagues5 retrospectively reviewed 61 patients who underwent expansive laminoplasty for CSM and stratified them according to age greater or less than 70 years. Compared with the younger patients, duration of symptoms in the 22 elderly patients correlated with a significant difference in outcomes as assessed by the mJOA, with a cutoff of 1 year.5 Similarly, Yamazaki and colleagues19 evaluated 64 patients who also underwent expansive laminoplasty for CSM and stratified them according to age greater or less than 65 years. Duration of symptoms in 35 elderly patients significantly correlated with outcomes as assessed by the JOA scale, such that those considered to have an excellent outcome had a mean duration of symptoms of 11.1 months compared to the 39 months of symptoms in those considered to have a fair outcome.19 In contrast to those studies, we found that 24 months rather than 12 months was significant. However, we also evaluated outcomes using the Nurick score rather than the JOA. The JOA is a more detailed instrument, and this may be the reason for the discrepancy. Nonetheless, our results are consistent with the extant literature and add to the limited number of studies that have commented on the combined interactions of symptom duration and age in postoperative outcomes for CSM.
There are several strengths and limitations to this study. One strength is the relatively large sample size of patients. However, there was an uneven distribution in the number of patients in each age cohort. Ideally, there would have been an equal number of patients in each age group. The fact that all patients were operated on by the same surgeon minimizes variability in outcomes due to surgeon skill. We also controlled for multiple variables that are known to affect CSM outcomes, but we did not have quantitative data with respect to degree of compression or cross-sectional area of the affected spinal cord, which have been described as significant variables in outcomes of CSM. Furthermore, we did not evaluate the results using several outcome measures such as the JOA in addition to the Nurick score, and this limits the comparability of our work to some of the existing literature. This study also suffers from the inherent biases and shortcomings of retrospective studies, and the fact that this was not a multicenter study may limit generalizability of the results. However, given the dearth of literature on this topic, our work adds to the literature. Further studies will be needed to more clearly elucidate this topic.
CONCLUSION
This study demonstrated that duration of symptoms may be a significant factor in the recovery of patients undergoing surgical decompression for CSM, but only in patients aged >65 years who have had symptoms for 24 months.
This paper will be judged for the Resident Writer’s Award.
1. Baptiste DC, Fehlings MG. Pathophysiology of cervical myelopathy. Spine J. 2006;6(6 Suppl.):190S-197S. doi:10.1016/j.spinee.2006.04.024.
2. Emery S. Cervical spondylotic myelopathy: diagnosis and treatment. J Am Acad Orthop Surg. 2001;9(6):376-688.
3. Matz PG, Anderson PA, Holly LT, et al. The natural history of cervical spondylotic myelopathy. J Neurosurg Spine. 2009;11(2):104-111. doi:10.3171/2009.1.SPINE08716.
4. Tracy JA, Bartleson JD. Cervical spondylotic myelopathy. Neurologist. 2010;16(3):176-187 doi:10.1097/NRL.0b013e3181da3a29.
5. Handa Y, Kubota T, Ishii H, Sato K, Tsuchida A, Arai Y. Evaluation of prognostic factors and clinical outcome in elderly patients in whom expansive laminoplasty is performed for cervical myelopathy due to multisegmental spondylotic canal stenosis. A retrospective comparison with younger patients. J Neurosurg. 2002;96(2):173-179. doi:10.3171/spi.2002.96.2.0173.
6. Naderi S, Ozgen S, Pamir MN, Ozek MM, Erzen C. Cervical spondylotic myelopathy: surgical results and factors affecting prognosis. Neurosurgery. 1998;43(1):43-49.
7. Furlan JC, Kalsi-Ryan S, Kailaya-Vasan A, Massicotte EM, Fehlings MG. Functional and clinical outcomes following surgical treatment in patients with cervical spondylotic myelopathy: a prospective study of 81 cases. J Neurosurg Spine. 2011;14(3):348-355. doi:10.3171/2010.10.SPINE091029.
8. Bertalanffy H, Eggert HR. Clinical long-term results of anterior discectomy Without fusion for treatment of cervical radiculopathy and myelopathy. Acta Neurochir. 1988;90(3-4):127-135. doi:10.1007/BF01560567.
9. Heidecke V, Rainov NG, Marx T, Burkert W. Outcome in Cloward anterior fusion for degenerative cervical spinal disease. Acta Neurochir (Wien). 2000;142(3):283-291.
10. Suzuki A, Misawa H, Simogata M, Tsutsumimoto T, Takaoka K, Nakamura H. Recovery process following cervical laminoplasty in patients with cervical compression myelopathy: prospective cohort study. Spine (Phila Pa 1976). 2009;34(26):2874-2879. doi:10.1097/BRS.0b013e3181bb0e33.
11. Pumberger M, Froemel D, Aichmair A, et al. Clinical predictors of surgical outcome in cervical spondylotic myelopathy: an analysis of 248 patients. Bone Joint J. 2013;95B(7):966-971. doi:10.1302/0301-620X.95B7.31363.
12. Saunders RL, Bernini PM, Shirreffs TG Jr, Reeves AG. Central corpectomy for cervical spondylotic myelopathy: A consecutive series with long-term follow-up evaluation. J Neurosurg. 1991;74(2):163-170. doi:10.3171/jns.1991.74.2.0163.
13. Suri A, Chabbra RP, Mehta VS, Gaikwad S, Pandey RM. Effect of intramedullary signal changes on the surgical outcome of patients with cervical spondylotic myelopathy. Spine J. 2003;3(1):33-45. doi:10.1016/S1529-9430(02)00448-5.
14. Chagas H, Domingues F, Aversa A, Vidal Fonseca AL, de Souza JM. Cervical spondylotic myelopathy: 10 years of prospective outcome analysis of anterior decompression and fusion. Surg Neurol. 2005;64 Suppl 1:S1:30-35; discussion:S1:35-36.
15. Holly LT, Matz PG, Anderson PA, et al. Clinical prognostic indicators of surgical outcome in cervical spondylotic myelopathy. J Neurosurg Spine. 2009;11(2):112-118. doi:10.3171/2009.1.SPINE08718.
16. Yoon ST, Raich A, Hashimoto RE, et al. Predictive factors affecting outcome after cervical laminoplasty. Spine (Phila Pa 1976). 2013;38(22 Suppl 1):S232-S252. doi:10.1097/BRS.0b013e3182a7eb55.
17. Ebersold M, Pare M, Quast LM. Surgical treatment for cervical spondylotic myelopathy. J Neurosurg. 1995;82(5):745-751. doi:10.3171/jns.1995.82.5.0745.
18. Tetreault LA, Kopjar B, Vaccaro A, et al. A clinical prediction model to determine outcomes in patients with cervical spondylotic myelopathy undergoing surgical treatment: data from the prospective, multi-center AOSpine North America study. J Bone Joint Surg Am. 2013;95(18):1659-1666. doi:10.2106/JBJS.L.01323.
19. Yamazaki T, Yanaka K, Sato H, Uemura K, Tsukada A, Nose T. Cervical spondylotic myelopathy: surgical results and factors affecting outcome with special reference to age differences. Neurosurgery. 2003;52(1):122-126.
20. Lee TT, Manzano GR, Green BA. Modified open-door cervical expansive laminoplasty for spondylotic myelopathy: operative technique, outcome, and predictors for gait improvement. J Neurosurg. 1997;86(1):64-68. doi:10.3171/jns.1997.86.1.0064.
21. Karpova A, Arun R, Davis AM, et al. Predictors of surgical outcome in cervical spondylotic myelopathy. Spine (Phila Pa 1976). 2013;38(5):392-400. doi:10.1097/BRS.0b013e3182715bc3.
22. Fujiwara K, Ebara YK, S, Ono K. The prognosis of surgery for cervical compression myelopathy. J Bone Joint Surg Br. 1989;71(3):393-398.
23. Roosen K, Grote W. Late results of operative treatment of cervical myelopathy. In: Grote W, Brock M, Clar HE, Klinger M, Nau HE, eds. Surgery of Cervical Myelopathy. Advances in Neurosurgery, vol 8. Heidelberg, Berlin: Springer; 1980:69-77.
24. Tetreault LA, Karpova A, Fehlings MG. Predictors of outcome in patients with degenerative cervical spondylotic myelopathy undergoing surgical treatment: results of a systematic review. Eur Spine J. 2015;24 Suppl 2:236-251. doi:10.1007/s00586-013-2658-z.
TAKE-HOME POINTS
- Decompression of cervical myelopathy within 24 months of symptom onset results in greater functional improvement compared to delayed decompression.
- The improvement with respect to time is more significant for patients older than 65 years compared to younger patients.
- Duration of symptoms does not seem to influence the severity of the preoperative Nurick score.
- Preoperative severity of symptoms is related to postoperative outcomes.
- Other significant predictors of worse outcomes include tobacco use, diabetes, and number of levels fused.