User login
Optimize HF meds rapidly and fully after hospital discharge: STRONG-HF
CHICAGO – Clinicians who prescribe heart failure meds are holding the best hand they’ve ever had, but with so much underuse and suboptimal dosing in actual practice, it seems many may not appreciate the value of their cards. But a major randomized trial that has captured the field’s attention may embolden them to go all in.
Results showed that a strategy of early, rapid up-titration of multiple guideline-directed meds in patients hospitalized with heart failure, compared with a usual-care approach, cut their 6-month risk for death or HF readmission by a steep 34% (P = .002).
The drugs had been started and partly up-titrated in the hospital with the goal of full up-titration within 2 weeks after discharge.
Patients well tolerated the high-intensity approach, researchers said. Their quality-of-life scores improved (P < .0001) compared with the usual-care group, and adverse events were considered few and manageable in the international trial with more than 1,000 patients.
Safety on the high-intensity strategy depended on close patient monitoring at frequently planned clinic visits along with guidance for the up-titrations from clinical signs and natriuretic peptide levels, observed Alexandre Mebazaa, MD, PhD, University of Paris and Public Hospitals of Paris.
Dr. Mebazaa is principal investigator on the trial, called STRONG-HF, which he presented at the American Heart Association scientific sessions, held in Chicago and virtually. He is also lead author on the study’s same-day publication in the Lancet.
The high-intensity strategy’s superiority emerged early in the trial, which was halted early on the data safety monitoring board’s recommendation, with about 90% of follow-ups completed. The board “felt it was unethical to keep patients in usual care,” Dr. Mebazaa said at a press conference.
A dramatic change
The next step, he said, will be to educate the heart failure community on the high-intensity care technique so it can swiftly enter clinical practice. Currently in acute heart failure, “very few patients are monitored after discharge and treated with full doses of heart failure therapies.”
Adoption of the strategy “would be a dramatic change from what’s currently being done,” said Martin B. Leon, MD, NewYork-Presbyterian/Columbia University Irving Medical Center, New York, who moderated the press conference.
Only an estimated 5% of patients with HF in the United States receive full guideline-directed medical therapy, Dr. Leon said, “so the generalizability of this strategy, with careful follow-up that has safety involved in it, is absolutely crucial.”
But the potential impact of this high-intensity approach on resource use is unknown, raising questions about how widely and consistently it could be implemented, said Dr. Leon, who is not connected with STRONG-HF.
The trial called for in-hospital initiation of the three distinct drug classes that, at the time, were the core of guideline-directed HF therapy, with up-titration to 50% of recommended dosage by hospital discharge, and then to 100% within 2 weeks later.
The meds included a beta-blocker, a mineralocorticoid receptor antagonist (MRA), and a renin-angiotensin system inhibitor (RASI). The latter could be an ACE inhibitor, angiotensin-receptor blocker (ARB), or angiotensin receptor-neprilysin inhibitor (ARNI).
How about a fourth drug?
Conspicuously absent from the list, for contemporary practice, was an SGLT2 inhibitor, a class that entered the HF guidelines well after STRONG-HF was designed. They would undoubtedly join the other three agents were the high-intensity strategy to enter practice, potentially changing its complexity and safety profile.
But Dr. Mebazaa and other experts don’t see that as a big challenge and would expect a smooth transition to a high-intensity approach that also includes the SGLT2 inhibitors.
STRONG-HF was necessary in part because many clinicians have been “reluctant” to take full advantage of three agents that had been the basis of guideline-directed therapy, he told this news organization.
That reluctance stemmed from concerns that beta-blockers might worsen the heart failure, ACE inhibitors could hurt the kidneys, or MRAs might cause hyperkalemia, Dr. Mebazaa said. The STRONG-HF high-intensity regimen, therefore, demanded multiple clinic visits for close follow-up.
But the SGLT2 inhibitors “are known to be rather safe drugs, at least much safer than the three others,” he said. So, it seems unlikely that their addition to a beta-blocker, RASI, and MRA in patients with HF would worsen the risk of adverse events.
John G.F. Cleland, MD, PhD, agrees. With addition of the fourth agent, “You may need to be a little bit more careful with renal function, just in that first couple of weeks,” he told this news organization. “But I think it would be easy to add an SGLT2 inhibitor into this regimen. And in general, there’s no titration with an SGLT2 inhibitor, so they’ll all be on full dose predischarge.”
Given the drugs’ diuretic-like action, moreover, some patients might be able to pull back on their loop diuretics, speculated Dr. Cleland, from the University of Glasgow’s School of Health and Wellbeing.
The prospect of a high-intensity strategy’s wide implementation in practice presents both “challenges and opportunities,” Amanda R. Vest, MBBS, MPH, Tufts University, Boston, told this news organization.
“There may be additional challenges in terms of ensuring we avoid hypotension or acute kidney injury in the up-titration phase,” said Dr. Vest, who is medical director of her center’s cardiac transplantation program but not connected with STRONG-HF.
“But it also gives us opportunities,” she added, “because there are some patients, especially in that vulnerable postdischarge phase, who are actually much more able to tolerate introduction of an SGLT2 inhibitor than, for example, an ACE inhibitor, ARB, or ARNI – or maybe a beta-blocker if they’ve been in a low cardiac-output state.” Effective dosing would depend on “the personalization and skill of the clinician in optimizing the medications in their correct sequence,” Dr. Vest said.
“It’s challenging to think that we would ever get to 100% up-titration,” she added, “and even in this excellent study, they didn’t get to 100%.” But as clinicians gain experience with the high-intensity strategy, especially as the SGLT2 inhibitors are included, “I think we can reasonably expect more progress to be made in these up-titration skills.”
No restrictions on LVEF
The researchers entered 1,078 patients hospitalized with acute HF in 14 countries across Africa, Europe, the Middle East, and South America, and randomly assigned them to the high-intensity management strategy or usual care.
About 60% of the patients were male and 77% were White. There were no entry restrictions based on left ventricular ejection fraction (LVEF), which exceeded 40% in almost a third of cases.
In the high-intensity care group’s 542 patients, the three agents were up-titrated to 50% of the maximum guideline-recommended dosage prior to hospital discharge, and to 100% within 2 weeks after discharge. Symptoms and laboratory biomarkers, including natriuretic peptides, were monitored closely at four planned clinical visits over the following 6 weeks.
The 536 patients assigned to usual care were discharged and managed according to local standards, with their meds handled by their own primary care doctors or cardiologists, the published report notes. They were reevaluated by STRONG-HF clinicians 90 days after discharge.
The number of clinic visits in the first 90 postdischarge days averaged 4.8 in the high-intensity care group and 1.0 for those receiving usual care. Full up-titration was far more likely in the high-intensity care group: 55% vs. 2% for RASI agents, 49% vs. 4% for beta-blockers, and 84% vs. 46% for MRAs.
They also fared significantly better on all measured parameters associated with decongestion, including weight, prevalence of peripheral edema, jugular venous pressure, NYHA functional class, and natriuretic peptide levels, the researchers said.
The primary endpoint of 180-day death from any cause or HF readmission was met by 15.2% of the high-intensity care group and 23.3% of usual-care patients, for an adjusted risk ratio (RR) of 0.66 (95% CI, 0.50-0.86; P = .0021).
Subgroup analyses saw no significant interactions by age, sex, race, geography, or baseline blood pressure, renal function, or LVEF. Patients with higher vs. lower baseline natriuretic peptide levels trend toward better responses to high-intensity care (P = .08)
The COVID effect
The group performed a sensitivity analysis that excluded deaths attributed to COVID-19 in STRONG-HF, which launched prior to the pandemic. The high-intensity strategy’s benefit for the primary endpoint grew, with an adjusted RR of 0.61 (95% CI, 0.46-0.82; P = .0005). There was no corresponding effect on death from any cause (P = .15).
Treatment-related adverse effects in the overall trial were seen in 41.1% of the high-intensity care group and in 29.5% of those assigned to usual care.
The higher rate in the high-intensity care arm “may be related to their higher number of [clinic] visits compared to usual care,” Dr. Mebazaa said. “However, serious adverse events and fatal adverse events were similar in both arms.”
Cardiac failure was the most common adverse event, developing in about 15% in both groups. It was followed by hypotension, hyperkalemia, and renal impairment, according to the published report.
Dr. Cleland cautioned that the risk of adverse events would potentially be higher should the high-intensity strategy become common clinical practice. The median age in STRONG-HF was 63, which is “10-15 years younger, on average, than the population with recently admitted heart failure that we see. There’s no doubt that older people have more multimorbidity.”
STRONG-HF was funded by Roche Diagnostics. Dr. Mebazaa discloses receiving grants from Roche Diagnostics, Abbott Laboratories, 4TEEN4, and Windtree Therapeutics; honoraria for lectures from Roche Diagnostics, Bayer, and Merck, Sharp & Dohme; and consulting for Corteria Pharmaceuticals, S-form Pharma, FIRE-1, Implicity, 4TEEN4, and Adrenomed; and to being a co-inventor on a patent involving combination therapy for patients having acute or persistent dyspnea.
Dr. Vest reports modest relationships with Boehringer Ingelheim, Corvia, and CareDx; and receiving research grants from the American Heart Association and the National Institutes of Health. Dr. Cleland discloses receiving honoraria from Idorsia; and research grants from Vifor Pharma, Medtronic, Bayer, and Bristol-Myers Squibb. Dr. Leon had no disclosures.
A version of this article first appeared on Medscape.com.
AT AHA 2022
Is there a doctor on the plane? Tips for providing in-flight assistance
In most cases, passengers on an airline flight are representative of the general population, which means that anyone could have an emergency at any time.
as determined on the basis of in-flight medical emergencies that resulted in calls to a physician-directed medical communications center, said Amy Faith Ho, MD, MPH of Integrative Emergency Services, Dallas–Fort Worth, in a presentation at the annual meeting of the American College of Emergency Physicians.
The study authors reviewed records of 11,920 in-flight medical emergencies between Jan. 1, 2008, and Oct. 31, 2010. The data showed that physician passengers provided medical assistance in nearly half of in-flight emergencies (48.1%) and that flights were diverted because of the emergency in 7.3% of cases.
The majority of the in-flight emergencies involved syncope or presyncope (37.4% of cases), followed by respiratory symptoms (12.1%) and nausea or vomiting (9.5%), according to the study.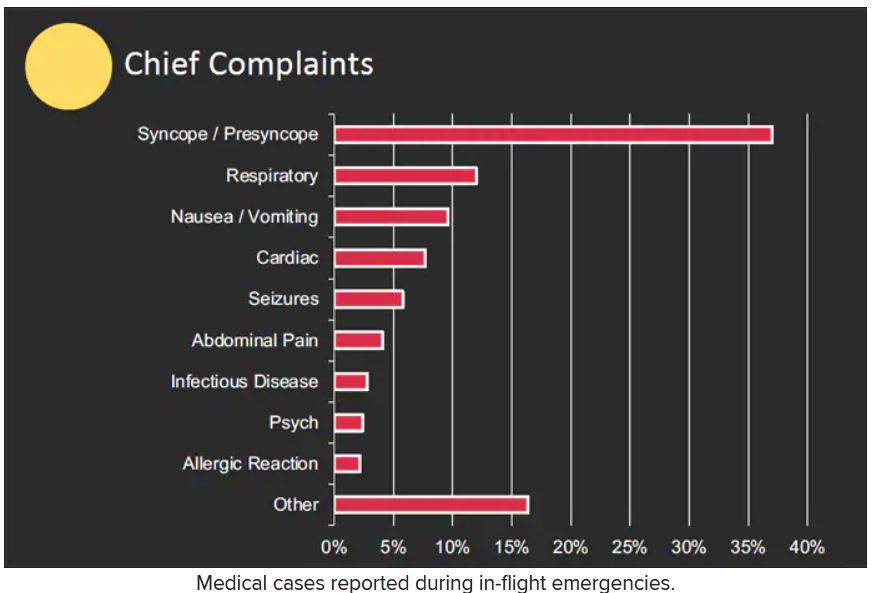
When a physician is faced with an in-flight emergency, the medical team includes the physician himself, medical ground control, and the flight attendants, said Dr. Ho. Requirements may vary among airlines, but all flight attendants will be trained in cardiopulmonary resuscitation (CPR) or basic life support, as well as use of automated external defibrillators (AEDs).
Physician call centers (medical ground control) can provide additional assistance remotely, she said.
The in-flight medical bag
Tools in a physician’s in-flight toolbox start with the first-aid kit. Airplanes also have an emergency medical kit (EMK), an oxygen tank, and an AED.
The minimum EMK contents are mandated by the Federal Aviation Administration, said Dr. Ho. The standard equipment includes a stethoscope, a sphygmomanometer, and three sizes of oropharyngeal airways. Other items include self-inflating manual resuscitation devices and CPR masks in thee sizes, alcohol sponges, gloves, adhesive tape, scissors, a tourniquet, as well as saline solution, needles, syringes, and an intravenous administration set consisting of tubing and two Y connectors.
An EMK also should contain the following medications: nonnarcotic analgesic tablets, antihistamine tablets, an injectable antihistamine, atropine, aspirin tablets, a bronchodilator, and epinephrine (both 1:1000; 1 injectable cc and 1:10,000; two injectable cc). Nitroglycerin tablets and 5 cc of 20 mg/mL injectable cardiac lidocaine are part of the mandated kit as well, according to Dr. Ho.
Some airlines carry additional supplies on all their flights, said Dr. Ho. Notably, American Airlines and British Airways carry EpiPens for adults and children, as well as opioid reversal medication (naloxone) and glucose for managing low blood sugar. American Airlines and Delta stock antiemetics, and Delta also carries naloxone. British Airways is unique in stocking additional cardiac medications, both oral and injectable.
How to handle an in-flight emergency
Physicians should always carry a copy of their medical license when traveling for documentation by the airline if they assist in a medical emergency during a flight, Dr. Ho emphasized. “Staff” personnel should be used. These include the flight attendants, medical ground control, and other passengers who might have useful skills, such as nursing, the ability to perform CPR, or therapy/counseling to calm a frightened patient. If needed, “crowdsource additional supplies from passengers,” such as a glucometer or pulse oximeter.
Legal lessons
Physicians are not obligated to assist during an in-flight medical emergency, said Dr. Ho. Legal jurisdiction can vary. In the United States, a bystander who assists in an emergency is generally protected by Good Samaritan laws; for international airlines, the laws may vary; those where the airline is based usually apply.
The Aviation Medical Assistance Act, passed in 1998, protects individuals from being sued for negligence while providing medical assistance, “unless the individual, while rendering such assistance, is guilty of gross negligence of willful misconduct,” Dr. Ho noted. The Aviation Medical Assistance Act also protects the airline itself “if the carrier in good faith believes that the passenger is a medically qualified individual.”
Dr. Ho disclosed no relevant financial relationships.
A version of this article first appeared on Medscape.com.
FROM ACEP 2022
Which anticoagulant is safest for frail elderly patients with nonvalvular A-fib?
ILLUSTRATIVE CASE
A frail 76-year-old woman with a history of hypertension and hyperlipidemia presents for evaluation of palpitations. An in-office electrocardiogram reveals that the patient is in AF. Her CHA2DS2-VASc score is 4 and her HAS-BLED score is 2.2,3 Using shared decision making, you decide to start medications for her AF. You plan to initiate a beta-blocker for rate control and must now decide on anticoagulation. Which oral anticoagulant would you prescribe for this patient’s AF, given her frail status?
Frailty is defined as a state of vulnerability with a decreased ability to recover from an acute stressful event.4 The prevalence of frailty varies by the measurements used and the population studied. A 2021 meta-analysis found that frailty prevalence ranges from 12% to 24% worldwide in patients older than 50 years5 and may increase to > 30% among those ages 85 years and older.6 Frailty increases rates of AEs such as falls7 and fracture,8 leading to disability,9 decreased quality of life,10 increased utilization of health care,11 and increased mortality.12 A number of validated approaches are available to screen for and measure frailty.13-18
Given the association with negative health outcomes and high health care utilization, frailty is an important clinical factor for physicians to consider when treating elderly patients. Frailty assessment may allow for more tailored treatment choices for patients, with a potential reduction in complications. Although CHA2DS2-VASc and HAS-BLED scores assist in the decision-making process of whether to start anticoagulation, these tools do not take frailty into consideration or guide anticoagulant choice.2,3 The purpose of this study was to analyze how levels of frailty affect the association of 3 different direct oral anticoagulants (DOACs) vs warfarin with various AEs (death, stroke, or major bleeding).
STUDY SUMMARY
This DOAC rose above the others
This retrospective cohort study compared the safety of 3 DOACs—dabigatran, rivaroxaban, and apixaban—vs warfarin in Medicare beneficiaries with AF, using 1:1 propensity score (PS)–matched analysis. Eligible patients were ages 65 years or older, with a filled prescription for a DOAC or warfarin, no prior oral anticoagulant exposure in the previous 183 days, a diagnostic code of AF, and continuous enrollment in Medicare Parts A, B, and D only. Patients were excluded if they had missing demographic data, received hospice care, resided in a nursing facility at drug initiation, had another indication for anticoagulation, or had a contraindication to either a DOAC or warfarin.
Frailty was measured using a claims-based frailty index (CFI), which applies health care utilization data to estimate a frailty index, with cut points for nonfrailty, prefrailty, and frailty. The CFI score has 93 claims-based variables, including wheelchairs and durable medical equipment, open wounds, diseases such as chronic obstructive pulmonary disease and ischemic heart disease, and transportation services.15-17 In this study, nonfrailty was defined as a CFI < 0.15, prefrailty as a CFI of 0.15 to 0.24, and frailty as a CFI ≥ 0.25.
The primary outcome—a composite endpoint of death, ischemic stroke, or major bleeding—was measured for each of the DOAC–warfarin cohorts in the overall population and stratified by frailty classification. Patients were followed until the occurrence of a study outcome, Medicare disenrollment, the end of the study period, discontinuation of the index drug (defined as > 5 days), change to a different anticoagulant, admission to a nursing facility, enrollment in hospice, initiation of dialysis, or kidney transplant. The authors conducted a PS-matched analysis to reduce any imbalances in clinical characteristics between the DOAC- and warfarin-treated groups, as well as a sensitivity analysis to assess the strength of the data findings using different assumptions.
The authors created 3 DOAC–warfarin cohorts: dabigatran (n = 81,863) vs warfarin (n = 256,722), rivaroxaban (n = 185,011) vs warfarin (n = 228,028), and apixaban (n = 222,478) vs warfarin (n = 206,031). After PS matching, the mean age in all cohorts was 76 to 77 years, about 50% were female, and 91% were White. The mean HAS-BLED score was 2 and the mean CHA2DS2-VASc score was 4. The mean CFI was 0.19 to 0.20, defined as prefrail. Patients classified as frail were older, more likely to be female, and more likely to have greater comorbidities, higher scores on CHA2DS2-VASc and HAS-BLED, and higher health care utilization.
Continue to: In the dabigatran-warfarin...
In the dabigatran–warfarin cohort (median follow-up, 72 days), the event rate of the composite endpoint per 1000 person-years (PY) was 63.5 for dabigatran and 65.6 for warfarin (hazard ratio [HR] = 0.98; 95% CI, 0.92 to 1.05; rate difference [RD] per 1000 PY = –2.2; 95% CI, –6.5 to 2.1). A lower rate of the composite endpoint was associated with dabigatran than warfarin for the nonfrail subgroup but not the prefrail or frail groups.
In the rivaroxaban–warfarin cohort (median follow-up, 82 days), the composite endpoint rate per 1000 PY was 77.8 for rivaroxaban and 83.7 for warfarin (HR = 0.98; 95% CI, 0.94 to 1.02; RD per 1000 PY = –5.9; 95% CI, –9.4 to –2.4). When stratifying by frailty category, both dabigatran and rivaroxaban were associated with a lower composite endpoint rate than warfarin for the nonfrail population only (HR = 0.81; 95% CI, 0.68 to 0.97, and HR = 0.88; 95% CI, 0.77 to 0.99, respectively).
In the apixaban–warfarin cohort (median follow-up, 84 days), the rate of the composite endpoint per 1000 PY was 60.1 for apixaban and 92.3 for warfarin (HR = 0.68; 95% CI, 0.65 to 0.72; RD per 1000 PY = –32.2; 95% CI, –36.1 to –28.3). The beneficial association for apixaban was present in all frailty categories, with an HR of 0.61 (95% CI, 0.52 to 0.71) for nonfrail patients, 0.66 (95% CI, 0.61 to 0.70) for prefrail patients, and 0.73 (95% CI, 0.67 to 0.80) for frail patients. Apixaban was the only DOAC with a relative reduction in the hazard of death, ischemic stroke, or major bleeding among all frailty groups.
WHAT’S NEW
Only apixaban had lower AE rates vs warfarin across frailty levels
Three DOACs (dabigatran, rivaroxaban, and apixaban) reduced the risk of death, ischemic stroke, or major bleeding compared with warfarin in older adults with AF, but only apixaban was associated with a relative reduction of these adverse outcomes in patients of all frailty classifications.
CAVEATS
Important data but RCTs are needed
The power of this observational study is considerable. However, it remains a retrospective observational study. The authors attempted to account for these limitations and potential confounders by performing a PS-matched analysis and sensitivity analysis; however, these findings should be confirmed with randomized controlled trials.
Continue to: Additionally, the study...
Additionally, the study collected data on each of the DOAC–warfarin cohorts for < 90 days. Trials to address long-term outcomes are warranted.
Finally, there was no control group in comparison with anticoagulation. It is possible that choosing not to use an anticoagulant is the best choice for frail elderly patients.
CHALLENGES TO IMPLEMENTATION
Doctors need a practical frailty scale, patients need an affordable Rx
Frailty is not often considered a measurable trait. The approach used in the study to determine the CFI is not a practical clinical tool. Studies comparing a frailty calculation software application or an easily implementable survey may help bring this clinically impactful information to the hands of primary care physicians. The Clinical Frailty Scale—a brief, 7-point scale based on the physician’s clinical impression of the patient—has been found to correlate with other established frailty measures18 and might be an option for busy clinicians. However, the current study did not utilize this measurement, and the validity of its use by primary care physicians in the outpatient setting requires further study.
In addition, cost may be a barrier for patients younger than 65 years or for those older than 65 years who do not qualify for Medicare or do not have Medicare Part D. The average monthly cost of the DOACs ranges from $560 for dabigatran19 to $600 for rivaroxaban20 and $623 for apixaban.21 As always, the choice of anticoagulant therapy is a clinical judgment and a joint decision of the patient and physician.
1. Kim DH, Pawar A, Gagne JJ, et al. Frailty and clinical outcomes of direct oral anticoagulants versus warfarin in older adults with atrial fibrillation: a cohort study. Ann Intern Med. 2021;174:1214-1223. doi: 10.7326/M20-7141
2. Zhu W, He W, Guo L, et al. The HAS-BLED score for predicting major bleeding risk in anticoagulated patients with atrial fibrillation: a systematic review and meta-analysis. Clin Cardiol. 2015;38:555-561. doi: 10.1002/clc.22435
3. Olesen JB, Lip GYH, Hansen ML, et al. Validation of risk stratification schemes for predicting stroke and thromboembolism in patients with atrial fibrillation: nationwide cohort study. BMJ. 2011;342:d124. doi: 10.1136/bmj.d124
4. Xue QL. The frailty syndrome: definition and natural history. Clin Geriatr Med. 2011;27:1-15. doi: 10.1016/j.cger.2010.08.009
5. O’Caoimh R, Sezgin D, O’Donovan MR, et al. Prevalence of frailty in 62 countries across the world: a systematic review and meta-analysis of population-level studies. Age Ageing. 2021;50:96-104. doi: 10.1093/ageing/afaa219
6. Campitelli MA, Bronskill SE, Hogan DB, et al. The prevalence and health consequences of frailty in a population-based older home care cohort: a comparison of different measures. BMC Geriatr. 2016;16:133. doi: 10.1186/s12877-016-0309-z
7. Kojima G. Frailty as a predictor of future falls among community-dwelling older people: a systematic review and meta-analysis. J Am Med Dir Assoc. 2015;16:1027-1033. doi: 10.1016/j.jamda. 2015.06.018
8. Kojima G. Frailty as a predictor of fractures among community-dwelling older people: a systematic review and meta-analysis. Bone. 2016;90:116-122. doi: 10.1016/j.bone.2016.06.009
9. Kojima G. Quick and simple FRAIL scale predicts incident activities of daily living (ADL) and instrumental ADL (IADL) disabilities: a systematic review and meta-analysis. J Am Med Dir Assoc. 2018;19:1063-1068. doi: 10.1016/j.jamda.2018.07.019
10. Kojima G, Liljas AEM, Iliffe S. Frailty syndrome: implications and challenges for health care policy. Risk Manag Healthc Policy. 2019;12:23-30. doi: 10.2147/RMHP.S168750
11. Roe L, Normand C, Wren MA, et al. The impact of frailty on healthcare utilisation in Ireland: evidence from The Irish Longitudinal Study on Ageing. BMC Geriatr. 2017;17:203. doi: 10.1186/s12877-017-0579-0
12. Hao Q, Zhou L, Dong B, et al. The role of frailty in predicting mortality and readmission in older adults in acute care wards: a prospective study. Sci Rep. 2019;9:1207. doi: 10.1038/s41598-018-38072-7
13. Fried LP, Tangen CM, Walston J, et al; Cardiovascular Health Study Collaborative Research Group. Frailty in older adults: evidence for a phenotype. J Gerontol A Biol Sci Med Sci. 2001;56:M146-M156. doi: 10.1093/gerona/56.3.m146
14. Ryan J, Espinoza S, Ernst ME, et al. Validation of a deficit-accumulation frailty Index in the ASPirin in Reducing Events in the Elderly study and its predictive capacity for disability-free survival. J Gerontol A Biol Sci Med Sci. 2022;77:19-26. doi: 10.1093/gerona/glab225
15. Kim DH, Glynn RJ, Avorn J, et al. Validation of a claims-based frailty index against physical performance and adverse health outcomes in the Health and Retirement Study. J Gerontol A Biol Sci Med Sci. 2019;74:1271-1276. doi: 10.1093/gerona/gly197
16. Kim DH, Schneeweiss S, Glynn RJ, et al. Measuring frailty in Medicare data: development and validation of a claims-based frailty index. J Gerontol A Biol Sci Med Sci. 2018;73:980-987. doi: 10.1093/gerona/glx229
17. Claims-based frailty index. Harvard Dataverse website. 2022. Accessed April 5, 2022. https://dataverse.harvard.edu/dataverse/cfi
18. Rockwood K, Song X, MacKnight C, et al. A global clinical measure of fitness and frailty in elderly people. CMAJ. 2005;173:489-95. doi: 10.1503/cmaj.050051
19. Dabigatran. GoodRx. Accessed September 26, 2022. www.goodrx.com/dabigatran
20. Rivaroxaban. GoodRx. Accessed September 26, 2022. www.goodrx.com/rivaroxaban
21. Apixaban (Eliquis). GoodRx. Accessed September 26, 2022. www.goodrx.com/eliquis
ILLUSTRATIVE CASE
A frail 76-year-old woman with a history of hypertension and hyperlipidemia presents for evaluation of palpitations. An in-office electrocardiogram reveals that the patient is in AF. Her CHA2DS2-VASc score is 4 and her HAS-BLED score is 2.2,3 Using shared decision making, you decide to start medications for her AF. You plan to initiate a beta-blocker for rate control and must now decide on anticoagulation. Which oral anticoagulant would you prescribe for this patient’s AF, given her frail status?
Frailty is defined as a state of vulnerability with a decreased ability to recover from an acute stressful event.4 The prevalence of frailty varies by the measurements used and the population studied. A 2021 meta-analysis found that frailty prevalence ranges from 12% to 24% worldwide in patients older than 50 years5 and may increase to > 30% among those ages 85 years and older.6 Frailty increases rates of AEs such as falls7 and fracture,8 leading to disability,9 decreased quality of life,10 increased utilization of health care,11 and increased mortality.12 A number of validated approaches are available to screen for and measure frailty.13-18
Given the association with negative health outcomes and high health care utilization, frailty is an important clinical factor for physicians to consider when treating elderly patients. Frailty assessment may allow for more tailored treatment choices for patients, with a potential reduction in complications. Although CHA2DS2-VASc and HAS-BLED scores assist in the decision-making process of whether to start anticoagulation, these tools do not take frailty into consideration or guide anticoagulant choice.2,3 The purpose of this study was to analyze how levels of frailty affect the association of 3 different direct oral anticoagulants (DOACs) vs warfarin with various AEs (death, stroke, or major bleeding).
STUDY SUMMARY
This DOAC rose above the others
This retrospective cohort study compared the safety of 3 DOACs—dabigatran, rivaroxaban, and apixaban—vs warfarin in Medicare beneficiaries with AF, using 1:1 propensity score (PS)–matched analysis. Eligible patients were ages 65 years or older, with a filled prescription for a DOAC or warfarin, no prior oral anticoagulant exposure in the previous 183 days, a diagnostic code of AF, and continuous enrollment in Medicare Parts A, B, and D only. Patients were excluded if they had missing demographic data, received hospice care, resided in a nursing facility at drug initiation, had another indication for anticoagulation, or had a contraindication to either a DOAC or warfarin.
Frailty was measured using a claims-based frailty index (CFI), which applies health care utilization data to estimate a frailty index, with cut points for nonfrailty, prefrailty, and frailty. The CFI score has 93 claims-based variables, including wheelchairs and durable medical equipment, open wounds, diseases such as chronic obstructive pulmonary disease and ischemic heart disease, and transportation services.15-17 In this study, nonfrailty was defined as a CFI < 0.15, prefrailty as a CFI of 0.15 to 0.24, and frailty as a CFI ≥ 0.25.
The primary outcome—a composite endpoint of death, ischemic stroke, or major bleeding—was measured for each of the DOAC–warfarin cohorts in the overall population and stratified by frailty classification. Patients were followed until the occurrence of a study outcome, Medicare disenrollment, the end of the study period, discontinuation of the index drug (defined as > 5 days), change to a different anticoagulant, admission to a nursing facility, enrollment in hospice, initiation of dialysis, or kidney transplant. The authors conducted a PS-matched analysis to reduce any imbalances in clinical characteristics between the DOAC- and warfarin-treated groups, as well as a sensitivity analysis to assess the strength of the data findings using different assumptions.
The authors created 3 DOAC–warfarin cohorts: dabigatran (n = 81,863) vs warfarin (n = 256,722), rivaroxaban (n = 185,011) vs warfarin (n = 228,028), and apixaban (n = 222,478) vs warfarin (n = 206,031). After PS matching, the mean age in all cohorts was 76 to 77 years, about 50% were female, and 91% were White. The mean HAS-BLED score was 2 and the mean CHA2DS2-VASc score was 4. The mean CFI was 0.19 to 0.20, defined as prefrail. Patients classified as frail were older, more likely to be female, and more likely to have greater comorbidities, higher scores on CHA2DS2-VASc and HAS-BLED, and higher health care utilization.
Continue to: In the dabigatran-warfarin...
In the dabigatran–warfarin cohort (median follow-up, 72 days), the event rate of the composite endpoint per 1000 person-years (PY) was 63.5 for dabigatran and 65.6 for warfarin (hazard ratio [HR] = 0.98; 95% CI, 0.92 to 1.05; rate difference [RD] per 1000 PY = –2.2; 95% CI, –6.5 to 2.1). A lower rate of the composite endpoint was associated with dabigatran than warfarin for the nonfrail subgroup but not the prefrail or frail groups.
In the rivaroxaban–warfarin cohort (median follow-up, 82 days), the composite endpoint rate per 1000 PY was 77.8 for rivaroxaban and 83.7 for warfarin (HR = 0.98; 95% CI, 0.94 to 1.02; RD per 1000 PY = –5.9; 95% CI, –9.4 to –2.4). When stratifying by frailty category, both dabigatran and rivaroxaban were associated with a lower composite endpoint rate than warfarin for the nonfrail population only (HR = 0.81; 95% CI, 0.68 to 0.97, and HR = 0.88; 95% CI, 0.77 to 0.99, respectively).
In the apixaban–warfarin cohort (median follow-up, 84 days), the rate of the composite endpoint per 1000 PY was 60.1 for apixaban and 92.3 for warfarin (HR = 0.68; 95% CI, 0.65 to 0.72; RD per 1000 PY = –32.2; 95% CI, –36.1 to –28.3). The beneficial association for apixaban was present in all frailty categories, with an HR of 0.61 (95% CI, 0.52 to 0.71) for nonfrail patients, 0.66 (95% CI, 0.61 to 0.70) for prefrail patients, and 0.73 (95% CI, 0.67 to 0.80) for frail patients. Apixaban was the only DOAC with a relative reduction in the hazard of death, ischemic stroke, or major bleeding among all frailty groups.
WHAT’S NEW
Only apixaban had lower AE rates vs warfarin across frailty levels
Three DOACs (dabigatran, rivaroxaban, and apixaban) reduced the risk of death, ischemic stroke, or major bleeding compared with warfarin in older adults with AF, but only apixaban was associated with a relative reduction of these adverse outcomes in patients of all frailty classifications.
CAVEATS
Important data but RCTs are needed
The power of this observational study is considerable. However, it remains a retrospective observational study. The authors attempted to account for these limitations and potential confounders by performing a PS-matched analysis and sensitivity analysis; however, these findings should be confirmed with randomized controlled trials.
Continue to: Additionally, the study...
Additionally, the study collected data on each of the DOAC–warfarin cohorts for < 90 days. Trials to address long-term outcomes are warranted.
Finally, there was no control group in comparison with anticoagulation. It is possible that choosing not to use an anticoagulant is the best choice for frail elderly patients.
CHALLENGES TO IMPLEMENTATION
Doctors need a practical frailty scale, patients need an affordable Rx
Frailty is not often considered a measurable trait. The approach used in the study to determine the CFI is not a practical clinical tool. Studies comparing a frailty calculation software application or an easily implementable survey may help bring this clinically impactful information to the hands of primary care physicians. The Clinical Frailty Scale—a brief, 7-point scale based on the physician’s clinical impression of the patient—has been found to correlate with other established frailty measures18 and might be an option for busy clinicians. However, the current study did not utilize this measurement, and the validity of its use by primary care physicians in the outpatient setting requires further study.
In addition, cost may be a barrier for patients younger than 65 years or for those older than 65 years who do not qualify for Medicare or do not have Medicare Part D. The average monthly cost of the DOACs ranges from $560 for dabigatran19 to $600 for rivaroxaban20 and $623 for apixaban.21 As always, the choice of anticoagulant therapy is a clinical judgment and a joint decision of the patient and physician.
1. Kim DH, Pawar A, Gagne JJ, et al. Frailty and clinical outcomes of direct oral anticoagulants versus warfarin in older adults with atrial fibrillation: a cohort study. Ann Intern Med. 2021;174:1214-1223. doi: 10.7326/M20-7141
2. Zhu W, He W, Guo L, et al. The HAS-BLED score for predicting major bleeding risk in anticoagulated patients with atrial fibrillation: a systematic review and meta-analysis. Clin Cardiol. 2015;38:555-561. doi: 10.1002/clc.22435
3. Olesen JB, Lip GYH, Hansen ML, et al. Validation of risk stratification schemes for predicting stroke and thromboembolism in patients with atrial fibrillation: nationwide cohort study. BMJ. 2011;342:d124. doi: 10.1136/bmj.d124
4. Xue QL. The frailty syndrome: definition and natural history. Clin Geriatr Med. 2011;27:1-15. doi: 10.1016/j.cger.2010.08.009
5. O’Caoimh R, Sezgin D, O’Donovan MR, et al. Prevalence of frailty in 62 countries across the world: a systematic review and meta-analysis of population-level studies. Age Ageing. 2021;50:96-104. doi: 10.1093/ageing/afaa219
6. Campitelli MA, Bronskill SE, Hogan DB, et al. The prevalence and health consequences of frailty in a population-based older home care cohort: a comparison of different measures. BMC Geriatr. 2016;16:133. doi: 10.1186/s12877-016-0309-z
7. Kojima G. Frailty as a predictor of future falls among community-dwelling older people: a systematic review and meta-analysis. J Am Med Dir Assoc. 2015;16:1027-1033. doi: 10.1016/j.jamda. 2015.06.018
8. Kojima G. Frailty as a predictor of fractures among community-dwelling older people: a systematic review and meta-analysis. Bone. 2016;90:116-122. doi: 10.1016/j.bone.2016.06.009
9. Kojima G. Quick and simple FRAIL scale predicts incident activities of daily living (ADL) and instrumental ADL (IADL) disabilities: a systematic review and meta-analysis. J Am Med Dir Assoc. 2018;19:1063-1068. doi: 10.1016/j.jamda.2018.07.019
10. Kojima G, Liljas AEM, Iliffe S. Frailty syndrome: implications and challenges for health care policy. Risk Manag Healthc Policy. 2019;12:23-30. doi: 10.2147/RMHP.S168750
11. Roe L, Normand C, Wren MA, et al. The impact of frailty on healthcare utilisation in Ireland: evidence from The Irish Longitudinal Study on Ageing. BMC Geriatr. 2017;17:203. doi: 10.1186/s12877-017-0579-0
12. Hao Q, Zhou L, Dong B, et al. The role of frailty in predicting mortality and readmission in older adults in acute care wards: a prospective study. Sci Rep. 2019;9:1207. doi: 10.1038/s41598-018-38072-7
13. Fried LP, Tangen CM, Walston J, et al; Cardiovascular Health Study Collaborative Research Group. Frailty in older adults: evidence for a phenotype. J Gerontol A Biol Sci Med Sci. 2001;56:M146-M156. doi: 10.1093/gerona/56.3.m146
14. Ryan J, Espinoza S, Ernst ME, et al. Validation of a deficit-accumulation frailty Index in the ASPirin in Reducing Events in the Elderly study and its predictive capacity for disability-free survival. J Gerontol A Biol Sci Med Sci. 2022;77:19-26. doi: 10.1093/gerona/glab225
15. Kim DH, Glynn RJ, Avorn J, et al. Validation of a claims-based frailty index against physical performance and adverse health outcomes in the Health and Retirement Study. J Gerontol A Biol Sci Med Sci. 2019;74:1271-1276. doi: 10.1093/gerona/gly197
16. Kim DH, Schneeweiss S, Glynn RJ, et al. Measuring frailty in Medicare data: development and validation of a claims-based frailty index. J Gerontol A Biol Sci Med Sci. 2018;73:980-987. doi: 10.1093/gerona/glx229
17. Claims-based frailty index. Harvard Dataverse website. 2022. Accessed April 5, 2022. https://dataverse.harvard.edu/dataverse/cfi
18. Rockwood K, Song X, MacKnight C, et al. A global clinical measure of fitness and frailty in elderly people. CMAJ. 2005;173:489-95. doi: 10.1503/cmaj.050051
19. Dabigatran. GoodRx. Accessed September 26, 2022. www.goodrx.com/dabigatran
20. Rivaroxaban. GoodRx. Accessed September 26, 2022. www.goodrx.com/rivaroxaban
21. Apixaban (Eliquis). GoodRx. Accessed September 26, 2022. www.goodrx.com/eliquis
PRACTICE CHANGER
Consider apixaban, which demonstrated a lower adverse event (AE) rate than warfarin regardless of frailty status, for anticoagulation treatment of older patients with nonvalvular atrial fibrillation (AF); by comparison, AE rates for dabigatran and rivaroxaban were lower vs warfarin only among nonfrail individuals.
STRENGTH OF RECOMMENDATION
C: Based on a retrospective observational cohort study.1
Kim DH, Pawar A, Gagne JJ, et al. Frailty and clinical outcomes of direct oral anticoagulants versus warfarin in older adults with atrial fibrillation: a cohort study. Ann Intern Med. 2021;174:1214-1223. doi: 10.7326/M20-7141

OSA raises risk of atrial fibrillation and stroke
compared with controls, based on data from 303 individuals.
OSA has become a common chronic disease, and cardiovascular diseases including AFib also are known independent risk factors associated with OSA, Anna Hojager, MD, of Zealand University Hospital, Roskilde, Denmark, and colleagues wrote. Previous studies have shown a significant increase in AFib risk in OSA patients with severe disease, but the prevalence of undiagnosed AFib in OSA patients has not been explored.
In a study published in Sleep Medicine, the researchers enrolled 238 adults with severe OSA (based on apnea-hypopnea index of 15 or higher) and 65 with mild or no OSA (based on an AHI of less than 15). The mean AHI across all participants was 34.2, and ranged from 0.2 to 115.8.
Participants underwent heart rhythm monitoring using a home system or standard ECG for 7 days; they were instructed to carry the device at all times except when showering or sweating heavily. The primary outcome was the detection of AFib, defined as at least one period of 30 seconds or longer with an irregular heart rhythm but without detectable evidence of another diagnosis. Sleep was assessed for one night using a portable sleep monitoring device. All participants were examined at baseline and measured for blood pressure, body mass index, waist-to-hip ratio, and ECG.
Overall, AFib occurred in 21 patients with moderate to severe OSA and 1 patient with mild/no OSA (8.8% vs. 1.5%, P = .045). The majority of patients across both groups had hypertension (66%) and dyslipidemia (77.6%), but the severe OSA group was more likely to be dysregulated and to have unknown prediabetes. Participants who were deemed candidates for anticoagulation therapy were referred for additional treatment. None of the 22 total patients with AFib had heart failure with reduced ejection fraction, and 68.2% had normal ejection fraction and ventricle function.
The researchers noted that no guidelines currently exist for systematic opportunistic screening for comorbidities in OSA patients, although the American Academy of Sleep Medicine recommends patient education as part of a multidisciplinary chronic disease management strategy. The high prevalence of AFib in OSA patients, as seen in the current study, “might warrant a recommendation of screening for paroxysmal [AFib] and could be valuable in the management of modifiable cardiovascular risk factors in patients with OSA,” they wrote.
The study findings were limited by several factors including the observational design and absence of polysomnography to assess OSA, the researchers noted. However, the study has the highest known prevalence of silent AFib in patients with moderate to severe OSA, and supports the value of screening and management for known comorbidities of OSA.
The study received no outside funding. The researchers had no financial conflicts to disclose.
FROM SLEEP MEDICINE
Sham-controlled renal denervation trial for hypertension is a near miss
SPYRAL HTN–ON MED hits headwinds
CHICAGO – Renal denervation, relative to a sham procedure, was linked with statistically significant reductions in blood pressure in the newly completed SPYRAL HTN–ON MED trial, but several factors are likely to have worked in concert to prevent the study from meeting its primary endpoint.
Of these differences, probably none was more important than the substantially higher proportion of patients in the sham group that received additional BP-lowering medications over the course of the study, David E. Kandzari, MD, reported at the American Heart Association scientific sessions.

The SPYRAL HTN–ON MED pivotal trial followed the previously completed SPYRAL HTN–ON MED pilot study, which did show a significant BP-lowering effect on antihypertensive medications followed radiofrequency denervation. In a recent update of the pilot study, the effect was persistent out to 3 years.
In the SPYRAL HTN–ON MED program, patients on their second screening visit were required to have a systolic pressure of between 140 and 170 mm Hg on 24-hour ambulatory BP monitoring (ABPM) while taking up to three antihypertensive medications. Patients who entered the study were randomized to renal denervation or sham control while maintaining their baseline antihypertensive therapies.
The previously reported pilot study comprised 80 patients. The expansion pivotal trial added 257 more patients for a total cohort of 337 patients. The primary efficacy endpoint was based on a Bayesian analysis of change in 24-hour systolic ABPM at 6 months for those in the experimental arm versus those on medications alone. Participants from both the pilot and pivotal trials were included.
The prespecified definition of success for renal denervation was a 97.5% threshold for probability of superiority on the basis of this Bayesian analysis. However, the Bayesian analysis was distorted by differences in the pilot and expansion cohorts, which complicated the superiority calculation. As a result, the analysis only yielded a 51% probability of superiority, a level substantially below the predefined threshold.
Despite differences seen in BP control in favor of renal denervation, several factors were identified that likely contributed to the missed primary endpoint. One stood out.
“Significant differences in medication prescriptions were disproportionate in favor of the sham group,” reported Dr. Kandzari, chief of Piedmont Heart Institute, Atlanta. He said these differences, which were a violation of the protocol mandate, led to a “bias toward the null” for the primary outcome.
The failure to meet the primary outcome was particularly disappointing in the wake of the favorable pilot study and the SPYRAL HTN–OFF MED pivotal trial, which were both positive.
In the pilot study, which did not have a medication imbalance, a 7.3–mm Hg reduction (P = .004) in 24-hour ABPM was seen at 6 months. Relative reductions in office-based systolic pressure reductions for renal denervation versus sham were 6.6 mm Hg (P = .03) and 4.0 mm Hg (P = .03) for the pilot and expansions groups, respectively.
On the basis of a Win ratio derived from a hierarchical analysis of ABMP and medication burden reduction, the 1.50 advantage (P = .005) for the renal denervation arm in the newly completed SPYRAL HTN–ON MED trial was also compelling.
At study entry, the median number of medications was 1.9 in both the renal denervation and sham arms. At the end of 6 months, the median number of medications was unchanged in the experimental arm but rose to 2.1 (P = .01) in the sham group. Similarly, there was little change in the medication burden from the start to the end of the trial in the denervation group (2.8 vs. 3.0), but a statistically significant change in the sham group (2.9 vs. 3.5; P = .04).
Furthermore, the net percentage change of patients receiving medications favoring BP reduction over the course of the study did not differ between the experimental and control arms of the pilot cohort, but was more than 10 times higher among controls in the expansion group (1.9% vs. 21.8%; P < .0001).
Medication changes over the course of the SPYRAL HTN–ON MED trial were even greater in some specific subgroups. Among Black participants, for example, 14.2% of those randomized to renal denervation and 54.6% of those randomized to the sham group increased their antihypertensive therapies over the course of the study.
The COVID-19 epidemic is suspected of playing another role in the negative results, according to Dr. Kandzari. After a brief pause in enrollment, the SPYRAL HTN–ON MED trial was resumed, but approximately 80% of the expansion cohort data were collected during this period. When compared, variances in office and 24-hour ABPM were observed for participants who were or were not evaluated during COVID.
“Significant differences in 24-hour ABPM patterns pre- and during COVID may reflect changes in patient behavior and lifestyle,” Dr. Kandzari speculated.
The data from this study differ from essentially all of the other studies in the SPYRAL HTN program as well as several other sham-controlled studies with renal denervation, according to Dr. Kandzari.
The AHA-invited discussant, Ajay J. Kirtane, MD, director of the Cardiac Catheterization Laboratories at Columbia University, New York, largely agreed that several variables appeared to conspire against a positive result in this trial, but he zeroed in on the imbalance of antihypertensive medications.
“Any trial that attempts to show a difference between renal denervation and a sham procedure must insure that antihypertensive medications are the same in the two arms. They cannot be different,” he said.
As an active investigator in the field of renal denervation, Dr. Kirtane thinks the evidence does support a benefit from renal denervation, but he believes data are still needed to determine which patients are candidates.
“Renal denervation is not going to be a replacement for previous established therapies, but it will be an adjunct,” he predicted. The preponderance of evidence supports clinically meaningful reductions in BP with this approach, “but we need to determine who to consider [for this therapy] and to have realistic expectations about the degree of benefit.”
Dr. Kandzari reported financial relationships with Abbott Vascular, Ablative Solutions, Biotronik, Boston Scientific, CSI, Medtronic Cardiovascular, OrbusNeich, and Teleflex. Dr. Kirtane reported financial relationships with Abbott Vascular, Abiomed, Boston Scientific, Cardiovascular Systems, Cathworks, Chiesi, Medtronic, Opens, Philipps, Regeneron, ReCor Medical, Siemens, Spectranetics, and Zoll.
SPYRAL HTN–ON MED hits headwinds
SPYRAL HTN–ON MED hits headwinds
CHICAGO – Renal denervation, relative to a sham procedure, was linked with statistically significant reductions in blood pressure in the newly completed SPYRAL HTN–ON MED trial, but several factors are likely to have worked in concert to prevent the study from meeting its primary endpoint.
Of these differences, probably none was more important than the substantially higher proportion of patients in the sham group that received additional BP-lowering medications over the course of the study, David E. Kandzari, MD, reported at the American Heart Association scientific sessions.
The SPYRAL HTN–ON MED pivotal trial followed the previously completed SPYRAL HTN–ON MED pilot study, which did show a significant BP-lowering effect on antihypertensive medications followed radiofrequency denervation. In a recent update of the pilot study, the effect was persistent out to 3 years.
In the SPYRAL HTN–ON MED program, patients on their second screening visit were required to have a systolic pressure of between 140 and 170 mm Hg on 24-hour ambulatory BP monitoring (ABPM) while taking up to three antihypertensive medications. Patients who entered the study were randomized to renal denervation or sham control while maintaining their baseline antihypertensive therapies.
The previously reported pilot study comprised 80 patients. The expansion pivotal trial added 257 more patients for a total cohort of 337 patients. The primary efficacy endpoint was based on a Bayesian analysis of change in 24-hour systolic ABPM at 6 months for those in the experimental arm versus those on medications alone. Participants from both the pilot and pivotal trials were included.
The prespecified definition of success for renal denervation was a 97.5% threshold for probability of superiority on the basis of this Bayesian analysis. However, the Bayesian analysis was distorted by differences in the pilot and expansion cohorts, which complicated the superiority calculation. As a result, the analysis only yielded a 51% probability of superiority, a level substantially below the predefined threshold.
Despite differences seen in BP control in favor of renal denervation, several factors were identified that likely contributed to the missed primary endpoint. One stood out.
“Significant differences in medication prescriptions were disproportionate in favor of the sham group,” reported Dr. Kandzari, chief of Piedmont Heart Institute, Atlanta. He said these differences, which were a violation of the protocol mandate, led to a “bias toward the null” for the primary outcome.
The failure to meet the primary outcome was particularly disappointing in the wake of the favorable pilot study and the SPYRAL HTN–OFF MED pivotal trial, which were both positive.
In the pilot study, which did not have a medication imbalance, a 7.3–mm Hg reduction (P = .004) in 24-hour ABPM was seen at 6 months. Relative reductions in office-based systolic pressure reductions for renal denervation versus sham were 6.6 mm Hg (P = .03) and 4.0 mm Hg (P = .03) for the pilot and expansions groups, respectively.
On the basis of a Win ratio derived from a hierarchical analysis of ABMP and medication burden reduction, the 1.50 advantage (P = .005) for the renal denervation arm in the newly completed SPYRAL HTN–ON MED trial was also compelling.
At study entry, the median number of medications was 1.9 in both the renal denervation and sham arms. At the end of 6 months, the median number of medications was unchanged in the experimental arm but rose to 2.1 (P = .01) in the sham group. Similarly, there was little change in the medication burden from the start to the end of the trial in the denervation group (2.8 vs. 3.0), but a statistically significant change in the sham group (2.9 vs. 3.5; P = .04).
Furthermore, the net percentage change of patients receiving medications favoring BP reduction over the course of the study did not differ between the experimental and control arms of the pilot cohort, but was more than 10 times higher among controls in the expansion group (1.9% vs. 21.8%; P < .0001).
Medication changes over the course of the SPYRAL HTN–ON MED trial were even greater in some specific subgroups. Among Black participants, for example, 14.2% of those randomized to renal denervation and 54.6% of those randomized to the sham group increased their antihypertensive therapies over the course of the study.
The COVID-19 epidemic is suspected of playing another role in the negative results, according to Dr. Kandzari. After a brief pause in enrollment, the SPYRAL HTN–ON MED trial was resumed, but approximately 80% of the expansion cohort data were collected during this period. When compared, variances in office and 24-hour ABPM were observed for participants who were or were not evaluated during COVID.
“Significant differences in 24-hour ABPM patterns pre- and during COVID may reflect changes in patient behavior and lifestyle,” Dr. Kandzari speculated.
The data from this study differ from essentially all of the other studies in the SPYRAL HTN program as well as several other sham-controlled studies with renal denervation, according to Dr. Kandzari.
The AHA-invited discussant, Ajay J. Kirtane, MD, director of the Cardiac Catheterization Laboratories at Columbia University, New York, largely agreed that several variables appeared to conspire against a positive result in this trial, but he zeroed in on the imbalance of antihypertensive medications.
“Any trial that attempts to show a difference between renal denervation and a sham procedure must insure that antihypertensive medications are the same in the two arms. They cannot be different,” he said.
As an active investigator in the field of renal denervation, Dr. Kirtane thinks the evidence does support a benefit from renal denervation, but he believes data are still needed to determine which patients are candidates.
“Renal denervation is not going to be a replacement for previous established therapies, but it will be an adjunct,” he predicted. The preponderance of evidence supports clinically meaningful reductions in BP with this approach, “but we need to determine who to consider [for this therapy] and to have realistic expectations about the degree of benefit.”
Dr. Kandzari reported financial relationships with Abbott Vascular, Ablative Solutions, Biotronik, Boston Scientific, CSI, Medtronic Cardiovascular, OrbusNeich, and Teleflex. Dr. Kirtane reported financial relationships with Abbott Vascular, Abiomed, Boston Scientific, Cardiovascular Systems, Cathworks, Chiesi, Medtronic, Opens, Philipps, Regeneron, ReCor Medical, Siemens, Spectranetics, and Zoll.
AT AHA 2022
How Low Is Too Low? A Retrospective Analysis of Very Low LDL-C Levels in Veterans
According to the Centers for Disease Control and Prevention (CDC), approximately 795,000 strokes occur in the United States yearly and are the fifth leading cause of death.1 The CDC also states that about 43 million Americans who could benefit from cholesterol medication are currently taking them.2 As of 2019, West Virginia, Ohio, and Kentucky are 3 states with the highest rates of heart disease mortality.3
Low-density lipoprotein cholesterol (LDL-C) accumulates on the walls of blood vessels, which can lead to coronary heart disease. However, some LDL-C is necessary to maintain proper brain function. Guidelines from the American College of Cardiology (ACC) and American Heart Association (AHA) recommend LDL-C goal levels < 70 mg/dL.4 Yet, there is no consensus on how low LDL-C levels should be. According to clinical practice guidelines for dyslipidemia, developed by the US Department of Veterans Affairs (VA) and US Department of Defense, statin medications are first-line agents for lowering LDL-C. The intensity of the statin medication is based on primary or secondary prevention, atherosclerotic cardiovascular disease (ASCVD) risk, and current LDL-C levels prior to treatment.5
Statin medications are used for primary and secondary prevention of ASCVD. In addition, statin medications decrease total cholesterol, LDL-C, and triglycerides while causing a mild increase in high-density lipoprotein cholesterol. Although statin medications are first-line therapy for LDL-C lowering, other medications can be used to assist in decreasing LDL-C. Ezetimibe, fenofibrates, and proprotein convertase subtilisin/kexin type 9 (PCSK9) inhibitors can also be used.5 Statin medications do pose a risk of severe adverse drug reactions (ADRs), such as rhabdomyolysis and myopathy.6
One prospective cohort study looked at 27,937 women and analyzed total cholesterol, LDL-C, high-density lipoprotein cholesterol, triglycerides, and strokes. The study noted a mean 19.3-year follow-up and within that follow-up, 137 hemorrhagic strokes occurred. Based on the study’s results, LDL-C levels < 70 mg/dL had 2.17 times the risk of experiencing a hemorrhagic stroke.7 A meta-analysis of prospective studies analyzed 476,173 patients and 7487 hemorrhagic stroke cases. This review concluded that a 10 mg/dL increase in LDL-C was associated with a 3% lower risk of hemorrhagic stroke.8
An observational study conducted in Asia of Chinese adults found that 22% of all strokes were hemorrhagic. The incidence of the hemorrhagic strokes was higher for patients who had an LDL-C < 1.8 mmol/L than those who had an LDL-C between 1.8 and 2.6 mmol/L. This study also showed that if hypertension was inadequately treated, the risk of hemorrhagic stroke increased. This study concluded that the benefit of reducing ASCVD outweighs the small risk of hemorrhagic strokes.9
Another prospective cohort study included 96,043 stroke-free participants and analyzed LDL-C concentrations and incidence of intracranial hemorrhage. The average LDL-C concentrations were calculated from data collected in 4 separate reporting years, and incidence of intracranial hemorrhage was confirmed through review of medication records. Over a 9-year follow-up period, the study concluded that participants with an LDL-C level of < 70 mg/dL had a significantly higher risk of developing intracranial hemorrhage than participants with LDL-C levels 70 to 99 mg/dL.10
The safety and effects of prolonged very low LDL-C levels are currently unknown. The current study sought to gather information to determine the risks of very low LDL-C levels in a veteran population.
Methods
A retrospective chart review was conducted on patients aged 18 to 90 years receiving care at the Hershel “Woody” Williams Veterans Affairs Medical Center (HWW VAMC) in Huntington, West Virginia, between January 1, 2010, and September 1, 2020. Approval of the current study was obtained through the Marshall University Institutional Review Board, HWW VAMC Research and Development Committee, and Veterans Health Administration (VHA) DATA Access Request Tracker (DART)/VA Informatic and Computing Infrastructure (VINCI). Data were obtained via the VHA Corporate Data Warehouse (CDW) for the HWW VAMC using Microsoft Structured Query Language (SQL) server available in VINCI. Analysis of the data was conducted using STATA v. 15.
Patients were included if they had a diagnosis of hyperlipidemia/dyslipidemia, received treatment with HMG-CoA reductase inhibitors or PCSK9 medications, and had an LDL-C level ≤ 40 mg/dL. The primary outcome was the rate of intracranial hemorrhage that could be caused by very low LDL-C levels. The secondary outcomes included actions taken by clinicians to address LDL-C level < 40 mg/dL, ADRs, duration of therapy, and medication adherence. Patients were excluded if they were aged < 18 or > 90 years, were pregnant during the study period, had hypothyroidism, received chronic anticoagulation medications, or had a triglyceride level > 300 mg/dL.
Results
The study included 3027 patients. Of those patients, 78 patients were female while 2949 were male, and the mean (SD) age was 68.3 (9.4) years. A subsample of 32 patients was analyzed to determine whether an ADR was noted or low LDL-C level was addressed in the chart. The subsample size was determined through chart review and included patients who had a documented intracranial hemorrhage. None of the 32 patients had an ADR documented, and 6 (19%) had the low LDL-C level addressed in the chart by monitoring levels, reducing statin doses, or discontinuing the medication. Of the total population analyzed, 8 patients (0.3%) had a documented intracranial hemorrhage within 1 year following the low LDL-C level.
We also analyzed the intensity of statin related to the low LDL-C level (Table 1). 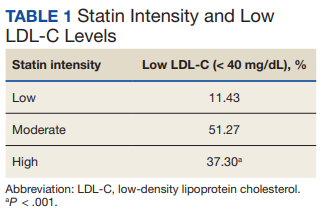
The most common ADRs were muscle, joint, and leg pain, rash, and cramps (Table 2). 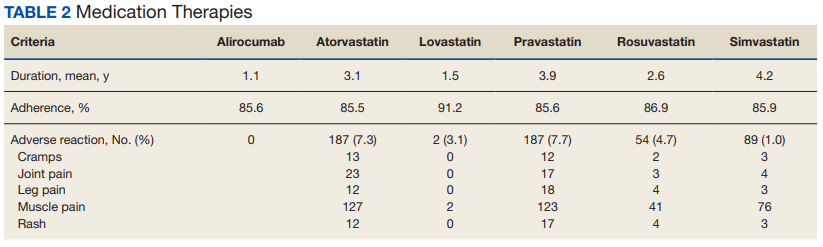
Adherence to the medications and duration of therapy was also analyzed and was found to be similar among the various medications. Lovastatin had the highest percent adherence with 91.2% while atorvastatin had the lowest with 85.5%. It can be noted that lovastatin had a lower documented percentage of ADRs while atorvastatin had a higher documented percentage of ADRs, which can be clinically meaningful when prescribing these medications; however, these similar adherence rates are not influencing the primary outcome of the rate of intracranial hemorrhage due to LDL-C level < 40 mg/dL. Mean duration of therapy lasted between 1 year and > 4 years with 1.1 years for alirocumab and 4.2 for simvastatin. The duration of therapy could be influenced by formulary restrictions during the study time. Nonetheless, patients, regardless of formulary restrictions, have taken these medications for a duration long enough to affect LDL-C levels.
Eight patients of the total sample analyzed had an intracranial hemorrhage within 1 year of having a recorded LDL-C level < 40 mg/dL. Secondarily, 32 patients had clinicians address an LDL-C level < 40 mg/dL through documentation or modifying the medication therapy. The most common ADRs among all medications analyzed were leg and joint pain, rash, and cramps. Of all medications included in this study, the mean duration of therapy was > 1 year, which would allow them to affect LDL-C levels and have those levels monitored and recorded in patients’ charts.
Discussion
When comparing our primary outcome of risk of intracranial hemorrhage with previous literature, the results are consistent with previous outcomes. Previous literature had a smaller sample size but analyzed LDL-C levels < 50 mg/dL and had an outcome of 48 patients experiencing an intracranial hemorrhage within 1 year of an LDL-C level < 50 mg/dL. Due to this study having stricter parameters of LDL-C levels < 40 mg/dL, there were fewer patients with documented intracranial hemorrhages. With there being a risk of intracranial hemorrhage with low LDL-C levels, the results demonstrate the need to monitor and address LDL-C levels.
Limitations
There were several notable limitations to this study. The retrospective, single-center nature coupled with the predominately male study population may affect the generalizability of the study results to patients outside of the facility in which the study was performed. Additionally, the study only included statin medications and PCSK9 inhibitors. With future studies, all lipid-lowering medications could be analyzed. The study was largely reliant on the proper documentation of International Statistical Classification of Diseases, Tenth Revision (ICD-10) codes exclusive to the HWW VAMC, which may exclude patients who first present to outside facilities. Due to time restraints, the incidence of hemorrhage was only analyzed 1 year following an LDL-C level < 40 mg/dL. For considerations for future investigation, the length of time to analyze incidence of hemorrhage could be expanded to be similar to previous studies, and the study could be expanded across the local Veterans Integrated Service Network or VA system. Additionally, the study could have analyzed the percentage of time a patient had an LDL-C level < 40 mg/dL in their lifetime.
Conclusions
These results show there is a risk that patients with an LDL-C level < 40 mg/dL may experience an intracranial hemorrhage. As seen by the results, there is a clinical need for practitioners to routinely monitor and address LDL-C levels. With various guidelines that recommend starting statin medication to reduce risk of ASCVD, it is necessary that practitioners routinely monitor cholesterol levels and adjust the medications according to laboratory results.11
Within 1 year of an LDL-C level < 40 mg/dL, 0.3% of patients had an intracranial hemorrhage. There was no statistical significance between the rate of ADRs among the medications analyzed. High-intensity statin medications were statistically significant in resulting in an LDL-C level < 40 mg/dL compared with moderate- and low-intensity statin medications. Of the 32 subsample of patients, LDL-C levels < 40 mg/mL are not routinely being addressed in the chart by the clinician.
1. Centers for Disease Control and Prevention. Stroke facts. Updated April 5, 2022. Accessed September 21, 2022. https://www.cdc.gov/stroke/facts.htm
2. Centers for Disease Control and Prevention. High cholesterol facts. Updated July 12, 2022. Accessed September 21, 2022. https://www.cdc.gov/cholesterol/facts.htm
3. Centers for Disease Control and Prevention. Heart disease mortality by state. Updated February 25, 2022. Accessed September 21, 2022. https://www.cdc.gov/nchs/pressroom/sosmap/heart_disease_mortality/heart_disease.htm
4. Grundy SM, Stone NJ, Bailey AL, et al. 2018 AHA/ACC/AACVPR/AAPA/ABC/ACPM/ADA/AGS/APhA/ASPC/NLA/PCNA Guideline on the Management of Blood Cholesterol: A Report of the American College of Cardiology/American Heart Association Task Force on Clinical Practice Guidelines. Circulation. 2019;139(25):e1082-e1143. doi:10.1161/CIR.0000000000000625
5. US Department of Veterans Affairs, US Department of Defense. VA/DoD Clinical Practice Guideline for the Management of Dyslipidemia for Cardiovascular Risk Reduction. Version 4.0. US Department of Veterans Affairs. June 2020. Accessed September 21, 2022. https://www.healthquality.va.gov/guidelines/CD/lipids/VADoDDyslipidemiaCPG5087212020.pdf
6. Tomaszewski M, Ste¸pien´ KM, Tomaszewska J, Czuczwar SJ. Statin-induced myopathies. Pharmacol Rep. 2011;63(4):859-66. doi:10.1016/s1734-1140(11)70601-6
7. Rist PM, Buring JE, Ridker PM, Kase CS, Kurth T, Rexrode KM. Lipid levels and the risk of hemorrhagic stroke among women. Neurology. 2019;92(19):e2286-e2294. doi:10.1212/WNL.0000000000007454
8. Ma C, Na M, Neumann S, Gao X. Low-density lipoprotein cholesterol and risk of hemorrhagic stroke: a systematic review and dose-response meta-analysis of prospective studies. Curr Atheroscler Rep. 2019;21(12):52. Published 2019 Nov 20. doi:10.1007/s11883-019-0815-5
9. Lui DT, Tan KC. Low-density lipoprotein cholesterol and stroke: How low should we go? J Diabetes Investig. 2020;11(6):1379-1381. doi:10.1111/jdi.13310
10. Ma C, Gurol ME, Huang Z, et al. Low-density lipoprotein cholesterol and risk of intracerebral hemorrhage: a prospective study. Neurology. 2019;93(5):e445-e457. doi:10.1212/WNL.0000000000007853
11. American Diabetes Association Professional Practice Committee. 10. Cardiovascular disease and risk management: standards of medical care in diabetes—2022. Diabetes Care. 2022;45(suppl 1):S144–S174. doi:10.2337/dc22-S010
According to the Centers for Disease Control and Prevention (CDC), approximately 795,000 strokes occur in the United States yearly and are the fifth leading cause of death.1 The CDC also states that about 43 million Americans who could benefit from cholesterol medication are currently taking them.2 As of 2019, West Virginia, Ohio, and Kentucky are 3 states with the highest rates of heart disease mortality.3
Low-density lipoprotein cholesterol (LDL-C) accumulates on the walls of blood vessels, which can lead to coronary heart disease. However, some LDL-C is necessary to maintain proper brain function. Guidelines from the American College of Cardiology (ACC) and American Heart Association (AHA) recommend LDL-C goal levels < 70 mg/dL.4 Yet, there is no consensus on how low LDL-C levels should be. According to clinical practice guidelines for dyslipidemia, developed by the US Department of Veterans Affairs (VA) and US Department of Defense, statin medications are first-line agents for lowering LDL-C. The intensity of the statin medication is based on primary or secondary prevention, atherosclerotic cardiovascular disease (ASCVD) risk, and current LDL-C levels prior to treatment.5
Statin medications are used for primary and secondary prevention of ASCVD. In addition, statin medications decrease total cholesterol, LDL-C, and triglycerides while causing a mild increase in high-density lipoprotein cholesterol. Although statin medications are first-line therapy for LDL-C lowering, other medications can be used to assist in decreasing LDL-C. Ezetimibe, fenofibrates, and proprotein convertase subtilisin/kexin type 9 (PCSK9) inhibitors can also be used.5 Statin medications do pose a risk of severe adverse drug reactions (ADRs), such as rhabdomyolysis and myopathy.6
One prospective cohort study looked at 27,937 women and analyzed total cholesterol, LDL-C, high-density lipoprotein cholesterol, triglycerides, and strokes. The study noted a mean 19.3-year follow-up and within that follow-up, 137 hemorrhagic strokes occurred. Based on the study’s results, LDL-C levels < 70 mg/dL had 2.17 times the risk of experiencing a hemorrhagic stroke.7 A meta-analysis of prospective studies analyzed 476,173 patients and 7487 hemorrhagic stroke cases. This review concluded that a 10 mg/dL increase in LDL-C was associated with a 3% lower risk of hemorrhagic stroke.8
An observational study conducted in Asia of Chinese adults found that 22% of all strokes were hemorrhagic. The incidence of the hemorrhagic strokes was higher for patients who had an LDL-C < 1.8 mmol/L than those who had an LDL-C between 1.8 and 2.6 mmol/L. This study also showed that if hypertension was inadequately treated, the risk of hemorrhagic stroke increased. This study concluded that the benefit of reducing ASCVD outweighs the small risk of hemorrhagic strokes.9
Another prospective cohort study included 96,043 stroke-free participants and analyzed LDL-C concentrations and incidence of intracranial hemorrhage. The average LDL-C concentrations were calculated from data collected in 4 separate reporting years, and incidence of intracranial hemorrhage was confirmed through review of medication records. Over a 9-year follow-up period, the study concluded that participants with an LDL-C level of < 70 mg/dL had a significantly higher risk of developing intracranial hemorrhage than participants with LDL-C levels 70 to 99 mg/dL.10
The safety and effects of prolonged very low LDL-C levels are currently unknown. The current study sought to gather information to determine the risks of very low LDL-C levels in a veteran population.
Methods
A retrospective chart review was conducted on patients aged 18 to 90 years receiving care at the Hershel “Woody” Williams Veterans Affairs Medical Center (HWW VAMC) in Huntington, West Virginia, between January 1, 2010, and September 1, 2020. Approval of the current study was obtained through the Marshall University Institutional Review Board, HWW VAMC Research and Development Committee, and Veterans Health Administration (VHA) DATA Access Request Tracker (DART)/VA Informatic and Computing Infrastructure (VINCI). Data were obtained via the VHA Corporate Data Warehouse (CDW) for the HWW VAMC using Microsoft Structured Query Language (SQL) server available in VINCI. Analysis of the data was conducted using STATA v. 15.
Patients were included if they had a diagnosis of hyperlipidemia/dyslipidemia, received treatment with HMG-CoA reductase inhibitors or PCSK9 medications, and had an LDL-C level ≤ 40 mg/dL. The primary outcome was the rate of intracranial hemorrhage that could be caused by very low LDL-C levels. The secondary outcomes included actions taken by clinicians to address LDL-C level < 40 mg/dL, ADRs, duration of therapy, and medication adherence. Patients were excluded if they were aged < 18 or > 90 years, were pregnant during the study period, had hypothyroidism, received chronic anticoagulation medications, or had a triglyceride level > 300 mg/dL.
Results
The study included 3027 patients. Of those patients, 78 patients were female while 2949 were male, and the mean (SD) age was 68.3 (9.4) years. A subsample of 32 patients was analyzed to determine whether an ADR was noted or low LDL-C level was addressed in the chart. The subsample size was determined through chart review and included patients who had a documented intracranial hemorrhage. None of the 32 patients had an ADR documented, and 6 (19%) had the low LDL-C level addressed in the chart by monitoring levels, reducing statin doses, or discontinuing the medication. Of the total population analyzed, 8 patients (0.3%) had a documented intracranial hemorrhage within 1 year following the low LDL-C level.
We also analyzed the intensity of statin related to the low LDL-C level (Table 1).
The most common ADRs were muscle, joint, and leg pain, rash, and cramps (Table 2).
Adherence to the medications and duration of therapy was also analyzed and was found to be similar among the various medications. Lovastatin had the highest percent adherence with 91.2% while atorvastatin had the lowest with 85.5%. It can be noted that lovastatin had a lower documented percentage of ADRs while atorvastatin had a higher documented percentage of ADRs, which can be clinically meaningful when prescribing these medications; however, these similar adherence rates are not influencing the primary outcome of the rate of intracranial hemorrhage due to LDL-C level < 40 mg/dL. Mean duration of therapy lasted between 1 year and > 4 years with 1.1 years for alirocumab and 4.2 for simvastatin. The duration of therapy could be influenced by formulary restrictions during the study time. Nonetheless, patients, regardless of formulary restrictions, have taken these medications for a duration long enough to affect LDL-C levels.
Eight patients of the total sample analyzed had an intracranial hemorrhage within 1 year of having a recorded LDL-C level < 40 mg/dL. Secondarily, 32 patients had clinicians address an LDL-C level < 40 mg/dL through documentation or modifying the medication therapy. The most common ADRs among all medications analyzed were leg and joint pain, rash, and cramps. Of all medications included in this study, the mean duration of therapy was > 1 year, which would allow them to affect LDL-C levels and have those levels monitored and recorded in patients’ charts.
Discussion
When comparing our primary outcome of risk of intracranial hemorrhage with previous literature, the results are consistent with previous outcomes. Previous literature had a smaller sample size but analyzed LDL-C levels < 50 mg/dL and had an outcome of 48 patients experiencing an intracranial hemorrhage within 1 year of an LDL-C level < 50 mg/dL. Due to this study having stricter parameters of LDL-C levels < 40 mg/dL, there were fewer patients with documented intracranial hemorrhages. With there being a risk of intracranial hemorrhage with low LDL-C levels, the results demonstrate the need to monitor and address LDL-C levels.
Limitations
There were several notable limitations to this study. The retrospective, single-center nature coupled with the predominately male study population may affect the generalizability of the study results to patients outside of the facility in which the study was performed. Additionally, the study only included statin medications and PCSK9 inhibitors. With future studies, all lipid-lowering medications could be analyzed. The study was largely reliant on the proper documentation of International Statistical Classification of Diseases, Tenth Revision (ICD-10) codes exclusive to the HWW VAMC, which may exclude patients who first present to outside facilities. Due to time restraints, the incidence of hemorrhage was only analyzed 1 year following an LDL-C level < 40 mg/dL. For considerations for future investigation, the length of time to analyze incidence of hemorrhage could be expanded to be similar to previous studies, and the study could be expanded across the local Veterans Integrated Service Network or VA system. Additionally, the study could have analyzed the percentage of time a patient had an LDL-C level < 40 mg/dL in their lifetime.
Conclusions
These results show there is a risk that patients with an LDL-C level < 40 mg/dL may experience an intracranial hemorrhage. As seen by the results, there is a clinical need for practitioners to routinely monitor and address LDL-C levels. With various guidelines that recommend starting statin medication to reduce risk of ASCVD, it is necessary that practitioners routinely monitor cholesterol levels and adjust the medications according to laboratory results.11
Within 1 year of an LDL-C level < 40 mg/dL, 0.3% of patients had an intracranial hemorrhage. There was no statistical significance between the rate of ADRs among the medications analyzed. High-intensity statin medications were statistically significant in resulting in an LDL-C level < 40 mg/dL compared with moderate- and low-intensity statin medications. Of the 32 subsample of patients, LDL-C levels < 40 mg/mL are not routinely being addressed in the chart by the clinician.
1. Centers for Disease Control and Prevention. Stroke facts. Updated April 5, 2022. Accessed September 21, 2022. https://www.cdc.gov/stroke/facts.htm
2. Centers for Disease Control and Prevention. High cholesterol facts. Updated July 12, 2022. Accessed September 21, 2022. https://www.cdc.gov/cholesterol/facts.htm
3. Centers for Disease Control and Prevention. Heart disease mortality by state. Updated February 25, 2022. Accessed September 21, 2022. https://www.cdc.gov/nchs/pressroom/sosmap/heart_disease_mortality/heart_disease.htm
4. Grundy SM, Stone NJ, Bailey AL, et al. 2018 AHA/ACC/AACVPR/AAPA/ABC/ACPM/ADA/AGS/APhA/ASPC/NLA/PCNA Guideline on the Management of Blood Cholesterol: A Report of the American College of Cardiology/American Heart Association Task Force on Clinical Practice Guidelines. Circulation. 2019;139(25):e1082-e1143. doi:10.1161/CIR.0000000000000625
5. US Department of Veterans Affairs, US Department of Defense. VA/DoD Clinical Practice Guideline for the Management of Dyslipidemia for Cardiovascular Risk Reduction. Version 4.0. US Department of Veterans Affairs. June 2020. Accessed September 21, 2022. https://www.healthquality.va.gov/guidelines/CD/lipids/VADoDDyslipidemiaCPG5087212020.pdf
6. Tomaszewski M, Ste¸pien´ KM, Tomaszewska J, Czuczwar SJ. Statin-induced myopathies. Pharmacol Rep. 2011;63(4):859-66. doi:10.1016/s1734-1140(11)70601-6
7. Rist PM, Buring JE, Ridker PM, Kase CS, Kurth T, Rexrode KM. Lipid levels and the risk of hemorrhagic stroke among women. Neurology. 2019;92(19):e2286-e2294. doi:10.1212/WNL.0000000000007454
8. Ma C, Na M, Neumann S, Gao X. Low-density lipoprotein cholesterol and risk of hemorrhagic stroke: a systematic review and dose-response meta-analysis of prospective studies. Curr Atheroscler Rep. 2019;21(12):52. Published 2019 Nov 20. doi:10.1007/s11883-019-0815-5
9. Lui DT, Tan KC. Low-density lipoprotein cholesterol and stroke: How low should we go? J Diabetes Investig. 2020;11(6):1379-1381. doi:10.1111/jdi.13310
10. Ma C, Gurol ME, Huang Z, et al. Low-density lipoprotein cholesterol and risk of intracerebral hemorrhage: a prospective study. Neurology. 2019;93(5):e445-e457. doi:10.1212/WNL.0000000000007853
11. American Diabetes Association Professional Practice Committee. 10. Cardiovascular disease and risk management: standards of medical care in diabetes—2022. Diabetes Care. 2022;45(suppl 1):S144–S174. doi:10.2337/dc22-S010
Evaluation of a Pharmacist-Driven Ambulatory Aspirin Deprescribing Protocol
The use of low-dose aspirin for the primary prevention of cardiovascular disease (CVD) morbidity and mortality continues to be controversial, particularly for older adults. Recently published, robust randomized controlled trials have revealed less cardiovascular benefit from aspirin for primary prevention compared with previous trials; additionally, an increased risk of major bleeding events has been notably more prevalent in older adults.1-5 These trials have suggested that preventative aspirin use in older adults confers less benefit than other therapies for decreasing atherosclerotic CVD (ASCVD) risk, including blood pressure (BP) control, cholesterol management, and tobacco cessation.1,6
A recent meta-analysis indicated a composite cardiovascular risk reduction in patients aged 53 to 74 years taking aspirin vs no aspirin; however, this benefit was offset with an even greater increased risk of major bleeding.7 This trend was consistent regardless of stratification by 10-year ASCVD risk or presence of diabetes mellitus (DM) diagnosis.7,8 Additionally, the recently published Aspirin in Reducing Events in the Elderly (ASPREE) trial studied the impacts of aspirin use in healthy adults aged ≥ 70 years and aged ≥ 65 years among Black and Hispanic adults.4 The study concluded that the risk of major bleeding with aspirin use was even higher vs the potential cardiovascular benefit in older adults.4
With this emerging evidence, guidelines have been updated to represent the need for risk vs benefit considerations regarding aspirin use for primary prevention in older adults.1,9,10 The most recent guideline update from the American College of Cardiology and American Heart Association (ACC/AHA) recommends against the routine use of aspirin in patients aged > 70 years or those with bleeding risk factors.1 The guideline recommends considering aspirin use for patients ages 40 to 70 years only after a patient-specific risk vs benefit discussion.1 Furthermore, the 2020 American Diabetes Association guideline recommends considering aspirin use for primary prevention in adults with DM between ages 50 and 70 only after a risk vs benefit discussion of patient-specific bleeding risk factors and ASCVD risk-enhancing factors.10
Despite the demonstrated risks for bleeding with the routine use of aspirin, studies indicate that aspirin continues to be used commonly among older adults, often when unnecessary. In the 2017 National Health Interview Survey, about 23% of adults aged > 40 years in the United States without CVD used aspirin daily, and 23% of these did so without recommendation from a health care professional.11 Furthermore, nearly half of adults ages ≥ 70 years and nearly one-quarter of adults with a history of peptic ulcer disease used aspirin daily.11 Although the most recent guidelines from the ACC/AHA do not recommend a 10-year ASCVD risk threshold for therapy, one study illustrated that 12% of older adult patients were inappropriately prescribed aspirin for primary prevention despite a 10-year ASCVD risk of < 6%.1,12 These studies highlight the large proportion of individuals, particularly older adults, who may be inappropriately taking aspirin for primary prevention.
Deprescribing Program
Deprescribing potentially inappropriate medications (PIMs) is particularly important in the older adult population, as these individuals experience a high risk of adverse effects (AEs), polypharmacy, cognitive decline, and falls related to medication use.6,13-17 Evidence suggests that mortality outcomes are improved with the implementation of targeted deprescribing efforts based on patient-specific factors.18 Additionally, deprescribing unnecessary medications may improve adherence to other essential medications and reduce financial burdens.19 Pharmacists play a crucial role among health care professionals in the implementation of deprescribing practices, and studies have shown that physicians are highly accepting of pharmacists’ deprescribing recommendations.13,20-22
Despite the evidence for the benefits of deprescribing, limited data are available regarding the impact and feasibility of a targeted aspirin deprescribing approach by nonphysician practitioners.23 The objective of this study was to implement and evaluate the success of a pharmacist-driven aspirin deprescribing protocol for older adults in a primary care setting.
This aspirin deprescribing protocol was developed by ambulatory care clinical pharmacist or clinical pharmacist practitioners (CPPs), at the William S. Middleton Memorial Veterans Hospital in Madison, Wisconsin. Within the US Department of Veterans Affairs (VA) health care system, CPPs work under a broad scope of practice with the ability to independently prescribe and monitor medications. The protocol was reviewed by physician stakeholders in both primary care and cardiology and a list was generated, including patients from 2 primary care panels aged ≥ 70 years with aspirin on their medication list, either as a prescription or over-the-counter medication, using the VA Information System Technology and Architecture. A CPP or supervised pharmacy intern identified patients from this list who were appropriate for risk/benefit discussions regarding the discontinuation of aspirin. Patients were excluded from the intervention if they had a history of clinical ASCVD, including myocardial infarction (MI), stable or unstable angina, coronary artery disease (CAD), coronary or other arterial revascularization, cerebrovascular accident (CVA), transient ischemic accident (TIA), or peripheral artery disease (PAD), or another documented indication for aspirin use, including pain, flushing (with niacin use), venous thromboembolism prophylaxis, valvular heart disease, or acute or recurrent pericarditis.
After identifying eligible patients, a CPP or pharmacy intern contacted patients by telephone, following a script to guide conversation. All patients were screened for potential appropriate aspirin indications, particularly any history of MI, CAD, CVA, TIA, PAD, or other clinical ASCVD. The patient was asked about their rationale for taking aspirin and patient-specific ASCVD risk-enhancing factors and bleeding risk factors and educated them on lifestyle modalities to reduce ASCVD risk, using the script as a guide. ASCVD risk-enhancing factors included family history of premature MI, inability to achieve BP goal, DM with the inability to achieve blood glucose or hemoglobin A1c goal, tobacco use, or inadequate statin therapy. Bleeding risk factors included a history of gastrointestinal bleed or peptic ulcer disease, concurrent use of medications that increase bleeding risk, chronic kidney disease, or thrombocytopenia.
Through shared decision making with careful consideration of these factors, we reached a conclusion with each patient to either continue or to deprescribe aspirin. Each discussion was documented in the electronic health record (EHR) using a standard documentation template (eAppendix, available at doi:10.12788/fp.0320). The patient’s medication list also was updated to reflect changes in aspirin use. For patients who declined deprescribing, the CPP or pharmacy intern asked the patient for their primary reason for preferring to continue aspirin, which was subsequently categorized as one of the following: no prior concerns with bleeding, concerns about a future cardiovascular event, wishing to discuss further with their primary care practitioner (PCP), or identifying an appropriate use for aspirin not evident through record review. For the patients who wished to further discuss the issue with their PCP before deprescribing, the patient’s PCP was notified of this preference by a record alert to the note documenting the encounter, and the patient was also encouraged to follow up about this issue. A voicemail was left if the patient did not answer requesting a call back, and a second attempt was made within 2 weeks.
Data Collected
We collected data to assess the proportion of patients for whom aspirin for primary prevention was discontinued. For patients who declined deprescribing, we documented the rationale for continuing aspirin. Additionally, the feasibility of implementation was assessed, including pharmacist time spent on each record review and intervention. Descriptive statistics were generated to evaluate baseline characteristics and intervention outcomes. The time to completion of these tasks was summarized with descriptive statistics.
We reviewed 459 patient records, and 110 were determined eligible for risk/benefit discussions. 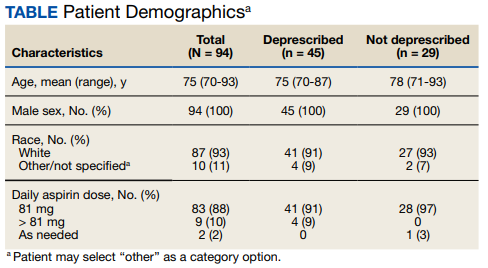
Patients had various reasons for declining deprescribing, including 8 (28%) who had no prior concerns with bleeding while on aspirin and 6 (21%) who were concerned about a future cardiovascular event. Of those who declined aspirin deprescribing, 6 (21%) wished to further discuss the issue with their PCP. In 9 (31%) patients an alternative appropriate indication for aspirin was identified through discussion. In these cases, the indication for aspirin was documented and updated in the EHR.
Most patients (87%) contacted reported taking low-dose aspirin 81 mg daily, while 10% reported taking higher doses (range, 162-325) and 3% on an as-needed basis. In all 3 patients who agreed to dose reduction, the initial dose of 325 mg daily was reduced to 81 mg daily.
Results of the time-study analysis for each intervention indicated that a pharmacy intern or pharmacist spent about 2 minutes reviewing the record of each patient to determine eligibility for risk/benefit discussions. The 110 patients identified as eligible were 24% of the 459 records reviewed. An average (range) of 12 (6-20) minutes was spent on the telephone call plus documentation for each patient contacted. Additionally, we estimated that CPPs and pharmacy interns spent an approximate combined 12 hours in the development and review of materials for this program, including the protocol, script, and documentation templates. This also included about 1 hour to identify appropriate parameters for, and generate, the eligible patient list.
Discussion
The implementation of a pharmacist-driven aspirin deprescribing protocol for older adults in a primary care setting led to the discontinuation of inappropriate aspirin use in nearly half of older adults contacted. Furthermore, opportunities were identified to update medication lists to reflect previously self-discontinued aspirin for older adults. Just over one-quarter of those contacted declined to discontinue or reduce their aspirin dose. It is hypothesized that with these targeted deprescribing interventions, overall risk reduction for bleeding and polypharmacy will be observed for older adults.1
In addition to deprescribing aspirin, CPPs used shared decision making to initiate risk/benefit discussions and to educate on targeted lifestyle modifications to lower ASCVD risk. While not all patients agreed to discontinue aspirin, all were provided education that may empower them to engage in future discussions with PCPs regarding appropriate aspirin use. Previous pharmacist-led deprescribing initiatives for proton pump inhibitors and other PIMs have indicated that a large percentage of patients who opt to further discuss a deprescribing concern with their PCPs ultimately resulted in deprescribing outcomes.24,25 Additionally, a recent trial examining pharmacist-led deprescribing of 4 common PIMs in older adults compared the impact of pharmacists leading educational interventions directly to patients with pharmacists making deprescribing recommendations to physicians. Deprescribing was more successful when patients were involved in the decision-making process.26
Limitations
Although this quality improvement initiative resulted in the deprescribing of inappropriate aspirin for many older adults, a limitation is the small sample size within a single institution. The population of male veterans also may limit generalizability to nonmale and nonveteran older adults. As the protocol was initiated within a limited number of primary care teams initially, future implementation into additional primary care teams will increase the number of older adults impacted by risk/benefit discussions regarding aspirin use. This work may not be generalizable to other health care systems. Many patients within the VA receive both their primary and specialty care within the system, which facilitates communication and collaboration between primary and specialty practitioners. The protocol may require workflow adjustments for patients receiving care within multiple systems. Additionally, although the deprescribing protocol was created in collaboration with physicians, CPPs within the VA work under a broad scope of practice that includes independent medication prescribing, deprescribing, and monitoring. This may be a consideration when implementing similar protocols at other sites, as collaborative practice agreements may need to be in place.
Future Directions
The time required to complete these interventions was generally feasible, though this intervention would require some workflow alteration to be incorporated routinely into a CPP’s schedule. The telephone calls were completed as isolated interventions and were not incorporated into existing scheduled primary care appointments. In the future, the aspirin deprescribing protocol could be incorporated into existing pharmacist-led primary care appointments. Based on the outcomes of this study, CPPs are leading an initiative to develop an aspirin deprescribing clinical reminder tool, which may be quickly inserted into a progress note within the EHR and may be incorporated into any primary care visit led by a CPP or PCP.
Conclusions
This study demonstrates that a pharmacist-led aspirin deprescribing protocol in the ambulatory care pharmacy setting was successful in the discontinuation of unnecessary aspirin use in older adults. The protocol also provided opportunities for education on ASCVD risk reduction in all older adults reached. These findings highlight the role of pharmacists in deprescribing PIMs for older adults and identifying opportunities to further streamline risk/benefit discussions on aspirin deprescribing potential within primary care visits.
1. Arnett DK, Blumenthal RS, Albert MA, et al. 2019 ACC/AHA guideline on the primary prevention of cardiovascular disease: a report of the American College of Cardiology/American Heart Association Task Force on clinical practice guidelines. Circulation. 2019;140(11):e596-e646. doi:10.1161/CIR.0000000000000678
2. Gaziano JM, Brotons C, Coppolecchia R, et al. Use of aspirin to reduce risk of initial vascular events in patients at moderate risk of cardiovascular disease (ARRIVE): a randomized, double-blind, placebo-controlled trial. Lancet. 2018;392(10152):1036-1046. doi:10.1016/S0140-6736(18)31924-X
3. Bowman L, Mafham M, et al; ASCEND Study Collaborative Group. Effects of aspirin for primary prevention in persons with diabetes mellitus. N Engl J Med. 2018;379(16):1529-1539. doi:10.1056/NEJMoa1804988
4. McNeil JJ, Wolfe R, Woods, RL, et al. Effect of aspirin on cardiovascular events and bleeding in the healthy elderly. N Engl J Med. 2018;379(16):1509-1518. doi:10.1056/NEJMoa1805819
5. García Rodríguez LA, Martín-Pérez M, Hennekens CH, Rothwell PM, Lanas A. Bleeding risk with long-term low-dose aspirin: a systematic review of observational studies. PloS One. 2016;11(8):e0160046. doi:10.1371/journal.pone.0160046
6. Gallagher P, Ryan C, Byrne S, Kennedy J, O’Mahony D. STOPP (Screening Tool of Older Person’s Prescriptions) and START (Screening Tool to Alert doctors to Right Treatment): consensus validation. Int J Clin Pharmacol Ther. 2008;46(2):72-83. doi:10.5414/cpp46072
7. Zheng SL, Roddick AJ. Association of aspirin use for primary prevention with cardiovascular events and bleeding events: a systematic review and meta-analysis. JAMA. 2019;321(3):277-287. doi:10.1001/jama.2018.20578
8. Patrono C, Baigent C. Role of aspirin in primary prevention of cardiovascular disease. Nat Rev Cardiol. 2019;16(11):675-686. doi:10.1038/s41569-019-0225-y
9. Bibbins-Domingo K; U.S. Preventative Services Task Force. Aspirin use for the primary prevention of cardiovascular disease and colorectal cancer: U.S. Preventive Services Task Force recommendation statement. Ann Intern Med. 2016;164(12):836-845. doi:10.7326/M16-0577
10. American Diabetes Association. Classification and diagnosis of diabetes: standards of medical care in diabetes-2020. Diabetes Care. 2020;43(suppl 1):S14-S31. doi:10.2337/dc20-S002
11. O’Brien CW, Juraschek SP, Wee CC. Prevalence of aspirin use for primary prevention of cardiovascular disease in the United States: results from the 2017 National Health Interview Survey. Ann Intern Med. 2019;171(8):596-598. doi:10.7326/M19-0953
12. Hira RS, Kennedy K, Nambi V, et al. Frequency and practice-level variation in inappropriate aspirin use for the primary prevention of cardiovascular disease: insights from the National Cardiovascular Disease Registry’s Practice Innovation and Clinical Excellence registry. J Am Coll Cardiol. 2015;65(2):111-121. doi:10.1016/j.jacc.2014.10.035
13. Cheong ST, Ng TM, Tan KT. Pharmacist-initiated deprescribing in hospitalized elderly: prevalence and acceptance by physicians. Eur J Hosp Pharm. 2018;25(e1):e35-e39. doi:10.1136/ejhpharm-2017-001251
14. Dyck MJ. Evidence-based administrative guideline: quality improvement in nursing homes. J Gerontol Nurs. 2005;31(2):4-10. doi:10.3928/0098-9134-20050201-04
15. Zullo AR, Gray SL, Holmes HM, Marcum ZA. Screening for medication appropriateness in older adults. Clin Geriatr Med. 2018;34(1):39-54. doi:10.1016/j.cger.2017.09.003
16. American Geriatrics Society. 2019 updated AGS Beers Criteria for potentially inappropriate medication use in older adults. J Am Geriatr Soc. 2019;67(4):674-694. doi:10.1111/jgs.15767
17. Shah BM, Hajjar ER. Polypharmacy, adverse drug reactions, and geriatric syndromes. Clin Geriatr Med. 2012;28(2):173-186. doi:10.1016/j.cger.2012.01.002
18. Page AT, Clifford RM, Potter K, Schwartz D, Etherton-Beer CD. The feasibility and effect of deprescribing in older adults on mortality and health: a systematic review and meta-analysis. Br J Clin Pharmacol. 2016;82(3):583-623. doi:10.1111/bcp.12975
19. Reeve E, Shakib S, Hendrix I, Roberts MS, Wiese MD. The benefits and harms of deprescribing. Med J Aust. 2014;201(7):386-389. doi:10.5694/mja13.00200
20. Ailabouni NJ, Marcum ZA, Schmader KE, Gray SL. Medication use quality and safety in older adults: 2018 update. J Am Geriatr Soc. 2019;67(12):2458-2462. doi:10.1111/jgs.16243
21. Frank C, Weir E. Deprescribing for older patients. CMAJ. 2014;186(18):1369-1376. doi:10.1503/cmaj.131873
22. Clark CM, LaValley SA, Singh R, Mustafa E, Monte SV, Wahler RG Jr. A pharmacist-led program to facilitate deprescribing in a primary care clinic. J Am Pharm Assoc (2003). 2020;60(1):105-111. doi:10.1016/j.japh.2019.09.011
23. Folks B, Leblanc WG, Staton EW, Pace WD. Reconsidering low-dose aspirin therapy for cardiovascular disease: a study protocol for physician and patient behavioral change. Implement Sci. 2011;6:65. Published 2011 Jun 26. doi:10.1186/1748-5908-6-65
24. Odenthal DR, Philbrick AM, Harris IM. Successful deprescribing of unnecessary proton pump inhibitors in a primary care clinic. J Am Pharm Assoc. 2020;60(1):100-104. doi:10.1016/j.japh.2019.08.012
25. Duncan, P. Duerden M, Payne RA. Deprescribing: a primary care perspective. Eur J Hosp Pharm. 2017;24(1):37-42. doi:10.1136/ejhpharm-2016-000967
26. Martin P, Tamblyn R, Benedetti A, Ahmed S, Tannenbaum C. Effect of a pharmacist-led educational intervention on inappropriate medication prescriptions in older adults: the D-PRESCRIBE randomized clinical trial. JAMA. 2018;320(18):1889-1898. doi:10.1001/jama.2018.16131
The use of low-dose aspirin for the primary prevention of cardiovascular disease (CVD) morbidity and mortality continues to be controversial, particularly for older adults. Recently published, robust randomized controlled trials have revealed less cardiovascular benefit from aspirin for primary prevention compared with previous trials; additionally, an increased risk of major bleeding events has been notably more prevalent in older adults.1-5 These trials have suggested that preventative aspirin use in older adults confers less benefit than other therapies for decreasing atherosclerotic CVD (ASCVD) risk, including blood pressure (BP) control, cholesterol management, and tobacco cessation.1,6
A recent meta-analysis indicated a composite cardiovascular risk reduction in patients aged 53 to 74 years taking aspirin vs no aspirin; however, this benefit was offset with an even greater increased risk of major bleeding.7 This trend was consistent regardless of stratification by 10-year ASCVD risk or presence of diabetes mellitus (DM) diagnosis.7,8 Additionally, the recently published Aspirin in Reducing Events in the Elderly (ASPREE) trial studied the impacts of aspirin use in healthy adults aged ≥ 70 years and aged ≥ 65 years among Black and Hispanic adults.4 The study concluded that the risk of major bleeding with aspirin use was even higher vs the potential cardiovascular benefit in older adults.4
With this emerging evidence, guidelines have been updated to represent the need for risk vs benefit considerations regarding aspirin use for primary prevention in older adults.1,9,10 The most recent guideline update from the American College of Cardiology and American Heart Association (ACC/AHA) recommends against the routine use of aspirin in patients aged > 70 years or those with bleeding risk factors.1 The guideline recommends considering aspirin use for patients ages 40 to 70 years only after a patient-specific risk vs benefit discussion.1 Furthermore, the 2020 American Diabetes Association guideline recommends considering aspirin use for primary prevention in adults with DM between ages 50 and 70 only after a risk vs benefit discussion of patient-specific bleeding risk factors and ASCVD risk-enhancing factors.10
Despite the demonstrated risks for bleeding with the routine use of aspirin, studies indicate that aspirin continues to be used commonly among older adults, often when unnecessary. In the 2017 National Health Interview Survey, about 23% of adults aged > 40 years in the United States without CVD used aspirin daily, and 23% of these did so without recommendation from a health care professional.11 Furthermore, nearly half of adults ages ≥ 70 years and nearly one-quarter of adults with a history of peptic ulcer disease used aspirin daily.11 Although the most recent guidelines from the ACC/AHA do not recommend a 10-year ASCVD risk threshold for therapy, one study illustrated that 12% of older adult patients were inappropriately prescribed aspirin for primary prevention despite a 10-year ASCVD risk of < 6%.1,12 These studies highlight the large proportion of individuals, particularly older adults, who may be inappropriately taking aspirin for primary prevention.
Deprescribing Program
Deprescribing potentially inappropriate medications (PIMs) is particularly important in the older adult population, as these individuals experience a high risk of adverse effects (AEs), polypharmacy, cognitive decline, and falls related to medication use.6,13-17 Evidence suggests that mortality outcomes are improved with the implementation of targeted deprescribing efforts based on patient-specific factors.18 Additionally, deprescribing unnecessary medications may improve adherence to other essential medications and reduce financial burdens.19 Pharmacists play a crucial role among health care professionals in the implementation of deprescribing practices, and studies have shown that physicians are highly accepting of pharmacists’ deprescribing recommendations.13,20-22
Despite the evidence for the benefits of deprescribing, limited data are available regarding the impact and feasibility of a targeted aspirin deprescribing approach by nonphysician practitioners.23 The objective of this study was to implement and evaluate the success of a pharmacist-driven aspirin deprescribing protocol for older adults in a primary care setting.
This aspirin deprescribing protocol was developed by ambulatory care clinical pharmacist or clinical pharmacist practitioners (CPPs), at the William S. Middleton Memorial Veterans Hospital in Madison, Wisconsin. Within the US Department of Veterans Affairs (VA) health care system, CPPs work under a broad scope of practice with the ability to independently prescribe and monitor medications. The protocol was reviewed by physician stakeholders in both primary care and cardiology and a list was generated, including patients from 2 primary care panels aged ≥ 70 years with aspirin on their medication list, either as a prescription or over-the-counter medication, using the VA Information System Technology and Architecture. A CPP or supervised pharmacy intern identified patients from this list who were appropriate for risk/benefit discussions regarding the discontinuation of aspirin. Patients were excluded from the intervention if they had a history of clinical ASCVD, including myocardial infarction (MI), stable or unstable angina, coronary artery disease (CAD), coronary or other arterial revascularization, cerebrovascular accident (CVA), transient ischemic accident (TIA), or peripheral artery disease (PAD), or another documented indication for aspirin use, including pain, flushing (with niacin use), venous thromboembolism prophylaxis, valvular heart disease, or acute or recurrent pericarditis.
After identifying eligible patients, a CPP or pharmacy intern contacted patients by telephone, following a script to guide conversation. All patients were screened for potential appropriate aspirin indications, particularly any history of MI, CAD, CVA, TIA, PAD, or other clinical ASCVD. The patient was asked about their rationale for taking aspirin and patient-specific ASCVD risk-enhancing factors and bleeding risk factors and educated them on lifestyle modalities to reduce ASCVD risk, using the script as a guide. ASCVD risk-enhancing factors included family history of premature MI, inability to achieve BP goal, DM with the inability to achieve blood glucose or hemoglobin A1c goal, tobacco use, or inadequate statin therapy. Bleeding risk factors included a history of gastrointestinal bleed or peptic ulcer disease, concurrent use of medications that increase bleeding risk, chronic kidney disease, or thrombocytopenia.
Through shared decision making with careful consideration of these factors, we reached a conclusion with each patient to either continue or to deprescribe aspirin. Each discussion was documented in the electronic health record (EHR) using a standard documentation template (eAppendix, available at doi:10.12788/fp.0320). The patient’s medication list also was updated to reflect changes in aspirin use. For patients who declined deprescribing, the CPP or pharmacy intern asked the patient for their primary reason for preferring to continue aspirin, which was subsequently categorized as one of the following: no prior concerns with bleeding, concerns about a future cardiovascular event, wishing to discuss further with their primary care practitioner (PCP), or identifying an appropriate use for aspirin not evident through record review. For the patients who wished to further discuss the issue with their PCP before deprescribing, the patient’s PCP was notified of this preference by a record alert to the note documenting the encounter, and the patient was also encouraged to follow up about this issue. A voicemail was left if the patient did not answer requesting a call back, and a second attempt was made within 2 weeks.
Data Collected
We collected data to assess the proportion of patients for whom aspirin for primary prevention was discontinued. For patients who declined deprescribing, we documented the rationale for continuing aspirin. Additionally, the feasibility of implementation was assessed, including pharmacist time spent on each record review and intervention. Descriptive statistics were generated to evaluate baseline characteristics and intervention outcomes. The time to completion of these tasks was summarized with descriptive statistics.
We reviewed 459 patient records, and 110 were determined eligible for risk/benefit discussions.
Patients had various reasons for declining deprescribing, including 8 (28%) who had no prior concerns with bleeding while on aspirin and 6 (21%) who were concerned about a future cardiovascular event. Of those who declined aspirin deprescribing, 6 (21%) wished to further discuss the issue with their PCP. In 9 (31%) patients an alternative appropriate indication for aspirin was identified through discussion. In these cases, the indication for aspirin was documented and updated in the EHR.
Most patients (87%) contacted reported taking low-dose aspirin 81 mg daily, while 10% reported taking higher doses (range, 162-325) and 3% on an as-needed basis. In all 3 patients who agreed to dose reduction, the initial dose of 325 mg daily was reduced to 81 mg daily.
Results of the time-study analysis for each intervention indicated that a pharmacy intern or pharmacist spent about 2 minutes reviewing the record of each patient to determine eligibility for risk/benefit discussions. The 110 patients identified as eligible were 24% of the 459 records reviewed. An average (range) of 12 (6-20) minutes was spent on the telephone call plus documentation for each patient contacted. Additionally, we estimated that CPPs and pharmacy interns spent an approximate combined 12 hours in the development and review of materials for this program, including the protocol, script, and documentation templates. This also included about 1 hour to identify appropriate parameters for, and generate, the eligible patient list.
Discussion
The implementation of a pharmacist-driven aspirin deprescribing protocol for older adults in a primary care setting led to the discontinuation of inappropriate aspirin use in nearly half of older adults contacted. Furthermore, opportunities were identified to update medication lists to reflect previously self-discontinued aspirin for older adults. Just over one-quarter of those contacted declined to discontinue or reduce their aspirin dose. It is hypothesized that with these targeted deprescribing interventions, overall risk reduction for bleeding and polypharmacy will be observed for older adults.1
In addition to deprescribing aspirin, CPPs used shared decision making to initiate risk/benefit discussions and to educate on targeted lifestyle modifications to lower ASCVD risk. While not all patients agreed to discontinue aspirin, all were provided education that may empower them to engage in future discussions with PCPs regarding appropriate aspirin use. Previous pharmacist-led deprescribing initiatives for proton pump inhibitors and other PIMs have indicated that a large percentage of patients who opt to further discuss a deprescribing concern with their PCPs ultimately resulted in deprescribing outcomes.24,25 Additionally, a recent trial examining pharmacist-led deprescribing of 4 common PIMs in older adults compared the impact of pharmacists leading educational interventions directly to patients with pharmacists making deprescribing recommendations to physicians. Deprescribing was more successful when patients were involved in the decision-making process.26
Limitations
Although this quality improvement initiative resulted in the deprescribing of inappropriate aspirin for many older adults, a limitation is the small sample size within a single institution. The population of male veterans also may limit generalizability to nonmale and nonveteran older adults. As the protocol was initiated within a limited number of primary care teams initially, future implementation into additional primary care teams will increase the number of older adults impacted by risk/benefit discussions regarding aspirin use. This work may not be generalizable to other health care systems. Many patients within the VA receive both their primary and specialty care within the system, which facilitates communication and collaboration between primary and specialty practitioners. The protocol may require workflow adjustments for patients receiving care within multiple systems. Additionally, although the deprescribing protocol was created in collaboration with physicians, CPPs within the VA work under a broad scope of practice that includes independent medication prescribing, deprescribing, and monitoring. This may be a consideration when implementing similar protocols at other sites, as collaborative practice agreements may need to be in place.
Future Directions
The time required to complete these interventions was generally feasible, though this intervention would require some workflow alteration to be incorporated routinely into a CPP’s schedule. The telephone calls were completed as isolated interventions and were not incorporated into existing scheduled primary care appointments. In the future, the aspirin deprescribing protocol could be incorporated into existing pharmacist-led primary care appointments. Based on the outcomes of this study, CPPs are leading an initiative to develop an aspirin deprescribing clinical reminder tool, which may be quickly inserted into a progress note within the EHR and may be incorporated into any primary care visit led by a CPP or PCP.
Conclusions
This study demonstrates that a pharmacist-led aspirin deprescribing protocol in the ambulatory care pharmacy setting was successful in the discontinuation of unnecessary aspirin use in older adults. The protocol also provided opportunities for education on ASCVD risk reduction in all older adults reached. These findings highlight the role of pharmacists in deprescribing PIMs for older adults and identifying opportunities to further streamline risk/benefit discussions on aspirin deprescribing potential within primary care visits.
1. Arnett DK, Blumenthal RS, Albert MA, et al. 2019 ACC/AHA guideline on the primary prevention of cardiovascular disease: a report of the American College of Cardiology/American Heart Association Task Force on clinical practice guidelines. Circulation. 2019;140(11):e596-e646. doi:10.1161/CIR.0000000000000678
2. Gaziano JM, Brotons C, Coppolecchia R, et al. Use of aspirin to reduce risk of initial vascular events in patients at moderate risk of cardiovascular disease (ARRIVE): a randomized, double-blind, placebo-controlled trial. Lancet. 2018;392(10152):1036-1046. doi:10.1016/S0140-6736(18)31924-X
3. Bowman L, Mafham M, et al; ASCEND Study Collaborative Group. Effects of aspirin for primary prevention in persons with diabetes mellitus. N Engl J Med. 2018;379(16):1529-1539. doi:10.1056/NEJMoa1804988
4. McNeil JJ, Wolfe R, Woods, RL, et al. Effect of aspirin on cardiovascular events and bleeding in the healthy elderly. N Engl J Med. 2018;379(16):1509-1518. doi:10.1056/NEJMoa1805819
5. García Rodríguez LA, Martín-Pérez M, Hennekens CH, Rothwell PM, Lanas A. Bleeding risk with long-term low-dose aspirin: a systematic review of observational studies. PloS One. 2016;11(8):e0160046. doi:10.1371/journal.pone.0160046
6. Gallagher P, Ryan C, Byrne S, Kennedy J, O’Mahony D. STOPP (Screening Tool of Older Person’s Prescriptions) and START (Screening Tool to Alert doctors to Right Treatment): consensus validation. Int J Clin Pharmacol Ther. 2008;46(2):72-83. doi:10.5414/cpp46072
7. Zheng SL, Roddick AJ. Association of aspirin use for primary prevention with cardiovascular events and bleeding events: a systematic review and meta-analysis. JAMA. 2019;321(3):277-287. doi:10.1001/jama.2018.20578
8. Patrono C, Baigent C. Role of aspirin in primary prevention of cardiovascular disease. Nat Rev Cardiol. 2019;16(11):675-686. doi:10.1038/s41569-019-0225-y
9. Bibbins-Domingo K; U.S. Preventative Services Task Force. Aspirin use for the primary prevention of cardiovascular disease and colorectal cancer: U.S. Preventive Services Task Force recommendation statement. Ann Intern Med. 2016;164(12):836-845. doi:10.7326/M16-0577
10. American Diabetes Association. Classification and diagnosis of diabetes: standards of medical care in diabetes-2020. Diabetes Care. 2020;43(suppl 1):S14-S31. doi:10.2337/dc20-S002
11. O’Brien CW, Juraschek SP, Wee CC. Prevalence of aspirin use for primary prevention of cardiovascular disease in the United States: results from the 2017 National Health Interview Survey. Ann Intern Med. 2019;171(8):596-598. doi:10.7326/M19-0953
12. Hira RS, Kennedy K, Nambi V, et al. Frequency and practice-level variation in inappropriate aspirin use for the primary prevention of cardiovascular disease: insights from the National Cardiovascular Disease Registry’s Practice Innovation and Clinical Excellence registry. J Am Coll Cardiol. 2015;65(2):111-121. doi:10.1016/j.jacc.2014.10.035
13. Cheong ST, Ng TM, Tan KT. Pharmacist-initiated deprescribing in hospitalized elderly: prevalence and acceptance by physicians. Eur J Hosp Pharm. 2018;25(e1):e35-e39. doi:10.1136/ejhpharm-2017-001251
14. Dyck MJ. Evidence-based administrative guideline: quality improvement in nursing homes. J Gerontol Nurs. 2005;31(2):4-10. doi:10.3928/0098-9134-20050201-04
15. Zullo AR, Gray SL, Holmes HM, Marcum ZA. Screening for medication appropriateness in older adults. Clin Geriatr Med. 2018;34(1):39-54. doi:10.1016/j.cger.2017.09.003
16. American Geriatrics Society. 2019 updated AGS Beers Criteria for potentially inappropriate medication use in older adults. J Am Geriatr Soc. 2019;67(4):674-694. doi:10.1111/jgs.15767
17. Shah BM, Hajjar ER. Polypharmacy, adverse drug reactions, and geriatric syndromes. Clin Geriatr Med. 2012;28(2):173-186. doi:10.1016/j.cger.2012.01.002
18. Page AT, Clifford RM, Potter K, Schwartz D, Etherton-Beer CD. The feasibility and effect of deprescribing in older adults on mortality and health: a systematic review and meta-analysis. Br J Clin Pharmacol. 2016;82(3):583-623. doi:10.1111/bcp.12975
19. Reeve E, Shakib S, Hendrix I, Roberts MS, Wiese MD. The benefits and harms of deprescribing. Med J Aust. 2014;201(7):386-389. doi:10.5694/mja13.00200
20. Ailabouni NJ, Marcum ZA, Schmader KE, Gray SL. Medication use quality and safety in older adults: 2018 update. J Am Geriatr Soc. 2019;67(12):2458-2462. doi:10.1111/jgs.16243
21. Frank C, Weir E. Deprescribing for older patients. CMAJ. 2014;186(18):1369-1376. doi:10.1503/cmaj.131873
22. Clark CM, LaValley SA, Singh R, Mustafa E, Monte SV, Wahler RG Jr. A pharmacist-led program to facilitate deprescribing in a primary care clinic. J Am Pharm Assoc (2003). 2020;60(1):105-111. doi:10.1016/j.japh.2019.09.011
23. Folks B, Leblanc WG, Staton EW, Pace WD. Reconsidering low-dose aspirin therapy for cardiovascular disease: a study protocol for physician and patient behavioral change. Implement Sci. 2011;6:65. Published 2011 Jun 26. doi:10.1186/1748-5908-6-65
24. Odenthal DR, Philbrick AM, Harris IM. Successful deprescribing of unnecessary proton pump inhibitors in a primary care clinic. J Am Pharm Assoc. 2020;60(1):100-104. doi:10.1016/j.japh.2019.08.012
25. Duncan, P. Duerden M, Payne RA. Deprescribing: a primary care perspective. Eur J Hosp Pharm. 2017;24(1):37-42. doi:10.1136/ejhpharm-2016-000967
26. Martin P, Tamblyn R, Benedetti A, Ahmed S, Tannenbaum C. Effect of a pharmacist-led educational intervention on inappropriate medication prescriptions in older adults: the D-PRESCRIBE randomized clinical trial. JAMA. 2018;320(18):1889-1898. doi:10.1001/jama.2018.16131
Preoperative Insulin Intensification to Improve Day of Surgery Blood Glucose Control
Perioperative hyperglycemia, defined as blood glucose levels ≥ 180 mg/dL in the immediate pre- and postoperative period, is associated with increased postoperative morbidity, including infections, preoperative interventions, and in-hospital mortality.1-3 Despite being identified as a barrier to optimal perioperative glycemic control, limited evidence is available on patient or health care practitioner (HCP) adherence to preoperative insulin protocols.4-6
Background
Despite mounting evidence of the advantages of maintaining perioperative glucose levels between 80 and 180 mg/dL, available guidelines vary in their recommendations for long-acting basal insulin dosing.7-10 The Society of Ambulatory Anesthesia suggests using 100% of the prescribed evening dosage of long-acting basal insulin dose on the night before surgery in patients without a history of nocturnal or morning hypoglycemia (category 2A evidence).9 However, the revised 2016 United Kingdom National Health Service consensus guideline recommends using 80% to 100% of the prescribed evening dosage of long-acting basal insulin dose on the night before surgery.7 The 2022 American Diabetes Association references an observational study of patients with type 2 DM (T2DM) treated with evening-only, long-acting glargine insulin, indicating that the optimal basal insulin dose on the evening before surgery is about 75% of the outpatient dose.5,10 However, in a randomized, prospective open trial of patients with DM treated with evening-only long-acting basal insulin, no significant difference was noted in the target day of surgery (DOS) glucose levels among different dosing strategies on the evening before surgery.6 Presently, the optimal dose of long-acting insulin analogs on the evening before surgery is unknown.
Additionally, little is known about the other factors that influence perioperative glycemic control. Several barriers to optimal perioperative care of patients with DM have been identified, including lack of prioritization by HCPs, lack of knowledge about current evidence-based recommendations, and lack of patient information and involvement.4 To determine the effect of patient adherence to preoperative medication instructions on postoperative outcome, a cross-sectional study assessed surgical patients admitted to the postanesthetic care unit (PACU) and found that only 70% of patients with insulin-treated DM took their medications preoperatively. Additionally, 23% of nonadherent patients who omitted their medications either did not understand or forgot preoperative medication management instructions. Preoperative DM medication omission was associated with higher rates of hyperglycemia in the PACU (23.8% vs 3.6%; P = .02).11 Importantly, to our knowledge, the extent of HCP adherence to DM management protocols and the subsequent effect on DOS hyperglycemia has not been examined until now.For patients with DM treated with an evening dose of long-acting basal insulin (ie, either once-daily long-acting basal insulin in the evening or twice-daily long-acting basal insulin, both morning and evening) presenting for elective noncardiac surgery, our aim was to decrease the rate of DOS hyperglycemia from 29% (our baseline) to 15% by intensifying the dose of insulin on the evening before surgery without increasing the rate of hypoglycemia. We also sought to determine the rates of HCP adherence to our insulin protocols as well as patients’ self-reported adherence to HCP instructions over the course of this quality improvement (QI) initiative.
Quality Improvement Program
Our surgical department consists of 11 surgical subspecialties that performed approximately 4400 noncardiac surgeries in 2019. All patients undergoing elective surgery are evaluated in the preoperative clinic, which is staffed by an anesthesiology professional (attending and resident physicians, nurse practitioners, and physician assistants) and internal medicine attending physicians. At the preoperative visit, each patient is evaluated by anesthesiology; medically complex patients may also be referred to an internal medicine professional for further risk stratification and optimization before surgery.
At the preoperative clinic visit, HCPs prepare written patient instructions for the preoperative management of medications, including glucose-lowering medications, based on a DM management protocol that was implemented in 2016 for the preoperative management of insulin, noninsulin injectable agents, and oral hyperglycemic agents. According to this protocol, patients with DM treated with evening long-acting basal insulin (eg, glargine insulin) are instructed to take 50% of their usual evening dose the evening before surgery. A preoperative clinic nurse reviews the final preoperative medication instructions with the patient at the end of the clinic visit. Patients are also instructed to avoid oral intake other than water and necessary medications after midnight before surgery regardless of the time of surgery. On the DOS, the patient’s blood glucose level is measured on arrival to the presurgical area.
Our QI initiative focused only on the dose of self-administered, long-acting basal insulin on the evening before surgery. The effect of the morning of surgery long-acting insulin dose on the DOS glucose levels largely depends on the timing of surgery, which is variable; therefore, we did not target this dose for our initiative. Patients receiving intermediate-acting neutral protamine Hagedorn (NPH) insulin were excluded because our protocol does not recommend a dose reduction for NPH insulin on the evening before surgery.
We developed a comprehensive driver diagram to help elucidate the different factors contributing to DOS hyperglycemia and to guide specific QI interventions.12 Some of the identified contributors to DOS hyperglycemia, such as the length of preoperative fasting and timing of surgery, are unpredictable and were deemed difficult to address preoperatively. Other contributors to DOS hyperglycemia, such as outpatient DM management, often require interventions over several months, which is well beyond the time usually allotted for preoperative evaluation and optimization. On the other hand, immediate preoperative insulin dosing directly affects DOS glycemic control; therefore, improvement of the preoperative insulin management protocol to optimize the dosage on the evening before surgery was considered to be an achievable QI goal with the potential for decreasing the rate of DOS hyperglycemia in patients presenting for elective noncardiac surgery.
We used the Model for Understanding Success in Quality (MUSIQ) as a framework to identify key contextual factors that may affect the success of our QI project.13 Limited resource availability and difficulty with dissemination of protocol changes in the preoperative clinic were determined to be potential barriers to the successful implementation of our QI initiative. Nonetheless, senior leadership support, microsystem QI culture, QI team skills, and physician involvement supported the implementation. The revised Standards for Quality Improvement Reporting Excellence (SQUIRE 2.0) guidelines were followed for this study.14
Interventions
With stakeholder input from anesthesiology, internal medicine, endocrinology, and nursing, we designed an intervention to iteratively change the HCP protocol instructions for long-acting insulin dosing on the evening before surgery. In phase 1 of the study (October 1, 2018, to March 11, 2019), we obtained baseline data on the rates of DOS hyperglycemia (blood glucose ≥ 180 mg/dL) and hypoglycemia (blood glucose < 80 mg/dL), as well as patient and HCP adherence rates to our existing preoperative DM protocol. For phase 2 (March 12, 2019, to July 22, 2019), the preoperative DM management protocol was changed to increase the dose of long-acting basal insulin on the evening before surgery for patients with hemoglobin A1c (HbA1c) levels > 8% from 50% of the usual outpatient dose to 100%. Finally, in phase 3 (July 23, 2019, to March 12, 2020), the protocol was changed to increase the dose of long-acting basal insulin on the evening before surgery for patients with HbA1c levels ≤ 8% from 50% of the usual outpatient dose to 75% while sustaining the phase 2 change. Preoperative HCPs were informed of the protocol changes in person and were provided with electronic and hard copies of each new protocol.
Protocol
We used a prospective cohort design of 424 consecutive patients with DM who presented for preoperative evaluation for elective noncardiac surgery between October 1, 2018, and March 12, 2020. For the subset of 195 patients treated with an evening dose of long-acting basal insulin, we examined the effect of intensification of this preoperative basal insulin dose on DOS hyperglycemia and hypoglycemia, HCP adherence to iterative changes of the protocol, and patient adherence to HCP instructions on preoperative medication dosing. The QI project was concluded when elective surgeries were paused due to the COVID-19 pandemic.
We created a standardized preoperative data collection form that included information on the most recent HbA1c, time, dose, and type of patient-administered insulin on the evening before surgery, and DOS blood glucose level. A preoperative clinic nurse completed the standardized preoperative data collection form. The HCP’s preoperative medication instructions and the preoperative data collection forms were gathered for review and data analysis.
The primary outcome was DOS hyperglycemia (blood glucose levels ≥ 180 mg/dL). We monitored the rate of DOS hypoglycemia (blood glucose levels < 80 mg/dL) as a balancing measure to ensure safety with long-acting basal insulin intensification. Although hypoglycemia is defined as a blood glucose level < 70 mg/dL, a target glucose range of 80 mg/dL to 180 mg/dL is recommended during the perioperative period.8 Therefore, we chose a more conservative definition of hypoglycemia (blood glucose levels < 80 mg/dL) to adhere to the recommended perioperative glucose target range.
Process measures included HCP adherence to each protocol change, which was assessed by comparing written preoperative patient instructions to the current protocol. Similarly, patient adherence to HCP-recommended long-acting basal insulin dosing was assessed by comparing written preoperative patient instructions to the patient’s self-reported time and dose of long-acting basal insulin on the evening before surgery. For any discrepancy between the HCP instructions and protocol or HCP-recommended dose and patient self-reported dose of long-acting basal insulin, a detailed chart review was performed to determine the etiology.
Statistical Analysis
We used the statistical process p-control chart to assess the effect of iterative changes to the preoperative long-acting basal insulin protocol on DOS hyperglycemia. The proportion defective (rate of DOS hyperglycemia) was plotted against time to determine whether the observed variations in the rate of DOS hyperglycemia over time were attributable to random common causes or special causes because of our intervention. The lower control limit (LCL) and upper control limit (UCL) define the limits of expected outcome measures in a stable process prior to introducing changes and were set at 3 SDs from the mean to balance the likelihood of type I (false-positive) and type II (false-negative) errors. Because of the variable interval sample sizes, we used the CRITBINOM function of Microsoft Excel to calculate the exact UCL satisfying the 3 SD limits of 0.99865.15 The Shewhart rules (outliers, runs or shifts, trends, sawtooth) were used to analyze the p-control chart to identify special cause signals resulting from our interventions.16 We used the statistical process t-control chart to record the time (days) between the few occurrences of DOS hypoglycemia because cases of hypoglycemia were rare.
Ethical Consideration
The Human Research Protection Program, Associate Chief of Staff for Research and Development, and Quality, Safety, and Values department reviewed this project in accordance with the Veterans Health Administration Program Guide 1200.21 and determined that it was a nonresearch operations activity; thus, approval by an institutional review board was not needed. The authors declare no competing interests.
Patient Outcomes
We prospectively followed 424 consecutive patients with DM undergoing elective noncardiac surgery from the time of the preoperative clinic evaluation until DOS; 195 patients were on evening 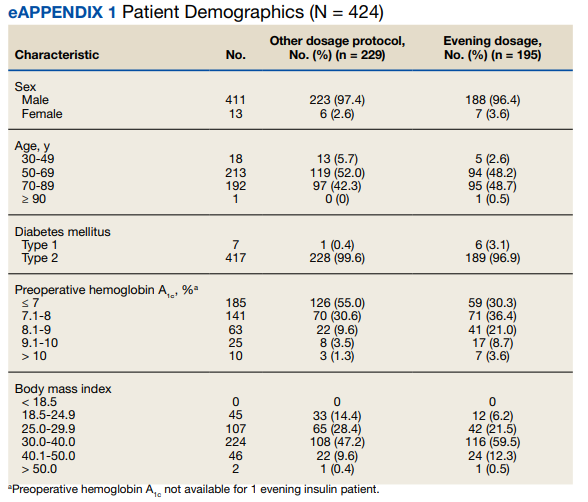
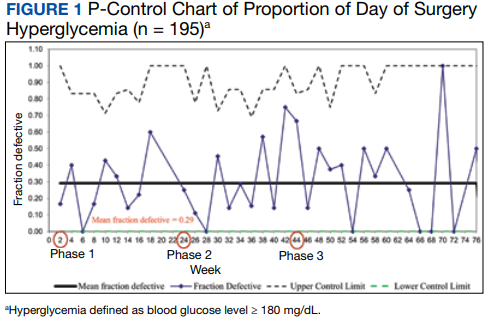
A subgroup analysis of DOS glucose levels in insulin-treated patients with preoperative HbA1c levels > 8% did not demonstrate a change in the rate of
Only 7 of 424 (1.7%) patients with DM and 4 of 195 (2.1%) patients treated with evening, long-acting basal insulin had marked hyperglycemia (DOS glucose levels ≥ 300 mg/dL). Only 1 patient who was not on outpatient insulin treatment had surgery canceled for hyperglycemia. 
Overall, 89% of the HCPs followed the preoperative insulin protocol. HCP adherence to the protocol decreased to 77% after the phase 2 change, often related to deviations from the protocol or when a prior version was used. By the end of phase 3, HCP adherence returned to the baseline rate (88%). Patient adherence to medication instructions was not affected by protocol changes (86% throughout the study period). Prospective data collection was briefly interrupted between January 18, 2019, and March 5, 2019, while designing our phase 2 intervention. We were unable to track the total number of eligible patients during this time, but were able to identify 8 insulin-treated patients with DM who underwent elective noncardiac surgery and included their data in phase 1.
Discussion
The management and prevention of immediate perioperative hyperglycemia and glycemic variability have attracted attention as evidence has mounted for their association with postoperative morbidity and mortality.1,2,17 Available guidelines for preventing DOS hyperglycemia vary in their recommendations for preoperative insulin management.7-10 Notably, concerns about iatrogenic hypoglycemia often hinder efforts to lower rates of DOS hyperglycemia.4 We successfully implemented an iterative intensification protocol for preoperative long-acting basal insulin doses on the evening before surgery but did not observe a lower rate of hyperglycemia. Importantly, we also did not observe a higher rate of hypoglycemia on the DOS, as observed in a previous study.5
The observational study by Demma and colleagues found that patients receiving 75% of their evening, long-acting basal insulin dose were significantly more likely to achieve target blood glucose levels of 100 to 180 mg/dL than patients receiving no insulin at all (78% vs 0%; P = .001). However, no significant difference was noted when this group was compared with patients receiving 50% of their evening, long-acting basal insulin doses (78% vs 70%; P = .56). This is more clinically pertinent as it is generally accepted that the evening, long-acting insulin dose should not be entirely withheld on the evening before surgery.5
These findings are consistent with our observation that the rate of DOS hyperglycemia did not decrease with intensification of the evening, long-acting insulin dose from 50% to 100% of the prescribed dose in patients with HbA1c levels > 8% (phase 2) and 50% to 75% of the prescribed dose in patients with HbA1c levels ≤ 8% (phase 3). In the study by Demma and colleagues, few patients presented with preoperative hypoglycemia (2.7%) but all had received 100% of their evening, long-acting basal insulin dose, suggesting a significant increase in the rate of hypoglycemia compared with patients receiving lower doses of insulin (P = .01).5 However, long-term DM control as assessed by HbA1c level was available for < 10% of the patients, making it difficult to evaluate the effect of overall DM control on the results.5 In our study, preoperative HbA1c levels were available for 99.5% of the patients and only those with HbA1c levels > 8% received 100% of their evening, long-acting insulin dose on the evening before surgery. Notably, we did not observe a higher rate of hypoglycemia in this patient population, indicating that preoperative insulin dose intensification is safe for this subgroup.
Although HCP adherence to perioperative DM management protocols has been identified as a predominant barrier to the delivery of optimal perioperative DM care, prior studies of various preoperative insulin protocols to reduce perioperative hyperglycemia have not reported HCP adherence to their insulin protocols or its effect on DOS hyperglycemia.4-6 Additionally, patient adherence to HCP instructions is a key factor identified in our driver diagram that may influence DOS hyperglycemia, a hypothesis that is supported by a prior cross-sectional study showing an increased rate of hyperglycemia in the PACU with omission of preoperative DM medication.11 In our study, patient adherence to preoperative medication management instructions was higher than reported previously and remained consistently high regardless of protocol changes, which may explain why patient adherence did not affect the rate of DOS hyperglycemia.
Although not part of our study protocol, our preoperative HCPs routinely prepare written patient instructions for the preoperative management of medications for all patients, which likely explains higher patient adherence to instructions in our study than seen in the previous study where written instructions were only encouraged.11 However, HCP adherence to the protocol decreased after our phase 2 changes and was associated with a transient increase in DOS hyperglycemia rates. The DOS hyperglycemia rates returned to baseline levels with ongoing QI efforts and education to improve HCP adherence to protocol.
Limitations
Our QI initiative had several limitations. Nearly all patients were male veterans with T2DM, and most were older (range, 50-89 years). This limits the generalizability to women, younger patients, and people with type 1 DM. Additionally, our data collection relied on completion and collection of the preoperative form by different HCPs, allowing for sampling bias if some patients with DM undergoing elective noncardiac surgery were missed. Furthermore, although we could verify HCP adherence to the preoperative DM management protocols by reviewing their written instructions, we relied on patients’ self-reported adherence to the preoperative instructions. Finally, we did not evaluate postoperative blood glucose levels because the effect of intraoperative factors such as fluid, insulin, and glucocorticoid administration on postoperative glucose levels are variable. To the best of our knowledge, no other major systematic changes occurred in the preoperative care of patients with DM during the study period.
Conclusions
The findings of our QI initiative suggest that HCP adherence to preoperative DM management protocols may be a key contributor to DOS hyperglycemia and that ensuring HCP adherence may be as important as preoperative insulin dose adjustments. To our knowledge, this is the first study to report rates of HCP adherence to preoperative DM management protocols and its effect on DOS hyperglycemia. We will focus future QI efforts on optimizing HCP adherence to preoperative DM management protocols at our institution.
Acknowledgments
We thank our endocrinology expert, Dr. Kristina Utzschneider, for her guidance in designing this improvement project and our academic research coach, Dr. Helene Starks, for her help in editing the manuscript.
1. van den Boom W, Schroeder RA, Manning MW, Setji TL, Fiestan GO, Dunson DB. Effect of A1c and glucose on postoperative mortality in noncardiac and cardiac surgeries. Diabetes Care. 2018;41(4):782-788. doi:10.2337/dc17-2232
2. Punthakee Z, Iglesias PP, Alonso-Coello P, et al. Association of preoperative glucose concentration with myocardial injury and death after non-cardiac surgery (GlucoVISION): a prospective cohort study. Lancet Diabetes Endocrinol. 2018;6(10):790-797. doi:10.1016/S2213-8587(18)30205-5
3. Kwon S, Thompson R, Dellinger P, Yanez D, Farrohki E, Flum D. Importance of perioperative glycemic control in general surgery: a report from the Surgical Care and Outcomes Assessment Program. Ann Surg. 2013;257(1):8-14. doi:10.1097/SLA.0b013e31827b6bbc
4. Hommel I, van Gurp PJ, den Broeder AA, et al. Reactive rather than proactive diabetes management in the perioperative period. Horm Metab Res. 2017;49(7):527-533. doi:10.1055/s-0043-105501
5. Demma LJ, Carlson KT, Duggan EW, Morrow JG 3rd, Umpierrez G. Effect of basal insulin dosage on blood glucose concentration in ambulatory surgery patients with type 2 diabetes. J Clin Anesth. 2017;36:184-188. doi:10.1016/j.jclinane.2016.10.003
6. Rosenblatt SI, Dukatz T, Jahn R, et al. Insulin glargine dosing before next-day surgery: comparing three strategies. J Clin Anesth. 2012;24(8):610-617. doi:10.1016/j.jclinane.2012.02.010
7. Dhatariya K, Levy N, Flanagen D, et al; Joint British Diabetes Societies for Inpatient Care. Management of adults with diabetes undergoing surgery and elective procedures: improving standards. Summary. Published 2011. Revised March 2016. Accessed October 31, 2022. https://www.diabetes.org.uk/resources-s3/2017-09/Surgical%20guideline%202015%20-%20summary%20FINAL%20amended%20Mar%202016.pdf
8. American Diabetes Association. 15. Diabetes care in the hospital: standards of medical care in diabetes–2021. Diabetes Care. 2021;44(suppl 1):S211-S220. doi:10.2337/dc21-S015
9. Joshi GP, Chung F, Vann MA, et al; Society for Ambulatory Anesthesia. Society for Ambulatory Anesthesia consensus statement on perioperative blood glucose management in diabetic patients undergoing ambulatory surgery. Anesth Analg. 2010;111(6):1378-1387. doi:10.1213/ANE.0b013e3181f9c288
10. American Diabetes Association Professional Practice Committee. 16. Diabetes care in the hospital: standards of medical care in diabetes–2022. Diabetes Care. 2021;45(suppl 1):S244-S253. doi:10.2337/dc22-S016
11. Notaras AP, Demetriou E, Galvin J, Ben-Menachem E. A cross-sectional study of preoperative medication adherence and early postoperative recovery. J Clin Anesth. 2016;35:129-135. doi:10.1016/j.jclinane.2016.07.007
12. Bennett B, Provost L. What’s your theory? Driver diagram serves as tool for building and testing theories for improvement. Quality Progress. 2015;48(7):36-43. Accessed August 31, 2022. http://www.apiweb.org/QP_whats-your-theory_201507.pdf
13. Kaplan HC, Provost LP, Froehle CM, Margolis PA. The Model for Understanding Success in Quality (MUSIQ): building a theory of context in healthcare quality improvement. BMJ Qual Saf. 2012;21(1):13-20. doi:10.1136/bmjqs-2011-000010
14. Ogrinc G, Davies L, Goodman D, Batalden P, Davidoff F, Stevens D. SQUIRE 2.0 (Standards for QUality Improvement Reporting Excellence): revised publication guidelines from a detailed consensus process. BMJ Qual Saf. 2016;25(12):986-992. doi:10.1136/bmjqs-2015-004411
15. Duclos A, Voirin N. The p-control chart: a tool for care improvement. Int J Qual Health Care. 2010;22(5):402-407. doi:10.1093/intqhc/mzq037
16. Cheung YY, Jung B, Sohn JH, Ogrinc G. Quality initiatives: statistical control charts: simplifying the analysis of data for quality improvement. Radiographics. 2012;32(7):2113-2126. doi:10.1148/rg.327125713
17. Simha V, Shah P. Perioperative glucose control in patients with diabetes undergoing elective surgery. JAMA. 2019;321(4):399. doi:10.1001/jama.2018.20922
Perioperative hyperglycemia, defined as blood glucose levels ≥ 180 mg/dL in the immediate pre- and postoperative period, is associated with increased postoperative morbidity, including infections, preoperative interventions, and in-hospital mortality.1-3 Despite being identified as a barrier to optimal perioperative glycemic control, limited evidence is available on patient or health care practitioner (HCP) adherence to preoperative insulin protocols.4-6
Background
Despite mounting evidence of the advantages of maintaining perioperative glucose levels between 80 and 180 mg/dL, available guidelines vary in their recommendations for long-acting basal insulin dosing.7-10 The Society of Ambulatory Anesthesia suggests using 100% of the prescribed evening dosage of long-acting basal insulin dose on the night before surgery in patients without a history of nocturnal or morning hypoglycemia (category 2A evidence).9 However, the revised 2016 United Kingdom National Health Service consensus guideline recommends using 80% to 100% of the prescribed evening dosage of long-acting basal insulin dose on the night before surgery.7 The 2022 American Diabetes Association references an observational study of patients with type 2 DM (T2DM) treated with evening-only, long-acting glargine insulin, indicating that the optimal basal insulin dose on the evening before surgery is about 75% of the outpatient dose.5,10 However, in a randomized, prospective open trial of patients with DM treated with evening-only long-acting basal insulin, no significant difference was noted in the target day of surgery (DOS) glucose levels among different dosing strategies on the evening before surgery.6 Presently, the optimal dose of long-acting insulin analogs on the evening before surgery is unknown.
Additionally, little is known about the other factors that influence perioperative glycemic control. Several barriers to optimal perioperative care of patients with DM have been identified, including lack of prioritization by HCPs, lack of knowledge about current evidence-based recommendations, and lack of patient information and involvement.4 To determine the effect of patient adherence to preoperative medication instructions on postoperative outcome, a cross-sectional study assessed surgical patients admitted to the postanesthetic care unit (PACU) and found that only 70% of patients with insulin-treated DM took their medications preoperatively. Additionally, 23% of nonadherent patients who omitted their medications either did not understand or forgot preoperative medication management instructions. Preoperative DM medication omission was associated with higher rates of hyperglycemia in the PACU (23.8% vs 3.6%; P = .02).11 Importantly, to our knowledge, the extent of HCP adherence to DM management protocols and the subsequent effect on DOS hyperglycemia has not been examined until now.For patients with DM treated with an evening dose of long-acting basal insulin (ie, either once-daily long-acting basal insulin in the evening or twice-daily long-acting basal insulin, both morning and evening) presenting for elective noncardiac surgery, our aim was to decrease the rate of DOS hyperglycemia from 29% (our baseline) to 15% by intensifying the dose of insulin on the evening before surgery without increasing the rate of hypoglycemia. We also sought to determine the rates of HCP adherence to our insulin protocols as well as patients’ self-reported adherence to HCP instructions over the course of this quality improvement (QI) initiative.
Quality Improvement Program
Our surgical department consists of 11 surgical subspecialties that performed approximately 4400 noncardiac surgeries in 2019. All patients undergoing elective surgery are evaluated in the preoperative clinic, which is staffed by an anesthesiology professional (attending and resident physicians, nurse practitioners, and physician assistants) and internal medicine attending physicians. At the preoperative visit, each patient is evaluated by anesthesiology; medically complex patients may also be referred to an internal medicine professional for further risk stratification and optimization before surgery.
At the preoperative clinic visit, HCPs prepare written patient instructions for the preoperative management of medications, including glucose-lowering medications, based on a DM management protocol that was implemented in 2016 for the preoperative management of insulin, noninsulin injectable agents, and oral hyperglycemic agents. According to this protocol, patients with DM treated with evening long-acting basal insulin (eg, glargine insulin) are instructed to take 50% of their usual evening dose the evening before surgery. A preoperative clinic nurse reviews the final preoperative medication instructions with the patient at the end of the clinic visit. Patients are also instructed to avoid oral intake other than water and necessary medications after midnight before surgery regardless of the time of surgery. On the DOS, the patient’s blood glucose level is measured on arrival to the presurgical area.
Our QI initiative focused only on the dose of self-administered, long-acting basal insulin on the evening before surgery. The effect of the morning of surgery long-acting insulin dose on the DOS glucose levels largely depends on the timing of surgery, which is variable; therefore, we did not target this dose for our initiative. Patients receiving intermediate-acting neutral protamine Hagedorn (NPH) insulin were excluded because our protocol does not recommend a dose reduction for NPH insulin on the evening before surgery.
We developed a comprehensive driver diagram to help elucidate the different factors contributing to DOS hyperglycemia and to guide specific QI interventions.12 Some of the identified contributors to DOS hyperglycemia, such as the length of preoperative fasting and timing of surgery, are unpredictable and were deemed difficult to address preoperatively. Other contributors to DOS hyperglycemia, such as outpatient DM management, often require interventions over several months, which is well beyond the time usually allotted for preoperative evaluation and optimization. On the other hand, immediate preoperative insulin dosing directly affects DOS glycemic control; therefore, improvement of the preoperative insulin management protocol to optimize the dosage on the evening before surgery was considered to be an achievable QI goal with the potential for decreasing the rate of DOS hyperglycemia in patients presenting for elective noncardiac surgery.
We used the Model for Understanding Success in Quality (MUSIQ) as a framework to identify key contextual factors that may affect the success of our QI project.13 Limited resource availability and difficulty with dissemination of protocol changes in the preoperative clinic were determined to be potential barriers to the successful implementation of our QI initiative. Nonetheless, senior leadership support, microsystem QI culture, QI team skills, and physician involvement supported the implementation. The revised Standards for Quality Improvement Reporting Excellence (SQUIRE 2.0) guidelines were followed for this study.14
Interventions
With stakeholder input from anesthesiology, internal medicine, endocrinology, and nursing, we designed an intervention to iteratively change the HCP protocol instructions for long-acting insulin dosing on the evening before surgery. In phase 1 of the study (October 1, 2018, to March 11, 2019), we obtained baseline data on the rates of DOS hyperglycemia (blood glucose ≥ 180 mg/dL) and hypoglycemia (blood glucose < 80 mg/dL), as well as patient and HCP adherence rates to our existing preoperative DM protocol. For phase 2 (March 12, 2019, to July 22, 2019), the preoperative DM management protocol was changed to increase the dose of long-acting basal insulin on the evening before surgery for patients with hemoglobin A1c (HbA1c) levels > 8% from 50% of the usual outpatient dose to 100%. Finally, in phase 3 (July 23, 2019, to March 12, 2020), the protocol was changed to increase the dose of long-acting basal insulin on the evening before surgery for patients with HbA1c levels ≤ 8% from 50% of the usual outpatient dose to 75% while sustaining the phase 2 change. Preoperative HCPs were informed of the protocol changes in person and were provided with electronic and hard copies of each new protocol.
Protocol
We used a prospective cohort design of 424 consecutive patients with DM who presented for preoperative evaluation for elective noncardiac surgery between October 1, 2018, and March 12, 2020. For the subset of 195 patients treated with an evening dose of long-acting basal insulin, we examined the effect of intensification of this preoperative basal insulin dose on DOS hyperglycemia and hypoglycemia, HCP adherence to iterative changes of the protocol, and patient adherence to HCP instructions on preoperative medication dosing. The QI project was concluded when elective surgeries were paused due to the COVID-19 pandemic.
We created a standardized preoperative data collection form that included information on the most recent HbA1c, time, dose, and type of patient-administered insulin on the evening before surgery, and DOS blood glucose level. A preoperative clinic nurse completed the standardized preoperative data collection form. The HCP’s preoperative medication instructions and the preoperative data collection forms were gathered for review and data analysis.
The primary outcome was DOS hyperglycemia (blood glucose levels ≥ 180 mg/dL). We monitored the rate of DOS hypoglycemia (blood glucose levels < 80 mg/dL) as a balancing measure to ensure safety with long-acting basal insulin intensification. Although hypoglycemia is defined as a blood glucose level < 70 mg/dL, a target glucose range of 80 mg/dL to 180 mg/dL is recommended during the perioperative period.8 Therefore, we chose a more conservative definition of hypoglycemia (blood glucose levels < 80 mg/dL) to adhere to the recommended perioperative glucose target range.
Process measures included HCP adherence to each protocol change, which was assessed by comparing written preoperative patient instructions to the current protocol. Similarly, patient adherence to HCP-recommended long-acting basal insulin dosing was assessed by comparing written preoperative patient instructions to the patient’s self-reported time and dose of long-acting basal insulin on the evening before surgery. For any discrepancy between the HCP instructions and protocol or HCP-recommended dose and patient self-reported dose of long-acting basal insulin, a detailed chart review was performed to determine the etiology.
Statistical Analysis
We used the statistical process p-control chart to assess the effect of iterative changes to the preoperative long-acting basal insulin protocol on DOS hyperglycemia. The proportion defective (rate of DOS hyperglycemia) was plotted against time to determine whether the observed variations in the rate of DOS hyperglycemia over time were attributable to random common causes or special causes because of our intervention. The lower control limit (LCL) and upper control limit (UCL) define the limits of expected outcome measures in a stable process prior to introducing changes and were set at 3 SDs from the mean to balance the likelihood of type I (false-positive) and type II (false-negative) errors. Because of the variable interval sample sizes, we used the CRITBINOM function of Microsoft Excel to calculate the exact UCL satisfying the 3 SD limits of 0.99865.15 The Shewhart rules (outliers, runs or shifts, trends, sawtooth) were used to analyze the p-control chart to identify special cause signals resulting from our interventions.16 We used the statistical process t-control chart to record the time (days) between the few occurrences of DOS hypoglycemia because cases of hypoglycemia were rare.
Ethical Consideration
The Human Research Protection Program, Associate Chief of Staff for Research and Development, and Quality, Safety, and Values department reviewed this project in accordance with the Veterans Health Administration Program Guide 1200.21 and determined that it was a nonresearch operations activity; thus, approval by an institutional review board was not needed. The authors declare no competing interests.
Patient Outcomes
We prospectively followed 424 consecutive patients with DM undergoing elective noncardiac surgery from the time of the preoperative clinic evaluation until DOS; 195 patients were on evening
A subgroup analysis of DOS glucose levels in insulin-treated patients with preoperative HbA1c levels > 8% did not demonstrate a change in the rate of
Only 7 of 424 (1.7%) patients with DM and 4 of 195 (2.1%) patients treated with evening, long-acting basal insulin had marked hyperglycemia (DOS glucose levels ≥ 300 mg/dL). Only 1 patient who was not on outpatient insulin treatment had surgery canceled for hyperglycemia.
Overall, 89% of the HCPs followed the preoperative insulin protocol. HCP adherence to the protocol decreased to 77% after the phase 2 change, often related to deviations from the protocol or when a prior version was used. By the end of phase 3, HCP adherence returned to the baseline rate (88%). Patient adherence to medication instructions was not affected by protocol changes (86% throughout the study period). Prospective data collection was briefly interrupted between January 18, 2019, and March 5, 2019, while designing our phase 2 intervention. We were unable to track the total number of eligible patients during this time, but were able to identify 8 insulin-treated patients with DM who underwent elective noncardiac surgery and included their data in phase 1.
Discussion
The management and prevention of immediate perioperative hyperglycemia and glycemic variability have attracted attention as evidence has mounted for their association with postoperative morbidity and mortality.1,2,17 Available guidelines for preventing DOS hyperglycemia vary in their recommendations for preoperative insulin management.7-10 Notably, concerns about iatrogenic hypoglycemia often hinder efforts to lower rates of DOS hyperglycemia.4 We successfully implemented an iterative intensification protocol for preoperative long-acting basal insulin doses on the evening before surgery but did not observe a lower rate of hyperglycemia. Importantly, we also did not observe a higher rate of hypoglycemia on the DOS, as observed in a previous study.5
The observational study by Demma and colleagues found that patients receiving 75% of their evening, long-acting basal insulin dose were significantly more likely to achieve target blood glucose levels of 100 to 180 mg/dL than patients receiving no insulin at all (78% vs 0%; P = .001). However, no significant difference was noted when this group was compared with patients receiving 50% of their evening, long-acting basal insulin doses (78% vs 70%; P = .56). This is more clinically pertinent as it is generally accepted that the evening, long-acting insulin dose should not be entirely withheld on the evening before surgery.5
These findings are consistent with our observation that the rate of DOS hyperglycemia did not decrease with intensification of the evening, long-acting insulin dose from 50% to 100% of the prescribed dose in patients with HbA1c levels > 8% (phase 2) and 50% to 75% of the prescribed dose in patients with HbA1c levels ≤ 8% (phase 3). In the study by Demma and colleagues, few patients presented with preoperative hypoglycemia (2.7%) but all had received 100% of their evening, long-acting basal insulin dose, suggesting a significant increase in the rate of hypoglycemia compared with patients receiving lower doses of insulin (P = .01).5 However, long-term DM control as assessed by HbA1c level was available for < 10% of the patients, making it difficult to evaluate the effect of overall DM control on the results.5 In our study, preoperative HbA1c levels were available for 99.5% of the patients and only those with HbA1c levels > 8% received 100% of their evening, long-acting insulin dose on the evening before surgery. Notably, we did not observe a higher rate of hypoglycemia in this patient population, indicating that preoperative insulin dose intensification is safe for this subgroup.
Although HCP adherence to perioperative DM management protocols has been identified as a predominant barrier to the delivery of optimal perioperative DM care, prior studies of various preoperative insulin protocols to reduce perioperative hyperglycemia have not reported HCP adherence to their insulin protocols or its effect on DOS hyperglycemia.4-6 Additionally, patient adherence to HCP instructions is a key factor identified in our driver diagram that may influence DOS hyperglycemia, a hypothesis that is supported by a prior cross-sectional study showing an increased rate of hyperglycemia in the PACU with omission of preoperative DM medication.11 In our study, patient adherence to preoperative medication management instructions was higher than reported previously and remained consistently high regardless of protocol changes, which may explain why patient adherence did not affect the rate of DOS hyperglycemia.
Although not part of our study protocol, our preoperative HCPs routinely prepare written patient instructions for the preoperative management of medications for all patients, which likely explains higher patient adherence to instructions in our study than seen in the previous study where written instructions were only encouraged.11 However, HCP adherence to the protocol decreased after our phase 2 changes and was associated with a transient increase in DOS hyperglycemia rates. The DOS hyperglycemia rates returned to baseline levels with ongoing QI efforts and education to improve HCP adherence to protocol.
Limitations
Our QI initiative had several limitations. Nearly all patients were male veterans with T2DM, and most were older (range, 50-89 years). This limits the generalizability to women, younger patients, and people with type 1 DM. Additionally, our data collection relied on completion and collection of the preoperative form by different HCPs, allowing for sampling bias if some patients with DM undergoing elective noncardiac surgery were missed. Furthermore, although we could verify HCP adherence to the preoperative DM management protocols by reviewing their written instructions, we relied on patients’ self-reported adherence to the preoperative instructions. Finally, we did not evaluate postoperative blood glucose levels because the effect of intraoperative factors such as fluid, insulin, and glucocorticoid administration on postoperative glucose levels are variable. To the best of our knowledge, no other major systematic changes occurred in the preoperative care of patients with DM during the study period.
Conclusions
The findings of our QI initiative suggest that HCP adherence to preoperative DM management protocols may be a key contributor to DOS hyperglycemia and that ensuring HCP adherence may be as important as preoperative insulin dose adjustments. To our knowledge, this is the first study to report rates of HCP adherence to preoperative DM management protocols and its effect on DOS hyperglycemia. We will focus future QI efforts on optimizing HCP adherence to preoperative DM management protocols at our institution.
Acknowledgments
We thank our endocrinology expert, Dr. Kristina Utzschneider, for her guidance in designing this improvement project and our academic research coach, Dr. Helene Starks, for her help in editing the manuscript.
1. van den Boom W, Schroeder RA, Manning MW, Setji TL, Fiestan GO, Dunson DB. Effect of A1c and glucose on postoperative mortality in noncardiac and cardiac surgeries. Diabetes Care. 2018;41(4):782-788. doi:10.2337/dc17-2232
2. Punthakee Z, Iglesias PP, Alonso-Coello P, et al. Association of preoperative glucose concentration with myocardial injury and death after non-cardiac surgery (GlucoVISION): a prospective cohort study. Lancet Diabetes Endocrinol. 2018;6(10):790-797. doi:10.1016/S2213-8587(18)30205-5
3. Kwon S, Thompson R, Dellinger P, Yanez D, Farrohki E, Flum D. Importance of perioperative glycemic control in general surgery: a report from the Surgical Care and Outcomes Assessment Program. Ann Surg. 2013;257(1):8-14. doi:10.1097/SLA.0b013e31827b6bbc
4. Hommel I, van Gurp PJ, den Broeder AA, et al. Reactive rather than proactive diabetes management in the perioperative period. Horm Metab Res. 2017;49(7):527-533. doi:10.1055/s-0043-105501
5. Demma LJ, Carlson KT, Duggan EW, Morrow JG 3rd, Umpierrez G. Effect of basal insulin dosage on blood glucose concentration in ambulatory surgery patients with type 2 diabetes. J Clin Anesth. 2017;36:184-188. doi:10.1016/j.jclinane.2016.10.003
6. Rosenblatt SI, Dukatz T, Jahn R, et al. Insulin glargine dosing before next-day surgery: comparing three strategies. J Clin Anesth. 2012;24(8):610-617. doi:10.1016/j.jclinane.2012.02.010
7. Dhatariya K, Levy N, Flanagen D, et al; Joint British Diabetes Societies for Inpatient Care. Management of adults with diabetes undergoing surgery and elective procedures: improving standards. Summary. Published 2011. Revised March 2016. Accessed October 31, 2022. https://www.diabetes.org.uk/resources-s3/2017-09/Surgical%20guideline%202015%20-%20summary%20FINAL%20amended%20Mar%202016.pdf
8. American Diabetes Association. 15. Diabetes care in the hospital: standards of medical care in diabetes–2021. Diabetes Care. 2021;44(suppl 1):S211-S220. doi:10.2337/dc21-S015
9. Joshi GP, Chung F, Vann MA, et al; Society for Ambulatory Anesthesia. Society for Ambulatory Anesthesia consensus statement on perioperative blood glucose management in diabetic patients undergoing ambulatory surgery. Anesth Analg. 2010;111(6):1378-1387. doi:10.1213/ANE.0b013e3181f9c288
10. American Diabetes Association Professional Practice Committee. 16. Diabetes care in the hospital: standards of medical care in diabetes–2022. Diabetes Care. 2021;45(suppl 1):S244-S253. doi:10.2337/dc22-S016
11. Notaras AP, Demetriou E, Galvin J, Ben-Menachem E. A cross-sectional study of preoperative medication adherence and early postoperative recovery. J Clin Anesth. 2016;35:129-135. doi:10.1016/j.jclinane.2016.07.007
12. Bennett B, Provost L. What’s your theory? Driver diagram serves as tool for building and testing theories for improvement. Quality Progress. 2015;48(7):36-43. Accessed August 31, 2022. http://www.apiweb.org/QP_whats-your-theory_201507.pdf
13. Kaplan HC, Provost LP, Froehle CM, Margolis PA. The Model for Understanding Success in Quality (MUSIQ): building a theory of context in healthcare quality improvement. BMJ Qual Saf. 2012;21(1):13-20. doi:10.1136/bmjqs-2011-000010
14. Ogrinc G, Davies L, Goodman D, Batalden P, Davidoff F, Stevens D. SQUIRE 2.0 (Standards for QUality Improvement Reporting Excellence): revised publication guidelines from a detailed consensus process. BMJ Qual Saf. 2016;25(12):986-992. doi:10.1136/bmjqs-2015-004411
15. Duclos A, Voirin N. The p-control chart: a tool for care improvement. Int J Qual Health Care. 2010;22(5):402-407. doi:10.1093/intqhc/mzq037
16. Cheung YY, Jung B, Sohn JH, Ogrinc G. Quality initiatives: statistical control charts: simplifying the analysis of data for quality improvement. Radiographics. 2012;32(7):2113-2126. doi:10.1148/rg.327125713
17. Simha V, Shah P. Perioperative glucose control in patients with diabetes undergoing elective surgery. JAMA. 2019;321(4):399. doi:10.1001/jama.2018.20922
Outcomes After Prolonged ICU Stays in Postoperative Cardiac Surgery Patients
Prolonged intensive care unit (ICU) stays, variably defined as > 48 h to > 14 days, are a known complication of cardiac surgery.1-8 Prolonged stays are associated with higher resource utilization and higher mortality.2,3,9-12 Although there are several cardiac surgery risk models that can be used preoperatively to identify patients at risk for prolonged ICU stay, factors that influence outcomes for patients who experience prolonged ICU stays are poorly understood.2,13-19 Little information is available to inform discussions between health care practitioners (HCPs) and patients throughout a prolonged ICU stay, especially those ≥ 7 days.
As cardiac surgical complexity, patient age, and preexisting comorbidities have increased over time, so has the need to provide patients and HCPs with data to inform decision making, enhance prognostication, and set realistic expectations at varying time intervals during prolonged ICU stay. The purpose of this study was to evaluate short- and long-term outcomes in cardiac surgery patients after prolonged ICU stays at relevant time intervals (7, 14, 21, and 28 days) and to determine factors that may predict a patient’s outcome after a prolonged ICU stay.
Methods
The University of Michigan Health System Institutional Review Board approved this study and waived informed consent. We merged the University of Michigan Medical Center Society of Thoracic Surgeons (STS) database, which is updated periodically with late mortality, with elements of the electronic health record (EHR). Adult patients were included if they had cardiac surgery at the University of Michigan between January 2, 2001, and December 31, 2011. Late mortality was updated through December 1, 2014. Data are presented as frequency (%), mean (SD), and median (IQR) as appropriate. Bivariate comparisons between survivors and nonsurvivors were done with χ2 or Fisher exact test for categorical data, Student t test for continuous normally distributed data, and Wilcoxon rank sum test for continuous not normally distributed data. To determine factors associated with operative mortality (death within 30 days of surgery or hospital discharge, whichever occurred later), we used logistic regression with forward selection. All available factors were initially entered in the models.
Separate logistic models were created based on all data available at days 7, 14, 21, and 28. Final models consisted of factors with statistically significant P values (< .05) and adjusted odds ratios (AORs) with 95% CIs that excluded 1. To determine factors associated with late mortality, we used a Cox proportional hazard model, which used data available at discharge and STS complications. As these complications did not include their timing, they could only be used in models created at discharge and not for days 7, 14, 21, and 28 models. Final models consisted of factors with P values < .05 and 95% CIs of the AORs or the hazard ratios (HRs) that excluded 1. As the EHR did not start recording data until January 2, 2004, and its capture of data remained incomplete for several years, rather than imputing these missing data or excluding these patients, we chose to create an extra categorical level for each factor to represent missing data. For continuous factors with missing data, we first converted the continuous data to terciles and the missing data became the fourth level.20,21
The discrimination of the logistic models were determined by the c-statistic and for the Cox proportional hazards model with the Harrell concordance index (C index). Time trends were assessed with the Cochran-Armitage trend test. P < .05 was deemed statistically significant. Statistics were calculated with SPSS versions 21-23 or SAS 9.4.
Results
Of 8309 admissions to the ICU after cardiac surgery, 1174 (14%) had ICU stays ≥ 7 days, 386 (5%) ≥ 14 days, 201 (2%) ≥ 21 days, and 80 (0.9%) ≥ 28 days. The prolonged ICU study population was mostly male, White race, with a mean (SD) age of 62 (14) years. Patients had a variety of comorbidities, most notably 61% had hypertension and half had heart failure. Valve surgery (55%) was the most common procedure (n = 651). Twenty-nine percent required > 1 procedure (eAppendix 1).
The operative mortality 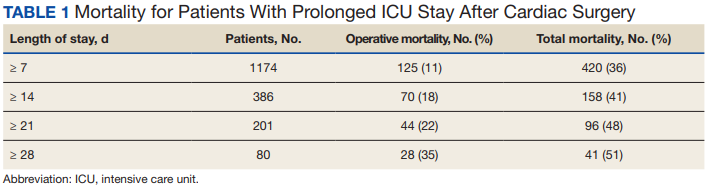
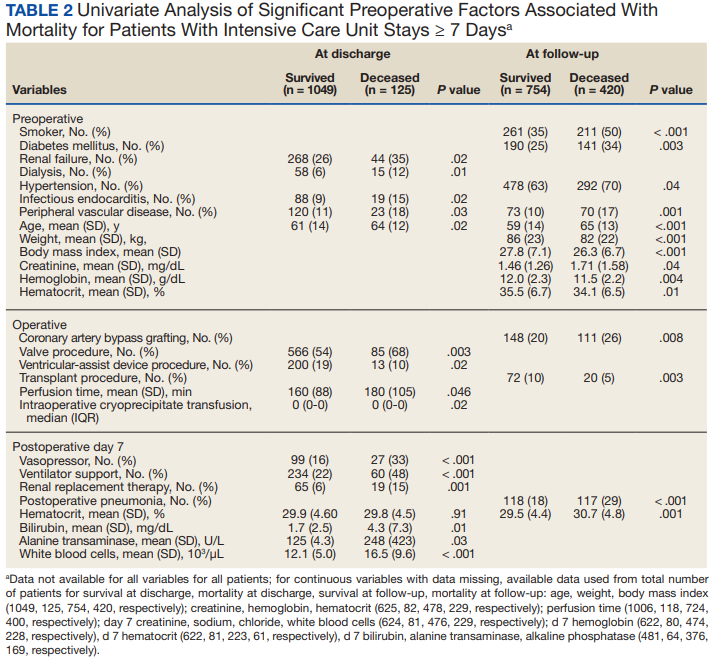
Using multivariable logistic regression to adjust for factors associated with mortality, we found that receiving mechanical ventilation on the day of analysis was associated with increased operative mortality with AOR increasing from 3.35 (95% CI, 2.82-3.98) for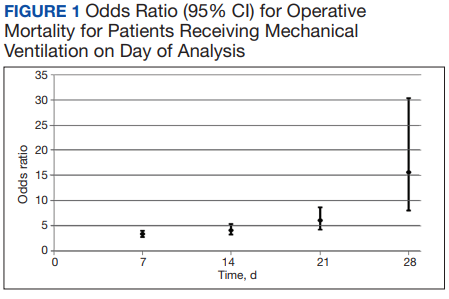
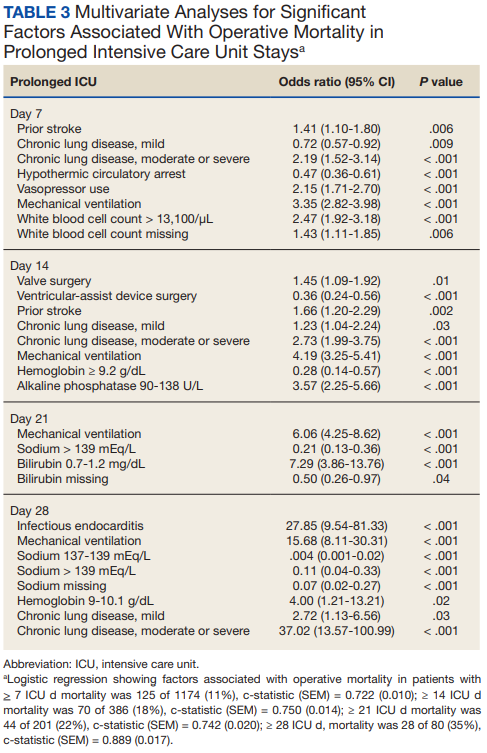
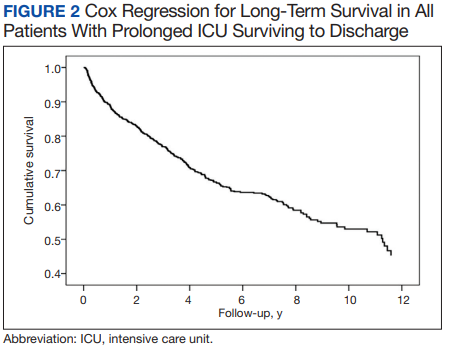

After multivariable Cox regression to adjust for confounders, we found that each postoperative week was associated with a 7% higher hazard of dying (HR, 1.07; 95% CI, 1.07-1.07; P < .001). Postoperative pneumonia was also associated with increased hazard of dying (HR, 1.59; 95% CI, 1.27-1.99; P < .001), 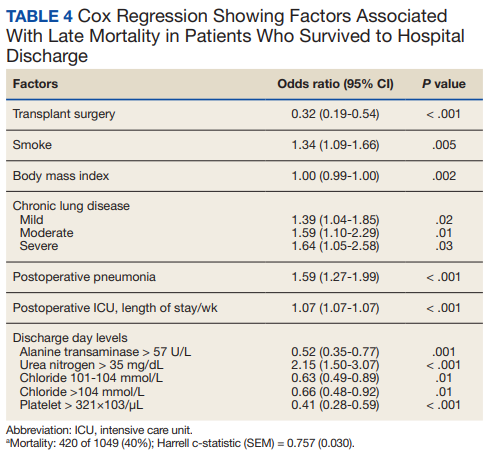
Discussion
We found that operative mortality increased the longer the patient stayed in the ICU, ranging from 11% for ≥ 7 days to 35% for ≥ 28 days. We further found that in ICU survivors, median (IQR) survival was 10.7 (0.7) years. While previous studies have evaluated prolonged ICU stays, they have been limited by studying limited subpopulations, such as patients who are dependent on dialysis or octogenarians, or used a single cutoff to define prolonged ICU stays, variably defined from > 48 hours to > 14 days.2-7,9-12,22 Our study is similar to others that used ≥ 2 cutoffs.1,8 However, our study was novel by providing 4 cutoffs to improve temporal prediction of hospital outcomes. Unlike a study by Ryan and colleagues, which found no increase in mortality with longer stay (43.5% for ≥ 14 days and 45% for ≥ 28 days), our study findings are similar to those of Yu and colleagues (11.1% mortality for prolonged ICU stays of 1 to 2 weeks, 26.6% for 2 to 4 weeks, and 31% for > 4 weeks) and others (8%, 3 to 14 days; 40%, >14 days; 10%, 1 to 2 weeks; 25.7% > 2 weeks) in finding a progressively increased hospital mortality with longer ICU stays.1,4,5,8 These differences may be related to different ICU populations or to improvements in care since Ryan and colleagues study was conducted.
Fewer studies have evaluated factors associated with mortality in cardiac surgery prolonged ICU stay patients. Our study is similar to other studies that evaluated risk factors by finding associations between a variety of comorbidities and process of care associated with both operative and long-term mortality; however, comparison between these studies is limited by the varying factors analyzed.1,3,5,6,8,9,11 We found that mechanical ventilation on days 7, 14, 21, and 28 was strongly associated with operative mortality, similar to noncardiac surgery patients and cardiac surgery patients.6,23,24 While we found several processes of care, such as catecholamine use and transfusions to be associated with mortality, which is similar to other studies, notably, we did not find an association between renal replacement therapy and mortality.1,25 While there is an association between renal replacement therapy and mortality in ICU patients, its status in cardiac surgery patients with prolonged ICU stays is less clear.26 While Ryan and colleagues found an association between renal replacement therapy and hospital mortality in patients staying ≥ 14 days, they did not find it in patients staying ≥.
28 days.1 Other studies of prolonged ICU stays for cardiac surgery patients have also failed to find an association between renal replacement therapy and mortality.5,6,9 Importantly, practice that expedites liberation from mechanical ventilation, such as fast tracking, daily spontaneous breathing trials, extubation to noninvasive respiratory support, and pulmonary rehabilitation may all have potential to limit mechanical ventilation duration and improve hospital survival and deserve further study.27-29Median (IQR) survival in hospital survivors was 10.7 (0.7) years, which is generally better than previously reported, but similar to that reported by Silberman and colleagues.2,4,6,8,11,12 Differences between these studies may relate to different patient populations within the cardiac surgery ICUs, definitions of prolonged ICU stays, or eras of care. Further study is needed to clarify these discrepancies. We found that cardiac transplantation and obesity were associated with the least risk of dying, while smoking, lung disease, and postoperative pneumonia were independently associated with increased hazard of dying. The obesity paradox, where obesity is protective, has been previously observed in cardiac surgery patients.30
Strengths and Limitations
There are several limitations of this study. This is a single center study, and our patient population and processes of care may differ from other centers, limiting its generalizability. Notably, we do fewer coronary bypass operations and more aortic reconstructions and ventricular assist device insertions than do many other centers. Second, we did not have laboratory values for about one-third of patients (preceded EHR implementation). However, we were able to compensate for this by binning values and including missing data as an extra bin.20,21
The main strength of this study is that we were able to combine disparate records to assess a large number of potential factors associated with both operative and long-term mortality. This produced models that had good to very good discrimination. By producing models at 7, 14, 21, and 28 days to predict operative mortality and a model at discharge, it may help to provide objective data to facilitate conversations with patients and their families. However, further studies to externally validate these models should be conducted.
Conclusions
We found that longer prolonged ICU stays are associated with both operative and late mortality. Receiving mechanical ventilation on days 7, 14, 21, or 28 was strongly associated with operative mortality.
1. Ryan TA, Rady MY, Bashour A, Leventhal M, Lytle B, Starr NJ. Predictors of outcome in cardiac surgical patients with prolonged intensive care stay. Chest. 1997;112(4):1035-1042. doi:10.1378/chest.112.4.1035
2. Hein OV, Birnbaum J, Wernecke K, England M, Konertz W, Spies C. Prolonged intensive care unit stay in cardiac surgery: risk factors and long-term-survival. Ann Thorac Surg. 2006;81(3):880-885. doi:10.1016/j.athoracsur.2005.09.077
3. Mahesh B, Choong CK, Goldsmith K, Gerrard C, Nashef SA, Vuylsteke A. Prolonged stay in intensive care unit is a powerful predictor of adverse outcomes after cardiac operations. Ann Thoracic Surg. 2012;94(1):109-116. doi:10.1016/j.athoracsur.2012.02.010
4. Silberman S, Bitran D, Fink D, Tauber R, Merin O. Very prolonged stay in the intensive care unit after cardiac operations: early results and late survival. Ann Thorac Surg. 2013;96(1):15-21. doi:10.1016/j.athoracsur.2013.01.103
5. Lapar DJ, Gillen JR, Crosby IK, et al. Predictors of operative mortality in cardiac surgical patients with prolonged intensive care unit duration. J Am Coll Surg. 2013;216(6):1116-1123. doi:10.1016/j.jamcollsurg.2013.02.028
6. Manji RA, Arora RC, Singal RK, et al. Long-term outcome and predictors of noninstitutionalized survival subsequent to prolonged intensive care unit stay after cardiac surgical procedures. Ann Thorac Surg. 2016;101(1):56-63. doi:10.1016/j.athoracsur.2015.07.004
7. Augustin P, Tanaka S, Chhor V, et al. Prognosis of prolonged intensive care unit stay after aortic valve replacement for severe aortic stenosis in octogenarians. J Cardiothorac Vasc Anesth. 2016;30(6):1555-1561. doi:10.1053/j.jvca.2016.07.029
8. Yu PJ, Cassiere HA, Fishbein J, Esposito RA, Hartman AR. Outcomes of patients with prolonged intensive care unit stay after cardiac surgery. J Cardiothorac Vasc Anesth. 2016;30(6):1550-1554. doi:10.1053/j.jvca.2016.03.145
9. Bashour CA, Yared JP, Ryan TA, et al. Long-term survival and functional capacity in cardiac surgery patients after prolonged intensive care. Crit Care Med. 2000;28(12):3847-3853. doi:10.1097/00003246-200012000-00018
10. Isgro F, Skuras JA, Kiessling AH, Lehmann A, Saggau W. Survival and quality of life after a long-term intensive care stay. Thorac Cardiovasc Surg. 2002;50(2):95-99. doi:10.1055/s-2002-26693
11. Williams MR, Wellner RB, Hartnett EA, Hartnett EA, Thornton B, Kavarana MN, Mahapatra R, Oz MC Sladen R. Long-term survival and quality of life in cardiac surgical patients with prolonged intensive care unit length of stay. Ann Thorac Surg. 2002;73(5):1472-1478.
12. Lagercrantz E, Lindblom D, Sartipy U. Survival and quality of life in cardiac surgery patients with prolonged intensive care. Ann Thorac Surg. 2010;89:490-495. doi:10.1016/s0003-4975(02)03464-1
13. Edwards FH, Clark RE, Schwartz M. Coronary artery bypass grafting: the Society of Thoracic Surgeons National Database experience. Ann Thorac Surg. 1994;57(1):12-19. doi:10.1016/0003-4975(94)90358-1
14. Lawrence DR, Valencia O, Smith EE, Murday A, Treasure T. Parsonnet score is a good predictor of the duration of intensive care unit stay following cardiac surgery. Heart. 2000;83(4):429-432. doi:10.1136/heart.83.4.429
15. Janssen DP, Noyez L, Wouters C, Brouwer RM. Preoperative prediction of prolonged stay in the intensive care unit for coronary bypass surgery. Eur J Cardiothorac Surg. 2004;25(2):203-207. doi:10.1016/j.ejcts.2003.11.005
16. Nilsson J, Algotsson L, Hoglund P, Luhrs C, Brandt J. EuroSCORE predicts intensive care unit stay and costs of open heart surgery. Ann Thorac Surg. 2004;78(5):1528-1534. doi:10.1016/j.athoracsur.2004.04.060
17. Ghotkar SV, Grayson AD, Fabri BM, Dihmis WC, Pullan DM. Preoperative calculation of risk for prolonged intensive care unit stay following coronary artery bypass grafting. J Cardiothorac Surg. 2006;1:14. doi:10.1186/1749-8090-1-1418. Messaoudi N, Decocker J, Stockman BA, Bossaert LL, Rodrigus IE. Is EuroSCORE useful in the prediction of extended intensive care unit stay after cardiac surgery? Eur J Cardiothoracic Surg. 2009;36(1):35-39. doi:10.1016/j.ejcts.2009.02.007
19. Ettema RG, Peelen LM, Schuurmans MJ, Nierich AP, Kalkman CJ, Moons KG. Prediction models for prolonged intensive care unit stay after cardiac surgery: systematic review and validation study. Circulation. 2010;122(7):682-689. doi:10.1161/CIRCULATIONAHA.109.926808
20. Engoren M. Does erythrocyte blood transfusion prevent acute kidney injury? Propensity-matched case control analysis. Anesthesiology. 2010;113(5):1126-1133. doi:10.1097/ALN.0b013e181f70f56
21. UK National Centre for Research Methods. Minimising the effect of missing data. Revised July 22, 2011. Accessed June 28, 2022. www.restore.ac.uk/srme/www/fac/soc/wie/research-new/srme/modules/mod3/9/index.html.
22. Leontyev S, Davierwala PM, Gaube LM, et al. Outcomes of dialysis-dependent patients after cardiac operations in a single-center experience of 483 patients. Ann Thorac Surg. 2017;103(4):1270-1276. doi:10.1016/j.athoracsur.2016.07.05223. Freundlich RE, Maile MD, Sferra JJ, Jewell ES, Kheterpal S, Engoren M. Complications associated with mortality in the National Surgical Quality Improvement Program Database. Anesth Analg. 2018;127(1):55-62. doi:10.1213/ANE.0000000000002799
24. Freundlich RE, Maile MD, Hajjar MM, et al. Years of life lost after complications of coronary artery bypass operations. Ann Thorac Surg. 2017;103(6):1893-1899. doi:10.1016/j.athoracsur.2016.09.048
25. Koch CG, Li L, Sessler DI, et al. Duration of red-cell storage and complications after cardiac surgery. N Engl J Med. 2008;358(12):1229-1239. doi:10.1056/NEJMoa070403
26. Truche AS, Ragey SP, Souweine B, et al. ICU survival and need of renal replacement therapy with respect to AKI duration in critically ill patients. Ann Intensive Care. 2018;8(1):127. doi:10.1186/s13613-018-0467-6
27. Kollef MH, Shapiro SD, Silver P, et al. A randomized, controlled trial of protocol-directed versus physician-directed weaning from mechanical ventilation. Crit Care Med. 1997;25(4):567-574. doi:10.1097/00003246-199704000-00004
28. McWilliams D, Weblin J, Atkins G, et al. Enhancing rehabilitation of mechanically ventilated patients in the intensive care unit: a quality improvement project. J Crit Care. 2015;30(1):13-18. doi:10.1016/j.jcrc.2014.09.018
29. Hernandez G, Vaquero C, Gonzalez P, et al. Effect of postextubation high-flow nasal cannula vs conventional oxygen therapy on reintubation in low-risk patients: a randomized clinical trial. JAMA. 2016;315(13):1354-1361. doi:10.1001/jama.2016.2711
30. Schwann TA, Ramira PS, Engoren MC, et al. Evidence and temporality of the obesity paradox in coronary bypass surgery: an analysis of cause-specific mortality. Eur J Cardiothorac Surg. 2018;54(5):896-903. doi:10.1093/ejcts/ezy207
Prolonged intensive care unit (ICU) stays, variably defined as > 48 h to > 14 days, are a known complication of cardiac surgery.1-8 Prolonged stays are associated with higher resource utilization and higher mortality.2,3,9-12 Although there are several cardiac surgery risk models that can be used preoperatively to identify patients at risk for prolonged ICU stay, factors that influence outcomes for patients who experience prolonged ICU stays are poorly understood.2,13-19 Little information is available to inform discussions between health care practitioners (HCPs) and patients throughout a prolonged ICU stay, especially those ≥ 7 days.
As cardiac surgical complexity, patient age, and preexisting comorbidities have increased over time, so has the need to provide patients and HCPs with data to inform decision making, enhance prognostication, and set realistic expectations at varying time intervals during prolonged ICU stay. The purpose of this study was to evaluate short- and long-term outcomes in cardiac surgery patients after prolonged ICU stays at relevant time intervals (7, 14, 21, and 28 days) and to determine factors that may predict a patient’s outcome after a prolonged ICU stay.
Methods
The University of Michigan Health System Institutional Review Board approved this study and waived informed consent. We merged the University of Michigan Medical Center Society of Thoracic Surgeons (STS) database, which is updated periodically with late mortality, with elements of the electronic health record (EHR). Adult patients were included if they had cardiac surgery at the University of Michigan between January 2, 2001, and December 31, 2011. Late mortality was updated through December 1, 2014. Data are presented as frequency (%), mean (SD), and median (IQR) as appropriate. Bivariate comparisons between survivors and nonsurvivors were done with χ2 or Fisher exact test for categorical data, Student t test for continuous normally distributed data, and Wilcoxon rank sum test for continuous not normally distributed data. To determine factors associated with operative mortality (death within 30 days of surgery or hospital discharge, whichever occurred later), we used logistic regression with forward selection. All available factors were initially entered in the models.
Separate logistic models were created based on all data available at days 7, 14, 21, and 28. Final models consisted of factors with statistically significant P values (< .05) and adjusted odds ratios (AORs) with 95% CIs that excluded 1. To determine factors associated with late mortality, we used a Cox proportional hazard model, which used data available at discharge and STS complications. As these complications did not include their timing, they could only be used in models created at discharge and not for days 7, 14, 21, and 28 models. Final models consisted of factors with P values < .05 and 95% CIs of the AORs or the hazard ratios (HRs) that excluded 1. As the EHR did not start recording data until January 2, 2004, and its capture of data remained incomplete for several years, rather than imputing these missing data or excluding these patients, we chose to create an extra categorical level for each factor to represent missing data. For continuous factors with missing data, we first converted the continuous data to terciles and the missing data became the fourth level.20,21
The discrimination of the logistic models were determined by the c-statistic and for the Cox proportional hazards model with the Harrell concordance index (C index). Time trends were assessed with the Cochran-Armitage trend test. P < .05 was deemed statistically significant. Statistics were calculated with SPSS versions 21-23 or SAS 9.4.
Results
Of 8309 admissions to the ICU after cardiac surgery, 1174 (14%) had ICU stays ≥ 7 days, 386 (5%) ≥ 14 days, 201 (2%) ≥ 21 days, and 80 (0.9%) ≥ 28 days. The prolonged ICU study population was mostly male, White race, with a mean (SD) age of 62 (14) years. Patients had a variety of comorbidities, most notably 61% had hypertension and half had heart failure. Valve surgery (55%) was the most common procedure (n = 651). Twenty-nine percent required > 1 procedure (eAppendix 1).
The operative mortality
Using multivariable logistic regression to adjust for factors associated with mortality, we found that receiving mechanical ventilation on the day of analysis was associated with increased operative mortality with AOR increasing from 3.35 (95% CI, 2.82-3.98) for
After multivariable Cox regression to adjust for confounders, we found that each postoperative week was associated with a 7% higher hazard of dying (HR, 1.07; 95% CI, 1.07-1.07; P < .001). Postoperative pneumonia was also associated with increased hazard of dying (HR, 1.59; 95% CI, 1.27-1.99; P < .001),
Discussion
We found that operative mortality increased the longer the patient stayed in the ICU, ranging from 11% for ≥ 7 days to 35% for ≥ 28 days. We further found that in ICU survivors, median (IQR) survival was 10.7 (0.7) years. While previous studies have evaluated prolonged ICU stays, they have been limited by studying limited subpopulations, such as patients who are dependent on dialysis or octogenarians, or used a single cutoff to define prolonged ICU stays, variably defined from > 48 hours to > 14 days.2-7,9-12,22 Our study is similar to others that used ≥ 2 cutoffs.1,8 However, our study was novel by providing 4 cutoffs to improve temporal prediction of hospital outcomes. Unlike a study by Ryan and colleagues, which found no increase in mortality with longer stay (43.5% for ≥ 14 days and 45% for ≥ 28 days), our study findings are similar to those of Yu and colleagues (11.1% mortality for prolonged ICU stays of 1 to 2 weeks, 26.6% for 2 to 4 weeks, and 31% for > 4 weeks) and others (8%, 3 to 14 days; 40%, >14 days; 10%, 1 to 2 weeks; 25.7% > 2 weeks) in finding a progressively increased hospital mortality with longer ICU stays.1,4,5,8 These differences may be related to different ICU populations or to improvements in care since Ryan and colleagues study was conducted.
Fewer studies have evaluated factors associated with mortality in cardiac surgery prolonged ICU stay patients. Our study is similar to other studies that evaluated risk factors by finding associations between a variety of comorbidities and process of care associated with both operative and long-term mortality; however, comparison between these studies is limited by the varying factors analyzed.1,3,5,6,8,9,11 We found that mechanical ventilation on days 7, 14, 21, and 28 was strongly associated with operative mortality, similar to noncardiac surgery patients and cardiac surgery patients.6,23,24 While we found several processes of care, such as catecholamine use and transfusions to be associated with mortality, which is similar to other studies, notably, we did not find an association between renal replacement therapy and mortality.1,25 While there is an association between renal replacement therapy and mortality in ICU patients, its status in cardiac surgery patients with prolonged ICU stays is less clear.26 While Ryan and colleagues found an association between renal replacement therapy and hospital mortality in patients staying ≥ 14 days, they did not find it in patients staying ≥.
28 days.1 Other studies of prolonged ICU stays for cardiac surgery patients have also failed to find an association between renal replacement therapy and mortality.5,6,9 Importantly, practice that expedites liberation from mechanical ventilation, such as fast tracking, daily spontaneous breathing trials, extubation to noninvasive respiratory support, and pulmonary rehabilitation may all have potential to limit mechanical ventilation duration and improve hospital survival and deserve further study.27-29Median (IQR) survival in hospital survivors was 10.7 (0.7) years, which is generally better than previously reported, but similar to that reported by Silberman and colleagues.2,4,6,8,11,12 Differences between these studies may relate to different patient populations within the cardiac surgery ICUs, definitions of prolonged ICU stays, or eras of care. Further study is needed to clarify these discrepancies. We found that cardiac transplantation and obesity were associated with the least risk of dying, while smoking, lung disease, and postoperative pneumonia were independently associated with increased hazard of dying. The obesity paradox, where obesity is protective, has been previously observed in cardiac surgery patients.30
Strengths and Limitations
There are several limitations of this study. This is a single center study, and our patient population and processes of care may differ from other centers, limiting its generalizability. Notably, we do fewer coronary bypass operations and more aortic reconstructions and ventricular assist device insertions than do many other centers. Second, we did not have laboratory values for about one-third of patients (preceded EHR implementation). However, we were able to compensate for this by binning values and including missing data as an extra bin.20,21
The main strength of this study is that we were able to combine disparate records to assess a large number of potential factors associated with both operative and long-term mortality. This produced models that had good to very good discrimination. By producing models at 7, 14, 21, and 28 days to predict operative mortality and a model at discharge, it may help to provide objective data to facilitate conversations with patients and their families. However, further studies to externally validate these models should be conducted.
Conclusions
We found that longer prolonged ICU stays are associated with both operative and late mortality. Receiving mechanical ventilation on days 7, 14, 21, or 28 was strongly associated with operative mortality.
1. Ryan TA, Rady MY, Bashour A, Leventhal M, Lytle B, Starr NJ. Predictors of outcome in cardiac surgical patients with prolonged intensive care stay. Chest. 1997;112(4):1035-1042. doi:10.1378/chest.112.4.1035
2. Hein OV, Birnbaum J, Wernecke K, England M, Konertz W, Spies C. Prolonged intensive care unit stay in cardiac surgery: risk factors and long-term-survival. Ann Thorac Surg. 2006;81(3):880-885. doi:10.1016/j.athoracsur.2005.09.077
3. Mahesh B, Choong CK, Goldsmith K, Gerrard C, Nashef SA, Vuylsteke A. Prolonged stay in intensive care unit is a powerful predictor of adverse outcomes after cardiac operations. Ann Thoracic Surg. 2012;94(1):109-116. doi:10.1016/j.athoracsur.2012.02.010
4. Silberman S, Bitran D, Fink D, Tauber R, Merin O. Very prolonged stay in the intensive care unit after cardiac operations: early results and late survival. Ann Thorac Surg. 2013;96(1):15-21. doi:10.1016/j.athoracsur.2013.01.103
5. Lapar DJ, Gillen JR, Crosby IK, et al. Predictors of operative mortality in cardiac surgical patients with prolonged intensive care unit duration. J Am Coll Surg. 2013;216(6):1116-1123. doi:10.1016/j.jamcollsurg.2013.02.028
6. Manji RA, Arora RC, Singal RK, et al. Long-term outcome and predictors of noninstitutionalized survival subsequent to prolonged intensive care unit stay after cardiac surgical procedures. Ann Thorac Surg. 2016;101(1):56-63. doi:10.1016/j.athoracsur.2015.07.004
7. Augustin P, Tanaka S, Chhor V, et al. Prognosis of prolonged intensive care unit stay after aortic valve replacement for severe aortic stenosis in octogenarians. J Cardiothorac Vasc Anesth. 2016;30(6):1555-1561. doi:10.1053/j.jvca.2016.07.029
8. Yu PJ, Cassiere HA, Fishbein J, Esposito RA, Hartman AR. Outcomes of patients with prolonged intensive care unit stay after cardiac surgery. J Cardiothorac Vasc Anesth. 2016;30(6):1550-1554. doi:10.1053/j.jvca.2016.03.145
9. Bashour CA, Yared JP, Ryan TA, et al. Long-term survival and functional capacity in cardiac surgery patients after prolonged intensive care. Crit Care Med. 2000;28(12):3847-3853. doi:10.1097/00003246-200012000-00018
10. Isgro F, Skuras JA, Kiessling AH, Lehmann A, Saggau W. Survival and quality of life after a long-term intensive care stay. Thorac Cardiovasc Surg. 2002;50(2):95-99. doi:10.1055/s-2002-26693
11. Williams MR, Wellner RB, Hartnett EA, Hartnett EA, Thornton B, Kavarana MN, Mahapatra R, Oz MC Sladen R. Long-term survival and quality of life in cardiac surgical patients with prolonged intensive care unit length of stay. Ann Thorac Surg. 2002;73(5):1472-1478.
12. Lagercrantz E, Lindblom D, Sartipy U. Survival and quality of life in cardiac surgery patients with prolonged intensive care. Ann Thorac Surg. 2010;89:490-495. doi:10.1016/s0003-4975(02)03464-1
13. Edwards FH, Clark RE, Schwartz M. Coronary artery bypass grafting: the Society of Thoracic Surgeons National Database experience. Ann Thorac Surg. 1994;57(1):12-19. doi:10.1016/0003-4975(94)90358-1
14. Lawrence DR, Valencia O, Smith EE, Murday A, Treasure T. Parsonnet score is a good predictor of the duration of intensive care unit stay following cardiac surgery. Heart. 2000;83(4):429-432. doi:10.1136/heart.83.4.429
15. Janssen DP, Noyez L, Wouters C, Brouwer RM. Preoperative prediction of prolonged stay in the intensive care unit for coronary bypass surgery. Eur J Cardiothorac Surg. 2004;25(2):203-207. doi:10.1016/j.ejcts.2003.11.005
16. Nilsson J, Algotsson L, Hoglund P, Luhrs C, Brandt J. EuroSCORE predicts intensive care unit stay and costs of open heart surgery. Ann Thorac Surg. 2004;78(5):1528-1534. doi:10.1016/j.athoracsur.2004.04.060
17. Ghotkar SV, Grayson AD, Fabri BM, Dihmis WC, Pullan DM. Preoperative calculation of risk for prolonged intensive care unit stay following coronary artery bypass grafting. J Cardiothorac Surg. 2006;1:14. doi:10.1186/1749-8090-1-1418. Messaoudi N, Decocker J, Stockman BA, Bossaert LL, Rodrigus IE. Is EuroSCORE useful in the prediction of extended intensive care unit stay after cardiac surgery? Eur J Cardiothoracic Surg. 2009;36(1):35-39. doi:10.1016/j.ejcts.2009.02.007
19. Ettema RG, Peelen LM, Schuurmans MJ, Nierich AP, Kalkman CJ, Moons KG. Prediction models for prolonged intensive care unit stay after cardiac surgery: systematic review and validation study. Circulation. 2010;122(7):682-689. doi:10.1161/CIRCULATIONAHA.109.926808
20. Engoren M. Does erythrocyte blood transfusion prevent acute kidney injury? Propensity-matched case control analysis. Anesthesiology. 2010;113(5):1126-1133. doi:10.1097/ALN.0b013e181f70f56
21. UK National Centre for Research Methods. Minimising the effect of missing data. Revised July 22, 2011. Accessed June 28, 2022. www.restore.ac.uk/srme/www/fac/soc/wie/research-new/srme/modules/mod3/9/index.html.
22. Leontyev S, Davierwala PM, Gaube LM, et al. Outcomes of dialysis-dependent patients after cardiac operations in a single-center experience of 483 patients. Ann Thorac Surg. 2017;103(4):1270-1276. doi:10.1016/j.athoracsur.2016.07.05223. Freundlich RE, Maile MD, Sferra JJ, Jewell ES, Kheterpal S, Engoren M. Complications associated with mortality in the National Surgical Quality Improvement Program Database. Anesth Analg. 2018;127(1):55-62. doi:10.1213/ANE.0000000000002799
24. Freundlich RE, Maile MD, Hajjar MM, et al. Years of life lost after complications of coronary artery bypass operations. Ann Thorac Surg. 2017;103(6):1893-1899. doi:10.1016/j.athoracsur.2016.09.048
25. Koch CG, Li L, Sessler DI, et al. Duration of red-cell storage and complications after cardiac surgery. N Engl J Med. 2008;358(12):1229-1239. doi:10.1056/NEJMoa070403
26. Truche AS, Ragey SP, Souweine B, et al. ICU survival and need of renal replacement therapy with respect to AKI duration in critically ill patients. Ann Intensive Care. 2018;8(1):127. doi:10.1186/s13613-018-0467-6
27. Kollef MH, Shapiro SD, Silver P, et al. A randomized, controlled trial of protocol-directed versus physician-directed weaning from mechanical ventilation. Crit Care Med. 1997;25(4):567-574. doi:10.1097/00003246-199704000-00004
28. McWilliams D, Weblin J, Atkins G, et al. Enhancing rehabilitation of mechanically ventilated patients in the intensive care unit: a quality improvement project. J Crit Care. 2015;30(1):13-18. doi:10.1016/j.jcrc.2014.09.018
29. Hernandez G, Vaquero C, Gonzalez P, et al. Effect of postextubation high-flow nasal cannula vs conventional oxygen therapy on reintubation in low-risk patients: a randomized clinical trial. JAMA. 2016;315(13):1354-1361. doi:10.1001/jama.2016.2711
30. Schwann TA, Ramira PS, Engoren MC, et al. Evidence and temporality of the obesity paradox in coronary bypass surgery: an analysis of cause-specific mortality. Eur J Cardiothorac Surg. 2018;54(5):896-903. doi:10.1093/ejcts/ezy207
Tirzepatide cuts BP during obesity treatment
CHICAGO – compared with placebo, while causing modest increases in heart rate, in a prespecified substudy of the SURMOUNT-1 trial.
“The large effects on ambulatory 24-hour blood pressure raise the possibility that there may be important long-term benefits of [tirzepatide] on the complications of obesity,” said James A. de Lemos, MD, during a presentation at the American Heart Association scientific sessions.
“The findings are concordant with the [previously reported] office-based measurements, and the blood pressure reductions provide further evidence for the potential benefits of tirzepatide on cardiovascular health and outcomes,” said Dr. de Lemos, a cardiologist and professor at the University of Texas Southwestern Medical Center, Dallas.
The substudy included 600 of the 2,539 people enrolled in SURMOUNT-1, the first of two pivotal trials for tirzepatide (Mounjaro) in people without diabetes but with obesity or overweight (body mass index of 27-29 kg/m2) plus at least one weight-related complication. The primary endpoints of SURMOUNT-1 were the percent change in weight from baseline to 72 weeks on treatment with either of three different weekly injected doses of tirzepatide, compared with control subjects who received placebo, and the percentage of enrolled subjects achieving at least 5% loss in baseline weight, compared with the controls.
Tirzepatide treatment led to significant increases in both results, compared with controls, with the highest dose tested, 15 mg/week, resulting in an average 20.9% drop in weight from baseline after 72 weeks of treatment, and 91% of enrolled subjects on that dose achieving the 5% weight-loss threshold during the same time frame, in results published in 2022 in the New England Journal of Medicine.
24-hour ambulatory pressures from 494 people
The substudy enrolled 600 of the SURMOUNT-1 participants and involved 24-hour ambulatory BP and heart rate measurements at entry and after 36 weeks on treatment. Full results were available for 494 of these people. The substudy included only study participants who entered with a BP of less than 140/90 mm Hg. Enrollment in SURMOUNT-1 overall excluded people with a BP of 160/100 mm Hg or higher. The average BP among all enrolled participants was about 123/80 mm Hg, while heart rates averaged about 73 beats per minute.
Systolic BP measured with the ambulatory monitor fell from baseline by an average of 5.6, 8.8, and 6.2 mm Hg in the people who received tirzepatide in weekly doses of 5, 10, or 15 mg, respectively, and rose by an average 1.8 mm Hg among the controls, Dr. de Lemos reported. Diastolic BP dropped among the tirzepatide recipients by an average of 1.5, 2.4, and 0.0 mm Hg in the three ascending tirzepatide treatment arms, and rose by an average 0.5 mm Hg among the controls. All of the differences between the intervention groups and the controls were significant except for the change in diastolic BP among participants who received 15 mg of tirzepatide weekly.
The results showed that 36 weeks on tirzepatide treatment was associated with “arguably clinically meaningful” reductions in systolic and diastolic BPs, Dr. de Lemos said. “There is a lot of optimism that this will translate into clinical benefits.” He also noted that, “within the limits of cross-study comparisons, the blood pressure changes look favorable, compared with the single-incretin mechanism GLP-1 [glucagonlike peptide–1] receptor agonists.”
Heart rate fell by an average 1.8 bpm in the controls, and rose by an average 0.3, 0.5, and 3.6 bpm among the three groups receiving ascending weekly tirzepatide doses, effects that were “consistent with what’s been seen with the GLP-1 receptor agonists,” noted Dr. de Lemos.
Tirzepatide is known as a “twincretin” because it shares this GLP-1 receptor agonism and also has a second incretin agonist activity, to the receptor for the glucose-dependent insulinotropic polypeptide.
Lowering of blood pressure plateaus
Changes in BP over time during the 72 weeks on treatment, data first presented in the original report, showed that average systolic pressure in the people who received tirzepatide fell sharply during the first 24 weeks on treatment, and then leveled out with little further change over time. Furthermore, all three tirzepatide doses produced roughly similar systolic BP reductions. Changes in diastolic pressure over time showed a mostly similar pattern of reduction, although a modest ongoing decrease in average diastolic pressure continued beyond 24 weeks.

This pattern of a plateau in BP reduction has been seen before in studies using other treatments to produce weight loss, including bariatric surgery, said Naveed Sattar, MBChB, PhD, professor of metabolic medicine at the University of Glasgow, who was not involved in SURMOUNT-1. He attributed the plateau in BP reduction among tirzepatide-treated people to them hitting a wall in their BP nadir based on homeostatic limits. Dr. Sattar noted that most enrolled participants had normal BPs at entry based on the reported study averages.
“It’s hard to go lower, but the blood pressure reduction may be larger in people who start at higher pressure levels,” Dr. Sattar said in an interview.
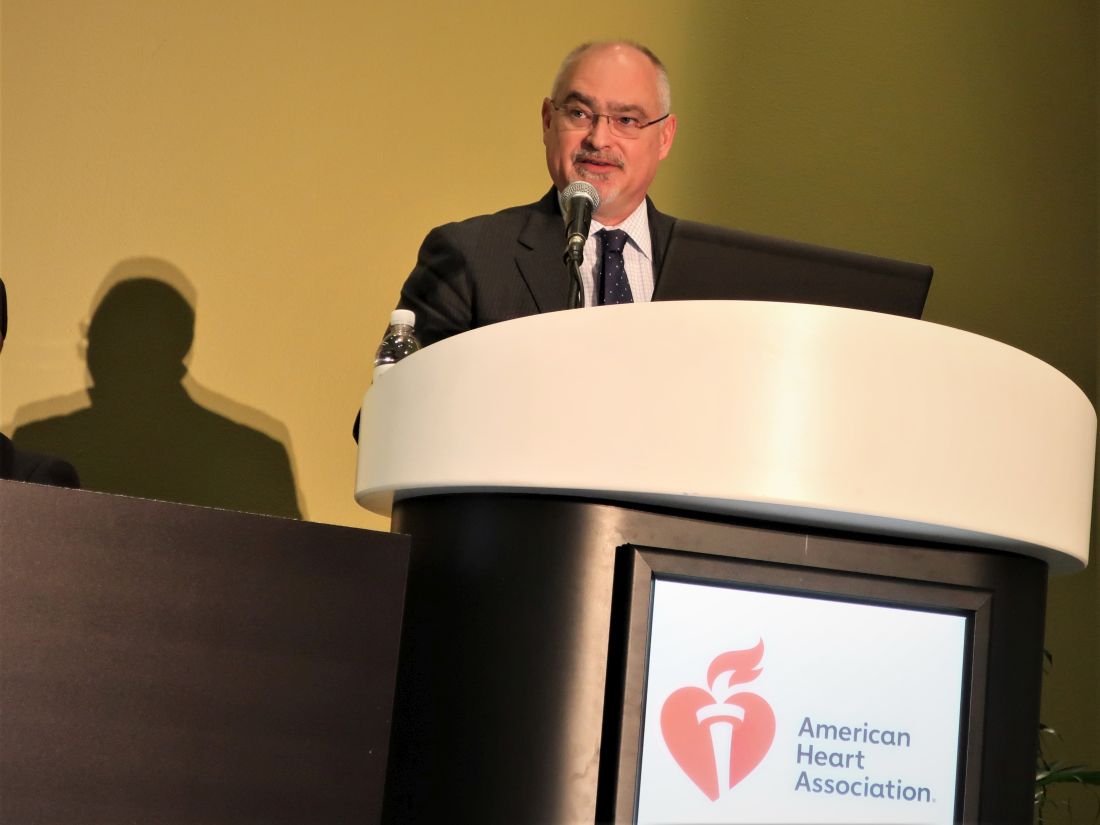
Another inferred cap on BP reductions in the trial hypothesizes that the individual clinicians who managed the enrolled patients may have cut back on other BP-lowering agents as the pressures of the tirzepatide recipients fell to relatively low levels, suggested Darren McGuire, MD, a cardiologist and professor at UT Southwestern Medical Center, who also was not involved in the SURMOUNT-1 study.
Incretin agonists as antihypertensive drugs
The substantial BP-lowering seen with tirzepatide, as well as with other incretin agonist agents, suggests a new way to think about BP control in people with overweight or obesity, Dr. Sattar said.
“Until now, we haven’t had tools where people lose so much weight. Now that we have these tools [incretin agonists as well as bariatric surgery], we see substantial blood pressure reductions. It makes you think we should use weight-loss agents to lower blood pressure rather than a beta-blocker or angiotensin-converting enzyme inhibitor; then we’d also produce all the other benefits from weight loss,” Dr. Sattar suggested.
Dr. de Lemos said he sees signals that the BP reductions caused by tirzepatide and the GLP-1 receptor agonists may go beyond just weight-loss effects.
“There appears to be a larger blood pressure reduction than anticipated based on the change in weight,” he said during his presentation. “GLP-1 is active in most vascular tissues, so these [receptor agonist] agents likely have vascular or cardiac effects, or even effects on other tissues that may affect blood pressure.”
Heart rate increases were usually modest
The experiences with GLP-1 receptor agonists also suggest that the heart rate increases seen with tirzepatide treatment in SURMOUNT-1 will not have long-term effects. “The [Food and Drug Administration] mandated this heart rate substudy to make sure that the increase in heart rate was not larger than what would be anticipated” with a GLP-1 receptor agonist, Dr. de Lemos explained.
SURMOUNT-1 had a treatment-stopping rule to prevent a person’s heart rate from rising beyond 10 bpm from baseline. “Trivial numbers” of patients experienced a heart rate increase of this magnitude, he said. If used in routine practice, Dr. de Lemos said that he would closely investigate a patient with a heart rate increase greater than 10 mm Hg. The average increase seen with the highest dose, about 4 bpm above baseline, would generally not be concerning.
Tirzepatide received U.S. marketing approval from the FDA in May 2022 for treating people with type 2 diabetes. In October 2022, the FDA gave tirzepatide “Fast Track” designation for the pending application for approval of an indication to treat people with overweight or obesity who match the entry criteria for SURMOUNT-1 and for the second pivotal trial for this indication, SURMOUNT-2. According to a statement from Eli Lilly, the company that is developing and markets tirzepatide (Mounjaro), the FDA’s decision on the obesity indication will remain pending until the SURMOUNT-2 results are available, which the company expects will occur in 2023.
SURMOUNT-1 and SURMOUNT-2 were sponsored by Lilly, the company that markets tirzepatide. Dr. de Lemos has been a consultant to Lilly as well as to Amgen, AstraZeneca, Janssen, Novo Nordisk, Ortho, Quidel Cardiovascular, and Regeneron. Dr. Sattar has financial ties to Lilly, Afimmune, Amgen, AstraZeneca, Boehringer Ingelheim, Hammi, Merck Sharpe & Dohme, Novartis, Novo Nordisk, Pfizer, Roche, and Sanofi-Aventis. Dr. McGuire has ties to Lilly as well as to Altimmune, Applied Therapeutics, Bayer, Boehringer Ingelheim, CSL Behring, Lexicon, Merck, Metavant, Novo Nordisk, and Sanofi.
CHICAGO – compared with placebo, while causing modest increases in heart rate, in a prespecified substudy of the SURMOUNT-1 trial.
“The large effects on ambulatory 24-hour blood pressure raise the possibility that there may be important long-term benefits of [tirzepatide] on the complications of obesity,” said James A. de Lemos, MD, during a presentation at the American Heart Association scientific sessions.
“The findings are concordant with the [previously reported] office-based measurements, and the blood pressure reductions provide further evidence for the potential benefits of tirzepatide on cardiovascular health and outcomes,” said Dr. de Lemos, a cardiologist and professor at the University of Texas Southwestern Medical Center, Dallas.
The substudy included 600 of the 2,539 people enrolled in SURMOUNT-1, the first of two pivotal trials for tirzepatide (Mounjaro) in people without diabetes but with obesity or overweight (body mass index of 27-29 kg/m2) plus at least one weight-related complication. The primary endpoints of SURMOUNT-1 were the percent change in weight from baseline to 72 weeks on treatment with either of three different weekly injected doses of tirzepatide, compared with control subjects who received placebo, and the percentage of enrolled subjects achieving at least 5% loss in baseline weight, compared with the controls.
Tirzepatide treatment led to significant increases in both results, compared with controls, with the highest dose tested, 15 mg/week, resulting in an average 20.9% drop in weight from baseline after 72 weeks of treatment, and 91% of enrolled subjects on that dose achieving the 5% weight-loss threshold during the same time frame, in results published in 2022 in the New England Journal of Medicine.
24-hour ambulatory pressures from 494 people
The substudy enrolled 600 of the SURMOUNT-1 participants and involved 24-hour ambulatory BP and heart rate measurements at entry and after 36 weeks on treatment. Full results were available for 494 of these people. The substudy included only study participants who entered with a BP of less than 140/90 mm Hg. Enrollment in SURMOUNT-1 overall excluded people with a BP of 160/100 mm Hg or higher. The average BP among all enrolled participants was about 123/80 mm Hg, while heart rates averaged about 73 beats per minute.
Systolic BP measured with the ambulatory monitor fell from baseline by an average of 5.6, 8.8, and 6.2 mm Hg in the people who received tirzepatide in weekly doses of 5, 10, or 15 mg, respectively, and rose by an average 1.8 mm Hg among the controls, Dr. de Lemos reported. Diastolic BP dropped among the tirzepatide recipients by an average of 1.5, 2.4, and 0.0 mm Hg in the three ascending tirzepatide treatment arms, and rose by an average 0.5 mm Hg among the controls. All of the differences between the intervention groups and the controls were significant except for the change in diastolic BP among participants who received 15 mg of tirzepatide weekly.
The results showed that 36 weeks on tirzepatide treatment was associated with “arguably clinically meaningful” reductions in systolic and diastolic BPs, Dr. de Lemos said. “There is a lot of optimism that this will translate into clinical benefits.” He also noted that, “within the limits of cross-study comparisons, the blood pressure changes look favorable, compared with the single-incretin mechanism GLP-1 [glucagonlike peptide–1] receptor agonists.”
Heart rate fell by an average 1.8 bpm in the controls, and rose by an average 0.3, 0.5, and 3.6 bpm among the three groups receiving ascending weekly tirzepatide doses, effects that were “consistent with what’s been seen with the GLP-1 receptor agonists,” noted Dr. de Lemos.
Tirzepatide is known as a “twincretin” because it shares this GLP-1 receptor agonism and also has a second incretin agonist activity, to the receptor for the glucose-dependent insulinotropic polypeptide.
Lowering of blood pressure plateaus
Changes in BP over time during the 72 weeks on treatment, data first presented in the original report, showed that average systolic pressure in the people who received tirzepatide fell sharply during the first 24 weeks on treatment, and then leveled out with little further change over time. Furthermore, all three tirzepatide doses produced roughly similar systolic BP reductions. Changes in diastolic pressure over time showed a mostly similar pattern of reduction, although a modest ongoing decrease in average diastolic pressure continued beyond 24 weeks.
This pattern of a plateau in BP reduction has been seen before in studies using other treatments to produce weight loss, including bariatric surgery, said Naveed Sattar, MBChB, PhD, professor of metabolic medicine at the University of Glasgow, who was not involved in SURMOUNT-1. He attributed the plateau in BP reduction among tirzepatide-treated people to them hitting a wall in their BP nadir based on homeostatic limits. Dr. Sattar noted that most enrolled participants had normal BPs at entry based on the reported study averages.
“It’s hard to go lower, but the blood pressure reduction may be larger in people who start at higher pressure levels,” Dr. Sattar said in an interview.
Another inferred cap on BP reductions in the trial hypothesizes that the individual clinicians who managed the enrolled patients may have cut back on other BP-lowering agents as the pressures of the tirzepatide recipients fell to relatively low levels, suggested Darren McGuire, MD, a cardiologist and professor at UT Southwestern Medical Center, who also was not involved in the SURMOUNT-1 study.
Incretin agonists as antihypertensive drugs
The substantial BP-lowering seen with tirzepatide, as well as with other incretin agonist agents, suggests a new way to think about BP control in people with overweight or obesity, Dr. Sattar said.
“Until now, we haven’t had tools where people lose so much weight. Now that we have these tools [incretin agonists as well as bariatric surgery], we see substantial blood pressure reductions. It makes you think we should use weight-loss agents to lower blood pressure rather than a beta-blocker or angiotensin-converting enzyme inhibitor; then we’d also produce all the other benefits from weight loss,” Dr. Sattar suggested.
Dr. de Lemos said he sees signals that the BP reductions caused by tirzepatide and the GLP-1 receptor agonists may go beyond just weight-loss effects.
“There appears to be a larger blood pressure reduction than anticipated based on the change in weight,” he said during his presentation. “GLP-1 is active in most vascular tissues, so these [receptor agonist] agents likely have vascular or cardiac effects, or even effects on other tissues that may affect blood pressure.”
Heart rate increases were usually modest
The experiences with GLP-1 receptor agonists also suggest that the heart rate increases seen with tirzepatide treatment in SURMOUNT-1 will not have long-term effects. “The [Food and Drug Administration] mandated this heart rate substudy to make sure that the increase in heart rate was not larger than what would be anticipated” with a GLP-1 receptor agonist, Dr. de Lemos explained.
SURMOUNT-1 had a treatment-stopping rule to prevent a person’s heart rate from rising beyond 10 bpm from baseline. “Trivial numbers” of patients experienced a heart rate increase of this magnitude, he said. If used in routine practice, Dr. de Lemos said that he would closely investigate a patient with a heart rate increase greater than 10 mm Hg. The average increase seen with the highest dose, about 4 bpm above baseline, would generally not be concerning.
Tirzepatide received U.S. marketing approval from the FDA in May 2022 for treating people with type 2 diabetes. In October 2022, the FDA gave tirzepatide “Fast Track” designation for the pending application for approval of an indication to treat people with overweight or obesity who match the entry criteria for SURMOUNT-1 and for the second pivotal trial for this indication, SURMOUNT-2. According to a statement from Eli Lilly, the company that is developing and markets tirzepatide (Mounjaro), the FDA’s decision on the obesity indication will remain pending until the SURMOUNT-2 results are available, which the company expects will occur in 2023.
SURMOUNT-1 and SURMOUNT-2 were sponsored by Lilly, the company that markets tirzepatide. Dr. de Lemos has been a consultant to Lilly as well as to Amgen, AstraZeneca, Janssen, Novo Nordisk, Ortho, Quidel Cardiovascular, and Regeneron. Dr. Sattar has financial ties to Lilly, Afimmune, Amgen, AstraZeneca, Boehringer Ingelheim, Hammi, Merck Sharpe & Dohme, Novartis, Novo Nordisk, Pfizer, Roche, and Sanofi-Aventis. Dr. McGuire has ties to Lilly as well as to Altimmune, Applied Therapeutics, Bayer, Boehringer Ingelheim, CSL Behring, Lexicon, Merck, Metavant, Novo Nordisk, and Sanofi.
AT AHA 2022