User login
In-hospital glucose management program gives dramatic savings
Initiatives targeting hypoglycemia and insulin pen wastage could lead to dramatic cost savings in small community hospitals, new data suggest.
The two projects are part of a dedicated inpatient glucose management service led by Mihail (“Misha”) Zilbermint, MD, one of the few full-time endocrine hospitalists in the United States and one of even fewer who work at a small community hospital.
In 2019, Dr. Zilbermint and colleagues reported that their inpatient glucose management program resulted in a 27% reduction in length of stay and a 10.7% lower 30-day readmission rate. The projected cost savings for the period January 2016 to May 2017 was $953,578.
Dr. Zilbermint’s team has written two new articles that document cost savings for specific elements of the program; namely, a set of hospital-wide hypoglycemia prevention measures, and an initiative that reduced duplicate inpatient insulin pen dispensing.
About 1 in 4 people in U.S. hospitals have diabetes or hyperglycemia. Large academic hospitals have endocrine divisions and training programs, but 85% of people receive care at small community hospitals.
“There are management guidelines, but they’re not always followed ... That’s why I’ve been advocating for endocrine hospitalists to be deployed nationally,” Dr. Zilbermint said. He is chief and director of endocrinology, diabetes, and metabolism at Johns Hopkins Community Physicians at Suburban Hospital, Bethesda, Maryland.
Asked to comment on behalf of the Society of Hospital Medicine (SHM), Greg Maynard, MD, program lead for SHM’s Electronic Quality Improvement Programs, said that Suburban’s overall program goals align with those of the SHM.
“Dedicated inpatient glycemic control teams are very important and desirable to improve the quality and safety of care for inpatients with hyperglycemia and diabetes,” he said.
Regarding specific initiatives, such as those aimed at reducing hypoglycemia and insulin pen wastage, Dr. Maynard said, “All of these are feasible in a wide variety of institutions. The main barrier is getting the institutional support for people to work on these interventions. This series of studies can help spread the word about the positive return on investment.”
Another barrier – the current lack of publicly reported measures or pay-for-performance programs for hypoglycemia prevention and glycemic control – may soon change, added Dr. Maynard, who is also chief quality officer at the University of California, Davis, Medical Center.
“The National Quality Forum has endorsed new measures, and the CDC’s National Healthcare Safety Network is working on ways to augment those measures and embed them into their infrastructure,” he said.
Although SHM doesn’t specifically endorse full-time glycemic control hospitalists over endocrinology-trained glycemic control experts, “certainly hospitalists who accrue added training are very well positioned to be an important part of these interdisciplinary teams,” Dr. Maynard said.
‘The nurses were so afraid of hypoglycemia’
Tackling hypoglycemia was Dr. Zilbermint’s first priority when he started the glycemic management program at Suburban in late 2015.
“One of the most common complaints from the nurses was that a lot of their patients had hypoglycemia, especially in the ICU, when patients were placed on insulin infusion protocols ... Every time, the nurse would have to call the attending and ask what to do,” he explains.
In addition, Dr. Zilbermint says, there was no standard for treating hypoglycemia. A nurse in one unit would give two cups of juice, another a 50% dextrose infusion, or another, milk. Even more concerning, “the nurses were so afraid of hypoglycemia they would reflexively discontinue all insulin, including basal.”
So one of the new initiatives, led by Carter Shelton, MSHCM, an administrative fellow at the Medical University of South Carolina, Charleston, was to implement a set of hospital-wide hypoglycemia prevention measures, as described in an article published online April 21 in the Journal of Diabetes Science and Technology.
Inpatient hypoglycemia rate was cut nearly in half
This began in 2016, when the multidisciplinary Suburban Hospital Glucose Steering Committee identified four main causes of insulin-induced hypoglycemia (defined as a blood glucose level of ≤70 mg/dL in a patient who had received at least one dose of insulin in the past 24 hours) and devised solutions for each:
1. Lack of a unified hypoglycemia protocol. A formal, evidence-based, nurse-driven treatment protocol with clinical decision support in the electronic medical record was developed. The Suburban team adapted much of the protocol from one that had been recently implemented at the flagship Johns Hopkins Hospital, in Baltimore, Maryland.
According to that protocol, if patients are able to swallow, they are given 15 g or 30 g of carbohydrates in order to achieve a blood glucose level of 50 to 70 mg/dL and <50 mg/dL, respectively. Levels are checked 15 minutes later. Intravenous D50 or glucagon is reserved for patients who can’t swallow.
2. For patients in critical care, the insulin infusion protocol that had been in use set blood glucose targets of 80 to 110 mg/dL, which resulted in hypoglycemia in nearly every patient who received an insulin infusion. This protocol was changed to the currently recommended 140 to 180 mg/dL.
3. Most patients were managed with sliding-scale insulin, an outdated yet still widely used regimen whereby insulin is given based only on current blood glucose without accounting for carbohydrates consumed with meals and not corrected until the subsequent meal. This was changed so that nurses give insulin after the patient has consumed at least 50% of their meal carbohydrates.
4. Lack of hypoglycemia reporting. A glucometrics dashboard – now used throughout the Johns Hopkins system – was adopted to produce daily hypoglycemia reports in the EMR system that could be reviewed by the inpatient glucose management service to track quality metrics and plan further interventions.
Between Jan. 1, 2016, and Sept. 30, 2019, out of a total 49,315 patient-days, there were 2,682 days on which any hypoglycemia occurred and 874 days on which moderate hypoglycemia occurred (≤54 mg/dL). Type 2 diabetes accounted for 84.4% of the total patient-days; type 1 accounted for 4.4%.
The overall frequency of any hypoglycemia patient-days per month decreased from 7.5% to 3.9% during the study period (P = .001). This was significant for the patients with type 2 diabetes (7.4% to 3.8%; P < .0001) but not for those with type 1 diabetes (18.5% to 18.0%; P = .08).
Rates of moderate hypoglycemia also decreased significantly among the patients with type 2 diabetes (1.9% to 1.0%; P = .03) but not for those with type 1 diabetes (7.4% to 6.0%; P = .14).
On the basis of these rates in reducing hypoglycemia, in which the inpatient hypoglycemia rate was cut nearly in half, the estimated savings in cost of care to the hospital was $98,635 during the period of January 2016 to September 2019.
Reducing insulin pen waste by minimizing duplicate prescriptions
Suburban Hospital had been using insulin vials and syringes when Dr. Zilbermint first arrived there. He lobbied the administration to allow use of pens, because they’re easier to use and they reduce the risk for needlestick injuries. Nurses were educated and retrained monthly in their use.
The switch to pens – aspart (Novolog Flexpen) for bolus insulin and glargine (Lantus SoloSTAR) – took place in 2018. The cost of the aspart pen was $16.19, and the cost of glargine was $25.08. Each holds 300 units of insulin.
After the first month, the team noticed a large increase in expenses. A quality improvement project was devised to address the issue.
“We were dispensing sometimes three or four pens per person. That’s a lot. Each pen holds 300 units, so one pen should last the entire hospital stay of an average 4- or 5-day stay,” Dr. Zilbermint explained. “We had to figure out where we were bleeding the money and where the pens were going.”
When pens disappeared, the pharmacy would have to dispense new ones. One problem was that when patients were transferred from one unit to another, the pen would be left behind and the room would be cleaned. Sometimes the pens weren’t stored properly or were misplaced. Often, they’d end up in a nurse’s pocket.
The second intervention was led by Urooj Najmi, MD, of the American International School of Medicine, Atlanta, Georgia. A program was instituted to reduce duplicate inpatient insulin pen dispensing, as detailed in an article published in the same issue of the Journal of Diabetes Science and Technology.
Solutions to reduce duplicate pen dispensing included having pharmacy track daily insulin pen reports and monitor duplicate orders, with “do not dispense” instructions conveyed via the EMR system. All multidose medications, including insulin pens, were to be placed in patients’ bins at the nursing station, and nurses were instructed to look for patients’ insulin pens prior to their being transferred to another unit, rather than ask for a replacement pen.
From July 2018 to July 2019, 3,121 patients received insulin, of whom 95% received aspart and 47% received glargine. Of the 9,516 pens dispensed, 68% were for aspart and 32% were for glargine. During the study period, the number of pens dispensed per patient dropped from 2.2 to 1.2 for aspart and from 2.1 to 1.3 for glargine; differences were highly significant (P = .0002 and P = .0005, respectively).
The total amount of unnecessary dispensing during the first 4 months after initiating the pen implementation program was 58%. The average monthly cost was $11,820.68; the projected cost per year was $141,848.
Six months after the waste reduction strategies were implemented, monthly waste had dropped to 42%, translating to an estimated potential cost savings of $66,261 over 12 months.
Because Suburban Hospital doesn’t have an outpatient dispensing license, there is still wastage when patients are discharged, because they can’t take their pens home with them. That remains a challenge, Dr. Zilbermint noted.
The team is working on implementing automatic A1c testing for patients admitted with hyperglycemia who either have a history of diabetes or whose blood glucose level is >140 mg/dL. Dr. Zilbermint said, “it’s in the guidelines, but it’s not always done.”
Dr. Zilbermint is a consultant for Guidepoint. Dr. Maynard, Mr. Shelton, and Dr. Najmi have disclosed no relevant financial relationships.
A version of this article first appeared on Medscape.com.
Two treatments show early promise for hypothalamic obesity
Two different agents showed potential for safely treating patients with hypothalamic obesity in two pilot studies with small numbers of patients.
One study prospectively randomized 21 adults with acquired hypothalamic obesity to treatment with placebo or Tesomet, a compound that combines the novel monoamine reuptake inhibitor tesofensine with metoprolol, a beta-blocker added to protect against adverse effects from tesofensine on heart rate and cardiac contractility. After 24 weeks of treatment, people on tesofensine/metoprolol had significant weight loss, compared with controls, while showing good tolerance with no significant effects on heart rate, blood pressure, or heart rhythm, Ulla Feldt-Rasmussen, MD, DMSc, reported at the annual meeting of the Endocrine Society.
The second report reviewed 18 children and adolescents with either acquired or genetic hypothalamic obesity who received open-label treatment with dextroamphetamine for an average of 20 months, and overall patients safely lost an average of 0.43 in their body mass index (BMI) standard deviation score, reported Jiska van Schaik, MD, in a separate talk at the meeting.
‘A supplement for lost satiety’
Patients with hypothalamic obesity face a dual problem from hypothalamic dysfunction that’s addressed by tesofensine, the weight-loss agent in Tesomet that increases hypothalamic levels of dopamine, serotonin, and noradrenaline by blocking reuptake, and thereby dulls appetite and food craving while also increasing fat metabolism, explained Dr. Feldt-Rasmussen, a professor of medical endocrinology at the University of Denmark and Rigshospitalet in Copenhagen. No treatment currently has regulatory approval for treating any form of hypothalamic obesity.
Tesofensine works as “a supplement for lost satiety, and satiety is what is lost” in patients with hypothalamic obesity as well in patients as Prader-Willi syndrome, the two disorders for which tesofensine/metoprolol is currently undergoing testing. “That’s the rationale, and it seems to work,” she declared during her talk. The formulation contains 0.5 mg tesofensine and 50 mg metoprolol administered orally once daily.
The study, run at Rigshospitalet, randomized 21 patients aged 18-75 years and with a BMI of at least 27 kg/m2who all had acquired hypothalamic obesity secondary to hypothalamic damage following cancer treatment. Patients averaged about 45 years of age, three-quarters were women, and their average BMI was about 37, with 90% having a BMI of at least 30.
The study’s design calls for 48-week follow-up; Dr. Feldt-Rasmussen presented the interim results after 24 weeks, with 18 of the 21 enrolled patients remaining in the study through 24 weeks. Three patients dropped out because of adverse events: one in the placebo arm, and two who received tesofensine/metoprolol.
Weight dropped by an average of 6.6 kg from baseline among the 11 patients who completed 24 weeks on tesofensine/metoprolol treatment, compared with no average change from baseline among the seven patients who completed the study on placebo, a significant difference. The researchers measured a validated, composite satiety score every 4 weeks, and found significantly more improvement among patients on tesofensine/metoprolol than in those on placebo during the study’s first half, but subsequently average scores among the actively treated patients fell to the same level of modest improvement as in the placebo patients.
Despite this, average weight loss in the patients on tesofensine/metoprolol steadily increased throughout the full 24 weeks.
Safety measures of diastolic blood pressure, heart rate, and corrected QT interval showed no significant between-group difference. Systolic pressure showed a transient average rise of 4 mm Hg above baseline in the tesofensine/metoprolol group, compared with a small dip in the control patients, but by 24 weeks average systolic blood pressure had reverted closer to baseline levels in both subgroups and showed no significant between-group difference. Two patients on tesofensine/metoprolol developed serious adverse events. In one patient these were not treatment related. The other patient developed anxiety after 8 weeks that was possibly treatment related but remained on treatment. Other adverse effects on tesofensine/metoprolol included dizziness, sleep disorder, and dry mouth, but all of these were mild and patients were willing to tolerate them to achieve their weight loss, Dr. Feldt-Rasmussen said.
Repurposing an ADHD treatment
Dextroamphetamine increases satiety and boosts resting energy expenditure, and is a common treatment for attention deficit hyperactivity disorder. Dr. van Schaik and coauthors reviewed 13 children and adolescents with acquired hypothalamic obesity and 5 with genetic hypothalamic obesity who received the treatment at either of two Dutch hospitals during 2014-2020. All 18 patients went on dextroamphetamine after other interventions had failed to produce improvement, said Dr. van Schaik, a researcher at University Medical Center and Wilhelmina Children’s Hospital in Utrecht, the Netherlands. The patients averaged about 13 years of age.
In addition to an overall effect on weight across all 18 subjects, the researchers found they could subdivide the full cohort into 10 responders (56%), 4 (22%) with weight stabilization on treatment, and 4 nonresponders (22%) who continued to gain weight despite treatment. The 10 responding patients had an average drop in their BMI standard deviation score of 0.91. All 10 responders had acquired hypothalamic obesity, and they averaged a 12.5 percentage point rise in their resting energy expenditure level, compared with baseline, while on treatment. The four whose weight stabilized on treatment included three patients with genetic hypothalamic obesity. The four nonresponders split into two with acquired hypothalamic obesity and two with the genetic form.
Thirteen patients (72%) had improvements in hyperphagia, energy, and behavior, and no patient had a serious adverse effect. One patient stopped treatment after 1 month because of elevated blood pressure.
“Dextroamphetamine may be promising, especially for acquired hypothalamic obesity,” Dr. van Schaik concluded, adding that prospective, controlled assessments are needed, and that a healthy lifestyle is the foundation of hypothalamic obesity treatment.
The Tesomet study was sponsored by Saniona, the company developing Tesomet. Dr Feldt-Rasmussen is an advisor to Saniona, and some of the coauthors on the study are Saniona employees. Dr. van Schaik had no disclosures.
FROM ENDO 2021
Possible obesity effect detected in cancer death rates
“By integrating 20 years of cancer mortality data, we demonstrated that trends in obesity-associated cancer mortality showed signs of recent deceleration, consistent with recent findings for heart disease mortality,” Christy L. Avery, PhD, and associates wrote in JAMA Network Open.
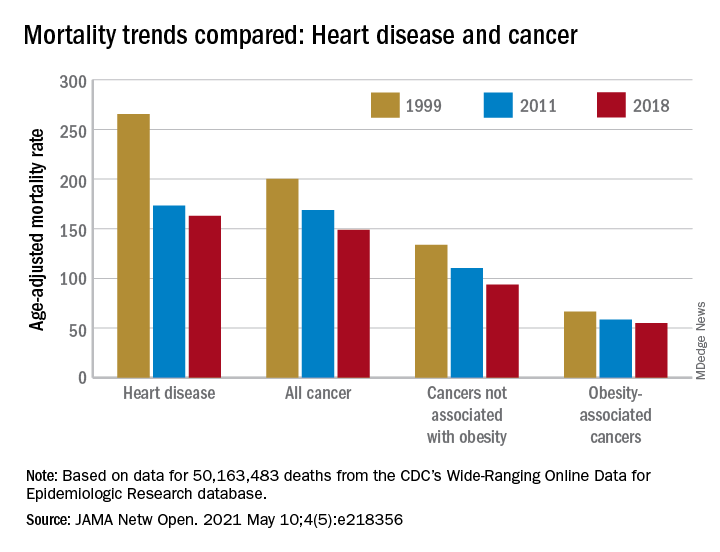
Improvements in mortality related to heart disease slowed after 2011, a phenomenon that has been associated with rising obesity rates. The age-adjusted mortality rate (AAMR) declined at an average of 3.8 deaths per 100,000 persons from 1999 to 2011 but only 0.7 deaths per 100,000 from 2011 to 2018, based on data from the Centers for Disease Control and Prevention’s Wide-Ranging Online Data for Epidemiologic Research (WONDER).
To understand trends in cancer mortality and their possible connection with obesity, data for 1999-2018 from the WONDER database were divided into obesity-associated and non–obesity-associated categories and compared with heart disease mortality, they explained. The database included more than 50 million deaths that matched inclusion criteria.
The analysis showed there was difference between obesity-associated and non–obesity-associated cancers that was obscured when all cancer deaths were considered together. The average annual change in AAMR for obesity-associated cancers slowed from –1.19 deaths per 100,000 in 1999-2011 to –0.83 in 2011-2018, Dr. Avery and associates reported.
For non–obesity-associated cancers, the annual change in AAMR increased from –1.62 per 100,000 for 1999-2011 to –2.29 for 2011-2018, following the trend for all cancers: –1.48 per 100,000 during 1999-2011 and –1.77 in 2011-2018, they said.
“The largest mortality decreases were observed for melanoma of the skin and lung cancer, two cancers not associated with obesity. For obesity-associated cancers, stable or increasing mortality rates have been observed for liver and pancreatic cancer among both men and women as well as for uterine cancer among women,” the investigators wrote.
Demographically, however, the slowing improvement in mortality for obesity-associated cancers did not follow the trend for heart disease. The deceleration for cancer was more pronounced for women and for non-Hispanic Whites and not seen at all in non-Hispanic Asian/Pacific Islander individuals. “For heart disease, evidence of a deceleration was consistent across sex, race, and ethnicity,” they said.
There are “longstanding disparities in obesity” among various populations in the United States, and the recent trend of obesity occurring earlier in life may be having an effect. “Whether the findings of decelerating mortality rates potentially signal a changing profile of cancer and heart disease mortality as the consequences of the obesity epidemic are realized remains to be seen,” they concluded.
The investigators reported receiving grants from the National Institutes of Health during the conduct of the study, but no other disclosures were reported.
“By integrating 20 years of cancer mortality data, we demonstrated that trends in obesity-associated cancer mortality showed signs of recent deceleration, consistent with recent findings for heart disease mortality,” Christy L. Avery, PhD, and associates wrote in JAMA Network Open.
Improvements in mortality related to heart disease slowed after 2011, a phenomenon that has been associated with rising obesity rates. The age-adjusted mortality rate (AAMR) declined at an average of 3.8 deaths per 100,000 persons from 1999 to 2011 but only 0.7 deaths per 100,000 from 2011 to 2018, based on data from the Centers for Disease Control and Prevention’s Wide-Ranging Online Data for Epidemiologic Research (WONDER).
To understand trends in cancer mortality and their possible connection with obesity, data for 1999-2018 from the WONDER database were divided into obesity-associated and non–obesity-associated categories and compared with heart disease mortality, they explained. The database included more than 50 million deaths that matched inclusion criteria.
The analysis showed there was difference between obesity-associated and non–obesity-associated cancers that was obscured when all cancer deaths were considered together. The average annual change in AAMR for obesity-associated cancers slowed from –1.19 deaths per 100,000 in 1999-2011 to –0.83 in 2011-2018, Dr. Avery and associates reported.
For non–obesity-associated cancers, the annual change in AAMR increased from –1.62 per 100,000 for 1999-2011 to –2.29 for 2011-2018, following the trend for all cancers: –1.48 per 100,000 during 1999-2011 and –1.77 in 2011-2018, they said.
“The largest mortality decreases were observed for melanoma of the skin and lung cancer, two cancers not associated with obesity. For obesity-associated cancers, stable or increasing mortality rates have been observed for liver and pancreatic cancer among both men and women as well as for uterine cancer among women,” the investigators wrote.
Demographically, however, the slowing improvement in mortality for obesity-associated cancers did not follow the trend for heart disease. The deceleration for cancer was more pronounced for women and for non-Hispanic Whites and not seen at all in non-Hispanic Asian/Pacific Islander individuals. “For heart disease, evidence of a deceleration was consistent across sex, race, and ethnicity,” they said.
There are “longstanding disparities in obesity” among various populations in the United States, and the recent trend of obesity occurring earlier in life may be having an effect. “Whether the findings of decelerating mortality rates potentially signal a changing profile of cancer and heart disease mortality as the consequences of the obesity epidemic are realized remains to be seen,” they concluded.
The investigators reported receiving grants from the National Institutes of Health during the conduct of the study, but no other disclosures were reported.
FROM JAMA NETWORK OPEN
A simple new definition for ‘metabolically healthy obesity’?
Scientists have proposed a simple new definition for “metabolically healthy obesity” to identify individuals who do not have an increased risk of cardiovascular disease (CVD) death and total mortality.
The team – led by Anika Zembic, MPH, German Institute of Human Nutrition Potsdam-Rehbruecke, Nuthetal, Germany – performed an assessment of anthropometric and metabolic risk factors as well as mortality data from two cohorts that “yielded a simple definition to categorize participants with obesity as metabolically healthy or unhealthy.”
They defined “metabolically healthy” as systolic blood pressure <130 mm Hg and no use of blood pressure-lowering medication; waist-to-hip ratio <0.95 (in women) and <1.03 (in men); and no prevalent type 2 diabetes.
Based on this new definition, 42% of participants in the third U.S. National Health and Nutrition Examination Survey (NHANES-III) and 19% of participants in the UK Biobank study had metabolically healthy obesity and did not have an increased risk for CVD mortality and total mortality compared with individuals with metabolically healthy normal weight.
“People with a phenotype defined as metabolically unhealthy using this definition had significantly higher hazard ratios for [CVD] mortality and total mortality irrespective of body mass index category, and people with phenotypes defined as having metabolically healthy obesity displayed no increased risk,” the researchers noted in their article, published May 7 in JAMA Network Open.
“Our new definition may be important not only to stratify risk of mortality in people with obesity, but also in people with overweight and normal weight,” they concluded.
Thirty different definitions of ‘metabolically healthy obesity’
“To date, there is no universally accepted standard for defining [metabolically healthy obesity] and more than 30 different definitions have been used to operationalize the phenotypes in studies,” which may explain the “continued unresolved debate” about outcomes in patients with metabolically unhealthy obesity, Ayana K. April-Sanders, PhD, and Carlos J. Rodriguez, MD, MPH, from Albert Einstein College of Medicine, New York, wrote in an accompanying commentary.
The current study, they noted, suggests that waist-to-hip ratio is a better measure of central adiposity than waist circumference, and that the effect of dyslipidemia on CVD mortality may be weaker among individuals with obesity.
However, the findings may not be generalizable to other CVD outcomes, they cautioned.
And importantly, some individuals with metabolically healthy obesity will likely transition to unhealthy obesity over time due to weight gain, aging, and lack of physical activity.
Therefore, “the present study provides a prototype of how that definition can be derived, but more rigorous tests and evidence using similar techniques are needed, particularly in prospective studies,” according to Dr. April-Sanders and Dr. Rodriguez.
They call for more research to establish a standardized definition of metabolically healthy obesity and then, using that definition, to determine the prevalence of healthy and unhealthy obesity and identify factors that preserve healthy obesity.
Definition developed from NHANES cohort, validated in UK biobank
Ms. Zembic and colleagues explained that previous definitions for metabolically healthy obesity were mainly based on the absence of either metabolic syndrome or insulin resistance, but some individuals with obesity but without metabolic disease still have increased risks of CVD mortality and total mortality.
To develop a more precise definition of metabolically healthy obesity, the researchers analyzed data from 12,341 individuals in the United States who participated in NHANES-III, conducted between 1988 and 1994. The individuals were a mean age of 42 and 51% were women, and they were followed for an average of 14.5 years.
The researchers validated this definition using data from 374,079 individuals in the population-based UK Biobank cohort who were assessed in 2006 to 2010. Those individuals were a mean age of 56 and 55% were women, and they were followed for a mean of 7.8 years.
The combination of systolic blood pressure and waist-to-hip ratio had the strongest association with CVD mortality and total mortality, and the prevalence of type 2 diabetes was also associated with greater risk.
Regardless of BMI, all groups of metabolically unhealthy individuals had increased risks of CVD mortality and total mortality.
The study and some of the researchers were supported by grants from the German Federal Ministry of Education and Research.
A version of this article first appeared on Medscape.com.
High body fat tied to slowed breast maturation in girls with obesity
Girls in late stages of puberty who had elevated levels of body fat showed unusually high levels of several hormones that could contribute to an earlier age of menarche and also slow breast development, according to data from 90 girls who spanned a wide range of body fat in the first longitudinal study to examine links between fat volume, levels of reproductive hormones, and clinical manifestations of hormone action during puberty.

The results showed that girls with greater body fat had higher levels of follicle stimulating hormone, inhibin B, estrone, and certain male-like reproductive hormones, and that this pattern “is specifically tied to body fat,” said Natalie D. Shaw, MD, senior investigator for the study, reported at the annual meeting of the Endocrine Society.
“We found that total body fat is associated with the timing of menarche, as others have reported for body weight,” she noted. The new findings showed that every 1% rise in percent total body fat linked with a significant 3% rise in the likelihood of menarche, menstrual onset. In the new study the average age of menarche was 11.7 years among the overweight or obese girls and 12.8 years among those with normal weights.
But the study’s unique use of an average of about three serial ultrasound breast examinations of each subject during an average 4 years of follow-up also showed that higher levels of body fat linked with slowed breast development in later stages, specifically maturation from stage D to stages D/E and E.
For example, girls with 33% body fat spent an average of 8.2 months in stage D, which stretched to an average of 11.2 months among girls with 38% body fat, reported Madison T. Ortega, a researcher with the Pediatric Endocrinology Group of the National Institute of Environmental Health Sciences in Research Triangle Park, N.C., who presented the report at the meeting.
Ultrasound shows what inspection can’t
Results from “several studies have shown earlier breast development in overweight and obese girls by inspection and palpation,” but the new findings from ultrasound examination provide more nuance about the structural breast changes actually occurring in these adolescents, said Dr. Shaw, who heads the Pediatric Endocrinology Group. The current study “was not designed to capture the onset of breast development,” and “it is possible that increased androgens or insulin resistance in girls with higher body fat interferes with normal breast development,” she explained in an interview.
“The authors showed that the timing and progress of early stages of puberty were not earlier in overweight or obese girls. Luteinizing hormone, the indicator of neuroendocrine pubertal onset, and timing of early stages of breast development were the same in all weight groups. The authors also discovered falsely advanced Turner breast stage designations with ultrasonography in some girls with obesity. This might suggest that prior findings in epidemiologic studies of an earlier start to puberty based mostly on breast development stages identified by self-reported inspection and, rarely, palpation, may have been biased by breast adipose tissue,” said Christine M. Burt Solorzano, MD, a pediatric endocrinologist at the University of Virginia in Charlottesville, who was not involved in the study.
“Development of increased follicle-stimulating hormone in late puberty suggests that pubertal tempo, not onset, may be increased in girls with obesity, and goes along with earlier menarche. Their finding of increased androgen levels during mid to late puberty with obesity are consistent with prior findings,” including work published Dr. Burt Solorzano and her associates, she noted. “Delayed timing of advanced breast morphology was unexpected and may reflect relatively lower levels of progesterone in girls with obesity,” a hormone necessary for later stages of breast maturation.
The findings “reinforce that early breast development in the setting of obesity may in fact reflect adipose tissue and not be a true representation of neuroendocrine precocious puberty,” Dr. Burt Solorzano said in an interview. The findings “also suggest that pubertal initiation may not happen earlier in girls with obesity, as has been thought, but rather the tempo of puberty may be more rapid, leading to earlier menarche.”
A possible step toward PCOS
The long-term clinical consequences of the hormonal state linked with overweight and obesity “are unknown,” said Dr. Shaw. However, she and her coworkers followed a few of their subjects with elevated testosterone levels during midpuberty, and several developed signs of early polycystic ovarian syndrome (PCOS) such as irregular menstrual cycles, acne, and hirsutism. “It may be possible to identify girls at high risk for PCOS before menarche,” she suggested.
Dr. Burt Solorzano agreed that delayed breast development in girls with high levels of body fat may reflect inadequate progesterone production, which when coupled with an obesity-related excess level of androgens could put girls at risk for chronic anovulation and later PCOS.
“Weight management during childhood and early puberty may mitigate the adverse effects of obesity on pubertal progression and avoid some of the lifetime complications related to early menarche,” Dr. Burt Solorzano said.
The Body Weight and Puberty Study enrolled 36 girls who were overweight or obese and 54 girls with normal weight. They averaged 11 years of age, with a range of 8.2-14.7 years. Average percent body fat was 41% among the overweight or obese girls and 27% among those with normal weight. The results reported by Ms. Ortega also appeared in a report published Feb 22, 2021 (J Clin Endocrinol Metab. doi: 10.1210/clinem/dgab092).
Dr. Shaw, Ms. Ortega, and Dr. Burt Solorzano had no disclosures.
Girls in late stages of puberty who had elevated levels of body fat showed unusually high levels of several hormones that could contribute to an earlier age of menarche and also slow breast development, according to data from 90 girls who spanned a wide range of body fat in the first longitudinal study to examine links between fat volume, levels of reproductive hormones, and clinical manifestations of hormone action during puberty.
The results showed that girls with greater body fat had higher levels of follicle stimulating hormone, inhibin B, estrone, and certain male-like reproductive hormones, and that this pattern “is specifically tied to body fat,” said Natalie D. Shaw, MD, senior investigator for the study, reported at the annual meeting of the Endocrine Society.
“We found that total body fat is associated with the timing of menarche, as others have reported for body weight,” she noted. The new findings showed that every 1% rise in percent total body fat linked with a significant 3% rise in the likelihood of menarche, menstrual onset. In the new study the average age of menarche was 11.7 years among the overweight or obese girls and 12.8 years among those with normal weights.
But the study’s unique use of an average of about three serial ultrasound breast examinations of each subject during an average 4 years of follow-up also showed that higher levels of body fat linked with slowed breast development in later stages, specifically maturation from stage D to stages D/E and E.
For example, girls with 33% body fat spent an average of 8.2 months in stage D, which stretched to an average of 11.2 months among girls with 38% body fat, reported Madison T. Ortega, a researcher with the Pediatric Endocrinology Group of the National Institute of Environmental Health Sciences in Research Triangle Park, N.C., who presented the report at the meeting.
Ultrasound shows what inspection can’t
Results from “several studies have shown earlier breast development in overweight and obese girls by inspection and palpation,” but the new findings from ultrasound examination provide more nuance about the structural breast changes actually occurring in these adolescents, said Dr. Shaw, who heads the Pediatric Endocrinology Group. The current study “was not designed to capture the onset of breast development,” and “it is possible that increased androgens or insulin resistance in girls with higher body fat interferes with normal breast development,” she explained in an interview.
“The authors showed that the timing and progress of early stages of puberty were not earlier in overweight or obese girls. Luteinizing hormone, the indicator of neuroendocrine pubertal onset, and timing of early stages of breast development were the same in all weight groups. The authors also discovered falsely advanced Turner breast stage designations with ultrasonography in some girls with obesity. This might suggest that prior findings in epidemiologic studies of an earlier start to puberty based mostly on breast development stages identified by self-reported inspection and, rarely, palpation, may have been biased by breast adipose tissue,” said Christine M. Burt Solorzano, MD, a pediatric endocrinologist at the University of Virginia in Charlottesville, who was not involved in the study.
“Development of increased follicle-stimulating hormone in late puberty suggests that pubertal tempo, not onset, may be increased in girls with obesity, and goes along with earlier menarche. Their finding of increased androgen levels during mid to late puberty with obesity are consistent with prior findings,” including work published Dr. Burt Solorzano and her associates, she noted. “Delayed timing of advanced breast morphology was unexpected and may reflect relatively lower levels of progesterone in girls with obesity,” a hormone necessary for later stages of breast maturation.
The findings “reinforce that early breast development in the setting of obesity may in fact reflect adipose tissue and not be a true representation of neuroendocrine precocious puberty,” Dr. Burt Solorzano said in an interview. The findings “also suggest that pubertal initiation may not happen earlier in girls with obesity, as has been thought, but rather the tempo of puberty may be more rapid, leading to earlier menarche.”
A possible step toward PCOS
The long-term clinical consequences of the hormonal state linked with overweight and obesity “are unknown,” said Dr. Shaw. However, she and her coworkers followed a few of their subjects with elevated testosterone levels during midpuberty, and several developed signs of early polycystic ovarian syndrome (PCOS) such as irregular menstrual cycles, acne, and hirsutism. “It may be possible to identify girls at high risk for PCOS before menarche,” she suggested.
Dr. Burt Solorzano agreed that delayed breast development in girls with high levels of body fat may reflect inadequate progesterone production, which when coupled with an obesity-related excess level of androgens could put girls at risk for chronic anovulation and later PCOS.
“Weight management during childhood and early puberty may mitigate the adverse effects of obesity on pubertal progression and avoid some of the lifetime complications related to early menarche,” Dr. Burt Solorzano said.
The Body Weight and Puberty Study enrolled 36 girls who were overweight or obese and 54 girls with normal weight. They averaged 11 years of age, with a range of 8.2-14.7 years. Average percent body fat was 41% among the overweight or obese girls and 27% among those with normal weight. The results reported by Ms. Ortega also appeared in a report published Feb 22, 2021 (J Clin Endocrinol Metab. doi: 10.1210/clinem/dgab092).
Dr. Shaw, Ms. Ortega, and Dr. Burt Solorzano had no disclosures.
FROM ENDO 2021
Only a third of adults with diabetes receive ADA-recommended care
In 2017-2018, only one in three U.S. adults with diabetes received five basic elements of care recommended by the American Diabetes Association, new research indicates.

The proportions of patients who visited a physician for diabetes care and received hemoglobin A1c testing, foot and eye exams, and cholesterol testing increased from 2005 to 2018. However, this increase was primarily among those aged 65 years and older, and therefore eligible for Medicare.
“Our study suggests that providing affordable health care coverage can help ensure people with diabetes get recommended care. We also found that patients who were not receiving recommended care were more likely to be younger, newly diagnosed with diabetes, and not on diabetes medication. Clinicians can pay more attention to these patient populations to improve recommended care delivery and prevent diabetes-related complications,” lead author Jung-Im Shin, MD, said in an interview.
The data predate the COVID-19 pandemic, which has also had major effects on delivery of diabetes care, added Dr. Shin of Johns Hopkins University, Baltimore.
“Routine visits to the doctor and important screenings for retinopathy or foot examination have been postponed. People with diabetes have had to reschedule or cancel nonurgent visits, some have lost ... insurance following unemployment, and many have avoided health care facilities out of fear. We are only just beginning to understand the consequences of the pandemic on the health of people with diabetes,” Dr. Shin noted.
Overall improvements seen only in those aged 65 and older
The data, from 4,069 adults aged 20 years and older from the 2005-2018 National Health and Nutrition and Examination Survey (NHANES), were published online April 16, 2021, in Diabetes Care.
Dr. Shin and colleagues defined receipt of diabetes care as meeting all of the following five criteria in the past 12 months, based on the ADA Standards of Care and NHANES data availability: seeing a primary doctor for diabetes care, receiving A1c testing, receiving a foot examination, receiving an eye examination, and receiving cholesterol testing.
Over the entire 13-year period, 29.2% of respondents reported having received all five components.
That proportion increased significantly over time, from 25.0% in 2005-2006 to 34.1% in 2017-2018 (P = .004). However, among the individual components, only receiving A1c testing increased significantly over time, from 64.4% to 85.3%, in all age groups (P < .001).
Moreover, when stratified by age, receipt of all five components only increased significantly among participants aged 65 and older, from 29.3% in 2005-2006 to 44.2% in 2017-2018 (P = .001).
The proportion remained unchanged among those aged 40-64 (25.2% to 25.8%; P = .457) and showed a nonsignificant increase in those aged 20-39 (9.9% to 26.0%; P = .401).
In adjusted analyses, older age, higher income and education, health insurance, longer duration of diabetes, use of diabetes medications, and hypercholesterolemia were significantly associated with receipt of ADA guideline–recommended diabetes care.
Factors not found to be associated with care receipt included sex, race/ethnicity, body mass index, smoking status, A1c, hypertension, cardiovascular disease, chronic kidney disease, and depressive symptoms.
Participants who received ADA guideline–recommended care were significantly more likely to achieve A1c below 7.5% (adjusted odds ratio, 1.52), blood pressure less than 140/90 mm Hg (aOR, 1.47), and LDL cholesterol below 100 mg/dL (aOR, 1.47), and to receive cholesterol-lowering medication (aOR, 1.79).
Dr. Shin said that it will be “important to study the impact of COVID-19 on diabetes care when new data are available.”
The project was supported by a research grant from Merck to Johns Hopkins University. Shin has reported receiving a grant from the National Institute of Diabetes and Digestive and Kidney Diseases. Two coauthors are Merck employees.
A version of this article first appeared on Medscape.com.
In 2017-2018, only one in three U.S. adults with diabetes received five basic elements of care recommended by the American Diabetes Association, new research indicates.
The proportions of patients who visited a physician for diabetes care and received hemoglobin A1c testing, foot and eye exams, and cholesterol testing increased from 2005 to 2018. However, this increase was primarily among those aged 65 years and older, and therefore eligible for Medicare.
“Our study suggests that providing affordable health care coverage can help ensure people with diabetes get recommended care. We also found that patients who were not receiving recommended care were more likely to be younger, newly diagnosed with diabetes, and not on diabetes medication. Clinicians can pay more attention to these patient populations to improve recommended care delivery and prevent diabetes-related complications,” lead author Jung-Im Shin, MD, said in an interview.
The data predate the COVID-19 pandemic, which has also had major effects on delivery of diabetes care, added Dr. Shin of Johns Hopkins University, Baltimore.
“Routine visits to the doctor and important screenings for retinopathy or foot examination have been postponed. People with diabetes have had to reschedule or cancel nonurgent visits, some have lost ... insurance following unemployment, and many have avoided health care facilities out of fear. We are only just beginning to understand the consequences of the pandemic on the health of people with diabetes,” Dr. Shin noted.
Overall improvements seen only in those aged 65 and older
The data, from 4,069 adults aged 20 years and older from the 2005-2018 National Health and Nutrition and Examination Survey (NHANES), were published online April 16, 2021, in Diabetes Care.
Dr. Shin and colleagues defined receipt of diabetes care as meeting all of the following five criteria in the past 12 months, based on the ADA Standards of Care and NHANES data availability: seeing a primary doctor for diabetes care, receiving A1c testing, receiving a foot examination, receiving an eye examination, and receiving cholesterol testing.
Over the entire 13-year period, 29.2% of respondents reported having received all five components.
That proportion increased significantly over time, from 25.0% in 2005-2006 to 34.1% in 2017-2018 (P = .004). However, among the individual components, only receiving A1c testing increased significantly over time, from 64.4% to 85.3%, in all age groups (P < .001).
Moreover, when stratified by age, receipt of all five components only increased significantly among participants aged 65 and older, from 29.3% in 2005-2006 to 44.2% in 2017-2018 (P = .001).
The proportion remained unchanged among those aged 40-64 (25.2% to 25.8%; P = .457) and showed a nonsignificant increase in those aged 20-39 (9.9% to 26.0%; P = .401).
In adjusted analyses, older age, higher income and education, health insurance, longer duration of diabetes, use of diabetes medications, and hypercholesterolemia were significantly associated with receipt of ADA guideline–recommended diabetes care.
Factors not found to be associated with care receipt included sex, race/ethnicity, body mass index, smoking status, A1c, hypertension, cardiovascular disease, chronic kidney disease, and depressive symptoms.
Participants who received ADA guideline–recommended care were significantly more likely to achieve A1c below 7.5% (adjusted odds ratio, 1.52), blood pressure less than 140/90 mm Hg (aOR, 1.47), and LDL cholesterol below 100 mg/dL (aOR, 1.47), and to receive cholesterol-lowering medication (aOR, 1.79).
Dr. Shin said that it will be “important to study the impact of COVID-19 on diabetes care when new data are available.”
The project was supported by a research grant from Merck to Johns Hopkins University. Shin has reported receiving a grant from the National Institute of Diabetes and Digestive and Kidney Diseases. Two coauthors are Merck employees.
A version of this article first appeared on Medscape.com.
Weight-related COVID-19 severity starts in normal BMI range, especially in young
The risk of severe outcomes with COVID-19 increases with excess weight in a linear manner beginning in normal body mass index ranges, with the effect apparently independent of obesity-related diseases such as diabetes, and stronger among younger people and Black persons, new research shows.

“Even a small increase in body mass index above 23 kg/m² is a risk factor for adverse outcomes after infection with SARS-CoV-2,” the authors reported.
“Excess weight is a modifiable risk factor and investment in the treatment of overweight and obesity, and long-term preventive strategies could help reduce the severity of COVID-19 disease,” they wrote.
The findings shed important new light in the ongoing efforts to understand COVID-19 effects, Krishnan Bhaskaran, PhD, said in an interview.
“These results confirm and add detail to the established links between overweight and obesity and COVID-19, and also add new information on risks among people with low BMI levels,” said Dr. Bhaskaran, an epidemiologist at the London School of Hygiene & Tropical Medicine, who authored an accompanying editorial.
Obesity has been well established as a major risk factor for poor outcomes among people with COVID-19; however, less is known about the risk of severe outcomes over the broader spectrum of excess weight, and its relationship with other factors.
For the prospective, community-based study, Carmen Piernas, PhD, of the University of Oxford (England) and colleagues evaluated data on nearly 7 million individuals registered in the U.K. QResearch database during Jan. 24–April 30, 2020.
Overall, patients had a mean BMI of 27 kg/m². Among them, 13,503 (.20%) were admitted to the hospital during the study period, 1,601 (.02%) were admitted to an ICU and 5,479 (.08%) died after testing positive for SARS-CoV-2.
Risk rises from BMI of 23 kg/m²
In looking at the risk of hospital admission with COVID-19, the authors found a J-shaped relationship with BMI, with the risk increased with a BMI of 20 kg/m² or lower, as well as an increased risk beginning with a BMI of 23 kg/m² – considered normal weight – or higher (hazard ratio, 1.05).
The risk of death from COVID-19 was also J-shaped, however the association with increases in BMI started higher – at 28 kg/m² (adjusted HR 1.04).
In terms of the risk of ICU admission with COVID-19, the curve was not J-shaped, with just a linear association of admission with increasing BMI beginning at 23 kg/m2 (adjusted HR 1.10).
“It was surprising to see that the lowest risk of severe COVID-19 was found at a BMI of 23, and each extra BMI unit was associated with significantly higher risk, but we don’t really know yet what the reason is for this,” Dr. Piernas said in an interview.
The association between increasing BMI and risk of hospital admission for COVID-19 beginning at a BMI of 23 kg/m² was more significant among younger people aged 20-39 years than in those aged 80-100 years, with an adjusted HR for hospital admission per BMI unit above 23 kg/m² of 1.09 versus 1.01 (P < .0001).
In addition, the risk associated with BMI and hospital admission was stronger in people who were Black, compared with those who were White (1.07 vs. 1.04), as was the risk of death due to COVID-19 (1.08 vs. 1.04; P < .0001 for both).
“For the risk of death, Blacks have an 8% higher risk with each extra BMI unit, whereas Whites have a 4% increase, which is half the risk,” Dr. Piernas said.
Notably, the increased risks of hospital admission and ICU due to COVID-19 seen with increases in BMI were slightly lower among people with type 2 diabetes, hypertension, and cardiovascular disease compared with patients who did not have those comorbidities, suggesting the association with BMI is not explained by those risk factors.
Dr. Piernas speculated that the effect could reflect that people with diabetes or cardiovascular disease already have a preexisting condition which makes them more susceptible to SARS-CoV-2.
Hence, “the association with BMI in this group may not be as strong as the association found among those without those conditions, in which BMI explains a higher proportion of this increased risk, given the absence of these preexisting conditions.”
Similarly, the effect of BMI on COVID-19 outcomes in younger patients may appear stronger because their rates of other comorbidities are much lower than in older patients.
“Among older people, preexisting conditions and perhaps a weaker immune system may explain their much higher rates of severe COVID outcomes,” Dr. Piernas noted.
Furthermore, older patients may have frailty and high comorbidities that could explain their lower rates of ICU admission with COVID-19, Dr. Bhaskaran added in further comments.
The findings overall underscore that excess weight can represent a risk in COVID-19 outcomes that is, importantly, modifiable, and “suggest that supporting people to reach and maintain a healthy weight is likely to help people reduce their risk of experiencing severe outcomes from this disease, now or in any future waves,” he concluded.
Dr. Piernas and Dr. Bhaskaran had no disclosures to report. Coauthors’ disclosures are detailed in the published study.
The risk of severe outcomes with COVID-19 increases with excess weight in a linear manner beginning in normal body mass index ranges, with the effect apparently independent of obesity-related diseases such as diabetes, and stronger among younger people and Black persons, new research shows.
“Even a small increase in body mass index above 23 kg/m² is a risk factor for adverse outcomes after infection with SARS-CoV-2,” the authors reported.
“Excess weight is a modifiable risk factor and investment in the treatment of overweight and obesity, and long-term preventive strategies could help reduce the severity of COVID-19 disease,” they wrote.
The findings shed important new light in the ongoing efforts to understand COVID-19 effects, Krishnan Bhaskaran, PhD, said in an interview.
“These results confirm and add detail to the established links between overweight and obesity and COVID-19, and also add new information on risks among people with low BMI levels,” said Dr. Bhaskaran, an epidemiologist at the London School of Hygiene & Tropical Medicine, who authored an accompanying editorial.
Obesity has been well established as a major risk factor for poor outcomes among people with COVID-19; however, less is known about the risk of severe outcomes over the broader spectrum of excess weight, and its relationship with other factors.
For the prospective, community-based study, Carmen Piernas, PhD, of the University of Oxford (England) and colleagues evaluated data on nearly 7 million individuals registered in the U.K. QResearch database during Jan. 24–April 30, 2020.
Overall, patients had a mean BMI of 27 kg/m². Among them, 13,503 (.20%) were admitted to the hospital during the study period, 1,601 (.02%) were admitted to an ICU and 5,479 (.08%) died after testing positive for SARS-CoV-2.
Risk rises from BMI of 23 kg/m²
In looking at the risk of hospital admission with COVID-19, the authors found a J-shaped relationship with BMI, with the risk increased with a BMI of 20 kg/m² or lower, as well as an increased risk beginning with a BMI of 23 kg/m² – considered normal weight – or higher (hazard ratio, 1.05).
The risk of death from COVID-19 was also J-shaped, however the association with increases in BMI started higher – at 28 kg/m² (adjusted HR 1.04).
In terms of the risk of ICU admission with COVID-19, the curve was not J-shaped, with just a linear association of admission with increasing BMI beginning at 23 kg/m2 (adjusted HR 1.10).
“It was surprising to see that the lowest risk of severe COVID-19 was found at a BMI of 23, and each extra BMI unit was associated with significantly higher risk, but we don’t really know yet what the reason is for this,” Dr. Piernas said in an interview.
The association between increasing BMI and risk of hospital admission for COVID-19 beginning at a BMI of 23 kg/m² was more significant among younger people aged 20-39 years than in those aged 80-100 years, with an adjusted HR for hospital admission per BMI unit above 23 kg/m² of 1.09 versus 1.01 (P < .0001).
In addition, the risk associated with BMI and hospital admission was stronger in people who were Black, compared with those who were White (1.07 vs. 1.04), as was the risk of death due to COVID-19 (1.08 vs. 1.04; P < .0001 for both).
“For the risk of death, Blacks have an 8% higher risk with each extra BMI unit, whereas Whites have a 4% increase, which is half the risk,” Dr. Piernas said.
Notably, the increased risks of hospital admission and ICU due to COVID-19 seen with increases in BMI were slightly lower among people with type 2 diabetes, hypertension, and cardiovascular disease compared with patients who did not have those comorbidities, suggesting the association with BMI is not explained by those risk factors.
Dr. Piernas speculated that the effect could reflect that people with diabetes or cardiovascular disease already have a preexisting condition which makes them more susceptible to SARS-CoV-2.
Hence, “the association with BMI in this group may not be as strong as the association found among those without those conditions, in which BMI explains a higher proportion of this increased risk, given the absence of these preexisting conditions.”
Similarly, the effect of BMI on COVID-19 outcomes in younger patients may appear stronger because their rates of other comorbidities are much lower than in older patients.
“Among older people, preexisting conditions and perhaps a weaker immune system may explain their much higher rates of severe COVID outcomes,” Dr. Piernas noted.
Furthermore, older patients may have frailty and high comorbidities that could explain their lower rates of ICU admission with COVID-19, Dr. Bhaskaran added in further comments.
The findings overall underscore that excess weight can represent a risk in COVID-19 outcomes that is, importantly, modifiable, and “suggest that supporting people to reach and maintain a healthy weight is likely to help people reduce their risk of experiencing severe outcomes from this disease, now or in any future waves,” he concluded.
Dr. Piernas and Dr. Bhaskaran had no disclosures to report. Coauthors’ disclosures are detailed in the published study.
FROM LANCET DIABETES & ENDOCRINOLOGY
Most kids with type 1 diabetes and COVID-19 in U.S. fared well
The majority of children with type 1 diabetes who tested positive for SARS-CoV-2 were cared for at home and did well, according to the first report of outcomes of pediatric patients with type 1 diabetes and COVID-19 from the United States.
Most children who were hospitalized had diabetic ketoacidosis (DKA) and high hemoglobin A1c levels, the new report from the T1D Exchange Quality Improvement Collaborative indicates. Fewer than 2% required respiratory support, and no deaths were recorded.
The greatest risk for adverse COVID-19 outcomes was among children with A1c levels >9%. In addition, children of certain ethnic minority groups and those with public health insurance were more likely to be hospitalized.
The study, conducted by G. Todd Alonso, MD, of the University of Colorado, Barbara Davis Center, Aurora, and colleagues, was published online April 14 in the Journal of Diabetes..
“As early reports identified diabetes as a risk factor for increased morbidity and mortality with COVID-19, the findings from this surveillance study should provide measured reassurance for families of children with type 1 diabetes as well as pediatric endocrinologists and their care teams,” say Dr. Alonso and colleagues.
Disproportionate rate of hospitalization, DKA among Black patients
Initiated in April 2020, the T1D Exchange Quality Improvement Collaborative comprises 56 diabetes centers, of which 52 submitted a total of 266 cases involving patients younger than 19 years who had type 1 diabetes and who tested positive for SARS-CoV-2 infection. Those with new-onset type 1 diabetes were excluded from this analysis and were reported separately. The data were collected between April 9, 2020, and Jan. 15, 2021.
Of the 266 patients, 23% (61) were hospitalized, and 205 were not. There were no differences by age, gender, or diabetes duration.
However, those hospitalized were more likely to be Black (34% vs. 13% among White patients; P < .001) and to have public health insurance (64% vs. 41%; P < .001). They also had higher A1c levels than patients who were not hospitalized (11% vs. 8.2%; P < .001), and fewer used insulin pumps (26% vs. 54%; P < .001) and continuous glucose monitors (39% vs. 75%; P < .001).
Those hospitalized were also more likely to have hyperglycemia (48% vs. 28%; P = .007), nausea (33% vs. 6%; P < .001), and vomiting (49% vs. 3%; P < .001). Rates of dry cough, excess fatigue, and body aches/headaches did not differ between those hospitalized and those who remained at home.
The most common adverse outcome was DKA, which occurred in 72% (44) of those hospitalized.
The most recent A1c level was less than 9% in 82% of those hospitalized vs. 31% of those who weren’t (P < .001) and in 38 of the 44 (86%) who had DKA.
“Our data reveal a disproportionate rate of hospitalization and DKA among racial and ethnic minority groups, children who were publicly insured, and those with higher A1c. It is essential to find pathways for the most vulnerable patients to have adequate, equitable access to medical care via in person and telehealth services, to obtain and successfully use diabetes technology, and to optimize sick day management,” say Dr. Alonso and colleagues.
One child, a 15-year-old White boy, underwent intubation and was placed on a ventilator. His most recent A1c was 8.9%. Another child, a 13-year-old boy whose most recent A1c level was 11.1%, developed multisystem inflammatory syndrome of childhood.
The registry remains open.
The T1D Exchange QI Collaborative is funded by the Helmsley Charitable Trust. The T1D Exchange received partial financial support for this study from Abbott Diabetes, Dexcom, Medtronic, Insulet Corporation, JDRF, Eli Lilly, and Tandem Diabetes Care. None of the sponsors were involved in initiating, designing, or preparing the manuscript for this study.
A version of this article first appeared on Medscape.com.
Acella recalls NP Thyroid lots found to have reduced potency
In its third voluntary recall in the past year, , this time after routine testing found the pills to be subpotent.
Specifically, the affected lots were found to contain less than 90% of the drug’s two labeled ingredients to treat hypothyroidism: liothyronine (LT3) and/or levothyroxine (LT4).
The affected lots include 15-mg, 30-mg, 60-mg, 90-mg and 120-mg formulations of NP Thyroid tablets, packed in 100-count and 7-count bottles.
The list of the specific recalled lots is published on the Food and Drug Administration website.
Acella reports that, so far, 43 reports of serious adverse events that could be related to the recall have been received.
Symptoms suggesting patients may have received a subpotent batch include the common signs of hypothyroidism, such as fatigue, increased sensitivity to cold, constipation, dry skin, puffy face, hair loss, slow heart rate, depression, swelling of the thyroid gland and/or unexplained weight gain or difficulty losing weight, Acella reports.
“There is reasonable risk of serious injury in newborn infants or pregnant women with hypothyroidism including early miscarriage, fetal hyperthyroidism, and/or impairments to fetal neural and skeletal development,” the company cautions in the recall statement.
Acella adds that toxic cardiac manifestations of hyperthyroidism, including cardiac pain, palpitations or cardiac arrhythmia may occur in elderly patients and patients with underlying cardiac disease.
While Acella is notifying affected parties to discontinue distribution of the recalled products, it advises that patients who are currently taking NP Thyroid from the lots being recalled “should not discontinue use without contacting their healthcare provider for further guidance and/or a replacement prescription.”
In November 2020, a recall of NP Thyroid was issued after FDA testing found subpotent levels, as low as 87% of the labeled amount, of LT4 in some lots.
And earlier, in May 2020, the company recalled 13 lots of the tablets due to excessive potency, with FDA testing showing some tablets contained up to 115% of the labeled amount of LT3.
NP Thyroid is a type of desiccated animal thyroid product that was long the standard of care for hypothyroidism prior to the advent of the synthetic hypothyroidism drug, Synthroid (levothyroxine sodium), now the most commonly used hypothyroidism treatment.
On its website, Acella refers to NP Thyroid as a “natural choice for thyroid therapy,” as desiccated thyroid is commonly referred to.
However, one of the most common concerns about desiccated thyroid is a tendency to have unreliable concentrations of active ingredients, as discussed in American Thyroid Association recommendations.
The “amounts of both T4 and T3 can vary in every batch of desiccated thyroid, making it harder to keep blood levels right,” the ATA states.
“Finally, even desiccated thyroid pills have chemicals (binders) in them to hold the pill together, so they are not completely ‘natural.’ ”
Consumers with questions about the recall are advised to email Acella Pharmaceuticals at [email protected] or call 1-888-424-4341, Monday through Friday from 8:00 am to 5:00 pm ET.
Being overweight ups risk of severe COVID-19 in hospital
In a global meta-analysis of more than 7,000 patients who were hospitalized with COVID-19, individuals with overweight or obesity were more likely to need respiratory support but were not more likely to die in the hospital, compared to individuals of normal weight.
Compared to patients without diabetes, those with diabetes had higher odds of needing invasive respiratory support (with intubation) but not for needing noninvasive respiratory support or of dying in the hospital.
“Surprisingly,” among patients with diabetes, being overweight or having obesity did not further increase the odds of any of these outcomes, the researchers wrote. The finding needs to be confirmed in larger studies, they said, because the sample sizes in these subanalyses were small and the confidence intervals were large.
The study by Danielle K. Longmore, PhD, of Murdoch Children’s Research Institute (MCRI), Melbourne, and colleagues from the International BMI-COVID consortium, was published online April 15 in Diabetes Care.
This new research “adds to the known data on the associations between obesity and severe COVID-19 disease and extends these findings” to patients who are overweight and/or have diabetes, Dr. Longmore, a pediatric endocrinologist with a clinical and research interest in childhood and youth obesity, said in an interview.
Immunologist Siroon Bekkering, PhD, of Radboud University Medical Center, Nijmegen, the Netherlands, explained that never before have so much data of different types regarding obesity been combined in one large study. Dr. Bekkering is a coauthor of the article and was a principal investigator.
“Several national and international observations already showed the important role of overweight and obesity in a more severe COVID-19 course. This study adds to those observations by combining data from several countries with the possibility to look at the risk factors separately,” she said in a statement from her institution.
“Regardless of other risk factors (such as heart disease or diabetes), we now see that too high a BMI [body mass index] can actually lead to a more severe course in [coronavirus] infection,” she said.
Study implications: Data show that overweight, obesity add to risk
These latest findings highlight the urgent need to develop public health policies to address socioeconomic and psychological drivers of obesity, Dr. Longmore said.
“Although taking steps to address obesity in the short term is unlikely to have an immediate impact in the COVID-19 pandemic, it will likely reduce the disease burden in future viral pandemics and reduce risks of complications like heart disease and stroke,” she observed in a statement issued by MCRI.
Coauthor Kirsty R. Short, PhD, a research fellow at the University of Queensland, Brisbane, Australia, noted that “obesity is associated with numerous poor health outcomes, including increased risk of cardiometabolic and respiratory disease and more severe viral disease including influenza, dengue, and SARS-CoV-1.
“Given the large scale of this study,” she said, “we have conclusively shown that being overweight or obese are independent risk factors for worse outcomes in adults hospitalized with COVID-19.”
“At the moment, the World Health Organization has not had enough high-quality data to include being overweight or obese as a risk factor for severe COVID-19 disease,” added another author, David P. Burgner, PhD, a pediatric infectious diseases clinician scientist from MCRI.

“Our study should help inform decisions about which higher-risk groups should be vaccinated as a priority,” he observed.
Does being overweight up risk of worse COVID-19 outcomes?
About 13% of the world’s population are overweight, and 40% have obesity. There are wide between-country variations in these data, and about 90% of patients with type 2 diabetes are overweight or obese, the researchers noted.
The Organisation for Economic Co-operation and Development reported that the prevalence of obesity in 2016-2017 was 5.7% to 8.9% in Asia, 9.8% to 16.8% in Europe, 26.5% in South Africa, and 40.0% in the United States, they added.
Obesity is common and has emerged as an important risk factor for severe COVID-19. However, most previous studies of COVID-19 and elevated BMI were conducted in single centers and did not focus on patients with overweight.
To investigate, the researchers identified 7,244 patients (two-thirds were overweight or obese) who were hospitalized with COVID-19 in 69 hospitals (18 sites) in 11 countries from Jan. 17, 2020, to June 2, 2020.
Most patients were hospitalized with COVID-19 in the Netherlands (2,260), followed by New York City (1,682), Switzerland (920), St. Louis (805), Norway, Italy, China, South Africa, Indonesia, Denmark, Los Angeles, Austria, and Singapore.
Just over half (60%) of the individuals were male, and 52% were older than 65.
Overall, 34.8% were overweight, and 30.8% had obesity, but the average weight varied considerably between countries and sites.
Increased need for respiratory support, same mortality risk
Compared with patients with normal weight, patients who were overweight had a 44% increased risk of needing supplemental oxygen/noninvasive ventilation, and those with obesity had a 75% increased risk of this, after adjustment for age (< 65, ≥ 65), sex, hypertension, diabetes, or preexisting cardiovascular disease or respiratory conditions.
Patients who were overweight had a 22% increased risk of needing invasive (mechanical) ventilation, and those with obesity had a 73% increased risk of this, after multivariable adjustment.
Being overweight or having obesity was not associated with a significantly increased risk of dying in the hospital, however.
“In other viral respiratory infections, such as influenza, there is a similar pattern of increased requirement for ventilatory support but lower in-hospital mortality among individuals with obesity, when compared to those with normal range BMI,” Dr. Longmore noted. She said that larger studies are needed to further explore this finding regarding COVID-19.
Compared to patients without diabetes, those with diabetes had a 21% increased risk of requiring invasive ventilation, but they did not have an increased risk of needing noninvasive ventilation or of dying in the hospital.
As in previous studies, individuals who had cardiovascular and preexisting respiratory diseases were not at greater risk of needing oxygen or mechanical ventilation but were at increased risk for in-hospital death. Men had a greater risk of needing invasive mechanical ventilation, and individuals who were older than 65 had an increased risk of requiring oxygen or of dying in the hospital.
A living meta-analysis, call for more collaborators
“We consider this a ‘living meta-analysis’ and invite other centers to join us,” Dr. Longmore said. “We hope to update the analyses as more data are contributed.”
No specific project funded the study. The authors have disclosed no relevant financial relationships.
A version of this article first appeared on Medscape.com.
In a global meta-analysis of more than 7,000 patients who were hospitalized with COVID-19, individuals with overweight or obesity were more likely to need respiratory support but were not more likely to die in the hospital, compared to individuals of normal weight.
Compared to patients without diabetes, those with diabetes had higher odds of needing invasive respiratory support (with intubation) but not for needing noninvasive respiratory support or of dying in the hospital.
“Surprisingly,” among patients with diabetes, being overweight or having obesity did not further increase the odds of any of these outcomes, the researchers wrote. The finding needs to be confirmed in larger studies, they said, because the sample sizes in these subanalyses were small and the confidence intervals were large.
The study by Danielle K. Longmore, PhD, of Murdoch Children’s Research Institute (MCRI), Melbourne, and colleagues from the International BMI-COVID consortium, was published online April 15 in Diabetes Care.
This new research “adds to the known data on the associations between obesity and severe COVID-19 disease and extends these findings” to patients who are overweight and/or have diabetes, Dr. Longmore, a pediatric endocrinologist with a clinical and research interest in childhood and youth obesity, said in an interview.
Immunologist Siroon Bekkering, PhD, of Radboud University Medical Center, Nijmegen, the Netherlands, explained that never before have so much data of different types regarding obesity been combined in one large study. Dr. Bekkering is a coauthor of the article and was a principal investigator.
“Several national and international observations already showed the important role of overweight and obesity in a more severe COVID-19 course. This study adds to those observations by combining data from several countries with the possibility to look at the risk factors separately,” she said in a statement from her institution.
“Regardless of other risk factors (such as heart disease or diabetes), we now see that too high a BMI [body mass index] can actually lead to a more severe course in [coronavirus] infection,” she said.
Study implications: Data show that overweight, obesity add to risk
These latest findings highlight the urgent need to develop public health policies to address socioeconomic and psychological drivers of obesity, Dr. Longmore said.
“Although taking steps to address obesity in the short term is unlikely to have an immediate impact in the COVID-19 pandemic, it will likely reduce the disease burden in future viral pandemics and reduce risks of complications like heart disease and stroke,” she observed in a statement issued by MCRI.
Coauthor Kirsty R. Short, PhD, a research fellow at the University of Queensland, Brisbane, Australia, noted that “obesity is associated with numerous poor health outcomes, including increased risk of cardiometabolic and respiratory disease and more severe viral disease including influenza, dengue, and SARS-CoV-1.
“Given the large scale of this study,” she said, “we have conclusively shown that being overweight or obese are independent risk factors for worse outcomes in adults hospitalized with COVID-19.”
“At the moment, the World Health Organization has not had enough high-quality data to include being overweight or obese as a risk factor for severe COVID-19 disease,” added another author, David P. Burgner, PhD, a pediatric infectious diseases clinician scientist from MCRI.
“Our study should help inform decisions about which higher-risk groups should be vaccinated as a priority,” he observed.
Does being overweight up risk of worse COVID-19 outcomes?
About 13% of the world’s population are overweight, and 40% have obesity. There are wide between-country variations in these data, and about 90% of patients with type 2 diabetes are overweight or obese, the researchers noted.
The Organisation for Economic Co-operation and Development reported that the prevalence of obesity in 2016-2017 was 5.7% to 8.9% in Asia, 9.8% to 16.8% in Europe, 26.5% in South Africa, and 40.0% in the United States, they added.
Obesity is common and has emerged as an important risk factor for severe COVID-19. However, most previous studies of COVID-19 and elevated BMI were conducted in single centers and did not focus on patients with overweight.
To investigate, the researchers identified 7,244 patients (two-thirds were overweight or obese) who were hospitalized with COVID-19 in 69 hospitals (18 sites) in 11 countries from Jan. 17, 2020, to June 2, 2020.
Most patients were hospitalized with COVID-19 in the Netherlands (2,260), followed by New York City (1,682), Switzerland (920), St. Louis (805), Norway, Italy, China, South Africa, Indonesia, Denmark, Los Angeles, Austria, and Singapore.
Just over half (60%) of the individuals were male, and 52% were older than 65.
Overall, 34.8% were overweight, and 30.8% had obesity, but the average weight varied considerably between countries and sites.
Increased need for respiratory support, same mortality risk
Compared with patients with normal weight, patients who were overweight had a 44% increased risk of needing supplemental oxygen/noninvasive ventilation, and those with obesity had a 75% increased risk of this, after adjustment for age (< 65, ≥ 65), sex, hypertension, diabetes, or preexisting cardiovascular disease or respiratory conditions.
Patients who were overweight had a 22% increased risk of needing invasive (mechanical) ventilation, and those with obesity had a 73% increased risk of this, after multivariable adjustment.
Being overweight or having obesity was not associated with a significantly increased risk of dying in the hospital, however.
“In other viral respiratory infections, such as influenza, there is a similar pattern of increased requirement for ventilatory support but lower in-hospital mortality among individuals with obesity, when compared to those with normal range BMI,” Dr. Longmore noted. She said that larger studies are needed to further explore this finding regarding COVID-19.
Compared to patients without diabetes, those with diabetes had a 21% increased risk of requiring invasive ventilation, but they did not have an increased risk of needing noninvasive ventilation or of dying in the hospital.
As in previous studies, individuals who had cardiovascular and preexisting respiratory diseases were not at greater risk of needing oxygen or mechanical ventilation but were at increased risk for in-hospital death. Men had a greater risk of needing invasive mechanical ventilation, and individuals who were older than 65 had an increased risk of requiring oxygen or of dying in the hospital.
A living meta-analysis, call for more collaborators
“We consider this a ‘living meta-analysis’ and invite other centers to join us,” Dr. Longmore said. “We hope to update the analyses as more data are contributed.”
No specific project funded the study. The authors have disclosed no relevant financial relationships.
A version of this article first appeared on Medscape.com.