User login
Possible mortality risk seen with tramadol in osteoarthritis
Tramadol appears to be associated with higher mortality risk among older patients with osteoarthritis when compared against common NSAIDs, according to findings from a study published online March 12 in JAMA.

The findings from the retrospective cohort study are worth noting despite their susceptibility to confounding by indication because “tramadol is a weak opioid agonist and has been considered a potential alternative to NSAIDs and traditional opioids because of its assumed relatively lower risk of serious cardiovascular and gastrointestinal adverse effects than NSAIDs, as well as a lower risk of addiction and respiratory depression compared with other opioids,” wrote Chao Zeng, MD, PhD, of Xiangya Hospital of Central South University, Changsha, China, and his coauthors.
The investigators analyzed data from a combined total of 88,902 individuals aged 50 years and older with knee, hip, or hand osteoarthritis who were seen during 2000-2015 and had visits recorded in the United Kingdom’s The Health Improvement Network (THIN) electronic medical records database. Participants were matched on sociodemographic and lifestyle factors, as well as osteoarthritis duration, comorbidities, other prescriptions, and health care utilization prior to the index date of the study.
Over 1 year of follow-up, researchers saw a 71% higher risk of all-cause mortality in patients taking tramadol than that in seen in those taking naproxen, 88% higher than in those taking diclofenac, 70% higher than in those taking celecoxib, and about twice as high as in patients taking etoricoxib.
However, there was no significant difference in risk of all-cause mortality between tramadol and codeine, the researchers found.
The authors suggested that tramadol may have adverse effects on the neurologic system by inhibiting central serotonin and norepinephrine uptake, which could potentially lead to serotonin syndrome. They also speculated that it could increase the risk of postoperative delirium, cause fatal poisoning or respiratory depression if taken in conjunction with alcohol or other drugs, or increase the risk of hypoglycemia, hyponatremia, fractures, or falls.
The numbers of deaths from cardiovascular, gastrointestinal, infection, cancer, and respiratory diseases were all higher in the tramadol group, compared with patients taking NSAIDs, but the differences were not statistically significant because of the relatively small number of deaths, the authors said.
Overall, 44,451 patients were taking tramadol, 12,397 were taking naproxen, 6,512 were taking diclofenac, 5,674 were taking celecoxib, 2,946 were taking etoricoxib, and 16,922 were taking codeine.
Patients in the tramadol cohort were generally older, with higher body mass index, a longer duration of osteoarthritis, and had a higher prevalence of comorbidities, higher health care utilization, and more prescriptions of other medications.
The authors noted that, while the patients from each medication cohort were matched on propensity score, the results were still susceptible to confounding by indication and should be interpreted with caution.
The study was supported by grants from the National Institute of Arthritis and Musculoskeletal and Skin Diseases and the National Natural Science Foundation of China. One author declared funding from the National Institute on Drug Abuse during the conduct of the study and grants from Optum Labs outside the study. No other conflicts of interest were declared.
SOURCE: Zeng C et al. JAMA. 2019;321:969-82.
Tramadol appears to be associated with higher mortality risk among older patients with osteoarthritis when compared against common NSAIDs, according to findings from a study published online March 12 in JAMA.
The findings from the retrospective cohort study are worth noting despite their susceptibility to confounding by indication because “tramadol is a weak opioid agonist and has been considered a potential alternative to NSAIDs and traditional opioids because of its assumed relatively lower risk of serious cardiovascular and gastrointestinal adverse effects than NSAIDs, as well as a lower risk of addiction and respiratory depression compared with other opioids,” wrote Chao Zeng, MD, PhD, of Xiangya Hospital of Central South University, Changsha, China, and his coauthors.
The investigators analyzed data from a combined total of 88,902 individuals aged 50 years and older with knee, hip, or hand osteoarthritis who were seen during 2000-2015 and had visits recorded in the United Kingdom’s The Health Improvement Network (THIN) electronic medical records database. Participants were matched on sociodemographic and lifestyle factors, as well as osteoarthritis duration, comorbidities, other prescriptions, and health care utilization prior to the index date of the study.
Over 1 year of follow-up, researchers saw a 71% higher risk of all-cause mortality in patients taking tramadol than that in seen in those taking naproxen, 88% higher than in those taking diclofenac, 70% higher than in those taking celecoxib, and about twice as high as in patients taking etoricoxib.
However, there was no significant difference in risk of all-cause mortality between tramadol and codeine, the researchers found.
The authors suggested that tramadol may have adverse effects on the neurologic system by inhibiting central serotonin and norepinephrine uptake, which could potentially lead to serotonin syndrome. They also speculated that it could increase the risk of postoperative delirium, cause fatal poisoning or respiratory depression if taken in conjunction with alcohol or other drugs, or increase the risk of hypoglycemia, hyponatremia, fractures, or falls.
The numbers of deaths from cardiovascular, gastrointestinal, infection, cancer, and respiratory diseases were all higher in the tramadol group, compared with patients taking NSAIDs, but the differences were not statistically significant because of the relatively small number of deaths, the authors said.
Overall, 44,451 patients were taking tramadol, 12,397 were taking naproxen, 6,512 were taking diclofenac, 5,674 were taking celecoxib, 2,946 were taking etoricoxib, and 16,922 were taking codeine.
Patients in the tramadol cohort were generally older, with higher body mass index, a longer duration of osteoarthritis, and had a higher prevalence of comorbidities, higher health care utilization, and more prescriptions of other medications.
The authors noted that, while the patients from each medication cohort were matched on propensity score, the results were still susceptible to confounding by indication and should be interpreted with caution.
The study was supported by grants from the National Institute of Arthritis and Musculoskeletal and Skin Diseases and the National Natural Science Foundation of China. One author declared funding from the National Institute on Drug Abuse during the conduct of the study and grants from Optum Labs outside the study. No other conflicts of interest were declared.
SOURCE: Zeng C et al. JAMA. 2019;321:969-82.
FROM JAMA
Trends in VA Telerehabilitation Patients and Encounters Over Time and by Rurality
Historically, the Veterans Health Administration (VHA) has excelled at improving veterans’ access to health care and enhancing foundational services, such as prosthetics and other veteran-centric services, and this continues to be the VHA’s top priority.1 Travel distance and time are often barriers to accessing health care for many veterans.2-11 For veterans with disabilities who must overcome additional physical, cognitive, and emotional obstacles to access vital rehabilitation services, these geographic obstacles are magnified. Further compounding the challenge is that rehabilitation therapies frequently require multiple encounters. Telerehabilitation is a promising solution for veterans in need of rehabilitation to regain optimal functioning. This alternative mode of service delivery can help veterans overcome geographic access barriers by delivering health care directly to veterans in their homes or nearby community-based outpatient clinics.12,13
A growing body of evidence supports telerehabilitation. In a 2017 systematic review and meta-analysis, Cottrell and colleagues reviewed and analyzed data from 13 studies that met their inclusion criteria; specifically, their meta-analytic sample comprised adults aged ≥ 18 years presenting with any diagnosed primary musculoskeletal condition; treatment interventions via a real-time telerehabilitation medium, trials that had a comparison group with the same condition; provided clinical outcomes data, and included published randomized and nonrandomized controlled trials.14 Based on their aggregated results, they concluded that real-time telerehabilitation was effective in improving physical function (standardized mean difference [SMD], 0.63; 95% CI, 0.92-2.33; I2, 93%), and reducing pain (SMD, 0.66; 95% CI, −0.27- .60; I2, 96%) in patients with any diagnosed primary musculoskeletal condition.14
Two other systematic reviews conducted by Pietrzak and colleagues and Agostini and colleagues also demonstrated the clinical effectiveness of telerehabilitation.15,16 Clinical effectiveness was defined as changes in health, functional status, and satisfaction with the telerehabilitation services delivered. The studies examined in the review included those that provided online self-management and education in addition to exercise via teleconferencing in real time.
Pietrzak and colleagues found that Internet-based osteoarthritis self-management interventions significantly improved 4 of 6 health status measures reviewed (ie, pain, fatigue, activity limitation, health distress, disability, and self‐reported global health).15 User acceptance and satisfaction were high (≥ 70% satisfied) in all studies meeting the inclusion criteria.
Agostini and colleagues found that telerehabilitation was more effective than other modes of delivering rehabilitation to regain motor function in cardiac (SMD, 0.24; 95% CI, 0.04-0.43) and total knee arthroplasty (Timed Up and Go test: SMD, −5.17; 95% CI, −9.79- −0.55) patients.16 Some evidence from VHA and non-VHA studies also support the use of telerehabilitation to reduce health care costs,17-19 improve treatment adherence,12,20 and enhance patient physical, cognitive and mobility function, as well as patient satisfaction and health-related quality of life.13,21-24
Since the first recorded use of telehealth in 1959, the application of technology to deliver health care, including rehabilitation services, has increased exponentially.14 In fiscal year (FY) 2017 alone, the VA provided > 2 million episodes of care for > 700,000 veterans using telehealth services.2
Although the process for accessing telerehabilitation may vary throughout the VA, typically a few common factors make a veteran eligible for this mode of rehabilitation care delivery: Veterans must meet criteria for a specific program (eg, amputation, occupational therapy, and physical therapy) and receive VA care from a VA medical facility or clinic that offers telehealth services. Care providers must believe that the veteran would benefit from telerehabilitation (eg, limited mobility and long-distance travel to the facility) and that they would be able to receive an appropriate consult. The veteran must meet the following requirements: (1) willingness to consent to a visit via telehealth; (2) access to required equipment/e-mail; and (3) a caregiver to assist if they are unable to complete a visit independently.
In this article, we provide an overview of the growth of telerehabilitation in the VHA. Data are presented for specific telerehabilitation programs over time and by rurality.
Methods
The VHA Support Service Center works with VHA program offices and field users to provide field-focused business, clinical, and special topic reports. An online portal provides access to these customizable reports organized as data cubes, which represent data dimensions (ie, clinic type) and measures (ie, number of unique patients). For this study, we used the Connected Care, Telehealth, Call Centers Clinical Video Telehealth/Store and Forward Telehealth data cube clinical stop codes to identify the numbers of telerehabilitation veteran users and encounters across time. The following telerehabilitation clinic-stop codes were selected: 197 (polytrauma/traumatic brain injury [TBI]–individuals), 201 (Physical Medicine and Rehabilitation [PM&R] Service), 205 (physical therapy), 206 (occupational therapy), 211 (PM&R amputation clinic), 418 (amputation clinic), 214 (kinesiotherapy), and 240 (PM&R assistive technology clinic). Data for total unique patients served and the total number of encounters were extracted at the national level and by rurality from FY 2012 to FY 2017, providing the past 5 years of VHA telerehabilitation data.
It is important to note that in FY 2015, the VHA changed its definition of rurality to a rural-urban commuting areas (RUCA)-based system (www.ruralhealth.va.gov/rural-definition.asp). Prior to FY 2015, the VHA used the US Census Bureau (CB) urbanized area definitions. According to CB, an urbanized area contains a central city and surrounding area that totals > 50,000 in population. It also includes places outside of urbanized areas with populations > 2,500. Rural areas are defined as all other areas. VHA added a third category, highly rural, which is defined as areas that had < 7 people per square mile. In the RUCA system, each census tract defined by the CB is given a score. The VHA definitions are as follows:
- Urban (U)—census tracts with RUCA scores of 1.0 or 1.1. These tracts are determined by the CB as being in an urban core and having the majority of their workers commute within that same core (1.0). If 30% to 49% commute to an even larger urban core, then the code is 1.1;
- Rural (R)—all tracts not receiving scores in the urban or highly rural tiers; and
- Highly rural (H)—tracts with a RUCA score of 10.0. These are the most remote occupied land areas. Less than 10% of workers travel to CB-defined urbanized areas or urban clusters.
In addition, VHA recently added an “I” category to complement “U,” “R,” and “H.” The “I” value is assigned to veterans living on the US insular islands (ie, territories): Guam, American Samoa, Northern Marianas, and US Virgin Islands. For the analysis by rurality in this study, we excluded veterans living in the insular islands and those of unknown rurality (< 1.0% of patients and encounters). Further, because the numbers of highly rural veterans were relatively small (< 2% of patients and encounters), the rural and highly rural categories were combined and compared with urban-dwelling veterans.
Results
Overall, the workload for telerehabilitation nearly quadrupled over the 5-year period (Table 1 and Figure 1). 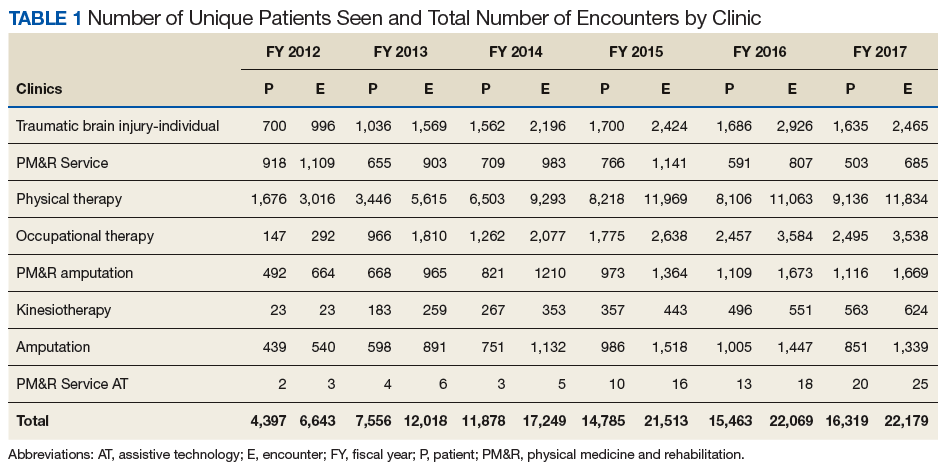
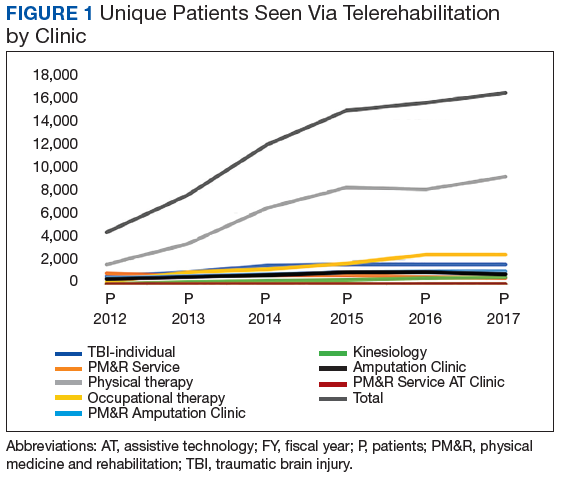
Interesting trends were seen by clinic type. Some clinics increased substantially, whereas others showed only moderate increases, and in 1 case (PM&R Service), a decrease. For example, there is significant growth in the number of patients and encounters involving physical therapy through telerehabilitation. This telerehabilitation clinic increased its workload from 1,676 patients with 3,016 encounters in FY 2012 to 9,136 patients with 11,834 encounters in FY 2017, accounting for 62.6% of total growth in patients and 56.8% of total growth in encounters.
Other clinics showing substantial growth over time included occupational therapy and polytrauma/TBI-individual secondary evaluation. Kinesiotherapy telerehabilitation was almost nonexistent in the VHA during FY 2012, with only 23 patients having 23 encounters. By FY 2017, there were 563 patients with 624 kinesiotherapy telerehabilitation encounters, equating to staggering increases in 5 years: 2,348% for patients and 2,613% for encounters. Similarly, the Physical Medicine and Rehabilitation Assistive Technology clinics had very low numbers in FY 2012 (patients, 2; encounters, 3) and increased over time; albeit, at a slow rate.
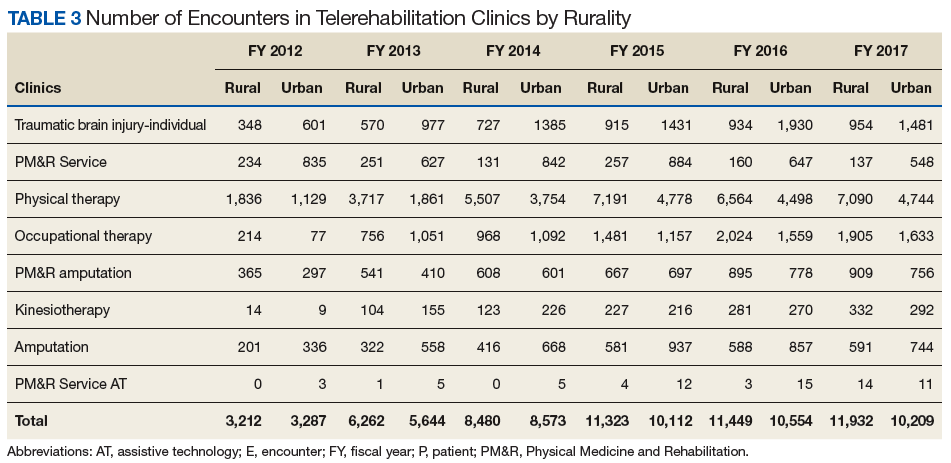
Trends by Rurality
Trends by rural location of patients and encounters must be interpreted with caution because of the changing rural definition between FY 2014 and FY 2015 (Tables 2 and 3; Figures 3 and 4). 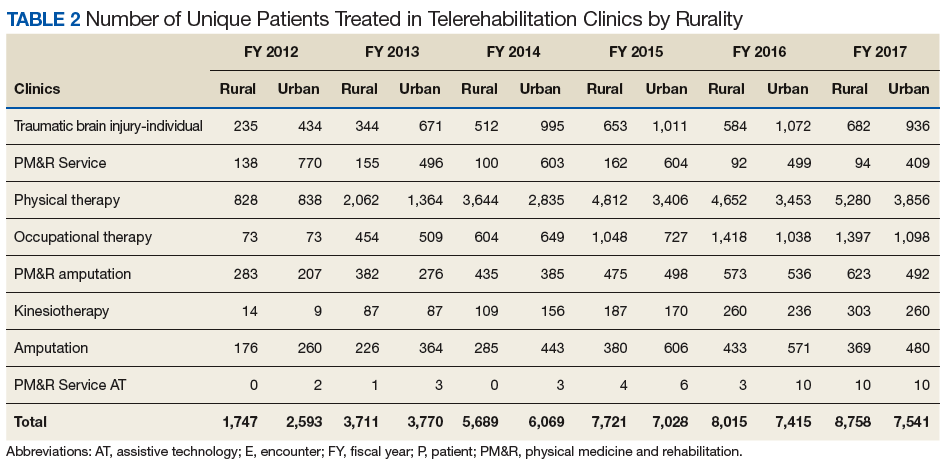
The increased total number of patients seen between FY 2012 and FY 2014 (old definition) was 225% for rural veterans vs 134% for urban veterans. Between FY 2015 and FY 2017 (new definition), the increase was lower for both groups (rural, 13.4%; urban, 7.3%), but rural veterans still increased at a higher rate than did urban dwellers. 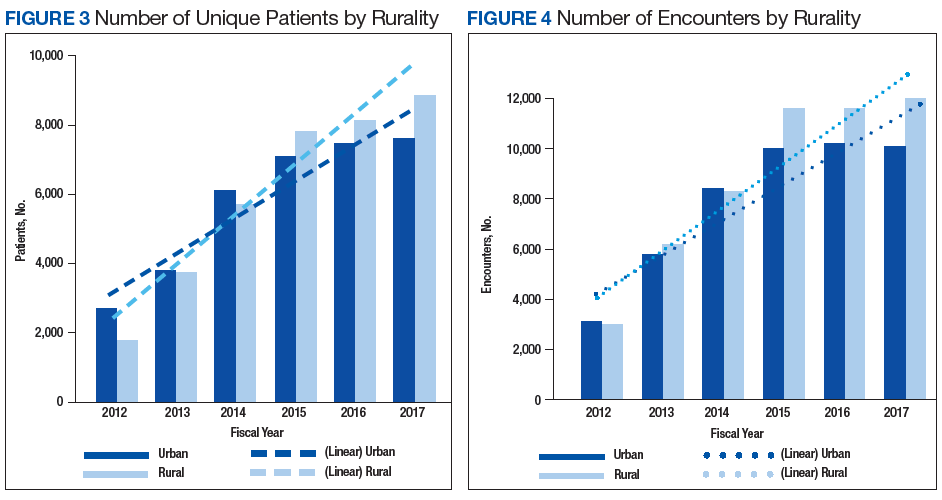
Discussion
Our primary aim was to provide data on the growth of telerehabilitation in the VHA over the past 5 years. Our secondary aim was to examine growth in the use of telerehabilitation by rurality. Specifically, we provided an overview of telerehabilitation growth in terms of unique patients and overall encounters in the VHA by rurality from FY 2012 to FY 2014 and FY 2015 to FY 2017 using the following programs: Polytrauma/TBI, PM&R Service, physical therapy, occupational therapy, PM&R amputation clinic, amputation clinic, kinesiotherapy, and PM&R assistive technology clinic. Our findings demonstrated a noteworthy increase in telerehabilitation encounters and unique patients over time for these programs. These findings were consistent with the overall trend of continued growth and expansion of telehealth within the VHA.
Our findings reveal an upward trend in the total number of rural encounters and rural unique patients despite the change in the VA’s definition of rurality in FY 2015. To our knowledge, urban and rural use of telerehabilitation has not been examined previously. Under both definitions of rurality, encounters and unique patients show an important increase over time, and by year-end 2017, more than half of all patients and encounters were attributed to rural patients (53.7% and 53.9%, respectively). Indeed, the upward trend may have been more pronounced if the rural definition had not changed in FY 2015. Our early VHA stroke patients study on the difference between rural-urban patients and taxonomies showed that the RUCA definition was more likely to reduce the number of rural patients by 8.5% than the early definition used by the VHA.26
It is notable that although the use of tele-delivery of rehabilitation has continually increased, the rate of this increase was steeper from FY 2012 to FY 2014 than FY 2015 to FY 2017. For the programs under consideration in this study, the total number of rural patients/encounters increased throughout the observed periods. However, urban patients and encounters increased through FY 2016 and experienced a slight decrease in FY 2017.
The appearance of a slower rate of increase may be due to a rapid initial rate of increase through early adopters and “crossing the diffusion chasm,” a well-documented process of slower diffusion between the time of invention to penetration that often characterizes the spread of successful telehealth innovations
With an emphasis on increasing access to rehabilitation services, the VHA can expect to see a continuing increase in both the number and the percentage of telerehabilitation rural patients and encounters. The VHA has several telerehabilitation initiatives underway through the VHA’s Physical Medicine and Rehabilitation Telerehabilitation Enterprise Wide Initiative (TREWI) and Rural Veterans Telerehabilitation Initiative. These projects demonstrate the feasibility of this delivery approach and facilitate integration of this modality in clinical workflows. However, to sustain these efforts, facilities will need more infrastructure and personnel resources dedicated to the delivery of services.
In an ongoing evaluation of the TREWI, several factors seem to influence the uptake of the VHA Office of Rural Health TREWI programs. These factors are the presence or absence of a local site champion; the quality of hospital leadership support; the quality of past relationships between telerehabilitation sending sites and receiving sites; barriers to getting a telehealth service agreement in place; the availability of space; administrative know-how on setting up clinics appropriately; time involved to bring on staff; contracting issues; equipment availability and installation; cultural issues in embracing technologic innovation; training burden; hassle factors; and limited funds. Although early adopters may be able to negotiate and push through many of the barriers associated with the diffusion of telerehabilitation, the numerous barriers may slow its larger systemwide diffusion.
Telerehabilitation is a promising mode to deliver care to rural veterans who otherwise may not have access to this type of specialty care. Therefore, the identification of elements that foster telerehabilitation growth in future investigations can assist policy makers and key stakeholders in optimally leveraging program resources for maximal productivity. Future studies investigating the drivers of increases in telerehabilitation growth by rurality are warranted. Furthermore, more research is needed to examine telerehabilitation growth quality of care outcomes (eg, patient and provider satisfaction) to ensure that care is not only timely and accessible, but of high quality.
Conclusion
Disparities between rural and urban veterans compel a mode of expanding delivery of care. The VHA has embraced the use of telehealth modalities to extend its reach of rehabilitation services to veterans with disability and rehabilitation needs. Growth in telerehabilitation rural patient encounters increases access to rehabilitative care, reduces patient and caregiver travel burden, and helps ensure treatment adherence. Telerehabilitation utilization (unique patients and total encounters) is growing more rapidly for rural veterans than for their urban counterparts. Overall, telerehabilitation is filling a gap for rural veterans, as well as veterans in general with challenges in accessibility to health care. In order to make full use of the telerehabilitation services across its health care system, VA health care facilities may need to expand their effort in telerehabilitation dissemination and education among providers and veterans, particularly among providers who are less familiar with telerehabilitation services and among veterans who live in rural or highly rural areas and need special rehabilitation care.
1. Shane L. What’s in the VA secretary’s 10-point plan to reform his department? https://rebootcamp.militarytimes.com/news/pentagon-congress/2017/02/28/what-s-in-the-va-secretary-s-10-point-plan-to-reform-his-department. Published February 28, 2017. Accessed November 21, 2018.
2. Burgess JF, DeFiore DA. The effect of distance to a VA facility on the choice and level of utilization of VA outpatient services. Soc Science Med. 1994;39(1):95-104.
3. LaVela SL, Smith B, Weaver FM, Miskevics SA. Geographical proximity and health care utilization in veterans with SCI&D in the USA. Soc Science Med. 2004;59:2387-2399.
4. Piette JD, Moos RH. The influence of distance on ambulatory care use, death, and readmission following a myocardial infarction. Health Serv Res. 1996;31(5):573-591.
5. Schmitt SK, Phibbs CS, Piette JD. The influence of distance on utilization of outpatient mental health aftercare following inpatient substance abuse treatment. Addictive Behav. 2003;28(6):1183-1192.
6. Fortney JC, Booth BM, Blow FC, Bunn JY. The effects of travel barriers and age on the utilization of alcoholism treatment aftercare. Am J Drug Alcohol Abuse. 1995;21(3):391-406.
7. McCarthy JF, Blow FC, Valenstein M, et al. Veterans Affairs Health System and mental health treatment retention among patients with serious mental illness: evaluating accessibility and availability barriers. Health Serv Res. 2007;42(3):1042-1060.
8. Mooney C, Zwanziger J, Phibbs CS, Schmitt S. Is travel distance a barrier to veterans’ use of VA hospitals for medical surgical care? Soc Sci Med. 2000;50(12):1743-1755.
9. Friedman SA, Frayne SM, Berg E, et al. Travel time and attrition from VHA care among women veterans: how far is too far? Med Care. 2015;53(4)(suppl 1):S15-S22.
10. Buzza C, Ono SS, Turvey C, et al. Distance is relative: unpacking a principal barrier in rural healthcare. J Gen Intern Med. 2011;26(suppl 2):648-654.
11. Goins RT, Williams KA, Carter MW, Spencer SM, Solovieva T. Perceived barriers to health care access among rural older adults: a qualitative study. J Rural Health. 2005;21(3):206-213.
12. Kairy D, Lehoux P, Vincent C, Visintin M. A systematic review of clinical outcomes, clinical process, healthcare utilization and costs associated with telerehabilitation. Disabil Rehabil. 2009;31(6):427-447.
13. McCue M, Fairman A, Pramuka M. Enhancing quality of life through telerehabilitation. Phys Med Rehabil Clin N Am. 2010;21(1):195-205.
14. Cottrell MA, Galea OA, O’Leary SP, Hill AJ, Russell TG. Real-time telerehabilitation for the treatment of musculoskeletal conditions is effective and comparable to standard practice: a systematic review and meta-analysis. Clin Rehabil. 2017;31(5):625-638.
15. Pietrzak E, Cotea C, Pullman S, Nasveld P. Self-management and rehabilitation in osteoarthritis: is there a place for internet-based interventions? Telemed J E Health. 2013;19(10):800-805.
16. Agostini M, Moja L, Banzi R, et al. Telerehabilitation and recovery of motor function: a systematic review and meta-analysis. J Telemed Telecare. 2015;21(4):202-213.
17. Kortke H, Stromeyer H, Zittermann A, et al. New East-Westfalian Postoperative Therapy Concept: A telemedicine guide for the study of ambulatory rehabilitation of patients after cardiac surgery. Telemed J E-Health. 2006;12(4):475-483.
18. Tousignant M, Boissy P, Corriveau H, Moffet H. In home telerehabilitation for older adults after discharge from an acute hospital or rehabilitation unit: A proof-of- concept study and costs estimation. Disabil Rehabil Assist Technol. 2006;1(4):209-216.
19. Sanford JA, Griffiths PC, Richardson P, et al. The effects of in-home rehabilitation on task self-efficacy in mobility-impaired adults: a randomized clinical trial. J Am Geriatr Soc. 2006;54(11):1641-1648.
20. Nakamura K, Takano T, Akao C. The effectiveness of videophones in home healthcare for the elderly. Med Care. 1999;37(2):117-125.
21. Levy CE, Silverman E, Jia H, Geiss M, Omura D. Effects of physical therapy delivery via home video telerehabilitation on functional and health-related quality of life outcomes. J Rehabil Res Dev. 2015;52(3):361-370.
22. Guilfoyle C, Wootton R, Hassall S, et al. User satisfaction with allied health services delivered to residential facilities via videoconferencing. J Telemed Telecare. 2003;9(1):S52-S54.23. Mair F, Whitten P. Systematic review of studies of patient satisfaction with telemedicine. BMJ. 2000;320(7248):1517-1520.
24. Williams T L, May C R, Esmail A. Limitations of patient satisfaction studies in telehealthcare: a systematic review of the literature. Telemed J E-Health. 2001;7(4):293-316.
25. US Department of Veterans Affairs, Office of Telehealth Services. http://vaww.telehealth.va.gov/quality/data/index.asp. Accessed June 1, 2018. [Nonpublic document; source not verified.]
26. Jia H, Cowper D, Tang Y, et al. Post-acute stroke rehabilitation utilization: Are there difference between rural-urban patients and taxonomies? J Rural Health. 2012;28(3):242-247.
27. Cho S, Mathiassen L, Gallivan M. Crossing the chasm: from adoption to diffusion of a telehealth innovation. In: León G, Bernardos AM, Casar JR, Kautz K, De Gross JI, eds. Open IT-Based Innovation: Moving Towards Cooperative IT Transfer and Knowledge Diffusion. Boston, MA: Springer; 2008.
28. Broderick A, Lindeman D. Scaling telehealth programs: lessons from early adopters. https://www.commonwealthfund.org/publications/case-study/2013/jan/scaling-telehealth-programs-lessons-early-adopters. Published January 2013. Accessed June 1, 2018.
Historically, the Veterans Health Administration (VHA) has excelled at improving veterans’ access to health care and enhancing foundational services, such as prosthetics and other veteran-centric services, and this continues to be the VHA’s top priority.1 Travel distance and time are often barriers to accessing health care for many veterans.2-11 For veterans with disabilities who must overcome additional physical, cognitive, and emotional obstacles to access vital rehabilitation services, these geographic obstacles are magnified. Further compounding the challenge is that rehabilitation therapies frequently require multiple encounters. Telerehabilitation is a promising solution for veterans in need of rehabilitation to regain optimal functioning. This alternative mode of service delivery can help veterans overcome geographic access barriers by delivering health care directly to veterans in their homes or nearby community-based outpatient clinics.12,13
A growing body of evidence supports telerehabilitation. In a 2017 systematic review and meta-analysis, Cottrell and colleagues reviewed and analyzed data from 13 studies that met their inclusion criteria; specifically, their meta-analytic sample comprised adults aged ≥ 18 years presenting with any diagnosed primary musculoskeletal condition; treatment interventions via a real-time telerehabilitation medium, trials that had a comparison group with the same condition; provided clinical outcomes data, and included published randomized and nonrandomized controlled trials.14 Based on their aggregated results, they concluded that real-time telerehabilitation was effective in improving physical function (standardized mean difference [SMD], 0.63; 95% CI, 0.92-2.33; I2, 93%), and reducing pain (SMD, 0.66; 95% CI, −0.27- .60; I2, 96%) in patients with any diagnosed primary musculoskeletal condition.14
Two other systematic reviews conducted by Pietrzak and colleagues and Agostini and colleagues also demonstrated the clinical effectiveness of telerehabilitation.15,16 Clinical effectiveness was defined as changes in health, functional status, and satisfaction with the telerehabilitation services delivered. The studies examined in the review included those that provided online self-management and education in addition to exercise via teleconferencing in real time.
Pietrzak and colleagues found that Internet-based osteoarthritis self-management interventions significantly improved 4 of 6 health status measures reviewed (ie, pain, fatigue, activity limitation, health distress, disability, and self‐reported global health).15 User acceptance and satisfaction were high (≥ 70% satisfied) in all studies meeting the inclusion criteria.
Agostini and colleagues found that telerehabilitation was more effective than other modes of delivering rehabilitation to regain motor function in cardiac (SMD, 0.24; 95% CI, 0.04-0.43) and total knee arthroplasty (Timed Up and Go test: SMD, −5.17; 95% CI, −9.79- −0.55) patients.16 Some evidence from VHA and non-VHA studies also support the use of telerehabilitation to reduce health care costs,17-19 improve treatment adherence,12,20 and enhance patient physical, cognitive and mobility function, as well as patient satisfaction and health-related quality of life.13,21-24
Since the first recorded use of telehealth in 1959, the application of technology to deliver health care, including rehabilitation services, has increased exponentially.14 In fiscal year (FY) 2017 alone, the VA provided > 2 million episodes of care for > 700,000 veterans using telehealth services.2
Although the process for accessing telerehabilitation may vary throughout the VA, typically a few common factors make a veteran eligible for this mode of rehabilitation care delivery: Veterans must meet criteria for a specific program (eg, amputation, occupational therapy, and physical therapy) and receive VA care from a VA medical facility or clinic that offers telehealth services. Care providers must believe that the veteran would benefit from telerehabilitation (eg, limited mobility and long-distance travel to the facility) and that they would be able to receive an appropriate consult. The veteran must meet the following requirements: (1) willingness to consent to a visit via telehealth; (2) access to required equipment/e-mail; and (3) a caregiver to assist if they are unable to complete a visit independently.
In this article, we provide an overview of the growth of telerehabilitation in the VHA. Data are presented for specific telerehabilitation programs over time and by rurality.
Methods
The VHA Support Service Center works with VHA program offices and field users to provide field-focused business, clinical, and special topic reports. An online portal provides access to these customizable reports organized as data cubes, which represent data dimensions (ie, clinic type) and measures (ie, number of unique patients). For this study, we used the Connected Care, Telehealth, Call Centers Clinical Video Telehealth/Store and Forward Telehealth data cube clinical stop codes to identify the numbers of telerehabilitation veteran users and encounters across time. The following telerehabilitation clinic-stop codes were selected: 197 (polytrauma/traumatic brain injury [TBI]–individuals), 201 (Physical Medicine and Rehabilitation [PM&R] Service), 205 (physical therapy), 206 (occupational therapy), 211 (PM&R amputation clinic), 418 (amputation clinic), 214 (kinesiotherapy), and 240 (PM&R assistive technology clinic). Data for total unique patients served and the total number of encounters were extracted at the national level and by rurality from FY 2012 to FY 2017, providing the past 5 years of VHA telerehabilitation data.
It is important to note that in FY 2015, the VHA changed its definition of rurality to a rural-urban commuting areas (RUCA)-based system (www.ruralhealth.va.gov/rural-definition.asp). Prior to FY 2015, the VHA used the US Census Bureau (CB) urbanized area definitions. According to CB, an urbanized area contains a central city and surrounding area that totals > 50,000 in population. It also includes places outside of urbanized areas with populations > 2,500. Rural areas are defined as all other areas. VHA added a third category, highly rural, which is defined as areas that had < 7 people per square mile. In the RUCA system, each census tract defined by the CB is given a score. The VHA definitions are as follows:
- Urban (U)—census tracts with RUCA scores of 1.0 or 1.1. These tracts are determined by the CB as being in an urban core and having the majority of their workers commute within that same core (1.0). If 30% to 49% commute to an even larger urban core, then the code is 1.1;
- Rural (R)—all tracts not receiving scores in the urban or highly rural tiers; and
- Highly rural (H)—tracts with a RUCA score of 10.0. These are the most remote occupied land areas. Less than 10% of workers travel to CB-defined urbanized areas or urban clusters.
In addition, VHA recently added an “I” category to complement “U,” “R,” and “H.” The “I” value is assigned to veterans living on the US insular islands (ie, territories): Guam, American Samoa, Northern Marianas, and US Virgin Islands. For the analysis by rurality in this study, we excluded veterans living in the insular islands and those of unknown rurality (< 1.0% of patients and encounters). Further, because the numbers of highly rural veterans were relatively small (< 2% of patients and encounters), the rural and highly rural categories were combined and compared with urban-dwelling veterans.
Results
Overall, the workload for telerehabilitation nearly quadrupled over the 5-year period (Table 1 and Figure 1).
Interesting trends were seen by clinic type. Some clinics increased substantially, whereas others showed only moderate increases, and in 1 case (PM&R Service), a decrease. For example, there is significant growth in the number of patients and encounters involving physical therapy through telerehabilitation. This telerehabilitation clinic increased its workload from 1,676 patients with 3,016 encounters in FY 2012 to 9,136 patients with 11,834 encounters in FY 2017, accounting for 62.6% of total growth in patients and 56.8% of total growth in encounters.
Other clinics showing substantial growth over time included occupational therapy and polytrauma/TBI-individual secondary evaluation. Kinesiotherapy telerehabilitation was almost nonexistent in the VHA during FY 2012, with only 23 patients having 23 encounters. By FY 2017, there were 563 patients with 624 kinesiotherapy telerehabilitation encounters, equating to staggering increases in 5 years: 2,348% for patients and 2,613% for encounters. Similarly, the Physical Medicine and Rehabilitation Assistive Technology clinics had very low numbers in FY 2012 (patients, 2; encounters, 3) and increased over time; albeit, at a slow rate.
Trends by Rurality
Trends by rural location of patients and encounters must be interpreted with caution because of the changing rural definition between FY 2014 and FY 2015 (Tables 2 and 3; Figures 3 and 4).
The increased total number of patients seen between FY 2012 and FY 2014 (old definition) was 225% for rural veterans vs 134% for urban veterans. Between FY 2015 and FY 2017 (new definition), the increase was lower for both groups (rural, 13.4%; urban, 7.3%), but rural veterans still increased at a higher rate than did urban dwellers.
Discussion
Our primary aim was to provide data on the growth of telerehabilitation in the VHA over the past 5 years. Our secondary aim was to examine growth in the use of telerehabilitation by rurality. Specifically, we provided an overview of telerehabilitation growth in terms of unique patients and overall encounters in the VHA by rurality from FY 2012 to FY 2014 and FY 2015 to FY 2017 using the following programs: Polytrauma/TBI, PM&R Service, physical therapy, occupational therapy, PM&R amputation clinic, amputation clinic, kinesiotherapy, and PM&R assistive technology clinic. Our findings demonstrated a noteworthy increase in telerehabilitation encounters and unique patients over time for these programs. These findings were consistent with the overall trend of continued growth and expansion of telehealth within the VHA.
Our findings reveal an upward trend in the total number of rural encounters and rural unique patients despite the change in the VA’s definition of rurality in FY 2015. To our knowledge, urban and rural use of telerehabilitation has not been examined previously. Under both definitions of rurality, encounters and unique patients show an important increase over time, and by year-end 2017, more than half of all patients and encounters were attributed to rural patients (53.7% and 53.9%, respectively). Indeed, the upward trend may have been more pronounced if the rural definition had not changed in FY 2015. Our early VHA stroke patients study on the difference between rural-urban patients and taxonomies showed that the RUCA definition was more likely to reduce the number of rural patients by 8.5% than the early definition used by the VHA.26
It is notable that although the use of tele-delivery of rehabilitation has continually increased, the rate of this increase was steeper from FY 2012 to FY 2014 than FY 2015 to FY 2017. For the programs under consideration in this study, the total number of rural patients/encounters increased throughout the observed periods. However, urban patients and encounters increased through FY 2016 and experienced a slight decrease in FY 2017.
The appearance of a slower rate of increase may be due to a rapid initial rate of increase through early adopters and “crossing the diffusion chasm,” a well-documented process of slower diffusion between the time of invention to penetration that often characterizes the spread of successful telehealth innovations
With an emphasis on increasing access to rehabilitation services, the VHA can expect to see a continuing increase in both the number and the percentage of telerehabilitation rural patients and encounters. The VHA has several telerehabilitation initiatives underway through the VHA’s Physical Medicine and Rehabilitation Telerehabilitation Enterprise Wide Initiative (TREWI) and Rural Veterans Telerehabilitation Initiative. These projects demonstrate the feasibility of this delivery approach and facilitate integration of this modality in clinical workflows. However, to sustain these efforts, facilities will need more infrastructure and personnel resources dedicated to the delivery of services.
In an ongoing evaluation of the TREWI, several factors seem to influence the uptake of the VHA Office of Rural Health TREWI programs. These factors are the presence or absence of a local site champion; the quality of hospital leadership support; the quality of past relationships between telerehabilitation sending sites and receiving sites; barriers to getting a telehealth service agreement in place; the availability of space; administrative know-how on setting up clinics appropriately; time involved to bring on staff; contracting issues; equipment availability and installation; cultural issues in embracing technologic innovation; training burden; hassle factors; and limited funds. Although early adopters may be able to negotiate and push through many of the barriers associated with the diffusion of telerehabilitation, the numerous barriers may slow its larger systemwide diffusion.
Telerehabilitation is a promising mode to deliver care to rural veterans who otherwise may not have access to this type of specialty care. Therefore, the identification of elements that foster telerehabilitation growth in future investigations can assist policy makers and key stakeholders in optimally leveraging program resources for maximal productivity. Future studies investigating the drivers of increases in telerehabilitation growth by rurality are warranted. Furthermore, more research is needed to examine telerehabilitation growth quality of care outcomes (eg, patient and provider satisfaction) to ensure that care is not only timely and accessible, but of high quality.
Conclusion
Disparities between rural and urban veterans compel a mode of expanding delivery of care. The VHA has embraced the use of telehealth modalities to extend its reach of rehabilitation services to veterans with disability and rehabilitation needs. Growth in telerehabilitation rural patient encounters increases access to rehabilitative care, reduces patient and caregiver travel burden, and helps ensure treatment adherence. Telerehabilitation utilization (unique patients and total encounters) is growing more rapidly for rural veterans than for their urban counterparts. Overall, telerehabilitation is filling a gap for rural veterans, as well as veterans in general with challenges in accessibility to health care. In order to make full use of the telerehabilitation services across its health care system, VA health care facilities may need to expand their effort in telerehabilitation dissemination and education among providers and veterans, particularly among providers who are less familiar with telerehabilitation services and among veterans who live in rural or highly rural areas and need special rehabilitation care.
1. Shane L. What’s in the VA secretary’s 10-point plan to reform his department? https://rebootcamp.militarytimes.com/news/pentagon-congress/2017/02/28/what-s-in-the-va-secretary-s-10-point-plan-to-reform-his-department. Published February 28, 2017. Accessed November 21, 2018.
2. Burgess JF, DeFiore DA. The effect of distance to a VA facility on the choice and level of utilization of VA outpatient services. Soc Science Med. 1994;39(1):95-104.
3. LaVela SL, Smith B, Weaver FM, Miskevics SA. Geographical proximity and health care utilization in veterans with SCI&D in the USA. Soc Science Med. 2004;59:2387-2399.
4. Piette JD, Moos RH. The influence of distance on ambulatory care use, death, and readmission following a myocardial infarction. Health Serv Res. 1996;31(5):573-591.
5. Schmitt SK, Phibbs CS, Piette JD. The influence of distance on utilization of outpatient mental health aftercare following inpatient substance abuse treatment. Addictive Behav. 2003;28(6):1183-1192.
6. Fortney JC, Booth BM, Blow FC, Bunn JY. The effects of travel barriers and age on the utilization of alcoholism treatment aftercare. Am J Drug Alcohol Abuse. 1995;21(3):391-406.
7. McCarthy JF, Blow FC, Valenstein M, et al. Veterans Affairs Health System and mental health treatment retention among patients with serious mental illness: evaluating accessibility and availability barriers. Health Serv Res. 2007;42(3):1042-1060.
8. Mooney C, Zwanziger J, Phibbs CS, Schmitt S. Is travel distance a barrier to veterans’ use of VA hospitals for medical surgical care? Soc Sci Med. 2000;50(12):1743-1755.
9. Friedman SA, Frayne SM, Berg E, et al. Travel time and attrition from VHA care among women veterans: how far is too far? Med Care. 2015;53(4)(suppl 1):S15-S22.
10. Buzza C, Ono SS, Turvey C, et al. Distance is relative: unpacking a principal barrier in rural healthcare. J Gen Intern Med. 2011;26(suppl 2):648-654.
11. Goins RT, Williams KA, Carter MW, Spencer SM, Solovieva T. Perceived barriers to health care access among rural older adults: a qualitative study. J Rural Health. 2005;21(3):206-213.
12. Kairy D, Lehoux P, Vincent C, Visintin M. A systematic review of clinical outcomes, clinical process, healthcare utilization and costs associated with telerehabilitation. Disabil Rehabil. 2009;31(6):427-447.
13. McCue M, Fairman A, Pramuka M. Enhancing quality of life through telerehabilitation. Phys Med Rehabil Clin N Am. 2010;21(1):195-205.
14. Cottrell MA, Galea OA, O’Leary SP, Hill AJ, Russell TG. Real-time telerehabilitation for the treatment of musculoskeletal conditions is effective and comparable to standard practice: a systematic review and meta-analysis. Clin Rehabil. 2017;31(5):625-638.
15. Pietrzak E, Cotea C, Pullman S, Nasveld P. Self-management and rehabilitation in osteoarthritis: is there a place for internet-based interventions? Telemed J E Health. 2013;19(10):800-805.
16. Agostini M, Moja L, Banzi R, et al. Telerehabilitation and recovery of motor function: a systematic review and meta-analysis. J Telemed Telecare. 2015;21(4):202-213.
17. Kortke H, Stromeyer H, Zittermann A, et al. New East-Westfalian Postoperative Therapy Concept: A telemedicine guide for the study of ambulatory rehabilitation of patients after cardiac surgery. Telemed J E-Health. 2006;12(4):475-483.
18. Tousignant M, Boissy P, Corriveau H, Moffet H. In home telerehabilitation for older adults after discharge from an acute hospital or rehabilitation unit: A proof-of- concept study and costs estimation. Disabil Rehabil Assist Technol. 2006;1(4):209-216.
19. Sanford JA, Griffiths PC, Richardson P, et al. The effects of in-home rehabilitation on task self-efficacy in mobility-impaired adults: a randomized clinical trial. J Am Geriatr Soc. 2006;54(11):1641-1648.
20. Nakamura K, Takano T, Akao C. The effectiveness of videophones in home healthcare for the elderly. Med Care. 1999;37(2):117-125.
21. Levy CE, Silverman E, Jia H, Geiss M, Omura D. Effects of physical therapy delivery via home video telerehabilitation on functional and health-related quality of life outcomes. J Rehabil Res Dev. 2015;52(3):361-370.
22. Guilfoyle C, Wootton R, Hassall S, et al. User satisfaction with allied health services delivered to residential facilities via videoconferencing. J Telemed Telecare. 2003;9(1):S52-S54.23. Mair F, Whitten P. Systematic review of studies of patient satisfaction with telemedicine. BMJ. 2000;320(7248):1517-1520.
24. Williams T L, May C R, Esmail A. Limitations of patient satisfaction studies in telehealthcare: a systematic review of the literature. Telemed J E-Health. 2001;7(4):293-316.
25. US Department of Veterans Affairs, Office of Telehealth Services. http://vaww.telehealth.va.gov/quality/data/index.asp. Accessed June 1, 2018. [Nonpublic document; source not verified.]
26. Jia H, Cowper D, Tang Y, et al. Post-acute stroke rehabilitation utilization: Are there difference between rural-urban patients and taxonomies? J Rural Health. 2012;28(3):242-247.
27. Cho S, Mathiassen L, Gallivan M. Crossing the chasm: from adoption to diffusion of a telehealth innovation. In: León G, Bernardos AM, Casar JR, Kautz K, De Gross JI, eds. Open IT-Based Innovation: Moving Towards Cooperative IT Transfer and Knowledge Diffusion. Boston, MA: Springer; 2008.
28. Broderick A, Lindeman D. Scaling telehealth programs: lessons from early adopters. https://www.commonwealthfund.org/publications/case-study/2013/jan/scaling-telehealth-programs-lessons-early-adopters. Published January 2013. Accessed June 1, 2018.
Evaluation of the American Academy of Orthopaedic Surgeons Appropriate Use Criteria for the Nonarthroplasty Treatment of Knee Osteoarthritis in Veterans
Knee osteoarthritis (OA) affects almost 9.3 million adults in the US and accounts for $27 billion in annual health care expenses.1,2 Due to the increasing cost of health care and an aging population, there has been renewed interest in establishing criteria for nonarthroplasty treatment of knee OA.
In 2013, using the RAND/UCLA Appropriateness method, the American Academy of Orthopaedic Surgeons (AAOS) developed an appropriate use criteria (AUC) for nonarthroplasty management of primary OA of the knee, based on orthopaedic literature and expert opinion.3 Interventions such as activity modification, weight loss, prescribed physical therapy, nonsteroidal anti-inflammatory drugs, tramadol, prescribed oral or transcutaneous opioids, acetaminophen, intra-articular corticosteroids, hinged or unloading knee braces, arthroscopic partial menisectomy or loose body removal, and realignment osteotomy were assessed. An algorithm was developed for 576 patients scenarios that incorporated patient-specific, prognostic/predictor variables to assign designations of “appropriate,” “may be appropriate,” or “rarely appropriate,” to treatment interventions.4,5 An online version of the algorithm (orthoguidelines.org) is available for physicians and surgeons to judge appropriateness of nonarthroplasty treatments; however, it is not intended to mandate candidacy for treatment or intervention.
Clinical evaluation of the AAOS AUC is necessary to determine how treatment recommendations correlate with current practice. A recent examination of the AAOS Appropriateness System for Surgical Management of Knee OA found that prognostic/predictor variables, such as patient age, OA severity, and pattern of knee OA involvement were more heavily weighted when determining arthroplasty appropriateness than was pain severity or functional loss.6 Furthermore, non-AAOS AUC prognostic/predictor variables, such as race and gender, have been linked to disparities in utilization of knee OA interventions.7-9 Such disparities can be costly not just from a patient perceptive, but also employer and societal perspectives.10
The Department of Veterans Affairs (VA) health care system represents a model of equal-access-to care system in the US that is ideal for examination of issues about health care utilization and any disparities within the AAOS AUC model and has previously been used to assess utilization of total knee arthroplasty.9 The aim of this study was to characterize utilization of the AAOS AUC for nonarthroplasty treatment of knee OA in a VA patient population. We asked the following questions: (1) What variables are predictive of receiving a greater number of AAOS AUC evaluated nonarthroplasty treatments? (2) What variables are predictive of receiving “rarely appropriate” AAOS AUC evaluated nonarthroplasty treatment? (3) What factors are predictive of duration of nonarthroplasty care until total knee arthroplasty (TKA)?
Methods
The institutional review board at the Louis Stokes Cleveland VA Medical Center in Ohio approved a retrospective chart review of nonarthroplasty treatments utilized by patients presenting to its orthopaedic section who subsequently underwent knee arthroplasty between 2013 and 2016. Eligibility criteria included patients aged ≥ 30 years with a diagnosis of unilateral or bilateral primary knee OA. Patients with posttraumatic OA, inflammatory arthritis, and a history of infectious arthritis or Charcot arthropathy of the knee were excluded. Patients with a body mass index (BMI) > 40 or a hemoglobin A1c > 8.0 at presentation were excluded as nonarthroplasty care was the recommended course of treatment above these thresholds.
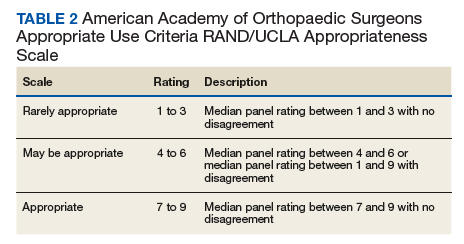
Data collected included race, gender, duration of nonarthroplasty treatment, BMI, and Kellgren-Lawrence classification of knee OA at time of presentation for symptomatic knee OA.11 All AAOS AUC-evaluated nonarthroplasty treatments utilized prior to arthroplasty intervention also were recorded (Table 1). 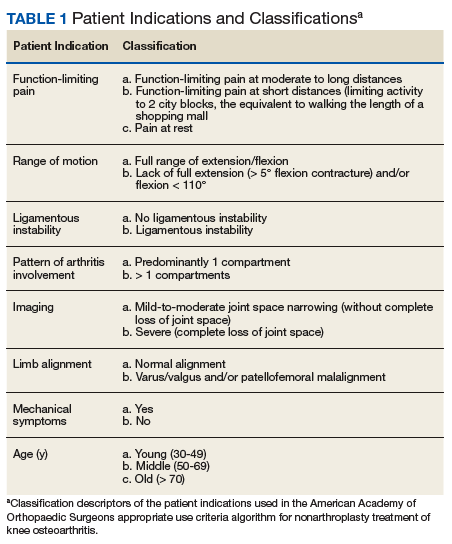
Statistical Analysis
Statistical analysis was completed with GraphPad Software Prism 7.0a (La Jolla, CA) and Mathworks MatLab R2016b software (Natick, MA). Univariate analysis with Student t tests with Welch corrections in the setting of unequal variance, Mann-Whitney nonparametric tests, and Fisher exact test were generated in the appropriate setting. Multivariable analyses also were conducted. For continuous outcomes, stepwise multiple linear regression was used to generate predictive models; for binary outcomes, binomial logistic regression was used.
Factors analyzed in regression modeling for the total number of AAOS AUC evaluated nonarthroplasty treatments utilized and the likelihood of receiving a rarely appropriate treatment included gender, race, function-limiting pain, range of motion (ROM), ligamentous instability, arthritis pattern, limb alignment, mechanical symptoms, BMI, age, and Kellgren-Lawrence grade. Factors analyzed in timing of TKA included the above variables plus the total number of AUC interventions, whether the patient received an inappropriate intervention, and average appropriateness of the interventions received. Residual analysis with Cook’s distance was used to identify outliers in regression. Observations with Cook’s distance > 3 times the mean Cook’s distance were identified as potential outliers, and models were adjusted accordingly. All statistical analyses were 2-tailed. Statistical significance was set to P ≤ .05 for all outputs.
Results
In the study, 97.8% of participants identified as male, and the mean age was 62.8 years (Table 3). 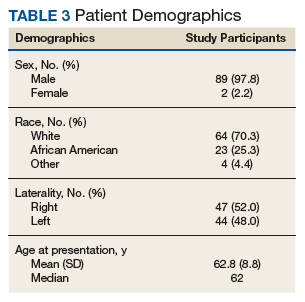
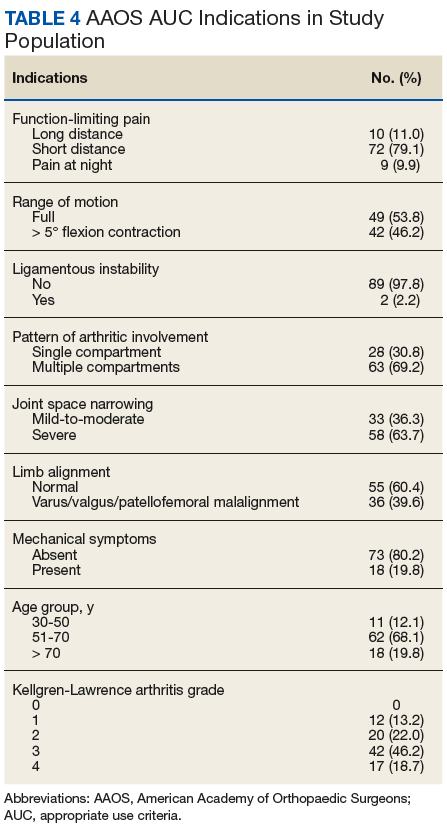
Appropriate Use Criteria Interventions
Patients received a mean of 5.2 AAOS AUC evaluated interventions before undergoing arthroplasty management at a mean of 32.3 months (range 2-181 months) from initial presentation. The majority of these interventions were classified as either appropriate or may be appropriate, according to the AUC definitions (95.1%). Self-management and physical therapy programs were widely utilized (100% and 90.1%, respectively), with all use of these interventions classified as appropriate.
Hinged or unloader knee braces were utilized in about half the study patients; this intervention was classified as rarely appropriate in 4.4% of these patients. Medical therapy was also widely used, with all use of NSAIDs, acetaminophen, and tramadol classified as appropriate or may be appropriate. Oral or transcutaneous opioid medications were prescribed in 14.3% of patients, with 92.3% of this use classified as rarely appropriate. Although the opioid medication prescribing provider was not specifically evaluated, there were no instances in which the orthopaedic service provided an oral or transcutaneous opioid prescriptions. Procedural interventions, with the exception of corticosteroid injections, were uncommon; no patient received realignment osteotomy, and only 12.1% of patients underwent arthroscopy. The use of arthroscopy was deemed rarely appropriate in 72.7% of these cases.
Factors Associated With AAOS AUC Intervention Use
There was no difference in the number of AAOS AUC evaluated interventions received based on BMI (mean [SD] BMI < 35, 5.2 [1.0] vs BMI ≥ 35, 5.3 [1.1], P = .49), age (mean [SD] aged < 60 years, 5.4 [1.0] vs aged ≥ 60 years, 5.1 [1.2], P = .23), or Kellgren-Lawrence arthritic grade (mean [SD] grade ≤ 2, 5.5 [1.0] vs grade > 2, 5.1 [1.1], P = .06). These variables also were not associated with receiving a rarely appropriate intervention (mean [SD] BMI < 35, 0.27 [0.5] vs BMI > 35, 0.2 [0.4], P = .81; aged > 60 years, 0.3 [0.5] vs aged < 60 years, 0.2 [0.4], P = .26; Kellgren-Lawrence grade < 2, 0.4 [0.6] vs grade > 2, 0.2 [0.4], P = .1).
Regression modeling to predict total number of AAOS AUC evaluated interventions received produced a significant model (R2 = 0.111, P = .006). The presence of ligamentous instability (β coefficient, -1.61) and the absence of mechanical symptoms (β coefficient, -0.67) were negative predictors of number of AUC interventions received. Variance inflation factors were 1.014 and 1.012, respectively. Likewise, regression modeling to identify factors predictive of receiving a rarely appropriate intervention also produced a significant model (pseudo R2= 0.06, P = .025), with lower Kellgren-Lawrence grade the only significant predictor of receiving a rarely appropriate intervention (odds ratio [OR] 0.54; 95% CI, 0.42 -0.72, per unit increase).
Timing from presentation to arthroplasty intervention was also evaluated. Age was a negative predictor (β coefficient -1.61), while positive predictors were reduced ROM (β coefficient 15.72) and having more AUC interventions (β coefficient 7.31) (model R2= 0.29, P = < .001). Age was the most significant predictor. Variance inflations factors were 1.02, 1.01, and 1.03, respectively. Receiving a rarely appropriate intervention was not associated with TKA timing.
Discussion
This single-center retrospective study examined the utilization of AAOS AUC-evaluated nonarthroplasty interventions for symptomatic knee OA prior to TKA. The aims of this study were to validate the AAOS AUC in a clinical setting and identify predictors of AAOS AUC utilization. In particular, this study focused on the number of interventions utilized prior to knee arthroplasty, whether interventions receiving a designation of rarely appropriate were used, and the duration of nonarthroplasty treatment.
Patients with knee instability used fewer total AAOS AUC evaluated interventions prior to TKA. Subjective instability has been reported as high as 27% in patients with OA and has been associated with fear of falling, poor balance confidence, activity limitations, and lower Western Ontario and McMaster Universities Osteoarthritis Index (WOMAC) physical function scores.12 However, it has not been found to correlate with knee laxity.13 Nevertheless, significant functional impairment with the risk of falling may reduce the number of nonarthroplasty interventions attempted. On the other hand, the presence of mechanical symptoms resulted in greater utilization of nonarthroplasty interventions. This is likely due to the greater utilization of arthroscopic partial menisectomy or loose body removal in this group of patients. Despite its inclusion as an AAOS AUC evaluated intervention, arthroscopy remains a contentious treatment for symptomatic knee pain in the setting of OA.14,15
For every unit decrease in Kellgren-Lawrence OA grade, patients were 54% more likely to receive a rarely appropriate intervention prior to knee arthroplasty. This is supported by the recent literature examining the AAOS AUC for surgical management of knee OA. Riddle and colleagues developed a classification tree to determine the contributions of various prognostic variables in final classifications of the 864 clinical vignettes used to develop the appropriateness algorithm and found that OA severity was strongly favored, with only 4 of the 432 vignettes with severe knee OA judged as rarely appropriate for surgical intervention.6
Our findings, too, may be explained by an AAOS AUC system that too heavily weighs radiographic severity of knee OA, resulting in more frequent rarely appropriate interventions in patients with less severe arthritis, including nonarthroplasty treatments. It is likely that rarely appropriate interventions were attempted in this subset of our study cohort based on patient’s subjective symptoms and functional status, both of which have been shown to be discordant with radiographic severity of knee OA.16
Oral or transcutaneous prescribed opioid medications were the most frequent intervention that received a rarely appropriate designation. Patients with preoperative opioid use undergoing TKA have been shown to have a greater risk for postoperative complications and longer hospital stay, particularly those patients aged < 75 years. Younger age, use of more interventions, and decreased knee ROM at presentation were predictive of longer duration of nonarthroplasty treatment. The use of more AAOS AUC evaluated interventions in these patients suggests that the AAOS AUC model may effectively be used to manage symptomatic OA, increasing the time from presentation to knee arthroplasty.
Interestingly, the use of rarely appropriate interventions did not affect TKA timing, as would be expected in a clinically effective nonarthroplasty treatment model. The reasons for rarely appropriate nonsurgical interventions are complex and require further investigation. One possible explanation is that decreased ROM was a marker for mechanical symptoms that necessitated additional intervention in the form of knee arthroscopy, delaying time to TKA.
Limitations
There are several limitations of this study. First, the small sample size (N = 90) requires acknowledgment; however, this limitation reflects the difficulty in following patients for years prior to an operative intervention. Second, the study population consists of veterans using the VA system and may not be reflective of the general population, differing with respect to gender, racial, and socioeconomic factors. Nevertheless, studies examining TKA utilization found, aside from racial and ethnic variability, patient gender and age do not affect arthroplasty utilization rate in the VA system.17
Additional limitations stem from the retrospective nature of this study. While the Computerized Patient Record System and centralized care of the VA system allows for review of all physical therapy consultations, orthotic consultations, and medications within the VA system, any treatments and intervention delivered by non-VA providers were not captured. Furthermore, the ability to assess for confounding variables limiting the prescription of certain medications, such as chronic kidney disease with NSAIDs or liver disease with acetaminophen, was limited by our study design.
Although our study suffers from selection bias with respect to examination of nonarthroplasty treatment in patients who have ultimately undergone TKA, we feel that this subset of patients with symptomatic knee OA represents the majority of patients evaluated for knee OA by orthopaedic surgeons in the clinic setting. It should be noted that although realignment osteotomies were sometimes indicated as appropriate by AAOS AUC model in our study population, this intervention was never performed due to patient and surgeon preference. Additionally, although it is not an AAOS AUC evaluated intervention, viscosupplementation was sporadically used during the study period; however, it is now off formulary at the investigation institution.
Conclusion
Our study suggests that patients without knee instability use more nonarthroplasty treatments over a longer period before TKA, and those patients with less severe knee OA are at risk of receiving an intervention judged to be rarely appropriate by the AAOS AUC. Such interventions do not affect timing of TKA. Nonarthroplasty care should be individualized to patients’ needs, and the decision to proceed with arthroplasty should be considered only after exhausting appropriate conservative measures. We recommend that providers use the AAOS AUC, especially when treating younger patients with less severe knee OA, particularly if considering opiate therapy or knee arthroscopy.
Acknowledgments
The authors would like to acknowledge Patrick Getty, MD, for his surgical care of some of the study patients. This material is the result of work supported with resources and the use of facilities at the Louis Stokes Cleveland VA Medical Center in Ohio.
1. Cross M, Smith E, Hoy D, et al. The global burden of hip and knee osteoarthritis: estimates from the Global Burden of Disease 2010 study. Ann Rheum Dis. 2014;73(7):1323-1330.
2. Losina E, Walensky RP, Kessler CL, et al. Cost-effectiveness of total knee arthroplasty in the United States: patient risk and hospital volume. Arch Intern Med. 2009;169(12):1113-1121; discussion 1121-1122.
3. Members of the Writing, Review, and Voting Panels of the AUC on the Non-Arthroplasty Treatment of Osteoarthritis of the Knee, Sanders JO, Heggeness MH, Murray J, Pezold R, Donnelly P. The American Academy of Orthopaedic Surgeons Appropriate Use Criteria on the Non-Arthroplasty Treatment of Osteoarthritis of the Knee. J Bone Joint Surg Am. 2014;96(14):1220-1221.
4. Sanders JO, Murray J, Gross L. Non-arthroplasty treatment of osteoarthritis of the knee. J Am Acad Orthop Surg. 2014;22(4):256-260.
5. Yates AJ Jr, McGrory BJ, Starz TW, Vincent KR, McCardel B, Golightly YM. AAOS appropriate use criteria: optimizing the non-arthroplasty management of osteoarthritis of the knee. J Am Acad Orthop Surg. 2014;22(4):261-267.
6. Riddle DL, Perera RA. Appropriateness and total knee arthroplasty: an examination of the American Academy of Orthopaedic Surgeons appropriateness rating system. Osteoarthritis Cartilage. 2017;25(12):1994-1998.
7. Morgan RC Jr, Slover J. Breakout session: ethnic and racial disparities in joint arthroplasty. Clin Orthop Relat Res. 2011;469(7):1886-1890.
8. O’Connor MI, Hooten EG. Breakout session: gender disparities in knee osteoarthritis and TKA. Clin Orthop Relat Res. 2011;469(7):1883-1885.
9. Ibrahim SA. Racial and ethnic disparities in hip and knee joint replacement: a review of research in the Veterans Affairs Health Care System. J Am Acad Orthop Surg. 2007;15(suppl 1):S87-S94.
10. Karmarkar TD, Maurer A, Parks ML, et al. A fresh perspective on a familiar problem: examining disparities in knee osteoarthritis using a Markov model. Med Care. 2017;55(12):993-1000.
11. Kohn MD, Sassoon AA, Fernando ND. Classifications in brief: Kellgren-Lawrence Classification of Osteoarthritis. Clin Orthop Relat Res. 2016;474(8):1886-1893.
12. Nguyen U, Felson DT, Niu J, et al. The impact of knee instability with and without buckling on balance confidence, fear of falling and physical function: the Multicenter Osteoarthritis Study. Osteoarthritis Cartilage. 2014;22(4):527-534.
13. Schmitt LC, Fitzgerald GK, Reisman AS, Rudolph KS. Instability, laxity, and physical function in patients with medial knee osteoarthritis. Phys Ther. 2008;88(12):1506-1516.
14. Laupattarakasem W, Laopaiboon M, Laupattarakasem P, Sumananont C. Arthroscopic debridement for knee osteoarthritis. Cochrane Database Syst Rev. 2008;(1):CD005118.
15. Lamplot JD, Brophy RH. The role for arthroscopic partial meniscectomy in knees with degenerative changes: a systematic review. Bone Joint J. 2016;98-B(7):934-938.
16. Whittle R, Jordan KP, Thomas E, Peat G. Average symptom trajectories following incident radiographic knee osteoarthritis: data from the Osteoarthritis Initiative. RMD Open. 2016;2(2):e000281.
17. Jones A, Kwoh CK, Kelley ME, Ibrahim SA. Racial disparity in knee arthroplasty utilization in the Veterans Health Administration. Arthritis Rheum. 2005;53(6):979-981.
Knee osteoarthritis (OA) affects almost 9.3 million adults in the US and accounts for $27 billion in annual health care expenses.1,2 Due to the increasing cost of health care and an aging population, there has been renewed interest in establishing criteria for nonarthroplasty treatment of knee OA.
In 2013, using the RAND/UCLA Appropriateness method, the American Academy of Orthopaedic Surgeons (AAOS) developed an appropriate use criteria (AUC) for nonarthroplasty management of primary OA of the knee, based on orthopaedic literature and expert opinion.3 Interventions such as activity modification, weight loss, prescribed physical therapy, nonsteroidal anti-inflammatory drugs, tramadol, prescribed oral or transcutaneous opioids, acetaminophen, intra-articular corticosteroids, hinged or unloading knee braces, arthroscopic partial menisectomy or loose body removal, and realignment osteotomy were assessed. An algorithm was developed for 576 patients scenarios that incorporated patient-specific, prognostic/predictor variables to assign designations of “appropriate,” “may be appropriate,” or “rarely appropriate,” to treatment interventions.4,5 An online version of the algorithm (orthoguidelines.org) is available for physicians and surgeons to judge appropriateness of nonarthroplasty treatments; however, it is not intended to mandate candidacy for treatment or intervention.
Clinical evaluation of the AAOS AUC is necessary to determine how treatment recommendations correlate with current practice. A recent examination of the AAOS Appropriateness System for Surgical Management of Knee OA found that prognostic/predictor variables, such as patient age, OA severity, and pattern of knee OA involvement were more heavily weighted when determining arthroplasty appropriateness than was pain severity or functional loss.6 Furthermore, non-AAOS AUC prognostic/predictor variables, such as race and gender, have been linked to disparities in utilization of knee OA interventions.7-9 Such disparities can be costly not just from a patient perceptive, but also employer and societal perspectives.10
The Department of Veterans Affairs (VA) health care system represents a model of equal-access-to care system in the US that is ideal for examination of issues about health care utilization and any disparities within the AAOS AUC model and has previously been used to assess utilization of total knee arthroplasty.9 The aim of this study was to characterize utilization of the AAOS AUC for nonarthroplasty treatment of knee OA in a VA patient population. We asked the following questions: (1) What variables are predictive of receiving a greater number of AAOS AUC evaluated nonarthroplasty treatments? (2) What variables are predictive of receiving “rarely appropriate” AAOS AUC evaluated nonarthroplasty treatment? (3) What factors are predictive of duration of nonarthroplasty care until total knee arthroplasty (TKA)?
Methods
The institutional review board at the Louis Stokes Cleveland VA Medical Center in Ohio approved a retrospective chart review of nonarthroplasty treatments utilized by patients presenting to its orthopaedic section who subsequently underwent knee arthroplasty between 2013 and 2016. Eligibility criteria included patients aged ≥ 30 years with a diagnosis of unilateral or bilateral primary knee OA. Patients with posttraumatic OA, inflammatory arthritis, and a history of infectious arthritis or Charcot arthropathy of the knee were excluded. Patients with a body mass index (BMI) > 40 or a hemoglobin A1c > 8.0 at presentation were excluded as nonarthroplasty care was the recommended course of treatment above these thresholds.
Data collected included race, gender, duration of nonarthroplasty treatment, BMI, and Kellgren-Lawrence classification of knee OA at time of presentation for symptomatic knee OA.11 All AAOS AUC-evaluated nonarthroplasty treatments utilized prior to arthroplasty intervention also were recorded (Table 1).
Statistical Analysis
Statistical analysis was completed with GraphPad Software Prism 7.0a (La Jolla, CA) and Mathworks MatLab R2016b software (Natick, MA). Univariate analysis with Student t tests with Welch corrections in the setting of unequal variance, Mann-Whitney nonparametric tests, and Fisher exact test were generated in the appropriate setting. Multivariable analyses also were conducted. For continuous outcomes, stepwise multiple linear regression was used to generate predictive models; for binary outcomes, binomial logistic regression was used.
Factors analyzed in regression modeling for the total number of AAOS AUC evaluated nonarthroplasty treatments utilized and the likelihood of receiving a rarely appropriate treatment included gender, race, function-limiting pain, range of motion (ROM), ligamentous instability, arthritis pattern, limb alignment, mechanical symptoms, BMI, age, and Kellgren-Lawrence grade. Factors analyzed in timing of TKA included the above variables plus the total number of AUC interventions, whether the patient received an inappropriate intervention, and average appropriateness of the interventions received. Residual analysis with Cook’s distance was used to identify outliers in regression. Observations with Cook’s distance > 3 times the mean Cook’s distance were identified as potential outliers, and models were adjusted accordingly. All statistical analyses were 2-tailed. Statistical significance was set to P ≤ .05 for all outputs.
Results
In the study, 97.8% of participants identified as male, and the mean age was 62.8 years (Table 3).
Appropriate Use Criteria Interventions
Patients received a mean of 5.2 AAOS AUC evaluated interventions before undergoing arthroplasty management at a mean of 32.3 months (range 2-181 months) from initial presentation. The majority of these interventions were classified as either appropriate or may be appropriate, according to the AUC definitions (95.1%). Self-management and physical therapy programs were widely utilized (100% and 90.1%, respectively), with all use of these interventions classified as appropriate.
Hinged or unloader knee braces were utilized in about half the study patients; this intervention was classified as rarely appropriate in 4.4% of these patients. Medical therapy was also widely used, with all use of NSAIDs, acetaminophen, and tramadol classified as appropriate or may be appropriate. Oral or transcutaneous opioid medications were prescribed in 14.3% of patients, with 92.3% of this use classified as rarely appropriate. Although the opioid medication prescribing provider was not specifically evaluated, there were no instances in which the orthopaedic service provided an oral or transcutaneous opioid prescriptions. Procedural interventions, with the exception of corticosteroid injections, were uncommon; no patient received realignment osteotomy, and only 12.1% of patients underwent arthroscopy. The use of arthroscopy was deemed rarely appropriate in 72.7% of these cases.
Factors Associated With AAOS AUC Intervention Use
There was no difference in the number of AAOS AUC evaluated interventions received based on BMI (mean [SD] BMI < 35, 5.2 [1.0] vs BMI ≥ 35, 5.3 [1.1], P = .49), age (mean [SD] aged < 60 years, 5.4 [1.0] vs aged ≥ 60 years, 5.1 [1.2], P = .23), or Kellgren-Lawrence arthritic grade (mean [SD] grade ≤ 2, 5.5 [1.0] vs grade > 2, 5.1 [1.1], P = .06). These variables also were not associated with receiving a rarely appropriate intervention (mean [SD] BMI < 35, 0.27 [0.5] vs BMI > 35, 0.2 [0.4], P = .81; aged > 60 years, 0.3 [0.5] vs aged < 60 years, 0.2 [0.4], P = .26; Kellgren-Lawrence grade < 2, 0.4 [0.6] vs grade > 2, 0.2 [0.4], P = .1).
Regression modeling to predict total number of AAOS AUC evaluated interventions received produced a significant model (R2 = 0.111, P = .006). The presence of ligamentous instability (β coefficient, -1.61) and the absence of mechanical symptoms (β coefficient, -0.67) were negative predictors of number of AUC interventions received. Variance inflation factors were 1.014 and 1.012, respectively. Likewise, regression modeling to identify factors predictive of receiving a rarely appropriate intervention also produced a significant model (pseudo R2= 0.06, P = .025), with lower Kellgren-Lawrence grade the only significant predictor of receiving a rarely appropriate intervention (odds ratio [OR] 0.54; 95% CI, 0.42 -0.72, per unit increase).
Timing from presentation to arthroplasty intervention was also evaluated. Age was a negative predictor (β coefficient -1.61), while positive predictors were reduced ROM (β coefficient 15.72) and having more AUC interventions (β coefficient 7.31) (model R2= 0.29, P = < .001). Age was the most significant predictor. Variance inflations factors were 1.02, 1.01, and 1.03, respectively. Receiving a rarely appropriate intervention was not associated with TKA timing.
Discussion
This single-center retrospective study examined the utilization of AAOS AUC-evaluated nonarthroplasty interventions for symptomatic knee OA prior to TKA. The aims of this study were to validate the AAOS AUC in a clinical setting and identify predictors of AAOS AUC utilization. In particular, this study focused on the number of interventions utilized prior to knee arthroplasty, whether interventions receiving a designation of rarely appropriate were used, and the duration of nonarthroplasty treatment.
Patients with knee instability used fewer total AAOS AUC evaluated interventions prior to TKA. Subjective instability has been reported as high as 27% in patients with OA and has been associated with fear of falling, poor balance confidence, activity limitations, and lower Western Ontario and McMaster Universities Osteoarthritis Index (WOMAC) physical function scores.12 However, it has not been found to correlate with knee laxity.13 Nevertheless, significant functional impairment with the risk of falling may reduce the number of nonarthroplasty interventions attempted. On the other hand, the presence of mechanical symptoms resulted in greater utilization of nonarthroplasty interventions. This is likely due to the greater utilization of arthroscopic partial menisectomy or loose body removal in this group of patients. Despite its inclusion as an AAOS AUC evaluated intervention, arthroscopy remains a contentious treatment for symptomatic knee pain in the setting of OA.14,15
For every unit decrease in Kellgren-Lawrence OA grade, patients were 54% more likely to receive a rarely appropriate intervention prior to knee arthroplasty. This is supported by the recent literature examining the AAOS AUC for surgical management of knee OA. Riddle and colleagues developed a classification tree to determine the contributions of various prognostic variables in final classifications of the 864 clinical vignettes used to develop the appropriateness algorithm and found that OA severity was strongly favored, with only 4 of the 432 vignettes with severe knee OA judged as rarely appropriate for surgical intervention.6
Our findings, too, may be explained by an AAOS AUC system that too heavily weighs radiographic severity of knee OA, resulting in more frequent rarely appropriate interventions in patients with less severe arthritis, including nonarthroplasty treatments. It is likely that rarely appropriate interventions were attempted in this subset of our study cohort based on patient’s subjective symptoms and functional status, both of which have been shown to be discordant with radiographic severity of knee OA.16
Oral or transcutaneous prescribed opioid medications were the most frequent intervention that received a rarely appropriate designation. Patients with preoperative opioid use undergoing TKA have been shown to have a greater risk for postoperative complications and longer hospital stay, particularly those patients aged < 75 years. Younger age, use of more interventions, and decreased knee ROM at presentation were predictive of longer duration of nonarthroplasty treatment. The use of more AAOS AUC evaluated interventions in these patients suggests that the AAOS AUC model may effectively be used to manage symptomatic OA, increasing the time from presentation to knee arthroplasty.
Interestingly, the use of rarely appropriate interventions did not affect TKA timing, as would be expected in a clinically effective nonarthroplasty treatment model. The reasons for rarely appropriate nonsurgical interventions are complex and require further investigation. One possible explanation is that decreased ROM was a marker for mechanical symptoms that necessitated additional intervention in the form of knee arthroscopy, delaying time to TKA.
Limitations
There are several limitations of this study. First, the small sample size (N = 90) requires acknowledgment; however, this limitation reflects the difficulty in following patients for years prior to an operative intervention. Second, the study population consists of veterans using the VA system and may not be reflective of the general population, differing with respect to gender, racial, and socioeconomic factors. Nevertheless, studies examining TKA utilization found, aside from racial and ethnic variability, patient gender and age do not affect arthroplasty utilization rate in the VA system.17
Additional limitations stem from the retrospective nature of this study. While the Computerized Patient Record System and centralized care of the VA system allows for review of all physical therapy consultations, orthotic consultations, and medications within the VA system, any treatments and intervention delivered by non-VA providers were not captured. Furthermore, the ability to assess for confounding variables limiting the prescription of certain medications, such as chronic kidney disease with NSAIDs or liver disease with acetaminophen, was limited by our study design.
Although our study suffers from selection bias with respect to examination of nonarthroplasty treatment in patients who have ultimately undergone TKA, we feel that this subset of patients with symptomatic knee OA represents the majority of patients evaluated for knee OA by orthopaedic surgeons in the clinic setting. It should be noted that although realignment osteotomies were sometimes indicated as appropriate by AAOS AUC model in our study population, this intervention was never performed due to patient and surgeon preference. Additionally, although it is not an AAOS AUC evaluated intervention, viscosupplementation was sporadically used during the study period; however, it is now off formulary at the investigation institution.
Conclusion
Our study suggests that patients without knee instability use more nonarthroplasty treatments over a longer period before TKA, and those patients with less severe knee OA are at risk of receiving an intervention judged to be rarely appropriate by the AAOS AUC. Such interventions do not affect timing of TKA. Nonarthroplasty care should be individualized to patients’ needs, and the decision to proceed with arthroplasty should be considered only after exhausting appropriate conservative measures. We recommend that providers use the AAOS AUC, especially when treating younger patients with less severe knee OA, particularly if considering opiate therapy or knee arthroscopy.
Acknowledgments
The authors would like to acknowledge Patrick Getty, MD, for his surgical care of some of the study patients. This material is the result of work supported with resources and the use of facilities at the Louis Stokes Cleveland VA Medical Center in Ohio.
1. Cross M, Smith E, Hoy D, et al. The global burden of hip and knee osteoarthritis: estimates from the Global Burden of Disease 2010 study. Ann Rheum Dis. 2014;73(7):1323-1330.
2. Losina E, Walensky RP, Kessler CL, et al. Cost-effectiveness of total knee arthroplasty in the United States: patient risk and hospital volume. Arch Intern Med. 2009;169(12):1113-1121; discussion 1121-1122.
3. Members of the Writing, Review, and Voting Panels of the AUC on the Non-Arthroplasty Treatment of Osteoarthritis of the Knee, Sanders JO, Heggeness MH, Murray J, Pezold R, Donnelly P. The American Academy of Orthopaedic Surgeons Appropriate Use Criteria on the Non-Arthroplasty Treatment of Osteoarthritis of the Knee. J Bone Joint Surg Am. 2014;96(14):1220-1221.
4. Sanders JO, Murray J, Gross L. Non-arthroplasty treatment of osteoarthritis of the knee. J Am Acad Orthop Surg. 2014;22(4):256-260.
5. Yates AJ Jr, McGrory BJ, Starz TW, Vincent KR, McCardel B, Golightly YM. AAOS appropriate use criteria: optimizing the non-arthroplasty management of osteoarthritis of the knee. J Am Acad Orthop Surg. 2014;22(4):261-267.
6. Riddle DL, Perera RA. Appropriateness and total knee arthroplasty: an examination of the American Academy of Orthopaedic Surgeons appropriateness rating system. Osteoarthritis Cartilage. 2017;25(12):1994-1998.
7. Morgan RC Jr, Slover J. Breakout session: ethnic and racial disparities in joint arthroplasty. Clin Orthop Relat Res. 2011;469(7):1886-1890.
8. O’Connor MI, Hooten EG. Breakout session: gender disparities in knee osteoarthritis and TKA. Clin Orthop Relat Res. 2011;469(7):1883-1885.
9. Ibrahim SA. Racial and ethnic disparities in hip and knee joint replacement: a review of research in the Veterans Affairs Health Care System. J Am Acad Orthop Surg. 2007;15(suppl 1):S87-S94.
10. Karmarkar TD, Maurer A, Parks ML, et al. A fresh perspective on a familiar problem: examining disparities in knee osteoarthritis using a Markov model. Med Care. 2017;55(12):993-1000.
11. Kohn MD, Sassoon AA, Fernando ND. Classifications in brief: Kellgren-Lawrence Classification of Osteoarthritis. Clin Orthop Relat Res. 2016;474(8):1886-1893.
12. Nguyen U, Felson DT, Niu J, et al. The impact of knee instability with and without buckling on balance confidence, fear of falling and physical function: the Multicenter Osteoarthritis Study. Osteoarthritis Cartilage. 2014;22(4):527-534.
13. Schmitt LC, Fitzgerald GK, Reisman AS, Rudolph KS. Instability, laxity, and physical function in patients with medial knee osteoarthritis. Phys Ther. 2008;88(12):1506-1516.
14. Laupattarakasem W, Laopaiboon M, Laupattarakasem P, Sumananont C. Arthroscopic debridement for knee osteoarthritis. Cochrane Database Syst Rev. 2008;(1):CD005118.
15. Lamplot JD, Brophy RH. The role for arthroscopic partial meniscectomy in knees with degenerative changes: a systematic review. Bone Joint J. 2016;98-B(7):934-938.
16. Whittle R, Jordan KP, Thomas E, Peat G. Average symptom trajectories following incident radiographic knee osteoarthritis: data from the Osteoarthritis Initiative. RMD Open. 2016;2(2):e000281.
17. Jones A, Kwoh CK, Kelley ME, Ibrahim SA. Racial disparity in knee arthroplasty utilization in the Veterans Health Administration. Arthritis Rheum. 2005;53(6):979-981.
Today’s Care Must Extend Beyond the Exam Room
In May 2014, a 70-year-old retiree underwent repair of a fracture of her left ankle. The procedure was performed at a local hospital. A splint was applied to the ankle, and a nurse provided crutches.
Following discharge from the hospital, the patient hailed a taxi to take her home. As she was exiting the taxi at her residence, the patient fell and sustained comminuted fractures to the distal radius and distal ulna of her right (dominant) wrist and a trimalleolar fracture to her repaired left ankle.
The plaintiff was transported back to the hospital via ambulance. She underwent closed reduction of her wrist fractures and 11 days later was transferred to another facility for open reduction and internal fixation of her left ankle fracture. Her hospitalizations totaled 13 days and were followed by a course of inpatient rehabilitative therapy; the latter lasted until late August 2014, with a brief interruption in June when she underwent open reduction and internal fixation of her wrist fractures. When she returned home in August, the patient required the assistance of visiting aides and 3 additional months of rehabilitative therapy.
At trial, the plaintiff claimed that her left ankle and her right wrist remained painful, that she sustained a mild residual diminution of each area’s range of motion, and that these residual effects hindered her performance of basic physical activities (eg, cleaning and cooking).
The plaintiff alleged that her fall while exiting the taxi resulted from unsteadiness, which was a lingering effect of morphine that was administered during the repair of her fracture. She sought recovery of damages for past and future pain and suffering from the hospital’s operator. The lawsuit alleged that the nurse had failed to provide instructions on the proper use of crutches, that the nurse had failed to undertake measures that would have diminished the plaintiff’s likelihood of falling, that the nurse’s failures constituted malpractice and negligence, and that the hospital operator was vicariously liable for the nurse’s actions.
The plaintiff claimed that she repeatedly warned that she did not believe that she could safely use the crutches provided by the nurse. She claimed that she was unsteady and lightheaded, and that when she requested a wheelchair, an escort, or an ambulance, the nurse rejected the request. The nursing standards expert for the plaintiff opined that the request should have been satisfied or alternatively, that the nurse should have explained the manner in which a crutch-dependent person could safely enter and exit a vehicle.
Defense counsel claimed that the nurse explained proper use of the crutches, the plaintiff indicated that she understood the explanation, and the plaintiff demonstrated proper use and did not express concern. The defense’s expert contended that the nurse did not have to explain how a crutch-dependent person could safely enter and exit a vehicle and that the plaintiff’s fall resulted from her own failure to exercise appropriate caution. The defense further contended that the plaintiff achieved an excellent recovery.
Continue to: After a 7-day trial...
After a 7-day trial and 3 hours and 45 minutes’ deliberation, the jury found in favor of the plaintiff. It found that the nurse was negligent in her provision of crutches and that the act was a substantial cause of the plaintiff’s injuries. The jury also found that the nurse did not properly explain the use of crutches but determined that the error was not a substantial cause of the plaintiff’s injuries.
VERDICT
The jury awarded the plaintiff a total of $850,000 in damages. The plaintiff also recovered stipulated medical expenses.
COMMENTARY
Medical malpractice litigation involves recovery for acts or omissions that constitute a departure from the standard of care. We all recognize injurious acts—improper esophageal intubation in the emergency department, transection of a nerve in the operating room, or prescription of a contraindicated medication to an allergic patient—and acknowledge damaging omissions, such as failure to screen for colon cancer or recognize treatable diabetes.
However, some cases are disposition related; they arise from how patients are discharged, what instructions they are given, where they go, and what they do after discharge. These cases involve the patient’s medical issues engrafted on his or her transportation, job, and more generally, living environment.
The lay public expects patients to have a right of self-determination, to control the nature and course of their medical care. Yet, the modern lay public also expects the medical profession to act as an authority figure—exercising a degree of paternalism to safeguard patients from harm. This expectation is commonly articulated in retrospect, after something has gone wrong. Consequently, clinicians must be aware of what will happen to the patient after discharge.
Continue to: With all interventions...
With all interventions, weigh the post-discharge consequences. If you give an injection of hydromorphone, you cannot discharge the patient to drive home 45 minutes later. If you have diagnosed vertigo in a patient, you cannot prescribe meclizine and return that patient to her job working on scaffolding 50 ft above ground. If a frail patient lives alone and cannot safely walk, and you’ve started him on furosemide, you cannot discharge him without considering how he will get to the bathroom. Other concerns are even more difficult—for example, the homeless patient who does not have the environment or resources to follow your instructions.
It is tempting to view these concerns as not our responsibility or dismiss them as “not medicine.” Clinicians can feel frustrated at being pulled into the realm of social work, where we are ill equipped to deal with and sort out the patient’s “life problems.” For one thing, we don’t often have the resources to deal with these issues. And for another, addressing the patient’s postdischarge living situation takes time—something in short supply and intangible to the other patients in the waiting room, who are expecting your attention and wondering, “What’s the holdup?”
In the case presented, the plaintiff was a 70-year-old retiree. She was discharged from the hospital with crutches. Crutches are age-old and familiar devices. Nevertheless, crutches are for people who are able to use their arms for weight bearing and propulsion and require a fair amount of physical strength, timing, and dexterity. While a potentially debatable point, an assumption that a 70-year-old patient has the arm strength and dexterity to properly propel herself with crutches may be faulty. There was disagreement between the patient, who claimed she could not safely use the crutches, and the nurse, who said the patient accepted the crutches without concern. The safest course of action would be for discharge personnel to demonstrate the use of crutches, observe the patient using the crutches, and document that in the record.
In this case, it is unclear if the nurse demonstrated how to use the crutches or witnessed the plaintiff demonstrating she could safely use them. The jury found the nurse was negligent “in her provision” of crutches—an act they deemed a substantial cause of the plaintiff’s injuries. Interestingly, the jury did not consider the lack of explanation on the crutches’ use to be a substantial cause of injury. But the bottom line is, they faulted the nurse for the act of giving this patient crutches and awarded $850,000 in damages.
Society is changing. Fifty years ago, jurors would expect people to be familiar with crutches, and if you fell while using them, that was your own fault. Modern jurors expect hospitals and providers to get more involved in what happens to a patient after discharge. The news media has heavily publicized cases of alleged “patient dumping.”
Continue to: As a result...
As a result, we see legislative changes, such as the recently passed California Senate Bill 1152, which requires that homeless patients be fed; provided weather-appropriate clothing, filled prescriptions, and vaccinations; given medical screening, examination, and evaluation that requires the “treating physician” to arrange behavioral health care; and enrolled in “any affordable health insurance coverage for which he or she is eligible.”
Whether it is appropriate to ask hospitals and clinicians to get this involved is beyond the scope of this column. What is clear is that society increasingly expects clinicians and hospitals to take responsibility for patients. This societal change has an impact on the lay public’s perception of what is expected of health care providers. Tomorrow’s juror comes to court with a belief that hospitals and clinicians owe a duty of care that extends beyond the walls of the exam room.
IN SUMMARY
Reality test your post-treatment instructions to be sure they will work for the patient and are not grossly incompatible with his or her known postdischarge environment. To the extent possible, involve discharge planning personnel in your practice. Let your record reflect that you are acting in the patient’s best interest, and evade the temptation to squint narrowly to avoid seeing circumstances in the patient’s life that prevent safe implementation of your plan.

Emicizumab performs well in surgical setting
PRAGUE – Emicizumab appears safe and effective for patients with hemophilia A undergoing surgical procedures, based on experience with a subpopulation of HAVEN 3 trial participants.

Out of 28 minor procedures performed without preventive factor VIII (FVIII), only 2 were associated with postoperative bleeds requiring treatment, reported lead author Elena Santagostino, MD, PhD, of Fondazione IRCCS Ca’ Granda Ospedale Maggiore Policlinico in Milan, and her colleagues.
All events requiring bleeding treatment were associated with dental procedures, highlighting an area where clinicians and dentists may need to exercise caution. Still, overall results supported emicizumab in a surgical setting.
“There were no thrombotic complications or other unexpected events, including inhibitor development,” Dr. Santagostino said at the annual congress of the European Association for Haemophilia and Allied Disorders.
The findings were drawn from 30 patients who underwent 50 surgeries (46 minor, 4 major) during HAVEN 3, a previously reported phase 3 trial investigating the use of emicizumab, a humanized bispecific monoclonal antibody for patients with hemophilia A without inhibitors.
The minor surgeries included dental or orthopedic procedures, esophagogastroduodenoscopy, or colonoscopy. The four major procedures were all orthopedic (knee arthroscopic synovectomy, biceps femoris tear repair, total ankle arthroplasty, and total hip replacement). The investigators analyzed surgery-related bleeds and the nature of FVIII usage.
Preventive FVIII was used in 18 procedures; infusion duration was 24 hours or less in 14 procedures, between 25 hours and 48 hours in 2 procedures, and more than 72 hours in 2 procedures. The median cumulative preventive FVIII dose per procedure was 30 IU/kg.
Of the 46 minor procedures, 28 (61%) were performed without preventive FVIII, and 2 (7.1%) were associated with bleeding requiring treatment, both after dental procedures. Two other participants who received preventive FVIII also needed postoperative bleeding treatment. Of note, these events were also after dental procedures, meaning all four instances of bleeding requiring treatment during the trial were associated with dentistry.
“[I]n this experience, dental procedures were somewhat tricky because the bleeding complications were mainly there,” Dr. Santagostino said.
When asked by an audience member if this trend was unique to mucosal bleeding, Dr. Santagostino said it was too early to draw such a conclusion but offered some insight. “To control and prevent bleeding during a dental procedure is not trivial, because … sometimes if you stop factor VIII treatment quite early, you may have late bleeding, mainly due to local reasons, because … dental procedures are very heterogenous.”
Among three other participants who had postoperative bleeding but did not require treatment, two underwent dental procedures, further supporting this association. Although the study numbers are relatively small, the findings may at least support caution, if not preventive FVIII in the dental setting, Dr. Santagostino said.
The four major procedures – all orthopedic – were knee arthroscopic synovectomy, biceps femoris tear repair, total ankle arthroplasty, and total hip replacement. Along with preoperative preventive FVIII, three of four patients undergoing major surgery received preventive FVIII for 14-18 days postoperatively. Doses ranged from 99-522 IU/kg. No postoperative bleeds occurred in this subgroup.
Study funding was provided by F. Hoffmann–La Roche and Chugai Pharmaceutical. The investigators reported financial relationships with Bayer, Shire, Pfizer, Novo Nordisk, and others.
SOURCE: Santagostino E et al. EAHAD 2019, Abstract OR15.
PRAGUE – Emicizumab appears safe and effective for patients with hemophilia A undergoing surgical procedures, based on experience with a subpopulation of HAVEN 3 trial participants.
Out of 28 minor procedures performed without preventive factor VIII (FVIII), only 2 were associated with postoperative bleeds requiring treatment, reported lead author Elena Santagostino, MD, PhD, of Fondazione IRCCS Ca’ Granda Ospedale Maggiore Policlinico in Milan, and her colleagues.
All events requiring bleeding treatment were associated with dental procedures, highlighting an area where clinicians and dentists may need to exercise caution. Still, overall results supported emicizumab in a surgical setting.
“There were no thrombotic complications or other unexpected events, including inhibitor development,” Dr. Santagostino said at the annual congress of the European Association for Haemophilia and Allied Disorders.
The findings were drawn from 30 patients who underwent 50 surgeries (46 minor, 4 major) during HAVEN 3, a previously reported phase 3 trial investigating the use of emicizumab, a humanized bispecific monoclonal antibody for patients with hemophilia A without inhibitors.
The minor surgeries included dental or orthopedic procedures, esophagogastroduodenoscopy, or colonoscopy. The four major procedures were all orthopedic (knee arthroscopic synovectomy, biceps femoris tear repair, total ankle arthroplasty, and total hip replacement). The investigators analyzed surgery-related bleeds and the nature of FVIII usage.
Preventive FVIII was used in 18 procedures; infusion duration was 24 hours or less in 14 procedures, between 25 hours and 48 hours in 2 procedures, and more than 72 hours in 2 procedures. The median cumulative preventive FVIII dose per procedure was 30 IU/kg.
Of the 46 minor procedures, 28 (61%) were performed without preventive FVIII, and 2 (7.1%) were associated with bleeding requiring treatment, both after dental procedures. Two other participants who received preventive FVIII also needed postoperative bleeding treatment. Of note, these events were also after dental procedures, meaning all four instances of bleeding requiring treatment during the trial were associated with dentistry.
“[I]n this experience, dental procedures were somewhat tricky because the bleeding complications were mainly there,” Dr. Santagostino said.
When asked by an audience member if this trend was unique to mucosal bleeding, Dr. Santagostino said it was too early to draw such a conclusion but offered some insight. “To control and prevent bleeding during a dental procedure is not trivial, because … sometimes if you stop factor VIII treatment quite early, you may have late bleeding, mainly due to local reasons, because … dental procedures are very heterogenous.”
Among three other participants who had postoperative bleeding but did not require treatment, two underwent dental procedures, further supporting this association. Although the study numbers are relatively small, the findings may at least support caution, if not preventive FVIII in the dental setting, Dr. Santagostino said.
The four major procedures – all orthopedic – were knee arthroscopic synovectomy, biceps femoris tear repair, total ankle arthroplasty, and total hip replacement. Along with preoperative preventive FVIII, three of four patients undergoing major surgery received preventive FVIII for 14-18 days postoperatively. Doses ranged from 99-522 IU/kg. No postoperative bleeds occurred in this subgroup.
Study funding was provided by F. Hoffmann–La Roche and Chugai Pharmaceutical. The investigators reported financial relationships with Bayer, Shire, Pfizer, Novo Nordisk, and others.
SOURCE: Santagostino E et al. EAHAD 2019, Abstract OR15.
REPORTING FROM EAHAD 2019
A Pain He Can’t Walk Off

ANSWER
The radiograph shows a right knee prosthesis in place with no evidence of failure or displacement. Of note, there is a hyperdense, somewhat elongated lesion along the distal third of the femur. Radiographically, this is most likely consistent with an enchondroma. Enchondromas are typically benign bone lesions that originate from cartilage. They
The patient was referred to his orthopedist for follow-up.

A 70-year-old man presents to the urgent care clinic for evaluation of right knee pain. He denies any specific injury or trauma. For the past several months, he says, he has had a “deep aching pain” that is exacerbated by walking and weight bearing.
His medical history is significant for mild hypertension and diabetes. His surgical history is significant for remote right total knee arthroplasty.
On examination, you note an elderly male in no obvious distress. His vital signs are normal. Inspection of the right knee shows a well-healed incision with no obvious effusion or erythema. He demonstrates a fairly good active range of motion. There is no evidence of ligament laxity.
You obtain a radiograph of the knee (shown). What is your impression?

TNFi use may not affect joint replacement rates for RA patients
Patients with rheumatoid arthritis using tumor necrosis factor inhibitors do not appear to have a lower rate of joint replacement when compared with patients taking conventional synthetic disease-modifying antirheumatic drugs, according to an analysis of data in the British Society for Rheumatology Biologics Register for RA.

Although there was not a general protective effect, patients with rheumatoid arthritis (RA) who were 60 years or older had a 40% reduction in total hip replacement (THR) when using tumor necrosis factor inhibitors (TNFi), according to first author Samuel Hawley from the Nuffield Department of Orthopaedics in the Rheumatology and Musculoskeletal Sciences at the University of Oxford (England) and his colleagues.
“While a reduction in THR amongst older TNFi users offers some support for biologics playing a role in reducing need for joint replacement, it must also be noted that the lack of an overall protective effect is suggestive that other factors apart from TNFi are likely to be involved in the ... downward population trends in joint replacement rates in RA,” Mr. Hawley and his colleagues wrote in their report published in the journal Rheumatology.
The researchers analyzed prospectively collected data on 11,202 RA patients from the British Society for Rheumatology Biologics Register for RA (BSRBR-RA) from 2001-2016 who were using TNFi (n = 9,558) or conventional synthetic disease-modifying antirheumatic drugs (csDMARDs; n = 1,644). Patients had a median disease duration of 11.0 years in the TNFi group and 10.8 years in the csDMARD group. TNFi and csDMARD users were matched based on their propensity to receive treatment, and researchers used a Cox regression analysis to compare the rates of total knee replacement (TKR), THR, and other joint replacement. The researchers utilized each csDMARD user a median of three times (interquartile range, one to six) in the comparisons.
The incidence rate for THR was 5.22/1,000 person-years for TNFi users and 6.30/1,000 person-years for csDMARD users, while the incidence rate for TKR was 8.89/1,000 person-years for TNFi users and 8.09/1,000 person-years for csDMARD users. Mr. Hawley and his colleagues found no association between TNFi use and THR when compared with csDMARD users (adjusted pooled hazard ratio, 0.86; 95% confidence interval, 0.60-1.22; P = .39) based on 589 THRs during follow-up. There was also no association between the incidence of TKR and TNFi use when compared with csDMARD users (adjusted pooled HR, 1.11; 95% CI, 0.84-1.47; P = .46) based on 846 TKRs during follow-up. When the researchers examined 336 other joint replacements performed during follow-up, there was also no significant difference in incidence between TNFi and csDMARD users (HR, 1.15; 95% CI, 0.75-1.77).
For patients 60 years or older, TNFi use was associated with a 40% reduction in THR incidence (HR, 0.60; 95% CI, 0.41-0.87; P = .008), but not in TKR incidence. However, younger patients using TNFi did not have a reduced incidence of THR, and there were no associations between TNFi use and incidence of TKR or other joint replacements.
“It could be that the relatively long disease duration at our baseline meant there was greater potential for prevention of joint destruction at the hip over knee, although details of differential natural history of RA disease at these two joints are not well established,” the researchers wrote. “It is also very difficult to disentangle the impact of TNFi on improved function and overall quality of life and how this may have mediated effects on longer-term progression of joint damage, potentially differentially at the knee and hip.”
The researchers said the study was limited by the potential for residual confounding by indication, and the long disease duration of patients means that the results would not be generalizable to patients with early RA. In addition, underreporting of joint replacement could create bias because the registry information is a combination of physician-reported and self-reported incidences, they added.
This study was funded by an award from the National Institute for Health Research (NIHR) and support from the Oxford NIHR Biomedical Research Unit. Four authors disclosed financial relationships with industry, including many companies marketing biologics for RA. Other authors reported no relevant conflicts of interest.
SOURCE: Hawley S et al. Rheumatology. 2019 Jan 10. doi: 10.1093/rheumatology/key424.
The arrival and widespread use of tumor necrosis factor inhibitors (TNFi) in the late 1990s has “created a perception of causality” that led many to believe that TNFi use was associated with decreased rates of joint replacement. However, the decline in total hip arthroplasties (THAs), total knee arthroplasties (TKAs), and other joint replacements is likely because of a confluence of factors, Susan M. Goodman, MD, and Anne R. Bass, MD, wrote in an editorial accompanying the report by Hawley et al. (Rheumatology. 2019 Jan 10. doi: 10.1093/rheumatology/kez022).
Although Hawley et al. attempted to mitigate confounding in their study by using a propensity score when comparing TNFi and conventional synthetic disease-modifying antirheumatic drug (csDMARD) users, there was a preference for physicians prescribing biologics at a rate of 87% versus 13%, and the biologic preference was associated with disease severity, which is “a strong driver of the need for surgery.” In addition, in patients 60 years or older for whom TNFi reduced indications for joint replacement, “[t]he differential effect of TNFi use on THA utilization in the elderly is especially curious because a previous study by the same authors demonstrated that TKA, but not THA, rates were impacted by introduction of NICE guidance in 2002.”
The authors also noted clinicians should exercise caution in extrapolating the results of Hawley et al. because the effects of biologic treatment in patients with a long disease duration, such as in this study, may not be generalizable to most RA patients.
Dr. Goodman and Dr. Bass are rheumatologists and professors of clinical medicine at Cornell University and the Hospital for Special Surgery, both in New York. Dr. Goodman disclosed financial relationships with Novartis and UCB outside the scope of this work.
Patients with rheumatoid arthritis using tumor necrosis factor inhibitors do not appear to have a lower rate of joint replacement when compared with patients taking conventional synthetic disease-modifying antirheumatic drugs, according to an analysis of data in the British Society for Rheumatology Biologics Register for RA.
Although there was not a general protective effect, patients with rheumatoid arthritis (RA) who were 60 years or older had a 40% reduction in total hip replacement (THR) when using tumor necrosis factor inhibitors (TNFi), according to first author Samuel Hawley from the Nuffield Department of Orthopaedics in the Rheumatology and Musculoskeletal Sciences at the University of Oxford (England) and his colleagues.
“While a reduction in THR amongst older TNFi users offers some support for biologics playing a role in reducing need for joint replacement, it must also be noted that the lack of an overall protective effect is suggestive that other factors apart from TNFi are likely to be involved in the ... downward population trends in joint replacement rates in RA,” Mr. Hawley and his colleagues wrote in their report published in the journal Rheumatology.
The researchers analyzed prospectively collected data on 11,202 RA patients from the British Society for Rheumatology Biologics Register for RA (BSRBR-RA) from 2001-2016 who were using TNFi (n = 9,558) or conventional synthetic disease-modifying antirheumatic drugs (csDMARDs; n = 1,644). Patients had a median disease duration of 11.0 years in the TNFi group and 10.8 years in the csDMARD group. TNFi and csDMARD users were matched based on their propensity to receive treatment, and researchers used a Cox regression analysis to compare the rates of total knee replacement (TKR), THR, and other joint replacement. The researchers utilized each csDMARD user a median of three times (interquartile range, one to six) in the comparisons.
The incidence rate for THR was 5.22/1,000 person-years for TNFi users and 6.30/1,000 person-years for csDMARD users, while the incidence rate for TKR was 8.89/1,000 person-years for TNFi users and 8.09/1,000 person-years for csDMARD users. Mr. Hawley and his colleagues found no association between TNFi use and THR when compared with csDMARD users (adjusted pooled hazard ratio, 0.86; 95% confidence interval, 0.60-1.22; P = .39) based on 589 THRs during follow-up. There was also no association between the incidence of TKR and TNFi use when compared with csDMARD users (adjusted pooled HR, 1.11; 95% CI, 0.84-1.47; P = .46) based on 846 TKRs during follow-up. When the researchers examined 336 other joint replacements performed during follow-up, there was also no significant difference in incidence between TNFi and csDMARD users (HR, 1.15; 95% CI, 0.75-1.77).
For patients 60 years or older, TNFi use was associated with a 40% reduction in THR incidence (HR, 0.60; 95% CI, 0.41-0.87; P = .008), but not in TKR incidence. However, younger patients using TNFi did not have a reduced incidence of THR, and there were no associations between TNFi use and incidence of TKR or other joint replacements.
“It could be that the relatively long disease duration at our baseline meant there was greater potential for prevention of joint destruction at the hip over knee, although details of differential natural history of RA disease at these two joints are not well established,” the researchers wrote. “It is also very difficult to disentangle the impact of TNFi on improved function and overall quality of life and how this may have mediated effects on longer-term progression of joint damage, potentially differentially at the knee and hip.”
The researchers said the study was limited by the potential for residual confounding by indication, and the long disease duration of patients means that the results would not be generalizable to patients with early RA. In addition, underreporting of joint replacement could create bias because the registry information is a combination of physician-reported and self-reported incidences, they added.
This study was funded by an award from the National Institute for Health Research (NIHR) and support from the Oxford NIHR Biomedical Research Unit. Four authors disclosed financial relationships with industry, including many companies marketing biologics for RA. Other authors reported no relevant conflicts of interest.
SOURCE: Hawley S et al. Rheumatology. 2019 Jan 10. doi: 10.1093/rheumatology/key424.
FROM RHEUMATOLOGY
Key clinical point: The rate of joint replacement did not differ among patients with RA using conventional synthetic disease-modifying antirheumatic drugs (csDMARDs) or tumor necrosis factor inhibitors (TNFis).
Major finding: There was no association between TNFi use and total hip replacement when compared with csDMARD users based on an adjusted pooled hazard ratio of 0.86 (95% confidence interval, 0.60-1.22), but patients older than 60 years using TNFi had a significantly greater reduction in total hip replacement.
Study details: An observational study of 11,202 prospectively collected RA patients in the British Society for Rheumatology Biologics Register for RA.
Disclosures: This study was funded by an award from the National Institute for Health Research (NIHR) and support from the Oxford NIHR Biomedical Research Unit. Four authors disclosed financial relationships with industry, including many companies marketing biologics for RA. Other authors reported no relevant conflicts of interest.
Source: Hawley S et al. Rheumatology. 2019 Jan 10. doi: 10.1093/rheumatology/key424.
Heberden’s nodes linked to knee OA progression
according to a review of 575 participants in a substudy of the Osteoarthritis Initiative cohort.
After assessing Heberden’s nodes (HNs) – bony enlargements of the last finger joint – and knee MRI findings at baseline and 24 months, the investigators found that HNs were associated with periarticular bone area expansion in the knee. The investigators reported their findings in Arthritis & Rheumatology.
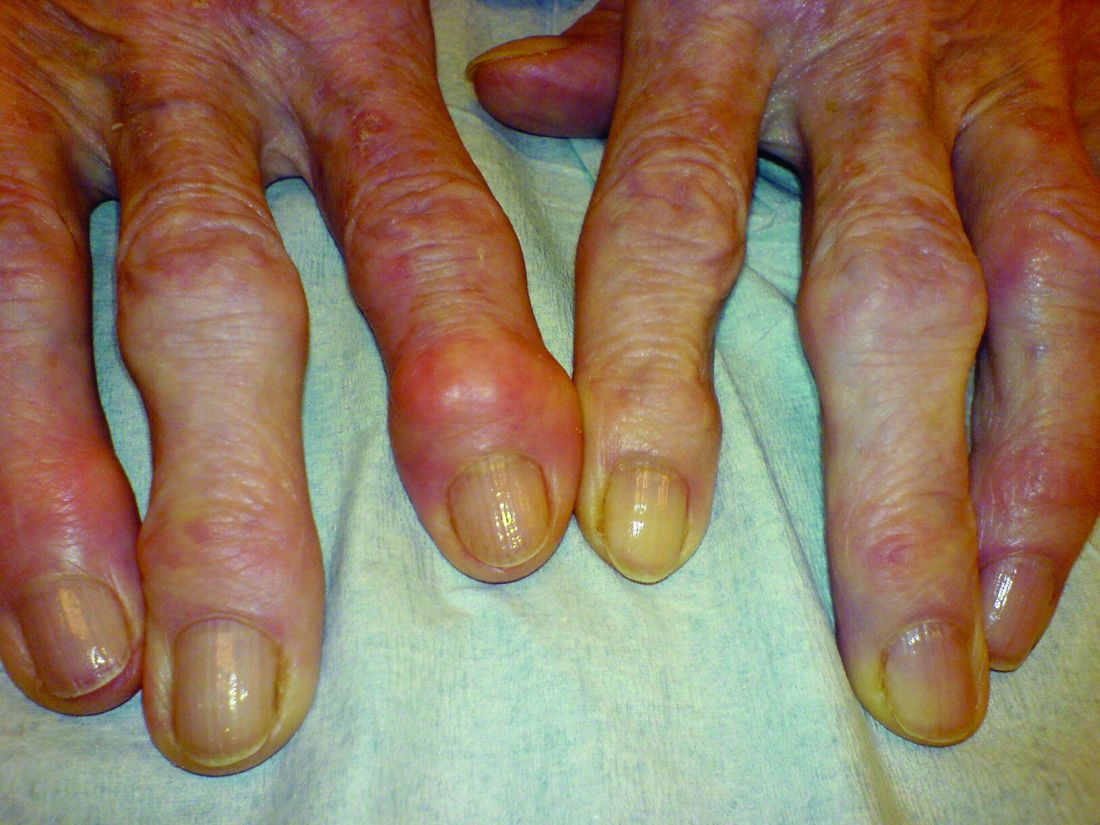
Comparing the 395 subjects with HNs with the 180 without, there was more periarticular bone area expansion among HN patients at 2 years in the knee joint (adjusted odds ratio, 1.39; 95% confidence interval, 1.06-1.83), especially in the medial femur (aOR, 1.49; 95% CI, 1.05-2.13), lateral femur (aOR, 2.51; 95% CI, 1.58-3.97), femoral notch (aOR, 1.37; 95% CI, 1.02-1.84), and lateral trochlea (aOR, 1.44; 95% CI, 1.08-1.9). The comparisons were adjusted for age, sex, body mass index, and bone remodeling agent use.
“The presence of Heberden’s nodes in a physical examination is associated with a distinct pattern of worsening of osteoarthritis-related structural damage in the knee joint,” lead investigator Arya Haj-Mirzaian, MD, a radiologist and postdoctoral fellow at Johns Hopkins University, Baltimore, said in a press release.
However, HNs were also associated with less worsening of knee osteophytes, especially at the femoral end of the knee joint (aOR, 0.54; 95% CI, 0.31-0.95); the finding seemed to contradict the overall picture of worsening knee osteoarthritis with HNs.
“Although osteophytes are thought to be a late secondary sequel or compensatory repair mechanism in OA and indicator of advanced knee OA, less worsening in osteophytes’ score ... may propose that less ossification is involved in the pathophysiology of knee OA in the presence of HNs,” the investigators wrote. It’s a subject for future research.
Patients with HNs were older, more often female, and had a lower frequency for other knee OA risk factors, such as excessive body mass index and knee injury. Patients with gout were excluded.
There was no external funding, and the investigators reported no disclosures.
SOURCE: Haj-Mirzaian A et al. Arthritis Rheumatol. 2019 Jan 9. doi: 10.1002/art.40811.
according to a review of 575 participants in a substudy of the Osteoarthritis Initiative cohort.
After assessing Heberden’s nodes (HNs) – bony enlargements of the last finger joint – and knee MRI findings at baseline and 24 months, the investigators found that HNs were associated with periarticular bone area expansion in the knee. The investigators reported their findings in Arthritis & Rheumatology.
Comparing the 395 subjects with HNs with the 180 without, there was more periarticular bone area expansion among HN patients at 2 years in the knee joint (adjusted odds ratio, 1.39; 95% confidence interval, 1.06-1.83), especially in the medial femur (aOR, 1.49; 95% CI, 1.05-2.13), lateral femur (aOR, 2.51; 95% CI, 1.58-3.97), femoral notch (aOR, 1.37; 95% CI, 1.02-1.84), and lateral trochlea (aOR, 1.44; 95% CI, 1.08-1.9). The comparisons were adjusted for age, sex, body mass index, and bone remodeling agent use.
“The presence of Heberden’s nodes in a physical examination is associated with a distinct pattern of worsening of osteoarthritis-related structural damage in the knee joint,” lead investigator Arya Haj-Mirzaian, MD, a radiologist and postdoctoral fellow at Johns Hopkins University, Baltimore, said in a press release.
However, HNs were also associated with less worsening of knee osteophytes, especially at the femoral end of the knee joint (aOR, 0.54; 95% CI, 0.31-0.95); the finding seemed to contradict the overall picture of worsening knee osteoarthritis with HNs.
“Although osteophytes are thought to be a late secondary sequel or compensatory repair mechanism in OA and indicator of advanced knee OA, less worsening in osteophytes’ score ... may propose that less ossification is involved in the pathophysiology of knee OA in the presence of HNs,” the investigators wrote. It’s a subject for future research.
Patients with HNs were older, more often female, and had a lower frequency for other knee OA risk factors, such as excessive body mass index and knee injury. Patients with gout were excluded.
There was no external funding, and the investigators reported no disclosures.
SOURCE: Haj-Mirzaian A et al. Arthritis Rheumatol. 2019 Jan 9. doi: 10.1002/art.40811.
FROM ARTHRITIS & RHEUMATOLOGY
Key clinical point: Heberden’s nodes may be an indicator of knee OA progression.
Major finding: There was more periarticular bone area expansion among patients with Heberden’s nodes at 2 years in the knee joint (adjusted odds ratio, 1.39; 95% confidence interval, 1.06-1.83).
Study details: A substudy of 575 participants in the Osteoarthritis Initiative cohort
Disclosures: There was no external funding, and the investigators reported no disclosures.
Source: Haj-Mirzaian A et al. Arthritis Rheumatol. 2019 Jan 9. doi: 10.1002/art.40811.
Knee pathologies, including multiple meniscal tears, predict accelerated OA
Accelerated knee osteoarthritis is characterized by distinct features that include destabilizing meniscal tears in two or more areas as well as other pathologies, based on data from the Osteoarthritis Initiative.
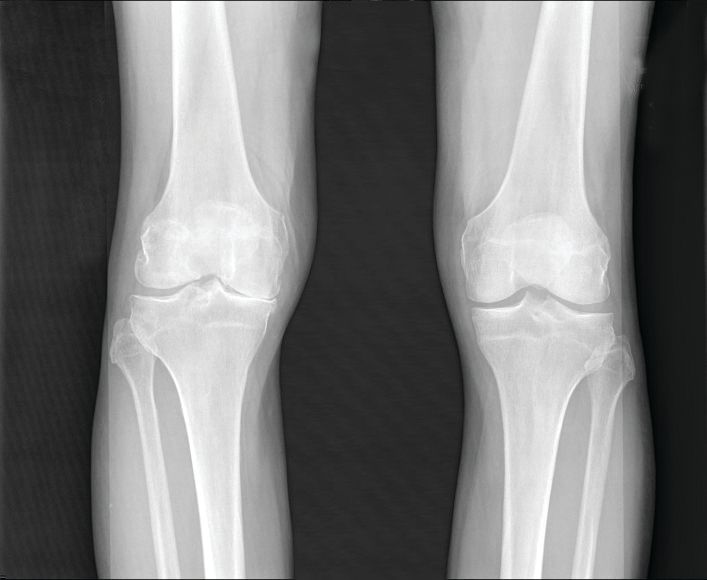
The possibility of accelerated knee osteoarthritis (AKOA) as a unique subset of knee osteoarthritis has not been well studied, wrote Jeffrey B. Driban, PhD, of Tufts University, Boston, and his colleagues.
“If specific pathologies differentiate people at risk for AKOA it may help identify adults with early-stage or high-risk for AKOA and inspire novel prevention strategies,” they wrote in their report, published in Arthritis & Rheumatology.
The researchers reviewed data from three groups of adults selected from participants in the Osteoarthritis Initiative, a cohort of 4,796 adults with KOA or at risk for symptomatic KOA who were recruited at four clinical sites in the United States. These groups included 125 with AKOA, 125 with typical knee osteoarthritis (KOA), and 125 without knee OA.
Overall, patients with AKOA were approximately seven times more likely than were patients with KOA to have destabilizing meniscal tears in two or more areas at the time of the index visit (42% vs. 14%); less than 5% of adults with no KOA experienced destabilizing meniscal tears. In addition, patients with AKOA were more than four times as likely to have miscellaneous pathology starting the year before the index visit, compared with those without AKOA.
Approximately 63% of the participants in each group were women, and the majority were overweight. The average age, weight, and global impact of arthritis were greater in the AKOA group when compared against the typical KOA and no-KOA groups.
Participants were assessed via MRI reviewed by radiologists who were blinded to the groups.
At the index visit, 49% of adults with AKOA had either a destabilizing meniscal tear or miscellaneous pathology, compared with 15% of adults with KOA and 6% of adults without KOA.
Adults with AKOA also showed significantly greater cartilage loss prior to the index visit in comparison with typical KOA patients, and AKOA patients had less cartilage in the medial and lateral tibia and medial femur, compared with adults who had typical KOA or no KOA after the index visit.
Adults who developed AKOA showed a significantly higher bone marrow lesion volume when compared against the typical KOA and no-KOA groups at 1 year prior to the index visit, and their bone marrow lesion volume increased on average 13 times more compared with typical KOA patients over the 2 years before the index visit, the researchers noted (2.00 mL vs. 0.15 mL, respectively).
“These findings add to the evidence that AKOA is different [from] the typically perceived archetype of slow-progressing osteoarthritis” with a unique risk profile, the researchers said.
The study findings were limited by several factors, including the relatively small sample size, uncertain timing of disease onset, a potentially limited definition of a destabilizing meniscal tear (defined as a root tear, radial tear, or complex tear, which almost always featured a radial component), a lack of a universal AKOA pathology, and some missing MRI data, the researchers noted. However, the results support previous studies suggesting a link between meniscal pathology and increased risk for AKOA, they said.
“It is important to acknowledge that it remains unclear if AKOA has any relation to type 2 rapidly progressive osteoarthritis, which was characterized by a more dramatic joint space narrowing (2 mm or more within 1 year) and greater abnormal bone loss/destruction,” they noted.
“Future research with a larger sample size of adults at risk for AKOA may help further refine our understanding of AKOA and help develop a clinically useful predictive model,” they added.
The study was supported in part by a grant from the National Institute of Arthritis and Musculoskeletal and Skin Diseases, and private funding included Merck, Novartis, GlaxoSmithKline, and Pfizer. The researchers had no financial conflicts to disclose.
SOURCE: Driban JB et al. Arthritis Rheumatol. 2018 Dec 28. doi: 10.1002/art.40826.
Accelerated knee osteoarthritis is characterized by distinct features that include destabilizing meniscal tears in two or more areas as well as other pathologies, based on data from the Osteoarthritis Initiative.
The possibility of accelerated knee osteoarthritis (AKOA) as a unique subset of knee osteoarthritis has not been well studied, wrote Jeffrey B. Driban, PhD, of Tufts University, Boston, and his colleagues.
“If specific pathologies differentiate people at risk for AKOA it may help identify adults with early-stage or high-risk for AKOA and inspire novel prevention strategies,” they wrote in their report, published in Arthritis & Rheumatology.
The researchers reviewed data from three groups of adults selected from participants in the Osteoarthritis Initiative, a cohort of 4,796 adults with KOA or at risk for symptomatic KOA who were recruited at four clinical sites in the United States. These groups included 125 with AKOA, 125 with typical knee osteoarthritis (KOA), and 125 without knee OA.
Overall, patients with AKOA were approximately seven times more likely than were patients with KOA to have destabilizing meniscal tears in two or more areas at the time of the index visit (42% vs. 14%); less than 5% of adults with no KOA experienced destabilizing meniscal tears. In addition, patients with AKOA were more than four times as likely to have miscellaneous pathology starting the year before the index visit, compared with those without AKOA.
Approximately 63% of the participants in each group were women, and the majority were overweight. The average age, weight, and global impact of arthritis were greater in the AKOA group when compared against the typical KOA and no-KOA groups.
Participants were assessed via MRI reviewed by radiologists who were blinded to the groups.
At the index visit, 49% of adults with AKOA had either a destabilizing meniscal tear or miscellaneous pathology, compared with 15% of adults with KOA and 6% of adults without KOA.
Adults with AKOA also showed significantly greater cartilage loss prior to the index visit in comparison with typical KOA patients, and AKOA patients had less cartilage in the medial and lateral tibia and medial femur, compared with adults who had typical KOA or no KOA after the index visit.
Adults who developed AKOA showed a significantly higher bone marrow lesion volume when compared against the typical KOA and no-KOA groups at 1 year prior to the index visit, and their bone marrow lesion volume increased on average 13 times more compared with typical KOA patients over the 2 years before the index visit, the researchers noted (2.00 mL vs. 0.15 mL, respectively).
“These findings add to the evidence that AKOA is different [from] the typically perceived archetype of slow-progressing osteoarthritis” with a unique risk profile, the researchers said.
The study findings were limited by several factors, including the relatively small sample size, uncertain timing of disease onset, a potentially limited definition of a destabilizing meniscal tear (defined as a root tear, radial tear, or complex tear, which almost always featured a radial component), a lack of a universal AKOA pathology, and some missing MRI data, the researchers noted. However, the results support previous studies suggesting a link between meniscal pathology and increased risk for AKOA, they said.
“It is important to acknowledge that it remains unclear if AKOA has any relation to type 2 rapidly progressive osteoarthritis, which was characterized by a more dramatic joint space narrowing (2 mm or more within 1 year) and greater abnormal bone loss/destruction,” they noted.
“Future research with a larger sample size of adults at risk for AKOA may help further refine our understanding of AKOA and help develop a clinically useful predictive model,” they added.
The study was supported in part by a grant from the National Institute of Arthritis and Musculoskeletal and Skin Diseases, and private funding included Merck, Novartis, GlaxoSmithKline, and Pfizer. The researchers had no financial conflicts to disclose.
SOURCE: Driban JB et al. Arthritis Rheumatol. 2018 Dec 28. doi: 10.1002/art.40826.
FROM ARTHRITIS & RHEUMATOLOGY
Key clinical point:
Major finding: One year before the knee OA index visit, more than 75% of patients with accelerated knee OA had meniscal damage in at least two regions.
Study details: The data come from 375 adults with typical knee OA, accelerated knee OA, or no knee OA in the longitudinal Osteoarthritis Initiative cohort study.
Disclosures: The study was supported in part by a grant from the National Institute of Arthritis and Musculoskeletal and Skin Diseases, and private funding included Merck, Novartis, GlaxoSmithKline, and Pfizer. The researchers had no financial conflicts to disclose.
Source: Driban JB et al. Arthritis Rheumatol. 2018 Dec 28. doi: 10.1002/art.40826.
Antidepressants tied to greater hip fracture incidence in older adults
Older patients in a Swedish registry who took antidepressants had a greater incidence of hip fracture the year before beginning antidepressant therapy and the year after starting therapy, compared with individuals in a matched control group.
The use of antidepressants is associated with adverse events such as a higher risk of falls, wrote Jon Brännström, MD, and his colleagues in JAMA Psychiatry. Some evidence also suggests that antidepressants “might affect bone metabolism, thereby increasing the risk of hip fracture.”
To examine the relationship between antidepressants and hip fracture, Dr. Brännström and his colleagues performed a nationwide cohort study of 204,072 individuals in the Prescribed Drug Register of Sweden’s National Board of Health and Welfare. All of the individuals were aged at least 65 years (mean age, 80.1 years; 63.1% women) and filled a prescription for an antidepressant between July 2006 and December 2011. Selective serotonin reuptake inhibitors made up 62.6% of the antidepressants used.
Patients who filled an antidepressant prescription during that time period were matched with a control group of individuals by birth year and gender and were studied the year before and after beginning antidepressant therapy.
In the year after initiating antidepressant therapy, there was a 3.5% incidence rate for hip fractures, compared with 1.3% in the control group.
After adjusting the results using a conditional logistic regression model, the highest rate of hip fracture among antidepressant users occurred between 16 days and 30 days prior to filling the prescription (odds ratio, 5.76; 95% confidence interval, 4.73-7.01); this association persisted in further subgroup analyses based on age, reported Dr. Brännström, who is affiliated with the department of community medicine and rehabilitation and geriatric medicine at Umeå University (Sweden), and his colleagues.
They noted that, although the study included all Swedish individuals who filled prescriptions for antidepressants during the study period, there is an absence of primary care comorbidity data and indications for antidepressant use. In addition, the definition of high- and low-medication doses does not always match what is considered high and low therapeutically and the information that can be gleaned from merging data from several different registries was limited.
“These findings raise questions about associations between antidepressant use and hip fracture seen in previous observational studies,” Dr. Brännström and his colleagues wrote. “Further analysis of this association in treatment studies and examination of the incidence of hip fracture before and after the discontinuation of treatment is required and may shed further light on the possible residual risk associated with treatment.”
This study was funded by the Swedish Research Council. The authors reported no relevant conflicts of interest.
SOURCE: Brännström J et al. JAMA Psychiatry. 2019 Jan 2. doi: 10.1001/jamapsychiatry.2018.3679.
In many cases where an adverse event is linked to a medication, such as in the case of gastrointestinal bleeds and blood thinners, the adverse event is not linked to the medication. However, this is not the case with antidepressants and hip fracture, Andrea Iaboni, MD, DPhil, and Donovan T. Maust, MD, wrote in a related editorial (JAMA Psychiatry. 2019 Jan 2. doi: 10.1001/jamapsychiatry.2018.3632).
“Patients are routinely prescribed antidepressants following a fracture,” the authors wrote, noting that depression can occur for patients who do not have a history of depression and can last as long as 1 year after hip fracture. The reasons for depression after hip fracture are possibly caused by the consequences of the event or a comorbid condition, such as cerebrovascular disease burden, cognitive impairment, frailty, and impaired functional status. In addition, new antidepressant prescriptions are 10 times the normal rate for older adults in the months after a hip fracture.
Many older users of antidepressants have a hip fracture event in their past, which could be caused by an untreated case of depression and an elevated risk of elevated fall or fracture, as suggested by Brännström et al., while other reasons could include off-label indications such as insomnia, poor motivation during rehabilitation therapy, pain, or hyperactive delirium.
“If individuals with untreated depression are at risk of falls and fractures, it follows that there would be an elevated rate of fractures before antidepressant use,” the authors wrote. “However, as discussed earlier, it is also important to recognize that, during the postfracture period, rightly or wrongly, antidepressants are prescribed at a high rate.”
Clinicians who treat these patients should not stop all antidepressant prescribing to this population. Instead, “a pragmatic preventive approach is warranted, starting with selecting the antidepressant, a cautious initial dose and dose-escalation schedule, a review of potentially interacting therapies ... and referral to fall prevention programs for patients with other risk factors for falls,” they wrote.
“For most older adults, the toll of untreated depression will likely outweigh the potential risks associated with antidepressant use.”
Dr. Iabroni is with the Toronto Rehabilitation Institute and the University of Toronto. He reported receiving fees from serving as a scientific adviser for Winterlight Labs. Dr. Maust is with the department of psychiatry at the University of Michigan, Ann Arbor. He reported no relevant conflicts of interest.
Older patients in a Swedish registry who took antidepressants had a greater incidence of hip fracture the year before beginning antidepressant therapy and the year after starting therapy, compared with individuals in a matched control group.
The use of antidepressants is associated with adverse events such as a higher risk of falls, wrote Jon Brännström, MD, and his colleagues in JAMA Psychiatry. Some evidence also suggests that antidepressants “might affect bone metabolism, thereby increasing the risk of hip fracture.”
To examine the relationship between antidepressants and hip fracture, Dr. Brännström and his colleagues performed a nationwide cohort study of 204,072 individuals in the Prescribed Drug Register of Sweden’s National Board of Health and Welfare. All of the individuals were aged at least 65 years (mean age, 80.1 years; 63.1% women) and filled a prescription for an antidepressant between July 2006 and December 2011. Selective serotonin reuptake inhibitors made up 62.6% of the antidepressants used.
Patients who filled an antidepressant prescription during that time period were matched with a control group of individuals by birth year and gender and were studied the year before and after beginning antidepressant therapy.
In the year after initiating antidepressant therapy, there was a 3.5% incidence rate for hip fractures, compared with 1.3% in the control group.
After adjusting the results using a conditional logistic regression model, the highest rate of hip fracture among antidepressant users occurred between 16 days and 30 days prior to filling the prescription (odds ratio, 5.76; 95% confidence interval, 4.73-7.01); this association persisted in further subgroup analyses based on age, reported Dr. Brännström, who is affiliated with the department of community medicine and rehabilitation and geriatric medicine at Umeå University (Sweden), and his colleagues.
They noted that, although the study included all Swedish individuals who filled prescriptions for antidepressants during the study period, there is an absence of primary care comorbidity data and indications for antidepressant use. In addition, the definition of high- and low-medication doses does not always match what is considered high and low therapeutically and the information that can be gleaned from merging data from several different registries was limited.
“These findings raise questions about associations between antidepressant use and hip fracture seen in previous observational studies,” Dr. Brännström and his colleagues wrote. “Further analysis of this association in treatment studies and examination of the incidence of hip fracture before and after the discontinuation of treatment is required and may shed further light on the possible residual risk associated with treatment.”
This study was funded by the Swedish Research Council. The authors reported no relevant conflicts of interest.
SOURCE: Brännström J et al. JAMA Psychiatry. 2019 Jan 2. doi: 10.1001/jamapsychiatry.2018.3679.
FROM JAMA PSYCHIATRY
Key clinical point: An association was found between greater hip fracture incidence for older individuals taking antidepressants in the year before beginning therapy and the year after starting therapy.
Major finding: Individuals who took antidepressants had a greater incidence of hip fractures in the year before (2.8% vs. 1.1%) and the year after (3.5% vs. 1.3%) beginning antidepressants, compared with individuals in a matched control group.
Study details: A nationwide cohort study of 408,144 individuals in the Prescribed Drugs Register of Sweden’s National Board of Health and Welfare who were aged 65 years or older.
Disclosures: This study was funded by the Swedish Research Council. The authors reported no relevant conflicts of interest.
Source: Brännström J et al. JAMA Psychiatry. 2019 Jan 2. doi: 10.1001/jamapsychiatry.2018.3679.