User login
A.I. and U 2
In a previous Letter from Maine I wrote about a study performed in China in which more than half a million patients were diagnosed by an artificial intelligence (A.I.) system that was able to extract and analyze information from their electronic medical records. The system was at least as accurate as physicians who had access to the same data (“A.I. Shows Promise Assisting Physicians,” by Cade Metz, The New York Times, Feb. 11, 2019). I ended my column with the hopeful assumption that despite incredible advances in A.I., the practice of medicine always would include a human element. However, I left unexplained exactly how physicians would fit into the post-A.I. revolution. In the weeks since I submitted that column, I have been searching for roles that might remain for physicians after A.I. has snatched their bread and butter of diagnosis and management.

I easily can envision a system in which the patient enters her chief complaint and current symptoms into her smartphone or tablet. Using its database of the patient’s past, family, and social history, the system generates a list of laboratory and imaging studies, some of which the patient may be able to submit directly from her handheld device. For example, the system may be able to use the patient’s phone to “examine” her. The A.I. system then generates a diagnosis.
If the diagnosed condition and management is simple and straightforward, such as a rash, the information could be communicated to the patient directly, with a short paragraph of explanation and list of persistent symptoms that would indicate that the condition was not improving as expected. A contact dermatitis comes to mind here.
However, suppose the A.I. system determines that the patient has a 90% chance of having stage IV pancreatic cancer, with a life expectancy of 6 months. Is this the kind of information you would like to learn about yourself by clicking “Your Diagnosis” box on your phone while you were having lunch with a friend? Obviously, a diagnosis of this severity should be communicated human to human, even though it was generated by a highly accurate computer system. And this communication would best be done in the form of a dialogue with someone who knows the patient and has some understanding of how she might understand and cope with the information. In the absence of a prior relationship, the dialogue should occur in real time and face to face at a minimum. I guess we have to acknowledge that FaceTime or Skype might be acceptable here.
Fortunately, stage IV cancers are rare, but there are a bazillion other conditions that, while not serious, require a nuanced explanation as part of a successful management plan that takes into account the patient’s level of anxiety and cognitive abilities. A boilerplate paragraph or two spit out by an A.I. system isn’t good health care. Although I know many physicians do rely on printed handouts for conditions they feel is a no-brainer.

The bottom line is that even when a machine may be better than we are at making some diagnoses, there always will be a role for a human to help other humans understand and cope with those diagnoses. At this point, physicians would appear be the obvious choice to fill that role. How we will get reimbursed for our communication skills is unclear.
Dr. Wilkoff practiced primary care pediatrics in Brunswick, Maine for nearly 40 years. He has authored several books on behavioral pediatrics, including “How to Say No to Your Toddler.” Email him at [email protected].
In a previous Letter from Maine I wrote about a study performed in China in which more than half a million patients were diagnosed by an artificial intelligence (A.I.) system that was able to extract and analyze information from their electronic medical records. The system was at least as accurate as physicians who had access to the same data (“A.I. Shows Promise Assisting Physicians,” by Cade Metz, The New York Times, Feb. 11, 2019). I ended my column with the hopeful assumption that despite incredible advances in A.I., the practice of medicine always would include a human element. However, I left unexplained exactly how physicians would fit into the post-A.I. revolution. In the weeks since I submitted that column, I have been searching for roles that might remain for physicians after A.I. has snatched their bread and butter of diagnosis and management.
I easily can envision a system in which the patient enters her chief complaint and current symptoms into her smartphone or tablet. Using its database of the patient’s past, family, and social history, the system generates a list of laboratory and imaging studies, some of which the patient may be able to submit directly from her handheld device. For example, the system may be able to use the patient’s phone to “examine” her. The A.I. system then generates a diagnosis.
If the diagnosed condition and management is simple and straightforward, such as a rash, the information could be communicated to the patient directly, with a short paragraph of explanation and list of persistent symptoms that would indicate that the condition was not improving as expected. A contact dermatitis comes to mind here.
However, suppose the A.I. system determines that the patient has a 90% chance of having stage IV pancreatic cancer, with a life expectancy of 6 months. Is this the kind of information you would like to learn about yourself by clicking “Your Diagnosis” box on your phone while you were having lunch with a friend? Obviously, a diagnosis of this severity should be communicated human to human, even though it was generated by a highly accurate computer system. And this communication would best be done in the form of a dialogue with someone who knows the patient and has some understanding of how she might understand and cope with the information. In the absence of a prior relationship, the dialogue should occur in real time and face to face at a minimum. I guess we have to acknowledge that FaceTime or Skype might be acceptable here.
Fortunately, stage IV cancers are rare, but there are a bazillion other conditions that, while not serious, require a nuanced explanation as part of a successful management plan that takes into account the patient’s level of anxiety and cognitive abilities. A boilerplate paragraph or two spit out by an A.I. system isn’t good health care. Although I know many physicians do rely on printed handouts for conditions they feel is a no-brainer.
The bottom line is that even when a machine may be better than we are at making some diagnoses, there always will be a role for a human to help other humans understand and cope with those diagnoses. At this point, physicians would appear be the obvious choice to fill that role. How we will get reimbursed for our communication skills is unclear.
Dr. Wilkoff practiced primary care pediatrics in Brunswick, Maine for nearly 40 years. He has authored several books on behavioral pediatrics, including “How to Say No to Your Toddler.” Email him at [email protected].
Food allergy can be revealed in the epidermis of children with atopic dermatitis
according to a study of children with and without AD and FA.
The researchers included 62 children aged 4-17 years, who were divided into three groups: atopic dermatitis and food allergy (AD FA+, n = 21), atopic dermatitis and no food allergy (AD FA−, n = 19), and nonatopic controls (NA, n = 22).
“In this prospective clinical study with laboratory personnel blinded to minimize bias, we demonstrate that children with AD FA+ represent a unique endotype that can be distinguished from AD FA− or NA,” wrote Donald Y. M. Leung, MD, of National Jewish Health, Denver, and his coauthors. Their work was published online in Science Translational Medicine.
According to three different scoring systems, the two AD groups were measured to have similar skin disease severity. Dr. Leung and colleagues then used skin tape stripping to measure the first layer of skin tissue for transepidermal water loss (TEWL) and stratum corneum (SC) composition, along with other variables that would indicate a difference between AD FA+ and the other groups.
Upon analysis, children in the AD FA+ group were found to have “a constellation of SC attributes,” including increased TEWL and lower levels of filaggrin gene breakdown products (urocanic acid and pyroglutamic acid) at nonlesional layers. In addition, there was an increase of Staphylococcus aureus on the nonlesional skin of AD FA+, compared with NA.
The coauthors shared the study’s limitations, which included transcriptome analysis being successful for only a fraction of the patients and the lack of skin biopsies, which would be useful to confirm “the potential role of changes in the deeper layers of skin.” However, they also noted that using minimally invasive STS led to more patients providing samples, and thus less bias in collection. “Although future studies are needed to validate our findings,” Dr. Leung and his associates wrote, “our current data support the concept that primary and secondary prevention of AD and FA in this subset of AD should focus on improving skin barrier function.”
The study was funded by the National Institute of Health/The National Institute of Allergy and Infectious Diseases’ Atopic Dermatitis Research Network, with partial support from the Edelstein Family Chair for Pediatric Allergy at NIH and a NIH/National Center for Advancing Translational Sciences Colorado Clinical and Translational Science Awards grant. Three of the authors declared being inventors of a patent that covers methods of identifying AD with FA as a unique endotype. No other conflicts of interest were reported.
SOURCE: Leung DYM et al. Sci Transl Med. 2019 Feb 20. doi: 10.1126/scitranslmed.aav2685.
FROM SCIENCE TRANSLATIONAL MEDICINE
Key clinical point: Children with both atopic dermatitis and food allergy can be distinguished from those with just atopic dermatitis via their nonlesional skin surface.
Major finding: Those in the AD FA+ group were found to have “a constellation of stratum corneum attributes,” including increased TEWL and lower levels of filaggrin gene breakdown products.
Study details: A prospective clinical study of 62 children aged 4-17 years who were divided into three groups: atopic dermatitis and food allergy, atopic dermatitis and no food allergy, and nonatopic controls.
Disclosures: The study was funded by the National Institute of Health/The National Institute of Allergy and Infectious Diseases’ Atopic Dermatitis Research Network, with partial support from the Edelstein Family Chair for Pediatric Allergy at NIH and a NIH/National Center for Advancing Translational Sciences Colorado Clinical and Translational Science Awards grant. Three of the authors declared being inventors of a patent that covers methods of identifying AD with FA as a unique endotype. No other conflicts of interest were reported.
Source: Leung DYM et al. Sci Transl Med. 2019 Feb 20. doi: 10.1126/scitranslmed.aav2685.
Sleeping poorly may mean itching more
Study results showing an association between active atopic dermatitis (AD) and poor sleep quality were published in JAMA Pediatrics by a group of dermatologists at the University of California, San Francisco (JAMA Pediatr. 2019 Mar 4. doi: 10.1001/jamapediatrics.2019.0025). The data on the sleep quality and quantity of nearly 14,000 children were collected over span of 11 years. Of these children, slightly fewer than 5,000 met the researchers’ definition of atopic dermatitis.

Although the sleep duration of children with and without AD was not statistically different, the reports of poor sleep quality and sleep disturbances by children with AD were dramatically more frequent – a nearly 50% higher chance of having more sleep-quality disturbances. In addition, children with more severe active disease were even more likely to report poor sleep quality – almost 80%.
I suspect that you’re not surprised by these findings. You have probably heard numerous tales of poor sleep from families who have children with AD. It just makes sense that a child whose skin is dry and itchy will have trouble sleeping. I’m sure you have struggled to help parents be more diligent about applying moisturizing creams and lotions, and have been aggressive with steroid creams during flare-ups. You may have added sleep onset-promoting antihistamines when topical treatments haven’t been as effective as you had hoped.
Has your working assumption always been that if you can get the child’s skin settled down, the itching will improve and the child will have an easier time falling asleep? But have you ever considered flipping the equation over and tried to be more aggressive in managing the child’s sleep problems?
Like many other folks with psoriasis, I have noticed that my itching is worse when I am tired, and particularly worse in that evil interval between crawling into bed and falling asleep. As the grandparent of a child with AD, I have observed a similar phenomenon. While I am not going to claim that sleep deprivation causes psoriasis or AD, I think that we need to consider the association between poor sleep quality and itching as a feedback loop that must be interrupted. This means that in addition to recommending topicals and moisturizing strategies, we must learn more about our patients’ sleep habits and suggest appropriate sleep hygiene practices.
Many parents aren’t aware of the cruel paradox that an overtired child is more likely to have trouble falling asleep. Has the child been allowed to give up his nap prematurely? Is bedtime at an appropriate hour, and does it consist of a limited number of sleep-promoting rituals? Is the bedroom dark enough, cool enough, and free of electronic distractions?
Providing effective counseling on sleep hygiene is time consuming and requires that you have first convinced the parents that the child’s itching is being aggravated by his sleep deprivation and not just the other way around. Successful management may require a close working relationship between the child’s pediatrician and his dermatologist, with both physicians reinforcing each other’s message that atopic dermatitis isn’t just skin deep.
Dr. Wilkoff practiced primary care pediatrics in Brunswick, Maine, for nearly 40 years. He has authored several books on behavioral pediatrics, including “Is My Child Overtired?: The Sleep Solution for Raising Happier, Healthier Children.” Email him at [email protected].
Study results showing an association between active atopic dermatitis (AD) and poor sleep quality were published in JAMA Pediatrics by a group of dermatologists at the University of California, San Francisco (JAMA Pediatr. 2019 Mar 4. doi: 10.1001/jamapediatrics.2019.0025). The data on the sleep quality and quantity of nearly 14,000 children were collected over span of 11 years. Of these children, slightly fewer than 5,000 met the researchers’ definition of atopic dermatitis.
Although the sleep duration of children with and without AD was not statistically different, the reports of poor sleep quality and sleep disturbances by children with AD were dramatically more frequent – a nearly 50% higher chance of having more sleep-quality disturbances. In addition, children with more severe active disease were even more likely to report poor sleep quality – almost 80%.
I suspect that you’re not surprised by these findings. You have probably heard numerous tales of poor sleep from families who have children with AD. It just makes sense that a child whose skin is dry and itchy will have trouble sleeping. I’m sure you have struggled to help parents be more diligent about applying moisturizing creams and lotions, and have been aggressive with steroid creams during flare-ups. You may have added sleep onset-promoting antihistamines when topical treatments haven’t been as effective as you had hoped.
Has your working assumption always been that if you can get the child’s skin settled down, the itching will improve and the child will have an easier time falling asleep? But have you ever considered flipping the equation over and tried to be more aggressive in managing the child’s sleep problems?
Like many other folks with psoriasis, I have noticed that my itching is worse when I am tired, and particularly worse in that evil interval between crawling into bed and falling asleep. As the grandparent of a child with AD, I have observed a similar phenomenon. While I am not going to claim that sleep deprivation causes psoriasis or AD, I think that we need to consider the association between poor sleep quality and itching as a feedback loop that must be interrupted. This means that in addition to recommending topicals and moisturizing strategies, we must learn more about our patients’ sleep habits and suggest appropriate sleep hygiene practices.
Many parents aren’t aware of the cruel paradox that an overtired child is more likely to have trouble falling asleep. Has the child been allowed to give up his nap prematurely? Is bedtime at an appropriate hour, and does it consist of a limited number of sleep-promoting rituals? Is the bedroom dark enough, cool enough, and free of electronic distractions?
Providing effective counseling on sleep hygiene is time consuming and requires that you have first convinced the parents that the child’s itching is being aggravated by his sleep deprivation and not just the other way around. Successful management may require a close working relationship between the child’s pediatrician and his dermatologist, with both physicians reinforcing each other’s message that atopic dermatitis isn’t just skin deep.
Dr. Wilkoff practiced primary care pediatrics in Brunswick, Maine, for nearly 40 years. He has authored several books on behavioral pediatrics, including “Is My Child Overtired?: The Sleep Solution for Raising Happier, Healthier Children.” Email him at [email protected].
Scales assessing pediatric OCD possess little symptom overlap
There is considerable heterogeneity among symptoms included in various freely available, self-reported scales assessing obsessive-compulsive disorder in pediatric populations, according to Rachel Visontay and her associates at the University of New South Wales, Sydney.

They reviewed seven scales that exclusively assessed obsessive-compulsive disorder (OCD) and measured both obsessive and compulsive components in their study, published in the Journal of Obsessive-Compulsive and Related Disorders. The scales are:
- Children’s Florida Obsessive Compulsive Inventory.
- Children’s Yale-Brown Obsessive Compulsive Scale Symptom Checklist.
- Leyton Obsessional Inventory–Child Version.
- Children’s Obsessional Compulsive Inventory–Revised–Self Report.
- Obsessive Compulsive Inventory–Child Version.
- OCD Family Functioning Scale.
- Short OCD Screener.
A total of 54 umbrella symptoms were included over all seven scales: 32 obsessions, 21 compulsion, and 1 other symptom (Give poor class presentations despite planning). Half of these symptoms were unique to one scale but were more commonly obsessions (18 of 32) than compulsions (8 of 21). No obsession symptom appeared on more than five of the seven scales, but two compulsion symptoms (cleaning and checking compulsion) did appear on all scales.
The mean overlap between scales after Jaccard analysis was 0.14 for obsessions and 0.39 for compulsions, indicating very weak and weak overlap, respectively. The correlation between number of included symptoms and mean overlap was 0.43 for obsessions, indicating that scale length did play a role in determining overlap, but was –0.09 for compulsions, indicating no relationship between scale length and symptom overlap.
“While youth OCD scales generally measure the same broader construct, they might have different scopes within that construct, or may be more or less comprehensive than one another. As such, low content overlap does not necessarily mean a scale is ‘worse’ than one with higher overlap,” the investigators wrote. “However, researchers and
The study authors reported no conflicts of interest. The study was funded by a University of New South Wales Medicine, Neuroscience, Mental Health and Addiction Theme and SPHERE Mindgardens Clinical Academic Group collaborative research seed funding grant.
There is considerable heterogeneity among symptoms included in various freely available, self-reported scales assessing obsessive-compulsive disorder in pediatric populations, according to Rachel Visontay and her associates at the University of New South Wales, Sydney.
They reviewed seven scales that exclusively assessed obsessive-compulsive disorder (OCD) and measured both obsessive and compulsive components in their study, published in the Journal of Obsessive-Compulsive and Related Disorders. The scales are:
- Children’s Florida Obsessive Compulsive Inventory.
- Children’s Yale-Brown Obsessive Compulsive Scale Symptom Checklist.
- Leyton Obsessional Inventory–Child Version.
- Children’s Obsessional Compulsive Inventory–Revised–Self Report.
- Obsessive Compulsive Inventory–Child Version.
- OCD Family Functioning Scale.
- Short OCD Screener.
A total of 54 umbrella symptoms were included over all seven scales: 32 obsessions, 21 compulsion, and 1 other symptom (Give poor class presentations despite planning). Half of these symptoms were unique to one scale but were more commonly obsessions (18 of 32) than compulsions (8 of 21). No obsession symptom appeared on more than five of the seven scales, but two compulsion symptoms (cleaning and checking compulsion) did appear on all scales.
The mean overlap between scales after Jaccard analysis was 0.14 for obsessions and 0.39 for compulsions, indicating very weak and weak overlap, respectively. The correlation between number of included symptoms and mean overlap was 0.43 for obsessions, indicating that scale length did play a role in determining overlap, but was –0.09 for compulsions, indicating no relationship between scale length and symptom overlap.
“While youth OCD scales generally measure the same broader construct, they might have different scopes within that construct, or may be more or less comprehensive than one another. As such, low content overlap does not necessarily mean a scale is ‘worse’ than one with higher overlap,” the investigators wrote. “However, researchers and
The study authors reported no conflicts of interest. The study was funded by a University of New South Wales Medicine, Neuroscience, Mental Health and Addiction Theme and SPHERE Mindgardens Clinical Academic Group collaborative research seed funding grant.
FROM THE JOURNAL OF OBSESSIVE-COMPULSIVE AND RELATED DISORDERS
Trofinetide may benefit patients with Rett syndrome
Furthermore, the treatment is safe and well tolerated, according to results published online ahead of print March 27 in Neurology.

“These are very promising data for the Rett community that is currently without any [Food and Drug Administration]–approved treatment option,” Daniel Glaze, MD, said in a press release from Acadia Pharmaceuticals, which is developing trofinetide.
In 2017, a phase 2 study indicated that the drug was safe and tolerable when administered in doses of 70 mg/kg b.i.d. to adolescent and adult females with Rett syndrome. The study also provided initial evidence of the drug’s efficacy. Dr. Glaze, professor of pediatrics and neurology at Baylor College of Medicine in Houston, and his colleagues decided to conduct a larger phase 2 study that examined higher doses and a longer treatment duration.
The researchers first enrolled 62 participants in the study, all of whom received placebo b.i.d. for 14 days. They next randomized participants in equal groups to placebo or one of three twice-daily doses of trofinetide (i.e., 50 mg/kg, 100 mg/kg, and 200 mg/kg). After a blinded review of safety and tolerability data, Dr. Glaze and his colleagues enrolled 20 more participants and randomized them in equal groups to placebo or 200 mg/kg b.i.d. of trofinetide. This modification in study design was intended to increase the likelihood of detecting a clinical benefit. Randomized, double-blind treatment lasted for 42 days. Participants presented for a final visit at approximately 10 days after the treatment period ended.
A total of 82 girls aged 5-15 years participated in the study. They all met the 2010 diagnostic criteria for classic Rett syndrome, had a documented pathogenic MECP2 variant, were in the postregression stage of the syndrome, and had been stable on pharmacologic and behavioral treatments for at least 4 weeks. The sample’s mean age was 9.7 years, 94% were white, and mean weight was 26.1 kg. The treatment groups’ demographic characteristics were balanced.
All three doses of trofinetide were safe and tolerable. One participant in the 200-mg/kg b.i.d. group was withdrawn from the study at her parents’ request. Serious adverse events occurred in one control participant, one receiving the 100-mg/kg b.i.d. dose, and one receiving the 200-mg/kg b.i.d. dose. These serious adverse events were considered unrelated to study medication and resolved by the study’s end. The most common adverse events were diarrhea, vomiting, upper respiratory tract infection, and pyrexia. Most were mild or moderate and considered unrelated to trofinetide.
The 200-mg/kg b.i.d. dose of trofinetide significantly improved outcomes on the Rett Syndrome Behavior Questionnaire (RSBQ), Clinical Global Impression Scale–Improvement (CGI-I), and Rett Syndrome Domain Specific Concerns (RTT-DSC), compared with placebo. The change of the median RTT-DSC score was 15%, and the change of the mean RSBQ score was 16%. More than 20% of participants receiving 200 mg/kg b.i.d. of trofinetide were rated much improved on the CGI-I, compared with less than 5% of controls.
“Overall, the observed clinical improvement in the present pediatric trial was more manifest than in the previous trial, with younger age (i.e., greater neuroplasticity), higher doses (i.e., higher drug exposure), and longer drug treatment duration (i.e., 28 days in Rett-001 vs. 42 days in Rett-002) as potential contributors,” said Dr. Glaze and his colleagues. “Future studies aiming at replicating the results of this pediatric trial would benefit from including the RSBQ as a primary endpoint and should also consider evaluating RSBQ subscales such as the General Mood.”
Neuren Pharmaceuticals and Rettsyndrome.org funded the study. Dr. Glaze is a consultant to Neuren Pharmaceuticals.
SOURCE: Glaze DG et al. Neurology. 2019 Mar 27. doi: 10.1212/WNL.0000000000007316.
Furthermore, the treatment is safe and well tolerated, according to results published online ahead of print March 27 in Neurology.
“These are very promising data for the Rett community that is currently without any [Food and Drug Administration]–approved treatment option,” Daniel Glaze, MD, said in a press release from Acadia Pharmaceuticals, which is developing trofinetide.
In 2017, a phase 2 study indicated that the drug was safe and tolerable when administered in doses of 70 mg/kg b.i.d. to adolescent and adult females with Rett syndrome. The study also provided initial evidence of the drug’s efficacy. Dr. Glaze, professor of pediatrics and neurology at Baylor College of Medicine in Houston, and his colleagues decided to conduct a larger phase 2 study that examined higher doses and a longer treatment duration.
The researchers first enrolled 62 participants in the study, all of whom received placebo b.i.d. for 14 days. They next randomized participants in equal groups to placebo or one of three twice-daily doses of trofinetide (i.e., 50 mg/kg, 100 mg/kg, and 200 mg/kg). After a blinded review of safety and tolerability data, Dr. Glaze and his colleagues enrolled 20 more participants and randomized them in equal groups to placebo or 200 mg/kg b.i.d. of trofinetide. This modification in study design was intended to increase the likelihood of detecting a clinical benefit. Randomized, double-blind treatment lasted for 42 days. Participants presented for a final visit at approximately 10 days after the treatment period ended.
A total of 82 girls aged 5-15 years participated in the study. They all met the 2010 diagnostic criteria for classic Rett syndrome, had a documented pathogenic MECP2 variant, were in the postregression stage of the syndrome, and had been stable on pharmacologic and behavioral treatments for at least 4 weeks. The sample’s mean age was 9.7 years, 94% were white, and mean weight was 26.1 kg. The treatment groups’ demographic characteristics were balanced.
All three doses of trofinetide were safe and tolerable. One participant in the 200-mg/kg b.i.d. group was withdrawn from the study at her parents’ request. Serious adverse events occurred in one control participant, one receiving the 100-mg/kg b.i.d. dose, and one receiving the 200-mg/kg b.i.d. dose. These serious adverse events were considered unrelated to study medication and resolved by the study’s end. The most common adverse events were diarrhea, vomiting, upper respiratory tract infection, and pyrexia. Most were mild or moderate and considered unrelated to trofinetide.
The 200-mg/kg b.i.d. dose of trofinetide significantly improved outcomes on the Rett Syndrome Behavior Questionnaire (RSBQ), Clinical Global Impression Scale–Improvement (CGI-I), and Rett Syndrome Domain Specific Concerns (RTT-DSC), compared with placebo. The change of the median RTT-DSC score was 15%, and the change of the mean RSBQ score was 16%. More than 20% of participants receiving 200 mg/kg b.i.d. of trofinetide were rated much improved on the CGI-I, compared with less than 5% of controls.
“Overall, the observed clinical improvement in the present pediatric trial was more manifest than in the previous trial, with younger age (i.e., greater neuroplasticity), higher doses (i.e., higher drug exposure), and longer drug treatment duration (i.e., 28 days in Rett-001 vs. 42 days in Rett-002) as potential contributors,” said Dr. Glaze and his colleagues. “Future studies aiming at replicating the results of this pediatric trial would benefit from including the RSBQ as a primary endpoint and should also consider evaluating RSBQ subscales such as the General Mood.”
Neuren Pharmaceuticals and Rettsyndrome.org funded the study. Dr. Glaze is a consultant to Neuren Pharmaceuticals.
SOURCE: Glaze DG et al. Neurology. 2019 Mar 27. doi: 10.1212/WNL.0000000000007316.
FROM NEUROLOGY
Key clinical point: Trofinetide provides clinically meaningful improvements in core symptoms of Rett syndrome.
Major finding: The 200 mg/kg b.i.d. dose of trofinetide improved outcomes on the Rett Syndrome Behavior Questionnaire by 16%.
Study details: A phase 2, double-blind, placebo-controlled study of 82 children and adolescents with Rett syndrome.
Disclosures: Neuren Pharmaceuticals and Rettsyndrome.org funded the study.
Source: Glaze DG et al. Neurology. 2019 Mar 27. doi: 10.1212/WNL.0000000000007316.
Earlier diagnosis, treatment needed to curb dramatic rise in neonatal HSV
A 56% increase in neonatal herpes simplex virus (HSV) infection over 7 years was determined as part of a retrospective, multistate, longitudinal cohort study using information collected from the MarketScan Medicaid Database, reported Sanjay Mahant, MD, of the University of Toronto, and his associates.
Comprehensive coordinated care – as well as public health strategies targeting disease prevention, early diagnosis, and treatment – are needed to manage the growing number of neonates diagnosed with HSV, Dr. Mahant and his colleagues said.
A total of 900 newborn Medicaid enrollees aged 0-28 days were chosen from 2,107,124 births for inclusion in the study. All patients, who were diagnosed with HSV infection during hospital admission, were born during Jan. 1, 2009–Dec. 31, 2015.
Susceptibility to primary HSV-1 infection among younger women has been attributed to an increase in oral sex practices over the past 2 decades, which is putting adolescents and young adults at greater risk of genital HSV-1 infection (J Infect Dis. 2007;196[12]:1852-9). As a result, more “primary or nonprimary genital HSV-1 infections among childbearing women” are believed to be the likely cause for the increasing numbers of neonatal HSV cases, the authors speculated, citing a recent study (J Infect Dis. 2014 Feb 1;209[3]:315-7).
HSV, a rare infection typically contracted immediately before or after birth, has both high morbidity and mortality rates; transmission rates “after exposure and during delivery increase from 2% in recurrent infection to 25% and 60% in nonprimary and primary infections, respectively,” Dr. Mahant and his colleagues noted.
Over the study period, disease incidence grew from 3.4/10,000 births in 2009 (1/2,941 births) to 5.3/10,000 births in 2015 (1/1,886 births).
Dr. Mahant and his associates noted several limitations in the study that might explain the increase in incidence.
ICD diagnosis codes, which they characterized as imperfect in their ability to correctly identify neonatal HSV infections, may have led researchers to include infants who were not actually infected or (less likely) to have excluded infants who were infected. States participating in the MarketScan Medicaid Database also may have changed over the study period. Incomplete follow-up after hospitalization made it impossible to track infants who had changed insurers, moved to other states, or died during the study. They also cautioned that outcomes may not be transferable to the general population because outcomes were specific to Medicaid enrollees.
The total cost for initial hospitalization and treatments provided during 6 months of follow-up was $60,620,431 ($87,602 median cost per patient) for the cohort of 900 infants. This is significant given that the authors reported a median length of stay of 18 days for initial hospitalization. Of the 846 patients discharged (54, or 6%, died during initial hospitalization), follow-up data was available for 692 (81%). A total of 316 (46%) infants required at least one subsequent visit to the emergency room, and another 112 (16%) experienced at least one hospital readmission.
That Dr. Mahant and his colleagues “observed high health care use and associated payments over the first 6 months, including and after hospitalization for neonatal HSV” suggests that there is a need for comprehensive, coordinated care once neonatal patients receive a diagnosis of HSV.
“Public health strategies that are targeted on disease prevention and early diagnosis and treatment are needed,” they advised.
The authors had no relevant financial disclosures. The study was funded by the National Institutes of Health.
SOURCE: Mahant S et al. Pediatrics. 2019 Mar. doi: 10.1542/peds.2018-3233.
The rise in herpes simplex virus cases among neonates reported by Mahant et al. is significant, but there are other possible explanations that warrant additional research, James Gaensbauer, MD, and Joseph A. Grubenhoff, MD, wrote in an accompanying editorial.
Among those explanations, Dr. Gaensbauer and Dr. Grubenhoff cite recommendations made nationally in 2013 to screen asymptomatic infants who had been exposed to HSV at the time of delivery as one possible factor elevating the number of cases being reported. More widespread use of polymerase chain reaction (PCR)–based diagnostic testing, which is reported to be more sensitive, also could play a role in increasing the number of cases being identified.
As part of a larger diagnostic “conundrum” challenging clinicians, the editorialists noted that, at present, there is no uniform consensus for performing HSV testing and providing empirical treatment. “Current recommendations from the American Academy of Pediatrics identify and emphasize the importance of recognition of the factors associated with increased likelihood of HSV infection but do not specify a more comprehensive (e.g., all febrile infants) strategy.” Stakeholders should build flexibility into their recommended treatment approaches for the benefit of practitioners operating on the front lines, they advised.
Ultimately, if the increase in incidence of neonatal HSV cases proves largely attributable to the changing behaviors of young women, who have been engaging more frequently in oral sex, as Dr. Mahant and his colleagues suggest, further research will be warranted, cautioned Dr. Gaensbauer and Dr. Grubenhoff.
“With their work, the authors contribute further nuance to a complicated and ongoing question: How do we correctly identify all infants with neonatal HSV in a timely manner while avoiding subjecting large numbers of children to unnecessary tests and empirical treatments?” This debate “is likely to be transformed by increasing availability of rapid PCR testing for HSV,” they said.
The “pathway to better clarity will depend on researchers and clinicians such as Mahant et al., who continue to provide important data and ask critical questions,” Dr. Gaensbauer and Dr. Grubenhoff concluded.
Dr. Gaensbauer and Dr. Grubenhoff are affiliated with the Denver Health Medical Center; the Children’s Hospital Colorado, Aurora; and the department of pediatrics at University of Colorado at Denver, Aurora. This is a summarization of their editorial, which accompanied the article by Mahant et al. (Pediatrics. 2019 Mar. doi: 10.1542/peds.2019-0159). They received no external funding and had no relevant financial disclosures.
A 56% increase in neonatal herpes simplex virus (HSV) infection over 7 years was determined as part of a retrospective, multistate, longitudinal cohort study using information collected from the MarketScan Medicaid Database, reported Sanjay Mahant, MD, of the University of Toronto, and his associates.
Comprehensive coordinated care – as well as public health strategies targeting disease prevention, early diagnosis, and treatment – are needed to manage the growing number of neonates diagnosed with HSV, Dr. Mahant and his colleagues said.
A total of 900 newborn Medicaid enrollees aged 0-28 days were chosen from 2,107,124 births for inclusion in the study. All patients, who were diagnosed with HSV infection during hospital admission, were born during Jan. 1, 2009–Dec. 31, 2015.
Susceptibility to primary HSV-1 infection among younger women has been attributed to an increase in oral sex practices over the past 2 decades, which is putting adolescents and young adults at greater risk of genital HSV-1 infection (J Infect Dis. 2007;196[12]:1852-9). As a result, more “primary or nonprimary genital HSV-1 infections among childbearing women” are believed to be the likely cause for the increasing numbers of neonatal HSV cases, the authors speculated, citing a recent study (J Infect Dis. 2014 Feb 1;209[3]:315-7).
HSV, a rare infection typically contracted immediately before or after birth, has both high morbidity and mortality rates; transmission rates “after exposure and during delivery increase from 2% in recurrent infection to 25% and 60% in nonprimary and primary infections, respectively,” Dr. Mahant and his colleagues noted.
Over the study period, disease incidence grew from 3.4/10,000 births in 2009 (1/2,941 births) to 5.3/10,000 births in 2015 (1/1,886 births).
Dr. Mahant and his associates noted several limitations in the study that might explain the increase in incidence.
ICD diagnosis codes, which they characterized as imperfect in their ability to correctly identify neonatal HSV infections, may have led researchers to include infants who were not actually infected or (less likely) to have excluded infants who were infected. States participating in the MarketScan Medicaid Database also may have changed over the study period. Incomplete follow-up after hospitalization made it impossible to track infants who had changed insurers, moved to other states, or died during the study. They also cautioned that outcomes may not be transferable to the general population because outcomes were specific to Medicaid enrollees.
The total cost for initial hospitalization and treatments provided during 6 months of follow-up was $60,620,431 ($87,602 median cost per patient) for the cohort of 900 infants. This is significant given that the authors reported a median length of stay of 18 days for initial hospitalization. Of the 846 patients discharged (54, or 6%, died during initial hospitalization), follow-up data was available for 692 (81%). A total of 316 (46%) infants required at least one subsequent visit to the emergency room, and another 112 (16%) experienced at least one hospital readmission.
That Dr. Mahant and his colleagues “observed high health care use and associated payments over the first 6 months, including and after hospitalization for neonatal HSV” suggests that there is a need for comprehensive, coordinated care once neonatal patients receive a diagnosis of HSV.
“Public health strategies that are targeted on disease prevention and early diagnosis and treatment are needed,” they advised.
The authors had no relevant financial disclosures. The study was funded by the National Institutes of Health.
SOURCE: Mahant S et al. Pediatrics. 2019 Mar. doi: 10.1542/peds.2018-3233.
FROM PEDIATRICS
AAP updates 2019-2020 flu vaccine recommendations to include nasal spray
Although the American Academy of Pediatrics had cited a preference for injected flu vaccines for children during the 2018-2019 flu season, this year’s recommendations say either that or the nasal spray formulation are acceptable, according to a press release. The Centers for Disease Control and Prevention has given similar guidance.
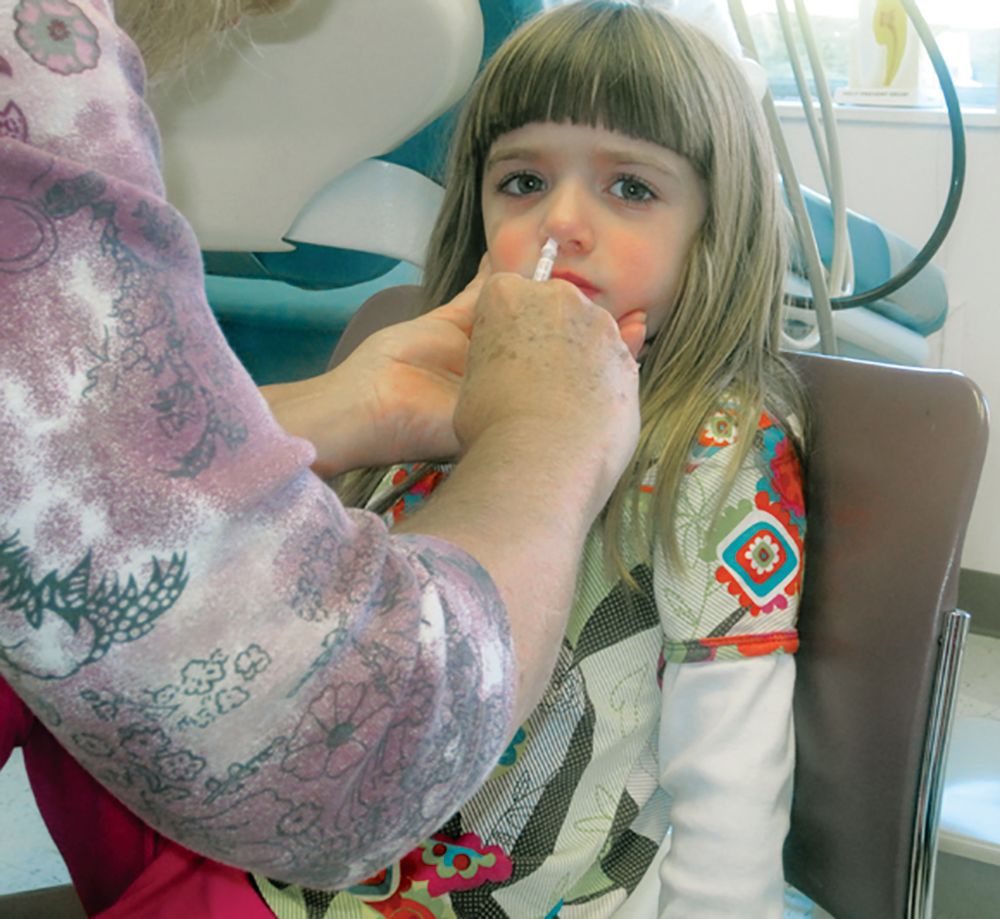
Because the spray did not work as well against A/H1N1 as the injected vaccine had during the 2013-2014 and 2014-2015 seasons, the AAP did not recommend the spray during the 2015-2016 and 2016-2017 seasons. However, in 2017 the spray’s manufacturer included a new strain of A/H1N1, and new data has supported the spray’s effectiveness against some strains.
according to the CDC. That said, the spray is especially appropriate for patients who refuse to receive the injected form, so the choice of formulation is at the pediatrician’s discretion, according to the AAP release.
Although the American Academy of Pediatrics had cited a preference for injected flu vaccines for children during the 2018-2019 flu season, this year’s recommendations say either that or the nasal spray formulation are acceptable, according to a press release. The Centers for Disease Control and Prevention has given similar guidance.
Because the spray did not work as well against A/H1N1 as the injected vaccine had during the 2013-2014 and 2014-2015 seasons, the AAP did not recommend the spray during the 2015-2016 and 2016-2017 seasons. However, in 2017 the spray’s manufacturer included a new strain of A/H1N1, and new data has supported the spray’s effectiveness against some strains.
according to the CDC. That said, the spray is especially appropriate for patients who refuse to receive the injected form, so the choice of formulation is at the pediatrician’s discretion, according to the AAP release.
Antibiotic Overprescribing

Swedish strategies improve survival for premature infants
based on data from a study of two cohorts including 2,205 births at 22-26 weeks’ gestational age.

The impact of the recommendations has not been well studied, wrote Mikael Norman, MD, PhD, of the Karolinska Institutet, Stockholm, and his colleagues in JAMA. To determine the impact, the researchers compared data from 1,009 births at 22-26 weeks’ gestational age during 2004-2007 with 1,196 births at 22-26 weeks’ gestational age during 2014-2016, after the implementation of guidelines on “centralization of care, antenatal corticosteroid treatment, mode of delivery, a neonatologist attending at the birth, and resuscitation of infants delivered at 22, 23, and 24 weeks’ gestational age.”
The 1-year survival increased from 70% during 2004-2007 to 77% during 2014-2016; a significant improvement (P = .003).
In addition, 1-year survival with no major morbidity improved significantly between the two time periods, from 32% to 38%, respectively (P = .008).
The mothers and infants were part of EXPRESS (Extremely Preterm Infants in Sweden Study), a national, population-based, prospective cohort study. In most cases, gestational age was determined by routine antenatal ultrasound early in the second trimester, or by date of embryo transfer in cases of in vitro fertilization. The primary outcome was survival at the age of 1 year; the secondary outcome was survival at 1 year with no major neonatal comorbidity.
Among premature infants who survived at 1 year, some conditions were significantly more prevalent in the earlier birth cohort, compared with the later cohort, notably cystic periventricular leukomalacia (6% vs. 2%), any bronchopulmonary dysplasia (73% vs. 62%), and severe bronchopulmonary dysplasia (25% vs. 14%).
Although the proportion of premature births with a neonatologist attending was similar between the two cohorts, significantly more premature infants were born outside of university hospitals and transported to a level III neonatal ICU after birth during 2004-2007, compared with 2014-2016, the researchers noted.
The study findings were limited by several factors including the retrospective design of the second cohort, inability to account for fetal losses prior to 22 weeks’ gestational age, lack of data on the causes of fetal and infant deaths, potentially unknown confounding variables that impacted infant survival, and the small sample size of some gestational age groups, the researchers noted. However, the results show improvements in 1-year survival in the wake of specific guidelines on perinatal management.
Dr. Norman reported receiving grants from the Swedish Heart Lung Foundation and the H2020/European Union, as well as personal fees from a Swedish medical journal, the Swedish patient insurance, Liber, Studentlitteratur, and AbbVie. The study was funded by the Swedish Order of Freemasons’ Foundation for Children’s Welfare.
SOURCE: Norman M et al. JAMA. 2019;321:1188-99.
The wide variation in outcomes for preterm birth worldwide raise questions as to whether the success seen in Sweden is possible in other countries, Matthew A. Rysavy, MD, PhD, and Danielle E. Y. Ehret, MD, MPH, wrote in an accompanying editorial. Considerations include population demographics, current guidelines, gestational age at which intensive care is offered, and the nature of follow-up care.
Sweden already has low rates of perinatal mortality, and current guidelines call for use of antenatal corticosteroids for births at 22 weeks’ gestation. By contrast, in the United States, antenatal corticosteroids are not recommended until 23-24 weeks’ gestation, they noted.
The editorialists called particular attention to the improvements in survival at 1 year and survival without major morbidity at 22-23 weeks’ gestation. “At 22 weeks’ gestation, the stillbirth rate decreased from 65% of all births during 2004-2007 to 35% during 2014-2016, with a reciprocal increase in live births.”
Although the results are promising, and show the possibilities for improving survival, the editorialists wrote that ongoing follow up of children born prematurely is essential to inform future research, as “much remains unknown about the later-life effects of being born so early and of the therapies used to sustain life after birth.”
Dr. Rysavy is affiliated with the department of pediatrics at the University of Iowa, Iowa City; Dr. Ehret is affiliated with the department of pediatrics at the University of Vermont, Burlington. This is a summary of their editorial accompanying the article by Norman et al. (JAMA. 2019 Mar 26;321:1163-64). They reported no financial conflicts.
based on data from a study of two cohorts including 2,205 births at 22-26 weeks’ gestational age.
The impact of the recommendations has not been well studied, wrote Mikael Norman, MD, PhD, of the Karolinska Institutet, Stockholm, and his colleagues in JAMA. To determine the impact, the researchers compared data from 1,009 births at 22-26 weeks’ gestational age during 2004-2007 with 1,196 births at 22-26 weeks’ gestational age during 2014-2016, after the implementation of guidelines on “centralization of care, antenatal corticosteroid treatment, mode of delivery, a neonatologist attending at the birth, and resuscitation of infants delivered at 22, 23, and 24 weeks’ gestational age.”
The 1-year survival increased from 70% during 2004-2007 to 77% during 2014-2016; a significant improvement (P = .003).
In addition, 1-year survival with no major morbidity improved significantly between the two time periods, from 32% to 38%, respectively (P = .008).
The mothers and infants were part of EXPRESS (Extremely Preterm Infants in Sweden Study), a national, population-based, prospective cohort study. In most cases, gestational age was determined by routine antenatal ultrasound early in the second trimester, or by date of embryo transfer in cases of in vitro fertilization. The primary outcome was survival at the age of 1 year; the secondary outcome was survival at 1 year with no major neonatal comorbidity.
Among premature infants who survived at 1 year, some conditions were significantly more prevalent in the earlier birth cohort, compared with the later cohort, notably cystic periventricular leukomalacia (6% vs. 2%), any bronchopulmonary dysplasia (73% vs. 62%), and severe bronchopulmonary dysplasia (25% vs. 14%).
Although the proportion of premature births with a neonatologist attending was similar between the two cohorts, significantly more premature infants were born outside of university hospitals and transported to a level III neonatal ICU after birth during 2004-2007, compared with 2014-2016, the researchers noted.
The study findings were limited by several factors including the retrospective design of the second cohort, inability to account for fetal losses prior to 22 weeks’ gestational age, lack of data on the causes of fetal and infant deaths, potentially unknown confounding variables that impacted infant survival, and the small sample size of some gestational age groups, the researchers noted. However, the results show improvements in 1-year survival in the wake of specific guidelines on perinatal management.
Dr. Norman reported receiving grants from the Swedish Heart Lung Foundation and the H2020/European Union, as well as personal fees from a Swedish medical journal, the Swedish patient insurance, Liber, Studentlitteratur, and AbbVie. The study was funded by the Swedish Order of Freemasons’ Foundation for Children’s Welfare.
SOURCE: Norman M et al. JAMA. 2019;321:1188-99.
FROM JAMA
AAP, AHA push for policies limiting children’s sugary beverage consumption
Physicians should actively advocate for policies that will reduce children’s consumption of sugar-sweetened beverages and subsequently reduce their risk of obesity, type 2 diabetes and other chronic diseases, urges a new policy statement from the American Academy of Pediatrics and the American Heart Association.

As “the leading source of added sugars in the U.S. diet,” sugary drinks “provide little to no nutritional value, are high in energy density, and do little to increase feelings of satiety,” wrote Natalie D. Muth, MD, MPH, of the University of California, Los Angeles, and the Children’s Primary Care Medical Group in Carlsbad, Calif., and her associates from the AAP’s Section on Obesity, the AAP’s Committee on Nutrition, and the American Heart Association.
Added sugars include sucrose, glucose, high-fructose corn syrup and processed fruit juice (but not naturally occurring fructose or lactose) that are added as sweeteners to food and drink products. In addition to contributing to childhood obesity, consuming drinks with added sugars increases children’s risk for “dental decay, cardiovascular disease, hypertension, dyslipidemia, insulin resistance, type 2 diabetes mellitus, fatty liver disease and all-cause mortality,” the statement noted.
Although less than 10% of individuals’ total calories should come from added sugars, according to the 2015–2020 Dietary Guidelines for Americans, added sugars make up an estimated 17% of U.S. children’s and teens’ average total caloric intake, and sugary drinks comprise almost half of this excess sugar, the statement noted. Consumption is higher and therefore more harmful in several subgroups, particularly those from minority and economically disadvantaged communities.
Previous AAP policy statements have urged doctors to encourage children and teens to drink water instead of high-calorie drinks, such as fruit juice, energy drinks and high-carbohydrate “sports drinks.” But this statement takes a page from success with tobacco control measures and focuses on the need for policy changes at local, state, and federal levels to help to reduce children’s intake of sugary drinks.
The statement makes six major recommendations:
• Excise tax: The AAP and AHA support the use of excise taxes or other means of increasing the cost of sugar-sweetened beverages – alongside an educational campaign to explain the rationale – and apportioning some of the subsequent revenue to addressing health and socioeconomic disparities.
Evidence shows how tobacco and alcohol consumption declined as their prices rose from taxes, and several places that have already implemented a sugary beverage tax have seen similar declines in consumption. Research models suggest an excise tax would potentially prevent 575,000 cases of childhood obesity.
• Reducing advertising/marketing: Research shows that teens, especially low-income and minority teens, are exposed to high amounts of advertising for soft drinks, fruit drinks, energy drinks, and sports drinks. Though such advertising cannot be outright banned without violating free speech, policies can disincentivize such marketing, such as “eliminating the advertising subsidy for nutritionally poor foods and beverages marketed to children” and not allowing in-school marketing.
• Improve existing nutritional assistance programs: WIC, the Child and Adult Care Food Program, school breakfast and lunch programs, and the Supplemental Nutrition Assistance Program (SNAP) vary in how well they discourage sugary drink consumption and can be improved through legislative changes.
• Consumer risk information: The AAP and AHA promote use of clear nutrition labels and menu labeling that explain the sugar content and risks of products, “including warning labels of the health harms of consumption of added sugars” not unlike those on cigarette packages.
• Changing the default: Physicians should advocate for policies that reduce access to sugary drinks and prioritize access to water and similarly healthier options.
• Norm-changing medical industry: Hospitals should implement policies that reduce consumption and/or access to sugary beverages, such as higher prices, less availability and risk-related labeling.
Pediatricians should continue to advise families about the risks of consuming added sugars, the substantial contribution that sugary drinks make to excess sugars in one’s diet, and the need to replace sugar-sweetened beverages with drinking water. Yet pediatricians can go beyond individual recommendations by advocating “for policy change through school boards, school health councils, hospital and medical group boards and committees, outreach to elected representatives and public comment opportunities.”
The statement used no external funding, and the authors had no disclosures or conflicts of interest.
SOURCE: Muth ND et al. Pediatrics. 2019;143(4):e20190282. doi: 10.1542/peds.2019-0282
Make counseling on healthy eating and exercise a priority
Pediatricians daily bear witness to the impact of poor nutrition on the health and quality of life of children. Healthy eating and drinking has long been an expected domain of conversation with children, adolescents and their families. In recent years, counseling regarding the consumption of added sugars, especially those in sugar-sweetened beverages (SSB), has gained traction. Pediatricians are aware of the health risks associated with over-consumption of SSB and that these risks, and consumption of sugary drinks, are more prevalent among the most vulnerable of children, including minorities and those living in low-income communities.

Primary care pediatricians face many demands that compete for time and attention, and time spent counseling on healthy eating and exercise needs to continue to be a priority. AAP-supported initiatives, such as the 5-3-2-1-0 rule – five vegetables and fruits per day, three structured meals, 2 hours or less of screen time, 1 hour or more of physical activity and zero sugary drinks most days – provide simple, clear messaging about limiting of sugary drinks. We should promote drinking of water as first choice, including during sports activities.
Messaging with community partners and on social media maximizes the impact of these important messages. The new AAP guideline “Public Policies to Reduce Sugary Drink Consumption in Children and Adolescents” also advocates for decreasing sugary drink marketing to children and adolescents. Pediatricians are trusted, credible voices who are well-positioned to advocate for an ad-free childhood, including SSB ads.
Melinda Clark, MD, is an associate professor of pediatrics at the Albany (N.Y.) Medical Center, and a MDedge Pediatrics editorial advisory board member. Dr. Clark had no disclosures.
Make counseling on healthy eating and exercise a priority
Pediatricians daily bear witness to the impact of poor nutrition on the health and quality of life of children. Healthy eating and drinking has long been an expected domain of conversation with children, adolescents and their families. In recent years, counseling regarding the consumption of added sugars, especially those in sugar-sweetened beverages (SSB), has gained traction. Pediatricians are aware of the health risks associated with over-consumption of SSB and that these risks, and consumption of sugary drinks, are more prevalent among the most vulnerable of children, including minorities and those living in low-income communities.
Primary care pediatricians face many demands that compete for time and attention, and time spent counseling on healthy eating and exercise needs to continue to be a priority. AAP-supported initiatives, such as the 5-3-2-1-0 rule – five vegetables and fruits per day, three structured meals, 2 hours or less of screen time, 1 hour or more of physical activity and zero sugary drinks most days – provide simple, clear messaging about limiting of sugary drinks. We should promote drinking of water as first choice, including during sports activities.
Messaging with community partners and on social media maximizes the impact of these important messages. The new AAP guideline “Public Policies to Reduce Sugary Drink Consumption in Children and Adolescents” also advocates for decreasing sugary drink marketing to children and adolescents. Pediatricians are trusted, credible voices who are well-positioned to advocate for an ad-free childhood, including SSB ads.
Melinda Clark, MD, is an associate professor of pediatrics at the Albany (N.Y.) Medical Center, and a MDedge Pediatrics editorial advisory board member. Dr. Clark had no disclosures.
Physicians should actively advocate for policies that will reduce children’s consumption of sugar-sweetened beverages and subsequently reduce their risk of obesity, type 2 diabetes and other chronic diseases, urges a new policy statement from the American Academy of Pediatrics and the American Heart Association.
As “the leading source of added sugars in the U.S. diet,” sugary drinks “provide little to no nutritional value, are high in energy density, and do little to increase feelings of satiety,” wrote Natalie D. Muth, MD, MPH, of the University of California, Los Angeles, and the Children’s Primary Care Medical Group in Carlsbad, Calif., and her associates from the AAP’s Section on Obesity, the AAP’s Committee on Nutrition, and the American Heart Association.
Added sugars include sucrose, glucose, high-fructose corn syrup and processed fruit juice (but not naturally occurring fructose or lactose) that are added as sweeteners to food and drink products. In addition to contributing to childhood obesity, consuming drinks with added sugars increases children’s risk for “dental decay, cardiovascular disease, hypertension, dyslipidemia, insulin resistance, type 2 diabetes mellitus, fatty liver disease and all-cause mortality,” the statement noted.
Although less than 10% of individuals’ total calories should come from added sugars, according to the 2015–2020 Dietary Guidelines for Americans, added sugars make up an estimated 17% of U.S. children’s and teens’ average total caloric intake, and sugary drinks comprise almost half of this excess sugar, the statement noted. Consumption is higher and therefore more harmful in several subgroups, particularly those from minority and economically disadvantaged communities.
Previous AAP policy statements have urged doctors to encourage children and teens to drink water instead of high-calorie drinks, such as fruit juice, energy drinks and high-carbohydrate “sports drinks.” But this statement takes a page from success with tobacco control measures and focuses on the need for policy changes at local, state, and federal levels to help to reduce children’s intake of sugary drinks.
The statement makes six major recommendations:
• Excise tax: The AAP and AHA support the use of excise taxes or other means of increasing the cost of sugar-sweetened beverages – alongside an educational campaign to explain the rationale – and apportioning some of the subsequent revenue to addressing health and socioeconomic disparities.
Evidence shows how tobacco and alcohol consumption declined as their prices rose from taxes, and several places that have already implemented a sugary beverage tax have seen similar declines in consumption. Research models suggest an excise tax would potentially prevent 575,000 cases of childhood obesity.
• Reducing advertising/marketing: Research shows that teens, especially low-income and minority teens, are exposed to high amounts of advertising for soft drinks, fruit drinks, energy drinks, and sports drinks. Though such advertising cannot be outright banned without violating free speech, policies can disincentivize such marketing, such as “eliminating the advertising subsidy for nutritionally poor foods and beverages marketed to children” and not allowing in-school marketing.
• Improve existing nutritional assistance programs: WIC, the Child and Adult Care Food Program, school breakfast and lunch programs, and the Supplemental Nutrition Assistance Program (SNAP) vary in how well they discourage sugary drink consumption and can be improved through legislative changes.
• Consumer risk information: The AAP and AHA promote use of clear nutrition labels and menu labeling that explain the sugar content and risks of products, “including warning labels of the health harms of consumption of added sugars” not unlike those on cigarette packages.
• Changing the default: Physicians should advocate for policies that reduce access to sugary drinks and prioritize access to water and similarly healthier options.
• Norm-changing medical industry: Hospitals should implement policies that reduce consumption and/or access to sugary beverages, such as higher prices, less availability and risk-related labeling.
Pediatricians should continue to advise families about the risks of consuming added sugars, the substantial contribution that sugary drinks make to excess sugars in one’s diet, and the need to replace sugar-sweetened beverages with drinking water. Yet pediatricians can go beyond individual recommendations by advocating “for policy change through school boards, school health councils, hospital and medical group boards and committees, outreach to elected representatives and public comment opportunities.”
The statement used no external funding, and the authors had no disclosures or conflicts of interest.
SOURCE: Muth ND et al. Pediatrics. 2019;143(4):e20190282. doi: 10.1542/peds.2019-0282
FROM PEDIATRICS