User login
Click for Credit: Psoriasis relief; Stress & CV problems; more
Here are 5 articles from the October issue of Clinician Reviews (individual articles are valid for one year from date of publication—expiration dates below):
1. Bronchiolitis is a feared complication of connective tissue disease
To take the posttest, go to: https://bit.ly/2klWpRb
Expires April 8, 2020
2. Stress incontinence surgery improves sexual dysfunction
To take the posttest, go to: https://bit.ly/2m0wb71
Expires April 10, 2020
3. Survey finds psoriasis patients seek relief with alternative therapies
To take the posttest, go to: https://bit.ly/2lZZDtO
Expires April 10, 2020
4. New data further suggest that stress does a number on the CV system
To take the posttest, go to: https://bit.ly/2lR31ax
Expires April 11, 2020
5. Rate of objects ingested by young children increased over last two decades
To take the posttest, go to: https://bit.ly/2mmYptb
Expires April 12, 2020

Lumbar spine BMD, bone strength benefits persist after romosozumab-to-alendronate switch
ORLANDO – Patients who took romosozumab for 12 months and then switched to alendronate continued to see benefits in bone mineral density (BMD) of the lumbar spine after 12 months of therapy with alendronate, compared with patients who began taking, and continued to take, alendronate over the same time period, according to findings from a subgroup of the ARCH study presented at the annual meeting of the American Society for Bone and Mineral Research.
“These effects occurred rapidly, as early as month 6, were sustained beyond 12 months after transitioning to alendronate, and are consistent with greater fracture-risk reduction observed in ARCH with romosozumab to alendronate versus alendronate to alendronate,” Jacques P. Brown, MD, FRCPC, of Laval University, Quebec City, said in his presentation.
In the double-blinded ARCH study, 4,093 postmenopausal women with osteoporosis and a previous fracture history were randomized to receive subcutaneous monthly romosozumab 210 mg or oral weekly alendronate 70 mg for 12 months, followed by an open-label period during which romosozumab patients received oral weekly alendronate 70 mg and alendronate patients continued to receive the same dose on the same schedule for an additional 24 months (Saag KG et al. N Eng J Med. 2017 Oct 12. doi: 10.1056/NEJMoa1708322).
Dr. Brown and colleagues performed an imaging substudy of ARCH, which included examining how the romosozumab-to-alendronate and alendronate-only groups improved lumbar spine BMD and lumbar spine bone strength. Lumbar spine BMD was assessed through quantitative CT, and lumbar spine bone strength was measured with finite element analysis. The researchers received quantitative CT images from baseline and at 6 months, 12 months, and 24 months, and determined the percentage change at each of those periods to calculate integral, trabecular, and cortical lumbar spine volumetric BMD (vBMD), and to bone mineral content (BMC). They also measured areal BMD (aBMD) at baseline, 6 months, 12 months, 18 months, and 24 months with dual-energy x-ray absorptiometry.
Overall, 49 romosozumab patients and 41 alendronate patients from the ARCH study were enrolled in the imaging substudy. Of those patients, 76 had vBMD and BMC information available at baseline and one or more time periods post baseline, and 86 patients had finite element analysis data at baseline and one or more postbaseline time periods. Patients in the romosozumab and alendronate groups had similar baseline characteristics with regard to age (73.1 years vs. 72.8 years, respectively), mean lumbar spine BMD T score (–2.82 vs. –3.38), mean total hip BMD T score (–2.65 vs. –2.75), mean femoral neck T score (–2.84 vs. –2.83), mean lumbar spine integral vBMD (130.3 mg/cm3 vs. 120.5 mg/cm3), trabecular vBMD (60.1 mg/cm3 vs. 53.7 mg/cm3) and cortical vBMD (284.6 mg/cm3 vs. 270.9 mg/cm3). Patients in both groups also had similar rates of previous osteoporotic fracture at or after aged 45 years, previous vertebral fracture, and history of hip fracture.
Beginning at 6 months, there were significant least squares mean BMD improvements in both groups, but the romosozumab group had significant improvements in aBMD percentage changes, compared with the alendronate group, which persisted until 24 months (P less than .001 at all time points). Integral, trabecular, and cortical vBMD in the romosozumab group also saw significantly greater increases from baseline, compared with the alendronate group, and those results persisted in the open-label portion of the study for patients in the romosozumab group who transitioned to alendronate and patients in the alendronate to alendronate group (P less than .001 at all time points).
“The rapid and large increases in BMD with romosozumab followed by BMD consolidation where [patients were] transitioning to alendronate, support the important role of romosozumab as a first-line therapy in treating patients who are at very high risk for fracture,” Dr. Brown said.
In regard to BMC, there were larger increases in least squares mean BMC changes from baseline in the cortical compartment than the trabecular compartment, and actual change in bone strength as measured by finite element analysis was highly correlated with integral BMC in the romosozumab group.
Dr. Brown said the study was limited to the small sample size from the imaging substudy of ARCH, and quantitative CT dictated the imaging sites for the substudy, which may have affected patient selection. However, he noted that the characteristics of the ARCH imaging substudy were similar to patients in the overall ARCH study.
Amgen, UCB Pharma, and Astellas Pharma funded the study in part. Amgen and UCB Pharma assisted in the preparation of Dr. Brown’s presentation at ASBMR 2019, including funding costs associated with its development. Dr. Brown and the other coauthors reported relationships with Amgen, UCB Pharma, and other companies in the form of consultancies, grants and research support, speaker’s bureau appointments, paid employment, and stock options.
SOURCE: Brown JP et al. ASBMR 2019, Abstract 1050.
REPORTING FROM ASBMR 2019
Secondary prevention of osteoporotic fractures lacking
The report by independent actuarial firm Milliman examined the economic and clinical burden of new osteoporotic fractures in 2015 in the Medicare fee-for-service population, with data from a large medical claims database.
More than 10 million adults aged 50 years and older in the United States are thought to have osteoporosis, and 43.9% of adults are affected by low bone mass.
This report found that about 1.4 million Medicare fee-for-service beneficiaries experienced more than 1.6 million osteoporotic fractures in that year, which if extrapolated to include Medicare Advantage beneficiaries would increase to a total of 2.3 million fractures in 2 million individuals.
The most common types of fractures were of the spine (23%) and hip (17%), although the authors noted that the spinal fracture figure did not account for potential underdiagnosis of vertebral fractures.
Women had a 79% higher rate of osteoporotic fractures than that of men, and one-third of people who experienced at least one osteoporotic fracture were aged 74-85 years.
Dane Hansen and colleagues from Milliman from drew particular attention to the lack of secondary prevention in people who had experienced a first osteoporotic fracture. They estimated that 15% of those who had a new osteoporotic fracture experienced one or more subsequent fractures within 12 months, yet only 9% of women received a bone mineral density test within 6 months to evaluate them for osteoporosis.
Overall, 21% of individuals who had a new osteoporotic fracture underwent bone mineral density testing during the fracture episode.
The authors pointed out that their analysis wasn’t able to look at pharmaceutical treatment, and so did not present “a full picture of the overall rate of BMD [bone mineral density] testing and appropriate treatment after a fracture for surviving patients.”
Nearly one in five Medicare beneficiaries experienced at least one new pressure ulcer during the fracture episode, and beneficiaries with osteoporotic fracture were two times more likely than were other Medicare beneficiaries to experience pressure ulcers. “This is significant because research has found that pressure ulcers are clinically difficult and expensive to manage,” the authors wrote. They also saw that nearly 20% of Medicare beneficiaries who experienced an osteoporotic fracture died within 12 months, with the highest mortality (30%) seen in those with hip fracture.
Osteoporotic fractures presented a significant cost burden, with 45% of beneficiaries having at least one acute inpatient hospital stay within 30 days of having a new osteoporotic fracture. The hospitalization rate was as high as 92% for individuals with hip fracture, while 11% of those with wrist fractures were hospitalized within 7 days of the fracture.
The annual allowed medical costs in the 12 months after a new fracture were more than twice the costs of the 12-month period before the fracture in the same individual, and each new fracture was associated with an incremental annual medical cost greater than $21,800.
“An osteoporotic fracture is a sentinel event that should trigger appropriate clinical attention directed to reducing the risk of future subsequent fractures,” the authors said. “Therefore, the months following an osteoporotic fracture, in which the risk of a subsequent fracture is high, provide an important opportunity to identify and treat osteoporosis and to perform other interventions, such as patient education and care coordination, in order to reduce the individual’s risk of a subsequent fracture.”
The report estimated that preventing 5% of subsequent osteoporotic fractures could have saved the Medicare program $310 million just in the 2-3 years after a new fracture, while preventing 20% of subsequent fractures could have saved $1,230 million. These figures included the cost of the additional bone mineral density testing, but did not account for the increased costs of treatment or fracture prevention.
“In future analysis, it will be important to net the total cost of the intervention and additional pharmaceutical treatment for osteoporosis against Medicare savings from avoided subsequent fractures to comprehensively measure the savings from secondary fracture prevention initiatives.”
SOURCE: Milliman Research Report, “Medicare Report of Osteoporotic Fractures,” August 2019.
FROM THE NATIONAL OSTEOPOROSIS FOUNDATION
U.S. increases in RA burden outpace global averages
according to a new analysis of RA activity in 195 countries.
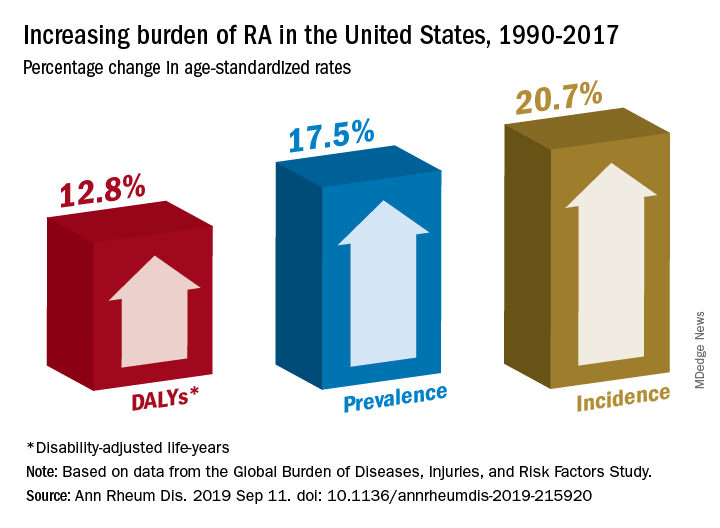
Percentage changes in the incidence, prevalence, and disability-adjusted life-year (DALY) rates for RA all reached double digits in the United States over the study period, but global increases for those measures stayed in the single digits, except for DALY, which did not increase, Saeid Safiri, PhD, of Tabriz (Iran) University of Medical Sciences and associates wrote in Annals of the Rheumatic Diseases.
Data from the Global Burden of Diseases, Injuries, and Risk Factors Study (GBD) 2017 show that RA incidence in the United States had the largest increase (20.7%) among the three measures, rising from 19.3 cases per 100,000 population in 1990 to 23.4 in 2017. Overall incidence for the 195 countries included in the study went from 13.7 to 14.9 cases per 100,000, for an increase of 8.2%, the investigators reported.
That pattern largely repeats for prevalence: an increase of 17.5% in the United States as the number of cases went from 336.5 per 100,000 in 1990 to 395.5 in 2017, and an increase of 7.4% globally, with the number of prevalent cases rising from 229.6 to 246.5 per 100,000, they said.
The DALY numbers – think of each DALY as 1 lost year of “healthy” life, the World Health Organization says – tell a somewhat different story. The United States had DALY rate of 53.2 per 100,000 in 1990, but by 2017 it had climbed to 60 per 100,000, an increase of 12.8%. Over that same time period, the global rate fell by 3.6% as it went from 44.9 to 43.3, Dr. Safiri and associates reported.
That long-term decline does, however, disguise a more recent trend. The global DALY rate “decreased from 1990 to 2012 but then increased and reached higher than expected levels in the following 5 years to 2017,” they wrote.
RA rates in the United States in 2017 were, as noted, above average, but they were not the highest. The United Kingdom achieved the RA trifecta of highest incidence (27.5 per 100,000), highest prevalence (471.8 per 100,000), and highest DALY rate (73 per 100,000) among the 195 countries in the study. At the other end of the three scales, Indonesia had the lowest incidence (5.6 per 100,000) and prevalence (91.1 per 100,000), and Sri Lanka had the lowest DALY rate (14.2 per 100,000), they said.
“Age-standardized prevalence and incidence rates are overall increasing globally. Increasing population awareness regarding RA, its risk factors and the importance of early diagnosis and treatment with disease-modifying agents is warranted to reduce the future burden of this condition,” the research team concluded.
GBD is funded by the Bill and Melinda Gates Foundation. The current analysis also was supported by Social Determinants of Health Research Center, Shahid Beheshti University of Medical Sciences in Tehran, Iran. The investigators did not declare any conflicts of interest.
SOURCE: Safiri S et al. Ann Rheum Dis. 2019 Sep 11. doi: 10.1136/annrheumdis-2019-215920.
according to a new analysis of RA activity in 195 countries.
Percentage changes in the incidence, prevalence, and disability-adjusted life-year (DALY) rates for RA all reached double digits in the United States over the study period, but global increases for those measures stayed in the single digits, except for DALY, which did not increase, Saeid Safiri, PhD, of Tabriz (Iran) University of Medical Sciences and associates wrote in Annals of the Rheumatic Diseases.
Data from the Global Burden of Diseases, Injuries, and Risk Factors Study (GBD) 2017 show that RA incidence in the United States had the largest increase (20.7%) among the three measures, rising from 19.3 cases per 100,000 population in 1990 to 23.4 in 2017. Overall incidence for the 195 countries included in the study went from 13.7 to 14.9 cases per 100,000, for an increase of 8.2%, the investigators reported.
That pattern largely repeats for prevalence: an increase of 17.5% in the United States as the number of cases went from 336.5 per 100,000 in 1990 to 395.5 in 2017, and an increase of 7.4% globally, with the number of prevalent cases rising from 229.6 to 246.5 per 100,000, they said.
The DALY numbers – think of each DALY as 1 lost year of “healthy” life, the World Health Organization says – tell a somewhat different story. The United States had DALY rate of 53.2 per 100,000 in 1990, but by 2017 it had climbed to 60 per 100,000, an increase of 12.8%. Over that same time period, the global rate fell by 3.6% as it went from 44.9 to 43.3, Dr. Safiri and associates reported.
That long-term decline does, however, disguise a more recent trend. The global DALY rate “decreased from 1990 to 2012 but then increased and reached higher than expected levels in the following 5 years to 2017,” they wrote.
RA rates in the United States in 2017 were, as noted, above average, but they were not the highest. The United Kingdom achieved the RA trifecta of highest incidence (27.5 per 100,000), highest prevalence (471.8 per 100,000), and highest DALY rate (73 per 100,000) among the 195 countries in the study. At the other end of the three scales, Indonesia had the lowest incidence (5.6 per 100,000) and prevalence (91.1 per 100,000), and Sri Lanka had the lowest DALY rate (14.2 per 100,000), they said.
“Age-standardized prevalence and incidence rates are overall increasing globally. Increasing population awareness regarding RA, its risk factors and the importance of early diagnosis and treatment with disease-modifying agents is warranted to reduce the future burden of this condition,” the research team concluded.
GBD is funded by the Bill and Melinda Gates Foundation. The current analysis also was supported by Social Determinants of Health Research Center, Shahid Beheshti University of Medical Sciences in Tehran, Iran. The investigators did not declare any conflicts of interest.
SOURCE: Safiri S et al. Ann Rheum Dis. 2019 Sep 11. doi: 10.1136/annrheumdis-2019-215920.
FROM ANNALS OF THE RHEUMATIC DISEASES
High-dose teriparatide tops standard dose in boosting BMD in postmenopausal women
A high dose of teriparatide in combination with denosumab increases bone mineral density (BMD) in postmenopausal women with osteoporosis to a greater extent than a lower-dose regimen.
The latest findings suggest that high-dose teriparatide “stimulates even greater separation between bone resorption and formation than that of standard-dose teriparatide,” wrote Joy N. Tsai, MD, of Harvard Medical School, Boston, and her coauthors in Lancet Diabetes & Endocrinology.
Previously, findings from the Denosumab and Teriparatide Administration (DATA) study showed that a combination of teriparatide and denosumab increased both BMD and estimated bone strength more than either drug alone. To determine if a higher dose of teriparatide plus denosumab would result in larger increases in BMD, investigators in the DATA-HD study randomly assigned 76 postmenopausal women with osteoporosis to receive either 40 μg of teriparatide daily (higher dose; n = 37) or 20 μg of teriparatide daily (standard dose; n = 39). At 3 months, patients in both groups were also started on 60 mg of denosumab every 6 months. Of the initial participants, 69 completed at least one postbaseline visit and were included in the analysis.
At the 15-month follow-up, areal BMD (aBMD) had increased in both groups in all measured sites – lumbar spine, femoral neck, total hip, and distal radius. Patients in the 40-μg group had a significantly higher increase in mean lumbar spine aBMD (17.5%), compared with those in the 20-μg or standard-dose group (9.5%; 95% confidence interval, 5.5-10.6; P less than .0001).
There was also a greater increase in mean femoral neck aBMD in patients in the 40-μg group (6.8%), compared with those in the 20-μg group (4.3; 95% CI, 0.5-4.5; P = .04) and in mean total hip aBMD (6.1% vs. 3.9%, 95% CI; 0.6-3.8, P less than .0001).
In all, 29 participants in the 40-μg group (78%) and 30 participants in the 20-μg group (77%) had adverse events, but with the exceptions of headache and rash, all serious adverse events were considered unrelated to treatment.
The authors noted the limitations of their study, including that it was conducted at a single site with a predominantly white population. In addition, the authors acknowledged that the small sample size did not allow for “direct assessment of fracture benefit [or] for rigorous evaluation of the tolerability and safety of this treatment.”
In an accompanying editorial, Sundeep Khosla, MD, of the Mayo Clinic, Rochester, Minn., wrote that the benefits of personalizing treatment for osteoporosis patients at high risk of fracture seemed to be coming into focus (Lancet Diabetes Endocrinol. 2019 Aug 22. doi: 10.1016/S2213-8587(19)30266-9).
Although the DATA and DATA-HD studies of teriparatide and denosumab reported by Dr. Tsai and colleagues have their limitations – including a small sample size for DATA-HD – they indicate the “possibility of refining treatment for patients with osteoporosis at high risk of fracture and personalizing treatment for these patients beyond the one-size-fits-all approach currently used,” Dr. Khosla wrote. Rather than offer bisphosphonates at standardized doses, patients at high risk could now be considered for the newly recommended high-dose teriparatide and denosumab combination, he said.
Dr. Khosla also noted that price remains an issue, given the estimated cost of $76,000 for 15 months of this proposed combination. However, the benefits in regard to at least bone mineral density are clear, he added, and that might prove sufficient enough for high-risk patients in need of an alternative therapy.
The study was supported by the Dart Family Foundation, the National Institutes of Health, and the National Institute of Arthritis and Musculoskeletal and Skin Diseases. Eli Lilly and Amgen supplied the drugs. The authors reported numerous conflicts of interest, including receiving grants, reimbursements, and personal fees from various pharmaceutical companies, committees, and research institutes. Dr. Khosla reported no conflicts of interest.
SOURCE: Tsai JN et al. Lancet Diabetes Endocrinol. 2019 Aug 22. doi: 10.1016/S2213-8587(19)30255-4.
FROM LANCET DIABETES & ENDOCRINOLOGY
Long-term advantages may not endure after early tight control in psoriatic arthritis
, based on data from 110 patients in the TIght COntrol of inflammation in early Psoriatic Arthritis (TICOPA) study.

In the original study, significantly more adults with psoriatic arthritis (PsA) who were randomized to a tight control, treat-to-target group achieved minimal disease activity criteria after 48 weeks, compared with a standard care group (40% vs. 25%).
“Following exit from this study, we hypothesized that this advantage would translate to a clinical advantage in the medium term,” wrote Laura C. Coates, MBChB, PhD, of the University of Oxford (England) and colleagues.
In a study published in Rheumatology, the researchers examined data from 54 patients in the tight control arm of TICOPA and 56 patients in the standard care arm.
At 5 years after the completion of the TICOPA study, 69% of patients in the tight control group and 76% of patients in the standard care group were considered to be in low disease activity. In addition, methotrexate use after 5 years was similar between the tight control and standard care groups (44% and 54%, respectively) and both groups had reduced methotrexate use since the study’s end.
Overall use of biologic drugs was similar between the tight control and standard care groups after 5 years (54% and 52%, respectively), although overall use of biologics was higher in the tight control group at the end of the original study, compared with the standard care group (33% vs. 9%).
The findings were limited by several factors, notably the lack of intention to continue treatment or observations beyond the end of the original TICOPA study, and the patients’ status at 5 years was based on routine clinician notes with no formal assessment of minimal disease activity or objective measure of disease status, the researchers noted.
However, “this result reflects clinical practice in routine rheumatology care,” and any benefit of early tight control on later disease activity could not be determined, they added.
The current study was funded by the National Institute for Health Research infrastructure at Leeds and Oxford (England). The original TICOPA study was funded by Arthritis Research UK (now called Versus Arthritis) and Pfizer. Some of the investigators disclosed financial relationships with companies that market drugs for PsA.
SOURCE: Coates LC et al. Rheumatology. 2019 Aug 31. doi: 10.1093/rheumatology/kez369.
, based on data from 110 patients in the TIght COntrol of inflammation in early Psoriatic Arthritis (TICOPA) study.
In the original study, significantly more adults with psoriatic arthritis (PsA) who were randomized to a tight control, treat-to-target group achieved minimal disease activity criteria after 48 weeks, compared with a standard care group (40% vs. 25%).
“Following exit from this study, we hypothesized that this advantage would translate to a clinical advantage in the medium term,” wrote Laura C. Coates, MBChB, PhD, of the University of Oxford (England) and colleagues.
In a study published in Rheumatology, the researchers examined data from 54 patients in the tight control arm of TICOPA and 56 patients in the standard care arm.
At 5 years after the completion of the TICOPA study, 69% of patients in the tight control group and 76% of patients in the standard care group were considered to be in low disease activity. In addition, methotrexate use after 5 years was similar between the tight control and standard care groups (44% and 54%, respectively) and both groups had reduced methotrexate use since the study’s end.
Overall use of biologic drugs was similar between the tight control and standard care groups after 5 years (54% and 52%, respectively), although overall use of biologics was higher in the tight control group at the end of the original study, compared with the standard care group (33% vs. 9%).
The findings were limited by several factors, notably the lack of intention to continue treatment or observations beyond the end of the original TICOPA study, and the patients’ status at 5 years was based on routine clinician notes with no formal assessment of minimal disease activity or objective measure of disease status, the researchers noted.
However, “this result reflects clinical practice in routine rheumatology care,” and any benefit of early tight control on later disease activity could not be determined, they added.
The current study was funded by the National Institute for Health Research infrastructure at Leeds and Oxford (England). The original TICOPA study was funded by Arthritis Research UK (now called Versus Arthritis) and Pfizer. Some of the investigators disclosed financial relationships with companies that market drugs for PsA.
SOURCE: Coates LC et al. Rheumatology. 2019 Aug 31. doi: 10.1093/rheumatology/kez369.
FROM RHEUMATOLOGY
Key clinical point: Patients in a psoriatic arthritis study comparing tight control and standard care showed no significant difference in disease activity 5 years later.
Major finding: At 5 years after the end of the TICOPA trial, 69% in the tight control group vs. 76% in the standard care group were considered to be in low disease activity.
Study details: The data come from a follow-up of 110 patients from the TIght COntrol of inflammation in early Psoriatic Arthritis (TICOPA) study.
Disclosures: The current study was funded by the National Institute for Health Research infrastructure at Leeds and Oxford (England). The original TICOPA study was funded by Arthritis Research UK (now called Versus Arthritis) and Pfizer. Some of the investigators disclosed financial relationships with companies that market drugs for PsA.
Source: Coates LC et al. Rheumatology. 2019 Aug 31. doi: 10.1093/rheumatology/kez369.
Two uveitis treatment options yield similar success
in an international, multicenter, open-label, randomized trial.
“The findings of this trial have implications for clinical practice because they provide scientific justification that mycophenolate mofetil is not more effective than methotrexate as a corticosteroid-sparing immunosuppressive therapy for uveitis,” wrote S.R. Rathinam, MD, PhD, of Aravind Eye Hospital and Postgraduate Institute of Ophthalmology, Madurai, India, and colleagues.
Although corticosteroid therapy is the first-line treatment for uveitis, adverse effects limit long-term use. Mycophenolate mofetil and methotrexate are options for corticosteroid-sparing immunosuppressive therapy for uveitis, but their effectiveness has not been compared until the current study, they said.
In the First-line Antimetabolites as Steroid-sparing Treatment (FAST) trial published Sept. 10 in JAMA, the researchers randomized 216 adults with uveitis (a total of 407 eyes with uveitis) to 25 mg of weekly oral methotrexate or 1.5 g of twice-daily oral mycophenolate mofetil at nine referral eye care centers in India, the United States, Australia, Saudi Arabia, and Mexico; the investigators were masked to the treatment assignment.
Patients with treatment success continued taking their randomized medication for another 6 months. If treatment failed, patients switched to the other antimetabolite with another 6-month follow-up. Overall, 84%-93% in each group had bilateral uveitis. Forty-six patients (21%) had intermediate uveitis only or anterior uveitis and intermediate uveitis, and 170 patients (79%) had posterior uveitis or panuveitis. The median age of the patients was 36 years in the methotrexate group and 41 years in the mycophenolate group; other demographic characteristics were similar between the groups.
Overall, 64 patients given methotrexate (67%) and 56 of those given mycophenolate (57%) achieved treatment success at 6 months. Treatment success included inflammation control defined as “less than or equal to 0.5+ anterior chamber cells by Standardization of Uveitis Nomenclature criteria, less than or equal to 0.5+ vitreous haze clinical grading using the National Eye Institute scale, and no active retinal or choroidal lesions,” as well as needing no more than 7.5 mg of prednisone daily and two drops or less of prednisolone acetate 1% per day, and reporting no intolerability or safety concerns requiring study discontinuation.
Adverse events were similar between the groups. The most common nonserious adverse events were fatigue and headaches, and the most common nonserious laboratory adverse event was elevated liver enzymes. Fourteen serious adverse events occurred during the study period; three in the methotrexate group and two in the mycophenolate group were deemed drug related and all were elevated liver function tests.
The study findings had several limitations, including lack of masking of the patients to the medication and an inability to compare between types of uveitis, the researchers noted. Avenues for further research include whether one of the drugs is more effective based on the uveitis subtype, they added.
The study was supported in part by the National Eye Institute and study drugs were provided by the University of California San Francisco Pharmacy. Dr. Rathinam disclosed grants from Aravind Eye Hospital, and several coauthors disclosed relationships with AbbVie, Allergan, Novartis, Novotech, and Bayer.
SOURCE: Rathinam SR et al. JAMA. 2019;322(10):936-45. doi: 10.1001/jama.2019.12618.
FROM JAMA
Key clinical point: Mycophenolate mofetil and methotrexate were similar as corticosteroid-sparing treatment in patients with uveitis.
Major finding: Among uveitis patients, 67% of those given methotrexate and 57% of those given mycophenolate achieved corticosteroid-sparing control of inflammation.
Study details: The data come from a randomized trial of 216 adults with noninfectious uveitis at nine referral eye care centers in India, the United States, Australia, Saudi Arabia, and Mexico.
Disclosures: The study was supported in part by the National Eye Institute and study drugs were provided by the University of California San Francisco Pharmacy. Dr. Rathinam disclosed grants from Aravind Eye Hospital, and several coauthors disclosed relationships with AbbVie, Allergan, Novartis, Novotech, and Bayer.
Source: Rathinam SR et al. JAMA. 2019;322(10):936-45. doi: 10.1001/jama.2019.12618.
FDA approves nintedanib for scleroderma interstitial lung disease
The Food and Drug Administration has approved nintedanib (Ofev) for the rare but sometimes deadly form of interstitial lung disease that’s caused by systemic sclerosis, or scleroderma.

Although scleroderma itself is rare, half of those patients present with scleroderma-related interstitial lung disease (SSc-ILD), and it remains the leading cause of death in scleroderma patients because it can lead to loss of pulmonary function. Nintedanib appears to slow the progress of SSc-ILD and is the first treatment approved for it, according to a news release from the FDA.
The approval is based on a randomized, double-blind, placebo-controlled trial of 576 patients aged 20-79 years with SSc-ILD. The primary efficacy endpoint was forced vital capacity, and patients on nintedanib showed less decline than did those on placebo.
The most frequent serious adverse event reported in this trial was pneumonia (2.8% with nintedanib vs. 0.3% with placebo). Adverse reactions that led to permanent dose reductions occurred in 34% of nintedanib patients and 4% of placebo-treated patients; the most common of these was diarrhea.
The full prescribing information, which is available on the FDA website, includes warnings for patients with moderate to severe hepatic impairment, elevated liver enzymes, and drug-induced liver injury, as well as those with gastrointestinal disorders. Nintedanib may cause embryo-fetal toxicity, so women of childbearing age should be counseled to avoid pregnancy while taking this drug.
Nintedanib received both Priority Review and Orphan Drug designation. The former meant the FDA intends to take action on the application within 6 months because the agency has determined that, if approved, it would have important effects on treatment of a serious condition. The latter provides incentives to assist and encourage development of drugs for rare diseases. The drug was approved in 2014 for adult patients with idiopathic pulmonary fibrosis, another interstitial lung disease.
The full release is available on the FDA website.
The Food and Drug Administration has approved nintedanib (Ofev) for the rare but sometimes deadly form of interstitial lung disease that’s caused by systemic sclerosis, or scleroderma.
Although scleroderma itself is rare, half of those patients present with scleroderma-related interstitial lung disease (SSc-ILD), and it remains the leading cause of death in scleroderma patients because it can lead to loss of pulmonary function. Nintedanib appears to slow the progress of SSc-ILD and is the first treatment approved for it, according to a news release from the FDA.
The approval is based on a randomized, double-blind, placebo-controlled trial of 576 patients aged 20-79 years with SSc-ILD. The primary efficacy endpoint was forced vital capacity, and patients on nintedanib showed less decline than did those on placebo.
The most frequent serious adverse event reported in this trial was pneumonia (2.8% with nintedanib vs. 0.3% with placebo). Adverse reactions that led to permanent dose reductions occurred in 34% of nintedanib patients and 4% of placebo-treated patients; the most common of these was diarrhea.
The full prescribing information, which is available on the FDA website, includes warnings for patients with moderate to severe hepatic impairment, elevated liver enzymes, and drug-induced liver injury, as well as those with gastrointestinal disorders. Nintedanib may cause embryo-fetal toxicity, so women of childbearing age should be counseled to avoid pregnancy while taking this drug.
Nintedanib received both Priority Review and Orphan Drug designation. The former meant the FDA intends to take action on the application within 6 months because the agency has determined that, if approved, it would have important effects on treatment of a serious condition. The latter provides incentives to assist and encourage development of drugs for rare diseases. The drug was approved in 2014 for adult patients with idiopathic pulmonary fibrosis, another interstitial lung disease.
The full release is available on the FDA website.
Which oral nonopioid agents are most effective for OA pain?
EVIDENCE SUMMARY
All NSAIDs at maximum clinical doses reduced large joint OA pain more effectively than placebo and acetaminophen based on data from a network meta-analysis of 129 RCTs with 32,129 patients (TABLE 1).1 When various doses of NSAIDs are ranked for efficacy based on their effect size compared to placebo, diclofenac 150 mg/d had the greatest treatment effect, followed by ibuprofen 2400 mg/d.2 Lower doses of NSAIDs—including diclofenac 70 mg/d, naproxen 750 mg/d, and ibuprofen 1200 mg/d—were not statistically superior to placebo (TABLE 2).2

Selective vs nonselective. There was no statistical difference in pain relief between the selective COX-2 inhibitor celecoxib and the nonselective NSAIDs naproxen, diclofenac, and ibuprofen (TABLE 1).1

Meloxicam. A systematic review of 16 RCTs and 22,886 patients found that meloxicam reduced pain more effectively than placebo (10-point visual analogue scale [VAS] score pain difference of –6.8; 95% CI, –9.3 to –4.2) but was marginally less effective than other NSAIDs (VAS score pain difference of 1.7; 95% CI, 0.8 to 2.7).3
Acetaminophen. Data from 6 RCTs involving 2083 adults with knee OA indicate acetaminophen did not achieve clinical significance compared to placebo (TABLE 1).1 Another meta-analysis of 5 RCTs involving 1741 patients with hip or knee OA also demonstrated that acetaminophen failed to achieve a clinically significant effect on pain, defined as a reduction of 9 mm on a 0 to 100 mm VAS (–3.7; 95% CI, –5.5 to –1.9).4 Another network meta-analysis of 6 RCTs including 58,556 patients with knee or hip OA, with the primary outcome of pain (using a hierarchy of pain scores, with global pain score taking precedence) also found no clinically significant difference between acetaminophen at the highest dose (4000 mg/d) and placebo (–0.17; 95% credible interval [CrI], –0.27 to –0.6).2
RECOMMENDATIONS
In a systematic review of mixed evidence-based and expert opinion recommendations and guidelines on the management of OA, 10 of the 11 guidelines that included pharmacologic management recommended acetaminophen as a first-line agent, followed by topical NSAIDs, and then oral NSAIDs. The exception is the most recent American Academy of Orthopaedic Surgeons guideline, which continues to recommend NSAIDs but is now unable to recommend for or against acetaminophen.5
1. Bannuru RR, Schmid CH, Kent DM, et al. Comparative effectiveness of pharmacologic interventions for knee osteoarthritis: a systematic review and network meta-analysis. Ann Intern Med. 2015;162:46-54.
2. da Costa BR, Reichenbach S, Keller N, et al. Effectiveness of non-steroidal anti-inflammatory drugs for the treatment of pain in knee and hip osteoarthritis: a network meta-analysis. Lancet. 2017;390:e23-e33.
3. Chen YF, Jobanputra P, Barton P, et al. Cyclooxygenase-2 selective non-steroidal anti-inflammatory drugs (etodolac, meloxicam, celecoxib, rofecoxib, etoricoxib, valdecoxib and lumiracoxib) for osteoarthritis and rheumatoid arthritis: a systematic review and economic evaluation. Health Technol Assess. 2008;12:1-278, iii.
4. Machado GC, Maher CG, Ferreira PH, et al. Efficacy and safety of paracetamol for spinal pain and osteoarthritis: systematic review and meta-analysis of randomised placebo controlled trials. BMJ. 2015;350:h1225.
5. Nelson AE, Allen KD, Golightly YM, et al. A systematic review of recommendations and guidelines for the management of osteoarthritis: The Chronic Osteoarthritis Management Initiative of the U.S. Bone and Joint Initiative. Semin Arthritis Rheum. 2014;43:701-712.
EVIDENCE SUMMARY
All NSAIDs at maximum clinical doses reduced large joint OA pain more effectively than placebo and acetaminophen based on data from a network meta-analysis of 129 RCTs with 32,129 patients (TABLE 1).1 When various doses of NSAIDs are ranked for efficacy based on their effect size compared to placebo, diclofenac 150 mg/d had the greatest treatment effect, followed by ibuprofen 2400 mg/d.2 Lower doses of NSAIDs—including diclofenac 70 mg/d, naproxen 750 mg/d, and ibuprofen 1200 mg/d—were not statistically superior to placebo (TABLE 2).2
Selective vs nonselective. There was no statistical difference in pain relief between the selective COX-2 inhibitor celecoxib and the nonselective NSAIDs naproxen, diclofenac, and ibuprofen (TABLE 1).1
Meloxicam. A systematic review of 16 RCTs and 22,886 patients found that meloxicam reduced pain more effectively than placebo (10-point visual analogue scale [VAS] score pain difference of –6.8; 95% CI, –9.3 to –4.2) but was marginally less effective than other NSAIDs (VAS score pain difference of 1.7; 95% CI, 0.8 to 2.7).3
Acetaminophen. Data from 6 RCTs involving 2083 adults with knee OA indicate acetaminophen did not achieve clinical significance compared to placebo (TABLE 1).1 Another meta-analysis of 5 RCTs involving 1741 patients with hip or knee OA also demonstrated that acetaminophen failed to achieve a clinically significant effect on pain, defined as a reduction of 9 mm on a 0 to 100 mm VAS (–3.7; 95% CI, –5.5 to –1.9).4 Another network meta-analysis of 6 RCTs including 58,556 patients with knee or hip OA, with the primary outcome of pain (using a hierarchy of pain scores, with global pain score taking precedence) also found no clinically significant difference between acetaminophen at the highest dose (4000 mg/d) and placebo (–0.17; 95% credible interval [CrI], –0.27 to –0.6).2
RECOMMENDATIONS
In a systematic review of mixed evidence-based and expert opinion recommendations and guidelines on the management of OA, 10 of the 11 guidelines that included pharmacologic management recommended acetaminophen as a first-line agent, followed by topical NSAIDs, and then oral NSAIDs. The exception is the most recent American Academy of Orthopaedic Surgeons guideline, which continues to recommend NSAIDs but is now unable to recommend for or against acetaminophen.5
1. Bannuru RR, Schmid CH, Kent DM, et al. Comparative effectiveness of pharmacologic interventions for knee osteoarthritis: a systematic review and network meta-analysis. Ann Intern Med. 2015;162:46-54.
2. da Costa BR, Reichenbach S, Keller N, et al. Effectiveness of non-steroidal anti-inflammatory drugs for the treatment of pain in knee and hip osteoarthritis: a network meta-analysis. Lancet. 2017;390:e23-e33.
3. Chen YF, Jobanputra P, Barton P, et al. Cyclooxygenase-2 selective non-steroidal anti-inflammatory drugs (etodolac, meloxicam, celecoxib, rofecoxib, etoricoxib, valdecoxib and lumiracoxib) for osteoarthritis and rheumatoid arthritis: a systematic review and economic evaluation. Health Technol Assess. 2008;12:1-278, iii.
4. Machado GC, Maher CG, Ferreira PH, et al. Efficacy and safety of paracetamol for spinal pain and osteoarthritis: systematic review and meta-analysis of randomised placebo controlled trials. BMJ. 2015;350:h1225.
5. Nelson AE, Allen KD, Golightly YM, et al. A systematic review of recommendations and guidelines for the management of osteoarthritis: The Chronic Osteoarthritis Management Initiative of the U.S. Bone and Joint Initiative. Semin Arthritis Rheum. 2014;43:701-712.
EVIDENCE-BASED ANSWER:
Nonsteroidal anti-inflammatory drugs (NSAIDs), when used at the maximum clinically effective dose, reduce osteoarthritis (OA) pain in large joints more effectively than either placebo or acetaminophen (strength of recommendation [SOR]: A, network meta-analysis of randomized controlled trials [RCTs]).
When ranked for efficacy, diclofenac 150 mg/d was the most effective (SOR: A, network meta-analysis of RCTs). The selective COX-2 inhibitors, such as celecoxib, are not more effective at reducing pain than the nonselective NSAIDs (SOR: A, meta-analysis of RCTs). Meloxicam is superior to placebo but marginally inferior to other NSAIDs (SOR: A, systematic review of RCTs).
Acetaminophen is no more effective than placebo (SOR: A, meta-analysis of RCTs).

Modifiable risk factors account for many gout cases
Four modifiable lifestyle risk factors account for a substantial proportion of gout cases in the United States, suggesting greater public health efforts could reduce the frequency of the condition, according to a paper published Sept. 4 in Arthritis & Rheumatology.

Hyon K. Choi, MD, DrPH, of the department of medicine at Massachusetts General Hospital, Boston, and his coauthors analyzed data from 14,624 adults involved in the third National Health and Nutrition Examination Survey. From this, they calculated prevalence ratios for hyperuricemia, the population attributable risks, and the variance associated with the risk factors of body mass index, alcohol intake, nonadherence to a Dietary Approaches to Stop Hypertension (DASH) diet, and diuretic use.
They found that 21% of men and 19% of women in the study were hyperuricemic, which they defined as having a serum urate level greater than 417 micromol/L (7.0 mg/dL) for men and greater than 340 micromol/L (5.7 mg/dL) for women.
BMI was the most important risk factor for hyperuricemia, accounting for 44% of cases overall. The prevalence of hyperuricemia was 85% higher in individuals with a BMI of 25.0-29.9 kg/m2, 2.72-fold higher in those with a BMI of 30.0-34.9, and 3.53-fold higher for those with a BMI of 35.0 or above when compared against people with a BMI less than 25.0.
The researchers found that adherence to a DASH-style diet could have prevented 9% of hyperuricemia cases, as those in the lowest quintile of DASH-style dietary score had a 22% higher prevalence of hyperuricemia, compared with those in the highest quintile.
There was also a dose-response relationship between alcohol intake and hyperuricemia prevalence, and the authors calculated that 8% of cases could have been avoided through abstaining from alcohol consumption.
Individuals taking diuretics had a 2.24-fold greater risk of gout, and the population attributable risk for diuretic use was 12%.
However the authors noted that the serum urate variance explained by these individual risk factors was very small; for example, the serum urate variance attributed to the DASH diet was just 0.1%.
“How can dietary changes over time (together with a Western lifestyle) be associated with obesity and gout epidemics, yet also paradoxically appear extremely insignificant according to the variance measure?” they asked. “This occurs because the variance measure does not incorporate how common the exposure is (i.e., its prevalence).”
In contrast, the population attributable risk of these factors did reflect the contribution of effect size as well as the high prevalence, particularly with respect to dietary factors, where less than 1% of the U.S. population is believed to be adherent to the DASH diet.
“These data collectively indicate there is substantial room for improvement in dietary factors to help prevent hyperuricemia and gout, as well as hypertension and related cardiovascular outcomes.”
The study and one author were supported by the National Institutes of Health. Two authors were also supported by awards from the Canadian Institutes of Health Research. No conflicts of interest were declared.
SOURCE: Choi H et al. Arthritis Rheumatol. 2019 Sep 4. doi: 10.1002/art.41067.
Four modifiable lifestyle risk factors account for a substantial proportion of gout cases in the United States, suggesting greater public health efforts could reduce the frequency of the condition, according to a paper published Sept. 4 in Arthritis & Rheumatology.
Hyon K. Choi, MD, DrPH, of the department of medicine at Massachusetts General Hospital, Boston, and his coauthors analyzed data from 14,624 adults involved in the third National Health and Nutrition Examination Survey. From this, they calculated prevalence ratios for hyperuricemia, the population attributable risks, and the variance associated with the risk factors of body mass index, alcohol intake, nonadherence to a Dietary Approaches to Stop Hypertension (DASH) diet, and diuretic use.
They found that 21% of men and 19% of women in the study were hyperuricemic, which they defined as having a serum urate level greater than 417 micromol/L (7.0 mg/dL) for men and greater than 340 micromol/L (5.7 mg/dL) for women.
BMI was the most important risk factor for hyperuricemia, accounting for 44% of cases overall. The prevalence of hyperuricemia was 85% higher in individuals with a BMI of 25.0-29.9 kg/m2, 2.72-fold higher in those with a BMI of 30.0-34.9, and 3.53-fold higher for those with a BMI of 35.0 or above when compared against people with a BMI less than 25.0.
The researchers found that adherence to a DASH-style diet could have prevented 9% of hyperuricemia cases, as those in the lowest quintile of DASH-style dietary score had a 22% higher prevalence of hyperuricemia, compared with those in the highest quintile.
There was also a dose-response relationship between alcohol intake and hyperuricemia prevalence, and the authors calculated that 8% of cases could have been avoided through abstaining from alcohol consumption.
Individuals taking diuretics had a 2.24-fold greater risk of gout, and the population attributable risk for diuretic use was 12%.
However the authors noted that the serum urate variance explained by these individual risk factors was very small; for example, the serum urate variance attributed to the DASH diet was just 0.1%.
“How can dietary changes over time (together with a Western lifestyle) be associated with obesity and gout epidemics, yet also paradoxically appear extremely insignificant according to the variance measure?” they asked. “This occurs because the variance measure does not incorporate how common the exposure is (i.e., its prevalence).”
In contrast, the population attributable risk of these factors did reflect the contribution of effect size as well as the high prevalence, particularly with respect to dietary factors, where less than 1% of the U.S. population is believed to be adherent to the DASH diet.
“These data collectively indicate there is substantial room for improvement in dietary factors to help prevent hyperuricemia and gout, as well as hypertension and related cardiovascular outcomes.”
The study and one author were supported by the National Institutes of Health. Two authors were also supported by awards from the Canadian Institutes of Health Research. No conflicts of interest were declared.
SOURCE: Choi H et al. Arthritis Rheumatol. 2019 Sep 4. doi: 10.1002/art.41067.
FROM ARTHRITIS & RHEUMATOLOGY