User login
Official news magazine of the Society of Hospital Medicine
Copyright by Society of Hospital Medicine or related companies. All rights reserved. ISSN 1553-085X
nav[contains(@class, 'nav-ce-stack nav-ce-stack__large-screen')]
header[@id='header']
div[contains(@class, 'header__large-screen')]
div[contains(@class, 'read-next-article')]
div[contains(@class, 'main-prefix')]
div[contains(@class, 'nav-primary')]
nav[contains(@class, 'nav-primary')]
section[contains(@class, 'footer-nav-section-wrapper')]
footer[@id='footer']
section[contains(@class, 'nav-hidden')]
div[contains(@class, 'ce-card-content')]
nav[contains(@class, 'nav-ce-stack')]
div[contains(@class, 'view-medstat-quiz-listing-panes')]
div[contains(@class, 'pane-article-sidebar-latest-news')]
div[contains(@class, 'pane-pub-article-hospitalist')]

FDA approves starting dose of roflumilast
The Food and Drug Administration has approved the use of a 250-mcg dose of roflumilast for patients with chronic obstructive pulmonary disease (COPD) for 4 weeks, followed by the use of 500-mcg therapeutic doses, according to a statement from the drug’s marketer, AstraZeneca.
The larger doses of roflumilast (Daliresp) are currently indicated for reducing the risk of COPD exacerbations in patients with severe COPD associated with chronic bronchitis and a history of exacerbations, according to the statement. The selective phosphodiesterase-4 inhibitor, roflumilast, was approved for this use in 500-mcg doses in 2011. The new smaller doses of the drug are being offered to help reduce the rate of treatment discontinuation with use of the higher therapeutic dosing. The 250-mcg doses of roflumilast are not to be used as treatment for COPD.
“As the only once-daily tablet to provide enhanced protection against COPD exacerbations when added to current bronchodilator therapy, this is an important new dosing option to help patients start and stay on treatment. Exacerbations are associated with hospitalizations and an accelerated decline in lung function, and these patients living with COPD need effective treatment options,” Tosh Butt, vice president, respiratory, at AstraZeneca, said in the press release.
The approval of use of the 250-mcg doses was based on data from the OPTIMIZE study (Evaluation of Tolerability and Pharmacokinetics of Roflumilast trial, 250 mcg and 500 mcg, as an add-on to Standard COPD Treatment to Treat Severe COPD), according to the statement.
Over 12 weeks, the percentage of patients stopping treatment was significantly lower in those first given 250 mcg of roflumilast daily for 4 weeks, followed by 500 mcg once a week for 8 weeks (18.4%), compared with those given 500 mcg of roflumilast daily for 12 weeks (24.6%; odds ratio, 0.66; 95% confidence interval, 0.47-0.93; P = .017).
In eight controlled clinical trials, the most common adverse effects were diarrhea, weight loss, nausea, headache, back pain, influenza, insomnia, dizziness, and decreased appetite.
VIDEO: New stroke guideline embraces imaging-guided thrombectomy
LOS ANGELES – When a panel organized by the American Heart Association’s Stroke Council recently revised the group’s guideline for early management of acute ischemic stroke, they were clear on the overarching change they had to make: Incorporate recent evidence collected in two trials that established brain imaging as the way to identify patients eligible for clot removal treatment by thrombectomy, a change in practice that has made this outcome-altering intervention available to more patients.
“The major take-home message [of the new guideline] is the extension of the time window for treating acute ischemic stroke,” said William J. Powers, MD, chair of the guideline group (Stroke. 2018 Jan 24. doi: 10.1161/STR.0000000000000158).
Based on recently reported results from the DAWN (N Engl J Med. 2018;378[1]:11-21) and DEFUSE 3 (N Engl J Med. 2018 Jan 24. doi: 10.1056/NEJMoa1713973) trials “we know that there are patients out to 24 hours from their stroke onset who may benefit” from thrombectomy. “This is a major, major change in how we view care for patients with stroke,” Dr. Powers said in a video interview. “Now there’s much more time. Ideally, we’ll see smaller hospitals develop the ability to do the imaging” that makes it possible to select acute ischemic stroke patients eligible for thrombectomy despite a delay of up to 24 hours from their stroke onset to the time of thrombectomy, said Dr. Powers, professor and chair of neurology at the University of North Carolina, Chapel Hill.
The big priority for the stroke community now that this major change in patient selection was incorporated into a U.S. practice guideline will be acting quickly to implement the steps needed to make this change happen, Dr. Powers and others said.
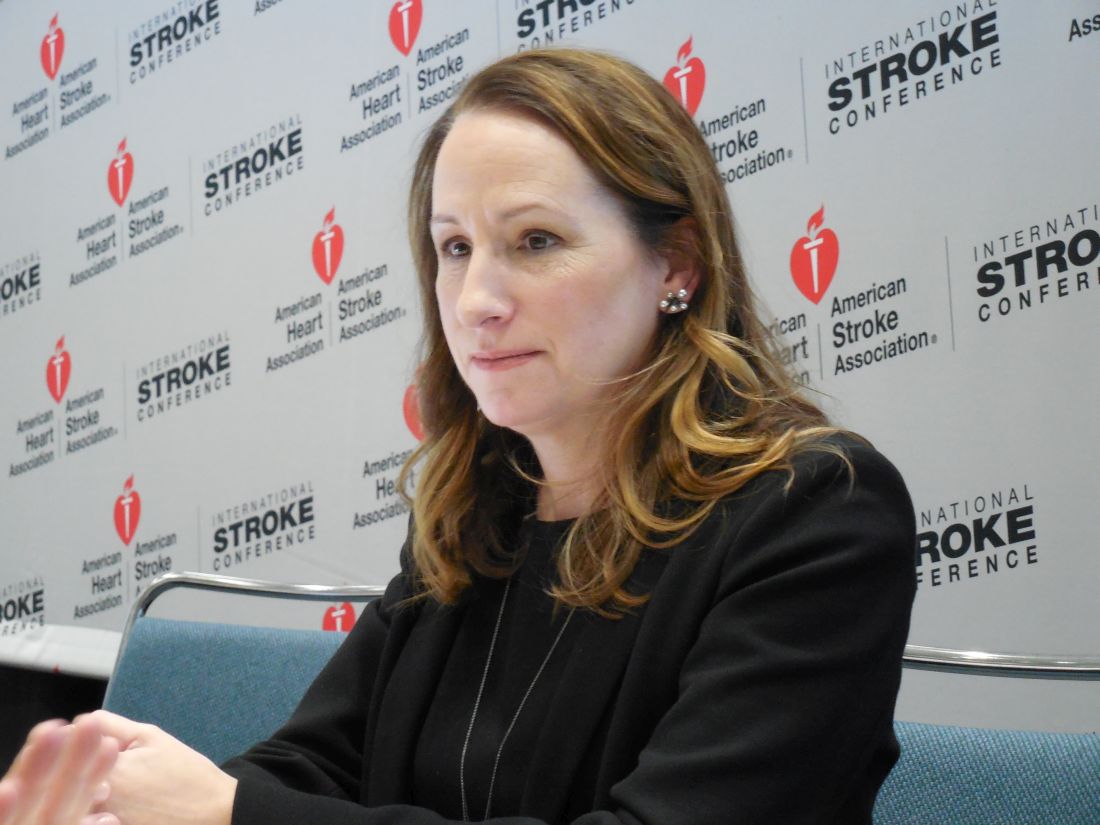
The new guideline will mean “changes in process and systems of care,” agreed Jeffrey L. Saver, MD, professor of neurology and director of the stroke unit at the University of California, Los Angeles. The imaging called for “will be practical at some primary stroke centers but not others,” he said, although most hospitals certified to provide stroke care as primary stroke centers or acute stroke–ready hospitals have a CT scanner that could provide the basic imaging needed to assess many patients. (CT angiography and perfusion CT are more informative for determining thrombectomy eligibility.) But interpretation of the brain images to distinguish patients eligible for thrombectomy from those who aren’t will likely happen at comprehensive stroke centers that perform thrombectomy or by experts using remote image reading.

Dr. Saver expects that the new guideline will translate most quickly into changes in the imaging and transfer protocols that the Joint Commission may now require from hospitals certified as primary stroke centers or acute stroke-ready hospitals, changes that could be in place sometime later in 2018, he predicted. These are steps “that would really help drive system change.”
Dr. Powers and Dr. Furie had no disclosures. Dr. Saver has received research support and personal fees from Medtronic-Abbott and Neuravia.
LOS ANGELES – When a panel organized by the American Heart Association’s Stroke Council recently revised the group’s guideline for early management of acute ischemic stroke, they were clear on the overarching change they had to make: Incorporate recent evidence collected in two trials that established brain imaging as the way to identify patients eligible for clot removal treatment by thrombectomy, a change in practice that has made this outcome-altering intervention available to more patients.
“The major take-home message [of the new guideline] is the extension of the time window for treating acute ischemic stroke,” said William J. Powers, MD, chair of the guideline group (Stroke. 2018 Jan 24. doi: 10.1161/STR.0000000000000158).
Based on recently reported results from the DAWN (N Engl J Med. 2018;378[1]:11-21) and DEFUSE 3 (N Engl J Med. 2018 Jan 24. doi: 10.1056/NEJMoa1713973) trials “we know that there are patients out to 24 hours from their stroke onset who may benefit” from thrombectomy. “This is a major, major change in how we view care for patients with stroke,” Dr. Powers said in a video interview. “Now there’s much more time. Ideally, we’ll see smaller hospitals develop the ability to do the imaging” that makes it possible to select acute ischemic stroke patients eligible for thrombectomy despite a delay of up to 24 hours from their stroke onset to the time of thrombectomy, said Dr. Powers, professor and chair of neurology at the University of North Carolina, Chapel Hill.
The big priority for the stroke community now that this major change in patient selection was incorporated into a U.S. practice guideline will be acting quickly to implement the steps needed to make this change happen, Dr. Powers and others said.
The new guideline will mean “changes in process and systems of care,” agreed Jeffrey L. Saver, MD, professor of neurology and director of the stroke unit at the University of California, Los Angeles. The imaging called for “will be practical at some primary stroke centers but not others,” he said, although most hospitals certified to provide stroke care as primary stroke centers or acute stroke–ready hospitals have a CT scanner that could provide the basic imaging needed to assess many patients. (CT angiography and perfusion CT are more informative for determining thrombectomy eligibility.) But interpretation of the brain images to distinguish patients eligible for thrombectomy from those who aren’t will likely happen at comprehensive stroke centers that perform thrombectomy or by experts using remote image reading.
Dr. Saver expects that the new guideline will translate most quickly into changes in the imaging and transfer protocols that the Joint Commission may now require from hospitals certified as primary stroke centers or acute stroke-ready hospitals, changes that could be in place sometime later in 2018, he predicted. These are steps “that would really help drive system change.”
Dr. Powers and Dr. Furie had no disclosures. Dr. Saver has received research support and personal fees from Medtronic-Abbott and Neuravia.
EXPERT ANALYSIS FROM ISC 2018

Checklists to improve patient safety have mixed results
Clinical question: Do checklists improve patient safety among hospitalized patients?
Background: Systematic reviews of nonrandomized studies suggest checklists may reduce adverse events and medical errors. No study has systematically reviewed randomized trials or summarized the quality of evidence on this topic.
Study design: Systematic review of randomized controlled trials (RCTs) with pooled estimates of 30-day mortality.
Setting: RCTs reporting inpatient safety outcomes.
Synopsis: A search among four databases from inception through 2016 yielded nine studies meeting inclusion criteria. Checklists included tools for daily rounding, discharge planning, patient transfer, surgical safety and infection control procedures, pharmaceutical prescribing, and pain control. Three studies examined 30-day mortality, three studied length of stay, and two reported checklist compliance. Five reported patient outcomes and five reported provider-level outcomes related to patient safety. Findings regarding the effectiveness of checklists across studies were mixed. A random-effects model using pooled data from the three studies assessing 30-day mortality showed lower mortality associated with checklist use (odds ratio, 0.6, 95% confidence interval, 0.41-0.89; P = .01). The methodologic quality of studies was assessed as moderate. The review included studies with substantial heterogeneity in checklists employed and outcomes assessed. Though included studies were supposed to have assessed patient outcomes and not the processes of care, several studies cited did not report such outcomes.
Bottom line: Evidence regarding the effectiveness of clinical checklists on patient safety outcomes is mixed, and there is substantial heterogeneity in the types of checklists employed and outcomes assessed.
Citation: Boyd JM et al. The impact of checklists on inpatient safety outcomes: A systematic review of randomized controlled trials. J Hosp Med. 2017 Aug;12:675-82.
Dr. Simonetti is a hospitalist at the University of Colorado School of Medicine.
Influenza: All that and MI too
Myocardial infarction admissions were six times more likely to occur in the week after a positive test for influenza than in the year before or the 51 weeks after the infection, according to analysis of a Canadian cohort that links laboratories with administrative databases.
The investigators used this cohort data to define definitions of “risk interval” – the first 7 days after flu detection – and a combined “control interval” – 52 weeks before the flu detection and 51 weeks after the end of the risk interval.
Among the total of 364 hospital admissions for MI in patients with confirmed influenza, 20 occurred during the defined 1-week risk interval (20 admissions/week) and 344 occurred during the control interval (3.3 admissions/week), giving an incidence ratio (IR) of 6.05, Jeffrey C. Kwong, MD, of the University of Toronto and his associates reported in the New England Journal of Medicine.
There was little difference between days 1 and 3 after flu confirmation (IR, 6.3) and days 4-7 (IR, 5.8), but risk dropped off quickly after that, with IRs of 0.6 at days 8-14 and 0.75 at days 15-28. Risk was increased for older adults, those with influenza B infection, and those who had their first MI, the investigators said.
MI incidence also was elevated after infection with noninfluenza respiratory viruses, although to a lesser extent than with influenza, which suggests that “influenza is illustrative of the role that acute respiratory infections have in precipitating acute myocardial infarction,” Dr. Kwong and his associates wrote.
The study was supported by the Canadian Institutes of Health Research, by Public Health Ontario, and by the Institute for Clinical Evaluative Sciences. Dr. Kwong reported grants from Canadian Institutes of Health Research during the conduct of the study, as well as grants from Canadian Institutes of Health Research and University of Toronto.
SOURCE: Kwong JC et al. N Engl J Med. 2018. 378(4):345-53. doi: 10.1056/NEJMoa1702090.
FROM THE NEW ENGLAND JOURNAL OF MEDICINE
Persistent opioid use a risk after surgery in teens and young adults
For a subset of opioid-naive adolescents and young adults who received perioperative opioid scripts, those prescriptions were filled for months after the surgery, raising concerns about long-term risk for substance use disorder.
To get an idea of the teen opioid problem, from 1997 to 2012 for adolescents aged 15-19 years, the incidence of hospitalizations for opioid poisonings per 100,000 teens increased from 3.69 to 10.17, an increase of 176%, according to a study in JAMA Pediatrics (2016;170[12]:1195-201). Adolescents are at a three to five time higher risk for serious medical outcomes when hospitalized with opioid poisoning, such as life-threatening symptoms or death, compared with younger children, according to a study reporting prescription drug exposures among children (Pediatrics. 2017;139[4]:e20163382).
These figures are concerning in part because “a significant association between medical use of prescription opioids alone in adolescence and subsequent nonmedical use of prescription opioids was observed at age 35 years” in a national longitudinal study reported in the journal Pain (2016 Oct;157[10]:2173-8), said Calista M. Harbaugh, MD, of the University of Michigan, Ann Arbor, and her study coauthors.
The study in Pediatrics, which drew from a large national insurance claims database, found some patient characteristics had independent associations with increased risk of persistent opioid use. These included being female or older, as well as having a prior history of substance use disorder, chronic pain, or filling an opioid prescription preoperatively.
Dr. Harbaugh and her collaborators used a large national research database to select opioid-naive patients aged 13-21 years who received 1 of 13 surgical procedures. A total of 88,637 opioid-naive surgical patients were included in the study, with 110,432 control nonsurgical patients. The control group consisted of 3% of the database’s nonsurgical patients who met age and opioid-naivete criteria. Patients in both groups also had to have continuous insurance for the prior 12 months, not have had an opioid prescription filled within the prior year, and not have received any subsequent surgical procedures during the study period.
To be able to compare medication use among patients receiving different types of opioids, the opioid component of all prescriptions was converted to milligrams, and then used to calculate oral morphine equivalents (OMEs) for each prescription.
Although the most common procedures were tonsillectomy and/or adenoidectomy (35.9% of patients), arthroscopic knee repair (25.3%), and appendectomy, (18.6%), these were not the procedures that were most associated with persistent opioid use.
Overall, 7.1% of patients had an initial daily dosage greater than 100 OMEs for their first postoperative prescription. These high opioid doses were likely to be seen in patients undergoing three procedures known to have considerable postoperative pain: pectus repair, posterior arthrodesis, and supracondylar fracture fixation. However, patients undergoing these procedures weren’t more likely to have persistent opioid use than other surgical patients in the study, the researchers said.
Rather, cholecystectomy and colectomy had the highest risk for persistent opioid use, with adjusted odds ratios of 1.13 and 2.33, respectively. Dr. Harbaugh and her collaborators, in discussing the study’s findings, noted that these two conditions involve high levels of preoperative inflammation and are characterized by visceral pain. This scenario, they said, may set these patients up for visceral and central sensitization and present an increased risk for chronic pain.
Dr. Harbaugh and her colleagues called for preoperative screening for risk factors for persistent opioid use, so that at-risk patients can receive closer monitoring and attention. “We are not suggesting that … pain should be underappreciated or undertreated,” or that at-risk patients should not be prescribed opioids.
The investigators said that their work “points toward the multifactorial etiology of postoperative pain and its complex nature in both the short and long term.” They called for more work to “elucidate the mechanism that underlies new persistent opioid use after certain procedures,” as well as more efforts to better understand how best to use multimodal pharmacologic and nonpharmacologic pain control measures in the adolescent and young adult population.
The study was funded by the Michigan Department of Health and Human Services. Dr. Harbaugh reported that she had no relevant financial disclosures. Some of the other investigators received grants from various agencies.
SOURCE: Harbaugh CM et al. Pediatrics 2018 Jan 1;141(1):e20172439
FROM PEDIATRICS
Key clinical point: Especially for females, older teens, and young adults, there’s a risk for persistent postsurgical opioid use.
Major finding: Opioid use persisted for 4.8% of patients undergoing surgery, compared with 0.1% of patients who did not have surgery.
Study details: Retrospective review of claims database including 88,637 adolescent and young adult patients undergoing surgery, and 110,432 controls who did not have surgery.
Disclosures: The study was funded by the Michigan Department of Health and Human Services. Dr. Harbaugh reported that she had no conflicts of interest. Some of the other investigators received grants from various agencies.
Source: Harbaugh CM et al. Pediatrics. 2018 Jan 1;141(1):e20172439
Journal of Hospital Medicine – Jan. 2018
BACKGROUND: Hospital charges and lengths of stay may be greater when adults with chronic conditions are admitted to children’s hospitals. Despite multiple efforts to improve pediatric-adult health care transitions, little guidance exists for transitioning inpatient care.
OBJECTIVE: This study sought to characterize pediatric-adult inpatient care transitions across general pediatric services at U.S. children’s hospitals.
DESIGN and SETTING: National survey of inpatient general pediatric service leaders at U.S. children’s hospitals from January 2016 to July 2016.
MEASUREMENT: Questionnaires assessed institutional characteristics, presence of inpatient transition initiatives (having a specific process and/or leader), and 22 inpatient transition activities. Scales of highly correlated activities were created using exploratory factor analysis. Logistic regression identified associations among institutional characteristics, transition activities, and presence of an inpatient transition initiative.
RESULTS: Of 195 children’s hospitals, 96 responded (49.2% response rate). Transition initiatives were present at 38% of children’s hospitals, more often where there were providers who were trained in both internal medicine and pediatrics or where there were outpatient transition processes. Specific activities were infrequent and varied widely from 2.1% (systems to track youth in transition) to 40.5% (addressing potential insurance problems). Institutions with initiatives more often consistently performed the majority of activities, including using checklists and creating patient-centered transition care plans. Of remaining activities, half involved transition planning, the essential step between readiness and transfer.
CONCLUSION: Relatively few inpatient general pediatric services at U.S. children’s hospitals have leaders or dedicated processes to shepherd transitions to adult-oriented inpatient care. Across institutions, there is wide variability in performance of activities to facilitate this transition. Feasible process and outcome measures are needed.
Also in JHM this month
Characterizing hospitalist practice and perceptions of critical care delivery
AUTHORS: Joseph R. Sweigart, MD, FACP, FHM; David Aymond, MD; Alfred Burger, MD, FACP, SFHM; Andy Kelly, MAS, MS; Nick Marzano, Med; Thomas McIlraith, MD, SFHM; Peter Morris, MD; Mark V. Williams, MD, FACP, MHM; and Eric M. Siegal, MD, SFHM, FCCM
Clinical decision making: Observing the smartphone user an observational study in predicting acute surgical patients’ suitability for discharge
AUTHORS: Richard Hoffmann, MBBS; Simon Harley, MBBS; Samuel Ellison, MBBS; and Peter G. Devitt, MBBS, FRACS
Predicting MDR Gram-negative infection mortality risk
Source control, defined as location and elimination of the source of the infection, was critical for patient survival in the case of multidrug resistant bacterial infection, according to the results of a case-control study of 62 critically ill surgical patients who were assessed between 2011 and 2014.
Researchers examined the characteristics of infected patients surviving to hospital discharge compared with those of nonsurvivors to look for predictive factors. Demographically, patients had an overall mean age of 62 years; 30.6% were women; 69.4% were white. The first culture obtained during a surgical ICU admission that grew a carbapenem-resistant Enterobacteriaceae (CRE), MDR Pseudomonas aeruginosa, or MDR Acinetobacter spp. was defined as the index culture.
“In this study, 33.9% [21/62] of critically ill surgical patients with a culture positive for MDR Gram-negative bacteria died prior to hospital discharge,” according to Andrew S. Jarrell, PharmD, of the Johns Hopkins Hospital, Baltimore, and his colleagues.
With multivariate logistic regression, achievement of source control was the only variable associated with decreased in-hospital mortality (odds ratio 0.04, 95% confidence interval, 0.003-0.52); P = .01).
“Source control status was predictive of in-hospital mortality after controlling for other factors. Specifically, the odds of in-hospital mortality were 97% lower when source control was achieved as compared to when source control was not achieved,” the authors stated (J Crit Care. 2018;43:321-6).
Scenarios in which source control was not applicable (pneumonia and urinary tract infection) were also similarly distributed between survivors and nonsurvivors, they reported.
Other than source control, the only significant risk factors for mortality, as seen in univariate analysis, all occurred prior to index culture. They were: vasopressor use (46.3% of survivors, vs. 76.2% of nonsurvivors, P = .03); mechanical ventilation (63.4% vs. 100%, P = .001); and median ICU length of stay (10 days vs. 18 days, P = .001).
“Achievement of source control stands out as a critical factor for patient survival. Clinicians should take this, along with prior ICU LOS, vasopressor use, and mechanical ventilation status, into consideration when evaluating patient prognosis,” Dr. Jarrell and his colleagues concluded.
The authors reported that they had no conflicts or source of funding.
Source: Jarrell, A.S., et al. J Crit Care. 2018;43:321-6.
FROM THE JOURNAL OF CRITICAL CARE
Key clinical point: Source control was the most important predictor of MDR Gram-negative infection mortality in hospitalized patients.
Major finding: The odds of in-hospital mortality were 97% lower when source control was achieved.
Study details: Case-control study of 62 critically ill surgical patients from 2011 to 2014 who had an MDR infection.
Disclosures: The authors reported that they had no conflicts or source of funding.
Source: Jarrell, A.S., et al. J Crit Care. 2018;43:321-6.
Rural residents admitted for opioid overdoses increasingly are hospitalized in urban hospitals
Clinical question: Is there an association between rurality and trends and characteristics of hospitalizations for opioid overdose?
Background: Hospitalization for an opioid overdose is an opportunity for intervention, and patients may have different discharge needs depending on their rurality. Differences in patient characteristics or overall trends in opioid overdose hospitalizations by rural status have not been described.
Study design: Time trend (2007-2014) and cross-sectional analysis (2012-2014).
Setting: Nationally representative sample of U.S. hospital discharges.
Synopsis: Using weighted data from the National Inpatient Sample and the American Community Survey, the authors found that 43,935 individuals were hospitalized for opioid overdose in the United States in 2007, increasing to 71,280 in 2014. A total of 99% of urban and 37% of rural residents were admitted to urban hospitals. Hospitalization rates for prescription opioid overdoses were higher among rural residents and increased among rural and urban residents until 2011 before declining among rural residents during 2012-2014. Hospitalization rates for prescription opioid overdoses increased among all groups before they declined among large urban population residents after 2011, declined among rural residents after 2012, and continued to rise among small urban residents. Hospitalization rates for heroin overdose increased across all years in all groups and were higher among urban as compared to rural residents.
Bottom line: Opioid overdose hospitalization is associated with patient rurality and a significant proportion of rural individuals are hospitalized for opioid overdose in urban facilities. These patients may have distinct discharge needs.
Citation: Mosher H et al. Trends in hospitalization for opioid overdose among rural compared to urban residents of the United States, 2007-2014. J Hosp Med. 2017. doi: 10.12788/jhm.2793.
Dr. Simonetti is a hospitalist at the University of Colorado School of Medicine.
SHM launches 2018 State of Hospital Medicine Survey
The Society of Hospital Medicine recently opened the 2018 State of Hospital Medicine (SoHM) Survey and is now seeking participants from hospital medicine groups to contribute to the collective understanding of the state of the specialty.
Results from the biennial survey will be analyzed and compiled into the 2018 SoHM Report to provide current data on hospitalist compensation and production, as well as cutting-edge knowledge covering practice demographics, staffing levels, turnover, staff growth, and financial support. The SoHM Survey closes on Feb. 16, 2018.
“The SoHM Survey lays the foundation for the creation of one of the most expansive tools for hospital medicine professionals,” said Beth Hawley, MBA, FACHE, chief operating officer of SHM. “With the help of participants from hospital medicine groups nationwide, it creates an up-to-date snapshot of trends in the specialty to help inform staffing and management decisions.”
The 2018 SoHM Survey includes new questions about open hospitalist physician positions during the year, including what percentage of approved staffing was unfilled and how the group filled the coverage. Other new topics ask about the number of work Relative Value Units generated by participating hospital medicine groups and who selects the billing codes for the groups.
Over the past year and a half, five distinct efforts were completed to collect user feedback for both the survey and report development processes. Efforts ranged from in-person focus groups at SHM’s Annual Conference to online user surveys. After information was collected and summarized, SHM’s Practice Analysis Committee ranked every question to trim down the Survey from 70 questions in 2016 to 52 questions in 2018.
The 2018 SoHM Report will be available this fall in print only, as a bundle of print and digital, or as digital only, with special discounts available for SHM members.
Committee members are available for one-on-one guidance as participants complete the Survey. For more information and to participate, visit www.hospitalmedicine.org/sohm.
Beware the COPD exacerbation
A 70-year-old man with chronic obstructive pulmonary disease (COPD) is admitted with increased shortness of breath. His O2 saturation levels are usually 90%, but they’re now running 84%-88%. He has had increasing symptoms for the past 3 days.

What would be your next step?
A) Begin a 5-day course of corticosteroids.
B) Begin a 14-day course of corticosteroids.
C) Begin azithromycin.
D) Start BiPAP.
E) Obtain D-dimer.
This is a situation we face frequently. COPD exacerbations are a clinical diagnosis that is often jumped to as the diagnosis in patients with COPD who have increasing dyspnea. This diagnosis is frequently correct – but not always.
Patients with COPD also may be at risk for or have heart failure, which can present with identical symptoms, including widespread wheezing. We are currently in a severe influenza epidemic, and influenza can mimic a COPD exacerbation or be the trigger.
About 20 years ago, I was out of the country when one of my patients with COPD was admitted to the hospital with a COPD exacerbation. I saw him in follow-up a week after his hospitalization. He was very dyspneic and had a room air oxygen saturation of 75%. He told me his dyspnea started a few days after he had injured his leg on a wood pile in his yard.
On exam, his right leg had 3+ edema; left leg, no edema. He reported to me that he was treated for 5 days with steroids and nebulizers, with minimal change in his dyspnea. I reviewed the chart, and five physicians had seen him while he was in the hospital. Starting with the emergency department, the diagnosis was COPD exacerbation, with no differential diagnosis in any note.
The patient had multiple pulmonary emboli, and he eventually improved with anticoagulation.
In 2009, Jacques Rizkallah, MD, and his colleagues published a systematic review and meta-analysis of articles looking at the prevalence of pulmonary emboli (PE) in patients diagnosed/treated for a COPD exacerbation.1 They found five articles comprising a total of 550 patients who met inclusion criteria. The prevalence was 19.9% (P = .014). The prevalence was much higher (24.7%) for hospitalized patients than it was for outpatients (3.3%). A very important finding in this study: There was no difference in symptoms between patients who did and did not have a pulmonary embolus.
Evrim Eylem Akpinar, MD, and colleagues studied all admissions for acute exacerbations of COPD at one hospital in Turkey over a 2-year period.2 A total of 172 patients admitted for COPD exacerbations were studied. The prevalence of pulmonary embolus was 29%.
In this study, patients who were obese or immobile were more likely to have pulmonary emboli. Pleuritic chest pain and lower-limb asymmetry were signs and symptoms more commonly found in patients who had PE. Obesity was the highest independent predictor (odds ratio, 4.97) for pulmonary embolus.
Floor Aleva, MD, and colleagues recently completed a systematic review and meta-analysis on prevalence and localization of pulmonary embolus in patients with acute exacerbations of COPD.3 They found similar numbers to the previous meta-analysis (16.1%) in a total of 880 patients. They also looked at location in the lungs of the emboli and found that two-thirds of the patients had pulmonary emboli in locations that had clear indication for anticoagulation treatment.
This is important, because criticisms of earlier studies were that clinically insignificant pulmonary emboli might be being found in the studies and that they had little to do with the patients’ symptoms.
In the case presented, I think that getting a D-dimer test would be the next best step. Acute exacerbation of COPD still is the most likely diagnosis, but PE is a plausible diagnosis that should be evaluated. If the D-dimer is normal, workup for PE would be complete. If elevated, then given the 20% prevalence of PE, a CT angiography would be warranted.
Key pearl: Among patients hospitalized for COPD exacerbations, 16%-24% have pulmonary embolism.

Dr. Paauw is professor of medicine in the division of general internal medicine at the University of Washington, Seattle, and he serves as third-year medical student clerkship director at the University of Washington. Contact Dr. Paauw at [email protected].
References
1. Chest. 2009 Mar;135(3):786-93.
2. J Bras Pneumol. 2014 Jan-Feb;40(1):38-45.
3. Chest. 2017 Mar;151(3):544-54.
A 70-year-old man with chronic obstructive pulmonary disease (COPD) is admitted with increased shortness of breath. His O2 saturation levels are usually 90%, but they’re now running 84%-88%. He has had increasing symptoms for the past 3 days.
What would be your next step?
A) Begin a 5-day course of corticosteroids.
B) Begin a 14-day course of corticosteroids.
C) Begin azithromycin.
D) Start BiPAP.
E) Obtain D-dimer.
This is a situation we face frequently. COPD exacerbations are a clinical diagnosis that is often jumped to as the diagnosis in patients with COPD who have increasing dyspnea. This diagnosis is frequently correct – but not always.
Patients with COPD also may be at risk for or have heart failure, which can present with identical symptoms, including widespread wheezing. We are currently in a severe influenza epidemic, and influenza can mimic a COPD exacerbation or be the trigger.
About 20 years ago, I was out of the country when one of my patients with COPD was admitted to the hospital with a COPD exacerbation. I saw him in follow-up a week after his hospitalization. He was very dyspneic and had a room air oxygen saturation of 75%. He told me his dyspnea started a few days after he had injured his leg on a wood pile in his yard.
On exam, his right leg had 3+ edema; left leg, no edema. He reported to me that he was treated for 5 days with steroids and nebulizers, with minimal change in his dyspnea. I reviewed the chart, and five physicians had seen him while he was in the hospital. Starting with the emergency department, the diagnosis was COPD exacerbation, with no differential diagnosis in any note.
The patient had multiple pulmonary emboli, and he eventually improved with anticoagulation.
In 2009, Jacques Rizkallah, MD, and his colleagues published a systematic review and meta-analysis of articles looking at the prevalence of pulmonary emboli (PE) in patients diagnosed/treated for a COPD exacerbation.1 They found five articles comprising a total of 550 patients who met inclusion criteria. The prevalence was 19.9% (P = .014). The prevalence was much higher (24.7%) for hospitalized patients than it was for outpatients (3.3%). A very important finding in this study: There was no difference in symptoms between patients who did and did not have a pulmonary embolus.
Evrim Eylem Akpinar, MD, and colleagues studied all admissions for acute exacerbations of COPD at one hospital in Turkey over a 2-year period.2 A total of 172 patients admitted for COPD exacerbations were studied. The prevalence of pulmonary embolus was 29%.
In this study, patients who were obese or immobile were more likely to have pulmonary emboli. Pleuritic chest pain and lower-limb asymmetry were signs and symptoms more commonly found in patients who had PE. Obesity was the highest independent predictor (odds ratio, 4.97) for pulmonary embolus.
Floor Aleva, MD, and colleagues recently completed a systematic review and meta-analysis on prevalence and localization of pulmonary embolus in patients with acute exacerbations of COPD.3 They found similar numbers to the previous meta-analysis (16.1%) in a total of 880 patients. They also looked at location in the lungs of the emboli and found that two-thirds of the patients had pulmonary emboli in locations that had clear indication for anticoagulation treatment.
This is important, because criticisms of earlier studies were that clinically insignificant pulmonary emboli might be being found in the studies and that they had little to do with the patients’ symptoms.
In the case presented, I think that getting a D-dimer test would be the next best step. Acute exacerbation of COPD still is the most likely diagnosis, but PE is a plausible diagnosis that should be evaluated. If the D-dimer is normal, workup for PE would be complete. If elevated, then given the 20% prevalence of PE, a CT angiography would be warranted.
Key pearl: Among patients hospitalized for COPD exacerbations, 16%-24% have pulmonary embolism.
Dr. Paauw is professor of medicine in the division of general internal medicine at the University of Washington, Seattle, and he serves as third-year medical student clerkship director at the University of Washington. Contact Dr. Paauw at [email protected].
References
1. Chest. 2009 Mar;135(3):786-93.
2. J Bras Pneumol. 2014 Jan-Feb;40(1):38-45.
3. Chest. 2017 Mar;151(3):544-54.