User login
U.K. variant spreading in the U.S. as COVID mutations raise stakes
The U.K.’s B117 variant is circulating in at least 24 states, according to new data from the Centers for Disease Control and Prevention COVID-19 variant surveillance. The CDC projects that the U.K. variant will become the dominant strain in the United States by March.
From any vantage point, the United Kingdom appears to be in the crosshairs of COVID-19: Weeks after a new, highly contagious variant emerged that fueled a surge in cases and fresh lockdowns, the United Kingdom was revealed to have the world’s highest coronavirus death rate.
But the United Kingdom also has a not-so-secret weapon of its own: A genomic sequencing program widely believed to be the most coordinated and advanced any nation has forged. In the vise grip of the virus, the Brits have gleaned key insights into the behavior and consequences of SARS-CoV-2.
But B117 is also notable for what it is missing: In this case, producing a negative result on certain polymerase chain reaction (PCR) tests in the spike protein, or S-gene.
One of the S-gene mutations specific to the variant deletes two amino acids, causing that portion of the PCR test to show up negative. The coincidental finding known as an S-gene target failure has become an integral proxy to help track where and when the variant is spreading in the United Kingdom, where about 5% of samples from COVID-19–infected patients are sequenced, said Sharon Peacock, PhD, executive director and chair of the COVID-19 Genomics U.K. Consortium.
That same tactic could prove valuable to clinicians similarly overwhelmed with cases and deaths but lacking high-level sequencing information on the virus, Dr. Peacock said in an interview. A British report released Friday stated that there is a “realistic possibility” that the variant has a higher death rate than other cases of SARS-CoV-2.
“In this particular variant, a deletion in the genome leads to one part of the diagnostic test failing,” Dr. Peacock explained. “Several targets are positive, but this is negative. In the U.K., this has been used as a surrogate marker.”
Targeting an invisible adversary
B117 is not the only variant that produces this result, Dr. Peacock cautioned, “but in screening for it, you can have this in mind.”
“Since the U.K. is sequencing about 5% of the cases they detect, this gives them really important clues about what’s happening there,” said Anderson Brito, PhD, a virologist and postdoctoral researcher at Yale University, New Haven, Conn., where investigators are creating custom PCR tests to detect the B117 variant.
Dr. Brito, who lived in the United Kingdom for 4 years while studying for his doctorate at Imperial College London, said a “major advantage” is the more unified process to collect and sequence samples. Crucial information – including the date and place of collection – comes with each sample, which fuels not only sequencing, but an epidemiologic perspective.
“They’re not in the dark at all,” Dr. Brito said in an interview. “I think no other country in the world knows better which virus lineages are circulating.”
The CDC launched the SPHERES consortium in May 2020 to coordinate the sequencing of SARS-CoV-2 genomes across the United States.
But American genomic efforts are “not as centralized,” said Dr. Brito, whose lab detected the first two cases of the U.K. variant in Connecticut on Jan. 6. “We struggle to get samples, because they’re decentralized to a level where there’s little coordination between hospitals and research centers. They’re not as connected as in the U.K. If we just get a sample and it has no date of collection and no origin information, for example, it’s basically useless.”
Global genomic collaborations include GISAID, an international database where researchers share new genomes from various coronaviruses. As of mid-January, the United States had submitted about 68,000 sequences to GISAID, adding about 3,000 new samples every week and expecting even more from commercial labs in coming days, according to the CDC.
“The U.K. is definitely much more on top of looking for variants as they pop up,” said Gigi Gronvall, PhD, an immunologist and senior scholar at Johns Hopkins Center for Health Security in Baltimore. “The U.S. has now turned that up.”
Warning from British scientists to the world
Despite these genomic accomplishments, some British scientists said they have regrets too, wishing they’d known just how rapidly SARS-CoV-2 was actually spreading a year ago, when it hit western Europe.
That information was crucial not only for preventive efforts, but because viruses inevitably mutate faster the more people who are infected, said Igor Rudan, MD, PhD, director of the Center for Global Health Research at University of Edinburgh.
“Italy showed us just how fast it was spreading and how deadly it is for the very old and people with multiple comorbidities,” said Dr. Rudan, who also editor in chief of the Journal of Global Health. “We wish we knew it was spreading so fast, and we wish we knew the threshold of cases we could allow to be infected before the virus would mutate.”
More mutations mean more new strains of SARS-CoV-2, Dr. Rudan said in an interview. “We’ve reached that threshold now and will see more of these mutations.”
Despite its current struggles, the United Kingdom is reaching beyond tracking its new variant’s spread and trying to identify new mutations that might change the way the virus behaves.
Three features of any emerging variant are particularly important, Dr. Peacock explained: Is it more transmissible? Is it more lethal? And does it cut the ability of natural- or vaccine-induced immunity to protect people from infection?
“We need to sequence people coming to the hospital who are sicker,” said Dr. Peacock, also a professor of public health and microbiology at the University of Cambridge (England). “Also, if anyone has the infection after they’ve already been sick or had the vaccine, we really want to know what that looks like” genomically.
SARS-CoV-2 has already logged more than 4,000 mutations, Dr. Peacock said. But “knowing that viruses mutate all the time is not sufficient reason not to look. We really want to know if mutations lead to changes in amino acids, and if that can lead to changes in functionality.”
For the moment, however, experts say they’re relieved that the U.K. strain doesn’t seem able to evade COVID-19 vaccines or render them less effective.
“Even though mutations are common, those able to change the viral coding are rare,” Dr. Brito explained. If necessary, vaccines could be tweaked to replace the spike gene sequence “within a matter of weeks. We already do this for flu vaccines. Every year, we have to monitor variants of the virus circulating to develop a vaccine that covers most of them. If we end up having to do it for SARS-CoV-2, I would not be surprised.”
But variant-fueled increases in infections will require more people to be vaccinated before herd immunity can be achieved, Dr. Rudan warned. “If it spreads faster, we’ll need to vaccinate probably 85% of people versus 70% to reach herd immunity.”
One lesson the COVID-19 pandemic has driven home “is to always be on your guard about what happens next,” Dr. Peacock said. Although confident about the genomic efforts in the United Kingdom to date, she and her colleagues feel they’re still reaching for a complete understanding of the evolutionary changes of the virus.
“We’re ahead of the curve right now, but we want to get in front of the curve,” Dr. Peacock said. “It’s essential to get ahead of what might be around the corner because we don’t know how the virus is going to evolve.”
A version of this article first appeared on Medscape.com.
Male Genital Examinations: Special Considerations and Pearls for Dermatologists
Men have unique dermatologic needs yet are significantly less likely than women to visit a dermatologist’s office.1 Male patients might have preconceived notions about the nature of dermatology visits and necessary areas of the body to be examined: For example, male patients might associate the genital examination with a urologist and not expect a dermatologist to complete such a seemingly private examination.2
Genital examinations are currently underperformed: Only one-quarter of dermatologists report examining a male patient’s genitals at most or all visits.3 In this commentary, we discuss the importance of genital examinations in men’s dermatology, specific issues that can arise, and strategies to enhance the quality and frequency of genital examinations in male patients.
Invaluable Aspect of Care
Thorough inspection of a male patient’s genital region is an important part of conducting a total-body skin examination (TBSE) for routine surveillance and evaluation of genital dermatoses. Sexually transmitted infections, warts, and other common lesions can be missed in diagnosis without careful inspection of the genital region. Additionally, scrotal malignancies, such as primary and metastatic melanoma and basal cell carcinoma, though rare, might be overlooked until symptoms become severe.4,5
There is no substitute for a physical examination but, in certain circumstances, it might be appropriate for a dermatologist to ask a patient if he has concerning lesions on his genitals. However, patients often are unsure of worrisome signs, and areas of the perineum might not be easily visible to a patient. Genital inspection during the physical examination allows for a teachable moment, during which the dermatologist can educate the patient about benign lesions and variants, such as pearly penile papules, seborrheic keratoses, and sebaceous cysts.6 These lesions might not require intervention but should be monitored for atypical features or infection.6
Also, the dermatologist might incidentally discover transmissible lesions, such as condylomata caused by human papillomavirus, which has been shown to be present in approximately 50% of men in the United States7—many of whom are unaware. Inflammatory dermatoses, such as psoriasis, often affect the genitals and go unnoticed; prompt intervention can decrease the likelihood of complications.6
Protocol for Genital Examinations
To examine the genitals, all surfaces of the penis, scrotum, and perineum should be evaluated, with anatomic and pathologic variants noted. The patient or physician should stretch the penis, maneuvering it in multiple directions so that all aspects can be examined. In uncircumcised men, the foreskin should be retracted so that the head of the penis can be examined, followed by replacement of the foreskin by the patient.8 The scrotum also should be examined and lifted to fully view the perineum.
Providers should not grasp the penis with the whole hand but use the thumb and first finger to hold the head of the penis to maneuver it.8 Similarly, using the back of the hand and fingers to manipulate the genitals establishes boundaries and sets a clinical tone for the examination.
Unintentional Erection
Unique to the male dermatologic examination is the unintentional patient erection; a physician might be unsure of how to approach such a potentially awkward situation. An erection is not always an indication of sexual arousal; rather, it can reflect an autonomic reflex in response to physical stimulation. Erections occur commonly in health care settings, especially if the genitals are being manipulated.9
Generally, the course of action here depends on the patient’s response.10 For patients who appear unbothered, it might be appropriate to ignore the erection and proceed with the examination, especially if the physician is not actively examining the genital region. If the patient appears embarrassed, the physician can say “This is completely normal” or “Random erections are common” to normalize the situation. Joking or laughing should be avoided. For a patient who appears upset, the physician can step outside the room for a brief period to give the patient privacy, then re-enter and ask him if he is comfortable continuing with the examination.
When a patient develops an erection, the physician might become uncomfortable and, consciously or subconsciously, increase the pace of the examination, which is a natural tendency, but expediency at the expense of comprehensive care is inappropriate.
Examiner’s Body Language and Tone
Throughout the genital examination, the physician should be mindful of their comments and body language to avoid exacerbating patient vulnerability. Using anatomic terms, rather than colloquial ones, to describe the genitalia is advised to prevent misunderstanding and maintain a professional clinical environment. Providers should be prepared to explain anatomic terms because some patients are not familiar with medical terminology.
Presence of a Chaperone
Involving a chaperone, as recommended by the American Medical Association, might make a patient more comfortable and alleviate potential misunderstanding. Still, physicians should be aware that some patients might feel uncomfortable with a chaperone, interpreting their presence as an expectation of impropriety.11 Universal offering of a chaperone to all patients, regardless of the gender of the physician, as well as appropriate signage in the clinical environment, normalizes chaperone invitation and use.
Other Helpful Considerations
Various strategies in the male genital examination can increase patient and physician comfort and improve care:
- The patient should be offered a gown before a TBSE or any skin examination during which the genitals will be examined.
- The patient should be allowed to keep his shorts or underwear on to avoid the feeling of being naked, which can provoke anxiety. Prior to beginning the examination, disclose that it will include “under the covered areas.”
- Ask the patient for permission to conduct the examination, enumerate the steps, and provide a rationale for a genital examination. These steps help gain cooperation, alleviate anticipation, and prevent surprise.
- To increase the patient’s comfort level, he can be asked whether he prefers to be examined supine or standing.
- Consider allowing the patient, himself, to expose and manipulate his genitals during the examination to increase his involvement and sense of autonomy.
- For genital examinations, patients often prefer that the examiner be a physician of the same gender. Accommodating a patient’s request regarding the examiner’s gender might not always be possible, but the medical practice should make an honest attempt to oblige.
Lastly, providers should be cognizant of the needs of male sexual and gender minority populations (ie, gay, bisexual, transgender/gender diverse, queer or questioning, intersex, and asexual persons). For example, transgender women might retain male anatomy or have surgical alteration of the genital region that also requires evaluation. In such patient populations, the genital examination is equally important to evaluate for dermatologic conditions that require treatment.
Final Thoughts
The male genital examination is an important component of the TBSE, as dermatologists can recognize lesions before symptoms present. Robust educational methods for trainees and practitioners in dermatology are lacking, and development of curricula might be beneficial to increase comfort in performing the genital examination. Still, use of the procedures described in this commentary can normalize the men’s genital examination, optimize the physical examination, and improve men’s overall dermatologic health.
- Tripathi R, Knusel KD, Ezaldein HH, et al. Association of demographic and socioeconomic characteristics with differences in use of outpatient dermatology services in the United States. JAMA Dermatol. 2018;154:1286-1291.
- Brezinski EA, Harskamp CT, Ledo L, et al. Public perception of dermatologists and comparison with other medical specialties: results from a national survey. J Am Acad Dermatol. 2014;71:875-881.
- Rieder EA, Mu EW, Wang J, et al. Dermatologist practices during total body skin examinations: a survey study. J Drugs Dermatol. 2018;17:516-520.
- Gonzalez CD, Hawkes JE, Bowles TL. Malignant melanoma scrotal metastasis: the importance of the genital examination. JAAD Case Rep. 2017;3:10-12.
- Solimani F, Juratli H, Hoch M, et al. Basal cell carcinoma of the scrotum: an important but easily overlooked entity. J Eur Acad Dermatol Venereol. 2018;32:E254-E255.
- Gabrielson AT, Le TV, Fontenot C, et al. Male genital dermatology: a primer for the sexual medicine physician. Sex Med Rev. 2019;7:71-83.
- Han JJ, Beltran TH, Song JW, et al. Prevalence of genital human papillomavirus infection and human papillomavirus vaccination rates among US adult men: National Health and Nutrition Examination Survey (NHANES) 2013-2014. JAMA Oncol. 2017;3:810-816.
- Albaugh JA, Kellogg-Spadt S. Genital and dermatologic examination. part II: the male patient. Urol Nurs. 2003;23:366-367.
- Dean RC, Lue TF. Physiology of penile erection and pathophysiology of erectile dysfunction. Urol Clin North Am. 2005;32:379-395.
- Norwick P, Weston GK, Grant-Kels JM. Erection ethics. J Am Acad Dermatol. 2019;81:1225.
- Vogel L. Chaperones: friend or foe, and to whom? CMAJ. 2012;184:642-643.
Men have unique dermatologic needs yet are significantly less likely than women to visit a dermatologist’s office.1 Male patients might have preconceived notions about the nature of dermatology visits and necessary areas of the body to be examined: For example, male patients might associate the genital examination with a urologist and not expect a dermatologist to complete such a seemingly private examination.2
Genital examinations are currently underperformed: Only one-quarter of dermatologists report examining a male patient’s genitals at most or all visits.3 In this commentary, we discuss the importance of genital examinations in men’s dermatology, specific issues that can arise, and strategies to enhance the quality and frequency of genital examinations in male patients.
Invaluable Aspect of Care
Thorough inspection of a male patient’s genital region is an important part of conducting a total-body skin examination (TBSE) for routine surveillance and evaluation of genital dermatoses. Sexually transmitted infections, warts, and other common lesions can be missed in diagnosis without careful inspection of the genital region. Additionally, scrotal malignancies, such as primary and metastatic melanoma and basal cell carcinoma, though rare, might be overlooked until symptoms become severe.4,5
There is no substitute for a physical examination but, in certain circumstances, it might be appropriate for a dermatologist to ask a patient if he has concerning lesions on his genitals. However, patients often are unsure of worrisome signs, and areas of the perineum might not be easily visible to a patient. Genital inspection during the physical examination allows for a teachable moment, during which the dermatologist can educate the patient about benign lesions and variants, such as pearly penile papules, seborrheic keratoses, and sebaceous cysts.6 These lesions might not require intervention but should be monitored for atypical features or infection.6
Also, the dermatologist might incidentally discover transmissible lesions, such as condylomata caused by human papillomavirus, which has been shown to be present in approximately 50% of men in the United States7—many of whom are unaware. Inflammatory dermatoses, such as psoriasis, often affect the genitals and go unnoticed; prompt intervention can decrease the likelihood of complications.6
Protocol for Genital Examinations
To examine the genitals, all surfaces of the penis, scrotum, and perineum should be evaluated, with anatomic and pathologic variants noted. The patient or physician should stretch the penis, maneuvering it in multiple directions so that all aspects can be examined. In uncircumcised men, the foreskin should be retracted so that the head of the penis can be examined, followed by replacement of the foreskin by the patient.8 The scrotum also should be examined and lifted to fully view the perineum.
Providers should not grasp the penis with the whole hand but use the thumb and first finger to hold the head of the penis to maneuver it.8 Similarly, using the back of the hand and fingers to manipulate the genitals establishes boundaries and sets a clinical tone for the examination.
Unintentional Erection
Unique to the male dermatologic examination is the unintentional patient erection; a physician might be unsure of how to approach such a potentially awkward situation. An erection is not always an indication of sexual arousal; rather, it can reflect an autonomic reflex in response to physical stimulation. Erections occur commonly in health care settings, especially if the genitals are being manipulated.9
Generally, the course of action here depends on the patient’s response.10 For patients who appear unbothered, it might be appropriate to ignore the erection and proceed with the examination, especially if the physician is not actively examining the genital region. If the patient appears embarrassed, the physician can say “This is completely normal” or “Random erections are common” to normalize the situation. Joking or laughing should be avoided. For a patient who appears upset, the physician can step outside the room for a brief period to give the patient privacy, then re-enter and ask him if he is comfortable continuing with the examination.
When a patient develops an erection, the physician might become uncomfortable and, consciously or subconsciously, increase the pace of the examination, which is a natural tendency, but expediency at the expense of comprehensive care is inappropriate.
Examiner’s Body Language and Tone
Throughout the genital examination, the physician should be mindful of their comments and body language to avoid exacerbating patient vulnerability. Using anatomic terms, rather than colloquial ones, to describe the genitalia is advised to prevent misunderstanding and maintain a professional clinical environment. Providers should be prepared to explain anatomic terms because some patients are not familiar with medical terminology.
Presence of a Chaperone
Involving a chaperone, as recommended by the American Medical Association, might make a patient more comfortable and alleviate potential misunderstanding. Still, physicians should be aware that some patients might feel uncomfortable with a chaperone, interpreting their presence as an expectation of impropriety.11 Universal offering of a chaperone to all patients, regardless of the gender of the physician, as well as appropriate signage in the clinical environment, normalizes chaperone invitation and use.
Other Helpful Considerations
Various strategies in the male genital examination can increase patient and physician comfort and improve care:
- The patient should be offered a gown before a TBSE or any skin examination during which the genitals will be examined.
- The patient should be allowed to keep his shorts or underwear on to avoid the feeling of being naked, which can provoke anxiety. Prior to beginning the examination, disclose that it will include “under the covered areas.”
- Ask the patient for permission to conduct the examination, enumerate the steps, and provide a rationale for a genital examination. These steps help gain cooperation, alleviate anticipation, and prevent surprise.
- To increase the patient’s comfort level, he can be asked whether he prefers to be examined supine or standing.
- Consider allowing the patient, himself, to expose and manipulate his genitals during the examination to increase his involvement and sense of autonomy.
- For genital examinations, patients often prefer that the examiner be a physician of the same gender. Accommodating a patient’s request regarding the examiner’s gender might not always be possible, but the medical practice should make an honest attempt to oblige.
Lastly, providers should be cognizant of the needs of male sexual and gender minority populations (ie, gay, bisexual, transgender/gender diverse, queer or questioning, intersex, and asexual persons). For example, transgender women might retain male anatomy or have surgical alteration of the genital region that also requires evaluation. In such patient populations, the genital examination is equally important to evaluate for dermatologic conditions that require treatment.
Final Thoughts
The male genital examination is an important component of the TBSE, as dermatologists can recognize lesions before symptoms present. Robust educational methods for trainees and practitioners in dermatology are lacking, and development of curricula might be beneficial to increase comfort in performing the genital examination. Still, use of the procedures described in this commentary can normalize the men’s genital examination, optimize the physical examination, and improve men’s overall dermatologic health.
- Tripathi R, Knusel KD, Ezaldein HH, et al. Association of demographic and socioeconomic characteristics with differences in use of outpatient dermatology services in the United States. JAMA Dermatol. 2018;154:1286-1291.
- Brezinski EA, Harskamp CT, Ledo L, et al. Public perception of dermatologists and comparison with other medical specialties: results from a national survey. J Am Acad Dermatol. 2014;71:875-881.
- Rieder EA, Mu EW, Wang J, et al. Dermatologist practices during total body skin examinations: a survey study. J Drugs Dermatol. 2018;17:516-520.
- Gonzalez CD, Hawkes JE, Bowles TL. Malignant melanoma scrotal metastasis: the importance of the genital examination. JAAD Case Rep. 2017;3:10-12.
- Solimani F, Juratli H, Hoch M, et al. Basal cell carcinoma of the scrotum: an important but easily overlooked entity. J Eur Acad Dermatol Venereol. 2018;32:E254-E255.
- Gabrielson AT, Le TV, Fontenot C, et al. Male genital dermatology: a primer for the sexual medicine physician. Sex Med Rev. 2019;7:71-83.
- Han JJ, Beltran TH, Song JW, et al. Prevalence of genital human papillomavirus infection and human papillomavirus vaccination rates among US adult men: National Health and Nutrition Examination Survey (NHANES) 2013-2014. JAMA Oncol. 2017;3:810-816.
- Albaugh JA, Kellogg-Spadt S. Genital and dermatologic examination. part II: the male patient. Urol Nurs. 2003;23:366-367.
- Dean RC, Lue TF. Physiology of penile erection and pathophysiology of erectile dysfunction. Urol Clin North Am. 2005;32:379-395.
- Norwick P, Weston GK, Grant-Kels JM. Erection ethics. J Am Acad Dermatol. 2019;81:1225.
- Vogel L. Chaperones: friend or foe, and to whom? CMAJ. 2012;184:642-643.
Practice Points
- Genital examinations are an important aspect of comprehensive dermatologic care for male patients.
- Unintentional patient erections are unique to male patients and should be addressed professionally, depending on the patient’s reaction.
- In addition to being mindful of body language and tone, dermatologists may consider involving a chaperone when performing genital examinations to optimize patient experience.
Brazilian researchers tracking reinfection by new virus variant
Just as Brazil surpassed 200,000 deaths from COVID-19 on Jan. 7, news from Bahia added another layer of concern: A platform case report in a preprint detailed the first case of reinfection in that state, apparently caused by a new strain, one having the E484K mutation.
That variant, now called Brazil P.1, has migrated to the United States. The Minnesota Department of Health announced on Jan. 25 the nation’s first known COVID-19 case associated with it.
The mutation is located in the protein gene of the virus’ spike, which forms the crown structure of coronaviruses and is responsible for the virus’ binding to human cells. The E484K mutation is now the focus because it’s associated with mutations that escape the immune system’s neutralizing antibodies.
“This mutation is at the center of worldwide concern, and it is the first time that it has appeared in a reinfection,” the study’s first author, Bruno Solano de Freitas Souza, MD, a researcher at the Salvador regional unit of Instituto D’Or of Teaching and Research, based at Hospital São Rafael, Salvador, Brazil, explained in an interview.
“We will wait for the sample from Bahia to confirm the case from the perspective of the Ministry of Health’s surveillance network,” said Fernando Motta, PhD, deputy head of the Laboratory for Respiratory Virus and Measles at the Oswaldo Cruz Institute in Rio de Janeiro, which acts as a national reference center for respiratory viruses with the Brazilian Ministry of Health (MS) and as a reference for the World Health Organization.
A case of reinfection
The case patient that led to the alarm was a 45-year-old woman who is a health care executive. She had no comorbidities. The team had been following health care professionals and patients who had tested positive on reverse transcription–polymerase chain reaction (RT-PCR) testing more than once to understand whether they represented cases of prolonged viral persistence or new infections.
The woman had symptoms of viral infection on two occasions (May 26 and Oct. 26). On both occasions, results of RT-PCR testing for SARS-CoV-2 on nasopharyngeal samples were positive. In the first episode, the patient had diarrhea, myalgia, asthenia, and odynophagia for about 7 days. She returned to activities 21 days later. In the second episode, she had more severe symptoms that lasted longer, but she still did not require hospitalization.
“It was the first confirmed case of reinfection in Bahia, and in the second episode, we observed a mutation that could have an impact on the ability of antibodies to neutralize the virus,” Dr. Souza said. “The research continues with the investigation of cases in which the patient has a positive SARS-CoV-2 RT-PCR more than once in an interval greater than 45 days, to have a higher level of evidence.”
He stressed that “it is very important to reinforce measures to control the pandemic, social distance, use of masks, and speed up vaccination to be able to control the circulation of the virus, while monitoring the evolution of it.”
On alert for more cases
A person who twice tests positive for SARS-CoV-2 on real-time RT-PCR is suspected of having been reinfected, provided 90 or more days have elapsed between the two episodes, regardless of the condition observed. To confirm the suspected case, the samples must be sent to reference laboratories according to a plan established by the Ministry of Health in Brazil.
A health professional living in the Brazilian city of Natal represented the first confirmed case of reinfection by the new coronavirus in Brazil. That case was announced on Dec. 10, 2020.
“We communicated this case of reinfection to the MS in early December 2020. And the second sample already had the E484K mutation on the spike, as in the case of Bahia,” said Dr. Motta.
The first step in differentiating reinfection from persistence is to observe differences in the genotyping of the virus. For the technique to be successful, Dr. Souza said, researchers need a large amount of viral genetic material, which usually cannot be obtained.
“That is why there are many more suspected than confirmed cases,” Dr. Souza explained. He admitted that, although there are few cases, “it is increasingly clear that reinfection is a reality.”
Markers of mutations
What worried the researchers most was not only the possibility of reinfection but also the fact that preliminary analyses showed a specific mutation.
“The E484K mutation is present in a group of variants identified in South Africa that have been associated with increased infectivity and has been observed in a strain recently described in Brazil,” Dr. Souza said.
Mutations are expected, appear spontaneously, and in most cases have no effects on transmission or clinical outcome – they are simply used as markers and are useful for contact tracing or studying transmission routes. But some mutations can last because they provide an advantage for the pathogen, even if only momentary. In the case of SARS-CoV-2, mutations in the protein spike gene (S) are relevant because they may give clues to that advantage – as well as to changes in infectivity, transmission potential, antibodies, and response to vaccines.
A variant of the virus that has eight changes that affect the protein S gene – and several others in different genes – is behind the increase in the number of cases in London and southeastern England. Researchers from the University of São Paulo identified one of the factors that made this new variant – classified as B.1.1.7 – more infectious.
With bioinformatics tools, they found that the protein S gene in the new viral strain has a stronger molecular interaction with the ACE2 receptor, which is on the surface of human cells and to which the virus binds, making infection possible. The variant has already spread to the rest of the world, and the first two cases have been confirmed in Brazil by the Adolf Lutz Institute.
The alert for a new variant in Africa – similar to B.1.1.7 in the United Kingdom in that it carries nine changes in protein S at position 501 – was made by the Brazilian virologist Tulio de Oliveira, PhD.
“We found that this strain seems to be spreading much faster,” Dr. Oliveira, who is with the University of KwaZulu Natal, told the journal Science. His work first alerted British scientists to the importance of the position N501Y.
“The new variants just described in the United Kingdom and South Africa are slightly more transmissible and have already been identified in cases imported into Brazil,” Dr. Motta said. “Unfortunately, we believe it is only a matter of time before it becomes indigenous.”
The viral family grows
Viruses such as SARS-CoV-2 are classified into strains on the basis of small differences in their genetic material. Since Dec. 26, 2020, in addition to the British and South African variants, it appears the Carioca lineage also is a player.
In a preprint article, researchers analyzed the evolution of the epidemic in Rio de Janeiro from April 2020 until just before the new increase in incidence in December. They compared the complete sequences of the viral genome of 180 patients from different municipalities. The study, which is being jointly conducted by members of the Federal University of Rio de Janeiro and the National Laboratory for Scientific Computing, identified a new variant of SARS-CoV-2 that has five unique mutations (from one of the predominant strains). Concern arose because, in addition to those five genetic changes, many of the samples had a sixth – the well-known E484K mutation.
“The three lines – the U.K., South Africa, and Brazil – were almost synchronous publications, but there is no clear evidence that they have any kind of common ancestry,” Carolina M. Voloch, PhD, the article’s first author and a biologist and researcher at the Molecular Virology Laboratory and associate professor in the department of genetics at the Federal University of Rio de Janeiro, said in an interview.
Dr. Voloch’s research focuses on the use of bioinformatics tools to study the molecular, phylogenetic, and genomic evolution of viruses.
“The emergence of new strains is common for viruses,” she said. “It can be happening anywhere in the world at any time.”
She stressed that identifying when mutations emerge will help to define the new Brazilian lineage. Researchers are working to determine whether the neutralizing antibodies of patients who have been infected with other strains respond to this Rio de Janeiro strain.
“We hope to soon be sharing these results,” Dr. Voloch said.
The article’s authors estimated that the new strain likely appeared in early July. They say more analysis is needed to predict whether the changes have a major effect on viral infectivity, the host’s immune response, or the severity of the disease. Asked about the lineage that caused the reinfection in Bahia, Dr. Voloch said she hadn’t yet contacted the authors to conduct a joint analysis but added that the data disclosed in the preprint would not represent the same variant.
“There are only two of the five mutations that characterize the Rio de Janeiro lineage. However, it has the E484K mutation that is present in more than 94% of the samples of the new variant of Rio,” she said.
She added that there’s a possibility of reinfection by the lineage that’s circulating in Rio de Janeiro and in other states, as well as countries such as the United States, the United Kingdom, and Japan.
“The Carioca virus is being exported to the rest of the world,” Dr. Voloch said.
Virus’ diversity still unknown
Researchers now know that SARS-CoV-2 probably circulated silently in Brazil as early as February 2020 and reached all the nation’s regions before air travel was restricted. Since the first half of 2020, there have been two predominant strains.
“More than a dozen strains have been identified in Brazil, but more important than counting strains to identify the speed with which they arise – which is directly associated with the rate of infection, which is very high in the country,” said Dr. Motta.
The so-called variant of Rio de Janeiro, he said, has also been detected in other states in four regions of Brazil. The key to documenting variants is to get a more representative sample with genomes from other parts of the country.
As of Jan. 10, a total of 347,000 complete genome sequences had been shared globally through open databases since SARS-CoV-2 was first identified, but the contribution of countries is uneven. Although the cost and complexity of genetic sequencing has dropped significantly over time, effective sequencing programs still require substantial investments in personnel, equipment, reagents, and bioinformatics infrastructure.
According to Dr. Voloch, it will only be possible to combat the new coronavirus by knowing its diversity and understanding how it evolves. The Fiocruz Genomic Network has made an infographic available so researchers can track the strains circulating in Brazil. It›s the result of collaboration between researchers from Fiocruz and the GISAID Initiative, an international partnership that promotes rapid data sharing.
As of Jan. 5, researchers in Brazil had studied 1,897 genomes – not nearly enough.
“In Brazil, there is little testing and even less sequencing,” lamented Dr. Souza.
“In the U.K., 1 in 600 cases is sequenced. In Brazil it is less than 1 in 10 million cases,” Dr. Voloch added.
So far, no decisive factors for public health, such as greater virulence or greater transmissibility, have been identified in any of the strains established in Brazil. The million-dollar question is whether the emergence of new strains could have an impact on the effectiveness of vaccines being administered today.
“In one way or another, the vaccine is our best bet ever, even if in the future we identify escapist mutants and have to modify it,” Dr. Motta said. “It is what we do annually with influenza.”
Dr. Voloch, Dr. Motta, and Dr. Souza disclosed no relevant financial relationships.
A version of this article first appeared on the Portuguese edition of Medscape.com.
Hypertrophic Lichen Planus–like Eruption Following Pembrolizumab
To the Editor:
Pembrolizumab, a humanized monoclonal anti–programmed cell death protein 1 (PD-1) antibody, acts by blocking negative immune regulators such as PD-1.1 Since its approval by the US Food and Drug Administration in 2014, the use of PD-1 inhibitors such as pembrolizumab has dramatically increased, and they are now the standard of care for cancers such as melanoma, lung cancer, and renal cell carcinoma.2,3 With increased use comes a better understanding of the cutaneous adverse effects that may occur. To date, almost 50% of patients treated with PD-1 inhibitors will develop an adverse cutaneous reaction.4 Thus far, cases of patients developing vitiligo, bullous pemphigoid, psoriasis, granulomatous skin reactions, severe cutaneous reactions (ie, toxic epidermal necrolysis), lupus erythematosus, and lichenoid reactions have been described.3,5,6 There are fewer than 30 documented cases of lichenoid reactions due to anti–PD-1 treatment described in the literature, increasing the importance of case reports to demonstrate a full range of cutaneous findings.3 We present a case of a reaction to pembrolizumab with an eruption of lichenoid papules predominantly involving the hands and feet as well as nail changes.
A 60-year-old man with ocular melanoma metastatic to the right lung, transverse colon, and right axillary lymph nodes presented with a chief concern of growing skin lesions present for 6 weeks on the hands and feet. The lesions were tender to the touch and occasionally drained a clear fluid. He also reported nail fragility. Of note, the patient was being treated for metastatic melanoma with pembrolizumab infusions every 3 weeks, which started 6 weeks prior to the onset of the eruption.
Physical examination demonstrated lichenoid papules on the dorsal and ventral aspects of the hands and feet (Figure 1), as well as longitudinal ridging on numerous fingernails and mild koilonychia. A punch biopsy revealed lichenoid interface dermatitis with irregular epidermal hyperplasia (Figure 2). A diagnosis of hypertrophic lichen planus–like drug eruption in response to pembrolizumab was made and clobetasol cream was prescribed.
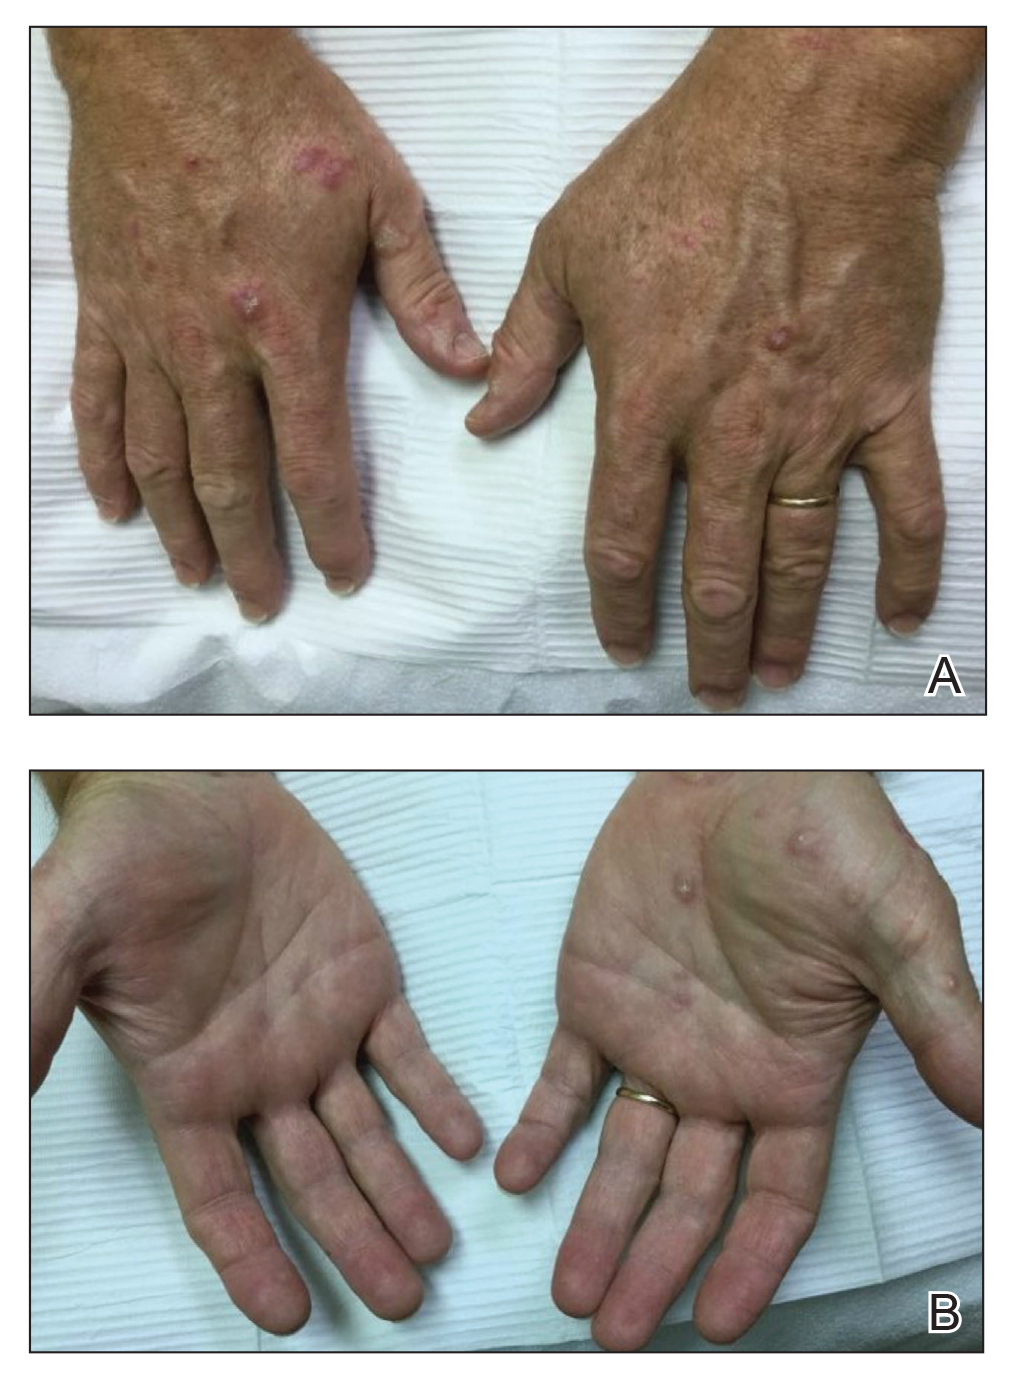

At 1-month follow-up, the patient reported notable improvement with clobetasol, and he was transitioned to tacrolimus ointment 0.1%. He continued to improve until a month later when he reported new lesions arising a week after a pembrolizumab infusion. He continued to use clobetasol cream for flares and tacrolimus ointment for maintenance.
Almost 3 months after the initial visit, the patient presented with inflammation around his right third fingernail of 1 week’s duration, with more notable fragility than his other nails. No trauma was described, and the nail abnormality was attributed to pembrolizumab. Clobetasol cream and biotin 3 mg daily resulted in improvement, and no other nails were affected in a similar way.
Programmed cell death protein 1 blockers are associated with a variety of adverse events including hypothyroidism, gastrointestinal abnormalities, fatigue, and skin disorders.7 In one study (N=83), cutaneous adverse drug events were found to occur in 42% (35/83) of patients following pembrolizumab therapy, with the most common cutaneous lesions being maculopapular eruptions (29% [24/83]), pruritus (12% [10/83]), and hypopigmentation (8% [7/83]).5
A total of 29 cases of lichenoid dermatitis following anti–PD-1 therapy have been described in the literature.3 Cases range from an eruption of photodistributed hyperkeratotic papules and plaques to hypertrophic vesiculobullous lesions.3,6 Suggested pathophysiology involves blocking the interaction of programmed death ligand 1 on keratinocytes with PD-1 on T cells.3 Management typically includes topical or systemic steroids. Cyclosporine and acitretin also have been successful in a small number of patients. Most patients continue anti–PD-1 treatment with systemic therapy.3
Our patient represents a similar lichenoid eruption; however, the distribution on the dorsal and ventral aspects of the hands and feet as well as nail dystrophy make the presentation unique. Anticancer drugs that increase the T-cell immune response by altering the complex signaling among T cells, antigen-presenting cells, and tumor cells have been associated with cutaneous eruptions. Although the exact mechanism is still not fully understood, clinical suspicion of a pembrolizumab reaction should remain high on the differential in the setting of hyperkeratotic papules in association with anti–PD-1 therapy.
- Homet Moreno B, Ribas A. Anti-programmed cell death protein-1/ligand-1 therapy in different cancers. Br J Cancer. 2015;112:1421-1427.
- Robert C, Ribas A, Wolchok JD, et al. Anti-programmed-death-receptor-1 treatment with pembrolizumab in ipilimumab-refractory advanced melanoma: a randomised dose-comparison cohort of a phase 1 trial. Lancet. 2014;384:1109-1117.
- Simonsen AB, Kaae J, Elleback E, et al. Cutaneous adverse reactions to anti-PD-1 treatment: a systematic review. J Am Acad Dermatol. 2020;83:1415-1424.
- Hwang SJ, Carlos G, Wakade D, et al. Cutaneous adverse events (AEs) of anti-programmed cell death (PD)-1 therapy in patients with metastatic melanoma: a single-institution cohort. J Am Acad Dermatol. 2016;74:455-461.
- Sanlorenzo M, Vujic I, Daud A, et al. Pembrolizumab cutaneous adverse events and their association with disease progression. JAMA Dermatol. 2015;151:1206-1212.
- Joseph RW, Cappel M, Goedjen B, et al. Lichenoid dermatitis in three patients with metastatic melanoma treated with anti-PD-1 therapy. Cancer Immunol Res. 2015;3:18-22.
- Hamid O, Robert C, Daud A, et al. Safety and tumor responses with lambrolizumab (anti-PD-1) in melanoma. N Engl J Med. 2013;369:134-144.
To the Editor:
Pembrolizumab, a humanized monoclonal anti–programmed cell death protein 1 (PD-1) antibody, acts by blocking negative immune regulators such as PD-1.1 Since its approval by the US Food and Drug Administration in 2014, the use of PD-1 inhibitors such as pembrolizumab has dramatically increased, and they are now the standard of care for cancers such as melanoma, lung cancer, and renal cell carcinoma.2,3 With increased use comes a better understanding of the cutaneous adverse effects that may occur. To date, almost 50% of patients treated with PD-1 inhibitors will develop an adverse cutaneous reaction.4 Thus far, cases of patients developing vitiligo, bullous pemphigoid, psoriasis, granulomatous skin reactions, severe cutaneous reactions (ie, toxic epidermal necrolysis), lupus erythematosus, and lichenoid reactions have been described.3,5,6 There are fewer than 30 documented cases of lichenoid reactions due to anti–PD-1 treatment described in the literature, increasing the importance of case reports to demonstrate a full range of cutaneous findings.3 We present a case of a reaction to pembrolizumab with an eruption of lichenoid papules predominantly involving the hands and feet as well as nail changes.
A 60-year-old man with ocular melanoma metastatic to the right lung, transverse colon, and right axillary lymph nodes presented with a chief concern of growing skin lesions present for 6 weeks on the hands and feet. The lesions were tender to the touch and occasionally drained a clear fluid. He also reported nail fragility. Of note, the patient was being treated for metastatic melanoma with pembrolizumab infusions every 3 weeks, which started 6 weeks prior to the onset of the eruption.
Physical examination demonstrated lichenoid papules on the dorsal and ventral aspects of the hands and feet (Figure 1), as well as longitudinal ridging on numerous fingernails and mild koilonychia. A punch biopsy revealed lichenoid interface dermatitis with irregular epidermal hyperplasia (Figure 2). A diagnosis of hypertrophic lichen planus–like drug eruption in response to pembrolizumab was made and clobetasol cream was prescribed.
At 1-month follow-up, the patient reported notable improvement with clobetasol, and he was transitioned to tacrolimus ointment 0.1%. He continued to improve until a month later when he reported new lesions arising a week after a pembrolizumab infusion. He continued to use clobetasol cream for flares and tacrolimus ointment for maintenance.
Almost 3 months after the initial visit, the patient presented with inflammation around his right third fingernail of 1 week’s duration, with more notable fragility than his other nails. No trauma was described, and the nail abnormality was attributed to pembrolizumab. Clobetasol cream and biotin 3 mg daily resulted in improvement, and no other nails were affected in a similar way.
Programmed cell death protein 1 blockers are associated with a variety of adverse events including hypothyroidism, gastrointestinal abnormalities, fatigue, and skin disorders.7 In one study (N=83), cutaneous adverse drug events were found to occur in 42% (35/83) of patients following pembrolizumab therapy, with the most common cutaneous lesions being maculopapular eruptions (29% [24/83]), pruritus (12% [10/83]), and hypopigmentation (8% [7/83]).5
A total of 29 cases of lichenoid dermatitis following anti–PD-1 therapy have been described in the literature.3 Cases range from an eruption of photodistributed hyperkeratotic papules and plaques to hypertrophic vesiculobullous lesions.3,6 Suggested pathophysiology involves blocking the interaction of programmed death ligand 1 on keratinocytes with PD-1 on T cells.3 Management typically includes topical or systemic steroids. Cyclosporine and acitretin also have been successful in a small number of patients. Most patients continue anti–PD-1 treatment with systemic therapy.3
Our patient represents a similar lichenoid eruption; however, the distribution on the dorsal and ventral aspects of the hands and feet as well as nail dystrophy make the presentation unique. Anticancer drugs that increase the T-cell immune response by altering the complex signaling among T cells, antigen-presenting cells, and tumor cells have been associated with cutaneous eruptions. Although the exact mechanism is still not fully understood, clinical suspicion of a pembrolizumab reaction should remain high on the differential in the setting of hyperkeratotic papules in association with anti–PD-1 therapy.
- Homet Moreno B, Ribas A. Anti-programmed cell death protein-1/ligand-1 therapy in different cancers. Br J Cancer. 2015;112:1421-1427.
- Robert C, Ribas A, Wolchok JD, et al. Anti-programmed-death-receptor-1 treatment with pembrolizumab in ipilimumab-refractory advanced melanoma: a randomised dose-comparison cohort of a phase 1 trial. Lancet. 2014;384:1109-1117.
- Simonsen AB, Kaae J, Elleback E, et al. Cutaneous adverse reactions to anti-PD-1 treatment: a systematic review. J Am Acad Dermatol. 2020;83:1415-1424.
- Hwang SJ, Carlos G, Wakade D, et al. Cutaneous adverse events (AEs) of anti-programmed cell death (PD)-1 therapy in patients with metastatic melanoma: a single-institution cohort. J Am Acad Dermatol. 2016;74:455-461.
- Sanlorenzo M, Vujic I, Daud A, et al. Pembrolizumab cutaneous adverse events and their association with disease progression. JAMA Dermatol. 2015;151:1206-1212.
- Joseph RW, Cappel M, Goedjen B, et al. Lichenoid dermatitis in three patients with metastatic melanoma treated with anti-PD-1 therapy. Cancer Immunol Res. 2015;3:18-22.
- Hamid O, Robert C, Daud A, et al. Safety and tumor responses with lambrolizumab (anti-PD-1) in melanoma. N Engl J Med. 2013;369:134-144.
Practice Points
- With an increased use of immunotherapy medications such as pembrolizumab for various cancers, it is important that dermatologists are aware of the wide range of adverse cutaneous reactions that can occur, including lichenoid reactions.
- Hypertrophic lichen planus should be considered in the differential diagnosis of patients with cutaneous lesions in addition to nail findings developing after starting programmed cell death protein 1 inhibitor therapy.

President Biden to up states’ vaccine supplies, targets more doses
Seven days into his presidency, Joe Biden announced that he is taking new steps to speed vaccines to Americans.
The president said he would increase the supply of vaccines to states from 8.6 million doses to 10 million doses per week, a 16% increase, for at least the next 3 weeks.
He said he was working to give states more advanced notice of their allotments so they could better plan their campaigns. He also said doses would be doled out based on population.
“We will both increase the supply and give our state and local partners more certainty about when doses will arrive,” he said Tuesday.
Finally, Mr. Biden announced that the United States would “soon be able to confirm” the purchase of 200 million more doses of the Pfizer and Moderna vaccines – 100 million of each – to effectively double the nation’s supply by “early summer.” That would increase the nation’s supply enough to fully vaccinate 300 million Americans by fall.
Mr. Biden said he was also working to shift the focus to getting more doses to economically disadvantaged communities and rural areas, which have fallen further behind as the vaccine rollout has faltered.
Even with these steps, Mr. Biden stressed that it would take months for vaccines to curb infections and deaths. He said, for the time being, masks, not vaccines, are the best way to save lives.
“The brutal truth is its going to take months before we get the majority of Americans vaccinated. Months,” he said, adding that wearing masks until at least April could save to save 50,000 lives.
“Let me be clear,” Mr. Biden said, “Things are going to get worse before they get better.
“We didn’t get into this mess overnight. It’s going to take months for us to turn things around. But let me be equally clear we’re going to get through this. We will defeat this pandemic,” he said.
A version of this article first appeared on WebMD.com.
Racial, social inequities persist in IBD
Although inflammatory bowel disease (IBD) affects primarily White patients, about one-quarter of cases are found in non-White racial and ethnic groups. Various factors have combined to lead to disparities in treatment and outcomes for non-Whites with IBD.
Ethnic and racial disparities, along with socioeconomic factors, were the subject of a presentation by Ruby Greywoode, MD, at the annual congress of the Crohn’s & Colitis Foundation and the American Gastroenterological Association.
“Historical and present-day realities of racial inequity and factors that contribute to socioeconomic status [include] educational and housing policies, employment practices, and generational wealth. Addressing health disparities requires acknowledging these systemic factors,” said Dr. Greywoode, who is with Montefiore Medical Center in New York.
An important concept in discussing health disparity is social determinants of health, which refers to nonbiological factors that affect health and health outcomes. These are “the conditions in which people live, work, learn, and play that affect their health and their quality of life,” said Dr. Greywoode.
Dr. Greywoode shared examples of social determinants that affect economic stability and financial worry. One study found that one in six IBD patients reported not taking their medications because of cost considerations. A survey of about 900 adults showed that 1 in 4 delayed medical care – half of those because of cost; patients who delayed care were 2.5 times more likely to report an IBD flare in the previous year.
Another important issue is food insecurity. Other presenters at the session emphasized the importance of high-quality nutrition in IBD, and Dr. Greywoode presented one survey showing that only 9% of patients who had both food security and social support reported cost-related medication nonadherence. Among those that had either food insecurity or poor social support, 12% reported cost-related medication nonadherence, but the proportion jumped to 57% among patients who had both food insecurity and lack of social support.
Session comoderator Kelly Issokson noted that socioeconomic factors often interfere with adoption of healthy diets. Whole foods and plant-based foods are expensive, and the financial pressures of the COVID-19 epidemic have made that worse. “Millions of people are slipping into poverty and food insecurity. This is one of the things she highlighted as factors in medication nonadherence,” said Ms. Issokson, who is the clinical nutritional coordinator at the digestive disease clinic at Cedars-Sinai Medical Center in Los Angeles.

Dr. Greywoode also described studies that looked at race, socioeconomic status, and IBD outcomes. A review from 2013 showed disparities among Whites, African Americans, and Hispanics with respect to undergoing ulcerative colitis–related colectomy and Crohn’s disease–related bowel resection. Ulcerative colitis patients on Medicaid had 230% greater in-patient mortality, compared with patients with private insurance, even after adjustment for multiple confounders.
But inequities are not static. “Since this publication, we have numerous other studies drawing conclusions that sometimes agree with and sometimes conflict with it. My belief is that health disparities in IBD will continue to be an active area of research. We know that it takes vigilance to identify, track, and address any disparities when they do arise,” said Dr. Greywoode.
Dr. Greywoode also noted that phenotypic differences based on race and ethnicity influence disparities. She showed results from a meta-analysis that found a difference in the frequency of perianal Crohn’s disease by race and ethnicity; the highest frequency occurred in Black patients (31%), followed by Asians (22%), Whites (14%), and Hispanics (13%). Another study showed that African American patients with Crohn’s disease were more likely to develop a new abscess (adjusted odds ratio, 2.27; 95% confidence interval, 1.31-3.93) or anal fissure (aOR, 1.76; 95% CI, 1.01-3.07), and were also more likely to be initiated on an anti–tumor necrosis factor drug (aOR, 1.85; 95% CI, 1.09-3.14).
Those differences underscore the need to recognize that IBD is not just a disease for White patients. “As we move forward in IBD research, we recognize that individuals of European ancestry are not the only ones who have IBD. There is a growing diverse racial and ethnic population with IBD,” said Dr. Greywoode.
She noted that, in the United States, it is estimated that about one in four adult patients are non-Hispanic African American, Hispanic, Asians, or other ethnicities. Nevertheless, Whites are overrepresented among participants in IBD clinical trials. Some trials are composed of as much as 95% White patients, and sometimes race isn’t even listed. “It’s unclear if [race/ethnicity data are] not collected or not deemed important, but we know that what is not collected is not measured, and what is not measured can’t be evaluated, either to praise or constructively criticize,” said Dr. Greywoode.
Fortunately, there are efforts in place to improve representation in clinical trials. There has been a mandate for almost 3 decades that federally funded research must include racial and ethnic minorities who have been traditionally underrepresented. The Food and Drug Administration has also provided guidance to industry to improve diversity in clinical trial participation, and industry groups have developed strategies, including improved representation among investigators and related early-career development programs. At the community and independent health care practice levels, clinical trial networks encourage patient participation with regulatory and data management support to bolster practices with insufficient resources.

Underrepresentation in clinical trials resonated with comoderator Tina Aswani Omprakash, who is a patient advocate and a master’s in public health student at the Icahn School of Medicine at Mount Sinai, New York. She called for greater awareness among physicians that IBD can occur among people of all backgrounds. “[Providers] would look at me and [say]: ‘There’s no way that, as a South Asian woman, you have that kind of disease.’ There’s that lack of believability,” said Ms. Aswani Omprakash.
Greater recognition of the diversity of patients, as well as the phenotypic differences found among ethnicities, could also inform clinical trial participation and, ultimately, more personalized medicine. “We have to look at these things, observe how they’re affecting populations differently, so that we can have proper medication solutions,” said Ms. Aswani Omprakash.
Dr. Greywoode and Ms. Issokson have no relevant financial disclosures. Ms. Aswani Omprakash has consulted for Genentech, AbbVie, Janssen, and Arena.
The AGA applauds researchers who are working to raise our awareness of health disparities in digestive diseases. The AGA is committed to addressing this important societal issue head on. Learn more about AGA’s commitment through the AGA Equity Project.
Updated Feb. 17, 2021.
Although inflammatory bowel disease (IBD) affects primarily White patients, about one-quarter of cases are found in non-White racial and ethnic groups. Various factors have combined to lead to disparities in treatment and outcomes for non-Whites with IBD.
Ethnic and racial disparities, along with socioeconomic factors, were the subject of a presentation by Ruby Greywoode, MD, at the annual congress of the Crohn’s & Colitis Foundation and the American Gastroenterological Association.
“Historical and present-day realities of racial inequity and factors that contribute to socioeconomic status [include] educational and housing policies, employment practices, and generational wealth. Addressing health disparities requires acknowledging these systemic factors,” said Dr. Greywoode, who is with Montefiore Medical Center in New York.
An important concept in discussing health disparity is social determinants of health, which refers to nonbiological factors that affect health and health outcomes. These are “the conditions in which people live, work, learn, and play that affect their health and their quality of life,” said Dr. Greywoode.
Dr. Greywoode shared examples of social determinants that affect economic stability and financial worry. One study found that one in six IBD patients reported not taking their medications because of cost considerations. A survey of about 900 adults showed that 1 in 4 delayed medical care – half of those because of cost; patients who delayed care were 2.5 times more likely to report an IBD flare in the previous year.
Another important issue is food insecurity. Other presenters at the session emphasized the importance of high-quality nutrition in IBD, and Dr. Greywoode presented one survey showing that only 9% of patients who had both food security and social support reported cost-related medication nonadherence. Among those that had either food insecurity or poor social support, 12% reported cost-related medication nonadherence, but the proportion jumped to 57% among patients who had both food insecurity and lack of social support.
Session comoderator Kelly Issokson noted that socioeconomic factors often interfere with adoption of healthy diets. Whole foods and plant-based foods are expensive, and the financial pressures of the COVID-19 epidemic have made that worse. “Millions of people are slipping into poverty and food insecurity. This is one of the things she highlighted as factors in medication nonadherence,” said Ms. Issokson, who is the clinical nutritional coordinator at the digestive disease clinic at Cedars-Sinai Medical Center in Los Angeles.
Dr. Greywoode also described studies that looked at race, socioeconomic status, and IBD outcomes. A review from 2013 showed disparities among Whites, African Americans, and Hispanics with respect to undergoing ulcerative colitis–related colectomy and Crohn’s disease–related bowel resection. Ulcerative colitis patients on Medicaid had 230% greater in-patient mortality, compared with patients with private insurance, even after adjustment for multiple confounders.
But inequities are not static. “Since this publication, we have numerous other studies drawing conclusions that sometimes agree with and sometimes conflict with it. My belief is that health disparities in IBD will continue to be an active area of research. We know that it takes vigilance to identify, track, and address any disparities when they do arise,” said Dr. Greywoode.
Dr. Greywoode also noted that phenotypic differences based on race and ethnicity influence disparities. She showed results from a meta-analysis that found a difference in the frequency of perianal Crohn’s disease by race and ethnicity; the highest frequency occurred in Black patients (31%), followed by Asians (22%), Whites (14%), and Hispanics (13%). Another study showed that African American patients with Crohn’s disease were more likely to develop a new abscess (adjusted odds ratio, 2.27; 95% confidence interval, 1.31-3.93) or anal fissure (aOR, 1.76; 95% CI, 1.01-3.07), and were also more likely to be initiated on an anti–tumor necrosis factor drug (aOR, 1.85; 95% CI, 1.09-3.14).
Those differences underscore the need to recognize that IBD is not just a disease for White patients. “As we move forward in IBD research, we recognize that individuals of European ancestry are not the only ones who have IBD. There is a growing diverse racial and ethnic population with IBD,” said Dr. Greywoode.
She noted that, in the United States, it is estimated that about one in four adult patients are non-Hispanic African American, Hispanic, Asians, or other ethnicities. Nevertheless, Whites are overrepresented among participants in IBD clinical trials. Some trials are composed of as much as 95% White patients, and sometimes race isn’t even listed. “It’s unclear if [race/ethnicity data are] not collected or not deemed important, but we know that what is not collected is not measured, and what is not measured can’t be evaluated, either to praise or constructively criticize,” said Dr. Greywoode.
Fortunately, there are efforts in place to improve representation in clinical trials. There has been a mandate for almost 3 decades that federally funded research must include racial and ethnic minorities who have been traditionally underrepresented. The Food and Drug Administration has also provided guidance to industry to improve diversity in clinical trial participation, and industry groups have developed strategies, including improved representation among investigators and related early-career development programs. At the community and independent health care practice levels, clinical trial networks encourage patient participation with regulatory and data management support to bolster practices with insufficient resources.
Underrepresentation in clinical trials resonated with comoderator Tina Aswani Omprakash, who is a patient advocate and a master’s in public health student at the Icahn School of Medicine at Mount Sinai, New York. She called for greater awareness among physicians that IBD can occur among people of all backgrounds. “[Providers] would look at me and [say]: ‘There’s no way that, as a South Asian woman, you have that kind of disease.’ There’s that lack of believability,” said Ms. Aswani Omprakash.
Greater recognition of the diversity of patients, as well as the phenotypic differences found among ethnicities, could also inform clinical trial participation and, ultimately, more personalized medicine. “We have to look at these things, observe how they’re affecting populations differently, so that we can have proper medication solutions,” said Ms. Aswani Omprakash.
Dr. Greywoode and Ms. Issokson have no relevant financial disclosures. Ms. Aswani Omprakash has consulted for Genentech, AbbVie, Janssen, and Arena.
The AGA applauds researchers who are working to raise our awareness of health disparities in digestive diseases. The AGA is committed to addressing this important societal issue head on. Learn more about AGA’s commitment through the AGA Equity Project.
Updated Feb. 17, 2021.
FROM THE CROHN’S & COLITIS CONGRESS
The current and future state of uterus transplantation
Since the first baby was born after a uterus transplantation in Sweden in 2014, uterus transplantation has been rapidly transitioning toward clinical reality.1 Several teams in the United States and multiple teams worldwide have performed the procedure, with the total number of worldwide surgeries performed nearing 100.

Uterus transplantation is the first and only true treatment for women with absolute uterine factor infertility – estimated to affect 1 in 500 women – and is filling an unmet need for this population of women. Women who have sought participation in uterus transplantation research have had complex and meaningful reasons and motivations for doing so.2 Combined with an accumulation of successful pregnancies, this makes continued research and technical improvement a worthy endeavor.
Most of the births thus far have occurred through the living-donor model; the initial Swedish trial involved nine women, seven of whom completed the procedure with viable transplants from living donors, and gave birth to eight healthy children. (Two required hysterectomy prior to attempted embryo transfer.3)
The Cleveland Clinic opted to build its first – and still ongoing – trial focusing on deceased-donor uterus transplants on the premise that such an approach obviates any risk to the donor and presents the fewest ethical challenges at the current time. Of eight uterus transplants performed thus far at the Cleveland Clinic, there have been three live births and two graft failures. As of early 2021, there was one ongoing pregnancy and two patients in preparation for embryo transfer.

Thus far, neither the living- nor deceased-donor model of uterus transplantation has been demonstrated to be superior. However, as data accrues from deceased donor studies, we will be able to more directly compare outcomes.
In the meantime, alongside a rapid ascent of clinical landmarks – the first live birth in the United States from living-donor uterus transplantation in 2017 at Baylor University Medical Center in Houston,4 for instance, and the first live birth in the United States from deceased-donor uterus transplantation in 2019 at the Cleveland Clinic – there have been significant improvements in surgical retrieval of the uterus and in the optimization of graft performance.5
Most notably, the utero-ovarian vein has been used successfully in living donors to achieve venous drainage of the graft. This has lessened the risks of deep pelvic dissection in the living donor and made the transition to laparoscopic and robotic approaches in the living donor much easier.
Donor procurement, venous drainage
Adequate circulatory inflow and outflow for the transplanted uterus are essential both for the prevention of ischemia and thrombosis, which have been major causes of graft failure, and for meeting the increased demands of blood flow during pregnancy. Of the two, the outflow is the more challenging component.
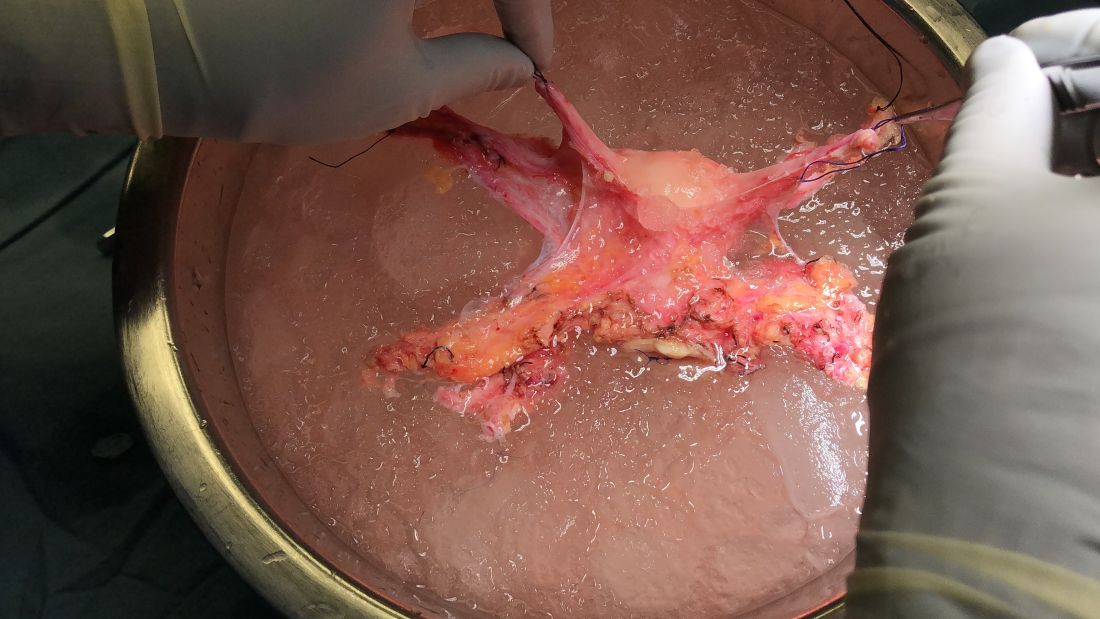
Venous drainage traditionally has been accomplished through the use of the uterine veins, which drain into the internal iliac veins; often the vascular graft will include a portion of the internal iliac vessel which can be connected via anastomoses to the external iliac vein classically in deceased donors. Typically, the gynecologic surgeon on the team performs the vaginal anastomosis and suspension of the uterus, while the transplant surgeons perform the venous and arterial anastomoses.
In the living-donor model, procurement and dissection of these often unpredictable and tortuous complexes in the deep pelvis – particularly the branching uterine veins that lie in close proximity to the ureter, bladder, other blood vessels, and rectum – can be risky. The anatomic variants in the uterine vein are numerous, and even in one patient, a comprehensive dissection on one side cannot be expected to be mirrored on the contralateral side.

In addition to the risk of injury to the donor, the anastomosis may be unsuccessful as the veins are thinly walled and challenging to suture. As such, multiple modifications have been developed, often adapted to the donor’s anatomy and the caliber and accessibility of vessels. Preoperative vascular imaging with CT and/or MRI may help to identify suitable candidates and also may facilitate presurgical planning of which vessels may be selected for use.
Recently, surgeons performing living-donor transplantations have successfully used the more accessible and less risky ovarian and/or utero-ovarian veins for venous anastomosis. In 2019, for instance, a team in Pune, India, reported laparoscopically dissecting the donor ovarian veins and a portion of the internal iliac artery, and completing anastomosis with bilateral donor internal iliac arteries to recipient internal iliac arteries, and bilateral donor ovarian veins to recipient external iliac veins.6 It is significant that these smaller-caliber vessels were found to able to support the uterus through pregnancy.

We must be cautious, however, to avoid removing donors’ ovaries. Oophorectomy for women in their 40s can result in significant long-term medical sequelae. Surgeons at Baylor have achieved at least one live birth after harvesting the donor’s utero-ovarian veins while conserving the ovaries – a significant advancement for the living-donor model.4
There is tremendous interest in developing minimally invasive approaches to further reduce living-donor risk. The Swedish team has completed a series of eight robotic hysterectomies in living-donor uterus transplantations as part of a second trial. Addressing the reality of a learning curve, their study was designed around a step-wise approach, mastering initial steps first – e.g., dissections of the uterovaginal fossa, arteries, and ureters – and ultimately converting to laparotomy.7 In the United States, Baylor University has now completed at least five completely robotic living-donor hysterectomies with complete vaginal extraction.
Published data on robotic surgery suggests that surgical access and perioperative visualization of the vessels may be improved. And as minimally invasive approaches are adopted and improved, the length of donor surgery – 10-13 hours of operating room time in the original Swedish series – should diminish, as should the morbidity associated with laparotomy.

Surgical acquisition of a uterine graft from a deceased donor diminishes concerns for injury to nearby structures. Therefore, although it is a technically similar procedure, a deceased-donor model allows more flexibility with the length, caliber, and number of vessels that can be used for anastomosis. The internal iliac vessels and even portions of the external iliac vessels and ovarian vessels can be used to allow maximum flexibility.8
Surgical technique for uterus recipients
For the recipient surgery, entry is achieved via a midline, vertical laparotomy. The external iliac vessels are exposed, and the sites of vascular anastomoses are identified. The peritoneal reflection of the bladder is identified and dissected away to expose the anterior vagina, and the vagina is opened to a diameter that matches the donor, typically using a monopolar electrosurgical cutting instrument.
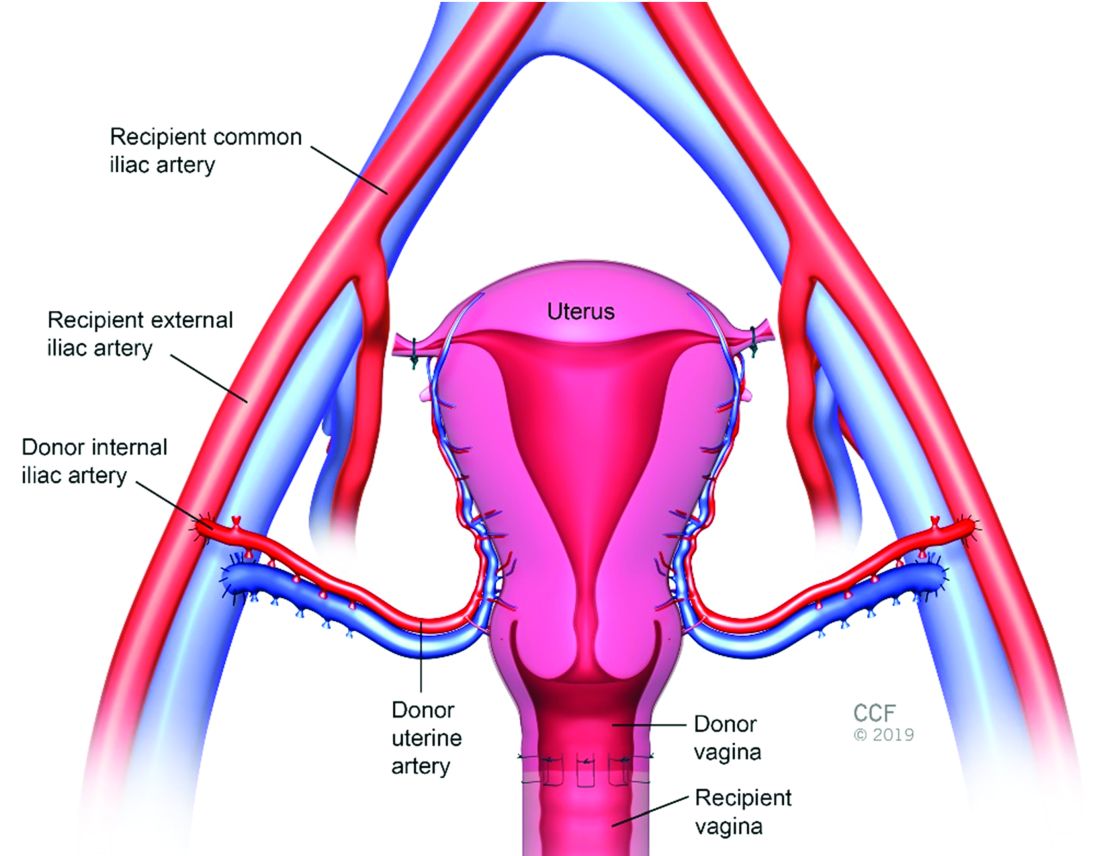
The vault of the donor vagina will be attached to the recipient’s existing vagina or vaginal pouch. It is important to identify recipient vaginal mucosa and incorporate it into the vaginal anastomosis to reduce the risk of vaginal stricture. We recommend that the vaginal mucosa be tagged with PDS II sutures or grasped with allis clamps to prevent retraction.
Surgical teams have taken multiple approaches to vaginal anastomosis. The Cleveland Clinic has used both a running suture as well as a horizontal mattress stitch for closure. For the latter, a 30-inch double-armed 2.0 Vicryl allows for complete suturing of the recipient vagina – with eight stitches placed circumferentially – before the uterus is placed. Both ends of the suture are passed intra-abdominal to intravaginal in the recipient.9
Once the donor uterus is suspended, attention focuses on vascular anastomosis, with bilateral end-to-side anastomosis between the donor anterior division of the internal iliac arteries and the external iliac vessels of the recipient, and with venous drainage commonly achieved through the uterine veins draining into the internal or external iliac vein of the recipient. As mentioned, recent cases involving living donors have also demonstrated success with the use of ovarian and/or utero-ovarian veins. Care should be taken to avoid having tension or twisting across the anastomosis.
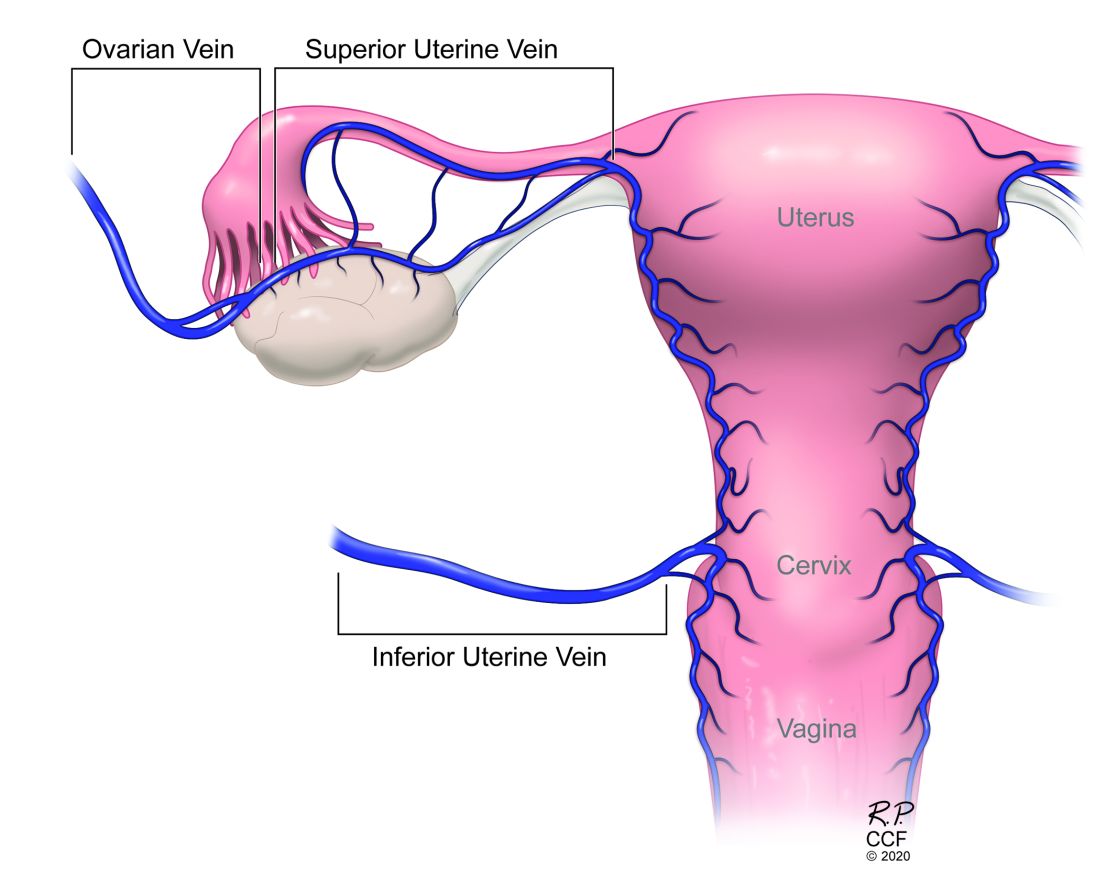
After adequate graft perfusion is confirmed, with the uterus turning from a dusky color to a pink and well-perfused organ, the vaginal anastomosis is completed, with the arms of the double-armed suture passed through the donor vagina, from intravaginal to intra-abdominal. Tension should be evenly spread along the recipient and donor vagina in order to reduce the formation of granulation tissue and the severity of future vaginal stricturing.
For uterine fixation, polypropylene sutures are placed between the graft uterosacral ligaments and recipient uterine rudiments, and between the graft round ligaments and the recipient pelvic side wall at the level of the deep inguinal ring.
Current uterus transplantation protocols require removal of the uterus after one or two live births are achieved, so that recipients will not be exposed to long-term immunosuppression.
Complications and controversies
Postoperative vaginal strictures can make embryo transfer difficult and are a common complication in both living- and deceased-donor models. The Cleveland Clinic team has applied techniques from vaginal reconstructive surgery to try to reduce the occurrence of postoperative strictures – mainly increasing attention paid to anastomosis tissue–site preparation and closure of the anastomosis using a tension-free interrupted suture technique, as described above.9 The jury is out on whether such changes are sufficient, and a more complete understanding of the causes of vaginal stricture is needed.
Other perioperative complications include infection and graft thrombosis, both of which typically result in urgent graft hysterectomy. During pregnancy, one of our patients experienced abnormal placentation, though this was not thought to be related to uterus transplantation.5
The U.S. Uterus Transplant Consortium (USUTC) is a group of active programs that are sharing ideas and outcomes and advocating for continued research in this rapidly developing field. Uterine transplants require collaboration with transplant surgery, transplant medicine, infectious disease, gynecologic surgery, high-risk obstetrics, and other specialties. While significant progress has been made in a short period of time, uterine transplantation is still in its early stages, and transplants should be done in institutions that have the capacity for mentorship, bioethical oversight, and long-term follow-up of donors, recipients, and offspring.
The USUTC has recently proposed guidelines for nomenclature related to operative technique, vascular anatomy, and uterine transplantation outcomes.10 It proposes standardizing the names for the four veins originating from the uterus (to eliminate current inconsistency), which will be important as optimal strategies for vascular anastomoses are discussed and determined.
In addition, the consortium is creating a registry for the rigorous collection of data on procedures and outcomes (from menstruation and pregnancy through delivery, graft removal, and long-term follow-up). A registry has also been proposed by the International Society for Uterine Transplantation.
A major question remains in our field: Is the living-donor or deceased-donor uterus transplant the best approach? Knowledge of the quality of the uterus is greater preoperatively within a living-donor model, but no matter how minimally invasive the technique, the donor still assumes some risk of prolonged surgery and extensive pelvic dissection for a transplant that is not lifesaving.
On the other hand, deceased-donor transplants require additional layers of organization and coordination, and the availability of suitable deceased-donor uteri will likely not be sufficient to meet the current demand. Many of us in the field believe that the future of uterine transplantation will involve some combination of living- and deceased-donor transplants – similar to other solid organ transplant programs.
Dr. Flyckt and Dr. Richards reported that they have no relevant financial disclosures.
Correction, 2/2/21: An earlier version of this article misstated Dr. Richards' name in the photo caption.
References
1. Lancet. 2015;14:385:607-16.
2. AJOB Empir Bioeth. 2019;10(1):23-5.
3. Transplantation. 2020;104(7):1312-5.
4. Am J Transplant. 2018;18(5):1270-4.
5. Am J Obstet Gynecol. 2020;223(2):143-51.
6. J Minimally Invasive Gynecol. 2019;26:628-35.
7. Acta Obstet Gynecol Scand. 2020;99(9):1222-9.
8. Fertil Steril. 2018;110(1):183.
9. Fertil Steril. 2020 Jul 16. doi: 10.1016/j.fertnstert.2020.05.017
10 Am J Transplant. 2020;20(12):3319-25.
Since the first baby was born after a uterus transplantation in Sweden in 2014, uterus transplantation has been rapidly transitioning toward clinical reality.1 Several teams in the United States and multiple teams worldwide have performed the procedure, with the total number of worldwide surgeries performed nearing 100.
Uterus transplantation is the first and only true treatment for women with absolute uterine factor infertility – estimated to affect 1 in 500 women – and is filling an unmet need for this population of women. Women who have sought participation in uterus transplantation research have had complex and meaningful reasons and motivations for doing so.2 Combined with an accumulation of successful pregnancies, this makes continued research and technical improvement a worthy endeavor.
Most of the births thus far have occurred through the living-donor model; the initial Swedish trial involved nine women, seven of whom completed the procedure with viable transplants from living donors, and gave birth to eight healthy children. (Two required hysterectomy prior to attempted embryo transfer.3)
The Cleveland Clinic opted to build its first – and still ongoing – trial focusing on deceased-donor uterus transplants on the premise that such an approach obviates any risk to the donor and presents the fewest ethical challenges at the current time. Of eight uterus transplants performed thus far at the Cleveland Clinic, there have been three live births and two graft failures. As of early 2021, there was one ongoing pregnancy and two patients in preparation for embryo transfer.
Thus far, neither the living- nor deceased-donor model of uterus transplantation has been demonstrated to be superior. However, as data accrues from deceased donor studies, we will be able to more directly compare outcomes.
In the meantime, alongside a rapid ascent of clinical landmarks – the first live birth in the United States from living-donor uterus transplantation in 2017 at Baylor University Medical Center in Houston,4 for instance, and the first live birth in the United States from deceased-donor uterus transplantation in 2019 at the Cleveland Clinic – there have been significant improvements in surgical retrieval of the uterus and in the optimization of graft performance.5
Most notably, the utero-ovarian vein has been used successfully in living donors to achieve venous drainage of the graft. This has lessened the risks of deep pelvic dissection in the living donor and made the transition to laparoscopic and robotic approaches in the living donor much easier.
Donor procurement, venous drainage
Adequate circulatory inflow and outflow for the transplanted uterus are essential both for the prevention of ischemia and thrombosis, which have been major causes of graft failure, and for meeting the increased demands of blood flow during pregnancy. Of the two, the outflow is the more challenging component.
Venous drainage traditionally has been accomplished through the use of the uterine veins, which drain into the internal iliac veins; often the vascular graft will include a portion of the internal iliac vessel which can be connected via anastomoses to the external iliac vein classically in deceased donors. Typically, the gynecologic surgeon on the team performs the vaginal anastomosis and suspension of the uterus, while the transplant surgeons perform the venous and arterial anastomoses.
In the living-donor model, procurement and dissection of these often unpredictable and tortuous complexes in the deep pelvis – particularly the branching uterine veins that lie in close proximity to the ureter, bladder, other blood vessels, and rectum – can be risky. The anatomic variants in the uterine vein are numerous, and even in one patient, a comprehensive dissection on one side cannot be expected to be mirrored on the contralateral side.
In addition to the risk of injury to the donor, the anastomosis may be unsuccessful as the veins are thinly walled and challenging to suture. As such, multiple modifications have been developed, often adapted to the donor’s anatomy and the caliber and accessibility of vessels. Preoperative vascular imaging with CT and/or MRI may help to identify suitable candidates and also may facilitate presurgical planning of which vessels may be selected for use.
Recently, surgeons performing living-donor transplantations have successfully used the more accessible and less risky ovarian and/or utero-ovarian veins for venous anastomosis. In 2019, for instance, a team in Pune, India, reported laparoscopically dissecting the donor ovarian veins and a portion of the internal iliac artery, and completing anastomosis with bilateral donor internal iliac arteries to recipient internal iliac arteries, and bilateral donor ovarian veins to recipient external iliac veins.6 It is significant that these smaller-caliber vessels were found to able to support the uterus through pregnancy.
We must be cautious, however, to avoid removing donors’ ovaries. Oophorectomy for women in their 40s can result in significant long-term medical sequelae. Surgeons at Baylor have achieved at least one live birth after harvesting the donor’s utero-ovarian veins while conserving the ovaries – a significant advancement for the living-donor model.4
There is tremendous interest in developing minimally invasive approaches to further reduce living-donor risk. The Swedish team has completed a series of eight robotic hysterectomies in living-donor uterus transplantations as part of a second trial. Addressing the reality of a learning curve, their study was designed around a step-wise approach, mastering initial steps first – e.g., dissections of the uterovaginal fossa, arteries, and ureters – and ultimately converting to laparotomy.7 In the United States, Baylor University has now completed at least five completely robotic living-donor hysterectomies with complete vaginal extraction.
Published data on robotic surgery suggests that surgical access and perioperative visualization of the vessels may be improved. And as minimally invasive approaches are adopted and improved, the length of donor surgery – 10-13 hours of operating room time in the original Swedish series – should diminish, as should the morbidity associated with laparotomy.
Surgical acquisition of a uterine graft from a deceased donor diminishes concerns for injury to nearby structures. Therefore, although it is a technically similar procedure, a deceased-donor model allows more flexibility with the length, caliber, and number of vessels that can be used for anastomosis. The internal iliac vessels and even portions of the external iliac vessels and ovarian vessels can be used to allow maximum flexibility.8
Surgical technique for uterus recipients
For the recipient surgery, entry is achieved via a midline, vertical laparotomy. The external iliac vessels are exposed, and the sites of vascular anastomoses are identified. The peritoneal reflection of the bladder is identified and dissected away to expose the anterior vagina, and the vagina is opened to a diameter that matches the donor, typically using a monopolar electrosurgical cutting instrument.
The vault of the donor vagina will be attached to the recipient’s existing vagina or vaginal pouch. It is important to identify recipient vaginal mucosa and incorporate it into the vaginal anastomosis to reduce the risk of vaginal stricture. We recommend that the vaginal mucosa be tagged with PDS II sutures or grasped with allis clamps to prevent retraction.
Surgical teams have taken multiple approaches to vaginal anastomosis. The Cleveland Clinic has used both a running suture as well as a horizontal mattress stitch for closure. For the latter, a 30-inch double-armed 2.0 Vicryl allows for complete suturing of the recipient vagina – with eight stitches placed circumferentially – before the uterus is placed. Both ends of the suture are passed intra-abdominal to intravaginal in the recipient.9
Once the donor uterus is suspended, attention focuses on vascular anastomosis, with bilateral end-to-side anastomosis between the donor anterior division of the internal iliac arteries and the external iliac vessels of the recipient, and with venous drainage commonly achieved through the uterine veins draining into the internal or external iliac vein of the recipient. As mentioned, recent cases involving living donors have also demonstrated success with the use of ovarian and/or utero-ovarian veins. Care should be taken to avoid having tension or twisting across the anastomosis.
After adequate graft perfusion is confirmed, with the uterus turning from a dusky color to a pink and well-perfused organ, the vaginal anastomosis is completed, with the arms of the double-armed suture passed through the donor vagina, from intravaginal to intra-abdominal. Tension should be evenly spread along the recipient and donor vagina in order to reduce the formation of granulation tissue and the severity of future vaginal stricturing.
For uterine fixation, polypropylene sutures are placed between the graft uterosacral ligaments and recipient uterine rudiments, and between the graft round ligaments and the recipient pelvic side wall at the level of the deep inguinal ring.
Current uterus transplantation protocols require removal of the uterus after one or two live births are achieved, so that recipients will not be exposed to long-term immunosuppression.
Complications and controversies
Postoperative vaginal strictures can make embryo transfer difficult and are a common complication in both living- and deceased-donor models. The Cleveland Clinic team has applied techniques from vaginal reconstructive surgery to try to reduce the occurrence of postoperative strictures – mainly increasing attention paid to anastomosis tissue–site preparation and closure of the anastomosis using a tension-free interrupted suture technique, as described above.9 The jury is out on whether such changes are sufficient, and a more complete understanding of the causes of vaginal stricture is needed.
Other perioperative complications include infection and graft thrombosis, both of which typically result in urgent graft hysterectomy. During pregnancy, one of our patients experienced abnormal placentation, though this was not thought to be related to uterus transplantation.5
The U.S. Uterus Transplant Consortium (USUTC) is a group of active programs that are sharing ideas and outcomes and advocating for continued research in this rapidly developing field. Uterine transplants require collaboration with transplant surgery, transplant medicine, infectious disease, gynecologic surgery, high-risk obstetrics, and other specialties. While significant progress has been made in a short period of time, uterine transplantation is still in its early stages, and transplants should be done in institutions that have the capacity for mentorship, bioethical oversight, and long-term follow-up of donors, recipients, and offspring.
The USUTC has recently proposed guidelines for nomenclature related to operative technique, vascular anatomy, and uterine transplantation outcomes.10 It proposes standardizing the names for the four veins originating from the uterus (to eliminate current inconsistency), which will be important as optimal strategies for vascular anastomoses are discussed and determined.
In addition, the consortium is creating a registry for the rigorous collection of data on procedures and outcomes (from menstruation and pregnancy through delivery, graft removal, and long-term follow-up). A registry has also been proposed by the International Society for Uterine Transplantation.
A major question remains in our field: Is the living-donor or deceased-donor uterus transplant the best approach? Knowledge of the quality of the uterus is greater preoperatively within a living-donor model, but no matter how minimally invasive the technique, the donor still assumes some risk of prolonged surgery and extensive pelvic dissection for a transplant that is not lifesaving.
On the other hand, deceased-donor transplants require additional layers of organization and coordination, and the availability of suitable deceased-donor uteri will likely not be sufficient to meet the current demand. Many of us in the field believe that the future of uterine transplantation will involve some combination of living- and deceased-donor transplants – similar to other solid organ transplant programs.
Dr. Flyckt and Dr. Richards reported that they have no relevant financial disclosures.
Correction, 2/2/21: An earlier version of this article misstated Dr. Richards' name in the photo caption.
References
1. Lancet. 2015;14:385:607-16.
2. AJOB Empir Bioeth. 2019;10(1):23-5.
3. Transplantation. 2020;104(7):1312-5.
4. Am J Transplant. 2018;18(5):1270-4.
5. Am J Obstet Gynecol. 2020;223(2):143-51.
6. J Minimally Invasive Gynecol. 2019;26:628-35.
7. Acta Obstet Gynecol Scand. 2020;99(9):1222-9.
8. Fertil Steril. 2018;110(1):183.
9. Fertil Steril. 2020 Jul 16. doi: 10.1016/j.fertnstert.2020.05.017
10 Am J Transplant. 2020;20(12):3319-25.
Uterus transplantation for absolute uterine factor infertility
Until the advent of uterus transplantation, there was no restorative procedure available to a woman presenting with an absent uterus or nonfunctioning uterus; that is, absolute uterine factor infertility (AUFI). It is estimated that 1 in 500 women of childbearing age are affected by AUFI.1,2 An absent uterus may be secondary to uterine agenesis or Mayer-Rokitansky-Küster-Hauser syndrome (MRKH), which occurs in 1 in 4,500 women.3,4 (Because women with MRKH have a normal karyotype, their children can be normal, without urogenital malformations.5)

Given the fact that roughly 240,000 hysterectomies are performed in the United States each year for women aged under 44 years, hysterectomy is the most common cause of acquired AUFI.6AUFI may also be secondary to a uterus that will not support a viable pregnancy; that is, a nonfunctional uterus. In this case, medical or surgical treatment is impossible to enable normal physiological uterine function to produce a successful pregnancy. Causal factors include Müllerian anomalies, severe intrauterine adhesions/Asherman syndrome, uterine fibroids not amendable to surgical therapy, and radiation injury not responsive to medical therapy.
Prior to uterus transplantation, parenthood could only be achieved via adoption, foster parenting, or gestational carrier. While utilizing a gestational carrier is legal in most U.S. states, most countries of western Europe as well as Brazil and Japan, to name a few, do not allow the use of gestational carriers. For some women, moreover, the desire is not only to have a baby, but to carry a child as well.
For this edition of the Master Class in Gynecologic Surgery, I have enlisted the assistance of Rebecca Flyckt, MD, division chief of reproductive endocrinology and infertility at University Hospitals Cleveland Medical Center and associate professor at Case Western Reserve University, Cleveland, and Elliott G. Richards, MD, director of reproductive endocrinology and infertility research at the Cleveland Clinic, to discuss the current and future state of uterus transplantation.
Dr. Flyckt and Dr. Richards have both contributed to the uterus transplantation team at the Cleveland Clinic and are founding members of the U.S. Uterus Transplant Consortium. They are well published in the field of minimally invasive gynecology and reproductive endocrinology and infertility. It is truly a pleasure to welcome them both to this edition of the Master Class in Gynecologic Surgery.
References
1. Fertil Steril. 2014 May;101(5):1228-36.
2. Acta Biomater. 2014 Dec;10(12):5034-42.
3. Hum Reprod Update. Mar-Apr 2001;7(2):161-74.
4. Obstet Gynecol Surv. 2000 Oct;55(10):644-9.
5. Fertil Steril. 1997 Feb;67(2):387-9
6. Am J Public Health. 2003 Feb;93(2):307-12.
Dr. Miller is professor of obstetrics & gynecology in the department of clinical sciences, Rosalind Franklin University, North Chicago, and director of minimally invasive gynecologic surgery at Advocate Lutheran General Hospital, Park Ridge, Ill. Dr. Miller reported that he has no disclosures relevant to this Master Class. Email him at [email protected].
Until the advent of uterus transplantation, there was no restorative procedure available to a woman presenting with an absent uterus or nonfunctioning uterus; that is, absolute uterine factor infertility (AUFI). It is estimated that 1 in 500 women of childbearing age are affected by AUFI.1,2 An absent uterus may be secondary to uterine agenesis or Mayer-Rokitansky-Küster-Hauser syndrome (MRKH), which occurs in 1 in 4,500 women.3,4 (Because women with MRKH have a normal karyotype, their children can be normal, without urogenital malformations.5)
Given the fact that roughly 240,000 hysterectomies are performed in the United States each year for women aged under 44 years, hysterectomy is the most common cause of acquired AUFI.6AUFI may also be secondary to a uterus that will not support a viable pregnancy; that is, a nonfunctional uterus. In this case, medical or surgical treatment is impossible to enable normal physiological uterine function to produce a successful pregnancy. Causal factors include Müllerian anomalies, severe intrauterine adhesions/Asherman syndrome, uterine fibroids not amendable to surgical therapy, and radiation injury not responsive to medical therapy.
Prior to uterus transplantation, parenthood could only be achieved via adoption, foster parenting, or gestational carrier. While utilizing a gestational carrier is legal in most U.S. states, most countries of western Europe as well as Brazil and Japan, to name a few, do not allow the use of gestational carriers. For some women, moreover, the desire is not only to have a baby, but to carry a child as well.
For this edition of the Master Class in Gynecologic Surgery, I have enlisted the assistance of Rebecca Flyckt, MD, division chief of reproductive endocrinology and infertility at University Hospitals Cleveland Medical Center and associate professor at Case Western Reserve University, Cleveland, and Elliott G. Richards, MD, director of reproductive endocrinology and infertility research at the Cleveland Clinic, to discuss the current and future state of uterus transplantation.
Dr. Flyckt and Dr. Richards have both contributed to the uterus transplantation team at the Cleveland Clinic and are founding members of the U.S. Uterus Transplant Consortium. They are well published in the field of minimally invasive gynecology and reproductive endocrinology and infertility. It is truly a pleasure to welcome them both to this edition of the Master Class in Gynecologic Surgery.
References
1. Fertil Steril. 2014 May;101(5):1228-36.
2. Acta Biomater. 2014 Dec;10(12):5034-42.
3. Hum Reprod Update. Mar-Apr 2001;7(2):161-74.
4. Obstet Gynecol Surv. 2000 Oct;55(10):644-9.
5. Fertil Steril. 1997 Feb;67(2):387-9
6. Am J Public Health. 2003 Feb;93(2):307-12.
Dr. Miller is professor of obstetrics & gynecology in the department of clinical sciences, Rosalind Franklin University, North Chicago, and director of minimally invasive gynecologic surgery at Advocate Lutheran General Hospital, Park Ridge, Ill. Dr. Miller reported that he has no disclosures relevant to this Master Class. Email him at [email protected].

Implementing the Quadruple Aim in Behavioral Health Care
From the Milwaukee County Behavioral Health Division, Milwaukee, WI.
Abstract
Objective: Implementation of the Quadruple Aim of health care must begin with a clearly articulated set of concepts, or core domains (CDs), that comprise each aim. These CDs can then be operationalized with existing or new measures. If aligned to the organization’s mission and strategic goals, these CDs have the potential to focus quality improvement activities and reduce measurement burden. This article represents the efforts of a publicly funded behavioral health system to operationalize the Quadruple Aim through the development of CDs.
Methods: Various stakeholders across the organization were consulted on their perceptions of the Quadruple Aim and the CDs they believed should support it. Then, a review of existing literature on core metrics for health care and population health was completed, summarized, and integrated with the stakeholder feedback.
Results: These efforts led to the development and adoption of 15 CDs, with an accompanying literature review and set of recommendations of new and existing measures for each domain.
Conclusions: It is possible to create a comprehensive yet economical set of CDs and attendant measures that can be implemented in a staged, scalable, enterprise manner. It is hoped that the process articulated here, and the accompanying literature review, may be of some benefit to other public or government-run health systems in their own quality improvement journey to operationalize the Quadruple Aim by developing a set of CDs.
Keywords: quality measures; quality improvement; adult behavioral health.
First articulated in 2008, the Triple Aim proposes that health care systems should simultaneously seek to improve the patient’s experience of care, improve the health of populations, and reduce the per capita costs of care for populations.1 More recently, some have argued that health care provider burnout can deleteriously impact the attainment of the Triple Aim and have therefore advocated for an expanded focus to include a fourth Aim, the work life quality of the staff.2 Milwaukee County Behavioral Health Division (BHD), a publicly funded, county-based behavioral health care system in Milwaukee, Wisconsin, recently adopted the Quadruple Aim as the framework by which it will organize its quality activities.
Although originally developed for medical organizations, BHD believes that the Quadruple Aim has strong applicability to county-level behavioral health services. Many county-based behavioral health divisions provide a variety of programs to large segments of the county based on financial eligibility and/or clinical need, and thus often have responsibilities to populations or subpopulations, rather than programs. County health divisions, such as Milwaukee County’s Department of Health and Human Services, are often asked to improve outcomes and client experience of care with neutral growth budgets and less reliance on taxes to fund programs, while simultaneously attracting and retaining competent staff.
Crucial to the effective implementation of the Quadruple Aim, however, is a clear set of population- level measures that help organizations assess their progress.3 Unfortunately, as some authors have noted, evaluation of the Quadruple Aim remains a challenge because the “concepts of (population) health, quality of care and costs are not unanimously defined and measures for these concepts are under construction.”4 Several authors have provided some guidance to assist in the development of a set of measures that effectively capture the elements of the Quadruple Aim.5,6 However, the recent rapid proliferation of quality measures in health care7,8 has been both burdensome and costly for providers.9,10 Any measures adopted should not only be as meaningful as possible with regards to assessing progress towards the basic aims of health care, but should also be parsimonious, to limit measurement burden for providers (and patients) and focus attention on important issues.11,12
To select the most effective, parsimonious set of measures possible, one must first select a set of key foci from among the many possible areas of focus that the core measure is intended to represent. The core domains (CDs), if appropriately consistent with the strategic goals of the organization, provide a mechanism to orient the efforts of the organization at every level and help every staff member of the organization understand how his or her work impacts the progress towards these goals.11 The CDs, therefore, represent the opportunity to affect a greater integration of efforts across the organization toward these shared aims, creating uniformity of purpose at every level. Further, increasing organizational attention on the CDs can also help to reduce measurement burden by streamlining and focusing the data capture processes on the most valuable elements of quality and health, and discarding other extraneous measures (albeit not at the expense of other reporting requirements).11 The remainder of this article describes the CDs selected by BHD to assess its progress toward implementation of the Quadruple Aim and are organized by the Aim which they best represent.
Methods
To effectively implement the Quadruple Aim at BHD, it was necessary to clearly define the subpopulation of focus for our efforts.6 In this case, the subpopulation of interest was defined as all adult clients (18 years and older) who received at least 1 service encounter within a specified time frame from a program that BHD either operated or contracted with to provide care. Services provided by the BHD network include everything from psychiatric inpatient services to mental health and addiction treatment and care management. A limited array of social services, including housing and employment services, is also available to eligible consumers. BHD is the county-run behavioral health provider for individuals who are uninsured or underinsured in Milwaukee County, a demographically diverse, primarily urban county of approximately 950,000 people located in Wisconsin. Approximately 15,000 adults receive services at BHD each year.
This work began by obtaining executive sponsorship for the project, in this case from the Chief Operations Officer and Executive Medical Director of BHD. With their backing, an initial review of the literature produced a preliminary set of possible domains, for which we created working definitions. We then made a list of key stakeholders throughout BHD to whom we needed to present the idea of the Quadruple Aim, and the CDs under each Aim, to secure their support. These stakeholders, which included individuals involved in quality activities, program managers, and executive leadership, were strategically selected based on their relative influence within the organization. A set of brief presentations and handouts explaining the project were then developed and shared at different focus groups with these stakeholders over the course of 6 months. These focus groups served to not only educate the organization about the Quadruple Aim and the CDs but afforded participants an opportunity to provide feedback as well.
During the focus groups, we asked participants which domains they believed were most important (were “core”) when operationalizing the Quadruple Aim. The focus groups provided feedback on the domain definitions, feedback that was used to develop uniform, mutually agreed upon definitions for the CDs that were generalizable to all departments at BHD, regardless of the focus of their services within the continuum of care or the continuum of age. This was a crucial step, as it will eventually enable BHD to aggregate data across departments, even if there are minor discrepancies in the specific items they use to assess the CDs. Comments from the focus groups ultimately resulted in a truncated list of domains and definitions, which, coupled with the literature review, resulted in our final set of CDs.
During our review of the literature, we also looked for items that we felt could best represent each CD in the briefest, most meaningful way. (These items were not meant to supersede existing data, but to provide examples that could be implemented with existing data or recommendations that could be utilized in the absence of existing data.) During this process, we made every effort to make use of existing data-reporting requirements. For example, if we had a state mandate to collect data on housing status, we attempted to leverage this required data point to represent the CD related to housing. In other cases, we attempted to utilize claims or other administrative data to operationalize the CD, such as in the cost-of-care metric articulated in the section the Third Aim. For CDs for which no data existed or were insufficient, we emphasized the use of single- versus multi-item scales. For example, if we found a single-item global assessment of quality of life that had good psychometric properties relative to its longer parent scale, we selected the single item. This approach to item selection allowed us to create the most efficient, parsimonious set of measures possible, which we believed would enable us to comprehensively assess all the CDs with the least amount of burden to staff and clients. These items were presented at stakeholder focus groups, during which we asked for comments on the existing measures in their program or department and gave them the opportunity to comment on the new recommended measures.
A working definition is provided for each CD, followed by a brief review of the research base supporting its inclusion in the final list. The item(s) selected by BHD to represent each CD and the source of the item(s) are then supplied. These items were based either on measures currently collected because of existing reporting mandates or, in the case where extant measures were not available, on new items that demonstrated acceptable psychometric properties in the research literature. The CDs and items are organized by the Aim they best represent. A full list of the CDs by Quadruple Aim and items by CD is provided in the Appendix of the online version of this article. This article concludes with a brief summary of this effort and a discussion of how staff will utilize these items at different levels throughout the BHD system.
The First Aim: Population Health
Health Outcomes
Deaths. This can be defined as the cause of death, as determined by the medical examiner’s office (where appropriate) or as the age at time of death. This CD can also be reported as proportion of deaths considered premature (eg, before age 75) or calculated as total years of potential life lost.
Brief review and suggested item(s). Rates and causes of premature mortality are critical foci for the County Health Rankings & Roadmaps,13 the Institute for Healthcare Improvement’s “Guide to Measuring the Triple Aim,”6 the Centers for Disease Control and Prevention’s “Community Health Assessment for Population Health Improvement,”14 and the Institute of Medicine’s (IOM) “Vital Signs: Core Metrics for Health and Health Care Progress.”11 There is ample evidence that individuals with serious mental illness are at increased risk of early mortality relative to the general population,15-18 and this risk applies to those with substance use disorders as well.15,19-20 BHD tracks all deaths that occur while patients are receiving BHD-funded, community-based services.
Self-Reported Health and Well-Being. This CD asks patients to rate their current physical and mental health status, as well as their overall quality of life.
Brief review and suggested item(s): Self-rated physical health. Premature mortality among individuals with behavioral health issues appears to be due, in large part, to their increased vulnerability to the development of medical comorbidities.16,21 A single self-rating question has demonstrated considerable sensitivity to premature mortality,22,23 with predictive properties up to a decade prior to death.24,25 Further, self-rated health has been associated with subsequent functional decline,26,27 acute service utilization,28,29 and overall health care costs.28
Brief review and suggested item(s): Self-rated mental health. Mental health disorders are associated with significant disability worldwide,30 and comorbid mental health issues can exacerbate the course of other medical problems. For example, depression is associated with increased rates of mortality among individuals with diabetes and31 cardiovascular disease,32 as well as with rates of overall mortality,33 and psychiatric comorbidity is associated with longer lengths of stay and higher costs among patients hospitalized for medical problems.34 Research has found that a single-item measure of self-rated mental health is associated with the presence of psychiatric diagnoses, psychiatric symptoms, and subsequent depression and serious mental illness up to 1 year post-assessment.35,36 There is even evidence that self-rated mental health may be more strongly associated with self-ratings of overall health than self-ratings of physical health.37
Brief review and suggested item(s): Self-rated quality of life. Quality of life is a critical component of the recovery journey and overall health.38 For example, the County Health Rankings & Roadmaps lists “quality of life” as 1 of its key “health outcomes” in its County Health Rankings.13 As some authors have noted, quality of life is often inferred from other “objective” recovery domains, such as employment, health status, or housing status. However, there is evidence that these objective domains are functionally distinct from the inherently subjective construct of quality of life.39 This has led other authors to conclude that these domains should be assessed separately when evaluating outcomes.40 Single-item quality of life assessments have been used in research with individuals with cancer,41 adults with disabilities,42 patients with cystic fibrosis,43 and children with epilepsy.44 For this effort, BHD selected the first global quality of life item from the World Health Organization’s WHOQOL-BREF quality of life assessment,45 an item used in other quality of life research.46
Health Factors
Substance Use. This CD is a composite of 4 different types of substance use, any recent heavy alcohol use (defined as 5 or more drinks in one sitting), any recent drug use, any recent prescription drug abuse, and any recent tobacco use.
Brief review and suggested item(s). As noted, substance use disorders confer an increased risk for early mortality15,19 and are significantly implicated in disease disability burden worldwide.30 Substance use has also been associated with both the onset47,48 and exacerbation of mental health diagnoses.49-51 Further, substance use appears to heighten the risk of violence in the general population52 and especially among those with a co-occurring mental illness.53,54 The County Health Rankings & Roadmaps list alcohol and drug use as key behaviors to address to improve the overall health of a given county,13 and the Centers for Medicare & Medicaid Services (CMS) has endorsed initiation and engagement in addiction treatment as one of the measures in its Adult Core Set.55
Tobacco use continues to be one of the most significant risk factors for early mortality worldwide, and evidence indicates that it is associated with a lower life expectancy of nearly 10 years.56 Unfortunately, rates of tobacco use are even higher among those with severe mental illness relative to the general population, and their rates of smoking cessation are lower.57,58 Tobacco use is a significant risk factor for the high rates of early mortality in individuals with severe mental illness.18 Further, a recent meta-analysis noted that, relative to those who continued to smoke, those who ceased smoking had reduced rates of psychological distress and increased quality of life rankings.59 Reducing tobacco use is one of the key components of the County Health Rankings & Roadmaps, and medication assistance with smoking and tobacco use cessation is also listed in the CMS Adult Core Set.13,55
An accumulating body of evidence suggests that single-item measures can adequately detect alcohol60-62 and drug use disorders.60-64 McNeely and colleagues recently developed and tested a brief 4-item screen, the Tobacco, Alcohol, Prescription medication, and other Substance use (TAPS) tool.65,66 Preliminary evidence suggests that the TAPS tool can effectively identify the presence of problematic and disordered use of tobacco, alcohol, prescription medications, and other drugs.65-67 BHD will use the 4 items from the TAPS tool to represent its substance use CD.
Education/Employment Status. This CD assesses the proportion of BHD members who have completed high school, who are in some type of educational or training program, or who are engaged in some type of employment activity (defined as full-time, part-time, supported, sheltered workshop, or as a full-time homemaker).
Brief review and suggested item(s). Research indicates that unemployment is a risk factor for mortality, even after controlling for other risk factors (eg, age, sex, socioeconomic status [SES], health).68 Unemployment is associated with poorer physical and mental health in the general population and among those with disabilities.69-71 Promisingly, evidence suggests that gaining employment or re-employment is associated with better health,72 even for individuals with substance use disorders73 or moderate74 to severe mental health disorders.75-78 Some authors have even proposed that, above and beyond the associated health benefits, employment may also help to realize a modest cost savings due to reduced service utilization and disability.79,80 Employment is a core tenet in the Substance Abuse and Mental Health Services Administration’s (SAMHSA’s) model of recovery,81 and is also listed as an important recovery goal for individuals with behavioral health issues.82 BHD collects data on employment status on all the patients it serves as part of its state-mandated reporting requirements and will use this item in the CD data set.83
Living Situation. This is measured as the proportion of people who live in permanent, supportive, stable housing; it may also be measured as the percentage of the population living with severe housing problems or who are homeless.
Brief review and suggested item(s). Housing problems can be conceptualized as 3 inter-related components: conditions within the home, neighborhood conditions, and housing affordability, each of which can contribute uniquely to poorer physical and mental health of individuals and families84 and to educational outcomes for children.85,86 Further, individuals who are homeless have a standardized mortality ratio 2 to 5 times that of the general population,87-89 even after controlling for low income status,90 and some evidence suggests these rates are even higher among unsheltered versus sheltered homeless individuals.91 Interventions to improve the condition of housing have demonstrated positive impacts on both physical and mental health,92 and a recent study found that individuals receiving housing assistance in the form of public housing or multifamily housing from the Department of Housing and Urban Development had better self-rated physical and mental health relative to individuals on the wait list for housing assistance.93 Moreover, the provision of housing has been shown to promote reductions in substance use and health service utilization among homeless individuals with substance use disorders.94 Rog and colleagues reviewed the literature on permanent supportive housing for individuals with substance use or mental health disorders who were homeless or disabled, and found that provision of housing led to reduced rates of homelessness, emergency department (ED) and inpatient utilization and increased consumer satisfaction.95
Importantly, evidence suggests that housing is viewed as facilitative of recovery. For example, in a recent qualitative study of homeless individuals with mental illness, housing was seen as a critical first step in recovery, providing a sense of security, increasing feelings of personal independence and autonomy, improving perceptions of health and well-being, and affording a stable environment to rebuild relationships with important others.96 BHD collects data on housing status on all the patients it serves as part of its state-mandated reporting requirements and will utilize this item in the CD data set.83
Social Relationships. This is defined as recent interactions with family, supportive networks (formal and informal), and other recovery services.
Brief review and suggested item(s). Research has long established that social relationships have a significant impact on health, including rates of mortality as well as physical and mental health morbidity.97-99 Social connectedness is another of the pillars supporting an individual’s recovery in SAMHSA’s formulation. Several reviews of the recovery literature38,82 support its importance to the recovery process and inclusion in any assessment of holistic recovery. Social support has been shown to promote recovery among individuals with severe mental illness100-102 and substance use disorders,103 and may mitigate the progression of chronic, life-threatening physical illnesses.97 For the purposes of BHD’s CD data set, the social support question from the “100 Million Healthier Lives Common Questionnaire for Adults” will be used to assess individuals’ perceived adequacy of social support.104
Legal Involvement. Defined as involvement with the civil or criminal justice system, including arrests, imprisonment, or detainment.
Brief review and suggested item(s). Involvement in the criminal justice system is both disruptive for the individual in recovery and expensive to the larger health care system.105 Individuals with substance use106 and severe mental health disorders107 are over-represented in the prison system, and evidence suggests that general physical and mental health declines while individuals are in prison.108,109 Perhaps even more concerning, numerous studies have demonstrated an increase in mortality rates for individuals recently released from prison relative to the general population, particularly during the period immediately following release.108-110 This relationship may even persist long term.111 Further, research indicates that individuals recently released from prison have increased emergency care and hospital utilization.112,113
Incarceration can have significant impacts on the health of the broader community as well. For example, research has found an association between parental incarceration to rates of infant mortality,114 increased behavioral and developmental problems of children of incarcerated parents,115,116 lower rates of child support payments,117 and poorer cardiovascular health of female partners of incarcerated individuals.118 Formerly incarcerated individuals experience slower wage growth as well.119 However, evidence also indicates that engagement in mental health120 and substance abuse121 treatment can reduce the likelihood of subsequent recidivism. As part of its state-mandated reporting, BHD is required to provide information on the criminal justice system involvement of its clients in the previous 6 months, including whether they have been jailed or imprisoned,83 and this will function as its measure of legal involvement in its CD data set.
Socioeconomic Status. Socioeconomic status is the social standing or class of an individual or group. It is often measured as a combination of education, income, and occupation. It can also be defined subjectively, such as one’s evaluation of status relative to similar others or based on an individual’s interpretation of her or his financial needs.
Brief review and suggested item(s). A large body of evidence supports the existence of a robust relationship between lower SES and poor health, including mortality and chronic medical diseases,122-124 as well as mental illness.125-127 Although previous research has examined this relationship using objective indicators of SES (eg, income, education level, occupation), there has recently been an increased interest in exploring the relationship of subjective SES with health indices. Subjective SES is generally assessed by asking individuals to rate themselves relative to others in the society in which they live, in terms of wealth, occupation, educational level, or other indicators of social status. Evidence suggests that subjective SES is associated with objective measures of SES,128-130 and relates to measures of physical and mental health as well, even after controlling for objective SES.130-135 BHD will be using a modified version of the Subject SES Scale,131,135 which is deployed in the “100 Million Healthier Lives Common Questionnaire for Adults.”104
Acute Service Use. This is defined as an admission to a medical or psychiatric emergency room or to a medical or psychiatric hospital or to a detoxification facility.
Brief review and suggested item(s). The CMS Adult Core Set includes “plan all cause readmissions” as a key quality metric.55 Hospital readmissions are also endorsed by the National Committee on Quality Assurance as one of its Health Effectiveness Data and Information Set (HEDIS) measures and by the National Quality Forum. Readmissions, despite their widespread endorsement, are a somewhat controversial measure. Although readmissions are costly to the health care system,136 the relationship between readmissions and quality is inconsistent. For example, Krumholz and colleagues137 found differential rates of readmission for the same patient discharged from 2 different hospitals, which were categorized based on previous readmission rates, suggesting that hospitals do have different levels of performance even when treating the same patient. However, other data indicate that 30-day, all-cause, risk-standardized readmission rates are not associated with hospital 30-day, all-cause, risk-standardized mortality rates.138
Chin and colleague found that readmissions to the hospital that occurred more than 7 days post-discharge were likely due to community- and household-related factors, rather than hospital-related quality factors.139 Transitional care interventions that have successfully reduced 30-day readmission rates are most often multicomponent and focus not just on hospital-based interventions (eg, discharge planning, education) but on follow-up care in the community by formal supports (eg, in-home visits, telephone calls, outpatient clinic appointments, case management) and informal supports (eg, family and friends).140-143 Further, qualitative evidence suggests that some individuals perceive psychiatric hospitalizations to be the result of insufficient resources or unsuccessful attempts to maintain their stability in the community.144 Thus, unplanned or avoidable hospital readmissions may represent a failure of the continuum of care not only from the perspective of the health care system, but from the patient perspective as well.
Frequent or nonurgent use of EDs is conceptually similar to excessive or avoidable inpatient utilization in several ways. For example, overuse of EDs is costly, with some estimates suggesting that it is responsible for up to $38 billion in wasteful spending each year.145 Individuals with frequent ED visits have a greater disease burden146 and an increased risk of mortality compared to nonfrequent users.147 Research suggests that individuals who visit the ED for non-urgent issues do so because of perceived difficulties associated with accessing primary care, and the convenience of EDs relative to primary care.148-150 Moreover, similar to the hospital readmission literature discussed earlier, successful strategies to reduce high rates of ED utilization generally focus on continuum of care interventions, such as provision of case management services.151-155
This evidence implies that frequent ED utilization and hospital readmissions may not be a fundamental issue of quality (or lack thereof) in hospitals or EDs but rather a lack of, or ineffectual, transitional and continuum of care strategies and services. To underscore this point, some authors have argued that a system that is excessively crisis-oriented hinders recovery because it is reactive rather than proactive, predicated on the notion that one’s condition must deteriorate to receive care.156
Although some organizations may have access to claims data or may function as self-contained health systems (eg, the Veterans Health Administration [VHA] ), others may not have access to such data. In the absence of claims data, patient self-report of service utilization has been used as a proxy for actual agency records.157 Although concordance between medical and/or agency records and patient self-report has been variable,157 evidence generally suggests that rates of agreement are higher the shorter the recall time interval.158,159 BHD does not have access to comprehensive claims data and has therefore chosen to use 5 dichotomously scored (yes/no) questions—related to medical inpatient, medical ED, psychiatric inpatient, psychiatric ED, and detoxification use in the last 30 days—to represent the CD of acute service utilization.
The Second Aim: Quality of Care
Safety
Safety is defined as avoiding injuries to patients from the care that is intended to help them.
Brief review and suggested item(s). As noted in “Crossing the Quality Chasm,” the IOM’s seminal document, “the health care environment should be safe for all patients, in all of its processes, all the time.”160 The landmark Harvard Medical Practice Study in 1991 found that adverse events occurred in nearly 4% of all hospital admissions and, among these, over a quarter were due to negligence.161 Other estimates of adverse events range as high as 17%.162 Indeed, a recent article by Makary and Daniel estimated that medical errors may be the third leading cause of death in the United States.163 Unfortunately, research on safety in the mental health field has lagged behind that of physical health,164 with evidence indicating that research in nonhospital settings in mental health care may be particularly scarce.165 In a study of adverse events that occurred in psychiatric inpatient units in the VHA system between 2015 and 2016, Mills and colleagues found that of the 87 root cause analysis reports, suicide attempts were the most frequent, and, among safety events, falls were the most frequently reported, followed by medication events.166 Another report on data collected from psychiatric inpatient units in the VHA revealed that nearly one-fifth of patients experienced a safety event, over half of which were deemed preventable.167 These numbers likely represent an underestimation of the true volume of safety events, as another study by the same research group found that less than 40% of safety events described in patient medical records were documented in the incident reporting system.168 BHD will utilize the total number of complaints and incident reports submitted within a given time frame as its “safety” metric in the CD data set.
Wait Time for Service
The CD is defined as the length of time between the date a patient first contacted BHD for services and the date of their first clinical service.
Brief review and suggested item(s). “Timeliness” was listed among the 6 aims for improvement in “Crossing the Quality Chasm” in 2001, and it remains no less relevant today.160 For example, evidence indicates that access to primary care is inversely related to avoidable hospitalizations.169 One study found that, of patients hospitalized for cardiovascular problems, those who had difficulty accessing routine care post discharge had higher 30-day readmission rates.170 Among VHA patients, longer wait times are associated with more avoidable hospitalizations and higher rates of mortality.171 Longer wait times appear to decrease the likelihood of attending a first appointment for individuals with substance use172,173 and mental health disorders.174 Importantly, longer wait times are associated with lower ratings of the patient experience of care, including perceptions of the quality of and satisfaction with care,175 and may be associated with worse outcomes for individuals in early intervention for psychosis treatment.176 For the purposes of the CD data set, BHD will monitor the length of time between the date a patient first contacted BHD for services and the date of their first clinical service.
Patient Satisfaction
Patient satisfaction is defined as the degree of patients’ satisfaction with the care they have received.
Brief review and suggested item(s). Research has consistently demonstrated the relationship of the patient’s experience of care to a variety of safety and clinical effectiveness measures in medical health care,177 and the therapeutic alliance is one of the most consistent predictors of outcomes in behavioral health, regardless of therapeutic modality.178 Patient satisfaction is a commonly assessed aspect of the patient experience of care. Patient satisfaction scores have been correlated with patient adherence to recommended treatment regimens, care quality, and health outcomes.179 For example, Aiken et al found that patient satisfaction with hospital care was associated with higher ratings of the quality and safety of nursing care in these hospitals.180 Increased satisfaction with inpatient care has been associated with lower 30-day readmission rates for patients with acute myocardial infarction, heart failure, and pneumonia,181 and patients with schizophrenia who reported higher treatment satisfaction also reported better quality of life.182,183 Many satisfaction survey options exist to evaluate this CD, including the Consumer Assessment of Healthcare Providers and Systems and the Client Satisfaction Questionnaire; BHD will utilize an outpatient behavioral health survey from a third-party vendor.
The Third Aim: Cost of Care
Cost of Care
This can be defined as the average cost to provide care per patient per month.
Brief review and suggested item(s). Per capita cost, or rather, the total cost of providing care to a circumscribed population divided by the total population, has been espoused as an important metric for the Triple Aim and the County Health Rankings.6,13 Indeed, between 1960 and 2016, per capita expenditures for health care have grown 70-fold, and the percent of the national gross domestic product accounted for by health expenditures has more than tripled (5.0% to 17.9%).184 One of the more common metrics deployed for assessing health care cost is the per capita per month cost, or rather, the per member per month cost of the predefined population for a given health care system.6,185,186 In fact, some authors have proposed that cost of care can be used not only to track efficient resource allocation, but can also be a proxy for a healthier population as well (ie, as health improves, individuals use fewer and less-expensive services, thus costing the system less).187 To assess this metric, BHD will calculate the total amount billed for patient care provided within BHD’s health network each month (irrespective of funding source) and then divide this sum by the number of members served each month. Although this measure does not account for care received at other health care facilities outside BHD’s provider network, nor does it include all the overhead costs associated with the care provided by BHD itself, it is consistent with the claims-based approach used or recommended by other authors.6,188
The Fourth Aim: Staff Well-being
Staff Quality of Work Life
This can be defined as the quality of the work life of health care clinicians and staff.
Brief review and suggested item(s). Some authors have suggested that the Triple Aim framework is incomplete and have proffered compelling arguments that provider well-being and the quality of work life constitutes a fourth aim.2 Provider burnout is prevalent in both medical2,189 and behavioral health care.190,191 Burnout among health care professionals has been associated with higher rates of perceived medical errors,192 lower patient satisfaction scores,189,193 lower rates of provider empathy,194 more negative attitudes towards patients,195 and poorer staff mental and physical health.191
Burnout is also associated with higher rates of absenteeism, turnover intentions, and turnover.190,191,196,197 However, burnout is not the only predictor of staff turnover; for example, turnover rates are a useful proxy for staff quality of work life for several reasons.198 First, turnover is associated with substantial direct and indirect costs, including lost productivity, increased errors, and lost revenue and recruitment costs, with some turnover cost estimates as high as $17 billion for physicians and $14 billion for nurses annually.199-201 Second, research indicates that staff turnover can have a deleterious impact on implementation of evidence-based interventions.202-205 Finally, consistent with the philosophy of utilizing existing data sources for the CD measures, turnover can be relatively easily extracted from administrative data for operated or contracted programs, and its collection does not place any additional burden on staff. As a large behavioral health system that is both a provider and payer of care, BHD will therefore examine the turnover rates of its internal administrative and clinical staff as well as the turnover of staff in its contracted provider network as its measures for the Staff Quality of Work Life CD.
Clinical Implications
These metrics can be deployed at any level of the organization. Clinicians may use 1 or more of the measures to track the recovery of individual clients, or in aggregate for their entire caseload. Similarly, managers can use these measures to assess the overall effectiveness of the programs for which they are responsible. Executive leaders can evaluate the impact of several programs or the system of care on the health of a subpopulation of clients with a specific condition, or for all their enrolled members. Further, not all measures need be utilized for every dashboard or evaluative effort. The benefit of a comprehensive set of measures lies in their flexibility—1 or more of the measures may be selected depending on the project being implemented or the interests of the stakeholder.
It is important to note that many of the CDs (and their accompanying measures) are aligned to/consistent with social determinants of health.206,207 Evidence suggests that social determinants make substantial contributions to the overall health of individuals and populations and may even account for a greater proportion of variance in health outcomes than health care itself.208 The measures articulated here, therefore, can be used to assess whether and how effectively care provision has addressed these social determinants, as well as the relative impact their resolution may have on other health outcomes (eg, mortality, self-rated health).
These measures can also be used to stratify clients by clinical severity or degree of socioeconomic deprivation. The ability to adjust for risk has many applications in health care, particularly when organizations are attempting to implement value-based purchasing models, such as pay-for-performance contracts or other alternative payment models (population health-based payment models).209 Indeed, once fully implemented, the CDs and measures will enable BHD to more effectively build and execute different conceptual models of “value” (see references 210 and 211 for examples). We will be able to assess the progress our clients have made in care, the cost associated with that degree of improvement, the experience of those clients receiving that care, and the clinical and social variables that may influence the relative degree of improvement (or lack thereof). Thus, the CDs provide a conceptual and data-driven foundation for the Quadruple Aim and any quality initiatives that either catalyze or augment its implementation.
Conclusion
This article provides an overview of the CDs selected by BHD to help organize, focus, advance, and track its quality efforts within the framework of the Quadruple Aim. Although items aligned to each of these CDs are offered, the CDs themselves have been broadly conceptualized such that they can flexibly admit a variety of possible items and/or assessments to operationalize each CD and thus have potential applicability to other behavioral health systems, particularly public systems that have state-mandated and other data reporting requirements.
Bearing in mind the burden that growing data collection requirements can have on the provision of quality care and staff work satisfaction and burnout,10,212 the CDs (and the items selected to represent each) are designed with “strategic parsimony” in mind. Although the CDs are inclusive in that they cover care quality, cost of care, staff quality of life, and general population health, only CDs and items undergirded by a solid evidence base and high value with regards to BHD’s mission and values, as determined by key stakeholders, were selected. Moreover, BHD attempted to make use of existing data collection and reporting mandates when selecting the final pool of items to reduce the measurement burden on staff and clients. Thus, the final set of CDs and items are designed to be comprehensive yet economical.
The CDs are deeply interrelated. Although each CD may be individually viewed as a valuable metric, improvements in any 1 CD will impact the others (eg, increasing care quality should impact population health, increasing staff quality of life should impact the quality of care). Moreover, this idea of interrelatedness acknowledges the need to view health systems and the populations they serve holistically, in that improvement is not simply the degree of change in any given metric (whether individually or collectively), but rather something more entirely. The concepts of value, quality, and health are complex, multidimensional, and dynamic, and the CDs that comprise these concepts should not be considered independently from one another. The CDs (and items) offered in this article are scalable in that they can be used at different levels of an organization depending on the question or stakeholder, and can be used individually or in combination with one another. Moreover, they are adaptable to a variety of risk-adjusted program, population health, and value-based evaluation models. It is hoped that the process articulated here, and the accompanying literature review, may benefit other public or government-run health systems in their own quality journey to operationalize the Quadruple Aim by developing a set of CDs.
Corresponding author: Walter Matthew Drymalski, PhD; [email protected].
Financial disclosures: None.
1. Berwick DM, Nolan TW, Whittington J. The Triple Aim: Care, health, and cost. Health Aff (Millwood). 2008;27(3):759-769.
2. Bodenheimer T, Sinsky C. From Triple to Quadruple Aim: Care of the patient requires care of the provider. Ann Fam Med. 2014;12(6):573-576.
3. Whittington JW, Nolan K, Lewis N, Torres T. Pursuing the Triple Aim: The first 7 years. Milbank Q. 2015;93(2):263-300.
4. Hendrikx RJP, Drewes HW, Spreeuwenberg M, et al. Which Triple Aim related measures are being used to evaluate population management initiatives? An international comparative analysis. Health Policy. 2016;120(5):471-485.
5. Kassler WJ, Howerton M, Thompson A, et al. Population Health Measurement at Centers for Medicare & Medicaid Services: Bridging the gap between public health and clinical quality. Popul Health Manag. 2017;20(3):173-180.
6. Stiefel MC, Nolan K. A Guide to Measuring the Triple Aim: Population health, experience of care, and per capita cost. IHI Innovation Series white paper. Institute for Healthcare Improvement; 2012.
7. Panzer RJ, Gitomer RS, Greene WH, et al. Increasing demands for quality measurement. JAMA. 2013;310(18):1971-1980.
8. Schuster MA, Onorato SE, Meltzer DO. Measuring the cost of quality measurement: a missing link in quality strategy. JAMA. 2017;318(13):1219-1220.
9. Casalino LP, Gans D, Weber R, et al. US physician practices spend more than $15.4 billion annually to report quality measures. Health Aff (Millwood). 2016;35(3):401-406.
10. Rao SK, Kimball AB, Lehrhoff SR, et al. The impact of administrative burden on academic physicians: results of a hospital-wide physician survey. Acad Med. 2017;92(2):237-243.
11. Institute of Medicine. Vital signs: Core metrics for health and health care progress. National Academies Press; 2015.
12. Meyer GS, Nelson EC, Pryor DB, et al. More quality measures versus measuring what matters: a call for balance and parsimony: Table 1. BMJ Qual Saf. 2012;21(11):964-968.
13. County Health Rankings. Measures & data sources. County Health Rankings & Roadmaps. Accessed January 11, 2021. https://www.countyhealthrankings.org/explore-health-rankings/measures-data-sources
14. U.S. Centers for Disease Control and Prevention. Community Health Assessment for population health improvement: Resource of most frequently recommended health outcomes and determinants. Office of Surveillance, Epidemiology, and Laboratory Services; 2013.
15. Chang C-K, Hayes RD, Perera G, et al. Life expectancy at birth for people with serious mental illness and other major disorders from a secondary mental health care case register in London. PLoS One. 2011;6(5):e19590.
16. De Hert M, Correll CU, Bobes J, et al. Physical illness in patients with severe mental disorders. I. Prevalence, impact of medications and disparities in health care. World Psychiatry. 2011;10(1):52-77.
17. Druss BG, Zhao L, Von Esenwein S, Morrato EH, Marcus SC. Understanding excess mortality in persons with mental illness: 17-year follow up of a nationally representative US survey. Med Care. 2011;49(6):599-604.
18. National Association of State Mental Health Program Directors, (NASMHPD) Medical Directors Council. Morbidity and mortality in people with serious mental illness. National Association of State Mental Health Program Directors, (NASMHPD) Medical Directors Council; 2006.
19. Nordentoft M, Wahlbeck K, Hällgren J, et al. Excess mortality, causes of death and life expectancy in 270,770 patients with recent onset of mental disorders in Denmark, Finland and Sweden. PLoS One. 2013;8(1):e55176.
20. Griswold MG, Fullman N, Hawley C, et al. Alcohol use and burden for 195 countries and territories, 1990–2016: a systematic analysis for the Global Burden of Disease Study 2016. Lancet. 2018;392(10152):1015-1035.
21. Walker ER, Druss BG. A public health perspective on mental and medical comorbidity. JAMA. 2016;316(10):1104-1105.
22. DeSalvo KB, Bloser N, Reynolds K, et al. Mortality prediction with a single general self-rated health question: a meta-analysis. J Gen Intern Med. 2005;21(3):267-275.
23. Mavaddat N, Parker RA, Sanderson S, et al. Relationship of self-rated health with fatal and non-fatal outcomes in cardiovascular disease: a systematic review and meta-analysis. PLoS One. 2014;9(7):e103509.
24. Lima-Costa MF, Cesar CC, Chor D, Proietti FA. Self-rated health compared with objectively measured health status as a tool for mortality risk screening in older adults: 10-year follow-up of the Bambui Cohort Study of Aging. Am J Epidemiol. 2012;175(3):228-235.
25. Stenholm S, Pentti J, Kawachi I, et al. Self-rated health in the last 12 years of life compared to matched surviving controls: the Health and Retirement Study. PLoS One. 2014;9(9):e107879.
26. Lee Y. The predictive value of self-assessed general, physical, and mental health on functional decline and mortality in older adults. J Epidemiol Community Health. 2000;54(2):123-129.
27. Tomioka K, Kurumatani N, Hosoi H. Self-rated health predicts decline in instrumental activities of daily living among high-functioning community-dwelling older people. Age Ageing. 2017;46(2):265-270.
28. DeSalvo KB, Jones TM, Peabody J, et al. Health care expenditure prediction with a single item, self-rated health measure. Med Care. 2009;47(4):440-447.
29. Farkas J, Kosnik M, Flezar M, Suskovic S, Lainscak M. Self-rated health predicts acute exacerbations and hospitalizations in patients with COPD. Chest. 2010;138(2):323-330.
30. Whiteford HA, Degenhardt L, Rehm J, et al. Global burden of disease attributable to mental and substance use disorders: findings from the Global Burden of Disease Study 2010. Lancet. 2013;382(9904):1575-1586.
31. Park M, Katon WJ, Wolf FM. Depression and risk of mortality in individuals with diabetes: a meta-analysis and systematic review. Gen Hosp Psychiatry. 2013;35(3):217-225.
32. Hare DL, Toukhsati SR, Johansson P, Jaarsma T. Depression and cardiovascular disease: a clinical review. Eur Heart J. 2014;35(21):1365-1372.
33. Cuijpers P, Schoevers RA. Increased mortality in depressive disorders: a review. Curr Psychiatry Rep. 2004;6(6):430-437.
34. Jansen L, van Schijndel M, van Waarde J, van Busschbach J. Health-economic outcomes in hospital patients with medical-psychiatric comorbidity: a systematic review and meta-analysis. PLoS One. 2018;13(3):e0194029.
35. Ahmad F, Jhajj AK, Stewart DE, et al. Single item measures of self-rated mental health: a scoping review. BMC Health Serv Res. 2014;14:398.
36. McAlpine DD, McCreedy E, Alang S. The meaning and predictive value of self-rated mental health among persons with a mental health problem. J Health Soc Behav. 2018;59(2):200-214.
37. Levinson D, Kaplan G. What does self-rated mental health represent? J Public Health Res. 2014;3(3):287.
38. Leamy M, Bird V, Boutillier CL, et al. Conceptual framework for personal recovery in mental health: systematic review and narrative synthesis. Br J Psychiatry. 2011;199(6):445-452.
39. Smith KW, Avis NE, Assmann SF. Distinguishing between quality of life and health status in quality of life research: a meta-analysis. Qual Life Res. 1999;8(5):447-459.
40. Hamming JF, De Vries J. Measuring quality of life. Br J Surg. 2007;94(8):923-924.
41. Singh JA, Satele D, Pattabasavaiah S, et al. Normative data and clinically significant effect sizes for single-item numerical linear analogue self-assessment (LASA) scales. Health Qual Life Outcomes. 2014;12(1):187.
42. Siebens HC, Tsukerman D, Adkins RH, et al. Correlates of a single-item quality-of-life measure in people aging with disabilities. Am J Phys Med Rehabil. 2015;94(12):1065-1074.
43. Yohannes AM, Dodd M, Morris J, Webb K. Reliability and validity of a single item measure of quality of life scale for adult patients with cystic fibrosis. Health Qual Life Outcomes. 2011;9(1):105.
44. Conway L, Widjaja E, Smith ML. Single-item measure for assessing quality of life in children with drug-resistant epilepsy. Epilepsia Open. 2018;3(1):46-54.
45. Skevington SM, Lofty M, O’Connell KA. The World Health Organization’s WHOQOL-BREF quality of life assessment: psychometric properties and results of the international field trial. Qual Life Res. 2004;13:299-310.
46. Atroszko PA, Baginska P, Mokosinska M, et al. Validity and reliability of single-item self-report measures of general quality of life, general health and sleep quality. In: CER Comparative European Research Conference: Research Track. Vol 2. Sciemcee Publishing; 2015:207-211.
47. Beaulieu S, Saury S, Sareen J, et al.
48. Marconi A, Di Forti M, Lewis CM, et al. Meta-analysis of the association between the level of cannabis use and risk of psychosis. Schizophr Bull. 2016;42(5):1262-1269.
49. Baker AL, Hiles SA, Thornton LK, et al. A systematic review of psychological interventions for excessive alcohol consumption among people with psychotic disorders. Acta Psychiatr Scand. 2012;126(4):243-255.
50. Baker AL, Hides L, Lubman DI. Treatment of cannabis use among people with psychotic or depressive disorders: a systematic review. J Clin Psychiatry. 2010;71(3):247-254.
51. Berenz EC, Coffey SF. Treatment of co-occurring posttraumatic stress disorder and substance use disorders. Curr Psychiatry Rep. 2012;14(5):469-477.
52. Pickard H, Fazel S. Substance abuse as a risk factor for violence in mental illness: some implications for forensic psychiatric practice and clinical ethics. Curr Opin Psychiatry. 2013;26(4):349-354.
53. Fazel S, Gulati G, Linsell L, Geddes JR, Grann M. Schizophrenia and violence: systematic review and meta-analysis. PLoS Med. 2009;6(8):e1000120.
54. Van Dorn R, Volavka J, Johnson N. Mental disorder and violence: Is there a relationship beyond substance use? Soc Psychiatry Psychiatr Epidemiol. 2012;47(3):487-503.
55. Centers for Medicare & Medicaid Services. 2019 Core set of adult health care quality measures for Medicaid (adult core set). Adult health care quality measures. Accessed January 11, 2021. https://www.medicaid.gov/medicaid/quality-of-care/performance-measurement/adult-core-set/index.html.
56. Jha P, Peto R. Global effects of smoking, of quitting, and of taxing tobacco. N Engl J Med. 2014;370(1):60-68.
57. Lê Cook B, Wayne GF, Kafali EN, et al. Trends in smoking among adults with mental illness and association between mental health treatment and smoking cessation. JAMA. 2014;311(2):172-182.
58. Smith PH, Mazure CM, McKee SA. Smoking and mental illness in the US population. Tob Control. 2014;23(0):e147-e153.
59. Taylor G, McNeill A, Girling A, et al. Change in mental health after smoking cessation: systematic review and meta-analysis. BMJ. 2014;348:g1151.
60. McNeely J, Cleland CM, Strauss SM, et al. Validation of self-administered single-item screening questions (SISQs) for unhealthy alcohol and drug use in primary care patients. J Gen Intern Med. 2015;30(12):1757-1764.
61. Saitz R, Cheng DM, Allensworth-Davies D, et al. The ability of single screening questions for unhealthy alcohol and other drug use to identify substance dependence in primary care. J Stud Alcohol Drugs. 2014;75(1):153-157.
62. Smith PC, Schmidt SM, Allensworth-Davies D, Saitz R. Primary care validation of a single-question alcohol screening test. J Gen Intern Med. 2009;24(7):783-788.
63. Dawson DA, Compton WM, Grant BF. Frequency of 5+/4+ drinks as a screener for drug use and drug-use disorders. J Stud Alcohol Drugs. 2010;71(5):751-760.
64. Smith PC, Schmidt SM, Allensworth-Davies D, Saitz R. A single-question screening test for drug use in primary care. Arch Intern Med. 2010;170(13):1155-1160.
65. McNeely J, Strauss SM, Saitz R, et al. A brief patient self-administered substance use screening tool for primary care: two-site validation study of the Substance Use Brief Screen (SUBS). Am J Med. 2015;128(7):784.e9-784.e19.
66. McNeely J, Wu L-T, Subramaniam G, et al. Performance of the Tobacco, Alcohol, Prescription medication, and other Substance use (TAPS) tool for substance use screening in primary care patients. Ann Intern Med. 2016;165(10):690-699.
67. Gryczynski J, McNeely J, Wu L-T, et al. Validation of the TAPS-1: a four-item screening tool to identify unhealthy substance use in primary care. J Gen Intern Med. 2017;32(9):990-996.
68. Roelfs DJ, Shor E, Davidson KW, Schwartz JE. Losing life and livelihood: a systematic review and meta-analysis of unemployment and all-cause mortality. Soc Sci Med. 2011;72(6):840-854.
69. McKee-Ryan F, Song Z, Wanberg CR, Kinicki AJ. Psychological and physical well-being during unemployment: a meta-analytic study. J Appl Psychol. 2005;90(1):53-76.
70. Zhang S, Bhavsar V. Unemployment as a risk factor for mental illness: combining social and psychiatric literature. Adv Appl Sociol. 2013;03(02):131-136.
71. Goodman N. The impact of employment on the health status and health care costs of working-age people with disabilities. The Lead Center. November 2015. Accessed January 11, 2021. http://www.leadcenter.org/system/files/resource/downloadable_version/impact_of_employment_health_status_health_care_costs_0.pdf
72. Hergenrather KC, Zeglin RJ, McGuire-Kuletz M, Rhodes SD. Employment as a social determinant of health: a systematic review of longitudinal studies exploring the relationship between employment status and physical health. Rehabil Res Policy Educ. 2015;29(1):2-26.
73. Walton MT, Hall MT. The effects of employment interventions on addiction treatment outcomes: a review of the literature. J Soc Work Pract Addict. 2016;16(4):358-384.
74. Schuring M, Robroek SJ, Burdorf A. The benefits of paid employment among persons with common mental health problems: evidence for the selection and causation mechanism. Scand J Work Environ Health. 2017;43(6):540-549.
75. Burns T, Catty J, White S, et al. The impact of supported employment and working on clinical and social functioning: results of an international study of individual placement and support. Schizophr Bull. 2009;35(5):949-958.
76. Kilian R, Lauber C, Kalkan R, et al. The relationships between employment, clinical status, and psychiatric hospitalisation in patients with schizophrenia receiving either IPS or a conventional vocational rehabilitation programme. Soc Psychiatry Psychiatr Epidemiol. 2012;47(9):1381-1389.
77. Marwaha S, Johnson S. Schizophrenia and employment. Soc Psychiatry Psychiatr Epidemiol. 2004;39(5):337-349.
78. Mueser KT, Drake RE, Bond GR. Recent advances in supported employment for people with serious mental illness. Curr Opin Psychiatry. 2016;29(3):196-201.
79. Bush PW, Drake RE, Xie H, et al. The long-term impact of employment on mental health service use and costs for persons with severe mental illness. Psychiatr Serv. 2009;60(8):1024-1031.
80. Drake RE, Skinner JS, Bond GR, Goldman HH. Social security and mental illness: reducing disability with supported employment. Health Aff (Millwood). 2009;28(3):761-770.
81. Substance Abuse and Mental Health Services Administration. SAMHSA’s working definition of recovery. Substance Abuse and Mental Health Services Administration. Published 2012. Accessed January 11, 2021. https://store.samhsa.gov/system/files/pep12-recdef.pdf
82. Drake RE, Whitley R. Recovery and severe mental illness: description and analysis. Can J Psychiatry. 2014;59(5):236-242.
83. Wisconsin Department of Health Services. PPS Mental Health Module Handbook. Published 2018. Accessed January 11, 2021. https://www.dhs.wisconsin.gov/publications/p02182.pdf
84. Robert Wood Johnson Foundation. Housing and Health. How does housing affect health? May 1, 2011. Accessed January 11, 2021. https://www.rwjf.org/en/library/research/2011/05/housing-and-health.html
85. Cunningham MK, MacDonald G. Housing as a platform for improving education outcomes among low-income children. Urban Institute. May 2012. Accessed January 11, 2021. https://www.urban.org/sites/default/files/publication/25331/412554-Housing-as-a-Platform-for-Improving-Education-Outcomes-among-Low-Income-Children.PDF
86. Friedman D. Social impact of poor housing. ECOTEC. March 2010. Accessed January 11, 2021. https://southdevonrural.co.uk/userfiles/file/JC-JC13-Social-impact-of-poor-housing.pdf
87. Fazel S, Geddes JR, Kushel M. The health of homeless people in high-income countries: descriptive epidemiology, health consequences, and clinical and policy recommendations. Lancet Lond Engl. 2014;384(9953):1529-1540.
88. Nusselder WJ, Slockers MT, Krol L, et al. Mortality and life expectancy in homeless men and women in Rotterdam: 2001–2010. PLoS One. 2013;8(10):e73979.
89. O’Connell JJ. Premature mortality in homeless populations: a review of the literature. National Health Care for the Homeless Council. Published 2005. Accessed April 23, 2019. http://sbdww.org/wp-content/uploads/2011/04/PrematureMortalityFinal.pdf
90. Hwang SW, Wilkins R, Tjepkema M, et al. Mortality among residents of shelters, rooming houses, and hotels in Canada: 11 year follow-up study. BMJ. 2009;339:b4036.
91. Roncarati JS, Baggett TP, O’Connell JJ, et al. Mortality among unsheltered homeless adults in Boston, Massachusetts, 2000-2009. JAMA Intern Med. 2018;178(9):1242-1248.
92. Thomson H, Thomas S, Sellstrom E, Petticrew M. Housing improvements for health and associated socio-economic outcomes. Cochrane Database Syst Rev. 2013;(2):CD008657.
93. Fenelon A, Mayne P, Simon AE, et al. Housing assistance programs and adult health in the United States. Am J Public Health. 2017;107(4):571-578.
94. Fitzpatrick-Lewis D, Ganann R, Krishnaratne S, et al. Effectiveness of interventions to improve the health and housing status of homeless people: a rapid systematic review. BMC Public Health. 2011;11(1):638.
95. Rog DJ, Marshall T, Dougherty RH, et al. Permanent supportive housing: assessing the evidence. Psychiatr Serv. 2014;65(3):287-294.
96. Kirst M, Zerger S, Wise Harris D, et al. The promise of recovery: narratives of hope among homeless individuals with mental illness participating in a Housing First randomised controlled trial in Toronto, Canada: Table 1. BMJ Open. 2014;4(3):e004379.
97. Cohen S, Janicki-Deverts D. Can we improve our physical health by altering our social networks? Perspect Psychol Sci. 2009;4(4):375-378.
98. House JS, Landis KR, Umberson D. Social relationships and health. Science. 1988;241(4865):540-545.
99. Kawachi I, Berkman LF. Social ties and mental health. J Urban Health. 2001;78(3):458-467.
100. Schön U-K, Denhov A, Topor A. Social relationships as a decisive factor in recovering from severe mental illness. Int J Soc Psychiatry. 2009;55(4):336-347.
101. Soundy A, Stubbs B, Roskell C, et al. Identifying the facilitators and processes which influence recovery in individuals with schizophrenia: a systematic review and thematic synthesis. J Ment Health. 2015;24(2):103-110.
102. Tew J, Ramon S, Slade M, et al. Social factors and recovery from mental health difficulties: a review of the evidence. Br J Soc Work. 2012;42(3):443-460.
103. Moos RH. Theory-based processes that promote the remission of substance use disorders. Clin Psychol Rev. 2007;27(5):537-551.
104. Stiefel MC, Riley CL, Roy B, et al. 100 Million Healthier Lives Measurement System: Progress to date. Institute for Healthcare Improvement; 2016:41. Accessed January 11, 2021. http://www.100mlives.org
105. Swanson JW, Frisman LK, Robertson AG, et al. Costs of criminal justice involvement among persons with serious mental illness in Connecticut. Psychiatr Serv. 2013;64(7):630-637.
106. Fazel S, Bains P, Doll H. Substance abuse and dependence in prisoners: a systematic review. Addiction. 2006;101(2):181-191.
107. Fazel S, Seewald K. Severe mental illness in 33 588 prisoners worldwide: systematic review and meta-regression analysis. Br J Psychiatry. 2012;200(05):364-373.
108. Fazel S, Baillargeon J. The health of prisoners. Lancet. 2011;377(9769):956-965.
109. Wildeman C, Wang EA. Mass incarceration, public health, and widening inequality in the USA. Lancet. 2017;389(10077):1464-1474.
110. Zlodre J, Fazel S. All-cause and external mortality in released prisoners: systematic review and meta-analysis. Am J Public Health. 2012;102(12):e67-e75.
111. Massoglia M, Pridemore WA. Incarceration and health. Annu Rev Sociol. 2015;41:291-310.
112. Kouyoumdjian FG, Cheng SY, Fung K, et al. The health care utilization of people in prison and after prison release: a population-based cohort study in Ontario, Canada. PLoS One. 2018;13(8):e0201592.
113. Winkelman TNA, Genao I, Wildeman C, Wang EA. Emergency department and hospital use among adolescents with justice system involvement. Pediatrics. 2017;140(5):e20171144.
114. Wildeman C. Imprisonment and infant mortality. Soc Prob. 2012;59:228-257.
115. Geller A, Cooper CE, Garfinkel I, et al. Beyond absenteeism: father incarceration and child development. Demography. 2012;49(1):49-76.
116. Turney K. Stress proliferation across generations? Examining the relationship between parental incarceration and childhood health. J Health Soc Behav. 2014;55(3):302-319.
117. Geller A, Garfinkel I, Western B. Paternal incarceration and support for children in fragile families. Demography. 2011;48(1):25-47.
118. Lee H, Wildeman C, Wang EA, et al. A heavy burden: the cardiovascular health consequences of having a family member incarcerated. Am J Public Health. 2014;104(3):421-427.
119. Western B. The impact of incarceration on wage mobility and inequality. Am Sociol Rev. 2002;67(4):526-546.
120. Constantine R, Andel R, Petrila J, et al. Characteristics and experiences of adults with a serious mental illness who were involved in the criminal justice system. Psychiatr Serv. 2010;61(5):451-457.
121. Garnick DW, Horgan CM, Acevedo A, et al. Criminal justice outcomes after engagement in outpatient substance abuse treatment. J Subst Abuse Treat. 2014;46(3):295-305.
122. Adler NE, Ostrove JM. Socioeconomic status and health: what we know and what we don’t. Ann N Y Acad Sci. 1999;896(1):3-15.
123. Luo Y, Waite LJ. The impact of childhood and adult SES on physical, mental, and cognitive well-being in later life. J Gerontol Ser B. 2005;60(2):S93-S101.
124. Mackenbach JP, Stirbu I, Roskam A-JR, et al. Socioeconomic inequalities in health in 22 European countries. N Engl J Med. 2008;358(23):2468-2481.
125. Hudson CG. Socioeconomic status and mental illness: tests of the social causation and selection hypotheses. Am J Orthopsychiatry. 2005;75(1):3-18.
126. McLaughlin KA, Breslau J, Green JG, et al. Childhood socio-economic status and the onset, persistence, and severity of DSM-IV mental disorders in a US national sample. Soc Sci Med. 2011;73(7):1088-1096.
127. Muntaner C. Socioeconomic position and major mental disorders. Epidemiol Rev. 2004;26(1):53-62.
128. Präg P, Mills MC, Wittek R. Subjective socioeconomic status and health in cross-national comparison. Soc Sci Med. 2016;149:84-92.
129. Shaked D, Williams M, Evans MK, Zonderman AB. Indicators of subjective social status: differential associations across race and sex. SSM Popul Health. 2016;2:700-707.
130. Singh-Manoux A, Adler NE, Marmot MG. Subjective social status: its determinants and its association with measures of ill-health in the Whitehall II study. Soc Sci Med. 2003;56(6):1321-1333.
131. Adler NE, Epel ES, Castellazzo G, Ickovics JR. Relationship of subjective and objective social status with psychological and physiological functioning: preliminary data in healthy, white women. Health Psychol. 2000;19(6):586-592.
132. Cundiff JM, Matthews KA. Is subjective social status a unique correlate of physical health? A meta-analysis. Health Psychol. 2017;36(12):1109-1125.
133. Demakakos P, Biddulph JP, de Oliveira C, et al. Subjective social status and mortality: The English Longitudinal Study of Ageing. Eur J Epidemiol. 2018;33(8):729-739.
134. Quon EC, McGrath JJ. Subjective socioeconomic status and adolescent health: a meta-analysis. Health Psychol. 2014;33(5):433-447.
135. Scott KM, Al-Hamzawi AO, Andrade LH, et al. Associations between subjective social status and DSM-IV mental disorders: Results from the World Mental Health Surveys. JAMA Psychiatry. 2014;71(12):1400-1408.
136. Jencks SF, Williams MV, Coleman EA. Rehospitalizations among patients in the Medicare Fee-for-Service Program. N Engl J Med. 2009;360(14):1418-1428.
137. Krumholz HM, Wang K, Lin Z, et al. Hospital-readmission risk—Isolating hospital effects from patient effects. N Engl J Med. 2017;377(11):1055-1064.
138. Krumholz HM, Lin Z, Keenan PS, et al. Relationship of hospital performance with readmission and mortality rates for patients hospitalized with acute myocardial infarction, heart failure, or pneumonia. JAMA. 2013;309(6):587-593.
139. Chin DL, Bang H, Manickam RN, Romano PS. Rethinking thirty-day hospital readmissions: Shorter intervals might be better indicators of quality of care. Health Aff (Millwood). 2016;35(10):1867-1875.
140. Feltner C, Jones CD, Cené CW, et al. Transitional care interventions to prevent readmissions for persons with heart failure: a systematic review and meta-analysis. Ann Intern Med. 2014;160(11):774-784.
141. Hudon C, Chouinard M-C, Lambert M, et al. Effectiveness of case management interventions for frequent users of healthcare services: a scoping review. BMJ Open. 2016;6(9):e012353.
142. Kripalani S, Theobald CN, Anctil B, Vasilevskis EE. Reducing hospital readmission: current strategies and future directions. Annu Rev Med. 2014;65:471-485.
143. Verhaegh KJ, MacNeil-Vroomen JL, Eslami S, et al. Transitional care interventions prevent hospital readmissions for adults with chronic illnesses. Health Aff (Millwood). 2014;33(9):1531-1539.
144. Duhig M, Gunasekara I, Patterson S. Understanding readmission to psychiatric hospital in Australia from the service users’ perspective: a qualitative study. Health Soc Care Community. 2017;25(1):75-82.
145. New England Healthcare Institute. A matter of urgency: Reducing emergency department overuse. Published 2010. Accessed January 11, 2021. https://www.nehi.net/writable/publication_files/file/nehi_ed_overuse_issue_brief_032610finaledits.pdf
146. Billings J, Raven MC. Dispelling an urban legend: Frequent emergency department users have substantial burden of disease. Health Aff (Millwood). 2013;32(12):2099-2108.
147. Moe J, Kirkland S, Ospina MB, et al. Mortality, admission rates and outpatient use among frequent users of emergency departments: a systematic review. Emerg Med J. 2016;33(3):230-236.
148. Carret MLV, Fassa ACG, Domingues MR. Inappropriate use of emergency services: a systematic review of prevalence and associated factors. Cad Saúde Pública. 2009;25(1):7-28.
149. Durand A-C, Palazzolo S, Tanti-Hardouin N, et al. Nonurgent patients in emergency departments: rational or irresponsible consumers? Perceptions of professionals and patients. BMC Res Notes. 2012;5(1):525.
150. Uscher-Pines L, Pines J, Kellermann A, et al. Deciding to visit the emergency department for non-urgent conditions: a systematic review of the literature. Am J Manag Care. 2013;19(1):47-59.
151. Kumar GS, Klein R. Effectiveness of case management strategies in reducing emergency department visits in frequent user patient populations: a systematic review. J Emerg Med. 2013;44(3):717-729.
152. Moe J, Kirkland SW, Rawe E, et al. Effectiveness of interventions to decrease emergency department visits by adult frequent users: a systematic review. Acad Emerg Med. 2017;24(1):40-52.
153. Raven MC, Kushel M, Ko MJ, et al. The effectiveness of emergency department visit reduction programs: a systematic review. Ann Emerg Med. 2016;68(4):467-483.e15.
154. Soril LJJ, Leggett LE, Lorenzetti DL, et al. Reducing frequent visits to the emergency department: a systematic review of interventions. PLoS One. 2015;10(4):e0123660.
155. Van den Heede K, Van de Voorde C. Interventions to reduce emergency department utilisation: a review of reviews. Health Policy. 2016;120(12):1337-1349.
156. Onken SJ, Dumont JM, Ridgway P, et al. Mental health recovery: What helps and what hinders? October 2002. Accessed January 11, 2021. https://www.nasmhpd.org/sites/default/files//MHSIPReport%281%29.pdf
157. Leggett LE, Khadaroo RG, Holroyd-Leduc J, et al. Measuring resource utilization. Medicine (Baltimore). 2016;95(10):e2759.
158. Bhandari A, Wagner T. Self-reported utilization of health care services: improving measurement and accuracy. Med Care Res Rev. 2006;63(2):217-235.
159. Short ME, Goetzel RZ, Pei X, et al. How accurate are self-reports? An analysis of self-reported healthcare utilization and absence when compared to administrative data. J Occup Environ Med. 2009;51(7):786-796.
160. Institute of Medicine. Crossing the Quality Chasm: A New Health System for the 21st Century. National Academies Press; 2001.
161. Brennan TA, Leape LL, Laird NM, et al. Incidence of adverse events and negligence in hospitalized patients. Results of the Harvard Medical Practice Study I. N Engl J Med. 1991;324(6):370-376.
162. Rafter N, Hickey A, Condell S, et al. Adverse events in healthcare: learning from mistakes. QJM. 2015;108(4):273-277.
163. Makary MA, Daniel M. Medical error—the third leading cause of death in the US. BMJ. 2016;3(353):i2139.
164. D’Lima D, Crawford MJ, Darzi A, Archer S. Patient safety and quality of care in mental health: A world of its own? BJPsych Bull. 2017;41(5):241-243.
165. Maidment ID, Lelliott P, Paton C. Medication errors in mental healthcare: a systematic review. Qual Saf Health Care. 2006;15(6):409-413.
166. Mills PD, Watts BV, Shiner B, Hemphill RR. Adverse events occurring on mental health units. Gen Hosp Psychiatry. 2018;50:63-68.
167. Marcus SC, Hermann RC, Frankel MR, Cullen SW. Safety of psychiatric inpatients at the Veterans Health Administration. Psychiatr Serv. 2017;69(2):204-210.
168. Reilly CA, Cullen SW, Watts BV, et al. How well do incident reporting systems work on inpatient psychiatric units? Jt Comm J Qual Patient Saf. 2019;45:63-69.
169. Rosano A, Loha CA, Falvo R, et al. The relationship between avoidable hospitalization and accessibility to primary care: a systematic review. Eur J Public Health. 2013;23(3):356-360.
170. Dupre ME, Xu H, Granger BB, et al. Access to routine care and risks for 30-day readmission in patients with cardiovascular disease. Am Heart J. 2018;196:9-17.
171. Pizer SD, Prentice JC. What are the consequences of waiting for health care in the veteran population? J Gen Intern Med. 2011;26(S2):676-682.
172. Festinger DS, Lamb RJ, Kirby KC, Marlowe DB. The accelerated intake: a method for increasing initial attendance to outpatient cocaine treatment. J Appl Behav Anal. 1996;29(3):387-389.
173. Festinger DS, Lamb RJ, Marlowe DB, Kirby KC. From telephone to office: intake attendance as a function of appointment delay. Addict Behav. 2002;27(1):131-137.
174. Gallucci G, Swartz W, Hackerman F. Brief reports: Impact of the wait for an initial appointment on the rate of kept appointments at a mental health center. Psychiatr Serv. 2005;56(3):344-346.
175. Bleustein C, Rothschild DB, Valen A, et al. Wait times, patient satisfaction scores, and the perception of care. Am J Manag Care. 2014;20(5):393-400.
176. Reichert A, Jacobs R. The impact of waiting time on patient outcomes: Evidence from early intervention in psychosis services in England. Health Econ. 2018;27(11):1772-1787.
177. Doyle C, Lennox L, Bell D. A systematic review of evidence on the links between patient experience and clinical safety and effectiveness. BMJ Open. 2013;3(1):e001570.
178. Horvath AO, Del Re AC, Flückiger C, Symonds D. Alliance in individual psychotherapy. Psychotherapy. 2011;48(1):9-16.
179. Farley H, Enguidanos ER, Coletti CM, et al. Patient satisfaction surveys and quality of care: an information paper. Ann Emerg Med. 2014;64(4):351-357.
180. Aiken LH, Sermeus W, Van den Heede K, et al. Patient safety, satisfaction, and quality of hospital care: cross sectional surveys of nurses and patients in 12 countries in Europe and the United States. BMJ. 2012;344:e1717.
181. Boulding W, Glickman SW, Manary MP, Schulman KA, Staelin R. Relationship between patient satisfaction with inpatient care and hospital readmission within 30 days. Am J Manag Care. 2011;17(1):41-48.
182. Rohland BM, Langbehn DR, Rohrer JE. Relationship between service effectiveness and satisfaction among persons receiving Medicaid mental health services. Psychiatr Serv. 2000;51(2):248-250.
183. Zendjidjian X-Y, Baumstarck K, Auquier P, et al. Satisfaction of hospitalized psychiatry patients: Why should clinicians care? Patient Prefer Adherence. 2014;8:575-583.
184. Centers for Medicare & Medicaid Services. National health expenditures; aggregate and per capita amounts, annual percent change and percent distribution: Calendar years 1960-2016. National Health Expenditure Data. https://www.cms.gov/research-statistics-data-and-systems/statistics-trends-and-reports/nationalhealthexpenddata/nationalhealthaccountshistorical.html. Published 2018. Accessed August 21, 2018.
185. DuBard CA. Running the numbers. N C Med J. 2016;77(4):297-300.
186. Peikes D, Chen A, Schore J, Brown R. Effects of care coordination on hospitalization, quality of care, and health care expenditures among Medicare beneficiaries: 15 randomized trials. JAMA. 2009;301(6):603-618.
187. Seow H-Y, Sibley LM. Developing a dashboard to help measure and achieve the triple aim: A population-based cohort study. BMC Health Serv Res. 2014;14(1):363.
188. Lee VS, Kawamoto K, Hess R, et al. Implementation of a value-driven outcomes program to identify high variability in clinical costs and outcomes and association with reduced cost and improved quality. JAMA. 2016;316(10):1061.
189. Dyrbye LN, Shanafelt TD, Sinsky CA, et al. Burnout among health care professionals: A call to explore and address this underrecognized threat to safe, high-quality care discussion paper. National Academy of Medicine. July 5, 2017. Accessed January 11, 2021. https://nam.edu/burnout-among-health-care-professionals-a-call-to-explore-and-address-this-underrecognized-threat-to-safe-high-quality-care/
190. Johnson J, Hall LH, Berzins K, et al. Mental healthcare staff well-being and burnout: a narrative review of trends, causes, implications, and recommendations for future interventions. Int J Ment Health Nurs. 2018;27(1):20-32.
191. Morse G, Salyers MP, Rollins AL, et al. Burnout in mental health services: a review of the problem and its remediation. Adm Policy Ment Health. 2012;39(5):341-352.
192. Hall LH, Johnson J, Watt I, et al. Healthcare staff wellbeing, burnout, and patient safety: a systematic review. PLoS One. 2016;11(7):e0159015.
193. Garman AN, Corrigan PW, Morris S. Staff burnout and patient satisfaction: evidence of relationships at the care unit level. J Occup Health Psychol. 2002;7(3):235-241.
194. Wilkinson H, Whittington R, Perry L, Eames C. Examining the relationship between burnout and empathy in healthcare professionals: a systematic review. Burn Res. 2017;6:18-29.
195. Holmqvist R, Jeanneau M. Burnout and psychiatric staff’s feelings towards patients. Psychiatry Res. 2006;145(2-3):207-213.
196. Leiter MP, Maslach C. Nurse turnover: the mediating role of burnout. J Nurs Manag. 2009;17(3):331-339.
197. Zhang Y, Feng X. The relationship between job satisfaction, burnout, and turnover intention among physicians from urban state-owned medical institutions in Hubei, China: a cross-sectional study. BMC Health Serv Res. 2011;11(1):235.
198. Halter M, Boiko O, Pelone F, et al. The determinants and consequences of adult nursing staff turnover: a systematic review of systematic reviews. BMC Health Serv Res. 2017;17(1):824.
199. Hamidi MS, Bohman B, Sandborg C, et al. Estimating institutional physician turnover attributable to self-reported burnout and associated financial burden: a case study. BMC Health Serv Res. 2018;18(1):851.
200. National Taskforce for Humanity in Healthcare. The business case for humanity in healthcare position paper. April 2018. Accessed January 11, 2021. https://www.vocera.com/public/pdf/NTHBusinessCase_final003.pdf
201. Waldman JD, Kelly F, Arora S, Smith HL. The shocking cost of turnover in health care. Health Care Manage Rev. 2004;29(1):2-7.
202. Brunette MF, Asher D, Whitley R, et al. Implementation of integrated dual disorders treatment: a qualitative analysis of facilitators and barriers. Psychiatr Serv. 2008;59(9):989-995.
203. Mancini AD, Moser LL, Whitley R, et al. Assertive community treatment: facilitators and barriers to implementation in routine mental health settings. Psychiatr Serv. 2009;60(2):189-195.
204. Rollins AL, Salyers MP, Tsai J, Lydick JM. Staff turnover in statewide implementation of ACT: Relationship with ACT fidelity and other team characteristics. Adm Policy Ment Health. 2010;37(5):417-426.
205. Woltmann EM, Whitley R, McHugo GJ, et al. The role of staff turnover in the implementation of evidence-based practices in mental health care. Psychiatr Serv. 2008;59(7):732-737.
206. Alegría M, NeMoyer A, Falgàs Bagué I, et al. Social determinants of mental health: Where we are and where we need to go. Curr Psychiatry Rep. 2018;20(11):95.
207. Daniel H, Bornstein SS, Kane GC. Addressing social determinants to improve patient care and promote health equity: an American College of Physicians position paper. Ann Intern Med. 2018;168(8):577-578.
208. Park H, Roubal AM, Jovaag A, Gennuso KP, Catlin BB. Relative contributions of a set of health factors to selected health outcomes. Am J Prev Med. 2015;49(6):961-969.
209. Ash AS, Mick EO, Ellis RP, et al. Social determinants of health in managed care payment formulas. JAMA Intern Med. 2017;177(10):1424.
210. de Beurs E, Warmerdam EH, Oudejans SCC, et al. Treatment outcome, duration, and costs: a comparison of performance indicators using data from eight mental health care providers in the Netherlands. Adm Policy Ment Health. 2018;45(2):212-223.
211. Dunbar-Rees R. Paying for what matters most: the future of outcomes-based payments in healthcare. Future Healthc J. 2018;5(2):98-102.
212. Woolhandler S, Himmelstein DU. Administrative work consumes one-sixth of U.S. physicians’ working hours and lowers their career satisfaction. Int J Health Serv. 2014;44(4):635-642.
From the Milwaukee County Behavioral Health Division, Milwaukee, WI.
Abstract
Objective: Implementation of the Quadruple Aim of health care must begin with a clearly articulated set of concepts, or core domains (CDs), that comprise each aim. These CDs can then be operationalized with existing or new measures. If aligned to the organization’s mission and strategic goals, these CDs have the potential to focus quality improvement activities and reduce measurement burden. This article represents the efforts of a publicly funded behavioral health system to operationalize the Quadruple Aim through the development of CDs.
Methods: Various stakeholders across the organization were consulted on their perceptions of the Quadruple Aim and the CDs they believed should support it. Then, a review of existing literature on core metrics for health care and population health was completed, summarized, and integrated with the stakeholder feedback.
Results: These efforts led to the development and adoption of 15 CDs, with an accompanying literature review and set of recommendations of new and existing measures for each domain.
Conclusions: It is possible to create a comprehensive yet economical set of CDs and attendant measures that can be implemented in a staged, scalable, enterprise manner. It is hoped that the process articulated here, and the accompanying literature review, may be of some benefit to other public or government-run health systems in their own quality improvement journey to operationalize the Quadruple Aim by developing a set of CDs.
Keywords: quality measures; quality improvement; adult behavioral health.
First articulated in 2008, the Triple Aim proposes that health care systems should simultaneously seek to improve the patient’s experience of care, improve the health of populations, and reduce the per capita costs of care for populations.1 More recently, some have argued that health care provider burnout can deleteriously impact the attainment of the Triple Aim and have therefore advocated for an expanded focus to include a fourth Aim, the work life quality of the staff.2 Milwaukee County Behavioral Health Division (BHD), a publicly funded, county-based behavioral health care system in Milwaukee, Wisconsin, recently adopted the Quadruple Aim as the framework by which it will organize its quality activities.
Although originally developed for medical organizations, BHD believes that the Quadruple Aim has strong applicability to county-level behavioral health services. Many county-based behavioral health divisions provide a variety of programs to large segments of the county based on financial eligibility and/or clinical need, and thus often have responsibilities to populations or subpopulations, rather than programs. County health divisions, such as Milwaukee County’s Department of Health and Human Services, are often asked to improve outcomes and client experience of care with neutral growth budgets and less reliance on taxes to fund programs, while simultaneously attracting and retaining competent staff.
Crucial to the effective implementation of the Quadruple Aim, however, is a clear set of population- level measures that help organizations assess their progress.3 Unfortunately, as some authors have noted, evaluation of the Quadruple Aim remains a challenge because the “concepts of (population) health, quality of care and costs are not unanimously defined and measures for these concepts are under construction.”4 Several authors have provided some guidance to assist in the development of a set of measures that effectively capture the elements of the Quadruple Aim.5,6 However, the recent rapid proliferation of quality measures in health care7,8 has been both burdensome and costly for providers.9,10 Any measures adopted should not only be as meaningful as possible with regards to assessing progress towards the basic aims of health care, but should also be parsimonious, to limit measurement burden for providers (and patients) and focus attention on important issues.11,12
To select the most effective, parsimonious set of measures possible, one must first select a set of key foci from among the many possible areas of focus that the core measure is intended to represent. The core domains (CDs), if appropriately consistent with the strategic goals of the organization, provide a mechanism to orient the efforts of the organization at every level and help every staff member of the organization understand how his or her work impacts the progress towards these goals.11 The CDs, therefore, represent the opportunity to affect a greater integration of efforts across the organization toward these shared aims, creating uniformity of purpose at every level. Further, increasing organizational attention on the CDs can also help to reduce measurement burden by streamlining and focusing the data capture processes on the most valuable elements of quality and health, and discarding other extraneous measures (albeit not at the expense of other reporting requirements).11 The remainder of this article describes the CDs selected by BHD to assess its progress toward implementation of the Quadruple Aim and are organized by the Aim which they best represent.
Methods
To effectively implement the Quadruple Aim at BHD, it was necessary to clearly define the subpopulation of focus for our efforts.6 In this case, the subpopulation of interest was defined as all adult clients (18 years and older) who received at least 1 service encounter within a specified time frame from a program that BHD either operated or contracted with to provide care. Services provided by the BHD network include everything from psychiatric inpatient services to mental health and addiction treatment and care management. A limited array of social services, including housing and employment services, is also available to eligible consumers. BHD is the county-run behavioral health provider for individuals who are uninsured or underinsured in Milwaukee County, a demographically diverse, primarily urban county of approximately 950,000 people located in Wisconsin. Approximately 15,000 adults receive services at BHD each year.
This work began by obtaining executive sponsorship for the project, in this case from the Chief Operations Officer and Executive Medical Director of BHD. With their backing, an initial review of the literature produced a preliminary set of possible domains, for which we created working definitions. We then made a list of key stakeholders throughout BHD to whom we needed to present the idea of the Quadruple Aim, and the CDs under each Aim, to secure their support. These stakeholders, which included individuals involved in quality activities, program managers, and executive leadership, were strategically selected based on their relative influence within the organization. A set of brief presentations and handouts explaining the project were then developed and shared at different focus groups with these stakeholders over the course of 6 months. These focus groups served to not only educate the organization about the Quadruple Aim and the CDs but afforded participants an opportunity to provide feedback as well.
During the focus groups, we asked participants which domains they believed were most important (were “core”) when operationalizing the Quadruple Aim. The focus groups provided feedback on the domain definitions, feedback that was used to develop uniform, mutually agreed upon definitions for the CDs that were generalizable to all departments at BHD, regardless of the focus of their services within the continuum of care or the continuum of age. This was a crucial step, as it will eventually enable BHD to aggregate data across departments, even if there are minor discrepancies in the specific items they use to assess the CDs. Comments from the focus groups ultimately resulted in a truncated list of domains and definitions, which, coupled with the literature review, resulted in our final set of CDs.
During our review of the literature, we also looked for items that we felt could best represent each CD in the briefest, most meaningful way. (These items were not meant to supersede existing data, but to provide examples that could be implemented with existing data or recommendations that could be utilized in the absence of existing data.) During this process, we made every effort to make use of existing data-reporting requirements. For example, if we had a state mandate to collect data on housing status, we attempted to leverage this required data point to represent the CD related to housing. In other cases, we attempted to utilize claims or other administrative data to operationalize the CD, such as in the cost-of-care metric articulated in the section the Third Aim. For CDs for which no data existed or were insufficient, we emphasized the use of single- versus multi-item scales. For example, if we found a single-item global assessment of quality of life that had good psychometric properties relative to its longer parent scale, we selected the single item. This approach to item selection allowed us to create the most efficient, parsimonious set of measures possible, which we believed would enable us to comprehensively assess all the CDs with the least amount of burden to staff and clients. These items were presented at stakeholder focus groups, during which we asked for comments on the existing measures in their program or department and gave them the opportunity to comment on the new recommended measures.
A working definition is provided for each CD, followed by a brief review of the research base supporting its inclusion in the final list. The item(s) selected by BHD to represent each CD and the source of the item(s) are then supplied. These items were based either on measures currently collected because of existing reporting mandates or, in the case where extant measures were not available, on new items that demonstrated acceptable psychometric properties in the research literature. The CDs and items are organized by the Aim they best represent. A full list of the CDs by Quadruple Aim and items by CD is provided in the Appendix of the online version of this article. This article concludes with a brief summary of this effort and a discussion of how staff will utilize these items at different levels throughout the BHD system.
The First Aim: Population Health
Health Outcomes
Deaths. This can be defined as the cause of death, as determined by the medical examiner’s office (where appropriate) or as the age at time of death. This CD can also be reported as proportion of deaths considered premature (eg, before age 75) or calculated as total years of potential life lost.
Brief review and suggested item(s). Rates and causes of premature mortality are critical foci for the County Health Rankings & Roadmaps,13 the Institute for Healthcare Improvement’s “Guide to Measuring the Triple Aim,”6 the Centers for Disease Control and Prevention’s “Community Health Assessment for Population Health Improvement,”14 and the Institute of Medicine’s (IOM) “Vital Signs: Core Metrics for Health and Health Care Progress.”11 There is ample evidence that individuals with serious mental illness are at increased risk of early mortality relative to the general population,15-18 and this risk applies to those with substance use disorders as well.15,19-20 BHD tracks all deaths that occur while patients are receiving BHD-funded, community-based services.
Self-Reported Health and Well-Being. This CD asks patients to rate their current physical and mental health status, as well as their overall quality of life.
Brief review and suggested item(s): Self-rated physical health. Premature mortality among individuals with behavioral health issues appears to be due, in large part, to their increased vulnerability to the development of medical comorbidities.16,21 A single self-rating question has demonstrated considerable sensitivity to premature mortality,22,23 with predictive properties up to a decade prior to death.24,25 Further, self-rated health has been associated with subsequent functional decline,26,27 acute service utilization,28,29 and overall health care costs.28
Brief review and suggested item(s): Self-rated mental health. Mental health disorders are associated with significant disability worldwide,30 and comorbid mental health issues can exacerbate the course of other medical problems. For example, depression is associated with increased rates of mortality among individuals with diabetes and31 cardiovascular disease,32 as well as with rates of overall mortality,33 and psychiatric comorbidity is associated with longer lengths of stay and higher costs among patients hospitalized for medical problems.34 Research has found that a single-item measure of self-rated mental health is associated with the presence of psychiatric diagnoses, psychiatric symptoms, and subsequent depression and serious mental illness up to 1 year post-assessment.35,36 There is even evidence that self-rated mental health may be more strongly associated with self-ratings of overall health than self-ratings of physical health.37
Brief review and suggested item(s): Self-rated quality of life. Quality of life is a critical component of the recovery journey and overall health.38 For example, the County Health Rankings & Roadmaps lists “quality of life” as 1 of its key “health outcomes” in its County Health Rankings.13 As some authors have noted, quality of life is often inferred from other “objective” recovery domains, such as employment, health status, or housing status. However, there is evidence that these objective domains are functionally distinct from the inherently subjective construct of quality of life.39 This has led other authors to conclude that these domains should be assessed separately when evaluating outcomes.40 Single-item quality of life assessments have been used in research with individuals with cancer,41 adults with disabilities,42 patients with cystic fibrosis,43 and children with epilepsy.44 For this effort, BHD selected the first global quality of life item from the World Health Organization’s WHOQOL-BREF quality of life assessment,45 an item used in other quality of life research.46
Health Factors
Substance Use. This CD is a composite of 4 different types of substance use, any recent heavy alcohol use (defined as 5 or more drinks in one sitting), any recent drug use, any recent prescription drug abuse, and any recent tobacco use.
Brief review and suggested item(s). As noted, substance use disorders confer an increased risk for early mortality15,19 and are significantly implicated in disease disability burden worldwide.30 Substance use has also been associated with both the onset47,48 and exacerbation of mental health diagnoses.49-51 Further, substance use appears to heighten the risk of violence in the general population52 and especially among those with a co-occurring mental illness.53,54 The County Health Rankings & Roadmaps list alcohol and drug use as key behaviors to address to improve the overall health of a given county,13 and the Centers for Medicare & Medicaid Services (CMS) has endorsed initiation and engagement in addiction treatment as one of the measures in its Adult Core Set.55
Tobacco use continues to be one of the most significant risk factors for early mortality worldwide, and evidence indicates that it is associated with a lower life expectancy of nearly 10 years.56 Unfortunately, rates of tobacco use are even higher among those with severe mental illness relative to the general population, and their rates of smoking cessation are lower.57,58 Tobacco use is a significant risk factor for the high rates of early mortality in individuals with severe mental illness.18 Further, a recent meta-analysis noted that, relative to those who continued to smoke, those who ceased smoking had reduced rates of psychological distress and increased quality of life rankings.59 Reducing tobacco use is one of the key components of the County Health Rankings & Roadmaps, and medication assistance with smoking and tobacco use cessation is also listed in the CMS Adult Core Set.13,55
An accumulating body of evidence suggests that single-item measures can adequately detect alcohol60-62 and drug use disorders.60-64 McNeely and colleagues recently developed and tested a brief 4-item screen, the Tobacco, Alcohol, Prescription medication, and other Substance use (TAPS) tool.65,66 Preliminary evidence suggests that the TAPS tool can effectively identify the presence of problematic and disordered use of tobacco, alcohol, prescription medications, and other drugs.65-67 BHD will use the 4 items from the TAPS tool to represent its substance use CD.
Education/Employment Status. This CD assesses the proportion of BHD members who have completed high school, who are in some type of educational or training program, or who are engaged in some type of employment activity (defined as full-time, part-time, supported, sheltered workshop, or as a full-time homemaker).
Brief review and suggested item(s). Research indicates that unemployment is a risk factor for mortality, even after controlling for other risk factors (eg, age, sex, socioeconomic status [SES], health).68 Unemployment is associated with poorer physical and mental health in the general population and among those with disabilities.69-71 Promisingly, evidence suggests that gaining employment or re-employment is associated with better health,72 even for individuals with substance use disorders73 or moderate74 to severe mental health disorders.75-78 Some authors have even proposed that, above and beyond the associated health benefits, employment may also help to realize a modest cost savings due to reduced service utilization and disability.79,80 Employment is a core tenet in the Substance Abuse and Mental Health Services Administration’s (SAMHSA’s) model of recovery,81 and is also listed as an important recovery goal for individuals with behavioral health issues.82 BHD collects data on employment status on all the patients it serves as part of its state-mandated reporting requirements and will use this item in the CD data set.83
Living Situation. This is measured as the proportion of people who live in permanent, supportive, stable housing; it may also be measured as the percentage of the population living with severe housing problems or who are homeless.
Brief review and suggested item(s). Housing problems can be conceptualized as 3 inter-related components: conditions within the home, neighborhood conditions, and housing affordability, each of which can contribute uniquely to poorer physical and mental health of individuals and families84 and to educational outcomes for children.85,86 Further, individuals who are homeless have a standardized mortality ratio 2 to 5 times that of the general population,87-89 even after controlling for low income status,90 and some evidence suggests these rates are even higher among unsheltered versus sheltered homeless individuals.91 Interventions to improve the condition of housing have demonstrated positive impacts on both physical and mental health,92 and a recent study found that individuals receiving housing assistance in the form of public housing or multifamily housing from the Department of Housing and Urban Development had better self-rated physical and mental health relative to individuals on the wait list for housing assistance.93 Moreover, the provision of housing has been shown to promote reductions in substance use and health service utilization among homeless individuals with substance use disorders.94 Rog and colleagues reviewed the literature on permanent supportive housing for individuals with substance use or mental health disorders who were homeless or disabled, and found that provision of housing led to reduced rates of homelessness, emergency department (ED) and inpatient utilization and increased consumer satisfaction.95
Importantly, evidence suggests that housing is viewed as facilitative of recovery. For example, in a recent qualitative study of homeless individuals with mental illness, housing was seen as a critical first step in recovery, providing a sense of security, increasing feelings of personal independence and autonomy, improving perceptions of health and well-being, and affording a stable environment to rebuild relationships with important others.96 BHD collects data on housing status on all the patients it serves as part of its state-mandated reporting requirements and will utilize this item in the CD data set.83
Social Relationships. This is defined as recent interactions with family, supportive networks (formal and informal), and other recovery services.
Brief review and suggested item(s). Research has long established that social relationships have a significant impact on health, including rates of mortality as well as physical and mental health morbidity.97-99 Social connectedness is another of the pillars supporting an individual’s recovery in SAMHSA’s formulation. Several reviews of the recovery literature38,82 support its importance to the recovery process and inclusion in any assessment of holistic recovery. Social support has been shown to promote recovery among individuals with severe mental illness100-102 and substance use disorders,103 and may mitigate the progression of chronic, life-threatening physical illnesses.97 For the purposes of BHD’s CD data set, the social support question from the “100 Million Healthier Lives Common Questionnaire for Adults” will be used to assess individuals’ perceived adequacy of social support.104
Legal Involvement. Defined as involvement with the civil or criminal justice system, including arrests, imprisonment, or detainment.
Brief review and suggested item(s). Involvement in the criminal justice system is both disruptive for the individual in recovery and expensive to the larger health care system.105 Individuals with substance use106 and severe mental health disorders107 are over-represented in the prison system, and evidence suggests that general physical and mental health declines while individuals are in prison.108,109 Perhaps even more concerning, numerous studies have demonstrated an increase in mortality rates for individuals recently released from prison relative to the general population, particularly during the period immediately following release.108-110 This relationship may even persist long term.111 Further, research indicates that individuals recently released from prison have increased emergency care and hospital utilization.112,113
Incarceration can have significant impacts on the health of the broader community as well. For example, research has found an association between parental incarceration to rates of infant mortality,114 increased behavioral and developmental problems of children of incarcerated parents,115,116 lower rates of child support payments,117 and poorer cardiovascular health of female partners of incarcerated individuals.118 Formerly incarcerated individuals experience slower wage growth as well.119 However, evidence also indicates that engagement in mental health120 and substance abuse121 treatment can reduce the likelihood of subsequent recidivism. As part of its state-mandated reporting, BHD is required to provide information on the criminal justice system involvement of its clients in the previous 6 months, including whether they have been jailed or imprisoned,83 and this will function as its measure of legal involvement in its CD data set.
Socioeconomic Status. Socioeconomic status is the social standing or class of an individual or group. It is often measured as a combination of education, income, and occupation. It can also be defined subjectively, such as one’s evaluation of status relative to similar others or based on an individual’s interpretation of her or his financial needs.
Brief review and suggested item(s). A large body of evidence supports the existence of a robust relationship between lower SES and poor health, including mortality and chronic medical diseases,122-124 as well as mental illness.125-127 Although previous research has examined this relationship using objective indicators of SES (eg, income, education level, occupation), there has recently been an increased interest in exploring the relationship of subjective SES with health indices. Subjective SES is generally assessed by asking individuals to rate themselves relative to others in the society in which they live, in terms of wealth, occupation, educational level, or other indicators of social status. Evidence suggests that subjective SES is associated with objective measures of SES,128-130 and relates to measures of physical and mental health as well, even after controlling for objective SES.130-135 BHD will be using a modified version of the Subject SES Scale,131,135 which is deployed in the “100 Million Healthier Lives Common Questionnaire for Adults.”104
Acute Service Use. This is defined as an admission to a medical or psychiatric emergency room or to a medical or psychiatric hospital or to a detoxification facility.
Brief review and suggested item(s). The CMS Adult Core Set includes “plan all cause readmissions” as a key quality metric.55 Hospital readmissions are also endorsed by the National Committee on Quality Assurance as one of its Health Effectiveness Data and Information Set (HEDIS) measures and by the National Quality Forum. Readmissions, despite their widespread endorsement, are a somewhat controversial measure. Although readmissions are costly to the health care system,136 the relationship between readmissions and quality is inconsistent. For example, Krumholz and colleagues137 found differential rates of readmission for the same patient discharged from 2 different hospitals, which were categorized based on previous readmission rates, suggesting that hospitals do have different levels of performance even when treating the same patient. However, other data indicate that 30-day, all-cause, risk-standardized readmission rates are not associated with hospital 30-day, all-cause, risk-standardized mortality rates.138
Chin and colleague found that readmissions to the hospital that occurred more than 7 days post-discharge were likely due to community- and household-related factors, rather than hospital-related quality factors.139 Transitional care interventions that have successfully reduced 30-day readmission rates are most often multicomponent and focus not just on hospital-based interventions (eg, discharge planning, education) but on follow-up care in the community by formal supports (eg, in-home visits, telephone calls, outpatient clinic appointments, case management) and informal supports (eg, family and friends).140-143 Further, qualitative evidence suggests that some individuals perceive psychiatric hospitalizations to be the result of insufficient resources or unsuccessful attempts to maintain their stability in the community.144 Thus, unplanned or avoidable hospital readmissions may represent a failure of the continuum of care not only from the perspective of the health care system, but from the patient perspective as well.
Frequent or nonurgent use of EDs is conceptually similar to excessive or avoidable inpatient utilization in several ways. For example, overuse of EDs is costly, with some estimates suggesting that it is responsible for up to $38 billion in wasteful spending each year.145 Individuals with frequent ED visits have a greater disease burden146 and an increased risk of mortality compared to nonfrequent users.147 Research suggests that individuals who visit the ED for non-urgent issues do so because of perceived difficulties associated with accessing primary care, and the convenience of EDs relative to primary care.148-150 Moreover, similar to the hospital readmission literature discussed earlier, successful strategies to reduce high rates of ED utilization generally focus on continuum of care interventions, such as provision of case management services.151-155
This evidence implies that frequent ED utilization and hospital readmissions may not be a fundamental issue of quality (or lack thereof) in hospitals or EDs but rather a lack of, or ineffectual, transitional and continuum of care strategies and services. To underscore this point, some authors have argued that a system that is excessively crisis-oriented hinders recovery because it is reactive rather than proactive, predicated on the notion that one’s condition must deteriorate to receive care.156
Although some organizations may have access to claims data or may function as self-contained health systems (eg, the Veterans Health Administration [VHA] ), others may not have access to such data. In the absence of claims data, patient self-report of service utilization has been used as a proxy for actual agency records.157 Although concordance between medical and/or agency records and patient self-report has been variable,157 evidence generally suggests that rates of agreement are higher the shorter the recall time interval.158,159 BHD does not have access to comprehensive claims data and has therefore chosen to use 5 dichotomously scored (yes/no) questions—related to medical inpatient, medical ED, psychiatric inpatient, psychiatric ED, and detoxification use in the last 30 days—to represent the CD of acute service utilization.
The Second Aim: Quality of Care
Safety
Safety is defined as avoiding injuries to patients from the care that is intended to help them.
Brief review and suggested item(s). As noted in “Crossing the Quality Chasm,” the IOM’s seminal document, “the health care environment should be safe for all patients, in all of its processes, all the time.”160 The landmark Harvard Medical Practice Study in 1991 found that adverse events occurred in nearly 4% of all hospital admissions and, among these, over a quarter were due to negligence.161 Other estimates of adverse events range as high as 17%.162 Indeed, a recent article by Makary and Daniel estimated that medical errors may be the third leading cause of death in the United States.163 Unfortunately, research on safety in the mental health field has lagged behind that of physical health,164 with evidence indicating that research in nonhospital settings in mental health care may be particularly scarce.165 In a study of adverse events that occurred in psychiatric inpatient units in the VHA system between 2015 and 2016, Mills and colleagues found that of the 87 root cause analysis reports, suicide attempts were the most frequent, and, among safety events, falls were the most frequently reported, followed by medication events.166 Another report on data collected from psychiatric inpatient units in the VHA revealed that nearly one-fifth of patients experienced a safety event, over half of which were deemed preventable.167 These numbers likely represent an underestimation of the true volume of safety events, as another study by the same research group found that less than 40% of safety events described in patient medical records were documented in the incident reporting system.168 BHD will utilize the total number of complaints and incident reports submitted within a given time frame as its “safety” metric in the CD data set.
Wait Time for Service
The CD is defined as the length of time between the date a patient first contacted BHD for services and the date of their first clinical service.
Brief review and suggested item(s). “Timeliness” was listed among the 6 aims for improvement in “Crossing the Quality Chasm” in 2001, and it remains no less relevant today.160 For example, evidence indicates that access to primary care is inversely related to avoidable hospitalizations.169 One study found that, of patients hospitalized for cardiovascular problems, those who had difficulty accessing routine care post discharge had higher 30-day readmission rates.170 Among VHA patients, longer wait times are associated with more avoidable hospitalizations and higher rates of mortality.171 Longer wait times appear to decrease the likelihood of attending a first appointment for individuals with substance use172,173 and mental health disorders.174 Importantly, longer wait times are associated with lower ratings of the patient experience of care, including perceptions of the quality of and satisfaction with care,175 and may be associated with worse outcomes for individuals in early intervention for psychosis treatment.176 For the purposes of the CD data set, BHD will monitor the length of time between the date a patient first contacted BHD for services and the date of their first clinical service.
Patient Satisfaction
Patient satisfaction is defined as the degree of patients’ satisfaction with the care they have received.
Brief review and suggested item(s). Research has consistently demonstrated the relationship of the patient’s experience of care to a variety of safety and clinical effectiveness measures in medical health care,177 and the therapeutic alliance is one of the most consistent predictors of outcomes in behavioral health, regardless of therapeutic modality.178 Patient satisfaction is a commonly assessed aspect of the patient experience of care. Patient satisfaction scores have been correlated with patient adherence to recommended treatment regimens, care quality, and health outcomes.179 For example, Aiken et al found that patient satisfaction with hospital care was associated with higher ratings of the quality and safety of nursing care in these hospitals.180 Increased satisfaction with inpatient care has been associated with lower 30-day readmission rates for patients with acute myocardial infarction, heart failure, and pneumonia,181 and patients with schizophrenia who reported higher treatment satisfaction also reported better quality of life.182,183 Many satisfaction survey options exist to evaluate this CD, including the Consumer Assessment of Healthcare Providers and Systems and the Client Satisfaction Questionnaire; BHD will utilize an outpatient behavioral health survey from a third-party vendor.
The Third Aim: Cost of Care
Cost of Care
This can be defined as the average cost to provide care per patient per month.
Brief review and suggested item(s). Per capita cost, or rather, the total cost of providing care to a circumscribed population divided by the total population, has been espoused as an important metric for the Triple Aim and the County Health Rankings.6,13 Indeed, between 1960 and 2016, per capita expenditures for health care have grown 70-fold, and the percent of the national gross domestic product accounted for by health expenditures has more than tripled (5.0% to 17.9%).184 One of the more common metrics deployed for assessing health care cost is the per capita per month cost, or rather, the per member per month cost of the predefined population for a given health care system.6,185,186 In fact, some authors have proposed that cost of care can be used not only to track efficient resource allocation, but can also be a proxy for a healthier population as well (ie, as health improves, individuals use fewer and less-expensive services, thus costing the system less).187 To assess this metric, BHD will calculate the total amount billed for patient care provided within BHD’s health network each month (irrespective of funding source) and then divide this sum by the number of members served each month. Although this measure does not account for care received at other health care facilities outside BHD’s provider network, nor does it include all the overhead costs associated with the care provided by BHD itself, it is consistent with the claims-based approach used or recommended by other authors.6,188
The Fourth Aim: Staff Well-being
Staff Quality of Work Life
This can be defined as the quality of the work life of health care clinicians and staff.
Brief review and suggested item(s). Some authors have suggested that the Triple Aim framework is incomplete and have proffered compelling arguments that provider well-being and the quality of work life constitutes a fourth aim.2 Provider burnout is prevalent in both medical2,189 and behavioral health care.190,191 Burnout among health care professionals has been associated with higher rates of perceived medical errors,192 lower patient satisfaction scores,189,193 lower rates of provider empathy,194 more negative attitudes towards patients,195 and poorer staff mental and physical health.191
Burnout is also associated with higher rates of absenteeism, turnover intentions, and turnover.190,191,196,197 However, burnout is not the only predictor of staff turnover; for example, turnover rates are a useful proxy for staff quality of work life for several reasons.198 First, turnover is associated with substantial direct and indirect costs, including lost productivity, increased errors, and lost revenue and recruitment costs, with some turnover cost estimates as high as $17 billion for physicians and $14 billion for nurses annually.199-201 Second, research indicates that staff turnover can have a deleterious impact on implementation of evidence-based interventions.202-205 Finally, consistent with the philosophy of utilizing existing data sources for the CD measures, turnover can be relatively easily extracted from administrative data for operated or contracted programs, and its collection does not place any additional burden on staff. As a large behavioral health system that is both a provider and payer of care, BHD will therefore examine the turnover rates of its internal administrative and clinical staff as well as the turnover of staff in its contracted provider network as its measures for the Staff Quality of Work Life CD.
Clinical Implications
These metrics can be deployed at any level of the organization. Clinicians may use 1 or more of the measures to track the recovery of individual clients, or in aggregate for their entire caseload. Similarly, managers can use these measures to assess the overall effectiveness of the programs for which they are responsible. Executive leaders can evaluate the impact of several programs or the system of care on the health of a subpopulation of clients with a specific condition, or for all their enrolled members. Further, not all measures need be utilized for every dashboard or evaluative effort. The benefit of a comprehensive set of measures lies in their flexibility—1 or more of the measures may be selected depending on the project being implemented or the interests of the stakeholder.
It is important to note that many of the CDs (and their accompanying measures) are aligned to/consistent with social determinants of health.206,207 Evidence suggests that social determinants make substantial contributions to the overall health of individuals and populations and may even account for a greater proportion of variance in health outcomes than health care itself.208 The measures articulated here, therefore, can be used to assess whether and how effectively care provision has addressed these social determinants, as well as the relative impact their resolution may have on other health outcomes (eg, mortality, self-rated health).
These measures can also be used to stratify clients by clinical severity or degree of socioeconomic deprivation. The ability to adjust for risk has many applications in health care, particularly when organizations are attempting to implement value-based purchasing models, such as pay-for-performance contracts or other alternative payment models (population health-based payment models).209 Indeed, once fully implemented, the CDs and measures will enable BHD to more effectively build and execute different conceptual models of “value” (see references 210 and 211 for examples). We will be able to assess the progress our clients have made in care, the cost associated with that degree of improvement, the experience of those clients receiving that care, and the clinical and social variables that may influence the relative degree of improvement (or lack thereof). Thus, the CDs provide a conceptual and data-driven foundation for the Quadruple Aim and any quality initiatives that either catalyze or augment its implementation.
Conclusion
This article provides an overview of the CDs selected by BHD to help organize, focus, advance, and track its quality efforts within the framework of the Quadruple Aim. Although items aligned to each of these CDs are offered, the CDs themselves have been broadly conceptualized such that they can flexibly admit a variety of possible items and/or assessments to operationalize each CD and thus have potential applicability to other behavioral health systems, particularly public systems that have state-mandated and other data reporting requirements.
Bearing in mind the burden that growing data collection requirements can have on the provision of quality care and staff work satisfaction and burnout,10,212 the CDs (and the items selected to represent each) are designed with “strategic parsimony” in mind. Although the CDs are inclusive in that they cover care quality, cost of care, staff quality of life, and general population health, only CDs and items undergirded by a solid evidence base and high value with regards to BHD’s mission and values, as determined by key stakeholders, were selected. Moreover, BHD attempted to make use of existing data collection and reporting mandates when selecting the final pool of items to reduce the measurement burden on staff and clients. Thus, the final set of CDs and items are designed to be comprehensive yet economical.
The CDs are deeply interrelated. Although each CD may be individually viewed as a valuable metric, improvements in any 1 CD will impact the others (eg, increasing care quality should impact population health, increasing staff quality of life should impact the quality of care). Moreover, this idea of interrelatedness acknowledges the need to view health systems and the populations they serve holistically, in that improvement is not simply the degree of change in any given metric (whether individually or collectively), but rather something more entirely. The concepts of value, quality, and health are complex, multidimensional, and dynamic, and the CDs that comprise these concepts should not be considered independently from one another. The CDs (and items) offered in this article are scalable in that they can be used at different levels of an organization depending on the question or stakeholder, and can be used individually or in combination with one another. Moreover, they are adaptable to a variety of risk-adjusted program, population health, and value-based evaluation models. It is hoped that the process articulated here, and the accompanying literature review, may benefit other public or government-run health systems in their own quality journey to operationalize the Quadruple Aim by developing a set of CDs.
Corresponding author: Walter Matthew Drymalski, PhD; [email protected].
Financial disclosures: None.
1. Berwick DM, Nolan TW, Whittington J. The Triple Aim: Care, health, and cost. Health Aff (Millwood). 2008;27(3):759-769.
2. Bodenheimer T, Sinsky C. From Triple to Quadruple Aim: Care of the patient requires care of the provider. Ann Fam Med. 2014;12(6):573-576.
3. Whittington JW, Nolan K, Lewis N, Torres T. Pursuing the Triple Aim: The first 7 years. Milbank Q. 2015;93(2):263-300.
4. Hendrikx RJP, Drewes HW, Spreeuwenberg M, et al. Which Triple Aim related measures are being used to evaluate population management initiatives? An international comparative analysis. Health Policy. 2016;120(5):471-485.
5. Kassler WJ, Howerton M, Thompson A, et al. Population Health Measurement at Centers for Medicare & Medicaid Services: Bridging the gap between public health and clinical quality. Popul Health Manag. 2017;20(3):173-180.
6. Stiefel MC, Nolan K. A Guide to Measuring the Triple Aim: Population health, experience of care, and per capita cost. IHI Innovation Series white paper. Institute for Healthcare Improvement; 2012.
7. Panzer RJ, Gitomer RS, Greene WH, et al. Increasing demands for quality measurement. JAMA. 2013;310(18):1971-1980.
8. Schuster MA, Onorato SE, Meltzer DO. Measuring the cost of quality measurement: a missing link in quality strategy. JAMA. 2017;318(13):1219-1220.
9. Casalino LP, Gans D, Weber R, et al. US physician practices spend more than $15.4 billion annually to report quality measures. Health Aff (Millwood). 2016;35(3):401-406.
10. Rao SK, Kimball AB, Lehrhoff SR, et al. The impact of administrative burden on academic physicians: results of a hospital-wide physician survey. Acad Med. 2017;92(2):237-243.
11. Institute of Medicine. Vital signs: Core metrics for health and health care progress. National Academies Press; 2015.
12. Meyer GS, Nelson EC, Pryor DB, et al. More quality measures versus measuring what matters: a call for balance and parsimony: Table 1. BMJ Qual Saf. 2012;21(11):964-968.
13. County Health Rankings. Measures & data sources. County Health Rankings & Roadmaps. Accessed January 11, 2021. https://www.countyhealthrankings.org/explore-health-rankings/measures-data-sources
14. U.S. Centers for Disease Control and Prevention. Community Health Assessment for population health improvement: Resource of most frequently recommended health outcomes and determinants. Office of Surveillance, Epidemiology, and Laboratory Services; 2013.
15. Chang C-K, Hayes RD, Perera G, et al. Life expectancy at birth for people with serious mental illness and other major disorders from a secondary mental health care case register in London. PLoS One. 2011;6(5):e19590.
16. De Hert M, Correll CU, Bobes J, et al. Physical illness in patients with severe mental disorders. I. Prevalence, impact of medications and disparities in health care. World Psychiatry. 2011;10(1):52-77.
17. Druss BG, Zhao L, Von Esenwein S, Morrato EH, Marcus SC. Understanding excess mortality in persons with mental illness: 17-year follow up of a nationally representative US survey. Med Care. 2011;49(6):599-604.
18. National Association of State Mental Health Program Directors, (NASMHPD) Medical Directors Council. Morbidity and mortality in people with serious mental illness. National Association of State Mental Health Program Directors, (NASMHPD) Medical Directors Council; 2006.
19. Nordentoft M, Wahlbeck K, Hällgren J, et al. Excess mortality, causes of death and life expectancy in 270,770 patients with recent onset of mental disorders in Denmark, Finland and Sweden. PLoS One. 2013;8(1):e55176.
20. Griswold MG, Fullman N, Hawley C, et al. Alcohol use and burden for 195 countries and territories, 1990–2016: a systematic analysis for the Global Burden of Disease Study 2016. Lancet. 2018;392(10152):1015-1035.
21. Walker ER, Druss BG. A public health perspective on mental and medical comorbidity. JAMA. 2016;316(10):1104-1105.
22. DeSalvo KB, Bloser N, Reynolds K, et al. Mortality prediction with a single general self-rated health question: a meta-analysis. J Gen Intern Med. 2005;21(3):267-275.
23. Mavaddat N, Parker RA, Sanderson S, et al. Relationship of self-rated health with fatal and non-fatal outcomes in cardiovascular disease: a systematic review and meta-analysis. PLoS One. 2014;9(7):e103509.
24. Lima-Costa MF, Cesar CC, Chor D, Proietti FA. Self-rated health compared with objectively measured health status as a tool for mortality risk screening in older adults: 10-year follow-up of the Bambui Cohort Study of Aging. Am J Epidemiol. 2012;175(3):228-235.
25. Stenholm S, Pentti J, Kawachi I, et al. Self-rated health in the last 12 years of life compared to matched surviving controls: the Health and Retirement Study. PLoS One. 2014;9(9):e107879.
26. Lee Y. The predictive value of self-assessed general, physical, and mental health on functional decline and mortality in older adults. J Epidemiol Community Health. 2000;54(2):123-129.
27. Tomioka K, Kurumatani N, Hosoi H. Self-rated health predicts decline in instrumental activities of daily living among high-functioning community-dwelling older people. Age Ageing. 2017;46(2):265-270.
28. DeSalvo KB, Jones TM, Peabody J, et al. Health care expenditure prediction with a single item, self-rated health measure. Med Care. 2009;47(4):440-447.
29. Farkas J, Kosnik M, Flezar M, Suskovic S, Lainscak M. Self-rated health predicts acute exacerbations and hospitalizations in patients with COPD. Chest. 2010;138(2):323-330.
30. Whiteford HA, Degenhardt L, Rehm J, et al. Global burden of disease attributable to mental and substance use disorders: findings from the Global Burden of Disease Study 2010. Lancet. 2013;382(9904):1575-1586.
31. Park M, Katon WJ, Wolf FM. Depression and risk of mortality in individuals with diabetes: a meta-analysis and systematic review. Gen Hosp Psychiatry. 2013;35(3):217-225.
32. Hare DL, Toukhsati SR, Johansson P, Jaarsma T. Depression and cardiovascular disease: a clinical review. Eur Heart J. 2014;35(21):1365-1372.
33. Cuijpers P, Schoevers RA. Increased mortality in depressive disorders: a review. Curr Psychiatry Rep. 2004;6(6):430-437.
34. Jansen L, van Schijndel M, van Waarde J, van Busschbach J. Health-economic outcomes in hospital patients with medical-psychiatric comorbidity: a systematic review and meta-analysis. PLoS One. 2018;13(3):e0194029.
35. Ahmad F, Jhajj AK, Stewart DE, et al. Single item measures of self-rated mental health: a scoping review. BMC Health Serv Res. 2014;14:398.
36. McAlpine DD, McCreedy E, Alang S. The meaning and predictive value of self-rated mental health among persons with a mental health problem. J Health Soc Behav. 2018;59(2):200-214.
37. Levinson D, Kaplan G. What does self-rated mental health represent? J Public Health Res. 2014;3(3):287.
38. Leamy M, Bird V, Boutillier CL, et al. Conceptual framework for personal recovery in mental health: systematic review and narrative synthesis. Br J Psychiatry. 2011;199(6):445-452.
39. Smith KW, Avis NE, Assmann SF. Distinguishing between quality of life and health status in quality of life research: a meta-analysis. Qual Life Res. 1999;8(5):447-459.
40. Hamming JF, De Vries J. Measuring quality of life. Br J Surg. 2007;94(8):923-924.
41. Singh JA, Satele D, Pattabasavaiah S, et al. Normative data and clinically significant effect sizes for single-item numerical linear analogue self-assessment (LASA) scales. Health Qual Life Outcomes. 2014;12(1):187.
42. Siebens HC, Tsukerman D, Adkins RH, et al. Correlates of a single-item quality-of-life measure in people aging with disabilities. Am J Phys Med Rehabil. 2015;94(12):1065-1074.
43. Yohannes AM, Dodd M, Morris J, Webb K. Reliability and validity of a single item measure of quality of life scale for adult patients with cystic fibrosis. Health Qual Life Outcomes. 2011;9(1):105.
44. Conway L, Widjaja E, Smith ML. Single-item measure for assessing quality of life in children with drug-resistant epilepsy. Epilepsia Open. 2018;3(1):46-54.
45. Skevington SM, Lofty M, O’Connell KA. The World Health Organization’s WHOQOL-BREF quality of life assessment: psychometric properties and results of the international field trial. Qual Life Res. 2004;13:299-310.
46. Atroszko PA, Baginska P, Mokosinska M, et al. Validity and reliability of single-item self-report measures of general quality of life, general health and sleep quality. In: CER Comparative European Research Conference: Research Track. Vol 2. Sciemcee Publishing; 2015:207-211.
47. Beaulieu S, Saury S, Sareen J, et al.
48. Marconi A, Di Forti M, Lewis CM, et al. Meta-analysis of the association between the level of cannabis use and risk of psychosis. Schizophr Bull. 2016;42(5):1262-1269.
49. Baker AL, Hiles SA, Thornton LK, et al. A systematic review of psychological interventions for excessive alcohol consumption among people with psychotic disorders. Acta Psychiatr Scand. 2012;126(4):243-255.
50. Baker AL, Hides L, Lubman DI. Treatment of cannabis use among people with psychotic or depressive disorders: a systematic review. J Clin Psychiatry. 2010;71(3):247-254.
51. Berenz EC, Coffey SF. Treatment of co-occurring posttraumatic stress disorder and substance use disorders. Curr Psychiatry Rep. 2012;14(5):469-477.
52. Pickard H, Fazel S. Substance abuse as a risk factor for violence in mental illness: some implications for forensic psychiatric practice and clinical ethics. Curr Opin Psychiatry. 2013;26(4):349-354.
53. Fazel S, Gulati G, Linsell L, Geddes JR, Grann M. Schizophrenia and violence: systematic review and meta-analysis. PLoS Med. 2009;6(8):e1000120.
54. Van Dorn R, Volavka J, Johnson N. Mental disorder and violence: Is there a relationship beyond substance use? Soc Psychiatry Psychiatr Epidemiol. 2012;47(3):487-503.
55. Centers for Medicare & Medicaid Services. 2019 Core set of adult health care quality measures for Medicaid (adult core set). Adult health care quality measures. Accessed January 11, 2021. https://www.medicaid.gov/medicaid/quality-of-care/performance-measurement/adult-core-set/index.html.
56. Jha P, Peto R. Global effects of smoking, of quitting, and of taxing tobacco. N Engl J Med. 2014;370(1):60-68.
57. Lê Cook B, Wayne GF, Kafali EN, et al. Trends in smoking among adults with mental illness and association between mental health treatment and smoking cessation. JAMA. 2014;311(2):172-182.
58. Smith PH, Mazure CM, McKee SA. Smoking and mental illness in the US population. Tob Control. 2014;23(0):e147-e153.
59. Taylor G, McNeill A, Girling A, et al. Change in mental health after smoking cessation: systematic review and meta-analysis. BMJ. 2014;348:g1151.
60. McNeely J, Cleland CM, Strauss SM, et al. Validation of self-administered single-item screening questions (SISQs) for unhealthy alcohol and drug use in primary care patients. J Gen Intern Med. 2015;30(12):1757-1764.
61. Saitz R, Cheng DM, Allensworth-Davies D, et al. The ability of single screening questions for unhealthy alcohol and other drug use to identify substance dependence in primary care. J Stud Alcohol Drugs. 2014;75(1):153-157.
62. Smith PC, Schmidt SM, Allensworth-Davies D, Saitz R. Primary care validation of a single-question alcohol screening test. J Gen Intern Med. 2009;24(7):783-788.
63. Dawson DA, Compton WM, Grant BF. Frequency of 5+/4+ drinks as a screener for drug use and drug-use disorders. J Stud Alcohol Drugs. 2010;71(5):751-760.
64. Smith PC, Schmidt SM, Allensworth-Davies D, Saitz R. A single-question screening test for drug use in primary care. Arch Intern Med. 2010;170(13):1155-1160.
65. McNeely J, Strauss SM, Saitz R, et al. A brief patient self-administered substance use screening tool for primary care: two-site validation study of the Substance Use Brief Screen (SUBS). Am J Med. 2015;128(7):784.e9-784.e19.
66. McNeely J, Wu L-T, Subramaniam G, et al. Performance of the Tobacco, Alcohol, Prescription medication, and other Substance use (TAPS) tool for substance use screening in primary care patients. Ann Intern Med. 2016;165(10):690-699.
67. Gryczynski J, McNeely J, Wu L-T, et al. Validation of the TAPS-1: a four-item screening tool to identify unhealthy substance use in primary care. J Gen Intern Med. 2017;32(9):990-996.
68. Roelfs DJ, Shor E, Davidson KW, Schwartz JE. Losing life and livelihood: a systematic review and meta-analysis of unemployment and all-cause mortality. Soc Sci Med. 2011;72(6):840-854.
69. McKee-Ryan F, Song Z, Wanberg CR, Kinicki AJ. Psychological and physical well-being during unemployment: a meta-analytic study. J Appl Psychol. 2005;90(1):53-76.
70. Zhang S, Bhavsar V. Unemployment as a risk factor for mental illness: combining social and psychiatric literature. Adv Appl Sociol. 2013;03(02):131-136.
71. Goodman N. The impact of employment on the health status and health care costs of working-age people with disabilities. The Lead Center. November 2015. Accessed January 11, 2021. http://www.leadcenter.org/system/files/resource/downloadable_version/impact_of_employment_health_status_health_care_costs_0.pdf
72. Hergenrather KC, Zeglin RJ, McGuire-Kuletz M, Rhodes SD. Employment as a social determinant of health: a systematic review of longitudinal studies exploring the relationship between employment status and physical health. Rehabil Res Policy Educ. 2015;29(1):2-26.
73. Walton MT, Hall MT. The effects of employment interventions on addiction treatment outcomes: a review of the literature. J Soc Work Pract Addict. 2016;16(4):358-384.
74. Schuring M, Robroek SJ, Burdorf A. The benefits of paid employment among persons with common mental health problems: evidence for the selection and causation mechanism. Scand J Work Environ Health. 2017;43(6):540-549.
75. Burns T, Catty J, White S, et al. The impact of supported employment and working on clinical and social functioning: results of an international study of individual placement and support. Schizophr Bull. 2009;35(5):949-958.
76. Kilian R, Lauber C, Kalkan R, et al. The relationships between employment, clinical status, and psychiatric hospitalisation in patients with schizophrenia receiving either IPS or a conventional vocational rehabilitation programme. Soc Psychiatry Psychiatr Epidemiol. 2012;47(9):1381-1389.
77. Marwaha S, Johnson S. Schizophrenia and employment. Soc Psychiatry Psychiatr Epidemiol. 2004;39(5):337-349.
78. Mueser KT, Drake RE, Bond GR. Recent advances in supported employment for people with serious mental illness. Curr Opin Psychiatry. 2016;29(3):196-201.
79. Bush PW, Drake RE, Xie H, et al. The long-term impact of employment on mental health service use and costs for persons with severe mental illness. Psychiatr Serv. 2009;60(8):1024-1031.
80. Drake RE, Skinner JS, Bond GR, Goldman HH. Social security and mental illness: reducing disability with supported employment. Health Aff (Millwood). 2009;28(3):761-770.
81. Substance Abuse and Mental Health Services Administration. SAMHSA’s working definition of recovery. Substance Abuse and Mental Health Services Administration. Published 2012. Accessed January 11, 2021. https://store.samhsa.gov/system/files/pep12-recdef.pdf
82. Drake RE, Whitley R. Recovery and severe mental illness: description and analysis. Can J Psychiatry. 2014;59(5):236-242.
83. Wisconsin Department of Health Services. PPS Mental Health Module Handbook. Published 2018. Accessed January 11, 2021. https://www.dhs.wisconsin.gov/publications/p02182.pdf
84. Robert Wood Johnson Foundation. Housing and Health. How does housing affect health? May 1, 2011. Accessed January 11, 2021. https://www.rwjf.org/en/library/research/2011/05/housing-and-health.html
85. Cunningham MK, MacDonald G. Housing as a platform for improving education outcomes among low-income children. Urban Institute. May 2012. Accessed January 11, 2021. https://www.urban.org/sites/default/files/publication/25331/412554-Housing-as-a-Platform-for-Improving-Education-Outcomes-among-Low-Income-Children.PDF
86. Friedman D. Social impact of poor housing. ECOTEC. March 2010. Accessed January 11, 2021. https://southdevonrural.co.uk/userfiles/file/JC-JC13-Social-impact-of-poor-housing.pdf
87. Fazel S, Geddes JR, Kushel M. The health of homeless people in high-income countries: descriptive epidemiology, health consequences, and clinical and policy recommendations. Lancet Lond Engl. 2014;384(9953):1529-1540.
88. Nusselder WJ, Slockers MT, Krol L, et al. Mortality and life expectancy in homeless men and women in Rotterdam: 2001–2010. PLoS One. 2013;8(10):e73979.
89. O’Connell JJ. Premature mortality in homeless populations: a review of the literature. National Health Care for the Homeless Council. Published 2005. Accessed April 23, 2019. http://sbdww.org/wp-content/uploads/2011/04/PrematureMortalityFinal.pdf
90. Hwang SW, Wilkins R, Tjepkema M, et al. Mortality among residents of shelters, rooming houses, and hotels in Canada: 11 year follow-up study. BMJ. 2009;339:b4036.
91. Roncarati JS, Baggett TP, O’Connell JJ, et al. Mortality among unsheltered homeless adults in Boston, Massachusetts, 2000-2009. JAMA Intern Med. 2018;178(9):1242-1248.
92. Thomson H, Thomas S, Sellstrom E, Petticrew M. Housing improvements for health and associated socio-economic outcomes. Cochrane Database Syst Rev. 2013;(2):CD008657.
93. Fenelon A, Mayne P, Simon AE, et al. Housing assistance programs and adult health in the United States. Am J Public Health. 2017;107(4):571-578.
94. Fitzpatrick-Lewis D, Ganann R, Krishnaratne S, et al. Effectiveness of interventions to improve the health and housing status of homeless people: a rapid systematic review. BMC Public Health. 2011;11(1):638.
95. Rog DJ, Marshall T, Dougherty RH, et al. Permanent supportive housing: assessing the evidence. Psychiatr Serv. 2014;65(3):287-294.
96. Kirst M, Zerger S, Wise Harris D, et al. The promise of recovery: narratives of hope among homeless individuals with mental illness participating in a Housing First randomised controlled trial in Toronto, Canada: Table 1. BMJ Open. 2014;4(3):e004379.
97. Cohen S, Janicki-Deverts D. Can we improve our physical health by altering our social networks? Perspect Psychol Sci. 2009;4(4):375-378.
98. House JS, Landis KR, Umberson D. Social relationships and health. Science. 1988;241(4865):540-545.
99. Kawachi I, Berkman LF. Social ties and mental health. J Urban Health. 2001;78(3):458-467.
100. Schön U-K, Denhov A, Topor A. Social relationships as a decisive factor in recovering from severe mental illness. Int J Soc Psychiatry. 2009;55(4):336-347.
101. Soundy A, Stubbs B, Roskell C, et al. Identifying the facilitators and processes which influence recovery in individuals with schizophrenia: a systematic review and thematic synthesis. J Ment Health. 2015;24(2):103-110.
102. Tew J, Ramon S, Slade M, et al. Social factors and recovery from mental health difficulties: a review of the evidence. Br J Soc Work. 2012;42(3):443-460.
103. Moos RH. Theory-based processes that promote the remission of substance use disorders. Clin Psychol Rev. 2007;27(5):537-551.
104. Stiefel MC, Riley CL, Roy B, et al. 100 Million Healthier Lives Measurement System: Progress to date. Institute for Healthcare Improvement; 2016:41. Accessed January 11, 2021. http://www.100mlives.org
105. Swanson JW, Frisman LK, Robertson AG, et al. Costs of criminal justice involvement among persons with serious mental illness in Connecticut. Psychiatr Serv. 2013;64(7):630-637.
106. Fazel S, Bains P, Doll H. Substance abuse and dependence in prisoners: a systematic review. Addiction. 2006;101(2):181-191.
107. Fazel S, Seewald K. Severe mental illness in 33 588 prisoners worldwide: systematic review and meta-regression analysis. Br J Psychiatry. 2012;200(05):364-373.
108. Fazel S, Baillargeon J. The health of prisoners. Lancet. 2011;377(9769):956-965.
109. Wildeman C, Wang EA. Mass incarceration, public health, and widening inequality in the USA. Lancet. 2017;389(10077):1464-1474.
110. Zlodre J, Fazel S. All-cause and external mortality in released prisoners: systematic review and meta-analysis. Am J Public Health. 2012;102(12):e67-e75.
111. Massoglia M, Pridemore WA. Incarceration and health. Annu Rev Sociol. 2015;41:291-310.
112. Kouyoumdjian FG, Cheng SY, Fung K, et al. The health care utilization of people in prison and after prison release: a population-based cohort study in Ontario, Canada. PLoS One. 2018;13(8):e0201592.
113. Winkelman TNA, Genao I, Wildeman C, Wang EA. Emergency department and hospital use among adolescents with justice system involvement. Pediatrics. 2017;140(5):e20171144.
114. Wildeman C. Imprisonment and infant mortality. Soc Prob. 2012;59:228-257.
115. Geller A, Cooper CE, Garfinkel I, et al. Beyond absenteeism: father incarceration and child development. Demography. 2012;49(1):49-76.
116. Turney K. Stress proliferation across generations? Examining the relationship between parental incarceration and childhood health. J Health Soc Behav. 2014;55(3):302-319.
117. Geller A, Garfinkel I, Western B. Paternal incarceration and support for children in fragile families. Demography. 2011;48(1):25-47.
118. Lee H, Wildeman C, Wang EA, et al. A heavy burden: the cardiovascular health consequences of having a family member incarcerated. Am J Public Health. 2014;104(3):421-427.
119. Western B. The impact of incarceration on wage mobility and inequality. Am Sociol Rev. 2002;67(4):526-546.
120. Constantine R, Andel R, Petrila J, et al. Characteristics and experiences of adults with a serious mental illness who were involved in the criminal justice system. Psychiatr Serv. 2010;61(5):451-457.
121. Garnick DW, Horgan CM, Acevedo A, et al. Criminal justice outcomes after engagement in outpatient substance abuse treatment. J Subst Abuse Treat. 2014;46(3):295-305.
122. Adler NE, Ostrove JM. Socioeconomic status and health: what we know and what we don’t. Ann N Y Acad Sci. 1999;896(1):3-15.
123. Luo Y, Waite LJ. The impact of childhood and adult SES on physical, mental, and cognitive well-being in later life. J Gerontol Ser B. 2005;60(2):S93-S101.
124. Mackenbach JP, Stirbu I, Roskam A-JR, et al. Socioeconomic inequalities in health in 22 European countries. N Engl J Med. 2008;358(23):2468-2481.
125. Hudson CG. Socioeconomic status and mental illness: tests of the social causation and selection hypotheses. Am J Orthopsychiatry. 2005;75(1):3-18.
126. McLaughlin KA, Breslau J, Green JG, et al. Childhood socio-economic status and the onset, persistence, and severity of DSM-IV mental disorders in a US national sample. Soc Sci Med. 2011;73(7):1088-1096.
127. Muntaner C. Socioeconomic position and major mental disorders. Epidemiol Rev. 2004;26(1):53-62.
128. Präg P, Mills MC, Wittek R. Subjective socioeconomic status and health in cross-national comparison. Soc Sci Med. 2016;149:84-92.
129. Shaked D, Williams M, Evans MK, Zonderman AB. Indicators of subjective social status: differential associations across race and sex. SSM Popul Health. 2016;2:700-707.
130. Singh-Manoux A, Adler NE, Marmot MG. Subjective social status: its determinants and its association with measures of ill-health in the Whitehall II study. Soc Sci Med. 2003;56(6):1321-1333.
131. Adler NE, Epel ES, Castellazzo G, Ickovics JR. Relationship of subjective and objective social status with psychological and physiological functioning: preliminary data in healthy, white women. Health Psychol. 2000;19(6):586-592.
132. Cundiff JM, Matthews KA. Is subjective social status a unique correlate of physical health? A meta-analysis. Health Psychol. 2017;36(12):1109-1125.
133. Demakakos P, Biddulph JP, de Oliveira C, et al. Subjective social status and mortality: The English Longitudinal Study of Ageing. Eur J Epidemiol. 2018;33(8):729-739.
134. Quon EC, McGrath JJ. Subjective socioeconomic status and adolescent health: a meta-analysis. Health Psychol. 2014;33(5):433-447.
135. Scott KM, Al-Hamzawi AO, Andrade LH, et al. Associations between subjective social status and DSM-IV mental disorders: Results from the World Mental Health Surveys. JAMA Psychiatry. 2014;71(12):1400-1408.
136. Jencks SF, Williams MV, Coleman EA. Rehospitalizations among patients in the Medicare Fee-for-Service Program. N Engl J Med. 2009;360(14):1418-1428.
137. Krumholz HM, Wang K, Lin Z, et al. Hospital-readmission risk—Isolating hospital effects from patient effects. N Engl J Med. 2017;377(11):1055-1064.
138. Krumholz HM, Lin Z, Keenan PS, et al. Relationship of hospital performance with readmission and mortality rates for patients hospitalized with acute myocardial infarction, heart failure, or pneumonia. JAMA. 2013;309(6):587-593.
139. Chin DL, Bang H, Manickam RN, Romano PS. Rethinking thirty-day hospital readmissions: Shorter intervals might be better indicators of quality of care. Health Aff (Millwood). 2016;35(10):1867-1875.
140. Feltner C, Jones CD, Cené CW, et al. Transitional care interventions to prevent readmissions for persons with heart failure: a systematic review and meta-analysis. Ann Intern Med. 2014;160(11):774-784.
141. Hudon C, Chouinard M-C, Lambert M, et al. Effectiveness of case management interventions for frequent users of healthcare services: a scoping review. BMJ Open. 2016;6(9):e012353.
142. Kripalani S, Theobald CN, Anctil B, Vasilevskis EE. Reducing hospital readmission: current strategies and future directions. Annu Rev Med. 2014;65:471-485.
143. Verhaegh KJ, MacNeil-Vroomen JL, Eslami S, et al. Transitional care interventions prevent hospital readmissions for adults with chronic illnesses. Health Aff (Millwood). 2014;33(9):1531-1539.
144. Duhig M, Gunasekara I, Patterson S. Understanding readmission to psychiatric hospital in Australia from the service users’ perspective: a qualitative study. Health Soc Care Community. 2017;25(1):75-82.
145. New England Healthcare Institute. A matter of urgency: Reducing emergency department overuse. Published 2010. Accessed January 11, 2021. https://www.nehi.net/writable/publication_files/file/nehi_ed_overuse_issue_brief_032610finaledits.pdf
146. Billings J, Raven MC. Dispelling an urban legend: Frequent emergency department users have substantial burden of disease. Health Aff (Millwood). 2013;32(12):2099-2108.
147. Moe J, Kirkland S, Ospina MB, et al. Mortality, admission rates and outpatient use among frequent users of emergency departments: a systematic review. Emerg Med J. 2016;33(3):230-236.
148. Carret MLV, Fassa ACG, Domingues MR. Inappropriate use of emergency services: a systematic review of prevalence and associated factors. Cad Saúde Pública. 2009;25(1):7-28.
149. Durand A-C, Palazzolo S, Tanti-Hardouin N, et al. Nonurgent patients in emergency departments: rational or irresponsible consumers? Perceptions of professionals and patients. BMC Res Notes. 2012;5(1):525.
150. Uscher-Pines L, Pines J, Kellermann A, et al. Deciding to visit the emergency department for non-urgent conditions: a systematic review of the literature. Am J Manag Care. 2013;19(1):47-59.
151. Kumar GS, Klein R. Effectiveness of case management strategies in reducing emergency department visits in frequent user patient populations: a systematic review. J Emerg Med. 2013;44(3):717-729.
152. Moe J, Kirkland SW, Rawe E, et al. Effectiveness of interventions to decrease emergency department visits by adult frequent users: a systematic review. Acad Emerg Med. 2017;24(1):40-52.
153. Raven MC, Kushel M, Ko MJ, et al. The effectiveness of emergency department visit reduction programs: a systematic review. Ann Emerg Med. 2016;68(4):467-483.e15.
154. Soril LJJ, Leggett LE, Lorenzetti DL, et al. Reducing frequent visits to the emergency department: a systematic review of interventions. PLoS One. 2015;10(4):e0123660.
155. Van den Heede K, Van de Voorde C. Interventions to reduce emergency department utilisation: a review of reviews. Health Policy. 2016;120(12):1337-1349.
156. Onken SJ, Dumont JM, Ridgway P, et al. Mental health recovery: What helps and what hinders? October 2002. Accessed January 11, 2021. https://www.nasmhpd.org/sites/default/files//MHSIPReport%281%29.pdf
157. Leggett LE, Khadaroo RG, Holroyd-Leduc J, et al. Measuring resource utilization. Medicine (Baltimore). 2016;95(10):e2759.
158. Bhandari A, Wagner T. Self-reported utilization of health care services: improving measurement and accuracy. Med Care Res Rev. 2006;63(2):217-235.
159. Short ME, Goetzel RZ, Pei X, et al. How accurate are self-reports? An analysis of self-reported healthcare utilization and absence when compared to administrative data. J Occup Environ Med. 2009;51(7):786-796.
160. Institute of Medicine. Crossing the Quality Chasm: A New Health System for the 21st Century. National Academies Press; 2001.
161. Brennan TA, Leape LL, Laird NM, et al. Incidence of adverse events and negligence in hospitalized patients. Results of the Harvard Medical Practice Study I. N Engl J Med. 1991;324(6):370-376.
162. Rafter N, Hickey A, Condell S, et al. Adverse events in healthcare: learning from mistakes. QJM. 2015;108(4):273-277.
163. Makary MA, Daniel M. Medical error—the third leading cause of death in the US. BMJ. 2016;3(353):i2139.
164. D’Lima D, Crawford MJ, Darzi A, Archer S. Patient safety and quality of care in mental health: A world of its own? BJPsych Bull. 2017;41(5):241-243.
165. Maidment ID, Lelliott P, Paton C. Medication errors in mental healthcare: a systematic review. Qual Saf Health Care. 2006;15(6):409-413.
166. Mills PD, Watts BV, Shiner B, Hemphill RR. Adverse events occurring on mental health units. Gen Hosp Psychiatry. 2018;50:63-68.
167. Marcus SC, Hermann RC, Frankel MR, Cullen SW. Safety of psychiatric inpatients at the Veterans Health Administration. Psychiatr Serv. 2017;69(2):204-210.
168. Reilly CA, Cullen SW, Watts BV, et al. How well do incident reporting systems work on inpatient psychiatric units? Jt Comm J Qual Patient Saf. 2019;45:63-69.
169. Rosano A, Loha CA, Falvo R, et al. The relationship between avoidable hospitalization and accessibility to primary care: a systematic review. Eur J Public Health. 2013;23(3):356-360.
170. Dupre ME, Xu H, Granger BB, et al. Access to routine care and risks for 30-day readmission in patients with cardiovascular disease. Am Heart J. 2018;196:9-17.
171. Pizer SD, Prentice JC. What are the consequences of waiting for health care in the veteran population? J Gen Intern Med. 2011;26(S2):676-682.
172. Festinger DS, Lamb RJ, Kirby KC, Marlowe DB. The accelerated intake: a method for increasing initial attendance to outpatient cocaine treatment. J Appl Behav Anal. 1996;29(3):387-389.
173. Festinger DS, Lamb RJ, Marlowe DB, Kirby KC. From telephone to office: intake attendance as a function of appointment delay. Addict Behav. 2002;27(1):131-137.
174. Gallucci G, Swartz W, Hackerman F. Brief reports: Impact of the wait for an initial appointment on the rate of kept appointments at a mental health center. Psychiatr Serv. 2005;56(3):344-346.
175. Bleustein C, Rothschild DB, Valen A, et al. Wait times, patient satisfaction scores, and the perception of care. Am J Manag Care. 2014;20(5):393-400.
176. Reichert A, Jacobs R. The impact of waiting time on patient outcomes: Evidence from early intervention in psychosis services in England. Health Econ. 2018;27(11):1772-1787.
177. Doyle C, Lennox L, Bell D. A systematic review of evidence on the links between patient experience and clinical safety and effectiveness. BMJ Open. 2013;3(1):e001570.
178. Horvath AO, Del Re AC, Flückiger C, Symonds D. Alliance in individual psychotherapy. Psychotherapy. 2011;48(1):9-16.
179. Farley H, Enguidanos ER, Coletti CM, et al. Patient satisfaction surveys and quality of care: an information paper. Ann Emerg Med. 2014;64(4):351-357.
180. Aiken LH, Sermeus W, Van den Heede K, et al. Patient safety, satisfaction, and quality of hospital care: cross sectional surveys of nurses and patients in 12 countries in Europe and the United States. BMJ. 2012;344:e1717.
181. Boulding W, Glickman SW, Manary MP, Schulman KA, Staelin R. Relationship between patient satisfaction with inpatient care and hospital readmission within 30 days. Am J Manag Care. 2011;17(1):41-48.
182. Rohland BM, Langbehn DR, Rohrer JE. Relationship between service effectiveness and satisfaction among persons receiving Medicaid mental health services. Psychiatr Serv. 2000;51(2):248-250.
183. Zendjidjian X-Y, Baumstarck K, Auquier P, et al. Satisfaction of hospitalized psychiatry patients: Why should clinicians care? Patient Prefer Adherence. 2014;8:575-583.
184. Centers for Medicare & Medicaid Services. National health expenditures; aggregate and per capita amounts, annual percent change and percent distribution: Calendar years 1960-2016. National Health Expenditure Data. https://www.cms.gov/research-statistics-data-and-systems/statistics-trends-and-reports/nationalhealthexpenddata/nationalhealthaccountshistorical.html. Published 2018. Accessed August 21, 2018.
185. DuBard CA. Running the numbers. N C Med J. 2016;77(4):297-300.
186. Peikes D, Chen A, Schore J, Brown R. Effects of care coordination on hospitalization, quality of care, and health care expenditures among Medicare beneficiaries: 15 randomized trials. JAMA. 2009;301(6):603-618.
187. Seow H-Y, Sibley LM. Developing a dashboard to help measure and achieve the triple aim: A population-based cohort study. BMC Health Serv Res. 2014;14(1):363.
188. Lee VS, Kawamoto K, Hess R, et al. Implementation of a value-driven outcomes program to identify high variability in clinical costs and outcomes and association with reduced cost and improved quality. JAMA. 2016;316(10):1061.
189. Dyrbye LN, Shanafelt TD, Sinsky CA, et al. Burnout among health care professionals: A call to explore and address this underrecognized threat to safe, high-quality care discussion paper. National Academy of Medicine. July 5, 2017. Accessed January 11, 2021. https://nam.edu/burnout-among-health-care-professionals-a-call-to-explore-and-address-this-underrecognized-threat-to-safe-high-quality-care/
190. Johnson J, Hall LH, Berzins K, et al. Mental healthcare staff well-being and burnout: a narrative review of trends, causes, implications, and recommendations for future interventions. Int J Ment Health Nurs. 2018;27(1):20-32.
191. Morse G, Salyers MP, Rollins AL, et al. Burnout in mental health services: a review of the problem and its remediation. Adm Policy Ment Health. 2012;39(5):341-352.
192. Hall LH, Johnson J, Watt I, et al. Healthcare staff wellbeing, burnout, and patient safety: a systematic review. PLoS One. 2016;11(7):e0159015.
193. Garman AN, Corrigan PW, Morris S. Staff burnout and patient satisfaction: evidence of relationships at the care unit level. J Occup Health Psychol. 2002;7(3):235-241.
194. Wilkinson H, Whittington R, Perry L, Eames C. Examining the relationship between burnout and empathy in healthcare professionals: a systematic review. Burn Res. 2017;6:18-29.
195. Holmqvist R, Jeanneau M. Burnout and psychiatric staff’s feelings towards patients. Psychiatry Res. 2006;145(2-3):207-213.
196. Leiter MP, Maslach C. Nurse turnover: the mediating role of burnout. J Nurs Manag. 2009;17(3):331-339.
197. Zhang Y, Feng X. The relationship between job satisfaction, burnout, and turnover intention among physicians from urban state-owned medical institutions in Hubei, China: a cross-sectional study. BMC Health Serv Res. 2011;11(1):235.
198. Halter M, Boiko O, Pelone F, et al. The determinants and consequences of adult nursing staff turnover: a systematic review of systematic reviews. BMC Health Serv Res. 2017;17(1):824.
199. Hamidi MS, Bohman B, Sandborg C, et al. Estimating institutional physician turnover attributable to self-reported burnout and associated financial burden: a case study. BMC Health Serv Res. 2018;18(1):851.
200. National Taskforce for Humanity in Healthcare. The business case for humanity in healthcare position paper. April 2018. Accessed January 11, 2021. https://www.vocera.com/public/pdf/NTHBusinessCase_final003.pdf
201. Waldman JD, Kelly F, Arora S, Smith HL. The shocking cost of turnover in health care. Health Care Manage Rev. 2004;29(1):2-7.
202. Brunette MF, Asher D, Whitley R, et al. Implementation of integrated dual disorders treatment: a qualitative analysis of facilitators and barriers. Psychiatr Serv. 2008;59(9):989-995.
203. Mancini AD, Moser LL, Whitley R, et al. Assertive community treatment: facilitators and barriers to implementation in routine mental health settings. Psychiatr Serv. 2009;60(2):189-195.
204. Rollins AL, Salyers MP, Tsai J, Lydick JM. Staff turnover in statewide implementation of ACT: Relationship with ACT fidelity and other team characteristics. Adm Policy Ment Health. 2010;37(5):417-426.
205. Woltmann EM, Whitley R, McHugo GJ, et al. The role of staff turnover in the implementation of evidence-based practices in mental health care. Psychiatr Serv. 2008;59(7):732-737.
206. Alegría M, NeMoyer A, Falgàs Bagué I, et al. Social determinants of mental health: Where we are and where we need to go. Curr Psychiatry Rep. 2018;20(11):95.
207. Daniel H, Bornstein SS, Kane GC. Addressing social determinants to improve patient care and promote health equity: an American College of Physicians position paper. Ann Intern Med. 2018;168(8):577-578.
208. Park H, Roubal AM, Jovaag A, Gennuso KP, Catlin BB. Relative contributions of a set of health factors to selected health outcomes. Am J Prev Med. 2015;49(6):961-969.
209. Ash AS, Mick EO, Ellis RP, et al. Social determinants of health in managed care payment formulas. JAMA Intern Med. 2017;177(10):1424.
210. de Beurs E, Warmerdam EH, Oudejans SCC, et al. Treatment outcome, duration, and costs: a comparison of performance indicators using data from eight mental health care providers in the Netherlands. Adm Policy Ment Health. 2018;45(2):212-223.
211. Dunbar-Rees R. Paying for what matters most: the future of outcomes-based payments in healthcare. Future Healthc J. 2018;5(2):98-102.
212. Woolhandler S, Himmelstein DU. Administrative work consumes one-sixth of U.S. physicians’ working hours and lowers their career satisfaction. Int J Health Serv. 2014;44(4):635-642.
A Preoperative Transthoracic Echocardiography Protocol to Reduce Time to Hip Fracture Surgery
From Dignity Health Methodist Hospital of Sacramento Family Medicine Residency Program, Sacramento, CA (Dr. Oldach); Nationwide Children’s Hospital, Columbus, OH (Dr. Irwin); OhioHealth Research Institute, Columbus, OH (Dr. Pershing); Department of Clinical Transformation, OhioHealth, Columbus, OH (Dr. Zigmont and Dr. Gascon); and Department of Geriatrics, OhioHealth, Columbus, OH (Dr. Skully).
Abstract
Objective: An interdisciplinary committee was formed to identify factors contributing to surgical delays in urgent hip fracture repair at an urban, level 1 trauma center, with the goal of reducing preoperative time to less than 24 hours. Surgical optimization was identified as a primary, modifiable factor, as surgeons were reluctant to clear patients for surgery without cardiac consultation. Preoperative transthoracic echocardiogram (TTE) was recommended as a safe alternative to cardiac consultation in most patients.
Methods: A retrospective review was conducted for patients who underwent urgent hip fracture repair between January 2010 and April 2014 (n = 316). Time to medical optimization, time to surgery, hospital length of stay, and anesthesia induction were compared for 3 patient groups of interest: those who received (1) neither TTE nor cardiology consultation (ie, direct to surgery); (2) a preoperative TTE; or (3) preoperative cardiac consultation.
Results: There were significant between-group differences in medical optimization time (P = 0.001) and mean time to surgery (P < 0.001) when comparing the 3 groups of interest. Patients in the preoperative cardiac consult group had the longest times, followed by the TTE and direct-to-surgery groups. There were no differences in the type of induction agent used across treatment groups when stratifying by ejection fraction.
Conclusion: Preoperative TTE allows for decreased preoperative time compared to a cardiology consultation. It provides an easily implemented inter-departmental, intra-institutional intervention to decrease preoperative time in patients presenting with hip fractures.
Keywords: surgical delay; preoperative risk stratification; process improvement.
Hip fractures are common, expensive, and associated with poor outcomes.1,2 Ample literature suggests that morbidity, mortality, and cost of care may be reduced by minimizing surgical delays.3-5 While individual reports indicate mixed evidence, in a 2010 meta-analysis, surgery within 72 hours was associated with significant reductions in pneumonia and pressure sores, as well as a 19% reduction in all-cause mortality through 1 year.6 Additional reviews suggest evidence of improved patient outcomes (pain, length of stay, non-union, and/or mortality) when surgery occurs early, within 12 to 72 hours after injury.4,6,7 Regardless of the definition of “early surgery” used, surgical delay remains a challenge, often due to organizational factors, including admission day of the week and hospital staffing, and patient characteristics, such as comorbidities, echocardiographic findings, age, and insurance status.7-9
Among factors that contribute to surgical delays, the need for preoperative cardiovascular risk stratification is significantly modifiable.10 The American College of Cardiology (ACC)/American Heart Association (AHA) Task Force risk stratification framework for preoperative cardiac testing assists clinicians in determining surgical urgency, active cardiac conditions, cardiovascular risk factors, and functional capacity of each patient, and is well established for low- or intermediate-risk patients.11 Specifically, metabolic equivalents (METs) measurements are used to identify medically stable patients with good or excellent functional capacity versus poor or unknown functional status. Patients with ≥ 4 METs may proceed to surgery without further testing; patients with < 4 METs may either proceed with planned surgery or undergo additional testing. Patients with a perceived increased risk profile who require urgent or semi-urgent hip fracture repair may be confounded by disagreement about required preoperative cardiac testing.
At OhioHealth Grant Medical Center (GMC), an urban, level 1 trauma center, the consideration of further preoperative noninvasive testing frequently contributed to surgical delays. In 2009, hip fracture patients arriving to the emergency department (ED) waited an average of 51 hours before being transferred to the operating room (OR) for surgery. Presuming prompt surgery is both desirable and feasible, the Grant Hip Fracture Management Committee (GHFMC) was developed in order to expedite surgeries in hip fracture patients. The GHFMC recommended a preoperative hip fracture protocol, and the outcomes from protocol implementation are described in this article.
Methods
This study was approved by the OhioHealth Institutional Review Board, with a waiver of the informed consent requirement. Medical records from patients treated at GMC during the time period between January 2010 and April 2014 (ie, following implementation of GHFMC recommendations) were retrospectively reviewed to identify the extent to which the use of preoperative transthoracic echocardiography (TTE) reduced average time to surgery and total length of stay, compared to cardiac consultation. This chart review included 316 participants and was used to identify primary induction agent utilized, time to medical optimization, time to surgery, and total length of hospital stay.
Intervention
The GHFMC conducted a 9-month quality improvement project to decrease ED-to-OR time to less than 24 hours for hip fracture patients. The multidisciplinary committee consisted of physicians from orthopedic surgery, anesthesia, hospital medicine, and geriatrics, along with key administrators and nurse outcomes managers. While there is lack of complete clarity surrounding optimal surgical timing, the committee decided that surgery within 24 hours would be beneficial for the majority of patients and therefore was considered a prudent goal.
Based on identified barriers that contributed to surgical delays, several process improvement strategies were implemented, including admitting patients to the hospitalist service, engaging the orthopedic trauma team, and implementing pre- and postoperative protocols and order sets (eg, ED and pain management order sets). Specific emphasis was placed on establishing guidelines for determining medical optimization. In the absence of established guidelines, medical optimization was determined at the discretion of the attending physician. The necessity of preoperative cardiac assessment was based, in part, on physician concerns about determining safe anesthesia protocols and hemodynamically managing patients who may have occult heart disease, specifically those patients with low functional capacity (< 4 METs) and/or inability to accurately communicate their medical history.
Many hip fractures result from a fall, and it may be unclear whether the fall causing a fracture was purely mechanical or indicative of a distinct acute or chronic illness. As a result, many patients received cardiac consultations, with or without pharmacologic stress testing, adding another 24 to 36 hours to preoperative time. As invasive preoperative cardiac procedures generally result in surgical delays without improving outcomes,11 the committee recommended that clinicians reserve preoperative cardiac consultation for patients with active cardiac conditions.
In lieu of cardiac consultation, the committee suggested preoperative TTE. While use of TTE has not been shown to improve preoperative risk stratification in routine noncardiac surgeries, it has been shown to provide clinically useful information in patients at high risk for cardiac complications.11 There was consensus for incorporating preoperative TTE for several reasons: (1) the patients with hip fractures were not “routine,” and often did not have a reliable medical history; (2) a large percentage of patients had cardiac risk factors; (3) patients with undiagnosed aortic stenosis, severe left ventricular dysfunction, or severe pulmonary hypertension would likely have altered intraoperative fluid management; and (4) in supplanting cardiac consultations, TTE would likely expedite patients’ ED-to-OR times. Therefore, the GHFMC created a recommendation of ordering urgent TTE for patients who were unable to exercise at ≥ 4 METs but needed urgent hip fracture surgery.
In order to evaluate the success of the new protocol, the ED-to-OR times were calculated for a cohort of patients who underwent surgery for hip fracture following algorithm implementation.
Participants
A chart review was conducted for patients admitted to GMC between January 2010 and April 2014 for operative treatment of a hip fracture. Exclusion criteria included lack of radiologist-diagnosed hip fracture, periprosthetic hip fracture, or multiple traumas. Electronic patient charts were reviewed by investigators (KI and BO) using a standardized, electronic abstraction form for 3 groups of patients who (1) proceeded directly to planned surgery without TTE or cardiac consultation (direct-to-surgery group); (2) received preoperative TTE but not a cardiac consultation (TTE-only group); or (3) received preoperative cardiac consultation (cardiac consult group).
Measures
Demographics, comorbid conditions, MET score, anesthesia protocol, and in-hospital morbidity and mortality were extracted from medical charts. Medical optimization time was determined by the latest time stamp of 1 of the following: time that the final consulting specialist stated that the patient was stable for surgery; time that the hospitalist described the patient as being ready for surgery; time that the TTE report was certified by the reading cardiologist; or time that the hospitalist described the outcome of completed preoperative risk stratification. Time elapsed prior to medical optimization, surgery, and discharge were calculated using differences between the patient’s arrival date and time at the ED, first recorded time of medical optimization, surgical start time (from the surgical report), and discharge time, respectively.
To assess whether the TTE protocol may have affected anesthesia selection, the induction agent (etomidate or propofol) was abstracted from anesthesia reports and stratified by the ejection fraction of each patient: very low (≤ 35%), low (36%–50%), or normal (> 50%). Patients without an echocardiogram report were assumed to have a normal ejection fraction for this analysis.
Analysis
Descriptive statistics were produced using mean and standard deviation (SD) for continuous variables and frequency and percentage for categorical variables. To determine whether statistically significant differences existed between the 3 groups, the Kruskal-Wallis test was used to compare skewed continuous variables, and Pearson’s chi-square test was used to compare categorical variables. Due to differences in baseline patient characteristics across the 3 treatment groups, inverse probability weights were used to adjust for group differences (using a multinomial logit treatment model) while comparing differences in outcome variables. This modeling strategy does not rely on any assumptions for the distribution of the outcome variable. Covariates were considered for inclusion in the treatment or outcome model if they were significantly associated (P < 0.05) with the group variable. Additionally, anesthetic agent (etomidate or propofol) was compared across the treatment groups after stratifying by ejection fraction to identify whether any differences existed in anesthesia regimen. Patients who were prescribed more than 1 anesthetic agent (n = 2) or an agent that was not of interest were removed from the analysis (n = 13). Stata (version 14) was used for analysis. All other missing data with respect to the tested variables were omitted in the analysis for that variable. Any disagreements about abstraction were resolved through consensus between the investigators.
Results
A total of 316 cases met inclusion criteria, including 108 direct-to-surgery patients, 143 preoperative TTE patients, and 65 cardiac consult patients. Patient demographics and preoperative characteristics are shown in Table 1. The average age for all patients was 76.5 years of age (SD, 12.89; IQR, 34-97); however, direct-to-surgery patients were significantly (P < 0.001) younger (71.2 years; SD, 14.2; interquartile range [IQR], 34-95 years) than TTE-only patients (79.0 years; SD, 11.5; IQR, 35-97 years) and cardiac consult patients (79.57 years; SD, 10.63; IQR, 49-97 years). The majority of patients were female (69.9%) and experienced a fall prior to admission (94%). Almost three-fourths of patients had 1 or more cardiac risk factors (73.7%), including history of congestive heart failure (CHF; 19%), coronary artery disease (CAD; 26.3%), chronic obstructive pulmonary disease (COPD; 19.3%), or aortic stenosis (AS; 3.5%). Due to between-group differences in these comorbid conditions, confounding factors were adjusted for in subsequent analyses.

As shown in Table 2, before adjustment for confounding factors, there were significant between-group differences in medical optimization time for patients in all 3 groups. After adjustment for treatment differences using age and number of comorbid diseases, and medical optimization time differences using age and COPD, fewer between-group differences were statistically significant. Patients who received a cardiac consult had an 18.44-hour longer medical optimization time compared to patients who went directly to surgery (29.136 vs 10.696 hours; P = 0.001). Optimization remained approximately 5 hours longer for the TTE-only group than for the direct-to-surgery group; however, this difference was not significant (P = 0.075).

When comparing differences in ED-to-OR time for the 3 groups after adjusting the probability of treatment for age and the number of comorbid conditions, and adjusting the probability of ED-to-OR time for age, COPD, and CHF, significant differences remained in ED-to-OR times across all groups. Specifically, patients in the direct-to-surgery group experienced the shortest time (mean, 20.64 hours), compared to patients in the TTE-only group (mean, 26.32; P = 0.04) or patients in the cardiac consult group (mean, 36.08; P < 0.001). TTE-only patients had a longer time of 5.68 hours, compared to the direct-to-surgery group, and patients in the preoperative cardiac consult group were on average 15.44 hours longer than the direct-to-surgery group.
When comparing differences in the length of stay for the 3 groups before statistical adjustments, differences were observed; however, after removing the confounding factors related to treatment (age and CAD) and the outcome (age and the number of comorbid conditions), there were no statistically significant differences in the length of stay for the 3 groups. Average length of stay was 131 hours for direct-to-surgery patients, 142 hours for TTE-only patients, and 141 hours for cardiac consult patients.
The use of different anesthetic agents was compared for patients in the 3 groups. The majority of patients in the study (87.7%) were given propofol, and there were no differences after stratifying by ejection fraction (Table 3).

Discussion
The GHFMC was created to reduce surgical delays for hip fracture. Medical optimization was considered a primary, modifiable factor given that surgeons were reluctant to proceed without a cardiac consult. To address this gap, the committee recommended a preoperative TTE for patients with low or unknown functional status. This threshold provides a quick and easy method for stratifying patients who previously required risk stratification by a cardiologist, which often resulted in surgery delays.
In their recommendations for implementation of hip fracture quality improvement projects, the Geriatric Fracture Center emphasizes the importance of multidisciplinary physician leadership along with standardization of approach across patients.12 This recommendation is supported by increasing evidence that orthogeriatric collaborations are associated with decreased mortality and length of stay.13 The GHFMC and subsequent interventions reflect this approach, allowing for collaboration to identify cross-disciplinary procedural barriers to care. In our institution, addressing identified procedural barriers to care was associated with a reduction in the average time to surgery from 51 hours to 25.3 hours.
Multiple approaches have been attempted to decrease presurgical time in hip fracture patients in various settings. Prehospital interventions, such as providing ambulances with checklists and ability to bypass the ED, have not been shown to decrease time to surgery for hip fracture patients, though similar strategies have been successful in other conditions, such as stroke.14,15 In-hospital procedures, such as implementation of a hip fracture protocol and reduction of preoperative interventions, have more consistently been found to decrease time to surgery and in-hospital mortality.16,17 However, reduced delays have not been found universally. Luttrell and Nana found that preoperative TTE resulted in approximately 30.8-hour delays from the ED to OR, compared to patients who did not receive a preoperative TTE.18 However, in that study hospitalists used TTE at their own discretion, and there may have been confounding factors contributing to delays. When used as part of a protocol targeting patients with poor or unknown functional capacity, we believe that preoperative TTE results in modest surgical delays yet provides clinically useful information about each patient.
ACC/AHA preoperative guidelines were updated after we implemented our intervention and now recommend that patients with poor or unknown functional capacity in whom stress testing will not influence care proceed to surgery “according to guideline-directed medical care.”11 While routine use of preoperative evaluation of left ventricular function is not recommended, assessing left ventricular function may be reasonable for patients with heart failure with a change in clinical status. Guidelines also recommend that patients with clinically suspected valvular stenosis undergo preoperative echocardiography.11
Limitations
This study has several limitations. First, due to resource limitations, a substantial period of time elapsed between implementation of the new protocol and the analysis of the data set. That is, the hip fracture protocol assessed in this paper occurred from January 2010 through April 2014, and final analysis of the data set occurred in April 2020. This limitation precludes our ability to formally assess any pre- or post-protocol changes in patient outcomes. Second, randomization was not used to create groups that were balanced in differing health characteristics (ie, patients with noncardiac-related surgeries, patients in different age groups); however, the use of inverse probability treatment regression analysis was a way to statistically address these between-group differences. Moreover, this study is limited by the factors that were measured; unmeasured factors cannot be accounted for. Third, health care providers working at the hospital during this time were aware of the goal to decrease presurgical time, possibly creating exaggerated effects compared to a blinded trial. Finally, although this intervention is likely translatable to other centers, these results represent the experiences of a single level 1 trauma center and may not be replicable elsewhere.
Conclusion
Preoperative TTE in lieu of cardiac consultation has several advantages. First, it requires interdepartmental collaboration for implementation, but can be implemented through a single hospital or hospital system. Unlike prehospital interventions, preoperative urgent TTE for patients with low functional capacity does not require the support of emergency medical technicians, ambulance services, or other hospitals in the region. Second, while costs are associated with TTE, they are offset by a reduction in expensive consultations with specialists, surgical delays, and longer lengths of stay. Third, despite likely increased ED-to-OR times compared to no intervention, urgent TTE decreases time to surgery compared with cardiology consultation. Prior to the GHFMC, the ED-to-OR time at our institution was 51 hours. In contrast, the mean time following the GHFMC-led protocol was less than half that, at 25.3 hours (SD, 19.1 hours). In fact, nearly two-thirds (65.2%) of the patients evaluated in this study underwent surgery within 24 hours of admission. This improvement in presurgical time was attributed, in part, to the implementation of preoperative TTE over cardiology consultations.
Acknowledgments: The authors thank Jenny Williams, RN, who was instrumental in obtaining the data set for analysis, and Shauna Ayres, MPH, from the OhioHealth Research Institute, who provided writing and technical assistance.
Corresponding author: Robert Skully, MD, OhioHealth Family Medicine Grant, 290 East Town St., Columbus, OH 43215; [email protected].
Funding: This work was supported by the OhioHealth Summer Research Externship Program.
Financial disclosures: None.
1. Brauer CA, Coca-Perraillon M, Cutler DM, Rosen AB. Incidence and mortality of hip fractures in the United States. JAMA. 2009;302:1573-1579.
2. Lewiecki EM, Wright NC, Curtis JR, et al. Hip fracture trends in the United States 2002 to 2015. Osteoporos Int. 2018;29:717-722.
3. Colais P, Di Martino M, Fusco D, et al. The effect of early surgery after hip fracture on 1-year mortality. BMC Geriatr. 2015;15:141.
4. Nyholm AM, Gromov K, Palm H, et al. Time to surgery is associated with thirty-day and ninety-day mortality after proximal femoral fracture: a retrospective observational study on prospectively collected data from the Danish Fracture Database Collaborators. J Bone Joint Surg Am. 2015;97:1333-1339.
5. Judd KT, Christianson E. Expedited operative care of hip fractures results in significantly lower cost of treatment. Iowa Orthop J. 2015;35:62-64.
6. Simunovic N, Devereaux PJ, Sprague S, et al. Effect of early surgery after hip fracture on mortality and complications: systematic review and meta-analysis. CMAJ. 2010;182:1609-1616.
7. Ryan DJ, Yoshihara H, Yoneoka D, et al. Delay in hip fracture surgery: an analysis of patient-specific and hospital-specific risk factors. J Orthop Trauma. 2015;29:343-348.
8. Ricci WM, Brandt A, McAndrew C, Gardner MJ. Factors affecting delay to surgery and length of stay for patients with hip fracture. J Orthop Trauma. 2015;29:e109-e114.
9. Hagino T, Ochiai S, Senga S, et al. Efficacy of early surgery and causes of surgical delay in patients with hip fracture. J Orthop. 2015;12:142-146.
10. Rafiq A, Sklyar E, Bella JN. Cardiac evaluation and monitoring of patients undergoing noncardiac surgery. Health Serv Insights. 2017;9:1178632916686074.
11. Fleisher LA, Fleischmann KE, Auerbach AD, et al. 2014 ACC/AHA guideline on perioperative cardiovascular evaluation and management of patients undergoing noncardiac surgery: a report of the American College of Cardiology/American Heart Association Task Force on Practice Guidelines. J Am Coll Cardiol. 2014;64:e77-e137.
12. Basu N, Natour M, Mounasamy V, Kates SL. Geriatric hip fracture management: keys to providing a successful program. Eur J Trauma Emerg Surg. 2016;42:565-569.
13. Grigoryan KV, Javedan H, Rudolph JL. Orthogeriatric care models and outcomes in hip fracture patients: a systematic review and meta-analysis. J Orthop Trauma. 2014;28:e49-e55.
14. Tai YJ, Yan B. Minimising time to treatment: targeted strategies to minimise time to thrombolysis for acute ischaemic stroke. Intern Med J. 2013;43:1176-1182.
15. Larsson G, Stromberg RU, Rogmark C, Nilsdotter A. Prehospital fast track care for patients with hip fracture: Impact on time to surgery, hospital stay, post-operative complications and mortality a randomised, controlled trial. Injury. 2016;47:881-886.
16. Bohm E, Loucks L, Wittmeier K, et al. Reduced time to surgery improves mortality and length of stay following hip fracture: results from an intervention study in a Canadian health authority. Can J Surg. 2015;58:257-263.
17. Ventura C, Trombetti S, Pioli G, et al. Impact of multidisciplinary hip fracture program on timing of surgery in elderly patients. Osteoporos Int J. 2014;25:2591-2597.
18. Luttrell K, Nana A. Effect of preoperative transthoracic echocardiogram on mortality and surgical timing in elderly adults with hip fracture. J Am Geriatr Soc. 2015;63:2505-2509.
From Dignity Health Methodist Hospital of Sacramento Family Medicine Residency Program, Sacramento, CA (Dr. Oldach); Nationwide Children’s Hospital, Columbus, OH (Dr. Irwin); OhioHealth Research Institute, Columbus, OH (Dr. Pershing); Department of Clinical Transformation, OhioHealth, Columbus, OH (Dr. Zigmont and Dr. Gascon); and Department of Geriatrics, OhioHealth, Columbus, OH (Dr. Skully).
Abstract
Objective: An interdisciplinary committee was formed to identify factors contributing to surgical delays in urgent hip fracture repair at an urban, level 1 trauma center, with the goal of reducing preoperative time to less than 24 hours. Surgical optimization was identified as a primary, modifiable factor, as surgeons were reluctant to clear patients for surgery without cardiac consultation. Preoperative transthoracic echocardiogram (TTE) was recommended as a safe alternative to cardiac consultation in most patients.
Methods: A retrospective review was conducted for patients who underwent urgent hip fracture repair between January 2010 and April 2014 (n = 316). Time to medical optimization, time to surgery, hospital length of stay, and anesthesia induction were compared for 3 patient groups of interest: those who received (1) neither TTE nor cardiology consultation (ie, direct to surgery); (2) a preoperative TTE; or (3) preoperative cardiac consultation.
Results: There were significant between-group differences in medical optimization time (P = 0.001) and mean time to surgery (P < 0.001) when comparing the 3 groups of interest. Patients in the preoperative cardiac consult group had the longest times, followed by the TTE and direct-to-surgery groups. There were no differences in the type of induction agent used across treatment groups when stratifying by ejection fraction.
Conclusion: Preoperative TTE allows for decreased preoperative time compared to a cardiology consultation. It provides an easily implemented inter-departmental, intra-institutional intervention to decrease preoperative time in patients presenting with hip fractures.
Keywords: surgical delay; preoperative risk stratification; process improvement.
Hip fractures are common, expensive, and associated with poor outcomes.1,2 Ample literature suggests that morbidity, mortality, and cost of care may be reduced by minimizing surgical delays.3-5 While individual reports indicate mixed evidence, in a 2010 meta-analysis, surgery within 72 hours was associated with significant reductions in pneumonia and pressure sores, as well as a 19% reduction in all-cause mortality through 1 year.6 Additional reviews suggest evidence of improved patient outcomes (pain, length of stay, non-union, and/or mortality) when surgery occurs early, within 12 to 72 hours after injury.4,6,7 Regardless of the definition of “early surgery” used, surgical delay remains a challenge, often due to organizational factors, including admission day of the week and hospital staffing, and patient characteristics, such as comorbidities, echocardiographic findings, age, and insurance status.7-9
Among factors that contribute to surgical delays, the need for preoperative cardiovascular risk stratification is significantly modifiable.10 The American College of Cardiology (ACC)/American Heart Association (AHA) Task Force risk stratification framework for preoperative cardiac testing assists clinicians in determining surgical urgency, active cardiac conditions, cardiovascular risk factors, and functional capacity of each patient, and is well established for low- or intermediate-risk patients.11 Specifically, metabolic equivalents (METs) measurements are used to identify medically stable patients with good or excellent functional capacity versus poor or unknown functional status. Patients with ≥ 4 METs may proceed to surgery without further testing; patients with < 4 METs may either proceed with planned surgery or undergo additional testing. Patients with a perceived increased risk profile who require urgent or semi-urgent hip fracture repair may be confounded by disagreement about required preoperative cardiac testing.
At OhioHealth Grant Medical Center (GMC), an urban, level 1 trauma center, the consideration of further preoperative noninvasive testing frequently contributed to surgical delays. In 2009, hip fracture patients arriving to the emergency department (ED) waited an average of 51 hours before being transferred to the operating room (OR) for surgery. Presuming prompt surgery is both desirable and feasible, the Grant Hip Fracture Management Committee (GHFMC) was developed in order to expedite surgeries in hip fracture patients. The GHFMC recommended a preoperative hip fracture protocol, and the outcomes from protocol implementation are described in this article.
Methods
This study was approved by the OhioHealth Institutional Review Board, with a waiver of the informed consent requirement. Medical records from patients treated at GMC during the time period between January 2010 and April 2014 (ie, following implementation of GHFMC recommendations) were retrospectively reviewed to identify the extent to which the use of preoperative transthoracic echocardiography (TTE) reduced average time to surgery and total length of stay, compared to cardiac consultation. This chart review included 316 participants and was used to identify primary induction agent utilized, time to medical optimization, time to surgery, and total length of hospital stay.
Intervention
The GHFMC conducted a 9-month quality improvement project to decrease ED-to-OR time to less than 24 hours for hip fracture patients. The multidisciplinary committee consisted of physicians from orthopedic surgery, anesthesia, hospital medicine, and geriatrics, along with key administrators and nurse outcomes managers. While there is lack of complete clarity surrounding optimal surgical timing, the committee decided that surgery within 24 hours would be beneficial for the majority of patients and therefore was considered a prudent goal.
Based on identified barriers that contributed to surgical delays, several process improvement strategies were implemented, including admitting patients to the hospitalist service, engaging the orthopedic trauma team, and implementing pre- and postoperative protocols and order sets (eg, ED and pain management order sets). Specific emphasis was placed on establishing guidelines for determining medical optimization. In the absence of established guidelines, medical optimization was determined at the discretion of the attending physician. The necessity of preoperative cardiac assessment was based, in part, on physician concerns about determining safe anesthesia protocols and hemodynamically managing patients who may have occult heart disease, specifically those patients with low functional capacity (< 4 METs) and/or inability to accurately communicate their medical history.
Many hip fractures result from a fall, and it may be unclear whether the fall causing a fracture was purely mechanical or indicative of a distinct acute or chronic illness. As a result, many patients received cardiac consultations, with or without pharmacologic stress testing, adding another 24 to 36 hours to preoperative time. As invasive preoperative cardiac procedures generally result in surgical delays without improving outcomes,11 the committee recommended that clinicians reserve preoperative cardiac consultation for patients with active cardiac conditions.
In lieu of cardiac consultation, the committee suggested preoperative TTE. While use of TTE has not been shown to improve preoperative risk stratification in routine noncardiac surgeries, it has been shown to provide clinically useful information in patients at high risk for cardiac complications.11 There was consensus for incorporating preoperative TTE for several reasons: (1) the patients with hip fractures were not “routine,” and often did not have a reliable medical history; (2) a large percentage of patients had cardiac risk factors; (3) patients with undiagnosed aortic stenosis, severe left ventricular dysfunction, or severe pulmonary hypertension would likely have altered intraoperative fluid management; and (4) in supplanting cardiac consultations, TTE would likely expedite patients’ ED-to-OR times. Therefore, the GHFMC created a recommendation of ordering urgent TTE for patients who were unable to exercise at ≥ 4 METs but needed urgent hip fracture surgery.
In order to evaluate the success of the new protocol, the ED-to-OR times were calculated for a cohort of patients who underwent surgery for hip fracture following algorithm implementation.
Participants
A chart review was conducted for patients admitted to GMC between January 2010 and April 2014 for operative treatment of a hip fracture. Exclusion criteria included lack of radiologist-diagnosed hip fracture, periprosthetic hip fracture, or multiple traumas. Electronic patient charts were reviewed by investigators (KI and BO) using a standardized, electronic abstraction form for 3 groups of patients who (1) proceeded directly to planned surgery without TTE or cardiac consultation (direct-to-surgery group); (2) received preoperative TTE but not a cardiac consultation (TTE-only group); or (3) received preoperative cardiac consultation (cardiac consult group).
Measures
Demographics, comorbid conditions, MET score, anesthesia protocol, and in-hospital morbidity and mortality were extracted from medical charts. Medical optimization time was determined by the latest time stamp of 1 of the following: time that the final consulting specialist stated that the patient was stable for surgery; time that the hospitalist described the patient as being ready for surgery; time that the TTE report was certified by the reading cardiologist; or time that the hospitalist described the outcome of completed preoperative risk stratification. Time elapsed prior to medical optimization, surgery, and discharge were calculated using differences between the patient’s arrival date and time at the ED, first recorded time of medical optimization, surgical start time (from the surgical report), and discharge time, respectively.
To assess whether the TTE protocol may have affected anesthesia selection, the induction agent (etomidate or propofol) was abstracted from anesthesia reports and stratified by the ejection fraction of each patient: very low (≤ 35%), low (36%–50%), or normal (> 50%). Patients without an echocardiogram report were assumed to have a normal ejection fraction for this analysis.
Analysis
Descriptive statistics were produced using mean and standard deviation (SD) for continuous variables and frequency and percentage for categorical variables. To determine whether statistically significant differences existed between the 3 groups, the Kruskal-Wallis test was used to compare skewed continuous variables, and Pearson’s chi-square test was used to compare categorical variables. Due to differences in baseline patient characteristics across the 3 treatment groups, inverse probability weights were used to adjust for group differences (using a multinomial logit treatment model) while comparing differences in outcome variables. This modeling strategy does not rely on any assumptions for the distribution of the outcome variable. Covariates were considered for inclusion in the treatment or outcome model if they were significantly associated (P < 0.05) with the group variable. Additionally, anesthetic agent (etomidate or propofol) was compared across the treatment groups after stratifying by ejection fraction to identify whether any differences existed in anesthesia regimen. Patients who were prescribed more than 1 anesthetic agent (n = 2) or an agent that was not of interest were removed from the analysis (n = 13). Stata (version 14) was used for analysis. All other missing data with respect to the tested variables were omitted in the analysis for that variable. Any disagreements about abstraction were resolved through consensus between the investigators.
Results
A total of 316 cases met inclusion criteria, including 108 direct-to-surgery patients, 143 preoperative TTE patients, and 65 cardiac consult patients. Patient demographics and preoperative characteristics are shown in Table 1. The average age for all patients was 76.5 years of age (SD, 12.89; IQR, 34-97); however, direct-to-surgery patients were significantly (P < 0.001) younger (71.2 years; SD, 14.2; interquartile range [IQR], 34-95 years) than TTE-only patients (79.0 years; SD, 11.5; IQR, 35-97 years) and cardiac consult patients (79.57 years; SD, 10.63; IQR, 49-97 years). The majority of patients were female (69.9%) and experienced a fall prior to admission (94%). Almost three-fourths of patients had 1 or more cardiac risk factors (73.7%), including history of congestive heart failure (CHF; 19%), coronary artery disease (CAD; 26.3%), chronic obstructive pulmonary disease (COPD; 19.3%), or aortic stenosis (AS; 3.5%). Due to between-group differences in these comorbid conditions, confounding factors were adjusted for in subsequent analyses.
As shown in Table 2, before adjustment for confounding factors, there were significant between-group differences in medical optimization time for patients in all 3 groups. After adjustment for treatment differences using age and number of comorbid diseases, and medical optimization time differences using age and COPD, fewer between-group differences were statistically significant. Patients who received a cardiac consult had an 18.44-hour longer medical optimization time compared to patients who went directly to surgery (29.136 vs 10.696 hours; P = 0.001). Optimization remained approximately 5 hours longer for the TTE-only group than for the direct-to-surgery group; however, this difference was not significant (P = 0.075).
When comparing differences in ED-to-OR time for the 3 groups after adjusting the probability of treatment for age and the number of comorbid conditions, and adjusting the probability of ED-to-OR time for age, COPD, and CHF, significant differences remained in ED-to-OR times across all groups. Specifically, patients in the direct-to-surgery group experienced the shortest time (mean, 20.64 hours), compared to patients in the TTE-only group (mean, 26.32; P = 0.04) or patients in the cardiac consult group (mean, 36.08; P < 0.001). TTE-only patients had a longer time of 5.68 hours, compared to the direct-to-surgery group, and patients in the preoperative cardiac consult group were on average 15.44 hours longer than the direct-to-surgery group.
When comparing differences in the length of stay for the 3 groups before statistical adjustments, differences were observed; however, after removing the confounding factors related to treatment (age and CAD) and the outcome (age and the number of comorbid conditions), there were no statistically significant differences in the length of stay for the 3 groups. Average length of stay was 131 hours for direct-to-surgery patients, 142 hours for TTE-only patients, and 141 hours for cardiac consult patients.
The use of different anesthetic agents was compared for patients in the 3 groups. The majority of patients in the study (87.7%) were given propofol, and there were no differences after stratifying by ejection fraction (Table 3).
Discussion
The GHFMC was created to reduce surgical delays for hip fracture. Medical optimization was considered a primary, modifiable factor given that surgeons were reluctant to proceed without a cardiac consult. To address this gap, the committee recommended a preoperative TTE for patients with low or unknown functional status. This threshold provides a quick and easy method for stratifying patients who previously required risk stratification by a cardiologist, which often resulted in surgery delays.
In their recommendations for implementation of hip fracture quality improvement projects, the Geriatric Fracture Center emphasizes the importance of multidisciplinary physician leadership along with standardization of approach across patients.12 This recommendation is supported by increasing evidence that orthogeriatric collaborations are associated with decreased mortality and length of stay.13 The GHFMC and subsequent interventions reflect this approach, allowing for collaboration to identify cross-disciplinary procedural barriers to care. In our institution, addressing identified procedural barriers to care was associated with a reduction in the average time to surgery from 51 hours to 25.3 hours.
Multiple approaches have been attempted to decrease presurgical time in hip fracture patients in various settings. Prehospital interventions, such as providing ambulances with checklists and ability to bypass the ED, have not been shown to decrease time to surgery for hip fracture patients, though similar strategies have been successful in other conditions, such as stroke.14,15 In-hospital procedures, such as implementation of a hip fracture protocol and reduction of preoperative interventions, have more consistently been found to decrease time to surgery and in-hospital mortality.16,17 However, reduced delays have not been found universally. Luttrell and Nana found that preoperative TTE resulted in approximately 30.8-hour delays from the ED to OR, compared to patients who did not receive a preoperative TTE.18 However, in that study hospitalists used TTE at their own discretion, and there may have been confounding factors contributing to delays. When used as part of a protocol targeting patients with poor or unknown functional capacity, we believe that preoperative TTE results in modest surgical delays yet provides clinically useful information about each patient.
ACC/AHA preoperative guidelines were updated after we implemented our intervention and now recommend that patients with poor or unknown functional capacity in whom stress testing will not influence care proceed to surgery “according to guideline-directed medical care.”11 While routine use of preoperative evaluation of left ventricular function is not recommended, assessing left ventricular function may be reasonable for patients with heart failure with a change in clinical status. Guidelines also recommend that patients with clinically suspected valvular stenosis undergo preoperative echocardiography.11
Limitations
This study has several limitations. First, due to resource limitations, a substantial period of time elapsed between implementation of the new protocol and the analysis of the data set. That is, the hip fracture protocol assessed in this paper occurred from January 2010 through April 2014, and final analysis of the data set occurred in April 2020. This limitation precludes our ability to formally assess any pre- or post-protocol changes in patient outcomes. Second, randomization was not used to create groups that were balanced in differing health characteristics (ie, patients with noncardiac-related surgeries, patients in different age groups); however, the use of inverse probability treatment regression analysis was a way to statistically address these between-group differences. Moreover, this study is limited by the factors that were measured; unmeasured factors cannot be accounted for. Third, health care providers working at the hospital during this time were aware of the goal to decrease presurgical time, possibly creating exaggerated effects compared to a blinded trial. Finally, although this intervention is likely translatable to other centers, these results represent the experiences of a single level 1 trauma center and may not be replicable elsewhere.
Conclusion
Preoperative TTE in lieu of cardiac consultation has several advantages. First, it requires interdepartmental collaboration for implementation, but can be implemented through a single hospital or hospital system. Unlike prehospital interventions, preoperative urgent TTE for patients with low functional capacity does not require the support of emergency medical technicians, ambulance services, or other hospitals in the region. Second, while costs are associated with TTE, they are offset by a reduction in expensive consultations with specialists, surgical delays, and longer lengths of stay. Third, despite likely increased ED-to-OR times compared to no intervention, urgent TTE decreases time to surgery compared with cardiology consultation. Prior to the GHFMC, the ED-to-OR time at our institution was 51 hours. In contrast, the mean time following the GHFMC-led protocol was less than half that, at 25.3 hours (SD, 19.1 hours). In fact, nearly two-thirds (65.2%) of the patients evaluated in this study underwent surgery within 24 hours of admission. This improvement in presurgical time was attributed, in part, to the implementation of preoperative TTE over cardiology consultations.
Acknowledgments: The authors thank Jenny Williams, RN, who was instrumental in obtaining the data set for analysis, and Shauna Ayres, MPH, from the OhioHealth Research Institute, who provided writing and technical assistance.
Corresponding author: Robert Skully, MD, OhioHealth Family Medicine Grant, 290 East Town St., Columbus, OH 43215; [email protected].
Funding: This work was supported by the OhioHealth Summer Research Externship Program.
Financial disclosures: None.
1. Brauer CA, Coca-Perraillon M, Cutler DM, Rosen AB. Incidence and mortality of hip fractures in the United States. JAMA. 2009;302:1573-1579.
2. Lewiecki EM, Wright NC, Curtis JR, et al. Hip fracture trends in the United States 2002 to 2015. Osteoporos Int. 2018;29:717-722.
3. Colais P, Di Martino M, Fusco D, et al. The effect of early surgery after hip fracture on 1-year mortality. BMC Geriatr. 2015;15:141.
4. Nyholm AM, Gromov K, Palm H, et al. Time to surgery is associated with thirty-day and ninety-day mortality after proximal femoral fracture: a retrospective observational study on prospectively collected data from the Danish Fracture Database Collaborators. J Bone Joint Surg Am. 2015;97:1333-1339.
5. Judd KT, Christianson E. Expedited operative care of hip fractures results in significantly lower cost of treatment. Iowa Orthop J. 2015;35:62-64.
6. Simunovic N, Devereaux PJ, Sprague S, et al. Effect of early surgery after hip fracture on mortality and complications: systematic review and meta-analysis. CMAJ. 2010;182:1609-1616.
7. Ryan DJ, Yoshihara H, Yoneoka D, et al. Delay in hip fracture surgery: an analysis of patient-specific and hospital-specific risk factors. J Orthop Trauma. 2015;29:343-348.
8. Ricci WM, Brandt A, McAndrew C, Gardner MJ. Factors affecting delay to surgery and length of stay for patients with hip fracture. J Orthop Trauma. 2015;29:e109-e114.
9. Hagino T, Ochiai S, Senga S, et al. Efficacy of early surgery and causes of surgical delay in patients with hip fracture. J Orthop. 2015;12:142-146.
10. Rafiq A, Sklyar E, Bella JN. Cardiac evaluation and monitoring of patients undergoing noncardiac surgery. Health Serv Insights. 2017;9:1178632916686074.
11. Fleisher LA, Fleischmann KE, Auerbach AD, et al. 2014 ACC/AHA guideline on perioperative cardiovascular evaluation and management of patients undergoing noncardiac surgery: a report of the American College of Cardiology/American Heart Association Task Force on Practice Guidelines. J Am Coll Cardiol. 2014;64:e77-e137.
12. Basu N, Natour M, Mounasamy V, Kates SL. Geriatric hip fracture management: keys to providing a successful program. Eur J Trauma Emerg Surg. 2016;42:565-569.
13. Grigoryan KV, Javedan H, Rudolph JL. Orthogeriatric care models and outcomes in hip fracture patients: a systematic review and meta-analysis. J Orthop Trauma. 2014;28:e49-e55.
14. Tai YJ, Yan B. Minimising time to treatment: targeted strategies to minimise time to thrombolysis for acute ischaemic stroke. Intern Med J. 2013;43:1176-1182.
15. Larsson G, Stromberg RU, Rogmark C, Nilsdotter A. Prehospital fast track care for patients with hip fracture: Impact on time to surgery, hospital stay, post-operative complications and mortality a randomised, controlled trial. Injury. 2016;47:881-886.
16. Bohm E, Loucks L, Wittmeier K, et al. Reduced time to surgery improves mortality and length of stay following hip fracture: results from an intervention study in a Canadian health authority. Can J Surg. 2015;58:257-263.
17. Ventura C, Trombetti S, Pioli G, et al. Impact of multidisciplinary hip fracture program on timing of surgery in elderly patients. Osteoporos Int J. 2014;25:2591-2597.
18. Luttrell K, Nana A. Effect of preoperative transthoracic echocardiogram on mortality and surgical timing in elderly adults with hip fracture. J Am Geriatr Soc. 2015;63:2505-2509.