User login
FDA orders stronger warnings on benzodiazepines
The Food and Drug Administration wants updated boxed warnings on benzodiazepines to reflect the “serious” risks of abuse, misuse, addiction, physical dependence, and withdrawal reactions associated with these medications.
![]()
“The current prescribing information for benzodiazepines does not provide adequate warnings about these serious risks and harms associated with these medicines so they may be prescribed and used inappropriately,” the FDA said in a safety communication.
The FDA also wants revisions to the patient medication guides for benzodiazepines to help educate patients and caregivers about these risks.
“While benzodiazepines are important therapies for many Americans, they are also commonly abused and misused, often together with opioid pain relievers and other medicines, alcohol, and illicit drugs,” FDA Commissioner Stephen M. Hahn, MD, said in a statement.
“We are taking measures and requiring new labeling information to help health care professionals and patients better understand that, while benzodiazepines have many treatment benefits, they also carry with them an increased risk of abuse, misuse, addiction, and dependence,” said Dr. Hahn.
Ninety-two million prescriptions in 2019
Benzodiazepines are widely used to treat anxiety, insomnia, seizures, and other conditions, often for extended periods of time.
According to the FDA, in 2019, an estimated 92 million benzodiazepine prescriptions were dispensed from U.S. outpatient pharmacies, most commonly alprazolam, clonazepam, and lorazepam.
Data from 2018 show that roughly 5.4 million people in the United States 12 years and older abused or misused benzodiazepines in the previous year.
Although the precise risk of benzodiazepine addiction remains unclear, population data “clearly indicate that both primary benzodiazepine use disorders and polysubstance addiction involving benzodiazepines do occur,” the FDA said.
Data from the National Survey on Drug Use and Health from 2015-2016 suggest that half million community-dwelling U.S. adults were estimated to have a benzodiazepine use disorder.
Jump in overdose deaths

Overdose deaths involving benzodiazepines jumped from 1,298 in 2010 to 11,537 in 2017 – an increase of more 780%. Most of these deaths involved benzodiazepines taken with prescription opioids.
the FDA said.
The agency urged particular caution when prescribing benzodiazepines with opioids and other central nervous system depressants, which has resulted in serious adverse events including severe respiratory depression and death.
The FDA also says patients and caregivers should be warned about the risks of abuse, misuse, addiction, dependence, and withdrawal with benzodiazepines and the associated signs and symptoms.
Physicians are encouraged to report adverse events involving benzodiazepines or other medicines to the FDA’s MedWatch program.
A version of this article originally appeared on Medscape.com.
The Food and Drug Administration wants updated boxed warnings on benzodiazepines to reflect the “serious” risks of abuse, misuse, addiction, physical dependence, and withdrawal reactions associated with these medications.
![]()
“The current prescribing information for benzodiazepines does not provide adequate warnings about these serious risks and harms associated with these medicines so they may be prescribed and used inappropriately,” the FDA said in a safety communication.
The FDA also wants revisions to the patient medication guides for benzodiazepines to help educate patients and caregivers about these risks.
“While benzodiazepines are important therapies for many Americans, they are also commonly abused and misused, often together with opioid pain relievers and other medicines, alcohol, and illicit drugs,” FDA Commissioner Stephen M. Hahn, MD, said in a statement.
“We are taking measures and requiring new labeling information to help health care professionals and patients better understand that, while benzodiazepines have many treatment benefits, they also carry with them an increased risk of abuse, misuse, addiction, and dependence,” said Dr. Hahn.
Ninety-two million prescriptions in 2019
Benzodiazepines are widely used to treat anxiety, insomnia, seizures, and other conditions, often for extended periods of time.
According to the FDA, in 2019, an estimated 92 million benzodiazepine prescriptions were dispensed from U.S. outpatient pharmacies, most commonly alprazolam, clonazepam, and lorazepam.
Data from 2018 show that roughly 5.4 million people in the United States 12 years and older abused or misused benzodiazepines in the previous year.
Although the precise risk of benzodiazepine addiction remains unclear, population data “clearly indicate that both primary benzodiazepine use disorders and polysubstance addiction involving benzodiazepines do occur,” the FDA said.
Data from the National Survey on Drug Use and Health from 2015-2016 suggest that half million community-dwelling U.S. adults were estimated to have a benzodiazepine use disorder.
Jump in overdose deaths
Overdose deaths involving benzodiazepines jumped from 1,298 in 2010 to 11,537 in 2017 – an increase of more 780%. Most of these deaths involved benzodiazepines taken with prescription opioids.
the FDA said.
The agency urged particular caution when prescribing benzodiazepines with opioids and other central nervous system depressants, which has resulted in serious adverse events including severe respiratory depression and death.
The FDA also says patients and caregivers should be warned about the risks of abuse, misuse, addiction, dependence, and withdrawal with benzodiazepines and the associated signs and symptoms.
Physicians are encouraged to report adverse events involving benzodiazepines or other medicines to the FDA’s MedWatch program.
A version of this article originally appeared on Medscape.com.
DAPA-CKD resets eGFR floor for safe SGLT2 inhibitor use
The dramatically positive safety and efficacy results from the DAPA-CKD trial, which showed that treatment with the sodium-glucose transporter 2 (SGLT2) inhibitor dapagliflozin significantly cut both chronic kidney disease progression and all-cause death in patients with or without type 2 diabetes, were also notable for broadening the population of patients eligible for this treatment to those in the upper range of stage 4 CKD.

Of the 4,304 CKD patients enrolled in DAPA-CKD, 624 (14%) had an estimated glomerular filtration rate (eGFR) of 25-29 mL/min per 1.73m2, an unprecedented population to receive a drug from the SGLT2 inhibitor class in a reported study. The results provided definitive evidence for efficacy and safety in this range of renal function, said Hiddo J.L. Heerspink, Ph.D., at the virtual annual meeting of the European Association for the Study of Diabetes.
Until now, the widely accepted lowest level for starting an SGLT2 inhibitor in routine practice has been an eGFR as low as 30 mL/min per 1.73 m2.
Using SGLT2 inhibitors when eGFR is as low as 25
“It’s time to reduce the eGFR level for initiating an SGLT2 inhibitor to as low as 25,” said Dr. Heerspink, a professor of clinical pharmacology at the University of Groningen (the Netherlands).
While conceding that this is primarily a decision to be made by guideline writers and regulatory bodies, he declared what he believed was established by the DAPA-CKD findings: “We’ve shown that dapagliflozin can be safely used in these patients. It is effective across the spectrum of kidney function.”
Other experts not associated with the study agreed.
The trial researchers were “brave” to enroll patients with eGFRs as low as 25 mL/min per 1.73 m2, and “we urgently need these agents in patients with an eGFR this low,” commented Chantal Mathieu, MD, an endocrinologist and professor of medicine at Catholic University in Leuven, Belgium, and designated discussant for the report. Overall, she called the findings “spectacular,” a “landmark trial,” and a “winner.”
The study also set an new, lower floor for the level of albuminuria that can be usefully treated with dapagliflozin (Farxiga) by enrolling patients with a urinary albumin-to-creatinine ratio as low as 200 mg/g; the previous lower limit had been 300 mg/g, noted Dr. Mathieu. The new findings pose challenges to guideline writers, regulators who approve drug labels, and payers to a quickly make changes that will bring dapagliflozin to a wider number of patients with CKD.
Once the full DAPA-CKD results are reported, “it will change practice, and push the eGFR needle down” to as low as 25. It will also lower the albuminuria threshold for using dapagliflozin or other drugs in the class, commented David Z.I. Cherney, MD, a nephrologist at the University of Toronto. “It’s just one study,” he admitted, but the consistent renal benefits seen across several studies involving all four drugs in the SGLT2 inhibitor class will help hasten this change in identifying treatable patients, as well as expand the drug class to patients with CKD but no type 2 diabetes (T2D).

“I don’t think we’ve ever had stronger evidence” for drugs that can benefit both heart and renal function, plus the drug class is “very safe, and really easy to start” and maintain in patients, Dr. Cherney said in an interview. “It’s wonderful for these patients that we now have something new for treatment,” a drug with a “very favorable benefit-to-risk ratio.”
Results show many dapagliflozin benefits
While this broadening of the range of patients proven to tolerate and benefit from an SGLT2 inhibitor was an important consequence of DAPA-CKD, the study’s primary finding – that dapagliflozin was as safe and effective for slowing CKD progression in patients regardless of whether they also had T2D – will have an even bigger impact on expanding the target patient population. Showing efficacy in patients with CKD but without a T2D etiology, the status of about a third of the enrolled 4,304 patients, makes this treatment an option for “millions” of additional patients worldwide, said Dr. Heerspink. “These are the most common patients nephrologists see.” A major challenge now will be to do a better job finding patients with CKD who could benefit from dapagliflozin.
DAPA-CKD enrolled CKD patients based primarily on prespecified albuminuria and eGFR levels at more than 300 centers in 34 countries, including the United States. Virtually all patients, 97%, were on the only treatment now available with proven efficacy for slowing CKD, either an ACE inhibitor or an angiotensin receptor blocker. The small number of patients not on one of these drugs was because of poor tolerance.
The study’s primary endpoint was the combined rate of cardiovascular death, renal death, end-stage renal disease, or a drop in eGFR of at least 50% from baseline. This occurred in 14.5% of patients who received placebo and in 9.2% of those who received dapagliflozin during a median follow-up of 2.4 years, a highly significant 39% relative risk reduction. Concurrently with the report at the virtual meeting the results also appeared online in the New England Journal of Medicine. This 5.3% cut in the absolute rate of the combined, primary adverse outcome converted into a number needed to treat of 19 to prevent 1 event during 2.4 years, a “much lower” number needed to treat than reported for renin-angiotensin system inhibitors in these types of patients, Dr. Heerspink said.
Notable positive secondary outcomes included a significant 31% relative cut (a 2% absolute decline) in all-cause mortality, “a major highlight” of the findings, Dr. Heerspink said. Dapagliflozin treatment also linked with a significant 29% relative cut in the incidence of cardiovascular death or hospitalization for heart failure.
“Cardiovascular disease is the most common cause of death in patients with CKD,” explained David C. Wheeler, MD, a coinvestigator on the study and professor of kidney medicine at University College London. “The heart and kidney are intertwined. This is about cardiorenal disease.”
DAPA-CKD was funded by AstraZeneca, the company that markets dapagliflozin. Dr. Heerspink has been a consultant to and received research funding from AstraZeneca. He has also received personal fees from Mundipharma and Novo Nordisk, and he has also served as consultant to several other companies with the honoraria being paid to his institution. Dr. Mathieu has had relationships with AstraZeneca and several other companies. Dr. Cherney has been a consultant to and has received research funding from AstraZeneca and several other companies. Dr. Wheeler has received personal fees from AstraZeneca and from several other companies.
SOURCE: Heerspink HJL et al. EASD 2020 and N Engl J Med. 2020 Sep 24. doi: 10.1056/NEJMoa2024816.
The dramatically positive safety and efficacy results from the DAPA-CKD trial, which showed that treatment with the sodium-glucose transporter 2 (SGLT2) inhibitor dapagliflozin significantly cut both chronic kidney disease progression and all-cause death in patients with or without type 2 diabetes, were also notable for broadening the population of patients eligible for this treatment to those in the upper range of stage 4 CKD.
Of the 4,304 CKD patients enrolled in DAPA-CKD, 624 (14%) had an estimated glomerular filtration rate (eGFR) of 25-29 mL/min per 1.73m2, an unprecedented population to receive a drug from the SGLT2 inhibitor class in a reported study. The results provided definitive evidence for efficacy and safety in this range of renal function, said Hiddo J.L. Heerspink, Ph.D., at the virtual annual meeting of the European Association for the Study of Diabetes.
Until now, the widely accepted lowest level for starting an SGLT2 inhibitor in routine practice has been an eGFR as low as 30 mL/min per 1.73 m2.
Using SGLT2 inhibitors when eGFR is as low as 25
“It’s time to reduce the eGFR level for initiating an SGLT2 inhibitor to as low as 25,” said Dr. Heerspink, a professor of clinical pharmacology at the University of Groningen (the Netherlands).
While conceding that this is primarily a decision to be made by guideline writers and regulatory bodies, he declared what he believed was established by the DAPA-CKD findings: “We’ve shown that dapagliflozin can be safely used in these patients. It is effective across the spectrum of kidney function.”
Other experts not associated with the study agreed.
The trial researchers were “brave” to enroll patients with eGFRs as low as 25 mL/min per 1.73 m2, and “we urgently need these agents in patients with an eGFR this low,” commented Chantal Mathieu, MD, an endocrinologist and professor of medicine at Catholic University in Leuven, Belgium, and designated discussant for the report. Overall, she called the findings “spectacular,” a “landmark trial,” and a “winner.”
The study also set an new, lower floor for the level of albuminuria that can be usefully treated with dapagliflozin (Farxiga) by enrolling patients with a urinary albumin-to-creatinine ratio as low as 200 mg/g; the previous lower limit had been 300 mg/g, noted Dr. Mathieu. The new findings pose challenges to guideline writers, regulators who approve drug labels, and payers to a quickly make changes that will bring dapagliflozin to a wider number of patients with CKD.
Once the full DAPA-CKD results are reported, “it will change practice, and push the eGFR needle down” to as low as 25. It will also lower the albuminuria threshold for using dapagliflozin or other drugs in the class, commented David Z.I. Cherney, MD, a nephrologist at the University of Toronto. “It’s just one study,” he admitted, but the consistent renal benefits seen across several studies involving all four drugs in the SGLT2 inhibitor class will help hasten this change in identifying treatable patients, as well as expand the drug class to patients with CKD but no type 2 diabetes (T2D).
“I don’t think we’ve ever had stronger evidence” for drugs that can benefit both heart and renal function, plus the drug class is “very safe, and really easy to start” and maintain in patients, Dr. Cherney said in an interview. “It’s wonderful for these patients that we now have something new for treatment,” a drug with a “very favorable benefit-to-risk ratio.”
Results show many dapagliflozin benefits
While this broadening of the range of patients proven to tolerate and benefit from an SGLT2 inhibitor was an important consequence of DAPA-CKD, the study’s primary finding – that dapagliflozin was as safe and effective for slowing CKD progression in patients regardless of whether they also had T2D – will have an even bigger impact on expanding the target patient population. Showing efficacy in patients with CKD but without a T2D etiology, the status of about a third of the enrolled 4,304 patients, makes this treatment an option for “millions” of additional patients worldwide, said Dr. Heerspink. “These are the most common patients nephrologists see.” A major challenge now will be to do a better job finding patients with CKD who could benefit from dapagliflozin.
DAPA-CKD enrolled CKD patients based primarily on prespecified albuminuria and eGFR levels at more than 300 centers in 34 countries, including the United States. Virtually all patients, 97%, were on the only treatment now available with proven efficacy for slowing CKD, either an ACE inhibitor or an angiotensin receptor blocker. The small number of patients not on one of these drugs was because of poor tolerance.
The study’s primary endpoint was the combined rate of cardiovascular death, renal death, end-stage renal disease, or a drop in eGFR of at least 50% from baseline. This occurred in 14.5% of patients who received placebo and in 9.2% of those who received dapagliflozin during a median follow-up of 2.4 years, a highly significant 39% relative risk reduction. Concurrently with the report at the virtual meeting the results also appeared online in the New England Journal of Medicine. This 5.3% cut in the absolute rate of the combined, primary adverse outcome converted into a number needed to treat of 19 to prevent 1 event during 2.4 years, a “much lower” number needed to treat than reported for renin-angiotensin system inhibitors in these types of patients, Dr. Heerspink said.
Notable positive secondary outcomes included a significant 31% relative cut (a 2% absolute decline) in all-cause mortality, “a major highlight” of the findings, Dr. Heerspink said. Dapagliflozin treatment also linked with a significant 29% relative cut in the incidence of cardiovascular death or hospitalization for heart failure.
“Cardiovascular disease is the most common cause of death in patients with CKD,” explained David C. Wheeler, MD, a coinvestigator on the study and professor of kidney medicine at University College London. “The heart and kidney are intertwined. This is about cardiorenal disease.”
DAPA-CKD was funded by AstraZeneca, the company that markets dapagliflozin. Dr. Heerspink has been a consultant to and received research funding from AstraZeneca. He has also received personal fees from Mundipharma and Novo Nordisk, and he has also served as consultant to several other companies with the honoraria being paid to his institution. Dr. Mathieu has had relationships with AstraZeneca and several other companies. Dr. Cherney has been a consultant to and has received research funding from AstraZeneca and several other companies. Dr. Wheeler has received personal fees from AstraZeneca and from several other companies.
SOURCE: Heerspink HJL et al. EASD 2020 and N Engl J Med. 2020 Sep 24. doi: 10.1056/NEJMoa2024816.
FROM EASD 2020
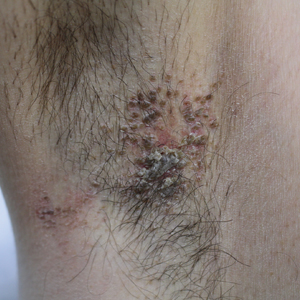
Pruritic Axillary Plaques
The Diagnosis: Granular Parakeratosis
Microscopic examination of a punch biopsy from the left axilla revealed verruciform epidermal hyperplasia with overlying parakeratosis and retention of keratohyalin granules in the stratum corneum (Figure). There was no evidence of acantholysis, dyskeratosis, epidermal neutrophils, or neutrophilic microabscesses.

The patient's history and characteristic histopathologic findings confirmed the diagnosis of granular parakeratosis (GP). He was instructed to discontinue his current antiperspirant and began treatment with topical fluocinolone oil 0.01% every morning and urea cream 20% every night. Complete resolution was achieved within 2 weeks, and he reported no recurrence at a 2-year follow-up visit.
Granular parakeratosis is a rare idiopathic skin condition characterized by hyperkeratotic papules and plaques, most often in intertriginous areas. Described by Northcutt et al1 as a contact reaction to antiperspirant in the axillae, GP also has been reported in the submammary and inguinal creases2 and rarely in nonintertriginous sites such as the abdomen.3 Although deodorants and antiperspirants in roll-on or stick form classically are implicated in GP, the condition also has been observed with exposure to laundry detergents containing benzalkonium chloride.4 Lesions with GP histology also have been incidentally observed in association with dermatophytosis,5 dermatomyositis,6 molluscum contagiosum,7 and carcinomas.8 Ding et al9 proposed that GP be reclassified as a reaction pattern observed in the skin as opposed to being a distinct disease entity.
Clinically, GP presents as pruritic intertriginous papules and coalescent plaques that most commonly are seen in the axillae but also may involve the groin or other sites.2,3 Both pruritus and disease burden can be aggravated by heat, sweating, or friction. There may be a history of a new irritant exposure prior to symptom onset, but GP has been observed in the absence of identifiable exposures and in the setting of long-term antiperspirant or deodorant use.3 Although a family history may be helpful, it can be difficult to distinguish GP from entities such as Hailey-Hailey disease or Darier disease based on history and examination alone; a biopsy often is necessary for definitive diagnosis.
Histologically, GP demonstrates acanthosis with parakeratosis and retention of keratohyalin granules in the stratum corneum.1 The stratum granulosum is preserved. On cursory examination, GP may resemble a psoriasiform dermatosis as can be seen in inverse psoriasis; however, neutrophilic microabscesses and infiltrates are not seen. Absence of acantholysis and dyskeratosis further differentiates GP from the clinically similar Hailey-Hailey disease and Darier disease. Spongiosis that is prominently found in allergic contact dermatitis also is absent.
Although a benign disorder, GP warrants treatment to achieve symptomatic relief. A mainstay of treatment is to eliminate exposure to suspected aggravating or inciting factors such as antiperspirants or deodorants. A variety of treatments including laser therapy, corticosteroids, isotretinoin, and vitamin D analogs such as calcipotriene and calcitriol have been reported to be effective treatments of GP in case studies and series.3,10 Large-scale clinical trials are not available because of the rarity of this condition. Our patient's clinical course suggests topical fluocinolone and urea in combination can be considered to achieve rapid resolution.
- Northcutt AD, Nelson DM, Tschen JA. Axillary granular parakeratosis. J Am Acad Dermatol. 1991;24:541-544.
- Burford C. Granular parakeratosis of multiple intertriginous areas. Australas J Dermatol. 2008;49:35-38.
- Samrao A, Reis M, Neidt G, et al. Granular parakeratosis: response to calcipotriene and brief review of current therapeutic options. Skinmed. 2010;8:357-359.
- Robinson AJ, Foster RS, Halbert AR, et al. Granular parakeratosis induced by benzalkonium chloride exposure from laundry rinse aids. Australas J Dermatol. 2017;58:E138-E140.
- Resnik KS, Kantor GR, DiLeonardo M. Dermatophyte-related granular parakeratosis. Am J Dermatopathol. 2004;26:70-71.
- Pock L, Hercogová J. Incidental granular parakeratosis associated with dermatomyositis. Am J Dermatopathol. 2006;28:147-149.
- Pock L, Cermáková A, Zipfelová J, et al. Incidental granular parakeratosis associated with molluscum contagiosum. Am J Dermatopathol. 2006;28:45-47.
- Resnik KS, DiLeonardo M. Incidental granular parakeratotic cornification in carcinomas. Am J Dermatopathol. 2007;29:264-269.
- Ding CY, Liu H, Khachemoune A. Granular parakeratosis: a comprehensive review and a critical reappraisal. Am J Clin Dermatol. 2015;16:495-500.
- Patel U, Patel T, Skinner RB. Resolution of granular parakeratosis with topical calcitriol. Arch Dermatol. 2011;147:997-998.
The Diagnosis: Granular Parakeratosis
Microscopic examination of a punch biopsy from the left axilla revealed verruciform epidermal hyperplasia with overlying parakeratosis and retention of keratohyalin granules in the stratum corneum (Figure). There was no evidence of acantholysis, dyskeratosis, epidermal neutrophils, or neutrophilic microabscesses.
The patient's history and characteristic histopathologic findings confirmed the diagnosis of granular parakeratosis (GP). He was instructed to discontinue his current antiperspirant and began treatment with topical fluocinolone oil 0.01% every morning and urea cream 20% every night. Complete resolution was achieved within 2 weeks, and he reported no recurrence at a 2-year follow-up visit.
Granular parakeratosis is a rare idiopathic skin condition characterized by hyperkeratotic papules and plaques, most often in intertriginous areas. Described by Northcutt et al1 as a contact reaction to antiperspirant in the axillae, GP also has been reported in the submammary and inguinal creases2 and rarely in nonintertriginous sites such as the abdomen.3 Although deodorants and antiperspirants in roll-on or stick form classically are implicated in GP, the condition also has been observed with exposure to laundry detergents containing benzalkonium chloride.4 Lesions with GP histology also have been incidentally observed in association with dermatophytosis,5 dermatomyositis,6 molluscum contagiosum,7 and carcinomas.8 Ding et al9 proposed that GP be reclassified as a reaction pattern observed in the skin as opposed to being a distinct disease entity.
Clinically, GP presents as pruritic intertriginous papules and coalescent plaques that most commonly are seen in the axillae but also may involve the groin or other sites.2,3 Both pruritus and disease burden can be aggravated by heat, sweating, or friction. There may be a history of a new irritant exposure prior to symptom onset, but GP has been observed in the absence of identifiable exposures and in the setting of long-term antiperspirant or deodorant use.3 Although a family history may be helpful, it can be difficult to distinguish GP from entities such as Hailey-Hailey disease or Darier disease based on history and examination alone; a biopsy often is necessary for definitive diagnosis.
Histologically, GP demonstrates acanthosis with parakeratosis and retention of keratohyalin granules in the stratum corneum.1 The stratum granulosum is preserved. On cursory examination, GP may resemble a psoriasiform dermatosis as can be seen in inverse psoriasis; however, neutrophilic microabscesses and infiltrates are not seen. Absence of acantholysis and dyskeratosis further differentiates GP from the clinically similar Hailey-Hailey disease and Darier disease. Spongiosis that is prominently found in allergic contact dermatitis also is absent.
Although a benign disorder, GP warrants treatment to achieve symptomatic relief. A mainstay of treatment is to eliminate exposure to suspected aggravating or inciting factors such as antiperspirants or deodorants. A variety of treatments including laser therapy, corticosteroids, isotretinoin, and vitamin D analogs such as calcipotriene and calcitriol have been reported to be effective treatments of GP in case studies and series.3,10 Large-scale clinical trials are not available because of the rarity of this condition. Our patient's clinical course suggests topical fluocinolone and urea in combination can be considered to achieve rapid resolution.
- Northcutt AD, Nelson DM, Tschen JA. Axillary granular parakeratosis. J Am Acad Dermatol. 1991;24:541-544.
- Burford C. Granular parakeratosis of multiple intertriginous areas. Australas J Dermatol. 2008;49:35-38.
- Samrao A, Reis M, Neidt G, et al. Granular parakeratosis: response to calcipotriene and brief review of current therapeutic options. Skinmed. 2010;8:357-359.
- Robinson AJ, Foster RS, Halbert AR, et al. Granular parakeratosis induced by benzalkonium chloride exposure from laundry rinse aids. Australas J Dermatol. 2017;58:E138-E140.
- Resnik KS, Kantor GR, DiLeonardo M. Dermatophyte-related granular parakeratosis. Am J Dermatopathol. 2004;26:70-71.
- Pock L, Hercogová J. Incidental granular parakeratosis associated with dermatomyositis. Am J Dermatopathol. 2006;28:147-149.
- Pock L, Cermáková A, Zipfelová J, et al. Incidental granular parakeratosis associated with molluscum contagiosum. Am J Dermatopathol. 2006;28:45-47.
- Resnik KS, DiLeonardo M. Incidental granular parakeratotic cornification in carcinomas. Am J Dermatopathol. 2007;29:264-269.
- Ding CY, Liu H, Khachemoune A. Granular parakeratosis: a comprehensive review and a critical reappraisal. Am J Clin Dermatol. 2015;16:495-500.
- Patel U, Patel T, Skinner RB. Resolution of granular parakeratosis with topical calcitriol. Arch Dermatol. 2011;147:997-998.
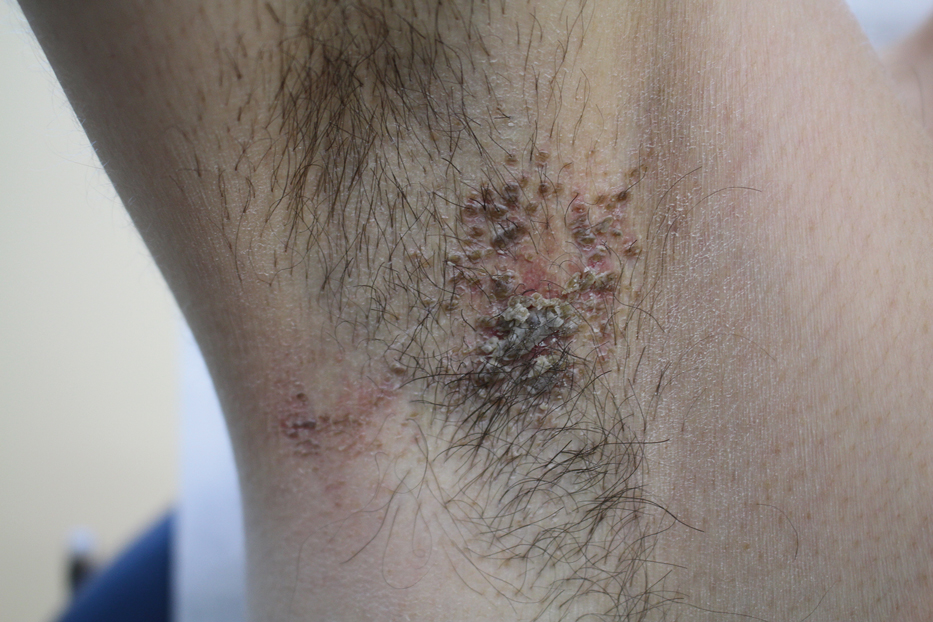
A 42-year-old man presented with pruritic axillary plaques of 6 months’ duration that were exacerbated by heat and friction. He maintained a very active lifestyle and used an antiperspirant regularly. He denied any family history of similar lesions. Thick emollients provided no relief. Physical examination demonstrated numerous soft, hyperkeratotic, waxy, yellowish brown papules coalescing into plaques localized to the bilateral axillary vaults, affecting the right axilla more than the left. Although some papules were firmly adherent to the skin, others were friable and easily removed with a cotton-tipped applicator, revealing an underlying, faintly erythematous base.
Predicting complications of cytoreductive nephrectomy in metastatic RCC
according to an analysis of registry data.
Higher intraoperative blood loss was also associated with low-grade postoperative complications. Intraoperative complications were more likely in patients who had concurrent thrombectomy and surgery on adjacent organs.
Eduard Roussel, MD, of University Hospitals Leuven (Belgium) and colleagues reported these findings in European Urology Oncology.
The authors noted that the role of CN in metastatic RCC is controversial. The CARMENA trial, published in the New England Journal of Medicine, “shifted treatment paradigms” away from surgery by suggesting that sunitinib alone is noninferior to sunitinib after CN.
“Nonetheless, there is a general consensus that certain selected subgroups of patients with low-volume, single-site metastases and few adverse IMDC [International Metastatic Renal Cell Carcinoma Database Consortium] criteria would still benefit from the continued use of upfront CN,” the authors wrote.
They advised clinicians to weigh the risks and benefits of CN, particularly because “postoperative morbidity might preclude or delay the use of subsequent systemic therapies.” However, the risk/benefit calculation for CN has been difficult because past investigations have tended to focus only on survival outcomes, so there isn’t much data on morbidity, the authors wrote.
Patient characteristics and complications
To investigate morbidity associated with CN, Dr. Roussel and colleagues reviewed data from the Registry of Metastatic RCC (REMARCC). The team analyzed the clinical records of 736 patients who underwent nephrectomy for metastatic RCC during 1980-2019.
The patients’ median age was 63 years (range, 55-70 years), and about three-quarters were men. The majority had clear cell carcinoma, and the lungs were the most common site of metastases.
More than 97% of procedures were complete nephrectomies, and the rest were partial. The median estimated blood loss was 400 mL, and the median follow-up was 16.5 months.
There were 69 patients who had intraoperative complications, most commonly bleeding (n = 25), spleen laceration (n = 13), and vascular injury (n = 11).
There were 217 patients who had postoperative complications, including 45 patients with high-grade complications (grade 3-5) and 10 who died.
The most common postoperative complications were vascular/lymphatic in nature. These occurred in 67 patients and included 10 lymphoceles.
“[G]iven the relatively high rate of postoperative lymphoceles, which is probably attributable to the performance of lymph node dissections and the lack of proven oncological survival benefit thereof, surgeons might reconsider the performance of lymphadenectomy during CN,” the investigators wrote.
Other common postoperative complications included infectious and cardiopulmonary issues, which occurred in 42 and 39 patients, respectively.
Predictors of complications
Thrombectomy and adjacent organ removal were significant predictors of intraoperative complications on multivariable analysis. The odds ratios were 1.38 (P = .009) for thrombectomy and 2.71 (P = .004) for adjacent organ removal.
Estimated blood loss was a significant predictor of low- and high-grade postoperative complications. The OR for high-grade complications per 200 mL of blood lost was 1.06 (P = .007), and the OR for low-grade complications per 200 mL blood lost was 1.09 (P = .001).
There was a strong inverse correlation with CN case load at each center and high-grade postoperative complications, which highlights “the impact of centralization of care on postoperative outcomes in complex surgical scenarios,” the investigators wrote. The OR per 25 cases was 0.88 (P = .04).

Results were largely the same when the analysis was limited to the 560 subjects treated since 2006, in the targeted therapy era, except that adjacent organ removal as a predictor of intraoperative complications did not quite reach statistical significance (P = .06).
The presurgery risk factors identified in this study should assist with presurgical counseling, said Zachery Reichert, MD, PhD, a genitourinary medical oncologist and assistant professor at the University of Michigan, Ann Arbor, who was not involved in this study.
“This is especially important for patients who require thrombectomy or adjacent organ removal or do not have access to a surgeon with high cytoreductive nephrectomy caseloads,” he said.
Dr. Reichert reported having no disclosures. There was no external funding for this study, and the investigators didn’t have any disclosures.
SOURCE: Roussel E et al. Eur Urol Oncol. 2020 Aug;3(4):523-9.
according to an analysis of registry data.
Higher intraoperative blood loss was also associated with low-grade postoperative complications. Intraoperative complications were more likely in patients who had concurrent thrombectomy and surgery on adjacent organs.
Eduard Roussel, MD, of University Hospitals Leuven (Belgium) and colleagues reported these findings in European Urology Oncology.
The authors noted that the role of CN in metastatic RCC is controversial. The CARMENA trial, published in the New England Journal of Medicine, “shifted treatment paradigms” away from surgery by suggesting that sunitinib alone is noninferior to sunitinib after CN.
“Nonetheless, there is a general consensus that certain selected subgroups of patients with low-volume, single-site metastases and few adverse IMDC [International Metastatic Renal Cell Carcinoma Database Consortium] criteria would still benefit from the continued use of upfront CN,” the authors wrote.
They advised clinicians to weigh the risks and benefits of CN, particularly because “postoperative morbidity might preclude or delay the use of subsequent systemic therapies.” However, the risk/benefit calculation for CN has been difficult because past investigations have tended to focus only on survival outcomes, so there isn’t much data on morbidity, the authors wrote.
Patient characteristics and complications
To investigate morbidity associated with CN, Dr. Roussel and colleagues reviewed data from the Registry of Metastatic RCC (REMARCC). The team analyzed the clinical records of 736 patients who underwent nephrectomy for metastatic RCC during 1980-2019.
The patients’ median age was 63 years (range, 55-70 years), and about three-quarters were men. The majority had clear cell carcinoma, and the lungs were the most common site of metastases.
More than 97% of procedures were complete nephrectomies, and the rest were partial. The median estimated blood loss was 400 mL, and the median follow-up was 16.5 months.
There were 69 patients who had intraoperative complications, most commonly bleeding (n = 25), spleen laceration (n = 13), and vascular injury (n = 11).
There were 217 patients who had postoperative complications, including 45 patients with high-grade complications (grade 3-5) and 10 who died.
The most common postoperative complications were vascular/lymphatic in nature. These occurred in 67 patients and included 10 lymphoceles.
“[G]iven the relatively high rate of postoperative lymphoceles, which is probably attributable to the performance of lymph node dissections and the lack of proven oncological survival benefit thereof, surgeons might reconsider the performance of lymphadenectomy during CN,” the investigators wrote.
Other common postoperative complications included infectious and cardiopulmonary issues, which occurred in 42 and 39 patients, respectively.
Predictors of complications
Thrombectomy and adjacent organ removal were significant predictors of intraoperative complications on multivariable analysis. The odds ratios were 1.38 (P = .009) for thrombectomy and 2.71 (P = .004) for adjacent organ removal.
Estimated blood loss was a significant predictor of low- and high-grade postoperative complications. The OR for high-grade complications per 200 mL of blood lost was 1.06 (P = .007), and the OR for low-grade complications per 200 mL blood lost was 1.09 (P = .001).
There was a strong inverse correlation with CN case load at each center and high-grade postoperative complications, which highlights “the impact of centralization of care on postoperative outcomes in complex surgical scenarios,” the investigators wrote. The OR per 25 cases was 0.88 (P = .04).
Results were largely the same when the analysis was limited to the 560 subjects treated since 2006, in the targeted therapy era, except that adjacent organ removal as a predictor of intraoperative complications did not quite reach statistical significance (P = .06).
The presurgery risk factors identified in this study should assist with presurgical counseling, said Zachery Reichert, MD, PhD, a genitourinary medical oncologist and assistant professor at the University of Michigan, Ann Arbor, who was not involved in this study.
“This is especially important for patients who require thrombectomy or adjacent organ removal or do not have access to a surgeon with high cytoreductive nephrectomy caseloads,” he said.
Dr. Reichert reported having no disclosures. There was no external funding for this study, and the investigators didn’t have any disclosures.
SOURCE: Roussel E et al. Eur Urol Oncol. 2020 Aug;3(4):523-9.
FROM EUROPEAN UROLOGY ONCOLOGY
Listening to Tim Ferriss
Let me tell you about Tim Ferriss. A few years ago, I started reading his best-selling book, The 4-Hour Body. Ferris detailed how he made himself into a one-man experiment – he’d make changes to his diet, checked his weight and his labs, maybe he even had metabolic studies done.

He’d take these measures after soaking in hot baths, then ice baths, and while I admired his discipline, he did lose me during the chapter where he was using steroids. In the end, he advised a dairy-free, low-carbohydrate diet of green vegetables, beans or lentils, and protein for four meals a day, 6 days a week, with free-for-all eating on the 7th day. Then, there was a weight-lifting routine with kettle bells and ice packs to be placed on your shoulders for a set amount of time each day.
I may not remember the program’s details, but something about Ferris fascinated me. He brands himself as being a “human guinea pig,” about “lifestyle design,” and whatever that is, I like it. Perhaps I am attracted to the idea that we might control the trajectories of our generally uncontrollable lives.
Tim Ferriss graduated from Princeton, he’s written five best-selling books and has a popular podcast, he’s been a TED speaker, and he’s been on Fortune’s “40 under 40” list – and there’s so much more. Ferriss is brilliant, innovative, handsome, charismatic, prolific, extraordinarily athletic. I may have forgotten to mention that he was the National Chinese Kickboxing Champion and was a semifinalist in the World Champion Tango competition in Buenos Aires. He’s adventuresome and fearless, and if that isn’t enough, he speaks five languages. In the genetic dice roll, Mr. Ferriss did well, and he’s a driven and energetic hard worker who is open to new experiences.
I subscribe to the Tim Ferriss podcast – as of this writing, there are 466 episodes, with an incredible lineup of interviews with famous and successful guests. I also subscribe to his “5-Bullet Friday” email list where he mentions the interesting things he is reading, watching, learning about, or eating, and the products he is trying – single-ply toilet paper gets a thumbs down – then ends with a thought-provoking quote. This gentleman spends a tremendous amount of time searching and striving, working on himself and his own emotional growth and self-improvement, and yet he still has time for incredible explorations and experiences.
A search for psychic peace
Honestly, were it not for a few little details, I would like to be Tim Ferriss. Who wouldn’t? But what stops me from actually wanting to be Ferriss is that early on while listening to him, I realized that his drive has been fueled by intense psychic pain. He talks openly about being very close to suicide in college, about a tormenting mood disorder, demons to tame, and productivity as an antidote to a fear of failure, not always as a joy for life. There are moments that I have felt so sad for this remarkable stranger. Tim Ferriss is a searcher and what I believe he searches for most is his own psychic peace.

In a forum for psychiatrists, I wish I could write that Ferriss has found solace with our Food and Drug Administration–approved pharmaceuticals and with psychotherapy, but that’s not what he says. What Ferriss has found helpful, however, is psychedelics, and a wide variety of psychological and philosophical teachings ranging from meditation to Stoicism. And most notably, Ferriss has been an advocate for using hallucinogens as a legal medical intervention. Ferriss was one of four philanthropists who donated a total of $17 million to fund the Johns Hopkins Center for Psychedelic & Consciousness Research. He’s helped to move this field forward and to improve its credibility.
On Sept. 14, 2020, Tim Ferriss released a podcast he recorded with his dance partner and close friend, Debbie Millman, and when he recorded it, he was not certain he would release it. None of his usual sponsors endorsed during the podcast. He starts Episode #464 with, “For me, this is the most important podcast episode I’ve ever published. In it, I describe the most life-shaping, certainly the most difficult, and certainly the most transformative journey of my 43 years on this planet. I’ve never shared it before.”
by a babysitter’s son. He worried about how this would affect his family, if they would be left feeling guilty or devastated. He says, “Please note that I expect to be completely overwhelmed emotionally and otherwise when this is published and please understand if I’m not able to reply to any outreach.”
Ferriss and Millman had a long discussion about their sexual abuse as children. Millman was abused by her stepfather at the age of 9, and she talks about confronting him many years later. Ferriss has not confronted his perpetrator, though he has contemplated doing so.
Sexual violence and violation at any age leaves people scarred. In a recent letter to the New York Times in response to President Trump’s words of support to Ghislaine Maxwell, the woman who helped Jeffrey Epstein find his victims, Baltimore psychiatrist Robin Weiss wrote, “Thirty-eight years ago, when I was 32, I was raped. I was married, I was a doctor – you might say I was in pretty stable shape. Yet the shame and guilt I felt were overwhelming. Why didn’t I fight harder? How did I let this happen? I knew better, yet it took me years to overcome those irrational feelings.” These feelings of shame, guilt, self-doubt, and self-blame are nearly universal in survivors of sexual trauma. In children, they can be even worse, as children often don’t have an understanding that what is being done to them is wrong. They lack the language and the maturity to process the events, and ongoing abuse may be accompanied by threats to life of the child or their family members if they tell others, as was the case with Millman. She chose to process her abuse and the consequent difficulties she had by seeking psychiatric care. She took antidepressants and has been in psychoanalysis, both of which she has found to be helpful. Her treatment has tamed her demons, it is ongoing decades later and those demons have not vanished.
Abuse comes back in ‘a tidal wave’
Not surprisingly, Ferriss struggled with whether to make these events public. While so much of his story feels familiar to those of us who help patients process their trauma, it’s not completely typical. Ferriss remembered these episodes of sexual abuse “in high resolution,” while using ayahuasca, a hallucinogen, about 5 years ago. He describes suppressing and discounting these memories until he attended a 10-day silent retreat where he used psilocybin. I found it interesting that Ferriss fasted for 5 days before attending the retreat “to increase the depth of the experience.” He goes on to say, “Around day 6 of this silent retreat, all of this abuse came back to me like a tidal wave and it was replaying as if I was wearing a virtual reality headset. I was immersed, I wasn’t an observer, it was as though I was being traumatized and retraumatized 24/7.” He describes an excruciating and horrifying experience and he referred to it as a “psychotic break.”
Ferriss goes on to talk about how bringing these memories to light has affected him, how it’s explained many of his behaviors and ways of relating in a way that has helped him organize and understand his life.
“It was at the tail end of the retreat that I realized that these 17 seemingly inexplicable behaviors of mine – these vicious cycles or triggers that I had been treating like separate problems to be solved, were all downstream of this trauma. Oh, now that you click that puzzle piece into place, these really strange behaviors – this self-loathing, this rage that was seemingly so exaggerated and disproportionate – leading to the near-suicide I had in college – all these things fell into places making sense.” It gave him a sense of relief but was simultaneously overwhelming.
Both Ferriss and Millman talk about books and treatments that have been helpful to them. Their knowledge of trauma treatments and resources is impressive and can be found at: Tim Ferriss – My Healing Journey After Childhood Abuse (Includes Extensive Resource List). Their wish is to share their suffering as a way to help others, impart hope, and better connect.
Dr. Miller is coauthor with Annette Hanson, MD, of “Committed: The Battle Over Involuntary Psychiatry Care” (Baltimore: Johns Hopkins University, 2016). She has a private practice and is assistant professor of psychiatry and behavioral sciences at Johns Hopkins, both in Baltimore.
Let me tell you about Tim Ferriss. A few years ago, I started reading his best-selling book, The 4-Hour Body. Ferris detailed how he made himself into a one-man experiment – he’d make changes to his diet, checked his weight and his labs, maybe he even had metabolic studies done.
He’d take these measures after soaking in hot baths, then ice baths, and while I admired his discipline, he did lose me during the chapter where he was using steroids. In the end, he advised a dairy-free, low-carbohydrate diet of green vegetables, beans or lentils, and protein for four meals a day, 6 days a week, with free-for-all eating on the 7th day. Then, there was a weight-lifting routine with kettle bells and ice packs to be placed on your shoulders for a set amount of time each day.
I may not remember the program’s details, but something about Ferris fascinated me. He brands himself as being a “human guinea pig,” about “lifestyle design,” and whatever that is, I like it. Perhaps I am attracted to the idea that we might control the trajectories of our generally uncontrollable lives.
Tim Ferriss graduated from Princeton, he’s written five best-selling books and has a popular podcast, he’s been a TED speaker, and he’s been on Fortune’s “40 under 40” list – and there’s so much more. Ferriss is brilliant, innovative, handsome, charismatic, prolific, extraordinarily athletic. I may have forgotten to mention that he was the National Chinese Kickboxing Champion and was a semifinalist in the World Champion Tango competition in Buenos Aires. He’s adventuresome and fearless, and if that isn’t enough, he speaks five languages. In the genetic dice roll, Mr. Ferriss did well, and he’s a driven and energetic hard worker who is open to new experiences.
I subscribe to the Tim Ferriss podcast – as of this writing, there are 466 episodes, with an incredible lineup of interviews with famous and successful guests. I also subscribe to his “5-Bullet Friday” email list where he mentions the interesting things he is reading, watching, learning about, or eating, and the products he is trying – single-ply toilet paper gets a thumbs down – then ends with a thought-provoking quote. This gentleman spends a tremendous amount of time searching and striving, working on himself and his own emotional growth and self-improvement, and yet he still has time for incredible explorations and experiences.
A search for psychic peace
Honestly, were it not for a few little details, I would like to be Tim Ferriss. Who wouldn’t? But what stops me from actually wanting to be Ferriss is that early on while listening to him, I realized that his drive has been fueled by intense psychic pain. He talks openly about being very close to suicide in college, about a tormenting mood disorder, demons to tame, and productivity as an antidote to a fear of failure, not always as a joy for life. There are moments that I have felt so sad for this remarkable stranger. Tim Ferriss is a searcher and what I believe he searches for most is his own psychic peace.
In a forum for psychiatrists, I wish I could write that Ferriss has found solace with our Food and Drug Administration–approved pharmaceuticals and with psychotherapy, but that’s not what he says. What Ferriss has found helpful, however, is psychedelics, and a wide variety of psychological and philosophical teachings ranging from meditation to Stoicism. And most notably, Ferriss has been an advocate for using hallucinogens as a legal medical intervention. Ferriss was one of four philanthropists who donated a total of $17 million to fund the Johns Hopkins Center for Psychedelic & Consciousness Research. He’s helped to move this field forward and to improve its credibility.
On Sept. 14, 2020, Tim Ferriss released a podcast he recorded with his dance partner and close friend, Debbie Millman, and when he recorded it, he was not certain he would release it. None of his usual sponsors endorsed during the podcast. He starts Episode #464 with, “For me, this is the most important podcast episode I’ve ever published. In it, I describe the most life-shaping, certainly the most difficult, and certainly the most transformative journey of my 43 years on this planet. I’ve never shared it before.”
by a babysitter’s son. He worried about how this would affect his family, if they would be left feeling guilty or devastated. He says, “Please note that I expect to be completely overwhelmed emotionally and otherwise when this is published and please understand if I’m not able to reply to any outreach.”
Ferriss and Millman had a long discussion about their sexual abuse as children. Millman was abused by her stepfather at the age of 9, and she talks about confronting him many years later. Ferriss has not confronted his perpetrator, though he has contemplated doing so.
Sexual violence and violation at any age leaves people scarred. In a recent letter to the New York Times in response to President Trump’s words of support to Ghislaine Maxwell, the woman who helped Jeffrey Epstein find his victims, Baltimore psychiatrist Robin Weiss wrote, “Thirty-eight years ago, when I was 32, I was raped. I was married, I was a doctor – you might say I was in pretty stable shape. Yet the shame and guilt I felt were overwhelming. Why didn’t I fight harder? How did I let this happen? I knew better, yet it took me years to overcome those irrational feelings.” These feelings of shame, guilt, self-doubt, and self-blame are nearly universal in survivors of sexual trauma. In children, they can be even worse, as children often don’t have an understanding that what is being done to them is wrong. They lack the language and the maturity to process the events, and ongoing abuse may be accompanied by threats to life of the child or their family members if they tell others, as was the case with Millman. She chose to process her abuse and the consequent difficulties she had by seeking psychiatric care. She took antidepressants and has been in psychoanalysis, both of which she has found to be helpful. Her treatment has tamed her demons, it is ongoing decades later and those demons have not vanished.
Abuse comes back in ‘a tidal wave’
Not surprisingly, Ferriss struggled with whether to make these events public. While so much of his story feels familiar to those of us who help patients process their trauma, it’s not completely typical. Ferriss remembered these episodes of sexual abuse “in high resolution,” while using ayahuasca, a hallucinogen, about 5 years ago. He describes suppressing and discounting these memories until he attended a 10-day silent retreat where he used psilocybin. I found it interesting that Ferriss fasted for 5 days before attending the retreat “to increase the depth of the experience.” He goes on to say, “Around day 6 of this silent retreat, all of this abuse came back to me like a tidal wave and it was replaying as if I was wearing a virtual reality headset. I was immersed, I wasn’t an observer, it was as though I was being traumatized and retraumatized 24/7.” He describes an excruciating and horrifying experience and he referred to it as a “psychotic break.”
Ferriss goes on to talk about how bringing these memories to light has affected him, how it’s explained many of his behaviors and ways of relating in a way that has helped him organize and understand his life.
“It was at the tail end of the retreat that I realized that these 17 seemingly inexplicable behaviors of mine – these vicious cycles or triggers that I had been treating like separate problems to be solved, were all downstream of this trauma. Oh, now that you click that puzzle piece into place, these really strange behaviors – this self-loathing, this rage that was seemingly so exaggerated and disproportionate – leading to the near-suicide I had in college – all these things fell into places making sense.” It gave him a sense of relief but was simultaneously overwhelming.
Both Ferriss and Millman talk about books and treatments that have been helpful to them. Their knowledge of trauma treatments and resources is impressive and can be found at: Tim Ferriss – My Healing Journey After Childhood Abuse (Includes Extensive Resource List). Their wish is to share their suffering as a way to help others, impart hope, and better connect.
Dr. Miller is coauthor with Annette Hanson, MD, of “Committed: The Battle Over Involuntary Psychiatry Care” (Baltimore: Johns Hopkins University, 2016). She has a private practice and is assistant professor of psychiatry and behavioral sciences at Johns Hopkins, both in Baltimore.
Glucocorticoid-induced osteoporosis: Teriparatide may be a good alternative to denosumab
Key clinical point: Teriparatide may have better therapeutic effects than denosumab in glucocorticoid-induced osteoporosis (GIO) patients previously treated with bisphosphonates.
Major finding: Teriparatide group showed a significantly greater improvement in the bone mineral density (BMD) of lumbar spine (P less than .01) and femoral neck (P less than .05) vs. denosumab group at 12 months, but not at 24 months. At 24 months, BMD of lumbar spine had significantly increased from baseline in both the groups, whereas BMD of femoral neck had increased only in the teriparatide group.
Study details: A prospective, open-label, nonrandomized, single-center study including 47 patients with GIO assigned to either teriparatide group (n = 23) or denosumab group (n = 24).
Disclosures: The study did not receive any specific funding. The authors declared no conflicts of interest.
Source: Hirooka Y et al. Bone Rep. 2020 Jul 4. doi: 10.1016/j.bonr.2020.100293.
Psoriatic arthritis, psoriasis, and osteoporosis: What is the association?
Key clinical point: Psoriatic arthritis (PsA) is associated with the risk for low bone mineral density (BMD), but this association is partially mediated by treatment with methotrexate or ciclosporin. Psoriasis excluding PsA in the absence of a secondary condition is not a risk factor for osteoporosis.
Major finding: PsA was associated with low BMD (β-coefficient = −0.014; P = .0006). However, the association became nonsignificant when patients were treated with methotrexate or ciclosporin (β-coefficient = −0.005; P = .28). Psoriasis without arthritis was not associated with low BMD or osteoporosis.
Study details: The data come from a cross-sectional study of 432,513 participants from the UK Biobank dataset.
Disclosures: The study was supported by the Zhejiang Provincial Natural Science Foundation for Distinguished Young Scholars of China and the National Natural Science Foundation of China. The authors declared no conflicts of interest.
Source: Xia J et al. Ann Rheum Dis. 2020 Jul 31. doi: 10.1136/annrheumdis-2020-217892.
Osteoporosis: Cardiovascular safety of abaloparatide in postmenopausal women
Key clinical point: Treatment with abaloparatide is associated with a transient increase in heart rate (HR) and a small decrease in post-dose blood pressure (BP) in postmenopausal women with osteoporosis.
Major finding: Abaloparatide showed a significantly higher mean HR change from pretreatment to 1 hour posttreatment on day 1 vs. placebo (mean [standard deviation]: 7.9 [8.5] vs. 1.2 [7.1] beats per minute; P less than .0001). Abaloparatide showed a significantly higher change in systolic and diastolic blood pressure from pre-dose to 1 hour post-dose vs. placebo (−2.7/−3.6 vs. −1.5/−2.3 mmHg; P less than .05). These changes were not associated with an increased risk of serious cardiac adverse events, major adverse cardiovascular events, and heart failure.
Study details: The findings are based on a post-hoc analysis from the ACTIVE and ACTIVExtend trials including 2,460 postmenopausal women with osteoporosis.
Disclosures: Dr. Felicia Cosman, Dr. Steven R Cummings, Dr. Linda R Peterson, and Dr. Dwight A Towler consulted for/received research grants from pharmaceutical companies/research institutes including Amgen; Radius Health, Inc.; and the National Institutes of Health. Dr. Bruce Mitlak and Dr. Yamei Wang are employees of and hold equity in Radius Health, Inc.
Source: Cosman F et al. J Clin Endocrinol Metab. 2020 Jul 13. doi: 10.1210/clinem/dgaa450.
Initiation of antiosteoporotic drugs in women starting glucocorticoid treatment
Key clinical point: Women with a previous fracture or who had an inflammatory rheumatic disease were more likely to start antiosteoporotic drugs (AODs) within 1 year from glucocorticoid (GC) initiation. However, the proportions starting an AOD were much lower than clinically indicated.
Major finding: Women with vs. without previous fracture were twice as likely to start an AOD within 1 year after initiating GC treatment, but the cumulative incidences were low: 9.1% vs. 4.6%, respectively. Women with a diagnosis of rheumatoid arthritis or another inflammatory rheumatic disease were more likely to start an AOD compared with women with other diagnoses.
Study details: This Norwegian population-based study evaluated the initiation of osteoporosis prophylaxis with AOD in women starting treatment with oral GC (n=105,477; age, 55 years or older).
Disclosures: Open Access funding was provided by the University of Bergen. Astrid Lunde is involved in the Denosumab Global Safety Study. Department of Clinical Epidemiology, Aarhus University receives an institutional research funding from several pharmaceutical companies, some of which manufacture AOD. None of these companies was involved in the current study. Vera Ehrenstein is a salaried employee of the Aarhus University. Ellen M Apalset, Mari Hoff, and Grethe S Tell declared no conflicts of interest.
Source: Apalset EM et al. Arch Osteoporos. 2020 Aug 5. doi: 10.1007/s11657-020-00783-8.
Delayed denosumab injections raise vertebral fracture risks in osteoporosis
Key clinical point: Delaying denosumab doses by more than 16 weeks is associated with an increased risk of vertebral fracture in patients with osteoporosis vs. on-time injections. However, evidence is insufficient to conclude that fracture risk is increased at other anatomical sites with a long delay.
Major finding: Compared with on-time injections (within 4 weeks after the recommended date), short delay (by 4-16 weeks) had a hazard ratio (HR) of 1.03 and long delay (by more than 16 weeks) an HR of 1.44 (P for trend = .093) for composite fracture. For vertebral fractures, short delay had an HR of 1.48 and long delay an HR of 3.91 (P for trend = .005).
Study details: This U.K. population-based cohort study included 2,594 patients (age, 45 years or older) who initiated denosumab therapy for osteoporosis.
Disclosures: The study was supported by a grant from the National Institutes of Health and by the internal resources from the National Clinical Research Center for Orthopedics, Sports Medicine & Rehabilitation (Beijing) and Xiangya Hospital, Central South University. The authors declared no conflicts of interest in relation to the subject of the study. Three of the authors reported receiving grants from 1 or more pharma companies, outside the submitted work.
Source: Lyu H et al. Ann Intern Med. 2020 Jul 28. doi: 10.7326/M20-0882.