User login
FDA launches call center project to streamline Expanded Access request process
CHICAGO – The Food and Drug Administration launched a new call center project to assist physicians seeking to help cancer patients access unapproved therapies.

Entitled “Project Facilitate,” the program aims to create a single point of contact with FDA oncology staff who can guide physicians through the process of submitting Expanded Access (EA) requests on behalf of individual patients.
“This is a pilot program to provide continuous support to health care professionals throughout the entire Expanded Access process,” Richard Pazdur, MD, director of the FDA’s Oncology Center of Excellence and acting director of the Office of Hematology and Oncology Products said during the unveiling of the project during a press briefing at the annual meeting of the American Society of Clinical Oncology.
Physicians utilizing Project Facilitate can expect a “concierge service” experience including advice on the information needed to complete requests, assistance completing forms, pharma/biotech contact information, independent review board resource options, and follow-up on patient outcomes.
The project will work in synergy with the Reagan-Udall EA Navigator website, an “online road map” for physicians and patients that was launched 2 years ago “to facilitate and coordinate and collaborate with the FDA to advance the science mission of FDA,” and which has been expanded in conjunction with Project Facilitate, Ellen V. Sigal, PhD, chair of the board of the Reagan-Udall Foundation for the FDA, said at the press briefing.
“EA Navigator delivers transparent, concise, and searchable information provided by companies about their Expanded Access policies,” Dr. Sigal said. “Today I’m pleased to announce that the Navigator now features Expanded Access opportunities listed in ClinicalTrials.gov for companies in the directory.
“For the first time, those who need quick access to drug availability and Expanded Access options will find it in one place without having to visit site by site by site, or sift through thousands of studies that don’t merit their needs,” she added, noting that EA Navigator will often be the first step for physicians before they engage with Project Facilitate.
Project Facilitate can be reached Monday-Friday, 9 a.m.-5 p.m. ET at 240-402-0004, or by email at [email protected].
CHICAGO – The Food and Drug Administration launched a new call center project to assist physicians seeking to help cancer patients access unapproved therapies.
Entitled “Project Facilitate,” the program aims to create a single point of contact with FDA oncology staff who can guide physicians through the process of submitting Expanded Access (EA) requests on behalf of individual patients.
“This is a pilot program to provide continuous support to health care professionals throughout the entire Expanded Access process,” Richard Pazdur, MD, director of the FDA’s Oncology Center of Excellence and acting director of the Office of Hematology and Oncology Products said during the unveiling of the project during a press briefing at the annual meeting of the American Society of Clinical Oncology.
Physicians utilizing Project Facilitate can expect a “concierge service” experience including advice on the information needed to complete requests, assistance completing forms, pharma/biotech contact information, independent review board resource options, and follow-up on patient outcomes.
The project will work in synergy with the Reagan-Udall EA Navigator website, an “online road map” for physicians and patients that was launched 2 years ago “to facilitate and coordinate and collaborate with the FDA to advance the science mission of FDA,” and which has been expanded in conjunction with Project Facilitate, Ellen V. Sigal, PhD, chair of the board of the Reagan-Udall Foundation for the FDA, said at the press briefing.
“EA Navigator delivers transparent, concise, and searchable information provided by companies about their Expanded Access policies,” Dr. Sigal said. “Today I’m pleased to announce that the Navigator now features Expanded Access opportunities listed in ClinicalTrials.gov for companies in the directory.
“For the first time, those who need quick access to drug availability and Expanded Access options will find it in one place without having to visit site by site by site, or sift through thousands of studies that don’t merit their needs,” she added, noting that EA Navigator will often be the first step for physicians before they engage with Project Facilitate.
Project Facilitate can be reached Monday-Friday, 9 a.m.-5 p.m. ET at 240-402-0004, or by email at [email protected].
REPORTING FROM ASCO 2019
Expanded indication being considered for meningococcal group B vaccine
LJUBLJANA, SLOVENIA – under the agency’s Breakthrough Therapy designation.

Breakthrough Therapy status is reserved for accelerated review of therapies considered to show substantial preliminary promise of effectively targeting a major unmet medical need.
The unmet need here is that there is no meningococcal group B vaccine approved for use in children under age 10 years. Yet infants and children under 5 years of age are at greatest risk of invasive meningococcal B disease, with reported case fatality rates of 8%-9%, Jason D. Maguire, MD, noted at the annual meeting of the European Society for Paediatric Infectious Diseases.
Trumenba has been approved in the United States for patients aged 10-25 years and in the European Union for individuals aged 10 years or older.
Dr. Maguire, of Pfizer’s vaccine clinical research and development program, presented the results of the two phase 2 randomized safety and immunogenicity trials conducted in patients aged 1- 9 years that the company has submitted to the FDA in support of the expanded indication. One study was carried out in 352 1-year-old toddlers, the other in 400 children aged 2-9 years, whose mean age was 4 years. The studies were carried out in Australia, Finland, Poland, and the Czech Republic.
In a pooled analysis of the vaccine’s immunogenicity when administered in a three-dose schedule of 120 mcg at 0, 2, and 6 months to 193 toddlers and 274 of the children aged 2-9 years, robust bactericidal antibody responses were seen against the four major Neisseria meningitidis group B strains that cause invasive disease. In fact, at least a fourfold rise in titers from baseline to 1 month after dose three was documented in the same high proportion of 1- to 9-year-olds as previously seen in the phase 3 trials that led to vaccine licensure in adolescents and young adults.
“These results support that the use of Trumenba, when given to children ages 1 to less than 10 years at the same dose and schedule that is currently approved in adolescents and young adults, can afford a high degree of protective antibody responses that correlate with immunity in this population,” Dr. Maguire said.
The safety and tolerability analysis included all 752 children in the two phase 2 studies, including the 110 toddlers randomized to three 60-mcg doses of the vaccine, although it has subsequently become clear that 120 mcg is the dose that provides the best immunogenicity with an acceptable safety profile, according to the physician.
Across the age groups, local reactions, including redness and swelling, were more common in Trumenba recipients than in controls who received hepatitis A vaccine and saline injections. So were systemic adverse events. Fever – a systemic event of particular interest to parents and clinicians – occurred in 37% of toddlers after vaccination, compared with 25% of 2- to 9-year-olds and 10%-12% of controls. Of note, prophylactic antipyretics weren’t allowed in the study.
“There’s somewhat of an inverse relationship between age and temperature. So as we go down in age, the rate of fever rises. But after each subsequent dose, regardless of age, there’s a reduction in the incidence of fever,” Dr. Maguire observed.
Most fevers were less than 39.0° C. Only 3 of 752 (less than 1%) patients experienced fever in excess of 40.0° C.
Two children withdrew from the study after developing hip synovitis, which was transient. Another withdrew because of prolonged irritability, fatigue, and decreased appetite.
“Although Trumenba had an acceptable safety and tolerability profile in 1- to 9-year-olds, this analysis wasn’t powered enough to detect uncommon adverse events, so we’ll continue to monitor safety for things like synovitis,” he said.
In 10- to 25-year-olds, the meningococcal vaccine can be given concomitantly with other vaccines without interference. There are plans to study concurrent vaccination with MMR and pneumococcal vaccines in 1- to 9-year-olds as well, according to Dr. Maguire.
Pfizer also now is planning clinical trials of the vaccine in infants, another important group currently unprotected against meningococcal group B disease, he added.
Dr. Maguire is an employee of Pfizer, who funded the studies.
LJUBLJANA, SLOVENIA – under the agency’s Breakthrough Therapy designation.
Breakthrough Therapy status is reserved for accelerated review of therapies considered to show substantial preliminary promise of effectively targeting a major unmet medical need.
The unmet need here is that there is no meningococcal group B vaccine approved for use in children under age 10 years. Yet infants and children under 5 years of age are at greatest risk of invasive meningococcal B disease, with reported case fatality rates of 8%-9%, Jason D. Maguire, MD, noted at the annual meeting of the European Society for Paediatric Infectious Diseases.
Trumenba has been approved in the United States for patients aged 10-25 years and in the European Union for individuals aged 10 years or older.
Dr. Maguire, of Pfizer’s vaccine clinical research and development program, presented the results of the two phase 2 randomized safety and immunogenicity trials conducted in patients aged 1- 9 years that the company has submitted to the FDA in support of the expanded indication. One study was carried out in 352 1-year-old toddlers, the other in 400 children aged 2-9 years, whose mean age was 4 years. The studies were carried out in Australia, Finland, Poland, and the Czech Republic.
In a pooled analysis of the vaccine’s immunogenicity when administered in a three-dose schedule of 120 mcg at 0, 2, and 6 months to 193 toddlers and 274 of the children aged 2-9 years, robust bactericidal antibody responses were seen against the four major Neisseria meningitidis group B strains that cause invasive disease. In fact, at least a fourfold rise in titers from baseline to 1 month after dose three was documented in the same high proportion of 1- to 9-year-olds as previously seen in the phase 3 trials that led to vaccine licensure in adolescents and young adults.
“These results support that the use of Trumenba, when given to children ages 1 to less than 10 years at the same dose and schedule that is currently approved in adolescents and young adults, can afford a high degree of protective antibody responses that correlate with immunity in this population,” Dr. Maguire said.
The safety and tolerability analysis included all 752 children in the two phase 2 studies, including the 110 toddlers randomized to three 60-mcg doses of the vaccine, although it has subsequently become clear that 120 mcg is the dose that provides the best immunogenicity with an acceptable safety profile, according to the physician.
Across the age groups, local reactions, including redness and swelling, were more common in Trumenba recipients than in controls who received hepatitis A vaccine and saline injections. So were systemic adverse events. Fever – a systemic event of particular interest to parents and clinicians – occurred in 37% of toddlers after vaccination, compared with 25% of 2- to 9-year-olds and 10%-12% of controls. Of note, prophylactic antipyretics weren’t allowed in the study.
“There’s somewhat of an inverse relationship between age and temperature. So as we go down in age, the rate of fever rises. But after each subsequent dose, regardless of age, there’s a reduction in the incidence of fever,” Dr. Maguire observed.
Most fevers were less than 39.0° C. Only 3 of 752 (less than 1%) patients experienced fever in excess of 40.0° C.
Two children withdrew from the study after developing hip synovitis, which was transient. Another withdrew because of prolonged irritability, fatigue, and decreased appetite.
“Although Trumenba had an acceptable safety and tolerability profile in 1- to 9-year-olds, this analysis wasn’t powered enough to detect uncommon adverse events, so we’ll continue to monitor safety for things like synovitis,” he said.
In 10- to 25-year-olds, the meningococcal vaccine can be given concomitantly with other vaccines without interference. There are plans to study concurrent vaccination with MMR and pneumococcal vaccines in 1- to 9-year-olds as well, according to Dr. Maguire.
Pfizer also now is planning clinical trials of the vaccine in infants, another important group currently unprotected against meningococcal group B disease, he added.
Dr. Maguire is an employee of Pfizer, who funded the studies.
EXPERT ANALYSIS FROM ESPID 2019
Novel enfortumab vedotin induces responses in advanced urothelial cancers
CHICAGO – Patients with advanced urothelial cancer that has progressed following platinum-based chemotherapy and immunotherapy with checkpoint inhibitors have a poor prognosis and few effective therapeutic options.
But in a phase 2 trial in 125 patients with locally advanced or metastatic urothelial cancer, the investigational agent enfortumab vedotin was associated with a 44% objective response rate, including a 12% complete response rate and 32% partial response rate. The responses were observed across all subgroups, irrespective of response to prior immunotherapy or the presence of liver metastases, reported Daniel Petrylak, MD, a professor of medical oncology and urology at Yale Cancer Center in New Haven, Connecticut.
In a video interview at the annual meeting of the American Society of Clinical Oncology, Dr. Petrylak described how the agent is directed toward a novel target, Nectin-4, a protein expressed in about 97% of urothelial cancers and in other solid tumor types.
The study is sponsored by Seattle Genetics and Astellas Pharma. Dr. Petrylak disclosed a consulting or advisory role with Astellas and others, funding from Seattle Genetics, and financial relationships with multiple other companies.
REPORTING FROM ASCO 2019
Use and Effectiveness of the Teach-Back Method in Patient Education and Health Outcomes
Studies have shown that a majority of patients remain confused about their health care plans after being discharged from the hospital.1,2 Furthermore, most patients do not recognize their lack of comprehension.2 A substantial proportion of medical information is forgotten immediately after discharge. Kessels found that when larger amounts of information were presented, less was recalled, and almost half of the recalled information was incorrect.3 Researchers also have found that health information that was focused on individual needs not only increased patients’ understanding of their health needs and improved their health literacy, but supported self-management and promoted health outcomes for adults with chronic illness.4,5
Health literacy is the “capacity to obtain, process, and understand basic health information and services needed to make appropriate health decisions.”6 To read instructions on a prescription bottle, patients need an intermediate level of health literacy. Even for patients with such a level of health literacy, comprehending and managing a health care plan for a chronic disease can be challenging. About 35% of Americans had lower than an intermediate level of health literacy.7 Insufficient health literacy is associated with increased health system use and costs, health disparities, and poor health outcomes.8 As a result, it is crucial to gear oral instructions to patients’ health literacy levels to ensure that patients understand health information and instructions and perform self-care at home. The teach-back method, a technique for verifying patients’ understanding of their health information, has been recommended by the Agency for Healthcare Research and Quality (AHRQ) and the Institute for Healthcare Improvement (IHI) as a strategy for taking universal precautions for health literacy. Patients are asked to repeat the instructions they receive from their health care professionals (HCPs). HCPs should use caring and plain language in a shame-free environment during patient education. By using the teach-back method, HCPs can assess patients’ understanding, and reteach or modify teaching if comprehension is not demonstrated. Patients have an important role in their health and their ability to understand health information has a significant impact on their health behavior and outcomes.
In our systematic research, we examined the effectiveness of using the teach-back method to understand health education as well as the impact of this method on patients’ disease self-management and health outcomes.
Methods
In the teach-back method, patients explain health information in their own words.9 To gauge the use and effectiveness of this method, investigators have studied patient perceptions and acknowledgments of the method as well as the effects of the method on health interventions. According to Dorothea Orem’s self-care deficit nursing theory, disease self-management is an “executive ability” to “control, handle, direct or govern” self-care activities.10 We define disease self-management as disease knowledge and disease management changes that promote self-care activities. In addition, we define health outcomes as health changes that result from the teach-back method, such as changes in postdischarge readmission rates, patient satisfaction, and health behavior.
Inclusion Criteria
We systematically reviewed evidence regarding the teach-back method as an educational intervention for patients aged ≥ 18 years. We included articles if they reported the process and outcomes of using the method alone or in combination with other educational strategies. The literature search focused on English-language articles published in peer-reviewed journals. Included in the review were qualitative, randomized controlled trials (RCTs); quasi-experimental studies; cohort studies; and pretest–posttest studies on the effects of the teach-back method. As the method can be applied in any health care setting, we used studies conducted in a variety of settings, including primary care, inpatient, outpatient, emergency department (ED), and community, in any time frame. Study participants had heart failure, diabetes mellitus (DM), hypertension, asthma, or other chronic diseases.
Exclusion Criteria
Studies that used the teach-back method as an outcome measurement but not an intervention were excluded. For example, those that used the method to measure patients’ postintervention understanding were excluded. Also excluded were those that used the method to examine HCP training or to measure HCP outcomes (ie, studies that did not use the method for patient education or outcomes).
Literature Search
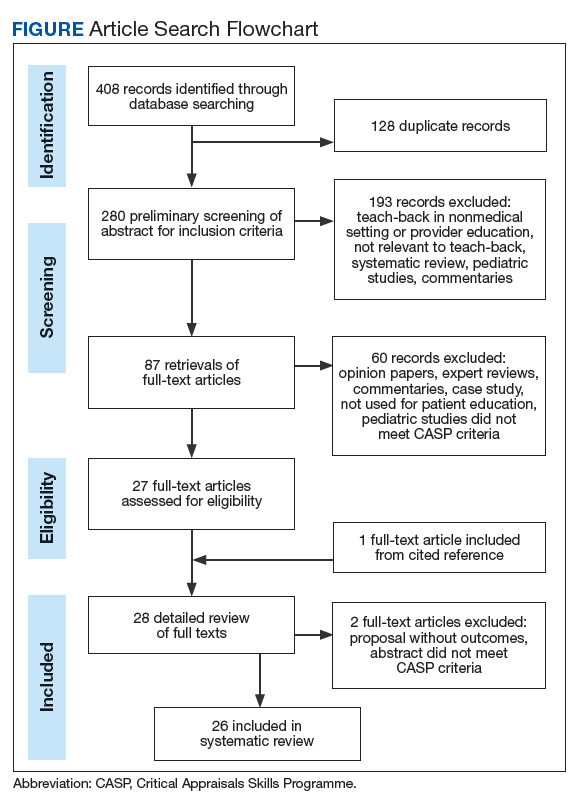
In September 2017, we searched 4 databases: Ovid Medline, PubMed, EBSCO (Elton B. Stephens Co), CINAHL (Cumulative Index to Nursing and Allied Health Literature), and ProQuest. Also included were relevant studies from cited reference searching (Figure).
This systematic review followed the PRISMA (Preferred Reporting Items for Systematic Reviews and Meta-Analyses) guideline for searches and formatting results. The literature search was performed with the term teach-back and terms from the structured PICO (population, intervention, comparison, outcomes) statement. The study population consisted of patients who received the teach-back intervention as part of the patient education process in a medical care setting, and the comparator population consisted of patients who did not receive the intervention in their patient education. Target outcomes were disease self-management, self-care, patient satisfaction, patient perception and acknowledgment of the teach-back method, and other health outcomes.
Data Collection
Data collected included authors, publication date, and journal; purpose; study design; setting, sample, and population; intervention; and outcomes.
The methodologic quality of papers retrieved for review was determined with Critical Appraisals Skills Programme (CASP) guidelines (casp-uk.net/casp-tools-checklists). CASP randomised controlled trial, cohort study, case control study, and qualitative checklists were used. The authors assessed the full texts for eligibility. Disagreements were resolved through discussion.
The initial literature search found 112, 135, and 161 articles from EBSCO CINAHL, Ovid Medline, and PubMed, respectively. Five articles from ProQuest were identified through the EBSCO CINAHL search. After inclusion and exclusion criteria were applied, duplicate articles removed, a cited reference added, and CASP criteria assessed, 26 articles remained in the review. The 26 studies consisted of 15 cohort studies, 5 case–control studies, 5 RCTs, and 1 qualitative interview. Twenty-two of the articles were published in the US, the other 4 in Australia and Iran (2 each).11-14 All 26 studies used the teach-back method with other educational interventions to reinforce learning (eg, the method was used after heart failure or DM education). Of the 26 studies, 10 used a pretest–posttest intervention design,15-24 and 10 used a quasi-experimental or experimental design.11,13,14,25-31
Results
The common outcome measures used in the 26 studies fall into 5 categories: patient satisfaction; postdischarge readmission; patient perception of teach-back method effectiveness; disease knowledge and disease management improvements; and intervention effects on health-related quality of life (HR-QOL). A summary of included articles, study setting, design, outcomes, and details is available from the author.
Patient Satisfaction
Ten studies examined the impact of the teach-back method on patient satisfaction.15,17,19,21,23,26,27,29,31,32 Of these 10 studies, 6 explored the influence of the method on Hospital Consumer Assessment of Healthcare Providers and Systems survey scores.15,17,19,21,22,26 All included studies indicated improved satisfaction with medication education, discharge information, and health management—except for the Silva study, who found an upward trend but not a statistically significant improvement in patient understanding of the purpose of a medication.23
Grice and colleagues also found that community-dwelling seniors expressed satisfaction with using the teach-back method while being evaluated and assessed for health services at home.32 Improvement or a positive trend in teach-back groups was reported in a majority of the studies except for those by Hyrkas and Wiggins, and Griffey and colleagues.27,29 Hyrkas and Wiggins found the method slightly improved patients’ medication confidence after hospital discharge, though patient satisfaction scores were associated with patient–nurse relationships, not with use of the teach-back method and a motivational interview.27 Similarly, Griffey and colleagues found that patients who had limited health literacy and received a standard discharge with teach-back scored higher on medication comprehension, compared with patients who received only a standard discharge, but there was no difference in patient satisfaction after an ED visit.29
Postdischarge Readmission
Results emphasized the importance of teach-back in reinforcing discharge instructions and improving postdischarge readmission rates. Of the 6 studies on the effect that teach-back with discharge summary had on readmission rates, 2 found statistically significant improvement for patients with heart failure at 12 months (teach-back, 59%; non-teach-back, 44%; P = .005) and patients with coronary artery bypass grafting (CABG) at 30 days (preintervention, 25%; postintervention, 12%; P = .02).11,16 In addition, 3 of the 6 studies reported improvement but did not provide P values.18,20,22 One study indicated improvement in other measured outcomes but found no significant difference for patients who received teach-back with their discharge summaries.27 In all studies, teach-back was added to an intervention and used to confirm and promote knowledge and self-care management.
Patient Perception of Teach-Back Effectiveness
In 2 qualitative studies, patients indicated teach-back was an effective educational method.16,33 For patients with CABG, Bates and colleagues added a scheduled cardiology follow-up appointment and teach-back patient education to their State Action on Avoidable Rehospitalizations interventions; 96% of participants rated teach-back effective or highly effective.16 In the other study, Samuels-Kalow and colleagues interviewed 51 patients and parents who received teach-back as part of the discharge process in 2 EDs; participants indicated teach-back helped them remember what they learned from their HCPs, and gave them the opportunity to connect with their HCPs, though some with lower health literacy expressed concerns about perceived judgment by HCPs.33
Disease Knowledge and Management
Thirteen studies examined knowledge improvement after interventions that included teach-back. Study participants answered most questions correctly after receiving teach-back.20,32,34,35 Slater and colleagues found ED patients who received discharge instructions with teach-back had significantly higher scores measuring knowledge of diagnosis (P < .001), signs and symptoms indicating a need to return to the ED (P < .001), and follow-up instructions (P = .03); scores measuring knowledge of medication were higher as well, but were not statistically different (P = .14).24 In multiple studies, improvement was not always statistically significant in terms of knowledge retention.12,25,29-31,36 Studies that compared medication adherence found teach-back was more effective than motivational interviews (P = .56).27
Teach-back has been widely used in primary care, inpatient, and ED settings. Two studies on the effect of teach-back in primary care sampled patients with DM.28,36 Kandula and colleagues found that participants who answered questions incorrectly after watching a multimedia DM education program could significantly improve their DM knowledge by engaging in teach-back immediately after the intervention; however, knowledge retention was not improved at 2-week follow-up (phone call).28 In contrast, Swavely and colleagues compared patients who completed a 13-hour DM education program with or without teach-back and found that teach-back patients demonstrated significantly improved DM knowledge and self-care activities at 3 months.36
Effects of Interventions on HR-QOL
The teach-back method had been used with QOL improvement programs and other interventions. Ahmadidarrehsima and colleagues incorporated teach-back into their medical self-management program (8 to 11 sessions, each lasting 1.5 to 2 hours) for women with breast cancer and found that the mean happiness score increased to 62.9 from 37.2 (P < .001) in the intervention group, whereas the score for the usual-care group decreased from 41.4 to 29.8.13 Ghiasvand and colleagues compared QOL of postpartum mothers who received routine care with QOL of those who received routine care plus 2 sessions of postpartum self-care with teach-back; mean QOL scores were significantly (P < .001) higher for the teach-back group (124.73) than for the no teach-back group (115.03).14
Discussion
This review examined the use and effectiveness of the teach-back method in health education and its influence in patients’ disease self-management and health outcomes. Results showed positive effects of teach-back on patient satisfaction, patient perceptions and acknowledgments, postdischarge readmissions, disease self-management and knowledge, and HR-QOL.
The teach-back method has been widely used in inpatient, outpatient, ED, and community settings as part of health education programs and interventions. It has been paired with educational interventions ranging from short instructions to 20-hour programs. These differences reflect the broad application of the method in patient education. Many studies have found that teach-back improves disease knowledge and self-management, though their results are not always statistically significant. In an RCT of patients with low health literacy, Griffey and colleagues studied the effect of ED discharge education with and without teach-back and found teach-back did not increase post-ED comprehension of diagnoses, medical examinations, and treatments or perceived comprehension of treatment and care; however, compared with the no teach-back group, the teach-back group had significantly higher scores on comprehension of post-ED self-care (P < .02), follow-up (P < .0001), and medication (P = .054).29 This finding indicates teach-back is an effective method for helping patients understand self-care and disease self-management at home.
Comprehending medical diagnoses, examinations, and treatments involves acquiring, analyzing, and comparing multiple pieces of health information. Because comprehension requires a level of abstract thinking usually present in patients with intermediate and proficient health literacy,improvements might be more difficult to see in patients with low health literacy.8 Press and colleagues found that asthma patients who repeated respiratory inhaler instructions with teach-back during discharge education had less misuse of (P = .01) metered-dose and Diskus (P = .05) inhalers and lower 30-day readmission rates (P = .02) compared with the misuse of patients who received only 1 set of oral and written instructions.31 Even though the Diskus result was not statistically significant, it demonstrated teach-back can be used to improve patient self-care and education.31
Most participants in the reviewed studies improved their disease knowledge with teach-back, though the evidence regarding improved health care knowledge retention was limited. For example, the 2 studies on use of teach-back in primary care clinics had contradictory knowledge retention results.28,36 As both studies incorporated teach-back into existing interventions, these results could be associated with those interventions and not with the teach-back method.
Health literacy is achieved through a complicated process of obtaining, analyzing, choosing, and communicating health information. Even though its knowledge retention results are inconsistent, the teach-back method is recommended by the American Academy of Family Physicians at strength of recommendation taxonomy level C.8 Such a designation indicates that the recommendation is based on expert opinion, bench research, consensus guideline, usual practice, clinical experience, or a case series and is appropriate for assessment of patient comprehension.37 Teach-back is also suggested by AHRQ and IHI for university precautions regarding health literacy and as such should remain a standard of practice. More study is needed to understand the inconsistent results of knowledge retention and the long-term effects of the teach-back method.
Limitations
Although this review did not limit the publication years of its articles, no pre-2011 articles were found. The teach-back method has been used to measure patients’ postintervention understanding and to educate HCPs on ways to improve patient communication. As this review did not include studies of teach-back as an outcome measurement or studies of training and adaptation of teach-back in HCP or nurse education, other study results may have a bearing on the current findings. Teach-back has been used to close communication gaps between patients and HCPs.
All articles included in this review used the teach-back method with other educational or organizational interventions. The outcomes found in this review may be associated with those interventions and not with teach-back itself. Data reported here have not demonstrated a definite association between teach-back and the measured outcomes; therefore, caution should be exercised when drawing conclusions based on these data. In addition, most of the studies considered in this review were cohort or case–control studies; only 5 RCTs were included. Other confounding factors, including patient health literacy levels, HCP types, HCP competencies in use of teach-back, and type and duration of interventions used before teach-back, may have contributed to this review’s findings.
Conclusion
Findings of this systematic review support use of the teach-back method as effective in reinforcing or confirming patient education. As none of the included studies reported harmful outcomes, the teach-back method poses little risk with respect to increasing patients’ understanding of their education. The findings emphasize the importance of conducting more studies to try to understand the inconsistent results of knowledge retention and determine ways to preserve the long-term effects of teach-back.
1. Zavala S, Shaffer C. Do patients understand discharge instruction? J Emerg Nurs. 2011;37(2):138-140.
2. Engel KG, Heisler M, Smith DM, Robinson CH, Forman JH, Ubel PA. Patient comprehension of emergency department care and instructions: are patients aware of when they do not understand? Ann Emerg Med. 2009;53(4):454-461.
3. Kessels RP. Patients’ memory for medical information. J R Soc Med. 2003;96(5):219-222.
4. Coulter A. Patient engagement—what works? J Ambul Care Manage. 2012;35(2):80-89.
5. Rees S, Williams A. Promoting and supporting self-management for adults living in the community with physical chronic illness: a systematic review of the effectiveness and meaningfulness of the patient–practitioner encounter. JBI Libr Syst Rev. 2009;7(13):492-582.
6. Somers SA, Mahadevan R. Health Literacy Implications of the Affordable Care Act. https://www.chcs.org/media/Health_Literacy_Implications_of_the_Affordable_Care_Act.pdf. Published November 2010. Accessed May 9, 2019.
7. US Department of Health and Human Services, Office of Disease Prevention and Health Promotion. America’s Health Literacy: Why We Need Accessible Health Information [issue brief]. https://health.gov/communication/literacy/issuebrief. Published 2008. Accessed May 9, 2019.
8. Hersh L, Salzman B, Snyderman D. Health literacy in primary care practice. Am Fam Physician. 2015;92(2):118-124.
9. Always Use Teach-back! [training toolkit]. http://www.teachbacktraining.org. Accessed May 9, 2019.
10. Taylor SG, Renpenning K. Self-Care Science, Nursing Theory and Evidence Based Practice. New York, NY: Springer; 2011.
11. Boyde M, Peters R, New N, Hwang R, Ha T, Korczyk D. Self-care educational intervention to reduce hospitalisations in heart failure: a randomised controlled trial. Eur J Cardiovasc Nurs. 2018;17(2):178-185.
12. Goeman D, Conway S, Norman R, et al. Optimising health literacy and access of service provision to community dwelling older people with diabetes receiving home nursing support. J Diabetes Res. 2016;2016:2483263.
13. Ahmadidarrehsima S, Rahnama M, Afshari M, Asadi Bidmeshki E. Effectiveness of teach-back self-management training program on happiness of breast cancer patients. Asian Pac J Cancer Prev. 2016;17(10):4555-4561.
14. Ghiasvand F, Riazi H, Hajian S, Kazemi E, Firoozi A. The effect of a self-care program based on the teach back method on the postpartum quality of life. Electron Physician. 2017;9(4):4180-4189.
15. Ahrens SL, Wirges AM. Using evidence to improve satisfaction with medication side-effects education on a neuro-medical surgical unit. J Neurosci Nurs. 2013;45(5):281-287.
16. Bates OL, O’Connor N, Dunn D, Hasenau SM. Applying STAAR interventions in incremental bundles: improving post-CABG surgical patient care. Worldviews Evid Based Nurs. 2014;11(2):89-97.
17. Gillam SW, Gillam AR, Casler TL, Curcio K. Education for medications and side effects: a two part mechanism for improving the patient experience. Appl Nurs Res. 2016;31:72-78.
18. Green UR, Dearmon V, Taggart H. Improving transition of care for veterans after total joint replacement. Orthop Nurs. 2015;34(2):79-86.
19. Kelly AM, Putney L. Teach back technique improves patient satisfaction in heart failure patients. Heart Lung. 2015;44(6):556-557.
20. Peter D, Robinson P, Jordan M, Lawrence S, Casey K, Salas-Lopez D. Reducing readmissions using teach-back: enhancing patient and family education. J Nurs Adm. 2015;45(1):35-42.
21. Price KA. Teach-Back Effect on Self-Reported Understanding of Health Management After Discharge. Minneapolis, MN: Walden University; 2014.
22. LeBreton M. Implementation of a Validated Health Literacy Tool With Teach-Back Education in a Super Utilizer Patient Population. Chester, PA: Widener University; 2015.
23. Silva LA. Teach-Back Effects on Self-Reported Understanding of Medication Management After Discharge. Minneapolis, MN: Walden University; 2014.
24. Slater BA, Huang Y, Dalawari P. The impact of teach-back method on retention of key domains of emergency department discharge instructions. J Emerg Med. 2017;53(5):e59-e65.
25. Betts V. Implementing a Discharge Process Change Using the Teach-Back Method for COPD Patients. Jersey City, NJ: Saint Peter’s University; 2014.
26. Centrella-Nigro AM, Alexander C. Using the teach-back method in patient education to improve patient satisfaction. J Contin Educ Nurs. 2017;48(1):47-52.
27. Hyrkas K, Wiggins M. A comparison of usual care, a patient-centred education intervention and motivational interviewing to improve medication adherence and readmissions of adults in an acute-care setting. J Nurs Manag. 2014;22(3):350-361.
28. Kandula NR, Malli T, Zei CP, Larsen E, Baker DW. Literacy and retention of information after a multimedia diabetes education program and teach-back. J Health Commun. 2011;16(suppl 3):89-102.
29. Griffey RT, Shin N, Jones S, et al. The impact of teach-back on comprehension of discharge instructions and satisfaction among emergency patients with limited health literacy: a randomized, controlled study. J Commun Healthc. 2015;8(1):10-21.
30. Negarandeh R, Mahmoodi H, Noktehdan H, Heshmat R, Shakibazadeh E. Teach back and pictorial image educational strategies on knowledge about diabetes and medication/dietary adherence among low health literate patients with type 2 diabetes. Prim Care Diabetes. 2013;7(2):111-118.
31. Press VG, Arora VM, Shah LM, et al. Teaching the use of respiratory inhalers to hospitalized patients with asthma or COPD: a randomized trial. J Gen Intern Med. 2012;27(10):1317-1325.
32. White M, Garbez R, Carroll M, Brinker E, Howie-Esquivel J. Is “teach-back” associated with knowledge retention and hospital readmission in hospitalized heart failure patients? J Cardiovasc Nurs. 2013;28(2):137-146.
33. Grice GR, Tiemeier A, Hurd P, et al. Student use of health literacy tools to improve patient understanding and medication adherence. Consult Pharm. 2014;29(4):240-253.
34. Samuels-Kalow M, Hardy E, Rhodes K, Mollen C. “Like a dialogue”: Teach-back in the emergency department. Patient Educ Couns. 2016;99(4):549-554.
35. Wilson FL, Mayeta-Peart A, Parada-Webster L, Nordstrom C. Using the teach-back method to increase maternal immunization literacy among low-income pregnant women in Jamaica: a pilot study. J Pediatr Nurs. 2012;27(5):451-459.
36. Swavely D, Vorderstrasse A, Maldonado E, Eid S, Etchason J. Implementation and evaluation of a low health literacy and culturally sensitive diabetes education program. J Healthc Qual. 2014;36(6):16-23.
37. Ebell MH, Siwek J, Weiss BD, et al. Strength of recommendation taxonomy (SORT): a patient-centered approach to grading evidence in the medical literature. Am Fam Physician. 2004;69(3):548-556.
Studies have shown that a majority of patients remain confused about their health care plans after being discharged from the hospital.1,2 Furthermore, most patients do not recognize their lack of comprehension.2 A substantial proportion of medical information is forgotten immediately after discharge. Kessels found that when larger amounts of information were presented, less was recalled, and almost half of the recalled information was incorrect.3 Researchers also have found that health information that was focused on individual needs not only increased patients’ understanding of their health needs and improved their health literacy, but supported self-management and promoted health outcomes for adults with chronic illness.4,5
Health literacy is the “capacity to obtain, process, and understand basic health information and services needed to make appropriate health decisions.”6 To read instructions on a prescription bottle, patients need an intermediate level of health literacy. Even for patients with such a level of health literacy, comprehending and managing a health care plan for a chronic disease can be challenging. About 35% of Americans had lower than an intermediate level of health literacy.7 Insufficient health literacy is associated with increased health system use and costs, health disparities, and poor health outcomes.8 As a result, it is crucial to gear oral instructions to patients’ health literacy levels to ensure that patients understand health information and instructions and perform self-care at home. The teach-back method, a technique for verifying patients’ understanding of their health information, has been recommended by the Agency for Healthcare Research and Quality (AHRQ) and the Institute for Healthcare Improvement (IHI) as a strategy for taking universal precautions for health literacy. Patients are asked to repeat the instructions they receive from their health care professionals (HCPs). HCPs should use caring and plain language in a shame-free environment during patient education. By using the teach-back method, HCPs can assess patients’ understanding, and reteach or modify teaching if comprehension is not demonstrated. Patients have an important role in their health and their ability to understand health information has a significant impact on their health behavior and outcomes.
In our systematic research, we examined the effectiveness of using the teach-back method to understand health education as well as the impact of this method on patients’ disease self-management and health outcomes.
Methods
In the teach-back method, patients explain health information in their own words.9 To gauge the use and effectiveness of this method, investigators have studied patient perceptions and acknowledgments of the method as well as the effects of the method on health interventions. According to Dorothea Orem’s self-care deficit nursing theory, disease self-management is an “executive ability” to “control, handle, direct or govern” self-care activities.10 We define disease self-management as disease knowledge and disease management changes that promote self-care activities. In addition, we define health outcomes as health changes that result from the teach-back method, such as changes in postdischarge readmission rates, patient satisfaction, and health behavior.
Inclusion Criteria
We systematically reviewed evidence regarding the teach-back method as an educational intervention for patients aged ≥ 18 years. We included articles if they reported the process and outcomes of using the method alone or in combination with other educational strategies. The literature search focused on English-language articles published in peer-reviewed journals. Included in the review were qualitative, randomized controlled trials (RCTs); quasi-experimental studies; cohort studies; and pretest–posttest studies on the effects of the teach-back method. As the method can be applied in any health care setting, we used studies conducted in a variety of settings, including primary care, inpatient, outpatient, emergency department (ED), and community, in any time frame. Study participants had heart failure, diabetes mellitus (DM), hypertension, asthma, or other chronic diseases.
Exclusion Criteria
Studies that used the teach-back method as an outcome measurement but not an intervention were excluded. For example, those that used the method to measure patients’ postintervention understanding were excluded. Also excluded were those that used the method to examine HCP training or to measure HCP outcomes (ie, studies that did not use the method for patient education or outcomes).
Literature Search
In September 2017, we searched 4 databases: Ovid Medline, PubMed, EBSCO (Elton B. Stephens Co), CINAHL (Cumulative Index to Nursing and Allied Health Literature), and ProQuest. Also included were relevant studies from cited reference searching (Figure).
This systematic review followed the PRISMA (Preferred Reporting Items for Systematic Reviews and Meta-Analyses) guideline for searches and formatting results. The literature search was performed with the term teach-back and terms from the structured PICO (population, intervention, comparison, outcomes) statement. The study population consisted of patients who received the teach-back intervention as part of the patient education process in a medical care setting, and the comparator population consisted of patients who did not receive the intervention in their patient education. Target outcomes were disease self-management, self-care, patient satisfaction, patient perception and acknowledgment of the teach-back method, and other health outcomes.
Data Collection
Data collected included authors, publication date, and journal; purpose; study design; setting, sample, and population; intervention; and outcomes.
The methodologic quality of papers retrieved for review was determined with Critical Appraisals Skills Programme (CASP) guidelines (casp-uk.net/casp-tools-checklists). CASP randomised controlled trial, cohort study, case control study, and qualitative checklists were used. The authors assessed the full texts for eligibility. Disagreements were resolved through discussion.
The initial literature search found 112, 135, and 161 articles from EBSCO CINAHL, Ovid Medline, and PubMed, respectively. Five articles from ProQuest were identified through the EBSCO CINAHL search. After inclusion and exclusion criteria were applied, duplicate articles removed, a cited reference added, and CASP criteria assessed, 26 articles remained in the review. The 26 studies consisted of 15 cohort studies, 5 case–control studies, 5 RCTs, and 1 qualitative interview. Twenty-two of the articles were published in the US, the other 4 in Australia and Iran (2 each).11-14 All 26 studies used the teach-back method with other educational interventions to reinforce learning (eg, the method was used after heart failure or DM education). Of the 26 studies, 10 used a pretest–posttest intervention design,15-24 and 10 used a quasi-experimental or experimental design.11,13,14,25-31
Results
The common outcome measures used in the 26 studies fall into 5 categories: patient satisfaction; postdischarge readmission; patient perception of teach-back method effectiveness; disease knowledge and disease management improvements; and intervention effects on health-related quality of life (HR-QOL). A summary of included articles, study setting, design, outcomes, and details is available from the author.
Patient Satisfaction
Ten studies examined the impact of the teach-back method on patient satisfaction.15,17,19,21,23,26,27,29,31,32 Of these 10 studies, 6 explored the influence of the method on Hospital Consumer Assessment of Healthcare Providers and Systems survey scores.15,17,19,21,22,26 All included studies indicated improved satisfaction with medication education, discharge information, and health management—except for the Silva study, who found an upward trend but not a statistically significant improvement in patient understanding of the purpose of a medication.23
Grice and colleagues also found that community-dwelling seniors expressed satisfaction with using the teach-back method while being evaluated and assessed for health services at home.32 Improvement or a positive trend in teach-back groups was reported in a majority of the studies except for those by Hyrkas and Wiggins, and Griffey and colleagues.27,29 Hyrkas and Wiggins found the method slightly improved patients’ medication confidence after hospital discharge, though patient satisfaction scores were associated with patient–nurse relationships, not with use of the teach-back method and a motivational interview.27 Similarly, Griffey and colleagues found that patients who had limited health literacy and received a standard discharge with teach-back scored higher on medication comprehension, compared with patients who received only a standard discharge, but there was no difference in patient satisfaction after an ED visit.29
Postdischarge Readmission
Results emphasized the importance of teach-back in reinforcing discharge instructions and improving postdischarge readmission rates. Of the 6 studies on the effect that teach-back with discharge summary had on readmission rates, 2 found statistically significant improvement for patients with heart failure at 12 months (teach-back, 59%; non-teach-back, 44%; P = .005) and patients with coronary artery bypass grafting (CABG) at 30 days (preintervention, 25%; postintervention, 12%; P = .02).11,16 In addition, 3 of the 6 studies reported improvement but did not provide P values.18,20,22 One study indicated improvement in other measured outcomes but found no significant difference for patients who received teach-back with their discharge summaries.27 In all studies, teach-back was added to an intervention and used to confirm and promote knowledge and self-care management.
Patient Perception of Teach-Back Effectiveness
In 2 qualitative studies, patients indicated teach-back was an effective educational method.16,33 For patients with CABG, Bates and colleagues added a scheduled cardiology follow-up appointment and teach-back patient education to their State Action on Avoidable Rehospitalizations interventions; 96% of participants rated teach-back effective or highly effective.16 In the other study, Samuels-Kalow and colleagues interviewed 51 patients and parents who received teach-back as part of the discharge process in 2 EDs; participants indicated teach-back helped them remember what they learned from their HCPs, and gave them the opportunity to connect with their HCPs, though some with lower health literacy expressed concerns about perceived judgment by HCPs.33
Disease Knowledge and Management
Thirteen studies examined knowledge improvement after interventions that included teach-back. Study participants answered most questions correctly after receiving teach-back.20,32,34,35 Slater and colleagues found ED patients who received discharge instructions with teach-back had significantly higher scores measuring knowledge of diagnosis (P < .001), signs and symptoms indicating a need to return to the ED (P < .001), and follow-up instructions (P = .03); scores measuring knowledge of medication were higher as well, but were not statistically different (P = .14).24 In multiple studies, improvement was not always statistically significant in terms of knowledge retention.12,25,29-31,36 Studies that compared medication adherence found teach-back was more effective than motivational interviews (P = .56).27
Teach-back has been widely used in primary care, inpatient, and ED settings. Two studies on the effect of teach-back in primary care sampled patients with DM.28,36 Kandula and colleagues found that participants who answered questions incorrectly after watching a multimedia DM education program could significantly improve their DM knowledge by engaging in teach-back immediately after the intervention; however, knowledge retention was not improved at 2-week follow-up (phone call).28 In contrast, Swavely and colleagues compared patients who completed a 13-hour DM education program with or without teach-back and found that teach-back patients demonstrated significantly improved DM knowledge and self-care activities at 3 months.36
Effects of Interventions on HR-QOL
The teach-back method had been used with QOL improvement programs and other interventions. Ahmadidarrehsima and colleagues incorporated teach-back into their medical self-management program (8 to 11 sessions, each lasting 1.5 to 2 hours) for women with breast cancer and found that the mean happiness score increased to 62.9 from 37.2 (P < .001) in the intervention group, whereas the score for the usual-care group decreased from 41.4 to 29.8.13 Ghiasvand and colleagues compared QOL of postpartum mothers who received routine care with QOL of those who received routine care plus 2 sessions of postpartum self-care with teach-back; mean QOL scores were significantly (P < .001) higher for the teach-back group (124.73) than for the no teach-back group (115.03).14
Discussion
This review examined the use and effectiveness of the teach-back method in health education and its influence in patients’ disease self-management and health outcomes. Results showed positive effects of teach-back on patient satisfaction, patient perceptions and acknowledgments, postdischarge readmissions, disease self-management and knowledge, and HR-QOL.
The teach-back method has been widely used in inpatient, outpatient, ED, and community settings as part of health education programs and interventions. It has been paired with educational interventions ranging from short instructions to 20-hour programs. These differences reflect the broad application of the method in patient education. Many studies have found that teach-back improves disease knowledge and self-management, though their results are not always statistically significant. In an RCT of patients with low health literacy, Griffey and colleagues studied the effect of ED discharge education with and without teach-back and found teach-back did not increase post-ED comprehension of diagnoses, medical examinations, and treatments or perceived comprehension of treatment and care; however, compared with the no teach-back group, the teach-back group had significantly higher scores on comprehension of post-ED self-care (P < .02), follow-up (P < .0001), and medication (P = .054).29 This finding indicates teach-back is an effective method for helping patients understand self-care and disease self-management at home.
Comprehending medical diagnoses, examinations, and treatments involves acquiring, analyzing, and comparing multiple pieces of health information. Because comprehension requires a level of abstract thinking usually present in patients with intermediate and proficient health literacy,improvements might be more difficult to see in patients with low health literacy.8 Press and colleagues found that asthma patients who repeated respiratory inhaler instructions with teach-back during discharge education had less misuse of (P = .01) metered-dose and Diskus (P = .05) inhalers and lower 30-day readmission rates (P = .02) compared with the misuse of patients who received only 1 set of oral and written instructions.31 Even though the Diskus result was not statistically significant, it demonstrated teach-back can be used to improve patient self-care and education.31
Most participants in the reviewed studies improved their disease knowledge with teach-back, though the evidence regarding improved health care knowledge retention was limited. For example, the 2 studies on use of teach-back in primary care clinics had contradictory knowledge retention results.28,36 As both studies incorporated teach-back into existing interventions, these results could be associated with those interventions and not with the teach-back method.
Health literacy is achieved through a complicated process of obtaining, analyzing, choosing, and communicating health information. Even though its knowledge retention results are inconsistent, the teach-back method is recommended by the American Academy of Family Physicians at strength of recommendation taxonomy level C.8 Such a designation indicates that the recommendation is based on expert opinion, bench research, consensus guideline, usual practice, clinical experience, or a case series and is appropriate for assessment of patient comprehension.37 Teach-back is also suggested by AHRQ and IHI for university precautions regarding health literacy and as such should remain a standard of practice. More study is needed to understand the inconsistent results of knowledge retention and the long-term effects of the teach-back method.
Limitations
Although this review did not limit the publication years of its articles, no pre-2011 articles were found. The teach-back method has been used to measure patients’ postintervention understanding and to educate HCPs on ways to improve patient communication. As this review did not include studies of teach-back as an outcome measurement or studies of training and adaptation of teach-back in HCP or nurse education, other study results may have a bearing on the current findings. Teach-back has been used to close communication gaps between patients and HCPs.
All articles included in this review used the teach-back method with other educational or organizational interventions. The outcomes found in this review may be associated with those interventions and not with teach-back itself. Data reported here have not demonstrated a definite association between teach-back and the measured outcomes; therefore, caution should be exercised when drawing conclusions based on these data. In addition, most of the studies considered in this review were cohort or case–control studies; only 5 RCTs were included. Other confounding factors, including patient health literacy levels, HCP types, HCP competencies in use of teach-back, and type and duration of interventions used before teach-back, may have contributed to this review’s findings.
Conclusion
Findings of this systematic review support use of the teach-back method as effective in reinforcing or confirming patient education. As none of the included studies reported harmful outcomes, the teach-back method poses little risk with respect to increasing patients’ understanding of their education. The findings emphasize the importance of conducting more studies to try to understand the inconsistent results of knowledge retention and determine ways to preserve the long-term effects of teach-back.
1. Zavala S, Shaffer C. Do patients understand discharge instruction? J Emerg Nurs. 2011;37(2):138-140.
2. Engel KG, Heisler M, Smith DM, Robinson CH, Forman JH, Ubel PA. Patient comprehension of emergency department care and instructions: are patients aware of when they do not understand? Ann Emerg Med. 2009;53(4):454-461.
3. Kessels RP. Patients’ memory for medical information. J R Soc Med. 2003;96(5):219-222.
4. Coulter A. Patient engagement—what works? J Ambul Care Manage. 2012;35(2):80-89.
5. Rees S, Williams A. Promoting and supporting self-management for adults living in the community with physical chronic illness: a systematic review of the effectiveness and meaningfulness of the patient–practitioner encounter. JBI Libr Syst Rev. 2009;7(13):492-582.
6. Somers SA, Mahadevan R. Health Literacy Implications of the Affordable Care Act. https://www.chcs.org/media/Health_Literacy_Implications_of_the_Affordable_Care_Act.pdf. Published November 2010. Accessed May 9, 2019.
7. US Department of Health and Human Services, Office of Disease Prevention and Health Promotion. America’s Health Literacy: Why We Need Accessible Health Information [issue brief]. https://health.gov/communication/literacy/issuebrief. Published 2008. Accessed May 9, 2019.
8. Hersh L, Salzman B, Snyderman D. Health literacy in primary care practice. Am Fam Physician. 2015;92(2):118-124.
9. Always Use Teach-back! [training toolkit]. http://www.teachbacktraining.org. Accessed May 9, 2019.
10. Taylor SG, Renpenning K. Self-Care Science, Nursing Theory and Evidence Based Practice. New York, NY: Springer; 2011.
11. Boyde M, Peters R, New N, Hwang R, Ha T, Korczyk D. Self-care educational intervention to reduce hospitalisations in heart failure: a randomised controlled trial. Eur J Cardiovasc Nurs. 2018;17(2):178-185.
12. Goeman D, Conway S, Norman R, et al. Optimising health literacy and access of service provision to community dwelling older people with diabetes receiving home nursing support. J Diabetes Res. 2016;2016:2483263.
13. Ahmadidarrehsima S, Rahnama M, Afshari M, Asadi Bidmeshki E. Effectiveness of teach-back self-management training program on happiness of breast cancer patients. Asian Pac J Cancer Prev. 2016;17(10):4555-4561.
14. Ghiasvand F, Riazi H, Hajian S, Kazemi E, Firoozi A. The effect of a self-care program based on the teach back method on the postpartum quality of life. Electron Physician. 2017;9(4):4180-4189.
15. Ahrens SL, Wirges AM. Using evidence to improve satisfaction with medication side-effects education on a neuro-medical surgical unit. J Neurosci Nurs. 2013;45(5):281-287.
16. Bates OL, O’Connor N, Dunn D, Hasenau SM. Applying STAAR interventions in incremental bundles: improving post-CABG surgical patient care. Worldviews Evid Based Nurs. 2014;11(2):89-97.
17. Gillam SW, Gillam AR, Casler TL, Curcio K. Education for medications and side effects: a two part mechanism for improving the patient experience. Appl Nurs Res. 2016;31:72-78.
18. Green UR, Dearmon V, Taggart H. Improving transition of care for veterans after total joint replacement. Orthop Nurs. 2015;34(2):79-86.
19. Kelly AM, Putney L. Teach back technique improves patient satisfaction in heart failure patients. Heart Lung. 2015;44(6):556-557.
20. Peter D, Robinson P, Jordan M, Lawrence S, Casey K, Salas-Lopez D. Reducing readmissions using teach-back: enhancing patient and family education. J Nurs Adm. 2015;45(1):35-42.
21. Price KA. Teach-Back Effect on Self-Reported Understanding of Health Management After Discharge. Minneapolis, MN: Walden University; 2014.
22. LeBreton M. Implementation of a Validated Health Literacy Tool With Teach-Back Education in a Super Utilizer Patient Population. Chester, PA: Widener University; 2015.
23. Silva LA. Teach-Back Effects on Self-Reported Understanding of Medication Management After Discharge. Minneapolis, MN: Walden University; 2014.
24. Slater BA, Huang Y, Dalawari P. The impact of teach-back method on retention of key domains of emergency department discharge instructions. J Emerg Med. 2017;53(5):e59-e65.
25. Betts V. Implementing a Discharge Process Change Using the Teach-Back Method for COPD Patients. Jersey City, NJ: Saint Peter’s University; 2014.
26. Centrella-Nigro AM, Alexander C. Using the teach-back method in patient education to improve patient satisfaction. J Contin Educ Nurs. 2017;48(1):47-52.
27. Hyrkas K, Wiggins M. A comparison of usual care, a patient-centred education intervention and motivational interviewing to improve medication adherence and readmissions of adults in an acute-care setting. J Nurs Manag. 2014;22(3):350-361.
28. Kandula NR, Malli T, Zei CP, Larsen E, Baker DW. Literacy and retention of information after a multimedia diabetes education program and teach-back. J Health Commun. 2011;16(suppl 3):89-102.
29. Griffey RT, Shin N, Jones S, et al. The impact of teach-back on comprehension of discharge instructions and satisfaction among emergency patients with limited health literacy: a randomized, controlled study. J Commun Healthc. 2015;8(1):10-21.
30. Negarandeh R, Mahmoodi H, Noktehdan H, Heshmat R, Shakibazadeh E. Teach back and pictorial image educational strategies on knowledge about diabetes and medication/dietary adherence among low health literate patients with type 2 diabetes. Prim Care Diabetes. 2013;7(2):111-118.
31. Press VG, Arora VM, Shah LM, et al. Teaching the use of respiratory inhalers to hospitalized patients with asthma or COPD: a randomized trial. J Gen Intern Med. 2012;27(10):1317-1325.
32. White M, Garbez R, Carroll M, Brinker E, Howie-Esquivel J. Is “teach-back” associated with knowledge retention and hospital readmission in hospitalized heart failure patients? J Cardiovasc Nurs. 2013;28(2):137-146.
33. Grice GR, Tiemeier A, Hurd P, et al. Student use of health literacy tools to improve patient understanding and medication adherence. Consult Pharm. 2014;29(4):240-253.
34. Samuels-Kalow M, Hardy E, Rhodes K, Mollen C. “Like a dialogue”: Teach-back in the emergency department. Patient Educ Couns. 2016;99(4):549-554.
35. Wilson FL, Mayeta-Peart A, Parada-Webster L, Nordstrom C. Using the teach-back method to increase maternal immunization literacy among low-income pregnant women in Jamaica: a pilot study. J Pediatr Nurs. 2012;27(5):451-459.
36. Swavely D, Vorderstrasse A, Maldonado E, Eid S, Etchason J. Implementation and evaluation of a low health literacy and culturally sensitive diabetes education program. J Healthc Qual. 2014;36(6):16-23.
37. Ebell MH, Siwek J, Weiss BD, et al. Strength of recommendation taxonomy (SORT): a patient-centered approach to grading evidence in the medical literature. Am Fam Physician. 2004;69(3):548-556.
Don’t Worry, It’s Just a Valve Problem
ANSWER
The correct interpretation includes normal sinus rhythm, possible left atrial enlargement (LAE), and left ventricular hypertrophy (LVH).
Normal sinus rhythm is defined as a P for every QRS and a QRS for every P, with a normal PR interval and a rate > 60 and < 100 beats/min.
Criteria for LAE include a P wave > 120 ms in lead II and/or a biphasic P wave in lead V1 with a downward deflection > 40 ms in length with a > 1-mm negative deflection. This ECG does not meet criteria for LAE; however, it is suspicious, particularly in the context of mitral regurgitation and LVH.
LVH is diagnosed using either the Sokolow-Lyon criteria (the sum of the S wave in V1 and the R wave in V5 or V6 ≥ 35 mm) or the Cornell voltage criteria (the S in V3 plus the R in aVL > 20 mm for women [> 28 mm for men]).
LVH is usually not a target of therapy. Management is typically directed at treating the underlying pathology. For this patient, it is important to manage her hypertension and provide follow-up—including periodic echocardiography of her left atrium, mitral valve, and left ventricle—to determine response to hypertensive therapy.

A 49-year-old woman establishes care at your clinic after moving to the area. When asked about previous health care provision, she reports being followed for a “valve problem” and high blood pressure—although she admits she hasn’t kept many of her scheduled appointments. Two past echocardiograms documented valvular heart disease, although she can’t remember which valve. She was told it was nothing to worry about but that she should have follow-up. She also says she’s been prescribed medication to help with her hypertension but in the past 6 months hasn’t taken any because she’s been “too busy” to get the script filled.
She denies a history of chest pain or dyspn
Medical history is remarkable for resection of 2 lipomas on her left arm and leg. She has had 2 uncomplicated pregnancies and 1 in which she had preeclampsia. All 3 deliveries were Cesarean. She is currently taking no medications and has no known drug allergies.
Family history is remarkable for hypothyroidism and type 2 diabetes (in her mother). When the patient was 4, her mother remarried, so she does not know her biological father’s health history. She has 2 sons and 1 daughter who are in good health.
Divorced for 7 years, the patient is not currently in a relationship. She is a project manager for a start-up software company where she works long, stressful hours and drinks “a lot” of coffee. She does not drink alcohol or smoke.
The review of systems is consistent with premenopausal symptoms including hot flashes, night sweats, and irregular menses. She has no gastrointestinal or urinary symptoms. She has had no recent weight loss or gain.
Vital signs include a blood pressure of 168/98 mm Hg; pulse, 80 beats/min; respiratory rate, 12 breaths/min-1; O2 saturation, 96% on room air; and temperature, 98.2°F. Her height is 64 in and her weight, 164 lb.
Physical exam reveals a pleasant, well-kept woman in no distress. She wears contact lenses and has no oropharyngeal lesions. Her teeth are capped with porcelain. There is no thyromegaly, jugular venous distention, or carotid bruits. The lungs are clear in all lung fields. The cardiac exam is remarkable for a regular rate and rhythm of 80 beats/min, with a mid-to-late systolic murmur best heard when the patient is in the left lateral decubitus position. She has no extra heart sounds or rubs.
The abdomen is soft and nontender, with a well-healed Pfannenstiel surgical scar. The extremities have full range of motion with no peripheral edema. She has a recent full-sleeve tattoo on her right arm, which is well healed with no erythema. The neurologic exam is grossly intact.
As part of her workup, you order an ECG. It reveals a ventricular rate of 79 beats/min; PR interval, 184 ms; QRS duration, 76 ms; QT/QTc interval, 382/438 ms; P axis, 48°; R axis, –29°; and T axis, 33°. What is your interpretation of this ECG?

Laparoscopic surgery survival outcomes on par with open approach in colorectal liver metastases
CHICAGO – For colorectal cancer patients with liver metastases, laparoscopic surgery has short-term advantages over open surgery, including fewer complications and better quality of life as compared to open surgery. Now, there are data to show that long-term outcomes with the laparoscopic approach aren’t any worse with the laparoscopic approach.
In a video interview at the annual meeting of the American Society of Clinical Oncology, Åsmund Avdem Fretland, MD, discusses results of the 280-patient randomized OSLO-COMET study, including 5-year survival of 56% for the laparoscopic approach, and similarly, 57% for the open procedure.
Based on lower morbidity, and now similar life expectancy, more centers should be doing laparoscopic procedures for liver metastases, said Dr. Fretland, a surgeon in the department of HPB surgery at Oslo University Hospital.
For now, however, open surgery appears to be the dominant approach. According to a recent survey, just 22% of U.S. patients with colorectal liver metastases have laparoscopic surgery.
More data could help. Dr. Fretland said in the interview that more randomized trials are underway aimed at evaluating the long-term outcomes of laparoscopic versus open procedures.
Dr. Fretland reported honoraria from Olympus Medical Systems.
REPORTING FROM ASCO 2019
Dupilumab for Treatment of Severe Atopic Dermatitis in a Heart Transplant Recipient
To the Editor:
Solid-organ transplant recipients can develop a range of dermatologic consequences due to chronic immunosuppression, including frequent skin infections and malignancies. Atopic dermatitis (AD) and psoriasis are relatively rare in this population because many immunosuppressive therapies, such as mycophenolate mofetil and tacrolimus, also are used to treat inflammatory dermatoses.1 In a large renal transplant population, the prevalence of AD was 1.3%.2 The pathogenesis of posttransplantation AD is poorly understood, and standard treatment regimens have not been defined. Dupilumab is a novel biologic medication that has demonstrated efficacy in the treatment of AD.3 Reports of dupilumab use for AD management in solid-organ transplant recipients are limited in the literature.
A 29-year-old woman with a history of a heart transplant 4 years prior presented to our dermatology clinic with an itchy rash over the entire body. Since the transplant, she had been on long-term immunosuppression with prednisone, mycophenolate mofetil, and tacrolimus. The rash appeared after she switched from brand-name to generic versions of the medications. Physical examination revealed erythematous scaly plaques on the lateral face, back, chest, arms, and legs covering approximately 10% of the body surface area. The patient’s total serum IgE level was elevated at 711,500 µg/L (reference range, 0–1500 µg/L). Outside biopsies revealed changes consistent with spongiotic dermatitis, and patch testing performed by an outside physician was positive for sensitivity to the preservative bronopol.
The patient was switched back to brand-name tacrolimus, but the rash did not improve. Topical steroids, phototherapy, and omalizumab were ineffective. The itching was primarily managed with desoximetasone spray, mometasone cream, and loratidine. With approval from the patient’s transplant team outside of our hospital system, she was started on dupilumab 300 mg once every 14 days. Complete clearance of the rash was noted within 3 months of treatment. Besides bilateral conjunctivitis, which was treated with ophthalmic prednisolone and moxifloxacin solutions, dupilumab was well tolerated. No issues related to immunosuppressant levels or graft-related issues, including rejection, were reported at 6-, 12-, and 18-month follow-up visits.
Atopic dermatitis is characterized by activation of type 2 immune responses, skin barrier defects, and increased Staphylococcus aureus colonization.4 A potential mechanism for the development of AD in transplant recipients relates to their use of tacrolimus for chronic immunosuppression. Tacrolimus increases intestinal permeability and therefore allows greater absorption of allergens. This influx of allergens promotes hypersensitivity reactions, resulting in elevated IgE levels and eosinophilia. Tacrolimus also facilitates predominance of helper T cells (TH2 cytokines) through selective inhibition of the TH1 cytokine IL-2.5
Dupilumab is a human monoclonal antibody that blocks IL-4 and IL-13, which are key drivers of TH2-mediated inflammation. In addition to downregulation of inflammatory mediators, dupilumab also increases production of epidermal barrier proteins, resulting in skin repair. It has demonstrated rapid, dose-dependent efficacy in patients with moderate to severe AD.6 Dupilumab boasts a good safety profile with no increase in risk for skin infections compared to placebo6; however, its safety has not yet been verified in transplant recipients.
Our case is notable for the severity of the patient’s AD despite considerable immunosuppression with transplant medications. Development of AD was associated with a switch from brand-name to generic drugs, which is not commonly reported. Her condition was refractory to a litany of treatments prior to a trial of dupilumab. The rapid clearance observed with this novel biologic medication highlights its potential to provide relief to patients who have particularly tenacious cases of AD. Prior to starting dupilumab, we do recommend more extensive laboratory testing in immunosuppressed patients including transplant recipients and patients with human immunodeficiency virus. We illustrate that a history of solid-organ transplant need not exclude patients from consideration for dupilumab therapy.
- Savoia P, Cavaliere G, Zavattaro E, et al. Inflammatory cutaneous diseases in renal transplant recipients [published online August 19, 2016]. Int J Mol Sci. doi:10.3390/ijms17081362.
- Lally A, Casabonne D, Imko-Walczuk B, et al. Prevalence of benign cutaneous disease among Oxford renal transplant recipients. J Eur Acad Dermatol Venereol. 2011;25:462-470.
- Beck L, Thaci D, Hamilton JD, et al. Dupilumab treatment in adults with moderate-to-severe atopic dermatitis. N Engl J Med. 2014;371:130-139.
- Simpson EL, Bieber T, Guttman-Yassky E, et al; SOLO 1 and SOLO 2 Investigators. Two phase 3 trials of dupilumab versus placebo in atopic dermatitis. N Engl J Med. 2016;375:2335-2348.
- Machura E, Chodór B, Kleszyk M, et al. Atopic allergy and chronic inflammation of the oral mucosa in a 3-year-old boy after heart transplantation—diagnostic and therapeutic difficulties. Kardiochir Torakochirurgia Pol. 2015;12:176-180.
- Beck L, Thaci D, Hamilton JD, et al. Dupilumab treatment in adults with moderate-to-severe atopic dermatitis. N Engl J Med. 2014;371:130-139.
To the Editor:
Solid-organ transplant recipients can develop a range of dermatologic consequences due to chronic immunosuppression, including frequent skin infections and malignancies. Atopic dermatitis (AD) and psoriasis are relatively rare in this population because many immunosuppressive therapies, such as mycophenolate mofetil and tacrolimus, also are used to treat inflammatory dermatoses.1 In a large renal transplant population, the prevalence of AD was 1.3%.2 The pathogenesis of posttransplantation AD is poorly understood, and standard treatment regimens have not been defined. Dupilumab is a novel biologic medication that has demonstrated efficacy in the treatment of AD.3 Reports of dupilumab use for AD management in solid-organ transplant recipients are limited in the literature.
A 29-year-old woman with a history of a heart transplant 4 years prior presented to our dermatology clinic with an itchy rash over the entire body. Since the transplant, she had been on long-term immunosuppression with prednisone, mycophenolate mofetil, and tacrolimus. The rash appeared after she switched from brand-name to generic versions of the medications. Physical examination revealed erythematous scaly plaques on the lateral face, back, chest, arms, and legs covering approximately 10% of the body surface area. The patient’s total serum IgE level was elevated at 711,500 µg/L (reference range, 0–1500 µg/L). Outside biopsies revealed changes consistent with spongiotic dermatitis, and patch testing performed by an outside physician was positive for sensitivity to the preservative bronopol.
The patient was switched back to brand-name tacrolimus, but the rash did not improve. Topical steroids, phototherapy, and omalizumab were ineffective. The itching was primarily managed with desoximetasone spray, mometasone cream, and loratidine. With approval from the patient’s transplant team outside of our hospital system, she was started on dupilumab 300 mg once every 14 days. Complete clearance of the rash was noted within 3 months of treatment. Besides bilateral conjunctivitis, which was treated with ophthalmic prednisolone and moxifloxacin solutions, dupilumab was well tolerated. No issues related to immunosuppressant levels or graft-related issues, including rejection, were reported at 6-, 12-, and 18-month follow-up visits.
Atopic dermatitis is characterized by activation of type 2 immune responses, skin barrier defects, and increased Staphylococcus aureus colonization.4 A potential mechanism for the development of AD in transplant recipients relates to their use of tacrolimus for chronic immunosuppression. Tacrolimus increases intestinal permeability and therefore allows greater absorption of allergens. This influx of allergens promotes hypersensitivity reactions, resulting in elevated IgE levels and eosinophilia. Tacrolimus also facilitates predominance of helper T cells (TH2 cytokines) through selective inhibition of the TH1 cytokine IL-2.5
Dupilumab is a human monoclonal antibody that blocks IL-4 and IL-13, which are key drivers of TH2-mediated inflammation. In addition to downregulation of inflammatory mediators, dupilumab also increases production of epidermal barrier proteins, resulting in skin repair. It has demonstrated rapid, dose-dependent efficacy in patients with moderate to severe AD.6 Dupilumab boasts a good safety profile with no increase in risk for skin infections compared to placebo6; however, its safety has not yet been verified in transplant recipients.
Our case is notable for the severity of the patient’s AD despite considerable immunosuppression with transplant medications. Development of AD was associated with a switch from brand-name to generic drugs, which is not commonly reported. Her condition was refractory to a litany of treatments prior to a trial of dupilumab. The rapid clearance observed with this novel biologic medication highlights its potential to provide relief to patients who have particularly tenacious cases of AD. Prior to starting dupilumab, we do recommend more extensive laboratory testing in immunosuppressed patients including transplant recipients and patients with human immunodeficiency virus. We illustrate that a history of solid-organ transplant need not exclude patients from consideration for dupilumab therapy.
- Savoia P, Cavaliere G, Zavattaro E, et al. Inflammatory cutaneous diseases in renal transplant recipients [published online August 19, 2016]. Int J Mol Sci. doi:10.3390/ijms17081362.
- Lally A, Casabonne D, Imko-Walczuk B, et al. Prevalence of benign cutaneous disease among Oxford renal transplant recipients. J Eur Acad Dermatol Venereol. 2011;25:462-470.
- Beck L, Thaci D, Hamilton JD, et al. Dupilumab treatment in adults with moderate-to-severe atopic dermatitis. N Engl J Med. 2014;371:130-139.
- Simpson EL, Bieber T, Guttman-Yassky E, et al; SOLO 1 and SOLO 2 Investigators. Two phase 3 trials of dupilumab versus placebo in atopic dermatitis. N Engl J Med. 2016;375:2335-2348.
- Machura E, Chodór B, Kleszyk M, et al. Atopic allergy and chronic inflammation of the oral mucosa in a 3-year-old boy after heart transplantation—diagnostic and therapeutic difficulties. Kardiochir Torakochirurgia Pol. 2015;12:176-180.
- Beck L, Thaci D, Hamilton JD, et al. Dupilumab treatment in adults with moderate-to-severe atopic dermatitis. N Engl J Med. 2014;371:130-139.
Practice Points
- Chronic tacrolimus use in solid-organ transplant recipients may increase intestinal permeability to allergens and is a potential cause for development of atopic dermatitis (AD).
- Dupilumab has the potential to provide relief from particularly tenacious cases of AD.
- History of solid-organ transplant should not be cause for exclusion from consideration for dupilumab therapy.
Coffee, tea, and soda all up GERD risk
SAN DIEGO – .
In an interview following the oral presentation, Raaj S. Mehta, MD, said that patients in his primary care panel at Massachusetts General Hospital, Boston, where he’s a senior resident, frequently came to him with GERD. In addition to questions about diet, patients frequently wanted to know which beverages might provoke or exacerbate their GERD.

In trying to help his patients, Dr. Mehta said he realized that there wasn’t a prospective evidence base to answer their questions about beverages and GERD, so he and his colleagues used data from the Nurses’ Health Study II (NHS II), a prospective cohort study, to look at the association between various beverages and the incidence of GERD.
“What’s exciting is that we were able to find that coffee, tea, and soda – all three – increase your risk for gastroesophageal reflux disease,” Dr. Mehta said in a video interview. “At the highest quintile level, so looking at people who consume six or more cups per day, you’re looking at maybe a 25%-35% increase in risk of reflux disease.”
There was a dose-response relationship as well: “You do see a slight increase as you go from one cup, to two, to three, and so on, all the way up to six cups” of the offending beverages, said Dr. Mehta.
Overall, the risk for GERD rose from 1.17 to 1.34 with coffee consumption as servings per day increased from less than one to six or more (P for trend less than .0001). Tea consumption was associated with increased GERD risk ranging from 1.08 to 1.26 as consumption rose (P for trend .001). For soda, the increased risk went from 1.12 at less than one serving daily, to 1.41 at four to five servings daily, and then fell to 1.29 at six or more daily servings (P for trend less than .0001).
Whether the beverages were caffeinated or not, said Dr. Mehta, only made a “minimal difference” in GERD risk.
“In contrast, we didn’t see an association for beverages like water, juice, and milk,” he said – reassuring findings in light of fruit juice’s anecdotal status as a GERD culprit.
The NHS II collected data every 2 years from 48,308 female nurses aged 42-62 years at the beginning of the study. Every 4 years dietary information was collected, and on the opposite 4-year cycle, participants answered questions about GERD. Medication use, including the incident use of proton pump inhibitors, was collected every 2 years.
Patients with baseline GERD or use of PPIs or H2 receptor antagonists were excluded from participation.
The quantity and type of beverages were assessed by food frequency questionnaires; other demographic, dietary, and medication variables were also gathered and used to adjust the statistical analysis.
A substitution analysis answered the “what-if” question of the effect of substituting two glasses of plain water daily for either coffee, tea, or soda. Dr. Mehta and colleagues saw a modest reduction in risk for GERD with this strategy.
In addition to the prospective nature of the study (abstract 514, doi: 10.1016/S0016-5085(19)37044-1), the large sample size, high follow-up rates, and well validated dietary data were all strengths, said Dr. Mehta. However, the study’s population is relatively homogeneous, and residual confounding couldn’t be excluded. Also, GERD was defined by self-report, though participants were asked to respond to clear, validated criteria.
For Dr. Mehta, he’s glad to have a clear answer to a common clinic question. “I think that this is one additional thing that I can recommend as a primary care provider to my patients when they come into my office,” he said.
Dr. Mehta reported no conflicts of interest.
Encourage your patients to visit the AGA GI Patient Center for education by specialists for patients about GERD symptoms and treatments at https://www.gastro.org/practice-guidance/gi-patient-center/topic/gastroesophageal-reflux-disease-gerd.
SAN DIEGO – .
In an interview following the oral presentation, Raaj S. Mehta, MD, said that patients in his primary care panel at Massachusetts General Hospital, Boston, where he’s a senior resident, frequently came to him with GERD. In addition to questions about diet, patients frequently wanted to know which beverages might provoke or exacerbate their GERD.
In trying to help his patients, Dr. Mehta said he realized that there wasn’t a prospective evidence base to answer their questions about beverages and GERD, so he and his colleagues used data from the Nurses’ Health Study II (NHS II), a prospective cohort study, to look at the association between various beverages and the incidence of GERD.
“What’s exciting is that we were able to find that coffee, tea, and soda – all three – increase your risk for gastroesophageal reflux disease,” Dr. Mehta said in a video interview. “At the highest quintile level, so looking at people who consume six or more cups per day, you’re looking at maybe a 25%-35% increase in risk of reflux disease.”
There was a dose-response relationship as well: “You do see a slight increase as you go from one cup, to two, to three, and so on, all the way up to six cups” of the offending beverages, said Dr. Mehta.
Overall, the risk for GERD rose from 1.17 to 1.34 with coffee consumption as servings per day increased from less than one to six or more (P for trend less than .0001). Tea consumption was associated with increased GERD risk ranging from 1.08 to 1.26 as consumption rose (P for trend .001). For soda, the increased risk went from 1.12 at less than one serving daily, to 1.41 at four to five servings daily, and then fell to 1.29 at six or more daily servings (P for trend less than .0001).
Whether the beverages were caffeinated or not, said Dr. Mehta, only made a “minimal difference” in GERD risk.
“In contrast, we didn’t see an association for beverages like water, juice, and milk,” he said – reassuring findings in light of fruit juice’s anecdotal status as a GERD culprit.
The NHS II collected data every 2 years from 48,308 female nurses aged 42-62 years at the beginning of the study. Every 4 years dietary information was collected, and on the opposite 4-year cycle, participants answered questions about GERD. Medication use, including the incident use of proton pump inhibitors, was collected every 2 years.
Patients with baseline GERD or use of PPIs or H2 receptor antagonists were excluded from participation.
The quantity and type of beverages were assessed by food frequency questionnaires; other demographic, dietary, and medication variables were also gathered and used to adjust the statistical analysis.
A substitution analysis answered the “what-if” question of the effect of substituting two glasses of plain water daily for either coffee, tea, or soda. Dr. Mehta and colleagues saw a modest reduction in risk for GERD with this strategy.
In addition to the prospective nature of the study (abstract 514, doi: 10.1016/S0016-5085(19)37044-1), the large sample size, high follow-up rates, and well validated dietary data were all strengths, said Dr. Mehta. However, the study’s population is relatively homogeneous, and residual confounding couldn’t be excluded. Also, GERD was defined by self-report, though participants were asked to respond to clear, validated criteria.
For Dr. Mehta, he’s glad to have a clear answer to a common clinic question. “I think that this is one additional thing that I can recommend as a primary care provider to my patients when they come into my office,” he said.
Dr. Mehta reported no conflicts of interest.
Encourage your patients to visit the AGA GI Patient Center for education by specialists for patients about GERD symptoms and treatments at https://www.gastro.org/practice-guidance/gi-patient-center/topic/gastroesophageal-reflux-disease-gerd.
REPORTING FROM DDW 2019

Cost of physician burnout estimated at $4.6 billion a year
Physician burnout costs the U.S. health care system approximately $4.6 billion a year in physician turnover and reduced productivity, according to the results of a cost-consequence analysis.
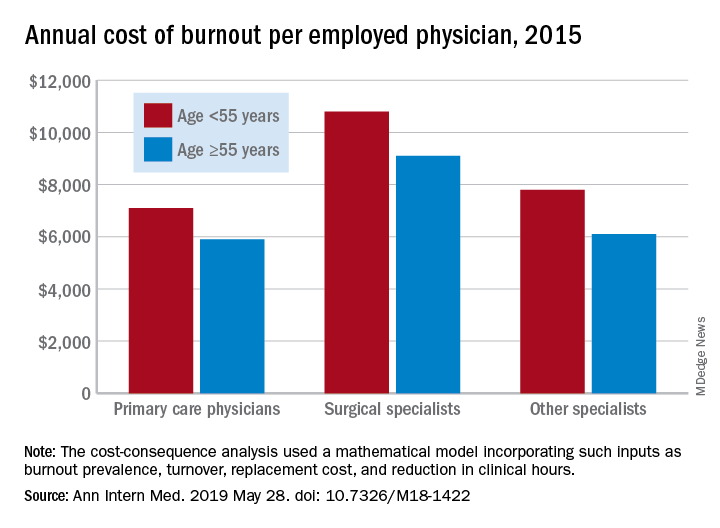
In 2015, the burnout-attributable cost per physician was $7,600 – an estimate occupying the conservative middle ground between the $3,700 and $11,000 extremes produced by the study’s mathematical model.
“Traditionally, the case for ameliorating physician burnout has been made primarily on ethical grounds.” This study, believed to be the first to look at the system-wide costs of burnout, “provides tools to evaluate the economic dimension of this problem,” wrote Shasha Han, MS, of the National University of Singapore and her associates in Annals of Internal Medicine.
Individual burnout-attributable costs were higher for physicians in the younger age group (less than 55 years) in all three specialty categories: $7,100 versus $5,900 for those aged at least 55 years among primary care physicians, $10,800 versus $9,100 for surgical specialists, and $7,800 versus $6,100 for other specialists, the investigators reported.
The mathematical model used in the study focused on two productivity metrics related to burnout – cost associated with physician replacement and lost income from unfilled physician positions. “Estimated turnover costs were generally higher than costs of reduced productivity across all” the various segments of age and specialty, Ms. Han and associates wrote.
“Burnout is a problem that extends beyond physicians to nurses and other health care staff. Future work holistically investigating the costs associated with burnout in health care organizations would be valuable. Studies focusing on differences in burnout-attributable costs across provider segments other than the ones investigated in this study, including academic versus private settings, or across a finer segmentation of physician specialties also might be fruitful,” they wrote.
One investigator has received grants from the American Medical Association Accelerating Change in Medical Education Consortium, the Physicians Foundation, and the National Institutes of Health. Another received a startup grant from the National University of Singapore. Ms. Han said that she had no financial conflicts to disclose. All of the investigators’ disclosures are available online.
Learn practical tips to avoid physician burnout presented during an AGA symposium at DDW® at https://www.ddwnews.org/news/aga-symposium-provides-practical-tips-to-avoid-physician-burnout/.
SOURCE: Han S et al. Ann Intern Med. 2019 May 28. doi: 10.7326/M18-1422.
Physician burnout costs the U.S. health care system approximately $4.6 billion a year in physician turnover and reduced productivity, according to the results of a cost-consequence analysis.
In 2015, the burnout-attributable cost per physician was $7,600 – an estimate occupying the conservative middle ground between the $3,700 and $11,000 extremes produced by the study’s mathematical model.
“Traditionally, the case for ameliorating physician burnout has been made primarily on ethical grounds.” This study, believed to be the first to look at the system-wide costs of burnout, “provides tools to evaluate the economic dimension of this problem,” wrote Shasha Han, MS, of the National University of Singapore and her associates in Annals of Internal Medicine.
Individual burnout-attributable costs were higher for physicians in the younger age group (less than 55 years) in all three specialty categories: $7,100 versus $5,900 for those aged at least 55 years among primary care physicians, $10,800 versus $9,100 for surgical specialists, and $7,800 versus $6,100 for other specialists, the investigators reported.
The mathematical model used in the study focused on two productivity metrics related to burnout – cost associated with physician replacement and lost income from unfilled physician positions. “Estimated turnover costs were generally higher than costs of reduced productivity across all” the various segments of age and specialty, Ms. Han and associates wrote.
“Burnout is a problem that extends beyond physicians to nurses and other health care staff. Future work holistically investigating the costs associated with burnout in health care organizations would be valuable. Studies focusing on differences in burnout-attributable costs across provider segments other than the ones investigated in this study, including academic versus private settings, or across a finer segmentation of physician specialties also might be fruitful,” they wrote.
One investigator has received grants from the American Medical Association Accelerating Change in Medical Education Consortium, the Physicians Foundation, and the National Institutes of Health. Another received a startup grant from the National University of Singapore. Ms. Han said that she had no financial conflicts to disclose. All of the investigators’ disclosures are available online.
Learn practical tips to avoid physician burnout presented during an AGA symposium at DDW® at https://www.ddwnews.org/news/aga-symposium-provides-practical-tips-to-avoid-physician-burnout/.
SOURCE: Han S et al. Ann Intern Med. 2019 May 28. doi: 10.7326/M18-1422.
FROM ANNALS OF INTERNAL MEDICINE
Key clinical point: Burnout-attributable costs were higher for younger physicians.
Major finding: Physician burnout costs the U.S. health care system approximately $4.6 billion a year.
Study details: A cost-consequence analysis focusing on physician turnover and lost clinical hours.
Disclosures: One investigator has received grants from the American Medical Association Accelerating Change in Medical Education Consortium, the Physicians Foundation, and the National Institutes of Health. Another received a startup grant from the National University of Singapore. Ms. Han said that she had no financial conflicts.
Source: Han S et al. Ann Intern Med. 2019 May 28. doi: 10.7326/M18-1422.
Pembrolizumab missed statistical cutoffs in hepatocellular carcinoma study
CHICAGO – Despite reducing risk of death by 22% versus placebo and improving progression-free survival, pembrolizumab did not meet prespecified criteria for significance of these efficacy end points in a phase 3 study in advanced hepatocellular carcinoma, an investigator reported.
The magnitude of benefit seen with pembrolizumab was nevertheless on par with results of the study that led to accelerated approval of the PD-1 inhibitor for hepatocellular carcinoma, Richard S. Finn, MD, of the University of California, Los Angeles, said at the annual meeting of the American Society of Clinical Oncology.
“These data support that the risk-benefit balance for pembrolizumab is favorable in the second line setting in hepatocellular carcinoma,” he said in an oral presentation on the phase 3 KEYNOTE-240 study.
Pembrolizumab did demonstrate “strong trends” in survival and other clinical characteristics in KEYNOTE-240, including response rate, duration of response, and a “very favorable” toxicity profile, said William P. Harris, MD, of the University of Washington and Fred Hutchinson Cancer Research Center, Seattle.
“I plan to continue to prescribe PD-1 inhibitors in the second-line setting, especially for those patients who show relative intolerance to tyrosine kinase inhibitors,” Dr. Harris said in a podium discussion of the results.
The Food and Drug Administration granted accelerated approval to the PD-1 inhibitor nivolumab in September 2017, and to pembrolizumab in November 2018, for treatment of patients with hepatocellular carcinoma who previously received sorafenib.
The accelerated approval of pembrolizumab was based on KEYNOTE-224, a single-arm, multicenter trial enrolling 104 patients with Child-Pugh Class A liver impairment who had disease progression on or after sorafenib, or were intolerant to sorafenib. Overall response rate in the study was 17%, with response durations ranging from 3.1 to 16.7 months.
The phase 3 KEYNOTE-240 study was designed to confirm the efficacy and safety of pembrolizumab in patients with hepatocellular carcinoma, Dr. Finn said. The study comprised 413 patients with Child Pugh class A, Barcelona Clinic Liver Cancer stage B/C disease who had previously received sorafenib. They were randomized 2:1 to pembrolizumab or placebo in addition to best supportive care for up to 35 cycles, or approximately 2 years of treatment.
Median overall survival was 13.9 months for the PD-1 inhibitor and 10.6 months for placebo, but the P value (.0238) did not meet a prespecified threshold of 0.0174 required to demonstrate statistical significance, according to Dr. Finn. Median progression-free survival was 3.0 months for pembrolizumab and 2.8 months for placebo, with a P value of .0186 that did not meet a prespecified value of .002.
The objective response rate was 18.3% and 4.4% for pembrolizumab and placebo, respectively (P = .00007), Dr. Finn reported. Duration of response was a median of 13.8 months for pembrolizumab, ranging from 1.5+ months to 23.6+ months, while for placebo, median duration of response was not yet reached, with a range of 2.8 to 20.4+ months, according to his report.
Rates of adverse events were similar between arms, according to Dr. Finn. While rates of grade 3-4 adverse events were higher in the pembrolizumab arm, those leading to treatment discontinuation were relatively low, he added.
About 10% of patients in the placebo arm subsequently received treatment with PD-1 or PD-L1 inhibitors, in an analysis that was prespecified in anticipation of new drugs that might be approved, according to Dr. Finn.
Ongoing now is KEYNOTE-394, another phase 3 study of pembrolizumab in previously treated, advanced hepatocellular carcinoma ongoing in the Asia Pacific region, Dr. Finn said.
Results of that phase 3 investigation could have important implications for the FDA’s subsequent analyses of pembrolizumab in this setting, according to Dr. Harris, the abstract discussant.
“I would recommend that they consider continued approval until they see results of the KEYNOTE-394 study, and take those results in sum,” he said in his presentation.
Dr. Finn reported disclosures related to AstraZeneca, Bayer, Bristol-Myers Squibb, Eisai, Exelixis, Genentech/Roche, Lilly, Merck, Novartis, and Pfizer.
SOURCE: Finn RS, et al. ASCO 2019. Abstract 4004.
REPORTING FROM ASCO 2019