User login
MedPAC to begin work on Part D redesign
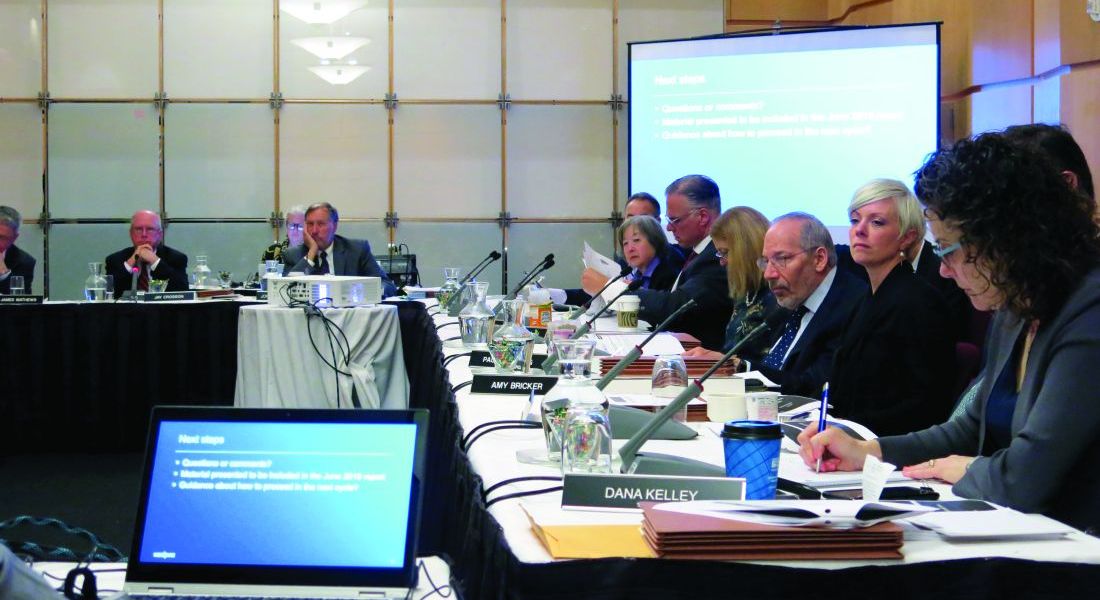
WASHINGTON – The Medicare Payment Advisory Commission will begin work on developing a plan to overhaul the Medicare Part D program.
Commission members, after hearing about a pair of options related to affordability of specialty drugs and biologics, instructed staff to pursue the option that would essentially amount to an overhaul to the program.
Commission staff presented two options to the commission at a meeting on April 5. Gaining no traction was the easier of the two fixes that could be implemented rapidly – setting a maximum out-of-pocket limit on each specialty tier prescription. The staff used the lesser of a 33% coinsurance (which is generally calculated against the list price of the drug) or $200 for a 30-day supply as the limit.
That first option gained little traction with commission members, who instead gravitated to the option that would restructure the Part D prescription drug benefit to provide stronger formulary and pricing incentives.
As proposed, the second option would replace the coverage gap discount with a manufacturer “cap discount” and restructure the catastrophic benefit.
Commission staff members said that this would help provide stronger incentives for the use of generics, increase affordability for enrollees and the Medicare program, and provide stronger incentives for plans to manage spending. Staff members also said it could provide a disincentive for manufacturers to set high launch prices and/or increase prices rapidly.
The basic plan design would have 25% coinsurance after the deductible is met, up to a to-be-determined out-of-pocket threshold. This would be followed by catastrophic coverage, with details about who pays and how much still to be determined. Currently, the basic structure of the Part D program calls for plan members to pay a 5% coinsurance.
While speaking favorably about the concept of redesign, MedPAC member Kathy Buto, former vice president of global health policy at Johnson & Johnson, noted that it might be a tough sell.
“The difficulty we are going to have, or Medicare will have, in moving to something like this is that people are now entrenched in the current [program],” she said. “As much as I like this, I think it’s daunting moving from the current system.”
She said that if there is a focus on getting the benefits right, it will be a much better approach that could result in lower drug prices.
MedPAC member Amy Bricker, vice president of supply chain strategy at Express Scripts, called for consideration of additional reform to the current program’s six protected classes of drugs, within which plans are required to cover all or substantially all products.
She also suggested providing Part D plans with the ability to exclude high-priced drug launches from their formularies, something they cannot do now.
“Having the ability to exclude a product at launch is the single biggest tool that a commercial plan has and manufacturers fear,” she said, noting that it gives plans leverage, especially if there is little or no competition to that product.
Ms. Bricker came out against the consensus of other members of the commission and supported the out-of-pocket cap in addition to the overhauled Part D proposal.
She noted that the background material provided to the commission offered a suggestion that coinsurance would provide pressure on manufacturers to lower list prices because of the difficulty it puts on beneficiaries. “It doesn’t,” she said. “You can get a headline in the Wall Street Journal. You can hear about these stories in pockets. But it does not impact the decisions of the manufacturer.”
MedPAC staff will be working in the coming year to work out the details of the restructured proposal.
REPORTING FROM MEDPAC
HM19: Lessons from the Update in Hospital Medicine session

In the second of two episodes, Amith Skandhan, MD, FHM, of Southeast Alabama Medical Center, Dothan, Ala., and Raman Palabindala, MD, SFHM, of the University of Mississippi Medical Center, Jackson, Miss., discuss more of their favorite lessons from the annual meeting of the Society of Hospital Medicine. Dr. Skandhan and Dr. Palabindala share practice-changing takeaways from the Update in Hospital Medicine session.
In the second of two episodes, Amith Skandhan, MD, FHM, of Southeast Alabama Medical Center, Dothan, Ala., and Raman Palabindala, MD, SFHM, of the University of Mississippi Medical Center, Jackson, Miss., discuss more of their favorite lessons from the annual meeting of the Society of Hospital Medicine. Dr. Skandhan and Dr. Palabindala share practice-changing takeaways from the Update in Hospital Medicine session.
In the second of two episodes, Amith Skandhan, MD, FHM, of Southeast Alabama Medical Center, Dothan, Ala., and Raman Palabindala, MD, SFHM, of the University of Mississippi Medical Center, Jackson, Miss., discuss more of their favorite lessons from the annual meeting of the Society of Hospital Medicine. Dr. Skandhan and Dr. Palabindala share practice-changing takeaways from the Update in Hospital Medicine session.
REPORTING FROM HM19
HM19: Key takeaways on quality and innovation

In the first of two episodes, Amith Skandhan, MD, FHM, of Southeast Alabama Medical Center, Dothan, Ala., and Raman Palabindala, MD, SFHM, of the University of Mississippi Medical Center, Jackson, Miss., discuss their favorite lessons from the annual meeting of the Society of Hospital Medicine. Dr. Skandhan and Dr. Palabindala review key points from sessions on quality and patient safety, caring for the complex medically ill, using data analytics to drive clinical change, and the best studies from the Research and Innovation poster competition.
In the first of two episodes, Amith Skandhan, MD, FHM, of Southeast Alabama Medical Center, Dothan, Ala., and Raman Palabindala, MD, SFHM, of the University of Mississippi Medical Center, Jackson, Miss., discuss their favorite lessons from the annual meeting of the Society of Hospital Medicine. Dr. Skandhan and Dr. Palabindala review key points from sessions on quality and patient safety, caring for the complex medically ill, using data analytics to drive clinical change, and the best studies from the Research and Innovation poster competition.
In the first of two episodes, Amith Skandhan, MD, FHM, of Southeast Alabama Medical Center, Dothan, Ala., and Raman Palabindala, MD, SFHM, of the University of Mississippi Medical Center, Jackson, Miss., discuss their favorite lessons from the annual meeting of the Society of Hospital Medicine. Dr. Skandhan and Dr. Palabindala review key points from sessions on quality and patient safety, caring for the complex medically ill, using data analytics to drive clinical change, and the best studies from the Research and Innovation poster competition.
REPORTING FROM HM19

Laparoscopic bilateral salpingo-oophorectomy via minilaparotomy assistance for the massively enlarged adnexal mass


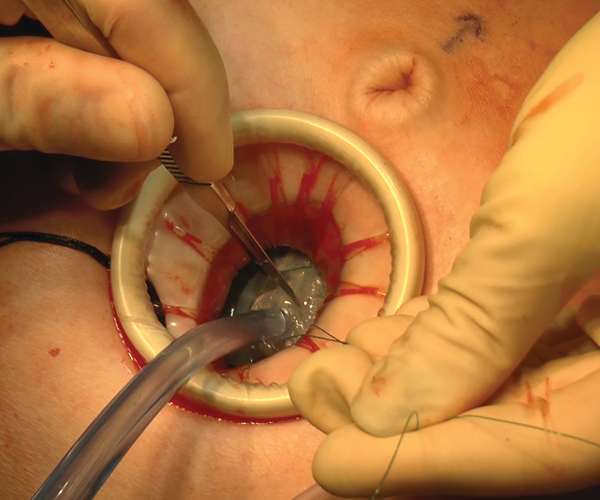
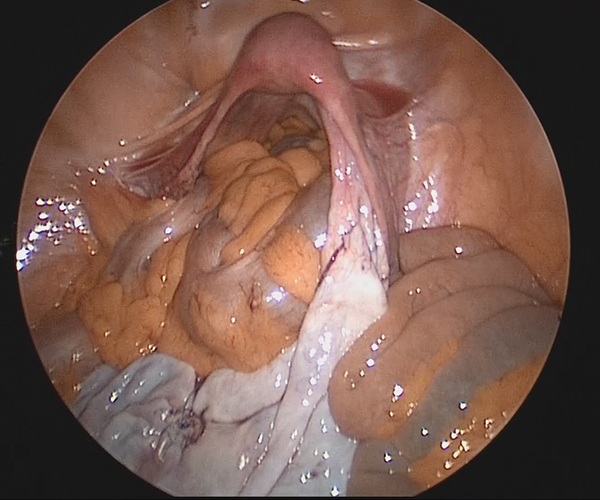
Large adnexal masses traditionally are removed surgically via laparotomy through a midline vertical incision to achieve adequate exposure and to avoid spillage of cyst contents. However, large laparotomies carry significant morbidity compared with minimally invasive techniques. Minilaparotomy is a minimally invasive approach that is associated with shorter operating times and lower estimated blood loss compared with laparoscopy in gynecologic surgery.1 The procedure also provides adequate exposure and can be used for carefully selected patients with a large adnexal mass.2,3 Preoperative assessment for the risk of malignancy typically includes an evaluation of risk factors, physical examination, imaging, and tumor markers.4
In this video, we illustrate a minimally invasive technique for the removal of a massively enlarged adnexal mass through laparoscopic bilateral salpingo-oophorectomy with minilaparotomy assistance. We conclude that this procedure is a safe and feasible option for women with a large benign adnexal mass, such as the highlighted patient whose final pathology resulted in a mucinous cystadenoma. Careful patient selection and preoperative assessment of malignancy risk is critical.5,6
We hope that you find this innovative approach useful in your clinical practice.
>> Dr. Arnold P. Advincula and colleagues
- Kumar A, Pearl M. Mini-laparotomy versus laparoscopy for gynecologic conditions. J Minim Invasive Gynecol. 2014;21:109-114.
- Pelosi MA. A novel minilaparotomy approach for large ovarian cysts. OBG Manag. 2004;16(2):17-30.
- Rhode JM, Advincula AP, Reynolds RK, et al. A minimally invasive technique for management of the large adnexal mass. J Minim Invasive Gynecol. 2006;13:476-479.
- American College of Obstetricians and Gynecologists' Committee on Practice Bulletins--Gynecology. Practice Bulletin No. 174: evaluation and management of adnexal masses. Obstet Gynecol. 2016;128:e210-e226.
- Roman LD, Muderspach LI, Stein SM, et al. Pelvic examination, tumor marker level, and gray-scale and Doppler sonography in the prediction of pelvic cancer. Obstet Gynecol. 1997;89:493-500.
- Dodge JE, Covens AL, Lacchetti C, et al; Gynecology Cancer Disease Site Group. Preoperative identification of a suspicious adnexal mass: a systematic review and meta-analysis. Gynecol Oncol. 2012:126:157-166.
Dr. Cui is Resident, Columbia University Irving Medical Center-New York Presbyterian Hospital, New York.
Dr. Dubin is Fellow, Minimally Invasive Gynecologic Surgery, Columbia University Irving Medical Center.

Dr. Advincula
Dr. Advincula is Levine Family Professor of Women's Health; Vice-Chair, Department of Obstetrics & Gynecology; Chief of Gynecology, Sloane Hospital for Women; and Medical Director, Mary & Michael Jaharis Simulation Center, Columbia University Irving Medical Center, New York-Presbyterian Hospital. He serves on the OBG Management Board of Editors.
Dr. Advincula reports serving as a consultant to ConMed, CooperSurgical, Intuitive Surgical, and Titan Medical and receiving royalties from CooperSurgical. The other authors report no financial relationships relevant to this article.
Dr. Cui is Resident, Columbia University Irving Medical Center-New York Presbyterian Hospital, New York.
Dr. Dubin is Fellow, Minimally Invasive Gynecologic Surgery, Columbia University Irving Medical Center.
Dr. Advincula
Dr. Advincula is Levine Family Professor of Women's Health; Vice-Chair, Department of Obstetrics & Gynecology; Chief of Gynecology, Sloane Hospital for Women; and Medical Director, Mary & Michael Jaharis Simulation Center, Columbia University Irving Medical Center, New York-Presbyterian Hospital. He serves on the OBG Management Board of Editors.
Dr. Advincula reports serving as a consultant to ConMed, CooperSurgical, Intuitive Surgical, and Titan Medical and receiving royalties from CooperSurgical. The other authors report no financial relationships relevant to this article.
Large adnexal masses traditionally are removed surgically via laparotomy through a midline vertical incision to achieve adequate exposure and to avoid spillage of cyst contents. However, large laparotomies carry significant morbidity compared with minimally invasive techniques. Minilaparotomy is a minimally invasive approach that is associated with shorter operating times and lower estimated blood loss compared with laparoscopy in gynecologic surgery.1 The procedure also provides adequate exposure and can be used for carefully selected patients with a large adnexal mass.2,3 Preoperative assessment for the risk of malignancy typically includes an evaluation of risk factors, physical examination, imaging, and tumor markers.4
In this video, we illustrate a minimally invasive technique for the removal of a massively enlarged adnexal mass through laparoscopic bilateral salpingo-oophorectomy with minilaparotomy assistance. We conclude that this procedure is a safe and feasible option for women with a large benign adnexal mass, such as the highlighted patient whose final pathology resulted in a mucinous cystadenoma. Careful patient selection and preoperative assessment of malignancy risk is critical.5,6
We hope that you find this innovative approach useful in your clinical practice.
>> Dr. Arnold P. Advincula and colleagues
- Kumar A, Pearl M. Mini-laparotomy versus laparoscopy for gynecologic conditions. J Minim Invasive Gynecol. 2014;21:109-114.
- Pelosi MA. A novel minilaparotomy approach for large ovarian cysts. OBG Manag. 2004;16(2):17-30.
- Rhode JM, Advincula AP, Reynolds RK, et al. A minimally invasive technique for management of the large adnexal mass. J Minim Invasive Gynecol. 2006;13:476-479.
- American College of Obstetricians and Gynecologists' Committee on Practice Bulletins--Gynecology. Practice Bulletin No. 174: evaluation and management of adnexal masses. Obstet Gynecol. 2016;128:e210-e226.
- Roman LD, Muderspach LI, Stein SM, et al. Pelvic examination, tumor marker level, and gray-scale and Doppler sonography in the prediction of pelvic cancer. Obstet Gynecol. 1997;89:493-500.
- Dodge JE, Covens AL, Lacchetti C, et al; Gynecology Cancer Disease Site Group. Preoperative identification of a suspicious adnexal mass: a systematic review and meta-analysis. Gynecol Oncol. 2012:126:157-166.

CAR T cells home in on HER2 in advanced sarcomas
ATLANTA – A novel chimeric antigen receptor (CAR) T-cell construct centered on HER2 as the target antigen was safe and showed early promise in the treatment of advanced sarcomas of bone and soft tissues in a phase I trial.
One patient, a 16-year-old girl with advanced osteosarcoma metastatic to her lungs, had a complete response to the therapy that is ongoing out to nearly 3 years, reported Shoba A. Navai, MD, from Baylor College of Medicine in Houston.
A second patient, an 8-year-old boy with rhabdomyosarcoma metastatic to bone marrow, had a complete response lasting 12 months. Upon relapse he was re-enrolled, received additional CAR T-cell infusions, and had a second complete response that has been ongoing for 17 months.
“HER2 CAR T cells can induce objective clinical responses in some patients with sarcoma, and engagement of endogenous immunity may aid in generation of tumor responses. We are currently working to validate these findings in other patients who were treated,” she said at a briefing at the annual meeting of the American Association for Cancer Research.
HER2 is a member of the human epidermal growth factor receptor family that is primarily expressed on the surface of tumor cells but is largely absent from nonmalignant tissues. HER2 can be expressed in a variety of sarcomas, including osteosarcoma, and HER2 expression in osteosarcoma correlates with worse overall survival.
Unlike HER2-positive breast cancers, however, HER2 expression levels in osteosarcoma are too low to be effectively targeted by anti-HER2 agents such as trastuzumab (Hereceptin).
But as Dr. Navai and colleagues have found, HER2 appears to be a valid target for CAR T-cell therapy in otherwise antigenically “cold” tumors – that is, tumors with few targetable antigens.
Old target, new weapon
They have developed a CAR T-cell construct using a HER2-directed antibody coupled with CD28 as the costimulatory molecule. As with other CAR T therapies, the patient’s T cells or selected T cell subsets are collected, transfected to express the antigen, and are then expanded and returned to the patient following lymphodepletion with either fludarabine alone or with cyclophosphamide.
Each patient received up to three infusions of autologous CAR T cells at a dose of 1 x 10⁸ cells/m2, and eligible patients received up to five additional infusions without additional lymphodepletion.
Dr. Navai presented data on 10 patients treated to date, including the two mentioned before; the boy with rhabdomyosarcoma was counted as two separate patients for the purpose of the efficacy analysis.
All patients had metastatic disease, including five with osteosarcoma, three with rhabdomyosarcoma, one with Ewing sarcoma, and one with synovial sarcoma.
The lymphodepletion regimens did their job, inducing neutropenia (defined as an absolute neutrophil count less than 500 per milliliter ) for up to 14 days.
Eight patients developed grade 1 or 2 cytokine release syndrome within 24 hours of CAR T-cell infusion, and all cases completely resolved with supportive care within 5 days of onset.
In nine patients, T cells were successfully expanded, with a median peak expansion on day 7.
In all 10 patients, CAR T cells were detected by quantitative polymerase chain reaction 6 weeks after infusion.
In addition to the two patients with complete remissions already described, three patients had stable disease. The remaining patients had disease progression. At the most recent analysis, five patients were still alive, and five had died.
The infusions were safe, with no dose-limiting toxicities reported. No patient required a transfusion, and there were no opportunistic, infections, no neurotoxicities, and no lasting pulmonary or cardiac toxicities, Dr. Navai reported.
Some fare better than others
Nilofer S. Azad, MD, of the Sidney Kimmel Comprehensive Cancer Center at Johns Hopkins, Baltimore, who moderated the briefing, commented that the study had “very small numbers, but is still very exciting.”
She noted that the patients who benefited most from the therapy either had minimal residual disease or bone marrow disease without visceral disease; she asked Dr. Navai how this could be addressed going forward.
“The patients who seemed to have had responses both in this trial, as well as in our previous trial without lymphodepletion, tended to have less disease or more accessible disease. So we hypothesized that disease that’s in the bone marrow because it’s more accessible, or in the lungs, where also CAR T cells go after they are first infused, may be more amenable to treatment,” Dr. Navai said.
In contrast, larger tumors and more invasive disease may emit immune inhibitory signals that dampen the efficacy of CAR T cells, she added.
Development of the CAR T-cell construct is supported by the Cancer Prevention & Research Institute of Texas, Stand Up to Cancer, the St. Baldrick’s Foundation, Cookies for Kids’ Cancer, Alex’s Lemonade Stand, and a grant from the National Institutes of Health. Dr. Navai and Dr. Azad reported having no disclosures relevant to the work.
SOURCE: Navai SA et al. AACR 2019, Abstract LB-147.
REPORTING FROM AACR 2019
Flu activity falling but still elevated
Measures of influenza activity fell again as the flu season continues to make its later-than-usual departure this year, according to the Centers for Disease Control and Prevention.
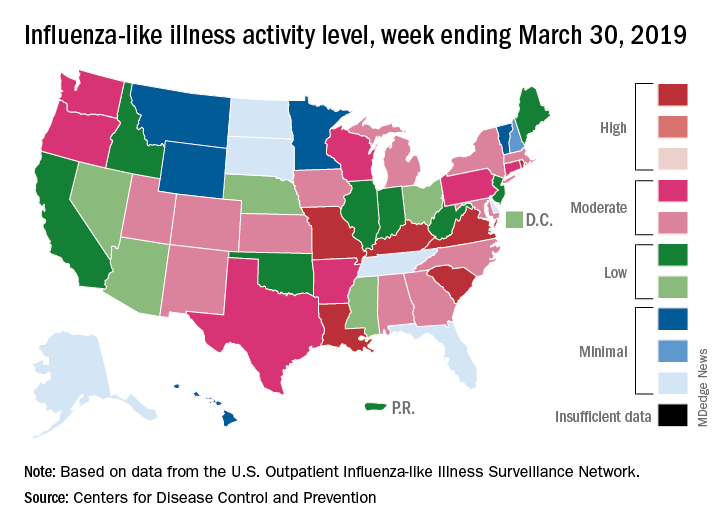
On the geographic front, the map of influenza-like illness (ILI) activity for the week ending March 30 shows that only 6 states are at level 10 on the CDC’s 1-10 scale, compared with 11 for the previous week, and that those same 6 states make up the entire membership of the high range of levels 8-10, which is down from 20 states a week ago, data from the CDC’s Outpatient ILI Surveillance Network show.
The proportion of outpatient visits for ILI, now at 3.2%, dropped for the sixth consecutive week after reaching its season high of 5.1% back in mid-February. The outpatient rate has now been at or above the national baseline of 2.2% for 19 weeks this season, the CDC’s influenza division said April 5, noting that the average for the past five seasons is 16 weeks.
Six flu-related pediatric deaths were reported in the week ending March 30, and the total is now 82 for the 2018-2019 season. Five of the six occurred during previous weeks of this season, and one occurred in the 2017-2018 season, the CDC said.
Measures of influenza activity fell again as the flu season continues to make its later-than-usual departure this year, according to the Centers for Disease Control and Prevention.
On the geographic front, the map of influenza-like illness (ILI) activity for the week ending March 30 shows that only 6 states are at level 10 on the CDC’s 1-10 scale, compared with 11 for the previous week, and that those same 6 states make up the entire membership of the high range of levels 8-10, which is down from 20 states a week ago, data from the CDC’s Outpatient ILI Surveillance Network show.
The proportion of outpatient visits for ILI, now at 3.2%, dropped for the sixth consecutive week after reaching its season high of 5.1% back in mid-February. The outpatient rate has now been at or above the national baseline of 2.2% for 19 weeks this season, the CDC’s influenza division said April 5, noting that the average for the past five seasons is 16 weeks.
Six flu-related pediatric deaths were reported in the week ending March 30, and the total is now 82 for the 2018-2019 season. Five of the six occurred during previous weeks of this season, and one occurred in the 2017-2018 season, the CDC said.
DDNA19: News and advances in IBD

Dr. Stephen Brant and Dr. Nikolaos Pyrsopoulos discuss the latest news and advances in inflammatory bowel disease (IBD) at Digestive Diseases: New Advances, jointly provided by Rutgers and Global Academy for Medical Education.
Global Academy and this news organization are owned by the same company.
Dr. Stephen Brant and Dr. Nikolaos Pyrsopoulos discuss the latest news and advances in inflammatory bowel disease (IBD) at Digestive Diseases: New Advances, jointly provided by Rutgers and Global Academy for Medical Education.
Global Academy and this news organization are owned by the same company.
Dr. Stephen Brant and Dr. Nikolaos Pyrsopoulos discuss the latest news and advances in inflammatory bowel disease (IBD) at Digestive Diseases: New Advances, jointly provided by Rutgers and Global Academy for Medical Education.
Global Academy and this news organization are owned by the same company.
REPORTING FROM DIGESTIVE DISEASES: NEW ADVANCES

New leaders at SGO, AACR
The Society of Gynecologic Oncology (SGO) has a new leader at the helm.

Warner K. Huh, MD, of the University of Alabama at Birmingham, has been named president of the SGO. Dr. Huh began his 1-year term at the end of SGO’s Annual Meeting on Women’s Cancer, which took place in March 2019.
Dr. Huh said he plans to focus his presidency on the changing practice of gynecologic oncology, including surgery and novel therapies, clinical trial mentorship, subspecialty awareness, alternative payment models, and the role of gynecologic oncologists in benign gynecologic surgery.
Another newly installed president is Elaine R. Mardis, PhD, of Nationwide Children’s Hospital in Columbus, Ohio. Dr. Mardis was named president of the American Association for Cancer Research (AACR) for 2019-2020.
She has conducted extensive research on the genomic characterization of various cancers. She was inaugurated as AACR president during the AACR’s annual meeting, which took place March 29-April 3, 2019.
Also at the AACR annual meeting, Antoni Ribas, MD, PhD, of the University of California, Los Angeles, was inducted as president-elect of AACR. Dr. Ribas will assume the presidency in April 2020. He has conducted research focused on malignant melanoma and is said to have been “instrumental” in the development of several drugs used to treat the disease.

In other news, the National Comprehensive Cancer Network (NCCN) named Ronald Walters, MD, chair of its board of directors, and Ruth O’Regan, MD, was named vice chair.
Dr. Walters, of the University of Texas MD Anderson Cancer Center in Houston, conducts research focused on health care reform and cost accounting in health care.
Dr. O’Regan, of the University of Wisconsin Carbone Cancer Center in Madison, conducts research focused on identifying mechanisms of treatment resistance and developing new therapies for breast cancer.

Finally, Giulio F. Draetta, MD, PhD, was named chief scientific officer at the University of Texas MD Anderson Cancer Center. This is a new position that “champions innovation, develops strong partnerships, and provides focused leadership on the science and clinical translation of research programs,” according to MD Anderson.
Dr. Draetta conducted “fundamental” research on the eukaryotic cell division cycle and DNA damage-induced checkpoints. He has cofounded and led biotechnology companies and headed drug discovery and development programs that led to two drug approvals, according to MD Anderson.
Movers in Medicine highlights career moves and personal achievements by hematologists and oncologists. Did you switch jobs, take on a new role, climb a mountain? Tell us all about it at [email protected], and you could be featured in Movers in Medicine.
The Society of Gynecologic Oncology (SGO) has a new leader at the helm.
Warner K. Huh, MD, of the University of Alabama at Birmingham, has been named president of the SGO. Dr. Huh began his 1-year term at the end of SGO’s Annual Meeting on Women’s Cancer, which took place in March 2019.
Dr. Huh said he plans to focus his presidency on the changing practice of gynecologic oncology, including surgery and novel therapies, clinical trial mentorship, subspecialty awareness, alternative payment models, and the role of gynecologic oncologists in benign gynecologic surgery.
Another newly installed president is Elaine R. Mardis, PhD, of Nationwide Children’s Hospital in Columbus, Ohio. Dr. Mardis was named president of the American Association for Cancer Research (AACR) for 2019-2020.
She has conducted extensive research on the genomic characterization of various cancers. She was inaugurated as AACR president during the AACR’s annual meeting, which took place March 29-April 3, 2019.
Also at the AACR annual meeting, Antoni Ribas, MD, PhD, of the University of California, Los Angeles, was inducted as president-elect of AACR. Dr. Ribas will assume the presidency in April 2020. He has conducted research focused on malignant melanoma and is said to have been “instrumental” in the development of several drugs used to treat the disease.
In other news, the National Comprehensive Cancer Network (NCCN) named Ronald Walters, MD, chair of its board of directors, and Ruth O’Regan, MD, was named vice chair.
Dr. Walters, of the University of Texas MD Anderson Cancer Center in Houston, conducts research focused on health care reform and cost accounting in health care.
Dr. O’Regan, of the University of Wisconsin Carbone Cancer Center in Madison, conducts research focused on identifying mechanisms of treatment resistance and developing new therapies for breast cancer.
Finally, Giulio F. Draetta, MD, PhD, was named chief scientific officer at the University of Texas MD Anderson Cancer Center. This is a new position that “champions innovation, develops strong partnerships, and provides focused leadership on the science and clinical translation of research programs,” according to MD Anderson.
Dr. Draetta conducted “fundamental” research on the eukaryotic cell division cycle and DNA damage-induced checkpoints. He has cofounded and led biotechnology companies and headed drug discovery and development programs that led to two drug approvals, according to MD Anderson.
Movers in Medicine highlights career moves and personal achievements by hematologists and oncologists. Did you switch jobs, take on a new role, climb a mountain? Tell us all about it at [email protected], and you could be featured in Movers in Medicine.
Tackling the challenges of pediatric localized scleroderma
MAUI, HAWAII – One of the most important steps to take when a child has received a biopsy-confirmed diagnosis of localized scleroderma is to sit down with the family and explain the rationale for the aggressive therapies to come, Anne M. Stevens, MD, PhD, said at the 2019 Rheumatology Winter Clinical Symposium.
It can be a tough sell at first, especially when a child has only a small red streak on the nose and perhaps a subtle linear lesion on the forehead or scalp. But the family has to come to understand that this is a serious, chronic, progressive fibrotic disease.
“Talk about what a big impact this disease can have on growth of a limb and the normal life of a child because of the cosmetic appearance. Explain that the length of treatment course is based on the long-term outcomes and quality of life. This discussion is usually sufficient” to convince people to give their children “these pretty serious medications,” said Dr. Stevens, professor of pediatrics and head of the division of pediatric rheumatology at the University of Washington, Seattle.
“The treatment goal is to control inflammation and prevent damage in these patients, who we like to catch very early, when it’s a subtle lesion,” she added.
The biggest problem
The biggest contributors to poor quality of life in patients with juvenile localized scleroderma are the extracutaneous manifestations, which occur in up to 50% of cases. Joint pain occurs in roughly 20% of patients, joint contractures due to fibrosis of skin and/or tendons in 30%, and myalgia with or without myositis in 15%. Muscle atrophy due to the deep component of the scleroderma can occur. Moreover, growth problems – especially leg or arm length discrepancies – happen in about 20% of patients in prospective studies. These growth problems may not be obvious until a child enters a growth spurt, at which point there is a limited ability to achieve improvement. That’s why Dr. Stevens recommends that every child with localized scleroderma should get a full joint exam at every visit, with measurement and photos of lesions and recording of all erythematous, violaceous, and waxy-hued areas. And if there are lesions on the head, annual eye exams are warranted.
The prevalence of juvenile localized scleroderma in the United States is about 3 per 100,000, with a mean age of onset of 8.2 years. That makes it 100-fold more common than pediatric systemic sclerosis.
The treatment ladder
There are no Food and Drug Administration–approved medications for localized scleroderma in children. It’s all off label. That being said, there is strong consensus among members of the Childhood Arthritis and Rheumatology Research Alliance that the first-line therapy is methotrexate at 15 mg/m2 or a maximum of 20 mg/week plus intravenous corticosteroids weaned over the course of 3-6 months. This is the treatment regimen with the best supporting evidence of safety and efficacy, including a single Italian randomized, double-blind, placebo-controlled clinical trial (Arthritis Rheum. 2011 Jul;63[7]:1998-2006) and an accompanying long-term, open-label follow-up study (J Am Acad Dermatol. 2012 Dec;67[6]:1151-6).
All of the other treatments she uses for juvenile localized scleroderma – mycophenolate mofetil (CellCept), abatacept (Orencia), tocilizumab (Actemra), and occasionally others – are backed only by a smattering of small case series. However, given the serious potential trajectory of this disease, that modest evidence base has been sufficient for her to receive insurance coverage approval of these agents.
In the randomized trial of first-line methotrexate, 48 of 65 patients treated with methotrexate plus steroid (74%) were responders. And among those 48 responders, 35 (73%) maintained a clinical remission for a mean of 25 months off-drug, while another 13 (27%) were in clinical remission on methotrexate. Twenty-eight patients developed side effects that were generally mild; no one required treatment discontinuation. At the 5-year mark, after an average of an initial 2 years on methotrexate, half of the patients were in a sustained clinical remission, which Dr. Stevens deemed “pretty good” considering the well established and manageable safety profile of the drug.
If a patient fails to respond to methotrexate plus corticosteroids within a few months or later experiences disease progression, Dr. Stevens’ second-line therapy is mycophenolate mofetil in conjunction with corticosteroids. Its use in arresting juvenile localized scleroderma is supported by two favorable published case series, the largest of which includes 10 patients (Rheumatology [Oxford]. 2009 Nov;48[11]:1410-3).
Dr. Stevens’ third-line therapy is intravenous abatacept at 10 mg/kg monthly along with intravenous methylprednisolone at 500 mg/week. There are five published case series, the most recent and largest of which included 13 adult patients, two of whom had en coup de sabre lesions (Acta Derm Venereol. 2018 Apr 16;98[4]:465-6). The biologic also shows promise in patients with advanced severe disease with deep tissue involvement (Semin Arthritis Rheum. 2017 Jun;46[6]:775-81). And abatacept has a plausible mechanism of action in localized scleroderma: French investigators have shown it induces regression of skin fibrosis in a mouse model of the disease (Ann Rheum Dis. 2016 Dec;75[12]:2142-9).
Her fourth-line strategy is the anti-interleukin-6 agent tocilizumab, again in conjunction with corticosteroids. In a translational study, tocilizumab has been shown to normalize dermal fibroblasts and collagen in patients with systemic sclerosis (Ann Rheum Dis. 2018 Sep;77[9]:1362-71). And there have been two promising small retrospective case series as well. A more definitive clinical trial is planned.
Dr. Stevens said that when starting a biologic agent in a child with localized scleroderma, she routinely adds methotrexate until the disease is under control.
Drugs supported by case reports and worth considering on an individual basis as a last resort are hydroxychloroquine, azathioprine, cyclosporine, and imatinib mesylate (Gleevec).
For mild, superficial lesions that don’t cross joints, ultraviolet light A phototherapy is a therapeutic option. It displayed significant benefit in a systematic review and meta-analysis of 19 studies comparing it to methotrexate, although the results with methotrexate were deemed superior (Semin Arthritis Rheum. 2018 Dec;48[3]:495-503).
The pros and cons of getting a baseline brain MRI
Children with localized scleroderma have increased rates of severe headache, peripheral neuropathy, complex partial seizures, and stroke. So it had been Dr. Stevens’ routine practice to obtain an initial brain MRI at the time of diagnosis. Of late, though, she has reconsidered that practice.
“The problem is that some patients with abnormal MRI lesions have no CNS disease at all, and there are also a fair number of patients with a normal MRI who have CNS symptoms. So in our practice we’re pulling back on doing screening MRIs because we don’t know what to do with the findings, and it just makes everybody worried,” she said.
However, if a child with localized scleroderma develops headaches, seizures, neuropathies, or other CNS symptoms, then by all means get an MRI, and if it shows findings such as brain atrophy, white matter lesions, calcifications, or leptomeningeal enhancement, consider treatment, she added.
Dr. Stevens reported receiving research funding from Kineta and Seattle Genetics.
REPORTING FROM RWCS 2019
DA-EPOCH-R appears more toxic than standard R-CHOP in DLBCL
The use of dose-adjusted etoposide, prednisone, vincristine, cyclophosphamide, doxorubicin, and rituximab (DA-EPOCH-R) as upfront treatment in patients with diffuse large B-cell lymphoma (DLBCL) showed greater toxicity and did not improve progression-free survival versus standard rituximab, cyclophosphamide, doxorubicin, vincristine, and prednisone (R-CHOP), according to results from a phase 3 trial.
“Less favorable outcomes for patients with recurrent DLBCL prompted efforts to improve first-line approaches and biomarkers to identify high-risk patients,” wrote Nancy L. Bartlett, MD, of Washington University, St. Louis, and her colleagues wrote in the Journal of Clinical Oncology.
The Alliance/CALGB 50303 study included 491 patients with DLBCL who were randomized in a 1:1 fashion to receive DA-EPOCH-R or R-CHOP every 21 days for a total of six cycles. Dosing for the DA-EPOCH-R regimen was determined using absolute neutrophil and platelet counts.
The primary endpoint measured was progression-free survival (PFS); secondary endpoints included safety, overall survival (OS), and response rate.
After a median follow-up of 5.2 years, the researchers found no significant difference in PFS between the study arms (DA-EPOCH-R hazard ratio, 0.93; 95% confidence interval, 0.68-1.27; P = .65). Additionally, there was no significant difference in OS (HR, 1.09; 95% CI, 0.75-1.59; P = .64).
The overall response rate was 88.0% in the R-CHOP arm versus 86.7% in the DA-EPOCH-R arm (P = .67).
With respect to safety, grade 3 or 4 adverse events were more frequently seen in the DA-EPOCH-R group than in the R-CHOP group (P less than .001). These toxicities included febrile neutropenia, infections, neuropathy, and mucositis.
The researchers did see significantly improved PFS in the DA-EPOCH-R arm in post hoc subset analyses of patients with International Prognostic Index (IPI) 3-5, but the subset analysis “was unplanned and not powered” and the significance “must be tempered in light of multiple comparisons.”
“We now understand DLBCL is even more heterogeneous than appreciated when this trial was designed,” the researchers wrote. “Therefore, the National Clinical Trials Network is planning a precision medicine approach to identify molecular subsets of DLBCL and determine if specific chemotherapy platforms and/or targeted agents offer differential benefit.”
The study was supported by the National Cancer Institute. The authors reported financial relationships with Bristol-Myers Squibb, Celgene, Janssen, Jazz Pharmaceuticals, Morphosys, and other companies.
SOURCE: Bartlett NL et al. J Clin Oncol. 2019 Apr 2. doi: 10.1200/JCO.18.01994.
FROM THE JOURNAL OF CLINICAL ONCOLOGY