User login
Pembrolizumab sBLA receives priority review
The US Food and Drug Administration (FDA) has granted priority review to a supplemental biologics license application (sBLA) for the anti-PD-1 therapy pembrolizumab (KEYTRUDA).
With this sBLA, Merck is seeking approval for pembrolizumab to treat adult and pediatric patients with refractory primary mediastinal B-cell lymphoma (PMBCL) or patients with PMBCL who have relapsed after 2 or more prior lines of therapy.
The FDA expects to make a decision on the sBLA by April 3, 2018.
The agency’s goal is to take action on a priority review application within 6 months of receiving it, rather than the standard 10 months.
The FDA grants priority review to applications for products that may provide significant improvements in the treatment, diagnosis, or prevention of serious conditions.
Pembrolizumab is currently FDA-approved to treat classical Hodgkin lymphoma, melanoma, lung cancer, head and neck cancer, urothelial carcinoma, microsatellite instability-high cancer, and gastric cancer.
The sBLA for pembrolizumab as a treatment for PMBCL is supported by the phase 2 KEYNOTE-170 trial. Results from this trial were presented at the 2017 ASH Annual Meeting (abstract 2833).
KEYNOTE-170 is an ongoing study in which researchers are evaluating pembrolizumab (given at a 200 mg fixed dose every 3 weeks) in patients with relapsed/refractory PMBCL or relapsed/refractory Richter syndrome.
The PMBCL cohort enrolled patients who relapsed after autologous stem cell transplant (ASCT), were refractory to ASCT, or were ineligible for ASCT. Patients ineligible for ASCT had to have received 2 or more lines of prior therapy.
The median duration of follow-up was 10.5 months (range, 0.1-17.7).
In the efficacy population (n=29), the overall response rate was 41% (n=12), and the complete response rate was 24% (n=7).
The median time to response was 2.8 months (range, 2.4-5.5), and the median duration of response was not reached (range, 1.1+ to 13.6+ months).
Of the 53 patients evaluated for safety, 57% (n=30) experienced treatment-related adverse events (TRAEs), including 21% (n=11) who experienced grade 3-4 TRAEs.
The most common TRAEs (occurring in at least 5% of patients) were neutropenia (n=11), hypothyroidism (n=4), asthenia (n=3), and pyrexia (n=3).
Immune-mediated adverse events of all grades occurred in 11% (n=6) of patients. These include hypothyroidism (n=4), hyperthyroidism (n=2), pneumonitis (n=1), and thyroiditis (n=1). There were no treatment-related deaths. ![]()
*Data in the abstract differ from the presentation.
Different perspectives on the care delivery process
Editor’s note: The Society of Hospital Medicine’s (SHM’s) Physician in Training Committee launched a scholarship program in 2015 for medical students to help transform health care and revolutionize patient care. The program has been expanded for the 2017-18 year, offering two options for students to receive funding and engage in scholarly work during their first, second and third years of medical school. As a part of the longitudinal (18-month) program, recipients are required to write about their experience on a monthly basis.
Last month I was able to conduct five interviews with key stakeholders, generate the patient flow diagram, define the problems, and propose potential interventions. The project is on time for the allotted time frame.
Interviewees include physicians and managers from infectious disease, hospital medicine, psychiatry and care management. They represent the services which admitted IVDU patients have contacts with: inpatient primary team, inpatient ID consult time, BIT (behavior intervention team), and OPAT (Outpatient Parenteral Antibiotic Therapy) program. I asked each interviewee about the specific challenges of care delivery during the inpatient, discharge, and outpatient follow up process.
It is not surprising that most would agree that discharge was the most difficult part. The ID service showed me data that those with IVDU history may have a one-time longer length of stay compared to the average. The social-psychological issues, including medication compliance, insurance coverage, and mental health comorbidities, are the most commonly mentioned factor for delayed discharge.
When asked about a suggestion for a particular area for quality improvement, different services came up with different recommendations. ID suggested looking at availability of community resources and improving patients’ access to them. Psychiatry has been trying to screen all admitted patients for substance use disorders, with an intention of early intervention. Hospital medicine and care management were contemplating the potential means for a repatriation program, i.e., making the transferring acute care facility agree to receive patients back once tertiary care was complete. Given that Dartmouth-Hitchcock Medical Center has a few satellite community hospitals, it would make sense to establish some institutional protocol to optimize patient flow within the system.
My next step would be to pursue one or two areas for improvement from the above options. I will work with the relevant stakeholders to define the problems and come up with a plan. I am excited about moving forward to the next phase.
My research approach has changed slightly during the process. Initially I was narrowly focused on the desired outcomes of decreasing length of stay and readmission rate. Dr. Huntington challenged me to understand the whole process thoroughly as well as to spend time on defining the problems before diving into interventions. I enjoyed my role of being a learner, researcher, and consultant in this project. I gained a very in-depth perspective on how each service operates and coordinates. Also, it is both challenging and fun to coming up with an improvement plan. In my future residency and physician career, I am definitely going to pursue more care improvement initiatives.

Yun Li is an MD/MBA student attending Geisel School of Medicine and Tuck School of Business at Dartmouth. She obtained her Bachelor of Arts degree from Hanover College double-majoring in Economics and Biological Chemistry. Ms. Li participated in research in injury epidemiology and genetics, and has conducted studies on traditional Tibetan medicine, rural health, health NGOs, and digital health. Her career interest is practicing hospital medicine and geriatrics as a clinician/administrator, either in the US or China. Ms. Li is a student member of the Society of Hospital Medicine.
Editor’s note: The Society of Hospital Medicine’s (SHM’s) Physician in Training Committee launched a scholarship program in 2015 for medical students to help transform health care and revolutionize patient care. The program has been expanded for the 2017-18 year, offering two options for students to receive funding and engage in scholarly work during their first, second and third years of medical school. As a part of the longitudinal (18-month) program, recipients are required to write about their experience on a monthly basis.
Last month I was able to conduct five interviews with key stakeholders, generate the patient flow diagram, define the problems, and propose potential interventions. The project is on time for the allotted time frame.
Interviewees include physicians and managers from infectious disease, hospital medicine, psychiatry and care management. They represent the services which admitted IVDU patients have contacts with: inpatient primary team, inpatient ID consult time, BIT (behavior intervention team), and OPAT (Outpatient Parenteral Antibiotic Therapy) program. I asked each interviewee about the specific challenges of care delivery during the inpatient, discharge, and outpatient follow up process.
It is not surprising that most would agree that discharge was the most difficult part. The ID service showed me data that those with IVDU history may have a one-time longer length of stay compared to the average. The social-psychological issues, including medication compliance, insurance coverage, and mental health comorbidities, are the most commonly mentioned factor for delayed discharge.
When asked about a suggestion for a particular area for quality improvement, different services came up with different recommendations. ID suggested looking at availability of community resources and improving patients’ access to them. Psychiatry has been trying to screen all admitted patients for substance use disorders, with an intention of early intervention. Hospital medicine and care management were contemplating the potential means for a repatriation program, i.e., making the transferring acute care facility agree to receive patients back once tertiary care was complete. Given that Dartmouth-Hitchcock Medical Center has a few satellite community hospitals, it would make sense to establish some institutional protocol to optimize patient flow within the system.
My next step would be to pursue one or two areas for improvement from the above options. I will work with the relevant stakeholders to define the problems and come up with a plan. I am excited about moving forward to the next phase.
My research approach has changed slightly during the process. Initially I was narrowly focused on the desired outcomes of decreasing length of stay and readmission rate. Dr. Huntington challenged me to understand the whole process thoroughly as well as to spend time on defining the problems before diving into interventions. I enjoyed my role of being a learner, researcher, and consultant in this project. I gained a very in-depth perspective on how each service operates and coordinates. Also, it is both challenging and fun to coming up with an improvement plan. In my future residency and physician career, I am definitely going to pursue more care improvement initiatives.
Yun Li is an MD/MBA student attending Geisel School of Medicine and Tuck School of Business at Dartmouth. She obtained her Bachelor of Arts degree from Hanover College double-majoring in Economics and Biological Chemistry. Ms. Li participated in research in injury epidemiology and genetics, and has conducted studies on traditional Tibetan medicine, rural health, health NGOs, and digital health. Her career interest is practicing hospital medicine and geriatrics as a clinician/administrator, either in the US or China. Ms. Li is a student member of the Society of Hospital Medicine.
Maternal mortality is set to be a top issue for 2018
Addressing issues around maternal mortality is going to be the top focus for the American Congress of Obstetricians and Gynecologists in 2018.
“It is will be the priority of my presidency here at ACOG,” President-elect Lisa Hollier, MD, said in an interview. Her term as president begins at the end of April 2018.

Rates of maternal mortality – defined as rates of death within 365 days of pregnancy – have become an increasingly prominent issue in the United States. Many states have created dedicated committees to examine the causes of increasing mortality and look for solutions. California, in particular, has had some success in reducing these rates.
To address the maternal mortality issue, ACOG is working on passing legislation through Congress that would give the federal government a role in funding these state-level committees.
“The main crux of the bill is to provide authorization for state maternal mortality, for funds to support state maternal mortality review committees,” said Rachel Tetlow, the director of federal affairs at ACOG. “We know that while a majority of states do have committees, there are still some who are struggling to stand them up and others that are struggling to fund them at full capacity. This legislation looks to support those state efforts to ensure that states really are able to move forward with reviewing maternal deaths and in some cases near misses in their states and recommend local state-based solutions.”
Another hot button issue that could affect maternal mortality is access to abortion.
“It is going to be interesting to see how those numbers shift as abortion providers are no longer available,” said Constance J. Bohon, MD, an ob.gyn. in Washington, D.C., and the ACOG state legislative chair from the District of Columbia. “For example, there is a concern that in states such as Texas, the maternal mortality rates may rise because of a lack of abortion providers.”
Attacks on abortion rights at both the state and federal level are expected in the coming year as well, Dr. Bohon said. She also expressed concerns over initiatives moving through some state houses that would hold doctors criminally liable for performing an abortion.
“What we have seen in the past is that these [abortion] bills come up really quickly without a whole lot of warning, so it’s difficult to say the specific legislation that we will see,” Ms. Tetlow said. “I am fairly confident that we will see at least one more vote in the House of Representatives and potentially one in the Senate ... before the 2018 elections.”
Maternal mortality could be symptomatic of another key issue in women’s health – an overall lack of access to adequate health care.

“One big issue is going to be how we get obstetrical care to women in communities where there is limited access,” she said. “We have got to figure out how to get all women, especially women in underserved areas who could be high risk into pregnancy care early on.”
Beyond that, ACOG is expecting that the women’s health services that have been in the cross hairs recently will continue to be so in 2018.
“2017 has been a year of just challenges and challenges and challenges for practicing ob.gyns. and patients, and we are expecting pretty much the same in 2018,” said Lucia DiVenere, a government and political affairs officer at ACOG.
Cuts to Medicaid, which House Speaker Paul Ryan (R-Wisc.) has identified as a key legislative priority for 2018, could create some significant issues for patients’ access to services.
“Roughly about 50% of deliveries are paid for by Medicaid,” Dr. Bohon said, noting that, for some states, that number can reach as high as 64%. “If those women don’t have access to care, it will be a disaster.”
The American Academy of Family Physicians will also be looking to maintain coverage of women’s health services in the Affordable Care Act.
“I think that our focus in 2018 is going to be around women’s continued access to comprehensive reproductive health care,” said AAFP President Michael Munger, MD. “Not only ensuring they have access to their breast, uterine, and cervical cancer screenings, prenatal maternity and postnatal care, but also preventive services.”
Dr. Munger singled out the Trump administration’s 2017 regulations allowing employers to opt out of providing contraception coverage for moral or religious reasons. “I think that is going to be a continued focus moving forward.”

“Three-quarters of women of childbearing age are in the workforce,” said Kandice Kapinos, PhD, of the Rand Corporation. “The studies on maternity leave show really positive effects of maternity leave on a wide range of child and maternal health outcomes.”
Not having an adequate amount of maternity leave can affect a woman’s ability to breastfeed her newborn, Dr. Kapinos added. “Breastfeeding can be difficult when you return to work,” she said. “Paid maternity leave would result in increases in breastfeeding. That has pretty big implications for health for women and children, which translates into pretty big cost savings.”
[email protected]
Addressing issues around maternal mortality is going to be the top focus for the American Congress of Obstetricians and Gynecologists in 2018.
“It is will be the priority of my presidency here at ACOG,” President-elect Lisa Hollier, MD, said in an interview. Her term as president begins at the end of April 2018.
Rates of maternal mortality – defined as rates of death within 365 days of pregnancy – have become an increasingly prominent issue in the United States. Many states have created dedicated committees to examine the causes of increasing mortality and look for solutions. California, in particular, has had some success in reducing these rates.
To address the maternal mortality issue, ACOG is working on passing legislation through Congress that would give the federal government a role in funding these state-level committees.
“The main crux of the bill is to provide authorization for state maternal mortality, for funds to support state maternal mortality review committees,” said Rachel Tetlow, the director of federal affairs at ACOG. “We know that while a majority of states do have committees, there are still some who are struggling to stand them up and others that are struggling to fund them at full capacity. This legislation looks to support those state efforts to ensure that states really are able to move forward with reviewing maternal deaths and in some cases near misses in their states and recommend local state-based solutions.”
Another hot button issue that could affect maternal mortality is access to abortion.
“It is going to be interesting to see how those numbers shift as abortion providers are no longer available,” said Constance J. Bohon, MD, an ob.gyn. in Washington, D.C., and the ACOG state legislative chair from the District of Columbia. “For example, there is a concern that in states such as Texas, the maternal mortality rates may rise because of a lack of abortion providers.”
Attacks on abortion rights at both the state and federal level are expected in the coming year as well, Dr. Bohon said. She also expressed concerns over initiatives moving through some state houses that would hold doctors criminally liable for performing an abortion.
“What we have seen in the past is that these [abortion] bills come up really quickly without a whole lot of warning, so it’s difficult to say the specific legislation that we will see,” Ms. Tetlow said. “I am fairly confident that we will see at least one more vote in the House of Representatives and potentially one in the Senate ... before the 2018 elections.”
Maternal mortality could be symptomatic of another key issue in women’s health – an overall lack of access to adequate health care.
“One big issue is going to be how we get obstetrical care to women in communities where there is limited access,” she said. “We have got to figure out how to get all women, especially women in underserved areas who could be high risk into pregnancy care early on.”
Beyond that, ACOG is expecting that the women’s health services that have been in the cross hairs recently will continue to be so in 2018.
“2017 has been a year of just challenges and challenges and challenges for practicing ob.gyns. and patients, and we are expecting pretty much the same in 2018,” said Lucia DiVenere, a government and political affairs officer at ACOG.
Cuts to Medicaid, which House Speaker Paul Ryan (R-Wisc.) has identified as a key legislative priority for 2018, could create some significant issues for patients’ access to services.
“Roughly about 50% of deliveries are paid for by Medicaid,” Dr. Bohon said, noting that, for some states, that number can reach as high as 64%. “If those women don’t have access to care, it will be a disaster.”
The American Academy of Family Physicians will also be looking to maintain coverage of women’s health services in the Affordable Care Act.
“I think that our focus in 2018 is going to be around women’s continued access to comprehensive reproductive health care,” said AAFP President Michael Munger, MD. “Not only ensuring they have access to their breast, uterine, and cervical cancer screenings, prenatal maternity and postnatal care, but also preventive services.”
Dr. Munger singled out the Trump administration’s 2017 regulations allowing employers to opt out of providing contraception coverage for moral or religious reasons. “I think that is going to be a continued focus moving forward.”
“Three-quarters of women of childbearing age are in the workforce,” said Kandice Kapinos, PhD, of the Rand Corporation. “The studies on maternity leave show really positive effects of maternity leave on a wide range of child and maternal health outcomes.”
Not having an adequate amount of maternity leave can affect a woman’s ability to breastfeed her newborn, Dr. Kapinos added. “Breastfeeding can be difficult when you return to work,” she said. “Paid maternity leave would result in increases in breastfeeding. That has pretty big implications for health for women and children, which translates into pretty big cost savings.”
[email protected]
MMRV vaccine cut chickenpox hospitalizations in young Brazilian children
(VZV) in children aged 1-4 years, said Marcelo Comerlato Scotta and associates at Pontifícia Universidade Católica do Rio Grande do Sul, Porto Alegre, Brazil.

Of the 69,791 admissions caused by VZV in Brazilian patients younger than 20 years, the rate of such hospitalizations for children aged 1-4 years significantly decreased from 27 cases per 100,000 children per year to 14 cases per 100,000 children per year after the vaccine was introduced, a reduction of 48% (P < .001). Changes in other age groups were not significant. That decrease in the rate of VZV admissions remained statistically significant in the vaccinated group after adjusting for seasonality (P < .001).
Direct costs of VZV-related admissions dropped 38% after introducing the MMRV vaccine, the researchers said. “Further studies are needed to evaluate long-term direct and indirect impact on the epidemiology of VZV infections.”
Read more in Vaccine (2017 Dec 1. doi: 10.1016/j.vaccine.2017.11.057.)
(VZV) in children aged 1-4 years, said Marcelo Comerlato Scotta and associates at Pontifícia Universidade Católica do Rio Grande do Sul, Porto Alegre, Brazil.
Of the 69,791 admissions caused by VZV in Brazilian patients younger than 20 years, the rate of such hospitalizations for children aged 1-4 years significantly decreased from 27 cases per 100,000 children per year to 14 cases per 100,000 children per year after the vaccine was introduced, a reduction of 48% (P < .001). Changes in other age groups were not significant. That decrease in the rate of VZV admissions remained statistically significant in the vaccinated group after adjusting for seasonality (P < .001).
Direct costs of VZV-related admissions dropped 38% after introducing the MMRV vaccine, the researchers said. “Further studies are needed to evaluate long-term direct and indirect impact on the epidemiology of VZV infections.”
Read more in Vaccine (2017 Dec 1. doi: 10.1016/j.vaccine.2017.11.057.)
FROM VACCINE
FDA approves Eskata for treatment of raised SKs
, according to Aclaris Therapeutics.
Approval for Eskata is based on results from two phase III clinical trials in which patients with raised SKs received either Eskata or a placebo for two doses, one at baseline and one after 2 weeks. Patients who received Eskata were more likely to have their SKs clear completely, compared with the placebo group.
Eskata is approved only for use in the office of a health care provider and is not for home usage.
The most common adverse events associated with Eskata are itching, stinging, crusting, swelling, redness, and scaling at the application site. Serious skin reactions are possible, and if the medication accidentally enters a patient’s eyes, the patient should flush his or her eyes with water for 15-30 minutes.
“This achievement delivers on Aclaris’ commitment to bringing innovative therapies to market that address significant unmet needs in dermatology. For the first time, with the approval of Eskata, patients will have access to an FDA-approved topical, non-invasive treatment for raised SKs,” Dr. Neal Walker, president and chief executive officer of Aclaris, said in written statement.
Zika virus testing shows low incidence in donor blood outside of high-infection areas
SAN DIEGO – The Zika virus is primarily transmitted via the Aedes mosquitoes, most commonly by A. aegypti, but recent outbreaks have revealed that nonvector transmission routes may also spread the infection. Some data suggest that blood transfusion can be a source of transmission.
While the number of contaminated blood donations remains very small, three studies presented at the American Association of Blood Banks annual meeting confirmed the ability of new investigational assays to detect Zika virus in donated blood.
There have been no confirmed transfusion-transmission cases of Zika virus in the United States, but as cases have now been documented in Brazil, the Food and Drug Administration issued revised guidance in August 2016 recommending that blood centers in all states and U.S. territories screen individual units of donated whole blood and blood components.
In the first report (C7-A01C), Paula Saá, PhD, and her colleagues at the American Red Cross initially investigated the use of mini-pool (MP)- nucleic acid testing (NAT) using the Procleix Zika Virus Assay (TMA). Testing was initially implemented on blood collections from Florida, Georgia, South Carolina, Mississippi, and Alabama – five states that were presumed to be at high risk of Zika virus infection. After the FDA revised its guidance, the protocol changed and testing was extended to all blood donations. The use of the MP-NAT was also converted to individual donation (ID)-NAT, and questions concerning travel history was also eventually discontinued.
However, even with the use of ID-NAT, the rate of confirmed positive donations was quite small but the associated cost was quite high, the researchers pointed out. “In the first year of testing at the American Red Cross, we identified nine confirmed positive donations,” said Dr. Saá.
The rate of confirmed positive donations was 1:354, 602 during the study period, but if the period up until September 2017 is taken into account (no additional cases were identified), the rate increases to 1:514,266. “This is a very low rate,” Dr. Saá said. “If there are no changes to the current guidelines, we have estimated that the yearly cost for the American Red Cross of testing will exceed $48 million.”
These figures extrapolate to approximately $6 million per confirmed case, according to the results of this study sponsored by the American Red Cross.
Confirmatory testing included repeat TMA; in addition, RT-PCR, serology and red blood cell count (RBC) TMA were performed. Estimates of viral loads were performed by endpoint TMA on plasma and RBCs.
A total of 2,288,855 blood donations had been tested as of April 2017, including 393,713 (17%) in 24,611 MPs, which did not detect any reactive donations.
Of the confirmed positive blood donors, three lived in Florida and two of those were from local transmission. Six individuals had traveled to a region highly active for Zika virus, and returned to the United States between 2 and 73 days before donating blood. Clinical symptoms were reported in two individuals with a travel risk; the other donors with a confirmed positive test (75%) remained asymptomatic. The longest period for detection in RBCs was 91 days thus far, but in the same person, detection in plasma was only 17 days.
“The data that we are showing here recommends a testing strategy with mini pool testing in areas at low risk of Zika transmission,” said Dr. Saá.
A second related study (C9-A01C), described the detection of ZIKV RNA in blood donations collected in U.S. states between April 3, 2016, and September 23, 2017, using the cobas Zika test, to be used on the cobas 6800/8800 Systems.
Although the test was investigational during the study period, it has just been approved by the FDA, said study author Lisa Pate, MD, who is with Roche Molecular Systems, the manufacturer of the cobas Zika test and cobas 6800/8800 systems. “This is now the first licensed test for screening blood donations for Zika virus.”
Overall, testing showed that Zika contamination in the U.S. blood supply was quite low. Only 0.001% of screened blood donations in United States were confirmed as true positives.
The development of this test came about after the first cases of Zika virus in the United States were detected in Puerto Rico in December 2015, explained Dr. Pate. Shortly after that, the FDA issued guidance prohibiting the use of blood collected in Zika active areas, unless the donations were screened.
“The impact was significant in Puerto Rico, as blood donations were halted, which then forced Puerto Rico to rely on imported blood,” she said.
About that time the FDA reached out to Roche and competitors to see if a test could be developed to screen for Zika.
The cobas Zika test was approved under an investigational new drug application on March 30, 2016, and although initially used to test blood samples in Puerto Rico, testing was expanded to include donor blood from all over the country.
Screening was conducted by individual donation testing, with all initial reactive results repeated in duplicate. Supplemental testing was also done, and included an alternative NAT (AltNAT) assay which was considered to be less sensitive than cobas Zika and serology testing for anti-Zika IgM and IgG. A donor confirmed Zika confirmed positive if at least one replicate of the repeat testing by cobas Zika was reactive on index donation or follow-up, reactive by AltNAT on the index donation, or positive for anti-Zika IgM on index or follow-up.
Screening was conducted at 12 testing labs in the United States, and more than 4 million donations were screened and 27 positive donations were confirmed. Overall, that amounted to less than 1 in 100,000.
“For donors in the U.S. with confirmed positive results, and for whom follow-up information is available, 84% of them report recent travel to Zika active areas,” noted Dr. Pate.
For Puerto Rico, 111,842 blood donations were screened and there were 356 confirmed positive results. The incidence is much higher than in United States, and was 1.27% during peak incidence in July 2016.
A third paper (C12-A01C), also reported on testing the blood supply in Singapore, which had reported its first locally transmitted Zika case last August, using the investigational Procleix ZIKV nucleic acid technology (NAT) assay.
The presence of Zika virus in screened blood was also quite low, with an incidence of only 0.0032%. The Procleix ZIKV assay was found to suitable for screening for Zika infection in an asymptomatic population, as it showed good analytical sensitivity and clinical performance.
The Zika virus came to Singapore in May 2016, imported by an individual who had recently traveled to Brazil, said Sally Lam, laboratory director, Blood Services Group, Health Sciences Authority, Singapore.
“Then in August we had 41 confirmed local Zika virus cases,” she said.
In 2016, there were 458 clinical Zika cases reported, with 8 clusters identified. This year, 63 cases have been reported to date, she said.
Mandatory Zika virus screening in donor blood with ID-NAT began after the onset of local outbreaks, and was implemented in January 2017. A total of 126,906 blood donations were screened.
Researchers in Singapore assessed the performance of the Procleix ZIKV NAT assay for universal blood donation screening. They screened all blood that was donated, beginning Oct. 1, 2016, a confirmed case was defined as having Zika RNA by PCR and/or Zika antibodies. Analytical sensitivity was assessed by use of 300 blinded frozen samples containing Zika virus and 25 negative controls. The performance of the Procleix ZIKV assay was also evaluated by use of samples from the local patient population.
Of four confirmed positive cases, only one was available for follow-up. “In the index donation, the viral load was quite high in the plasma but at 10 days, it was reduced to about 400 copies/mL in the plasma,” said Ms. Lam. “The donor did not develop any symptoms.”
The analytical sensitivity for the Procleix ZIKV assay was determined to be 2.1 copies/mL at 50% LOD and 10.0 copies/mL at 95% LOD, and it detected RNA in six out of nine patient samples for an 85.7% agreement with reference material, according to the researchers.
AT AABB17
FDA approves tofacitinib for psoriatic arthritis
(PsA) who have had an inadequate response or intolerance to methotrexate or other disease-modifying antirheumatic drugs (DMARDs), according to a Dec. 14 announcement from its manufacturer, Pfizer.
The approvals of tofacitinib (Xeljanz) at 5 mg twice daily and extended-release tofacitinib (Xeljanz XR) at 11 mg once daily are based on data from the phase 3 Oral Psoriatic Arthritis Trial (OPAL) clinical development program, which consisted of two pivotal studies, OPAL Broaden and OPAL Beyond.
In the OPAL Broaden study, 50% of patients who received tofacitinib 5 mg twice daily in combination with a nonbiologic DMARD achieved an ACR20 response at 3 months, compared with 33% of those treated with placebo (P equal to or less than .05). In the OPAL Beyond study, 50% of patients achieved an ACR20 response with tofacitinib 5 mg twice daily at 3 months, when compared with 24% of patients taking placebo (P equal to or less than .05).
Tofacitinib is the first and only Janus kinase inhibitor approved by the FDA to treat both moderate to severe rheumatoid arthritis and active PsA, Pfizer said in its announcement. It is noted that the recommended dose of tofacitinib is in combination with nonbiologic DMARDs, and use in combination with biologic DMARDs or with potent immunosuppressants such as azathioprine and cyclosporine is not recommended.
The safety of tofacitinib in these trials was consistent with the safety profile observed in rheumatoid arthritis patients. The most common adverse events that occurred in greater than 3% of patients on tofacitinib 5 mg twice daily were nasopharyngitis, upper respiratory tract infection, headache, and diarrhea.
Adolescents’ use of opioids, cigarettes is down; pot use is up
The positive trends in drug use among adolescents appear to be continuing – overall, according to the 2017 Monitoring the Future survey.
“This year, we have very good news, because ... the pattern of drug use among teenagers in the United States is continuing to go down, and it’s most notable in the case of opioid drugs,” Nora D. Volkow, MD, director of the National Institute on Drug Abuse said in a video interview posted by NIDA. “We are observing some of the lowest rates of opioid use that we have been monitoring through the survey.”
The national survey results of 8th, 10th, and 12th graders, released Dec. 14, found that lifetime, past-year, and past-month misuse of prescription pain medications are at lows that NIDA called historic. Among high school seniors, the survey showed, Vicodin use was at its lowest point since 2002 at 2% – a decrease from its high of 10.5% in 2003. Similarly, the reported use of OxyContin among high school seniors dropped from 5.5% in 2005 to 2.7% this year.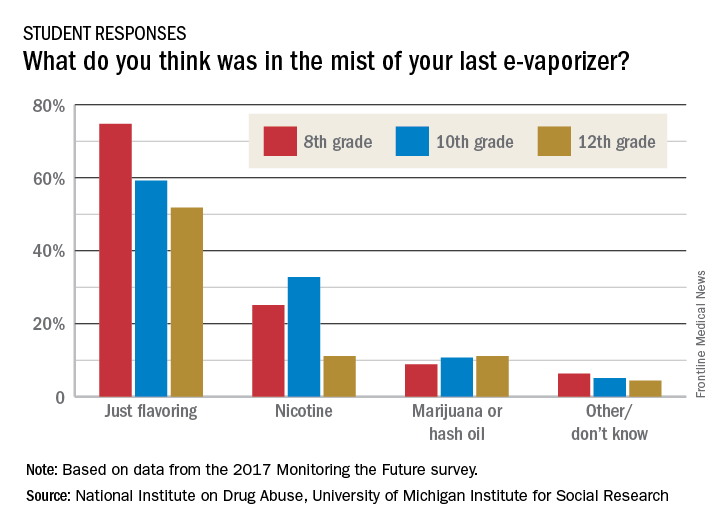
“We’re also seeing continuing decreases in cigarette smoking that are at the lowest levels that we’ve ever seen,” Dr. Volkow said in the interview. Daily cigarette use was 0.6% among 8th graders, 2.2% among 10th graders, and 4.2% among 12th graders in 2017. Those numbers were down from 10.4% and 18.3% among 8th and 10th graders in 1996, and a peak of 24.6 % of 12th graders in 1997.
Twelfth graders also reported lower past-year use of hookah: Use of that substance declined to 10% this year from 13% a year earlier.
As the use of traditional and smokeless tobacco has decreased, however, overall vaping levels held steady in 2017. For the first time, Monitoring the Future reported national, standard estimates of four categories of vaping: nicotine, marijuana, flavoring-only, and any vaping. The reported past-year rates of use under the “any vaping” category in the 2017 survey was 13.3% for 8th graders, 23.9% for 10th graders, and 27.8% for 12th graders. Vaping for flavoring only was the most popular option, and the highest rates were reported by 12th graders – who reported past-month use of 9.7%.
Dr. Volkow said a key concern is that it is unclear that adolescents know what substance they are vaping. Furthermore, adolescents who start vaping any substance are more likely to start to vape nicotine than are those who do not vape. “And we know that when an individual is exposed to nicotine and then gets exposed to another drug, that drug will be more rewarding,” Dr. Volkow said in a teleconference announcing the results.
Richard A. Miech, PhD, MPH, principal investigator of the survey, echoed Dr. Volkow’s concerns.
“These findings emphasize that vaping has progressed well beyond a cigarette alternative,” Dr. Miech said in a statement. “.”
Meanwhile, the past-year use of marijuana among adolescents climbed significantly by 1.3% in 2017, to 24% for all three grades levels combined.
“Historically marijuana use has gone up as adolescents see less risk of harm in using it,” Dr. Miech, of the University of Michigan, Ann Arbor, said in another statement. “We’ve found that the risk adolescents see in marijuana use has been steadily going down for years to the point that it is now at the lowest level we’ve seen in 4 decades.”
Reported overall illicit use of substances such as cocaine, anabolic steroids, and “synthetic marijuana” was relatively low.
“We should take encouragement from this year’s MTF results,” Dr. Volkow wrote on her blog. “Most substance use by middle and high school students is the lowest it has ever been, which suggests that prevention interventions and policies continue to have the desired effect. ...“There is also need to expand on prevention strategies to further reduce drug use – such as use of marijuana.”
The Monitoring the Future survey has been conducted since 1975. The 2017 survey, taken at the beginning of the year, is based on reports from almost 45,000 students in about 380 public and private secondary schools across the country. The survey is designed and conducted by research scientists at the University of Michigan, and is funded by NIDA.
SOURCE: Miech RA et al. 2017 Monitoring the Future
Key clinical point: Eighth, 10th, and 12th grade students are reporting higher rates of marijuana use.
Major finding: Teen misuse of Vicodin stood at 2% in 2017, a decline from a 10.5% peak in 2003.
Study details: Survey of 43,703 students from 360 public and private schools in the United States.
Disclosures: This survey is sponsored by a grant from the National Institute on Drug Abuse.
Source: Miech RA et al. 2017 Monitoring the Future.
Survey: Safety, rather than ethics, tops concerns about uterine transplantation
Uterine transplantation is generally seen as ethical, with acceptable risk levels for both donors and recipients, according to two parallel surveys given to women’s health physicians and to the general public.
The results, presented at the annual meeting of the American Society for Reproductive Medicine (ASRM), showed that “the majority of gynecologists surveyed find uterine transplantation to be an acceptable and ethical option for patients with uterine factor infertility,” wrote Pietro Bortoletto, MD, and his coauthors.
Similarly, about two-thirds of the general public found uterine transplantation permissible and ethical, according to responses from an age- and gender-balanced nationally representative survey.
The web-based surveys were designed to assess the personal beliefs of both the public and of physicians about the permissibility of uterine transplantation, and to evaluate respondents’ concerns about perceived risks associated with the procedure. Respondents in each survey were also asked to identify any ethical concerns they might have; recipients of both surveys received background information about uterine transplantation.
Dr. Bortoletto and his colleagues sent the survey by email to physicians who were members of ASRM and AAGL. Of the 4,216 physicians who were invited to take the survey, 447 (28.4%) completed it, though results were tallied just for the 414 respondents who were United States–based physicians.
Physician respondents, when asked whether women should be allowed to donate or receive a transplanted uterus, responded mostly in the affirmative: 20% strongly agreed and 36% agreed, while 23% were neutral. The remainder disagreed or strongly disagreed.
The possibility of complications for the recipient was identified as the top concern by about 50% of physician respondents. Next most concerning was fetal outcomes, of primary concern for about 28%, followed by complications to the donor and cost, each of which was of primary concern to 10% or fewer of the physician respondents.
The risk to donors of uterine transplantation was seen as acceptable by 73.7% of AAGL members and 71.7% of ASRM members; just over half of each group saw the risk as acceptable for the recipients and the infants, however.
Though over half of physician respondents (57.9% of AAGL members and 59.5% of ASRM members) felt that uterine transplantation should be a potential treatment option for women with absolute uterine factor infertility, fewer felt it should be covered by health insurance – 35.4% of AAGL members and 40.5% of ASRM members held this opinion.
Among the general public, over three quarters (78%) felt that women should be allowed to undergo uterine transplantation. Slightly fewer (67%) respondents to the public survey felt that uterine transplantation is ethical; those who agreed had slightly higher incomes and education levels (relative risk, 1.11 and 1.09, respectively). A similar number (66%) felt that uterine transplantation was an acceptable alternative to using a gestational carrier.
As was the case for physicians, fewer members of the general public (45%) agreed that health insurance should cover the procedure; here, women and Hispanics were more likely to agree (relative risk, 1.11 and 1.18, respectively).
The results of the survey of the general public were presented by first author Eduardo Hariton, MD, a coauthor of Dr. Bortoletto’s in the study of physician survey results. Both Dr. Hariton and Dr. Bortoletto are resident physicians in the department of obstetrics, gynecology, and reproductive biology at Brigham and Women’s Hospital, Boston.
The public survey was sent to a nationally representative sample, balanced by gender and age. Of 1,444 individuals who were recruited to receive the survey, 1,337 completed it. Ninety respondents reported that they found in vitro fertilization unacceptable; these responses were excluded, Dr. Hariton said in an interview. “We wanted to get at uterine transplantation per se,” rather than assisted reproductive technology in general.
Placing the ethics of uterine transplantation in a broader context, Dr. Bortoletto said in an interview that the United States is one of just a few countries that permit gestational surrogacy, with regulations varying by state. To his knowledge, he said, Ukraine and Russia are the only other two nations that permit compensation for surrogacy. Greece and the United Kingdom permit altruistic surrogacy, while gestational surrogacy of any sort is forbidden in the European Union. Thus, in those nations, uterine transplantation will be the only option for women who wish to bear their biological children.
“I think the main takeaway is that for people who had hesitation about [uterine transplantation], it was mainly around safety,” and not ethical concerns, said Dr. Hariton. “I was a bit surprised, but also encouraged, by the degree of support.”
Neither Dr. Hariton nor Dr. Bortoletto reported any conflicts of interest. The public opinion study was funded by an Expanding the Boundaries grant.
FDA approves premixed, low-volume colon-cleansing solution
in adults preparing to undergo colonoscopy, according to Ferring Pharmaceuticals.
The sodium picosulfate, magnesium oxide, and anhydrous citric acid oral solution is a relatively low-volume, premixed, cranberry-flavored solution, making it easier to use and more palatable for patients.
Sodium picosulfate, magnesium oxide, and anhydrous citric acid oral solution is approved with two dosing options: split dose, one dose the evening prior and one dose the morning of the procedure, or the day before dose, which involves taking both doses the day prior to the procedure. Day before dosing is an alternative and should be used when split dosing is not appropriate. After each dose of sodium picosulfate, magnesium oxide, and anhydrous citric acid oral solution, clear liquids should be consumed based on the dosing recommendation. The American College of Gastroenterology recommends the split-dose regimen because of its improved cleansing quality of the colon and better tolerability of the liquid volume by patients.
Patients with impaired renal function should exercise caution if using sodium picosulfate, magnesium oxide, and anhydrous citric acid oral solution as it may effect renal function. A more comprehensive list of safety information is available at www.clenpiq.com.
To help your patients understand and prepare for a colonoscopy, use AGA’s patient education materials at http://www.gastro.org/patient-care/procedures/colonoscopy.