User login
Flu study shows overall efficacy of LAIV, but weakness for one strain
Trivalent and quadrivalent inactivated influenza vaccine (IIV) and quadrivalent live attenuated influenza vaccine (LAIV) all gave statistically significant protection against any flu in U.S. children aged 2-17 years in 2015-2016, Katherine A. Poehling, MD, of Wake Forest University, Winston-Salem, N.C., and her associates reported in a study of more than 1,000 children.
“This study also adds to the clinical evidence suggesting that ,” the researchers concluded.
“The 2015-2016 season northern hemisphere trivalent IIV included A/California/7/2009 (H1N1)-like virus, a new A/Switzerland/9715293/2013 (H3N2)-like virus, and a new B/Phuket/3073/2013-like virus (Yamagata lineage),” the investigators noted. “Quadrivalent IIV was similar to trivalent IIV and also included B/Brisbane/60/2008-like virus (Victoria lineage). LAIV was similar to quadrivalent IIV, except that it contained A/Bolivia/559/2013.”
Of the 1,012 children enrolled, 59% were unvaccinated, 10% were given LAIV, 10% received trivalent IIV, 20% were given quadrivalent IIV, and 1% received IIV of “unknown valence.”
Vaccine efficacy against any influenza was 46% for LAIV and 65% for IIV, compared with no vaccination. But only IIV gave “significant protection against influenza A(H1N1)pdm09 strains in the total study population,” Dr. Poehling and her associates said. Vaccine efficacy against influenza A(H1N1)pdm09 strains was 50% for LAIV and 71% for IIV.
Read more in Clinical Infectious Diseases (2017 Oct 4. doi: 10.1093/cid/cix869).
FROM CLINICAL INFECTIOUS DISEASES
Pilot study: Novel spray powder stops GI bleeding
ORLANDO – TC-325 (Hemospray), a proprietary mineral powder blend developed for endoscopic hemostasis, promoted immediate hemostasis and prevented rebleeding in patients with malignant gastrointestinal bleeding in a randomized pilot trial.
Nine of 10 patients randomized to receive treatment with TC-325 experienced immediate hemostasis, compared with 4 of 10 patients randomized to receive standard of care (usually argon plasma coagulation, sometimes with radiation therapy), Alan Barkun, MD, of McGill University, Montreal reported at the World Congress of Gastroenterology at ACG 2017.
Five of six patients in the standard of care group who did not achieve immediate hemostasis crossed over to TC-325. Hemostasis was then achieved at index endoscopy in 80% of these crossovers, said Dr. Barkun, whose work received the 2017 GI Bleeding Category Award at the congress.
“So a total of 15 patients were treated with Hemospray among both groups, and 100% of them achieved immediate hemostasis,” he said. “We also assessed feasibility of recruitment and randomization, and it was indeed demonstrated in the context of this feasibility trial.”
Secondary measures, including the use of additional hemostatic approaches, blood transfusions, length of stay, and mortality, among others, did not differ between the two groups.
“This pilot trial is the first to assess TC-325 in patients with malignant bleeding, allowing us to plan for adequate powering and demonstrating feasibility for a larger multicenter, randomized, controlled trial,” he said. “Although this trial was not powered to seek statistically significant differences, the observed results suggest that TC-325 may indeed be a promising hemostatic modality in managing patients with malignant bleeding in achieving both immediate hemostasis and in our minds, surprisingly, perhaps delayed rebleeding.”
Hemospray, which is approved in Canada for upper/lower gastrointestinal bleeding of any etiology, as well as in Mexico and in some countries in Europe, Asia, and South America, works by forming a mechanical barrier over the bleeding site. The powder absorbs water, then acts both cohesively and adhesively to form that barrier, according to information from Cook Medical, which developed the product. It is not currently approved for this indication in the United States.
“An adequately powered randomized, controlled trial is now needed to better determine any beneficial downstream effect on subsequent rebleeding and health care resource use when compared to existing standard of care,” he concluded.
Dr. Barkun is an advisory committee/board member and consultant for Cook Medical and has received grant/research support from the company.
AT THE WORLD CONGRESS OF GASTROENTEROLOGY
Key clinical point:
Major finding: All 15 patients treated with Hemospray achieved immediate hemostasis.
Data source: A randomized pilot study of 20 patients.
Disclosures: Dr. Barkun is an advisory committee/board member and consultant for Cook Medical and has received grant/research support from the company.
Make The Diagnosis - November 2017
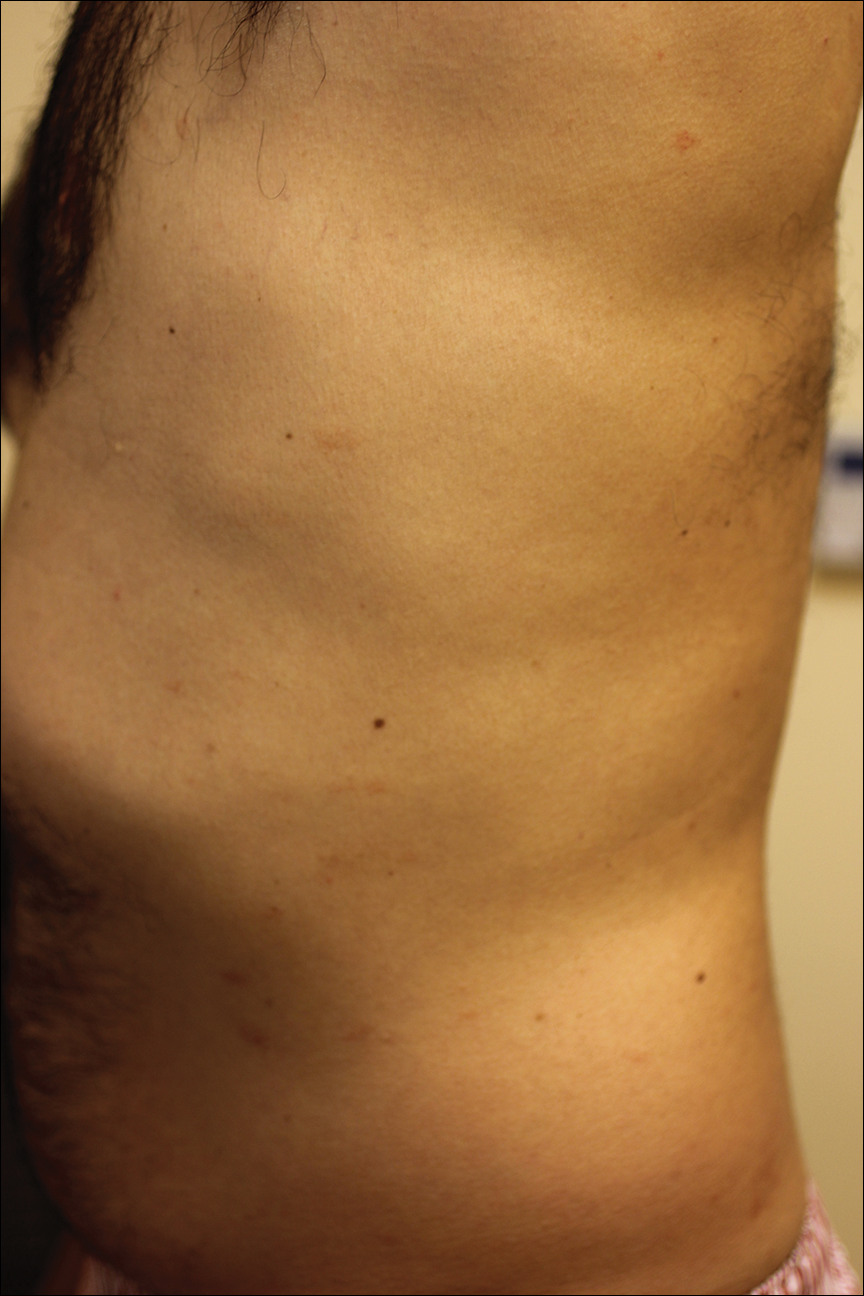
Angiosarcoma is also known as malignant hemangioendothelioma, hemangiosarcoma, and lymphangiosarcoma. It is an uncommon, high-grade malignant vascular neoplasm of the inner lining of blood vessels. Unlike most sarcomas, it occurs more superficially, most often on the head and neck (particularly on the scalp). This neoplasm occurs twice as often in males as it does in females. Angiosarcomas can occur in the breast after radiation therapy, as well as in the liver and spleen, but 60% are cutaneous.
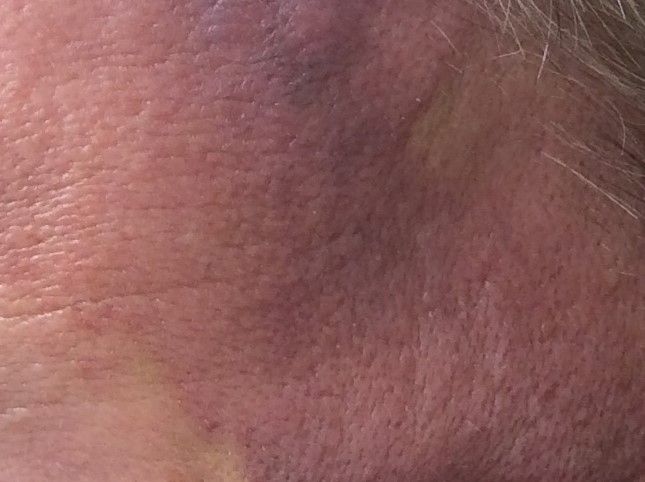
Clinical exam findings may show a violaceous lesion similar to a bruise on the head and neck that does not heal or bleeds when scratched; this is of particular concern when the lesion has appeared in an area of prior radiation therapy. Deeper tumors may be felt as a soft nodule. Ulceration may be present. Biopsy of the lesion will show hyperchromatic, pleomorphic tumor cells that dissect between collagen bundles with endothelial cells that are multilayered along with hemorrhage. Malignant cells stain positive for CD31, CD34, ERG, and FLI1.
For localized disease, surgery with wide local excision plus adjuvant radiation therapy can be used. For metastatic disease, chemotherapy is the treatment modality of choice. Unfortunately, prognosis is poor, with a 5-year survival rate of about 35% in nonmetastatic angiosarcoma cases. The majority of recurrences – approximately 75% – occur within 24 months of local treatment.
This case and photo were submitted by Parteek Singla, MD, of the division of dermatology at Washington University and at Barnes-Jewish Hospital, both in St. Louis, and by Susannah McClain, MD, of Three Rivers Dermatology, Coraopolis, Pa.

Dr. Bilu Martin is a board-certified dermatologist in private practice at Premier Dermatology, in Aventura, Fla. More diagnostic cases are available at edermatologynews.com. To submit a case for possible publication, send an email to [email protected].
Angiosarcoma is also known as malignant hemangioendothelioma, hemangiosarcoma, and lymphangiosarcoma. It is an uncommon, high-grade malignant vascular neoplasm of the inner lining of blood vessels. Unlike most sarcomas, it occurs more superficially, most often on the head and neck (particularly on the scalp). This neoplasm occurs twice as often in males as it does in females. Angiosarcomas can occur in the breast after radiation therapy, as well as in the liver and spleen, but 60% are cutaneous.
Clinical exam findings may show a violaceous lesion similar to a bruise on the head and neck that does not heal or bleeds when scratched; this is of particular concern when the lesion has appeared in an area of prior radiation therapy. Deeper tumors may be felt as a soft nodule. Ulceration may be present. Biopsy of the lesion will show hyperchromatic, pleomorphic tumor cells that dissect between collagen bundles with endothelial cells that are multilayered along with hemorrhage. Malignant cells stain positive for CD31, CD34, ERG, and FLI1.
For localized disease, surgery with wide local excision plus adjuvant radiation therapy can be used. For metastatic disease, chemotherapy is the treatment modality of choice. Unfortunately, prognosis is poor, with a 5-year survival rate of about 35% in nonmetastatic angiosarcoma cases. The majority of recurrences – approximately 75% – occur within 24 months of local treatment.
This case and photo were submitted by Parteek Singla, MD, of the division of dermatology at Washington University and at Barnes-Jewish Hospital, both in St. Louis, and by Susannah McClain, MD, of Three Rivers Dermatology, Coraopolis, Pa.
Dr. Bilu Martin is a board-certified dermatologist in private practice at Premier Dermatology, in Aventura, Fla. More diagnostic cases are available at edermatologynews.com. To submit a case for possible publication, send an email to [email protected].
A 62-year-old healthy man presented with a skin lesion located on the left scalp. The lesion was swollen and painful and had been present for 4 months. This lesion had not been treated in the past.
Levofloxacin-Induced Purpura Annularis Telangiectodes of Majocchi
To the Editor:
Purpura annularis telangiectodes of Majocchi (PATM) is a type of pigmented purpuric dermatosis (PPD). Patients present with nonblanchable, annular, symmetric, purpuric, and telangiectatic patches, often on the legs, with histology revealing a perivascular lymphocytic infiltrate and extravasated erythrocytes.1,2 A variety of medications have been linked to the development of PPD. We describe a case of levofloxacin-induced PATM.
RELATED ARTICLE: Granulomatous Changes Associated With Pigmented Purpuric Dermatosis
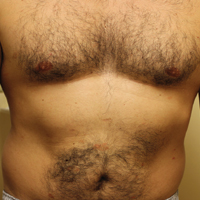
A 42-year-old man presented with a rash on the arms, trunk, abdomen, and legs of 1 month’s duration. He reported no associated itching, bleeding, or pain, and no history of a similar rash. He had a history of hypothyroidism and had been taking levothyroxine for years. He had no known allergies and no history of childhood eczema, asthma, or allergic rhinitis. Notably, the rash started shortly after the patient finished a 2-week course of levofloxacin, an antibiotic he had not taken in the past. The patient resided with his wife, 3 children, and a pet dog, and no family members had the rash. Prior to presentation, the patient had tried econazole cream and then triamcinolone acetonide cream 0.5% without any clinical improvement.
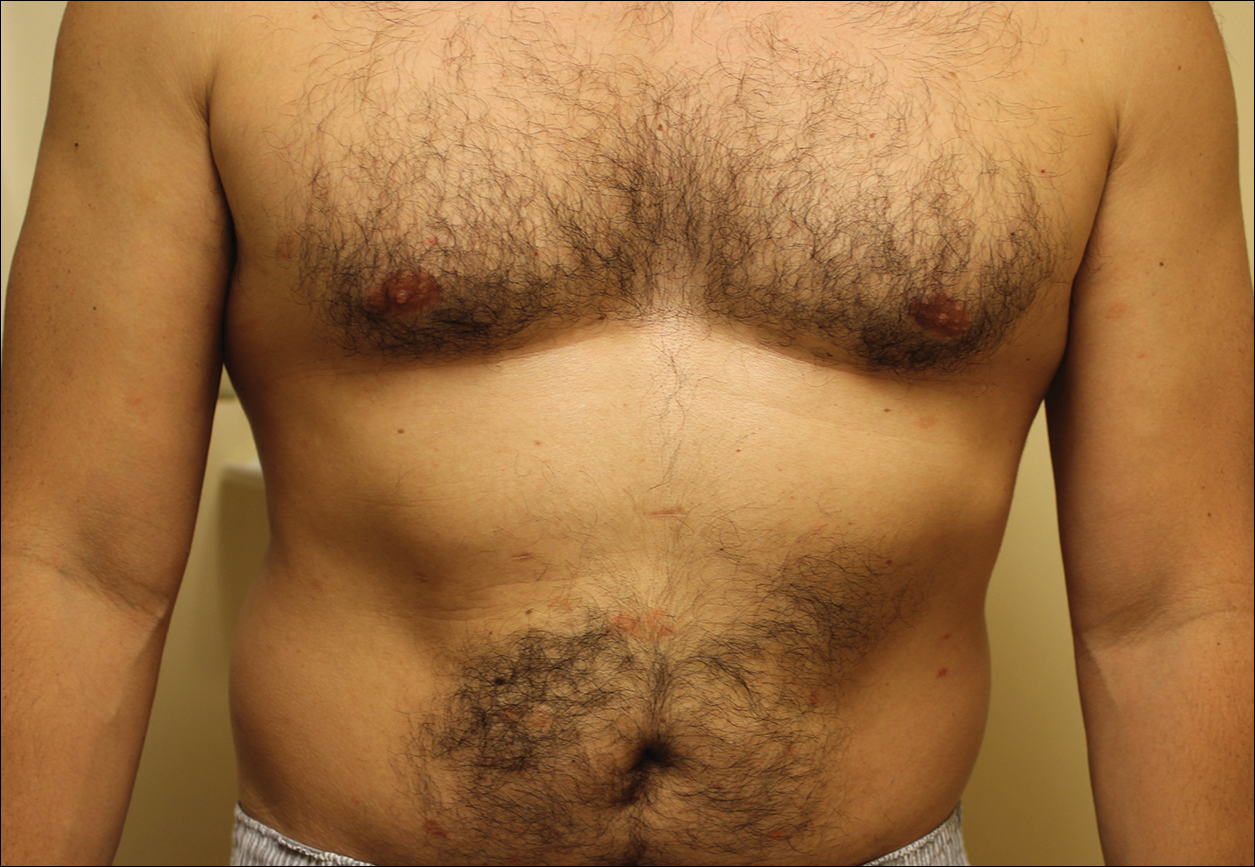
A complete review of systems was unremarkable. Physical examination revealed scattered, reddish brown, annular, nonscaly patches on the back, abdomen (Figure 1), arms, and legs with nonblanching petechiae within the patches.
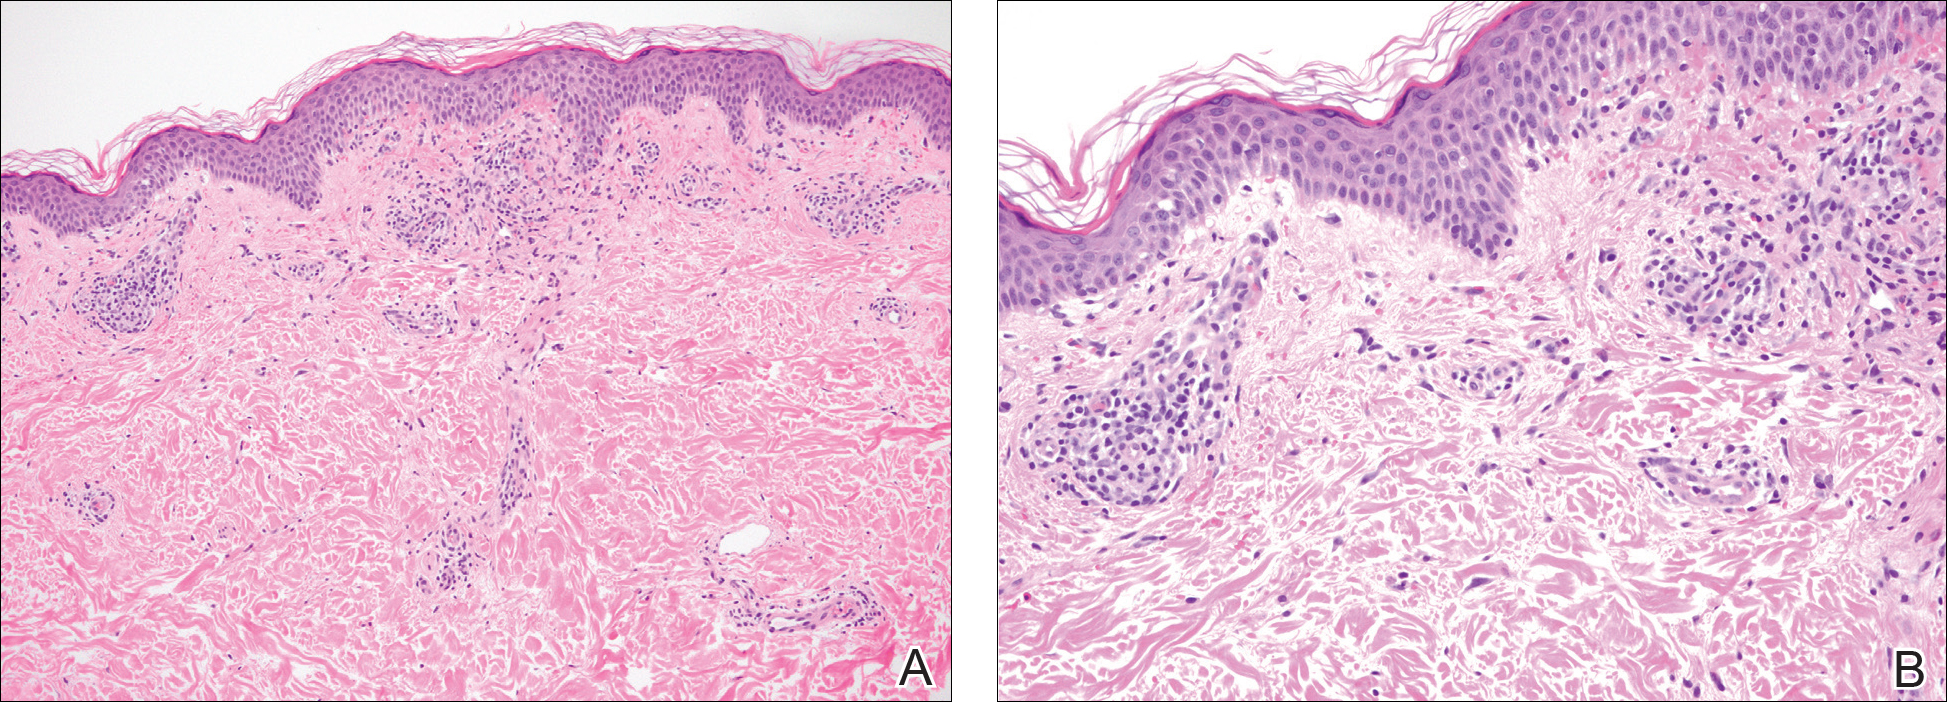
A punch biopsy of the left inner thigh demonstrated patchy interface dermatitis, superficial perivascular inflammation, and numerous extravasated red blood cells in the papillary dermis (Figure 2). The histologic features were compatible with the clinical impression of PATM. The patient presented for a follow-up visit 2 weeks later with no new lesions and the old lesions were rapidly fading (Figure 3).
Pigmented purpuric dermatoses are a group of conditions that have different clinical morphologies but similar histopathologic examinations.2 All PPDs are characterized by nonblanching, nonpalpable, purpuric lesions that often are bilaterally symmetrical and present on the legs.2,3 Although the precise etiology of these conditions is not known, most cases include a perivascular lymphocytic infiltrate along with the presence of extravasated erythrocytes and hemosiderin deposition in the dermis.2 Of note, PATM often is idiopathic and patients usually present with no associated comorbidities.3 The currently established PPDs include progressive pigmentary dermatosis (Schamberg disease), PATM, pigmented purpuric lichenoid dermatosis of Gougerot and Blum, lichen aureus, and eczematidlike purpura of Doucas and Kapetanakis.2,4
RELATED ARTICLE: Granulomatous Pigmented Purpuric Dermatosis
The lesions of PATM are symmetrically distributed on the bilateral legs and may be symptomatic in most cases, with severe pruritus being reported in several drug-induced PATM cases.3,5 Although the exact etiology of PPDs currently is unknown, some contributing factors that are thought to play a role include exercise, venous stasis, gravitational dependence, capillary fragility, hypertension, drugs, chemical exposure or ingestions, and contact allergy to dyes.3 Some of the drugs known to cause drug-induced PPDs fall into the class of sedatives, stimulants, antibiotics, cardiovascular drugs, vitamins, and nutritional supplements.3,6 Some medications that have been reported to cause PPDs include acetaminophen, aspirin, carbamazepine, diltiazem, furosemide, glipizide, hydralazine, infliximab, isotretinoin, lorazepam, minocycline, nitroglycerine, and sildenafil.3,7-15
Although the mechanism of drug-induced PPD is not completely understood, it is thought that the ingested substance leads to an immunologic response in the capillary endothelium, which results in a cell-mediated immune response causing vascular damage.3 The ingested substance may act as a hapten, stimulating antibody formation and immune-mediated injury, leading to the clinical presentation of nonblanching, symmetric, purpuric, telangiectatic, and atrophic patches at the site of injury.1,3
Levofloxacin is a broad-spectrum antibiotic that has activity against both gram-positive and gram-negative bacteria. It inhibits the enzymes DNA gyrase and topoisomerase IV, preventing bacteria from undergoing proper DNA synthesis.16 Our patient’s rash began shortly after a 2-week course of levofloxacin and faded within a few weeks of discontinuing the drug; the clinical presentation, time course, and histologic appearance of the lesions were consistent with the diagnosis of drug-induced PPD. Of note, solar capillaritis has been reported following a phototoxic reaction induced by levofloxacin.17 Our case differs in that our patient had annular lesions on both photoprotected and photoexposed skin.
The first-line interventions for the treatment of PPDs are nonpharmacologic, such as discontinuation of an offending drug or allergen or wearing supportive stockings if there are signs of venous stasis. Other interventions include the use of a medium- or high-potency topical corticosteroid once to twice daily to affected areas for 4 to 6 weeks.18 Some case series also have shown improvement with narrowband UVB treatment after 24 to 28 treatment sessions or with psoralen plus UVA phototherapy within 7 to 20 treatments.19,20 If the above measures are unsuccessful in resolving symptoms, other treatment alternatives may include pentoxifylline, griseofulvin, colchicine, cyclosporine, and methotrexate. The potential benefit of treatment must be weighed against the side-effect profile of these medications.2,21-24 Of note, oral rutoside (50 mg twice daily) and ascorbic acid (500 mg twice daily) were administered to 3 patients with chronic progressive pigmented purpura. At the end of the 4-week treatment period, complete clearance of skin lesions was seen in all patients with no adverse reactions noted.25
Despite these treatment options, PATM does not necessitate treatment given its benign course and often self-resolving nature.26 In cases of drug-induced PPD such as in our patient, discontinuation of the offending drug often may lead to resolution.
In summary, PATM is a PPD that has been associated with different etiologic factors. If PATM is suspected to be caused by a drug, discontinuation of the offending agent usually results in resolution of symptoms, as it did in our case with fading of lesions within a few weeks after the patient was no longer taking levofloxacin.
- Hale EK. Purpura annularis telangiectodes of Majocchi. Dermatol Online J. 2003;9:17.
- Hoesly FJ, Huerter CJ, Shehan JM. Purpura annularis telangiectodes of Majocchi: case report and review of the literature. Int J Dermatol. 2009;48:1129-1133.
- Kaplan R, Meehan SA, Leger M. A case of isotretinoin-induced purpura annularis telangiectodes of Majocchi and review of substance-induced pigmented purpuric dermatosis. JAMA Dermatol. 2014;150:182-184.
- Newton RC, Raimer SS. Pigmented purpuric eruptions. Dermatol Clin. 1985;3:165-169.
- Ratnam KV, Su WP, Peters MS. Purpura simplex (inflammatory purpura without vasculitis): a clinicopathologic study of 174 cases. J Am Acad Dermatol. 1991;25:642-647.
- Pang BK, Su D, Ratnam KV. Drug-induced purpura simplex: clinical and histological characteristics. Ann Acad Med Singapore. 1993;22:870-872.
- Abeck D, Gross GE, Kuwert C, et al. Acetaminophen-induced progressive pigmentary purpura (Schamberg’s disease). J Am Acad Dermatol. 1992;27:123-124.
- Lipsker D, Cribier B, Heid E, et al. Cutaneous lymphoma manifesting as pigmented, purpuric capillaries [in French]. Ann Dermatol Venereol. 1999;126:321-326.
- Peterson WC Jr, Manick KP. Purpuric eruptions associated with use of carbromal and meprobamate. Arch Dermatol. 1967;95:40-42.
- Nishioka K, Katayama I, Masuzawa M, et al. Drug-induced chronic pigmented purpura. J Dermatol. 1989;16:220-222.
- Voelter WW. Pigmented purpuric dermatosis-like reaction to topical fluorouracil. Arch Dermatol. 1983;119:875-876.
- Adams BB, Gadenne AS. Glipizide-induced pigmented purpuric dermatosis. J Am Acad Dermatol. 1999;41(5, pt 2):827-829.
- Tsao H, Lerner LH. Pigmented purpuric eruption associated with injection medroxyprogesterone acetate. J Am Acad Dermatol. 2000;43(2, pt 1):308-310.
- Koçak AY, Akay BN, Heper AO. Sildenafil-induced pigmented purpuric dermatosis. Cutan Ocul Toxicol. 2013;32:91-92.
- Nishioka K, Sarashi C, Katayama I. Chronic pigmented purpura induced by chemical substances. Clin Exp Dermatol. 1980;5:213-218.
- Drlica K, Zhao X. DNA gyrase, topoisomerase IV, and the 4-quinolones. Microbiol Mol Biol Rev. 1997;61:377-392.
- Rubegni P, Feci L, Pellegrino M, et al. Photolocalized purpura during levofloxacin therapy. Photodermatol Photoimmunol Photomed. 2012;28:105-107.
- Sardana K, Sarkar R, Sehgal VN. Pigmented purpuric dermatoses: an overview. Int J Dermatol. 2004;43:482-488.
- Fathy H, Abdelgaber S. Treatment of pigmented purpuric dermatoses with narrow-band UVB: a report of six cases. J Eur Acad Dermatol Venereol. 2011;25:603-606.
- Krizsa J, Hunyadi J, Dobozy A. PUVA treatment of pigmented purpuric lichenoid dermatitis (Gougerot-Blum). J Am Acad Dermatol. 1992;27(5, pt 1):778-780.
- Panda S, Malakar S, Lahiri K. Oral pentoxifylline vs topical betamethasone in Schamberg disease: a comparative randomized investigator-blinded parallel-group trial. Arch Dermatol. 2004;140:491-493.
- Tamaki K, Yasaka N, Osada A, et al. Successful treatment of pigmented purpuric dermatosis with griseofulvin. Br J Dermatol. 1995;132:159-160.
- Geller M. Benefit of colchicine in the treatment of Schamberg’s disease. Ann Allergy Asthma Immunol. 2000;85:246.
- Okada K, Ishikawa O, Miyachi Y. Purpura pigmentosa chronica successfully treated with oral cyclosporin A. Br J Dermatol. 1996;134:180-181.
- Reinhold U, Seiter S, Ugurel S, et al. Treatment of progressive pigmented purpura with oral bioflavonoids and ascorbic acid: an open pilot study in 3 patients. J Am Acad Dermatol. 1999;41(2, pt 1):207-208.
- Wang A, Shuja F, Chan A, et al. Unilateral purpura annularis telangiectodes of Majocchi in an elderly male: an atypical presentation. Dermatol Online J. 2013;19:19263.
To the Editor:
Purpura annularis telangiectodes of Majocchi (PATM) is a type of pigmented purpuric dermatosis (PPD). Patients present with nonblanchable, annular, symmetric, purpuric, and telangiectatic patches, often on the legs, with histology revealing a perivascular lymphocytic infiltrate and extravasated erythrocytes.1,2 A variety of medications have been linked to the development of PPD. We describe a case of levofloxacin-induced PATM.
RELATED ARTICLE: Granulomatous Changes Associated With Pigmented Purpuric Dermatosis
A 42-year-old man presented with a rash on the arms, trunk, abdomen, and legs of 1 month’s duration. He reported no associated itching, bleeding, or pain, and no history of a similar rash. He had a history of hypothyroidism and had been taking levothyroxine for years. He had no known allergies and no history of childhood eczema, asthma, or allergic rhinitis. Notably, the rash started shortly after the patient finished a 2-week course of levofloxacin, an antibiotic he had not taken in the past. The patient resided with his wife, 3 children, and a pet dog, and no family members had the rash. Prior to presentation, the patient had tried econazole cream and then triamcinolone acetonide cream 0.5% without any clinical improvement.
A complete review of systems was unremarkable. Physical examination revealed scattered, reddish brown, annular, nonscaly patches on the back, abdomen (Figure 1), arms, and legs with nonblanching petechiae within the patches.
A punch biopsy of the left inner thigh demonstrated patchy interface dermatitis, superficial perivascular inflammation, and numerous extravasated red blood cells in the papillary dermis (Figure 2). The histologic features were compatible with the clinical impression of PATM. The patient presented for a follow-up visit 2 weeks later with no new lesions and the old lesions were rapidly fading (Figure 3).
Pigmented purpuric dermatoses are a group of conditions that have different clinical morphologies but similar histopathologic examinations.2 All PPDs are characterized by nonblanching, nonpalpable, purpuric lesions that often are bilaterally symmetrical and present on the legs.2,3 Although the precise etiology of these conditions is not known, most cases include a perivascular lymphocytic infiltrate along with the presence of extravasated erythrocytes and hemosiderin deposition in the dermis.2 Of note, PATM often is idiopathic and patients usually present with no associated comorbidities.3 The currently established PPDs include progressive pigmentary dermatosis (Schamberg disease), PATM, pigmented purpuric lichenoid dermatosis of Gougerot and Blum, lichen aureus, and eczematidlike purpura of Doucas and Kapetanakis.2,4
RELATED ARTICLE: Granulomatous Pigmented Purpuric Dermatosis
The lesions of PATM are symmetrically distributed on the bilateral legs and may be symptomatic in most cases, with severe pruritus being reported in several drug-induced PATM cases.3,5 Although the exact etiology of PPDs currently is unknown, some contributing factors that are thought to play a role include exercise, venous stasis, gravitational dependence, capillary fragility, hypertension, drugs, chemical exposure or ingestions, and contact allergy to dyes.3 Some of the drugs known to cause drug-induced PPDs fall into the class of sedatives, stimulants, antibiotics, cardiovascular drugs, vitamins, and nutritional supplements.3,6 Some medications that have been reported to cause PPDs include acetaminophen, aspirin, carbamazepine, diltiazem, furosemide, glipizide, hydralazine, infliximab, isotretinoin, lorazepam, minocycline, nitroglycerine, and sildenafil.3,7-15
Although the mechanism of drug-induced PPD is not completely understood, it is thought that the ingested substance leads to an immunologic response in the capillary endothelium, which results in a cell-mediated immune response causing vascular damage.3 The ingested substance may act as a hapten, stimulating antibody formation and immune-mediated injury, leading to the clinical presentation of nonblanching, symmetric, purpuric, telangiectatic, and atrophic patches at the site of injury.1,3
Levofloxacin is a broad-spectrum antibiotic that has activity against both gram-positive and gram-negative bacteria. It inhibits the enzymes DNA gyrase and topoisomerase IV, preventing bacteria from undergoing proper DNA synthesis.16 Our patient’s rash began shortly after a 2-week course of levofloxacin and faded within a few weeks of discontinuing the drug; the clinical presentation, time course, and histologic appearance of the lesions were consistent with the diagnosis of drug-induced PPD. Of note, solar capillaritis has been reported following a phototoxic reaction induced by levofloxacin.17 Our case differs in that our patient had annular lesions on both photoprotected and photoexposed skin.
The first-line interventions for the treatment of PPDs are nonpharmacologic, such as discontinuation of an offending drug or allergen or wearing supportive stockings if there are signs of venous stasis. Other interventions include the use of a medium- or high-potency topical corticosteroid once to twice daily to affected areas for 4 to 6 weeks.18 Some case series also have shown improvement with narrowband UVB treatment after 24 to 28 treatment sessions or with psoralen plus UVA phototherapy within 7 to 20 treatments.19,20 If the above measures are unsuccessful in resolving symptoms, other treatment alternatives may include pentoxifylline, griseofulvin, colchicine, cyclosporine, and methotrexate. The potential benefit of treatment must be weighed against the side-effect profile of these medications.2,21-24 Of note, oral rutoside (50 mg twice daily) and ascorbic acid (500 mg twice daily) were administered to 3 patients with chronic progressive pigmented purpura. At the end of the 4-week treatment period, complete clearance of skin lesions was seen in all patients with no adverse reactions noted.25
Despite these treatment options, PATM does not necessitate treatment given its benign course and often self-resolving nature.26 In cases of drug-induced PPD such as in our patient, discontinuation of the offending drug often may lead to resolution.
In summary, PATM is a PPD that has been associated with different etiologic factors. If PATM is suspected to be caused by a drug, discontinuation of the offending agent usually results in resolution of symptoms, as it did in our case with fading of lesions within a few weeks after the patient was no longer taking levofloxacin.
- Hale EK. Purpura annularis telangiectodes of Majocchi. Dermatol Online J. 2003;9:17.
- Hoesly FJ, Huerter CJ, Shehan JM. Purpura annularis telangiectodes of Majocchi: case report and review of the literature. Int J Dermatol. 2009;48:1129-1133.
- Kaplan R, Meehan SA, Leger M. A case of isotretinoin-induced purpura annularis telangiectodes of Majocchi and review of substance-induced pigmented purpuric dermatosis. JAMA Dermatol. 2014;150:182-184.
- Newton RC, Raimer SS. Pigmented purpuric eruptions. Dermatol Clin. 1985;3:165-169.
- Ratnam KV, Su WP, Peters MS. Purpura simplex (inflammatory purpura without vasculitis): a clinicopathologic study of 174 cases. J Am Acad Dermatol. 1991;25:642-647.
- Pang BK, Su D, Ratnam KV. Drug-induced purpura simplex: clinical and histological characteristics. Ann Acad Med Singapore. 1993;22:870-872.
- Abeck D, Gross GE, Kuwert C, et al. Acetaminophen-induced progressive pigmentary purpura (Schamberg’s disease). J Am Acad Dermatol. 1992;27:123-124.
- Lipsker D, Cribier B, Heid E, et al. Cutaneous lymphoma manifesting as pigmented, purpuric capillaries [in French]. Ann Dermatol Venereol. 1999;126:321-326.
- Peterson WC Jr, Manick KP. Purpuric eruptions associated with use of carbromal and meprobamate. Arch Dermatol. 1967;95:40-42.
- Nishioka K, Katayama I, Masuzawa M, et al. Drug-induced chronic pigmented purpura. J Dermatol. 1989;16:220-222.
- Voelter WW. Pigmented purpuric dermatosis-like reaction to topical fluorouracil. Arch Dermatol. 1983;119:875-876.
- Adams BB, Gadenne AS. Glipizide-induced pigmented purpuric dermatosis. J Am Acad Dermatol. 1999;41(5, pt 2):827-829.
- Tsao H, Lerner LH. Pigmented purpuric eruption associated with injection medroxyprogesterone acetate. J Am Acad Dermatol. 2000;43(2, pt 1):308-310.
- Koçak AY, Akay BN, Heper AO. Sildenafil-induced pigmented purpuric dermatosis. Cutan Ocul Toxicol. 2013;32:91-92.
- Nishioka K, Sarashi C, Katayama I. Chronic pigmented purpura induced by chemical substances. Clin Exp Dermatol. 1980;5:213-218.
- Drlica K, Zhao X. DNA gyrase, topoisomerase IV, and the 4-quinolones. Microbiol Mol Biol Rev. 1997;61:377-392.
- Rubegni P, Feci L, Pellegrino M, et al. Photolocalized purpura during levofloxacin therapy. Photodermatol Photoimmunol Photomed. 2012;28:105-107.
- Sardana K, Sarkar R, Sehgal VN. Pigmented purpuric dermatoses: an overview. Int J Dermatol. 2004;43:482-488.
- Fathy H, Abdelgaber S. Treatment of pigmented purpuric dermatoses with narrow-band UVB: a report of six cases. J Eur Acad Dermatol Venereol. 2011;25:603-606.
- Krizsa J, Hunyadi J, Dobozy A. PUVA treatment of pigmented purpuric lichenoid dermatitis (Gougerot-Blum). J Am Acad Dermatol. 1992;27(5, pt 1):778-780.
- Panda S, Malakar S, Lahiri K. Oral pentoxifylline vs topical betamethasone in Schamberg disease: a comparative randomized investigator-blinded parallel-group trial. Arch Dermatol. 2004;140:491-493.
- Tamaki K, Yasaka N, Osada A, et al. Successful treatment of pigmented purpuric dermatosis with griseofulvin. Br J Dermatol. 1995;132:159-160.
- Geller M. Benefit of colchicine in the treatment of Schamberg’s disease. Ann Allergy Asthma Immunol. 2000;85:246.
- Okada K, Ishikawa O, Miyachi Y. Purpura pigmentosa chronica successfully treated with oral cyclosporin A. Br J Dermatol. 1996;134:180-181.
- Reinhold U, Seiter S, Ugurel S, et al. Treatment of progressive pigmented purpura with oral bioflavonoids and ascorbic acid: an open pilot study in 3 patients. J Am Acad Dermatol. 1999;41(2, pt 1):207-208.
- Wang A, Shuja F, Chan A, et al. Unilateral purpura annularis telangiectodes of Majocchi in an elderly male: an atypical presentation. Dermatol Online J. 2013;19:19263.
Practice Point
- Purpura annularis telangiectodes of Majocchi, a type of pigmented purpuric dermatosis, may on occasion be triggered by a medication; therefore, a careful medication history may prove to be an important part of the workup for this eruption.
Adverse effects low in long-term crisaborole eczema study
, suggesting that the therapy has the potential to treat atopic dermatitis without the side effects of the current topical treatments, said Lawrence F. Eichenfield, MD, of Rady Children’s Hospital, San Diego, and his associates.
The multicenter, long-term, open-label safety study of 48 weeks assessed 517 patients with mild to moderate atopic dermatitis after they had finished a 28-day phase 3 study of 2% crisaborole ointment. The patients in the extension study were told to apply crisaborole twice daily for 28 days, with an off-treatment period initiated if their disease severity was clear or almost clear after the 28 days. They were told to stop the treatment if they had no improvement in their Investigator’s Static Global Assessment score after three consecutive treatment periods.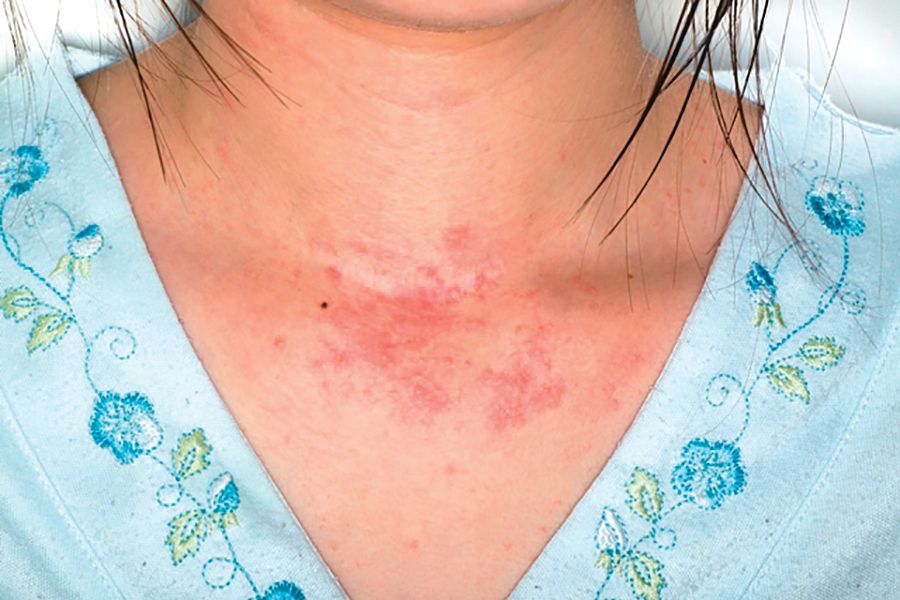
Treatment-related adverse events occurred in 10% of patients; 86% of them were mild or moderate. Dermatitis atopic – defined as worsening, exacerbation, flare, or flare-up – occurred in 3% of patients; application-site burning or stinging in 2%; and application-site infection in 1%. The median duration was 18 days for dermatitis atopic, 5 days for application-site burning or stinging, and 12 days for application-site infection. The frequency of these adverse events did not increase over time, the investigators said.
Most patients (78%) did not need rescue therapy, 79% later resumed crisaborole therapy at a later date, and 76% stayed in the study until week 48 or the end of the study.

Read more in the Journal of the American Academy of Dermatology (2017 Oct;77[4]:641-9).
, suggesting that the therapy has the potential to treat atopic dermatitis without the side effects of the current topical treatments, said Lawrence F. Eichenfield, MD, of Rady Children’s Hospital, San Diego, and his associates.
The multicenter, long-term, open-label safety study of 48 weeks assessed 517 patients with mild to moderate atopic dermatitis after they had finished a 28-day phase 3 study of 2% crisaborole ointment. The patients in the extension study were told to apply crisaborole twice daily for 28 days, with an off-treatment period initiated if their disease severity was clear or almost clear after the 28 days. They were told to stop the treatment if they had no improvement in their Investigator’s Static Global Assessment score after three consecutive treatment periods.
Treatment-related adverse events occurred in 10% of patients; 86% of them were mild or moderate. Dermatitis atopic – defined as worsening, exacerbation, flare, or flare-up – occurred in 3% of patients; application-site burning or stinging in 2%; and application-site infection in 1%. The median duration was 18 days for dermatitis atopic, 5 days for application-site burning or stinging, and 12 days for application-site infection. The frequency of these adverse events did not increase over time, the investigators said.
Most patients (78%) did not need rescue therapy, 79% later resumed crisaborole therapy at a later date, and 76% stayed in the study until week 48 or the end of the study.
Read more in the Journal of the American Academy of Dermatology (2017 Oct;77[4]:641-9).
FROM THE JOURNAL OF THE AMERICAN ACADEMY OF DERMATOLOGY
MACRA in a nutshell
Much has been written over the past year about the Medicare Access and CHIP Reauthorization Act of 2015 (MACRA), and its primary vehicle, the Merit-Based Incentive System (MIPS); but many small practices seem reluctant to take it seriously, despite the fact that it puts yet another significant percentage of our Medicare reimbursements at risk.
Those much-publicized attempts to “repeal and replace” the Affordable Care Act earlier this year undoubtedly contributed to the apathy; but the ACA is apparently here to stay, and the first MIPS “performance period” ends on Dec. 31, so now would be an excellent time to get up to speed. Herewith, the basics:
Each practice must choose between two payment tracks: either MIPS or one of the so-called Alternate Payment Models (APM). The MIPS track will use the four reporting programs just mentioned to compile a composite score between 0 and 100 each year for every practitioner, based on four performance metrics: quality measures listed in Qualified Clinical Data Registries (QCDRs), such as Approved Quality Improvement (AQI); total resources used by each practitioner, as measured by VBM; “improvement activities” (MOC); and MU, in some new, as-yet-undefined form. You can earn a bonus of 4% of reimbursement in 2019, rising to 5% in 2020, 7% in 2021, and 9% in 2022 – or you can be penalized those amounts (“negative adjustments”) if your performance doesn’t measure up.
The final MACRA regulations, issued last October, allow a more gradual MIPS implementation that should decrease the penalty burden for small practices, at least initially. For example, you can avoid a penalty in 2019 – but not qualify for a bonus – by reporting your performance in only one quality-of-care or practice-improvement category by the end of this year. A decrease in penalties, however, means a smaller pot for bonuses – and reprieves will be temporary.
The alternative, APM, is difficult to discuss, as very few models have been presented – or even defined – to date. Only Accountable Care Organizations (ACOs) have been introduced in any quantity, and most of those have failed miserably in real-world settings. The Episode of Care (EOC) model, which pays providers a fixed amount for all services rendered in a bundle (“episode”) of care, has been discussed at some length, but this remains untested and in the end may turn out to be just another variant of capitation.
So, which to choose? Long term, I strongly suggest that everyone prepare for the APM track as soon as APMs that are better and more efficient become available, as it appears that there will be more financial security there, with less risk of penalties; but you will probably need to start in the MIPS program, since most projections indicate that the great majority of practitioners, particularly those in smaller operations, will do so.
While some may be prompted to join a larger organization or network to decrease their risk of MIPS penalties and gain quicker access to the APM track – which may well be one of the Center for Medicare & Medicaid Services’ surreptitious goals in introducing MACRA in the first place – there are steps that those individuals and small groups who choose to remain independent can take now to maximize their chances of landing on the bonus side of the MIPS ledger.

If the alphabet soup above has your head swimming, join the club – you’re far from alone; but don’t be discouraged. CMS has indicated its willingness to make changes aimed at decreasing the administrative burden and, in its words, “making the transition to MACRA as simple and as flexible as possible.”
Dr. Eastern practices dermatology and dermatologic surgery in Belleville, N.J. He is the author of numerous articles and textbook chapters, and is a longtime monthly columnist for Dermatology News. Write to him at [email protected].
Much has been written over the past year about the Medicare Access and CHIP Reauthorization Act of 2015 (MACRA), and its primary vehicle, the Merit-Based Incentive System (MIPS); but many small practices seem reluctant to take it seriously, despite the fact that it puts yet another significant percentage of our Medicare reimbursements at risk.
Those much-publicized attempts to “repeal and replace” the Affordable Care Act earlier this year undoubtedly contributed to the apathy; but the ACA is apparently here to stay, and the first MIPS “performance period” ends on Dec. 31, so now would be an excellent time to get up to speed. Herewith, the basics:
Each practice must choose between two payment tracks: either MIPS or one of the so-called Alternate Payment Models (APM). The MIPS track will use the four reporting programs just mentioned to compile a composite score between 0 and 100 each year for every practitioner, based on four performance metrics: quality measures listed in Qualified Clinical Data Registries (QCDRs), such as Approved Quality Improvement (AQI); total resources used by each practitioner, as measured by VBM; “improvement activities” (MOC); and MU, in some new, as-yet-undefined form. You can earn a bonus of 4% of reimbursement in 2019, rising to 5% in 2020, 7% in 2021, and 9% in 2022 – or you can be penalized those amounts (“negative adjustments”) if your performance doesn’t measure up.
The final MACRA regulations, issued last October, allow a more gradual MIPS implementation that should decrease the penalty burden for small practices, at least initially. For example, you can avoid a penalty in 2019 – but not qualify for a bonus – by reporting your performance in only one quality-of-care or practice-improvement category by the end of this year. A decrease in penalties, however, means a smaller pot for bonuses – and reprieves will be temporary.
The alternative, APM, is difficult to discuss, as very few models have been presented – or even defined – to date. Only Accountable Care Organizations (ACOs) have been introduced in any quantity, and most of those have failed miserably in real-world settings. The Episode of Care (EOC) model, which pays providers a fixed amount for all services rendered in a bundle (“episode”) of care, has been discussed at some length, but this remains untested and in the end may turn out to be just another variant of capitation.
So, which to choose? Long term, I strongly suggest that everyone prepare for the APM track as soon as APMs that are better and more efficient become available, as it appears that there will be more financial security there, with less risk of penalties; but you will probably need to start in the MIPS program, since most projections indicate that the great majority of practitioners, particularly those in smaller operations, will do so.
While some may be prompted to join a larger organization or network to decrease their risk of MIPS penalties and gain quicker access to the APM track – which may well be one of the Center for Medicare & Medicaid Services’ surreptitious goals in introducing MACRA in the first place – there are steps that those individuals and small groups who choose to remain independent can take now to maximize their chances of landing on the bonus side of the MIPS ledger.
If the alphabet soup above has your head swimming, join the club – you’re far from alone; but don’t be discouraged. CMS has indicated its willingness to make changes aimed at decreasing the administrative burden and, in its words, “making the transition to MACRA as simple and as flexible as possible.”
Dr. Eastern practices dermatology and dermatologic surgery in Belleville, N.J. He is the author of numerous articles and textbook chapters, and is a longtime monthly columnist for Dermatology News. Write to him at [email protected].
Chromoblastomycosis Infection From a House Plant
To the Editor:
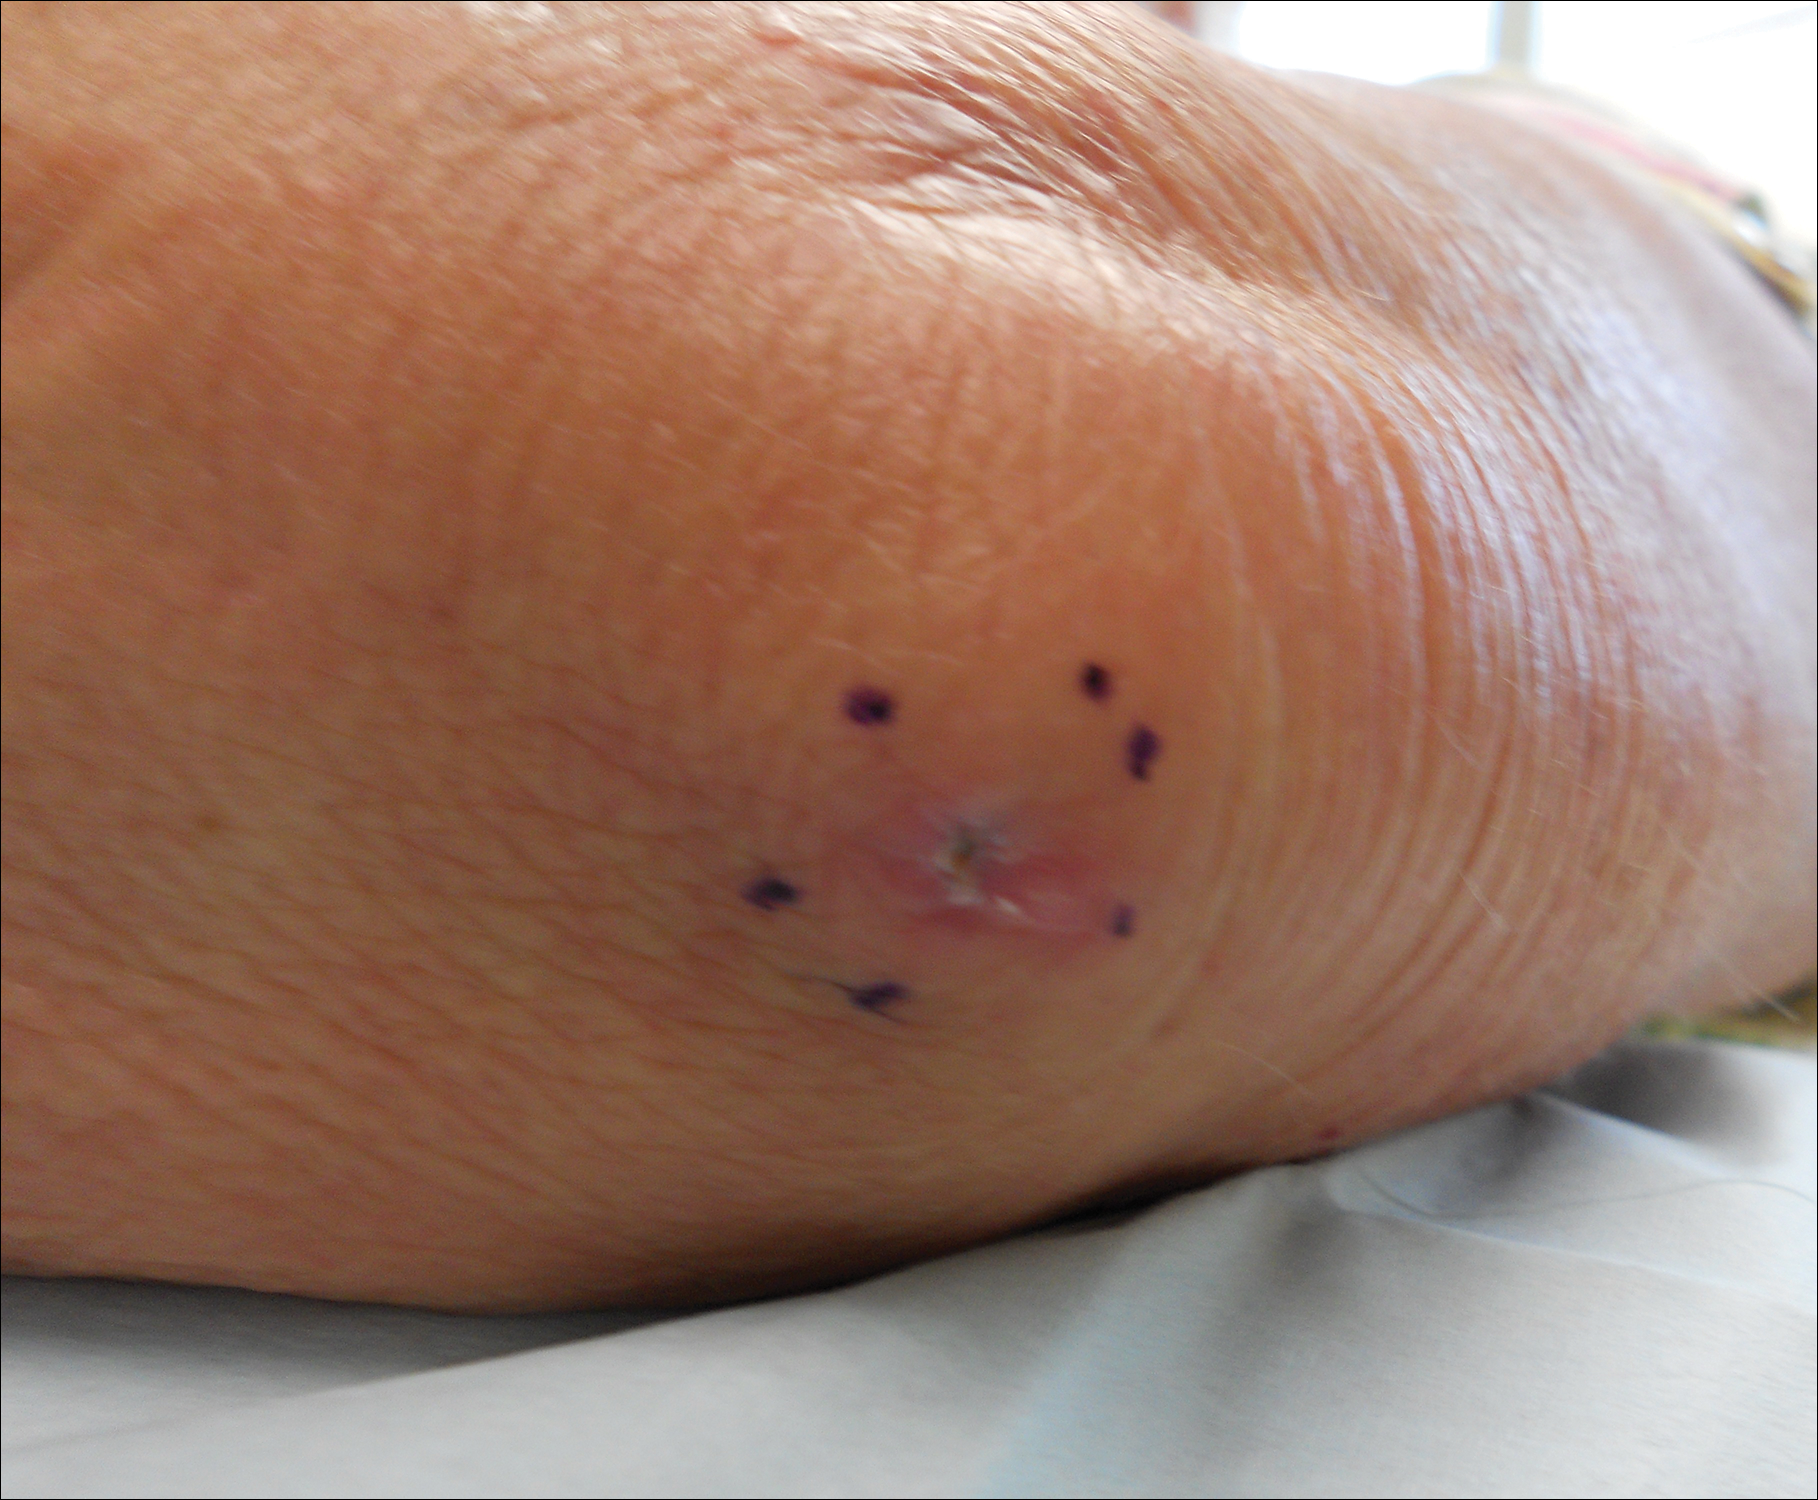
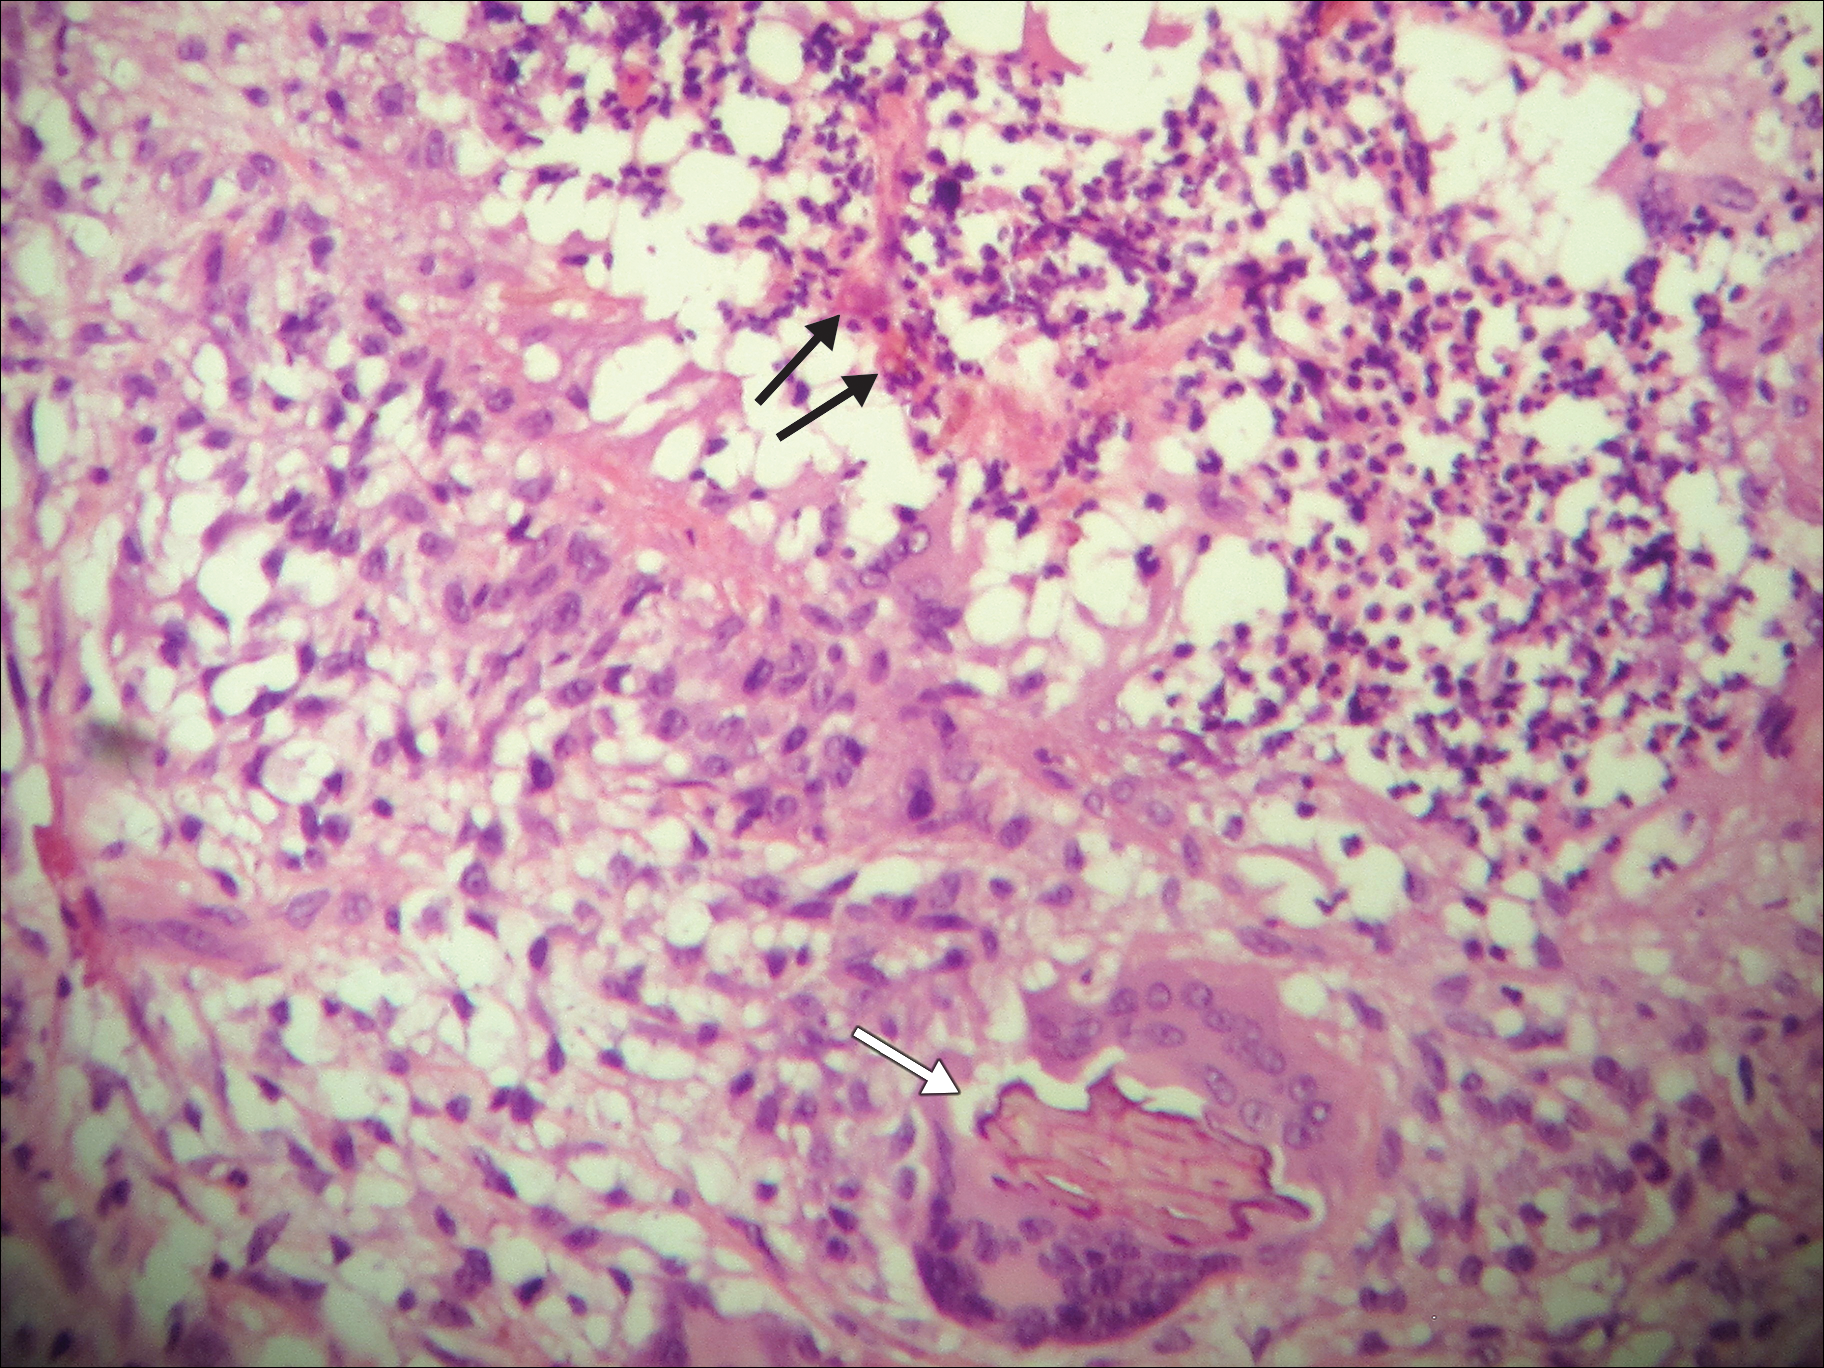
A 69-year-old woman with no history of immunodeficiency presented 1 month after a thorn from her locally grown Madagascar palm plant (Pachypodium lamerei) pierced the skin. The patient developed a painful nodule at the site on the left elbow (Figure 1). An excisional biopsy by an outside dermatologist was performed, which showed granulomatous inflammation within the dermis with epidermal hyperplasia and the presence of golden brown spherules (medlar bodies). The diagnosis was a dermal fungal infection consistent with chromoblastomycosis. A curative surgical excision was performed, and medlar bodies were seen adjacent to a polarizable foreign body consistent with plant material on histology (Figure 2). Because the lesion was localized, adjuvant medical treatment was not deemed necessary. The patient has not had any recurrence in the last 1.5 years since the resection.
The categorization of chromoblastomycosis includes a chronic fungal infection of the cutaneous and subcutaneous tissues by dematiaceous (pigmented) fungi. This definition is such that there are a multitude of organisms that can be the primary cause of this diagnosis. Generally, infection follows a traumatic permeation of the skin by a foreign body contaminated by the causative organism in agricultural workers. The most common dematiaceous pathogens are Fonsecaea pedrosoi, Phialophora verrucosa, and Cladosporium carrionii; however, the specific causative organism varies heavily on geographic location. With inoculation by a foreign body, a small papule develops at the site of the lesion. Several years after the primary infection, nodules and verrucous erythematous plaques develop in the same area, and patients present with concerns of pain and pruritus.1 Lesions usually are localized to the initial area of inoculation, generally a break in the skin by the offending foreign body, on the legs, arms, or hands, but hematogenous or lymphatic dissemination with distant transmission due to scratching also can occur. Ulceration due to secondary bacterial infection is another possible manifestation, resulting in a foul odor and less commonly lymphedema. Rarely, squamous cell carcinoma is a complication.2
RELATED ARTICLE: Fungal Foes: Presentations of Chromoblastomycosis Post–Hurricane Ike
On histopathology, thick-walled sclerotic bodies termed medlar bodies or copper pennies are pathognomonic for chromoblastomycosis and represent the fungal elements. Grossly, black dots can be seen on the skin in the affected areas from the transepidermal elimination of the fungi.1,2 However, there is no specificity for determining the causative organism in this manner, or even with culture, as it is difficult to differentiate the species morphologically. More advanced tests can help, such as polymerase chain reaction or enzyme-linked immunosorbent assay, where available.2 Hematoxylin and eosin stain also shows epidermal hyperplasia and dermal mononuclear infiltrate.
Treatment modalities include surgical excision, cryotherapy, pharmacologic treatment, and combination therapy. Localized lesions often can be resected, but more severe infections can require pharmacologic treatment. Unfortunately, there tends to be a high risk for relapse with most antifungal modalities. The combination of itraconazole and terbinafine has been shown to offer the best medical therapy with lower risk for refractoriness to treatment by producing a synergistic effect between the 2 antifungals.2,3 Many surgical treatments often are combined with oral antifungals to try to attain complete eradication in deep or extensive lesions, as seen in a case in which oral terbinafine was used prior to surgery to reduce the size of the lesion, followed by complete resection.4 With localized lesions that are resectable, a wide and deep incision often can be curative. Cryotherapy also may be coupled with surgical excision or pharmacologic therapy. Most literature suggests that cryotherapy or the use of antifungals prior to excision offers improved outcomes.2,5 Prognosis tends to be good for chromoblastomycoses, particularly with smaller lesions. Complete eradication varies greatly on the size and depth of the lesion, independent of the causative pathogen.
Our patient’s presentation with chromoblastomycosis is unique because of the source of infection, which was a plant grown from seeds in a local nursery in South Florida and then sold to the patient. The majority of chromoblastomycosis infections occur in agricultural workers, typically in tropical climates such as South and Central America, the Caribbean, and Mexico.1,2 Historically, infections in the United States have been uncommon, with the majority presenting in patients on prolonged corticosteroid therapy or with other immunosuppressive conditions.6,7
- Torres-Guerrero E, Isa-Isa R, Isa M, et al. Chromoblastomycosis. Clin Dermatol. 2012;30:403-408.
- Ameen M. Managing chromoblastomycosis. Trop Doct. 2010;40:65-67.
- Zhang J, Xi L, Lu C, et al. Successful treatment for chromoblastomycosis caused by Fonsecaea monophora: a report of three cases in Guangdong, China. Mycoses. 2009;52:176-181.
- Tamura K, Matsuyama T, Yahagi E, et al. A case of chromomycosis treated by surgical therapy combined with preceded oral administration of terbinafine to reduce the size of the lesion. Tokai J Exp Clin Med. 2012;37:6-10.
- Patel U, Chu J, Patel R, et al. Subcutaneous dematiaceous fungal infection. Dermatol Online J. 2011;17:19.
- Basílio FM, Hammerschmidt M, Mukai MM, et al. Mucormycosis and chromoblastomycosis occurring in a patient with leprosy type 2 reaction under prolonged corticosteroid and thalidomide therapy. An Bras Dermatol. 2012;87:767-771.
- Parente JN, Talhari C, Ginter-Hanselmayer G, et al. Subcutaneous phaeohyphomycosis in immunocompetent patients: two new cases caused by Exophiala jeanselmei and Cladophialophora carrionii. Mycoses. 2001;54:265-269.
To the Editor:
A 69-year-old woman with no history of immunodeficiency presented 1 month after a thorn from her locally grown Madagascar palm plant (Pachypodium lamerei) pierced the skin. The patient developed a painful nodule at the site on the left elbow (Figure 1). An excisional biopsy by an outside dermatologist was performed, which showed granulomatous inflammation within the dermis with epidermal hyperplasia and the presence of golden brown spherules (medlar bodies). The diagnosis was a dermal fungal infection consistent with chromoblastomycosis. A curative surgical excision was performed, and medlar bodies were seen adjacent to a polarizable foreign body consistent with plant material on histology (Figure 2). Because the lesion was localized, adjuvant medical treatment was not deemed necessary. The patient has not had any recurrence in the last 1.5 years since the resection.
The categorization of chromoblastomycosis includes a chronic fungal infection of the cutaneous and subcutaneous tissues by dematiaceous (pigmented) fungi. This definition is such that there are a multitude of organisms that can be the primary cause of this diagnosis. Generally, infection follows a traumatic permeation of the skin by a foreign body contaminated by the causative organism in agricultural workers. The most common dematiaceous pathogens are Fonsecaea pedrosoi, Phialophora verrucosa, and Cladosporium carrionii; however, the specific causative organism varies heavily on geographic location. With inoculation by a foreign body, a small papule develops at the site of the lesion. Several years after the primary infection, nodules and verrucous erythematous plaques develop in the same area, and patients present with concerns of pain and pruritus.1 Lesions usually are localized to the initial area of inoculation, generally a break in the skin by the offending foreign body, on the legs, arms, or hands, but hematogenous or lymphatic dissemination with distant transmission due to scratching also can occur. Ulceration due to secondary bacterial infection is another possible manifestation, resulting in a foul odor and less commonly lymphedema. Rarely, squamous cell carcinoma is a complication.2
RELATED ARTICLE: Fungal Foes: Presentations of Chromoblastomycosis Post–Hurricane Ike
On histopathology, thick-walled sclerotic bodies termed medlar bodies or copper pennies are pathognomonic for chromoblastomycosis and represent the fungal elements. Grossly, black dots can be seen on the skin in the affected areas from the transepidermal elimination of the fungi.1,2 However, there is no specificity for determining the causative organism in this manner, or even with culture, as it is difficult to differentiate the species morphologically. More advanced tests can help, such as polymerase chain reaction or enzyme-linked immunosorbent assay, where available.2 Hematoxylin and eosin stain also shows epidermal hyperplasia and dermal mononuclear infiltrate.
Treatment modalities include surgical excision, cryotherapy, pharmacologic treatment, and combination therapy. Localized lesions often can be resected, but more severe infections can require pharmacologic treatment. Unfortunately, there tends to be a high risk for relapse with most antifungal modalities. The combination of itraconazole and terbinafine has been shown to offer the best medical therapy with lower risk for refractoriness to treatment by producing a synergistic effect between the 2 antifungals.2,3 Many surgical treatments often are combined with oral antifungals to try to attain complete eradication in deep or extensive lesions, as seen in a case in which oral terbinafine was used prior to surgery to reduce the size of the lesion, followed by complete resection.4 With localized lesions that are resectable, a wide and deep incision often can be curative. Cryotherapy also may be coupled with surgical excision or pharmacologic therapy. Most literature suggests that cryotherapy or the use of antifungals prior to excision offers improved outcomes.2,5 Prognosis tends to be good for chromoblastomycoses, particularly with smaller lesions. Complete eradication varies greatly on the size and depth of the lesion, independent of the causative pathogen.
Our patient’s presentation with chromoblastomycosis is unique because of the source of infection, which was a plant grown from seeds in a local nursery in South Florida and then sold to the patient. The majority of chromoblastomycosis infections occur in agricultural workers, typically in tropical climates such as South and Central America, the Caribbean, and Mexico.1,2 Historically, infections in the United States have been uncommon, with the majority presenting in patients on prolonged corticosteroid therapy or with other immunosuppressive conditions.6,7
- Torres-Guerrero E, Isa-Isa R, Isa M, et al. Chromoblastomycosis. Clin Dermatol. 2012;30:403-408.
- Ameen M. Managing chromoblastomycosis. Trop Doct. 2010;40:65-67.
- Zhang J, Xi L, Lu C, et al. Successful treatment for chromoblastomycosis caused by Fonsecaea monophora: a report of three cases in Guangdong, China. Mycoses. 2009;52:176-181.
- Tamura K, Matsuyama T, Yahagi E, et al. A case of chromomycosis treated by surgical therapy combined with preceded oral administration of terbinafine to reduce the size of the lesion. Tokai J Exp Clin Med. 2012;37:6-10.
- Patel U, Chu J, Patel R, et al. Subcutaneous dematiaceous fungal infection. Dermatol Online J. 2011;17:19.
- Basílio FM, Hammerschmidt M, Mukai MM, et al. Mucormycosis and chromoblastomycosis occurring in a patient with leprosy type 2 reaction under prolonged corticosteroid and thalidomide therapy. An Bras Dermatol. 2012;87:767-771.
- Parente JN, Talhari C, Ginter-Hanselmayer G, et al. Subcutaneous phaeohyphomycosis in immunocompetent patients: two new cases caused by Exophiala jeanselmei and Cladophialophora carrionii. Mycoses. 2001;54:265-269.
Practice Points
- Chromoblastomycosis is an uncommon fungal infection that should be considered in cases of traumatic injuries to the skin.
- Biopsies of growing or nonhealing nodules will demonstrate characteristic golden brown spherules (medlar bodies).
- In localized cases, surgical excision may be curative.
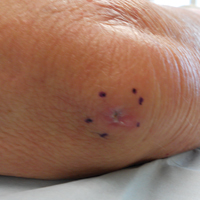
Observational Study of Peripheral Intravenous Catheter Outcomes in Adult Hospitalized Patients: A Multivariable Analysis of Peripheral Intravenous Catheter Failure
INTRODUCTION
Peripheral intravenous catheter (PIV) insertion is the fastest, simplest, and most cost-effective method to gain vascular access, and it is used for short-term intravenous (IV) fluids, medications, blood products, and contrast media.1 It is the most common invasive device in hospitalized patients,2 with up to 70% of hospital patients receiving a PIV.3 Unacceptable PIV failure rates have been reported as high as 69%.4-7 Failure is most frequently due to phlebitis (vein wall irritation/inflammation), occlusion (blockage), infiltration or extravasation (IV fluids/vesicant therapy entering surrounding tissue), partial dislodgement or accidental removal, leakage, and infection.4,6,8 These failures have important implications for patients, who endure the discomfort of PIV complications and catheter replacements, and healthcare staff and budgets.
To reduce the incidence of catheter failure and avoid preventable PIV replacements, a clear understanding of why catheters fail is required. Previous research has identified that catheter gauge,9-11 insertion site,12-14 and inserter skill10,15 have an impact on PIV failure. Limitations of existing research are small study sizes,16-18 retrospective design,19 or secondary analysis of an existing data set; all potentially introduce sampling bias.10,20
To overcome these potential biases, we developed a data collection instrument based on the catheter-associated risk factors described in the literature,9-11,13 and other potential insertion and maintenance risks for PIV failure (eg, multiple insertion attempts, medications administered), with data collected prospectively. The study aim was to improve patient outcomes by identifying PIV insertion and maintenance risk factors amenable to modification through education or alternative clinical interventions, such as catheter gauge selection or insertion site.
METHODS
Study Design and Participants
We conducted this prospective cohort study in a large tertiary hospital in Queensland, Australia. Ethics committee approval was obtained from the hospital (HREC/14/QRBW/76) and Griffith University (NRS/26/14/HREC). The study was registered with the Australian New Zealand Clinical Trials Registry (ACTRN12615000738527). Patients in medical and surgical wards were screened Monday, Wednesday, and Friday between October 2014 and December 2015. Patients over 18 years with a PIV (BD InsyteTM AutoguardTM BC; Becton Dickinson, Franklin Lakes, NJ) inserted within 24 hours, and who were able to provide written informed consent, were eligible and recruited sequentially. Patients classified as palliative by the treating clinical team were excluded.
Sample Size Calculation
The “10 events per variable” rule was used to determine the sample size required to study 50 potential risk factors.21,22 This determined that 1000 patients, with an average of 1.5 PIVs each and an expected PIV failure of 30% (500 events), were required.
Data Collection
At recruitment, baseline patient information was collected by a research nurse (ReNs) (demographics, admitting diagnosis, comorbidities, skin type,23 and vein condition) and entered into an electronic data platform supported by Research Electronic Data Capture (REDCap).24 Baseline data also included catheter variables (eg, gauge, insertion site, catheterized vein) and insertion details (eg, department of insertion, inserting clinician, number of insertion attempts). We included every PIV the participant had during their admission until hospital discharge or insertion of a central venous access device. PIV sites were reviewed Monday, Wednesday, and Friday by ReNs for site complications (eg, redness, pain, swelling, palpable cord). Potential risk factors for failure were also recorded (eg, infusates and additives, antibiotic type and dosage, flushing regimen, number of times the PIV was accessed each day for administration of IV medications or fluids, dressing type and condition, securement method for the catheter and tubing, presence of extension tubing or 3-way taps, patient mobility status, and delirium). A project manager trained and supervised ReNs for protocol compliance and audited study data quality. We considered PIV failure to have occurred if the catheter had complications at removal identified by the ReNs assessment, from medical charts, or by speaking to the patient and beside nurse. We grouped the failures in 1 of 3 types: (1) occlusion or infiltration, defined as blockage, IV fluids moving into surrounding tissue, induration, or swelling greater than 1 cm from the insertion site at or within 24 hours of removal; (2) phlebitis, defined as per clinicians’ definitions or one or more of the following signs and symptoms: pain or tenderness scored at 2 or more on a 1 to 10 increasing severity pain scale, or redness or a palpable cord (either extending greater than 1 cm from the insertion site) at or within 24 hours of PIV removal; and (3) dislodgement (partial or complete). If multiple complications were present, all were recorded.
Statistical Analysis
Data were downloaded from REDcap to Stata 14.2 (StataCorp., College Station, TX) for data management and analysis. Missing data were not imputed. Nominal data observations were collapsed into a single observation per device. Patient and device variables were described as frequencies and proportions, means and standard deviations, or medians and interquartile ranges. Failure incidence rates were calculated, and a Kaplan-Meier survival curve was plotted. In general, Cox proportional hazards models were fitted (Efron method) to handle tied failures (clustering by patient). Variables significant at P < 0.20 on univariable analyses were subjected to multivariable regression. Generally, the largest category was set as referent. Correlations between variables were checked (Spearman’s rank for binary variables, R-squared value of linear regressions for continuous/categorical or continuous/continuous variables). Correlations were considered significant if r > 0.5 and the lower bound of the 95% confidence interval (CI) was >0.5 (where calculated). Covariate interactions were explored, and effects at P < 0.05 noted. The 4 steps of multivariable model building were (1) baseline covariates only with manual stepwise removal of covariates at P ≥ 0.05, (2) treatment covariates only with manual stepwise removal of covariates at P ≥ 0.05, (3) a combination of the derived models from (1) and (2) and manual stepwise removal of covariates at P ≥ 0.05, and (4) manual stepwise addition and removal (at P ≥ 0.05) of variables dropped during the previous steps and interaction testing. Final models were checked as follows: global proportional-hazards assumption test, concordance probability (that predictions and outcomes were in agreement), and Nelson-Aalen cumulative hazard function plotted against the Cox-Snell residuals.
RESULTS
Patient Characteristics
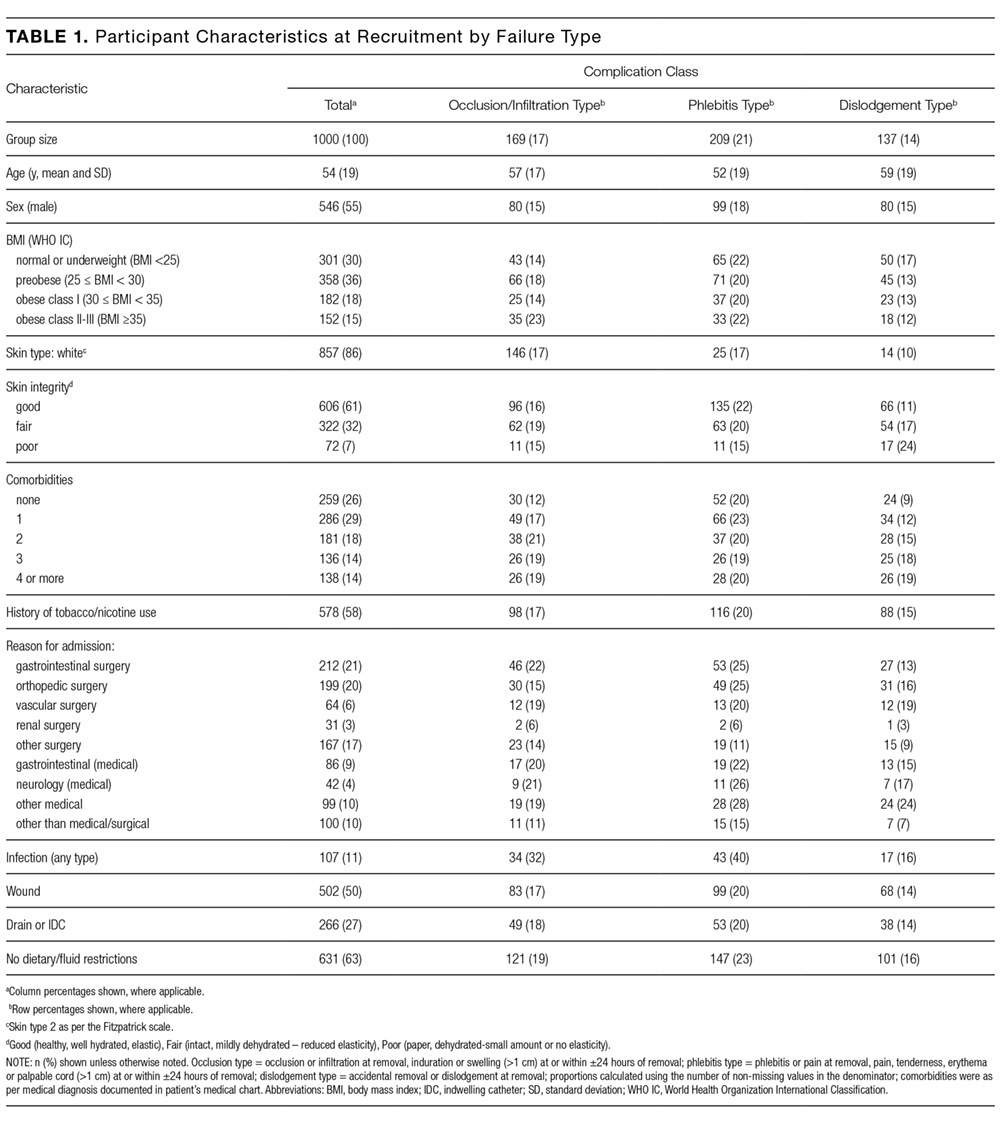
In total, 1000 patients with 1578 PIVs were recruited. The average age was 54 years and the majority were surgical patients (673; 67%). Almost half of patients (455; 46%) had 2 or more comorbidities, and 334 (33%) were obese (body mass index greater than 30). Sample characteristics are shown by the type of catheter failure in Table 1.
PIV Characteristics
All 1578 PIVs were followed until removal, with only 7 PIVs (0.44%) having missing data for the 3 outcomes of interest (these were coded as nonfailures for analysis). Sixty percent of participants had more than 1 PIV followed in the study. Doctors and physicians inserted 1278 (83%) catheters. A total of 550 (35%) were placed in the ward, with 428 (28%) inserted in the emergency department or ambulance. A third of the catheters (540; 34%) were 18-gauge or larger in diameter, and 1000 (64%) were located in the cubital fossa or hand. Multiple insertion attempts were required to place 315 (23%) PIVs. No PIVs were inserted with ultrasound, as this is rarely used in this hospital. The flushing policy was for the administration of 9% sodium chloride every 8 hours if no IV medications or fluids were ordered. Table 2 contains further details of device-related characteristics. Although the hospital policy was for catheter removal by 72 hours, dwell time ranged from <1 to 14 days, with an average of 2.4 days.
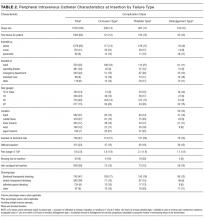
PIV Complications
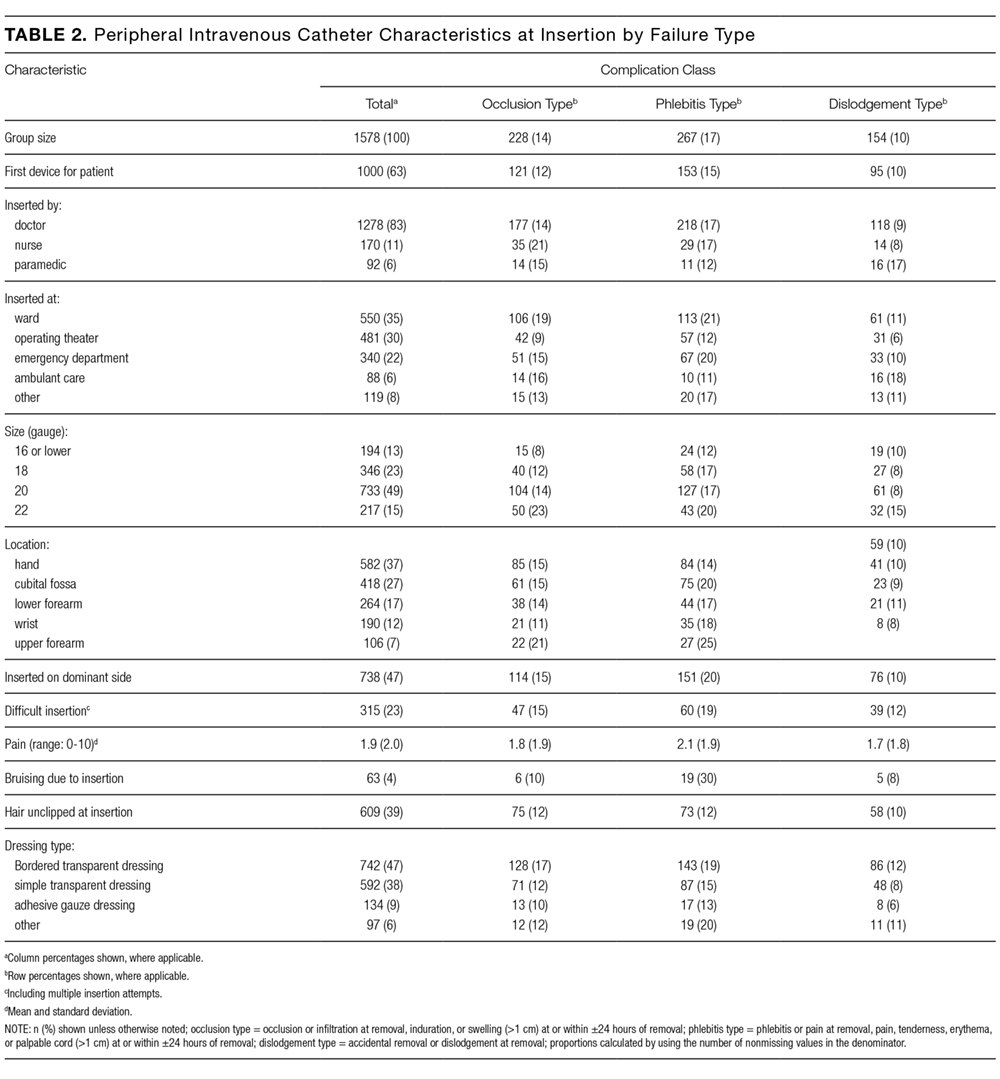
Catheter failure (any cause) occurred in 512 (32%) catheters, which is a failure rate of 136 per 1000 catheter days (95% CI, 125-148). A total of 346 patients out of 1000 (35%) had at least 1 failed PIV during the study. Failures were 267 phlebitis (17%), 228 occlusion/infiltration (14%), and/or 154 dislodgement (10%; Figure), with some PIVs exhibiting multiple concurrent complications (Table 2).
Multivariable AnalysisOcclusion/Infiltration
The multivariable analysis (Table 3) showed occlusion or infiltration was statistically significantly associated with female patients (hazard ratio [HR], 1.48; 95% CI, 1.10-2.00), with a 22-gauge catheter (HR, 1.43; 95% CI, 1.02-2.00), IV flucloxacillin (HR, 1.98; 95% CI, 1.19-3.31), and with frequent PIV access (HR, 1.12; 95% CI, 1.04-1.21; ie, with each increase of 1 in the mean medications/fluids administrations per day, relative PIV failure increased 112%). Less occlusion and infiltration were statistically significantly associated with securement by using additional nonsterile tape (HR, 0.46; 95% CI, 0.33-0.63), elasticized tubular bandages (HR, 0.49; 95% CI, 0.35-0.70 ), or other types of additional securement for the PIV (HR, 0.35; 95% CI, 0.26-0.47).
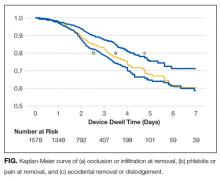
Phlebitis

Phlebitis was statistically significantly associated with female patients (HR, 1.81; 95% CI, 1.40-2.35), bruising at the insertion site (HR, 2.16; 95% CI, 1.26-3.71), insertion in patients’ dominant side (HR, 1.39; 95% CI, 1.09-1.77), IV flucloxicillin (HR, 2.01; 95% CI, 1.26-3.21), or with frequent PIV access (HR, 1.14; 95% CI, 1.08-1.21). Older age, (HR, 0.99; 95% CI, 0.98-0.99; ie, each year older was associated with 1% less phlebitis), securement with additional nonsterile tape (HR, 0.63; 95% CI, 0.48-0.82) or with any other additional securement (HR, 0.53; 95% CI, 0.39-0.70), or the administration of IV cephazolin (HR, 0.63; 95% CI, 0.44-0.89) were associated with lower phlebitis risk.
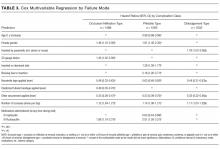
Dislodgement
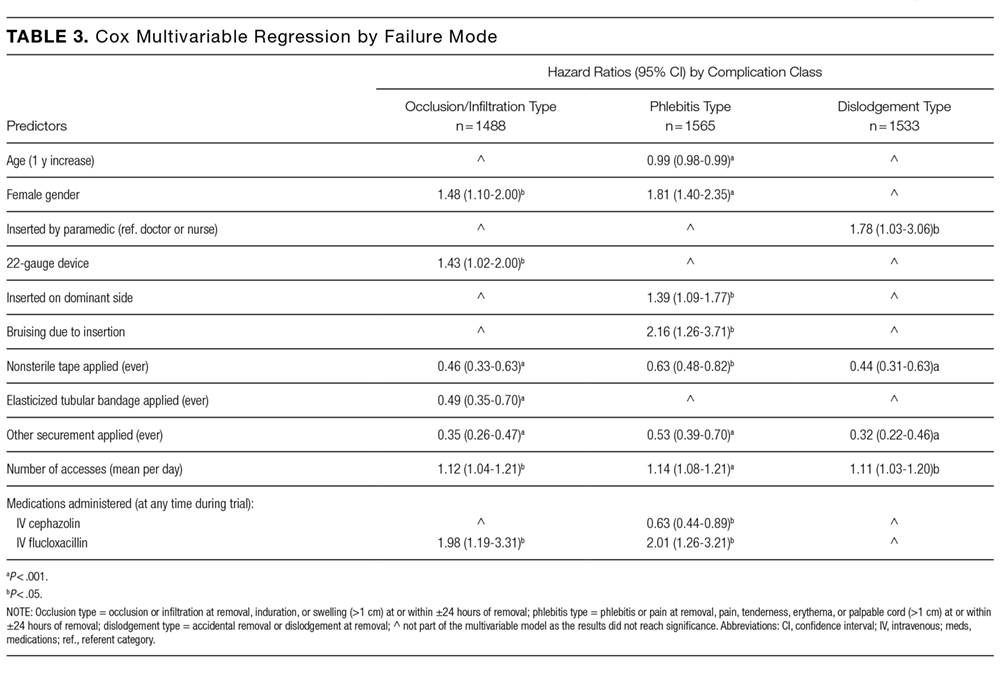
Statistically significant predictors associated with an increased risk of PIV dislodgement included paramedic insertion (HR, 1.78; 95% CI, 1.03-3.06) and frequent PIV access (HR, 1.11; 95% CI, 1.03-1.20). A decreased risk was associated with the additional securement of the PIV, including nonsterile tape (HR, 0.44; 95% CI, 0.31-0.63) or other forms of additional securement (HR, 0.32; 95% CI, 0.22-0.46).
DISCUSSION
One in 3 PIVs failed in this study, with phlebitis as the most common cause of PIV failure. The 17% phlebitis rate reflected clinician-reported phlebitis or phlebitis observed by research staff using a 1-criteria definition because any sign or symptom can trigger PIV removal (eg, pain), even if other signs or symptoms are not present. Reported phlebitis rates are lower if definitions require 2 signs or symptoms.4,6 With over 71 different phlebitis assessment scales in use, and none well validated, the best method for diagnosing phlebitis remains unclear and explains the variation in reported rates.25 Occlusion/infiltration and dislodgement were also highly prevalent forms of PIV failure at 14% and 10%, respectively. Occlusion and infiltration were combined because clinical staff use these terms interchangeably, and differential diagnostic tools are not used in practice. Both result in the same outcome (therapy interruption and PIV removal), and this combination of outcomes has been used previously.23 No PIV-associated bloodstream infections occurred, despite the heightened awareness of these infections in the literature.3
Females had significantly more occlusion/infiltration and phlebitis than males, in keeping with previous studies.7,9,10 This could be because of females’ smaller vein caliber, although the effect remained after adjustment for PIV gauge.7,26 The effect of aging on vascular endothelium and structural integrity may explain the observed decrease in phlebitis of 1% with each older year of age.27 However, gender and age effects could be explained by psychosocial factors (eg, older people may be less likely to admit pain, or we may question them less sympathetically), but, regardless, women and younger patients should be monitored more closely.
We found 22-gauge catheters were more likely to fail from occlusion/infiltration than other sizes. This confirms similar findings from Abolfotouh et al.9 PIV gauge selection for this study was made at the inserter’s discretion and may be confounded by smaller vein size, which was not measured. In addition, risk may be because of smaller gauge alone or also more influenced by the shorter length of the studied 22-gauge (25 mm) than the <20-gauge catheters (30 mm). These results question international guidelines, which currently recommend the smallest gauge peripheral catheter possible,28,29 and randomized trials are needed. Although practice varies between inserters, some preferentially cannulate the nondominant limb. We are not aware of previous studies on this practice; however, our results support this approach.
Flucloxacillin was associated with a 2-fold increase in occlusion/infiltration and phlebitis. Although multiple studies have reported IV medications9,11 and IV antibiotics10,30,31 as risk factors for PIV failure, none have identified flucloxacillin as an independent risk factor. IV flucloxacillin is recommended for reconstitution as 1 g in 15 mL to 20 mL of sterile water, and injection over 3 to 4 minutes, although this may not be adhered to in practice. Alternative administration regimes or improved adherence to current policy may be needed. An exception to the relationship between IV antibiotics and catheter failure was IV cephazolin, associated with 40% relatively less phlebitis. This may be a spurious finding because the administration, pH, and osmolality of cephazolin are similar to other IV antibiotics.
The more PIVs that were accessed per day, whether for infusions or medications, the more failure occurred from occlusion/infiltration, phlebitis, and dislodgement. This suggests that peripheral veins are easily damaged and/or inflamed by the influx of fluids or medications. Lower injection pressures or the timely transfer to oral medications may limit this problem. Flushing regimens may also assist because practice varies greatly, and questions on whether slow continuous flush infusion or intermittent manual flushing are more vein-protective, and the optimal flush volume, frequency, and technique (eg, pulsatile) remain.32,33 Manual handling for frequent access may loosen dressings and securement, thus explaining the observed association between frequent access and catheter dislodgement. Finally, the association between use and failure may indicate that many of these patients were not suitable for a PIV, and different approaches (eg, ultrasound-guided insertion) or a midline may have been a superior option. There is growing emphasis on the need for better preinsertion assessment and selection of the most appropriate device for the patient and the IV treatment required.34
Suboptimal dressings or securements are not unusual in hospitals.35 Despite our policy of PIV securement with bordered transparent dressings, we found 4 dressing types in use. In addition, we found almost 50% of PIVs had an additional (secondary) securement, and this was associated with significantly less PIV failure of all 3 types. This suggests that 1 or more of nonsterile tape, elasticized tubular bandages, or other securement (eg, bandage or second transparent dressing) can reduce PIV failure, although a randomized trial is lacking.36 Whether the dressing was failing and required reinforcement or hospital staff lacked confidence in the dressing and placed additional securement preventatively is unclear. Both PIV failure and PIV dressing failure are common, and further research into superior PIV products and practices is urgently needed. Paramedic insertions had a higher risk of dislodgement, suggesting that the increased emphasis on securement should start in the prehospital setting.
While multiple or difficult insertion attempts were not associated with PIV failure, insertions were not directly observed, and clinicians may have underreported attempts. In contrast, insertion-related bruising (a surrogate for difficult insertion) was associated with more than double the incidence of phlebitis. The long-term implications of multiple insertion attempts on patient’s vasculature are unclear, but we believe first time PIV insertion is important to patients and of interest to clinicians. A recent systematic review of strategies associated with first attempt PIV insertion success in an emergency department found little evidence for effective strategies and recommended further research.37
The overall PIV failure rate in our study was 32%, lower than the 35% to 40% failure observed in our previous randomized controlled trials, which had more stringent inclusion and exclusion criteria (eg, longer predicted duration of therapy).6,38 The implications for patients and costs to the organization of frequent catheter replacement demonstrate urgent need for further research in this area of practice.39 A strength of this study is that all PIVs, regardless of the expected length of dwell time or reason for insertion, were eligible for inclusion, providing more generalizable results. The PIV failure rate of 32% is concerning because these failures trigger treatment delays and replacement insertions, with significant increased labor and equipment costs. The mean cost of PIV replacement has been costed at AUD $69.30 or US $51.92 (as per 2010 $ value) per episode of IV treatment.40 For our hospital, which uses 200,000 PIVs per year, the current level of PIV failure suggests almost AU $5.5 (US $4.1) million in waste annually at this site alone.
The additional strengths of this study include the extensive information collected prospectively about PIV insertion and maintenance, including information on who inserted the PIV, IV medications administered, and PIV dressings used. Limitations were the population of surgical and medical patients in 1 tertiary hospital, which may not be generalizable to other settings.
CONCLUSION
Our study confirms the high rate of catheter failure in acute care hospitals, validates existing evidence related to PIV failure, and identifies new, potentially modifiable risk factors to improve PIV insertion and management. Implications for future research were also identified.
Acknowledgments
The researchers acknowledge and thank the nurses and patients involved in this study. The authors would also like to acknowledge Becton Dickinson for partly funding this study in the form of an unrestricted grant-in-aid paid to Griffith University. Becton Dickinson did not design the study protocol, collect or analyze data, and did not prepare or review the manuscript.
Disclosure
On behalf of NM and CMR, Griffith University has received unrestricted educational and research grants and consultancy payment for lectures from 3M and Becton Dickinson. On behalf of NM, MC, and CMR, Griffith University has received unrestricted investigator-initiated research grants from Centurion Medical Products and Entrotech Lifesciences (manufacturers of PIV dressings) and Becton Dickinson (manufacturer of PIVs). On behalf of MC, Griffith University has received a consultancy payment to develop education material from Baxter. On behalf of CMR, Griffith University has received unrestricted donations or investigator initiated research grants unrelated to this research from Adhezion, Angiodynamics, Baxter, Carefusion, Cook Medical, Hospira, Mayo, Smiths Medical, and Vygon. On behalf of CMR, Griffith University has received consultancy payments for educational lectures or professional opinion from B. Braun, Bard, Carefusion, Mayo, ResQDevices, and Smiths Medical. On behalf of EL, Griffith University has received consultancy payments for educational lecture from 3M. On behalf of MC, Griffith University has received a consultancy payment to develop education material from Baxter. As this was an observational study, no products were trialed in this study. JW and GM have no conflicts of interest.
1
2
3
4
5
6
7
8
9
1
1
1
1
1
1
1
1
1
1
2
2
2
2
2
2
2
2
2
2
3
3
3
33. Schreiber S, Zanchi C, Ronfani L, et al. Normal saline flushes performed once
daily maintain peripheral intravenous catheter patency: a randomised controlled
trial. Arch Dis Child. 2015;100(7):700-703. PubMed
34. Chopra V, Flanders SA, Saint S, et al. The Michigan Appropriateness Guide
for Intravenous Catheters (MAGIC): results from a multispecialty panel using
the RAND/UCLA appropriateness method. Ann Intern Med. 2015;163(6 Suppl):
S1-S40. PubMed
35. New KA, Webster J, Marsh NM, Hewer B. Intravascular device use, management,
documentation and complications: a point prevalence survey. Aust Health Rev.
2014;38(3):345-349. PubMed
36. Marsh N, Webster J, Mihala G, Rickard C. Devices and dressings to secure peripheral
venous catheters to prevent complications. Cochrane Database Syst Rev.
2015(6):CD11070. PubMed
37. Parker SI, Benzies KM, Hayden KA, Lang ES. Effectiveness of interventions for
adult peripheral intravenous catheterization: A systematic review and meta-analysis
of randomized controlled trials. Int Emerg Nurs. 2016;31:15-21. PubMed
38. Webster J, Lloyd S, Hopkins T, Osborne S, Yaxley M. Developing a Research base
for Intravenous Peripheral cannula re-sites (DRIP trial). A randomised controlled
trial of hospital in-patients. Int J Nurs Stud. 2007;44(5):664-671. PubMed
39. Helm RE, Klausner JD, Klemperer JD, Flint LM, Huang E. Accepted but unacceptable:
peripheral IV catheter failure. J Infus Nurs. 2015;38(3):189-203. PubMed
40. Tuffaha HW, Rickard CM, Webster J, et al. Cost-effectiveness analysis of clinically
indicated versus routine replacement of peripheral intravenous catheters. Appl
Health Econ Health Policy. 2014;12(1):51-58. PubMed
INTRODUCTION
Peripheral intravenous catheter (PIV) insertion is the fastest, simplest, and most cost-effective method to gain vascular access, and it is used for short-term intravenous (IV) fluids, medications, blood products, and contrast media.1 It is the most common invasive device in hospitalized patients,2 with up to 70% of hospital patients receiving a PIV.3 Unacceptable PIV failure rates have been reported as high as 69%.4-7 Failure is most frequently due to phlebitis (vein wall irritation/inflammation), occlusion (blockage), infiltration or extravasation (IV fluids/vesicant therapy entering surrounding tissue), partial dislodgement or accidental removal, leakage, and infection.4,6,8 These failures have important implications for patients, who endure the discomfort of PIV complications and catheter replacements, and healthcare staff and budgets.
To reduce the incidence of catheter failure and avoid preventable PIV replacements, a clear understanding of why catheters fail is required. Previous research has identified that catheter gauge,9-11 insertion site,12-14 and inserter skill10,15 have an impact on PIV failure. Limitations of existing research are small study sizes,16-18 retrospective design,19 or secondary analysis of an existing data set; all potentially introduce sampling bias.10,20
To overcome these potential biases, we developed a data collection instrument based on the catheter-associated risk factors described in the literature,9-11,13 and other potential insertion and maintenance risks for PIV failure (eg, multiple insertion attempts, medications administered), with data collected prospectively. The study aim was to improve patient outcomes by identifying PIV insertion and maintenance risk factors amenable to modification through education or alternative clinical interventions, such as catheter gauge selection or insertion site.
METHODS
Study Design and Participants
We conducted this prospective cohort study in a large tertiary hospital in Queensland, Australia. Ethics committee approval was obtained from the hospital (HREC/14/QRBW/76) and Griffith University (NRS/26/14/HREC). The study was registered with the Australian New Zealand Clinical Trials Registry (ACTRN12615000738527). Patients in medical and surgical wards were screened Monday, Wednesday, and Friday between October 2014 and December 2015. Patients over 18 years with a PIV (BD InsyteTM AutoguardTM BC; Becton Dickinson, Franklin Lakes, NJ) inserted within 24 hours, and who were able to provide written informed consent, were eligible and recruited sequentially. Patients classified as palliative by the treating clinical team were excluded.
Sample Size Calculation
The “10 events per variable” rule was used to determine the sample size required to study 50 potential risk factors.21,22 This determined that 1000 patients, with an average of 1.5 PIVs each and an expected PIV failure of 30% (500 events), were required.
Data Collection
At recruitment, baseline patient information was collected by a research nurse (ReNs) (demographics, admitting diagnosis, comorbidities, skin type,23 and vein condition) and entered into an electronic data platform supported by Research Electronic Data Capture (REDCap).24 Baseline data also included catheter variables (eg, gauge, insertion site, catheterized vein) and insertion details (eg, department of insertion, inserting clinician, number of insertion attempts). We included every PIV the participant had during their admission until hospital discharge or insertion of a central venous access device. PIV sites were reviewed Monday, Wednesday, and Friday by ReNs for site complications (eg, redness, pain, swelling, palpable cord). Potential risk factors for failure were also recorded (eg, infusates and additives, antibiotic type and dosage, flushing regimen, number of times the PIV was accessed each day for administration of IV medications or fluids, dressing type and condition, securement method for the catheter and tubing, presence of extension tubing or 3-way taps, patient mobility status, and delirium). A project manager trained and supervised ReNs for protocol compliance and audited study data quality. We considered PIV failure to have occurred if the catheter had complications at removal identified by the ReNs assessment, from medical charts, or by speaking to the patient and beside nurse. We grouped the failures in 1 of 3 types: (1) occlusion or infiltration, defined as blockage, IV fluids moving into surrounding tissue, induration, or swelling greater than 1 cm from the insertion site at or within 24 hours of removal; (2) phlebitis, defined as per clinicians’ definitions or one or more of the following signs and symptoms: pain or tenderness scored at 2 or more on a 1 to 10 increasing severity pain scale, or redness or a palpable cord (either extending greater than 1 cm from the insertion site) at or within 24 hours of PIV removal; and (3) dislodgement (partial or complete). If multiple complications were present, all were recorded.
Statistical Analysis
Data were downloaded from REDcap to Stata 14.2 (StataCorp., College Station, TX) for data management and analysis. Missing data were not imputed. Nominal data observations were collapsed into a single observation per device. Patient and device variables were described as frequencies and proportions, means and standard deviations, or medians and interquartile ranges. Failure incidence rates were calculated, and a Kaplan-Meier survival curve was plotted. In general, Cox proportional hazards models were fitted (Efron method) to handle tied failures (clustering by patient). Variables significant at P < 0.20 on univariable analyses were subjected to multivariable regression. Generally, the largest category was set as referent. Correlations between variables were checked (Spearman’s rank for binary variables, R-squared value of linear regressions for continuous/categorical or continuous/continuous variables). Correlations were considered significant if r > 0.5 and the lower bound of the 95% confidence interval (CI) was >0.5 (where calculated). Covariate interactions were explored, and effects at P < 0.05 noted. The 4 steps of multivariable model building were (1) baseline covariates only with manual stepwise removal of covariates at P ≥ 0.05, (2) treatment covariates only with manual stepwise removal of covariates at P ≥ 0.05, (3) a combination of the derived models from (1) and (2) and manual stepwise removal of covariates at P ≥ 0.05, and (4) manual stepwise addition and removal (at P ≥ 0.05) of variables dropped during the previous steps and interaction testing. Final models were checked as follows: global proportional-hazards assumption test, concordance probability (that predictions and outcomes were in agreement), and Nelson-Aalen cumulative hazard function plotted against the Cox-Snell residuals.
RESULTS
Patient Characteristics
In total, 1000 patients with 1578 PIVs were recruited. The average age was 54 years and the majority were surgical patients (673; 67%). Almost half of patients (455; 46%) had 2 or more comorbidities, and 334 (33%) were obese (body mass index greater than 30). Sample characteristics are shown by the type of catheter failure in Table 1.
PIV Characteristics
All 1578 PIVs were followed until removal, with only 7 PIVs (0.44%) having missing data for the 3 outcomes of interest (these were coded as nonfailures for analysis). Sixty percent of participants had more than 1 PIV followed in the study. Doctors and physicians inserted 1278 (83%) catheters. A total of 550 (35%) were placed in the ward, with 428 (28%) inserted in the emergency department or ambulance. A third of the catheters (540; 34%) were 18-gauge or larger in diameter, and 1000 (64%) were located in the cubital fossa or hand. Multiple insertion attempts were required to place 315 (23%) PIVs. No PIVs were inserted with ultrasound, as this is rarely used in this hospital. The flushing policy was for the administration of 9% sodium chloride every 8 hours if no IV medications or fluids were ordered. Table 2 contains further details of device-related characteristics. Although the hospital policy was for catheter removal by 72 hours, dwell time ranged from <1 to 14 days, with an average of 2.4 days.
PIV Complications
Catheter failure (any cause) occurred in 512 (32%) catheters, which is a failure rate of 136 per 1000 catheter days (95% CI, 125-148). A total of 346 patients out of 1000 (35%) had at least 1 failed PIV during the study. Failures were 267 phlebitis (17%), 228 occlusion/infiltration (14%), and/or 154 dislodgement (10%; Figure), with some PIVs exhibiting multiple concurrent complications (Table 2).
Multivariable AnalysisOcclusion/Infiltration
The multivariable analysis (Table 3) showed occlusion or infiltration was statistically significantly associated with female patients (hazard ratio [HR], 1.48; 95% CI, 1.10-2.00), with a 22-gauge catheter (HR, 1.43; 95% CI, 1.02-2.00), IV flucloxacillin (HR, 1.98; 95% CI, 1.19-3.31), and with frequent PIV access (HR, 1.12; 95% CI, 1.04-1.21; ie, with each increase of 1 in the mean medications/fluids administrations per day, relative PIV failure increased 112%). Less occlusion and infiltration were statistically significantly associated with securement by using additional nonsterile tape (HR, 0.46; 95% CI, 0.33-0.63), elasticized tubular bandages (HR, 0.49; 95% CI, 0.35-0.70 ), or other types of additional securement for the PIV (HR, 0.35; 95% CI, 0.26-0.47).
Phlebitis
Phlebitis was statistically significantly associated with female patients (HR, 1.81; 95% CI, 1.40-2.35), bruising at the insertion site (HR, 2.16; 95% CI, 1.26-3.71), insertion in patients’ dominant side (HR, 1.39; 95% CI, 1.09-1.77), IV flucloxicillin (HR, 2.01; 95% CI, 1.26-3.21), or with frequent PIV access (HR, 1.14; 95% CI, 1.08-1.21). Older age, (HR, 0.99; 95% CI, 0.98-0.99; ie, each year older was associated with 1% less phlebitis), securement with additional nonsterile tape (HR, 0.63; 95% CI, 0.48-0.82) or with any other additional securement (HR, 0.53; 95% CI, 0.39-0.70), or the administration of IV cephazolin (HR, 0.63; 95% CI, 0.44-0.89) were associated with lower phlebitis risk.
Dislodgement
Statistically significant predictors associated with an increased risk of PIV dislodgement included paramedic insertion (HR, 1.78; 95% CI, 1.03-3.06) and frequent PIV access (HR, 1.11; 95% CI, 1.03-1.20). A decreased risk was associated with the additional securement of the PIV, including nonsterile tape (HR, 0.44; 95% CI, 0.31-0.63) or other forms of additional securement (HR, 0.32; 95% CI, 0.22-0.46).
DISCUSSION
One in 3 PIVs failed in this study, with phlebitis as the most common cause of PIV failure. The 17% phlebitis rate reflected clinician-reported phlebitis or phlebitis observed by research staff using a 1-criteria definition because any sign or symptom can trigger PIV removal (eg, pain), even if other signs or symptoms are not present. Reported phlebitis rates are lower if definitions require 2 signs or symptoms.4,6 With over 71 different phlebitis assessment scales in use, and none well validated, the best method for diagnosing phlebitis remains unclear and explains the variation in reported rates.25 Occlusion/infiltration and dislodgement were also highly prevalent forms of PIV failure at 14% and 10%, respectively. Occlusion and infiltration were combined because clinical staff use these terms interchangeably, and differential diagnostic tools are not used in practice. Both result in the same outcome (therapy interruption and PIV removal), and this combination of outcomes has been used previously.23 No PIV-associated bloodstream infections occurred, despite the heightened awareness of these infections in the literature.3
Females had significantly more occlusion/infiltration and phlebitis than males, in keeping with previous studies.7,9,10 This could be because of females’ smaller vein caliber, although the effect remained after adjustment for PIV gauge.7,26 The effect of aging on vascular endothelium and structural integrity may explain the observed decrease in phlebitis of 1% with each older year of age.27 However, gender and age effects could be explained by psychosocial factors (eg, older people may be less likely to admit pain, or we may question them less sympathetically), but, regardless, women and younger patients should be monitored more closely.
We found 22-gauge catheters were more likely to fail from occlusion/infiltration than other sizes. This confirms similar findings from Abolfotouh et al.9 PIV gauge selection for this study was made at the inserter’s discretion and may be confounded by smaller vein size, which was not measured. In addition, risk may be because of smaller gauge alone or also more influenced by the shorter length of the studied 22-gauge (25 mm) than the <20-gauge catheters (30 mm). These results question international guidelines, which currently recommend the smallest gauge peripheral catheter possible,28,29 and randomized trials are needed. Although practice varies between inserters, some preferentially cannulate the nondominant limb. We are not aware of previous studies on this practice; however, our results support this approach.
Flucloxacillin was associated with a 2-fold increase in occlusion/infiltration and phlebitis. Although multiple studies have reported IV medications9,11 and IV antibiotics10,30,31 as risk factors for PIV failure, none have identified flucloxacillin as an independent risk factor. IV flucloxacillin is recommended for reconstitution as 1 g in 15 mL to 20 mL of sterile water, and injection over 3 to 4 minutes, although this may not be adhered to in practice. Alternative administration regimes or improved adherence to current policy may be needed. An exception to the relationship between IV antibiotics and catheter failure was IV cephazolin, associated with 40% relatively less phlebitis. This may be a spurious finding because the administration, pH, and osmolality of cephazolin are similar to other IV antibiotics.
The more PIVs that were accessed per day, whether for infusions or medications, the more failure occurred from occlusion/infiltration, phlebitis, and dislodgement. This suggests that peripheral veins are easily damaged and/or inflamed by the influx of fluids or medications. Lower injection pressures or the timely transfer to oral medications may limit this problem. Flushing regimens may also assist because practice varies greatly, and questions on whether slow continuous flush infusion or intermittent manual flushing are more vein-protective, and the optimal flush volume, frequency, and technique (eg, pulsatile) remain.32,33 Manual handling for frequent access may loosen dressings and securement, thus explaining the observed association between frequent access and catheter dislodgement. Finally, the association between use and failure may indicate that many of these patients were not suitable for a PIV, and different approaches (eg, ultrasound-guided insertion) or a midline may have been a superior option. There is growing emphasis on the need for better preinsertion assessment and selection of the most appropriate device for the patient and the IV treatment required.34
Suboptimal dressings or securements are not unusual in hospitals.35 Despite our policy of PIV securement with bordered transparent dressings, we found 4 dressing types in use. In addition, we found almost 50% of PIVs had an additional (secondary) securement, and this was associated with significantly less PIV failure of all 3 types. This suggests that 1 or more of nonsterile tape, elasticized tubular bandages, or other securement (eg, bandage or second transparent dressing) can reduce PIV failure, although a randomized trial is lacking.36 Whether the dressing was failing and required reinforcement or hospital staff lacked confidence in the dressing and placed additional securement preventatively is unclear. Both PIV failure and PIV dressing failure are common, and further research into superior PIV products and practices is urgently needed. Paramedic insertions had a higher risk of dislodgement, suggesting that the increased emphasis on securement should start in the prehospital setting.
While multiple or difficult insertion attempts were not associated with PIV failure, insertions were not directly observed, and clinicians may have underreported attempts. In contrast, insertion-related bruising (a surrogate for difficult insertion) was associated with more than double the incidence of phlebitis. The long-term implications of multiple insertion attempts on patient’s vasculature are unclear, but we believe first time PIV insertion is important to patients and of interest to clinicians. A recent systematic review of strategies associated with first attempt PIV insertion success in an emergency department found little evidence for effective strategies and recommended further research.37
The overall PIV failure rate in our study was 32%, lower than the 35% to 40% failure observed in our previous randomized controlled trials, which had more stringent inclusion and exclusion criteria (eg, longer predicted duration of therapy).6,38 The implications for patients and costs to the organization of frequent catheter replacement demonstrate urgent need for further research in this area of practice.39 A strength of this study is that all PIVs, regardless of the expected length of dwell time or reason for insertion, were eligible for inclusion, providing more generalizable results. The PIV failure rate of 32% is concerning because these failures trigger treatment delays and replacement insertions, with significant increased labor and equipment costs. The mean cost of PIV replacement has been costed at AUD $69.30 or US $51.92 (as per 2010 $ value) per episode of IV treatment.40 For our hospital, which uses 200,000 PIVs per year, the current level of PIV failure suggests almost AU $5.5 (US $4.1) million in waste annually at this site alone.
The additional strengths of this study include the extensive information collected prospectively about PIV insertion and maintenance, including information on who inserted the PIV, IV medications administered, and PIV dressings used. Limitations were the population of surgical and medical patients in 1 tertiary hospital, which may not be generalizable to other settings.
CONCLUSION
Our study confirms the high rate of catheter failure in acute care hospitals, validates existing evidence related to PIV failure, and identifies new, potentially modifiable risk factors to improve PIV insertion and management. Implications for future research were also identified.
Acknowledgments
The researchers acknowledge and thank the nurses and patients involved in this study. The authors would also like to acknowledge Becton Dickinson for partly funding this study in the form of an unrestricted grant-in-aid paid to Griffith University. Becton Dickinson did not design the study protocol, collect or analyze data, and did not prepare or review the manuscript.
Disclosure
On behalf of NM and CMR, Griffith University has received unrestricted educational and research grants and consultancy payment for lectures from 3M and Becton Dickinson. On behalf of NM, MC, and CMR, Griffith University has received unrestricted investigator-initiated research grants from Centurion Medical Products and Entrotech Lifesciences (manufacturers of PIV dressings) and Becton Dickinson (manufacturer of PIVs). On behalf of MC, Griffith University has received a consultancy payment to develop education material from Baxter. On behalf of CMR, Griffith University has received unrestricted donations or investigator initiated research grants unrelated to this research from Adhezion, Angiodynamics, Baxter, Carefusion, Cook Medical, Hospira, Mayo, Smiths Medical, and Vygon. On behalf of CMR, Griffith University has received consultancy payments for educational lectures or professional opinion from B. Braun, Bard, Carefusion, Mayo, ResQDevices, and Smiths Medical. On behalf of EL, Griffith University has received consultancy payments for educational lecture from 3M. On behalf of MC, Griffith University has received a consultancy payment to develop education material from Baxter. As this was an observational study, no products were trialed in this study. JW and GM have no conflicts of interest.
1
2
3
4
5
6
7
8
9
1
1
1
1
1
1
1
1
1
1
2
2
2
2
2
2
2
2
2
2
3
3
3
33. Schreiber S, Zanchi C, Ronfani L, et al. Normal saline flushes performed once
daily maintain peripheral intravenous catheter patency: a randomised controlled
trial. Arch Dis Child. 2015;100(7):700-703. PubMed
34. Chopra V, Flanders SA, Saint S, et al. The Michigan Appropriateness Guide
for Intravenous Catheters (MAGIC): results from a multispecialty panel using
the RAND/UCLA appropriateness method. Ann Intern Med. 2015;163(6 Suppl):
S1-S40. PubMed
35. New KA, Webster J, Marsh NM, Hewer B. Intravascular device use, management,
documentation and complications: a point prevalence survey. Aust Health Rev.
2014;38(3):345-349. PubMed
36. Marsh N, Webster J, Mihala G, Rickard C. Devices and dressings to secure peripheral
venous catheters to prevent complications. Cochrane Database Syst Rev.
2015(6):CD11070. PubMed
37. Parker SI, Benzies KM, Hayden KA, Lang ES. Effectiveness of interventions for
adult peripheral intravenous catheterization: A systematic review and meta-analysis
of randomized controlled trials. Int Emerg Nurs. 2016;31:15-21. PubMed
38. Webster J, Lloyd S, Hopkins T, Osborne S, Yaxley M. Developing a Research base
for Intravenous Peripheral cannula re-sites (DRIP trial). A randomised controlled
trial of hospital in-patients. Int J Nurs Stud. 2007;44(5):664-671. PubMed
39. Helm RE, Klausner JD, Klemperer JD, Flint LM, Huang E. Accepted but unacceptable:
peripheral IV catheter failure. J Infus Nurs. 2015;38(3):189-203. PubMed
40. Tuffaha HW, Rickard CM, Webster J, et al. Cost-effectiveness analysis of clinically
indicated versus routine replacement of peripheral intravenous catheters. Appl
Health Econ Health Policy. 2014;12(1):51-58. PubMed
1
2
3
4
5
6
7
8
9
1
1
1
1
1
1
1
1
1
1
2
2
2
2
2
2
2
2
2
2
3
3
3
33. Schreiber S, Zanchi C, Ronfani L, et al. Normal saline flushes performed once
daily maintain peripheral intravenous catheter patency: a randomised controlled
trial. Arch Dis Child. 2015;100(7):700-703. PubMed
34. Chopra V, Flanders SA, Saint S, et al. The Michigan Appropriateness Guide
for Intravenous Catheters (MAGIC): results from a multispecialty panel using
the RAND/UCLA appropriateness method. Ann Intern Med. 2015;163(6 Suppl):
S1-S40. PubMed
35. New KA, Webster J, Marsh NM, Hewer B. Intravascular device use, management,
documentation and complications: a point prevalence survey. Aust Health Rev.
2014;38(3):345-349. PubMed
36. Marsh N, Webster J, Mihala G, Rickard C. Devices and dressings to secure peripheral
venous catheters to prevent complications. Cochrane Database Syst Rev.
2015(6):CD11070. PubMed
37. Parker SI, Benzies KM, Hayden KA, Lang ES. Effectiveness of interventions for
adult peripheral intravenous catheterization: A systematic review and meta-analysis
of randomized controlled trials. Int Emerg Nurs. 2016;31:15-21. PubMed
38. Webster J, Lloyd S, Hopkins T, Osborne S, Yaxley M. Developing a Research base
for Intravenous Peripheral cannula re-sites (DRIP trial). A randomised controlled
trial of hospital in-patients. Int J Nurs Stud. 2007;44(5):664-671. PubMed
39. Helm RE, Klausner JD, Klemperer JD, Flint LM, Huang E. Accepted but unacceptable:
peripheral IV catheter failure. J Infus Nurs. 2015;38(3):189-203. PubMed
40. Tuffaha HW, Rickard CM, Webster J, et al. Cost-effectiveness analysis of clinically
indicated versus routine replacement of peripheral intravenous catheters. Appl
Health Econ Health Policy. 2014;12(1):51-58. PubMed
© 2017 Society of Hospital Medicine
Expanding Treatment Opportunities for Hospitalized Patients with Opioid Use Disorders
The United States is facing an epidemic of prescription opioid and heroin use, which has been linked to the escalating prescribing of opioid analgesics. Though opioid prescriptions appear to be reaching a plateau, estimates suggest there are at least 900,000 active heroin users in the United States, and this number continues to grow.1 One response to this epidemic (through state legislation and medical society guidelines) has been a move to reduce opioid prescribing in order to diminish the potential for diversion and misuse.2 However, the treatment of pain is not the sole driver of heroin epidemiology, and new strategies are also needed to better engage patients with existing opioid use disorders (OUDs) to begin treatment. These patients are increasingly hospitalized for infectious comorbidities of injection drug use, trauma, or pregnancy, and this may present a unique opportunity to initiate these patients on maintenance opioid agonist therapy, the most effective option for medication-assisted treatment (MAT) for addiction.
MISSED OPPORTUNITIES
Patients with OUDs comprise an estimated 2% to 4% of hospitalized patients, representing a disproportionately large number of inpatients.3-6 According to a recent analysis of data from the National (Nationwide) Inpatient Sample, the estimated annual number of hospitalizations associated with OUDs in the United States increased from approximately 300,000 to more than 500,000 in the decade from 2002 to 2012.7 Severe bacterial infections associated with intravenous administration of opioids (including endocarditis, osteomyelitis, septic arthritis, and epidural abscess) increased substantially at an estimated cost of more than $700 million in 2012.7 Over a similar period, the prevalence of opioid use among women in labor increased from 13.7 to 22.0 per 10,000 live births,8 and there was a corresponding rise in admissions to neonatal intensive care units for neonatal abstinence syndrome.9 As the prevalence of prescription drug and heroin dependence continues to rise across the United States, hospitals and clinicians find themselves on the front lines of this epidemic, creating potential opportunities to engage patients in recovery, a “treatable moment” for this vulnerable population.10
Currently, a common approach in the hospitalized patient is to attempt medically assisted withdrawal using a rapid taper of long-acting opioids. This process may appeal to healthcare providers who hope to guide their patients in transitioning to opioid abstinence. However, tapering an opioid regimen, even over a period of months, results in unacceptably high rates of relapse (as high as 70% to 90% in some studies), especially when a patient is acutely ill and symptomatic from a concurrent medical issue.11-13 In the hospital setting, this treatment failure can manifest as pain and undertreated withdrawal symptoms (such as agitation, arthralgias, and gastrointestinal distress), which may hinder some patients from completing their treatment or drive some to leave against medical advice.14 Further harm may occur when an inpatient rapid taper is accomplished, putting patients at increased risk of a fatal relapse after discharge due to loss of tolerance.15Maintenance opioid agonist therapy with buprenorphine or methadone, in which a long-acting opioid is titrated until craving and withdrawal symptoms are well controlled, is the first-line modality for MAT among patients with OUDs in outpatient settings and is associated with reduced risk of fatal overdose and all-cause mortality.16 Initiation and dose stabilization of agonist therapy with these agents during acute medical hospitalization has been shown to be feasible in a variety of inpatient settings.17-20 In one trial, patients randomized to buprenorphine induction and linkage to office-based therapy during their inpatient stay were more than 5 times as likely to enter and remain in treatment after discharge when compared with those in whom buprenorphine was tapered.20 International guidelines support the use of maintenance agonist therapy in this context, but this remains an underutilized strategy in recent efforts to treat OUDs in the United States.21,22 A few key barriers currently prevent this strategy from being applied broadly within our healthcare system.
TOWARD EVIDENCE-BASED INPATIENT MANAGEMENT
First, there is a common misconception that regulations prohibit the use of methadone and buprenorphine for opioid agonist therapy by inpatient medical providers without special certification. Title 42 of the Code of Federal Regulations (CFR) provides extensive guidance regarding the use of opioid medications by registered outpatient opioid treatment programs. However, it also contains an exemption from these rules for hospitals treating patients with emergent medical needs (21 CFR § 1306.07[c]) allowing hospital-based clinicians “to maintain or detoxify a person as an incidental adjunct to medical or surgical treatment of conditions other than addiction” without restriction. According to guidelines from the Substance Abuse and Mental Health Services Administration, this exemption applies to the use of both methadone and buprenorphine.23
Many clinicians and hospital pharmacy departments interpret this law to limit the use of maintenance therapy in patients already enrolled in outpatient programs or to require a rapid taper over the first 3 days of hospitalization. However, these interpretations may in part be rooted in confusion with an adjacent section of the regulations (21 CFR § 1306.07[b]) directed at outpatient physicians providing time-limited, emergency treatment for withdrawal in an office setting. The application of this time limit to hospitalized patients has not been supported by communication from the Drug Enforcement Agency.24 There is no case law or other regulation requiring an opioid regimen to be time limited for patients during medical hospitalization, and hospital policies need not place undue constraints on the ability of clinicians to stabilize patients on maintenance therapy and transition them to outpatient treatment.
Second, the limited capacity of existing opioid maintenance programs can lead to a gap in treatment upon hospital discharge for patients in whom methadone or buprenorphine is initiated. Health delivery systems can play a role in mitigating the impact of this resource gap. Integrating the model of screening, brief intervention, and referral to treatment into hospital admission processes and engaging social workers, addiction consult services (where available), and other supports early in the course of hospitalization can help facilitate appropriate follow-up care.25,26 Hospitals may also be eligible for federal funding to strengthen local referral networks for outpatient MAT programs under Section 103 of the Comprehensive Addiction and Recovery Act passed into law in July 2016. Innovative delivery models designed to enhance integration across community stakeholders in healthcare, social services, and criminal justice have recently been developed, such as Vermont’s “Hub and Spoke” model,27 Boston Medical Center’s Faster Paths opioid urgent care center,28 and the police-led Angel Program in Gloucester, Massachusetts.29 Implementation science studies will be needed to identify the most effective ways to engage inpatient medical teams in such efforts.
Currently, individual providers can already play a central role in providing a bridge for patients in whom a delay in beginning MAT cannot be avoided upon discharge. Interim buprenorphine maintenance treatment has been shown to dramatically decrease the use of illicit opioids among those awaiting initiation of comprehensive MAT programs and substantially increase retention in long-term treatment.20,30,31 With the recent expansion of the limits on buprenorphine prescriptions to 275 patients per provider (part of the waiver required under the Drug Addiction Treatment Act [DATA] of 2000 to provide outpatient buprenorphine treatment, also known as a DATA waiver), this may be an increasingly promising option for hospital discharge.
Obtaining a waiver to prescribe buprenorphine is not required for the inpatient initiation of buprenorphine therapy. However, doing so is relatively simple (requiring an online, 8-hour training [https://www.samhsa.gov/medication-assisted-treatment/training-resources/buprenorphine-physician-training]) and allows hospital-based providers not only to ensure optimal management of OUDs during hospitalization but also to help their patients with the next steps toward recovery after discharge. The use of buprenorphine may be challenging in some patients with significant pain as a component of their medical condition. For these patients, methadone will likely be better tolerated.
Additional funding is also urgently needed to expand the capacity of existing opioid treatment programs and create specialized discharge-transition clinics that can provide structured interim opioid therapy while patients are on waitlists for traditional MAT programs. Requiring patients who are not ready or able to begin long-term maintenance agonist therapy to rapidly taper an inpatient opioid regimen unnecessarily puts them at risk for overdose after discharge.15 Regardless of the available resources for long-term treatment within the community, hospital discharge planning should include a naloxone prescription and brief training for patients and their loved ones.32 The long-acting opioid antagonist, depot naltrexone, is another effective, alternative MAT option and is increasingly used in community settings among patients who are motivated to achieve opioid abstinence.33,34 It has not yet been studied among hospitalized patients, and further research is needed to determine if it could be a viable option for discharge. However, the requirement that a patient be abstinent from opioids for 7 to 10 days prior to administering the first dose of depot naltrexone may serve as a significant barrier to its use for most hospitalized patients.
Finally, healthcare providers must be trained in the appropriate use of opioid agonist therapy. Medical schools, residency programs, and schools of pharmacy and nursing should develop curricula to expand the capacity of nonspecialists to care for patients with OUDs and to focus on judicious analgesic prescribing to prevent chronic opioid use. This curriculum should address the appropriate titration of methadone and buprenorphine for agonist therapy and address the stigma faced by patients with substance use disorders. Other important topics include the management of overdose and withdrawal symptoms, structured approaches to pain management in patients with OUDs, harm-reduction methods, and multidisciplinary care for the psychosocial and psychiatric comorbidities of addiction. Though international guidelines have been developed for the inpatient management of patients with OUDs,21,22 hospitals and professional societies should take a leadership role in facilitating continuing education to disseminate them among current medical providers.
There is great potential for the leadership and front-line staff of hospital systems, with a few key changes in policy and practice, to become advocates for patients with OUDs to access treatment. As perspectives about opioid prescribing change amid efforts to limit the escalation of the current heroin epidemic, it is vital to identify opportunities to reduce opioid exposure for opioid-naïve patients and enhance the engagement of patients diagnosed with OUDs in treatment.
Disclosure
The authors have no conflicts of interest to declare.
1. Longo DL, Compton WM, Jones CM, Baldwin GT. Relationship between Nonmedical Prescription-Opioid Use and Heroin Use. N Engl J Med. 2016;374(2):154-163. doi:10.1056/NEJMra1508490. PubMed
2. Dowell D, Haegerich TM, Chou R. CDC Guideline for Prescribing Opioids for Chronic Pain — United States, 2016. MMWR Recomm Rep. 2016;65(1):1-49. doi:10.15585/mmwr.rr6501e1. PubMed
3. Dans PE, Matricciani RM, Otter SE, Reuland DS. Intravenous drug abuse and one academic health center. JAMA. 1990;263(23):3173-3176. PubMed
4. Stein MD, Wilkinson J, Berglas N, O’Sullivan P. Prevalence and detection of illicit drug disorders among hospitalized patients. Am J Drug Alcohol Abuse. 1996;22(3):463-471. PubMed
5. Brown RL, Leonard T, Saunders LA, Papasouliotis O. The prevalence and detection of substance use disorders among inpatients ages 18 to 49: an opportunity for prevention. Prev Med. 1998;27(1):101-110. doi:10.1006/pmed.1997.0250. PubMed
6. McNeely J, Gourevitch MN, Paone D, Shah S, Wright S, Heller D. Estimating the prevalence of illicit opioid use in New York City using multiple data sources. BMC Public Health. 2012;12:443. doi:10.1186/1471-2458-12-443. PubMed
7. Ronan MV, Herzig SJ. Hospitalizations Related To Opioid Abuse/Dependence And Associated Serious Infections Increased Sharply, 2002-12. Health Aff. 2016;35(5):832-837. doi:10.1377/hlthaff.2015.1424. PubMed
8. Pan I-J, Yi H. Prevalence of hospitalized live births affected by alcohol and drugs and parturient women diagnosed with substance abuse at liveborn delivery: United States, 1999-2008. Matern Child Health J. 2013;17(4):667-676. doi:10.1007/s10995-012-1046-3. PubMed
9. Tolia VN, Patrick SW, Bennett MM, et al. Increasing incidence of the neonatal abstinence syndrome in U.S. neonatal ICUs. N Engl J Med. 2015;372(22):2118-2126. doi:10.1056/NEJMsa1500439. PubMed
10. O’Toole TP, Pollini RA, Ford DE, Bigelow G. The health encounter as a treatable moment for homeless substance-using adults: the role of homelessness, health seeking behavior, readiness for behavior change and motivation for treatment. Addict Behav. 2008;33(9):1239-1243. doi:10.1016/j.addbeh.2008.04.015. PubMed
11. Nielsen S, Larance B, Degenhardt L, Gowing L, Kehler C, Lintzeris N. Opioid agonist treatment for pharmaceutical opioid dependent people. Cochrane Database Syst Rev. 2016;(5):CD011117. doi:10.1002/14651858.CD011117.pub2. PubMed
12. Gossop M, Green L, Phillips G, Bradley B. Lapse, relapse and survival among opiate addicts after treatment. A prospective follow-up study. Br J Psychiatry. 1989;154:348-353. PubMed
13. Smyth BP, Barry J, Keenan E, Ducray K. Lapse and relapse following inpatient treatment of opiate dependence. Ir Med J. 2010;103(6):176-179. PubMed
14. McNeil R, Small W, Wood E, Kerr T. Hospitals as a “risk environment”: an ethno-epidemiological study of voluntary and involuntary discharge from hospital against medical advice among people who inject drugs. Soc Sci Med. 2014;105:59-66. doi:10.1016/j.socscimed.2014.01.010. PubMed
15. Strang J. Loss of tolerance and overdose mortality after inpatient opiate detoxification: follow up study. BMJ. 2003;326(7396):959-960. doi:10.1136/bmj.326.7396.959. PubMed
16. Sordo L, Barrio G, Bravo MJ, et al. Mortality risk during and after opioid substitution treatment: systematic review and meta-analysis of cohort studies. BMJ. 2017;357:j1550. PubMed
17. Persico AM, Di Giannantonio M, Tempesta E. A prospective assessment of opiate addiction treatment protocols for inpatients with HIV-related syndromes. Drug Alcohol Depend. 1991;27(1):79-86. PubMed
18. Shanahan CW, Beers D, Alford DP, Brigandi E, Samet JH. A transitional opioid program to engage hospitalized drug users. J Gen Intern Med. 2010;25(8):803-808. doi:10.1007/s11606-010-1311-3. PubMed
19. Morozova O, Dvoryak S, Altice FL. Methadone treatment improves tuberculosis treatment among hospitalized opioid dependent patients in Ukraine. Int J Drug Policy. 2013;24(6):e91-e98. doi:10.1016/j.drugpo.2013.09.001. PubMed
20. Liebschutz JM, Crooks D, Herman D, et al. Buprenorphine Treatment for Hospitalized, Opioid-Dependent Patients: A Randomized Clinical Trial. JAMA Intern Med. 2014;174(8):1369. doi:10.1001/jamainternmed.2014.2556. PubMed
21. Haber PS, Demirkol A, Lange K, Murnion B. Management of injecting drug users admitted to hospital. Lancet. 2009;374(9697):1284-1293. doi:10.1016/S0140-6736(09)61036-9. PubMed
22. Donroe JH, Holt SR, Tetrault JM. Caring for patients with opioid use disorder in the hospital. CMAJ. 2016;188(17-18):1232-1239. doi:10.1503/cmaj.160290. PubMed
23. Substance Abuse and Mental Health Services Administration. Special Circumstances for Providing Buprenorphine. https://www.samhsa.gov/medication-assisted-treatment/legislation-regulations-guidelines/special-circumstances-providing-buprenorphine. Accessed October 8, 2016.
24. Noska A, Mohan A, Wakeman S, Rich J, Boutwell A. Managing Opioid Use Disorder During and After Acute Hospitalization: A Case-Based Review Clarifying Methadone Regulation for Acute Care Settings. J Addict Behav Ther Rehabil. 2015;4(2). pii: 1000138. doi:10.4172/2324-9005.1000138. PubMed
25. InSight Project Research Group. SBIRT outcomes in Houston: final report on InSight, a hospital district-based program for patients at risk for alcohol or drug use problems. Alcohol Clin Exp Res. 2009;33(8):1374-1381. doi:10.1111/j.1530-0277.2009.00967.x. PubMed
26. Estee S, Wickizer T, He L, Shah MF, Mancuso D. Evaluation of the Washington state screening, brief intervention, and referral to treatment project: cost outcomes for Medicaid patients screened in hospital emergency departments. Med Care. 2010;48(1):18-24. doi:10.1097/MLR.0b013e3181bd498f. PubMed
27. Simpatico TA. Vermont responds to its opioid crisis. Prev Med. 2015;80:10-11. doi:10.1016/j.ypmed.2015.04.002. PubMed
28. Boston University Medical Center. Boston medical center launches new opioid urgent care center. https://www.eurekalert.org/pub_releases/2016-10/bumc-bmc101716.php. Published on October 17, 2016. Accessed December 29, 2016.
29. Schiff DM, Drainoni M-L, Bair-Merritt M, Weinstein Z, Rosenbloom D. A Police-Led Addiction Treatment Referral Program in Massachusetts. N Engl J Med. 2016;375(25):2502-2503. doi:10.1056/NEJMc1611640. PubMed
30. D’Onofrio G, O’Connor PG, Pantalon MV, et al. Emergency department-initiated buprenorphine/naloxone treatment for opioid dependence: a randomized clinical trial. JAMA. 2015;313(16):1636-1644. doi:10.1001/jama.2015.3474. PubMed
31. Sigmon SC, Ochalek TA, Meyer AC, et al. Interim Buprenorphine vs. Waiting List for Opioid Dependence. N Engl J Med. 2016;375(25):2504-2505. doi:10.1056/NEJMc1610047. PubMed
32. McDonald R, Strang J. Are take-home naloxone programmes effective? Systematic review utilizing application of the Bradford Hill criteria. Addiction. 2016;111(7):1177-1187. doi:10.1111/add.13326. . 2015;9(3):238-243. doi:10.1097/ADM.0000000000000125.J Addict Med PubMed
34. Nunes EV, Krupitsky E, Ling W, et al. Treating Opioid Dependence With Injectable Extended-Release Naltrexone (XR-NTX): Who Will Respond? . 2011;377(9776):1506-1513. doi:10.1016/S0140-6736(11)60358-9.Lancet PubMed
33. Krupitsky E, Nunes EV, Ling W, Illeperuma A, Gastfriend DR, Silverman BL. Injectable extended-release naltrexone for opioid dependence: a double-blind, placebo-controlled, multicentre randomised trial. PubMed
The United States is facing an epidemic of prescription opioid and heroin use, which has been linked to the escalating prescribing of opioid analgesics. Though opioid prescriptions appear to be reaching a plateau, estimates suggest there are at least 900,000 active heroin users in the United States, and this number continues to grow.1 One response to this epidemic (through state legislation and medical society guidelines) has been a move to reduce opioid prescribing in order to diminish the potential for diversion and misuse.2 However, the treatment of pain is not the sole driver of heroin epidemiology, and new strategies are also needed to better engage patients with existing opioid use disorders (OUDs) to begin treatment. These patients are increasingly hospitalized for infectious comorbidities of injection drug use, trauma, or pregnancy, and this may present a unique opportunity to initiate these patients on maintenance opioid agonist therapy, the most effective option for medication-assisted treatment (MAT) for addiction.
MISSED OPPORTUNITIES
Patients with OUDs comprise an estimated 2% to 4% of hospitalized patients, representing a disproportionately large number of inpatients.3-6 According to a recent analysis of data from the National (Nationwide) Inpatient Sample, the estimated annual number of hospitalizations associated with OUDs in the United States increased from approximately 300,000 to more than 500,000 in the decade from 2002 to 2012.7 Severe bacterial infections associated with intravenous administration of opioids (including endocarditis, osteomyelitis, septic arthritis, and epidural abscess) increased substantially at an estimated cost of more than $700 million in 2012.7 Over a similar period, the prevalence of opioid use among women in labor increased from 13.7 to 22.0 per 10,000 live births,8 and there was a corresponding rise in admissions to neonatal intensive care units for neonatal abstinence syndrome.9 As the prevalence of prescription drug and heroin dependence continues to rise across the United States, hospitals and clinicians find themselves on the front lines of this epidemic, creating potential opportunities to engage patients in recovery, a “treatable moment” for this vulnerable population.10
Currently, a common approach in the hospitalized patient is to attempt medically assisted withdrawal using a rapid taper of long-acting opioids. This process may appeal to healthcare providers who hope to guide their patients in transitioning to opioid abstinence. However, tapering an opioid regimen, even over a period of months, results in unacceptably high rates of relapse (as high as 70% to 90% in some studies), especially when a patient is acutely ill and symptomatic from a concurrent medical issue.11-13 In the hospital setting, this treatment failure can manifest as pain and undertreated withdrawal symptoms (such as agitation, arthralgias, and gastrointestinal distress), which may hinder some patients from completing their treatment or drive some to leave against medical advice.14 Further harm may occur when an inpatient rapid taper is accomplished, putting patients at increased risk of a fatal relapse after discharge due to loss of tolerance.15Maintenance opioid agonist therapy with buprenorphine or methadone, in which a long-acting opioid is titrated until craving and withdrawal symptoms are well controlled, is the first-line modality for MAT among patients with OUDs in outpatient settings and is associated with reduced risk of fatal overdose and all-cause mortality.16 Initiation and dose stabilization of agonist therapy with these agents during acute medical hospitalization has been shown to be feasible in a variety of inpatient settings.17-20 In one trial, patients randomized to buprenorphine induction and linkage to office-based therapy during their inpatient stay were more than 5 times as likely to enter and remain in treatment after discharge when compared with those in whom buprenorphine was tapered.20 International guidelines support the use of maintenance agonist therapy in this context, but this remains an underutilized strategy in recent efforts to treat OUDs in the United States.21,22 A few key barriers currently prevent this strategy from being applied broadly within our healthcare system.
TOWARD EVIDENCE-BASED INPATIENT MANAGEMENT
First, there is a common misconception that regulations prohibit the use of methadone and buprenorphine for opioid agonist therapy by inpatient medical providers without special certification. Title 42 of the Code of Federal Regulations (CFR) provides extensive guidance regarding the use of opioid medications by registered outpatient opioid treatment programs. However, it also contains an exemption from these rules for hospitals treating patients with emergent medical needs (21 CFR § 1306.07[c]) allowing hospital-based clinicians “to maintain or detoxify a person as an incidental adjunct to medical or surgical treatment of conditions other than addiction” without restriction. According to guidelines from the Substance Abuse and Mental Health Services Administration, this exemption applies to the use of both methadone and buprenorphine.23
Many clinicians and hospital pharmacy departments interpret this law to limit the use of maintenance therapy in patients already enrolled in outpatient programs or to require a rapid taper over the first 3 days of hospitalization. However, these interpretations may in part be rooted in confusion with an adjacent section of the regulations (21 CFR § 1306.07[b]) directed at outpatient physicians providing time-limited, emergency treatment for withdrawal in an office setting. The application of this time limit to hospitalized patients has not been supported by communication from the Drug Enforcement Agency.24 There is no case law or other regulation requiring an opioid regimen to be time limited for patients during medical hospitalization, and hospital policies need not place undue constraints on the ability of clinicians to stabilize patients on maintenance therapy and transition them to outpatient treatment.
Second, the limited capacity of existing opioid maintenance programs can lead to a gap in treatment upon hospital discharge for patients in whom methadone or buprenorphine is initiated. Health delivery systems can play a role in mitigating the impact of this resource gap. Integrating the model of screening, brief intervention, and referral to treatment into hospital admission processes and engaging social workers, addiction consult services (where available), and other supports early in the course of hospitalization can help facilitate appropriate follow-up care.25,26 Hospitals may also be eligible for federal funding to strengthen local referral networks for outpatient MAT programs under Section 103 of the Comprehensive Addiction and Recovery Act passed into law in July 2016. Innovative delivery models designed to enhance integration across community stakeholders in healthcare, social services, and criminal justice have recently been developed, such as Vermont’s “Hub and Spoke” model,27 Boston Medical Center’s Faster Paths opioid urgent care center,28 and the police-led Angel Program in Gloucester, Massachusetts.29 Implementation science studies will be needed to identify the most effective ways to engage inpatient medical teams in such efforts.
Currently, individual providers can already play a central role in providing a bridge for patients in whom a delay in beginning MAT cannot be avoided upon discharge. Interim buprenorphine maintenance treatment has been shown to dramatically decrease the use of illicit opioids among those awaiting initiation of comprehensive MAT programs and substantially increase retention in long-term treatment.20,30,31 With the recent expansion of the limits on buprenorphine prescriptions to 275 patients per provider (part of the waiver required under the Drug Addiction Treatment Act [DATA] of 2000 to provide outpatient buprenorphine treatment, also known as a DATA waiver), this may be an increasingly promising option for hospital discharge.
Obtaining a waiver to prescribe buprenorphine is not required for the inpatient initiation of buprenorphine therapy. However, doing so is relatively simple (requiring an online, 8-hour training [https://www.samhsa.gov/medication-assisted-treatment/training-resources/buprenorphine-physician-training]) and allows hospital-based providers not only to ensure optimal management of OUDs during hospitalization but also to help their patients with the next steps toward recovery after discharge. The use of buprenorphine may be challenging in some patients with significant pain as a component of their medical condition. For these patients, methadone will likely be better tolerated.
Additional funding is also urgently needed to expand the capacity of existing opioid treatment programs and create specialized discharge-transition clinics that can provide structured interim opioid therapy while patients are on waitlists for traditional MAT programs. Requiring patients who are not ready or able to begin long-term maintenance agonist therapy to rapidly taper an inpatient opioid regimen unnecessarily puts them at risk for overdose after discharge.15 Regardless of the available resources for long-term treatment within the community, hospital discharge planning should include a naloxone prescription and brief training for patients and their loved ones.32 The long-acting opioid antagonist, depot naltrexone, is another effective, alternative MAT option and is increasingly used in community settings among patients who are motivated to achieve opioid abstinence.33,34 It has not yet been studied among hospitalized patients, and further research is needed to determine if it could be a viable option for discharge. However, the requirement that a patient be abstinent from opioids for 7 to 10 days prior to administering the first dose of depot naltrexone may serve as a significant barrier to its use for most hospitalized patients.
Finally, healthcare providers must be trained in the appropriate use of opioid agonist therapy. Medical schools, residency programs, and schools of pharmacy and nursing should develop curricula to expand the capacity of nonspecialists to care for patients with OUDs and to focus on judicious analgesic prescribing to prevent chronic opioid use. This curriculum should address the appropriate titration of methadone and buprenorphine for agonist therapy and address the stigma faced by patients with substance use disorders. Other important topics include the management of overdose and withdrawal symptoms, structured approaches to pain management in patients with OUDs, harm-reduction methods, and multidisciplinary care for the psychosocial and psychiatric comorbidities of addiction. Though international guidelines have been developed for the inpatient management of patients with OUDs,21,22 hospitals and professional societies should take a leadership role in facilitating continuing education to disseminate them among current medical providers.
There is great potential for the leadership and front-line staff of hospital systems, with a few key changes in policy and practice, to become advocates for patients with OUDs to access treatment. As perspectives about opioid prescribing change amid efforts to limit the escalation of the current heroin epidemic, it is vital to identify opportunities to reduce opioid exposure for opioid-naïve patients and enhance the engagement of patients diagnosed with OUDs in treatment.
Disclosure
The authors have no conflicts of interest to declare.
1. Longo DL, Compton WM, Jones CM, Baldwin GT. Relationship between Nonmedical Prescription-Opioid Use and Heroin Use. N Engl J Med. 2016;374(2):154-163. doi:10.1056/NEJMra1508490. PubMed
2. Dowell D, Haegerich TM, Chou R. CDC Guideline for Prescribing Opioids for Chronic Pain — United States, 2016. MMWR Recomm Rep. 2016;65(1):1-49. doi:10.15585/mmwr.rr6501e1. PubMed
3. Dans PE, Matricciani RM, Otter SE, Reuland DS. Intravenous drug abuse and one academic health center. JAMA. 1990;263(23):3173-3176. PubMed
4. Stein MD, Wilkinson J, Berglas N, O’Sullivan P. Prevalence and detection of illicit drug disorders among hospitalized patients. Am J Drug Alcohol Abuse. 1996;22(3):463-471. PubMed
5. Brown RL, Leonard T, Saunders LA, Papasouliotis O. The prevalence and detection of substance use disorders among inpatients ages 18 to 49: an opportunity for prevention. Prev Med. 1998;27(1):101-110. doi:10.1006/pmed.1997.0250. PubMed
6. McNeely J, Gourevitch MN, Paone D, Shah S, Wright S, Heller D. Estimating the prevalence of illicit opioid use in New York City using multiple data sources. BMC Public Health. 2012;12:443. doi:10.1186/1471-2458-12-443. PubMed
7. Ronan MV, Herzig SJ. Hospitalizations Related To Opioid Abuse/Dependence And Associated Serious Infections Increased Sharply, 2002-12. Health Aff. 2016;35(5):832-837. doi:10.1377/hlthaff.2015.1424. PubMed
8. Pan I-J, Yi H. Prevalence of hospitalized live births affected by alcohol and drugs and parturient women diagnosed with substance abuse at liveborn delivery: United States, 1999-2008. Matern Child Health J. 2013;17(4):667-676. doi:10.1007/s10995-012-1046-3. PubMed
9. Tolia VN, Patrick SW, Bennett MM, et al. Increasing incidence of the neonatal abstinence syndrome in U.S. neonatal ICUs. N Engl J Med. 2015;372(22):2118-2126. doi:10.1056/NEJMsa1500439. PubMed
10. O’Toole TP, Pollini RA, Ford DE, Bigelow G. The health encounter as a treatable moment for homeless substance-using adults: the role of homelessness, health seeking behavior, readiness for behavior change and motivation for treatment. Addict Behav. 2008;33(9):1239-1243. doi:10.1016/j.addbeh.2008.04.015. PubMed
11. Nielsen S, Larance B, Degenhardt L, Gowing L, Kehler C, Lintzeris N. Opioid agonist treatment for pharmaceutical opioid dependent people. Cochrane Database Syst Rev. 2016;(5):CD011117. doi:10.1002/14651858.CD011117.pub2. PubMed
12. Gossop M, Green L, Phillips G, Bradley B. Lapse, relapse and survival among opiate addicts after treatment. A prospective follow-up study. Br J Psychiatry. 1989;154:348-353. PubMed
13. Smyth BP, Barry J, Keenan E, Ducray K. Lapse and relapse following inpatient treatment of opiate dependence. Ir Med J. 2010;103(6):176-179. PubMed
14. McNeil R, Small W, Wood E, Kerr T. Hospitals as a “risk environment”: an ethno-epidemiological study of voluntary and involuntary discharge from hospital against medical advice among people who inject drugs. Soc Sci Med. 2014;105:59-66. doi:10.1016/j.socscimed.2014.01.010. PubMed
15. Strang J. Loss of tolerance and overdose mortality after inpatient opiate detoxification: follow up study. BMJ. 2003;326(7396):959-960. doi:10.1136/bmj.326.7396.959. PubMed
16. Sordo L, Barrio G, Bravo MJ, et al. Mortality risk during and after opioid substitution treatment: systematic review and meta-analysis of cohort studies. BMJ. 2017;357:j1550. PubMed
17. Persico AM, Di Giannantonio M, Tempesta E. A prospective assessment of opiate addiction treatment protocols for inpatients with HIV-related syndromes. Drug Alcohol Depend. 1991;27(1):79-86. PubMed
18. Shanahan CW, Beers D, Alford DP, Brigandi E, Samet JH. A transitional opioid program to engage hospitalized drug users. J Gen Intern Med. 2010;25(8):803-808. doi:10.1007/s11606-010-1311-3. PubMed
19. Morozova O, Dvoryak S, Altice FL. Methadone treatment improves tuberculosis treatment among hospitalized opioid dependent patients in Ukraine. Int J Drug Policy. 2013;24(6):e91-e98. doi:10.1016/j.drugpo.2013.09.001. PubMed
20. Liebschutz JM, Crooks D, Herman D, et al. Buprenorphine Treatment for Hospitalized, Opioid-Dependent Patients: A Randomized Clinical Trial. JAMA Intern Med. 2014;174(8):1369. doi:10.1001/jamainternmed.2014.2556. PubMed
21. Haber PS, Demirkol A, Lange K, Murnion B. Management of injecting drug users admitted to hospital. Lancet. 2009;374(9697):1284-1293. doi:10.1016/S0140-6736(09)61036-9. PubMed
22. Donroe JH, Holt SR, Tetrault JM. Caring for patients with opioid use disorder in the hospital. CMAJ. 2016;188(17-18):1232-1239. doi:10.1503/cmaj.160290. PubMed
23. Substance Abuse and Mental Health Services Administration. Special Circumstances for Providing Buprenorphine. https://www.samhsa.gov/medication-assisted-treatment/legislation-regulations-guidelines/special-circumstances-providing-buprenorphine. Accessed October 8, 2016.
24. Noska A, Mohan A, Wakeman S, Rich J, Boutwell A. Managing Opioid Use Disorder During and After Acute Hospitalization: A Case-Based Review Clarifying Methadone Regulation for Acute Care Settings. J Addict Behav Ther Rehabil. 2015;4(2). pii: 1000138. doi:10.4172/2324-9005.1000138. PubMed
25. InSight Project Research Group. SBIRT outcomes in Houston: final report on InSight, a hospital district-based program for patients at risk for alcohol or drug use problems. Alcohol Clin Exp Res. 2009;33(8):1374-1381. doi:10.1111/j.1530-0277.2009.00967.x. PubMed
26. Estee S, Wickizer T, He L, Shah MF, Mancuso D. Evaluation of the Washington state screening, brief intervention, and referral to treatment project: cost outcomes for Medicaid patients screened in hospital emergency departments. Med Care. 2010;48(1):18-24. doi:10.1097/MLR.0b013e3181bd498f. PubMed
27. Simpatico TA. Vermont responds to its opioid crisis. Prev Med. 2015;80:10-11. doi:10.1016/j.ypmed.2015.04.002. PubMed
28. Boston University Medical Center. Boston medical center launches new opioid urgent care center. https://www.eurekalert.org/pub_releases/2016-10/bumc-bmc101716.php. Published on October 17, 2016. Accessed December 29, 2016.
29. Schiff DM, Drainoni M-L, Bair-Merritt M, Weinstein Z, Rosenbloom D. A Police-Led Addiction Treatment Referral Program in Massachusetts. N Engl J Med. 2016;375(25):2502-2503. doi:10.1056/NEJMc1611640. PubMed
30. D’Onofrio G, O’Connor PG, Pantalon MV, et al. Emergency department-initiated buprenorphine/naloxone treatment for opioid dependence: a randomized clinical trial. JAMA. 2015;313(16):1636-1644. doi:10.1001/jama.2015.3474. PubMed
31. Sigmon SC, Ochalek TA, Meyer AC, et al. Interim Buprenorphine vs. Waiting List for Opioid Dependence. N Engl J Med. 2016;375(25):2504-2505. doi:10.1056/NEJMc1610047. PubMed
32. McDonald R, Strang J. Are take-home naloxone programmes effective? Systematic review utilizing application of the Bradford Hill criteria. Addiction. 2016;111(7):1177-1187. doi:10.1111/add.13326. . 2015;9(3):238-243. doi:10.1097/ADM.0000000000000125.J Addict Med PubMed
34. Nunes EV, Krupitsky E, Ling W, et al. Treating Opioid Dependence With Injectable Extended-Release Naltrexone (XR-NTX): Who Will Respond? . 2011;377(9776):1506-1513. doi:10.1016/S0140-6736(11)60358-9.Lancet PubMed
33. Krupitsky E, Nunes EV, Ling W, Illeperuma A, Gastfriend DR, Silverman BL. Injectable extended-release naltrexone for opioid dependence: a double-blind, placebo-controlled, multicentre randomised trial. PubMed
© 2017 Society of Hospital Medicine
Derivation of a Clinical Model to Predict Unchanged Inpatient Echocardiograms
Transthoracic echocardiography (TTE) is one of the most commonly ordered diagnostic tests in healthcare. Studies of Medicare beneficiaries, for example, have shown that each year, approximately 20% undergo at least 1 TTE, including 4% who have 2 or more.1 TTE utilization rates increased dramatically in the 1990s and early 2000s. Between 1999 and 2008, for example, the rate of use of TTE per Medicare beneficiary nearly doubled.2 In 2014, echocardiography accounted for 10% of all Medicare spending for imaging services, or approximately $930 million.3 In response to concerns about the possible unnecessary use of TTE, the American Heart Association and American Society of Echocardiography developed Appropriate Use Criteria (AUC) in 2007 and 2011, which describe appropriate versus inappropriate indications for TTE.4 Subsequent studies have shown that rather than rooting out inappropriate studies, the vast majority of ordered studies appear to be appropriate according to the AUC criteria.5 The AUC criteria have also been criticized for being based on expert opinion rather than clinical evidence.6 Repeat TTE, defined as TTE done within 1 year of a prior TTE, represents 24% to 42% of all studies,7-9 and 31% of all Medicare beneficiaries who have a TTE get a repeat TTE within 1 year.10 In the present study, we reviewed all inpatient TTE performed over 1 year and described the group that have had a prior TTE within the past year (“repeat TTE”). We then derived a clinical prediction model to predict unchanged repeat TTE, with the goal of defining a subset of studies that are potentially unnecessary.
METHODS
The West Haven Connecticut Veteran’s Administration Hospital (WHVA), located outside New Haven, Connecticut, is a 228-bed tertiary care center affiliated with Yale University School of Medicine. Potential subjects were identified from review of the electronic medical records of all inpatients who had an inpatient echocardiogram between October 1, 2013, and September 30, 2014. Patient’s records were reviewed by using a standardized data extraction form for demographics, comorbidity, cardiovascular risk factors, service ordering the TTE, intensive care unit (ICU) location, prior TTE abnormalities, TTE indication, AUC category, time between TTEs, technical quality of TTE, electrocardiogram (ECG) abnormalities, history of intervening acute coronary syndrome, cardiac surgery, and revascularization. Candidate predictors included any variables suspected by the authors as being potentially associated with the primary outcome of changed repeat TTE. All patients who had an inpatient TTE and a prior TTE within the Veterans Affairs (VA) system within the past year were included in the study. Repeat studies from the same admission were only counted as 1 TTE and patients had to have had a prior TTE from a different admission or a prior outpatient TTE to be included. Patients who did not have a prior TTE within the past year or who had only a transesophageal echocardiogram or stress echocardiography were excluded. Suboptimal studies were included but noted as limited quality. The study was approved by the WHVA Institutional Review Board. The Transparent Reporting of a Multivariable Prediction Model for Individual Prognosis or Diagnosis statement was used in planning and reporting this study.11
TTEs were classified as normal, mildly abnormal, or with a major abnormality based on previously published definitions.12-14 Any abnormality was defined as any left ventricle (LV) dysfunction (left ventricular ejection fraction [LVEF] <55%), any aortic or mitral valve stenosis, any regional wall motion abnormality, any right ventricular dysfunction, any pulmonary hypertension, mild or greater valvular regurgitation, any diastolic dysfunction, moderate or greater pericardial effusion, any ventricular hypertrophy, or any other significant abnormality including thrombus, vegetation, or tamponade. Major abnormality was defined as moderate or greater LV dysfunction (LVEF <45%), moderate or greater valvular regurgitation, moderate or greater valvular stenosis (aortic or mitral valve area <1.5 cm²), any regional wall motion abnormality, right ventricular dysfunction, moderate or greater pulmonary hypertension, moderate or greater diastolic dysfunction, moderate or greater pericardial effusion, or any other major abnormality including thrombus, vegetation, tumor, or tamponade. Repeat TTEs were classified as changed or unchanged. Changed TTEs were divided into any new abnormality or improvement or a new major abnormality or improvement. Any new abnormality or improvement was defined as any new TTE abnormality that had not previously been described or in which there was a change of at least 1 severity grade from a prior TTE, including improvement by 1 grade. A new major TTE abnormality or improvement was defined as any new major TTE abnormality that had previously been normal, or if there had been a prior abnormality, a change in at least 1 severity grade for LVEF or 2 severity grades for abnormal valvular, pericardial, or prior pulmonary hypertension, including improvement by 2 severity grades. A change from mild to moderate mitral regurgitation therefore was classified as a nonmajor change, whereas a change from mild to severe was classified as major. All TTE classifications were based on the electronic TTE reports and were reviewed by 2 independent investigators (CG and JC) blinded to the patients’ other clinical characteristics. For TTE studies in which the investigators agreed, that determination was the final classification. Disagreements were reviewed and the final classification was determined by consensus.
In an analogous manner, ECGs were classified as normal, mildly abnormal, or with a major abnormality based on previous definitions in the literature.15 Major abnormality was defined as atrial fibrillation or flutter, high-degree atrioventricular blocks, left bundle-branch block, right bundle-branch block, indeterminate conduction delay, q-wave myocardial infarction, isolated ischemic abnormalities, left ventricular hypertrophy with ST-T abnormalities, other arrhythmias including supraventricular tachycardia (SVT) or ventricular tachycardia (VT), low voltage (peak-to-peak QRS amplitude of <5 mm in the limb leads and/or <10 mm in the precordial leads), paced rhythm, sinus tachycardia (heart rate [HR] >100) or bradycardia (HR <50). Mild ECG abnormality was defined as low-grade atrioventricular blocks, borderline prolonged ventricular excitation, prolonged ventricular repolarization, isolated minor Q and ST-T abnormalities, left ventricular hypertrophy without ST-T abnormalities, left atrial enlargement, atrial or ventricular premature beats, or fascicular blocks. New major ECG abnormalities were any of the listed major ECG abnormalities that were not present on ECGs prior to the admission during which the repeat TTE was performed.
Other study definitions included intervening acute myocardial infarction (AMI), which was defined by any intervening history of elevated troponins, regardless of symptoms or ECG changes and including demand ischemia. Chronic kidney disease (CKD) was defined as an abnormal serum creatinine on 2 or more occasions 3 months apart. Active cancer was defined as receiving chemotherapy or palliative care for advanced cancer. Valvular heart disease was defined as prior moderate or severe valvular stenosis or regurgitation.
For analysis, we first compared patients with repeat TTE with major changes with those without major changes. For comparison of dichotomous variables, χ2 or Fisher exact tests were used. For continuous variables, Student t test or the Mann-Whitney U test were performed. Because many of the frequencies of individual AUC criteria were small, related AUC criteria were grouped for analysis as grouped by the tables of the American College of Cardiology Foundation Appropriate Use Criteria Task Force, American Society of Echocardiography, American Heart Association, American Society of Nuclear Cardiology, Heart Failure Society of America, Heart Rhythm Society, Society for Cardiovascular Angiography and Interventions, Society of Critical Care Medicine, Society of Cardiovascular Computed Tomography, and Society for Cardiovascular Magnetic Resonance (ACCF/ASE/AHA) Guideline.4 Criteria groupings that were significantly less likely to have major TTE changes on analysis were classified as low risk and criteria that were significantly more likely were classified as high risk. Criteria groupings that were not significantly associated with TTE change were classified as average risk. All variables with P values less than 0.05 on bivariate analysis were then entered into a multivariate logistic regression analysis with major TTE change as the dependent variable, using backward stepwise variable selection with entry and exit criteria of P < 0.05 and P > 0.10, respectively. Scores were derived by converting the regression coefficients of independently predictive variables in the logistic regression model into corresponding integers. A total score was calculated for each patient by summing up the points for each independently significant variable. Model performance was described by calculating a C statistic by creation of a receiver operating characteristic curve to assess discrimination, and by performing the Hosmer and Lemeshow test to assess calibration. Internal validation was assessed by calculating the C statistic using the statistical method of bootstrapping in which the data were resampled multiple times (n = 200) and the average resultant C statistic reported. The bootstrap analysis was performed using R version 3.1 (R Foundation for Statistical Computing, Vienna, Austria). All other analyses were performed using SPSS version 21.0 (IBM, Armonk, New York). P values <0.05 were considered significant.
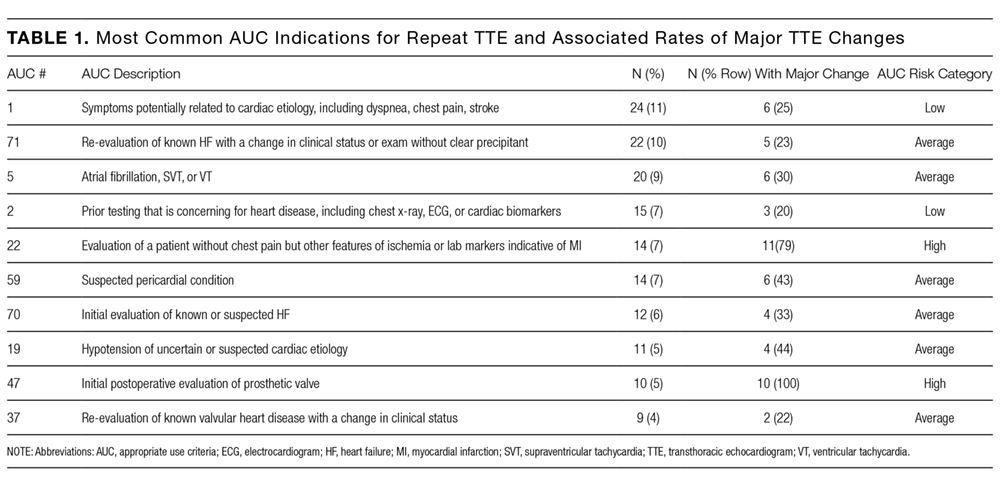
RESULTS
During the 1-year study period, there were 3944 medical/surgical admissions for 3266 patients and 845 inpatient TTEs obtained on 601 patients. Of all patients who were admitted, 601/3266 (18.4%) had at least 1 inpatient TTE. Of these 601 TTEs, 211 (35%) had a TTE within the VA system during the prior year. Of the 211 repeat TTEs, 67 (32%) were unchanged, 66 (31%) had minor changes, and 78 (37%) had major changes. The kappa statistic for agreement between extractors for “major TTE change” was 0.91, P < 0.001. The 10 most common AUC indications for TTE, which accounted for 72% of all studies, are listed in Table 1. The initial AUCs assigned by reviewers were the same in 187 of 211 TTEs (kappa 0.86, P < 0.001). Most indications were not associated with TTE outcome, although studies ordered for AUC indications 1 and 2 were less likely be associated with major changes and AUC indications 22 and 47 were more likely to be associated with major changes. Table 2 shows the comparison of the 78 patients that had repeat TTE with major changes compared with the 133 patients that did not. Nine variables were significantly different between the 2 groups; repeat TTEs with major changes were more likely to have dementia, be ordered by the surgery service, be located in an ICU, have major new ECG changes, have had prior valvular heart disease, have had an intervening AMI or cardiac surgery, or be in a high-risk AUC category. Patients with CKD were less likely to have major changes. Table 3 shows the results of the multivariate analysis; CKD, intervening AMI, prior valvular heart disease, major new ECG changes, and intervening cardiac surgery all independently predicted major changes on repeat TTE. Based on the β-coefficient for each variable, a point system was assigned to each variable and a total score calculated for each patient. Most variables had β-coefficients close to 1 and were therefore assigned a score of 1. CKD was associated with a lower risk of major TTE abnormality and was assigned a negative score. Intervening AMI was associated with a β-coefficient of 2.2 and was assigned a score of 2. Based on the points assigned to each variable and its presence or absence for each patient, a total score, which we named the CAVES score, was calculated. The acronym CAVES stands for CKD, AMI, valvular disease, ECG changes, and surgery (cardiac). Table 4 shows the frequencies of each score for each patient, ranging from patients with CKD and no other risk factors who scored −1 to patients without CKD who had all 4 of the other variables who scored 5. The prevalence of major TTE change for the full cohort was 37%. For the group with a CAVES score of −1, the probability was only 5.6%; for the group with a score of 0, the probability was 17.7%; and for the group with a score ≥1, the probability was 55.3%.
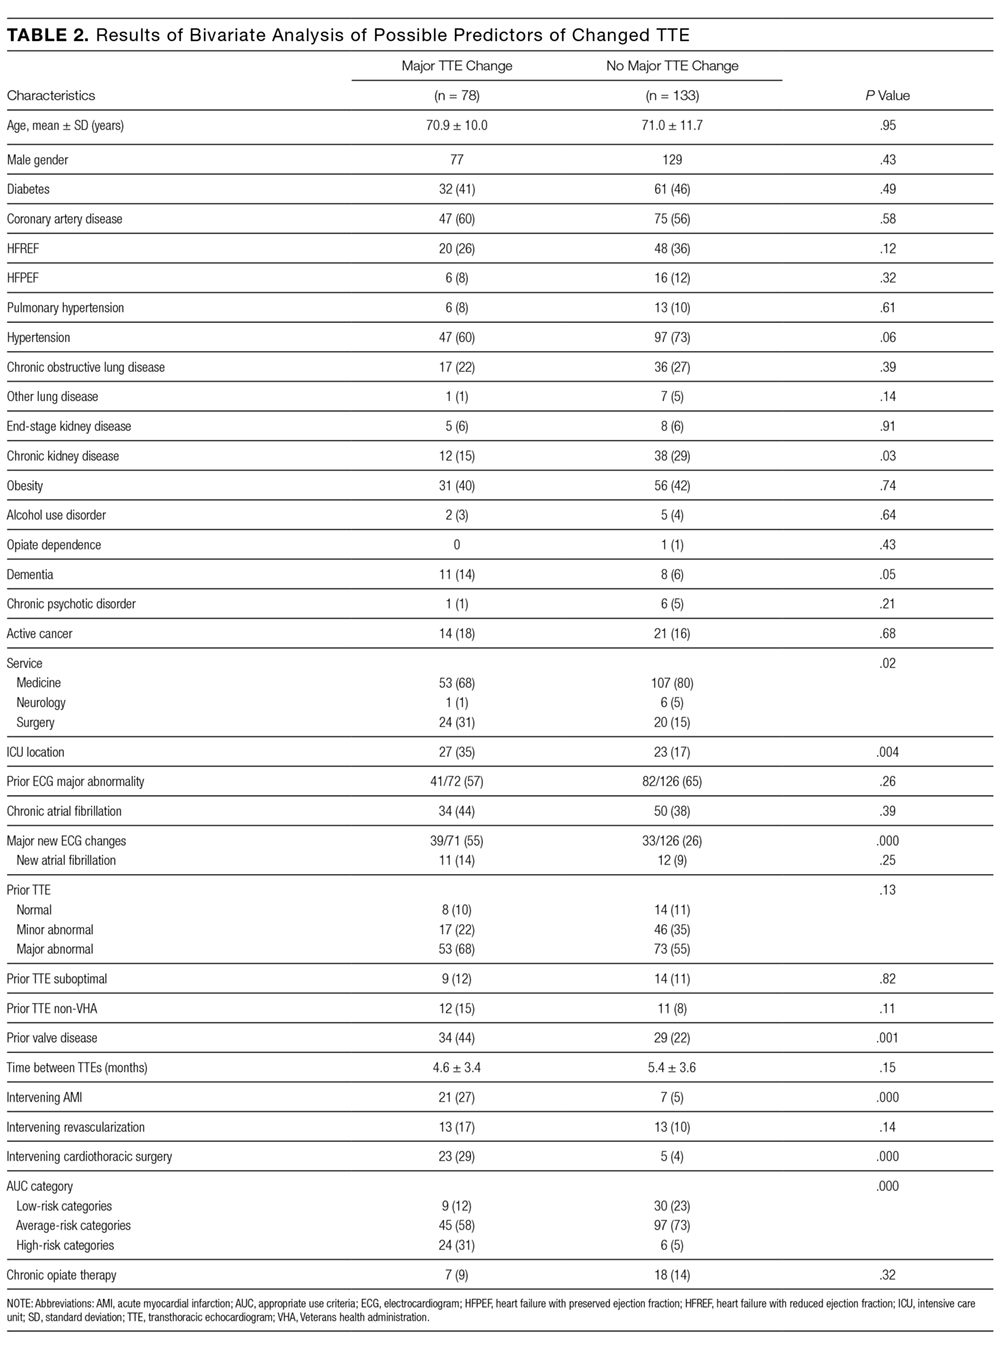
The bootstrap corrected C statistic for the model was 0.78 (95% confidence interval, 0.72-0.85), indicating good discrimination. The Hosmer and Lemeshow test showed nonsignificance, indicating good calibration (χ2 = 5.20, df = 6, P = 0.52).
DISCUSSION
In this retrospective study, we found that approximately 18% of all patients admitted to the hospital had an inpatient TTE performed, and that approximately 35% of this group had a prior TTE within the past year. Of the group with prior TTEs within the past year, 37% had a major new change and 63% had either minor or no changes. Prior studies have reported similar high rates of repeat TTE7-9 and of major changes on repeat TTE.8,14,16 On multivariate analysis, we found that 5 variables were independent predictors of new changes on TTE—absence of CKD, intervening AMI, intervening cardiac surgery, history of valvular heart disease, and major new ECG changes. We developed and internally validated a risk score based on these 5 variables, which was found to have good overall accuracy as measured by the bootstrap corrected C statistic. The simplified version of the score divides patients into low, intermediate, and high risk for major changes on TTE. The low-risk group, defined as the group with no risk factors, had an approximately 6% risk of a major TTE change; the intermediate risk group, defined as a score of 0, had an 18% risk of major TTE change; and the high-risk group, defined as a score of 1 or greater, had a 55% chance of major TTE change. We believe that this risk score, if further validated, will potentially allow hospital-based clinicians to estimate the chance of a major change on TTE prior to ordering the study. For the low-risk group, this may indicate that the study is unnecessary. Conversely, for patients at high risk, this may offer further evidence that it will be useful to obtain a repeat TTE.
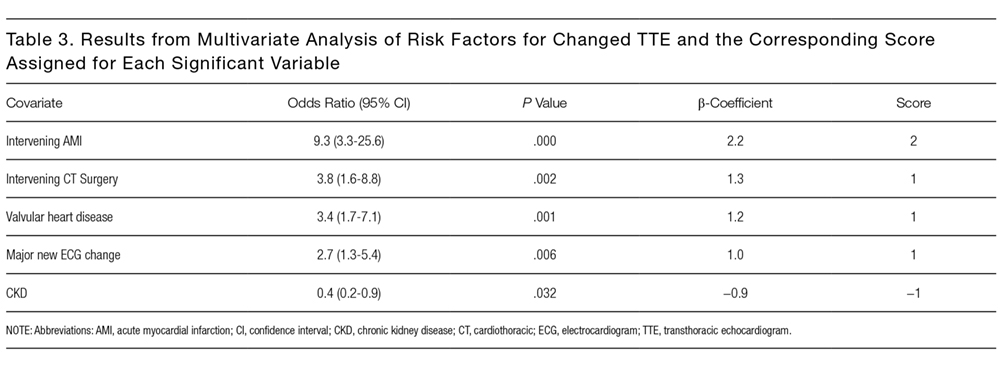
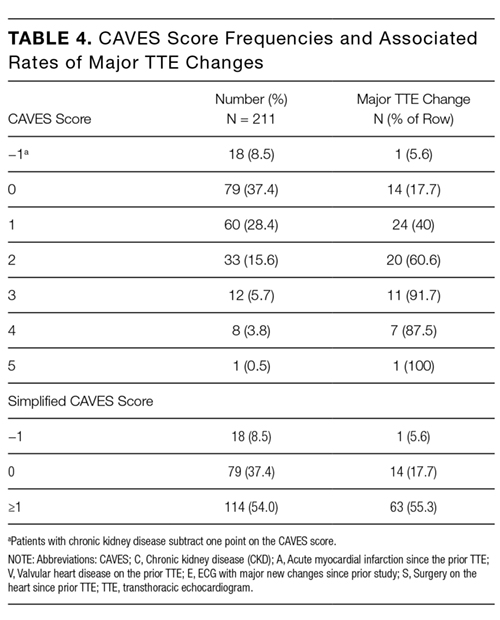
In summary, we have developed a simple score to predict the likelihood of major changes on repeat TTEs for hospitalized patients. The CAVES score identified 8.5% of patients as being low risk for changed repeat TTE, 37% at intermediate risk, and 54% at high risk for major changes. We believe that the CAVES score, if further validated, may be used to risk stratify patients for ordering TTE and to potentially avoid unnecessary repeat studies.
Disclosure
The authors indicated no conflicts of interest.
1. Virnig BA, Shippee SN, O’Donnell B, Zeglin J, Parashuram S. Data point 20: echocardiography trends. In Trends in the Use of Echocardiography, 2007 to 2011. Rockville, MD: Agency for Healthcare Research and Quality; 2014. p 1-21. PubMed
2. Andrus BW, Welch HG. Medicare services provided by cardiologists in the United States: 1999-2008. Circ Cardiovasc Qual Outcomes. 2012;5(1):31-36. PubMed
3. Report to the Congress: Medicare Payment Policy. 2016; 105. http://www.medpac.gov/docs/default-source/data-book/june-2016-data-book-section-7-ambulatory-care.pdf?sfvrsn=0. Accessed on August 14, 2017.
4. American College of Cardiology Foundation Appropriate Use Criteria Task Force, American Society of Echocardiography, American Heart Association, et al. ACCF/ASE/AHA/ASNC/HFSA/HRS/SCAI/SCCM/SCCT/SCMR 2011 Appropriate use criteria for echocardiography. A report of the American College of Cardiology Foundation Appropriate Use Criteria Task Force, American Society of Echocardiography, American Heart Association, American Society of Nuclear Cardiology, Heart Failure Society of America, Heart Rhythm Society, Society for Cardiovascular Angiography and Interventions, Society of Critical Care Medicine, Society of Cardiovascular Computed Tomography, and Society for Cardiovascular Magnetic Resonance Endorsed by the American College of Chest Physicians. J Am Coll Cardiol. 2011;57(9):1126-1166. PubMed
5. Matulevicius SA, Rohatgi A, Das SR, Price AL, DeLuna A, Reimold SC. Appropriate use and clinical impact of transthoracic echocardiography. JAMA Intern Med. 2013;173(17):1600-1607. PubMed
6. Ioannidis JP. Appropriate vs clinically useful diagnostic tests. JAMA Intern Med. 2013;173(17):1607-1609. PubMed
7. Ghatak A, Pullatt R, Vyse S, Silverman DI. Appropriateness criteria are an imprecise measure for repeat echocardiograms. Echocardiography. 2011;28(2):131-135. PubMed
8. Koshy TP, Rohatgi A, Das SR, et al. The association of abnormal findings on transthoracic echocardiography with 2011 Appropriate Use Criteria and clinical impact. Int J Cardiovasc Imaging. 2015;31(3):521-528. PubMed
9. Bhatia RS, Carne DM, Picard MH, Weiner RB. Comparison of the 2007 and 2011 appropriate use criteria for transesophageal echocardiography. J Am Soc Echocardiogr. 2012;25(11):1170-1175. PubMed
10. Welch HG, Hayes KJ, Frost C. Repeat testing among Medicare beneficiaries. Arch Intern Med. 2012;172(22):1745-1751. PubMed
11. Collins GS, Reitsma JB, Altman DG, Moons KG. Transparent Reporting of a multivariable prediction model for Individual Prognosis Or Diagnosis (TRIPOD). Ann Intern Med. 2015;162(10):735-736. PubMed
12. Ward RP, Mansour IN, Lemieux N, Gera N, Mehta R, Lang RM. Prospective evaluation of the clinical application of the American College of Cardiology Foundation/American Society of Echocardiography Appropriateness Criteria for transthoracic echocardiography. JACC Cardiovasc Imaging. 2008;1(5):663-671. PubMed
13. Bhatia RS, Carne DM, Picard MH, Weiner RB. Comparison of the 2007 and 2011 appropriate use criteria for transthoracic echocardiography in various clinical settings. J Am Soc Echocardiogr. 2012;25(11):1162-1169. PubMed
14. Mansour IN, Razi RR, Bhave NM, Ward RP. Comparison of the updated 2011 appropriate use criteria for echocardiography to the original criteria for transthoracic, transesophageal, and stress echocardiography. J Am Soc Echocardiogr. 2012;25(11):1153-1161. PubMed
15. Denes P, Larson JC, Lloyd-Jones DM, Prineas RJ, Greenland P. Major and minor ECG abnormalities in asymptomatic women and risk of cardiovascular events and mortality. JAMA. 2007;297(9):978-985. PubMed
16. Kirkpatrick JN, Ky B, Rahmouni HW, et al. Application of appropriateness criteria in outpatient transthoracic echocardiography. J Am Soc Echocardiogr. 2009;22(1):53-59. PubMed
Transthoracic echocardiography (TTE) is one of the most commonly ordered diagnostic tests in healthcare. Studies of Medicare beneficiaries, for example, have shown that each year, approximately 20% undergo at least 1 TTE, including 4% who have 2 or more.1 TTE utilization rates increased dramatically in the 1990s and early 2000s. Between 1999 and 2008, for example, the rate of use of TTE per Medicare beneficiary nearly doubled.2 In 2014, echocardiography accounted for 10% of all Medicare spending for imaging services, or approximately $930 million.3 In response to concerns about the possible unnecessary use of TTE, the American Heart Association and American Society of Echocardiography developed Appropriate Use Criteria (AUC) in 2007 and 2011, which describe appropriate versus inappropriate indications for TTE.4 Subsequent studies have shown that rather than rooting out inappropriate studies, the vast majority of ordered studies appear to be appropriate according to the AUC criteria.5 The AUC criteria have also been criticized for being based on expert opinion rather than clinical evidence.6 Repeat TTE, defined as TTE done within 1 year of a prior TTE, represents 24% to 42% of all studies,7-9 and 31% of all Medicare beneficiaries who have a TTE get a repeat TTE within 1 year.10 In the present study, we reviewed all inpatient TTE performed over 1 year and described the group that have had a prior TTE within the past year (“repeat TTE”). We then derived a clinical prediction model to predict unchanged repeat TTE, with the goal of defining a subset of studies that are potentially unnecessary.
METHODS
The West Haven Connecticut Veteran’s Administration Hospital (WHVA), located outside New Haven, Connecticut, is a 228-bed tertiary care center affiliated with Yale University School of Medicine. Potential subjects were identified from review of the electronic medical records of all inpatients who had an inpatient echocardiogram between October 1, 2013, and September 30, 2014. Patient’s records were reviewed by using a standardized data extraction form for demographics, comorbidity, cardiovascular risk factors, service ordering the TTE, intensive care unit (ICU) location, prior TTE abnormalities, TTE indication, AUC category, time between TTEs, technical quality of TTE, electrocardiogram (ECG) abnormalities, history of intervening acute coronary syndrome, cardiac surgery, and revascularization. Candidate predictors included any variables suspected by the authors as being potentially associated with the primary outcome of changed repeat TTE. All patients who had an inpatient TTE and a prior TTE within the Veterans Affairs (VA) system within the past year were included in the study. Repeat studies from the same admission were only counted as 1 TTE and patients had to have had a prior TTE from a different admission or a prior outpatient TTE to be included. Patients who did not have a prior TTE within the past year or who had only a transesophageal echocardiogram or stress echocardiography were excluded. Suboptimal studies were included but noted as limited quality. The study was approved by the WHVA Institutional Review Board. The Transparent Reporting of a Multivariable Prediction Model for Individual Prognosis or Diagnosis statement was used in planning and reporting this study.11
TTEs were classified as normal, mildly abnormal, or with a major abnormality based on previously published definitions.12-14 Any abnormality was defined as any left ventricle (LV) dysfunction (left ventricular ejection fraction [LVEF] <55%), any aortic or mitral valve stenosis, any regional wall motion abnormality, any right ventricular dysfunction, any pulmonary hypertension, mild or greater valvular regurgitation, any diastolic dysfunction, moderate or greater pericardial effusion, any ventricular hypertrophy, or any other significant abnormality including thrombus, vegetation, or tamponade. Major abnormality was defined as moderate or greater LV dysfunction (LVEF <45%), moderate or greater valvular regurgitation, moderate or greater valvular stenosis (aortic or mitral valve area <1.5 cm²), any regional wall motion abnormality, right ventricular dysfunction, moderate or greater pulmonary hypertension, moderate or greater diastolic dysfunction, moderate or greater pericardial effusion, or any other major abnormality including thrombus, vegetation, tumor, or tamponade. Repeat TTEs were classified as changed or unchanged. Changed TTEs were divided into any new abnormality or improvement or a new major abnormality or improvement. Any new abnormality or improvement was defined as any new TTE abnormality that had not previously been described or in which there was a change of at least 1 severity grade from a prior TTE, including improvement by 1 grade. A new major TTE abnormality or improvement was defined as any new major TTE abnormality that had previously been normal, or if there had been a prior abnormality, a change in at least 1 severity grade for LVEF or 2 severity grades for abnormal valvular, pericardial, or prior pulmonary hypertension, including improvement by 2 severity grades. A change from mild to moderate mitral regurgitation therefore was classified as a nonmajor change, whereas a change from mild to severe was classified as major. All TTE classifications were based on the electronic TTE reports and were reviewed by 2 independent investigators (CG and JC) blinded to the patients’ other clinical characteristics. For TTE studies in which the investigators agreed, that determination was the final classification. Disagreements were reviewed and the final classification was determined by consensus.
In an analogous manner, ECGs were classified as normal, mildly abnormal, or with a major abnormality based on previous definitions in the literature.15 Major abnormality was defined as atrial fibrillation or flutter, high-degree atrioventricular blocks, left bundle-branch block, right bundle-branch block, indeterminate conduction delay, q-wave myocardial infarction, isolated ischemic abnormalities, left ventricular hypertrophy with ST-T abnormalities, other arrhythmias including supraventricular tachycardia (SVT) or ventricular tachycardia (VT), low voltage (peak-to-peak QRS amplitude of <5 mm in the limb leads and/or <10 mm in the precordial leads), paced rhythm, sinus tachycardia (heart rate [HR] >100) or bradycardia (HR <50). Mild ECG abnormality was defined as low-grade atrioventricular blocks, borderline prolonged ventricular excitation, prolonged ventricular repolarization, isolated minor Q and ST-T abnormalities, left ventricular hypertrophy without ST-T abnormalities, left atrial enlargement, atrial or ventricular premature beats, or fascicular blocks. New major ECG abnormalities were any of the listed major ECG abnormalities that were not present on ECGs prior to the admission during which the repeat TTE was performed.
Other study definitions included intervening acute myocardial infarction (AMI), which was defined by any intervening history of elevated troponins, regardless of symptoms or ECG changes and including demand ischemia. Chronic kidney disease (CKD) was defined as an abnormal serum creatinine on 2 or more occasions 3 months apart. Active cancer was defined as receiving chemotherapy or palliative care for advanced cancer. Valvular heart disease was defined as prior moderate or severe valvular stenosis or regurgitation.
For analysis, we first compared patients with repeat TTE with major changes with those without major changes. For comparison of dichotomous variables, χ2 or Fisher exact tests were used. For continuous variables, Student t test or the Mann-Whitney U test were performed. Because many of the frequencies of individual AUC criteria were small, related AUC criteria were grouped for analysis as grouped by the tables of the American College of Cardiology Foundation Appropriate Use Criteria Task Force, American Society of Echocardiography, American Heart Association, American Society of Nuclear Cardiology, Heart Failure Society of America, Heart Rhythm Society, Society for Cardiovascular Angiography and Interventions, Society of Critical Care Medicine, Society of Cardiovascular Computed Tomography, and Society for Cardiovascular Magnetic Resonance (ACCF/ASE/AHA) Guideline.4 Criteria groupings that were significantly less likely to have major TTE changes on analysis were classified as low risk and criteria that were significantly more likely were classified as high risk. Criteria groupings that were not significantly associated with TTE change were classified as average risk. All variables with P values less than 0.05 on bivariate analysis were then entered into a multivariate logistic regression analysis with major TTE change as the dependent variable, using backward stepwise variable selection with entry and exit criteria of P < 0.05 and P > 0.10, respectively. Scores were derived by converting the regression coefficients of independently predictive variables in the logistic regression model into corresponding integers. A total score was calculated for each patient by summing up the points for each independently significant variable. Model performance was described by calculating a C statistic by creation of a receiver operating characteristic curve to assess discrimination, and by performing the Hosmer and Lemeshow test to assess calibration. Internal validation was assessed by calculating the C statistic using the statistical method of bootstrapping in which the data were resampled multiple times (n = 200) and the average resultant C statistic reported. The bootstrap analysis was performed using R version 3.1 (R Foundation for Statistical Computing, Vienna, Austria). All other analyses were performed using SPSS version 21.0 (IBM, Armonk, New York). P values <0.05 were considered significant.
RESULTS
During the 1-year study period, there were 3944 medical/surgical admissions for 3266 patients and 845 inpatient TTEs obtained on 601 patients. Of all patients who were admitted, 601/3266 (18.4%) had at least 1 inpatient TTE. Of these 601 TTEs, 211 (35%) had a TTE within the VA system during the prior year. Of the 211 repeat TTEs, 67 (32%) were unchanged, 66 (31%) had minor changes, and 78 (37%) had major changes. The kappa statistic for agreement between extractors for “major TTE change” was 0.91, P < 0.001. The 10 most common AUC indications for TTE, which accounted for 72% of all studies, are listed in Table 1. The initial AUCs assigned by reviewers were the same in 187 of 211 TTEs (kappa 0.86, P < 0.001). Most indications were not associated with TTE outcome, although studies ordered for AUC indications 1 and 2 were less likely be associated with major changes and AUC indications 22 and 47 were more likely to be associated with major changes. Table 2 shows the comparison of the 78 patients that had repeat TTE with major changes compared with the 133 patients that did not. Nine variables were significantly different between the 2 groups; repeat TTEs with major changes were more likely to have dementia, be ordered by the surgery service, be located in an ICU, have major new ECG changes, have had prior valvular heart disease, have had an intervening AMI or cardiac surgery, or be in a high-risk AUC category. Patients with CKD were less likely to have major changes. Table 3 shows the results of the multivariate analysis; CKD, intervening AMI, prior valvular heart disease, major new ECG changes, and intervening cardiac surgery all independently predicted major changes on repeat TTE. Based on the β-coefficient for each variable, a point system was assigned to each variable and a total score calculated for each patient. Most variables had β-coefficients close to 1 and were therefore assigned a score of 1. CKD was associated with a lower risk of major TTE abnormality and was assigned a negative score. Intervening AMI was associated with a β-coefficient of 2.2 and was assigned a score of 2. Based on the points assigned to each variable and its presence or absence for each patient, a total score, which we named the CAVES score, was calculated. The acronym CAVES stands for CKD, AMI, valvular disease, ECG changes, and surgery (cardiac). Table 4 shows the frequencies of each score for each patient, ranging from patients with CKD and no other risk factors who scored −1 to patients without CKD who had all 4 of the other variables who scored 5. The prevalence of major TTE change for the full cohort was 37%. For the group with a CAVES score of −1, the probability was only 5.6%; for the group with a score of 0, the probability was 17.7%; and for the group with a score ≥1, the probability was 55.3%.
The bootstrap corrected C statistic for the model was 0.78 (95% confidence interval, 0.72-0.85), indicating good discrimination. The Hosmer and Lemeshow test showed nonsignificance, indicating good calibration (χ2 = 5.20, df = 6, P = 0.52).
DISCUSSION
In this retrospective study, we found that approximately 18% of all patients admitted to the hospital had an inpatient TTE performed, and that approximately 35% of this group had a prior TTE within the past year. Of the group with prior TTEs within the past year, 37% had a major new change and 63% had either minor or no changes. Prior studies have reported similar high rates of repeat TTE7-9 and of major changes on repeat TTE.8,14,16 On multivariate analysis, we found that 5 variables were independent predictors of new changes on TTE—absence of CKD, intervening AMI, intervening cardiac surgery, history of valvular heart disease, and major new ECG changes. We developed and internally validated a risk score based on these 5 variables, which was found to have good overall accuracy as measured by the bootstrap corrected C statistic. The simplified version of the score divides patients into low, intermediate, and high risk for major changes on TTE. The low-risk group, defined as the group with no risk factors, had an approximately 6% risk of a major TTE change; the intermediate risk group, defined as a score of 0, had an 18% risk of major TTE change; and the high-risk group, defined as a score of 1 or greater, had a 55% chance of major TTE change. We believe that this risk score, if further validated, will potentially allow hospital-based clinicians to estimate the chance of a major change on TTE prior to ordering the study. For the low-risk group, this may indicate that the study is unnecessary. Conversely, for patients at high risk, this may offer further evidence that it will be useful to obtain a repeat TTE.
In summary, we have developed a simple score to predict the likelihood of major changes on repeat TTEs for hospitalized patients. The CAVES score identified 8.5% of patients as being low risk for changed repeat TTE, 37% at intermediate risk, and 54% at high risk for major changes. We believe that the CAVES score, if further validated, may be used to risk stratify patients for ordering TTE and to potentially avoid unnecessary repeat studies.
Disclosure
The authors indicated no conflicts of interest.
1. Virnig BA, Shippee SN, O’Donnell B, Zeglin J, Parashuram S. Data point 20: echocardiography trends. In Trends in the Use of Echocardiography, 2007 to 2011. Rockville, MD: Agency for Healthcare Research and Quality; 2014. p 1-21. PubMed
2. Andrus BW, Welch HG. Medicare services provided by cardiologists in the United States: 1999-2008. Circ Cardiovasc Qual Outcomes. 2012;5(1):31-36. PubMed
3. Report to the Congress: Medicare Payment Policy. 2016; 105. http://www.medpac.gov/docs/default-source/data-book/june-2016-data-book-section-7-ambulatory-care.pdf?sfvrsn=0. Accessed on August 14, 2017.
4. American College of Cardiology Foundation Appropriate Use Criteria Task Force, American Society of Echocardiography, American Heart Association, et al. ACCF/ASE/AHA/ASNC/HFSA/HRS/SCAI/SCCM/SCCT/SCMR 2011 Appropriate use criteria for echocardiography. A report of the American College of Cardiology Foundation Appropriate Use Criteria Task Force, American Society of Echocardiography, American Heart Association, American Society of Nuclear Cardiology, Heart Failure Society of America, Heart Rhythm Society, Society for Cardiovascular Angiography and Interventions, Society of Critical Care Medicine, Society of Cardiovascular Computed Tomography, and Society for Cardiovascular Magnetic Resonance Endorsed by the American College of Chest Physicians. J Am Coll Cardiol. 2011;57(9):1126-1166. PubMed
5. Matulevicius SA, Rohatgi A, Das SR, Price AL, DeLuna A, Reimold SC. Appropriate use and clinical impact of transthoracic echocardiography. JAMA Intern Med. 2013;173(17):1600-1607. PubMed
6. Ioannidis JP. Appropriate vs clinically useful diagnostic tests. JAMA Intern Med. 2013;173(17):1607-1609. PubMed
7. Ghatak A, Pullatt R, Vyse S, Silverman DI. Appropriateness criteria are an imprecise measure for repeat echocardiograms. Echocardiography. 2011;28(2):131-135. PubMed
8. Koshy TP, Rohatgi A, Das SR, et al. The association of abnormal findings on transthoracic echocardiography with 2011 Appropriate Use Criteria and clinical impact. Int J Cardiovasc Imaging. 2015;31(3):521-528. PubMed
9. Bhatia RS, Carne DM, Picard MH, Weiner RB. Comparison of the 2007 and 2011 appropriate use criteria for transesophageal echocardiography. J Am Soc Echocardiogr. 2012;25(11):1170-1175. PubMed
10. Welch HG, Hayes KJ, Frost C. Repeat testing among Medicare beneficiaries. Arch Intern Med. 2012;172(22):1745-1751. PubMed
11. Collins GS, Reitsma JB, Altman DG, Moons KG. Transparent Reporting of a multivariable prediction model for Individual Prognosis Or Diagnosis (TRIPOD). Ann Intern Med. 2015;162(10):735-736. PubMed
12. Ward RP, Mansour IN, Lemieux N, Gera N, Mehta R, Lang RM. Prospective evaluation of the clinical application of the American College of Cardiology Foundation/American Society of Echocardiography Appropriateness Criteria for transthoracic echocardiography. JACC Cardiovasc Imaging. 2008;1(5):663-671. PubMed
13. Bhatia RS, Carne DM, Picard MH, Weiner RB. Comparison of the 2007 and 2011 appropriate use criteria for transthoracic echocardiography in various clinical settings. J Am Soc Echocardiogr. 2012;25(11):1162-1169. PubMed
14. Mansour IN, Razi RR, Bhave NM, Ward RP. Comparison of the updated 2011 appropriate use criteria for echocardiography to the original criteria for transthoracic, transesophageal, and stress echocardiography. J Am Soc Echocardiogr. 2012;25(11):1153-1161. PubMed
15. Denes P, Larson JC, Lloyd-Jones DM, Prineas RJ, Greenland P. Major and minor ECG abnormalities in asymptomatic women and risk of cardiovascular events and mortality. JAMA. 2007;297(9):978-985. PubMed
16. Kirkpatrick JN, Ky B, Rahmouni HW, et al. Application of appropriateness criteria in outpatient transthoracic echocardiography. J Am Soc Echocardiogr. 2009;22(1):53-59. PubMed
© 2018 Society of Hospital Medicine