User login
In California, medical vaccine exemptions tripled after personal belief exemption ban
The proportion of California kindergartners with medical exemptions from vaccination tripled after the state eliminated personal belief exemptions, a study has shown.
Furthermore, California counties that previously had the highest rates of personal belief exemptions now have the highest rates of medical exemptions, Paul L. Delamater, PhD, of the University of North Carolina at Chapel Hill, and his associates reported in a research letter in JAMA. Such trends undermine California Senate Bill 277, will “limit [the law’s] long-term benefits, if sustained,” and could lead to outbreaks of vaccine-preventable diseases in the near future, the researchers warned.
Beginning in fall 2016, SB 277 prohibited unvaccinated kindergartners from matriculating at a public or private school in California without a medical exemption from vaccination, having eliminated the personal belief exemption from the state’s school-entry vaccine requirements. But the new law also gave physicians broader discretion to grant the medical exemptions, prompting concerns that “vaccine-hesitant” parents might successfully obtain medical exemptions in lieu of personal belief exemptions. To explore that possibility, the researchers analyzed data from the California state health department on kindergarten enrollment, vaccination, and vaccination exemptions. These data covered about 95% of California kindergartners, Dr. Delamater and his associates noted (JAMA. 2017;318[9]:863-4).
At the county level, rates of medical exemptions strongly correlated with historic rates of personal belief exemptions (P less than .001). Thus, counties with the highest historic rates of personal belief exemptions had the largest increases in rates of medical exemptions in 2016, that is, a change of between –1.00% and 3.38% of kindergartners. Furthermore, vaccination rates among all elementary school-aged children in California are even lower because SB 277 permitted children who previously entered kindergarten with personal belief exemptions to continue attending school without receiving vaccines until seventh grade. “Because the largest increases in [medical exemption] percentage occurred in regions with high past–[personal belief exemption] use, portions of California may remain susceptible to vaccine-preventable disease outbreaks in the near future,” Dr. Delamater and his associates concluded.
The investigators reported having no conflicts of interest.
FROM JAMA
Key clinical point:
Major finding: In 2016, 0.51% of California kindergartners had medical exemptions, a threefold rise from 2015.
Data source: An analysis of reportable state health department data from 2001 to 2016.
Disclosures: The investigators reported having no conflicts of interest.
The Disease for Which There Is No Cure and Not Enough Conversation
If I simply let the title of this column stand alone, I suspect most readers of Federal Practitioner would fill in the blank with diseases, such as cancer, HIV, or even devastating genetic conditions, just as I would if presented with the statement without explication.
I read the sentence several weeks ago on a website for caregivers of patients with dementia while browsing for quite a different purpose, and it has haunted me ever since. As a consultation psychiatrist who has spent my career as a VA hospitalist, I am well aware of the sad reality of dementia, but against the backdrop of the aging veteran population, the poignancy of the human tragedy overwhelmed me.
Almost every day on the medical and surgical wards of the VA hospital where I have worked for nearly 2 decades, I see an aging veteran population. There are days when the average age of inpatients is pushing 70 years, and there are many patients in their 80s and 90s. The statistics show that my facility is by no means unique in the VA. Data from the American Community Survey Profile of veterans in 2015 indicate that the median age of veterans is 64 years whereas that of nonveterans is 41.1 The survey emphasized that this age factor has a rippling effect on many other demographic parameters, such as disability, income, and employment, all, in turn, impact the epidemiology of health and illness.1
It is not just age that increases the likelihood that a veteran will develop dementia: Research has identified several aspects of military service that raise the risk of being diagnosed with major neurocognitive disorder, the Diagnostic and Statistical Manual of Mental Disorders, 5th Edition designation for dementia. Many families, patients, and even a few health care professionals may not realize that major neurocognitive disorder is the new neuropsychiatric term for dementia.
Also, many health care professionals do not realize that dementia is the sixth leading cause of death in the U.S.2 Traumatic brain injury, posttraumatic stress disorder, and depression are identified as potential contributors to a higher incidence of dementia in service men and women often with onset at an earlier age.3 Given the prevalence of these comorbidities in persons who were in the military, the VA and DoD will face the medical and psychosocial challenges of providing not only clinical treatment, but also a range of social services for military personnel and veterans. Indeed, federal institutions like the GRECC (Geriatric Research Education and Clinical Center) already are engaged in cutting edge research, delivering high-quality medical treatment, and specialized geriatric and dementia care education and support.
Despite these impressive efforts, too often families ask me 2 crucial questions when a patient is already at a moderate or severe stage of the disease: Is there a cure, and will they get better with or without treatment? This lack of knowledge and understanding is by no means confined to federal health care.
A 2015 report from the Alzheimer’s Association found that 45% of patients with Alzheimer disease or their caregivers were not told about the diagnosis by the doctor.2 Doctors reported that they were more likely to have informed the family of a cancer diagnosis at least in part because they felt there were treatments available and in some cases a cure.
Families ask these questions of me and other health care professionals in the hope of finding guidance. Often the veteran has been hospitalized after behavioral disturbances or wandering have made it impossible to care for the loved elder at home. The family is faced with a double blow: learning the patient has an incurable terminal disease and having to make the decision to place a grandmother or father in a nursing facility. Granted this woeful decision may have to be made even when the family has been fully informed at the time of diagnosis, but it is more distressing when the decision is needed immediately based on safety.
Husbands and wives of 50 years or more and adult children, graying themselves, often ask the second question about improvement. Although treatments exist that can help relieve symptoms and slow progression temporarily, the inexorable and tragic course of the wiping away of memory cannot be reversed or halted.
Not surprisingly, practitioners avoid telling patients and families about a dementia diagnosis because those conversations are painful and difficult. However, the news is much less agonizing to hear when there is time to enjoy the good days that remain and to make arrangements for finances and families. For these important reasons, VA emphasizes shared decision making as the cornerstone of geriatric care. Yet there can be no shared decisions without the compassionate and truthful telling about the diagnosis and the prognosis.
1. U.S. Department of Veterans Affairs National Ce- nter for Veterans Analytics and Statistics. Profile of veterans: 2015 data from the American Community Survey. https://www.va.gov/vetdata/docs/Specia lReports/Profile_of_Veterans_2015.pdf. Published March 2017. Accessed August 22, 2017.
2. Alzheimer’s Association. 2015 Alzheimer’s disease facts and figures. Alzheimers Dement. 2015;11(3):332-384.
3. Weiner MW, Friedl KE, Pacifico A, et al. Military risk factors for Alzheimer’s disease. Alzheimers Dement. 2013;9(4):445-451.
If I simply let the title of this column stand alone, I suspect most readers of Federal Practitioner would fill in the blank with diseases, such as cancer, HIV, or even devastating genetic conditions, just as I would if presented with the statement without explication.
I read the sentence several weeks ago on a website for caregivers of patients with dementia while browsing for quite a different purpose, and it has haunted me ever since. As a consultation psychiatrist who has spent my career as a VA hospitalist, I am well aware of the sad reality of dementia, but against the backdrop of the aging veteran population, the poignancy of the human tragedy overwhelmed me.
Almost every day on the medical and surgical wards of the VA hospital where I have worked for nearly 2 decades, I see an aging veteran population. There are days when the average age of inpatients is pushing 70 years, and there are many patients in their 80s and 90s. The statistics show that my facility is by no means unique in the VA. Data from the American Community Survey Profile of veterans in 2015 indicate that the median age of veterans is 64 years whereas that of nonveterans is 41.1 The survey emphasized that this age factor has a rippling effect on many other demographic parameters, such as disability, income, and employment, all, in turn, impact the epidemiology of health and illness.1
It is not just age that increases the likelihood that a veteran will develop dementia: Research has identified several aspects of military service that raise the risk of being diagnosed with major neurocognitive disorder, the Diagnostic and Statistical Manual of Mental Disorders, 5th Edition designation for dementia. Many families, patients, and even a few health care professionals may not realize that major neurocognitive disorder is the new neuropsychiatric term for dementia.
Also, many health care professionals do not realize that dementia is the sixth leading cause of death in the U.S.2 Traumatic brain injury, posttraumatic stress disorder, and depression are identified as potential contributors to a higher incidence of dementia in service men and women often with onset at an earlier age.3 Given the prevalence of these comorbidities in persons who were in the military, the VA and DoD will face the medical and psychosocial challenges of providing not only clinical treatment, but also a range of social services for military personnel and veterans. Indeed, federal institutions like the GRECC (Geriatric Research Education and Clinical Center) already are engaged in cutting edge research, delivering high-quality medical treatment, and specialized geriatric and dementia care education and support.
Despite these impressive efforts, too often families ask me 2 crucial questions when a patient is already at a moderate or severe stage of the disease: Is there a cure, and will they get better with or without treatment? This lack of knowledge and understanding is by no means confined to federal health care.
A 2015 report from the Alzheimer’s Association found that 45% of patients with Alzheimer disease or their caregivers were not told about the diagnosis by the doctor.2 Doctors reported that they were more likely to have informed the family of a cancer diagnosis at least in part because they felt there were treatments available and in some cases a cure.
Families ask these questions of me and other health care professionals in the hope of finding guidance. Often the veteran has been hospitalized after behavioral disturbances or wandering have made it impossible to care for the loved elder at home. The family is faced with a double blow: learning the patient has an incurable terminal disease and having to make the decision to place a grandmother or father in a nursing facility. Granted this woeful decision may have to be made even when the family has been fully informed at the time of diagnosis, but it is more distressing when the decision is needed immediately based on safety.
Husbands and wives of 50 years or more and adult children, graying themselves, often ask the second question about improvement. Although treatments exist that can help relieve symptoms and slow progression temporarily, the inexorable and tragic course of the wiping away of memory cannot be reversed or halted.
Not surprisingly, practitioners avoid telling patients and families about a dementia diagnosis because those conversations are painful and difficult. However, the news is much less agonizing to hear when there is time to enjoy the good days that remain and to make arrangements for finances and families. For these important reasons, VA emphasizes shared decision making as the cornerstone of geriatric care. Yet there can be no shared decisions without the compassionate and truthful telling about the diagnosis and the prognosis.
1. U.S. Department of Veterans Affairs National Ce- nter for Veterans Analytics and Statistics. Profile of veterans: 2015 data from the American Community Survey. https://www.va.gov/vetdata/docs/Specia lReports/Profile_of_Veterans_2015.pdf. Published March 2017. Accessed August 22, 2017.
2. Alzheimer’s Association. 2015 Alzheimer’s disease facts and figures. Alzheimers Dement. 2015;11(3):332-384.
3. Weiner MW, Friedl KE, Pacifico A, et al. Military risk factors for Alzheimer’s disease. Alzheimers Dement. 2013;9(4):445-451.

Optical Coherence Tomography in Dermatology
Optical coherence tomography (OCT) is a noninvasive imaging technique that is cleared by the US Food and Drug Administration as a 510(k) class II regulatory device to visualize biological tissues in vivo and in real time.1-3 In July 2017, OCT received 2 category III Current Procedural Terminology (CPT) codes from the American Medical Association—0470T and 0471T—enabling physicians to report and track the usage of this emerging imaging method.4 Category III CPT codes remain investigational and therefore are not easily reimbursed by insurance.5 The goal of OCT manufacturers and providers within the next 5 years is to upgrade to category I coding before the present codes are archived. Although documented advantages of OCT include its unique ability to effectively differentiate and monitor skin lesions throughout nonsurgical treatment as well as to efficiently delineate presurgical margins, additional research reporting its efficacy may facilitate the coding conversion and encourage greater usage of OCT technology. We present a brief review of OCT imaging in dermatology, including its indications and limitations.
RELATED VIDEO: Imaging Overview: Report From the Mount Sinai Fall Symposium
Types of OCT
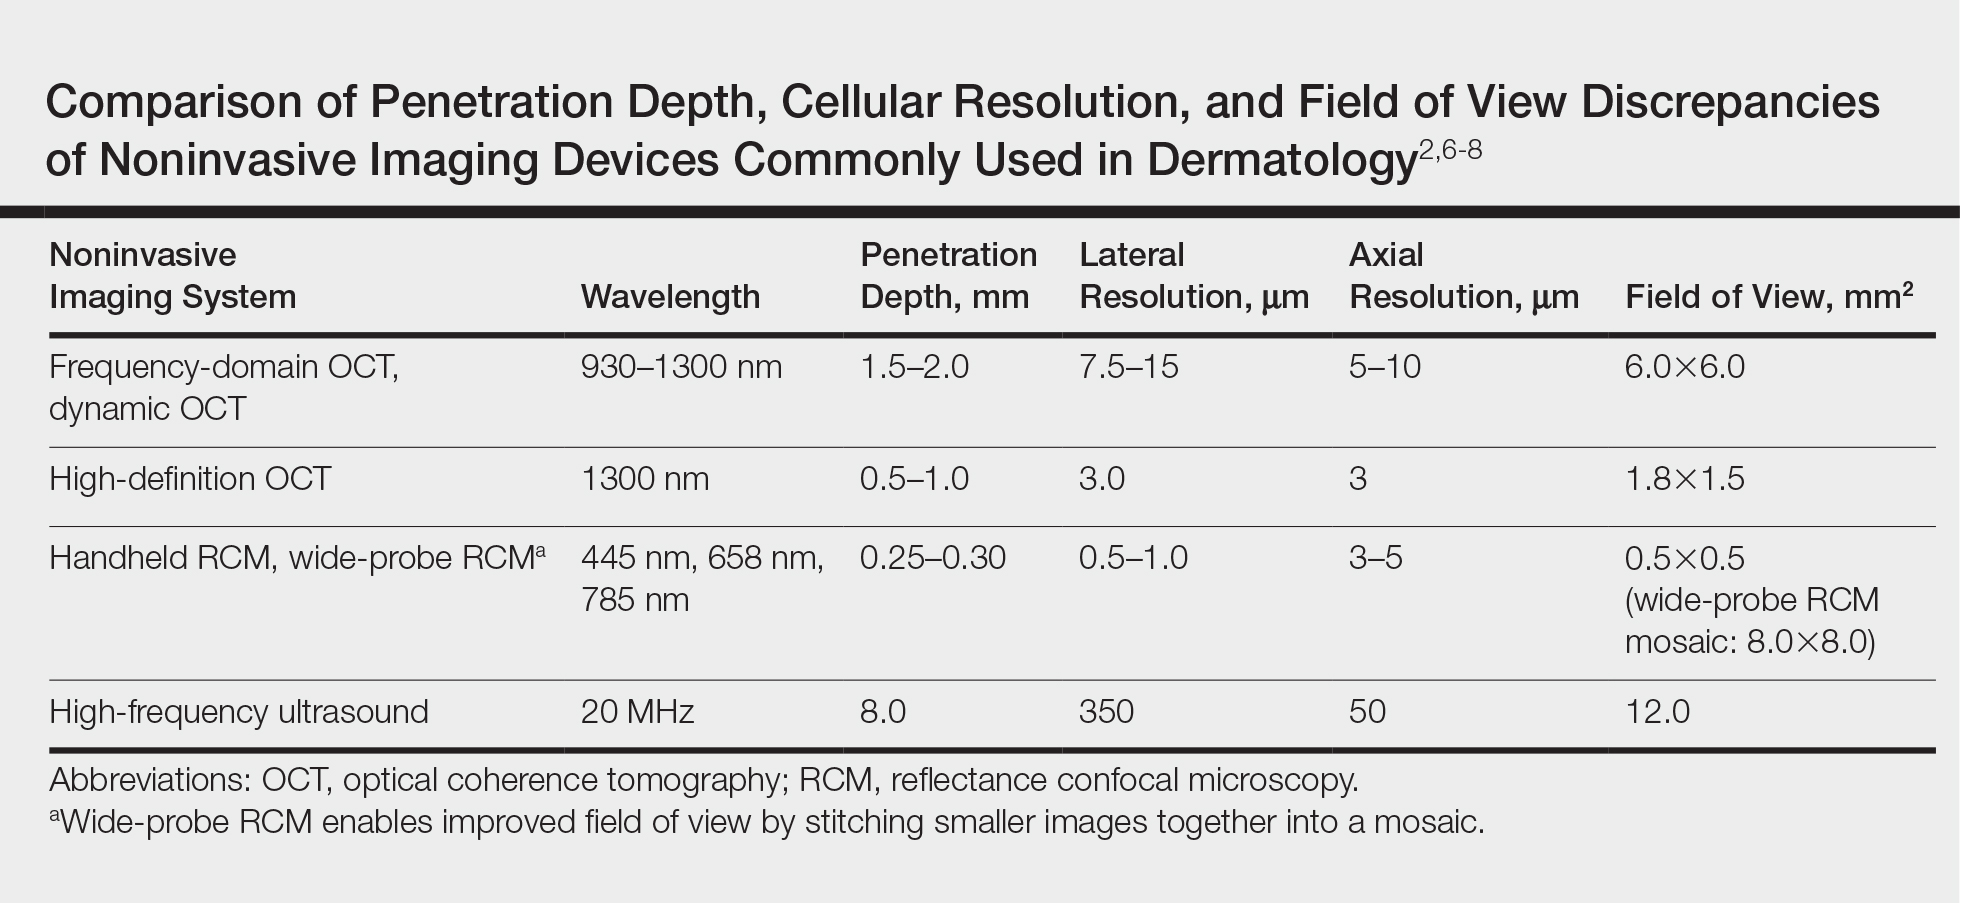
Optical coherence tomography, based on the principle of low-coherence interferometry, uses infrared light to extract fine details from within highly scattering turbid media to visualize the subsurface of the skin.2 Since its introduction for use in dermatology, OCT has been used to study skin in both the research and clinical settings.2,3 Current OCT devices on the market are mobile and easy to use in a busy dermatology practice. The Table reviews the most commonly used noninvasive imaging tools for the skin, depicting the inverse relationship between penetration depth and cellular resolution as well as field of view discrepancies.2,6-8 Optical coherence tomography technology collects cross-sectional (vertical) images similar to histology and en face (horizontal) images similar to reflective confocal microscopy (RCM) of skin areas with adequate cellular resolution and without compromising penetration depth as well as a field of view comparable to the probe aperture contacting the skin.
RELATED VIDEO: Noninvasive Imaging: Report From the Mount Sinai Fall Symposium
Conventional OCT
Due to multiple simultaneous beams, conventional frequency-domain OCT (FD-OCT) provides enhanced lateral resolution of 7.5 to 15 µm and axial resolution of 5 to 10 µm with a field of view of 6.0×6.0 mm2 and depth of 1.5 to 2.0 mm.2,6,8 Conventional FD-OCT detects architectural details within tissue with better cellular clarity than high-frequency ultrasound and better depth than RCM, yet FD-OCT is not sufficient to distinguish individual cells.
Dynamic OCT
The recent development of dynamic OCT (D-OCT) software based on speckle-variance has the added ability to visualize the skin microvasculature and therefore detect blood vessels and their distribution within specific lesions. This angiographic variant of FD-OCT detects motion corresponding to blood flow in the images and may enhance diagnostic accuracy, particularly in the differentiation of nevi and malignant melanomas.8-11
High-Definition OCT
High-definition OCT (HD-OCT), a hybrid of RCM and FD-OCT, provides improved optical resolution of 3 μm for both lateral and axial imaging approaching a resolution similar to RCM making it possible to visualize individual cells, though at the expense of lower penetration depth of 0.5 to 1.0 mm and reduced field of view of 1.8×1.5 mm2 to FD-OCT. High-definition OCT combines 2 different views to produce a 3-dimensional image for additional data interpretation (Table).7,8,12
Current CPT Guidelines
Two category III CPT codes—0470T and 0471T—allow the medical community to collect and track the usage of the emerging OCT technology. Code 0470T is used for microstructural and morphological skin imaging, specifically acquisition, interpretation, and reading of the images. Code 0471T is used for each additional skin lesion imaged.4
Current Procedural Terminology category III codes remain investigational in contrast to the permanent category I codes. Reimbursement for CPT III codes is difficult because it is not generally an accepted service covered by insurance.5 The goal within the next 5 years is to convert to category I CPT codes, meanwhile the CPT III codes should encourage increased utilization of OCT technology.
Indications for OCT
Depiction of Healthy Versus Diseased Skin
Optical coherence tomography is a valuable tool in visualizing normal skin morphology including principal skin layers, namely the dermis, epidermis, and dermoepidermal junction, as well as structures such as hair follicles, blood vessels, and glands.2,13 The OCT images show architectural changes of the skin layers and can be used to differentiate abnormal from normal tissue in vivo.2
Diagnosis and Treatment Monitoring of Skin Cancers
Optical coherence tomography is well established for use in the diagnosis and management of nonmelanoma skin cancers and to determine clinical end points of nonsurgical treatment without the need for skin biopsy. Promising diagnostic criteria have been developed for nonmelanoma skin cancers including basal cell carcinoma (BCC) and squamous cell carcinoma, as well as premalignant actinic keratoses using FD-OCT and the newer D-OCT and HD-OCT devices.9-17 For example, FD-OCT offers improved diagnosis of lesions suspicious for BCC, the most common type of skin cancer, showing improved sensitivity (79%–96%) and specificity (75%–96%) when compared with clinical assessment and dermoscopy alone.12,14 Typical OCT features differentiating BCC from other lesions include hyporeflective ovoid nests with a dark rim and an alteration of the dermoepidermal junction. In addition to providing a good diagnostic overview of skin, OCT devices show promise in monitoring the effects of treatment on primary and recurrent lesions.14-16
In Vivo Excision Planning
Additionally, OCT is a helpful tool in delineating tumor margins prior to surgical resection to achieve optimal cosmesis. By detecting subclinical tumor extension, this preoperative technique has been shown to reduce the number of surgical stages. Pomerantz et al17 showed that mapping BCC tumor margins with OCT prior to Mohs micrographic surgery closely approximated the final surgical defects. Alawi et al18 showed that the OCT-defined lateral margins correctly indicated complete removal of tumors. These studies illustrate the ability of OCT to minimize the amount of skin excised without compromising the integrity of tumor-free borders. The use of ex vivo OCT to detect residual tumors is not recommended based on current studies.6,17,18
Diagnosis and Treatment Monitoring of Other Diseases
Further applications of OCT include diagnosis of noncancerous lesions such as nail conditions, scleroderma, psoriatic arthritis, blistering diseases, and vascular lesions, as well as assessment of skin moisture and hydration, burn depth, wound healing, skin atrophy, and UV damage.2 For example, Aldahan et al19 demonstrated the utility of D-OCT to identify structural and vascular features specific to nail psoriasis useful in the diagnosis and treatment monitoring of the condition.
Limitations of OCT
Resolution
Frequency-domain OCT enables the detection of architectural details within tissue, but its image resolution is not sufficient to distinguish individual cells, therefore restricting its use in evaluating pigmented benign and malignant lesions such as dysplastic nevi and melanomas. Higher-resolution RCM is superior for imaging these lesions, as its device can better evaluate microscopic structures. With the advent of D-OCT and HD-OCT, research is being conducted to assess their use in differentiating pigmented lesions.8,20 Schuh et al9 and Gambichler et al20 reported preliminary results indicating the utility of D-OCT and HD-OCT to differentiate dysplastic nevi from melanomas and melanoma in situ, respectively.
Depth Measurement
Another limitation is associated with measuring lesion depth for advanced tumors. Although the typical imaging depth of OCT is significantly deeper than most other noninvasive imaging modalities used on skin, imaging deep tumor margins and invasion is restricted.
Image Interpretation
Diagnostic imaging requires image interpretation leading to potential interobserver and intraobserver variation. Experienced observers in OCT more accurately differentiated normal from lesional skin compared to novices, which suggests that training could improve agreement.21,22
Reimbursement and Device Cost
Other practical limitations to widespread OCT utilization at this time include its initial laser device cost and lack of reimbursement. As such, large academic and research centers remain the primary sites to utilize these devices.
Future Directions
Optical coherence tomography complements other established noninvasive imaging tools allowing for real-time visualization of the skin without interfering with the tissue and offering images with a good balance of depth, resolution, and field of view. Although a single histology cut has superior cellular resolution to any imaging modality, OCT provides additional information that is not provided by a physical biopsy, given the multiple vertical sections of data. Optical coherence tomography is a useful diagnostic technique enabling patients to avoid unnecessary biopsies while increasing early lesion diagnosis. Furthermore, OCT helps to decrease repetitive biopsies throughout nonsurgical treatments. With the availability of newer technology such as D-OCT and HD-OCT, OCT will play an increasing role in patient management. Clinicians and researchers should work to convert from category III to category I CPT codes and obtain reimbursement for imaging, with the ultimate goal of increasing its use in clinical practice and improving patient care.
- Michelson Diagnostics secures CPT codes for optical coherence tomography imaging of skin [press release]. Maidstone, Kent, United Kingdom: Michelson Diagnostics; July 14, 2017. https://vivosight.com/wp-content/uploads/2017/07/Press-Release-CPT-code-announcement-12-July-2017.pdf. Accessed August 17, 2017.
- Schmitz L, Reinhold U, Bierhoff E, et al. Optical coherence tomography: its role in daily dermatological practice. J Dtsch Dermatol Ges. 2013;11:499-507.
- Hibler BP, Qi Q, Rossi AM. Current state of imaging in dermatology. Semin Cutan Med Surg. 2016;35:2-8.
- Current Procedural Terminology 2018, Professional Edition. Chicago IL: American Medical Association; 2017.
- Current Procedural Terminology 2017, Professional Edition. Chicago IL: American Medical Association; 2016.
- Cheng HM, Guitera P. Systemic review of optical coherence tomography usage in the diagnosis and management of basal cell carcinoma. Br J Dermatol. 2015;173:1371-1380.
- Cao T, Tey HL. High-definition optical coherence tomography—an aid to clinical practice and research in dermatology. J Dtsch Dermatol Ges. 2015;13:886-890.
- Schwartz M, Siegel DM, Markowitz O. Commentary on the diagnostic utility of non-invasive imaging devices for field cancerization. Exp Dermatol. 2016;25:855-856.
- Schuh S, Holmes J, Ulrich M, et al. Imaging blood vessel morphology in skin: dynamic optical coherence tomography as a novel potential diagnostic tool in dermatology. Dermatol Ther. 2017;7:187-202.
- Themstrup L, Pellacani G, Welzel J, et al. In vivo microvascular imaging of cutaneous actinic keratosis, Bowen’s disease and squamous cell carcinoma using dynamic optical coherence tomography [published online May 14, 2017]. J Eur Acad Dermatol Venereol. doi:10.1111/jdv.14335.
- Markowitz O, Schwartz M, Minhas S, et al. DM. Speckle-variance optical coherence tomography: a novel approach to skin cancer characterization using vascular patterns. Dermatol Online J. 2016;18:22. pii:13030/qt7w10290r.
- Ulrich M, von Braunmuehl T, Kurzen H, et al. The sensitivity and specificity of optical coherence tomography for the assisted diagnosis of nonpigmented basal cell carcinoma: an observational study. Br J Dermatol. 2015;173:428-435.
- Hussain AA, Themstrup L, Jemec GB. Optical coherence tomography in the diagnosis of basal cell carcinoma. Arch Dermatol Res. 2015;307:1-10.
- Markowitz O, Schwartz M, Feldman E, et al. Evaluation of optical coherence tomography as a means of identifying earlier stage basal carcinomas while reducing the use of diagnostic biopsy. J Clin Aesthet Dermatol. 2015;8:14-20.
- Banzhaf CA, Themstrup L, Ring HC, et al. Optical coherence tomography imaging of non-melanoma skin cancer undergoing imiquimod therapy. Skin Res Technol. 2014;20:170-176.
- Themstrup L, Banzhaf CA, Mogensen M, et al. Optical coherence tomography imaging of non-melanoma skin cancer undergoing photodynamic therapy reveals subclinical residual lesions. Photodiagnosis Photodyn Ther. 2014;11:7-12.
- Pomerantz R, Zell D, McKenzie G, et al. Optical coherence tomography used as a modality to delineate basal cell carcinoma prior to Mohs micrographic surgery. Case Rep Dermatol. 2011;3:212-218.
- Alawi SA, Kuck M, Wahrlich C, et al. Optical coherence tomography for presurgical margin assessment of non-melanoma skin cancer—a practical approach. Exp Dermatol. 2013;22:547-551.
- Aldahan AS, Chen LL, Fertig RM, et al. Vascular features of nail psoriasis using dynamic optical coherence tomography. Skin Appendage Disord. 2017;2:102-108.
- Gambichler T, Plura I, Schmid-Wendtner M, et al. High-definition optical coherence tomography of melanocytic skin lesions. J Biophotonics. 2015;8:681-686.
- Mogensen M, Joergensen TM, Nurnberg BM, et al. Assessment of optical coherence tomography imaging in the diagnosis of non-melanoma skin cancer and benign lesions versus normal skin: observer-blinded evaluation by dermatologists. Dermatol Surg. 2009;35:965-972.
- Olsen J, Themstrup L, De Carbalho N, et al. Diagnostic accuracy of optical coherence tomography in actinic keratosis and basal cell carcinoma. Photodiagnosis Photodyn Ther. 2016;16:44-49.
Optical coherence tomography (OCT) is a noninvasive imaging technique that is cleared by the US Food and Drug Administration as a 510(k) class II regulatory device to visualize biological tissues in vivo and in real time.1-3 In July 2017, OCT received 2 category III Current Procedural Terminology (CPT) codes from the American Medical Association—0470T and 0471T—enabling physicians to report and track the usage of this emerging imaging method.4 Category III CPT codes remain investigational and therefore are not easily reimbursed by insurance.5 The goal of OCT manufacturers and providers within the next 5 years is to upgrade to category I coding before the present codes are archived. Although documented advantages of OCT include its unique ability to effectively differentiate and monitor skin lesions throughout nonsurgical treatment as well as to efficiently delineate presurgical margins, additional research reporting its efficacy may facilitate the coding conversion and encourage greater usage of OCT technology. We present a brief review of OCT imaging in dermatology, including its indications and limitations.
RELATED VIDEO: Imaging Overview: Report From the Mount Sinai Fall Symposium
Types of OCT
Optical coherence tomography, based on the principle of low-coherence interferometry, uses infrared light to extract fine details from within highly scattering turbid media to visualize the subsurface of the skin.2 Since its introduction for use in dermatology, OCT has been used to study skin in both the research and clinical settings.2,3 Current OCT devices on the market are mobile and easy to use in a busy dermatology practice. The Table reviews the most commonly used noninvasive imaging tools for the skin, depicting the inverse relationship between penetration depth and cellular resolution as well as field of view discrepancies.2,6-8 Optical coherence tomography technology collects cross-sectional (vertical) images similar to histology and en face (horizontal) images similar to reflective confocal microscopy (RCM) of skin areas with adequate cellular resolution and without compromising penetration depth as well as a field of view comparable to the probe aperture contacting the skin.
RELATED VIDEO: Noninvasive Imaging: Report From the Mount Sinai Fall Symposium
Conventional OCT
Due to multiple simultaneous beams, conventional frequency-domain OCT (FD-OCT) provides enhanced lateral resolution of 7.5 to 15 µm and axial resolution of 5 to 10 µm with a field of view of 6.0×6.0 mm2 and depth of 1.5 to 2.0 mm.2,6,8 Conventional FD-OCT detects architectural details within tissue with better cellular clarity than high-frequency ultrasound and better depth than RCM, yet FD-OCT is not sufficient to distinguish individual cells.
Dynamic OCT
The recent development of dynamic OCT (D-OCT) software based on speckle-variance has the added ability to visualize the skin microvasculature and therefore detect blood vessels and their distribution within specific lesions. This angiographic variant of FD-OCT detects motion corresponding to blood flow in the images and may enhance diagnostic accuracy, particularly in the differentiation of nevi and malignant melanomas.8-11
High-Definition OCT
High-definition OCT (HD-OCT), a hybrid of RCM and FD-OCT, provides improved optical resolution of 3 μm for both lateral and axial imaging approaching a resolution similar to RCM making it possible to visualize individual cells, though at the expense of lower penetration depth of 0.5 to 1.0 mm and reduced field of view of 1.8×1.5 mm2 to FD-OCT. High-definition OCT combines 2 different views to produce a 3-dimensional image for additional data interpretation (Table).7,8,12
Current CPT Guidelines
Two category III CPT codes—0470T and 0471T—allow the medical community to collect and track the usage of the emerging OCT technology. Code 0470T is used for microstructural and morphological skin imaging, specifically acquisition, interpretation, and reading of the images. Code 0471T is used for each additional skin lesion imaged.4
Current Procedural Terminology category III codes remain investigational in contrast to the permanent category I codes. Reimbursement for CPT III codes is difficult because it is not generally an accepted service covered by insurance.5 The goal within the next 5 years is to convert to category I CPT codes, meanwhile the CPT III codes should encourage increased utilization of OCT technology.
Indications for OCT
Depiction of Healthy Versus Diseased Skin
Optical coherence tomography is a valuable tool in visualizing normal skin morphology including principal skin layers, namely the dermis, epidermis, and dermoepidermal junction, as well as structures such as hair follicles, blood vessels, and glands.2,13 The OCT images show architectural changes of the skin layers and can be used to differentiate abnormal from normal tissue in vivo.2
Diagnosis and Treatment Monitoring of Skin Cancers
Optical coherence tomography is well established for use in the diagnosis and management of nonmelanoma skin cancers and to determine clinical end points of nonsurgical treatment without the need for skin biopsy. Promising diagnostic criteria have been developed for nonmelanoma skin cancers including basal cell carcinoma (BCC) and squamous cell carcinoma, as well as premalignant actinic keratoses using FD-OCT and the newer D-OCT and HD-OCT devices.9-17 For example, FD-OCT offers improved diagnosis of lesions suspicious for BCC, the most common type of skin cancer, showing improved sensitivity (79%–96%) and specificity (75%–96%) when compared with clinical assessment and dermoscopy alone.12,14 Typical OCT features differentiating BCC from other lesions include hyporeflective ovoid nests with a dark rim and an alteration of the dermoepidermal junction. In addition to providing a good diagnostic overview of skin, OCT devices show promise in monitoring the effects of treatment on primary and recurrent lesions.14-16
In Vivo Excision Planning
Additionally, OCT is a helpful tool in delineating tumor margins prior to surgical resection to achieve optimal cosmesis. By detecting subclinical tumor extension, this preoperative technique has been shown to reduce the number of surgical stages. Pomerantz et al17 showed that mapping BCC tumor margins with OCT prior to Mohs micrographic surgery closely approximated the final surgical defects. Alawi et al18 showed that the OCT-defined lateral margins correctly indicated complete removal of tumors. These studies illustrate the ability of OCT to minimize the amount of skin excised without compromising the integrity of tumor-free borders. The use of ex vivo OCT to detect residual tumors is not recommended based on current studies.6,17,18
Diagnosis and Treatment Monitoring of Other Diseases
Further applications of OCT include diagnosis of noncancerous lesions such as nail conditions, scleroderma, psoriatic arthritis, blistering diseases, and vascular lesions, as well as assessment of skin moisture and hydration, burn depth, wound healing, skin atrophy, and UV damage.2 For example, Aldahan et al19 demonstrated the utility of D-OCT to identify structural and vascular features specific to nail psoriasis useful in the diagnosis and treatment monitoring of the condition.
Limitations of OCT
Resolution
Frequency-domain OCT enables the detection of architectural details within tissue, but its image resolution is not sufficient to distinguish individual cells, therefore restricting its use in evaluating pigmented benign and malignant lesions such as dysplastic nevi and melanomas. Higher-resolution RCM is superior for imaging these lesions, as its device can better evaluate microscopic structures. With the advent of D-OCT and HD-OCT, research is being conducted to assess their use in differentiating pigmented lesions.8,20 Schuh et al9 and Gambichler et al20 reported preliminary results indicating the utility of D-OCT and HD-OCT to differentiate dysplastic nevi from melanomas and melanoma in situ, respectively.
Depth Measurement
Another limitation is associated with measuring lesion depth for advanced tumors. Although the typical imaging depth of OCT is significantly deeper than most other noninvasive imaging modalities used on skin, imaging deep tumor margins and invasion is restricted.
Image Interpretation
Diagnostic imaging requires image interpretation leading to potential interobserver and intraobserver variation. Experienced observers in OCT more accurately differentiated normal from lesional skin compared to novices, which suggests that training could improve agreement.21,22
Reimbursement and Device Cost
Other practical limitations to widespread OCT utilization at this time include its initial laser device cost and lack of reimbursement. As such, large academic and research centers remain the primary sites to utilize these devices.
Future Directions
Optical coherence tomography complements other established noninvasive imaging tools allowing for real-time visualization of the skin without interfering with the tissue and offering images with a good balance of depth, resolution, and field of view. Although a single histology cut has superior cellular resolution to any imaging modality, OCT provides additional information that is not provided by a physical biopsy, given the multiple vertical sections of data. Optical coherence tomography is a useful diagnostic technique enabling patients to avoid unnecessary biopsies while increasing early lesion diagnosis. Furthermore, OCT helps to decrease repetitive biopsies throughout nonsurgical treatments. With the availability of newer technology such as D-OCT and HD-OCT, OCT will play an increasing role in patient management. Clinicians and researchers should work to convert from category III to category I CPT codes and obtain reimbursement for imaging, with the ultimate goal of increasing its use in clinical practice and improving patient care.
- Michelson Diagnostics secures CPT codes for optical coherence tomography imaging of skin [press release]. Maidstone, Kent, United Kingdom: Michelson Diagnostics; July 14, 2017. https://vivosight.com/wp-content/uploads/2017/07/Press-Release-CPT-code-announcement-12-July-2017.pdf. Accessed August 17, 2017.
- Schmitz L, Reinhold U, Bierhoff E, et al. Optical coherence tomography: its role in daily dermatological practice. J Dtsch Dermatol Ges. 2013;11:499-507.
- Hibler BP, Qi Q, Rossi AM. Current state of imaging in dermatology. Semin Cutan Med Surg. 2016;35:2-8.
- Current Procedural Terminology 2018, Professional Edition. Chicago IL: American Medical Association; 2017.
- Current Procedural Terminology 2017, Professional Edition. Chicago IL: American Medical Association; 2016.
- Cheng HM, Guitera P. Systemic review of optical coherence tomography usage in the diagnosis and management of basal cell carcinoma. Br J Dermatol. 2015;173:1371-1380.
- Cao T, Tey HL. High-definition optical coherence tomography—an aid to clinical practice and research in dermatology. J Dtsch Dermatol Ges. 2015;13:886-890.
- Schwartz M, Siegel DM, Markowitz O. Commentary on the diagnostic utility of non-invasive imaging devices for field cancerization. Exp Dermatol. 2016;25:855-856.
- Schuh S, Holmes J, Ulrich M, et al. Imaging blood vessel morphology in skin: dynamic optical coherence tomography as a novel potential diagnostic tool in dermatology. Dermatol Ther. 2017;7:187-202.
- Themstrup L, Pellacani G, Welzel J, et al. In vivo microvascular imaging of cutaneous actinic keratosis, Bowen’s disease and squamous cell carcinoma using dynamic optical coherence tomography [published online May 14, 2017]. J Eur Acad Dermatol Venereol. doi:10.1111/jdv.14335.
- Markowitz O, Schwartz M, Minhas S, et al. DM. Speckle-variance optical coherence tomography: a novel approach to skin cancer characterization using vascular patterns. Dermatol Online J. 2016;18:22. pii:13030/qt7w10290r.
- Ulrich M, von Braunmuehl T, Kurzen H, et al. The sensitivity and specificity of optical coherence tomography for the assisted diagnosis of nonpigmented basal cell carcinoma: an observational study. Br J Dermatol. 2015;173:428-435.
- Hussain AA, Themstrup L, Jemec GB. Optical coherence tomography in the diagnosis of basal cell carcinoma. Arch Dermatol Res. 2015;307:1-10.
- Markowitz O, Schwartz M, Feldman E, et al. Evaluation of optical coherence tomography as a means of identifying earlier stage basal carcinomas while reducing the use of diagnostic biopsy. J Clin Aesthet Dermatol. 2015;8:14-20.
- Banzhaf CA, Themstrup L, Ring HC, et al. Optical coherence tomography imaging of non-melanoma skin cancer undergoing imiquimod therapy. Skin Res Technol. 2014;20:170-176.
- Themstrup L, Banzhaf CA, Mogensen M, et al. Optical coherence tomography imaging of non-melanoma skin cancer undergoing photodynamic therapy reveals subclinical residual lesions. Photodiagnosis Photodyn Ther. 2014;11:7-12.
- Pomerantz R, Zell D, McKenzie G, et al. Optical coherence tomography used as a modality to delineate basal cell carcinoma prior to Mohs micrographic surgery. Case Rep Dermatol. 2011;3:212-218.
- Alawi SA, Kuck M, Wahrlich C, et al. Optical coherence tomography for presurgical margin assessment of non-melanoma skin cancer—a practical approach. Exp Dermatol. 2013;22:547-551.
- Aldahan AS, Chen LL, Fertig RM, et al. Vascular features of nail psoriasis using dynamic optical coherence tomography. Skin Appendage Disord. 2017;2:102-108.
- Gambichler T, Plura I, Schmid-Wendtner M, et al. High-definition optical coherence tomography of melanocytic skin lesions. J Biophotonics. 2015;8:681-686.
- Mogensen M, Joergensen TM, Nurnberg BM, et al. Assessment of optical coherence tomography imaging in the diagnosis of non-melanoma skin cancer and benign lesions versus normal skin: observer-blinded evaluation by dermatologists. Dermatol Surg. 2009;35:965-972.
- Olsen J, Themstrup L, De Carbalho N, et al. Diagnostic accuracy of optical coherence tomography in actinic keratosis and basal cell carcinoma. Photodiagnosis Photodyn Ther. 2016;16:44-49.
Practice Points
- Optical coherence tomography (OCT) technology has considerable utility in research and clinical settings given its high resolution, wide field of view, moderate penetration depth, straightforward image acquisition, and accessibility to anatomically challenging areas.
- Potential benefits of OCT include its ability to noninvasively diagnose and monitor nonmelanoma skin cancers as well as to delineate presurgical margins and elucidate the course and mechanism of action of skin conditions at the bedside.
- Limitations of OCT include device cost, lack of reimbursement, and training, as well as restricted ability to image advanced deep tumors and differentiate melanocytic lesions.
- Optical coherence tomography recently received 2 category III Current Procedural Terminology (CPT) codes to track its utilization in clinical practice and will hopefully receive category I CPT codes within the next 5 years.
ACS NSQIP pilot project IDs risks in older surgical patients
NEW YORK – The American College of Surgeons’ National Surgical Improvement Program Geriatric Surgery Pilot Project, which was initiated in 2014, is beginning to bear fruit.
Institutions participating in the project are generating data on geriatric-specific factors such as cognition and mobility that have been shown to add to standard risks associated with surgery in older adults.
“Before you operate at all, there is a decision, and often surgeons use this framework when deciding whether or not to operate: There is an isolated surgical problem, and I think we can fix that problem,” Julia R. Berian, MD, said at the ACS Quality and Safety Conference. “This fails to really incorporate the context of these older, complicated surgical patients.”
“We are facing a silver tsunami. The population is aging,” Emily Finlayson, MD, FACS, said during a separate presentation at the conference. “People are coming to us to decide, A, if they should have surgery, and B, how best to prepare for surgery.”
“As we know, from mounting evidence, surgical outcomes in frail older adults are pretty abysmal.” In addition to the physiologic vulnerabilities, “there is a lot of social isolation, depression, and anxiety that is underdiagnosed in this population,” Dr. Finlayson said. “In light of these incredibly high risks, we need to approach decision making in a slightly different way than we do with, say, a 40-year-old patient.”
Use data to guide interventions
The ACS NSQIP and the ACS Geriatric Task Force created the ACS NSQIP Geriatric Surgery Pilot Project in part to determine if including geriatric-specific preoperative variables and outcome measures in the NSQIP database would improve postoperative outcomes. Since its launch in January 2014, more than 30 hospitals have contributed data from over 30,000 surgical cases involving patients 65 years and older. The vast majority of cases involve orthopedic surgery or general surgery, with total hip and total knee arthroplasty, colectomy, spine surgery, and hip fracture procedures leading the list.
Cognition, function, mobility, and goals/decision making are the four main project domains. “The event rate for postoperative delirium overall was 12%; the functional decline was quite high at 43%; and the need for postoperative mobility aid was 30%,” said Dr. Berian, a fourth-year general surgery resident at the University of Chicago and an ACS Clinical Scholar, when presenting initial 3-year results.
“What we have learned from this experience is that these geriatric-specific risk factors do contribute to risk adjustment for traditional morbidity and mortality outcomes. In other words, we think they are very important to collect,” Dr. Berian said.
Cognitive impairment was associated only with prolonged ventilation, whereas surrogate consent for surgery correlated with any morbidity, reintubation, pneumonia, and more. Use of a mobility aid before surgery correlated with increased risk for a UTI, surgical site infection, sepsis, and other morbidities. A history of falls within the previous year was associated with higher risk of cardiac complications and mortality. Functional status, origin from home before surgery, and use of preoperative palliative care were not contributors to risk.
A second objective of the project is to create a platform for introducing interventions to improve outcomes in this population. Future plans include further validation of the pilot data and incorporation of the results into a geriatric-specific quality program.
Focus on potential solutions
Addressing a wide range of preoperative considerations in older adults may seem daunting, but “there are simple, low-tech things you can do,” said Dr. Finlayson, director of the University of California San Francisco Center for Surgery in Older Adults. Strategies include reviewing medications, providing adequate hydration “so they don’t come in as dry as a potato chip,” and removing earwax. “You might think they’re confused but they really cannot hear.”
Whenever possible, address the core vulnerabilities that put an older patient at higher risk, Dr. Finlayson said. Comorbidity, polypharmacy, incontinence, social isolation, depression and anxiety, as well as deficits in function, nutrition, and mobility can contribute.
Cognition is also critical. If you think an older patient is at risk of postoperative delirium, involve the family, Dr. Finlayson recommended. “We know if family members are at the bedside, the patient is less likely to get confused.” Clinicians at UCSF found this “very helpful” and even give families a sign-up sheet to assign shifts in the hospital.
“If you don’t think delirium is an important outcome to begin tracking in our registries, I want to point out that there are serious consequences for postop delirium,” Dr. Berian said. Delirium alone in surgical patients doubles the increased risk of prolonged length of stay, 1.5 times the risk for institutional discharge, and 2.3 times the risk for 30-day readmission (JAMA Surgery. 2015;150[12]:1134-40). “When you combine delirium with complications, those risks increase dramatically,” she added.
Take a team approach
Session moderator David A. Hoyt, MD, FACS, executive director of the American College of Surgeons, asked Dr. Finlayson how she convinced her colleagues to participate in the program at UCSF.
“We haven’t had any problems with buy-in in terms of recognizing the need,” she replied. “The challenge is a lot of surgeons feel like they don’t have the expertise or the time to slow down and learn how to do these assessments and optimization strategies.” She suggested involving geriatricians and other providers when possible. “You have to be very creative within your own system in terms of what kind of team you are going to put together.”
Elicit patient goals
Perhaps most importantly, you really need to individualize your approach, Dr. Finlayson said. Take the time to talk to these patients. “This isn’t just don’t smoke, lose weight, diet and exercise. It’s eliciting patient goals and tailoring an assessment of geriatric vulnerability,” she added. “It’s not one size fits all. It’s not just about fitness for surgery; it’s about what they want for the rest of their lives.”
Patient-driven goals are important, Dr. Berian said, because “older adults may prioritize quality of life over quantity of life.” She also noted that surgery could cure their disease, prolong life, and/or provide symptom relief, or it could cause loss of function and independence, delirium, cognitive loss, and/or premature death. “There was an interesting study … looking at outcomes that could be considered worse than death,” Dr. Berian said (JAMA Intern. Med. 2016;176[10]:1557-9). Bowel and bladder incontinence, being confused all the time, and relying on a feeding tube to live were among the outcomes the researchers examined.
Dr. Finlayson highlighted a high-touch, resource-intensive, and successful intervention in older patients in the United Kingdom (Age Ageing. 2007;36[6]:670-5). “The reduction in morbidity was incredibly dramatic.” The study shows if you truly have the resources to address these geriatric syndromes, you can really improve care in this population.
Dr. Berian had no relevant financial disclosures. Dr. Finlayson is a founding shareholder of Ooney, Inc.
AT THE ACS QUALITY AND SAFETY CONFERENCE
Incorporating New Atopic Dermatitis Medications in Your Practice
What advice do you give your patients today?
There is more scientific data supporting educational intervention with an eczema action plan as the core of prevention and therapy. Early institution of emollient therapy is preventive of approximately half of atopic dermatitis (AD) cases. Application of emollients immediately after bathing is best for improvement of skin hydration. The art of medicine is deciding how to pick emollients with patients. It is important to avoid patient's allergens, but ultimately the choice comes down to cold weather petrolatum and warm weather thick lotions or creams.
Therapy must still be individually tailored. Head and neck disease is best treated with nonsteroidal agents including low-strength topical corticosteroids and calcineurin inhibitors that have a black box warning, both of which have a track record of efficacy in the care of AD. A newer option is crisaborole, a topical phosphodiesterase inhibitor, which is an alternative for childhood and adult AD. For the body, any of these agents can be used comfortably, but often a mixture of topical corticosteroids of various strengths is chosen to address different sites of disease. When topical corticosteroids fail, the usage of systemic agents or phototherapy may be appropriate. The new prescription injectable dupilumab is approved for adults with AD and therapies such as these will hopefully soon be available for children with severe disease who need intervention to improve their quality of life.
How have you integrated new medications? How do you deal with side effects?
For all the therapies that truly work for AD, there are still many patients with limited to poor response on standard regimens and I offer them newer options and I also review their old regimens. Many patients believe they will be cured in 1 to 2 weeks and stop ongoing care. Counseling on the recurrent and relapsing nature of AD is important. On the other hand, I have AD patients who believe they had or truly have steroid sensitivity including allergy or withdrawal syndromes. I have seen topical steroid atrophy in this setting due to lack of intermittent discontinuation. Other situations in which topical steroid side effects are common in my practice are in the application sites of the thigh and calf in teenaged girls and the chest in teenaged boys, sites where striae are not uncommon naturally during adolescence. In these settings, confirmation of allergy via patch testing may be helpful and offering nonsteroidal agents can allow for remission of disease. Side effects with nonsteroidal agents are common but usually mild including pruritus, burning, and stinging. It is common for these symptoms to dissipate with time; therefore, preemptive education is vital (ie, stopping and restarting a day later) as well as avoidance of application to recently washed skin and limited application initially. Steroid pretreatment sometimes aids in acceptance of a nonsteroidal agent.
What information do patients want to hear?
Patients and guardians believe there has to be a cure for AD and that it will be dietary in nature. They hope I will provide an avoidance diet that will rapidly clear the disease, which I wish was true. In reality, the nature of current research is such that long-term remissions and possible cure do lie on the horizon but today are not readily available. No one can bypass good skin care and the current treatment paradigm. Withdrawal diets may cause malnourishment in children and should not be undertaken without proof of allergy.
How do you deal with steroid phobia?
Steroid phobia has become a hot topic but has existed since the advent of topical agents. Steroid phobia can cause nonadherence and poor outcomes. In reality, many topical steroidal agents have good testing and approvals in younger children. Fear is a powerful motivator and hard to break. Therefore, parents/guardians may reasonably opt for nonsteroidal care, which is a fine option when it works. Although little data on real-world combination usage of nonsteroidal and steroidal agents exist, combinations in my practice often enhance clearance.
What patient resources do you recommend?
Quoting study data may be beneficial. One of my favorite studies is historic comparative data of hydrocortisone cream 1% and mometasone furoate cream 0.1% in 48 children with moderate to severe AD (Vernon et al). At completion of the study, mometasone performed better in clearance and the only patient who developed hypothalamic-pituitary-adrenal axis suppression was in the hydrocortisone arm. I use this study to explain to parents why a prescription-strength agent may produce better results with fewer side effects.
Online snake oils abound in AD and the sources for solid information I choose are the websites of the National Eczema Association as well as academic organizations such as the American Academy of Dermatology and the Society for Pediatric Dermatology. Membership in support groups and participation can help parents/guardians and children alike and allow access to early clinical trial data. I sometimes ask parents/guardians to review manufacturer websites to specifically look for quoted clinical trial data. Although all clinical trials are not equivalent, many better eczema care manufacturers have numerous clinical trials in support of their agents, which should give a parent some enhanced comfort level.
Suggested Readings
- Chiang C, Eichenfield LF. Quantitative assessment of combination bathing and moisturizing regimens on skin hydration in atopic dermatitis. Pediatr Dermatol. 2009;26:273-278.
- Juha'sz MLW, Curley RA, Rasmussen A, et al. Systematic review of the topical steroid addiction and steroid withdrawal phenomenon in children diagnosed with atopic dermatitis and treated with topical corticosteroids. J Dermatol Nurses Assoc. In press.
- Mueller SM, Itin P, Vogt DR, et al. Assessment of "corticophobia" as an indicator of non-adherence to topical corticosteroids: a pilot study. J Dermatolog Treat. 2017;28:104-111.
- Shirley M. Dupilumab: first global approval. Drugs. 2017;77:1115-1121.
- Silverberg NB, Durán-McKinster C. Special considerations for therapy of pediatric atopic dermatitis. Dermatol Clin. 2017;35:351-363.
- Simpson EL, Chalmers JR, Hanifin JM, et al. Emollient enhancement of the skin barrier from birth offers effective atopic dermatitis prevention. J Allergy Clin Immunol. 2014;134:818-823.
- Vernon HJ, Lane AT, Weston W. Comparison of mometasone furoate 0.1% cream and hydrocortisone 1.0% cream in the treatment of childhood atopic dermatitis. J Am Acad Dermatol. 1991;24:603-607.

Noxious Nocebos in Dermatology
The medical dictum primum non nocere (first, do no harm) is a fundamental rule by which physicians have lived for centuries.1 Physicians are familiar with the term placebo (I shall please) and the placebo effect of improvement based on expectation of positive results; however, many are not familiar with the term nocebo (I shall harm) and the nocebo effect of lack of improvement or deterioration based on the expectation of negative results. The patient’s expectation of being pleased and/or being harmed may be on the conscious level and/or on one or more subconscious and unconscious levels.
Words can have as much of an impact on some patients as medications or procedures. Rudyard Kipling said, “Words are, of course, the most powerful drug used by mankind.” The words that a dermatologist chooses to use can have either a placebo or a nocebo effect on the patient. The purpose of this commentary is to elevate awareness that there are positive alternatives to unintended negative suggestions that are commonly used in dermatologic practice.
A search of PubMed articles indexed for MEDLINE and Scopus published from January 1966 through July 28, 2016, was conducted using the terms placebo or nocebo and cutaneous or skin. Prior publications in this area related specifically to dermatology include those of Poletti2 and Sonthalia et al.3
Patient expectations play an important role in both positive and negative treatment outcomes. Patient-physician communication can moderate these effects both positively and negatively.4 Nocebo effects can substantially reduce treatment efficacy and patient compliance. Patient expectations of negative results or side effects of a treatment or medication can be self-induced or can be induced by inappropriate physician-patient communication, drug information leaflets, influence of family or peers, or discovery of reported adverse effects through reading materials on the Internet.4 Expectation of negative effects can reduce patient adherence and compliance with treatment, reducing treatment efficacy. The psychosocial context around the patient and the treatment may change the neuronal biochemistry and circuitry in the patient’s brain, and the central and peripheral mechanisms activated by placebos and nocebos have been found to be the same as those activated by the medications, suggesting cognitive/affective enhancing or impeding of drug action.5
The subconscious and unconscious habitual automated parts of the brain hear words on the level of a 5- or 6-year-old child with literal unconscious cognitive interpretation of the words. These parts also do not connect words in a sentence with each other.5 For example, if the dermatologist or nurse says “This will not hurt,” the unconscious brain hears not and hurt but does not connect the two. On the other hand, if the dermatologist or nurse says “ You may experience some discomfort,” the unconscious brain hears comfort. Telling the patient “Don’t scratch” may be heard unconsciously as scratch. See the Table for suggested rephrasing of common nocebos used in dermatology. The conscious parts of the brain help determine cognitions influenced by associated unconscious memories, positive or negative. Both the conscious and unconscious parts of the brain influence affect or emotion.
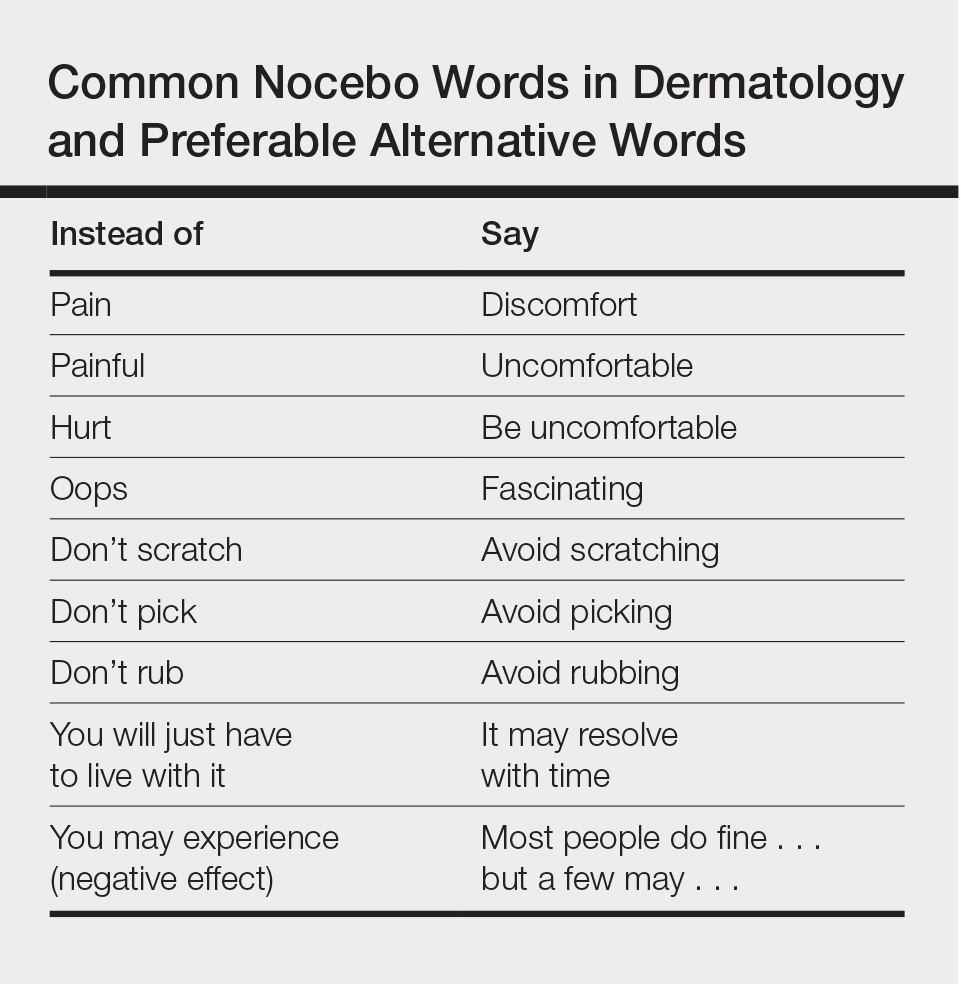
When excess stress occurs, there is a natural shift downward from social communicative newer parasympathetic nervous system to fight or flight sympathetic nervous system, and possibly further shift to the freeze response of older parasympathetic nervous system dominance. Memories that are associated with a strong surge of norepinephrine tend to be much more strongly fixed in the memory than ordinary memories and frequently are associated with overwhelming traumatic experiences. When a threat is perceived, negative interpretations and perceptions generally win out over positive interpretations and perceptions. Unconscious fears generally prevail over conscious thoughts, and stronger emotions generally prevail over weaker emotions. Anxiety often is associated with rapid breathing and activation of the sympathetic nervous system. It can be countered by slow breathing to a rate of approximately 6 breaths per minute, helping to bring back more parasympathetic balance. Pacing a patient’s breathing to slow it and using a soothing tone of voice can help reduce patient anxiety. Reducing anxiety can decrease the patient’s tendency to jump to negative conclusions or have negative perceptions or emotions that can invoke the nocebo effect.
For the dermatologist, as for the patient, changing an old habit and creating a new habit requires repeating something differently and consistently 20 to 40 times. Becoming more conscious of the effects of language on the patient is an important part of the art of medicine. By carefully choosing words, intonation, and body language, it is possible to enhance the placebo effect and decrease the nocebo effect for the benefit of the patient. When describing possible adverse effects of treatments or medications, if the dermatologist says that most people do fine with the treatment but a few can experience the described adverse effect, it usually takes the edge off the potential suggested nocebo effect.
In conclusion, primum non nocere includes careful consideration and use of language, tone, and body language to maximize the placebo effect and minimize the nocebo effect.
- Hippocrates. Epidemics. Jones WHS, trans. Loeb Classical Library: Hippocrates. Vol 1. Cambridge, MA: Harvard University Press; 1923:164-165.
- Poletti ED. El efecto nocebo in dermatología. Dermatol Cosmet Quirg. 2007;5:74.
- Sonthalia S, Sahaya K, Arora R, et al. Nocebo effect in dermatology. Indian J Dermatol Venereol Leprol. 2015;81:242-250.
- Bingel U. Avoiding nocebo effects to optimize treatment outcomes. JAMA. 2014;312:693-694.
- Greenwald AG. New look 3: unconscious cognition reclaimed. Am Psychol. 1992;47:766-779.
- Porges SW. The Polyvagal Theory: Neurophysiological Foundations of Emotions, Attachment, Communication, and Self-regulation. New York, NY: W.W. Norton & Co; 2011.
The medical dictum primum non nocere (first, do no harm) is a fundamental rule by which physicians have lived for centuries.1 Physicians are familiar with the term placebo (I shall please) and the placebo effect of improvement based on expectation of positive results; however, many are not familiar with the term nocebo (I shall harm) and the nocebo effect of lack of improvement or deterioration based on the expectation of negative results. The patient’s expectation of being pleased and/or being harmed may be on the conscious level and/or on one or more subconscious and unconscious levels.
Words can have as much of an impact on some patients as medications or procedures. Rudyard Kipling said, “Words are, of course, the most powerful drug used by mankind.” The words that a dermatologist chooses to use can have either a placebo or a nocebo effect on the patient. The purpose of this commentary is to elevate awareness that there are positive alternatives to unintended negative suggestions that are commonly used in dermatologic practice.
A search of PubMed articles indexed for MEDLINE and Scopus published from January 1966 through July 28, 2016, was conducted using the terms placebo or nocebo and cutaneous or skin. Prior publications in this area related specifically to dermatology include those of Poletti2 and Sonthalia et al.3
Patient expectations play an important role in both positive and negative treatment outcomes. Patient-physician communication can moderate these effects both positively and negatively.4 Nocebo effects can substantially reduce treatment efficacy and patient compliance. Patient expectations of negative results or side effects of a treatment or medication can be self-induced or can be induced by inappropriate physician-patient communication, drug information leaflets, influence of family or peers, or discovery of reported adverse effects through reading materials on the Internet.4 Expectation of negative effects can reduce patient adherence and compliance with treatment, reducing treatment efficacy. The psychosocial context around the patient and the treatment may change the neuronal biochemistry and circuitry in the patient’s brain, and the central and peripheral mechanisms activated by placebos and nocebos have been found to be the same as those activated by the medications, suggesting cognitive/affective enhancing or impeding of drug action.5
The subconscious and unconscious habitual automated parts of the brain hear words on the level of a 5- or 6-year-old child with literal unconscious cognitive interpretation of the words. These parts also do not connect words in a sentence with each other.5 For example, if the dermatologist or nurse says “This will not hurt,” the unconscious brain hears not and hurt but does not connect the two. On the other hand, if the dermatologist or nurse says “ You may experience some discomfort,” the unconscious brain hears comfort. Telling the patient “Don’t scratch” may be heard unconsciously as scratch. See the Table for suggested rephrasing of common nocebos used in dermatology. The conscious parts of the brain help determine cognitions influenced by associated unconscious memories, positive or negative. Both the conscious and unconscious parts of the brain influence affect or emotion.
When excess stress occurs, there is a natural shift downward from social communicative newer parasympathetic nervous system to fight or flight sympathetic nervous system, and possibly further shift to the freeze response of older parasympathetic nervous system dominance. Memories that are associated with a strong surge of norepinephrine tend to be much more strongly fixed in the memory than ordinary memories and frequently are associated with overwhelming traumatic experiences. When a threat is perceived, negative interpretations and perceptions generally win out over positive interpretations and perceptions. Unconscious fears generally prevail over conscious thoughts, and stronger emotions generally prevail over weaker emotions. Anxiety often is associated with rapid breathing and activation of the sympathetic nervous system. It can be countered by slow breathing to a rate of approximately 6 breaths per minute, helping to bring back more parasympathetic balance. Pacing a patient’s breathing to slow it and using a soothing tone of voice can help reduce patient anxiety. Reducing anxiety can decrease the patient’s tendency to jump to negative conclusions or have negative perceptions or emotions that can invoke the nocebo effect.
For the dermatologist, as for the patient, changing an old habit and creating a new habit requires repeating something differently and consistently 20 to 40 times. Becoming more conscious of the effects of language on the patient is an important part of the art of medicine. By carefully choosing words, intonation, and body language, it is possible to enhance the placebo effect and decrease the nocebo effect for the benefit of the patient. When describing possible adverse effects of treatments or medications, if the dermatologist says that most people do fine with the treatment but a few can experience the described adverse effect, it usually takes the edge off the potential suggested nocebo effect.
In conclusion, primum non nocere includes careful consideration and use of language, tone, and body language to maximize the placebo effect and minimize the nocebo effect.
- Hippocrates. Epidemics. Jones WHS, trans. Loeb Classical Library: Hippocrates. Vol 1. Cambridge, MA: Harvard University Press; 1923:164-165.
- Poletti ED. El efecto nocebo in dermatología. Dermatol Cosmet Quirg. 2007;5:74.
- Sonthalia S, Sahaya K, Arora R, et al. Nocebo effect in dermatology. Indian J Dermatol Venereol Leprol. 2015;81:242-250.
- Bingel U. Avoiding nocebo effects to optimize treatment outcomes. JAMA. 2014;312:693-694.
- Greenwald AG. New look 3: unconscious cognition reclaimed. Am Psychol. 1992;47:766-779.
- Porges SW. The Polyvagal Theory: Neurophysiological Foundations of Emotions, Attachment, Communication, and Self-regulation. New York, NY: W.W. Norton & Co; 2011.

Presumed Serum Sickness Following Thymoglobulin Treatment of Acute Cellular Rejection of a Cardiac Allograft
Serum sickness was first described by von Pirquet and Schick1 as a constellation of signs and symptoms displayed in patients receiving equine serum as an antitoxin for the treatment of scarlet fever and diphtheria. Serum sickness is an immune complex–mediated hypersensitivity reaction that can be clinically diagnosed in patients who present with fever, rash, and polyarthralgia or polyarthritis following exposure to heterologous serum proteins.2,3 Symptom onset typically occurs within 1 to 2 weeks of first exposure to the serum, and resolution frequently occurs with discontinuation of the offending agent. Other symptoms may include malaise, gastrointestinal tract concerns, headache, blurred vision, or lymphadenopathy.4 Proteinuria, hematuria, and a transient decrease in creatinine clearance also have been reported in serum sickness.4
Serum sickness is caused by a type III immune complex–mediated hypersensitivity reaction to heterologous rabbit or equine serum proteins. Nonhuman proteins present in antithymocyte globulin (ATG) stimulate the production of IgG, IgM, IgA, and IgE antibodies.2-4 If the resultant immune complexes overwhelm the mononuclear phagocyte system, these complexes are deposited in blood vessels and tissues, which leads to complement activation and the production of complement fragments such as C3a and C5a.5 C3a is an anaphylatoxin that causes mast cell degranulation and the consequent formation of urticarial lesions. C5a is a neutrophil chemoattractant that promotes inflammation at the site of complement deposition.
Serum sickness–like reactions may occur days to weeks following administration of certain drugs, such as cefaclor or penicillin. Although the symptoms and timing of serum sickness–like reactions are similar to serum sickness, they are not caused by an immune complex–mediated mechanism and are believed to be secondary to an idiosyncratic delayed drug reaction.6
Thymoglobulin, a type of ATG, is a polyclonal antibody generated in rabbits that targets numerous human epitopes, including cell surface markers on T cells (CD2, CD3, CD4, CD8), B cells (CD21, CD19, CD40), and adhesion molecules (CD6, CD25, CD44, CD45, and the integrin LFA-1 [lymphocyte function-associated antigen-1]).7,8 Thymoglobulin has proven efficacy in the setting of cardiac transplantation.9-11 Although calcineurin inhibitors form the foundation in the armamentarium of immunosuppressive agents in cardiac transplantation, their nephrotoxicity has limited their unrestrained use in patients.9 By delaying the need for calcineurin inhibitors, thymoglobulin preserves greater renal function without increasing the risk for acute rejection.9,10 Akin to its use in the patient presented in this case report, thymoglobulin also is used in the treatment of acute cellular rejection in heart transplant recipients with signs of heart failure.11
Case Report
A 35-year-old man with a history of familial cardiomyopathy who underwent orthotopic heart transplantation presented with grade 3R acute cellular rejection. The patient’s immunosuppressive regimen consisted of thymoglobulin 150 mg once daily, tacrolimus 2.5 mg twice daily, hydrocortisone 100 mg once daily, and mycophenolate mofetil 1000 mg twice daily. On day 7 of thymoglobulin treatment, the dermatology department was consulted to evaluate a pruritic eruption. The patient reported that he noticed redness of the palms and soles, as well as redness accentuated in the axilla, groin, and other skin creases 2 days prior. The patient also reported symmetric bilateral hand pain that had started 1 day following rash onset. He denied fever and remained afebrile throughout his hospitalization.
On physical examination, the patient displayed a blanching, erythematous, edematous, evanescent macular rash with some areas of wheal formation symmetrically distributed in the bilateral axillae, inframammary folds, and groin (Figure, A and B). The palms and soles were tender with diffuse blanching erythema. The eruption was accentuated at the lateral and medial borders of both feet (Figure, C). There was concern that the patient may have a form of serum sickness with a blunted incomplete response due to his concomitant use of immunosuppressive agents. Shortly after evaluation, the patient left the hospital against medical advice before the recommended evaluation and systemic workup could be implemented.
The patient returned for an outpatient appointment approximately 1 week later. Medical records indicated that the patient’s skin eruption had resolved. Tests for antithymoglobulin antibodies at this visit were negative. The antithymoglobulin antibody enzyme-linked immunosorbent assay has a diagnostic sensitivity of 86%12 and large interlaboratory variability.13 Given the presence of other features of serum sickness, a false-negative result was considered by dermatology. Nonetheless, one must consider other differential diagnoses, including a simple cutaneous adverse drug eruption or viral exanthem that might have in fact been causative.
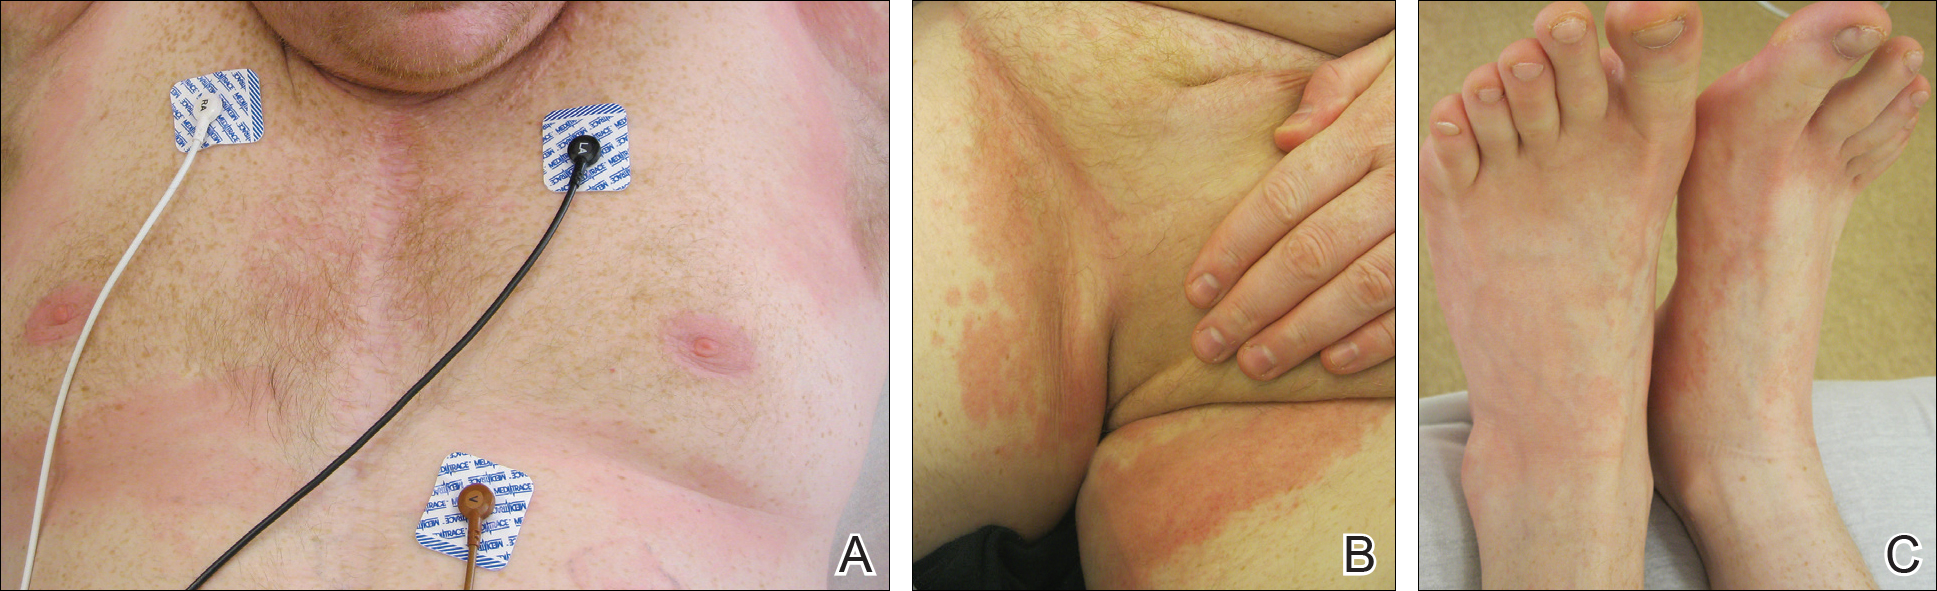
Comment
We present an atypical case of possible serum sickness in a heart transplant recipient following thymoglobulin treatment of acute cellular rejection of the cardiac allograft. Serum sickness is a clinical diagnosis supported by laboratory data. Some authors have suggested major and minor diagnostic criteria to aid with the diagnosis.7 Major diagnostic criteria include onset more than 7 days after the initial thymoglobulin administration, persistent high fevers (temperature, >38.4°C), persistent arthritis/arthralgia, and positive heterologous antibodies on enzyme-linked immunosorbent assay. Minor diagnostic criteria include rash, acute renal failure, trismus, and low serum complement (C3 and C4).
The variable cutaneous presentations of serum sickness are important to recognize in the process of making the correct diagnosis. Rash is frequently reported in serum sickness, with some studies displaying rates of up to 93%.4,14 The skin findings are most frequently described as urticarial or serpiginous macular lesions.3 Other variations of the eruption exist, and morbilliform eruptions or a combination of morbilliform and urticarial eruptions have been reported.3 It is important to judge cutaneous eruptions of serum sickness within the context of the potential cytopenia in a patient being treated with ATG. As such, purpuric eruptions have been attributed to serum sickness in thrombocytopenic patients receiving ATG for bone marrow failure.14
Usually, cutaneous eruptions of serum sickness initially are identified in the groin, axilla, and periumbilical region, and then they proceed to include the trunk and extremities. Erythema of the palms and soles frequently is described as well as a linear accentuation of the rash along the lateral and medial borders of the feet and hands at the margin of the plantar or palmar skin, respectively.14 The mucous membranes frequently are spared in serum sickness.
Despite the lack of evidence-based guidelines, case series and literature reviews have suggested a treatment regimen for serum sickness,7,15-18 calling for immediate withdrawal of the offending agent. Antihistamines may be added to control pruritus and rash. Patients with high fever, a progressive rash, or severe arthralgia have benefited from short courses of oral16,18 or intravenous7,17 glucocorticoids. The extent of the eruption in our patient was concerning, particularly because he was already receiving systemic corticosteroids in conjunction with other immunosuppressives, which may have explained his lack of fever.
Because our patient satisfied some diagnostic criteria for serum sickness and failed to satisfy others, our team was faced with the challenge of balancing the risks of possible serum sickness with the risks of the potential for progressive cardiac rejection from the withdrawal of thymoglobulin.7 There is some evidence in the literature for the use of therapeutic plasma exchange (TPE) for the treatment of serum sickness if the offending agent could not be discontinued. Tanriover et al19 presented a case series of 5 renal transplant recipients treated with thymoglobulin who developed serum sickness. The diagnosis of serum sickness was made clinically and augmented by the presence of antiheterologous antibodies. All 5 patients had persistent symptoms of serum sickness despite 2 days of glucocorticoid treatment. Interestingly, 3 patients had complete resolution of all symptoms after a single TPE treatment, and 2 patients achieved resolution of fever and arthritis after 2 consecutive days of TPE treatments.19 Because plasmapheresis is used to treat cardiac allograft rejection in patients showing signs of heart failure,11 the employment of TPE in these patients may have dual beneficial effects of concurrently treating serum sickness and allograft rejection.
Given the patient’s noncompliance and leaving the hospital against medical advice, a full workup was not able to be pursued in this case, though fortunately the eruption and his other symptoms had resolved by the time he was seen for outpatient follow-up 1 week later. Noncompliance with immunosuppressive therapy is a considerable risk factor for morbidity and mortality following heart transplantation. These patients have more transplant coronary artery disease and substantially shorter clinical event-free time.20 Our patient demonstrates the need for proactive compliance-enhancing interventions in heart transplant patients who experience allograft rejection.
- von Pirquet C, Schick B. Serum Sickness. Schick B, trans-ed. Baltimore, MD; Williams & Wilkins; 1951.
- Vincent C, Revillard JP. Antibody response to horse gamma-globulin in recipients of renal allografts: relationship with transplant crises and transplant survival. Transplantation. 1977;24:141-147.
- Lawley TJ, Bielory L, Gascon P, et al. A prospective clinical and immunologic analysis of patients with serum sickness. N Engl J Med. 1984;311:1407-1413.
- Bielory L, Gascon P, Lawley TJ, et al. Human serum sickness: a prospective analysis of 35 patients treated with equine anti-thymocyte globulin for bone marrow failure. Medicine (Baltimore). 1988;67:40-57.
- Chen M, Daha MR, Kallenberg CG. The complement system in systemic autoimmune disease. J Autoimmun. 2010;34:J276-J286.
- Knowles SR, Uetrecht J, Shear NH. Idiosyncratic drug reactions: the reactive metabolite syndromes. Lancet. 2000;356:1587-1591.
- Lundquist AL, Chari RS, Wood JH, et al. Serum sickness following rabbit antithymocyte-globulin induction in a liver transplant recipient: case report and literature review. Liver Transpl. 2007;13:647-650.
- Bourdage JS, Hamlin DM. Comparative polyclonal antithymocyte globulin and antilymphocyte/antilymphoblast globulin anti-CD antigen analysis by flow cytometry. Transplantation. 1995;59:1194-1200.
- Zuckermann AO, Aliabadi AZ. Calcineurin-inhibitor minimization protocols in heart transplantation. Transpl Int. 2009;22:78-89.
- Cantarovich M, Giannetti N, Barkun J, et al. Antithymocyte globulin induction allows a prolonged delay in the initiation of cyclosporine in heart transplant patients with postoperative renal dysfunction. Transplantation. 2004;78:779-781.
- Patel JK, Kittleson M, Kobashigawa JA. Cardiac allograft rejection. Surgeon. 2010;9:160-167.
- Tatum AH, Bollinger RR, Sanfilippo F. Rapid serologic diagnosis of serum sickness from antithymocyte globulin therapy using enzyme immunoassay. Transplantation. 1984;38:582-586.
- Kimball JA, Pescovitz MD, Book BK, et al. Reduced human IgG anti-ATGAM antibody formation in renal transplant recipients receiving mycophenolate mofetil. Transplantation. 1995;60:1379-1383.
- Bielory L, Yancey KB, Young NS, et al. Cutaneous manifestations of serum sickness in patients receiving antithymocyte globulin. J Am Acad Dermatol. 1985;13:411-417.
- Joubert GI, Hadad K, Matsui D, et al. Selection of treatment of cefaclor-associated urticarial, serum sickness-like reactions and erythema multiforme by emergency pediatricians: lack of a uniform standard of care. Can J Clin Pharmacol. 1999;6:197-201.
- Clark BM, Kotti GH, Shah AD, et al. Severe serum sickness reaction to oral and intramuscular penicillin. Pharmacotherapy. 2006;26:705-708.
- Finger E, Scheinberg M. Development of serum sickness-like symptoms after rituximab infusion in two patients with severe hypergammaglobulinemia. J Clin Rheumatol. 2007;13:94-95.
- Tatum AJ, Ditto AM, Patterson R. Severe serum sickness-like reaction to oral penicillin drugs: three case reports. Ann Allergy Asthma Immunol. 2001;86:330-334.
- Tanriover B, Chuang P, Fishbach B, et al. Polyclonal antibody-induced serum sickness in renal transplant recipients: treatment with therapeutic plasma exchange. Transplantation. 2005;80:279-281.
- Dobbels F, De Geest S, van Cleemput J, et al. Effect of late medication non-compliance on outcome after heart transplantation: a 5-year follow-up. J Heart Lung Transplant. 2004;23:1245-1251.
Serum sickness was first described by von Pirquet and Schick1 as a constellation of signs and symptoms displayed in patients receiving equine serum as an antitoxin for the treatment of scarlet fever and diphtheria. Serum sickness is an immune complex–mediated hypersensitivity reaction that can be clinically diagnosed in patients who present with fever, rash, and polyarthralgia or polyarthritis following exposure to heterologous serum proteins.2,3 Symptom onset typically occurs within 1 to 2 weeks of first exposure to the serum, and resolution frequently occurs with discontinuation of the offending agent. Other symptoms may include malaise, gastrointestinal tract concerns, headache, blurred vision, or lymphadenopathy.4 Proteinuria, hematuria, and a transient decrease in creatinine clearance also have been reported in serum sickness.4
Serum sickness is caused by a type III immune complex–mediated hypersensitivity reaction to heterologous rabbit or equine serum proteins. Nonhuman proteins present in antithymocyte globulin (ATG) stimulate the production of IgG, IgM, IgA, and IgE antibodies.2-4 If the resultant immune complexes overwhelm the mononuclear phagocyte system, these complexes are deposited in blood vessels and tissues, which leads to complement activation and the production of complement fragments such as C3a and C5a.5 C3a is an anaphylatoxin that causes mast cell degranulation and the consequent formation of urticarial lesions. C5a is a neutrophil chemoattractant that promotes inflammation at the site of complement deposition.
Serum sickness–like reactions may occur days to weeks following administration of certain drugs, such as cefaclor or penicillin. Although the symptoms and timing of serum sickness–like reactions are similar to serum sickness, they are not caused by an immune complex–mediated mechanism and are believed to be secondary to an idiosyncratic delayed drug reaction.6
Thymoglobulin, a type of ATG, is a polyclonal antibody generated in rabbits that targets numerous human epitopes, including cell surface markers on T cells (CD2, CD3, CD4, CD8), B cells (CD21, CD19, CD40), and adhesion molecules (CD6, CD25, CD44, CD45, and the integrin LFA-1 [lymphocyte function-associated antigen-1]).7,8 Thymoglobulin has proven efficacy in the setting of cardiac transplantation.9-11 Although calcineurin inhibitors form the foundation in the armamentarium of immunosuppressive agents in cardiac transplantation, their nephrotoxicity has limited their unrestrained use in patients.9 By delaying the need for calcineurin inhibitors, thymoglobulin preserves greater renal function without increasing the risk for acute rejection.9,10 Akin to its use in the patient presented in this case report, thymoglobulin also is used in the treatment of acute cellular rejection in heart transplant recipients with signs of heart failure.11
Case Report
A 35-year-old man with a history of familial cardiomyopathy who underwent orthotopic heart transplantation presented with grade 3R acute cellular rejection. The patient’s immunosuppressive regimen consisted of thymoglobulin 150 mg once daily, tacrolimus 2.5 mg twice daily, hydrocortisone 100 mg once daily, and mycophenolate mofetil 1000 mg twice daily. On day 7 of thymoglobulin treatment, the dermatology department was consulted to evaluate a pruritic eruption. The patient reported that he noticed redness of the palms and soles, as well as redness accentuated in the axilla, groin, and other skin creases 2 days prior. The patient also reported symmetric bilateral hand pain that had started 1 day following rash onset. He denied fever and remained afebrile throughout his hospitalization.
On physical examination, the patient displayed a blanching, erythematous, edematous, evanescent macular rash with some areas of wheal formation symmetrically distributed in the bilateral axillae, inframammary folds, and groin (Figure, A and B). The palms and soles were tender with diffuse blanching erythema. The eruption was accentuated at the lateral and medial borders of both feet (Figure, C). There was concern that the patient may have a form of serum sickness with a blunted incomplete response due to his concomitant use of immunosuppressive agents. Shortly after evaluation, the patient left the hospital against medical advice before the recommended evaluation and systemic workup could be implemented.
The patient returned for an outpatient appointment approximately 1 week later. Medical records indicated that the patient’s skin eruption had resolved. Tests for antithymoglobulin antibodies at this visit were negative. The antithymoglobulin antibody enzyme-linked immunosorbent assay has a diagnostic sensitivity of 86%12 and large interlaboratory variability.13 Given the presence of other features of serum sickness, a false-negative result was considered by dermatology. Nonetheless, one must consider other differential diagnoses, including a simple cutaneous adverse drug eruption or viral exanthem that might have in fact been causative.
Comment
We present an atypical case of possible serum sickness in a heart transplant recipient following thymoglobulin treatment of acute cellular rejection of the cardiac allograft. Serum sickness is a clinical diagnosis supported by laboratory data. Some authors have suggested major and minor diagnostic criteria to aid with the diagnosis.7 Major diagnostic criteria include onset more than 7 days after the initial thymoglobulin administration, persistent high fevers (temperature, >38.4°C), persistent arthritis/arthralgia, and positive heterologous antibodies on enzyme-linked immunosorbent assay. Minor diagnostic criteria include rash, acute renal failure, trismus, and low serum complement (C3 and C4).
The variable cutaneous presentations of serum sickness are important to recognize in the process of making the correct diagnosis. Rash is frequently reported in serum sickness, with some studies displaying rates of up to 93%.4,14 The skin findings are most frequently described as urticarial or serpiginous macular lesions.3 Other variations of the eruption exist, and morbilliform eruptions or a combination of morbilliform and urticarial eruptions have been reported.3 It is important to judge cutaneous eruptions of serum sickness within the context of the potential cytopenia in a patient being treated with ATG. As such, purpuric eruptions have been attributed to serum sickness in thrombocytopenic patients receiving ATG for bone marrow failure.14
Usually, cutaneous eruptions of serum sickness initially are identified in the groin, axilla, and periumbilical region, and then they proceed to include the trunk and extremities. Erythema of the palms and soles frequently is described as well as a linear accentuation of the rash along the lateral and medial borders of the feet and hands at the margin of the plantar or palmar skin, respectively.14 The mucous membranes frequently are spared in serum sickness.
Despite the lack of evidence-based guidelines, case series and literature reviews have suggested a treatment regimen for serum sickness,7,15-18 calling for immediate withdrawal of the offending agent. Antihistamines may be added to control pruritus and rash. Patients with high fever, a progressive rash, or severe arthralgia have benefited from short courses of oral16,18 or intravenous7,17 glucocorticoids. The extent of the eruption in our patient was concerning, particularly because he was already receiving systemic corticosteroids in conjunction with other immunosuppressives, which may have explained his lack of fever.
Because our patient satisfied some diagnostic criteria for serum sickness and failed to satisfy others, our team was faced with the challenge of balancing the risks of possible serum sickness with the risks of the potential for progressive cardiac rejection from the withdrawal of thymoglobulin.7 There is some evidence in the literature for the use of therapeutic plasma exchange (TPE) for the treatment of serum sickness if the offending agent could not be discontinued. Tanriover et al19 presented a case series of 5 renal transplant recipients treated with thymoglobulin who developed serum sickness. The diagnosis of serum sickness was made clinically and augmented by the presence of antiheterologous antibodies. All 5 patients had persistent symptoms of serum sickness despite 2 days of glucocorticoid treatment. Interestingly, 3 patients had complete resolution of all symptoms after a single TPE treatment, and 2 patients achieved resolution of fever and arthritis after 2 consecutive days of TPE treatments.19 Because plasmapheresis is used to treat cardiac allograft rejection in patients showing signs of heart failure,11 the employment of TPE in these patients may have dual beneficial effects of concurrently treating serum sickness and allograft rejection.
Given the patient’s noncompliance and leaving the hospital against medical advice, a full workup was not able to be pursued in this case, though fortunately the eruption and his other symptoms had resolved by the time he was seen for outpatient follow-up 1 week later. Noncompliance with immunosuppressive therapy is a considerable risk factor for morbidity and mortality following heart transplantation. These patients have more transplant coronary artery disease and substantially shorter clinical event-free time.20 Our patient demonstrates the need for proactive compliance-enhancing interventions in heart transplant patients who experience allograft rejection.
- von Pirquet C, Schick B. Serum Sickness. Schick B, trans-ed. Baltimore, MD; Williams & Wilkins; 1951.
- Vincent C, Revillard JP. Antibody response to horse gamma-globulin in recipients of renal allografts: relationship with transplant crises and transplant survival. Transplantation. 1977;24:141-147.
- Lawley TJ, Bielory L, Gascon P, et al. A prospective clinical and immunologic analysis of patients with serum sickness. N Engl J Med. 1984;311:1407-1413.
- Bielory L, Gascon P, Lawley TJ, et al. Human serum sickness: a prospective analysis of 35 patients treated with equine anti-thymocyte globulin for bone marrow failure. Medicine (Baltimore). 1988;67:40-57.
- Chen M, Daha MR, Kallenberg CG. The complement system in systemic autoimmune disease. J Autoimmun. 2010;34:J276-J286.
- Knowles SR, Uetrecht J, Shear NH. Idiosyncratic drug reactions: the reactive metabolite syndromes. Lancet. 2000;356:1587-1591.
- Lundquist AL, Chari RS, Wood JH, et al. Serum sickness following rabbit antithymocyte-globulin induction in a liver transplant recipient: case report and literature review. Liver Transpl. 2007;13:647-650.
- Bourdage JS, Hamlin DM. Comparative polyclonal antithymocyte globulin and antilymphocyte/antilymphoblast globulin anti-CD antigen analysis by flow cytometry. Transplantation. 1995;59:1194-1200.
- Zuckermann AO, Aliabadi AZ. Calcineurin-inhibitor minimization protocols in heart transplantation. Transpl Int. 2009;22:78-89.
- Cantarovich M, Giannetti N, Barkun J, et al. Antithymocyte globulin induction allows a prolonged delay in the initiation of cyclosporine in heart transplant patients with postoperative renal dysfunction. Transplantation. 2004;78:779-781.
- Patel JK, Kittleson M, Kobashigawa JA. Cardiac allograft rejection. Surgeon. 2010;9:160-167.
- Tatum AH, Bollinger RR, Sanfilippo F. Rapid serologic diagnosis of serum sickness from antithymocyte globulin therapy using enzyme immunoassay. Transplantation. 1984;38:582-586.
- Kimball JA, Pescovitz MD, Book BK, et al. Reduced human IgG anti-ATGAM antibody formation in renal transplant recipients receiving mycophenolate mofetil. Transplantation. 1995;60:1379-1383.
- Bielory L, Yancey KB, Young NS, et al. Cutaneous manifestations of serum sickness in patients receiving antithymocyte globulin. J Am Acad Dermatol. 1985;13:411-417.
- Joubert GI, Hadad K, Matsui D, et al. Selection of treatment of cefaclor-associated urticarial, serum sickness-like reactions and erythema multiforme by emergency pediatricians: lack of a uniform standard of care. Can J Clin Pharmacol. 1999;6:197-201.
- Clark BM, Kotti GH, Shah AD, et al. Severe serum sickness reaction to oral and intramuscular penicillin. Pharmacotherapy. 2006;26:705-708.
- Finger E, Scheinberg M. Development of serum sickness-like symptoms after rituximab infusion in two patients with severe hypergammaglobulinemia. J Clin Rheumatol. 2007;13:94-95.
- Tatum AJ, Ditto AM, Patterson R. Severe serum sickness-like reaction to oral penicillin drugs: three case reports. Ann Allergy Asthma Immunol. 2001;86:330-334.
- Tanriover B, Chuang P, Fishbach B, et al. Polyclonal antibody-induced serum sickness in renal transplant recipients: treatment with therapeutic plasma exchange. Transplantation. 2005;80:279-281.
- Dobbels F, De Geest S, van Cleemput J, et al. Effect of late medication non-compliance on outcome after heart transplantation: a 5-year follow-up. J Heart Lung Transplant. 2004;23:1245-1251.
Practice Points
- Serum sickness can be seen in patients treated with thymoglobulin to prevent transplant rejection.
- Serum sickness can display multiple cutaneous manifestation, thus making it an important entity for dermatologists.
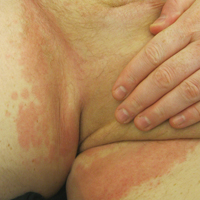
Acronymic Despair: MACRA, MIPS, and Me
The year is moving ahead, and we are in the first year with a new president and a new administration. There have been multiple attempts to defund, revoke, or otherwise eliminate the Patient Protection and Affordable Care Act. As a physician, you may be asking, “What should I be doing for MACRA (Medicare Access and CHIP Reauthorization Act of 2015) and MIPS (Merit-Based Incentive Payments System)?”
RELATED VIDEO: Update on Coding Changes: Report From the Mount Sinai Fall Symposium
What is MACRA?
Of course, there is no such thing as a free lunch. The less pleasant side of MACRA is the Quality Payment Program under which providers will be paid based on the quality and effectiveness of the care provided; physician assistants, nurse practitioners, clinical nurse specialists, and certified registered nurse anesthetists also will be under the new system in addition to physicians. We are to be paid based on value, not volume. Heady stuff. The devil, as always, is in the details, as the factors we will be measured against are diverse. Having an electronic medical record (EMR) can make capturing data for some of these measures a bit less onerous. If you do not have an EMR, the cost of transitioning to one, especially if you are a small solo practice or approaching the end of your career, may outweigh the benefits.
RELATED VIDEO: Update on Coding Changes: Report From the Mount Sinai Fall Symposium
What is MIPS?
A small group of providers, most likely those in large multispecialty groups or academic settings, will instead participate in advanced Alternative Payment Models that will provide a lump sum bonus payment of 5% of their Medicare charges from 2019 to 2024.
For those taking the more common MIPS pathway, beginning in 2019 you can see a penalty of up to 4% on your Medicare payments if you do nothing and a bonus of up to 4% if you do it all. This rate will increase to a 5% penalty or a reward of up to 5% in 2020, 7% in 2021, and 9% in 2022. The penalty is a result of nonparticipation, while complete participation might get you to the maximum bonus. Of course, the bonus pool is limited, and if everyone does it all, the bonus would be much less, assuming the program is not changed or eliminated by the current administration. At the time of writing this column, Senate Majority Leader Mitch McConnell (R-KY) has failed multiple times to pass a Patient Protection and Affordable Care Act repeal bill following rebellions in his own party.4
So what do you, dear colleague, need to do right now, or at least before the end of the calendar year? You could do it all and try to grab the brass ring 4% bonus for 2019, putting time, effort, and expense into going after what could be an elusive reward. Or you could simply avoid the penalty and go back to work knowing you have locked in normal payments (whatever that will be!) for 2019. We are both doing the latter, and so might you, especially if you have not done anything yet this year.
MIPS Made Merry
To learn what you need to do or can do, pay a visit to the Quality Payment Program website (https://qpp.cms.gov/) where you can look yourself up with your national provider identifier number and find out what system you are under. Unless you are part of a large enterprise, you are likely under MIPS, but it never hurts to check.
It will then give you the options for reporting as an individual or a group. Either way, you can send in quality data through your routine Medicare claims process, which is our suggested route; no registry, no EMR, just an extra line on a claim form. You can review the complete list of quality measures that are available on the Quality Payment Program website (https://qpp.cms.gov/mips/quality-measures). There are 271 measures to read through and ponder, but by now you already have a headache, so take the following advice:
- Filter with the “Data Submission Method” by checking off “Claims,” which gives you 74 choices.
- Filter further with the “Specialty Measure Set”by checking off “Dermatology,” which gives you 4 choices.
- The top choice and probably the easiest one to get your staff to help with is “Documentation of Current Medications in the Medical Record,” which if you click on it further identifies it as “Quality ID: 130,” the official name of this measure.
You can see the MIPS program information in all its bureaucratic glory on the Quality Payment Program website (https://qpp.cms.gov/resources/education); click on “Quality Measure Specifications” to download a 250 MB zip file that contains information on all the measures in detail. The Measure #130 (Documentation of Current Medications in the Medical Record) file indicates that the clinician must use a G code (G8427) to report that current medications have been documented. The measure reads: “Eligible clinician attests to documenting, updating or reviewing a patient’s current medications using all immediate resources available on the date of encounter. This list must include ALL known prescriptions, over-the counters, herbals, and vitamin/mineral/dietary (nutritional) supplements AND must contain the medications’ name, dosages, frequency and route of administration.”5
You likely already confirm current medications with patients in some form or other, so simply look at the list of medications and supplements with all their dosages, frequencies, and routes of administration and sign the sheet of paper your practice likely already uses as an extra way of confirming that you have reviewed it. You report code G8427 as you would any Current Procedural Terminology code and link it to any International Classification of Diseases, Tenth Revision, code in your claim along with any evaluation and management and/or procedure codes that you would otherwise report for that encounter.
Some clearinghouses will not accept $0 charges, so we recommend you place a $0.01 charge for G8427 and write it off later. Upon receiving your explanation of benefits, you should notice 2 remark codes relating to the G8427 line: CO-246 and N620. Both of these codes indicate that the Centers for Medicare & Medicaid Services acknowledge your quality submission. To avoid that 4% penalty in 2019, you only need to do it once, but doing it a few times until you get back an explanation of benefits acknowledging it may help you sleep better.
Conclusion
Although the future of the Patient Protection and Affordable Care Act is still unclear, one thing is for sure: MACRA and MIPS are here to stay. Avoid the 4% penalty in 2019 and take good care of your patients and, if eligible, make donations to the American Academy of Dermatology Association Political Action Committee (skinPAC). It is going to be a wild ride.
- MACRA: delivery system reform, Medicare payment reform. Centers for Medicare & Medicaid Services website. https://www.cms.gov/Medicare/Quality-Initiatives-Patient-Assessment-Instruments/Value-Based-Programs/MACRA-MIPS-and-APMs/MACRA-MIPS-and-APMs.html. Updated June 26, 2016. Accessed August 1, 2017.
- MACRA tools and resources. American Academy of Dermatology website. https://www.aad.org/practicecenter/coding-and-reimbursement/macra. Accessed August 1, 2017.
- Balanced Budget Act of 1997. Senate and House of Representatives of the United States of America. https://www.gpo.gov/fdsys/pkg/PLAW-105publ33/html/PLAW-105publ33.htm. Accessed August 1, 2017.
- Bruni F. The misery of Mitch McConnell. New York Times. June 28, 2017. https://www.nytimes.com/2017/06/28/opinion/mitch-mcconnell-health-care-misery.html. Accessed August 1, 2017.
- American Medical Association. Measure #130 (NQF 0419): Documentation of Current Medications in the Medical Record-National Quality Strategy Domain: Patient Safety. Published November 15, 2016. Accessed August 18, 2016.
The year is moving ahead, and we are in the first year with a new president and a new administration. There have been multiple attempts to defund, revoke, or otherwise eliminate the Patient Protection and Affordable Care Act. As a physician, you may be asking, “What should I be doing for MACRA (Medicare Access and CHIP Reauthorization Act of 2015) and MIPS (Merit-Based Incentive Payments System)?”
RELATED VIDEO: Update on Coding Changes: Report From the Mount Sinai Fall Symposium
What is MACRA?
Of course, there is no such thing as a free lunch. The less pleasant side of MACRA is the Quality Payment Program under which providers will be paid based on the quality and effectiveness of the care provided; physician assistants, nurse practitioners, clinical nurse specialists, and certified registered nurse anesthetists also will be under the new system in addition to physicians. We are to be paid based on value, not volume. Heady stuff. The devil, as always, is in the details, as the factors we will be measured against are diverse. Having an electronic medical record (EMR) can make capturing data for some of these measures a bit less onerous. If you do not have an EMR, the cost of transitioning to one, especially if you are a small solo practice or approaching the end of your career, may outweigh the benefits.
RELATED VIDEO: Update on Coding Changes: Report From the Mount Sinai Fall Symposium
What is MIPS?
A small group of providers, most likely those in large multispecialty groups or academic settings, will instead participate in advanced Alternative Payment Models that will provide a lump sum bonus payment of 5% of their Medicare charges from 2019 to 2024.
For those taking the more common MIPS pathway, beginning in 2019 you can see a penalty of up to 4% on your Medicare payments if you do nothing and a bonus of up to 4% if you do it all. This rate will increase to a 5% penalty or a reward of up to 5% in 2020, 7% in 2021, and 9% in 2022. The penalty is a result of nonparticipation, while complete participation might get you to the maximum bonus. Of course, the bonus pool is limited, and if everyone does it all, the bonus would be much less, assuming the program is not changed or eliminated by the current administration. At the time of writing this column, Senate Majority Leader Mitch McConnell (R-KY) has failed multiple times to pass a Patient Protection and Affordable Care Act repeal bill following rebellions in his own party.4
So what do you, dear colleague, need to do right now, or at least before the end of the calendar year? You could do it all and try to grab the brass ring 4% bonus for 2019, putting time, effort, and expense into going after what could be an elusive reward. Or you could simply avoid the penalty and go back to work knowing you have locked in normal payments (whatever that will be!) for 2019. We are both doing the latter, and so might you, especially if you have not done anything yet this year.
MIPS Made Merry
To learn what you need to do or can do, pay a visit to the Quality Payment Program website (https://qpp.cms.gov/) where you can look yourself up with your national provider identifier number and find out what system you are under. Unless you are part of a large enterprise, you are likely under MIPS, but it never hurts to check.
It will then give you the options for reporting as an individual or a group. Either way, you can send in quality data through your routine Medicare claims process, which is our suggested route; no registry, no EMR, just an extra line on a claim form. You can review the complete list of quality measures that are available on the Quality Payment Program website (https://qpp.cms.gov/mips/quality-measures). There are 271 measures to read through and ponder, but by now you already have a headache, so take the following advice:
- Filter with the “Data Submission Method” by checking off “Claims,” which gives you 74 choices.
- Filter further with the “Specialty Measure Set”by checking off “Dermatology,” which gives you 4 choices.
- The top choice and probably the easiest one to get your staff to help with is “Documentation of Current Medications in the Medical Record,” which if you click on it further identifies it as “Quality ID: 130,” the official name of this measure.
You can see the MIPS program information in all its bureaucratic glory on the Quality Payment Program website (https://qpp.cms.gov/resources/education); click on “Quality Measure Specifications” to download a 250 MB zip file that contains information on all the measures in detail. The Measure #130 (Documentation of Current Medications in the Medical Record) file indicates that the clinician must use a G code (G8427) to report that current medications have been documented. The measure reads: “Eligible clinician attests to documenting, updating or reviewing a patient’s current medications using all immediate resources available on the date of encounter. This list must include ALL known prescriptions, over-the counters, herbals, and vitamin/mineral/dietary (nutritional) supplements AND must contain the medications’ name, dosages, frequency and route of administration.”5
You likely already confirm current medications with patients in some form or other, so simply look at the list of medications and supplements with all their dosages, frequencies, and routes of administration and sign the sheet of paper your practice likely already uses as an extra way of confirming that you have reviewed it. You report code G8427 as you would any Current Procedural Terminology code and link it to any International Classification of Diseases, Tenth Revision, code in your claim along with any evaluation and management and/or procedure codes that you would otherwise report for that encounter.
Some clearinghouses will not accept $0 charges, so we recommend you place a $0.01 charge for G8427 and write it off later. Upon receiving your explanation of benefits, you should notice 2 remark codes relating to the G8427 line: CO-246 and N620. Both of these codes indicate that the Centers for Medicare & Medicaid Services acknowledge your quality submission. To avoid that 4% penalty in 2019, you only need to do it once, but doing it a few times until you get back an explanation of benefits acknowledging it may help you sleep better.
Conclusion
Although the future of the Patient Protection and Affordable Care Act is still unclear, one thing is for sure: MACRA and MIPS are here to stay. Avoid the 4% penalty in 2019 and take good care of your patients and, if eligible, make donations to the American Academy of Dermatology Association Political Action Committee (skinPAC). It is going to be a wild ride.
- MACRA: delivery system reform, Medicare payment reform. Centers for Medicare & Medicaid Services website. https://www.cms.gov/Medicare/Quality-Initiatives-Patient-Assessment-Instruments/Value-Based-Programs/MACRA-MIPS-and-APMs/MACRA-MIPS-and-APMs.html. Updated June 26, 2016. Accessed August 1, 2017.
- MACRA tools and resources. American Academy of Dermatology website. https://www.aad.org/practicecenter/coding-and-reimbursement/macra. Accessed August 1, 2017.
- Balanced Budget Act of 1997. Senate and House of Representatives of the United States of America. https://www.gpo.gov/fdsys/pkg/PLAW-105publ33/html/PLAW-105publ33.htm. Accessed August 1, 2017.
- Bruni F. The misery of Mitch McConnell. New York Times. June 28, 2017. https://www.nytimes.com/2017/06/28/opinion/mitch-mcconnell-health-care-misery.html. Accessed August 1, 2017.
- American Medical Association. Measure #130 (NQF 0419): Documentation of Current Medications in the Medical Record-National Quality Strategy Domain: Patient Safety. Published November 15, 2016. Accessed August 18, 2016.
Practice Points
- MACRA (Medicare Access and CHIP Reauthorization Act of 2015) and MIPS (Merit-Based Incentive Payments System) need not ruin your life this year.
- A single measure can eliminate your downside risk for 2019.

Atopic Dermatitis Prevention and Treatment
Atopic dermatitis (AD) is a disease that finally is coming of age in dermatology research. New topical agents and systemic biologic agents offer patients with AD other options for medical management. This article provides a practical review of prevention strategies and treatment guidelines for AD.
PREVENTION
Prevention strategies for AD have been largely unsuccessful in the past, which may relate to factors such as prenatal triggers.1 However, some newer interventional studies have shown some promise in AD prevention in specific settings. For example, a randomized trial of infants in the United States and United Kingdom at high risk for AD (ie, family history of atopy) reported that the AD risk was reduced by 50% when patients were treated with at least once-daily application of full-body emollients for 6 months (beginning by 3 weeks of life).2 The strategy of daily application of emollients for avoidance of AD in infants with a family history of AD is reasonable but may not offer lifetime prevention, and the benefit in children not from AD families is unknown.
Other trials to prevent AD have included usage of dust avoidance and dust covers for mattresses. This strategy showed modest benefit in reducing the incidence of atopic diatheses in the first year3 but did not gain endorsement by the most recent guidelines of the American Academy of Dermatology (AAD).4
Prenatal and postnatal (maternal and child) supplementation of Lactobacillus rhamnosus has shown promise in prevention.5 The exact regimen likely makes an impact on efficacy. An early study showed the usage of probiotics (eg, Lactobacillus reuteri) prenatally in pregnant women and postnatally in infants resulted in no reduction in occurrence of AD and possible reduction in IgE-associated AD.6 Kalliomäki et al7 demonstrated that L rhamnosus GG alone reduced AD by half in at-risk infants in a double-blind, placebo-controlled trial. On the other hand, Taylor et al8 performed a study of probiotic supplementation in which patients at high risk for AD developed higher rates of allergen sensitization. The most successful recent trial involved the randomization of 415 pregnant women to receive interventions from 36 weeks’ gestation until 3 months postpartum.9 The intervention was a randomized comparison of milk without probiotics versus a blend of probiotic milk containing L rhamnosus GG, Lactobacillus acidophilus La-5, and Bifidobacterium animalis subsp lactis Bb-12. At 6 years of age, 81 babies who consumed probiotic milk and 82 babies who consumed milk without probiotics were available for testing. The strategy caused a statistically significant reduction in AD in the complete case analysis (odds ratio, 0.48; 95% confidence interval, 0.25-0.92; P=.027; number needed to treat, 6). Sadly, other allergic diseases were not prevented in this study.9
MANAGEMENT OF AD
There currently is no cure or perfected prevention technique for AD. As a result, therapy focuses on avoiding triggers and alleviating symptoms.10 Recent guidelines from the AAD state that“[t]he ultimate judgment regarding the propriety of any specific therapy must be made by the physician and the patient in light of all the circumstances presented by the individual patient, and the known variability and biologic behavior of the disease.”11 Skin-directed therapies are the first line of treatment including emollients, gentle skin care, and topical medicaments. In AD, therapies are needed to reduce disease activity and flare severity, clear flares, and provide relief.
Parental education and written eczema action plans are recommended to help patients and parents/guardians follow recommended regimens12; Tollefson and Bruckner13 for the American Academy of Pediatrics provide an action plan to guide the care of children with atopic dermatitis that is simple, but many others exist online. The eczema action plan usually provides information on how to bathe and what to do when the skin is actively inflamed.
In 2014, a 4-part series of guidelines of care for the management of AD was published by the AAD, replacing prior guidelines.4,11,14,15 The following sections review some of the important parameters of care highlighted in these management guidelines.
Psychological Support
Appropriate psychological support for AD patients can be sought through counselors, therapists, psychiatrists, and support groups such as the National Eczema Association (https://nationaleczema.org/).
Education
Education is the leading form of medical therapy in patients with AD. Eczema schools are popular in Europe and are just beginning to form in the United States (http://tuh.templehealth.org/content/eczema_school.htm), which can be helpful to educate caregivers and patients with AD. Patient resources online and through support groups with an online presence, in-person meetings, and patient/family conventions can be helpful to AD patients. Often, an initial office visit with a dermatologist involves a review of avoidance of triggers, usage of gentle skin care including bland emollients, and therapeutic regimens for disease activity. This form of verbal education is to be paired with an eczema action plan, a written document that allows individuals to reference recommendations and share information with other caregivers.12,13,16
Emollients and Gentle Skin Care
Gentle skin care regimens, which includes the usage of synthetic cleansers with a low pH to help maintain the acidity (acid mantle) of the skin, seek to reduce irritation and have been rated as level IA (highest level) in recent AAD guidelines.14 Although bathing frequency has been emphasized in the guidelines, AD severity as reflected by SCORAD (SCORing Atopic Dermatitis) was not different for daily bathing versus twice weekly.17 The American Academy of Pediatrics recommended a skin care regimen of bathing every 2 to 3 days in lukewarm water for 10 to 15 minutes, followed by application of emollients that are fragrance free and have few preservatives.13 Topical emollients with additives such as colloidal oatmeal, avenanthramides, or ceramides can be used to enhance the skin barrier and are well tolerated in all age groups.18,19 Despite enhanced emollients, the therapy of AD still requires usage of prescription or over-the-counter TCs and/or topical calcineurin inhibitors (TCIs) in many cases.20
Topical Medication
Children have a relatively higher body surface area–to-weight ratio, allowing for greater potential absorption of topical medicaments and potential side effects from absorption. Types of vehicle, cost, site of application, and availability may impact patient and physician preference in choice of therapeutic topical agent.14
Topical Corticosteroids
Topical corticosteroids (TCs) are the mainstay of treatment for AD and have been used for more than 60 years.14,20 Topical corticosteroids provide anti-inflammatory effects on T cells, monocytes, and macrophages, producing altered cytokine activity locally. Topical corticosteroids inhibit collagen synthesis, potentially causing skin atrophy. They also inhibit IL-1, IL-2, IL-6, IFN-α, and tumor necrosis factor α.21 Topical corticosteroids are classified as class I (ultra-high potency) to class VII (low potency). In children, low-potency TCs generally are applied to the face, intertriginous areas, groin, and genitalia, and mid-potency corticosteroids are applied to the body, arms, and legs. An even higher-strength agent can be prescribed as a rescue medication in severe cases. After clearance with once- or twice-daily therapy, twice-weekly usage can benefit disease activity.22 Topical corticosteroids reduce inflammation as well as Staphylococcus aureus load through inhibition of cytokines that inhibit antimicrobial peptides. Topical corticosteroids have been endorsed as level IA evidence therapy by the AAD guidelines.14
Topical corticosteroids, particularly prolonged usage of mid- to high-potency products, have been associated with side effects such as skin atrophy, striae, telangiectases, hypopigmentation, rosacea, acneiform eruptions, focal hypertrichosis, perioral dermatitis, and acne23; potential systemic side effects include hypothalamic-pituitary-adrenal axis suppression, cataracts, glaucoma (with periocular application), Cushing syndrome, hyperglycemia, hypertension,23 and growth retardation.14 Long-term corticosteroid therapy is associated with tachyphylaxis and potential rebound of disease with discontinuation.24 Based on the potential risk of side effects with TCs, the least potent product for the shortest time needed is recommended, with special care for thin skin. Discontinuation when clearance occurs is advised. Allergy to TCs and/or vehicle ingredients such as propylene glycol should be suspected in severe unremitting cases.14 A recent registry review of children screened for contact dermatitis demonstrated that children with AD had higher sensitization to the steroid tixocortol pivalate.25
Topical Calcineurin Inhibitors
Topical calcineurin inhibitors include pimecrolimus cream 1%, which is approved for mild to moderate AD in adults and children 2 years and older, and tacrolimus ointment 0.03% and 0.1%, which are approved for moderate to severe AD in adults and children aged 2 to 15 years (0.03% formulation only). Topical calcineurin inhibitors can be used as second-line agents in AD in patients who have inadequate response to TCs or who may not be able to use TCs due to the disease site.10,13,14 Guidelines from the AAD also have endorsed TCIs as level IA evidence for steroid-sparing agents.
Concerns about the reporting of cancers and lymphomas prompted the US Food and Drug Administration to issue a black box warning on TCIs more than 10 years ago. Pimecrolimus, which has little absorption and no notable immunosuppressive effects, has been used without detrimental effect on vaccination and delayed-type hypersensitivities, but many decades of data are lacking.10,13,14,17,26-29 Topical calcineurin inhibitors can be used as steroid-sparing agents in lieu of corticosteroids in specific locations such as the face and eyelids and for long-term suppressive therapy twice weekly.30 Intermittent usage and cycling with corticosteroids is advisable,28 but usage intermittently beyond 1 year has not been evaluated.
Topical calcineurin inhibitors are recommended as effective for acute and chronic AD. Their use as maintenance therapy in adults and children, for AD recalcitrant to steroids, for AD in sensitive areas, for steroid-induced atrophy, and for long-term uninterrupted topical steroid usage carries a level IA evidence recommendation. Furthermore, the AAD guidelines have recommended TCIs as steroid-sparing agents with level IA evidence and off-label use of TCIs in children younger than 2 years with level IA evidence. Pretreatment with TCs to reduce stinging has level IIB evidence. Usage for flare prevention is level IA evidence. Routine blood monitoring of TCI-treated patients was not recommended; in fact, the AAD guidelines provided this recommendation as level IA evidence against routine laboratory monitoring of TCI-treated patients.14
Topical Antibiotics
Topical antibiotics are indicated for the therapy of impetigo and can be used in the setting of impetiginized AD in conjunction with TCs. Recent AAD guidelines suggested against routine usage of topical antistaphylococcal agents as level IA evidence.14 There is one study supporting usage of topical mupirocin in addition to TCs to heal children with eczema area and severity index scores more than 7 more rapidly in the first week of AD therapy, but in the same study, additive benefit was not demonstrated in AD beyond the first week.31 There also are data supporting usage of intranasal mupirocin adjunctively with bleach baths in patients with moderate to severe AD, which was rated as level IIB evidence in the AAD guidelines.14,32 There are limited data on the long-term utility of topical anti-infectives in AD. The risks of long-term usage could include resistance formation to agents such as mupirocin, contact dermatitis, and lack of efficacy.
Additional Therapeutics
Wet Wraps
Penetration through the stratum corneum is needed for drug activity in AD. Penetration can be enhanced using wet wrap therapy or using ointments, which produce higher relative potency.13 Wet wraps overlying a dilute topical medicament have been described as effective in AD and are recommended in AAD guidelines as level IIB evidence.14 Different wet wrap techniques can be used, including wet pajamas covered by dry pajamas or saline-soaked gauze wrapped around the affected areas and then dry gauze applied over the wet gauze. The methodology used should be tailored to the patient as well as to whether the individual is an inpatient or outpatient.
Bleach Baths
Dilute sodium hypochlorite solution 0.005% (one-quarter cup bleach in 20 gallons of water) has been demonstrated to be beneficial in reduction of disease activity in AD patients with recurrent bacterial infections.32 This simple technique in addition to intranasal mupirocin can reduce AD severity and improve quality of life and is the only ongoing S aureus therapeutic management endorsed by the AAD guidelines for the management of AD.14,32
Topical and Oral Delivery
Antihistamines
Topical antihistamines are ineffective in AD. Oral antihistamines can be used to reduce pruritus and are most effective when given as sedating agents for sleep enhancement but may be given as nonsedating agents for patients with concomitant allergic disorders such as allergic rhinoconjunctivitis. Paradoxical hyperreactivity with sedating antihistamines is not uncommon in small children, and sedating antihistamine usage should be discontinued in these instances.13 Parents of children with AD have reported giving the child antihistamines to sleep was helpful, as well as putting on creams, using special clothes (eg, all cotton), and keeping the room cool.33 There is level IIIC evidence against use of systemic antihistamines and level IIA evidence for sedating and nonsedating, according to the AAD guidelines.14
Systemic Therapeutics
Oral therapeutics range from oral antihistamines to oral antibiotics and immunosuppressive medications. Oral antibiotics (level IIB evidence) are reserved for superinfected AD, which is not easily defined for the following reasons: there is no consensus definition of superinfected AD; the majority of active AD lesions when cultured will demonstrate S aureus growth; and most AD lesions ooze, thereby creating the appearance of superinfection. In real-world practice, superinfection can be diagnosed based on the presence of pustules; furuncles; or signs of infection such as tracking erythema, tenderness, severe erosions, or maceration. Clinical judgment is always required.
The immunosuppressive medications used in AD include leukotriene inhibitors, which rarely are effective for AD.34 More effective systemic agents for AD include cyclosporine (level I to IIB evidence), azathioprine (level IIB evidence), mycophenolate mofetil (level IIIC evidence), and methotrexate (level IIB evidence). These agents are indicated for pediatric or adult patients when topical agents and/or phototherapy have failed.15 Monitoring these agents for side effects includes ongoing evaluation for renal and liver toxicity. Short courses (ie, 6 months) are preferred to minimize side effects.35
Dupilumab, an injectable AD therapy, is approved in the United States. This agent is injected every 2 weeks and binds to the IL-4Rα shared by IL-4 and IL-13. In 4 weeks of monotherapy, 85% of adult patients treated had 50% or greater clearance.36 Recently published consensus opinion from the International Eczema Council recommends assessment of a variety of factors before initiating systemic therapy including comorbid illnesses such as contact allergy, trigger avoidance, superinfection, and impact on quality of life.37
Oral Corticosteroids
Systemic corticosteroids clear patients quickly but provide no sustained improvement; in fact, many patients rebound or have tachyphylaxis. Although short-term corticosteroid usage can break the itch-scratch cycle, long-term usage is associated with osteoporosis, Cushing syndrome, and aseptic necrosis of the femoral head. Decreased linear growth will occur during therapy in children; therefore, systemic steroids are not recommended in children with AD, except for additional or comorbid conditions (eg, asthma or contact dermatitis).4
Phototherapy
Phototherapy has been recommended in the AAD guidelines as a second-line treatment after failure of first-line agents (ie, TCIs and TCs) for clearance and or maintenance and should be tailored to the patient’s skin tone by an experienced physician. Narrowband UVB phototherapy may act through the suppression of T-cell activity in the skin and possibly via suppression of staphylococcal superantigens; however, many phototherapy types have been described for AD.38,39 Usage can be effective in school-aged children and teenagers but may be limited due to school attendance. Phototherapy was graded as level IIB evidence in the AAD guidelines.15 Side effects include aggravation of AD by exposure to heat and UV light, actinic damage, tenderness, erythema, pruritus, burning, and stinging. Lentigines; skin cancers (melanoma and nonmelanoma); folliculitis; and ocular toxicity, especially cataracts, can occur.15 Children younger than 6 years will find it difficult to stand in a phototherapy booth and may be poor candidates.15,38,39
Complementary and Alternative Medicine
Complementary and alternative medicine (CAM) also has been used for AD in the United States. In a review of the 2007 National Health Interview Survey of 9417 children aged 0 to 17 years, CAM was used for AD by 0.99% of children. Some CAM techniques were associated with worsening severity of AD, including herbal therapy, vitamins, homeopathic agents, diet, and movement techniques.40 Usage of Chinese herbal medications for AD can be associated with liver toxicity.41 Only one CAM therapy—massage therapy—has some mild supportive data.42
Allergen Avoidance and Diet
Bronsnick et al43 discussed the possible benefit of prenatal and postnatal probiotics for prevention of AD, which were not supported in the AAD guidelines for management of AD4; postnatal prebiotic supplementation; and exclusive breastfeeding and/or supplementation with hydrolyzed formula in at-risk children. Elimination diets for children and mothers were not recommended. The authors found no beneficial role of supplements including vitamin D, selenium, fish oil, borage oil, and zinc sulfate.43
A National Institute of Allergy and Infectious Diseases consensus group recommended avoidance of proven but not random elimination of food allergens in AD, asthma, and/or eosinophilic esophagitis.44 Restricted maternal diet was not recommended, and breastfeeding exclusively for the first 4 to 6 months was recommended. Hydrolyzed formulas were suggested as a possible preventive strategy in at-risk infants as a breastfeeding alternative, with cost of these formulas being a problem.44
In children younger than 5 years, food allergy screening for the most common allergens (eg, milk, eggs, peanuts, wheat, soy) should be considered in children with persistent unremitting dermatitis and/or known food challenge–induced reactions.4 Conservative measures to avoid house dust mite exposure in known sensitized individuals including dust covers for pillows and mattresses may be beneficial.4,45
Emerging Therapies
Recently approved therapies include better-targeted agents that appear to have a reasonable safety profile and may fulfill unmet needs in AD care. Of these agents, crisaborole, a topical boron-based phosphodiesterase 4 inhibitor, was approved in December 2016 for mild to moderate AD in patients 2 years and older.Topically, this agent seems to be efficacious in the absence of notable carcinogenicity.46
The systemic (injectable) biologic agent dupilumab was approved in March 2017 for moderate to severe AD. Phase 3 studies in adults with AD showed excellent success in adults with moderate to severe AD.37 This agent is a monoclonal antibody targeted at blockade of the crucial atopic inflammatory triggering pathway via blockade of the IL-4A receptor site, targeting IL-4 and IL-13 activity.36,47 There are many medications in the pipeline, which Renert-Yuval and Guttman-Yassky48 review. However, an overview of the landscape demonstrates that Janus kinase (JAK) inhibitors49 and biologic medications in addition to dupilumab affecting targeted inflammatory cascades in AD are in development. In particular, the JAK inhibitors appear promising due to availability both as oral and topical agents.49
Need for Ongoing Care and Monitoring
Atopic dermatitis is a chronic inflammatory skin disorder with a genetic basis. Once initiated, the process of AD may persist throughout the patient’s life and become a systemic disorder with comorbidities including sleep disturbance, reduced quality of life, and cardiovascular disease.50 Ongoing management of AD includes topical reduction in irritants and triggers, topical medicaments, and management of pruritus and infections. At this time, emollients and irritant avoidance paired with judicious topical medicaments including TCs and second-line or site-specific (eg, eyelids) usage of TCIs or phosphodiesterase 4 inhibitors remain the backbone of therapy. Ongoing review of therapeutics for associated morbidities is underway, which may guide future therapeutic interventions into AD. The future of prevention and therapy look bright, but time will tell.
- Kelleher M, Dunn-Galvin A, Hourihane JO, et al. Skin barrier dysfunction measured by transepidermal water loss at 2 days and 2 months predates and predicts atopic dermatitis at 1 year. J Allergy Clin Immunol. 2015;135:930-935.
- Simpson EL, Chalmers JR, Hanifin JM, et al. Emollient enhancement of the skin barrier from birth offers effective atopic dermatitis prevention. J Allergy Clin Immunol. 2014;134:818-823.
- Tsitoura S, Nestoridou K, Botis P, et al. Randomized trial to prevent sensitization to mite allergens in toddlers and preschoolers by allergen reduction and education: one-year results. Arch Pediatr Adolesc Med. 2002;156:1021-1027.
- Sidbury R, Tom WL, Bergman JN, et al. Guidelines of care for the management of atopic dermatitis: section 4. prevention of disease flares and use of adjunctive therapies and approaches. J Am Acad Dermatol. 2014;71:1218-1233.
- Foolad N, Brezinski EA, Chase EP, et al. Effect of nutrient supplementation on atopic dermatitis in children: a systematic review of probiotics, prebiotics, formula, and fatty acids. JAMA Dermatol. 2013;149:350-355.
- Abrahamsson TR, Jakobsson T, Böttcher MF, et al. Probiotics in prevention of IgE-associated eczema: a double-blind, randomized, placebo-controlled trial. J Allergy Clin Immunol. 2007;119:1174-1180.
- Kalliomäki M, Salminen S, Arvilommi H, et al. Probiotics in primary prevention of atopic disease: a randomised placebo-controlled trial. Lancet. 2001;357:1076-1079.
- Taylor AL, Dunstan JA, Prescott SL. Probiotic supplementation for the first 6 months of life fails to reduce the risk of atopic dermatitis and increases the risk of allergen sensitization in high-risk children: a randomized controlled trial. J Allergy Clin Immunol. 2007;119:184-191.
- Simpson MR, Dotterud CK, Storrø O, et al. Perinatal probiotic supplementation in the prevention of allergy related disease: 6 year follow up of a randomised controlled trial. BMC Dermatol. 2015;15:13. doi:10.1186/s12895-015-0030-1.
- Carr WW. Topical calcineurin inhibitors for atopic dermatitis: review and treatment recommendations. Paediatr Drugs. 2013;15:303-310.
- Eichenfield LF, Tom WL, Chamlin SL, et al. Guidelines of care for the management of atopic dermatitis: section 1. diagnosis and assessment of atopic dermatitis. J Am Acad Dermatol. 2014;70:338-351.
- Silverberg NB. Creating an action plan for eczema patients. Cutis. 2015;96:362-363.
- Tollefson MM, Bruckner AL; Section on Dermatology. Atopic dermatitis: skin-directed management. Pediatrics. 2014;134:E1735-E1744.
- Eichenfield LF, Tom WL, Berger TG, et al. Guidelines of care for the management of atopic dermatitis: section 2. management and treatment of atopic dermatitis with topical therapies. J Am Acad Dermatol. 2014;71:116-132.
- Sidbury R, Davis DM, Cohen DE, et al; American Academy of Dermatology. Guidelines of care for the management of atopic dermatitis: section 3. management and treatment with phototherapy and systemic agents. J Am Acad Dermatol. 2014;71:327-349.
- Shi VY, Nanda S, Lee K, et al. Improving patient education with an eczema action plan: a randomized controlled trial. JAMA Dermatol. 2013;149:481-483.
- Koutroulis I, Petrova K, Kratimenos P, et al. Frequency of bathing in the management of atopic dermatitis: to bathe or not to bathe? Clin Pediatr (Phila). 2014;53:677-681.
- Fowler JF, Nebus J, Wallo W, et al. Colloidal oatmeal formulations as adjunct treatments in atopic dermatitis. J Drugs Dermatol. 2012;11:804-807.
- Fowler J Jr, Silverberg N. Active naturals have a key role in atopic dermatitis. Semin Cutan Med Surg. 2008;27:8-10.
- Eichenfield LF. Consensus guidelines in diagnosis and treatment of atopic dermatitis. Allergy. 2004;59:86-92.
- Nghiem P, Pearson G, Langley RG. Tacrolimus and pimecrolimus: from clever prokaryotes to inhibiting calcineurin and treating atopic dermatitis. J Am Acad Dermatol. 2002;46:228-241.
- Schmitt J. Commentary: eczema and cancer risk. Br J Dermatol. 2011;165:463-464.
- Abramovits W, Hung P, Tong KB. Efficacy and economics of topical calcineurin inhibitors for the treatment of atopic dermatitis. Am J Clin Dermatol. 2006;7:213-222.
- Takahashi-Ando N, Jones MA, Fujisawa S, et al. Patient-reported outcomes after discontinuation of long-term topical corticosteroid treatment for atopic dermatitis: a targeted cross-sectional survey. Drug Healthc Patient Saf. 2015;7:57-62.
- Jacob SE, McGowan M, Silverberg NB, et al. Pediatric contact dermatitis registry data on contact allergy in children with atopic dermatitis. JAMA Dermatol. 2017;153:765-770.
- Werfel T. Topical use of pimecrolimus in atopic dermatitis: update on the safety and efficacy. J Dtsch Dermatol Ges. 2009;7:739-742.
- Wahn U, Bos JD, Goodfield M, et al. Efficacy and safety of pimecrolimus cream in the long-term management of atopic dermatitis in children. Pediatrics. 2002;110(1, pt 1):E2.
- Berger TG, Duvic M, Van Voorhees AS, et al; American Academy of Dermatology Association Task Force. The use of topical calcineurin inhibitors in dermatology: safety concerns. report of the American Academy of Dermatology Association Task Force. J Am Acad Dermatol. 2006;54:818-823.
- Paller AS. Latest approaches to treating atopic dermatitis. Chem Immunol Allergy. 2012;96:132-140.
- Thaçi D, Reitamo S, Gonzalez Ensenat MA, et al. Proactive disease management with 0.03% tacrolimus ointment for children with atopic dermatitis: results of a randomized, multicentre, comparative study. Br J Dermatol. 2008;159:1348-1356.
- Gong JQ, Lin L, Lin T, et al. Skin colonization by Staphylococcus aureus in patients with eczema and atopic dermatitis and relevant combined topical therapy: a double-blind multicentre randomized controlled trial. Br J Dermatol. 2006;155:680-687.
- Huang JT, Abrams M, Tlougan B, et al. Treatment of Staphylococcus aureus colonization in atopic dermatitis decreases disease severity. Pediatrics. 2009;123:E808-E814.
- Reid P, Lewis-Jones MS. Sleep difficulties and their management in preschoolers with atopic eczema. Clin Exp Dermatol. 1995;20:38-41.
- Silverberg NB, Paller AS. Leukotriene receptor antagonists are ineffective for severe atopic dermatitis. J Am Acad Dermatol. 2004;50:485-486.
- Wolverton SE. Comprehensive Dermatologic Drug Therapy. 3rd ed. New York, NY: Elsevier Saunders; 2013.
- Beck LA, Thaçi D, Hamilton JD, et al. Dupilumab treatment in adults with moderate-to-severe atopic dermatitis. N Engl J Med. 2014;371:130-139.
- Simpson EL, Bruin-Weller M, Flohr C, et al. When does atopic dermatitis warrant systemic therapy? recommendations from an expert panel of the International Eczema Council [published online August 10, 2017]. J Am Acad Dermatol. doi:10.1016/j.jaad.2017.06.042.
- Veith W, DeLeo V, Silverberg N. Medical phototherapy in childhood skin diseases. Minerva Pediatr. 2011;63:327-333.
- Song E, Reja D, Silverberg N, et al. Phototherapy: kids are not just little people. Clin Dermatol. 2015;33:672-680.
- Silverberg JI, Lee-Wong M, Silverberg NB. Complementary and alternative medicines and childhood eczema: a US population-based study. Dermatitis. 2014;25:246-254.
- Stickel F, Shouval D. Hepatotoxicity of herbal and dietary supplements: an update. Arch Toxicol. 2015;89:851-865.
- Schachner L, Field T, Hernandez-Reif M, et al. Atopic dermatitis symptoms decreased in children following massage therapy. Pediatr Dermatol. 1998;15:390-395.
- Bronsnick T, Murzaku EC, Rao BK. Diet in dermatology: part I. atopic dermatitis, acne, and nonmelanoma skin cancer. J Am Acad Dermatol. 2014;71:1039.e1-1039.e12.
- Boyce JA, Assa’ad A, Burks AW, et al. Guidelines for the diagnosis and management of food allergy in the United States: summary of the NIAID-sponsored expert panel report. Nutr Res. 2011;31:61-75.
- Silverberg NB, Lee-Wong M, Yosipovitch G. Diet and atopic dermatitis. Cutis. 2016;97:227-232.
- Hanifin JM, Chan SC, Cheng JB, et al. Type phosphodiesterase inhibitors have clinical and in vitro anti-inflammatory effects in atopic dermatitis. J Invest Dermatol. 1996;107:51-56.
- Boguniewicz M, Leung DY. Targeted therapy for allergic diseases: at the intersection of cutting-edge science and clinical practice. J Allergy Clin Immunol. 2015;135:354-356.
- Renert-Yuval Y, Guttman-Yassky E. Systemic therapies in atopic dermatitis: the pipeline. Clin Dermatol. 2017;35:387-397.
- Damsky W, King BA. JAK inhibitors in dermatology: the promise of a new drug class. J Am Acad Dermatol. 2017;76:736-744.
- Brunner PM, Silverberg JI, Guttman-Yassky E, et al. Increasing comorbidities suggest that atopic dermatitis is a systemic disorder. J Invest Dermatol. 2017;137:18-25.
Atopic dermatitis (AD) is a disease that finally is coming of age in dermatology research. New topical agents and systemic biologic agents offer patients with AD other options for medical management. This article provides a practical review of prevention strategies and treatment guidelines for AD.
PREVENTION
Prevention strategies for AD have been largely unsuccessful in the past, which may relate to factors such as prenatal triggers.1 However, some newer interventional studies have shown some promise in AD prevention in specific settings. For example, a randomized trial of infants in the United States and United Kingdom at high risk for AD (ie, family history of atopy) reported that the AD risk was reduced by 50% when patients were treated with at least once-daily application of full-body emollients for 6 months (beginning by 3 weeks of life).2 The strategy of daily application of emollients for avoidance of AD in infants with a family history of AD is reasonable but may not offer lifetime prevention, and the benefit in children not from AD families is unknown.
Other trials to prevent AD have included usage of dust avoidance and dust covers for mattresses. This strategy showed modest benefit in reducing the incidence of atopic diatheses in the first year3 but did not gain endorsement by the most recent guidelines of the American Academy of Dermatology (AAD).4
Prenatal and postnatal (maternal and child) supplementation of Lactobacillus rhamnosus has shown promise in prevention.5 The exact regimen likely makes an impact on efficacy. An early study showed the usage of probiotics (eg, Lactobacillus reuteri) prenatally in pregnant women and postnatally in infants resulted in no reduction in occurrence of AD and possible reduction in IgE-associated AD.6 Kalliomäki et al7 demonstrated that L rhamnosus GG alone reduced AD by half in at-risk infants in a double-blind, placebo-controlled trial. On the other hand, Taylor et al8 performed a study of probiotic supplementation in which patients at high risk for AD developed higher rates of allergen sensitization. The most successful recent trial involved the randomization of 415 pregnant women to receive interventions from 36 weeks’ gestation until 3 months postpartum.9 The intervention was a randomized comparison of milk without probiotics versus a blend of probiotic milk containing L rhamnosus GG, Lactobacillus acidophilus La-5, and Bifidobacterium animalis subsp lactis Bb-12. At 6 years of age, 81 babies who consumed probiotic milk and 82 babies who consumed milk without probiotics were available for testing. The strategy caused a statistically significant reduction in AD in the complete case analysis (odds ratio, 0.48; 95% confidence interval, 0.25-0.92; P=.027; number needed to treat, 6). Sadly, other allergic diseases were not prevented in this study.9
MANAGEMENT OF AD
There currently is no cure or perfected prevention technique for AD. As a result, therapy focuses on avoiding triggers and alleviating symptoms.10 Recent guidelines from the AAD state that“[t]he ultimate judgment regarding the propriety of any specific therapy must be made by the physician and the patient in light of all the circumstances presented by the individual patient, and the known variability and biologic behavior of the disease.”11 Skin-directed therapies are the first line of treatment including emollients, gentle skin care, and topical medicaments. In AD, therapies are needed to reduce disease activity and flare severity, clear flares, and provide relief.
Parental education and written eczema action plans are recommended to help patients and parents/guardians follow recommended regimens12; Tollefson and Bruckner13 for the American Academy of Pediatrics provide an action plan to guide the care of children with atopic dermatitis that is simple, but many others exist online. The eczema action plan usually provides information on how to bathe and what to do when the skin is actively inflamed.
In 2014, a 4-part series of guidelines of care for the management of AD was published by the AAD, replacing prior guidelines.4,11,14,15 The following sections review some of the important parameters of care highlighted in these management guidelines.
Psychological Support
Appropriate psychological support for AD patients can be sought through counselors, therapists, psychiatrists, and support groups such as the National Eczema Association (https://nationaleczema.org/).
Education
Education is the leading form of medical therapy in patients with AD. Eczema schools are popular in Europe and are just beginning to form in the United States (http://tuh.templehealth.org/content/eczema_school.htm), which can be helpful to educate caregivers and patients with AD. Patient resources online and through support groups with an online presence, in-person meetings, and patient/family conventions can be helpful to AD patients. Often, an initial office visit with a dermatologist involves a review of avoidance of triggers, usage of gentle skin care including bland emollients, and therapeutic regimens for disease activity. This form of verbal education is to be paired with an eczema action plan, a written document that allows individuals to reference recommendations and share information with other caregivers.12,13,16
Emollients and Gentle Skin Care
Gentle skin care regimens, which includes the usage of synthetic cleansers with a low pH to help maintain the acidity (acid mantle) of the skin, seek to reduce irritation and have been rated as level IA (highest level) in recent AAD guidelines.14 Although bathing frequency has been emphasized in the guidelines, AD severity as reflected by SCORAD (SCORing Atopic Dermatitis) was not different for daily bathing versus twice weekly.17 The American Academy of Pediatrics recommended a skin care regimen of bathing every 2 to 3 days in lukewarm water for 10 to 15 minutes, followed by application of emollients that are fragrance free and have few preservatives.13 Topical emollients with additives such as colloidal oatmeal, avenanthramides, or ceramides can be used to enhance the skin barrier and are well tolerated in all age groups.18,19 Despite enhanced emollients, the therapy of AD still requires usage of prescription or over-the-counter TCs and/or topical calcineurin inhibitors (TCIs) in many cases.20
Topical Medication
Children have a relatively higher body surface area–to-weight ratio, allowing for greater potential absorption of topical medicaments and potential side effects from absorption. Types of vehicle, cost, site of application, and availability may impact patient and physician preference in choice of therapeutic topical agent.14
Topical Corticosteroids
Topical corticosteroids (TCs) are the mainstay of treatment for AD and have been used for more than 60 years.14,20 Topical corticosteroids provide anti-inflammatory effects on T cells, monocytes, and macrophages, producing altered cytokine activity locally. Topical corticosteroids inhibit collagen synthesis, potentially causing skin atrophy. They also inhibit IL-1, IL-2, IL-6, IFN-α, and tumor necrosis factor α.21 Topical corticosteroids are classified as class I (ultra-high potency) to class VII (low potency). In children, low-potency TCs generally are applied to the face, intertriginous areas, groin, and genitalia, and mid-potency corticosteroids are applied to the body, arms, and legs. An even higher-strength agent can be prescribed as a rescue medication in severe cases. After clearance with once- or twice-daily therapy, twice-weekly usage can benefit disease activity.22 Topical corticosteroids reduce inflammation as well as Staphylococcus aureus load through inhibition of cytokines that inhibit antimicrobial peptides. Topical corticosteroids have been endorsed as level IA evidence therapy by the AAD guidelines.14
Topical corticosteroids, particularly prolonged usage of mid- to high-potency products, have been associated with side effects such as skin atrophy, striae, telangiectases, hypopigmentation, rosacea, acneiform eruptions, focal hypertrichosis, perioral dermatitis, and acne23; potential systemic side effects include hypothalamic-pituitary-adrenal axis suppression, cataracts, glaucoma (with periocular application), Cushing syndrome, hyperglycemia, hypertension,23 and growth retardation.14 Long-term corticosteroid therapy is associated with tachyphylaxis and potential rebound of disease with discontinuation.24 Based on the potential risk of side effects with TCs, the least potent product for the shortest time needed is recommended, with special care for thin skin. Discontinuation when clearance occurs is advised. Allergy to TCs and/or vehicle ingredients such as propylene glycol should be suspected in severe unremitting cases.14 A recent registry review of children screened for contact dermatitis demonstrated that children with AD had higher sensitization to the steroid tixocortol pivalate.25
Topical Calcineurin Inhibitors
Topical calcineurin inhibitors include pimecrolimus cream 1%, which is approved for mild to moderate AD in adults and children 2 years and older, and tacrolimus ointment 0.03% and 0.1%, which are approved for moderate to severe AD in adults and children aged 2 to 15 years (0.03% formulation only). Topical calcineurin inhibitors can be used as second-line agents in AD in patients who have inadequate response to TCs or who may not be able to use TCs due to the disease site.10,13,14 Guidelines from the AAD also have endorsed TCIs as level IA evidence for steroid-sparing agents.
Concerns about the reporting of cancers and lymphomas prompted the US Food and Drug Administration to issue a black box warning on TCIs more than 10 years ago. Pimecrolimus, which has little absorption and no notable immunosuppressive effects, has been used without detrimental effect on vaccination and delayed-type hypersensitivities, but many decades of data are lacking.10,13,14,17,26-29 Topical calcineurin inhibitors can be used as steroid-sparing agents in lieu of corticosteroids in specific locations such as the face and eyelids and for long-term suppressive therapy twice weekly.30 Intermittent usage and cycling with corticosteroids is advisable,28 but usage intermittently beyond 1 year has not been evaluated.
Topical calcineurin inhibitors are recommended as effective for acute and chronic AD. Their use as maintenance therapy in adults and children, for AD recalcitrant to steroids, for AD in sensitive areas, for steroid-induced atrophy, and for long-term uninterrupted topical steroid usage carries a level IA evidence recommendation. Furthermore, the AAD guidelines have recommended TCIs as steroid-sparing agents with level IA evidence and off-label use of TCIs in children younger than 2 years with level IA evidence. Pretreatment with TCs to reduce stinging has level IIB evidence. Usage for flare prevention is level IA evidence. Routine blood monitoring of TCI-treated patients was not recommended; in fact, the AAD guidelines provided this recommendation as level IA evidence against routine laboratory monitoring of TCI-treated patients.14
Topical Antibiotics
Topical antibiotics are indicated for the therapy of impetigo and can be used in the setting of impetiginized AD in conjunction with TCs. Recent AAD guidelines suggested against routine usage of topical antistaphylococcal agents as level IA evidence.14 There is one study supporting usage of topical mupirocin in addition to TCs to heal children with eczema area and severity index scores more than 7 more rapidly in the first week of AD therapy, but in the same study, additive benefit was not demonstrated in AD beyond the first week.31 There also are data supporting usage of intranasal mupirocin adjunctively with bleach baths in patients with moderate to severe AD, which was rated as level IIB evidence in the AAD guidelines.14,32 There are limited data on the long-term utility of topical anti-infectives in AD. The risks of long-term usage could include resistance formation to agents such as mupirocin, contact dermatitis, and lack of efficacy.
Additional Therapeutics
Wet Wraps
Penetration through the stratum corneum is needed for drug activity in AD. Penetration can be enhanced using wet wrap therapy or using ointments, which produce higher relative potency.13 Wet wraps overlying a dilute topical medicament have been described as effective in AD and are recommended in AAD guidelines as level IIB evidence.14 Different wet wrap techniques can be used, including wet pajamas covered by dry pajamas or saline-soaked gauze wrapped around the affected areas and then dry gauze applied over the wet gauze. The methodology used should be tailored to the patient as well as to whether the individual is an inpatient or outpatient.
Bleach Baths
Dilute sodium hypochlorite solution 0.005% (one-quarter cup bleach in 20 gallons of water) has been demonstrated to be beneficial in reduction of disease activity in AD patients with recurrent bacterial infections.32 This simple technique in addition to intranasal mupirocin can reduce AD severity and improve quality of life and is the only ongoing S aureus therapeutic management endorsed by the AAD guidelines for the management of AD.14,32
Topical and Oral Delivery
Antihistamines
Topical antihistamines are ineffective in AD. Oral antihistamines can be used to reduce pruritus and are most effective when given as sedating agents for sleep enhancement but may be given as nonsedating agents for patients with concomitant allergic disorders such as allergic rhinoconjunctivitis. Paradoxical hyperreactivity with sedating antihistamines is not uncommon in small children, and sedating antihistamine usage should be discontinued in these instances.13 Parents of children with AD have reported giving the child antihistamines to sleep was helpful, as well as putting on creams, using special clothes (eg, all cotton), and keeping the room cool.33 There is level IIIC evidence against use of systemic antihistamines and level IIA evidence for sedating and nonsedating, according to the AAD guidelines.14
Systemic Therapeutics
Oral therapeutics range from oral antihistamines to oral antibiotics and immunosuppressive medications. Oral antibiotics (level IIB evidence) are reserved for superinfected AD, which is not easily defined for the following reasons: there is no consensus definition of superinfected AD; the majority of active AD lesions when cultured will demonstrate S aureus growth; and most AD lesions ooze, thereby creating the appearance of superinfection. In real-world practice, superinfection can be diagnosed based on the presence of pustules; furuncles; or signs of infection such as tracking erythema, tenderness, severe erosions, or maceration. Clinical judgment is always required.
The immunosuppressive medications used in AD include leukotriene inhibitors, which rarely are effective for AD.34 More effective systemic agents for AD include cyclosporine (level I to IIB evidence), azathioprine (level IIB evidence), mycophenolate mofetil (level IIIC evidence), and methotrexate (level IIB evidence). These agents are indicated for pediatric or adult patients when topical agents and/or phototherapy have failed.15 Monitoring these agents for side effects includes ongoing evaluation for renal and liver toxicity. Short courses (ie, 6 months) are preferred to minimize side effects.35
Dupilumab, an injectable AD therapy, is approved in the United States. This agent is injected every 2 weeks and binds to the IL-4Rα shared by IL-4 and IL-13. In 4 weeks of monotherapy, 85% of adult patients treated had 50% or greater clearance.36 Recently published consensus opinion from the International Eczema Council recommends assessment of a variety of factors before initiating systemic therapy including comorbid illnesses such as contact allergy, trigger avoidance, superinfection, and impact on quality of life.37
Oral Corticosteroids
Systemic corticosteroids clear patients quickly but provide no sustained improvement; in fact, many patients rebound or have tachyphylaxis. Although short-term corticosteroid usage can break the itch-scratch cycle, long-term usage is associated with osteoporosis, Cushing syndrome, and aseptic necrosis of the femoral head. Decreased linear growth will occur during therapy in children; therefore, systemic steroids are not recommended in children with AD, except for additional or comorbid conditions (eg, asthma or contact dermatitis).4
Phototherapy
Phototherapy has been recommended in the AAD guidelines as a second-line treatment after failure of first-line agents (ie, TCIs and TCs) for clearance and or maintenance and should be tailored to the patient’s skin tone by an experienced physician. Narrowband UVB phototherapy may act through the suppression of T-cell activity in the skin and possibly via suppression of staphylococcal superantigens; however, many phototherapy types have been described for AD.38,39 Usage can be effective in school-aged children and teenagers but may be limited due to school attendance. Phototherapy was graded as level IIB evidence in the AAD guidelines.15 Side effects include aggravation of AD by exposure to heat and UV light, actinic damage, tenderness, erythema, pruritus, burning, and stinging. Lentigines; skin cancers (melanoma and nonmelanoma); folliculitis; and ocular toxicity, especially cataracts, can occur.15 Children younger than 6 years will find it difficult to stand in a phototherapy booth and may be poor candidates.15,38,39
Complementary and Alternative Medicine
Complementary and alternative medicine (CAM) also has been used for AD in the United States. In a review of the 2007 National Health Interview Survey of 9417 children aged 0 to 17 years, CAM was used for AD by 0.99% of children. Some CAM techniques were associated with worsening severity of AD, including herbal therapy, vitamins, homeopathic agents, diet, and movement techniques.40 Usage of Chinese herbal medications for AD can be associated with liver toxicity.41 Only one CAM therapy—massage therapy—has some mild supportive data.42
Allergen Avoidance and Diet
Bronsnick et al43 discussed the possible benefit of prenatal and postnatal probiotics for prevention of AD, which were not supported in the AAD guidelines for management of AD4; postnatal prebiotic supplementation; and exclusive breastfeeding and/or supplementation with hydrolyzed formula in at-risk children. Elimination diets for children and mothers were not recommended. The authors found no beneficial role of supplements including vitamin D, selenium, fish oil, borage oil, and zinc sulfate.43
A National Institute of Allergy and Infectious Diseases consensus group recommended avoidance of proven but not random elimination of food allergens in AD, asthma, and/or eosinophilic esophagitis.44 Restricted maternal diet was not recommended, and breastfeeding exclusively for the first 4 to 6 months was recommended. Hydrolyzed formulas were suggested as a possible preventive strategy in at-risk infants as a breastfeeding alternative, with cost of these formulas being a problem.44
In children younger than 5 years, food allergy screening for the most common allergens (eg, milk, eggs, peanuts, wheat, soy) should be considered in children with persistent unremitting dermatitis and/or known food challenge–induced reactions.4 Conservative measures to avoid house dust mite exposure in known sensitized individuals including dust covers for pillows and mattresses may be beneficial.4,45
Emerging Therapies
Recently approved therapies include better-targeted agents that appear to have a reasonable safety profile and may fulfill unmet needs in AD care. Of these agents, crisaborole, a topical boron-based phosphodiesterase 4 inhibitor, was approved in December 2016 for mild to moderate AD in patients 2 years and older.Topically, this agent seems to be efficacious in the absence of notable carcinogenicity.46
The systemic (injectable) biologic agent dupilumab was approved in March 2017 for moderate to severe AD. Phase 3 studies in adults with AD showed excellent success in adults with moderate to severe AD.37 This agent is a monoclonal antibody targeted at blockade of the crucial atopic inflammatory triggering pathway via blockade of the IL-4A receptor site, targeting IL-4 and IL-13 activity.36,47 There are many medications in the pipeline, which Renert-Yuval and Guttman-Yassky48 review. However, an overview of the landscape demonstrates that Janus kinase (JAK) inhibitors49 and biologic medications in addition to dupilumab affecting targeted inflammatory cascades in AD are in development. In particular, the JAK inhibitors appear promising due to availability both as oral and topical agents.49
Need for Ongoing Care and Monitoring
Atopic dermatitis is a chronic inflammatory skin disorder with a genetic basis. Once initiated, the process of AD may persist throughout the patient’s life and become a systemic disorder with comorbidities including sleep disturbance, reduced quality of life, and cardiovascular disease.50 Ongoing management of AD includes topical reduction in irritants and triggers, topical medicaments, and management of pruritus and infections. At this time, emollients and irritant avoidance paired with judicious topical medicaments including TCs and second-line or site-specific (eg, eyelids) usage of TCIs or phosphodiesterase 4 inhibitors remain the backbone of therapy. Ongoing review of therapeutics for associated morbidities is underway, which may guide future therapeutic interventions into AD. The future of prevention and therapy look bright, but time will tell.
- Kelleher M, Dunn-Galvin A, Hourihane JO, et al. Skin barrier dysfunction measured by transepidermal water loss at 2 days and 2 months predates and predicts atopic dermatitis at 1 year. J Allergy Clin Immunol. 2015;135:930-935.
- Simpson EL, Chalmers JR, Hanifin JM, et al. Emollient enhancement of the skin barrier from birth offers effective atopic dermatitis prevention. J Allergy Clin Immunol. 2014;134:818-823.
- Tsitoura S, Nestoridou K, Botis P, et al. Randomized trial to prevent sensitization to mite allergens in toddlers and preschoolers by allergen reduction and education: one-year results. Arch Pediatr Adolesc Med. 2002;156:1021-1027.
- Sidbury R, Tom WL, Bergman JN, et al. Guidelines of care for the management of atopic dermatitis: section 4. prevention of disease flares and use of adjunctive therapies and approaches. J Am Acad Dermatol. 2014;71:1218-1233.
- Foolad N, Brezinski EA, Chase EP, et al. Effect of nutrient supplementation on atopic dermatitis in children: a systematic review of probiotics, prebiotics, formula, and fatty acids. JAMA Dermatol. 2013;149:350-355.
- Abrahamsson TR, Jakobsson T, Böttcher MF, et al. Probiotics in prevention of IgE-associated eczema: a double-blind, randomized, placebo-controlled trial. J Allergy Clin Immunol. 2007;119:1174-1180.
- Kalliomäki M, Salminen S, Arvilommi H, et al. Probiotics in primary prevention of atopic disease: a randomised placebo-controlled trial. Lancet. 2001;357:1076-1079.
- Taylor AL, Dunstan JA, Prescott SL. Probiotic supplementation for the first 6 months of life fails to reduce the risk of atopic dermatitis and increases the risk of allergen sensitization in high-risk children: a randomized controlled trial. J Allergy Clin Immunol. 2007;119:184-191.
- Simpson MR, Dotterud CK, Storrø O, et al. Perinatal probiotic supplementation in the prevention of allergy related disease: 6 year follow up of a randomised controlled trial. BMC Dermatol. 2015;15:13. doi:10.1186/s12895-015-0030-1.
- Carr WW. Topical calcineurin inhibitors for atopic dermatitis: review and treatment recommendations. Paediatr Drugs. 2013;15:303-310.
- Eichenfield LF, Tom WL, Chamlin SL, et al. Guidelines of care for the management of atopic dermatitis: section 1. diagnosis and assessment of atopic dermatitis. J Am Acad Dermatol. 2014;70:338-351.
- Silverberg NB. Creating an action plan for eczema patients. Cutis. 2015;96:362-363.
- Tollefson MM, Bruckner AL; Section on Dermatology. Atopic dermatitis: skin-directed management. Pediatrics. 2014;134:E1735-E1744.
- Eichenfield LF, Tom WL, Berger TG, et al. Guidelines of care for the management of atopic dermatitis: section 2. management and treatment of atopic dermatitis with topical therapies. J Am Acad Dermatol. 2014;71:116-132.
- Sidbury R, Davis DM, Cohen DE, et al; American Academy of Dermatology. Guidelines of care for the management of atopic dermatitis: section 3. management and treatment with phototherapy and systemic agents. J Am Acad Dermatol. 2014;71:327-349.
- Shi VY, Nanda S, Lee K, et al. Improving patient education with an eczema action plan: a randomized controlled trial. JAMA Dermatol. 2013;149:481-483.
- Koutroulis I, Petrova K, Kratimenos P, et al. Frequency of bathing in the management of atopic dermatitis: to bathe or not to bathe? Clin Pediatr (Phila). 2014;53:677-681.
- Fowler JF, Nebus J, Wallo W, et al. Colloidal oatmeal formulations as adjunct treatments in atopic dermatitis. J Drugs Dermatol. 2012;11:804-807.
- Fowler J Jr, Silverberg N. Active naturals have a key role in atopic dermatitis. Semin Cutan Med Surg. 2008;27:8-10.
- Eichenfield LF. Consensus guidelines in diagnosis and treatment of atopic dermatitis. Allergy. 2004;59:86-92.
- Nghiem P, Pearson G, Langley RG. Tacrolimus and pimecrolimus: from clever prokaryotes to inhibiting calcineurin and treating atopic dermatitis. J Am Acad Dermatol. 2002;46:228-241.
- Schmitt J. Commentary: eczema and cancer risk. Br J Dermatol. 2011;165:463-464.
- Abramovits W, Hung P, Tong KB. Efficacy and economics of topical calcineurin inhibitors for the treatment of atopic dermatitis. Am J Clin Dermatol. 2006;7:213-222.
- Takahashi-Ando N, Jones MA, Fujisawa S, et al. Patient-reported outcomes after discontinuation of long-term topical corticosteroid treatment for atopic dermatitis: a targeted cross-sectional survey. Drug Healthc Patient Saf. 2015;7:57-62.
- Jacob SE, McGowan M, Silverberg NB, et al. Pediatric contact dermatitis registry data on contact allergy in children with atopic dermatitis. JAMA Dermatol. 2017;153:765-770.
- Werfel T. Topical use of pimecrolimus in atopic dermatitis: update on the safety and efficacy. J Dtsch Dermatol Ges. 2009;7:739-742.
- Wahn U, Bos JD, Goodfield M, et al. Efficacy and safety of pimecrolimus cream in the long-term management of atopic dermatitis in children. Pediatrics. 2002;110(1, pt 1):E2.
- Berger TG, Duvic M, Van Voorhees AS, et al; American Academy of Dermatology Association Task Force. The use of topical calcineurin inhibitors in dermatology: safety concerns. report of the American Academy of Dermatology Association Task Force. J Am Acad Dermatol. 2006;54:818-823.
- Paller AS. Latest approaches to treating atopic dermatitis. Chem Immunol Allergy. 2012;96:132-140.
- Thaçi D, Reitamo S, Gonzalez Ensenat MA, et al. Proactive disease management with 0.03% tacrolimus ointment for children with atopic dermatitis: results of a randomized, multicentre, comparative study. Br J Dermatol. 2008;159:1348-1356.
- Gong JQ, Lin L, Lin T, et al. Skin colonization by Staphylococcus aureus in patients with eczema and atopic dermatitis and relevant combined topical therapy: a double-blind multicentre randomized controlled trial. Br J Dermatol. 2006;155:680-687.
- Huang JT, Abrams M, Tlougan B, et al. Treatment of Staphylococcus aureus colonization in atopic dermatitis decreases disease severity. Pediatrics. 2009;123:E808-E814.
- Reid P, Lewis-Jones MS. Sleep difficulties and their management in preschoolers with atopic eczema. Clin Exp Dermatol. 1995;20:38-41.
- Silverberg NB, Paller AS. Leukotriene receptor antagonists are ineffective for severe atopic dermatitis. J Am Acad Dermatol. 2004;50:485-486.
- Wolverton SE. Comprehensive Dermatologic Drug Therapy. 3rd ed. New York, NY: Elsevier Saunders; 2013.
- Beck LA, Thaçi D, Hamilton JD, et al. Dupilumab treatment in adults with moderate-to-severe atopic dermatitis. N Engl J Med. 2014;371:130-139.
- Simpson EL, Bruin-Weller M, Flohr C, et al. When does atopic dermatitis warrant systemic therapy? recommendations from an expert panel of the International Eczema Council [published online August 10, 2017]. J Am Acad Dermatol. doi:10.1016/j.jaad.2017.06.042.
- Veith W, DeLeo V, Silverberg N. Medical phototherapy in childhood skin diseases. Minerva Pediatr. 2011;63:327-333.
- Song E, Reja D, Silverberg N, et al. Phototherapy: kids are not just little people. Clin Dermatol. 2015;33:672-680.
- Silverberg JI, Lee-Wong M, Silverberg NB. Complementary and alternative medicines and childhood eczema: a US population-based study. Dermatitis. 2014;25:246-254.
- Stickel F, Shouval D. Hepatotoxicity of herbal and dietary supplements: an update. Arch Toxicol. 2015;89:851-865.
- Schachner L, Field T, Hernandez-Reif M, et al. Atopic dermatitis symptoms decreased in children following massage therapy. Pediatr Dermatol. 1998;15:390-395.
- Bronsnick T, Murzaku EC, Rao BK. Diet in dermatology: part I. atopic dermatitis, acne, and nonmelanoma skin cancer. J Am Acad Dermatol. 2014;71:1039.e1-1039.e12.
- Boyce JA, Assa’ad A, Burks AW, et al. Guidelines for the diagnosis and management of food allergy in the United States: summary of the NIAID-sponsored expert panel report. Nutr Res. 2011;31:61-75.
- Silverberg NB, Lee-Wong M, Yosipovitch G. Diet and atopic dermatitis. Cutis. 2016;97:227-232.
- Hanifin JM, Chan SC, Cheng JB, et al. Type phosphodiesterase inhibitors have clinical and in vitro anti-inflammatory effects in atopic dermatitis. J Invest Dermatol. 1996;107:51-56.
- Boguniewicz M, Leung DY. Targeted therapy for allergic diseases: at the intersection of cutting-edge science and clinical practice. J Allergy Clin Immunol. 2015;135:354-356.
- Renert-Yuval Y, Guttman-Yassky E. Systemic therapies in atopic dermatitis: the pipeline. Clin Dermatol. 2017;35:387-397.
- Damsky W, King BA. JAK inhibitors in dermatology: the promise of a new drug class. J Am Acad Dermatol. 2017;76:736-744.
- Brunner PM, Silverberg JI, Guttman-Yassky E, et al. Increasing comorbidities suggest that atopic dermatitis is a systemic disorder. J Invest Dermatol. 2017;137:18-25.
Practice Points
- Prevention of atopic dermatitis is desired in high-risk settings (ie, 1 or more relatives with atopy).
- Emollient therapy from early infancy has been described as one method.
- Other forms of disease prevention have not yet been adequately developed.
Clinical Pearl: Mastering the Flexible Scalpel Blade With the Banana Practice Model
The flexible scalpel blade (FSB) is a 2-sided handheld razor blade that serves as a pivotal instrument in certain dermatologic procedures. Its unrivaled sharpness1 permits pinpoint precision for shave biopsies, excisions of superficial lesions,2 scar contouring, and harvesting of split-thickness skin grafts.3 Given its flexibility and long edge, considerable manual dexterity and skill are required to maximize its full potential.
Practice Gap
Prior to practicing on live patients, students on clinical rotation would benefit from in vitro skin simulators to practice correct hand position, FSB control for concave and convex surface cutting, and safety. Prior practice models have included mannequins, tomatoes, and eggplants.4,5 Here, the authors recommend the use of a banana (genus Musa). In addition to its year-round availability, economic feasibility, simplicity, and portability, the banana has colored skin that well represents the epidermis, dermis, and subcutaneous tissue, allowing for visual feedback. Furthermore, its contour irregularities simulate convexities and concavities for various anatomic locations. Although the firmness of a yellow-green banana provides immediate tissue feedback, the softness and pliability of a ripe banana simulates the consistency of older skin and the use of appropriate traction.
Tools
To begin, one simply requires a marking pen, banana, and razor blade. Various shapes, including a circle, ellipse, rectangle, trapezoid, triangle, and multilobed lesion are demarcated by students or attendings (Figure 1).
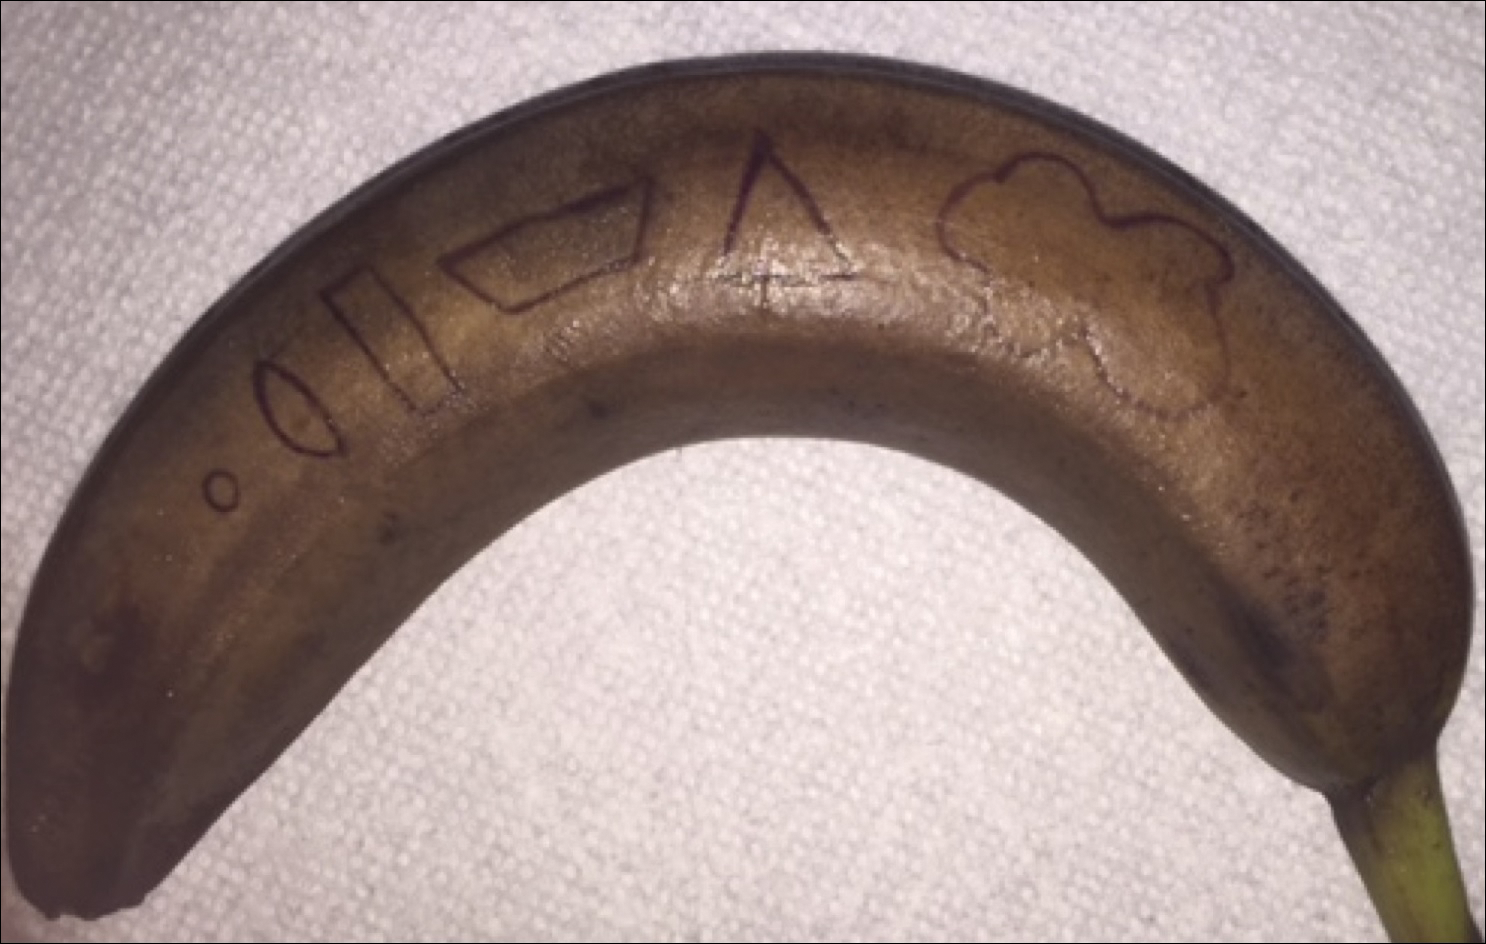
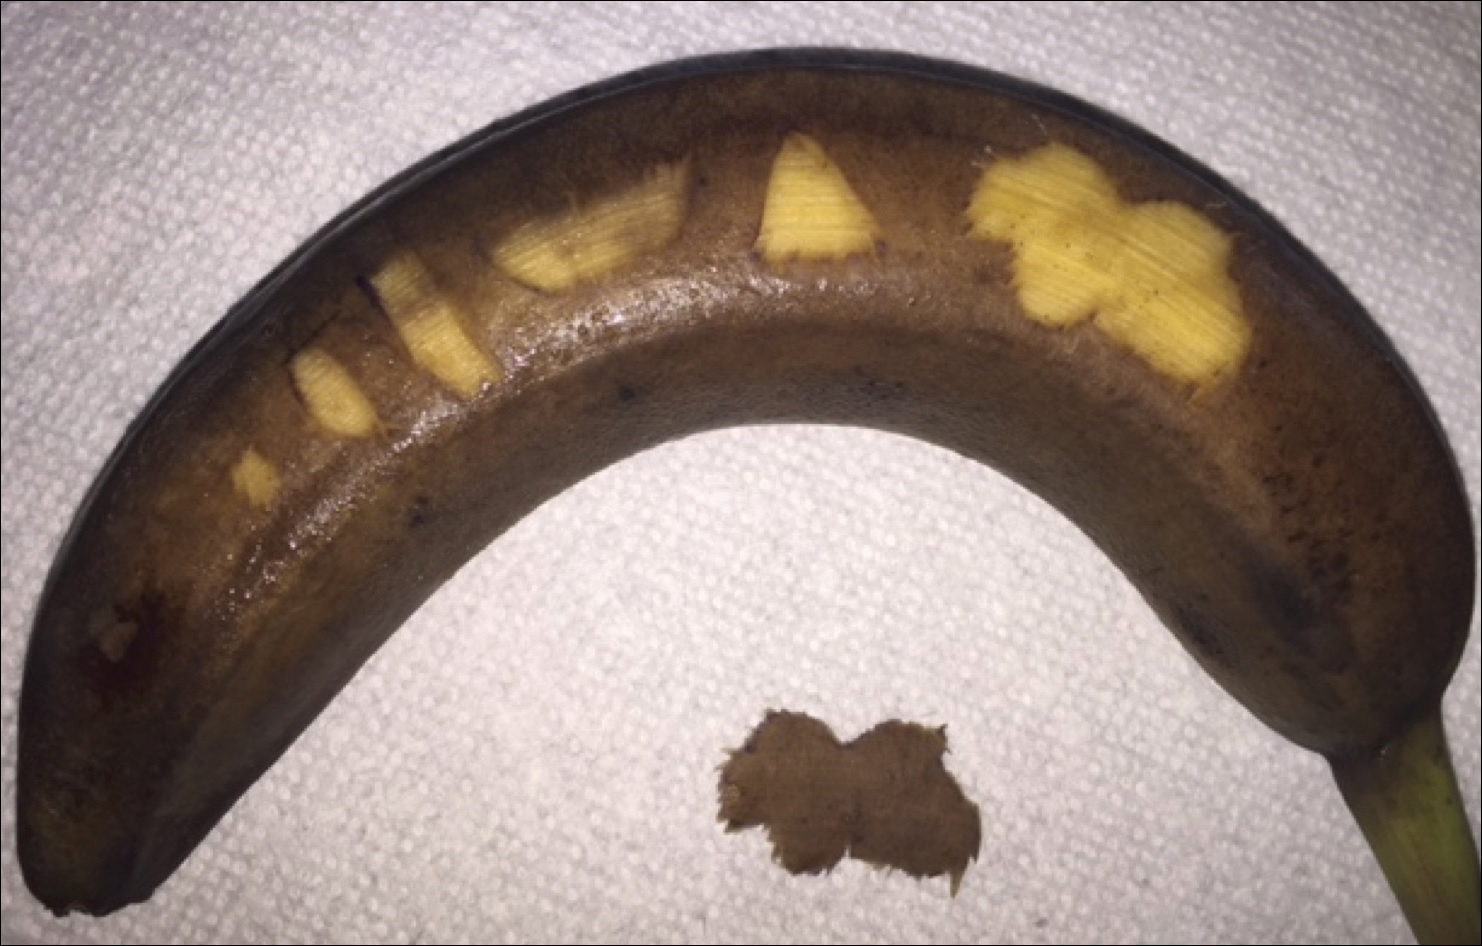
The Technique
To handle the FSB, one can hold the lateral edges of the blade between the thumb and index finger or between the thumb and middle finger. The thumb and index finger position allows for additional flexible working space and visualization, increased traction by the remaining 3 fingers, and greater ease of removal of lesions with considerable height. The thumb and middle finger hold allows for versatile use of the index finger of the same hand for stabilizing the center of the blade, fixing the tissue on the FSB while it is removed, and sliding the specimen off the FSB. It is important to maintain a fixed distance from the blade to the metacarpals at all times to ensure smooth advancement of the blade and visualization. Beginners can lift the pinky finger of the hand holding the FSB and move the finger up and down to control the angle of the blade.
Practice Implications
Generally, we utilize various techniques of shaving using the FSB. We approach the target lesion 2 to 3 mm from the marked location and slide parallel to the skin surface and perpendicular to the lesion until the epidermis is penetrated. Second, we advance the blade toward the lesion with careful attention paid to the perimeter of the lesion and the points of contact of the FSB. For lesions with hardier consistencies, a sawing motion of the blade is employed, which also requires controlled tilting of the wrist to maintain an even depth and smooth bevel. To cut deeper, flexing the FSB with lateral pressure is helpful. More shallow lesions require the instrument to be flatter and less bowed. When finishing the shave, it is important to start angling the blade upward early, either at the center of the targeted lesion or 2 to 3 mm before the demarcated edge of the skin graft, while applying traction away from the lesion and slight downward pressure with the nondominant hand.
For larger lesions, the perimeter may be more difficult to remove precisely and can be achieved by rotating the blade around the lesion with focus on one point of contact of the FSB to cut and glide through the tissue’s perimeter. To achieve a more exact wound edge and to preclude jagged borders, a No. 15 blade can be used to score the perimeter very superficially to the papillary dermis prior to shave removal. The main disadvantage, however, is that the beveled edge is removed.
In summary, the FSB is an exceptional tool for biopsies, tumor removal, scar contouring, and split-thickness skin grafts. Through the banana practice model, one can attain fine control and reap the benefits of the FSB after meticulous and dedicated training.
- Awadalla B, Hexsel C, Goldberg LH. The sharpness of blades used in dermatologic surgery. Dermatol Surg. 2016;42:105-107.
- Vergilis-Kalner IJ, Goldberg LH, Firoz B, et al. Horizontal excision of in situ epidermal tumors using a flexible blade. Dermatol Surg. 2011;37:234-236.
- Hexsel CL, Loosemore M, Goldberg LH, et al. Postauricular skin: an excellent donor site for split-thickness skin grafts for the head, neck, and upper chest. Dermatol Surg. 2015;41:48-52.
- Chen TM, Mellette JR. Surgical pearl: tomato—an alternative model for shave biopsy training. J Am Acad Dermatol. 2006;54:517-518.
- Wang X, Albahrani Y, Pan M, et al. Skin simulators for dermatological procedures. Dermatol Online J. 2015;21. pii:13030/qt33j6x4nx.
The flexible scalpel blade (FSB) is a 2-sided handheld razor blade that serves as a pivotal instrument in certain dermatologic procedures. Its unrivaled sharpness1 permits pinpoint precision for shave biopsies, excisions of superficial lesions,2 scar contouring, and harvesting of split-thickness skin grafts.3 Given its flexibility and long edge, considerable manual dexterity and skill are required to maximize its full potential.
Practice Gap
Prior to practicing on live patients, students on clinical rotation would benefit from in vitro skin simulators to practice correct hand position, FSB control for concave and convex surface cutting, and safety. Prior practice models have included mannequins, tomatoes, and eggplants.4,5 Here, the authors recommend the use of a banana (genus Musa). In addition to its year-round availability, economic feasibility, simplicity, and portability, the banana has colored skin that well represents the epidermis, dermis, and subcutaneous tissue, allowing for visual feedback. Furthermore, its contour irregularities simulate convexities and concavities for various anatomic locations. Although the firmness of a yellow-green banana provides immediate tissue feedback, the softness and pliability of a ripe banana simulates the consistency of older skin and the use of appropriate traction.
Tools
To begin, one simply requires a marking pen, banana, and razor blade. Various shapes, including a circle, ellipse, rectangle, trapezoid, triangle, and multilobed lesion are demarcated by students or attendings (Figure 1).
The Technique
To handle the FSB, one can hold the lateral edges of the blade between the thumb and index finger or between the thumb and middle finger. The thumb and index finger position allows for additional flexible working space and visualization, increased traction by the remaining 3 fingers, and greater ease of removal of lesions with considerable height. The thumb and middle finger hold allows for versatile use of the index finger of the same hand for stabilizing the center of the blade, fixing the tissue on the FSB while it is removed, and sliding the specimen off the FSB. It is important to maintain a fixed distance from the blade to the metacarpals at all times to ensure smooth advancement of the blade and visualization. Beginners can lift the pinky finger of the hand holding the FSB and move the finger up and down to control the angle of the blade.
Practice Implications
Generally, we utilize various techniques of shaving using the FSB. We approach the target lesion 2 to 3 mm from the marked location and slide parallel to the skin surface and perpendicular to the lesion until the epidermis is penetrated. Second, we advance the blade toward the lesion with careful attention paid to the perimeter of the lesion and the points of contact of the FSB. For lesions with hardier consistencies, a sawing motion of the blade is employed, which also requires controlled tilting of the wrist to maintain an even depth and smooth bevel. To cut deeper, flexing the FSB with lateral pressure is helpful. More shallow lesions require the instrument to be flatter and less bowed. When finishing the shave, it is important to start angling the blade upward early, either at the center of the targeted lesion or 2 to 3 mm before the demarcated edge of the skin graft, while applying traction away from the lesion and slight downward pressure with the nondominant hand.
For larger lesions, the perimeter may be more difficult to remove precisely and can be achieved by rotating the blade around the lesion with focus on one point of contact of the FSB to cut and glide through the tissue’s perimeter. To achieve a more exact wound edge and to preclude jagged borders, a No. 15 blade can be used to score the perimeter very superficially to the papillary dermis prior to shave removal. The main disadvantage, however, is that the beveled edge is removed.
In summary, the FSB is an exceptional tool for biopsies, tumor removal, scar contouring, and split-thickness skin grafts. Through the banana practice model, one can attain fine control and reap the benefits of the FSB after meticulous and dedicated training.
- Awadalla B, Hexsel C, Goldberg LH. The sharpness of blades used in dermatologic surgery. Dermatol Surg. 2016;42:105-107.
- Vergilis-Kalner IJ, Goldberg LH, Firoz B, et al. Horizontal excision of in situ epidermal tumors using a flexible blade. Dermatol Surg. 2011;37:234-236.
- Hexsel CL, Loosemore M, Goldberg LH, et al. Postauricular skin: an excellent donor site for split-thickness skin grafts for the head, neck, and upper chest. Dermatol Surg. 2015;41:48-52.
- Chen TM, Mellette JR. Surgical pearl: tomato—an alternative model for shave biopsy training. J Am Acad Dermatol. 2006;54:517-518.
- Wang X, Albahrani Y, Pan M, et al. Skin simulators for dermatological procedures. Dermatol Online J. 2015;21. pii:13030/qt33j6x4nx.