User login
Early phase III data positive for adalimumab biosimilar, for both psoriasis and PsA
MADRID – To date, an adalimumab biosimilar has proven itself in a large, phase III trial of patients with psoriasis, including a subset with mild to moderate psoriatic arthritis (PsA).
The biosimilar, known as CHS-1420, cleared psoriatic plaques and improved health-related quality of life just as well as adalimumab after 12 weeks of treatment, Barbara Finck, MD, said at the European Congress of Rheumatology. It also suppressed high-sensitivity C-reactive protein (CRP) as well as the originator molecule, she said.
Dr. Finck, the chief medical officer of Coherus Biosciences, the developer of CHS-1420, reported results from the first 16-week phase of the 48-week study. Data are still to come on a 6-week period during which half those taking adalimumab switched to CHS-1420 in a blinded fashion, and 26 weeks of open-label CHS-1420 for all patients.
The study’s primary endpoint was a 75% reduction in the Psoriasis Area and Severity Index (PASI) score (PASI 75) Two additional endpoints were evaluated in patients with PsA: change in the Health Assessment Questionnaire-Disability Index (HAQ-DI) and changes in CRP.
Dr. Finck bemoaned the lack of the clinical rheumatologic endpoint, tender and swollen joint count. “I advocated for this but was unable to convince our dermatology colleagues” to conduct this exam, she said. “I think we have a ways to go to educate our colleagues in this regard.”
The study comprised 545 patients with mild to moderate psoriasis; of these, 127 had PsA. They received subcutaneous injections of either CHS-1420 or adalimumab at identical doses (80 mg at week 1, followed by 40 mg every other week). They were a mean of 44 years o
_web.jpg)
In the entire study population, treatment with CHS-1420 and adalimumab followed almost identical response curves. By week 4, 22% of the CHS-1420 group and 20% of the adalimumab group had reached a PASI75 response. By week 8, those numbers were 57% and 61%, respectively, and by week 12, they were 69% and 72% – not significantly different.
Response was similar in the subgroup of PsA patients: By week 12, 82% of the CHS-1420 group and 77% of the adalimumab group had reached a PASI 75. PsA patients also responded equally well to both medications on the HAQ-DI by week 12. At baseline, the mean HAQ-DI was about 1 in each group. At 12 weeks, it was reduced by about half a point in both groups. High-sensitivity CRP decreased similarly in the CHS-1420 and adalimumab groups as well (reductions of 8.9 mg/L and 6.3 mg/L, respectively).
Adalimumab, a tumor necrosis factor blocker, is a highly immunogenic molecule, and as such, many patients developed antibodies to both it and to CHS-1420. By week 12, 84% of both treatment groups had developed anti-drug antibodies and 32%, neutralizing antibodies. Among those with PsA, 82% taking CHS-1420 and 88% of those taking adalimumab developed antidrug antibodies. Neutralizing antibodies developed in 33% and 30%, respectively. Neither of these differences was statistically significant.
Other adverse events were similar, Dr. Finck noted. These included nasopharyngitis (9% of both groups), upper respiratory tract infection (6%), injection site reaction (4%), headache (3%), and worsening of psoriasis (1% for CHS-1420, and 3% for adalimumab).
If the switching study data are similarly positive, Coherus expects to file a Biologics License Application with the Food and Drug Administration in early 2018, Dr. Finck said.
[email protected]
On Twitter @Alz_gal
MADRID – To date, an adalimumab biosimilar has proven itself in a large, phase III trial of patients with psoriasis, including a subset with mild to moderate psoriatic arthritis (PsA).
The biosimilar, known as CHS-1420, cleared psoriatic plaques and improved health-related quality of life just as well as adalimumab after 12 weeks of treatment, Barbara Finck, MD, said at the European Congress of Rheumatology. It also suppressed high-sensitivity C-reactive protein (CRP) as well as the originator molecule, she said.
Dr. Finck, the chief medical officer of Coherus Biosciences, the developer of CHS-1420, reported results from the first 16-week phase of the 48-week study. Data are still to come on a 6-week period during which half those taking adalimumab switched to CHS-1420 in a blinded fashion, and 26 weeks of open-label CHS-1420 for all patients.
The study’s primary endpoint was a 75% reduction in the Psoriasis Area and Severity Index (PASI) score (PASI 75) Two additional endpoints were evaluated in patients with PsA: change in the Health Assessment Questionnaire-Disability Index (HAQ-DI) and changes in CRP.
Dr. Finck bemoaned the lack of the clinical rheumatologic endpoint, tender and swollen joint count. “I advocated for this but was unable to convince our dermatology colleagues” to conduct this exam, she said. “I think we have a ways to go to educate our colleagues in this regard.”
The study comprised 545 patients with mild to moderate psoriasis; of these, 127 had PsA. They received subcutaneous injections of either CHS-1420 or adalimumab at identical doses (80 mg at week 1, followed by 40 mg every other week). They were a mean of 44 years o
In the entire study population, treatment with CHS-1420 and adalimumab followed almost identical response curves. By week 4, 22% of the CHS-1420 group and 20% of the adalimumab group had reached a PASI75 response. By week 8, those numbers were 57% and 61%, respectively, and by week 12, they were 69% and 72% – not significantly different.
Response was similar in the subgroup of PsA patients: By week 12, 82% of the CHS-1420 group and 77% of the adalimumab group had reached a PASI 75. PsA patients also responded equally well to both medications on the HAQ-DI by week 12. At baseline, the mean HAQ-DI was about 1 in each group. At 12 weeks, it was reduced by about half a point in both groups. High-sensitivity CRP decreased similarly in the CHS-1420 and adalimumab groups as well (reductions of 8.9 mg/L and 6.3 mg/L, respectively).
Adalimumab, a tumor necrosis factor blocker, is a highly immunogenic molecule, and as such, many patients developed antibodies to both it and to CHS-1420. By week 12, 84% of both treatment groups had developed anti-drug antibodies and 32%, neutralizing antibodies. Among those with PsA, 82% taking CHS-1420 and 88% of those taking adalimumab developed antidrug antibodies. Neutralizing antibodies developed in 33% and 30%, respectively. Neither of these differences was statistically significant.
Other adverse events were similar, Dr. Finck noted. These included nasopharyngitis (9% of both groups), upper respiratory tract infection (6%), injection site reaction (4%), headache (3%), and worsening of psoriasis (1% for CHS-1420, and 3% for adalimumab).
If the switching study data are similarly positive, Coherus expects to file a Biologics License Application with the Food and Drug Administration in early 2018, Dr. Finck said.
[email protected]
On Twitter @Alz_gal
AT THE EULAR 2017 CONGRESS
Key clinical point:
Major finding: By week 12, 69% of those who received CHS-1420 and 72% of those who received adalimumab had reached a PASI75, response rates that were not significantly different.
Data source: The phase III trial randomized 545 patients with psoriasis, including 127 with PsA, to treatment with adalimumab or the biosimilar.
Disclosures: Dr. Finck is chief medical officer of Coherus Biosciences, which is developing CHS-1420.

Endometriomas: Classification and surgical management
Related article:
Endometriosis: Expert answers to 7 crucial questions on diagnosis
Etiology
Endometriomas are extensively described in the literature, and their origin is the subject of several theories. In 1921, Sampson noted luteal membrane and ovarian epithelial tissues within endometriomas and was the first to indicate that endometriomas may result from the invasion of functional cysts by endometrial tissue.2,4,5 In 1979, Czernobilsky and Morris6 found endometrial and oviduct-like epithelium in ovarian endometriosis and concluded that ovarian tissue may be a common histologic precursor. Several other authors subsequently have reported finding different types of tissue within ovarian endometriomas, and not all of these chocolate cysts showed histologic evidence of endometriosis.4,7,8
Read about the classification of endometriomas
Disease classification
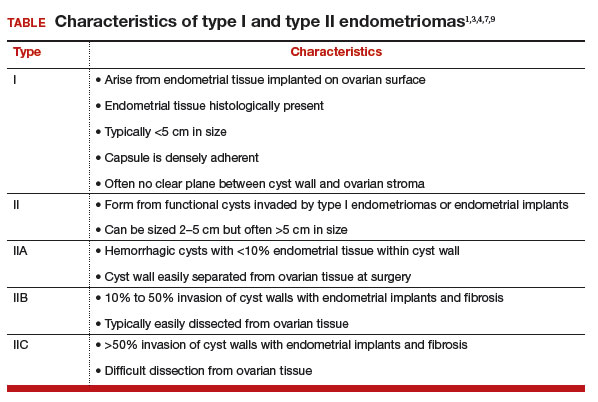
Our classification system identifies 2 types of endometriomas on the basis of their etiologies and characteristics. Type I, which arise from endometrial tissue implanted on the ovarian surface, are also called true endometriomas. Invagination of cortex and subsequent hemorrhage from endometrial tissue result in cyst formation. Endometrial tissue (endometrial stroma and glands) is histologically present in all type I endometriomas.1,4,9 These endometriomas usually are small (<5 cm in diameter) and have a densely adherent fibrous capsule.4 Often, there is no clear plane between cyst wall and ovarian stroma.3
Type II endometriomas arise from functional cysts involved in or invaded by cortical or pelvic side-wall endometrial implants or by type I endometriomas. Type II endometriomas are subclassified by the extent of endometrial implant involvement in the cyst wall. Type IIA endometriomas are hemorrhagic cysts with less than 10% of endometrial tissue within the cyst wall. Similar to the functional cysts from which they originate, type IIA endometriomas have a cyst wall that is separated easily from ovarian tissue during surgery.4,7,9 Although type II endometriomas tend to be larger than their type I counterparts, in some cases they are identified at an early stage of 2 to 5 cm. Endometriomas larger than 5 cm are almost always type II.4
Type IIB and IIC endometriomas have endometrial implants and fibrosis within their cyst walls, with progressively more endometrial invasion in type IIC endometriomas (>50%) than in type IIB (10% to 50%). Consequently, type IIB cysts are relatively easy to dissect from ovarian tissue, except adjacent to an endometriotic area where the cyst densely adheres to the ovarian stroma. In type IIC, endometrial tissue more extensively penetrates the capsule, making dissection of diseased tissue from the ovarian stroma more difficult; in fact, separating type IIC cyst wall from ovarian stroma can be as challenging as excising a type I endometrioma.7 In most cases, a type IIC cyst is attached by adhesions and fibrosis to the pelvic side wall or uterus and ruptures during mobilization (TABLE).
Related article:
Imaging the endometrioma and mature cystic teratoma
Presentation and diagnosis
Almost all patients with an endometrioma concurrently have peritoneal endometriosis, which is characterized by dysmenorrhea, dyspareunia, chronic pelvic pain, infertility, and, in some cases, gastrointestinal or genitourinary dysfunction.1 Pelvic examination may reveal an adnexal mass that is an endometrioma, or an endometrioma may appear on imaging obtained in a pelvic pain or infertility work-up. Given its 73% sensitivity, 94% specificity, safety, and low cost, transvaginal ultrasonography is the preferred imaging modality for endometrioma.3 The characteristic ultrasonographic appearance is that of a round, homogeneous, fluid-filled mass with low-level echoes.1 Magnetic resonance imaging is appropriate when a more sensitive imaging modality is indicated, as for a patient with risk factors for malignancy.3,10–12
Read about the surgical management of endometriomas
Surgical management
Indications for surgical excision of endometriomas include pelvic pain, infertility, and prevention and diagnosis of malignancy. Endometriomas may be excised prior to use of assisted reproductive technology.13–15 Medical therapy, such as oral contraceptives, can be used to reduce the size of endometriomas but does not improve fertility.3 Certain ovarian cancers are more common in women with endometriosis, and ovarian tumors are thought to develop in about 1% of ovarian endometriosis cases.1,12 Therefore, endometrioma excision may reduce the risk of malignancy. As with other ovarian cysts, large endometriomas may be excised to reduce the risks of rupture and torsion.
Approach
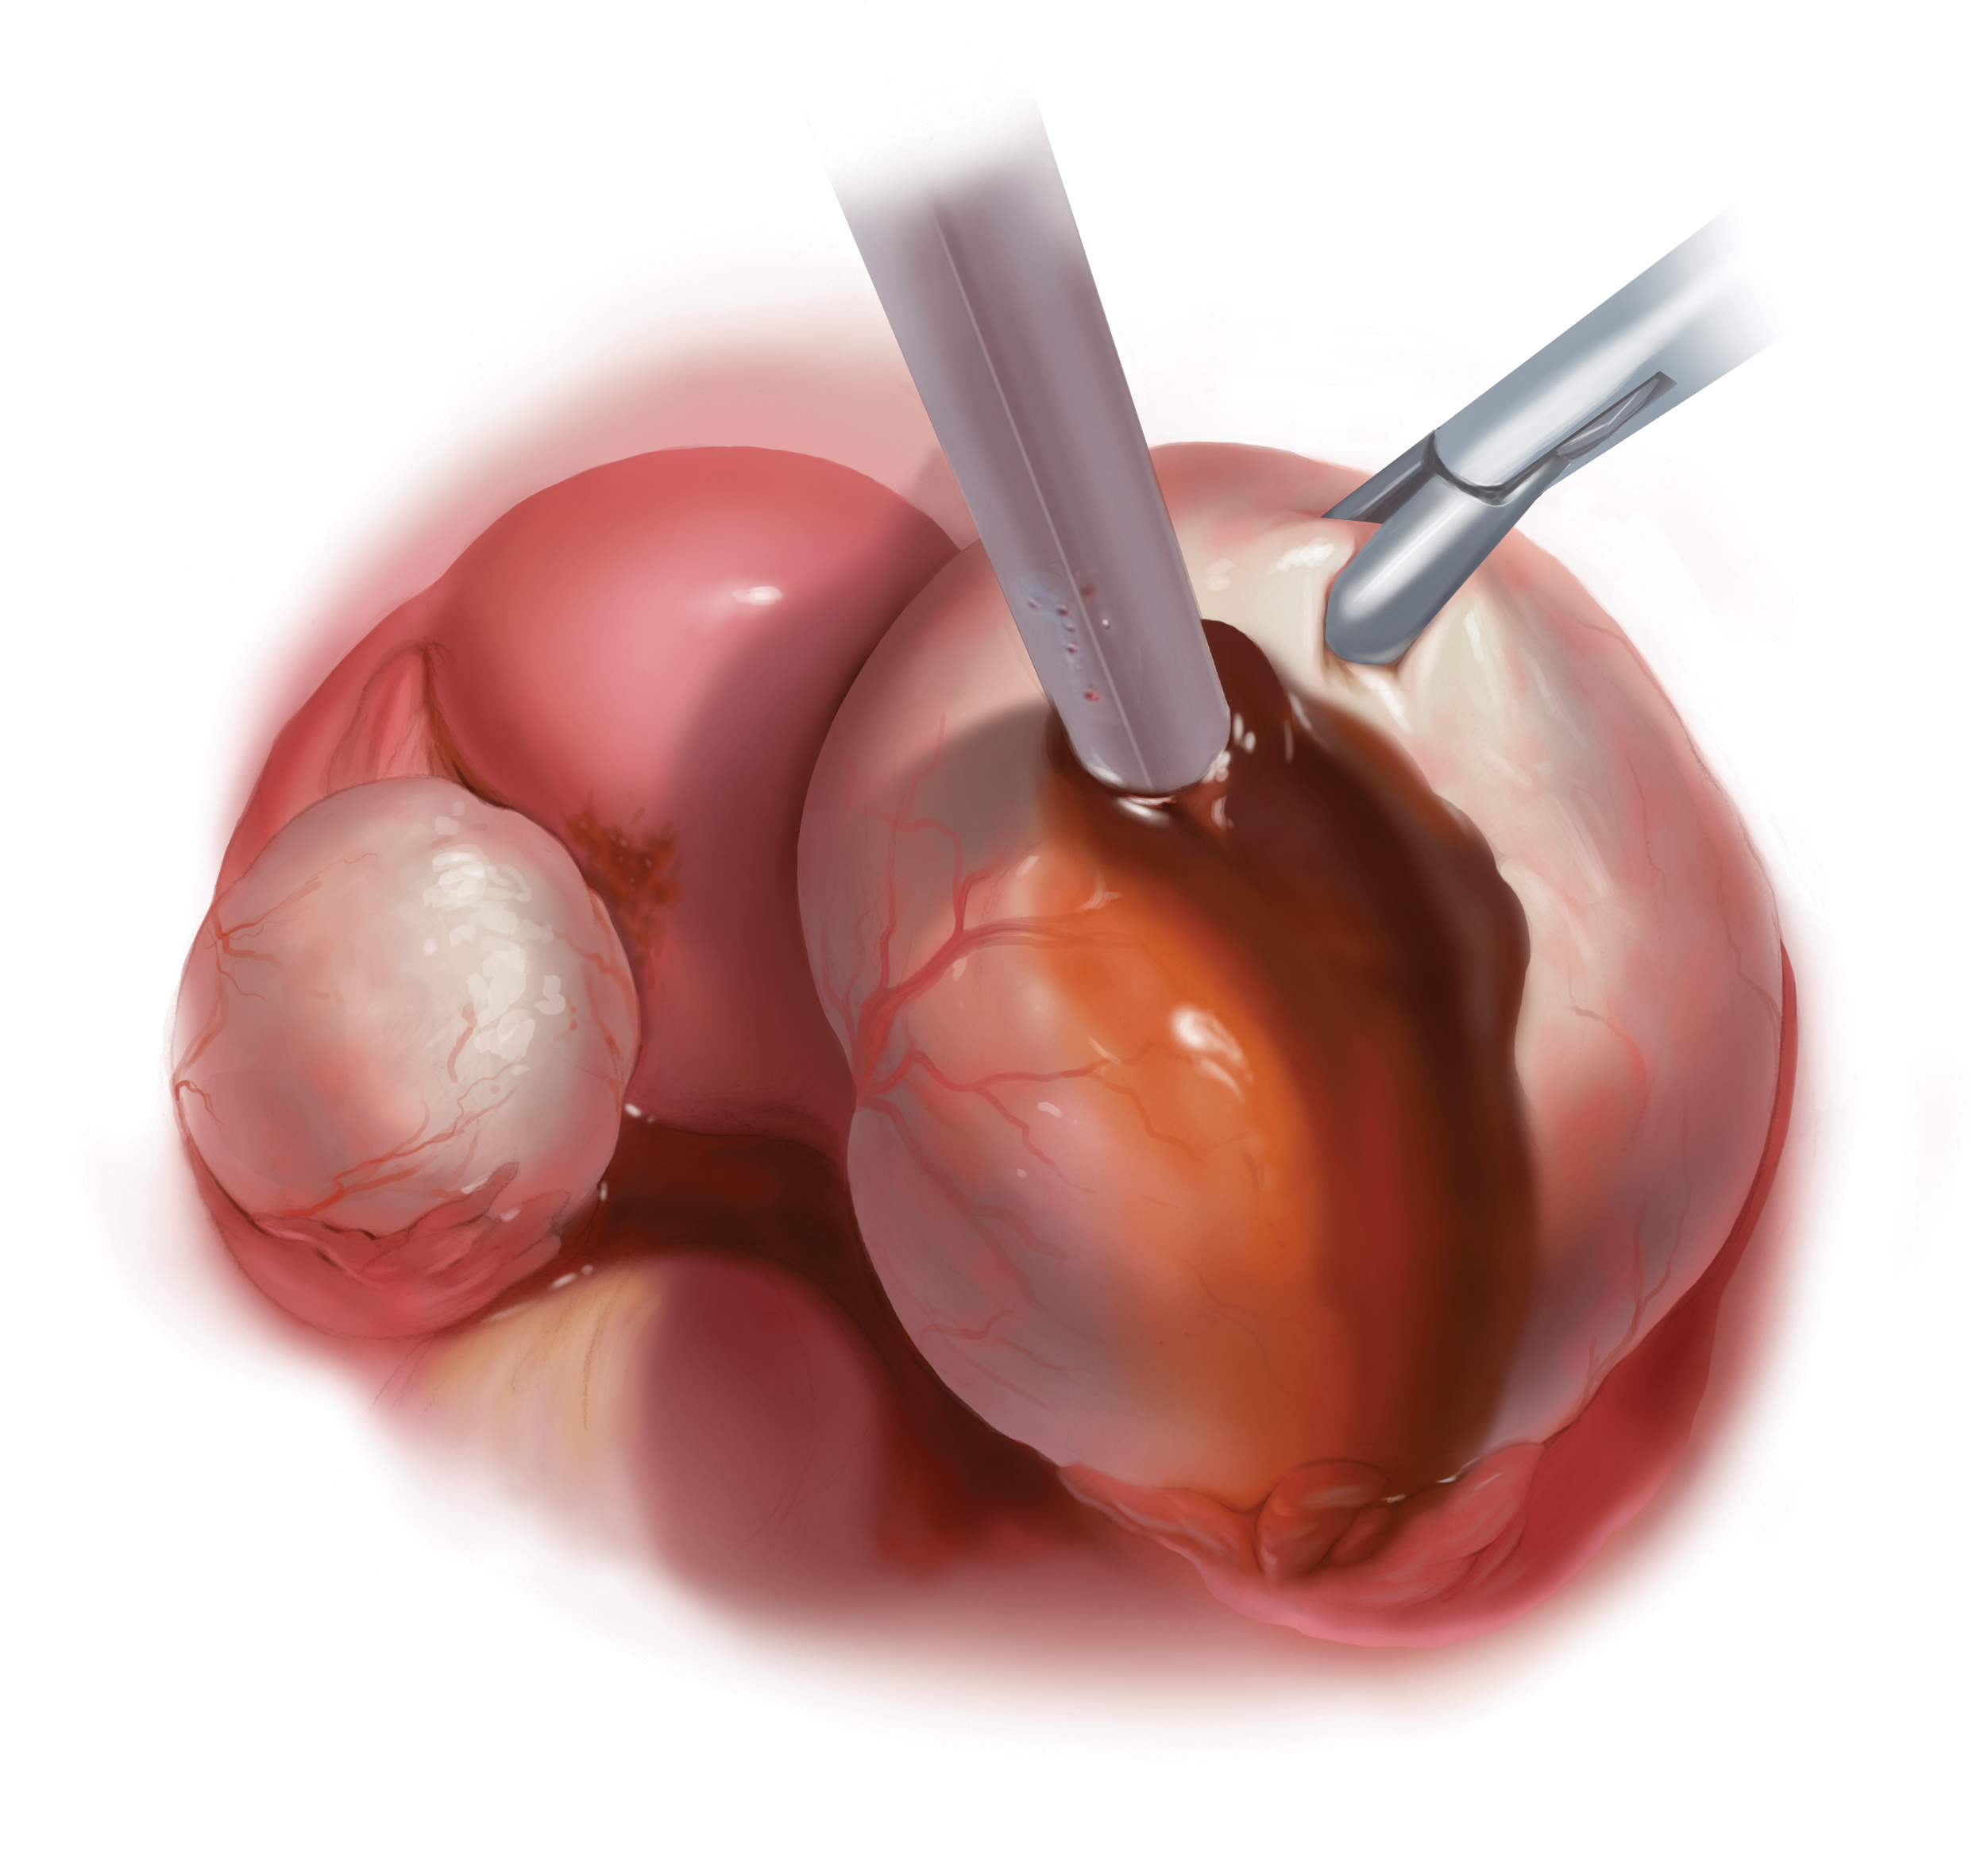
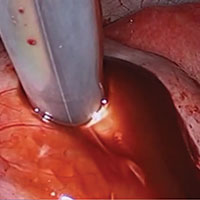
Laparoscopy is the preferred approach for endometrioma excision. Controversy exists regarding the ideal procedure: complete excision (with stripping of the cyst capsule) or drainage and ablation of the cyst wall. Compared with drainage and ablation, excision reduces recurrence of endometriomas; relieves dysmenorrhea, dyspareunia, pelvic pain, and other symptoms; and improves fertility.13,16 The recurrence rate may be as low as 5.8% with complete excision but is 90% with simple transvaginal aspiration.17,18 If not performed properly, however, cyst capsule stripping may damage nearby ovarian stroma and decrease the ovarian reserve.14 Some authors have advocated combining excision and ablation—performing cystectomy until there is no longer a clear plane between capsule and ovarian stroma and then ablating any remaining endometrial tissue.8
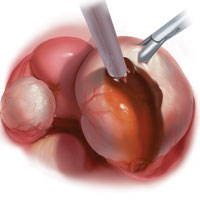
With type I and IIC endometriomas, we have seen the endometrial cyst wall infiltrating the ovarian stroma so deeply there is not always a definable plane. By contrast, type IIA and IIB endometriomas typically have a plane between the cyst wall and the ovarian cortex. In type II endometriomas, endometrial implants on the ovarian cortex infiltrate the plane of the cyst wall such that the juxtaposing lipomatous follicular cyst detaches with minimal intraoperative traction. Portions of type II endometriomas containing fibrosis and adhesions may become more difficult to peel off the cyst wall. For most endometriomas, at least 1 spot is difficult to peel off the ovary, and extra care must be taken at the hilum of ovary to avoid excising healthy ovarian cortex.4,5,7,8
Our surgical approach accounts for the described variations in type I and II endometriomas. Endometrial contents often spill as the endometrioma is dissected off neighboring structures. When possible, endometriomas should be aspirated and irrigated prior to cystectomy to avoid seeding the pelvis and abdomen with spilled endometriotic contents. We use hydrodissection, the injection of dilute vasopressin with a laparoscopic needle, to create a plane between cyst wall and ovarian stroma and strip the cyst capsule with laparoscopic graspers. Type I endometriomas adhere densely to the ovary. Given the presence of fibrosis and adhesions, the cyst is excised in a piecemeal fashion. Care is taken to remove any endometrial implants from the ovary while preserving as much of the ovarian tissue as possible.1
Type II endometriomas are larger cysts originating from the invasion of endometrial implants or type I endometrioma into functional cysts. The difficulty of capsule excision varies according to the extent of endometrial invasion. Type IIA endometriomas contain less than 10% endometrial tissue within the cyst capsule. Thus, the standard ovarian cystectomy stripping technique is successful in removing more than 90% of the cyst capsule. Special care is taken in stripping the residual small portion that involves the endometrial glands and stroma and adheres densely to the ovary.
The larger proportion of endometrial tissue present in type IIB and IIC endometriomas degrades the plane between the cyst capsule and the ovarian stroma, making excision more difficult. Similar to the type I excision, a piecemeal approach is often necessary. If complete stripping of the cyst capsule would result in extensive loss of healthy ovarian tissue, then electrocautery, plasma energy, or laser ablation can be selectively used to destroy focal areas of endometrial invasion. Complete ablation may be difficult, as the endometrioma wall can be up to 5 mm thick.19 For these thick-walled endometriomas, we recommend excision (vs ablation), which lowers the risk of endometrioma recurrence.
Related article:
Endometriosis and pain: Expert answers to 6 questions targeting your management options
- Endometriomas are common adnexal masses in women affected by endometriosis and may exacerbate pelvic pain and impair fertility. Classification of endometriomas into type I and type II,depending on their etiology and characteristics, can guide minimally invasive surgical management.
- Type I endometriomas arise from invagination of endometrial implants on the ovarian cortex, resulting in dense fibrosis and adhesions. These lesions typically require piecemeal excision in order to completely remove the cyst capsule.
- Type II endometriomas result from invasion of endometrial tissue into preexisting functional cysts and are further subclassified by the proportion of cyst capsule containing endometrial tissue (IIA <10%, IIB 10% to 50%, IIC >50%).
- The difficulty of excising type II endometriomas correlates with the degree of endometrial invasion, with type IIA being relatively straightforward and type IIC being as challenging and piecemeal as type I.
- We generally favor complete excision rather than ablation of the cyst capsule, except for when excision would result in an unacceptable loss of healthy ovarian tissue.
Conclusion
Endometriomas, common adnexal masses in women affected by endometriosis, may exacerbate pelvic pain and impair fertility. Gynecologists should be prepared to excise endometriomas completely and exercise care in preserving as much of the ovarian stroma as possible. We classify endometriomas into 2 types: type I, which develop from invagination of endometrial implants in the ovarian cortex, and type II, which stem from invasion of functional cysts by endometrial implants or type I endometrioma. This distinction guides surgical management. We hope this article and its accompanying video will be helpful in guiding laparoscopic excision of type I and II endometriomas.
Share your thoughts! Send your Letter to the Editor to [email protected]. Please include your name and the city and state in which you practice.
- Nezhat C, Buescher E, Paka C, et al. Video-assisted laparoscopic treatment of endometriosis. In: Nezhat C, Nezhat F, Nezhat C, eds. Nezhat’s Video-Assisted and Robotic-Assisted Laparoscopy and Hysteroscopy. 4th ed. New York, NY: Cambridge University Press; 2013:265–302.
- Burney RO, Giudice LC. Pathogenesis and pathophysiology of endometriosis. Fertil Steril. 2012;98(3):511–519.
- Keyhan S, Hughes C, Price T, Muasher S. An update on surgical versus expectant management of ovarian endometriomas in infertile women. Biomed Res Int. 2015;2015:204792.
- Nezhat F, Nezhat C, Allan CJ, Metzger DA, Sears DL. Clinical and histologic classification of endometriomas. Implications for a mechanism of pathogenesis. J Reprod Med. 1992;37(9):771–776.
- Burney RO, Giudice LC. The pathogenesis of endometriosis. In: Nezhat C, Nezhat F, Nezhat C, eds. Nezhat’s Video-Assisted and Robotic-Assisted Laparoscopy and Hysteroscopy. 4th ed. New York, NY: Cambridge University Press; 2013:252–258.
- Czernobilsky B, Morris WJ. A histologic study of ovarian endometriosis with emphasis on hyperplastic and atypical changes. Obstet Gynecol. 1979;53(3):318–323.
- Nezhat F, Nezhat C, Nezhat C, Admon D. A fresh look at ovarian endometriomas. Contemp Ob Gyn. 1994;39(11):81–94.
- Donnez J, Lousse JC, Jadoul P, Donnez O, Squifflet J. Laparoscopic management of endometriomas using a combined technique of excisional (cystectomy) and ablative surgery. Fertil Steril. 2010;94(1):28–32.
- Nezhat C, Nezhat F, Nezhat C, Seidman DS. Classification of endometriosis. Improving the classification of endometriotic ovarian cysts. Hum Reprod. 1994;9(12):2212–2213.
- Nezhat FR, Pejovic T, Reis FM, Guo SW. The link between endometriosis and ovarian cancer: clinical implications. Int J Gynecol Cancer. 2014;24(4):623–628.
- Nezhat F, Apostol R, Mahmoud M, el Daouk M. Malignant transformation of endometriosis and its clinical significance. Fertil Steril. 2014;102(2):342–344.
- Nezhat FR, Apostal R, Nezhat C, Pejovic T. New insights in the pathophysiology of ovarian cancer and implications for screening and prevention. Am J Obstet Gynecol. 2015;213(3):262–267.
- Hart RJ, Hickey M, Maouris P, Buckett W. Excisional surgery versus ablative surgery for ovarian endometriomata. Cochrane Database Syst Rev. 2008;(2):CD004992.
- Yates J. Endometriosis and infertility: expert answers to 6 questions to help pinpoint the best route to pregnancy. OBG Manag. 2015;27(6):30–35.
- Littman E, Giudice L, Lathi R, Berker B, Milki A, Nezhat C. Role of laparoscopic treatment of endometriosis in patients with failed in vitro fertilization cycles. Fertil Steril. 2005;84(6):1574–1578.
- Exacoustos C, Zupi E, Amadio A, et al. Laparoscopic removal of endometriomas: sonographic evaluation of residual functioning ovarian tissue. Am J Obstet Gynecol. 2004;191(1):68–72.
- Gonçalves FC, Andres MP, Passman LJ, Gonçalves MO, Podgaec S. A systematic review of ultrasonography-guided transvaginal aspiration of recurrent ovarian endometrioma. Int J Gynaecol Obstet. 2016;134(1):3–7.
- Alborzi S, Momtahan M, Parsanezhad ME, Dehbashi S, Zolghadri J, Alborzi S. A prospective, randomized study comparing laparoscopic ovarian cystectomy versus fenestration and coagulation in patients with endometriomas. Fertil Steril. 2004;82(6):1633–1637.
- Nezhat C, Crowgey SR, Garrison CP. Surgical treatment of endometriosis via laser laparoscopy. Fertil Steril. 1986;45(6):778–783.

Dr. Falik is from the Center for Special Minimally Invasive and Robotic Surgery and Stanford University Medical Center, Palo Alto, California.

Dr. Li is from the Center for Special Minimally Invasive and Robotic Surgery and Stanford University Medical Center.

At the time of this writing, Dr. Farrimond was medical student, University of California–San Francisco, and is currently resident, Obstetrics and Gynecology, Kaiser Santa Clara Medical Center, Santa Clara, California.

Dr. Razavi is from the Center for Special Minimally Invasive and Robotic Surgery.

Dr. C. Nezhat is Fellowship Director, Atlanta Center for Minimally Invasive Surgery and Reproductive Medicine, Atlanta, Georgia.

Dr. F. Nezhat is Clinical Professor, Obstetrics and Gynecology, Weill Cornell Medical College, Cornell University, New York, New York, and Adjunct Professor, Obstetrics, Gynecology, and Reproductive Medicine, School of Medicine, Stony Brook University, Stony Brook, New York.
Dr. F. Nezhat reports being a speaker for Ambry Genetics. The other authors report no financial relationships relevant to this article.
Dr. Falik is from the Center for Special Minimally Invasive and Robotic Surgery and Stanford University Medical Center, Palo Alto, California.
Dr. Li is from the Center for Special Minimally Invasive and Robotic Surgery and Stanford University Medical Center.
At the time of this writing, Dr. Farrimond was medical student, University of California–San Francisco, and is currently resident, Obstetrics and Gynecology, Kaiser Santa Clara Medical Center, Santa Clara, California.
Dr. Razavi is from the Center for Special Minimally Invasive and Robotic Surgery.
Dr. C. Nezhat is Fellowship Director, Atlanta Center for Minimally Invasive Surgery and Reproductive Medicine, Atlanta, Georgia.
Dr. F. Nezhat is Clinical Professor, Obstetrics and Gynecology, Weill Cornell Medical College, Cornell University, New York, New York, and Adjunct Professor, Obstetrics, Gynecology, and Reproductive Medicine, School of Medicine, Stony Brook University, Stony Brook, New York.
Dr. F. Nezhat reports being a speaker for Ambry Genetics. The other authors report no financial relationships relevant to this article.
Related article:
Endometriosis: Expert answers to 7 crucial questions on diagnosis
Etiology
Endometriomas are extensively described in the literature, and their origin is the subject of several theories. In 1921, Sampson noted luteal membrane and ovarian epithelial tissues within endometriomas and was the first to indicate that endometriomas may result from the invasion of functional cysts by endometrial tissue.2,4,5 In 1979, Czernobilsky and Morris6 found endometrial and oviduct-like epithelium in ovarian endometriosis and concluded that ovarian tissue may be a common histologic precursor. Several other authors subsequently have reported finding different types of tissue within ovarian endometriomas, and not all of these chocolate cysts showed histologic evidence of endometriosis.4,7,8
Read about the classification of endometriomas
Disease classification
Our classification system identifies 2 types of endometriomas on the basis of their etiologies and characteristics. Type I, which arise from endometrial tissue implanted on the ovarian surface, are also called true endometriomas. Invagination of cortex and subsequent hemorrhage from endometrial tissue result in cyst formation. Endometrial tissue (endometrial stroma and glands) is histologically present in all type I endometriomas.1,4,9 These endometriomas usually are small (<5 cm in diameter) and have a densely adherent fibrous capsule.4 Often, there is no clear plane between cyst wall and ovarian stroma.3
Type II endometriomas arise from functional cysts involved in or invaded by cortical or pelvic side-wall endometrial implants or by type I endometriomas. Type II endometriomas are subclassified by the extent of endometrial implant involvement in the cyst wall. Type IIA endometriomas are hemorrhagic cysts with less than 10% of endometrial tissue within the cyst wall. Similar to the functional cysts from which they originate, type IIA endometriomas have a cyst wall that is separated easily from ovarian tissue during surgery.4,7,9 Although type II endometriomas tend to be larger than their type I counterparts, in some cases they are identified at an early stage of 2 to 5 cm. Endometriomas larger than 5 cm are almost always type II.4
Type IIB and IIC endometriomas have endometrial implants and fibrosis within their cyst walls, with progressively more endometrial invasion in type IIC endometriomas (>50%) than in type IIB (10% to 50%). Consequently, type IIB cysts are relatively easy to dissect from ovarian tissue, except adjacent to an endometriotic area where the cyst densely adheres to the ovarian stroma. In type IIC, endometrial tissue more extensively penetrates the capsule, making dissection of diseased tissue from the ovarian stroma more difficult; in fact, separating type IIC cyst wall from ovarian stroma can be as challenging as excising a type I endometrioma.7 In most cases, a type IIC cyst is attached by adhesions and fibrosis to the pelvic side wall or uterus and ruptures during mobilization (TABLE).
Related article:
Imaging the endometrioma and mature cystic teratoma
Presentation and diagnosis
Almost all patients with an endometrioma concurrently have peritoneal endometriosis, which is characterized by dysmenorrhea, dyspareunia, chronic pelvic pain, infertility, and, in some cases, gastrointestinal or genitourinary dysfunction.1 Pelvic examination may reveal an adnexal mass that is an endometrioma, or an endometrioma may appear on imaging obtained in a pelvic pain or infertility work-up. Given its 73% sensitivity, 94% specificity, safety, and low cost, transvaginal ultrasonography is the preferred imaging modality for endometrioma.3 The characteristic ultrasonographic appearance is that of a round, homogeneous, fluid-filled mass with low-level echoes.1 Magnetic resonance imaging is appropriate when a more sensitive imaging modality is indicated, as for a patient with risk factors for malignancy.3,10–12
Read about the surgical management of endometriomas
Surgical management
Indications for surgical excision of endometriomas include pelvic pain, infertility, and prevention and diagnosis of malignancy. Endometriomas may be excised prior to use of assisted reproductive technology.13–15 Medical therapy, such as oral contraceptives, can be used to reduce the size of endometriomas but does not improve fertility.3 Certain ovarian cancers are more common in women with endometriosis, and ovarian tumors are thought to develop in about 1% of ovarian endometriosis cases.1,12 Therefore, endometrioma excision may reduce the risk of malignancy. As with other ovarian cysts, large endometriomas may be excised to reduce the risks of rupture and torsion.
Approach
Laparoscopy is the preferred approach for endometrioma excision. Controversy exists regarding the ideal procedure: complete excision (with stripping of the cyst capsule) or drainage and ablation of the cyst wall. Compared with drainage and ablation, excision reduces recurrence of endometriomas; relieves dysmenorrhea, dyspareunia, pelvic pain, and other symptoms; and improves fertility.13,16 The recurrence rate may be as low as 5.8% with complete excision but is 90% with simple transvaginal aspiration.17,18 If not performed properly, however, cyst capsule stripping may damage nearby ovarian stroma and decrease the ovarian reserve.14 Some authors have advocated combining excision and ablation—performing cystectomy until there is no longer a clear plane between capsule and ovarian stroma and then ablating any remaining endometrial tissue.8
With type I and IIC endometriomas, we have seen the endometrial cyst wall infiltrating the ovarian stroma so deeply there is not always a definable plane. By contrast, type IIA and IIB endometriomas typically have a plane between the cyst wall and the ovarian cortex. In type II endometriomas, endometrial implants on the ovarian cortex infiltrate the plane of the cyst wall such that the juxtaposing lipomatous follicular cyst detaches with minimal intraoperative traction. Portions of type II endometriomas containing fibrosis and adhesions may become more difficult to peel off the cyst wall. For most endometriomas, at least 1 spot is difficult to peel off the ovary, and extra care must be taken at the hilum of ovary to avoid excising healthy ovarian cortex.4,5,7,8
Our surgical approach accounts for the described variations in type I and II endometriomas. Endometrial contents often spill as the endometrioma is dissected off neighboring structures. When possible, endometriomas should be aspirated and irrigated prior to cystectomy to avoid seeding the pelvis and abdomen with spilled endometriotic contents. We use hydrodissection, the injection of dilute vasopressin with a laparoscopic needle, to create a plane between cyst wall and ovarian stroma and strip the cyst capsule with laparoscopic graspers. Type I endometriomas adhere densely to the ovary. Given the presence of fibrosis and adhesions, the cyst is excised in a piecemeal fashion. Care is taken to remove any endometrial implants from the ovary while preserving as much of the ovarian tissue as possible.1
Type II endometriomas are larger cysts originating from the invasion of endometrial implants or type I endometrioma into functional cysts. The difficulty of capsule excision varies according to the extent of endometrial invasion. Type IIA endometriomas contain less than 10% endometrial tissue within the cyst capsule. Thus, the standard ovarian cystectomy stripping technique is successful in removing more than 90% of the cyst capsule. Special care is taken in stripping the residual small portion that involves the endometrial glands and stroma and adheres densely to the ovary.
The larger proportion of endometrial tissue present in type IIB and IIC endometriomas degrades the plane between the cyst capsule and the ovarian stroma, making excision more difficult. Similar to the type I excision, a piecemeal approach is often necessary. If complete stripping of the cyst capsule would result in extensive loss of healthy ovarian tissue, then electrocautery, plasma energy, or laser ablation can be selectively used to destroy focal areas of endometrial invasion. Complete ablation may be difficult, as the endometrioma wall can be up to 5 mm thick.19 For these thick-walled endometriomas, we recommend excision (vs ablation), which lowers the risk of endometrioma recurrence.
Related article:
Endometriosis and pain: Expert answers to 6 questions targeting your management options
- Endometriomas are common adnexal masses in women affected by endometriosis and may exacerbate pelvic pain and impair fertility. Classification of endometriomas into type I and type II,depending on their etiology and characteristics, can guide minimally invasive surgical management.
- Type I endometriomas arise from invagination of endometrial implants on the ovarian cortex, resulting in dense fibrosis and adhesions. These lesions typically require piecemeal excision in order to completely remove the cyst capsule.
- Type II endometriomas result from invasion of endometrial tissue into preexisting functional cysts and are further subclassified by the proportion of cyst capsule containing endometrial tissue (IIA <10%, IIB 10% to 50%, IIC >50%).
- The difficulty of excising type II endometriomas correlates with the degree of endometrial invasion, with type IIA being relatively straightforward and type IIC being as challenging and piecemeal as type I.
- We generally favor complete excision rather than ablation of the cyst capsule, except for when excision would result in an unacceptable loss of healthy ovarian tissue.
Conclusion
Endometriomas, common adnexal masses in women affected by endometriosis, may exacerbate pelvic pain and impair fertility. Gynecologists should be prepared to excise endometriomas completely and exercise care in preserving as much of the ovarian stroma as possible. We classify endometriomas into 2 types: type I, which develop from invagination of endometrial implants in the ovarian cortex, and type II, which stem from invasion of functional cysts by endometrial implants or type I endometrioma. This distinction guides surgical management. We hope this article and its accompanying video will be helpful in guiding laparoscopic excision of type I and II endometriomas.
Share your thoughts! Send your Letter to the Editor to [email protected]. Please include your name and the city and state in which you practice.
Related article:
Endometriosis: Expert answers to 7 crucial questions on diagnosis
Etiology
Endometriomas are extensively described in the literature, and their origin is the subject of several theories. In 1921, Sampson noted luteal membrane and ovarian epithelial tissues within endometriomas and was the first to indicate that endometriomas may result from the invasion of functional cysts by endometrial tissue.2,4,5 In 1979, Czernobilsky and Morris6 found endometrial and oviduct-like epithelium in ovarian endometriosis and concluded that ovarian tissue may be a common histologic precursor. Several other authors subsequently have reported finding different types of tissue within ovarian endometriomas, and not all of these chocolate cysts showed histologic evidence of endometriosis.4,7,8
Read about the classification of endometriomas
Disease classification
Our classification system identifies 2 types of endometriomas on the basis of their etiologies and characteristics. Type I, which arise from endometrial tissue implanted on the ovarian surface, are also called true endometriomas. Invagination of cortex and subsequent hemorrhage from endometrial tissue result in cyst formation. Endometrial tissue (endometrial stroma and glands) is histologically present in all type I endometriomas.1,4,9 These endometriomas usually are small (<5 cm in diameter) and have a densely adherent fibrous capsule.4 Often, there is no clear plane between cyst wall and ovarian stroma.3
Type II endometriomas arise from functional cysts involved in or invaded by cortical or pelvic side-wall endometrial implants or by type I endometriomas. Type II endometriomas are subclassified by the extent of endometrial implant involvement in the cyst wall. Type IIA endometriomas are hemorrhagic cysts with less than 10% of endometrial tissue within the cyst wall. Similar to the functional cysts from which they originate, type IIA endometriomas have a cyst wall that is separated easily from ovarian tissue during surgery.4,7,9 Although type II endometriomas tend to be larger than their type I counterparts, in some cases they are identified at an early stage of 2 to 5 cm. Endometriomas larger than 5 cm are almost always type II.4
Type IIB and IIC endometriomas have endometrial implants and fibrosis within their cyst walls, with progressively more endometrial invasion in type IIC endometriomas (>50%) than in type IIB (10% to 50%). Consequently, type IIB cysts are relatively easy to dissect from ovarian tissue, except adjacent to an endometriotic area where the cyst densely adheres to the ovarian stroma. In type IIC, endometrial tissue more extensively penetrates the capsule, making dissection of diseased tissue from the ovarian stroma more difficult; in fact, separating type IIC cyst wall from ovarian stroma can be as challenging as excising a type I endometrioma.7 In most cases, a type IIC cyst is attached by adhesions and fibrosis to the pelvic side wall or uterus and ruptures during mobilization (TABLE).
Related article:
Imaging the endometrioma and mature cystic teratoma
Presentation and diagnosis
Almost all patients with an endometrioma concurrently have peritoneal endometriosis, which is characterized by dysmenorrhea, dyspareunia, chronic pelvic pain, infertility, and, in some cases, gastrointestinal or genitourinary dysfunction.1 Pelvic examination may reveal an adnexal mass that is an endometrioma, or an endometrioma may appear on imaging obtained in a pelvic pain or infertility work-up. Given its 73% sensitivity, 94% specificity, safety, and low cost, transvaginal ultrasonography is the preferred imaging modality for endometrioma.3 The characteristic ultrasonographic appearance is that of a round, homogeneous, fluid-filled mass with low-level echoes.1 Magnetic resonance imaging is appropriate when a more sensitive imaging modality is indicated, as for a patient with risk factors for malignancy.3,10–12
Read about the surgical management of endometriomas
Surgical management
Indications for surgical excision of endometriomas include pelvic pain, infertility, and prevention and diagnosis of malignancy. Endometriomas may be excised prior to use of assisted reproductive technology.13–15 Medical therapy, such as oral contraceptives, can be used to reduce the size of endometriomas but does not improve fertility.3 Certain ovarian cancers are more common in women with endometriosis, and ovarian tumors are thought to develop in about 1% of ovarian endometriosis cases.1,12 Therefore, endometrioma excision may reduce the risk of malignancy. As with other ovarian cysts, large endometriomas may be excised to reduce the risks of rupture and torsion.
Approach
Laparoscopy is the preferred approach for endometrioma excision. Controversy exists regarding the ideal procedure: complete excision (with stripping of the cyst capsule) or drainage and ablation of the cyst wall. Compared with drainage and ablation, excision reduces recurrence of endometriomas; relieves dysmenorrhea, dyspareunia, pelvic pain, and other symptoms; and improves fertility.13,16 The recurrence rate may be as low as 5.8% with complete excision but is 90% with simple transvaginal aspiration.17,18 If not performed properly, however, cyst capsule stripping may damage nearby ovarian stroma and decrease the ovarian reserve.14 Some authors have advocated combining excision and ablation—performing cystectomy until there is no longer a clear plane between capsule and ovarian stroma and then ablating any remaining endometrial tissue.8
With type I and IIC endometriomas, we have seen the endometrial cyst wall infiltrating the ovarian stroma so deeply there is not always a definable plane. By contrast, type IIA and IIB endometriomas typically have a plane between the cyst wall and the ovarian cortex. In type II endometriomas, endometrial implants on the ovarian cortex infiltrate the plane of the cyst wall such that the juxtaposing lipomatous follicular cyst detaches with minimal intraoperative traction. Portions of type II endometriomas containing fibrosis and adhesions may become more difficult to peel off the cyst wall. For most endometriomas, at least 1 spot is difficult to peel off the ovary, and extra care must be taken at the hilum of ovary to avoid excising healthy ovarian cortex.4,5,7,8
Our surgical approach accounts for the described variations in type I and II endometriomas. Endometrial contents often spill as the endometrioma is dissected off neighboring structures. When possible, endometriomas should be aspirated and irrigated prior to cystectomy to avoid seeding the pelvis and abdomen with spilled endometriotic contents. We use hydrodissection, the injection of dilute vasopressin with a laparoscopic needle, to create a plane between cyst wall and ovarian stroma and strip the cyst capsule with laparoscopic graspers. Type I endometriomas adhere densely to the ovary. Given the presence of fibrosis and adhesions, the cyst is excised in a piecemeal fashion. Care is taken to remove any endometrial implants from the ovary while preserving as much of the ovarian tissue as possible.1
Type II endometriomas are larger cysts originating from the invasion of endometrial implants or type I endometrioma into functional cysts. The difficulty of capsule excision varies according to the extent of endometrial invasion. Type IIA endometriomas contain less than 10% endometrial tissue within the cyst capsule. Thus, the standard ovarian cystectomy stripping technique is successful in removing more than 90% of the cyst capsule. Special care is taken in stripping the residual small portion that involves the endometrial glands and stroma and adheres densely to the ovary.
The larger proportion of endometrial tissue present in type IIB and IIC endometriomas degrades the plane between the cyst capsule and the ovarian stroma, making excision more difficult. Similar to the type I excision, a piecemeal approach is often necessary. If complete stripping of the cyst capsule would result in extensive loss of healthy ovarian tissue, then electrocautery, plasma energy, or laser ablation can be selectively used to destroy focal areas of endometrial invasion. Complete ablation may be difficult, as the endometrioma wall can be up to 5 mm thick.19 For these thick-walled endometriomas, we recommend excision (vs ablation), which lowers the risk of endometrioma recurrence.
Related article:
Endometriosis and pain: Expert answers to 6 questions targeting your management options
- Endometriomas are common adnexal masses in women affected by endometriosis and may exacerbate pelvic pain and impair fertility. Classification of endometriomas into type I and type II,depending on their etiology and characteristics, can guide minimally invasive surgical management.
- Type I endometriomas arise from invagination of endometrial implants on the ovarian cortex, resulting in dense fibrosis and adhesions. These lesions typically require piecemeal excision in order to completely remove the cyst capsule.
- Type II endometriomas result from invasion of endometrial tissue into preexisting functional cysts and are further subclassified by the proportion of cyst capsule containing endometrial tissue (IIA <10%, IIB 10% to 50%, IIC >50%).
- The difficulty of excising type II endometriomas correlates with the degree of endometrial invasion, with type IIA being relatively straightforward and type IIC being as challenging and piecemeal as type I.
- We generally favor complete excision rather than ablation of the cyst capsule, except for when excision would result in an unacceptable loss of healthy ovarian tissue.
Conclusion
Endometriomas, common adnexal masses in women affected by endometriosis, may exacerbate pelvic pain and impair fertility. Gynecologists should be prepared to excise endometriomas completely and exercise care in preserving as much of the ovarian stroma as possible. We classify endometriomas into 2 types: type I, which develop from invagination of endometrial implants in the ovarian cortex, and type II, which stem from invasion of functional cysts by endometrial implants or type I endometrioma. This distinction guides surgical management. We hope this article and its accompanying video will be helpful in guiding laparoscopic excision of type I and II endometriomas.
Share your thoughts! Send your Letter to the Editor to [email protected]. Please include your name and the city and state in which you practice.
- Nezhat C, Buescher E, Paka C, et al. Video-assisted laparoscopic treatment of endometriosis. In: Nezhat C, Nezhat F, Nezhat C, eds. Nezhat’s Video-Assisted and Robotic-Assisted Laparoscopy and Hysteroscopy. 4th ed. New York, NY: Cambridge University Press; 2013:265–302.
- Burney RO, Giudice LC. Pathogenesis and pathophysiology of endometriosis. Fertil Steril. 2012;98(3):511–519.
- Keyhan S, Hughes C, Price T, Muasher S. An update on surgical versus expectant management of ovarian endometriomas in infertile women. Biomed Res Int. 2015;2015:204792.
- Nezhat F, Nezhat C, Allan CJ, Metzger DA, Sears DL. Clinical and histologic classification of endometriomas. Implications for a mechanism of pathogenesis. J Reprod Med. 1992;37(9):771–776.
- Burney RO, Giudice LC. The pathogenesis of endometriosis. In: Nezhat C, Nezhat F, Nezhat C, eds. Nezhat’s Video-Assisted and Robotic-Assisted Laparoscopy and Hysteroscopy. 4th ed. New York, NY: Cambridge University Press; 2013:252–258.
- Czernobilsky B, Morris WJ. A histologic study of ovarian endometriosis with emphasis on hyperplastic and atypical changes. Obstet Gynecol. 1979;53(3):318–323.
- Nezhat F, Nezhat C, Nezhat C, Admon D. A fresh look at ovarian endometriomas. Contemp Ob Gyn. 1994;39(11):81–94.
- Donnez J, Lousse JC, Jadoul P, Donnez O, Squifflet J. Laparoscopic management of endometriomas using a combined technique of excisional (cystectomy) and ablative surgery. Fertil Steril. 2010;94(1):28–32.
- Nezhat C, Nezhat F, Nezhat C, Seidman DS. Classification of endometriosis. Improving the classification of endometriotic ovarian cysts. Hum Reprod. 1994;9(12):2212–2213.
- Nezhat FR, Pejovic T, Reis FM, Guo SW. The link between endometriosis and ovarian cancer: clinical implications. Int J Gynecol Cancer. 2014;24(4):623–628.
- Nezhat F, Apostol R, Mahmoud M, el Daouk M. Malignant transformation of endometriosis and its clinical significance. Fertil Steril. 2014;102(2):342–344.
- Nezhat FR, Apostal R, Nezhat C, Pejovic T. New insights in the pathophysiology of ovarian cancer and implications for screening and prevention. Am J Obstet Gynecol. 2015;213(3):262–267.
- Hart RJ, Hickey M, Maouris P, Buckett W. Excisional surgery versus ablative surgery for ovarian endometriomata. Cochrane Database Syst Rev. 2008;(2):CD004992.
- Yates J. Endometriosis and infertility: expert answers to 6 questions to help pinpoint the best route to pregnancy. OBG Manag. 2015;27(6):30–35.
- Littman E, Giudice L, Lathi R, Berker B, Milki A, Nezhat C. Role of laparoscopic treatment of endometriosis in patients with failed in vitro fertilization cycles. Fertil Steril. 2005;84(6):1574–1578.
- Exacoustos C, Zupi E, Amadio A, et al. Laparoscopic removal of endometriomas: sonographic evaluation of residual functioning ovarian tissue. Am J Obstet Gynecol. 2004;191(1):68–72.
- Gonçalves FC, Andres MP, Passman LJ, Gonçalves MO, Podgaec S. A systematic review of ultrasonography-guided transvaginal aspiration of recurrent ovarian endometrioma. Int J Gynaecol Obstet. 2016;134(1):3–7.
- Alborzi S, Momtahan M, Parsanezhad ME, Dehbashi S, Zolghadri J, Alborzi S. A prospective, randomized study comparing laparoscopic ovarian cystectomy versus fenestration and coagulation in patients with endometriomas. Fertil Steril. 2004;82(6):1633–1637.
- Nezhat C, Crowgey SR, Garrison CP. Surgical treatment of endometriosis via laser laparoscopy. Fertil Steril. 1986;45(6):778–783.
IN THIS ARTICLE
Not so fast
If you are a busy primary care physician, wouldn’t you like to get some quick confirmation that your patient with a fever and runny nose has a viral upper respiratory infection? If there were a test or a simple physical finding that could give you the answer while the patient was still in the office, you could dispense a quick dose of reassurance and send him or her on their way. It would probably help you inch a bit closer to relieving the congestion in your waiting room.
I am sure most of you realize that relying on the patient’s temperature or the color of his or her nasal mucus is not going to give you that reliable and swift answer you would like. There have been rapid diagnostic tests for influenza on the market for several years, but I have not been aware of a similar test for rhinovirus. But I recently came across a study that offers some hope that such a test might become a reality in the future (EBioMedicine. 2017 Mar;17:172-81). In the study, researchers at Duke University and elsewhere identified a group of proteins in mucus that can confirm – with 86% accuracy – that the patient is infected with a cold or flu virus. They anticipate that this discovery could be adapted into a rapid test that could be performed in the doctor’s office.

However, I am sure that most of you would do a careful exam and spend a few minutes on a slightly more detailed discussion of what worrisome symptoms the parents should be watching for. But let’s be honest. Isn’t it likely that knowing that the patient has a rhinovirus infection might derail your diagnostic process short of a full consideration? Isn’t it tempting to say to yourself, “He only has a viral URI, and I even know the name of the virus. My job is done.”
Although the odds are that the virus is causing all your patient’s symptoms, there is always the chance that he or she is harboring a bacterial coinfection. Or, that what appears to be “only” a virus is actually an early step in the deadly spiral of the first episode of diabetic ketoacidosis.
This quandary is another example of the paradox in which more information can make your job as a diagnostician more difficult. Does your patient’s positive rapid strep test mean that strep is the primary cause of your patient’s fever and sore throat? Couldn’t he or she just be a carrier? Should a positive test that confirms your clinical impression put an end to your evaluation of the patient?
You could answer that you don’t have the time to go looking for zebra stripes hidden on the underbelly of every equine that gallops into your exam room. Of course you don’t. But, you are obligated to keep your mind open to the possibility that a lab test promising to make your job easy may not be telling you the whole story.
Dr. Wilkoff practiced primary care pediatrics in Brunswick, Maine, for nearly 40 years. He has authored several books on behavioral pediatrics, including “How to Say No to Your Toddler.” Email him at [email protected].
If you are a busy primary care physician, wouldn’t you like to get some quick confirmation that your patient with a fever and runny nose has a viral upper respiratory infection? If there were a test or a simple physical finding that could give you the answer while the patient was still in the office, you could dispense a quick dose of reassurance and send him or her on their way. It would probably help you inch a bit closer to relieving the congestion in your waiting room.
I am sure most of you realize that relying on the patient’s temperature or the color of his or her nasal mucus is not going to give you that reliable and swift answer you would like. There have been rapid diagnostic tests for influenza on the market for several years, but I have not been aware of a similar test for rhinovirus. But I recently came across a study that offers some hope that such a test might become a reality in the future (EBioMedicine. 2017 Mar;17:172-81). In the study, researchers at Duke University and elsewhere identified a group of proteins in mucus that can confirm – with 86% accuracy – that the patient is infected with a cold or flu virus. They anticipate that this discovery could be adapted into a rapid test that could be performed in the doctor’s office.
However, I am sure that most of you would do a careful exam and spend a few minutes on a slightly more detailed discussion of what worrisome symptoms the parents should be watching for. But let’s be honest. Isn’t it likely that knowing that the patient has a rhinovirus infection might derail your diagnostic process short of a full consideration? Isn’t it tempting to say to yourself, “He only has a viral URI, and I even know the name of the virus. My job is done.”
Although the odds are that the virus is causing all your patient’s symptoms, there is always the chance that he or she is harboring a bacterial coinfection. Or, that what appears to be “only” a virus is actually an early step in the deadly spiral of the first episode of diabetic ketoacidosis.
This quandary is another example of the paradox in which more information can make your job as a diagnostician more difficult. Does your patient’s positive rapid strep test mean that strep is the primary cause of your patient’s fever and sore throat? Couldn’t he or she just be a carrier? Should a positive test that confirms your clinical impression put an end to your evaluation of the patient?
You could answer that you don’t have the time to go looking for zebra stripes hidden on the underbelly of every equine that gallops into your exam room. Of course you don’t. But, you are obligated to keep your mind open to the possibility that a lab test promising to make your job easy may not be telling you the whole story.
Dr. Wilkoff practiced primary care pediatrics in Brunswick, Maine, for nearly 40 years. He has authored several books on behavioral pediatrics, including “How to Say No to Your Toddler.” Email him at [email protected].
Effective treatment of recurrent bacterial vaginosis
Bacterial vaginosis (BV) is caused by a complex change in vaginal bacterial flora, with a reduction in lactobacilli (which help maintain an acidic environment) and an increase in anaerobic gram-negative organisms including Gardnerella vaginalis species and Bacteroides, Prevotella, and Mobiluncus genera. Infection with G vaginalis is thought to trigger a cascade of changes in vaginal flora that leads to BV.1
BV is present in 30% to 50% of sexually active women, and of these women 50% to 75% have an abnormal vaginal discharge, which is gray, thin, and homogeneous and may have a fishy odor.2 In addition to causing an abnormal vaginal discharge, BV is a cause of postpartum fever, posthysterectomy vaginal cuff cellulitis, and postabortion infection, and it increases the risk of acquiring HIV, herpes simplex type 2, gonorrhea, chlamydia, and trichomoniasis infection.3
When using microscopy and the Amsel criteria, the diagnosis of BV is made when at least 3 of the following 4 criteria are present:
- homogeneous, thin, gray discharge
- vaginal pH >4.5
- positive whiff-amine test when applying a drop of 10% KOH to a sample of the vaginal discharge
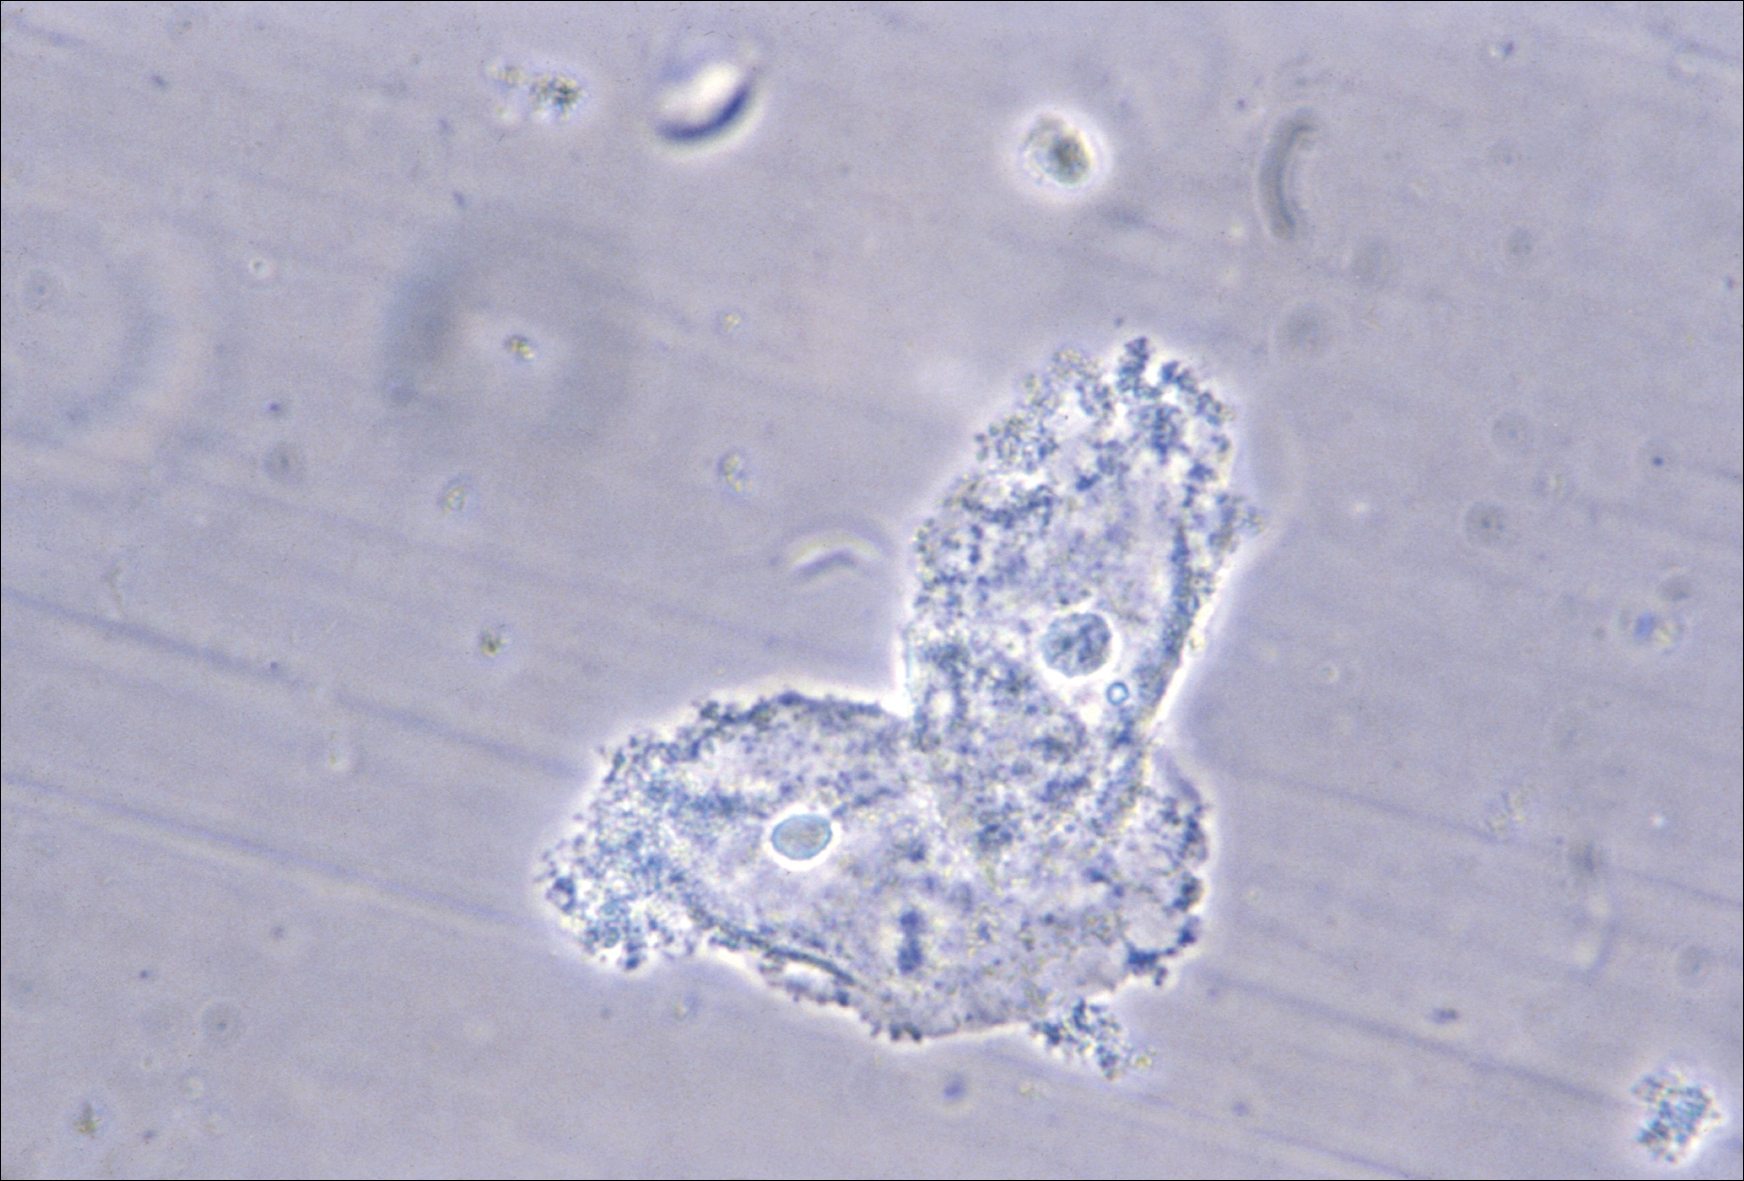
- clue cells detected with microscopy on a saline wet mount.
If microscopy is not available, the Affirm VPIII test (BD Diagnostic Systems, Franklin Lakes, New Jersey) for DNA sequences of G vaginalis has high sensitivity and specificity.4 The OSOM BVBlue test (Sekisui Diagnostics, Lexington, Massachusetts), a Clinical Laboratory Improvement Amendments-waived point of service test, measures vaginal sialidase, which is produced by Gardnerella and other pathogens associated with BV.5 BV may be detected in routine cervical cytology testing and, if the patient is symptomatic, treatment is recommended.
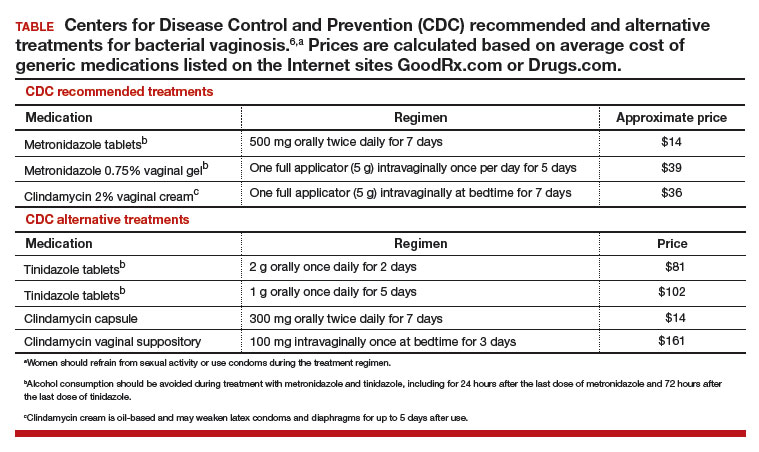
Initial treatment of BV. The Centers for Disease Control and Prevention (CDC) has recommended 3 treatment regimens for BV and 4 alternative treatment options (TABLE).6 In addition to antimicrobial treatment, the CDC recommends that women with BV use condoms with sexual intercourse. The CDC also advises that clinicians should con-sider testing women with BV for HIV and other sexually transmitted infections.
Related article:
Successful treatment of chronic vaginitis
Treatment of recurrent BV
A major problem with BV is that, although initial treatment is successful in about 80% of cases, up to 50% of women will have a recurrence of BV within 12 months of initial treatment.2 Preliminary studies suggest that for women with 3 or more episodes of BV, the regimens below may be effective.
Regimen 1
Following the completion of a CDC-recommended treatment regimen (see TABLE), prescribe metronidazole vaginal gel 0.75%, one full applicator, twice weekly for 6 months.7
In a prospective randomized trial examining this regimen, following initial treatment with a 10-day metronidazole vaginal gel regimen 112 women were randomly assigned to chronic suppressive therapy with metronidazole vaginal gel 0.75%, one full applicator, twice weekly for 16 weeks or a placebo. During the treatment period, recurrent BV was diagnosed in 26% of the women taking metronidazole gel and 59% of the women taking placebo.7 This regimen may be complicated by secondary vaginal candidiasis, which may be treated with a vaginal or oral antifungal agent.
Regimen 2
Initiate a 21-day course of vaginal boric acid capsules 600 mg once daily at bedtime and simultaneously prescribe a standard CDC treatment regimen (see TABLE). At the completion of the vaginal boric acid treatment initiate metronidazole vaginal gel 0.75% twice weekly for 6 months.8
NOTE: Boric acid can cause death if consumed orally.9 Boric acid capsules should be stored securely to ensure that they are not accidentally taken orally. Boric acid poisoning may present with vomiting, fever, skin rash, neutropenia, thrombocytopenia, metabolic acidosis, and renal failure.10 Boric acid should not be used by pregnant women because it is a teratogen.11
The bacterial organisms responsible for BV reside in a self-produced matrix, referred to as a biofilm, that protect the organisms from antimicrobial agents.12 Boric acid may prevent the formation of a biofilm and increase the effectiveness of anti-microbial treatment.
Regimen 3
Following the completion of a standard treatment regimen (see TABLE), prescribe oral metronidazole 2 g and fluconazole 150 mg administered once every month.13
In a randomized clinical trial, 310 female sex workers were randomly assigned to monthly treatment with oral metronidazole 2 g plus fluconazole 150 mg or placebo for up to 12 months.13 In the treatment and placebo groups episodes of BV were 199 and 326 per 100 person-years, respectively (hazard ratio, 0.55; 95% confidence interval, 0.49-0.63; P<.001). In Canada, a vaginal ovule containing both a high dose of metronidazole (500 mg) and nystatin (10,000 IU) is available and could be used intermittently to prevent recurrence.14
Treatment of partners
The CDC does not recommend treatment of the partners of women with BV because there are no definitive data to support such a recommendation. However, the 6 published clinical trials testing the utility of treating sex partners of women with BV have significant methodologic flaws, including underpowered studies and suboptimal antibiotic treatment regimens.15 Hence, whether partners should be treated remains an open question. Many experts believe that, in most cases, BV is a sexually transmitted disease.16,17 For women who have sex with women, the rate of BV concordance among partners is high. If one woman has diagnosed BV and symptoms are present in her partner, treatment of the partner is reasonable. For women with BV who have sex with men, sexual intercourse influences disease activity, and consistent use of condoms may reduce the rate of recurrence.18 Male circumcision may reduce the risk of BV in female partners.19
Related article:
Bacterial vaginosis: Meet patients' needs with effective diagnosis and treatment
Over-the-counter treatments
In women with BV it is thought that the vaginal administration of lactic acid can help restore the normal acidic pH of the vagina, encourage the growth of lactobacilli, and suppress the growth of the bacteria that cause BV.20 Many products containing lactic acid in a formulation for vaginal use are available (among them Luvena and Gynofit gel).
Lactobacilli play an important role in maintaining vaginal health. Lactobacillus rhamnosus and Lactobacillus reuteri are available for purchase as supplements for oral administration. It is thought that oral administration of lactobacilli can help improve the vaginal microbiome. In one clinical trial, 125 women with BV were randomly assigned to receive the combination of 1 week of metronidazole plus oral Lactobacillus twice daily for 30 days or metronidazole plus placebo.21 Resolution of symptoms was reported as 88% and 40% in the metronidazole-lactobacilli and metronidazole-placebo groups, respectively.21 By contrast, one systematic review of probiotic treatment of BV concluded that there is insufficient evidence to recommend for or against probiotic treatment of BV.22 Patients with recurrent BV commonly report that they believe a probiotic was helpful in resolving their symptoms.
On the horizon
In one trial, a single 2-g oral dose of secnidazole was as effective as a 7-day course of oral metronidazole 500 mg twice daily.23 In a small dose-finding study, a single dose of either secnidazole 1 g or 2 g was equally effective in treating BV.24 An effective single-dose treatment of BV would likely improve patient adherence with therapy. Symbiomix is preparing for FDA review of this medication (secnidazole, Solosec) for use in the United States.
BV is a prevalent problem and often adversely impacts a woman's quality of life and love relationships. BV recurrence is very common. Many women report that their BV was resistant to intermittet treatment and recurred, repetitively over many years. The 3 treatment options presented in this editorial may help to suppress the recurrence rate and improve symptoms.
Share your thoughts! Send your Letter to the Editor to [email protected]. Please include your name and the city and state in which you practice.
- Schwebke JR, Muzny CA, Josey WE. Role of Gardnerella vaginalis in the pathogenesis of bacterial vaginosis: a conceptual model. J Infect Dis. 2014;210(3):338-343.
- Bradshaw CS, Morton AN, Hocking J, et al. High recurrence rates of bacterial vaginosis over the course of 12 months after oral metronidazole therapy and factors associated with recurrence. J Infect Dis. 2006;193(11):1478-1486.
- Murphy K, Mitchell CM. The interplay of host immunity, environment and the risk of bacterial vaginosis and associated reproductive health outcomes. J Infect Dis. 2016;214(suppl 1):S29-S35.
- Mulhem E, Boyanton BL Jr, Robinson-Dunn B, Ebert C, Dzebo R. Performance of the Affirm VP-III using residual vaginal discharge collected from the speculum to characterize vaginitis in symptomatic women. J Low Genit Tract Dis. 2014;18(4):344-346.
- Bradshaw CS, Morton AN, Garland SM, Horvath LB, Kuzevska I, Fairley CK. Evaluation of a point-of-care test, BVBLue, and clinical and laboratory criteria for diagnosis of bacterial vaginosis. J Clin Microbiol. 2005;43(3):1304-1308.
- 2015 Sexually transmitted disease treatment guidelines: Bacterial vaginosis. Centers for Disease Control and Prevention website. https://www.cdc.gov/std/tg2015/bv.htm. Updated June 4,2015. Accessed June 9, 2017.
- Sobel JD, Ferris D, Schwebke J, et al. Suppressive antibacterial therapy with 0.75% metronidazole vaginal gel to prevent recurrent bacterial vaginosis. Am J Obstet Gynecol. 2006;194(5):1283-1289.
- Reichman O, Akins R, Sobel JD. Boric acid addition to suppressive antimicrobial therapy for recurrent bacterial vaginosis. Sex Transm Dis. 2009;36(11):732-734.
- Wong LC, Heimbach MD, Truscott DR, Duncan BD. Boric acid poisoning: report of 11 cases. Can Med Assoc J. 1964;90:1018-1023.
- Teshima D, Morishita K, Ueda Y, et al. Clinical management of boric acid ingestion: pharmacokinetic assessment of efficacy of hemodialysis for treatment of acute boric acid poisoning. J Pharmacobiodyn. 1992;15(6):287-294.
- Di Renzo F, Cappelletti G, Broccia ML, Giavini E, Menegola E. Boric acid inhibits embryonic histone deacetylases: a suggested mechanism to explain boric acid-related teratogenicity. Toxicol Appl Pharmacol. 2007;220(2):178-185.
- Muzny CA, Schwebke JR. Biofilms: an underappreciated mechanism of treatment failure and recurrence in vaginal infections. Clin Infect Dis. 2015;61(4):601-606.
- McClelland RS, Richardson BA, Hassan WM, et al. Improvement of vaginal health for Kenyan women at risk for acquisition of human immunodeficiency virus type 1: results of a randomized trial. J Infect Dis. 2008;197(10):1361-1368.
- Sanchez S, Garcia PJ, Thomas KK, Catlin M, Holmes KK. Intravaginal metronidazole gel versus metronidazole plus nystatin ovules for bacterial vaginosis: a randomized controlled trial. Am J Obstet Gynecol. 2004;191(6):1898-1906.
- Mehta SD. Systematic review of randomized trials of treatment of male sexual partners for improved bacteria vaginosis outcomes in women. Sex Transm Dis. 2012;39(10):822-830.
- Muzny CA, Schwebke JR. Pathogenesis of bacterial vaginosis: discussion of current hypotheses. J Infect Dis. 2016;214(suppl 1):S1-S5.
- Vodstrcil LA, Walker SM, Hocking JS, et al. Incident bacterial vaginosis (BV) in women who have sex with women is associated with behaviors that suggest sexual transmission of BV. Clin Infect Dis. 2015;60(7):1042-1053.
- Bradshaw CS, Vodstrcil LA, Hocking JS, et al. Recurrence of bacterial vaginosis is significantly associated with posttreatment sexual activities and hormonal contraceptive use. Clin Infect Dis. 2013;56(6):777-786.
- Gray RH, Kigozi G, Serwadda D, et al. The effects of male circumcision on female partners' genital tract symptoms and vaginal infections in a randomized trial in Rakai, Uganda. Am J Obstet Gynecol. 2009;200(1):42.e1-e7.
- O'Hanlon DE, Moench TR, Cone RA. In vaginal fluid, bacteria associated with bacterial vaginosis can be suppressed with lactic acid but not hydrogen peroxide. BMC Infect Dis. 2011;11:200.
- Anukam K, Osazuwa E, Ahonkhai I, et al. Augmentation of antimicrobial metronidazole therapy of bacterial vaginosis with oral probiotic Lactobacillus rhamnosus GR-1 and Lactobacillus reuteri RC-14: randomized, double-blind, placebo controlled trial. Microbes Infect. 2006;8(6):1450-1454.
- Senok AC, Verstraelen H, Temmerman M, Botta GA. Probiotics for the treatment of bacterial vaginosis. Cochrane Database Syst Rev. 2009;(4):CD006289.
- Bohbot JM, Vicaut E, Fagnen D, Brauman M. Treatment of bacterial vaginosis: a multicenter, double-blind, double-dummy, randomised phase III study comparing secnidazole and metronidazole. Infect Dis Obstet Gynecol. 2010;2010. doi:10.1155/2010/705692.
- Núñez JT, Gómez G. Low-dose secnidazole in the treatment of bacterial vaginosis. Int J Gynaecol Obstet. 2005;88(3):281-285.

Dr. Barbieri is Editor in Chief, OBG Management; Chair, Obstetrics and Gynecology, Brigham and Women’s Hospital; and Kate Macy Ladd Professor of Obstetrics, Gynecology, and Reproductive Biology, Harvard Medical School, Boston, Massachusetts.
Dr. Barbieri reports no financial relationships relevant to this article.
Bacterial vaginosis (BV) is caused by a complex change in vaginal bacterial flora, with a reduction in lactobacilli (which help maintain an acidic environment) and an increase in anaerobic gram-negative organisms including Gardnerella vaginalis species and Bacteroides, Prevotella, and Mobiluncus genera. Infection with G vaginalis is thought to trigger a cascade of changes in vaginal flora that leads to BV.1
BV is present in 30% to 50% of sexually active women, and of these women 50% to 75% have an abnormal vaginal discharge, which is gray, thin, and homogeneous and may have a fishy odor.2 In addition to causing an abnormal vaginal discharge, BV is a cause of postpartum fever, posthysterectomy vaginal cuff cellulitis, and postabortion infection, and it increases the risk of acquiring HIV, herpes simplex type 2, gonorrhea, chlamydia, and trichomoniasis infection.3
When using microscopy and the Amsel criteria, the diagnosis of BV is made when at least 3 of the following 4 criteria are present:
- homogeneous, thin, gray discharge
- vaginal pH >4.5
- positive whiff-amine test when applying a drop of 10% KOH to a sample of the vaginal discharge
- clue cells detected with microscopy on a saline wet mount.
If microscopy is not available, the Affirm VPIII test (BD Diagnostic Systems, Franklin Lakes, New Jersey) for DNA sequences of G vaginalis has high sensitivity and specificity.4 The OSOM BVBlue test (Sekisui Diagnostics, Lexington, Massachusetts), a Clinical Laboratory Improvement Amendments-waived point of service test, measures vaginal sialidase, which is produced by Gardnerella and other pathogens associated with BV.5 BV may be detected in routine cervical cytology testing and, if the patient is symptomatic, treatment is recommended.
Initial treatment of BV. The Centers for Disease Control and Prevention (CDC) has recommended 3 treatment regimens for BV and 4 alternative treatment options (TABLE).6 In addition to antimicrobial treatment, the CDC recommends that women with BV use condoms with sexual intercourse. The CDC also advises that clinicians should con-sider testing women with BV for HIV and other sexually transmitted infections.
Related article:
Successful treatment of chronic vaginitis
Treatment of recurrent BV
A major problem with BV is that, although initial treatment is successful in about 80% of cases, up to 50% of women will have a recurrence of BV within 12 months of initial treatment.2 Preliminary studies suggest that for women with 3 or more episodes of BV, the regimens below may be effective.
Regimen 1
Following the completion of a CDC-recommended treatment regimen (see TABLE), prescribe metronidazole vaginal gel 0.75%, one full applicator, twice weekly for 6 months.7
In a prospective randomized trial examining this regimen, following initial treatment with a 10-day metronidazole vaginal gel regimen 112 women were randomly assigned to chronic suppressive therapy with metronidazole vaginal gel 0.75%, one full applicator, twice weekly for 16 weeks or a placebo. During the treatment period, recurrent BV was diagnosed in 26% of the women taking metronidazole gel and 59% of the women taking placebo.7 This regimen may be complicated by secondary vaginal candidiasis, which may be treated with a vaginal or oral antifungal agent.
Regimen 2
Initiate a 21-day course of vaginal boric acid capsules 600 mg once daily at bedtime and simultaneously prescribe a standard CDC treatment regimen (see TABLE). At the completion of the vaginal boric acid treatment initiate metronidazole vaginal gel 0.75% twice weekly for 6 months.8
NOTE: Boric acid can cause death if consumed orally.9 Boric acid capsules should be stored securely to ensure that they are not accidentally taken orally. Boric acid poisoning may present with vomiting, fever, skin rash, neutropenia, thrombocytopenia, metabolic acidosis, and renal failure.10 Boric acid should not be used by pregnant women because it is a teratogen.11
The bacterial organisms responsible for BV reside in a self-produced matrix, referred to as a biofilm, that protect the organisms from antimicrobial agents.12 Boric acid may prevent the formation of a biofilm and increase the effectiveness of anti-microbial treatment.
Regimen 3
Following the completion of a standard treatment regimen (see TABLE), prescribe oral metronidazole 2 g and fluconazole 150 mg administered once every month.13
In a randomized clinical trial, 310 female sex workers were randomly assigned to monthly treatment with oral metronidazole 2 g plus fluconazole 150 mg or placebo for up to 12 months.13 In the treatment and placebo groups episodes of BV were 199 and 326 per 100 person-years, respectively (hazard ratio, 0.55; 95% confidence interval, 0.49-0.63; P<.001). In Canada, a vaginal ovule containing both a high dose of metronidazole (500 mg) and nystatin (10,000 IU) is available and could be used intermittently to prevent recurrence.14
Treatment of partners
The CDC does not recommend treatment of the partners of women with BV because there are no definitive data to support such a recommendation. However, the 6 published clinical trials testing the utility of treating sex partners of women with BV have significant methodologic flaws, including underpowered studies and suboptimal antibiotic treatment regimens.15 Hence, whether partners should be treated remains an open question. Many experts believe that, in most cases, BV is a sexually transmitted disease.16,17 For women who have sex with women, the rate of BV concordance among partners is high. If one woman has diagnosed BV and symptoms are present in her partner, treatment of the partner is reasonable. For women with BV who have sex with men, sexual intercourse influences disease activity, and consistent use of condoms may reduce the rate of recurrence.18 Male circumcision may reduce the risk of BV in female partners.19
Related article:
Bacterial vaginosis: Meet patients' needs with effective diagnosis and treatment
Over-the-counter treatments
In women with BV it is thought that the vaginal administration of lactic acid can help restore the normal acidic pH of the vagina, encourage the growth of lactobacilli, and suppress the growth of the bacteria that cause BV.20 Many products containing lactic acid in a formulation for vaginal use are available (among them Luvena and Gynofit gel).
Lactobacilli play an important role in maintaining vaginal health. Lactobacillus rhamnosus and Lactobacillus reuteri are available for purchase as supplements for oral administration. It is thought that oral administration of lactobacilli can help improve the vaginal microbiome. In one clinical trial, 125 women with BV were randomly assigned to receive the combination of 1 week of metronidazole plus oral Lactobacillus twice daily for 30 days or metronidazole plus placebo.21 Resolution of symptoms was reported as 88% and 40% in the metronidazole-lactobacilli and metronidazole-placebo groups, respectively.21 By contrast, one systematic review of probiotic treatment of BV concluded that there is insufficient evidence to recommend for or against probiotic treatment of BV.22 Patients with recurrent BV commonly report that they believe a probiotic was helpful in resolving their symptoms.
On the horizon
In one trial, a single 2-g oral dose of secnidazole was as effective as a 7-day course of oral metronidazole 500 mg twice daily.23 In a small dose-finding study, a single dose of either secnidazole 1 g or 2 g was equally effective in treating BV.24 An effective single-dose treatment of BV would likely improve patient adherence with therapy. Symbiomix is preparing for FDA review of this medication (secnidazole, Solosec) for use in the United States.
BV is a prevalent problem and often adversely impacts a woman's quality of life and love relationships. BV recurrence is very common. Many women report that their BV was resistant to intermittet treatment and recurred, repetitively over many years. The 3 treatment options presented in this editorial may help to suppress the recurrence rate and improve symptoms.
Share your thoughts! Send your Letter to the Editor to [email protected]. Please include your name and the city and state in which you practice.
- Schwebke JR, Muzny CA, Josey WE. Role of Gardnerella vaginalis in the pathogenesis of bacterial vaginosis: a conceptual model. J Infect Dis. 2014;210(3):338-343.
- Bradshaw CS, Morton AN, Hocking J, et al. High recurrence rates of bacterial vaginosis over the course of 12 months after oral metronidazole therapy and factors associated with recurrence. J Infect Dis. 2006;193(11):1478-1486.
- Murphy K, Mitchell CM. The interplay of host immunity, environment and the risk of bacterial vaginosis and associated reproductive health outcomes. J Infect Dis. 2016;214(suppl 1):S29-S35.
- Mulhem E, Boyanton BL Jr, Robinson-Dunn B, Ebert C, Dzebo R. Performance of the Affirm VP-III using residual vaginal discharge collected from the speculum to characterize vaginitis in symptomatic women. J Low Genit Tract Dis. 2014;18(4):344-346.
- Bradshaw CS, Morton AN, Garland SM, Horvath LB, Kuzevska I, Fairley CK. Evaluation of a point-of-care test, BVBLue, and clinical and laboratory criteria for diagnosis of bacterial vaginosis. J Clin Microbiol. 2005;43(3):1304-1308.
- 2015 Sexually transmitted disease treatment guidelines: Bacterial vaginosis. Centers for Disease Control and Prevention website. https://www.cdc.gov/std/tg2015/bv.htm. Updated June 4,2015. Accessed June 9, 2017.
- Sobel JD, Ferris D, Schwebke J, et al. Suppressive antibacterial therapy with 0.75% metronidazole vaginal gel to prevent recurrent bacterial vaginosis. Am J Obstet Gynecol. 2006;194(5):1283-1289.
- Reichman O, Akins R, Sobel JD. Boric acid addition to suppressive antimicrobial therapy for recurrent bacterial vaginosis. Sex Transm Dis. 2009;36(11):732-734.
- Wong LC, Heimbach MD, Truscott DR, Duncan BD. Boric acid poisoning: report of 11 cases. Can Med Assoc J. 1964;90:1018-1023.
- Teshima D, Morishita K, Ueda Y, et al. Clinical management of boric acid ingestion: pharmacokinetic assessment of efficacy of hemodialysis for treatment of acute boric acid poisoning. J Pharmacobiodyn. 1992;15(6):287-294.
- Di Renzo F, Cappelletti G, Broccia ML, Giavini E, Menegola E. Boric acid inhibits embryonic histone deacetylases: a suggested mechanism to explain boric acid-related teratogenicity. Toxicol Appl Pharmacol. 2007;220(2):178-185.
- Muzny CA, Schwebke JR. Biofilms: an underappreciated mechanism of treatment failure and recurrence in vaginal infections. Clin Infect Dis. 2015;61(4):601-606.
- McClelland RS, Richardson BA, Hassan WM, et al. Improvement of vaginal health for Kenyan women at risk for acquisition of human immunodeficiency virus type 1: results of a randomized trial. J Infect Dis. 2008;197(10):1361-1368.
- Sanchez S, Garcia PJ, Thomas KK, Catlin M, Holmes KK. Intravaginal metronidazole gel versus metronidazole plus nystatin ovules for bacterial vaginosis: a randomized controlled trial. Am J Obstet Gynecol. 2004;191(6):1898-1906.
- Mehta SD. Systematic review of randomized trials of treatment of male sexual partners for improved bacteria vaginosis outcomes in women. Sex Transm Dis. 2012;39(10):822-830.
- Muzny CA, Schwebke JR. Pathogenesis of bacterial vaginosis: discussion of current hypotheses. J Infect Dis. 2016;214(suppl 1):S1-S5.
- Vodstrcil LA, Walker SM, Hocking JS, et al. Incident bacterial vaginosis (BV) in women who have sex with women is associated with behaviors that suggest sexual transmission of BV. Clin Infect Dis. 2015;60(7):1042-1053.
- Bradshaw CS, Vodstrcil LA, Hocking JS, et al. Recurrence of bacterial vaginosis is significantly associated with posttreatment sexual activities and hormonal contraceptive use. Clin Infect Dis. 2013;56(6):777-786.
- Gray RH, Kigozi G, Serwadda D, et al. The effects of male circumcision on female partners' genital tract symptoms and vaginal infections in a randomized trial in Rakai, Uganda. Am J Obstet Gynecol. 2009;200(1):42.e1-e7.
- O'Hanlon DE, Moench TR, Cone RA. In vaginal fluid, bacteria associated with bacterial vaginosis can be suppressed with lactic acid but not hydrogen peroxide. BMC Infect Dis. 2011;11:200.
- Anukam K, Osazuwa E, Ahonkhai I, et al. Augmentation of antimicrobial metronidazole therapy of bacterial vaginosis with oral probiotic Lactobacillus rhamnosus GR-1 and Lactobacillus reuteri RC-14: randomized, double-blind, placebo controlled trial. Microbes Infect. 2006;8(6):1450-1454.
- Senok AC, Verstraelen H, Temmerman M, Botta GA. Probiotics for the treatment of bacterial vaginosis. Cochrane Database Syst Rev. 2009;(4):CD006289.
- Bohbot JM, Vicaut E, Fagnen D, Brauman M. Treatment of bacterial vaginosis: a multicenter, double-blind, double-dummy, randomised phase III study comparing secnidazole and metronidazole. Infect Dis Obstet Gynecol. 2010;2010. doi:10.1155/2010/705692.
- Núñez JT, Gómez G. Low-dose secnidazole in the treatment of bacterial vaginosis. Int J Gynaecol Obstet. 2005;88(3):281-285.
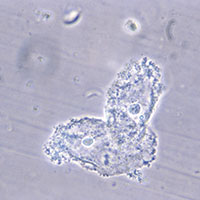
Gene therapy for spinal muscular atrophy shows promise in early study
BOSTON – Promising results were evident in an ongoing phase I study of a gene therapy for spinal muscular atrophy type 1 (SMA1), with children in the trial walking, talking, and moving.
After a single intravenous infusion of the therapy, AVXS-101, children in the industry-funded study achieved unexpected progress in terms of physical achievement ad survival, researchers reported at the annual meeting of the American Academy of Neurology.
Video clips showed children in the trial rolling, sitting unassisted, and showing normal levels of hand and fine motor control. No other children with SMA1 have been reported to reach any major motor milestone.
In one clip, an 18-month-old boy toddles down a hallway and carries an electronic toy to an elevator where he reaches up to press the button. “He’s basically completely back to normal. You see and examine him; it just about takes your breath away,” said the study’s lead investigator, Jerry R. Mendell, MD, a neurologist at Nationwide Children’s Hospital, Columbus, Ohio.

All 15 patients in the study were alive as of the AAN presentation, with six older than aged 2 years. Previous studies have reported various life expectancies for SMA1 patients: A 2010 Korean study of 14 SMA1 patients reported that the average lifespan was 22.8 ± 2.0 months (Korean J Pediatr. 2010 Nov;53[11]:965-70), while a 2007 Hong Kong study (n = 22) found that only 30% survived to aged 4 years and all survivors were venilator-dependent (Pediatrics. 2004 Nov;114[5]:e548-53).
The open label phase I dose-escalating study recruited 15 patients (nine under aged 9 months; six 6 under aged 6 months) with SMA1 as defined by genetic criteria and onset between birth and 6 months. All received a one-time intravenous infusion of AVXS-101 after a 1-mg/1-kg dose of prednisolone the previous day. AVXS-101 is designed to boost levels of the SMN protein via delivery of a functional human SMN gene into motor neuron cells.
The first cohort of three patients received one dose. All survived to greater than aged 30 months, although one did require respiratory assistance at about 30 months, said Dr. Mendell, professor of pediatrics, neurology, pathology, and physiology and cell Biology at Ohio State University, Columbus.
Researchers moved to a larger dose, “the highest amount of virus that’s ever been given in any clinical trial,” Dr. Mendell said. The first patient has passed 30 months of age, and 9 patients have reached at least 20 months, he noted.
In this second cohort, all patients “are able to bring hand to mouth, which is obviously important for feeding. Eleven of the 12 have good head control, and 9 of the patients can roll over. And 11 can sit without assistance,” he said.
In addition, eight can sit more than 30 seconds, and two can crawl, stand, and walk independently. Eight of 12 patients are speaking, and 11 of 12 are feeding orally.
To date, five treatment-related adverse events in four patients have been reported – all asymptomatic increases in liver function enzymes, which resolved.
The study is funded by AveXis, the company developing this gene therapy. Dr. Mendell reported compensation for consulting and research support from AveXis and Sarepta Therapeutics.
BOSTON – Promising results were evident in an ongoing phase I study of a gene therapy for spinal muscular atrophy type 1 (SMA1), with children in the trial walking, talking, and moving.
After a single intravenous infusion of the therapy, AVXS-101, children in the industry-funded study achieved unexpected progress in terms of physical achievement ad survival, researchers reported at the annual meeting of the American Academy of Neurology.
Video clips showed children in the trial rolling, sitting unassisted, and showing normal levels of hand and fine motor control. No other children with SMA1 have been reported to reach any major motor milestone.
In one clip, an 18-month-old boy toddles down a hallway and carries an electronic toy to an elevator where he reaches up to press the button. “He’s basically completely back to normal. You see and examine him; it just about takes your breath away,” said the study’s lead investigator, Jerry R. Mendell, MD, a neurologist at Nationwide Children’s Hospital, Columbus, Ohio.
All 15 patients in the study were alive as of the AAN presentation, with six older than aged 2 years. Previous studies have reported various life expectancies for SMA1 patients: A 2010 Korean study of 14 SMA1 patients reported that the average lifespan was 22.8 ± 2.0 months (Korean J Pediatr. 2010 Nov;53[11]:965-70), while a 2007 Hong Kong study (n = 22) found that only 30% survived to aged 4 years and all survivors were venilator-dependent (Pediatrics. 2004 Nov;114[5]:e548-53).
The open label phase I dose-escalating study recruited 15 patients (nine under aged 9 months; six 6 under aged 6 months) with SMA1 as defined by genetic criteria and onset between birth and 6 months. All received a one-time intravenous infusion of AVXS-101 after a 1-mg/1-kg dose of prednisolone the previous day. AVXS-101 is designed to boost levels of the SMN protein via delivery of a functional human SMN gene into motor neuron cells.
The first cohort of three patients received one dose. All survived to greater than aged 30 months, although one did require respiratory assistance at about 30 months, said Dr. Mendell, professor of pediatrics, neurology, pathology, and physiology and cell Biology at Ohio State University, Columbus.
Researchers moved to a larger dose, “the highest amount of virus that’s ever been given in any clinical trial,” Dr. Mendell said. The first patient has passed 30 months of age, and 9 patients have reached at least 20 months, he noted.
In this second cohort, all patients “are able to bring hand to mouth, which is obviously important for feeding. Eleven of the 12 have good head control, and 9 of the patients can roll over. And 11 can sit without assistance,” he said.
In addition, eight can sit more than 30 seconds, and two can crawl, stand, and walk independently. Eight of 12 patients are speaking, and 11 of 12 are feeding orally.
To date, five treatment-related adverse events in four patients have been reported – all asymptomatic increases in liver function enzymes, which resolved.
The study is funded by AveXis, the company developing this gene therapy. Dr. Mendell reported compensation for consulting and research support from AveXis and Sarepta Therapeutics.
AT AAN 2017
Red flags for type 2 diabetes seen 25 years before diagnosis
SAN DIEGO – Based on their analysis of a cohort of more than half a million people, Swedish researchers now believe that mildly elevated fasting plasma glucose and triglyceride levels could indicate an increased risk for type 2 diabetes a quarter-century before diagnosis.
“Previous studies have shown that risk factors for type 2 diabetes, including obesity and elevated fasting glucose, may be present up to 10 years before disease onset. Our study extends this period to more than 20 years before diagnosis,” said the study’s lead author Håkan Malmström, PhD, an epidemiologist with the Karolinska Institute, Stockholm. “Even small elevations in subjects over time early in life may be important to recognize, in particular for people who are overweight or obese.” The study findings were presented in an oral presentation at the scientific sessions of the American Diabetes Association.
The researchers identified 47,997 new type 2 diabetes cases in a Swedish cohort of 537,119 people tracked from 1985-2012. For each case, they compared risk factors from clinical examinations performed from 1985-1996 with those of five matched controls.

They found that on average, several risk factors were more common among individuals with type 2 diabetes, compared with the matched controls “many years before the diagnosis,” Dr. Malmström said. “In particular, BMI [body mass index], fasting triglycerides, fasting glucose, the apo B/apo A-I ratio and inflammatory markers were increased up to 25 years before the diagnosis.”
For example, 25 years before diagnosis, mean fasting plasma glucose in the type 2 diabetes group was higher than controls at 90 mg/dL vs. 86 mg/dL, respectively. By 10 years before diagnosis, that gap had widened to 98 mg/dL vs. 88 mg/dL. At 1 year before diagnosis, the levels were 106 mg/dl vs. 90 mg/dL.
As for fasting triglycerides, high levels earlier in life appeared to be especially risky: Individuals with levels over 124 mg/dL were more likely to develop type 2 diabetes 20 years later, even if they weren’t overweight or had elevated mean fasting glucose levels.
At 25 years before diagnosis, the type 2 diabetes group had mean fasting triglyceride levels of 120 mg/dL vs. 89 mg/dL in the control group. And at 1 year before diagnosis, the difference had widened to 146 mg/dL vs. 106 mg/dL.
Researchers found signs of higher levels of fructosamine – a marker of glycemic levels over an extended period of time (2-3 weeks) – at about 15 years before diagnosis. According to Dr. Malmström, this finding suggests that “glucose metabolism was starting to become more disturbed later than the changes in fasting glucose, but still many years before the type 2 diabetes diagnosis.”
He speculated that early signs of type 2 diabetes revealed by the study are related to genetic predisposition. “The risk of developing the disease presents early with increased BMI and dyslipidemia, which in turn leads to successively decreased insulin sensitivity,” he said.
One step for future research, he added, would be to “elaborate on these early changes in risk factors and create a risk score based on a few easily available factors in clinical settings.”
The study was funded by Sweden’s Gunnar and Ingmar Jungner Foundation for Laboratory Medicine. Dr. Malmström reported no relevant disclosures.
SAN DIEGO – Based on their analysis of a cohort of more than half a million people, Swedish researchers now believe that mildly elevated fasting plasma glucose and triglyceride levels could indicate an increased risk for type 2 diabetes a quarter-century before diagnosis.
“Previous studies have shown that risk factors for type 2 diabetes, including obesity and elevated fasting glucose, may be present up to 10 years before disease onset. Our study extends this period to more than 20 years before diagnosis,” said the study’s lead author Håkan Malmström, PhD, an epidemiologist with the Karolinska Institute, Stockholm. “Even small elevations in subjects over time early in life may be important to recognize, in particular for people who are overweight or obese.” The study findings were presented in an oral presentation at the scientific sessions of the American Diabetes Association.
The researchers identified 47,997 new type 2 diabetes cases in a Swedish cohort of 537,119 people tracked from 1985-2012. For each case, they compared risk factors from clinical examinations performed from 1985-1996 with those of five matched controls.
They found that on average, several risk factors were more common among individuals with type 2 diabetes, compared with the matched controls “many years before the diagnosis,” Dr. Malmström said. “In particular, BMI [body mass index], fasting triglycerides, fasting glucose, the apo B/apo A-I ratio and inflammatory markers were increased up to 25 years before the diagnosis.”
For example, 25 years before diagnosis, mean fasting plasma glucose in the type 2 diabetes group was higher than controls at 90 mg/dL vs. 86 mg/dL, respectively. By 10 years before diagnosis, that gap had widened to 98 mg/dL vs. 88 mg/dL. At 1 year before diagnosis, the levels were 106 mg/dl vs. 90 mg/dL.
As for fasting triglycerides, high levels earlier in life appeared to be especially risky: Individuals with levels over 124 mg/dL were more likely to develop type 2 diabetes 20 years later, even if they weren’t overweight or had elevated mean fasting glucose levels.
At 25 years before diagnosis, the type 2 diabetes group had mean fasting triglyceride levels of 120 mg/dL vs. 89 mg/dL in the control group. And at 1 year before diagnosis, the difference had widened to 146 mg/dL vs. 106 mg/dL.
Researchers found signs of higher levels of fructosamine – a marker of glycemic levels over an extended period of time (2-3 weeks) – at about 15 years before diagnosis. According to Dr. Malmström, this finding suggests that “glucose metabolism was starting to become more disturbed later than the changes in fasting glucose, but still many years before the type 2 diabetes diagnosis.”
He speculated that early signs of type 2 diabetes revealed by the study are related to genetic predisposition. “The risk of developing the disease presents early with increased BMI and dyslipidemia, which in turn leads to successively decreased insulin sensitivity,” he said.
One step for future research, he added, would be to “elaborate on these early changes in risk factors and create a risk score based on a few easily available factors in clinical settings.”
The study was funded by Sweden’s Gunnar and Ingmar Jungner Foundation for Laboratory Medicine. Dr. Malmström reported no relevant disclosures.
AT THE ADA ANNUAL SCIENTIFIC SESSIONS
Top free menstrual cycle tracking apps for your patients
App overload is a challenge for both providers and patients. As of September 2015, the number of health apps in the US Apple iTunes and Google Play stores exceeded 165,000, with approximately 7% focused on women's health and pregnancy.1 Clinicians express interest in promoting the use of health apps with their patients and seek guidance about making app recommendations.2 In my prior articles in this "App review" series, I have recommended due date calculator and drug reference apps.
One area in which an app may enhance your patient care is in menstrual cycle tracking. Patients may be more honest with their phones than with their health care professionals, and the results are more accurate than paper questionnaires and calendars.3 Of note, menstrual cycle tracking apps are the fourth most popular health app among adults and likely even more popular if limited to adult women.4
Dr. Paula Castano and her team systematically identified and evaluated free menstrual cycle tracking apps.5 The accuracy of each app was determined by menstrual cycle predictions based on average cycle lengths of at least 3 previous cycles, ovulation predicted at 13 to 15 days prior to the start of the next cycle, and qualification that the application contained no misinformation.5
The top 3 recommended menstrual cycle tracking apps from Dr. Castano and colleagues' study are listed in the TABLE alphabetically and are detailed with a shortened version of the APPLICATIONS scoring system, APPLI (app comprehensiveness, price, platform, literature use, and important special features).6 I hope this column will allow you to feel more comfortable recommending these "vetted" apps to your patients.
Share your thoughts! Send your Letter to the Editor to [email protected]. Please include your name and the city and state in which you practice.
- IMS Institute for Healthcare Informatics. Patient adoption of mHealth. Parsippany (NJ): IMS Institute for Healthcare Informatics; 2015. http://www.imshealth.com/files/web/IMSH%20Institute/Reports/Patient%20Adoption%20of%20mHealth/IIHI_Patient_Adoption_of_mHealth.pdf. Published September 2015. Accessed June 6, 2017.
- Terry K. Prescribing mobile apps: What to consider. Med Econ. 2015;92(12):35-38, 40.
- Wortham J. We're more honest with our phones than our doctors. NY Times Magazine. https://www.nytimes.com/2016/03/27/magazine/were-more-honest-with-our-phones-than-with-our-doctors.html?_r=0. Published March 23, 2016. Accessed June 6. 2017.
- Fox S, Duggan M. Pew Research Center. Mobile Health 2012. http://www.pewinternet.org/files/old-media//Files/Reports/2012/PIP_MobileHealth2012_FINAL.pdf. Published November 8, 2012. Accessed June 6, 2017.
- Moglia M, Nguyen H, Chyjek K, Chen KT, Castano PM. Evaluation of smartphone menstrual cycle tracking applications using an adapted APPLICATIONS scoring system. Obstet Gynecol. 2016;127(6):1153-1160.
- Chyjek K, Farag S, Chen KT. Rating pregnancy wheel applications using the APPLICATIONS scoring system. Obstet Gynecol. 2015;125(6):1478-1483.

Dr. Chen is Professor of Obstetrics, Gynecology, and Reproductive Science and Medical Education, Vice-Chair of Ob-Gyn Education for the Mount Sinai Health System, Icahn School of Medicine, Mount Sinai, New York, New York.
The author reports receiving royalties from UpToDate, Inc.
Dr. Chen is Professor of Obstetrics, Gynecology, and Reproductive Science and Medical Education, Vice-Chair of Ob-Gyn Education for the Mount Sinai Health System, Icahn School of Medicine, Mount Sinai, New York, New York.
The author reports receiving royalties from UpToDate, Inc.
Dr. Chen is Professor of Obstetrics, Gynecology, and Reproductive Science and Medical Education, Vice-Chair of Ob-Gyn Education for the Mount Sinai Health System, Icahn School of Medicine, Mount Sinai, New York, New York.
The author reports receiving royalties from UpToDate, Inc.
App overload is a challenge for both providers and patients. As of September 2015, the number of health apps in the US Apple iTunes and Google Play stores exceeded 165,000, with approximately 7% focused on women's health and pregnancy.1 Clinicians express interest in promoting the use of health apps with their patients and seek guidance about making app recommendations.2 In my prior articles in this "App review" series, I have recommended due date calculator and drug reference apps.
One area in which an app may enhance your patient care is in menstrual cycle tracking. Patients may be more honest with their phones than with their health care professionals, and the results are more accurate than paper questionnaires and calendars.3 Of note, menstrual cycle tracking apps are the fourth most popular health app among adults and likely even more popular if limited to adult women.4
Dr. Paula Castano and her team systematically identified and evaluated free menstrual cycle tracking apps.5 The accuracy of each app was determined by menstrual cycle predictions based on average cycle lengths of at least 3 previous cycles, ovulation predicted at 13 to 15 days prior to the start of the next cycle, and qualification that the application contained no misinformation.5
The top 3 recommended menstrual cycle tracking apps from Dr. Castano and colleagues' study are listed in the TABLE alphabetically and are detailed with a shortened version of the APPLICATIONS scoring system, APPLI (app comprehensiveness, price, platform, literature use, and important special features).6 I hope this column will allow you to feel more comfortable recommending these "vetted" apps to your patients.
Share your thoughts! Send your Letter to the Editor to [email protected]. Please include your name and the city and state in which you practice.
- IMS Institute for Healthcare Informatics. Patient adoption of mHealth. Parsippany (NJ): IMS Institute for Healthcare Informatics; 2015. http://www.imshealth.com/files/web/IMSH%20Institute/Reports/Patient%20Adoption%20of%20mHealth/IIHI_Patient_Adoption_of_mHealth.pdf. Published September 2015. Accessed June 6, 2017.
- Terry K. Prescribing mobile apps: What to consider. Med Econ. 2015;92(12):35-38, 40.
- Wortham J. We're more honest with our phones than our doctors. NY Times Magazine. https://www.nytimes.com/2016/03/27/magazine/were-more-honest-with-our-phones-than-with-our-doctors.html?_r=0. Published March 23, 2016. Accessed June 6. 2017.
- Fox S, Duggan M. Pew Research Center. Mobile Health 2012. http://www.pewinternet.org/files/old-media//Files/Reports/2012/PIP_MobileHealth2012_FINAL.pdf. Published November 8, 2012. Accessed June 6, 2017.
- Moglia M, Nguyen H, Chyjek K, Chen KT, Castano PM. Evaluation of smartphone menstrual cycle tracking applications using an adapted APPLICATIONS scoring system. Obstet Gynecol. 2016;127(6):1153-1160.
- Chyjek K, Farag S, Chen KT. Rating pregnancy wheel applications using the APPLICATIONS scoring system. Obstet Gynecol. 2015;125(6):1478-1483.

Febrile Seizures: Evaluation and Treatment
From the Nationwide Children’s Hospital, Columbus, OH (Dr. Patel) and Cook Children’s Medical Center, Fort Worth, TX (Dr. Perry).
Abstract
- Objective: To review the current understanding and management of febrile seizures.
- Methods: Review of the literature.
- Results: Febrile seizures are a common manifestation in early childhood and very often a benign occurrence. For simple febrile seizures, minimal evaluation is necessary and treatment typically not warranted beyond reassurance and education of caregivers. For complex febrile seizures, additional evaluation in rare cases may suggest an underlying seizure tendency, though most follow a typical benign course of febrile seizures. In some cases, as-needed benzodiazepines used for prolonged or recurrent febrile seizures may be of value. There are well described epilepsy syndromes for which febrile seizures may be the initial manifestation and it is paramount that providers recognize the signs and symptoms of these syndromes in order to appropriately counsel families and initiate treatment or referral when warranted.
- Conclusion: Providers caring for pediatric patients should be aware of the clinical considerations in managing patients with febrile seizures.
Key words: febrile seizure; Dravat syndrome; GEFS+; PCDH19; FIRES; complex febrile seizure.
A febrile seizure is defined as a seizure in association with a febrile illness in the absence of a central nervous system infection or acute electrolyte imbalance in children older than 1 month of age without prior afebrile seizures [1]. The mechanism by which fever provokes a febrile seizure is unclear [2]. Febrile seizures are the most common type of childhood seizures, affecting 2% to 5% of children [1]. The age of onset is between 6 months and 5 years [3]; peak incidence occurs at about 18 months of age. Simple febrile seizures are the most common type of febrile seizure. By definition, they are generalized, last less than 10 minutes and only occur once in a 24-hour time-period. A complex febrile seizure is one with focal onset or one that occurs more than once during a febrile illness, or lasts more than 10 minutes. Febrile status epilepticus, a subtype of complex febrile seizures, represents about 25% of all episodes of childhood status epilepticus. They account for more than two-thirds of cases during the first 2 years of life.
The risk of reoccurrence after presenting with one febrile seizure is approximately 30%, with the risk being 60% after 2 febrile seizures and 90% after 3 [4–6]. Some families have an autosomal dominant inheritance pattern with polygenic inheritance suspected for the majority of patients presenting with febrile seizures.
Multiple chromosomes have been postulated to be associated with genetic susceptibility for febrile seizures, with siblings having a 25% increased risk and high concordance noted in monozygotic twins [7]. The pathophysiology for febrile seizures has been associated with a genetic risk associated with the rate of temperature rise with animal studies suggesting temperature regulation of c-aminobutyric acid (GABA) a receptors [2]. Other studies propose a link between genetic and environmental factors resulting in an inflammatory process which influences neuronal excitement predisposing one to a febrile seizure [8].
Debate exists between the relation of febrile seizures and childhood vaccinations. Seizures are rare following administration of childhood vaccines. Most seizures following administration of vaccines are simple febrile seizures [9]. Febrile seizures associated with vaccines are more associated with underlying epilepsy. In a study of patients with vaccine-related encephalopathy and febrile status epilepticus, the majority of patients were found to have Dravet syndrome; it was determined that the vaccine may have triggered an earlier onset of the presentation for Dravet in those predestined to develop this disease but did not adversely impact ultimate outcome [10].
In this article, we review simple and complex febrile seizures with a focus on clinical management. Epilepsy syndromes associated with febrile seizures are also discussed. Cases are provided to highlight important clinical considerations.
Case 1: Simple Febrile Seizure
A 9-month-old infant and his mother present to the pediatrician. The mother notes that the infant had an event of concern. She notes the infant had stiffness in all 4 extremities followed by jerking that lasted 30 to 60 seconds. The infant was not responsive during the event. He was sleepy afterward, but returned to normal soon after the event ended. After, she noted that the infant felt warm and she checked his temperature. He had a fever of 101°F. The infant has normal development and no other medical problems.
What are management considerations for simple febrile seizure?
A simple febrile seizure is the most common type of febrile seizure. They are generalized, lasting less than 10 minutes and only occur once in a 24-hour period. There is no increased risk of developing epilepsy or developmental delay for patients after the first simple febrile seizures when compared to other children [5,6]. The diagnosis is based on history provided and a physical examination including evaluation of body temperature [11,12].
No routine laboratory tests are needed as a result of a simple febrile seizure unless obtained to assist in identifying the fever source [3,11]. Routine EEG testing is not recommended for these patients [3,11]. Routine imaging of the brain is also not needed [3,11]. Only if a patient has signs of meningitis should a lumbar puncture be performed [11]. The American Academy of Pediatrics states that a lumbar puncture is strongly considered for those younger than 12 months if they present with their first complex febrile seizure as signs of meningitis may be absent in young children. For infants 6 to 12 months of age, a lumbar puncture can be considered when immunization status is deficient or unknown [13,14]. Also, a lumbar puncture is an option for children who are pretreated with antibiotics [11]. For patients younger than 6 months, data is lacking on the percentage of patients with bacterial meningitis following a simple febrile seizure.
Daily preventative therapy with an anti-epilepsy medication is not necessary [3,11]. A review of several treatment studies shows that some anti-epileptic medications are effective in preventing recurrent simple febrile seizures. Studies have demonstrated the effectiveness of phenobarbital, primidone, and valproic acid in preventing the recurrence of simple febrile seizures; however, the side effects of each medication outweighed the benefit [3]. Carbamazepine and phenytoin have not been shown to be effective in preventing recurrent febrile seizures [3].
For anxious caregivers with children having recurrent febrile seizures, a daily medication or treating with an abortive seizure medication at the time of a febrile illness can be considered [3,5,6,15]. Treating with an abortive medication may mask signs and symptoms of meningitis making evaluation more challenging [16]. Evidence does not support that using antipyretic medications such as acetaminophen or ibuprofen will reduce the recurrence of febrile seizures. The seizure usually is the first noticed symptom due to the rise of temperature being the cause of the febrile seizure in an otherwise well child prior to the seizure [11,17]. Damage to the brain and associated structures is not found with patients presenting with simple febrile seizures [5,6]. Education on all of these principles is strongly recommended for caregiver reassurance.
Case 2: Complex Febrile Seizure
A 1-year-old child presents to the emergency department. Mother was with the child and she noticed stiffness followed by jerking of the left arm and leg, which quickly became noted in both arms and legs. The episode appeared to last for 15 minutes before EMS arrived to the house. A medication was given to the child by EMS that stopped the event. EMS noted the child had a temperature of 101.5°F. The child was previously healthy and has had normal development thus far.
What is the epidemiology of complex febrile seizure?
A complex febrile seizure is one with focal onset, or one that occurs more than once during a febrile illness or lasts more than 10 minutes. They are less common, representing only 20% to 30% of all febrile seizures [18–20]. In The National Collaborative Perinatal Project (NCPP), 1706 children with febrile seizures were identified from 54,000 and were followed from birth until 7 years of age. The initial febrile seizure was defined as complex in about 28%. For all febrile seizures, focal features were present in 4%, prolonged duration (> 10 minutes) in 7.6%, and recurrent episodes within 24 hours in 16.2% [21]. Similar observations have been reported by Berg and Shinnar [5,6]. Of 136 children who had recurrences, 41.2% had one or more complex features and the strongest correlate of having recurrent complex febrile seizure was the number of recurrent seizures. They also found that children with complex recurrences had other recurrences that were not complex; however, complex features had a tendency to recur. Further, a strong association between focal onset and prolonged duration was found [5,6]. Previous studies established a correlation between complex attacks, particularly prolonged ones and young age (age < 1 year) [5,6]. Additionally, children with seizures with a relatively low fever (< 102°F) were slightly more likely to have a complex febrile seizure as the initial episode [5,6].
Children with febrile seizures are already at 4- to 5-fold increased risk for subsequent unprovoked seizures. A history of febrile seizures has been found in 13% to 18% of children with new-onset epilepsy. In the NCPP study, the predictors identified for the development of epilepsy following febrile seizures were an abnormal neurological and developmental status of the child before the seizure, a history of afebrile seizures in a parent or prior-born sibling, or complex features [21]. Ten percent of children with 2 or more of the previously mentioned risk factors (including complex features) developed epilepsy and 13% of them had seizures without fever [20,22]. Further, intractable epilepsy and neurological impair-ment have been found to be more common in children with prior prolonged febrile seizure, with no association to any specific seizure type [18,23–25]. The association between febrile seizures and mesial temporal sclerosis (MTS) is a commonly debated topic. Retrospective studies have reported an association between prolonged or atypical febrile seizures and intractable temporal lobe epilepsy. Epidemiological studies fail to show a causal relationship between febrile seizures and temporal lobe epilepsy [26]. This suggests that febrile seizures are a marker of susceptibility to seizures and future epilepsy (in some cases) rather than a direct cause. It is clear that a minority of cases of MTS or complex partial seizures are associated with prior febrile seizures [20,22].
What is the risk of intracranial pathology in complex febrile seizure?
Patients with complex febrile seizures usually seek medical attention [27]. However, the risk of acute pathology necessitating treatment changes based on neuroimaging was found to be very low and likely not necessary in the evaluation of complex febrile seizures during the acute presentation [27]. Imaging with a high-resolution brain MRI could be considered later on a routine basis for prolonged febrile seizures due to the possible association between prolonged febrile seizures and mesial temporal sclerosis [19,28,29].
Neuroimaging has provided evidence that hippocampal injury can occasionally occur during prolonged and focal febrile seizures in infants who otherwise appear normal. It has been speculated that a pre-existing abnormality increases the propensity to focal prolonged seizures and further hippocampal damage. Hesdorffer and colleagues [30] found definite abnormalities on MRI in 14.8% of children with complex febrile seizures and 11.4 % of simple febrile seizures among 159 children with a first febrile seizure. However, MRI abnormalities were related to a specific subtype of complex seizures: focal and prolonged. The most common abnormalities observed were subcortical focal hyperintensity, an abnormal white matter signal, and focal cortical dysplasia.
What are important aspects of the clinical evaluation?
The evaluation and management of the child with complex febrile seizures is debated as well. The most important part in the history and examination is to look for the source of the fever and rule out the presence of a CNS infection, since complex febrile seizures are much more frequently associated with meningitis than simple febrile seizures [16]. The American Academy of Pediatrics recommended that a lumbar puncture be strongly considered in infants younger than 12 months after a first febrile seizure and should be considered in children between 12 and 18 months of age, since signs of meningitis may be absent in young children [13]. If the threshold for a lumbar puncture is low in infants with febrile seizures in general, it should be even lower for children with complex febrile episodes for all the factors mentioned above. The guidelines developed in 1990 by the Royal College of Physicians and the British Paediatric Association concluded that indications for performing an lumbar puncture were complex febrile seizure, signs of meningismus, or a child who is unduly drowsy and irritable or systematically ill [21].
Obtaining an EEG within 24 hours of presentation may show generalized background slowing, which could make identifying possible epileptiform abnormalities difficult [22]. Therefore, a routine sleep deprived EEG when the child is back to baseline can be more useful in identifying if epileptiform abnormalities are present. If epileptiform abnormalities are present on a routine sleep deprived EEG, this may suggest the patient is at higher risk for developing future epilepsy and the febrile illness lowered the seizure threshold; however, it is unclear whether clinical management would change as a result [31].
What treatment options are available?
Complications with prolonged and/or recurrent seizures can occur. Treatments options can be stratified into 3 possible categories: emergency rescue treatment for prolonged or a cluster of febrile seizures, intermittent treatment at the time of illness, and chronic use of medication. Treatment options for complex febrile seizures may include the use of a rescue seizure medication when the febrile seizure is prolonged. Rectal preparations of diazepam gel can be effective in stopping an ongoing seizure and can be provided for home use in patients with known recurrence of febrile status epilepticus [3]. For children and adolescents where a rectal administration is not ideal, intranasal versed can be utilized instead of rectal diazepam. In addition, the use of an intermittent benzodiazepine at the onset of febrile illness can also be considered a treatment option. Using oral diazepam at the time of a febrile illness has been demonstrated in reducing the recurrence of febrile seizures [3]. Other studies have shown similar results when using buccal midazolam [32]. No adequate studies have been performed using second- or third-generation anti-epilepsy medications in the treatment of recurrent of complex febrile seizures [3].
It is unclear whether benefit is present to using intermittent benzodiazepine doses prior or during a febrile illness for those prone for recurrent febrile seizures [33]. Physicians may consider this option in patients with frequent recurrent seizures, when caregivers can identify the fever before the seizure occurs.
Overall, parental education of efficacy and side effect profiles should be discussed in detail when considering any treatment options for complex febrile seizures [34]. It is important to remember that the long-term prognosis in terms of developing epilepsy or neurological and cognitive problems is not influenced by the use of antiepileptic medications for recurrent febrile seizures [17]. Even in the case of prolonged febrile seizures in otherwise neurodevelopmentally normal children, antiepileptics have not been shown to cause damage to the brain [19].
Febrile Status Epilepticus
Febrile status epilepticus is a subtype of complex febrile seizures and is defined as a febrile seizure lasting greater than 30 minutes. Overall, febrile status epilepticus accounts for approximately 5% of all presentations of febrile seizures [35]. It represents about 25% of all episodes of childhood status epilepticus and more than two-thirds of cases during the first 2 years of life. Literature suggests that an increased risk for focal epilepsy exists [36]. Children presenting with febrile status epilepticus are more likely to have a family history of epilepsy and a history of a previous neurological abnormality [22]. It is likely to reoccur if the first presentation was febrile status epilepticus. However, increased risk for death or developmental disability as a result of the seizure is not seen [37].
The prospective multicenter study of the consequences of prolonged febrile seizures in childhood (FEBSTAT) has been conducted. The study reported that febrile status epilepticus is usually focal (67% of episodes), occurs in very young children (median age 1.3 years), and is frequently the first febrile seizure [22]. In this study, the median duration of the seizure was about 68 minutes and 24% of children had an episode lasting more than 2 hours. In 87% of the events, seizures did not stop spontaneously and benzodiazepines were needed. Focal features observed were eye and head deviation, staring, and impaired consciousness prior to the seizure and an asymmetric convulsion or Todd’s paresis.
Case 3: Epilepsy Syndromes Associated With Febrile Seizures
A 1-year-old female presents for evaluation of seizures that began at age 8 months. Seizures are described as occurring in the setting of fever with bilateral symmetric tonic clonic activity lasting durations of less than 10 minutes on average, but at least 2 instances of seizure lasting 20 minutes or more. The family notes that seizures have occurred almost every time the child has had a febrile illness and often cluster over several days. They report at least 1 seizure that occurred in the absence of fever. Development has been normal to date and an EEG done by their primary provider was also normal.
What epilepsy syndromes are associated with febrile seizures?
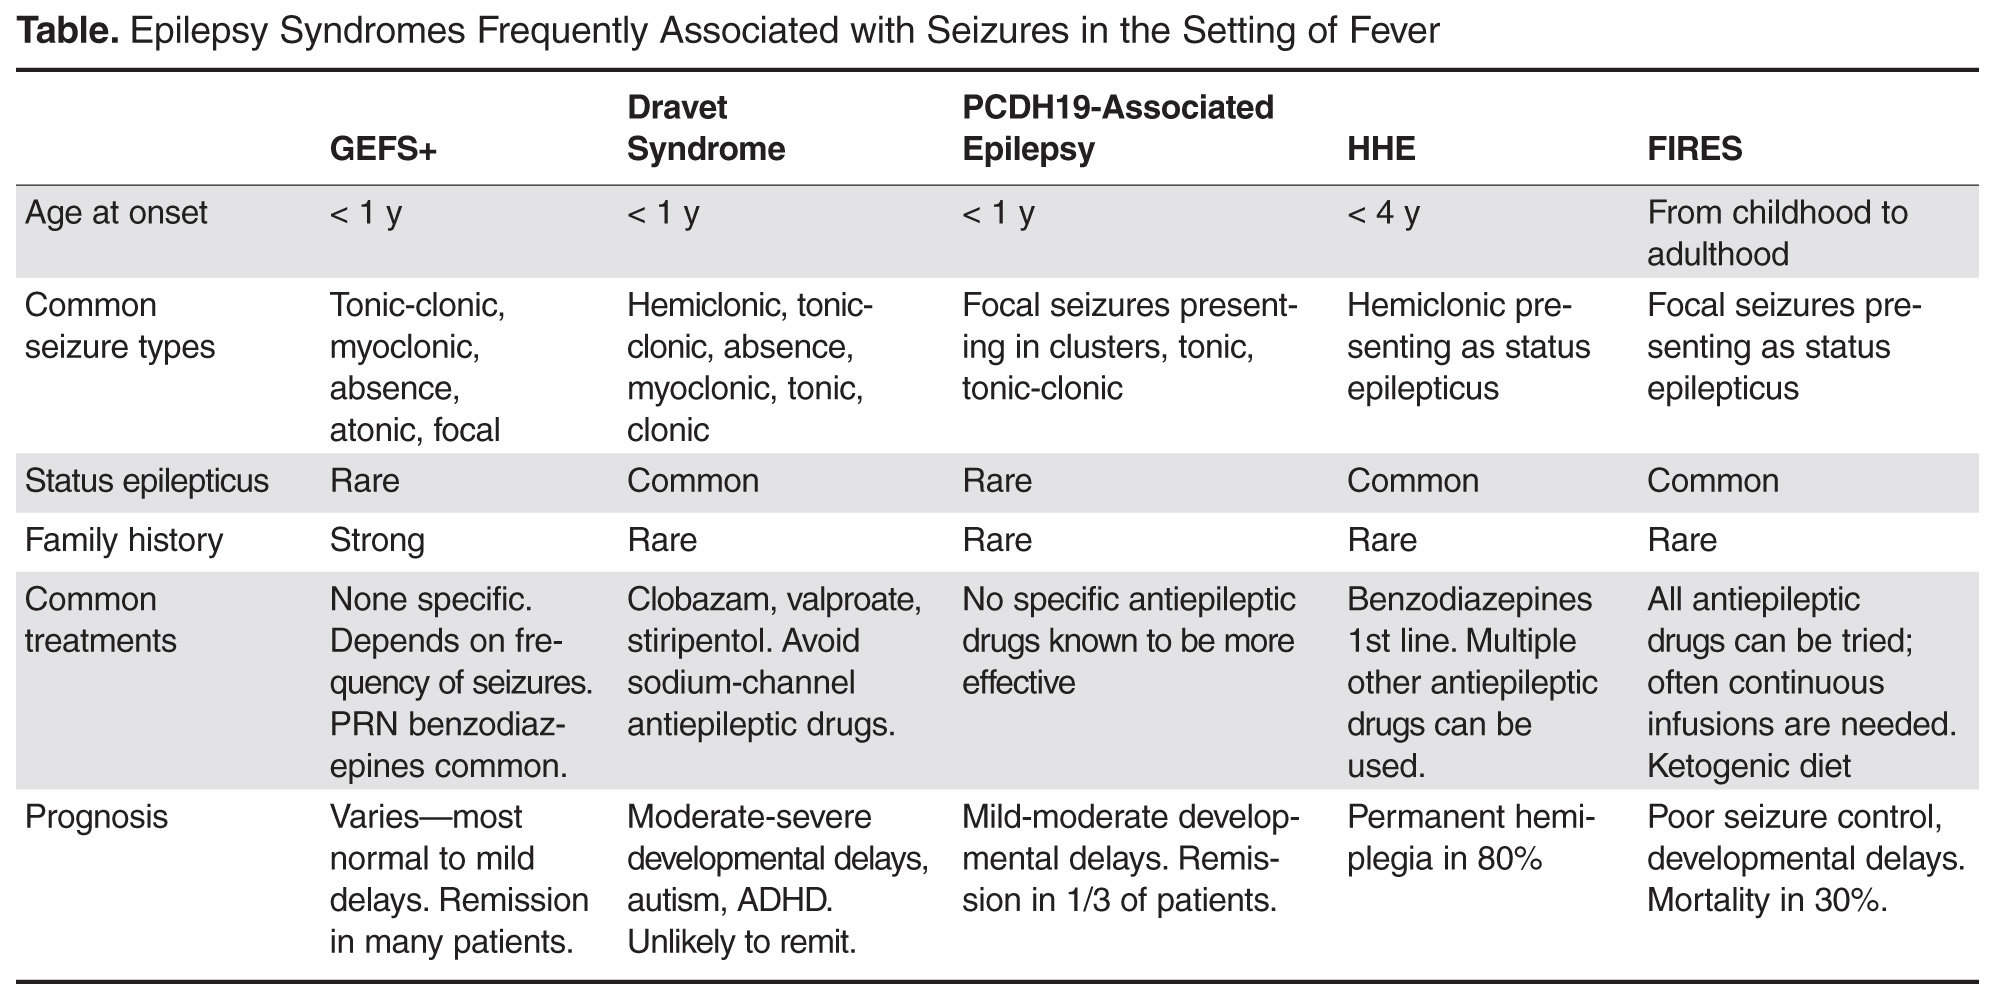
Genetic Epilepsy with Febrile Seizures Plus
GEFS+ was first described in 1997 following recognition of a pattern of febrile seizures followed later by the development of various epilepsy syndromes within the same family [38]. As such, the syndrome is defined based on the familial occurrence of febrile and afebrile seizures in at least 2 family members and can have a wide range of phenotypes. The most common presentation is of typical febrile seizures which can persist beyond the typical upper age limit of 6 years. Unprovoked generalized seizures of multiple types (ie, myoclonic, absence, atonic) occur at a later age, though focal seizures may also be present. The presence of focal onset seizures led to the naming change from “generalized” epilepsy with febrile seizures plus as it was previously referred. Seizure frequency and severity may vary between family members, as can response to treatment, making prognosis difficult to predict. As even in typical febrile seizures a family history of febrile seizure may be common, it may be difficult to diagnose the syndrome after the initial febrile seizure. However, if the family history is strong for a family member with a GEFS+ phenotype, one can appropriately counsel the family on the possibility that a similar course may evolve. While the majority of GEFS+ patients have milder phenotypes, some more severe phenotypes can have cognitive delays. Dravet syndrome falls within the spectrum of GEFS+ and is a prime example of the phenotypic continuum to more severe presentations in some patients.
The syndrome is believed to be inherited in an auto-somal dominant fashion with incomplete penetrance. Multiple genes have been implicated as a cause, though only 11.5% of families with clinical GEFS+ may have mutations [39]. SCN1A, encoding the α-subunit of the voltage-gated sodium channel is most frequently reported in GEFS+ families, yet is only found in 10% [38]. When associated with GEFS+, SCN1A mutations are more often missense type, whereas truncating and nonsense mutations are more commonly encountered in Dravet syndrome. Mutations in SCN1B encoding the β1 subunit of the voltage-gated sodium channel has also been reported [40]. Finally, the GABA(A) receptor gamma 2 subunit GABRG2 has been found in < 1% of GEFS+ families [39]. The variability in causative genes underscores the reasons for phenotype variability and it is likely that other modifier genes are responsible for the heterogeneity within GEFS+ families [41].
Dravet Syndrome
Dravet syndrome, often referred to as severe myoclonic epilepsy of infancy, was first described in 1978 and has since become one of the most recognized genetic epilepsy syndromes [42]. The clinical presentation often begins with seizures in the first year of life, frequently in the setting of febrile illness. The initial seizures are generalized or hemiclonic in the majority and are often prolonged evolving to status epilepticus. Unlike typical febrile seizures, one should suspect Dravet syndrome in children that present with repetitive bouts of complex febrile seizures or febrile status epilepticus, especially if the associated seizure semiology is of hemiclonic type. In addition, seizures in the setting of modest hyperthermia (ie, hot baths) should raise suspicion for this condition. Commonly EEG and MRI are normal in the first year of life and psychomotor development remains normal until typically the second year of life [43].
By the second year, other seizure types including myoclonic, atypical absence, clonic, and tonic seizures arise. The EEG frequently begins to show generalized spike wave and polyspike wave discharges. Seizures continue occurring frequently during early childhood, often resulting in status epilepticus. Cognitive development begins to stagnate between the ages of 1 and 4 years with emergence of autistic traits and hyperactivity [44]. Development may stabilize between the ages of 5 and 16 years, but fails to demonstrate much improvement [44]. Higher frequency of seizures may correlate with increase in cognitive impairment and behavior problems, supporting the need for rapid diagnosis and appropriate therapy [44].
Over the years, several cases of atypical or borderline Dravet syndrome have been described, most highlighting the absence of myoclonic seizures [45]. Others may present with primarily clonic or tonic-clonic type seizures only [46]. Despite these differences, all cases share a similar drug resistance and cognitive delay and are categorized as Dravet syndrome.
In 2001, Claus et al discovered the genetic alteration in SCN1A responsible for 70% of Dravet syndrome cases [47]. The disorder is inherited in an autosomal dominant fashion, though 40% to 80% of mutations resulting in Dravet syndrome are de novo [48]. Mutations can be present in other family members, as this syndrome is part of the spectrum of GEFS+, though parental phenotypes are often much less severe. Approximately 50% of mutations resulting in Dravet syndrome are truncating, while the other 50% are missense mutations involving splice site or pore forming regions leading to loss of function [49]. Finally, small and large chromosome rearrangements make up 2% to 3% of cases [50]. Other genes reported to result in Dravet syndrome include SCN1B and GABRG2 mutations. In addition, PCDH19 can produce a phenotype similar to Dravet syndrome in females and is discussed in more detail below.
With the emergence of more rapid and cheaper forms of genetic testing, molecular diagnosis can now be made earlier in life before all the typical clinical features of Dravet syndrome arise. As a result, one might hope to alter treatment strategy and gear therapy towards the most effective medications. While drug resistance is the norm for the condition, certain drugs such as benzodiazepines, valproate, and stiripentol may be most effective [43]. Topiramate and levetiracetam have been reported as effi-cacious in small series, as has the ketogenic diet [51–55]. Varieties of medications which target sodium channels are known to exacerbate seizures in Dravet syndrome and should be avoided, including lamotrigine, carbamazepine, oxcarbazepine, and phenytoin [56]. In addition to maintenance therapy, it is important to provide patients with a rescue plan for acute seizures in an effort to avoid status epilepticus. In addition, measures to avoid overheating may provide additional benefit.
Case 3 Continued
After a careful history, the physician discovers that the child also has frequent myoclonic seizures described as brief jerks of the extremities or sudden forward falls. The family notes they have seen these seizures more frequently since antiepileptic therapy was started. The physician recognize that this child may have Dravet syndrome and suspect her medication may be resulting in aggravation of seizures.
The physician decides to discontinue the medication suspected to aggravate the seizures and chooses to start the child on clobazam. The physician also begins evaluation for Dravet syndrome by sending directed SCN1A genetic testing. The testing comes back negative for mutations in the SCN1A gene.
What other investigations would be warranted now?
PCDH19
PCDH19 was first recognized as a cause of epilepsy and mental retardation limited to females (EFMR), a syndrome characterized by onset of seizures in infancy or early childhood with predominantly generalized type seizures including tonic-clonic, absence, myoclonic, tonic, and atonic [57]. Since that initial description, the phenotype associated with PCDH19 mutations has expanded to include female patients with primarily focal epilepsy, variable cognitive impairment, and commonly onset with seizures in the setting of fever [58,59]. Typically seizures begin around age 10 months presenting as a cluster of focal seizures in the setting of fever, often followed by a second cluster 6 months later [59]. Generalized seizures occur in a small proportion of patients (9%) and this feature, along with relatively fewer bouts of status epilepticus and less frequent seizures (most monthly to yearly frequency) can differentiate PCDH19 associated epilepsy from Dravet syndrome [59]. Seizures tend to improve with age and no particular antiepileptic drug has been found especially efficacious in the syndrome. Unlike Dravet syndrome, up to a third of patients with this syndrome may ultimately become seizure-free [59].
Cognitive development is normal prior to seizure onset in the majority of patients and most but not all patients will develop some cognitive impairment ranging from mild to severe [59]. It is the more severe patients that most often have overlapping characteristics of Dravet syndrome, thus PCDH19 mutations should be investigated in female patients with Dravet phenotype yet negative SCN1A testing.
PCDH19 is a calcium-dependent adhesion protein involved in neuronal circuit formation during development and in the maintenance of normal synaptic circuits in adulthood [60,61]. Disease causing mutations in PCDH19 are primarily missense (48.5%) or frameshift, nonsense, and splice-site mutations resulting in premature termination codon [59]. Ninety percent of mutations are de novo. When inherited, the disorder is X-linked and may come from an unaffected father or a mother that is similarly affected or not, suggesting variable clinical severity in females and gender-related protections in males [59].
Case 3 Continued
Given the negative SCN1A testing, the physician chooses to pursue other genetic testing that may explain the patient’s phenotype. A more extensive “epilepsy gene panel” that includes 70 different genes associated with epilepsy syndromes is ordered.
Hemiconvulsion-Hemiplegia Epilepsy Syndrome
Hemiconvulsion-hemiplegia epilepsy syndrome (HHE) is characterized by the occurrence of unilateral convulsive status epilepticus followed by transient or permanent ipsilateral hemiplegia. The syndrome occurs in otherwise healthy children often in the setting of nonspecific febrile illness before the age of 4 years, with peak occurrence in the first 2 years of life [62]. Seizures are characterized by unilateral clonic activity with EEG demonstrating rhythmic 2–3 Hz slow wave activity and spikes in the hemisphere contralateral to the body involvement. MRI frequently demonstrates diffusion changes congruent with EEG findings, often in the perisylvian region. The hemiplegia that remains following status epilepticus is permanent in up to 80% of cases [63]. As hemiplegia can occur following complex febrile seizures, it is recommended a minimum duration of hemiplegia of 1 week be used to differentiate HHE [64]. Status epilepticus is persistent in this syndrome and can last for hours if untreated. Focal onset seizures will often continue to occur in the patient even after the status has been aborted.
The etiology of HHE is variable with many cases idiopathic. Some cases are reported as symptomatic, as the syndrome can present in the setting of other underlying brain disorders such as Sturge-Weber and tuberous sclerosis complex. While some viruses have been proposed as a cause, they are not found in the cerebral spinal fluid of patients [65]. Treatment consists of rapid treatment of status epilepticus with benzodiazepines as first-line therapy, often followed by other intravenous antiepileptic drugs as necessary.
Febrile Infection–Related Epilepsy Syndrome
Febrile infection–related epilepsy syndrome (FIRES) is presented under several names in the literature including idiopathic catastrophic epileptic encephalopathy [66], devastating encephalopathy in school-age children [67], new-onset refractory status epilepticus [68], as well as fever-induced refractory epileptic encephalopathy syndrome [69] and fever-induced refractory epileptic encephalopathy in school-age children [70]. All describe rare catastrophic epilepsy presenting in otherwise healthy children during or days following a febrile illness. While febrile illness precedes the epilepsy in 96% of cases, up to 50% of patients may not have fever at the time they present [41,65]. While age of onset is typically in early childhood, presentation in adulthood also occurs. Initial seizures are often focal, presenting as forced lateral head or eye deviation, oral or manual automatisms, and clonic movements of the face and extremities. Seizures will inevitably progress to status epilepticus with ictal onset often multifocal predominating in the perisylvian regions [41]. MRI is often normal at onset or shows only subtle swelling of the mesial temporal structures. Over months, MRI often shows T2-hyperintensity and atrophy of the mesial temporal structures, though as many as 50% of MRIs may remain normal [71].
The evaluation for cause in FIRES is often unrewarding. Inflammatory markers are typically absent from both serum and CSF. CSF may show minimal pleocytosis with negative oligoclonal bands and absence of common receptor antibodies. Treatment is equally unrewarding with patients typically failing conventional antiepileptic drugs and continuous infusions titrated to burst suppression. Immunomodulatory therapies are mostly ineffective as well. The most useful therapy reported has been the keto-genic diet with efficacy in up to 50% of patients [72]. Recently, therapeutic hypothermia has also been reported to be effective in 2 cases [73]. For the majority of patients, therapy will remain ineffective and seizures will continue for weeks to months with gradual resolution, though seizures often continue intermittently following the end of status epilepticus. Prognosis is poor for seizure control and neurocognitive recovery with mortality of 30% reported [41].
Case 3 Conclusion
The epilepsy gene panel ordered returns with the result of a disease-causing mutation in the PCDH19 gene. The child is diagnosed with PCDH19-associated epilepsy and is treated with phenobarbital. For the first years of life, she presents on average once per year with a cluster of seizures in the setting of febrile illness which is often managed with short durations of scheduled benzodiazepines. Seizures slow by age 6. She has mild delays in speech and receives some accommodations through her school system. By age 10, she has been seizure-free for several years. She is able to be weaned off medications without recurrence of seizures.
Summary
Febrile seizures are a common manifestation in early childhood and very often a benign occurrence. For simple febrile seizures, minimal evaluation is necessary and treatment typically not warranted beyond reassurance and education of caregivers. For complex febrile seizures, additional evaluation in rare cases may suggest an underlying seizure tendency, though most follow a typical benign course of febrile seizures. In some cases, as needed benzodiazepines used for prolonged or recurrent febrile seizures may be of value. There are well described epilepsy syndromes for which febrile seizures may be the initial manifestation and it is paramount that providers recognize the signs and symptoms of these syndromes in order to appropriately counsel families and initiate treatment or referral when warranted. Providers should have a high index of suspicion for these syndromes when they encounter children that repeatedly present with prolonged febrile seizures, clusters of febrile seizures, or febrile seizures in addition to afebrile seizure events. Early referral, diagnosis, and treatment has the potential to alter outcome in some of these syndromes, thus the importance of becoming familiar with these diagnoses.
Corresponding author: Anup D. Patel, MD, Nationwide Children's Hospital, Columbus, OH 43205, [email protected].
Financial disclosures: Dr. Patel disclosed that he has consulted for GW Pharmaceuticals and Supernus and is on the Scientific Advisory Board for UCB Pharma.
1. Shinnar S, Glauser TA. Febrile seizures. J Child Neurol 2002;17 Suppl 1:S44–52.
2. Kang J-Q, Shen W, Macdonald RL. Why does fever trigger febrile seizures? GABAA receptor γ2 subunit mutations associated with idiopathic generalized epilepsies have temperature-dependent trafficking deficiencies. J Neurosci 2006;26:2590–7.
3. Baumann RJ, Duffner PK. Treatment of children with simple febrile seizures: the AAP practice parameter. American Academy of Pediatrics. Pediatr Neurol 2000;23:11–7.
4. Tarkka R, Rantala H, Uhari M, Pokka T. Risk of recurrence and outcome after the first febrile seizure. Pediatr Neurol 1998;18:218–20.
5. Berg AT, Shinnar S. Complex febrile seizures. Epilepsia 1996;37:126–33.
6. Berg AT, Shinnar S. Unprovoked seizures in children with febrile seizures: short-term outcome. Neurology 1996;47:562–8.
7. Audenaert D, Schwartz E, Claeys KG, et al. A novel GABRG2 mutation associated with febrile seizures. Neurology 2006;67:687–90.
8. Dube CM, Brewster AL, Baram TZ. Febrile seizures: mechanisms and relationship to epilepsy. Brain Dev 2009;31:366–71.
9. Vestergaard M, Christensen J. Register-based studies on febrile seizures in Denmark. Brain Dev 2009;31:372–7.
10. Berkovic SF, Petrou S. Febrile seizures: traffic slows in the heat. Trends Molecul Med 2006;12:343–4.
11. Practice parameter: the neurodiagnostic evaluation of the child with a first simple febrile seizure. American Academy of Pediatrics. Provisional Committee on Quality Improvement, Subcommittee on Febrile Seizures. Pediatrics 1996;97:769–72; discussion 773–765.
12. Fukuyama Y, Seki T, Ohtsuka C, et al. Practical guidelines for physicians in the management of febrile seizures. Brain Dev 1996;18:479–84.
13. Neurodiagnostic evaluation of the child with a simple febrile seizure. Pediatrics 2011;127:389–94.
14. Guedj R, Chappuy H, Titomanlio L, et al. Risk of bacterial meningitis in children 6 to 11 months of age with a first simple febrile seizure: a retrospective, cross-sectional, observational study. Acad Emerg Med 2015;22:1290–7.
15. Wo SB, Lee JH, Lee YJ, et al. Risk for developing epilepsy and epileptiform discharges on EEG in patients with febrile seizures. Brain Dev 2013;35:307–11.
16. Green SM, Rothrock SG, Clem KJ, et al. Can seizures be the sole manifestation of meningitis in febrile children? Pediatrics 1993;92:527–34.
17. Knudsen FU. Febrile seizures: treatment and prognosis. Epilepsia 2000;41:2–9.
18. Annegers JF, Hauser WA, Shirts SB, Kurland LT. Factors prognostic of unprovoked seizures after febrile convulsions. N Engl J Med 1987;316:493–8.
19. Teng D, Dayan P, Tyler S, et al. Risk of intracranial pathologic conditions requiring emergency intervention after a first complex febrile seizure episode among children. Pediatrics 2006;117:304–8.
20. Janszky J, Schulz R, Ebner A. Clinical features and surgical outcome of medial temporal lobe epilepsy with a history of complex febrile convulsions. Epilepsy Res 2003;55:1–8.
21. Capovilla G, Mastrangelo M, Romeo A, Vigevano F. Recommendations for the management of «febrile seizures»: Ad Hoc Task Force of LICE Guidelines Commission. Epilepsia 2009;50 Suppl 1:2–6.
22. Shinnar S, Hesdorffer DC, Nordli DR Jr, et al. Phenomenology of prolonged febrile seizures: results of the FEBSTAT study. Neurology 2008;71:170–6.
23. Camfield P, Camfield C, Gordon K, Dooley J. What types of epilepsy are preceded by febrile seizures? A population-based study of children. Dev Med Child Neurol 1994;36:887–92.
24. Nelson KB, Ellenberg JH. Predictors of epilepsy in children who have experienced febrile seizures. N Engl J Med 1976;295:1029–33.
25. Hamati-Haddad A, Abou-Khalil B. Epilepsy diagnosis and localization in patients with antecedent childhood febrile convulsions. Neurology 1998;50:917–22.
26. Davies KG, Hermann BP, Dohan FC Jr, et al. Relationship of hippocampal sclerosis to duration and age of onset of epilepsy, and childhood febrile seizures in temporal lobectomy patients. Epilepsy Res 1996;24:119–26.
27. Kimia AA, Ben-Joseph E, Prabhu S, et al. Yield of emergent neuroimaging among children presenting with a first complex febrile seizure. Pediatr Emerg Care 2012;28:316–21.
28. Abou-Khalil B, Andermann E, Andermann F, et al. Temporal lobe epilepsy after prolonged febrile convulsions: excellent outcome after surgical treatment. Epilepsia 1993;34:878–83.
29. Cendes F. Febrile seizures and mesial temporal sclerosis. Curr Opin Neurol 2004;17:161–4.
30. Hesdorffer DC, Chan S, Tian H, et al. Are MRI-detected brain abnormalities associated with febrile seizure type? Epilepsia 2008;49:765–71.
31. Patel AD, Vidaurre J. Complex febrile seizures: a practical guide to evaluation and treatment. J Child Neurol 2013;28:762–67.
32. Pavlidou E, Tzitiridou M, Panteliadis C. Effectiveness of intermittent diazepam prophylaxis in febrile seizures: long-term prospective controlled study. J Child Neurol 2006;21:1036–40.
33. Offringa M, Newton R. Prophylactic drug management for febrile seizures in children (Review). Evid Based Child Health 2013;8:1376–485.
34. Gordon KE, Dooley JM, Camfield PR, et al. Treatment of febrile seizures: the influence of treatment efficacy and side-effect profile on value to parents. Pediatrics 2001;108:1080–8.
35. Maytal J, Shinnar S. Febrile status epilepticus. Pediatrics 1990;86:611–6.
36. Ahmad S, Marsh ED. Febrile status epilepticus: current state of clinical and basic research. Semin Pediatr Neurol 2010;17:150–4.
37. Maytal J, Shinnar S, Moshe SL, Alvarez LA. Low morbidity and mortality of status epilepticus in children. Pediatrics 1989;83:323–31.
38. Scheffer IE, Berkovic SF. Generalized epilepsy with febrile seizures plus. A genetic disorder with heterogeneous clinical phenotypes. Brain 1997;120 (Pt 3):479–90.
39. Marini C, Mei D, Temudo T, et al. Idiopathic epilepsies with seizures precipitated by fever and SCN1A abnormalities. Epilepsia 2007;48:1678–85.
40. Wallace RH, Scheffer IE, Parasivam G, et al. Generalized epilepsy with febrile seizures plus: mutation of the sodium channel subunit SCN1B. Neurology 2002;58:1426–9.
41. Cross JH. Fever and fever-related epilepsies. Epilepsia 2012;53 Suppl 4:3–8.
42. Dravet C. Les epilepsies graves de l’enfant. Vie Med 1978;8:543–8.
43. Dravet C. Dravet syndrome history. Dev Med Child Neurol 2011;53 Suppl 2:1–6.
44. Wolff M, Casse-Perrot C, Dravet C. Severe myoclonic epilepsy of infants (Dravet syndrome): natural history and neuropsychological findings. Epilepsia 2006;47 Suppl 2:45–8.
45. Ogino T, Ohtsuka Y, Amano R, et al. An investigation on the borderland of severe myoclonic epilepsy in infancy. Jap J Psych Neurol 1988;42:554–5.
46. Kanazawa O. Refractory grand mal seizures with onset during infancy including severe myoclonic epilepsy in infancy. Brain Dev 2001;23:749–56.
47. van der Worp HB, Claus SP, Bar PR, et al. Reproducibility of measurements of cerebral infarct volume on CT scans. Stroke 2001;32:424–30.
48. Wang JW, Kurahashi H, Ishii A, et al. Microchromosomal deletions involving SCN1A and adjacent genes in severe myoclonic epilepsy in infancy. Epilepsia 2008;49:1528–34.
49. Madia F, Striano P, Gennaro E, et al. Cryptic chromosome deletions involving SCN1A in severe myoclonic epilepsy of infancy. Neurology 2006;67:1230–5.
50. Marini C, Scheffer IE, Nabbout R, et al. SCN1A duplications and deletions detected in Dravet syndrome: implications for molecular diagnosis. Epilepsia 2009;50:1670–8.
51. Coppola G, Capovilla G, Montagnini A, et al. Topiramate as add-on drug in severe myoclonic epilepsy in infancy: an Italian multicenter open trial. Epilepsy Res 2002;49:45–8.
52. Nieto-Barrera M, Candau R, Nieto-Jimenez M, et al. Topiramate in the treatment of severe myoclonic epilepsy in infancy. Seizure 2000;9:590–4.
53. Striano P, Coppola A, Pezzella M, et al. An open-label trial of levetiracetam in severe myoclonic epilepsy of infancy. Neurology 2007;69:250–4.
54. Caraballo RH, Cersosimo RO, Sakr D, et al. Ketogenic diet in patients with Dravet syndrome. Epilepsia 2005;46:1539–44.
55. Kang HC, Kim YJ, Kim DW, Kim HD. Efficacy and safety of the ketogenic diet for intractable childhood epilepsy: Korean multicentric experience. Epilepsia 2005;46:272–9.
56. Chiron C. Current therapeutic procedures in Dravet syndrome. Dev Med Child Neurol 2011;53 Suppl 2:16–8.
57. Dibbens LM, Tarpey PS, Hynes K, et al. X-linked protocadherin 19 mutations cause female-limited epilepsy and cognitive impairment. Nat Genet 2008;40:776–81.
58. Specchio N, Marini C, Terracciano A, et al. Spectrum of phenotypes in female patients with epilepsy due to protocadherin 19 mutations. Epilepsia 2011;52:1251–7.
59. Marini C, Darra F, Specchio N, et al. Focal seizures with affective symptoms are a major feature of PCDH19 gene-related epilepsy. Epilepsia 2012;53:2111–9.
60. Hirano S, Yan Q, Suzuki ST. Expression of a novel protocadherin, OL-protocadherin, in a subset of functional systems of the developing mouse brain. J Neurosci 1999;19:995–1005.
61. Kim SY, Chung HS, Sun W, Kim H. Spatiotemporal expression pattern of non-clustered protocadherin family members in the developing rat brain. Neuroscience 2007;147:996–1021.
62. Gastaut H, Poirier F, Payan H, et al. H.H.E. syndrome; hemiconvulsions, hemiplegia, epilepsy. Epilepsia 1960;1:418–47.
63. Panayiotopoulos CP. The epilepsies: seizures, syndromes and management. Oxfordshire (UK): Bladon Medical Publishing; 2005.
64. Chauvel P, Dravet C. The HHE syndrome. In: Roger J, Bureau M, Dravet C, editors. Epileptic syndromes in infancy, childhood and adolescence. 4th ed. John Libbey; 2005; 247–60.
65. Nabbout R. FIRES and IHHE: Delineation of the syndromes. Epilepsia 2013;54 Suppl 6:54–6.
66. Baxter P, Clarke A, Cross H, et al. Idiopathic catastrophic epileptic encephalopathy presenting with acute onset intractable status. Seizure 2003;12:379–87.
67. Mikaeloff Y, Jambaque I, Hertz-Pannier L, et al. Devastating epileptic encephalopathy in school-aged children (DESC): a pseudo encephalitis. Epilepsy Res 2006;69:67–79.
68. Wilder-Smith EP, Lim EC, Teoh HL, et al. The NORSE (new-onset refractory status epilepticus) syndrome: defining a disease entity. Ann Acad Med Singapore 2005;34:417–20.
69. van Baalen A, Hausler M, Boor R, et al. Febrile infection-related epilepsy syndrome (FIRES): a nonencephalitic encephalopathy in childhood. Epilepsia 2010;51:1323–8.
70. Nabbout R, Vezzani A, Dulac O, Chiron C. Acute encephalopathy with inflammation-mediated status epilepticus. Lancet Neurol 2011;10:99–108.
71. Howell KB, Katanyuwong K, Mackay MT, et al. Long-term follow-up of febrile infection-related epilepsy syndrome. Epilepsia 2012;53:101–10.
72. Nabbout R, Mazzuca M, Hubert P, et al. Efficacy of ketogenic diet in severe refractory status epilepticus initiating fever induced refractory epileptic encephalopathy in school age children (FIRES). Epilepsia 2010;51:2033–7.
73. Lin JJ, Lin KL, Hsia SH, Wang HS. Therapeutic hypothermia for febrile infection-related epilepsy syndrome in two patients. Pediatr Neurol 2012;47:448–50.
From the Nationwide Children’s Hospital, Columbus, OH (Dr. Patel) and Cook Children’s Medical Center, Fort Worth, TX (Dr. Perry).
Abstract
- Objective: To review the current understanding and management of febrile seizures.
- Methods: Review of the literature.
- Results: Febrile seizures are a common manifestation in early childhood and very often a benign occurrence. For simple febrile seizures, minimal evaluation is necessary and treatment typically not warranted beyond reassurance and education of caregivers. For complex febrile seizures, additional evaluation in rare cases may suggest an underlying seizure tendency, though most follow a typical benign course of febrile seizures. In some cases, as-needed benzodiazepines used for prolonged or recurrent febrile seizures may be of value. There are well described epilepsy syndromes for which febrile seizures may be the initial manifestation and it is paramount that providers recognize the signs and symptoms of these syndromes in order to appropriately counsel families and initiate treatment or referral when warranted.
- Conclusion: Providers caring for pediatric patients should be aware of the clinical considerations in managing patients with febrile seizures.
Key words: febrile seizure; Dravat syndrome; GEFS+; PCDH19; FIRES; complex febrile seizure.
A febrile seizure is defined as a seizure in association with a febrile illness in the absence of a central nervous system infection or acute electrolyte imbalance in children older than 1 month of age without prior afebrile seizures [1]. The mechanism by which fever provokes a febrile seizure is unclear [2]. Febrile seizures are the most common type of childhood seizures, affecting 2% to 5% of children [1]. The age of onset is between 6 months and 5 years [3]; peak incidence occurs at about 18 months of age. Simple febrile seizures are the most common type of febrile seizure. By definition, they are generalized, last less than 10 minutes and only occur once in a 24-hour time-period. A complex febrile seizure is one with focal onset or one that occurs more than once during a febrile illness, or lasts more than 10 minutes. Febrile status epilepticus, a subtype of complex febrile seizures, represents about 25% of all episodes of childhood status epilepticus. They account for more than two-thirds of cases during the first 2 years of life.
The risk of reoccurrence after presenting with one febrile seizure is approximately 30%, with the risk being 60% after 2 febrile seizures and 90% after 3 [4–6]. Some families have an autosomal dominant inheritance pattern with polygenic inheritance suspected for the majority of patients presenting with febrile seizures.
Multiple chromosomes have been postulated to be associated with genetic susceptibility for febrile seizures, with siblings having a 25% increased risk and high concordance noted in monozygotic twins [7]. The pathophysiology for febrile seizures has been associated with a genetic risk associated with the rate of temperature rise with animal studies suggesting temperature regulation of c-aminobutyric acid (GABA) a receptors [2]. Other studies propose a link between genetic and environmental factors resulting in an inflammatory process which influences neuronal excitement predisposing one to a febrile seizure [8].
Debate exists between the relation of febrile seizures and childhood vaccinations. Seizures are rare following administration of childhood vaccines. Most seizures following administration of vaccines are simple febrile seizures [9]. Febrile seizures associated with vaccines are more associated with underlying epilepsy. In a study of patients with vaccine-related encephalopathy and febrile status epilepticus, the majority of patients were found to have Dravet syndrome; it was determined that the vaccine may have triggered an earlier onset of the presentation for Dravet in those predestined to develop this disease but did not adversely impact ultimate outcome [10].
In this article, we review simple and complex febrile seizures with a focus on clinical management. Epilepsy syndromes associated with febrile seizures are also discussed. Cases are provided to highlight important clinical considerations.
Case 1: Simple Febrile Seizure
A 9-month-old infant and his mother present to the pediatrician. The mother notes that the infant had an event of concern. She notes the infant had stiffness in all 4 extremities followed by jerking that lasted 30 to 60 seconds. The infant was not responsive during the event. He was sleepy afterward, but returned to normal soon after the event ended. After, she noted that the infant felt warm and she checked his temperature. He had a fever of 101°F. The infant has normal development and no other medical problems.
What are management considerations for simple febrile seizure?
A simple febrile seizure is the most common type of febrile seizure. They are generalized, lasting less than 10 minutes and only occur once in a 24-hour period. There is no increased risk of developing epilepsy or developmental delay for patients after the first simple febrile seizures when compared to other children [5,6]. The diagnosis is based on history provided and a physical examination including evaluation of body temperature [11,12].
No routine laboratory tests are needed as a result of a simple febrile seizure unless obtained to assist in identifying the fever source [3,11]. Routine EEG testing is not recommended for these patients [3,11]. Routine imaging of the brain is also not needed [3,11]. Only if a patient has signs of meningitis should a lumbar puncture be performed [11]. The American Academy of Pediatrics states that a lumbar puncture is strongly considered for those younger than 12 months if they present with their first complex febrile seizure as signs of meningitis may be absent in young children. For infants 6 to 12 months of age, a lumbar puncture can be considered when immunization status is deficient or unknown [13,14]. Also, a lumbar puncture is an option for children who are pretreated with antibiotics [11]. For patients younger than 6 months, data is lacking on the percentage of patients with bacterial meningitis following a simple febrile seizure.
Daily preventative therapy with an anti-epilepsy medication is not necessary [3,11]. A review of several treatment studies shows that some anti-epileptic medications are effective in preventing recurrent simple febrile seizures. Studies have demonstrated the effectiveness of phenobarbital, primidone, and valproic acid in preventing the recurrence of simple febrile seizures; however, the side effects of each medication outweighed the benefit [3]. Carbamazepine and phenytoin have not been shown to be effective in preventing recurrent febrile seizures [3].
For anxious caregivers with children having recurrent febrile seizures, a daily medication or treating with an abortive seizure medication at the time of a febrile illness can be considered [3,5,6,15]. Treating with an abortive medication may mask signs and symptoms of meningitis making evaluation more challenging [16]. Evidence does not support that using antipyretic medications such as acetaminophen or ibuprofen will reduce the recurrence of febrile seizures. The seizure usually is the first noticed symptom due to the rise of temperature being the cause of the febrile seizure in an otherwise well child prior to the seizure [11,17]. Damage to the brain and associated structures is not found with patients presenting with simple febrile seizures [5,6]. Education on all of these principles is strongly recommended for caregiver reassurance.
Case 2: Complex Febrile Seizure
A 1-year-old child presents to the emergency department. Mother was with the child and she noticed stiffness followed by jerking of the left arm and leg, which quickly became noted in both arms and legs. The episode appeared to last for 15 minutes before EMS arrived to the house. A medication was given to the child by EMS that stopped the event. EMS noted the child had a temperature of 101.5°F. The child was previously healthy and has had normal development thus far.
What is the epidemiology of complex febrile seizure?
A complex febrile seizure is one with focal onset, or one that occurs more than once during a febrile illness or lasts more than 10 minutes. They are less common, representing only 20% to 30% of all febrile seizures [18–20]. In The National Collaborative Perinatal Project (NCPP), 1706 children with febrile seizures were identified from 54,000 and were followed from birth until 7 years of age. The initial febrile seizure was defined as complex in about 28%. For all febrile seizures, focal features were present in 4%, prolonged duration (> 10 minutes) in 7.6%, and recurrent episodes within 24 hours in 16.2% [21]. Similar observations have been reported by Berg and Shinnar [5,6]. Of 136 children who had recurrences, 41.2% had one or more complex features and the strongest correlate of having recurrent complex febrile seizure was the number of recurrent seizures. They also found that children with complex recurrences had other recurrences that were not complex; however, complex features had a tendency to recur. Further, a strong association between focal onset and prolonged duration was found [5,6]. Previous studies established a correlation between complex attacks, particularly prolonged ones and young age (age < 1 year) [5,6]. Additionally, children with seizures with a relatively low fever (< 102°F) were slightly more likely to have a complex febrile seizure as the initial episode [5,6].
Children with febrile seizures are already at 4- to 5-fold increased risk for subsequent unprovoked seizures. A history of febrile seizures has been found in 13% to 18% of children with new-onset epilepsy. In the NCPP study, the predictors identified for the development of epilepsy following febrile seizures were an abnormal neurological and developmental status of the child before the seizure, a history of afebrile seizures in a parent or prior-born sibling, or complex features [21]. Ten percent of children with 2 or more of the previously mentioned risk factors (including complex features) developed epilepsy and 13% of them had seizures without fever [20,22]. Further, intractable epilepsy and neurological impair-ment have been found to be more common in children with prior prolonged febrile seizure, with no association to any specific seizure type [18,23–25]. The association between febrile seizures and mesial temporal sclerosis (MTS) is a commonly debated topic. Retrospective studies have reported an association between prolonged or atypical febrile seizures and intractable temporal lobe epilepsy. Epidemiological studies fail to show a causal relationship between febrile seizures and temporal lobe epilepsy [26]. This suggests that febrile seizures are a marker of susceptibility to seizures and future epilepsy (in some cases) rather than a direct cause. It is clear that a minority of cases of MTS or complex partial seizures are associated with prior febrile seizures [20,22].
What is the risk of intracranial pathology in complex febrile seizure?
Patients with complex febrile seizures usually seek medical attention [27]. However, the risk of acute pathology necessitating treatment changes based on neuroimaging was found to be very low and likely not necessary in the evaluation of complex febrile seizures during the acute presentation [27]. Imaging with a high-resolution brain MRI could be considered later on a routine basis for prolonged febrile seizures due to the possible association between prolonged febrile seizures and mesial temporal sclerosis [19,28,29].
Neuroimaging has provided evidence that hippocampal injury can occasionally occur during prolonged and focal febrile seizures in infants who otherwise appear normal. It has been speculated that a pre-existing abnormality increases the propensity to focal prolonged seizures and further hippocampal damage. Hesdorffer and colleagues [30] found definite abnormalities on MRI in 14.8% of children with complex febrile seizures and 11.4 % of simple febrile seizures among 159 children with a first febrile seizure. However, MRI abnormalities were related to a specific subtype of complex seizures: focal and prolonged. The most common abnormalities observed were subcortical focal hyperintensity, an abnormal white matter signal, and focal cortical dysplasia.
What are important aspects of the clinical evaluation?
The evaluation and management of the child with complex febrile seizures is debated as well. The most important part in the history and examination is to look for the source of the fever and rule out the presence of a CNS infection, since complex febrile seizures are much more frequently associated with meningitis than simple febrile seizures [16]. The American Academy of Pediatrics recommended that a lumbar puncture be strongly considered in infants younger than 12 months after a first febrile seizure and should be considered in children between 12 and 18 months of age, since signs of meningitis may be absent in young children [13]. If the threshold for a lumbar puncture is low in infants with febrile seizures in general, it should be even lower for children with complex febrile episodes for all the factors mentioned above. The guidelines developed in 1990 by the Royal College of Physicians and the British Paediatric Association concluded that indications for performing an lumbar puncture were complex febrile seizure, signs of meningismus, or a child who is unduly drowsy and irritable or systematically ill [21].
Obtaining an EEG within 24 hours of presentation may show generalized background slowing, which could make identifying possible epileptiform abnormalities difficult [22]. Therefore, a routine sleep deprived EEG when the child is back to baseline can be more useful in identifying if epileptiform abnormalities are present. If epileptiform abnormalities are present on a routine sleep deprived EEG, this may suggest the patient is at higher risk for developing future epilepsy and the febrile illness lowered the seizure threshold; however, it is unclear whether clinical management would change as a result [31].
What treatment options are available?
Complications with prolonged and/or recurrent seizures can occur. Treatments options can be stratified into 3 possible categories: emergency rescue treatment for prolonged or a cluster of febrile seizures, intermittent treatment at the time of illness, and chronic use of medication. Treatment options for complex febrile seizures may include the use of a rescue seizure medication when the febrile seizure is prolonged. Rectal preparations of diazepam gel can be effective in stopping an ongoing seizure and can be provided for home use in patients with known recurrence of febrile status epilepticus [3]. For children and adolescents where a rectal administration is not ideal, intranasal versed can be utilized instead of rectal diazepam. In addition, the use of an intermittent benzodiazepine at the onset of febrile illness can also be considered a treatment option. Using oral diazepam at the time of a febrile illness has been demonstrated in reducing the recurrence of febrile seizures [3]. Other studies have shown similar results when using buccal midazolam [32]. No adequate studies have been performed using second- or third-generation anti-epilepsy medications in the treatment of recurrent of complex febrile seizures [3].
It is unclear whether benefit is present to using intermittent benzodiazepine doses prior or during a febrile illness for those prone for recurrent febrile seizures [33]. Physicians may consider this option in patients with frequent recurrent seizures, when caregivers can identify the fever before the seizure occurs.
Overall, parental education of efficacy and side effect profiles should be discussed in detail when considering any treatment options for complex febrile seizures [34]. It is important to remember that the long-term prognosis in terms of developing epilepsy or neurological and cognitive problems is not influenced by the use of antiepileptic medications for recurrent febrile seizures [17]. Even in the case of prolonged febrile seizures in otherwise neurodevelopmentally normal children, antiepileptics have not been shown to cause damage to the brain [19].
Febrile Status Epilepticus
Febrile status epilepticus is a subtype of complex febrile seizures and is defined as a febrile seizure lasting greater than 30 minutes. Overall, febrile status epilepticus accounts for approximately 5% of all presentations of febrile seizures [35]. It represents about 25% of all episodes of childhood status epilepticus and more than two-thirds of cases during the first 2 years of life. Literature suggests that an increased risk for focal epilepsy exists [36]. Children presenting with febrile status epilepticus are more likely to have a family history of epilepsy and a history of a previous neurological abnormality [22]. It is likely to reoccur if the first presentation was febrile status epilepticus. However, increased risk for death or developmental disability as a result of the seizure is not seen [37].
The prospective multicenter study of the consequences of prolonged febrile seizures in childhood (FEBSTAT) has been conducted. The study reported that febrile status epilepticus is usually focal (67% of episodes), occurs in very young children (median age 1.3 years), and is frequently the first febrile seizure [22]. In this study, the median duration of the seizure was about 68 minutes and 24% of children had an episode lasting more than 2 hours. In 87% of the events, seizures did not stop spontaneously and benzodiazepines were needed. Focal features observed were eye and head deviation, staring, and impaired consciousness prior to the seizure and an asymmetric convulsion or Todd’s paresis.
Case 3: Epilepsy Syndromes Associated With Febrile Seizures
A 1-year-old female presents for evaluation of seizures that began at age 8 months. Seizures are described as occurring in the setting of fever with bilateral symmetric tonic clonic activity lasting durations of less than 10 minutes on average, but at least 2 instances of seizure lasting 20 minutes or more. The family notes that seizures have occurred almost every time the child has had a febrile illness and often cluster over several days. They report at least 1 seizure that occurred in the absence of fever. Development has been normal to date and an EEG done by their primary provider was also normal.
What epilepsy syndromes are associated with febrile seizures?
Genetic Epilepsy with Febrile Seizures Plus
GEFS+ was first described in 1997 following recognition of a pattern of febrile seizures followed later by the development of various epilepsy syndromes within the same family [38]. As such, the syndrome is defined based on the familial occurrence of febrile and afebrile seizures in at least 2 family members and can have a wide range of phenotypes. The most common presentation is of typical febrile seizures which can persist beyond the typical upper age limit of 6 years. Unprovoked generalized seizures of multiple types (ie, myoclonic, absence, atonic) occur at a later age, though focal seizures may also be present. The presence of focal onset seizures led to the naming change from “generalized” epilepsy with febrile seizures plus as it was previously referred. Seizure frequency and severity may vary between family members, as can response to treatment, making prognosis difficult to predict. As even in typical febrile seizures a family history of febrile seizure may be common, it may be difficult to diagnose the syndrome after the initial febrile seizure. However, if the family history is strong for a family member with a GEFS+ phenotype, one can appropriately counsel the family on the possibility that a similar course may evolve. While the majority of GEFS+ patients have milder phenotypes, some more severe phenotypes can have cognitive delays. Dravet syndrome falls within the spectrum of GEFS+ and is a prime example of the phenotypic continuum to more severe presentations in some patients.
The syndrome is believed to be inherited in an auto-somal dominant fashion with incomplete penetrance. Multiple genes have been implicated as a cause, though only 11.5% of families with clinical GEFS+ may have mutations [39]. SCN1A, encoding the α-subunit of the voltage-gated sodium channel is most frequently reported in GEFS+ families, yet is only found in 10% [38]. When associated with GEFS+, SCN1A mutations are more often missense type, whereas truncating and nonsense mutations are more commonly encountered in Dravet syndrome. Mutations in SCN1B encoding the β1 subunit of the voltage-gated sodium channel has also been reported [40]. Finally, the GABA(A) receptor gamma 2 subunit GABRG2 has been found in < 1% of GEFS+ families [39]. The variability in causative genes underscores the reasons for phenotype variability and it is likely that other modifier genes are responsible for the heterogeneity within GEFS+ families [41].
Dravet Syndrome
Dravet syndrome, often referred to as severe myoclonic epilepsy of infancy, was first described in 1978 and has since become one of the most recognized genetic epilepsy syndromes [42]. The clinical presentation often begins with seizures in the first year of life, frequently in the setting of febrile illness. The initial seizures are generalized or hemiclonic in the majority and are often prolonged evolving to status epilepticus. Unlike typical febrile seizures, one should suspect Dravet syndrome in children that present with repetitive bouts of complex febrile seizures or febrile status epilepticus, especially if the associated seizure semiology is of hemiclonic type. In addition, seizures in the setting of modest hyperthermia (ie, hot baths) should raise suspicion for this condition. Commonly EEG and MRI are normal in the first year of life and psychomotor development remains normal until typically the second year of life [43].
By the second year, other seizure types including myoclonic, atypical absence, clonic, and tonic seizures arise. The EEG frequently begins to show generalized spike wave and polyspike wave discharges. Seizures continue occurring frequently during early childhood, often resulting in status epilepticus. Cognitive development begins to stagnate between the ages of 1 and 4 years with emergence of autistic traits and hyperactivity [44]. Development may stabilize between the ages of 5 and 16 years, but fails to demonstrate much improvement [44]. Higher frequency of seizures may correlate with increase in cognitive impairment and behavior problems, supporting the need for rapid diagnosis and appropriate therapy [44].
Over the years, several cases of atypical or borderline Dravet syndrome have been described, most highlighting the absence of myoclonic seizures [45]. Others may present with primarily clonic or tonic-clonic type seizures only [46]. Despite these differences, all cases share a similar drug resistance and cognitive delay and are categorized as Dravet syndrome.
In 2001, Claus et al discovered the genetic alteration in SCN1A responsible for 70% of Dravet syndrome cases [47]. The disorder is inherited in an autosomal dominant fashion, though 40% to 80% of mutations resulting in Dravet syndrome are de novo [48]. Mutations can be present in other family members, as this syndrome is part of the spectrum of GEFS+, though parental phenotypes are often much less severe. Approximately 50% of mutations resulting in Dravet syndrome are truncating, while the other 50% are missense mutations involving splice site or pore forming regions leading to loss of function [49]. Finally, small and large chromosome rearrangements make up 2% to 3% of cases [50]. Other genes reported to result in Dravet syndrome include SCN1B and GABRG2 mutations. In addition, PCDH19 can produce a phenotype similar to Dravet syndrome in females and is discussed in more detail below.
With the emergence of more rapid and cheaper forms of genetic testing, molecular diagnosis can now be made earlier in life before all the typical clinical features of Dravet syndrome arise. As a result, one might hope to alter treatment strategy and gear therapy towards the most effective medications. While drug resistance is the norm for the condition, certain drugs such as benzodiazepines, valproate, and stiripentol may be most effective [43]. Topiramate and levetiracetam have been reported as effi-cacious in small series, as has the ketogenic diet [51–55]. Varieties of medications which target sodium channels are known to exacerbate seizures in Dravet syndrome and should be avoided, including lamotrigine, carbamazepine, oxcarbazepine, and phenytoin [56]. In addition to maintenance therapy, it is important to provide patients with a rescue plan for acute seizures in an effort to avoid status epilepticus. In addition, measures to avoid overheating may provide additional benefit.
Case 3 Continued
After a careful history, the physician discovers that the child also has frequent myoclonic seizures described as brief jerks of the extremities or sudden forward falls. The family notes they have seen these seizures more frequently since antiepileptic therapy was started. The physician recognize that this child may have Dravet syndrome and suspect her medication may be resulting in aggravation of seizures.
The physician decides to discontinue the medication suspected to aggravate the seizures and chooses to start the child on clobazam. The physician also begins evaluation for Dravet syndrome by sending directed SCN1A genetic testing. The testing comes back negative for mutations in the SCN1A gene.
What other investigations would be warranted now?
PCDH19
PCDH19 was first recognized as a cause of epilepsy and mental retardation limited to females (EFMR), a syndrome characterized by onset of seizures in infancy or early childhood with predominantly generalized type seizures including tonic-clonic, absence, myoclonic, tonic, and atonic [57]. Since that initial description, the phenotype associated with PCDH19 mutations has expanded to include female patients with primarily focal epilepsy, variable cognitive impairment, and commonly onset with seizures in the setting of fever [58,59]. Typically seizures begin around age 10 months presenting as a cluster of focal seizures in the setting of fever, often followed by a second cluster 6 months later [59]. Generalized seizures occur in a small proportion of patients (9%) and this feature, along with relatively fewer bouts of status epilepticus and less frequent seizures (most monthly to yearly frequency) can differentiate PCDH19 associated epilepsy from Dravet syndrome [59]. Seizures tend to improve with age and no particular antiepileptic drug has been found especially efficacious in the syndrome. Unlike Dravet syndrome, up to a third of patients with this syndrome may ultimately become seizure-free [59].
Cognitive development is normal prior to seizure onset in the majority of patients and most but not all patients will develop some cognitive impairment ranging from mild to severe [59]. It is the more severe patients that most often have overlapping characteristics of Dravet syndrome, thus PCDH19 mutations should be investigated in female patients with Dravet phenotype yet negative SCN1A testing.
PCDH19 is a calcium-dependent adhesion protein involved in neuronal circuit formation during development and in the maintenance of normal synaptic circuits in adulthood [60,61]. Disease causing mutations in PCDH19 are primarily missense (48.5%) or frameshift, nonsense, and splice-site mutations resulting in premature termination codon [59]. Ninety percent of mutations are de novo. When inherited, the disorder is X-linked and may come from an unaffected father or a mother that is similarly affected or not, suggesting variable clinical severity in females and gender-related protections in males [59].
Case 3 Continued
Given the negative SCN1A testing, the physician chooses to pursue other genetic testing that may explain the patient’s phenotype. A more extensive “epilepsy gene panel” that includes 70 different genes associated with epilepsy syndromes is ordered.
Hemiconvulsion-Hemiplegia Epilepsy Syndrome
Hemiconvulsion-hemiplegia epilepsy syndrome (HHE) is characterized by the occurrence of unilateral convulsive status epilepticus followed by transient or permanent ipsilateral hemiplegia. The syndrome occurs in otherwise healthy children often in the setting of nonspecific febrile illness before the age of 4 years, with peak occurrence in the first 2 years of life [62]. Seizures are characterized by unilateral clonic activity with EEG demonstrating rhythmic 2–3 Hz slow wave activity and spikes in the hemisphere contralateral to the body involvement. MRI frequently demonstrates diffusion changes congruent with EEG findings, often in the perisylvian region. The hemiplegia that remains following status epilepticus is permanent in up to 80% of cases [63]. As hemiplegia can occur following complex febrile seizures, it is recommended a minimum duration of hemiplegia of 1 week be used to differentiate HHE [64]. Status epilepticus is persistent in this syndrome and can last for hours if untreated. Focal onset seizures will often continue to occur in the patient even after the status has been aborted.
The etiology of HHE is variable with many cases idiopathic. Some cases are reported as symptomatic, as the syndrome can present in the setting of other underlying brain disorders such as Sturge-Weber and tuberous sclerosis complex. While some viruses have been proposed as a cause, they are not found in the cerebral spinal fluid of patients [65]. Treatment consists of rapid treatment of status epilepticus with benzodiazepines as first-line therapy, often followed by other intravenous antiepileptic drugs as necessary.
Febrile Infection–Related Epilepsy Syndrome
Febrile infection–related epilepsy syndrome (FIRES) is presented under several names in the literature including idiopathic catastrophic epileptic encephalopathy [66], devastating encephalopathy in school-age children [67], new-onset refractory status epilepticus [68], as well as fever-induced refractory epileptic encephalopathy syndrome [69] and fever-induced refractory epileptic encephalopathy in school-age children [70]. All describe rare catastrophic epilepsy presenting in otherwise healthy children during or days following a febrile illness. While febrile illness precedes the epilepsy in 96% of cases, up to 50% of patients may not have fever at the time they present [41,65]. While age of onset is typically in early childhood, presentation in adulthood also occurs. Initial seizures are often focal, presenting as forced lateral head or eye deviation, oral or manual automatisms, and clonic movements of the face and extremities. Seizures will inevitably progress to status epilepticus with ictal onset often multifocal predominating in the perisylvian regions [41]. MRI is often normal at onset or shows only subtle swelling of the mesial temporal structures. Over months, MRI often shows T2-hyperintensity and atrophy of the mesial temporal structures, though as many as 50% of MRIs may remain normal [71].
The evaluation for cause in FIRES is often unrewarding. Inflammatory markers are typically absent from both serum and CSF. CSF may show minimal pleocytosis with negative oligoclonal bands and absence of common receptor antibodies. Treatment is equally unrewarding with patients typically failing conventional antiepileptic drugs and continuous infusions titrated to burst suppression. Immunomodulatory therapies are mostly ineffective as well. The most useful therapy reported has been the keto-genic diet with efficacy in up to 50% of patients [72]. Recently, therapeutic hypothermia has also been reported to be effective in 2 cases [73]. For the majority of patients, therapy will remain ineffective and seizures will continue for weeks to months with gradual resolution, though seizures often continue intermittently following the end of status epilepticus. Prognosis is poor for seizure control and neurocognitive recovery with mortality of 30% reported [41].
Case 3 Conclusion
The epilepsy gene panel ordered returns with the result of a disease-causing mutation in the PCDH19 gene. The child is diagnosed with PCDH19-associated epilepsy and is treated with phenobarbital. For the first years of life, she presents on average once per year with a cluster of seizures in the setting of febrile illness which is often managed with short durations of scheduled benzodiazepines. Seizures slow by age 6. She has mild delays in speech and receives some accommodations through her school system. By age 10, she has been seizure-free for several years. She is able to be weaned off medications without recurrence of seizures.
Summary
Febrile seizures are a common manifestation in early childhood and very often a benign occurrence. For simple febrile seizures, minimal evaluation is necessary and treatment typically not warranted beyond reassurance and education of caregivers. For complex febrile seizures, additional evaluation in rare cases may suggest an underlying seizure tendency, though most follow a typical benign course of febrile seizures. In some cases, as needed benzodiazepines used for prolonged or recurrent febrile seizures may be of value. There are well described epilepsy syndromes for which febrile seizures may be the initial manifestation and it is paramount that providers recognize the signs and symptoms of these syndromes in order to appropriately counsel families and initiate treatment or referral when warranted. Providers should have a high index of suspicion for these syndromes when they encounter children that repeatedly present with prolonged febrile seizures, clusters of febrile seizures, or febrile seizures in addition to afebrile seizure events. Early referral, diagnosis, and treatment has the potential to alter outcome in some of these syndromes, thus the importance of becoming familiar with these diagnoses.
Corresponding author: Anup D. Patel, MD, Nationwide Children's Hospital, Columbus, OH 43205, [email protected].
Financial disclosures: Dr. Patel disclosed that he has consulted for GW Pharmaceuticals and Supernus and is on the Scientific Advisory Board for UCB Pharma.
1. Shinnar S, Glauser TA. Febrile seizures. J Child Neurol 2002;17 Suppl 1:S44–52.
2. Kang J-Q, Shen W, Macdonald RL. Why does fever trigger febrile seizures? GABAA receptor γ2 subunit mutations associated with idiopathic generalized epilepsies have temperature-dependent trafficking deficiencies. J Neurosci 2006;26:2590–7.
3. Baumann RJ, Duffner PK. Treatment of children with simple febrile seizures: the AAP practice parameter. American Academy of Pediatrics. Pediatr Neurol 2000;23:11–7.
4. Tarkka R, Rantala H, Uhari M, Pokka T. Risk of recurrence and outcome after the first febrile seizure. Pediatr Neurol 1998;18:218–20.
5. Berg AT, Shinnar S. Complex febrile seizures. Epilepsia 1996;37:126–33.
6. Berg AT, Shinnar S. Unprovoked seizures in children with febrile seizures: short-term outcome. Neurology 1996;47:562–8.
7. Audenaert D, Schwartz E, Claeys KG, et al. A novel GABRG2 mutation associated with febrile seizures. Neurology 2006;67:687–90.
8. Dube CM, Brewster AL, Baram TZ. Febrile seizures: mechanisms and relationship to epilepsy. Brain Dev 2009;31:366–71.
9. Vestergaard M, Christensen J. Register-based studies on febrile seizures in Denmark. Brain Dev 2009;31:372–7.
10. Berkovic SF, Petrou S. Febrile seizures: traffic slows in the heat. Trends Molecul Med 2006;12:343–4.
11. Practice parameter: the neurodiagnostic evaluation of the child with a first simple febrile seizure. American Academy of Pediatrics. Provisional Committee on Quality Improvement, Subcommittee on Febrile Seizures. Pediatrics 1996;97:769–72; discussion 773–765.
12. Fukuyama Y, Seki T, Ohtsuka C, et al. Practical guidelines for physicians in the management of febrile seizures. Brain Dev 1996;18:479–84.
13. Neurodiagnostic evaluation of the child with a simple febrile seizure. Pediatrics 2011;127:389–94.
14. Guedj R, Chappuy H, Titomanlio L, et al. Risk of bacterial meningitis in children 6 to 11 months of age with a first simple febrile seizure: a retrospective, cross-sectional, observational study. Acad Emerg Med 2015;22:1290–7.
15. Wo SB, Lee JH, Lee YJ, et al. Risk for developing epilepsy and epileptiform discharges on EEG in patients with febrile seizures. Brain Dev 2013;35:307–11.
16. Green SM, Rothrock SG, Clem KJ, et al. Can seizures be the sole manifestation of meningitis in febrile children? Pediatrics 1993;92:527–34.
17. Knudsen FU. Febrile seizures: treatment and prognosis. Epilepsia 2000;41:2–9.
18. Annegers JF, Hauser WA, Shirts SB, Kurland LT. Factors prognostic of unprovoked seizures after febrile convulsions. N Engl J Med 1987;316:493–8.
19. Teng D, Dayan P, Tyler S, et al. Risk of intracranial pathologic conditions requiring emergency intervention after a first complex febrile seizure episode among children. Pediatrics 2006;117:304–8.
20. Janszky J, Schulz R, Ebner A. Clinical features and surgical outcome of medial temporal lobe epilepsy with a history of complex febrile convulsions. Epilepsy Res 2003;55:1–8.
21. Capovilla G, Mastrangelo M, Romeo A, Vigevano F. Recommendations for the management of «febrile seizures»: Ad Hoc Task Force of LICE Guidelines Commission. Epilepsia 2009;50 Suppl 1:2–6.
22. Shinnar S, Hesdorffer DC, Nordli DR Jr, et al. Phenomenology of prolonged febrile seizures: results of the FEBSTAT study. Neurology 2008;71:170–6.
23. Camfield P, Camfield C, Gordon K, Dooley J. What types of epilepsy are preceded by febrile seizures? A population-based study of children. Dev Med Child Neurol 1994;36:887–92.
24. Nelson KB, Ellenberg JH. Predictors of epilepsy in children who have experienced febrile seizures. N Engl J Med 1976;295:1029–33.
25. Hamati-Haddad A, Abou-Khalil B. Epilepsy diagnosis and localization in patients with antecedent childhood febrile convulsions. Neurology 1998;50:917–22.
26. Davies KG, Hermann BP, Dohan FC Jr, et al. Relationship of hippocampal sclerosis to duration and age of onset of epilepsy, and childhood febrile seizures in temporal lobectomy patients. Epilepsy Res 1996;24:119–26.
27. Kimia AA, Ben-Joseph E, Prabhu S, et al. Yield of emergent neuroimaging among children presenting with a first complex febrile seizure. Pediatr Emerg Care 2012;28:316–21.
28. Abou-Khalil B, Andermann E, Andermann F, et al. Temporal lobe epilepsy after prolonged febrile convulsions: excellent outcome after surgical treatment. Epilepsia 1993;34:878–83.
29. Cendes F. Febrile seizures and mesial temporal sclerosis. Curr Opin Neurol 2004;17:161–4.
30. Hesdorffer DC, Chan S, Tian H, et al. Are MRI-detected brain abnormalities associated with febrile seizure type? Epilepsia 2008;49:765–71.
31. Patel AD, Vidaurre J. Complex febrile seizures: a practical guide to evaluation and treatment. J Child Neurol 2013;28:762–67.
32. Pavlidou E, Tzitiridou M, Panteliadis C. Effectiveness of intermittent diazepam prophylaxis in febrile seizures: long-term prospective controlled study. J Child Neurol 2006;21:1036–40.
33. Offringa M, Newton R. Prophylactic drug management for febrile seizures in children (Review). Evid Based Child Health 2013;8:1376–485.
34. Gordon KE, Dooley JM, Camfield PR, et al. Treatment of febrile seizures: the influence of treatment efficacy and side-effect profile on value to parents. Pediatrics 2001;108:1080–8.
35. Maytal J, Shinnar S. Febrile status epilepticus. Pediatrics 1990;86:611–6.
36. Ahmad S, Marsh ED. Febrile status epilepticus: current state of clinical and basic research. Semin Pediatr Neurol 2010;17:150–4.
37. Maytal J, Shinnar S, Moshe SL, Alvarez LA. Low morbidity and mortality of status epilepticus in children. Pediatrics 1989;83:323–31.
38. Scheffer IE, Berkovic SF. Generalized epilepsy with febrile seizures plus. A genetic disorder with heterogeneous clinical phenotypes. Brain 1997;120 (Pt 3):479–90.
39. Marini C, Mei D, Temudo T, et al. Idiopathic epilepsies with seizures precipitated by fever and SCN1A abnormalities. Epilepsia 2007;48:1678–85.
40. Wallace RH, Scheffer IE, Parasivam G, et al. Generalized epilepsy with febrile seizures plus: mutation of the sodium channel subunit SCN1B. Neurology 2002;58:1426–9.
41. Cross JH. Fever and fever-related epilepsies. Epilepsia 2012;53 Suppl 4:3–8.
42. Dravet C. Les epilepsies graves de l’enfant. Vie Med 1978;8:543–8.
43. Dravet C. Dravet syndrome history. Dev Med Child Neurol 2011;53 Suppl 2:1–6.
44. Wolff M, Casse-Perrot C, Dravet C. Severe myoclonic epilepsy of infants (Dravet syndrome): natural history and neuropsychological findings. Epilepsia 2006;47 Suppl 2:45–8.
45. Ogino T, Ohtsuka Y, Amano R, et al. An investigation on the borderland of severe myoclonic epilepsy in infancy. Jap J Psych Neurol 1988;42:554–5.
46. Kanazawa O. Refractory grand mal seizures with onset during infancy including severe myoclonic epilepsy in infancy. Brain Dev 2001;23:749–56.
47. van der Worp HB, Claus SP, Bar PR, et al. Reproducibility of measurements of cerebral infarct volume on CT scans. Stroke 2001;32:424–30.
48. Wang JW, Kurahashi H, Ishii A, et al. Microchromosomal deletions involving SCN1A and adjacent genes in severe myoclonic epilepsy in infancy. Epilepsia 2008;49:1528–34.
49. Madia F, Striano P, Gennaro E, et al. Cryptic chromosome deletions involving SCN1A in severe myoclonic epilepsy of infancy. Neurology 2006;67:1230–5.
50. Marini C, Scheffer IE, Nabbout R, et al. SCN1A duplications and deletions detected in Dravet syndrome: implications for molecular diagnosis. Epilepsia 2009;50:1670–8.
51. Coppola G, Capovilla G, Montagnini A, et al. Topiramate as add-on drug in severe myoclonic epilepsy in infancy: an Italian multicenter open trial. Epilepsy Res 2002;49:45–8.
52. Nieto-Barrera M, Candau R, Nieto-Jimenez M, et al. Topiramate in the treatment of severe myoclonic epilepsy in infancy. Seizure 2000;9:590–4.
53. Striano P, Coppola A, Pezzella M, et al. An open-label trial of levetiracetam in severe myoclonic epilepsy of infancy. Neurology 2007;69:250–4.
54. Caraballo RH, Cersosimo RO, Sakr D, et al. Ketogenic diet in patients with Dravet syndrome. Epilepsia 2005;46:1539–44.
55. Kang HC, Kim YJ, Kim DW, Kim HD. Efficacy and safety of the ketogenic diet for intractable childhood epilepsy: Korean multicentric experience. Epilepsia 2005;46:272–9.
56. Chiron C. Current therapeutic procedures in Dravet syndrome. Dev Med Child Neurol 2011;53 Suppl 2:16–8.
57. Dibbens LM, Tarpey PS, Hynes K, et al. X-linked protocadherin 19 mutations cause female-limited epilepsy and cognitive impairment. Nat Genet 2008;40:776–81.
58. Specchio N, Marini C, Terracciano A, et al. Spectrum of phenotypes in female patients with epilepsy due to protocadherin 19 mutations. Epilepsia 2011;52:1251–7.
59. Marini C, Darra F, Specchio N, et al. Focal seizures with affective symptoms are a major feature of PCDH19 gene-related epilepsy. Epilepsia 2012;53:2111–9.
60. Hirano S, Yan Q, Suzuki ST. Expression of a novel protocadherin, OL-protocadherin, in a subset of functional systems of the developing mouse brain. J Neurosci 1999;19:995–1005.
61. Kim SY, Chung HS, Sun W, Kim H. Spatiotemporal expression pattern of non-clustered protocadherin family members in the developing rat brain. Neuroscience 2007;147:996–1021.
62. Gastaut H, Poirier F, Payan H, et al. H.H.E. syndrome; hemiconvulsions, hemiplegia, epilepsy. Epilepsia 1960;1:418–47.
63. Panayiotopoulos CP. The epilepsies: seizures, syndromes and management. Oxfordshire (UK): Bladon Medical Publishing; 2005.
64. Chauvel P, Dravet C. The HHE syndrome. In: Roger J, Bureau M, Dravet C, editors. Epileptic syndromes in infancy, childhood and adolescence. 4th ed. John Libbey; 2005; 247–60.
65. Nabbout R. FIRES and IHHE: Delineation of the syndromes. Epilepsia 2013;54 Suppl 6:54–6.
66. Baxter P, Clarke A, Cross H, et al. Idiopathic catastrophic epileptic encephalopathy presenting with acute onset intractable status. Seizure 2003;12:379–87.
67. Mikaeloff Y, Jambaque I, Hertz-Pannier L, et al. Devastating epileptic encephalopathy in school-aged children (DESC): a pseudo encephalitis. Epilepsy Res 2006;69:67–79.
68. Wilder-Smith EP, Lim EC, Teoh HL, et al. The NORSE (new-onset refractory status epilepticus) syndrome: defining a disease entity. Ann Acad Med Singapore 2005;34:417–20.
69. van Baalen A, Hausler M, Boor R, et al. Febrile infection-related epilepsy syndrome (FIRES): a nonencephalitic encephalopathy in childhood. Epilepsia 2010;51:1323–8.
70. Nabbout R, Vezzani A, Dulac O, Chiron C. Acute encephalopathy with inflammation-mediated status epilepticus. Lancet Neurol 2011;10:99–108.
71. Howell KB, Katanyuwong K, Mackay MT, et al. Long-term follow-up of febrile infection-related epilepsy syndrome. Epilepsia 2012;53:101–10.
72. Nabbout R, Mazzuca M, Hubert P, et al. Efficacy of ketogenic diet in severe refractory status epilepticus initiating fever induced refractory epileptic encephalopathy in school age children (FIRES). Epilepsia 2010;51:2033–7.
73. Lin JJ, Lin KL, Hsia SH, Wang HS. Therapeutic hypothermia for febrile infection-related epilepsy syndrome in two patients. Pediatr Neurol 2012;47:448–50.
LEADER post hoc analysis: Mechanism behind liraglutide’s cardioprotective effects unclear
SAN DIEGO – The glucagon-like peptide-1 (GLP-1) receptor agonist liraglutide significantly reduced the risk of initial and recurrent major cardiovascular events in high-risk patients with type 2 diabetes, according to new posthoc analyses from the LEADER (Liraglutide Effect and Action in Diabetes: Evaluation of Cardiovascular Outcome Results) trial.
Liraglutide’s cardioprotective effect did not depend on baseline use of insulin or cardiovascular medications, nor whether patients started insulin, sulfonylureas, or thiazolidinediones, or developed severe hypoglycemia during the trial, Richard Pratley, MD, told a packed auditorium at the annual scientific sessions of the American Diabetes Association. “It appears unlikely that the cardiovascular risk reduction with liraglutide can be fully explained by the observed differences in hemoglobin A1c, body weight, systolic blood pressure, and lipids,” he said. Experts have proposed several pathways, “but the bottom line is, in humans, we don’t know the mechanism for liraglutide’s benefit.”
In LEADER, 9,340 older patients with suboptimally controlled type 2 diabetes and additional cardiovascular risk factors were randomly assigned to liraglutide or placebo once daily. Patients were typically male, obese, and hypertensive, and about 18% had prior heart failure. Topline results reported last year at ADA included a 13% reduction in the rate of initial cardiovascular death, non-fatal myocardial infarction, and non-fatal stroke in the liraglutide group, compared with the placebo group (hazard ratio, 0.87; 95% confidence interval, 0.78 to 0.97).
The new posthoc analyses indicate that liraglutide also prevents both initial and recurrent cardiovascular events (HR, 0.86; 95% CI, 0.78 to 0.95) and that its cardioprotective effect spans subgroups of patients stratified according to whether they were on insulin, beta-blockers, ACE inhibitors, statins, and platelet aggregation inhibitors at baseline, said Dr. Pratley, senior investigator at the Translational Research Institute for Metabolism and Diabetes, and medical director of the Florida Hospital Diabetes Institute, Orlando.

Liraglutide also reduced cardiovascular events to about the same extent regardless of whether patients later started insulin, sulfonylureas, or thiazolidinediones or developed severe hypoglycemia.
Such findings signal a fundamental shift in diabetes care, commented Steven Nissen, MD, chair of the department of cardiovascular medicine, at the Cleveland Clinic, Cleveland, Ohio. For decades, patients and clinicians lacked diabetes outcomes trials, and “it took three successive shockwaves to awaken the medical community from its 50-year slumber.”
The wake-up call started when Dr. Nissen and his associates linked muraglitazar (JAMA. 2005 Nov 23;294[20]:2581-6) and rosiglitazone (N Engl J Med 2007; 356:2457-71) to an increased risk of major adverse cardiovascular events. This continued when researchers found that targeting glycated hemoglobin levels below 6.0% increased the risk of death in patients with type 2 diabetes, in the Action to Control Cardiovascular Risk in Diabetes (ACCORD) trial (N Engl J Med 2008; 358:2545-59).
In response, the Food and Drug Administration began requiring cardiovascular outcomes trials before and after approving new diabetes drugs. “The result has been a new era of research” that has revealed uneven outcomes and a lack of uniform class effects, Dr. Nissen said.
For example, lixisenatide and long-acting exenatide are GLP-1 receptor agonists like liraglutide, but neither of these two drugs were found to prevent cardiovascular outcomes compared with placebo. In addition, the DPP-4 inhibitors “provide no meaningful outcome benefits, minimal glucose lowering, and potential harm at a high cost of about $400 per month,” he said.
This class has suffered “three disappointments,” he added. He referred to findings that alogliptin and sitagliptin did not reduce cardiovascular events compared with placebo in the EXAMINE trial (N Engl J Med 2013; 369:1327-35) and TECOS trial (N Engl J Med 2015; 373:232-42), respectively, while the SAVOR-TIMI 53 trial linked saxagliptin to an increased risk of hospitalization for heart failure (HR, 1.27; 95% CI, 1.07 to 1.51).
In contrast, the sodium-glucose cotransporter-2 (SGLT-2) inhibitor empagliflozin reduced the rate of cardiovascular death, stroke, and MI by about 14% in the EMPA-REG trial (N Engl J Med 2015;373:2117-28).

Based on the LEADER results, the Food and Drug Administration’s Endocrinologic and Metabolic Drugs Advisory Committee voted 17-2 supporting a new cardiovascular indication for liraglutide in type 2 diabetes, at a meeting in June 2017.
“After 60 years of stagnation, we are now witnessing a new era in the pharmacological management of type 2 diabetes, which is allowing a choice of therapies based on actual clinical outcomes – risks and benefits – rather than a surrogate biochemical marker like glucose levels,” Dr. Nissen said.
But current ADA recommendations “only weakly reflect contemporary knowledge,” he added. Although these guidelines do recommend considering empagliflozin or liraglutide for patients with atherosclerotic cardiovascular disease and “long-standing, suboptimally controlled type 2 diabetes,” their guidance on dual therapy does not reflect diverse cardiovascular outcomes data within and between classes, he said. “Just as we observed with statins, adoption of pivotal results is often just too slow.”
Integrating knowledge into practice will require close collaboration between cardiovascular and diabetes practitioners and “leadership from ADA to overcome residual inertia from decades of complacency,” he commented.
Dr. Pratley disclosed ties to AstraZeneca, Boehringer Ingelheim, Eli Lilly and Company, and several other pharmaceutical companies. Dr. Nissen disclosed research support from Novo Nordisk, Abbvie, Eli Lilly, and several other pharmaceutical companies, and travel support from Novo Nordisk.
SAN DIEGO – The glucagon-like peptide-1 (GLP-1) receptor agonist liraglutide significantly reduced the risk of initial and recurrent major cardiovascular events in high-risk patients with type 2 diabetes, according to new posthoc analyses from the LEADER (Liraglutide Effect and Action in Diabetes: Evaluation of Cardiovascular Outcome Results) trial.
Liraglutide’s cardioprotective effect did not depend on baseline use of insulin or cardiovascular medications, nor whether patients started insulin, sulfonylureas, or thiazolidinediones, or developed severe hypoglycemia during the trial, Richard Pratley, MD, told a packed auditorium at the annual scientific sessions of the American Diabetes Association. “It appears unlikely that the cardiovascular risk reduction with liraglutide can be fully explained by the observed differences in hemoglobin A1c, body weight, systolic blood pressure, and lipids,” he said. Experts have proposed several pathways, “but the bottom line is, in humans, we don’t know the mechanism for liraglutide’s benefit.”
In LEADER, 9,340 older patients with suboptimally controlled type 2 diabetes and additional cardiovascular risk factors were randomly assigned to liraglutide or placebo once daily. Patients were typically male, obese, and hypertensive, and about 18% had prior heart failure. Topline results reported last year at ADA included a 13% reduction in the rate of initial cardiovascular death, non-fatal myocardial infarction, and non-fatal stroke in the liraglutide group, compared with the placebo group (hazard ratio, 0.87; 95% confidence interval, 0.78 to 0.97).
The new posthoc analyses indicate that liraglutide also prevents both initial and recurrent cardiovascular events (HR, 0.86; 95% CI, 0.78 to 0.95) and that its cardioprotective effect spans subgroups of patients stratified according to whether they were on insulin, beta-blockers, ACE inhibitors, statins, and platelet aggregation inhibitors at baseline, said Dr. Pratley, senior investigator at the Translational Research Institute for Metabolism and Diabetes, and medical director of the Florida Hospital Diabetes Institute, Orlando.
Liraglutide also reduced cardiovascular events to about the same extent regardless of whether patients later started insulin, sulfonylureas, or thiazolidinediones or developed severe hypoglycemia.
Such findings signal a fundamental shift in diabetes care, commented Steven Nissen, MD, chair of the department of cardiovascular medicine, at the Cleveland Clinic, Cleveland, Ohio. For decades, patients and clinicians lacked diabetes outcomes trials, and “it took three successive shockwaves to awaken the medical community from its 50-year slumber.”
The wake-up call started when Dr. Nissen and his associates linked muraglitazar (JAMA. 2005 Nov 23;294[20]:2581-6) and rosiglitazone (N Engl J Med 2007; 356:2457-71) to an increased risk of major adverse cardiovascular events. This continued when researchers found that targeting glycated hemoglobin levels below 6.0% increased the risk of death in patients with type 2 diabetes, in the Action to Control Cardiovascular Risk in Diabetes (ACCORD) trial (N Engl J Med 2008; 358:2545-59).
In response, the Food and Drug Administration began requiring cardiovascular outcomes trials before and after approving new diabetes drugs. “The result has been a new era of research” that has revealed uneven outcomes and a lack of uniform class effects, Dr. Nissen said.
For example, lixisenatide and long-acting exenatide are GLP-1 receptor agonists like liraglutide, but neither of these two drugs were found to prevent cardiovascular outcomes compared with placebo. In addition, the DPP-4 inhibitors “provide no meaningful outcome benefits, minimal glucose lowering, and potential harm at a high cost of about $400 per month,” he said.
This class has suffered “three disappointments,” he added. He referred to findings that alogliptin and sitagliptin did not reduce cardiovascular events compared with placebo in the EXAMINE trial (N Engl J Med 2013; 369:1327-35) and TECOS trial (N Engl J Med 2015; 373:232-42), respectively, while the SAVOR-TIMI 53 trial linked saxagliptin to an increased risk of hospitalization for heart failure (HR, 1.27; 95% CI, 1.07 to 1.51).
In contrast, the sodium-glucose cotransporter-2 (SGLT-2) inhibitor empagliflozin reduced the rate of cardiovascular death, stroke, and MI by about 14% in the EMPA-REG trial (N Engl J Med 2015;373:2117-28).
Based on the LEADER results, the Food and Drug Administration’s Endocrinologic and Metabolic Drugs Advisory Committee voted 17-2 supporting a new cardiovascular indication for liraglutide in type 2 diabetes, at a meeting in June 2017.
“After 60 years of stagnation, we are now witnessing a new era in the pharmacological management of type 2 diabetes, which is allowing a choice of therapies based on actual clinical outcomes – risks and benefits – rather than a surrogate biochemical marker like glucose levels,” Dr. Nissen said.
But current ADA recommendations “only weakly reflect contemporary knowledge,” he added. Although these guidelines do recommend considering empagliflozin or liraglutide for patients with atherosclerotic cardiovascular disease and “long-standing, suboptimally controlled type 2 diabetes,” their guidance on dual therapy does not reflect diverse cardiovascular outcomes data within and between classes, he said. “Just as we observed with statins, adoption of pivotal results is often just too slow.”
Integrating knowledge into practice will require close collaboration between cardiovascular and diabetes practitioners and “leadership from ADA to overcome residual inertia from decades of complacency,” he commented.
Dr. Pratley disclosed ties to AstraZeneca, Boehringer Ingelheim, Eli Lilly and Company, and several other pharmaceutical companies. Dr. Nissen disclosed research support from Novo Nordisk, Abbvie, Eli Lilly, and several other pharmaceutical companies, and travel support from Novo Nordisk.
AT THE ADA ANNUAL SCIENTIFIC SESSIONS
Letter from the Editor: Brace yourself, but have a nice summer
By the time this column appears in print we will know whether the US Senate passed a version of the GOP health care bill. If so, millions of our patients will be at risk of losing insurance coverage in the name of tax and deficit reduction. I refer you to an article I wrote for the June issue of Clinical Gastroenterology and Hepatology about the potential transition from Obamacare to Trumpcare.
Our “Flashback” article this month concerns another long-running Congressional issue: repeal of the Sustainable Growth Rate and implementation of value-based reimbursement. We thank Dr. Larry Kosinski for his commentary and for successfully creating the first GI-specific alternative payment model to be endorsed by CMS.

John I. Allen, MD, MBA, AGAF, FACP
Editor in Chief
By the time this column appears in print we will know whether the US Senate passed a version of the GOP health care bill. If so, millions of our patients will be at risk of losing insurance coverage in the name of tax and deficit reduction. I refer you to an article I wrote for the June issue of Clinical Gastroenterology and Hepatology about the potential transition from Obamacare to Trumpcare.
Our “Flashback” article this month concerns another long-running Congressional issue: repeal of the Sustainable Growth Rate and implementation of value-based reimbursement. We thank Dr. Larry Kosinski for his commentary and for successfully creating the first GI-specific alternative payment model to be endorsed by CMS.
John I. Allen, MD, MBA, AGAF, FACP
Editor in Chief
