User login
High-status occupation spells worse response to antidepressant therapy
VIENNA – Depressed patients with a high-status job appear to be significantly less responsive to antidepressant therapy than other workers, Joseph Zohar, MD, reported at the annual congress of the European College of Neuropsychopharmacology.
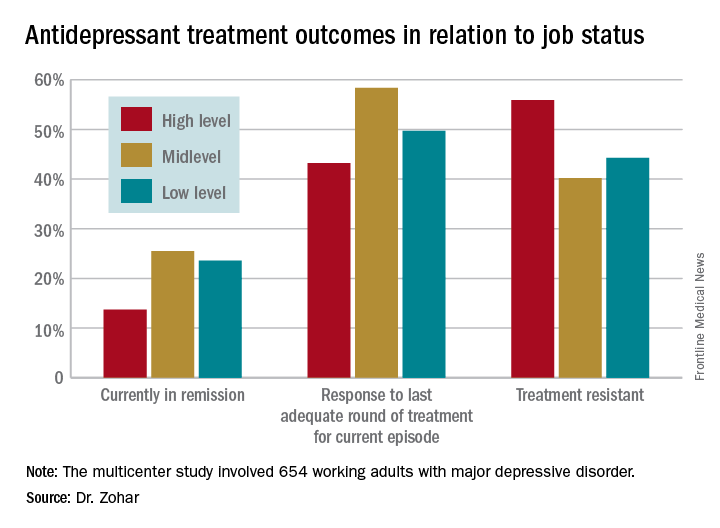
He presented a multicenter study of 654 Austrian, Israeli, Belgian, and Italian working adults with major depressive disorder. Those categorized as having a high occupational level were significantly less likely to have responded to the most recent trial of antidepressant medication for their current episode. They also had a significantly higher rate of treatment-resistant depression as defined by nonresponse to at least two previous adequate treatment trials, compared with the patients with mid- or low-level occupations.

“These results show that the need for precise prescribing is not only related to the symptoms and genetics but also to occupational level. One might need to prescribe different medication for the same disorder and need to take into account the occupational level in order to reach optimum effect,” he continued.
He and his coinvestigators categorized occupational level according to Hollingshead’s Occupational Scale, a tool widely used by sociologists. Occupational level is a different concept from socioeconomic status. It incorporates prestige, entry qualifications, job responsibilities, and skill requirements – as well as earnings. Examples of high occupational level jobs in this construct include physicians, engineers, architects, scientists, lawyers, CEOs, and professors.
Fifty-one percent of the study participants were classified as having high-status occupations, with the rest evenly divided between mid- and low-level occupations. Only 43.2% of patients in the high-level group had responded to their last treatment episode based upon clinical judgment and a Hamilton Depression Rating Scale score of 17 or less, compared with 58.4% of patients with mid- and 49.7% with low-level jobs.
At this point the explanation for the observed relationship between occupation level and antidepressant treatment response remains speculative. This is the first large study of its kind, and the results require confirmation. If the findings hold up, the results could have important implications for employers, who might want to discourage patients with high-status jobs and a history of treatment-resistant depression from particularly high work stress environments in order to reduce depression-related disability in the workplace, according to the psychiatrist.
Potential explanations for the findings include the possibility that depressed patients in high-level occupations are more likely to have poor illness acceptance, be less adherent to prescribed medications, or possess certain personality, cognitive, or behavioral differences that predispose to poor treatment outcome.
The study was funded by the ECNP’s Expert Platform on Mental Health – Focus on Depression. Dr. Zohar reported having no relevant financial conflicts.
VIENNA – Depressed patients with a high-status job appear to be significantly less responsive to antidepressant therapy than other workers, Joseph Zohar, MD, reported at the annual congress of the European College of Neuropsychopharmacology.
He presented a multicenter study of 654 Austrian, Israeli, Belgian, and Italian working adults with major depressive disorder. Those categorized as having a high occupational level were significantly less likely to have responded to the most recent trial of antidepressant medication for their current episode. They also had a significantly higher rate of treatment-resistant depression as defined by nonresponse to at least two previous adequate treatment trials, compared with the patients with mid- or low-level occupations.
“These results show that the need for precise prescribing is not only related to the symptoms and genetics but also to occupational level. One might need to prescribe different medication for the same disorder and need to take into account the occupational level in order to reach optimum effect,” he continued.
He and his coinvestigators categorized occupational level according to Hollingshead’s Occupational Scale, a tool widely used by sociologists. Occupational level is a different concept from socioeconomic status. It incorporates prestige, entry qualifications, job responsibilities, and skill requirements – as well as earnings. Examples of high occupational level jobs in this construct include physicians, engineers, architects, scientists, lawyers, CEOs, and professors.
Fifty-one percent of the study participants were classified as having high-status occupations, with the rest evenly divided between mid- and low-level occupations. Only 43.2% of patients in the high-level group had responded to their last treatment episode based upon clinical judgment and a Hamilton Depression Rating Scale score of 17 or less, compared with 58.4% of patients with mid- and 49.7% with low-level jobs.
At this point the explanation for the observed relationship between occupation level and antidepressant treatment response remains speculative. This is the first large study of its kind, and the results require confirmation. If the findings hold up, the results could have important implications for employers, who might want to discourage patients with high-status jobs and a history of treatment-resistant depression from particularly high work stress environments in order to reduce depression-related disability in the workplace, according to the psychiatrist.
Potential explanations for the findings include the possibility that depressed patients in high-level occupations are more likely to have poor illness acceptance, be less adherent to prescribed medications, or possess certain personality, cognitive, or behavioral differences that predispose to poor treatment outcome.
The study was funded by the ECNP’s Expert Platform on Mental Health – Focus on Depression. Dr. Zohar reported having no relevant financial conflicts.
AT THE ECNP CONGRESS
Key clinical point:
Major finding: Fifty-six percent of patients with high-status occupations who were treated for major depression were classified as treatment resistant, compared with 40% of patients with midlevel occupations and 44% with low-level occupations.
Data source: A study of 654 working adults with major depression in four countries.
Disclosures: The study was funded by the Expert Platform on Mental Health Focus on Depression. The presenter reported having no relevant financial conflicts.

Few non-ICU patients receive palliative care consults
LOS ANGELES – A significant percentage of patients who meet criteria for palliative care consultations do not receive a consult during their hospital stay, results from a single-center retrospective analysis showed.
“Physicians need to recognize the palliative care needs of patients with chronic illnesses other than malignancy before they get admitted to the ICU, especially when these patients are admitted repeatedly for the same problem [and] have a significant decline in functional status with a large symptom burden,” Mohleen Kang, MD, said in an interview in advance of the annual meeting of the American College of Chest Physicians. “There is a potential missed opportunity for these conversations to occur with the patients and their family prior to their decompensation and crisis.”

Twenty-nine percent (132) of the patients studied met an indication for a palliative care consult (PCC), with only 35 (27%) of such patients having received a PCC. Patients with metastatic cancer were significantly more likely to have received a PCC, compared with non-cancer patients (64% vs. 21%, respectively; P less than .001), while patients with New York Heart Association Class III or IV congestive heart failure were less likely to receive a PCC, compared with those who did not have congestive heart failure (5.6% vs. 29.8%; P = .014).
Criteria for PCC on admission include a life-limiting diagnosis and more than one admission in the past 3 months, decline in function, or complex care requirements. Criteria for PCC during hospitalization include life-limiting diagnosis and uncertainty about decisions, an ICU stay greater than 7 days, or lack of goals of care.
Dr. Kang, chief resident in the department of medicine at New Jersey Medical School, Newark, presented the results, which were of patients admitted to the department of medicine at University Hospital in Newark in 2015. Those admitted to the ICU within 24 hours of admission were excluded from the analysis, leaving 461 patient charts that were screened for PCC needs based on the consensus report from the Center to Advance Palliative Care.
The patients who met an indication for PCC had a mean age of 60 years and an average length of stay of 7 days. The percentages of these patients who were female, African American, and Hispanic were 45%, 40%, and 21%, respectively.
On multivariate analysis, patients who had a PCC within 72 hours of admission were eight times more likely to have a hospital length of stay less than 7 days (P = .019), while those who had a PCC within 48 hours of admission were 20 times more likely to have a hospital length of stay less than 7 days (P = .017). “So if we intervened early, we were able to decrease their length of stay to less than 7 days,” Dr. Kang said at the meeting.
She acknowledged certain limitations of the study, including its small sample size, retrospective design, and lack of follow-up. “This study also has a lot of confounding socioeconomic factors that do not make it applicable to every hospital across the country,” she said. “This is not a homogeneous patient population.”
The study’s principal investigator was Anne Sutherland, MD, medical intensive care unit director at University Hospital. Dr. Kang reported having no financial disclosures.
LOS ANGELES – A significant percentage of patients who meet criteria for palliative care consultations do not receive a consult during their hospital stay, results from a single-center retrospective analysis showed.
“Physicians need to recognize the palliative care needs of patients with chronic illnesses other than malignancy before they get admitted to the ICU, especially when these patients are admitted repeatedly for the same problem [and] have a significant decline in functional status with a large symptom burden,” Mohleen Kang, MD, said in an interview in advance of the annual meeting of the American College of Chest Physicians. “There is a potential missed opportunity for these conversations to occur with the patients and their family prior to their decompensation and crisis.”
Twenty-nine percent (132) of the patients studied met an indication for a palliative care consult (PCC), with only 35 (27%) of such patients having received a PCC. Patients with metastatic cancer were significantly more likely to have received a PCC, compared with non-cancer patients (64% vs. 21%, respectively; P less than .001), while patients with New York Heart Association Class III or IV congestive heart failure were less likely to receive a PCC, compared with those who did not have congestive heart failure (5.6% vs. 29.8%; P = .014).
Criteria for PCC on admission include a life-limiting diagnosis and more than one admission in the past 3 months, decline in function, or complex care requirements. Criteria for PCC during hospitalization include life-limiting diagnosis and uncertainty about decisions, an ICU stay greater than 7 days, or lack of goals of care.
Dr. Kang, chief resident in the department of medicine at New Jersey Medical School, Newark, presented the results, which were of patients admitted to the department of medicine at University Hospital in Newark in 2015. Those admitted to the ICU within 24 hours of admission were excluded from the analysis, leaving 461 patient charts that were screened for PCC needs based on the consensus report from the Center to Advance Palliative Care.
The patients who met an indication for PCC had a mean age of 60 years and an average length of stay of 7 days. The percentages of these patients who were female, African American, and Hispanic were 45%, 40%, and 21%, respectively.
On multivariate analysis, patients who had a PCC within 72 hours of admission were eight times more likely to have a hospital length of stay less than 7 days (P = .019), while those who had a PCC within 48 hours of admission were 20 times more likely to have a hospital length of stay less than 7 days (P = .017). “So if we intervened early, we were able to decrease their length of stay to less than 7 days,” Dr. Kang said at the meeting.
She acknowledged certain limitations of the study, including its small sample size, retrospective design, and lack of follow-up. “This study also has a lot of confounding socioeconomic factors that do not make it applicable to every hospital across the country,” she said. “This is not a homogeneous patient population.”
The study’s principal investigator was Anne Sutherland, MD, medical intensive care unit director at University Hospital. Dr. Kang reported having no financial disclosures.
AT CHEST 2016
Key clinical point:
Major finding: Patients with metastatic cancer were significantly more likely to have received a PCC, compared with non-cancer patients (64% vs. 21%, respectively; P less than .001).
Data source: A retrospective study of 132 patients admitted to the department of medicine at University Hospital in Newark, N.J., in 2015.
Disclosures: Dr. Kang reported having no financial disclosures.
Fluid administration in sepsis did not increase need for dialysis
LOS ANGELES – Fluid administration of at least 1 L did not increase the incidence of acute respiratory or heart failure in severe sepsis, and actually seemed to decrease the need for dialysis in a review of 164 patients at Scott and White Memorial Hospital in Temple, Tex.
For every 1 mL of fluid administered per kilogram of body weight, the likelihood of dialysis decreased by 8.5% (odds ratio, 0.915; 95% confidence interval, 0.854-0.980; P = .0111), with no increase in heart or respiratory failure on univariate analysis. The 126 patients (77%) who received at least 1 L had a 68% reduction in the need for dialysis (OR, 0.32; CI, 0.117-0.890; P = .0288).

“The No. 1 reason we weren’t meeting benchmarks was fluid administration,” explained lead investigator Aruna Jahoor, MD, a pulmonary critical care and sleep medicine fellow at Texas Tech University Health Sciences Center.
Seventeen percent of patients received greater than or equal to 30 mL/kg of fluid resuscitation, while 28% received greater than or equal to 20 mL/kg of intravenous fluid resuscitation. It turned out that staff in the emergency department - where most of the patients were treated in the critical first 6 hours - were concerned about fluid overload and throwing patients into respiratory, heart, or renal failure, Dr. Jahoor said. The team didn’t find a difference in mortality when patients received 30 mL/kg - just over 2 L in a 70-kg patient - versus 20 mL/kg or 1 L. The patients’ in-hospital mortality rate and 28-day mortality rate were 27%, and 32%, respectively.
There also weren’t increased rates of heart failure, acute respiratory failure, or mechanical ventilation when patients received at least 1 L of fluid. “There were [also] lower rates of dialysis, which indicated that we weren’t overloading patients. Even when we looked at fluid as a continuous variable, we still didn’t see” complications, Dr. Jahoor said.
The findings should be reassuring to treating physicians. “When you have pushback against 30-mL/kg administration, you can say ‘well, at least let’s give a liter. You don’t have to worry as much about some of the complications you are citing,’ ” she said.
For very obese patients, “it can get a little uncomfortable to be given” enough fluid to meet the 30-mL/kg goal, “but you can give at least a liter” without having to worry too much, she said. The patients in the study were treated from 2010 to 2013; normal saline was the most common resuscitation fluid. The hospital has since added the 30-mL/kg fluid resuscitation to its sepsis admission orders, and compliance has increased significantly.
A multivariate analysis is in the works to control for confounders. “We will probably [still] see you are not having increased rates of congestive heart or respiratory failure, or needing dialysis,” Dr. Jahoor said. The protective effect against dialysis might drop out, “but I am hoping it doesn’t,” he said.
The investigators had no relevant financial disclosures.
LOS ANGELES – Fluid administration of at least 1 L did not increase the incidence of acute respiratory or heart failure in severe sepsis, and actually seemed to decrease the need for dialysis in a review of 164 patients at Scott and White Memorial Hospital in Temple, Tex.
For every 1 mL of fluid administered per kilogram of body weight, the likelihood of dialysis decreased by 8.5% (odds ratio, 0.915; 95% confidence interval, 0.854-0.980; P = .0111), with no increase in heart or respiratory failure on univariate analysis. The 126 patients (77%) who received at least 1 L had a 68% reduction in the need for dialysis (OR, 0.32; CI, 0.117-0.890; P = .0288).
“The No. 1 reason we weren’t meeting benchmarks was fluid administration,” explained lead investigator Aruna Jahoor, MD, a pulmonary critical care and sleep medicine fellow at Texas Tech University Health Sciences Center.
Seventeen percent of patients received greater than or equal to 30 mL/kg of fluid resuscitation, while 28% received greater than or equal to 20 mL/kg of intravenous fluid resuscitation. It turned out that staff in the emergency department - where most of the patients were treated in the critical first 6 hours - were concerned about fluid overload and throwing patients into respiratory, heart, or renal failure, Dr. Jahoor said. The team didn’t find a difference in mortality when patients received 30 mL/kg - just over 2 L in a 70-kg patient - versus 20 mL/kg or 1 L. The patients’ in-hospital mortality rate and 28-day mortality rate were 27%, and 32%, respectively.
There also weren’t increased rates of heart failure, acute respiratory failure, or mechanical ventilation when patients received at least 1 L of fluid. “There were [also] lower rates of dialysis, which indicated that we weren’t overloading patients. Even when we looked at fluid as a continuous variable, we still didn’t see” complications, Dr. Jahoor said.
The findings should be reassuring to treating physicians. “When you have pushback against 30-mL/kg administration, you can say ‘well, at least let’s give a liter. You don’t have to worry as much about some of the complications you are citing,’ ” she said.
For very obese patients, “it can get a little uncomfortable to be given” enough fluid to meet the 30-mL/kg goal, “but you can give at least a liter” without having to worry too much, she said. The patients in the study were treated from 2010 to 2013; normal saline was the most common resuscitation fluid. The hospital has since added the 30-mL/kg fluid resuscitation to its sepsis admission orders, and compliance has increased significantly.
A multivariate analysis is in the works to control for confounders. “We will probably [still] see you are not having increased rates of congestive heart or respiratory failure, or needing dialysis,” Dr. Jahoor said. The protective effect against dialysis might drop out, “but I am hoping it doesn’t,” he said.
The investigators had no relevant financial disclosures.
AT CHEST 2016
Key clinical point:
Major finding: For every 1 mL/kg of fluid administered, the likelihood of dialysis decreased by 8.5% (OR, 0.915; 95% CI, 0.854-0.980; P = .0111), with no increase in heart or respiratory failure on univariate analysis.
Data source: A review of 164 septic patients.
Disclosures: The investigators had no relevant financial disclosures.
Data point to optimal window for endoscopy in sicker patients with peptic ulcer bleeding
The timing of endoscopy may make the difference between life and death in sicker patients with peptic ulcer bleeding, according to an analysis of more than 12,000 patients treated in Denmark.
Patients who were hemodynamically stable but had a higher level of comorbidity were about half as likely to die during their hospital stay if they underwent endoscopy within 12-36 hours of presentation as compared with sooner or later, results showed (Gastrointest Endosc. 2016 Sep 10. doi: 10.1016/j.gie.2016.08.049). And hemodynamically unstable patients had a roughly one-fourth reduction in the odds of death if they underwent the procedure within 6-24 hours.
“Although caution should be applied when interpreting these data, the current recommendation of endoscopy within 0-24 hours may not be optimal for all patients,” wrote the investigators, who were led by Stig B. Laursen, PhD, department of medical gastroenterology, Odense (Denmark) University Hospital.
“Our data may suggest that in patients with major comorbidities, the first few hours of hospital admission might be best used for optimising treatment of comorbidities, which may include correction of severe anaemia, reversal of anticoagulants, and investigation for possible infection that requires rapid treatment with antibiotics,” they elaborate. “Likewise, in patients with hemodynamic instability, endoscopy between 6 and 24 hours from time of admission to hospital allows time for optimal resuscitation and initiating treatment of comorbid diseases before endoscopy. However, these data should not lead to delayed endoscopy in patients with severe hemodynamic instability not responding to intensive resuscitation.”
The investigators analyzed data from 12,601 consecutive patients with peptic ulcer bleeding admitted between January 2005 and September 2013 to Danish hospitals, where all patients had access to 24-hour endoscopy. Time to endoscopy was assessed from hospital admission, defined as arrival in the emergency department, or from symptom onset in patients who developed bleeding when already hospitalized.
For analyses, the patients were stratified by hemodynamic status (a marker for the severity of bleeding) and by American Society of Anesthesiologists score (a marker for the extent of comorbidity).
The timing of endoscopy did not significantly influence in-hospital or 30-day mortality in hemodynamically stable patients with an American Society of Anesthesiologists score of 1-2 as a whole, Dr. Laursen and his colleagues report. Subgroup analyses suggested a reduction of in-hospital mortality when it was done between 0 and 24 hours in those patients whose bleeding began outside the hospital (adjusted odds ratio, 0.48).
In contrast, analyses revealed a U-shaped association between timing and mortality for hemodynamically stable patients with an American Society of Anesthesiologists score of 3-5. For this group, in-hospital mortality was significantly lower when endoscopy was performed within 12-36 hours as compared with times outside this window (adjusted OR, 0.48), and 30-day mortality tended to be lower as well.
Similarly, timing appeared to influence outcome for hemodynamically unstable patients, having both systolic blood pressure below 100 mm Hg and heart rate above 100 beats/min. For this group, performance of endoscopy within 6-24 hours was associated with significantly lower in-hospital mortality (adjusted OR, 0.73) and also 30-day mortality (adjusted OR, 0.66). Patients’ American Society of Anesthesiologists score did not appear to play a role here.
The study’s findings may have been affected by unmeasured and unknown confounders, acknowledge the investigators, who declared that they have no competing interests related to the research.
“Although a well-powered randomized controlled trial represents the best way to account for these problems, randomizing patients with [peptic ulcer bleeding] to early versus late endoscopy will be very difficult, including from an ethical and methodological point of view,” they note.
Key clinical point:
Major finding: In-hospital mortality was lower when endoscopy was performed within 12-36 hours in hemodynamically stable patients with higher comorbidity (odds ratio, 0.48) and within 6-24 hours in hemodynamically unstable patients (OR, 0.73).
Data source: A nationwide cohort study of 12,601 consecutive patients admitted to Danish hospitals with peptic ulcer bleeding.
Disclosures: The investigators declare that they do not have any competing interests.
Surgical infections, early discharge hike readmissions in extrahepatic cholangiocarcinoma
WASHINGTON – Hospital readmissions are common after resection of extrahepatic cholangiocarcinoma, with about 20% of patients returning in the first 90 days after surgery.
Two factors – surgical site infections and an abbreviated length of stay – both quadrupled the risk of readmission, Michail Mavros, MD, said at the American College of Surgeons Clinical Congress.
“Surgeons are scrutinized over length of stay and, as a result, these fast-track recovery pathways are increasingly important. Readmission rates are being used as a quality metric and performance indicator, and tied to reimbursement. But our data suggest that we should be somewhat cautious in implementing those with this surgery. The patient may look great with good pain control, and be eating and ambulating by day 4 or 5, but it may be premature to discharge at that point, and safer to wait a little longer. The financial penalty for readmission is probably not worth that small bonus we get for early discharge.”
The study comprised 422 patients who underwent resection with curative intent for extrahepatic cholangiocarcinoma. This is a rare tumor with about 5,000 cases presenting each year. Dr. Mavros and his colleagues extracted their data from the U.S. Extrahepatic Cholangiocarcinoma Collaborative. The primary outcomes were 30- and 90-day readmission rates.
The patients’ median age was 67 years. About a third had mild comorbidities with an American Society of Anesthesiologist (ASA) comorbidity class of 1-2. The rest had moderate to severe comorbidities (ASA class 3-4). Hypertension was common (48%); 18% had diabetes.
Tumor location was split almost equally between distal and hilar; the median tumor size was 2.3 cm.
Final margins were positive in 28% and half of the cohort had positive regional lymph nodes.
The procedures were quite varied, and included common bile duct resection (18%); hepatectomy plus common bile duct resection (40%); and Whipple procedure (42%). The median estimated blood loss was 500 cc; 28% of the cohort required transfusion with packed red blood cells and 8% with fresh frozen plasma.
Postoperative complications were common (63%), with half of those being classed as serious. Infectious complications were most common, including superficial (11%), deep (7%), and organ space infections (16%).
Bile leaks occurred in 4% of cases. Reoperations were necessary in 7%. The 30-day mortality was 4.5% and 90-day mortality, 8%.The median length of stay was 8 days but this ranged from 7 to 18 days.
The 30-day readmission rate was 19% and the 90-day readmission rate was 23%. Most readmissions occurred fairly quickly – the median time to readmission was 12 days, with a range of 6-24 days.
The investigators conducted a multivariate analysis to determine independent predictors of readmission. The strongest predictors were any surgical complications (odds ratio, 8.4); organ-space infection (OR, 4.5); and length of stay of 8 days or less (OR, 4.3). Other predictors were advancing age (OR, 1.5 for each 10 years) and having had a liver resection (OR, 2.0).
“It’s clear from these results that avoidance of complications, especially infectious complications, may improve readmission rates dramatically,” Dr. Mavros said. “We would advise caution in implementing any fast-track protocols with these patients, given the finding that early discharge was associated with a higher rate of readmission.”
Dr. Mavros had no financial disclosures.
[email protected]
On Twitter @alz_gal
Key clinical point:
Major finding: Organ space infections and a shorter length of stay both quadrupled the risk of a readmission.
Data source: The database review comprised 422 patients.
Disclosures: Dr. Mavros had no financial disclosures.
VA Treats Patients’ Impatience With Clinical Pharmacists
MADISON, WIS.— Something astonishing has happened in the past year to outpatient treatment at the Veterans Affairs hospital here.
Vets regularly get next-day and even same-day appointments for primary care now, no longer waiting a month or more to see a doctor as many once did.
The reason is they don’t all see doctors. Clinical pharmacists — whose special training permits them to prescribe drugs, order lab tests, make referrals to specialists and do physical examinations — are handling more patients’ chronic care needs. That frees physicians to concentrate on new patients and others with complex needs.
A quarter of primary care appointments at the Madison hospital are now handled by clinical pharmacists since they were integrated in patient care teams in 2015. Several VA hospitals — in El Paso, Texas, and Kansas City, Mo., among them — have followed Madison’s approach and more than 36 others are considering it, according to hospital officials.
“It’s made a tremendous positive impact in improving access,” said Dr. Jean Montgomery, chief of primary care services at the Madison hospital.
That’s critical for the VA, the focus of a national scandal in 2014 after news reports revealed the Phoenix VA hospital had booked primary care appointments months in advance, schedulers falsified wait times to make them look shorter and dozens had died awaiting care. Further investigations uncovered similar problems at other VA facilities. More than two years later, tens of thousands of vets are still waiting a month or two for an appointment, according to the latest data from the VA.
The Obama administration has allowed some veterans to seek care in the private sector if they choose, but VA wait times remain long and more action is needed, theGeneral Accountability Office reported in April.
Expanding clinical pharmacists’ role is a solution.
They receive two more years of education than regular pharmacists and they can handle many primary care needs for patients, particularly after physicians have diagnosed their conditions.
The VA has had them for more than 20 years, but their growing involvement in patient care is more recent. This year it employs 3,185 clinical pharmacists with authority to prescribe medications, order lab tests and perform physical assessments — nearly a 50 percent increase since 2011.
“It’s having a significant impact on reducing wait times and our office is trying to expand more of them nationally to increase access,” said Heather Ourth, national clinical program manager for VA Pharmacy Benefits Management Services.
In 2015, VA clinical pharmacists wrote 1.9 million prescriptions for chronic diseases, according to a report co-authored by Ourth and published in September in the American Journal of Health-System Pharmacy.
A goal is to increase the use of clinical pharmacists to help patients with mental health needs and pain management.
“This helps open up appointment slots for physicians to meet patients with acute care needs,” Ourth said.
Clinical pharmacists’ authority is determined at each VA hospital based on their training and knowledge.
The Madison VA allowed clinical pharmacists to take over management of patients with chronic diseases such as diabetes and high blood pressure, participate in weekly meetings with doctors and other members of patients’ care teams and handle patients’ calls about medications.
They typically see five patients in their office each day, usually for 30 minutes each, and they talk to another 10 by telephone, said Ellina Seckel, the clinical pharmacist who led the changes at the hospital.
Many issues involve adjusting medication dosages such as insulin, which do not require a face-to-face visit. When Seckel sees patients, she often helps them lower the number of drugs they take because they may cause unnecessary complications.
Expanding clinical pharmacists’ role in primary care has cut readmission rates and helped more patients keep their diabetes under control, Seckel said.
VA hospital officials in both Madison and El Paso said they faced challenges initially in persuading doctors to delegate some duties to qualified pharmacists.
“Some physicians feel like it’s a turf war and don’t want to refer their patients because they feel the clinical pharmacist is trying to practice medicine,” said Lanre’ Obisesan, a clinical pharmacist and assistant chief of pharmacy at the El Paso VA.
Even so, the El Paso VA’s average wait time fell from two months to two weeks, he said, after it added several clinical pharmacists and gave them independence to help patients. About 30 percent of the VA patients in El Paso have used clinical pharmacists, Obisesan said.
That share will rise. The hospital now has one clinical pharmacist for every six physicians, but it aims to add more pharmacists to reduce the ratio to 1 to 3.
The Madison VA is close to that ratio now after adding four clinical pharmacist positions in the past year.
Patients there can choose whether to see a doctor or a pharmacist. With approval from primary care physicians, pharmacists took over 27 percent of the follow-up appointments for patients with chronic illnesses, Seckel said.
That shift yields benefits for both doctors and patients, said Montgomery, the head of primary care services at the Madison VA.
Many VA doctors only have time to deal with patients’ acute care issues, such as knee or back pain, with little time to focus on a patient’s multiple chronic illnesses and often a dozen or more medications they may be taking for them.
“The more we can have members of the team to do routine things that do not require a physician’s time the better the quality of the visit and the better patient outcomes,” he said.
Patients seem to like what the hospital is doing.
Stephen Howard Foster saw a clinical pharmacist recently who told him he could stop taking one heartburn medication and switched him to another medicine to reduce side effects. He said he was comfortable with the pharmacist advising him without first consulting his physician and he saved time.
“This is a good idea rather than put up with normal delays,” said Foster, 51.
Another Madison VA patient, Mike Fonger, 71, saw clinical pharmacist Anita Kashyap recently to get a blood pressure check, lab test results, a review of his medications and to change an ointment he was taking for back and shoulder pain. Kashyap also helped him ease the side effects from the cholesterol-lowering drug he takes by cutting his dosage in half.
“I like the extra attention I get here,” Fonger said.
This story was produced by Kaiser Health News, which publishes California Healthline, a service of the California Health Care Foundation.
Test approved to screen donated blood for sickle cell trait
The US Food and Drug Administration (FDA) has approved use of the PreciseType HEA test to screen blood donors for sickle cell trait (SCT).
The test was previously FDA approved for use in determining blood compatibility between donors and transfusion recipients.
The added utility of screening donors for SCT addresses the desire to avoid transfusing red blood cells from SCT donors to neonates or patients with sickle cell disease.
Blood from SCT donors can also present a problem when performing the required filtration of white cells from the blood donation.
The PreciseType HEA test will allow these units to be identified prior to filtration and provide blood center staff with the opportunity to decide how best to utilize the various components of a whole blood donation.
The PreciseType HEA test is manufactured by BioArray Solutions, a wholly owned subsidiary of Immucor, Inc.
“We’ve successfully demonstrated the clinical benefits of our PreciseType HEA test, and this is evident in the FDA broadening its approved use,” said Michael Spigarelli, vice president of medical affairs at Immucor.
“The use of PreciseType HEA to screen donor units for patients with sickle cell disease, neonates, or any individual that may require SCT-negative blood provides a great improvement over previously used methods and offers the first FDA-approved molecular method specifically for screening units.”
SCT screening has traditionally been performed by solubility testing of sickle hemoglobin in buffer, but blood centers have been looking for an alternative due to limitations in this method.
According to Immucor, a molecular approach using PreciseType HEA can overcome the throughput limitations and reduce the false-positive rates observed with the traditional SCT screening method.
“We had already validated the PreciseType HEA test for [SCT screening] in our lab,” said Connie Westhoff, PhD, of the New York Blood Center in New York, New York.
“Our previous screening method required manual testing and interpretation of the results and had high false-positive rates. About 1 in 12 minority donors possess the sickle trait, so accurate results are important to us to avoid unnecessary notifications to donors and deferred blood units. We are now able to identify SCT in our donors utilizing the same PreciseType HEA test we are already running on many of our donors without running additional tests.” ![]()
FDA grants drug orphan designation for CTCL
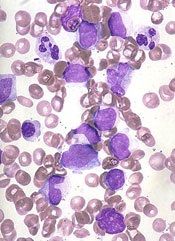
The US Food and Drug Administration (FDA) has granted orphan drug designation to TLC178 for the treatment of cutaneous T-cell lymphoma (CTCL).
TLC178 is a liposomal-encapsulated formulation of the chemotherapy drug vinorelbine, which is FDA approved to treat non-small cell lung cancer.
The goal with TLC178 is to improve the efficacy and decrease the toxicity of vinorelbine to extend the indication beyond solid tumors into lymphoma.
A proprietary technology known as NanoX™ is used to load vinorelbine into liposomes designed to target tumor-specific cell-surface epitopes, extend the circulation time of the drug, increase the concentation of drug delivered to tumor cells, and decrease side effects.
TLC178 is being developed by Taiwan Liposome Company.
The company recently received US FDA approval for its phase 1/2 study (NCT02925000) investigating TLC178 in patients with advanced cancers, including CTCL and other lymphomas.
This trial is planned for sites in Taiwan and the US. The trial will be initiated in Taiwan once approval is granted by the Taiwan FDA.
About orphan designation
The US FDA grants orphan designation to drugs and biologics intended to treat, diagnose, or prevent diseases/disorders that affect fewer than 200,000 people in the US.
The designation provides incentives for sponsors to develop products for rare diseases. This may include tax credits toward the cost of clinical trials, prescription drug user fee waivers, and 7 years of market exclusivity if the product is approved. ![]()
Resource use lower for patients on dabigatran, data suggest

Photo by ec-jpr
Real-world data suggest that, in the first year of treatment with an anticoagulant, patients with non-valvular atrial fibrillation tend to use fewer healthcare resources if they receive dabigatran rather than warfarin.
Patients treated with dabigatran experienced fewer all-cause hospitalizations, emergency room (ER) visits, and physician office visits than patients treated with warfarin.
These findings were published in The American Journal of Pharmacy Benefits.
The research was supported by Boehringer Ingelheim Pharmaceuticals, Inc., the company that markets dabigatran as Pradaxa.
“While there are many published studies comparing the clinical outcomes of [dabigatran] and warfarin, this is one of the first to compare their respective impact on the use of healthcare resources,” said study author Matthew Sussman, of Boston Health Economics, Inc. in Waltham, Massachusetts.
“Beyond data from clinical studies, it is important for physicians to also understand the experiences patients have in real-world settings, including the economic considerations of their treatment choices.”
Sussman and his colleagues analyzed data on 3890 patients newly diagnosed with non-valvular atrial fibrillation—1945 treated with dabigatran and 1945 treated with warfarin—using de-identified electronic health records from a large, nationwide database of US integrated delivery networks.
Patients in the warfarin cohort were propensity-score matched 1:1 to patients in the dabigatran cohort and were followed up to 1 year after initiating therapy to assess all-cause, stroke-related, and bleed-related healthcare resource use.
The researchers found that dabigatran-treated patients had a significantly lower number of mean per-patient per-year (PPPY) hospitalizations (1.07 vs 1.20, P<0.001), ER visits (0.36 vs 0.51, P<0.001), and physician office visits (10.64 vs 18.13, P<0.001) than patients treated with warfarin.
When it came to stroke-related resource use, dabigatran-treated patients had a significantly lower number of mean PPPY hospitalizations (0.06 vs 0.10, P=0.03) and physician office visits (0.16 vs 0.29, P=0.02). But the difference in ER visits between the dabigatran and warfarin groups was not significant (0 vs 0.01, P=0.65).
As for bleed-related resource use, there was no significant difference between the dabigatran and warfarin groups with regard to the mean number of PPPY hospitalizations (0.05 vs 0. 03, P=0.49) or physician office visits (0.05 vs 0.15, P=0.57). But the difference in ER visits was significant (0.01 vs 0.03, P=0.02). ![]()
Team identifies genetic hallmarks of B-ALL subtype

Photo courtesy of St. Jude
Children’s Research Hospital
Researchers say they have uncovered a unique paradigm of transcription factor deregulation in B-precursor acute lymphoblastic leukemia (B-ALL).
The team found that deregulation of the homeobox transcription factor gene DUX4 and the ETS transcription factor gene ERG is a hallmark of a subtype of B-ALL that may comprise up to 8% of B-ALL cases.
The researchers reported these findings in Nature Genetics.
“Our work is motivated by a lack of information on the genetic basis of many B-ALL cases,” said study author Charles Mullighan, MBBS, MD, of St. Jude Children’s Research Hospital in Memphis, Tennessee.
“We discovered a distinct gene pattern in blood samples from some patients in our study and wanted to determine the underlying molecular events behind this signal.”
The researchers studied a group of 1913 B-ALL patients (including children, adolescents, and young adults) to understand the genetic basis of the disease.
Microarray and transcriptome sequencing revealed that 7.6% of these patients had the distinctive genetic profile the researchers wanted to characterize further.
“Our work revealed that, in this type of B-ALL, there is a sequence of molecular events that involves the interplay of 2 transcription factors,” Dr Mullighan said.
The team observed rearrangement of the gene DUX4 in all cases of this subtype of B-ALL, which resulted in high-level expression of DUX4. DUX4 was shown to bind to the ERG gene, leading to deregulated expression of ERG.
The deregulation of ERG compromised the function of ERG either by deleting part of the gene or by expressing another form of ERG—ERGalt. In both cases, loss of activity was observed for the ERG transcription factor, which led to leukemia.
“These results underscore that there is still more to be learned about the genetic changes in ALL, and that this knowledge can help refine treatment for patients,” said study author Stephen Hunger, MD, of the Children’s Hospital of Philadelphia in Pennsylvania.
The researchers hope identification of the relationships between the 2 transcription factors will lead to new diagnostic tests for patients. DUX4/ERG ALL is linked to favorable outcomes even when other detrimental genetic mutations are present.
Currently, only transcriptome or genome sequencing helps identify the DUX4 rearrangements. The researchers say other detection methods, such as fluorescence hybridization or karyotyping, are not sufficient to recognize genetic changes to DUX4. ![]()