User login
Combo appears effective against B-ALL
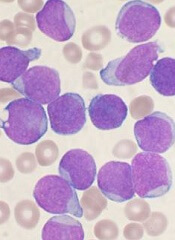
Combining a MEK inhibitor and a BCL-2/BCL-XL inhibitor may be a feasible treatment option for B-cell acute lymphoblastic leukemia (B-ALL), according to preclinical research published in Cell Death and Disease.
Researchers found that, when given alone, the MEK inhibitor trametinib did not block B-ALL cell growth.
And the BCL-2/BCL-XL inhibitors navitoclax (ABT-263) and venetoclax (ABT-199) did not prove particularly effective either.
However, combining trametinib with navitoclax or venetoclax successfully induced apoptosis in B-ALL cells.
“Cancer cells often outwit us by rewiring themselves, but this early research offers a promising idea to get ahead of them,” said study author Richard Marais, PhD, of the Cancer Research UK Manchester Institute.
“We’ll still need to do further research to prove that this is the case beyond cancer cells in the laboratory, and it may take many years before we see it in the clinic, but it’s the first step to finding a new, effective drug combination for B-cell acute lymphoblastic leukemia.”
Dr Marais and his colleagues found that, although the MEK/ERK pathway is activated in B-ALL cells driven by different oncogenes, MEK inhibition alone did not suppress B-ALL cell growth.
And although B-ALL cells were sensitive to treatment with navitoclax or venetoclax alone, the researchers did not see complete loss of cell viability at clinically achievable doses.
However, trametinib did synergize with either navitoclax or venetoclax to suppress proliferation and induce apoptosis in B-ALL cells.
Further investigation revealed that the resistance of B-ALL cells to BCL-2/BCL-XL inhibition is mediated by MCL-1. And the synergism between trametinib and navitoclax/venetoclax is mediated by the pro-apoptotic factor BIM.
BIM is dephosphorylated as a result of MEK inhibition, which allows it to bind to and neutralize MCL-1, thereby enhancing BCL-2/BCL-XL inhibitor-induced cell death.
The researchers said they observed this effect in B-ALL cells driven by a range of genetic abnormalities, so the combination of a MEK inhibitor and a BCL-2/BCL-XL inhibitor could have therapeutic potential in a range of B-ALL subtypes. ![]()
Why married cancer patients fare better

Photo by Alena Kratochvilova
Results from two new studies provide a possible explanation for the link between marital status and survival in cancer patients.
Previous studies have shown that married cancer patients are more likely to survive and tend to have longer survival times than unmarried cancer patients.
Now, a pair of studies published in Cancer suggest it is the social support a patient receives from a spouse that may improve the patient’s outcome.
In the first study, Scarlett Lin Gomez, PhD, of the Cancer Prevention Institute of California, and her colleagues assessed the impact of socioeconomic factors and marital status on survival in cancer patients.
The team found evidence to suggest that economic resources play a minimal role in explaining the inferior survival observed in unmarried cancer patients.
In the second study, María Elena Martínez, PhD, of UC San Diego Moores Cancer Center, and her colleagues assessed the roles that race/ethnicity, sex, and nativity play in the survival of married and unmarried cancer patients.
The group found that not being married was associated with higher mortality, but the association varied by race/ethnicity and sex. The researchers believe these differences can be explained by the differences in social support networks between racial/ethnic groups and between men and women.
Patient cohort
Both studies were conducted on the same cohort of patients from the California Cancer Registry.
The researchers studied 783,167 cancer patients—393,470 males and 389,697 females. They were diagnosed from 2000 through 2009 with a first primary, invasive cancer of the 10 most common sites of cancer-related death for each sex, which included leukemias and lymphomas.
The patients were followed through December 31, 2012. A total of 386,607 patients died from any cause—204,007 males and 182,600 females.
Economic factors
Dr Gomez and her colleagues evaluated health insurance status and neighborhood socioeconomic status for the nearly 800,000 patients.
The researchers found that unmarried cancer patients had a greater risk of death than married patients, and this risk was higher among males than females. The hazard ratio (HR) for males was 1.27 (95% CI, 1.26-1.29), and the HR for females was 1.19 (95% CI, 1.18-1.20, P-interaction <0.001).
When the researchers adjusted for insurance status and neighborhood socioeconomic status, the marital status HRs decreased to 1.22 (95% CI, 1.21–1.24) for males and 1.15 (95% CI, 1.14–1.16) for females.
Based on these results, the researchers concluded that the survival benefit of marriage operates independently of the economic resources evaluated in this study.
“While other studies have found similar protective effects associated with being married, ours is the first in a large, population-based setting to assess the extent to which economic resources explain these protective effects,” Dr Gomez said. “Our study provides evidence for social support as a key driver.”
Race/ethnicity, nativity, and sex
Dr Martínez and her colleagues found that all-cause mortality was higher in the unmarried patients than in the married patients, but this varied significantly according to race/ethnicity and sex.
Marriage conferred less of a survival benefit for women than for men. However, for both sexes, non-Hispanic whites benefitted the most from being married, and Hispanics and Asian Pacific Islanders benefitted less.
Among males, the adjusted HRs were 1.24 (95% CI, 1.23-1.26) in non-Hispanic whites, 1.20 (95% CI, 1.16-1.24) in blacks, 1.20 (95% CI, 1.17-1.23) in Hispanics, and 1.11 (95% CI, 1.07-1.15) in Asian Pacific Islanders.
In females, the adjusted HRs were 1.17 (95% CI, 1.15-1.18) in non-Hispanic whites, 1.09 (95% CI, 1.05-1.13) in blacks, 1.11 (95% CI, 1.08-1.14) in Hispanics, and 1.07 (95% CI, 1.04-1.11) in Asian Pacific Islanders.
The researchers also found that all-cause mortality associated with unmarried status was higher in US-born Asian Pacific Islander and Hispanic men and women relative to their foreign-born counterparts.
“The results suggest that the more acculturated you become to US culture, the more it impacts cancer survivorship,” Dr Martínez said. “Our hypothesis is that non-Hispanic whites don’t have the same social network as other cultures that have stronger bonds with family and friends outside of marriage.”
“As individuals acculturate, they tend to lose those bonds. It’s also been shown that women seek out help for health concerns more frequently than men, and women tend to remind spouses to see their physicians and live a healthy lifestyle.” ![]()
Novel drug fails to prevent contrast-induced nephropathy
CHICAGO – CMX-2043, a novel agent intended for prevention of contrast-induced nephropathy, failed in the phase II, double-blind, placebo-controlled CARIN clinical trial presented at the annual meeting of the American College of Cardiology.
The drug had also shown promise in small preliminary studies for the prevention of periprocedural myocardial infarction in patients undergoing coronary stenting. There again, however, CMX-2043 – a derivative of alpha lipoic acid with antioxidant and cell membrane–stabilizing properties – proved ineffective in the 361-patient, 31-center phase II trial, reported Dr. Deepak L. Bhatt, professor of medicine at Harvard Medical School and executive director of interventional cardiovascular programs at Brigham and Women’s Hospital, both in Boston.

All participants in CARIN had baseline severe impairment of kidney function or mild to moderate renal impairment plus another risk factor, such as diabetes or age greater than 75 years. One hour prior to coronary angiography, they received various doses of CMX-2043 or placebo.
Unfortunately, no difference between the four treatment arms was present in terms of the primary study endpoint: the incidence of acute kidney injury as defined by at least a 0.3 mg/dL rise in serum creatinine from baseline on day 4. No dose response to CMX-2043 was evident, nor did the investigational agent have any impact on the risk of major adverse cardiovascular events.
Immediately prior to Dr. Bhatt’s presentation, Dr. Michelle L. O’Donoghue of Brigham and Women’s Hospital presented the equally negative results of the LATITUDE-TIMI 60 trial, a phase III trial of the investigational mitogen-activated protein kinase inhibitor losmapimod, a drug developed to improve outcomes in patients with an acute coronary syndrome.
“It’s a bit distressing” to witness back to back presentations of clinical trials that proved resoundingly negative despite very strong-looking preliminary data, commented discussant Dr. Anthony N. DeMaria, professor of medicine at the University of California, San Diego. What’s going on here? he asked.
“I think it’s a fundamental truth that a lot of things that look good in preclinical work, even when backed up by a lot of solid science, don’t pan out in human studies,” Dr. Bhatt replied. “That’s a challenge, and probably in no other arena more so than in tackling inflammation and antioxidant therapy.
“There’s a graveyard of compounds that have not worked, and now we’ve perhaps added another one,” Dr. Bhatt continued. “But it doesn’t mean that scientific inquiry isn’t important, because I think eventually we’ll have drugs for these problems, whether it’s reperfusion injury or contrast-induced nephropathy. It’ll probably just take a lot more time and effort.”
The one solace regarding the CARIN trial, in Dr. Bhatt’s view, is that it highlighted the advantages of what is known as an adaptive trial design. Instead of jumping from positive early-phase results straight to a definitive 10,000-patient phase III clinical trial, investigators were able to obtain answers regarding the drug’s ability to prevent two major problems in patients undergoing coronary angiography – contrast-induced nephropathy and major adverse cardiac events – by means of a single 361-patient trial that was comparatively inexpensive.
Acute kidney injury secondary to exposure to contrast agents remains a significant problem, with an incidence of 20%-25% in high-risk patients. Numerous proposed prophylactic agents have ultimately proved not useful, including sodium bicarbonate, N-acetylcysteine, and intravenous fenoldopam.
Indeed, the only preventive measures of proven effectiveness are hydration with saline for 12 hours preangioplasty, and limiting the volume of contrast agent used. In real-world clinical practice, however, it’s often impractical to administer the optimal 12 hours of saline because of hospital pressure to get patients out quickly, Dr. Bhatt observed.
“There remains an important unmet clinical need to find agents that reduce the occurrence of contrast nephropathy,” he stressed.
Ischemix funded the CARIN trial. Dr. Bhatt reported receiving a research grant from the company that was directed to Brigham and Women’s Hospital.
CHICAGO – CMX-2043, a novel agent intended for prevention of contrast-induced nephropathy, failed in the phase II, double-blind, placebo-controlled CARIN clinical trial presented at the annual meeting of the American College of Cardiology.
The drug had also shown promise in small preliminary studies for the prevention of periprocedural myocardial infarction in patients undergoing coronary stenting. There again, however, CMX-2043 – a derivative of alpha lipoic acid with antioxidant and cell membrane–stabilizing properties – proved ineffective in the 361-patient, 31-center phase II trial, reported Dr. Deepak L. Bhatt, professor of medicine at Harvard Medical School and executive director of interventional cardiovascular programs at Brigham and Women’s Hospital, both in Boston.
All participants in CARIN had baseline severe impairment of kidney function or mild to moderate renal impairment plus another risk factor, such as diabetes or age greater than 75 years. One hour prior to coronary angiography, they received various doses of CMX-2043 or placebo.
Unfortunately, no difference between the four treatment arms was present in terms of the primary study endpoint: the incidence of acute kidney injury as defined by at least a 0.3 mg/dL rise in serum creatinine from baseline on day 4. No dose response to CMX-2043 was evident, nor did the investigational agent have any impact on the risk of major adverse cardiovascular events.
Immediately prior to Dr. Bhatt’s presentation, Dr. Michelle L. O’Donoghue of Brigham and Women’s Hospital presented the equally negative results of the LATITUDE-TIMI 60 trial, a phase III trial of the investigational mitogen-activated protein kinase inhibitor losmapimod, a drug developed to improve outcomes in patients with an acute coronary syndrome.
“It’s a bit distressing” to witness back to back presentations of clinical trials that proved resoundingly negative despite very strong-looking preliminary data, commented discussant Dr. Anthony N. DeMaria, professor of medicine at the University of California, San Diego. What’s going on here? he asked.
“I think it’s a fundamental truth that a lot of things that look good in preclinical work, even when backed up by a lot of solid science, don’t pan out in human studies,” Dr. Bhatt replied. “That’s a challenge, and probably in no other arena more so than in tackling inflammation and antioxidant therapy.
“There’s a graveyard of compounds that have not worked, and now we’ve perhaps added another one,” Dr. Bhatt continued. “But it doesn’t mean that scientific inquiry isn’t important, because I think eventually we’ll have drugs for these problems, whether it’s reperfusion injury or contrast-induced nephropathy. It’ll probably just take a lot more time and effort.”
The one solace regarding the CARIN trial, in Dr. Bhatt’s view, is that it highlighted the advantages of what is known as an adaptive trial design. Instead of jumping from positive early-phase results straight to a definitive 10,000-patient phase III clinical trial, investigators were able to obtain answers regarding the drug’s ability to prevent two major problems in patients undergoing coronary angiography – contrast-induced nephropathy and major adverse cardiac events – by means of a single 361-patient trial that was comparatively inexpensive.
Acute kidney injury secondary to exposure to contrast agents remains a significant problem, with an incidence of 20%-25% in high-risk patients. Numerous proposed prophylactic agents have ultimately proved not useful, including sodium bicarbonate, N-acetylcysteine, and intravenous fenoldopam.
Indeed, the only preventive measures of proven effectiveness are hydration with saline for 12 hours preangioplasty, and limiting the volume of contrast agent used. In real-world clinical practice, however, it’s often impractical to administer the optimal 12 hours of saline because of hospital pressure to get patients out quickly, Dr. Bhatt observed.
“There remains an important unmet clinical need to find agents that reduce the occurrence of contrast nephropathy,” he stressed.
Ischemix funded the CARIN trial. Dr. Bhatt reported receiving a research grant from the company that was directed to Brigham and Women’s Hospital.
AT ACC 16
Key clinical point: There continues to be a major unmet need for agents that reduce the risk of contrast-induced nephropathy.
Major finding: The once-promising investigational antioxidant and cell membrane stabilizer CMX-2043 proved ineffective for prevention of renal or cardiac injuries in patients undergoing coronary angiography.
Data source: This randomized, double-blind, placebo-controlled, 31-center, phase II study involved 361 patients with baseline renal impairment, all of whom were scheduled for coronary angiography.
Disclosures: Ischemix funded the study. Dr. Bhatt reported receiving a research grant from the company that was directed to Brigham and Women’s Hospital.

Stick with wheat flour for baked egg and milk challenges
LOS ANGELES – Children who pass oral food challenges to baked egg and milk with wheat flour are at risk for reacting to baked goods made with nonwheat flours, according to a review of more than 200 pediatric food challenges at National Jewish Health in Denver.
The children were already known to be sensitive to egg and milk, and some were being challenged to see if exposure therapy was helping. Unbeknown to the pediatric food allergy team, a kitchen worker at National Jewish had started making muffins with rice flour, thinking it would be safer.

During the month of muffins with rice flour, the failure rate for baked egg challenge muffins rose from 28% (33/120) to 58% (11/19) with rice flour. Failure to baked milk muffins rose from 14% (9/66) to 36% (5/14) (J Allergy Clin Immunol. 2016 Feb. doi: 10.1016/j.jaci.2015.12.579).
Adjusting for age, gender, and atopic dermatitis, children were more than five times more likely to fail baked eggs without wheat (odds ratio, 5.4; P = .002), and more than four times more likely to fail baked milk (OR, 4.06; P = .05).
Given that the phenomenon hasn’t been reported before, “This was very surprising to us,” said study investigator Dr. Bruce Lanser, director of the pediatric food allergy program at National Jewish. “You have to warn parents that if children pass a baked challenge with wheat, they have to continue to eat their baked milk and egg with wheat. Gluten-free products are not going to have the same effect.
“If somebody is avoiding wheat because it causes a bit of redness and itchiness, you have to clear that wheat allergy” before moving to baked egg and milk, Dr. Lanser added.
There’s also concern that “kids will go home after passing a wheat muffin challenge, eat something that’s gluten-free, and have a reaction,” he noted. Wheat-free baked goods might also not build tolerance as well, although that’s not clear from the study, Dr. Lanser said at the annual meeting of the American Academy of Allergy, Asthma, and Immunology.
Wheat seems to have something unique that alters the allergic properties of egg and milk proteins to help children outgrow their sensitivities. “Rice doesn’t have the same effect,” he observed, and it’s not known if any other grains do. Dr. Lanser said he is interested in looking into rye, barley, oats, and other alternatives.
The mean age of the children in the study was 6 years, and most children had multiple food allergies. Sensitization was confirmed by skin tests and specific IgE.
Meanwhile, there’s a new rule in the National Jewish kitchen: Unless a child has true celiac disease, “always make [challenge] muffins with wheat,” Dr. Lanser said.
There was no industry funding for the work, and the investigators had no disclosures.
LOS ANGELES – Children who pass oral food challenges to baked egg and milk with wheat flour are at risk for reacting to baked goods made with nonwheat flours, according to a review of more than 200 pediatric food challenges at National Jewish Health in Denver.
The children were already known to be sensitive to egg and milk, and some were being challenged to see if exposure therapy was helping. Unbeknown to the pediatric food allergy team, a kitchen worker at National Jewish had started making muffins with rice flour, thinking it would be safer.
During the month of muffins with rice flour, the failure rate for baked egg challenge muffins rose from 28% (33/120) to 58% (11/19) with rice flour. Failure to baked milk muffins rose from 14% (9/66) to 36% (5/14) (J Allergy Clin Immunol. 2016 Feb. doi: 10.1016/j.jaci.2015.12.579).
Adjusting for age, gender, and atopic dermatitis, children were more than five times more likely to fail baked eggs without wheat (odds ratio, 5.4; P = .002), and more than four times more likely to fail baked milk (OR, 4.06; P = .05).
Given that the phenomenon hasn’t been reported before, “This was very surprising to us,” said study investigator Dr. Bruce Lanser, director of the pediatric food allergy program at National Jewish. “You have to warn parents that if children pass a baked challenge with wheat, they have to continue to eat their baked milk and egg with wheat. Gluten-free products are not going to have the same effect.
“If somebody is avoiding wheat because it causes a bit of redness and itchiness, you have to clear that wheat allergy” before moving to baked egg and milk, Dr. Lanser added.
There’s also concern that “kids will go home after passing a wheat muffin challenge, eat something that’s gluten-free, and have a reaction,” he noted. Wheat-free baked goods might also not build tolerance as well, although that’s not clear from the study, Dr. Lanser said at the annual meeting of the American Academy of Allergy, Asthma, and Immunology.
Wheat seems to have something unique that alters the allergic properties of egg and milk proteins to help children outgrow their sensitivities. “Rice doesn’t have the same effect,” he observed, and it’s not known if any other grains do. Dr. Lanser said he is interested in looking into rye, barley, oats, and other alternatives.
The mean age of the children in the study was 6 years, and most children had multiple food allergies. Sensitization was confirmed by skin tests and specific IgE.
Meanwhile, there’s a new rule in the National Jewish kitchen: Unless a child has true celiac disease, “always make [challenge] muffins with wheat,” Dr. Lanser said.
There was no industry funding for the work, and the investigators had no disclosures.
AT 2016 AAAAI ANNUAL MEETING
Key clinical point: Children are more likely to react to nonwheat challenge muffins, and wheat substitutes might not work as well for oral immunotherapy.
Major finding: The failure rate for baked egg challenge muffins rose from 28% (33/120) to 58% (11/19) with rice flour. Failure to baked milk muffins rose from 14% (9/66) to 36% (5/14).
Data source: Single-center review of more than 200 pediatric food challenges.
Disclosures: There was no industry funding for the work, and the investigators had no disclosures.
Some infants predisposed to epidermal barrier breakdown, atopic dermatitis
Neonates with the highest transepidermal water loss at birth, likely mediated through an impaired epidermal barrier, show significantly elevated chymotrypsinlike protease activity and reduced levels of filaggrin-derived natural moisturizing factors, which may predispose them to the development of atopic dermatitis, according to a report published online in the British Journal of Dermatology.
John Chittock of the University of Sheffield, England, and his colleagues assessed the biophysical, biologic, and functional properties of the developing neonatal stratum corneum (SC) from birth to 4 weeks of age in 115 healthy, full-term (at least 37 weeks’ gestation) neonates from the OBSERVE (Oil in Baby Skincare) randomized study birth cohort recruited at Saint Mary’s Hospital, Central Manchester NHS Foundation Trust, between September 2013 and June 2014.
For comparative purposes, an unrelated cohort of 20 adults with healthy skin was recruited from the local community between January and April 2015 (Br J Dermatol. 2016 Mar 19. doi: 10.1111/bjd.14568).
The researchers found that the biophysical properties of the neonatal SC are transitional from birth. For example, overall transepidermal water loss (TEWL) increased significantly during the first 4 weeks of infant life. Compared with adult skin, the newborn infant SC was found to be drier and more alkaline. In addition, levels of superficial chymotrypsinlike protease activity at birth did not differ between newborns and adults, while levels of filaggrin-derived natural moisturizing factors (NMF) were significantly lower at birth than in adulthood.
The increased chymotrypsinlike protease activity and NMF at 4 weeks of age exceeded levels found in healthy adults, rather than reaching their mature state. Compared with adult skin, the skin of infants is functionally immature, with undeveloped mechanisms of desquamation and differentiation, the investigators noted.
Further analysis revealed a correlation between TEWL and both superficial chymotrypsinlike protease activity and filaggrin-derived NMF at birth.
To explore that link, the researchers stratified the neonatal cohort according to TEWL percentile. The neonates in the 76th-100th percentile, the highest TEWL at birth, showed significantly elevated chymotrypsinlike protease activity and reduced levels of filaggrin-derived NMF, compared with neonates in lower percentiles. Therefore, those neonates are at highest risk for developing atopic dermatitis, the study authors said.
The findings indicate a need for infant skin care regimens that protect and support normal barrier development from birth, the researchers noted. They also suggested that clinical strategies targeting the early mechanisms of barrier breakdown could act as preventive measures in neonates at increased risk of developing atopic dermatitis.
The research was funded jointly by the University of Sheffield and a doctoral research fellowship supported by the National Institute for Health Research. The authors declared no conflicts of interest.
FROM THE BRITISH JOURNAL OF DERMATOLOGY
Key clinical point: Some infants are predisposed to epidermal barrier breakdown and the development of atopic dermatitis through elevated protease activity and reduced levels of natural moisturizing factors at birth.
Major finding: Significantly elevated chymotrypsinlike protease activity and reduced levels of natural moisturizing factors were associated with impaired epidermal barrier function at birth.
Data sources: The OBSERVE study birth cohort included a total of 115 healthy, full-term (at least 37 weeks’ gestation) neonates recruited at Saint Mary’s Hospital, Central Manchester NHS Foundation Trust, between September 2013 and June 2014, as well as an unrelated cohort of 20 adults with healthy skin recruited from the local community between January and April 2015.
Disclosures: This independent research was funded jointly by the University of Sheffield and a Doctoral Research Fellowship supported by the National Institute for Health Research. The authors declared no conflicts of interest.
OTX015 dose for lymphoma narrowed in phase 1 study
As a single agent for use in patients with lymphoma, an acceptable once-daily dose of OTX015 appears to be 80 mg on a 14 days on, 7 days off schedule, the results of a phase 1 study indicate.
The small-molecule inhibitor, which inhibits binding of bromodomain and exterminal proteins to acetylated histones, was associated with acceptable toxicity and efficacy in this regimen. The investigational drug is now being tested in expansion cohorts on a schedule of 14 days every 3 weeks, a regimen projected to allow for recovery from the drug’s toxic effects, Dr. Sandy Amorin of Hôpital Saint Louis, Paris, and associates reported.
The drug also is being evaluated in patients with acute leukemias.
Adults with nonleukemia hematologic malignancies that progressed on standard therapies participated in the open-label study, which was conducted at seven university hospital centers in Europe. Oral OTX015 was given once a day at one of five doses (10 mg, 20 mg, 40 mg, 80 mg, and 120 mg). The 3 + 3 study design permitted evaluation of alternative administration schedules. The primary endpoint was dose-limiting toxicity in the first treatment cycle (21 days). Secondary objectives were to evaluate safety, pharmacokinetics, and preliminary clinical activity of OTX015. The study is ongoing and is registered with ClinicalTrials.gov, number NCT01713582.
The study included 33 patients with lymphoma and 12 with myeloma; patients’ median age was 66 years, and they had received a median of four lines of prior therapy. No dose-limiting toxicities were seen in three patients given doses as high as 80 mg once a day. However, grade 4 thrombocytopenia occurred in five of six patients on a 21-day schedule of 40 mg twice a day. No patient tolerated various schedules of 120 mg once a day (Lancet Haematol. 2016;3[4]:e196-204).
The researchers then examined the 80 mg once a day dose on a continuous basis in four patients, two of whom developed grade 4 thrombocytopenia. In light of these and other toxicities, a regimen was proposed of 80 mg once a day on a schedule of 14 days on, 7 days off.
Thrombocytopenia affected 43 of 45 patients, and 26 of them had grade 3-4 events. Other grade 3-4 events were infrequent. Anemia was seen in 41, and neutropenia in 23.
Of three patients with diffuse large B-cell lymphoma, two had complete responses at 120 mg once a day, and one had a partial response at 80 mg once a day. Six additional patients, two with diffuse large B-cell lymphoma and four with indolent lymphomas, had evidence of clinical activity, but did not meet the criteria for an objective response.
The study was funded by the developers of OTX015, Oncoethix GmbH, a wholly owned subsidiary of Merck Sharp & Dohme.
On Twitter @maryjodales
FROM THE LANCET HAEMATOLOGY
Key clinical point: For lymphoma patients, a regimen has been determined for the small-molecule inhibitor OTX015 that was associated with acceptable toxicity and efficacy.
Major finding: On a regimen of 80 mg once a day on a schedule of 14 days on, 7 days off, thrombocytopenia affected 43 of 45 patients, and 26 of them had grade 3-4 events. However, other grade 3-4 events were infrequent.
Data source: The open-label study NCT01713582 was conducted at seven university hospital centers in Europe.
Disclosures: The study was funded by the developers of OTX015, Oncoethix GmbH, a wholly owned subsidiary of Merck Sharp & Dohme.
Early predictors of GDM identified in women with PCOS
BOSTON – A prospective cohort study of women with polycystic ovarian syndrome who developed gestational diabetes mellitus during pregnancy has implicated fasting blood glucose, non–high density lipoprotein, and sex hormone–binding globulin as significant predictive factors for the development of GDM.
“Polycystic ovarian syndrome [PCOS] is the most common reproductive disorder in women of reproductive age and is commonly associated with metabolic disorders including diabetes and obesity. In women with GDM, a history of PCOS is associated with higher incidence of complications and postpregnancy glucose intolerance. Risk factors during early pregnancy in women with PCOS for development of GDM have not been well characterized,” said Dr. Wenyu Huang of Northwestern University, Chicago.

To provide some clarity, Dr. Huang and his colleagues conducted a prospective cohort study. Inclusion criteria were age 18-45 years, diagnosis of PCOS prior to conception, singlet pregnancy, and enrollment during the first trimester. Preexisting chronic disease including diabetes, hypertension, and thyroid, kidney, or cardiovascular disease was grounds for exclusion. The findings were presented at the annual meeting of the Endocrine Society.
The 248 women with PCOS enrolled from 2011 to 2013 from a screened population of 25,000 pregnant women were followed from their first prenatal visit (before week 18) to delivery. Blood was collected at the first visit for analysis of metabolic hormones. A 75-g oral glucose tolerance test (OGTT) was carried out at week 24-28 and diagnosis of GDM was according to 2013 American Diabetes Association OGTT criteria.
Of the 248 women, 75 (30.2%) developed GDM, and 173 (69.8%) women had normal OGTT results. Examination over the same time period early in pregnancy revealed a higher incidence of GDM in women with PCOS.
In a univariate analysis, PCOS patients who developed GDM had higher fasting blood glucose (FBG), Homeostasis Model Assessment-Insulin resistance (HOMA-IR) score, total cholesterol, low-density lipoprotein cholesterol, non-HDL cholesterol, systolic and diastolic blood pressures, and free testosterone index. These patients also had lower levels of sex hormone–binding globulin (SHBG) and higher likelihood of family history of diabetes and earlier delivery.
Multiple logistic regression revealed associations between increased incidence of GDM and FBG greater than or equal to 4.86 mmol/L, non-HDL cholesterol greater than or equal to 2.84 mmol/L, and SHBG greater than or equal to 222 nmol/L. The predictive power of the three factors for the development of GDM in PCOS was relatively strong.
Future studies could aim to validate the prediction model and clarify the pathogenic basis of GDM in PCOS women, according to the researchers .
The study was funded by the Beijing Science Committee. Dr. Huang had no disclosures.
BOSTON – A prospective cohort study of women with polycystic ovarian syndrome who developed gestational diabetes mellitus during pregnancy has implicated fasting blood glucose, non–high density lipoprotein, and sex hormone–binding globulin as significant predictive factors for the development of GDM.
“Polycystic ovarian syndrome [PCOS] is the most common reproductive disorder in women of reproductive age and is commonly associated with metabolic disorders including diabetes and obesity. In women with GDM, a history of PCOS is associated with higher incidence of complications and postpregnancy glucose intolerance. Risk factors during early pregnancy in women with PCOS for development of GDM have not been well characterized,” said Dr. Wenyu Huang of Northwestern University, Chicago.
To provide some clarity, Dr. Huang and his colleagues conducted a prospective cohort study. Inclusion criteria were age 18-45 years, diagnosis of PCOS prior to conception, singlet pregnancy, and enrollment during the first trimester. Preexisting chronic disease including diabetes, hypertension, and thyroid, kidney, or cardiovascular disease was grounds for exclusion. The findings were presented at the annual meeting of the Endocrine Society.
The 248 women with PCOS enrolled from 2011 to 2013 from a screened population of 25,000 pregnant women were followed from their first prenatal visit (before week 18) to delivery. Blood was collected at the first visit for analysis of metabolic hormones. A 75-g oral glucose tolerance test (OGTT) was carried out at week 24-28 and diagnosis of GDM was according to 2013 American Diabetes Association OGTT criteria.
Of the 248 women, 75 (30.2%) developed GDM, and 173 (69.8%) women had normal OGTT results. Examination over the same time period early in pregnancy revealed a higher incidence of GDM in women with PCOS.
In a univariate analysis, PCOS patients who developed GDM had higher fasting blood glucose (FBG), Homeostasis Model Assessment-Insulin resistance (HOMA-IR) score, total cholesterol, low-density lipoprotein cholesterol, non-HDL cholesterol, systolic and diastolic blood pressures, and free testosterone index. These patients also had lower levels of sex hormone–binding globulin (SHBG) and higher likelihood of family history of diabetes and earlier delivery.
Multiple logistic regression revealed associations between increased incidence of GDM and FBG greater than or equal to 4.86 mmol/L, non-HDL cholesterol greater than or equal to 2.84 mmol/L, and SHBG greater than or equal to 222 nmol/L. The predictive power of the three factors for the development of GDM in PCOS was relatively strong.
Future studies could aim to validate the prediction model and clarify the pathogenic basis of GDM in PCOS women, according to the researchers .
The study was funded by the Beijing Science Committee. Dr. Huang had no disclosures.
Key clinical point: Several factors may be predictive of early development of gestational diabetes mellitus in pregnant women with polycystic ovarian syndrome.
Major finding: Multiple logistic regression revealed associations between increased incidence of gestational diabetes mellitus and fasting blood glucose greater than or equal to 4.86 mmol/L, non-HDL cholesterol greater than or equal to 2.84 mmol/L, and sex hormone–binding globulin greater than or equal to 222 nmol/L.
Data source: Prospective cohort study involving 248 women.
Disclosures: The study was funded by the Beijing Science Committee. Dr. Huang had no disclosures.

Hepatitis C virus transmission peaked in 1950
Iatrogenic factors, not high-risk behaviors, were the main cause of the exponential spread of hepatitis C virus infections in North America, according to a phylogenetic study published online in the Lancet Infectious Diseases.
The study shifted the epicenter of spread back by more than 15 years, to about 1950, when medical procedures were expanding after World War II at the same time that clinicians continued to reuse metal and glass syringes, said Dr. Jeffrey Joy of the British Columbia Centre for Excellence in HIV/AIDS, Vancouver, and his associates.

Exponential HCV transmission had mostly ended by 1965, negating “the idea that the epidemic among baby boomers and other demographic groups in North America is primarily due to injection drug use, unsafe tattooing, high-risk sex, and travel to high endemic areas during youth,” the researchers added.
The hepatitis C virus evolves rapidly, enabling researchers to characterize its spread based on the genetic divergence of infections. Dr. Joy and his associates studied 45,316 HCV genotype 1a sequences from the National Center for Biotechnology Information GenBank nucleotide database to carry out phylogenetic analyses of five HCV genes – E1, E2, NS2, NS4B, and NS5B (Lancet Infect Dis. 2016 Mar 30. doi: 10.1016/S1473-3099[16]00124-9).
The combined results for all gene regions suggested that the North American HCV epidemic expanded the most between 1940 and 1965, and that transmission rates peaked in 1950, when the oldest baby boomers were only 5 years old. Thus, nosocomial transmission rather than risky behaviors was the likely driver behind most infections, the researchers said.
“Our results could help to reduce stigma related to screening and diagnosis of hepatitis C virus, potentially increasing the numbers of providers offering screening, patients accepting testing, and if positive, presenting for care and treatment,” the authors noted.
The researchers also found that HCV transmission rates plateaued between 1965 and 1989, and dropped in the early 1990s, coinciding with increases in blood product testing and needle exchange programs aimed at preventing HIV infections. Furthermore, HCV infections rose slightly after 2000, mirroring epidemiologic reports of outbreaks among young injection drug users in nonurban areas and among men who have sex with men, the researchers said.
The Canadian Institutes of Health Research, Michael Smith Foundation for Health Research, and BC Centre for Excellence in HIV/AIDS funded the study. The investigators disclosed no competing interests.
Dr. Jeffrey Joy and colleagues offer evidence that the era of high rates of transmission and rapid expansion of hepatitis C virus infections was from 1940 to 1960, when reuse of glass and metal syringes was common.
The authors conclude that attributing the spread of hepatitis C virus to the medical establishment, rather than youthful behavior long outgrown by most baby boomers, could justify changing the message around screening of baby boomers. Baby boomers came of age when nosocomial transmission could have been rampant. For this additional reason, rather than just individual behavior, all Americans born between 1945 and 1965 should be tested, say the authors.
This change of message, while effective, could backfire. By accepting responsibility for the pre-1960 spread, the medical establishment might increase stigma for patients born after the uptake of disposable syringes and safer clinical practices. Also, screening by birth cohort might already be outlasting its usefulness in some populations. Lowering the cost of hepatitis C virus testing could lead to routine, universal testing becoming the norm, making birth cohort testing obsolete.
Last, the novel method used in this study could be replaced by an even newer, more precise technology; would our message need to change once more?
Here are the facts: Hepatitis C virus is common among Americans born between 1945 and 1965. A current Centers for Disease Control and Prevention fact sheet asserts that most people infected with hepatitis C virus are unaware of their diagnosis, despite aggressive campaigns since 2012 to find cases. Let’s just go ahead and test our baby boomers.
Dr. Anne C. Spaulding and Dr. Lesley S. Miller are at the Rollins School of Public Health, Emory University, Atlanta. They reported receiving grants and other funding from Gilead Sciences and Bristol-Myers Squibb. These comments are from their editorial (Lancet Infect Dis. 2016 Mar 30. doi: 10.1016/S1473-3099[16]30002-0).
Iatrogenic factors, not high-risk behaviors, were the main cause of the exponential spread of hepatitis C virus infections in North America, according to a phylogenetic study published online in the Lancet Infectious Diseases.
The study shifted the epicenter of spread back by more than 15 years, to about 1950, when medical procedures were expanding after World War II at the same time that clinicians continued to reuse metal and glass syringes, said Dr. Jeffrey Joy of the British Columbia Centre for Excellence in HIV/AIDS, Vancouver, and his associates.
Exponential HCV transmission had mostly ended by 1965, negating “the idea that the epidemic among baby boomers and other demographic groups in North America is primarily due to injection drug use, unsafe tattooing, high-risk sex, and travel to high endemic areas during youth,” the researchers added.
The hepatitis C virus evolves rapidly, enabling researchers to characterize its spread based on the genetic divergence of infections. Dr. Joy and his associates studied 45,316 HCV genotype 1a sequences from the National Center for Biotechnology Information GenBank nucleotide database to carry out phylogenetic analyses of five HCV genes – E1, E2, NS2, NS4B, and NS5B (Lancet Infect Dis. 2016 Mar 30. doi: 10.1016/S1473-3099[16]00124-9).
The combined results for all gene regions suggested that the North American HCV epidemic expanded the most between 1940 and 1965, and that transmission rates peaked in 1950, when the oldest baby boomers were only 5 years old. Thus, nosocomial transmission rather than risky behaviors was the likely driver behind most infections, the researchers said.
“Our results could help to reduce stigma related to screening and diagnosis of hepatitis C virus, potentially increasing the numbers of providers offering screening, patients accepting testing, and if positive, presenting for care and treatment,” the authors noted.
The researchers also found that HCV transmission rates plateaued between 1965 and 1989, and dropped in the early 1990s, coinciding with increases in blood product testing and needle exchange programs aimed at preventing HIV infections. Furthermore, HCV infections rose slightly after 2000, mirroring epidemiologic reports of outbreaks among young injection drug users in nonurban areas and among men who have sex with men, the researchers said.
The Canadian Institutes of Health Research, Michael Smith Foundation for Health Research, and BC Centre for Excellence in HIV/AIDS funded the study. The investigators disclosed no competing interests.
FROM THE LANCET INFECTIOUS DISEASES
Key clinical point: Iatrogenic factors, rather than high-risk behaviors, were the most likely cause of the exponential spread of hepatitis C virus infections in North America.
Major finding: Transmission of HCV genotype 1a peaked in North America in 1950, when the oldest baby boomers were 5 years old.
Data source: A retrospective phylogenetic study of five HCV genotype 1a genes from 45,316 publicly available sequences.
Disclosures: The Canadian Institutes of Health Research, Michael Smith Foundation for Health Research, and BC Centre for Excellence in HIV/AIDS funded the study. The investigators disclosed no competing interests.
Colombia reports first Zika deaths, all in medically compromised patients
AMSTERDAM – Five people with confirmed Zika virus infections have died in Colombia, and all had medical comorbidities, including leukemia, diabetes, sickle cell anemia, and hypertension.
All of the deaths occurred last October in northern and central Colombia, Dr. Alfonso Rodriguez-Morales said at the European Society of Clinical Microbiology and Infectious Diseases annual congress.
Four of the cases were simultaneously published April 7 in the Lancet Infectious Diseases (2016 Apr 7. doi: 10.1016/S1473-3099[16]30006-8). The fifth case occurred in northern Colombia, and was reported in Emerging Infectious Diseases (2016 May. doi: 10.3201/eid2205.151934).
Reports of confirmed Zika-related deaths are rare. Brazil, the only other country to disclose them, has now reported three, said Dr. Rodriguez-Morales of the Universidad Tecnológica de Pereira, Colombia.

“Before the current outbreak in Latin America, Zika virus was not linked to deaths,” he noted. But the eight confirmed Zika-related deaths in South America “call attention to the need for evidence-based guidelines for clinical management of Zika, as well as the possible occurrence of atypical and severe cases, including possibly congenitally related microcephaly.”
Because they all occurred in medically compromised patients, Dr. Rodriguez-Morales also urged clinicians to cast a wary eye on such patients who present with arbovirus-type symptoms, including fever and rash.
From September 2015 to March 2016, Colombia had 58,838 reported cases of Zika. Of those, only 2,361 were lab confirmed. The rest were either diagnosed clinically or were suspected cases, Dr. Rodriguez-Morales said. Although Colombia has a much smaller population than Brazil (49 million vs. 210 million), its Zika case rate is much higher, 120 cases per 100,000 people vs. 34 cases per 100,000 people.
The group of four deaths occurred in central Colombia, and included a 2-year-old girl, a 30-year-old woman, a 61-year-old man, and a 72-year-old woman. All presented with 2-6 days of fever. All were initially suspected to have dengue fever or chikungunya. None tested positive for dengue, but the man was coinfected with chikungunya.
All patients presented with anemia. All but the older man also had severe thrombocytopenia.
The toddler presented with hepatomegaly, mucosal hemorrhage, progressive respiratory collapse, progressive thrombocytopenia, and intravascular coagulation. She died 5 days after symptom onset and was found to have had unrecognized lymphoblastic leukemia.
The 30-year-old woman presented with a severe rash on both arms. She also exhibited coagulation dysfunction, including severe thrombocytopenia and leukopenia that progressed to intracerebral and subarachnoid hemorrhage. She died 12 days after symptom onset. She was determined to have had unrecognized acute myeloid leukemia.
The elderly man had a history of medically controlled hypertension. He experienced mucosal hemorrhage and respiratory distress. He died 7 days after symptom onset. On autopsy, his liver showed necrotic areas, and his spleen indicated a systemic inflammatory response.
The elderly woman had a history of insulin-controlled type 2 diabetes. Her symptoms included gastrointestinal distress, thrombocytopenia, and acute respiratory failure. She died 48 hours after symptom onset; her brain showed edema and ischemic lesions.
The 15-year-old girl in northern Colombia had a 5-year history of sickle cell disease, which, Dr. Rodriguez-Morales pointed out, is a risk factor for arbovirus diseases. However, the patient had never been hospitalized for a vasoocclusive crisis. She presented with a high fever; joint, muscle, and abdominal pain; and jaundice. She was assumed to have dengue virus. Within another day, she had progressed into respiratory failure and was on a ventilator. She died less than 2 days later.
Her autopsy showed hepatic necrosis and severe decrease of splenic lymphoid tissue with splenic sequestration. Systemic inflammation probably triggered a fatal vasoocclusive crisis and splenic sequestration.
Dr. Rodriguez-Morales had no financial disclosures.
AMSTERDAM – Five people with confirmed Zika virus infections have died in Colombia, and all had medical comorbidities, including leukemia, diabetes, sickle cell anemia, and hypertension.
All of the deaths occurred last October in northern and central Colombia, Dr. Alfonso Rodriguez-Morales said at the European Society of Clinical Microbiology and Infectious Diseases annual congress.
Four of the cases were simultaneously published April 7 in the Lancet Infectious Diseases (2016 Apr 7. doi: 10.1016/S1473-3099[16]30006-8). The fifth case occurred in northern Colombia, and was reported in Emerging Infectious Diseases (2016 May. doi: 10.3201/eid2205.151934).
Reports of confirmed Zika-related deaths are rare. Brazil, the only other country to disclose them, has now reported three, said Dr. Rodriguez-Morales of the Universidad Tecnológica de Pereira, Colombia.
“Before the current outbreak in Latin America, Zika virus was not linked to deaths,” he noted. But the eight confirmed Zika-related deaths in South America “call attention to the need for evidence-based guidelines for clinical management of Zika, as well as the possible occurrence of atypical and severe cases, including possibly congenitally related microcephaly.”
Because they all occurred in medically compromised patients, Dr. Rodriguez-Morales also urged clinicians to cast a wary eye on such patients who present with arbovirus-type symptoms, including fever and rash.
From September 2015 to March 2016, Colombia had 58,838 reported cases of Zika. Of those, only 2,361 were lab confirmed. The rest were either diagnosed clinically or were suspected cases, Dr. Rodriguez-Morales said. Although Colombia has a much smaller population than Brazil (49 million vs. 210 million), its Zika case rate is much higher, 120 cases per 100,000 people vs. 34 cases per 100,000 people.
The group of four deaths occurred in central Colombia, and included a 2-year-old girl, a 30-year-old woman, a 61-year-old man, and a 72-year-old woman. All presented with 2-6 days of fever. All were initially suspected to have dengue fever or chikungunya. None tested positive for dengue, but the man was coinfected with chikungunya.
All patients presented with anemia. All but the older man also had severe thrombocytopenia.
The toddler presented with hepatomegaly, mucosal hemorrhage, progressive respiratory collapse, progressive thrombocytopenia, and intravascular coagulation. She died 5 days after symptom onset and was found to have had unrecognized lymphoblastic leukemia.
The 30-year-old woman presented with a severe rash on both arms. She also exhibited coagulation dysfunction, including severe thrombocytopenia and leukopenia that progressed to intracerebral and subarachnoid hemorrhage. She died 12 days after symptom onset. She was determined to have had unrecognized acute myeloid leukemia.
The elderly man had a history of medically controlled hypertension. He experienced mucosal hemorrhage and respiratory distress. He died 7 days after symptom onset. On autopsy, his liver showed necrotic areas, and his spleen indicated a systemic inflammatory response.
The elderly woman had a history of insulin-controlled type 2 diabetes. Her symptoms included gastrointestinal distress, thrombocytopenia, and acute respiratory failure. She died 48 hours after symptom onset; her brain showed edema and ischemic lesions.
The 15-year-old girl in northern Colombia had a 5-year history of sickle cell disease, which, Dr. Rodriguez-Morales pointed out, is a risk factor for arbovirus diseases. However, the patient had never been hospitalized for a vasoocclusive crisis. She presented with a high fever; joint, muscle, and abdominal pain; and jaundice. She was assumed to have dengue virus. Within another day, she had progressed into respiratory failure and was on a ventilator. She died less than 2 days later.
Her autopsy showed hepatic necrosis and severe decrease of splenic lymphoid tissue with splenic sequestration. Systemic inflammation probably triggered a fatal vasoocclusive crisis and splenic sequestration.
Dr. Rodriguez-Morales had no financial disclosures.
AT ECCMID 2016

Policy Experts Urge Hospitalists to Get Involved, Share Knowledge
SAN DIEGO — Think beyond your four walls, speakers told hospitalists at HM16. When it comes to public health and public policy, with your experience and knowledge, your input is simply too valuable not to share, they said.
During several sessions at the SHM annual meeting, hospitalists were urged to understand that they could influence the world of healthcare beyond their own patients and their own centers.
“You have more power than you realize,” U.S. Surgeon General Vivek Murthy, MD, MBA, told hospitalists in his opening address. As a hospitalist at Brigham and Women’s Hospital in Boston, Dr. Murthy created the nonprofit organization Doctors for America, which promotes affordable, high-quality healthcare for all Americans.
A member of Congress, he said, once told him that a call from a doctor is listed as “a notable event” and 10 calls from doctors in a day is “a full-blown crisis.” “I’m often struck by how infrequently elected leaders hear from doctors,” Dr. Murthy added. “I’m also struck by how many good ideas I hear from doctors.”
Dr. Murthy suggested that as the HM movement grows, hospitalists should ask themselves questions around issues of leadership, change, and public health.
“Can hospitalists leverage their leadership in the hospital to not only improve systems but also create a culture that supports healing in health?” Dr. Murthy asked. “Can hospitalists be as powerful a force for change outside the hospital as they are inside the hospital, recognizing that critical drivers of illness like nutrition, safety, and physical activity are most often grounded in the community rather than the clinic? As people who often mentor trainees and younger physicians, can we inspire the next generation of physicians with a broader vision of medicine, one where physicians’ sacred duty is to safeguard the health of their community by treating illness but also by preventing it?”
Achieving such goals might be a tall order. When asked about how influential they feel in the world of public health, some hospitalists said they feel they can have some impact in their daily work but, beyond the hospital, not so much.
“I don’t feel very empowered,” said Janna Gelderman-Moffett, DO, a locum tenens physician in Boulder City, Colo. She added, though, that she is “frustrated with how medicine is portrayed.”
Robert Wachter, MD, MHM, chief of the division of hospital medicine at the University of California, San Francisco Medical Center, who coined the term “hospitalist” 20 years ago, told hospitalists at HM16 that it’s “crucial” for them to take on new roles. But he also waved a caution flag: too much and you may go too far afield.
“We have to be careful about scope creep,” Dr. Wachter said. “And as much as I enjoyed the Surgeon General’s comments, I think we’ve got to be thoughtful about taking on [too much responsibility]. I have people in my group who do a lot of work, for example, in population health. That’s part of their job, but I’m not sure that’s our job, to fix the world of prevention outside of the hospital and SNF. If we begin becoming something for everybody, I think we’ll lose the special focus that made us successful.”
Ron Greeno, MD, FCCP, MHM, chief strategy officer for IPC Healthcare in North Hollywood, Calif., chair of SHM’s Public Policy Committee, and an SHM board member, said the society and hospitalists are “specially suited” to give input to help shape the details of the Medicare Access and CHIP Reauthorization Act of 2015 (MACRA), which replaced the repealed Sustainable Growth Rate (SGR) formula.
With MACRA, SGR’s threat of broader Medicare payment cuts is eliminated, but it increases the scope of quality measurement, including resource use and clinical-improvement practices. It also uses incentives to push providers toward risk-based models.
With many of MACRA’s specifics now left to the rule-making process, it’s still largely “a creature devoid of form,” Dr. Greeno said. Hospitalists and SHM can make a difference largely because of their roles within systems, he said. “We are trying to actually make things better,” he added. “We’re always looking for a better way to do things.”
Joining SHM’s Grassroots Network, which can involve something as simple as sending a pre-written letter to Washington, D.C.–based legislators, can be a big help. “You know what?” Dr. Greeno said. “This stuff actually has an impact.”
Tresa McNeal, MD, a hospitalist at Baylor Scott & White Health, a not-for-profit healthcare system serving Texas communities, said she was motivated by the speakers’ remarks.
“It’s really good to know that we have people representing us from SHM to [not only] help us learn about these issues but also represent us,” Dr. McNeal said. “I think it makes me want to be part of the grassroots initiative, just realizing that there’s power in numbers.” TH
Thomas R. Collins is a freelance writer in South Florida.