User login
Ibrutinib bodes well for relapsed mantle-cell lymphoma
Progression-free survival was significantly better when patients with relapsed or refractory mantle-cell lymphoma were treated with oral ibrutinib than with intravenous temsirolimus, based on results from 280 patients in an international, randomized, open-label phase III trial.
Study subjects had undergone one or more previous rituximab-containing chemotherapy regimens to receive intravenous temsirolimus or oral ibrutinib at a daily dose of 560 mg.
Compared with temsirolimus, ibrutinib resulted in a 57% reduction in the risk of disease progression or death at a median follow-up of 20 months. Median progression-free survival – the trial’s primary endpoint – was 14.6 months for the ibrutinib group and 6.2 months for the temsirolimus group.
Ibrutinib was also better tolerated, with 68% of patients having grade 3 or higher treatment-emergent adverse events as compared to 87% of patients in the temsirolimus group, despite a median 4-fold longer treatment duration for the ibrutinib group than the temsirolimus group. Additionally, 6% of patients discontinued ibrutinib because of adverse events versus 26% in the temsirolimus group, reported Dr. Martin Dreyling of Klinikum der Universität in Munich, Germany, and his associates.

Based on results of the Functional Assessment of Cancer Therapy-Lymphoma (FACT-Lym) questionnaire, ibrutinib was associated with greater and more rapid improvements, and also with less worsening in lymphoma symptoms, as measured by the lymphoma subscale of the FACT-Lym (Lancet. 2016;387:770-78).
Ibrutinib, a first-in-class oral inhibitor of Bruton’s tyrosine kinase, is approved in the United States and the European Union at a dose of 560 mg per day for patients with mantle cell lymphoma who have received at least one previous line of therapy.
The mammalian target of rapamycin (mTOR) inhibitor temsirolimus is approved in the European Union for relapsed or refractory mantle-cell lymphoma, but does not have FDA approval for this indication.
The study, funded by Janssen, is ongoing. Future research, the investigators say, should examine ibrutinib-based combination approaches for patients with relapsed or refractory mantle-cell lymphoma and in front-line therapy.
Dr. Dreyling reported grants and personal fees from Janssen and Pfizer outside of the study. Several other authors reported grants from Janssen during the study and financial ties to the company.
The findings from this phase III trial clearly establish ibrutinib as a new standard for treatment of relapsed mantle-cell lymphoma. Within the next 2 years, many expect the agent will find its way into the frontline setting for treatment of mantle cell lymphoma in combination with standard chemotherapy, based on results of another already completed phase III trial (the SHINE trial).
Despite this remarkable progress, however, mantle-cell lymphoma remains incurable. Roughly 30%-40% of people with the disease will not respond to ibrutinib, and even among responders relapse seems inevitable.
Mantle-cell lymphoma has been a model for accelerated development of novel drugs. Ibrutinib was developed with tremendous speed, and the FDA’s approval of the agent in 2013 based on findings from a non-pivotal phase II trial was surprising to everyone other than the participating patients and physicians. Hopefully the resources mobilized to bring ibrutinib so far, so fast, will continue to be available to help us learn how best to use the drug.
Dr. Peter Martin is with the department of medicine at Weill Cornell Medical College in New York. His comments are excerpted from an editorial that accompanied the study in The Lancet. Dr. Martin reported that he is a consultant for Janssen and has received honoraria from the company for speaking.
Progression-free survival was significantly better when patients with relapsed or refractory mantle-cell lymphoma were treated with oral ibrutinib than with intravenous temsirolimus, based on results from 280 patients in an international, randomized, open-label phase III trial.
Study subjects had undergone one or more previous rituximab-containing chemotherapy regimens to receive intravenous temsirolimus or oral ibrutinib at a daily dose of 560 mg.
Compared with temsirolimus, ibrutinib resulted in a 57% reduction in the risk of disease progression or death at a median follow-up of 20 months. Median progression-free survival – the trial’s primary endpoint – was 14.6 months for the ibrutinib group and 6.2 months for the temsirolimus group.
Ibrutinib was also better tolerated, with 68% of patients having grade 3 or higher treatment-emergent adverse events as compared to 87% of patients in the temsirolimus group, despite a median 4-fold longer treatment duration for the ibrutinib group than the temsirolimus group. Additionally, 6% of patients discontinued ibrutinib because of adverse events versus 26% in the temsirolimus group, reported Dr. Martin Dreyling of Klinikum der Universität in Munich, Germany, and his associates.
Based on results of the Functional Assessment of Cancer Therapy-Lymphoma (FACT-Lym) questionnaire, ibrutinib was associated with greater and more rapid improvements, and also with less worsening in lymphoma symptoms, as measured by the lymphoma subscale of the FACT-Lym (Lancet. 2016;387:770-78).
Ibrutinib, a first-in-class oral inhibitor of Bruton’s tyrosine kinase, is approved in the United States and the European Union at a dose of 560 mg per day for patients with mantle cell lymphoma who have received at least one previous line of therapy.
The mammalian target of rapamycin (mTOR) inhibitor temsirolimus is approved in the European Union for relapsed or refractory mantle-cell lymphoma, but does not have FDA approval for this indication.
The study, funded by Janssen, is ongoing. Future research, the investigators say, should examine ibrutinib-based combination approaches for patients with relapsed or refractory mantle-cell lymphoma and in front-line therapy.
Dr. Dreyling reported grants and personal fees from Janssen and Pfizer outside of the study. Several other authors reported grants from Janssen during the study and financial ties to the company.
FROM THE LANCET
Key clinical point: Ibrutinib significantly improved progression-free survival, compared with temsirolimus in patients with relapsed or refractory mantle-cell lymphoma.
Major finding: Median progression-free survival was 14.6 months with ibrutinib and 6.2 months with temsirolimus.
Data source: A randomized open-label phase III trial (ongoing) that randomized 280 patients to each treatment group.
Disclosures: The study was funded by Janssen. Dr. Dreyling reported grants and personal fees from Janssen and Pfizer outside of the study, and other authors reported grants from Janssen during the study and financial ties to the company.
Childhood emotional abuse fuels odds for migraine in adulthood
Emotionally abused children are 52% more likely to develop migraine in young adulthood than are those who were never abused, based on longitudinal survey data from nearly 15,000 individuals.
“Childhood maltreatment, and especially emotional abuse, is a common, likely under-recognized occurrence, which has enduring consequences for health throughout life. The association of emotional abuse with migraine has not heretofore been well studied, being the subject of only population-based study,” lead author Dr. Gretchen E. Tietjen of the University of Toledo (Ohio) said in an interview in advance of the presentation of the study at the annual meeting of the American Academy of Neurology in Vancouver in April.

Dr. Tietjen and her colleagues assessed data from 14,484 adults aged 24-32 years who took part in wave four of the National Longitudinal Study of Adolescent to Adult Health. Of these, 2,061 (14%) reported a migraine diagnosis, and 1,246 (60%) of those diagnosed with migraines reported some type of childhood abuse. A total of 6,088 (49%) individuals without migraine reported some type of childhood abuse.
Overall, the odds of migraine in adulthood was 55% higher in children who reported emotional abuse, physical abuse, or sexual abuse, compared with those who reported no childhood abuse, after controlling for age, race, sex, and income (odds ratio, 1.55; 95% confidence interval, 1.35-1.77). However, only emotional abuse remained significantly associated with increased odds for migraine after controlling for other types of abuse (OR, 1.52; 95% CI, 1.34-1.73).
Emotional abuse was assessed by asking, “How often did a parent or other adult caregiver say things that really hurt your feelings or made you feel like you were not wanted or loved?” Physical abuse was defined as being hit with a fist, kicked, or thrown down on the floor, into a wall, or down stairs. Sexual abuse included forced sexual touching or sexual relations.
Controlling for depression and anxiety weakened the associations between childhood abuse overall and likelihood of migraine in young adulthood, as well as for emotional abuse in particular, but the relationships remained statistically significant (OR, 1.32 and 1.33, respectively).
Dr. Tietjen said she was surprised by the absence of an association between migraine and physical and sexual abuse after controlling for other types of abuse.
“Sexual and physical abuse may be less frequent, occur over a briefer duration, and if limited, lead in some cases to resilience,” Dr. Tietjen noted. “Emotional abuse is likely more insidious, being ingrained in the fabric of the family dynamic. It may occur over years without recognition or intervention,” she said. “This type of abuse may cause more cumulative stress, with subsequent dysregulation of the HPA axis, immune, autonomic, and metabolic systems,” she added.
The study does not show cause and effect, the researchers noted, and more research is needed. But the findings suggest that clinicians might consider childhood abuse when counseling adult migraine patients.
“In migraineurs, childhood abuse, particularly emotional abuse, is common and possibly causally related,” Dr. Tietjen said. “Knowledge of adverse childhood experiences allows physicians to identify migraineurs at higher risk for psychiatric disease, pain comorbidities, and conditions associated with inflammation. These patients would likely benefit from exposure to cognitive behavioral therapy strategies, in order to decrease neurophysiological responses to stress,” she noted.
“There are currently therapies which reverse stress-induced epigenetic changes, which might be particularly useful in the subset of migraineurs who have been abused,” said Dr. Tietjen. Her next steps for research involve studying the effect of early life stress on factors such as pain sensitivity, anxiety, and depression.
The University of Toledo and the Clair Martig Endowment funded the study.
Emotionally abused children are 52% more likely to develop migraine in young adulthood than are those who were never abused, based on longitudinal survey data from nearly 15,000 individuals.
“Childhood maltreatment, and especially emotional abuse, is a common, likely under-recognized occurrence, which has enduring consequences for health throughout life. The association of emotional abuse with migraine has not heretofore been well studied, being the subject of only population-based study,” lead author Dr. Gretchen E. Tietjen of the University of Toledo (Ohio) said in an interview in advance of the presentation of the study at the annual meeting of the American Academy of Neurology in Vancouver in April.
Dr. Tietjen and her colleagues assessed data from 14,484 adults aged 24-32 years who took part in wave four of the National Longitudinal Study of Adolescent to Adult Health. Of these, 2,061 (14%) reported a migraine diagnosis, and 1,246 (60%) of those diagnosed with migraines reported some type of childhood abuse. A total of 6,088 (49%) individuals without migraine reported some type of childhood abuse.
Overall, the odds of migraine in adulthood was 55% higher in children who reported emotional abuse, physical abuse, or sexual abuse, compared with those who reported no childhood abuse, after controlling for age, race, sex, and income (odds ratio, 1.55; 95% confidence interval, 1.35-1.77). However, only emotional abuse remained significantly associated with increased odds for migraine after controlling for other types of abuse (OR, 1.52; 95% CI, 1.34-1.73).
Emotional abuse was assessed by asking, “How often did a parent or other adult caregiver say things that really hurt your feelings or made you feel like you were not wanted or loved?” Physical abuse was defined as being hit with a fist, kicked, or thrown down on the floor, into a wall, or down stairs. Sexual abuse included forced sexual touching or sexual relations.
Controlling for depression and anxiety weakened the associations between childhood abuse overall and likelihood of migraine in young adulthood, as well as for emotional abuse in particular, but the relationships remained statistically significant (OR, 1.32 and 1.33, respectively).
Dr. Tietjen said she was surprised by the absence of an association between migraine and physical and sexual abuse after controlling for other types of abuse.
“Sexual and physical abuse may be less frequent, occur over a briefer duration, and if limited, lead in some cases to resilience,” Dr. Tietjen noted. “Emotional abuse is likely more insidious, being ingrained in the fabric of the family dynamic. It may occur over years without recognition or intervention,” she said. “This type of abuse may cause more cumulative stress, with subsequent dysregulation of the HPA axis, immune, autonomic, and metabolic systems,” she added.
The study does not show cause and effect, the researchers noted, and more research is needed. But the findings suggest that clinicians might consider childhood abuse when counseling adult migraine patients.
“In migraineurs, childhood abuse, particularly emotional abuse, is common and possibly causally related,” Dr. Tietjen said. “Knowledge of adverse childhood experiences allows physicians to identify migraineurs at higher risk for psychiatric disease, pain comorbidities, and conditions associated with inflammation. These patients would likely benefit from exposure to cognitive behavioral therapy strategies, in order to decrease neurophysiological responses to stress,” she noted.
“There are currently therapies which reverse stress-induced epigenetic changes, which might be particularly useful in the subset of migraineurs who have been abused,” said Dr. Tietjen. Her next steps for research involve studying the effect of early life stress on factors such as pain sensitivity, anxiety, and depression.
The University of Toledo and the Clair Martig Endowment funded the study.
FROM THE AAN 2016 ANNUAL MEETING
Key clinical point: Childhood abuse had a significant effect on the likelihood of developing migraine in young adulthood, and emotional abuse was a stronger factor than physical or sexual abuse.
Major finding: Childhood abuse increased the odds of a migraine diagnosis in young adulthood by 55%; emotional abuse was associated with a 52% increased likelihood of migraine.
Data source: The data were taken from 14,484 adults aged 24-32 years in wave four of the National Longitudinal Study of Adolescent to Adult Health.
Disclosures: The University of Toledo and the Clair Martig Endowment funded the study.

Need for caution before extending the use of antenatal corticosteroids beyond 34 weeks’ gestation
The results of the highly anticipated Antenatal Late Preterm Study recently have become available.1 Data from this randomized controlled trial, conducted by the Eunice Kennedy Shriver National Institute of Child Health and Human Development (NICHD) Maternal-Fetal Medicine Units (MFMU) Network, demonstrated that administration of betamethasone to women at risk for preterm delivery between 34 weeks 0 days and 36 weeks 6 days of gestation significantly reduces the rate of neonatal respiratory complications. It may represent the largest study of antenatal corticosteroids (ACS) to date, with 2,827 infants studied, and its results inevitably lead to the logical practical question: Should ACS use be extended beyond the 34 weeks’ gestation limit previously recommended by professional guidelines in the United States2?
There are some issues that bear discussion before such a significant change in standard of care should be promoted.2
Antenatal Late Preterm Study outcomesThe primary outcome in the study was a composite end point describing the need for respiratory support within 72 hours after birth. Based on a pilot study, the investigators had anticipated a 33% decrease in the rate of the primary outcome; however, the reduction was only 20% (relative risk [RR], 0.80; 95% confidence interval [CI], 0.66−0.97). Although the effect size was statistically significant, one could question the clinical relevance of such a small difference.
A 33% reduction effect, more consistent with the preliminary expectations, was noted in the prespecified secondary composite outcome of severe respiratory complications (RR, 0.67; 95% CI, 0.53−0.84). Occurrences included in the secondary composite outcome that also showed significant rate reductions were:
- the use of continuous positive airway pressure (CPAP) or high-flow oxygen via nasal cannula for at least 12 hours (RR, 0.62; 95% CI, 0.48−0.80)
- need for resuscitation at birth (RR, 0.78; 95% CI, 0.66−0.92)
- surfactant use (RR, 0.59; 95% CI, 0.37−0.96)
- transient tachypnea of the newborn (RR, 0.68; 95% CI, 0.53−0.87).
The reported reduction in bronchopulmonary dysplasia (RR, 0.22; 95% CI, 0.02−0.92) cannot plausibly be attributed to ACS. Randomized data aggregated by the Cochrane Database of Systematic Reviews3 do not show improvement in chronic lung disease with ACS use. Moreover, the authors recognize that the assessment for bronchopulmonary dysplasia at only 28 days of life is only partially informative and that longer childhood follow-up is required to confirm the finding.
- Although corticosteroids have been shown to reduce the risk of the baby needing breathing support by 20%, they are associated with a 60% increase in risk for low blood sugar in the newborn (hypoglycemia). Hypoglycemia can place the baby at risk for seizures and even brain damage.
- There is an unknown safety profile for corticosteroid administration at this gestational age. The fetal brain is still developing during this period, and there is some information to suggest that corticosteroids could have an unfavorable effect on brain development.
- Corticosteroids are potent hormones and potentially can have undesired hormonal effects at this gestational age.
- If corticosteroids are given and the mother carries the baby to term (37 weeks or later) there are some studies that suggest the baby is at an increased risk for neurologic, cognitive, metabolic, and/or behavioral abnormalities in later life.
We recommend caution before changing current practiceWe propose prudence with ACS use after 34 weeks’ gestation for the following reasons: the increased risk for neonatal hypoglycemia associated with ACS, the increased risk for ACS-related harm in term-born babies, and safety concerns with ACS in the late preterm period.
Evidence shows an increased risk for neonatal hypoglycemiaThe most profound effect modification observed in the study was an adverse effect—namely, a 60% increase in neonatal hypoglycemia with ACS administration (RR, 1.6; 95% CI, 1.37−1.87). The rate of neonatal hypoglycemia was 24% in the ACS group, compared with 15% in the placebo group.
Results of prior studies have demonstrated either no increased risk of hypoglycemia with ACS use4−7 or a much smaller increase (from 4.2% to 5.7%).8 The higher rate of neonatal hypoglycemia seen in this study suggests the possibility that the late preterm population may be more vulnerable to the negative impact of ACS on neonatal glucose/insulin homeostasis. Presumed mechanisms of action are either maternal hyperglycemia or fetal adrenal suppression or both, with potential for fetal adrenal suppression resulting from betamethasone exposure to affect long-term metabolic outcomes.9
Of note, women with pregestational diabetes were excluded from the study and, in routine practice, inclusion of such patients may further increase the risk of neonatal hypoglycemia.
There are few data on the prognostic significance of neonatal hypoglycemia in preterm infants, with the exception of a single study, the results of which show that it is associated with adverse neurodevelopment at 18 months of age.10
Data reveal increased risk for harm in term-born babiesIn spite of strict protocol specifications to increase the probability of delivery before 37 weeks’ gestation, 16% of women in the trial delivered at term. Investigators of prior randomized studies of ACS, aimed at reducing the risks of prematurity, have reported a rate of term delivery of about one-third,4,11 and in routine practice, administration of ACS after 34 weeks may be associated with even higher rates of term delivery.
This is important because recent evidence shows an unfavorable impact of ACS exposure in term-born children.12 The 5-year follow-up of the largest randomized trial in which multiple ACS courses were used noted that babies born at term had a 4-fold increased odds ratio for neurosensory disability.11 There was no dose−response interaction, with the same adverse odds ratio after 1 or 4 additional ACS courses. This observation was consistent with a previously reported Swedish national cohort, pointing to an unfavorable impact of even a single course of ACS in term-born children, with a greater likelihood of harm than benefit.13
In a UK follow-up of children aged 8 to 15 years who were enrolled in an RCT of ACS before cesarean delivery at term, low academic achievement was significantly more common in the group whose mothers had received ACS.14 In another study of 304 children born at term after exposure to a single course of ACS, investigators noted significantly increased cortisol reactivity to acute psychological stress at ages 6 to 11 years in the ACS-exposed patients, compared with 212 babies of women with threatened preterm labor who did not receive ACS and 372 babies from uncomplicated term pregnancies.15
The relevance of such study findings extends beyond childhood given the fact that elevated hypothalamic-pituitary-adrenal (HPA) axis reactivity has been linked to the pathogenesis of metabolic syndrome and depression in adult life.16 As recently as 2015, investigators of a randomized trial of ACS in 6 low- and middle-income countries highlighted their concern regarding “potentially harmful use of antenatal corticosteroids for infants not delivered preterm.”17
There are safety concerns with ACS in the late preterm periodThe effects of ACS are more pleiotropic than those reflected in a lower incidence of respiratory difficulties. Knowledge of the overall consequences of ACS exposure in infants born late-preterm or at term is still limited. The close-to-term fetus exposed to exogenous corticosteroids is also exposed to the physiologic endogenous surge of cortisol known to occur in the maternal circulation in late pregnancy, which reaches levels 3 times higher than those seen in nonpregnant women.18 Although placental 11 beta-hydroxysteroid dehydrogenase type 2 plays a protective role by allowing no more than 10% to 20% of maternal corticosteroids to cross the placenta, fetal overexposure from concomitant exogenous maternal corticosteroid administration remains a theoretical concern close to term. This is especially worrisome if there is a gestational age−related increase in the sensitivity to corticosteroid-induced in utero fetal programming. It has been reported that fetal overexposure to corticosteroids in late pregnancy can permanently increase the activity of the HPA-axis, with likely consequences in adult life.19
Another concern relates to oligodendrocytes development. Although the neuronal division process in humans usually is completed by 24 weeks’ gestation, the most rapid growth for oligodendrocytes occurs between 34 and 36 weeks’ gestation; these are the cells responsible for the synthesis of myelin. Overexposure to corticosteroids at this vulnerable time in the late preterm fetus potentially may have unanticipated negative neurologic consequences.20
This is the only scenario in which we feel antenatal corticosteroids could be used in a fetus aged 34 weeks to 36 weeks 5 days. In the setting of a scheduled cesarean delivery between 34 weeks and 35 weeks, the concerns relative to term delivery after corticosteroid exposure may not apply, but the concerns in relation to the administration of corticosteroid in the late preterm period—which is a time of possibly increased neurohormonal and neurologic vulnerability—still apply. With regard to the risk of neonatal hypoglycemia, one might argue that close neonatal monitoring of babies so exposed may ensure that any associated neonatal hypoglycemia does not go unnoticed or untreated. However, the prognostic significance of even short periods of neonatal hypoglycemia has not been established.
Where should future studies focus?There is clear neonatal benefit from a single course of ACS given to women who will deliver before 34 weeks’ gestation. It is widely accepted, based on the evidence provided by the 30-year follow-up of the cohort of 534 participants from the Auckland trial (the longest follow-up for any pregnancy trial), that administration of ACS at less than 34 weeks’ gestation is not associated with any obvious major developmental risk.21−23
However, the reassurances provided by the Auckland cohort should be neither directly extrapolated to the administration of ACS in the late preterm period nor applied to term-born babies exposed to ACS, for the simple reason that these subgroups never have been analyzed separately. The risk:benefit ratio of ACS use in the late-preterm period is as yet unknown, and in term-born babies the ratio may be unfavorable.
Follow-up studies are neededWe consider that there is a vital need for long-term follow-up studies. The focus of research on the effects of ACS no longer is on the immediate neonatal outcomes and now is on safety and the long-term outcomes of this exposure.
Bottom lineWe regard the large, high-quality study conducted by the NICHD MFMU Network1 as an opportunity to answer current concerns. It is hoped that the resources necessaryfor in-depth follow-up of the children involved in this study will be provided to the investigators and to the NICHD. It is only with such follow-up that mid- and long-term adverse effects can be assessed. We believe that, at a minimum, mid-term follow-up data should be available before it is wise to make any definitive recommendations for a sweeping change in clinical practice.
Share your thoughts! Send your Letter to the Editor to [email protected]. Please include your name and the city and state in which you practice.
- Gyamfi-Bannerman C, Thom EA, Blackwell SC, et al; NICHD Maternal-Fetal Medicine Units Network. Antenatal betamethasone for women at risk for late preterm delivery [published online ahead of print February 4, 2016]. N Engl J Med.
- American College of Obstetricians and Gynecologists Committee on Obstetric Practice. ACOG Committee Opinion No. 475: antenatal corticosteroid therapy for fetal maturation. Obstet Gynecol. 2011;117(2 pt 1):422–424.
- Roberts D, Dalziel S. Antenatal corticosteroids for accelerating fetal lung maturation for women at risk of preterm birth. Cochrane Database Syst Rev. 2006;(3):CD004454.
- Liggins GC, Howie RN. A controlled trial of antepartum glucocorticoid treatment for prevention of the respiratory distress syndrome in premature infants. Pediatrics. 1972;50(4):515–525.
- Sann L, Burnod J, Lasne Y, Bethenod M. Antenatal administration of betamethasone: effects upon neonatal blood glucose in premature infants [in French]. Nouv Presse Med. 1979;8(39):3147–3148.
- Rokicki W, Krasnodebski J. Antenatal glucocorticoid administration and neonatal glycemia. Dev Pharmacol Ther. 1987;10(4):307–311.
- Gazquez Serrano IM, Arroyos Plana A, Diaz Morales O, Herraiz Perea C, Holgueras Bragado A. Antenatal corticosteroid therapy and late preterm infant morbidity and mortality [in Spanish]. An Pediatr (Barc). 2014;81(6):374–382.
- Pettit KE, Tran SH, Lee E, Caughey AB. The association of antenatal corticosteroids with neonatal hypoglycemia and hyperbilirubinemia. J Matern Fetal Neonatal Med. 2014;27(7):683–686.
- Aydin M, Derveci U, Hakan N. Neonatal hypoglycemia associated with the antenatal corticosteroids may be secondary to fetal adrenal suppression. J Matern Fetal Neonatal Med. 2015;28(8):892.
- Lucas A, Morley R, Cole TJ. Adverse neurodevelopmental outcome of moderate neonatal hypoglycaemia. BMJ. 1988;297(6659):1304–1308.
- Asztalos EV, Murphy KE, Willan AR, et al; MACS-5 Collaborative Group. Multiple courses of antenatal corticosteroids for preterm birth study: outcomes in children at 5 years of age (MACS-5). JAMA Pediatr. 2013;167(12):1102–1110.
- Vidaeff AC, Belfort MA, Steer PJ. Antenatal corticosteroids: a time for more careful scrutiny of the indications [published online ahead of print January 18, 2016]. BJOG. doi:10.1111/1471-0528.13853.
- Eriksson L, Haglund B, Ewald U, Odlind V, Kieler H. Health consequences of prophylactic exposure to antenatal corticosteroids among children born late preterm or term. Acta Obstet Gynecol Scand. 2012;91(12):1415–1421.
- Stutchfield PR, Whitaker R, Gliddon AE, Hobson L, Kotecha S, Doull IJ. Behavioural, educational and respiratory outcomes of antenatal betamethasone for term caesarean section (ASTECS trial). Arch Dis Child Fetal Neonatal Ed. 2013;98(3):F195–F200.
- Alexander N, Rosenlocher F, Stalder T, et al. Impact of antenatal synthetic glucocorticoid exposure on endocrine stress reactivity in term-born children. J Clin Endocrinol Metab. 2012;97(10):3538–3544.
- Chrousos GP. Stress and disorders of the stress system. Nat Rev Endocrinol. 2009;5(7):374–381.
- Althabe F, Belizan JM, McClure EM, et al. A population-based, multifaceted strategy to implement antenatal corticosteroid treatment versus standard care for the reduction of neonatal mortality due to preterm birth in low-income and middle-income countries: the ACT cluster-randomised trial. Lancet. 2015;385(9968):629–639.
- Jung C, Ho JT, Torpy DJ, et al. A longitudinal study of plasma and urinary cortisol in pregnancy and postpartum. J Clin Endocrinol Metab. 2011;96(5):1533–1540.
- Welberg LA, Seckl JR, Holmes MC. Inhibition of 11ß-hydroxysteroid dehydrogenase, the foeto-placental barrier to maternal glucocorticoids, permanently programs amygdale GR mRNA expression and anxiety-like behavior in the offspring. Eur J Neurosci. 2000;12(3):1047–1054.
- Whitelaw A, Thoresen M. Antenatal steroids and the developing brain. Arch Dis Child Fetal Neonatal Ed. 2000;83(2):F154–F157.
- Dalziel SR, Walker NK, Parag V, et al. Cardiovascular risk factors after antenatal exposure to betamethasone: 30-year follow-up of a randomised controlled trial. Lancet. 2005;365(9474):1856–1862.
- Dalziel SR, Lim VK, Lambert A, et al. Antenatal exposure to betamethasone: psychological functioning and health related quality of life 31 years after inclusion in randomised controlled trial. BMJ. 2005;331(7518):665.
- Welberg LA, Seckl JR, Holmes MC. Inhibition of 11Dalziel SR, Walker NK, Parag V, et al. Dalziel SR, Lim VK, Lambert A, et al. Dalziel SR, Rea HH, Walker NK, et al.

Dr. Vidaeff is Professor and Program Director, Maternal-Fetal Medicine Fellowship, Department of Obstetrics and Gynecology, Baylor College of Medicine, Texas Children’s Hospital Pavilion for Women, Houston.

Dr. Belfort is Ernst W. Bertner Chairman and Professor, Department of Obstetrics and Gynecology, Baylor College of Medicine, and Obstetrician and Gynecologist-in-Chief, Texas Children’s Hospital, Houston.

Dr. Steer is Emeritus Professor, Imperial College London, Editor Emeritus, British Journal of Obstetrics and Gynaecology, London, England.
The authors report no financial relationships relevant to this article.
Dr. Vidaeff is Professor and Program Director, Maternal-Fetal Medicine Fellowship, Department of Obstetrics and Gynecology, Baylor College of Medicine, Texas Children’s Hospital Pavilion for Women, Houston.
Dr. Belfort is Ernst W. Bertner Chairman and Professor, Department of Obstetrics and Gynecology, Baylor College of Medicine, and Obstetrician and Gynecologist-in-Chief, Texas Children’s Hospital, Houston.
Dr. Steer is Emeritus Professor, Imperial College London, Editor Emeritus, British Journal of Obstetrics and Gynaecology, London, England.
The authors report no financial relationships relevant to this article.
The results of the highly anticipated Antenatal Late Preterm Study recently have become available.1 Data from this randomized controlled trial, conducted by the Eunice Kennedy Shriver National Institute of Child Health and Human Development (NICHD) Maternal-Fetal Medicine Units (MFMU) Network, demonstrated that administration of betamethasone to women at risk for preterm delivery between 34 weeks 0 days and 36 weeks 6 days of gestation significantly reduces the rate of neonatal respiratory complications. It may represent the largest study of antenatal corticosteroids (ACS) to date, with 2,827 infants studied, and its results inevitably lead to the logical practical question: Should ACS use be extended beyond the 34 weeks’ gestation limit previously recommended by professional guidelines in the United States2?
There are some issues that bear discussion before such a significant change in standard of care should be promoted.2
Antenatal Late Preterm Study outcomesThe primary outcome in the study was a composite end point describing the need for respiratory support within 72 hours after birth. Based on a pilot study, the investigators had anticipated a 33% decrease in the rate of the primary outcome; however, the reduction was only 20% (relative risk [RR], 0.80; 95% confidence interval [CI], 0.66−0.97). Although the effect size was statistically significant, one could question the clinical relevance of such a small difference.
A 33% reduction effect, more consistent with the preliminary expectations, was noted in the prespecified secondary composite outcome of severe respiratory complications (RR, 0.67; 95% CI, 0.53−0.84). Occurrences included in the secondary composite outcome that also showed significant rate reductions were:
- the use of continuous positive airway pressure (CPAP) or high-flow oxygen via nasal cannula for at least 12 hours (RR, 0.62; 95% CI, 0.48−0.80)
- need for resuscitation at birth (RR, 0.78; 95% CI, 0.66−0.92)
- surfactant use (RR, 0.59; 95% CI, 0.37−0.96)
- transient tachypnea of the newborn (RR, 0.68; 95% CI, 0.53−0.87).
The reported reduction in bronchopulmonary dysplasia (RR, 0.22; 95% CI, 0.02−0.92) cannot plausibly be attributed to ACS. Randomized data aggregated by the Cochrane Database of Systematic Reviews3 do not show improvement in chronic lung disease with ACS use. Moreover, the authors recognize that the assessment for bronchopulmonary dysplasia at only 28 days of life is only partially informative and that longer childhood follow-up is required to confirm the finding.
- Although corticosteroids have been shown to reduce the risk of the baby needing breathing support by 20%, they are associated with a 60% increase in risk for low blood sugar in the newborn (hypoglycemia). Hypoglycemia can place the baby at risk for seizures and even brain damage.
- There is an unknown safety profile for corticosteroid administration at this gestational age. The fetal brain is still developing during this period, and there is some information to suggest that corticosteroids could have an unfavorable effect on brain development.
- Corticosteroids are potent hormones and potentially can have undesired hormonal effects at this gestational age.
- If corticosteroids are given and the mother carries the baby to term (37 weeks or later) there are some studies that suggest the baby is at an increased risk for neurologic, cognitive, metabolic, and/or behavioral abnormalities in later life.
We recommend caution before changing current practiceWe propose prudence with ACS use after 34 weeks’ gestation for the following reasons: the increased risk for neonatal hypoglycemia associated with ACS, the increased risk for ACS-related harm in term-born babies, and safety concerns with ACS in the late preterm period.
Evidence shows an increased risk for neonatal hypoglycemiaThe most profound effect modification observed in the study was an adverse effect—namely, a 60% increase in neonatal hypoglycemia with ACS administration (RR, 1.6; 95% CI, 1.37−1.87). The rate of neonatal hypoglycemia was 24% in the ACS group, compared with 15% in the placebo group.
Results of prior studies have demonstrated either no increased risk of hypoglycemia with ACS use4−7 or a much smaller increase (from 4.2% to 5.7%).8 The higher rate of neonatal hypoglycemia seen in this study suggests the possibility that the late preterm population may be more vulnerable to the negative impact of ACS on neonatal glucose/insulin homeostasis. Presumed mechanisms of action are either maternal hyperglycemia or fetal adrenal suppression or both, with potential for fetal adrenal suppression resulting from betamethasone exposure to affect long-term metabolic outcomes.9
Of note, women with pregestational diabetes were excluded from the study and, in routine practice, inclusion of such patients may further increase the risk of neonatal hypoglycemia.
There are few data on the prognostic significance of neonatal hypoglycemia in preterm infants, with the exception of a single study, the results of which show that it is associated with adverse neurodevelopment at 18 months of age.10
Data reveal increased risk for harm in term-born babiesIn spite of strict protocol specifications to increase the probability of delivery before 37 weeks’ gestation, 16% of women in the trial delivered at term. Investigators of prior randomized studies of ACS, aimed at reducing the risks of prematurity, have reported a rate of term delivery of about one-third,4,11 and in routine practice, administration of ACS after 34 weeks may be associated with even higher rates of term delivery.
This is important because recent evidence shows an unfavorable impact of ACS exposure in term-born children.12 The 5-year follow-up of the largest randomized trial in which multiple ACS courses were used noted that babies born at term had a 4-fold increased odds ratio for neurosensory disability.11 There was no dose−response interaction, with the same adverse odds ratio after 1 or 4 additional ACS courses. This observation was consistent with a previously reported Swedish national cohort, pointing to an unfavorable impact of even a single course of ACS in term-born children, with a greater likelihood of harm than benefit.13
In a UK follow-up of children aged 8 to 15 years who were enrolled in an RCT of ACS before cesarean delivery at term, low academic achievement was significantly more common in the group whose mothers had received ACS.14 In another study of 304 children born at term after exposure to a single course of ACS, investigators noted significantly increased cortisol reactivity to acute psychological stress at ages 6 to 11 years in the ACS-exposed patients, compared with 212 babies of women with threatened preterm labor who did not receive ACS and 372 babies from uncomplicated term pregnancies.15
The relevance of such study findings extends beyond childhood given the fact that elevated hypothalamic-pituitary-adrenal (HPA) axis reactivity has been linked to the pathogenesis of metabolic syndrome and depression in adult life.16 As recently as 2015, investigators of a randomized trial of ACS in 6 low- and middle-income countries highlighted their concern regarding “potentially harmful use of antenatal corticosteroids for infants not delivered preterm.”17
There are safety concerns with ACS in the late preterm periodThe effects of ACS are more pleiotropic than those reflected in a lower incidence of respiratory difficulties. Knowledge of the overall consequences of ACS exposure in infants born late-preterm or at term is still limited. The close-to-term fetus exposed to exogenous corticosteroids is also exposed to the physiologic endogenous surge of cortisol known to occur in the maternal circulation in late pregnancy, which reaches levels 3 times higher than those seen in nonpregnant women.18 Although placental 11 beta-hydroxysteroid dehydrogenase type 2 plays a protective role by allowing no more than 10% to 20% of maternal corticosteroids to cross the placenta, fetal overexposure from concomitant exogenous maternal corticosteroid administration remains a theoretical concern close to term. This is especially worrisome if there is a gestational age−related increase in the sensitivity to corticosteroid-induced in utero fetal programming. It has been reported that fetal overexposure to corticosteroids in late pregnancy can permanently increase the activity of the HPA-axis, with likely consequences in adult life.19
Another concern relates to oligodendrocytes development. Although the neuronal division process in humans usually is completed by 24 weeks’ gestation, the most rapid growth for oligodendrocytes occurs between 34 and 36 weeks’ gestation; these are the cells responsible for the synthesis of myelin. Overexposure to corticosteroids at this vulnerable time in the late preterm fetus potentially may have unanticipated negative neurologic consequences.20
This is the only scenario in which we feel antenatal corticosteroids could be used in a fetus aged 34 weeks to 36 weeks 5 days. In the setting of a scheduled cesarean delivery between 34 weeks and 35 weeks, the concerns relative to term delivery after corticosteroid exposure may not apply, but the concerns in relation to the administration of corticosteroid in the late preterm period—which is a time of possibly increased neurohormonal and neurologic vulnerability—still apply. With regard to the risk of neonatal hypoglycemia, one might argue that close neonatal monitoring of babies so exposed may ensure that any associated neonatal hypoglycemia does not go unnoticed or untreated. However, the prognostic significance of even short periods of neonatal hypoglycemia has not been established.
Where should future studies focus?There is clear neonatal benefit from a single course of ACS given to women who will deliver before 34 weeks’ gestation. It is widely accepted, based on the evidence provided by the 30-year follow-up of the cohort of 534 participants from the Auckland trial (the longest follow-up for any pregnancy trial), that administration of ACS at less than 34 weeks’ gestation is not associated with any obvious major developmental risk.21−23
However, the reassurances provided by the Auckland cohort should be neither directly extrapolated to the administration of ACS in the late preterm period nor applied to term-born babies exposed to ACS, for the simple reason that these subgroups never have been analyzed separately. The risk:benefit ratio of ACS use in the late-preterm period is as yet unknown, and in term-born babies the ratio may be unfavorable.
Follow-up studies are neededWe consider that there is a vital need for long-term follow-up studies. The focus of research on the effects of ACS no longer is on the immediate neonatal outcomes and now is on safety and the long-term outcomes of this exposure.
Bottom lineWe regard the large, high-quality study conducted by the NICHD MFMU Network1 as an opportunity to answer current concerns. It is hoped that the resources necessaryfor in-depth follow-up of the children involved in this study will be provided to the investigators and to the NICHD. It is only with such follow-up that mid- and long-term adverse effects can be assessed. We believe that, at a minimum, mid-term follow-up data should be available before it is wise to make any definitive recommendations for a sweeping change in clinical practice.
Share your thoughts! Send your Letter to the Editor to [email protected]. Please include your name and the city and state in which you practice.
- Gyamfi-Bannerman C, Thom EA, Blackwell SC, et al; NICHD Maternal-Fetal Medicine Units Network. Antenatal betamethasone for women at risk for late preterm delivery [published online ahead of print February 4, 2016]. N Engl J Med.
- American College of Obstetricians and Gynecologists Committee on Obstetric Practice. ACOG Committee Opinion No. 475: antenatal corticosteroid therapy for fetal maturation. Obstet Gynecol. 2011;117(2 pt 1):422–424.
- Roberts D, Dalziel S. Antenatal corticosteroids for accelerating fetal lung maturation for women at risk of preterm birth. Cochrane Database Syst Rev. 2006;(3):CD004454.
- Liggins GC, Howie RN. A controlled trial of antepartum glucocorticoid treatment for prevention of the respiratory distress syndrome in premature infants. Pediatrics. 1972;50(4):515–525.
- Sann L, Burnod J, Lasne Y, Bethenod M. Antenatal administration of betamethasone: effects upon neonatal blood glucose in premature infants [in French]. Nouv Presse Med. 1979;8(39):3147–3148.
- Rokicki W, Krasnodebski J. Antenatal glucocorticoid administration and neonatal glycemia. Dev Pharmacol Ther. 1987;10(4):307–311.
- Gazquez Serrano IM, Arroyos Plana A, Diaz Morales O, Herraiz Perea C, Holgueras Bragado A. Antenatal corticosteroid therapy and late preterm infant morbidity and mortality [in Spanish]. An Pediatr (Barc). 2014;81(6):374–382.
- Pettit KE, Tran SH, Lee E, Caughey AB. The association of antenatal corticosteroids with neonatal hypoglycemia and hyperbilirubinemia. J Matern Fetal Neonatal Med. 2014;27(7):683–686.
- Aydin M, Derveci U, Hakan N. Neonatal hypoglycemia associated with the antenatal corticosteroids may be secondary to fetal adrenal suppression. J Matern Fetal Neonatal Med. 2015;28(8):892.
- Lucas A, Morley R, Cole TJ. Adverse neurodevelopmental outcome of moderate neonatal hypoglycaemia. BMJ. 1988;297(6659):1304–1308.
- Asztalos EV, Murphy KE, Willan AR, et al; MACS-5 Collaborative Group. Multiple courses of antenatal corticosteroids for preterm birth study: outcomes in children at 5 years of age (MACS-5). JAMA Pediatr. 2013;167(12):1102–1110.
- Vidaeff AC, Belfort MA, Steer PJ. Antenatal corticosteroids: a time for more careful scrutiny of the indications [published online ahead of print January 18, 2016]. BJOG. doi:10.1111/1471-0528.13853.
- Eriksson L, Haglund B, Ewald U, Odlind V, Kieler H. Health consequences of prophylactic exposure to antenatal corticosteroids among children born late preterm or term. Acta Obstet Gynecol Scand. 2012;91(12):1415–1421.
- Stutchfield PR, Whitaker R, Gliddon AE, Hobson L, Kotecha S, Doull IJ. Behavioural, educational and respiratory outcomes of antenatal betamethasone for term caesarean section (ASTECS trial). Arch Dis Child Fetal Neonatal Ed. 2013;98(3):F195–F200.
- Alexander N, Rosenlocher F, Stalder T, et al. Impact of antenatal synthetic glucocorticoid exposure on endocrine stress reactivity in term-born children. J Clin Endocrinol Metab. 2012;97(10):3538–3544.
- Chrousos GP. Stress and disorders of the stress system. Nat Rev Endocrinol. 2009;5(7):374–381.
- Althabe F, Belizan JM, McClure EM, et al. A population-based, multifaceted strategy to implement antenatal corticosteroid treatment versus standard care for the reduction of neonatal mortality due to preterm birth in low-income and middle-income countries: the ACT cluster-randomised trial. Lancet. 2015;385(9968):629–639.
- Jung C, Ho JT, Torpy DJ, et al. A longitudinal study of plasma and urinary cortisol in pregnancy and postpartum. J Clin Endocrinol Metab. 2011;96(5):1533–1540.
- Welberg LA, Seckl JR, Holmes MC. Inhibition of 11ß-hydroxysteroid dehydrogenase, the foeto-placental barrier to maternal glucocorticoids, permanently programs amygdale GR mRNA expression and anxiety-like behavior in the offspring. Eur J Neurosci. 2000;12(3):1047–1054.
- Whitelaw A, Thoresen M. Antenatal steroids and the developing brain. Arch Dis Child Fetal Neonatal Ed. 2000;83(2):F154–F157.
- Dalziel SR, Walker NK, Parag V, et al. Cardiovascular risk factors after antenatal exposure to betamethasone: 30-year follow-up of a randomised controlled trial. Lancet. 2005;365(9474):1856–1862.
- Dalziel SR, Lim VK, Lambert A, et al. Antenatal exposure to betamethasone: psychological functioning and health related quality of life 31 years after inclusion in randomised controlled trial. BMJ. 2005;331(7518):665.
- Welberg LA, Seckl JR, Holmes MC. Inhibition of 11Dalziel SR, Walker NK, Parag V, et al. Dalziel SR, Lim VK, Lambert A, et al. Dalziel SR, Rea HH, Walker NK, et al.

Study examines efficacy of small group programs for fatigue in MS
NEW ORLEANS – Fatigue: Take Control (FTC), a 6-week group education and behavioral program widely used to address fatigue in patients with multiple sclerosis, was comparable to a general MS education program for decreasing fatigue and improving self-efficacy in a randomized, controlled study.
In 218 subjects randomized to participate in either FTC or a general MS education program (MS: Take Control, or MSTC), Modified Fatigue Impact Scale scores improved significantly, compared with baseline and regardless of group assignment; there was no difference between the groups at visit 6 (mean change, –4.5 and –3.6 in the FTC and MSTC groups, respectively), Cinda L. Hugos of the VA Portland (Ore.) Health Care System and her colleagues reported at a meeting held by the Americas Committee for Treatment and Research in Multiple Sclerosis.

Multiple Sclerosis Self-Efficacy scale scores did, however, improve significantly in the FTC group vs. the MSTC group (mean increase of 45.5 vs. a decrease of 15.8), but the improvement was not maintained at 6 months, the investigators reported in a poster at the meeting.
The two groups had comparable baseline characteristics, with a mean age of nearly 54 years, as well as similar mean time since diagnosis (12.5 years), self-administered Expanded Disability Status Scale scores (5.2), and demographics.
Fatigue is common in MS patients, occurring in up to 95% of patients, and many report that it is the most disabling symptom. FTC, which addresses medical management of fatigue, exercise, environment, and changes and choices with respect to energy and fatigue control, is often used by chapters of the National MS Society, but its effectiveness for decreasing fatigue or improving self-efficacy has not been proven, the investigators noted.
To determine if FTC decreases fatigue and increases self-efficacy, compared with a general MS education program that addresses issues such as nutrition, emotional health, cognitive problems, and fitness, the investigators randomized subjects at four sites in groups of between 3 and 10 participants to either an FTC or MSTC group. All subjects had moderate to severe fatigue. Those with pregnancy, severe depression, uncontrolled problems that would limit participation, relapse in the prior month, or initiation of a new disease-modifying treatment within the prior 3 months were excluded.
“Both FTC and MSTC structured small group programs were associated with improved self-reported fatigue at program completion and at 3- and 6-month follow-up, but there were no significant differences in fatigue scores between FTC and MSTC participants at any time point,” the investigators wrote.
Self-efficacy was significantly better among FTC participants at program completion, but was not sustained, they noted, concluding that the findings suggest that “participating in structured small group programs is associated with prolonged reductions in fatigue in people with MS and that supporting goal setting provides short-term improvements in self-efficacy.”
Further research is needed to determine whether booster sessions would be beneficial for sustaining improvements in self-efficacy, they added.
This study was supported by the Rehabilitation, Research, & Development Service of the Veterans Affairs Office of Research & Development. The authors reported having no disclosures.
NEW ORLEANS – Fatigue: Take Control (FTC), a 6-week group education and behavioral program widely used to address fatigue in patients with multiple sclerosis, was comparable to a general MS education program for decreasing fatigue and improving self-efficacy in a randomized, controlled study.
In 218 subjects randomized to participate in either FTC or a general MS education program (MS: Take Control, or MSTC), Modified Fatigue Impact Scale scores improved significantly, compared with baseline and regardless of group assignment; there was no difference between the groups at visit 6 (mean change, –4.5 and –3.6 in the FTC and MSTC groups, respectively), Cinda L. Hugos of the VA Portland (Ore.) Health Care System and her colleagues reported at a meeting held by the Americas Committee for Treatment and Research in Multiple Sclerosis.
Multiple Sclerosis Self-Efficacy scale scores did, however, improve significantly in the FTC group vs. the MSTC group (mean increase of 45.5 vs. a decrease of 15.8), but the improvement was not maintained at 6 months, the investigators reported in a poster at the meeting.
The two groups had comparable baseline characteristics, with a mean age of nearly 54 years, as well as similar mean time since diagnosis (12.5 years), self-administered Expanded Disability Status Scale scores (5.2), and demographics.
Fatigue is common in MS patients, occurring in up to 95% of patients, and many report that it is the most disabling symptom. FTC, which addresses medical management of fatigue, exercise, environment, and changes and choices with respect to energy and fatigue control, is often used by chapters of the National MS Society, but its effectiveness for decreasing fatigue or improving self-efficacy has not been proven, the investigators noted.
To determine if FTC decreases fatigue and increases self-efficacy, compared with a general MS education program that addresses issues such as nutrition, emotional health, cognitive problems, and fitness, the investigators randomized subjects at four sites in groups of between 3 and 10 participants to either an FTC or MSTC group. All subjects had moderate to severe fatigue. Those with pregnancy, severe depression, uncontrolled problems that would limit participation, relapse in the prior month, or initiation of a new disease-modifying treatment within the prior 3 months were excluded.
“Both FTC and MSTC structured small group programs were associated with improved self-reported fatigue at program completion and at 3- and 6-month follow-up, but there were no significant differences in fatigue scores between FTC and MSTC participants at any time point,” the investigators wrote.
Self-efficacy was significantly better among FTC participants at program completion, but was not sustained, they noted, concluding that the findings suggest that “participating in structured small group programs is associated with prolonged reductions in fatigue in people with MS and that supporting goal setting provides short-term improvements in self-efficacy.”
Further research is needed to determine whether booster sessions would be beneficial for sustaining improvements in self-efficacy, they added.
This study was supported by the Rehabilitation, Research, & Development Service of the Veterans Affairs Office of Research & Development. The authors reported having no disclosures.
AT ACTRIMS FORUM 2016
Key clinical point: Fatigue: Take Control (FTC), a 6-week program widely used to address fatigue in patients with multiple sclerosis, was comparable to a general MS education program for decreasing fatigue and improving self-efficacy in a randomized, controlled study.
Major finding: FTC and a general MS education program improved Modified Fatigue Impact Scale scores significantly, with no difference between the groups at visit 6 (mean change, –4.5 and –3.6 in the groups, respectively).
Data source: A randomized, controlled trial of 218 MS patients.
Disclosures: This study was supported by the Rehabilitation, Research & Development Service of the VA Office of Research and Development. The authors reported having no disclosures.

Is BRCA testing causing women to undergo unnecessary prophylactic mastectomy?
Because the prevalence of BRCA1 and BRCA2 mutations is elevated among young women diagnosed with breast cancer, guidelines recommend carrier testing for women diagnosed with this disease at age 50 years or younger.1 Are women being tested, however, and what are their treatment decisions surrounding those test results? The Young Women’s Breast Cancer Study (YWBCS) seeks to answer such questions.
Details of the study
Study investigators recruited women diagnosed with breast cancer at age 40 or younger from 11 academic and community hospitals in the United States and Canada beginning in 2006. There were 897 evaluable participants who were recruited between 2006 and 2014. Their mean age at diagnosis was 35.5 years and 86.1% of them were white non-Hispanic. A respective 84.5% and 99.8% of women had at least a college education and were insured.
Overall, BRCA testing was performed within 1 year of breast cancer diagnosis in 87% of participants, with rates rising from 77% in 2006 to 95% in 2013. Among participants tested, 7.6% had a BRCA1 mutation, 4.5% had a BRCA2 mutation, 4.6% had an indeterminate result of unknown clinical significance, and 81.3% had a negative test result.
A total of 86.4% of women found to be mutation carriers proceeded with risk-reducing bilateral mastectomy; 51.2% found not to be mutation carriers had this same prophylactic surgery.
What this evidence means for practice
Although it is encouraging to see that the proportion of young women with breast cancer who are receiving counseling and genetic testing is rising, the findings from this study of highly educated, largely white and affluent women is not generalizable to all US women diagnosed with breast cancer at a young age.
That more than half of BRCA-negative women in this study chose bilateral prophylactic mastectomy, a procedure not recommended in this population, is concerning, and reflects nationwide trends.2 The increasing use of next-generation sequencing (which yields information on moderate- and low-penetrance genes in addition to BRCA status) means that women and their providers increasingly are being confronted with genetic testing results that call for formal genetics expertise. Unfortunately, genetics counselors remain in short supply and many clinicians without specific genetics training are offering these tests. As editorialists appropriately point out, these trends may further increase the number of relatively low-risk women proceeding with unwarranted bilateral mastectomy.3 In my practice, I continue to refer women whose family or personal histories indicate high-risk status to a cancer genetics counselor for formal counseling and possible testing.
—Andrew M. Kaunitz, MD
Share your thoughts! Send your Letter to the Editor to [email protected]. Please include your name and the city and state in which you practice.
- U.S. Preventive Services Task Force. Risk Assessment, Genetic Counseling, and Genetic Testing for BRCA-Related Cancer in Women: Clinical Summary of USPSTF Recommendation. AHRQ Publication No. 12-05164-EF-3. http://www.uspreventiveservicestaskforce.org/uspstf12/brcatest/brcatestsumm.htm. Published December 2013. Accessed February 25, 2016.
- Tuttle TM, Jarosek S, Habermann EB, et al. Increasing rates of contralateral prophylactic mastectomy among patients with ductal carcinoma in situ. J Clin Oncol. 2009;27(9):1362–1367.
- Blazer KR, Slavin T, Weitzel JN. Increased reach of genetic cancer risk assessment as a tool for precision management of hereditary breast cancer [published online ahead of print February 11, 2016]. JAMA Oncol. doi:10.1001/jamaoncol.2015.5975.
Because the prevalence of BRCA1 and BRCA2 mutations is elevated among young women diagnosed with breast cancer, guidelines recommend carrier testing for women diagnosed with this disease at age 50 years or younger.1 Are women being tested, however, and what are their treatment decisions surrounding those test results? The Young Women’s Breast Cancer Study (YWBCS) seeks to answer such questions.
Details of the study
Study investigators recruited women diagnosed with breast cancer at age 40 or younger from 11 academic and community hospitals in the United States and Canada beginning in 2006. There were 897 evaluable participants who were recruited between 2006 and 2014. Their mean age at diagnosis was 35.5 years and 86.1% of them were white non-Hispanic. A respective 84.5% and 99.8% of women had at least a college education and were insured.
Overall, BRCA testing was performed within 1 year of breast cancer diagnosis in 87% of participants, with rates rising from 77% in 2006 to 95% in 2013. Among participants tested, 7.6% had a BRCA1 mutation, 4.5% had a BRCA2 mutation, 4.6% had an indeterminate result of unknown clinical significance, and 81.3% had a negative test result.
A total of 86.4% of women found to be mutation carriers proceeded with risk-reducing bilateral mastectomy; 51.2% found not to be mutation carriers had this same prophylactic surgery.
What this evidence means for practice
Although it is encouraging to see that the proportion of young women with breast cancer who are receiving counseling and genetic testing is rising, the findings from this study of highly educated, largely white and affluent women is not generalizable to all US women diagnosed with breast cancer at a young age.
That more than half of BRCA-negative women in this study chose bilateral prophylactic mastectomy, a procedure not recommended in this population, is concerning, and reflects nationwide trends.2 The increasing use of next-generation sequencing (which yields information on moderate- and low-penetrance genes in addition to BRCA status) means that women and their providers increasingly are being confronted with genetic testing results that call for formal genetics expertise. Unfortunately, genetics counselors remain in short supply and many clinicians without specific genetics training are offering these tests. As editorialists appropriately point out, these trends may further increase the number of relatively low-risk women proceeding with unwarranted bilateral mastectomy.3 In my practice, I continue to refer women whose family or personal histories indicate high-risk status to a cancer genetics counselor for formal counseling and possible testing.
—Andrew M. Kaunitz, MD
Share your thoughts! Send your Letter to the Editor to [email protected]. Please include your name and the city and state in which you practice.
- U.S. Preventive Services Task Force. Risk Assessment, Genetic Counseling, and Genetic Testing for BRCA-Related Cancer in Women: Clinical Summary of USPSTF Recommendation. AHRQ Publication No. 12-05164-EF-3. http://www.uspreventiveservicestaskforce.org/uspstf12/brcatest/brcatestsumm.htm. Published December 2013. Accessed February 25, 2016.
- Tuttle TM, Jarosek S, Habermann EB, et al. Increasing rates of contralateral prophylactic mastectomy among patients with ductal carcinoma in situ. J Clin Oncol. 2009;27(9):1362–1367.
- Blazer KR, Slavin T, Weitzel JN. Increased reach of genetic cancer risk assessment as a tool for precision management of hereditary breast cancer [published online ahead of print February 11, 2016]. JAMA Oncol. doi:10.1001/jamaoncol.2015.5975.
Subtle radiographic progression in axial SpA cannot be reliably distinguished from error
Sacroiliitis observed in patients with axial spondyloarthritis more often regressed rather than progressed on radiography over nearly 5 years of follow-up of the Assessment of SpondyloArthritis international Society (ASAS) cohort, which lead author Dr. Alexandre Sepriano and his colleagues called “strange” and “sobering.”
The findings call into question the reliability of plain pelvic radiographs for detecting subtle change in sacroiliitis and should prompt the evaluation of alternative imaging modalities such as MRI and low-dose CT, according to Dr. Sepriano of Leiden (the Netherlands) University Medical Center and his associates.

Determining the presence of radiographic sacroiliitis is prognostically relevant and can pave the way for treatment with biologics, but ambiguity in making this decision and in tracking progression has been revealed in the large inter-and intrareader variability found in previous studies. Furthermore, previous studies tracking progression of nonradiographic axial spondyloarthritis (axSpA) to radiographic axSpA have addressed only disease progression and ignored regression. While regression is likely to be rare, it cannot be ignored from a methodologic standpoint, the investigators wrote.
The researchers therefore set out in the current study to assess positive and negative changes in sacroiliitis on plain pelvic radiographs over time in 975 patients from the ASAS cohort who had chronic back pain of unknown origin or undiagnosed peripheral symptoms (Ann Rheum Dis. 2016 Feb 22. doi: 10.1136/annrheumdis-2015-208964).
Of the 357 of the patients who had paired plain pelvic radiographs available at baseline and follow-up, 17.4% (62/357) fulfilled the criteria for radiographic axSpA at baseline, as defined by modified New York criteria (mNY). At a mean follow-up of 4.4 years, this figure had risen to 22.4% (80/357), suggesting a net progression of 5%.
However, when the authors cross-tabulated their figures, more than half (36/62) of the patients considered mNY positive at baseline were assessed as mNY negative at follow-up. This would mean that radiographic sacroiliitis would have regressed in 58% of the cases; conversely, only 54 of 295 patients (18.3%) became mNY positive at follow-up.
“If only positive change (progression) is valued and negative change is ignored, one would disregard measurement error and spuriously attribute part of the observed positive change to real progression,” the research team explained. “The most likely explanation of our strange and extreme observation is that subtle radiographic progression (the signal) – if truly present – cannot be reliably distinguished from measurement error (the noise). These sobering data clearly illustrate that more research is needed in visualising progression in axSpA.”
ASAS funded the study. The authors had no competing interests to declare.
Sacroiliitis observed in patients with axial spondyloarthritis more often regressed rather than progressed on radiography over nearly 5 years of follow-up of the Assessment of SpondyloArthritis international Society (ASAS) cohort, which lead author Dr. Alexandre Sepriano and his colleagues called “strange” and “sobering.”
The findings call into question the reliability of plain pelvic radiographs for detecting subtle change in sacroiliitis and should prompt the evaluation of alternative imaging modalities such as MRI and low-dose CT, according to Dr. Sepriano of Leiden (the Netherlands) University Medical Center and his associates.
Determining the presence of radiographic sacroiliitis is prognostically relevant and can pave the way for treatment with biologics, but ambiguity in making this decision and in tracking progression has been revealed in the large inter-and intrareader variability found in previous studies. Furthermore, previous studies tracking progression of nonradiographic axial spondyloarthritis (axSpA) to radiographic axSpA have addressed only disease progression and ignored regression. While regression is likely to be rare, it cannot be ignored from a methodologic standpoint, the investigators wrote.
The researchers therefore set out in the current study to assess positive and negative changes in sacroiliitis on plain pelvic radiographs over time in 975 patients from the ASAS cohort who had chronic back pain of unknown origin or undiagnosed peripheral symptoms (Ann Rheum Dis. 2016 Feb 22. doi: 10.1136/annrheumdis-2015-208964).
Of the 357 of the patients who had paired plain pelvic radiographs available at baseline and follow-up, 17.4% (62/357) fulfilled the criteria for radiographic axSpA at baseline, as defined by modified New York criteria (mNY). At a mean follow-up of 4.4 years, this figure had risen to 22.4% (80/357), suggesting a net progression of 5%.
However, when the authors cross-tabulated their figures, more than half (36/62) of the patients considered mNY positive at baseline were assessed as mNY negative at follow-up. This would mean that radiographic sacroiliitis would have regressed in 58% of the cases; conversely, only 54 of 295 patients (18.3%) became mNY positive at follow-up.
“If only positive change (progression) is valued and negative change is ignored, one would disregard measurement error and spuriously attribute part of the observed positive change to real progression,” the research team explained. “The most likely explanation of our strange and extreme observation is that subtle radiographic progression (the signal) – if truly present – cannot be reliably distinguished from measurement error (the noise). These sobering data clearly illustrate that more research is needed in visualising progression in axSpA.”
ASAS funded the study. The authors had no competing interests to declare.
FROM ANNALS OF THE RHEUMATIC DISEASES
Key clinical point: Subtle radiographic progression in axSpA cannot be reliably distinguished from measurement error.
Major finding: Using plain radiographs, more than half of the patients identified as mNY positive for axSpA at baseline were assessed as mNY negative at a mean follow-up of 4.4 years.
Data source: 975 patients with chronic back pain of unknown origin or undiagnosed peripheral symptoms taking part in the Assessment of SpondyloArthritis international Society (ASAS) cohort.
Disclosures: ASAS funded the study. The authors had no competing interests to declare.

Pro basketball players’ hearts: LV keeps growing, aortic root doesn’t
For the first time, cardiologists have characterized the adaptive cardiac remodeling in a large cohort of National Basketball Association players, which establishes a normative database and allows physicians to distinguish it from occult pathologic changes that may precipitate sudden cardiac death, according to an imaging study.
“We hope that the present data will help to focus decision making and improve clinical acumen for the purpose of primary prevention of cardiac emergencies in U.S. basketball players and in the athletic community at large,” said Dr. David J. Engel and his associates of Columbia University, New York.

Until now, most of the literature concerning the structural features of the athletic heart has been based on European studies, where comprehensive cardiac screening of all elite athletes is mandatory. The typical sports activities and the demographics of athletes in the U.S. are different, and their cardiologic profiles have not been well studied because detailed cardiac examinations are not compulsory. But the NBA recently mandated that all athletes undergo annual preseason medical evaluations including stress echocardiograms, and allowed the division of cardiology at Columbia to assess the results each year.
“A detailed understanding of normal and expected cardiac remodeling in U.S. basketball players has significant clinical importance given that the incidence of sports-related sudden cardiac death in the U.S. is highest among basketball players and that the most common cause ... in this population is hypertrophic cardiomyopathy,” the investigators noted.
Their analysis of all 526 ECGs performed on NBA players during a 1-year period “will provide an invaluable frame of reference to enhance player safety for the large group of U.S. basketball players in training at all skill levels, and in the athletic community at large,” they said.
The study participants were aged 18-39 years (mean age, 25.7 years). Roughly 77% were African American, 20% were white, 2% were Hispanic, and 1% were Asian or other ethnicities. The mean height was 200.2 cm (6’7”).
Left ventricular cavity size was larger than that in the general population, but LV size was proportional to the athletes’ large body size. “Scaling LV size to body size is vitally important in the cardiac evaluation of basketball players, whose heights extend to 218 cm and body surface areas to 2.8 m2,” Dr. Engel and his associates said (JAMA Cardiol. 2016 Feb 24. doi: 10.1001/jamacardio.2015.0252).
Left ventricular hypertrophy (LVH) was identified in only 27% of the athletes. African Americans had increased indices of LVH, compared with whites, and had a higher incidence of nondilated concentric hypertrophy, while whites showed predominantly eccentric dilated hypertrophy. These findings should help clinicians recognize genuine hypertrophic cardiomyopathy, which is a contraindication to participating in all but the most low-intensity competitive sports.
Most of the participants had a normal left ventricular ejection fraction, and all showed normal augmentation of LV systolic function with exercise.
Aortic root diameter was larger than that in the general population but similar to that in other elite athletes. Surprisingly, aortic root diameter increased with increasing body size only to a certain point, reaching a plateau at 31-35 mm. Fewer than 5% of the participants had an aortic root diameter of 40 mm or more, and the maximal diameter was 42 mm. “These data have important implications in the evaluation of exceptionally large athletes and question the applicability in individuals with significantly increased biometrics of the traditional formula to estimate aortic root diameter that assumes a linear association between [it] and body surface area,” they noted.
“We hope that the results of this study will assist recognition of cardiac pathologic change and provide a framework to help avoid unnecessary exclusions of athletes from competition. We believe that these data have additional applicability to other sports that preselect for athletes with height, such as volleyball, rowing, and track and field,” Dr. Engel and his associates added.
This study was supported by the National Basketball Association as part of a medical services agreement with Columbia University. Dr. Engel and his associates reported having no relevant financial disclosures.
The most interesting finding of this study was that despite the immense body size of the athletes, aortic root diameter exceeded 40 mm in less than 5%, and when dilation did occur it was of a very small magnitude, with a maximal diameter of 42 mm.
This important finding confirms that only mild aortic dilation should be considered physiologic among athletes, and that even athletes at the extreme end of the height spectrum should not be expected to show proportionally extreme aortic dilation.
Unlike ventricular size, which increases proportionally with body size, aortic dilation has an upper limit. Athletes with aortic dimensions that exceed this limit should be considered at risk for aortopathy and either prohibited from competitive sports or closely monitored if they do participate.
Dr. Aaron L. Baggish of the Cardiovascular Performance Program at Massachusetts General Hospital, Boston, made these remarks in an accompanying editorial (JAMA Cardiol. 2016 Feb 24. doi: 10.1001/jamacardio.2015.0289). He reported having no relevant financial conflicts of interest.
For the first time, cardiologists have characterized the adaptive cardiac remodeling in a large cohort of National Basketball Association players, which establishes a normative database and allows physicians to distinguish it from occult pathologic changes that may precipitate sudden cardiac death, according to an imaging study.
“We hope that the present data will help to focus decision making and improve clinical acumen for the purpose of primary prevention of cardiac emergencies in U.S. basketball players and in the athletic community at large,” said Dr. David J. Engel and his associates of Columbia University, New York.
Until now, most of the literature concerning the structural features of the athletic heart has been based on European studies, where comprehensive cardiac screening of all elite athletes is mandatory. The typical sports activities and the demographics of athletes in the U.S. are different, and their cardiologic profiles have not been well studied because detailed cardiac examinations are not compulsory. But the NBA recently mandated that all athletes undergo annual preseason medical evaluations including stress echocardiograms, and allowed the division of cardiology at Columbia to assess the results each year.
“A detailed understanding of normal and expected cardiac remodeling in U.S. basketball players has significant clinical importance given that the incidence of sports-related sudden cardiac death in the U.S. is highest among basketball players and that the most common cause ... in this population is hypertrophic cardiomyopathy,” the investigators noted.
Their analysis of all 526 ECGs performed on NBA players during a 1-year period “will provide an invaluable frame of reference to enhance player safety for the large group of U.S. basketball players in training at all skill levels, and in the athletic community at large,” they said.
The study participants were aged 18-39 years (mean age, 25.7 years). Roughly 77% were African American, 20% were white, 2% were Hispanic, and 1% were Asian or other ethnicities. The mean height was 200.2 cm (6’7”).
Left ventricular cavity size was larger than that in the general population, but LV size was proportional to the athletes’ large body size. “Scaling LV size to body size is vitally important in the cardiac evaluation of basketball players, whose heights extend to 218 cm and body surface areas to 2.8 m2,” Dr. Engel and his associates said (JAMA Cardiol. 2016 Feb 24. doi: 10.1001/jamacardio.2015.0252).
Left ventricular hypertrophy (LVH) was identified in only 27% of the athletes. African Americans had increased indices of LVH, compared with whites, and had a higher incidence of nondilated concentric hypertrophy, while whites showed predominantly eccentric dilated hypertrophy. These findings should help clinicians recognize genuine hypertrophic cardiomyopathy, which is a contraindication to participating in all but the most low-intensity competitive sports.
Most of the participants had a normal left ventricular ejection fraction, and all showed normal augmentation of LV systolic function with exercise.
Aortic root diameter was larger than that in the general population but similar to that in other elite athletes. Surprisingly, aortic root diameter increased with increasing body size only to a certain point, reaching a plateau at 31-35 mm. Fewer than 5% of the participants had an aortic root diameter of 40 mm or more, and the maximal diameter was 42 mm. “These data have important implications in the evaluation of exceptionally large athletes and question the applicability in individuals with significantly increased biometrics of the traditional formula to estimate aortic root diameter that assumes a linear association between [it] and body surface area,” they noted.
“We hope that the results of this study will assist recognition of cardiac pathologic change and provide a framework to help avoid unnecessary exclusions of athletes from competition. We believe that these data have additional applicability to other sports that preselect for athletes with height, such as volleyball, rowing, and track and field,” Dr. Engel and his associates added.
This study was supported by the National Basketball Association as part of a medical services agreement with Columbia University. Dr. Engel and his associates reported having no relevant financial disclosures.
FROM JAMA CARDIOLOGY
Key clinical point: Cardiologists characterized normal, adaptive cardiac remodeling in NBA players, allowing physicians to distinguish it from occult pathologic changes that may precipitate sudden cardiac death.
Major finding: Aortic root diameter increased with increasing body size only to a certain point, reaching a plateau at 31-35 mm.
Data source: An observational cohort study in which echocardiograms of 526 professional athletes were analyzed.
Disclosures: This study was supported by the National Basketball Association as part of a medical services agreement with Columbia University. Dr. Engel and his associates reported having no relevant financial disclosures.

Can CA 125 screening reduce mortality from ovarian cancer?
To date, screening has not been found effective in reducing mortality from ovarian cancer. Collaborative trial investigators in the United Kingdom studied postmenopausal women in the general population to assess whether early detection by screening could decrease ovarian cancer mortality.
Details of the study
During 2001 to 2005, more than 200,000 UK postmenopausal women aged 50 to 74 years (mean age at baseline, 60.6 years) were randomly assigned to no screening, annual transvaginal ultrasound screening (TVUS), or annual multimodal screening (MMS) with serum CA 125 using the Risk of Ovarian Cancer Algorithm (ROCA), which takes into account changes in CA 125 levels over time. When ROCA scores indicated normal risk for ovarian cancer, women were advised to undergo repeat CA 125 assessment in 1 year. Women with intermediate risk were advised to repeat CA 125 assessment in 3 months, while high-risk women were advised to undergo TVUS.
With a median of 11.1 years of follow-up, ovarian cancer (including fallopian tube malignancies) was diagnosed in 1,282 participants (0.6%), with fatal outcomes among the 3 groups as follows: 0.34% in the no-screening group, 0.30% in the TVUS group, and 0.29% in the MMS group. Based on the results of a planned secondary analysis that excluded prevalent cases of ovarian cancer, annual MMS was associated with an overall average mortality reduction of 20% compared with no screening (P = .021). When the mortality reduction was broken down by years of annual screening, 0 to 7 years was associated with an 8% mortality reduction over no screening, and this jumped to 28% for 7 to 14 annual MMS screening years.
The overall average mortality reduction with TVUS compared with no screening was smaller than with MMS. With MMS, the number needed to screen to prevent 1 death from ovarian cancer was 641.
Assessing unnecessary treatment
False-positive screens that resulted in surgical intervention with findings of benign adnexal pathology or normal adnexa occurred in 14 and 50 per 10,000 screens in the MMS and TVUS groups, respectively. For each ovarian cancer detected in the MMS and TVUS groups, an additional 2 and 10 women, respectively, underwent surgery based on false-positive results.
WHAT THIS EVIDENCE MEANS FOR PRACTICE
This massive trial’s findings provide optimism that screening for ovarian cancer can indeed reduce mortality from this uncommon but too-often lethal disease. There are unanswered questions, however, which include the cost-effectiveness of MMS screening and how well this strategy can be implemented outside of a highly centralized and controlled clinical trial. While encouraging, these trial results should be viewed as preliminary until additional efficacy and cost-effectiveness data—and guidance from professional organizations—are available.
—ANDREW M. KAUNITZ, MD
Share your thoughts! Send your Letter to the Editor to [email protected]. Please include your name and the city and state in which you practice.
VIDEO: Hands-off yields best brain arteriovenous malformation outcomes
LOS ANGELES – Hang a do-not-disturb sign on brain arteriovenous malformations.
Patients who underwent invasive interventions to repair an unruptured arteriovenous malformation (AVM) in their brain faced a greater than two-fold increased rate of death or stroke during an average 4 years of follow-up, compared with patients who received medical treatment only with no active intervention, Dr. Christian Stapf reported at the International Stroke Conference.
When analyzed on an intention-to-treat basis, for every five AVM patients treated by endovascular surgery, conventional surgery, or radiotherapy, one additional patient died or had a stroke, compared with the death or stroke rate among control patients who received only medical management. When analyzed based on the treatments that patients actually received, the number-needed-to-harm fell to one excess death or stroke for every three AVM patients who underwent an invasive procedure, compared with control patients, reported Dr. Stapf, a professor in the department of neurosciences at the University of Montreal.
The results from A Randomized Trial of Unruptured Brain AVMs (ARUBA) “show us that we clearly have not been as good as we thought in helping patients against their stroke risk,” said Dr. Stapf in a video interview during the meeting. “Given that the risk of death or stroke was reduced three- to fivefold with no [invasive] treatment and leaving the AVM alone makes us think that we can’t recommend preventive intervention with currently-used techniques. Living with the AVM seems like the far better option.”
The ARUBA study, run at 39 centers in nine countries including 13 U.S. centers, randomized 226 patients with unruptured AVMs before the study’s data safety and monitoring board stopped study enrollment prematurely in April 2013. The study group included 110 patients randomized to receive medical interventions only and 116 randomized to medical intervention plus “best possible” AVM eradication. The exact type of eradication for each patient was left up to local clinicians, who tailored the intervention to address the size, location, and anatomy of each AVM. Medical management included steps such as treatment with antiepileptic drugs to treat seizures, various treatments for headaches, and physiotherapy for patients with neurologic deficits.
The study’s primary endpoint was the combined rate of death or stroke, which occurred in 41 of the 116 patients (35%) randomized to receive an invasive intervention and in 15 of the 110 (14%) randomized to medical treatment only during an average follow-up of 50 months, with many patients followed for 5 years.
When analyzed by the treatment patients actually received, 106 underwent an invasive intervention and 43 of these patients (41%) died or had a stroke, and 120 patients received medical treatments only, of whom 13 (11%) died or had a stroke.
A secondary endpoint was the rate of death or disability after 5-year follow-up, with disability defined as a modified Rankin Scale score of 2 or more. This occurred in 38% of the 45 patients who underwent AVM eradication and had this follow-up available, and in 18% of 51 patients who had medial treatment only and received this follow-up.
Interim results from the study came out 2 years ago, with an average follow-up of 33 months (Lancet. 2014 Feb 15;383[9917]:614-21), but the trial was designed to have 5-year follow-up, largely accomplished in the new data reported by Dr. Stapf.
Many clinicians had already abandoned invasive interventions to treat brain AVMs following release of the interim results, and Dr. Stapf predicted that this trend will further strengthen now that the final results are in and confirm the earlier indication of hazard. Until the ARUBA results became available, clinicians had presumed invasive interventions to resolve or minimize malformations were beneficial based on intuition. ARUBA is the first systematic comparison of procedures versus a hands-off approach for brain AVMs, he said.
“Neurologists will now be less likely to refer patients for intervention, and interventionalists will be less enthusiastic to perform procedures,” Dr. Stapf said during the meeting, sponsored by the American Heart Association. In addition, anyone now performing an intervention in routine practice would need to consider the possible legal implications if the patient were to have a bad outcome. Dr. Stapf also noted that some professional societies are now considering recommendations against routine interventions. He conceded that some invasive interventions might still occur for selected cases on an investigational basis, but the ARUBA results “set the bar very high against performing any new interventions,” he concluded.
Approximately 3,000 patients annually are newly diagnosed with an unruptured brain AVM in the United States and Canada, he estimated.
ARUBA received no commercial support. Dr. Stapf had no disclosures.
The video associated with this article is no longer available on this site. Please view all of our videos on the MDedge YouTube channel
On Twitter @mitchelzoler
AT THE INTERNATIONAL STROKE CONFERENCE
Key clinical point: The first direct comparison of invasive treatment and medical management only for intracerebral arteriovenous malformations showed substantial hazard from active intervention.
Major finding: The incidence of death or stroke was 35% with active intervention and 14% with medical management only.
Data source: ARUBA, a multicenter, prospective, international, randomized study with 226 patients.
Disclosures: ARUBA received no commercial support. Dr. Stapf had no disclosures.

Cardiorenal Syndrome Type 1: Renal Dysfunction in Acute Decompensated Heart Failure
From the Cardiovascular Division, Department of Internal Medicine, University of Minnesota, Minneapolis, MN.
Abstract
- Objective: To present a review of cardiorenal syndrome type 1 (CRS1).
- Methods: Review of the literature.
- Results: Acute kidney injury occurs in approximately one-third of patients with acute decompensated heart failure (ADHF) and the resultant condition was named CRS1. A growing body of literature shows CRS1 patients are at high risk for poor outcomes, and thus there is an urgent need to understand the pathophysiology and subsequently develop effective treatments. In this review we discuss prevalence, proposed pathophysiology including hemodynamic and nonhemodynamic factors, prognosticating variables, data for different treatment strategies, and ongoing clinical trials and highlight questions and problems physicians will face moving forward with this common and challenging condition.
- Conclusion: Further research is needed to understand the pathophysiology of this complex clinical entity and to develop effective treatments.
Acute decompensated heart failure (ADHF) is an epidemic facing physicians throughout the world. In the United States alone, ADHF accounts for over 1 million hospitalizations annually, with costs in 2012 reaching $30.7 billion [1]. Despite the advances in chronic heart failure management, ADHF continues to be associated with poor outcomes as exemplified by 30-day readmission rates of over 20% and in-hospital mortality rates of 5% to 6%, both of which have not significantly improved over the past 20 years [2,3]. One of the strongest predictors of adverse outcomes in ADHF is renal dysfunction. An analysis from the Acute Decompensated Heart Failure National Registry (ADHERE) revealed the combination of renal dysfunction (creatinine > 2.75 mg/dL and blood urea nitrogen (BUN) > 43 mg/dL) and hypotension (systolic blood pressure (SBP) < 115 mm Hg) upon admission was associated with an in-hospital mortality of > 20% [4]. The Organized Program to Initiate Lifesaving Treatment in Hospitalized Patients with Heart Failure (OPTIMIZE-HF) registry documented a 16.3% in-hospital mortality when patients had a SBP < 100 mm Hg and creatinine > 2.0 mg/dL at admission [5].
The presence of acute kidney injury in the setting of ADHF is a very common occurrence and was termed cardiorenal syndrome type 1 (CRS1) [6]. The prevalence of CRS1 in single-centered studies ranged from 32% to 40% of all ADHF admissions [7,8]. If this estimate holds true throughout the United States, there would be 320,000 to 400,000 hospitalizations for CRS1 annually, highlighting the magnitude of this problem. Moreover, with the number of patients with heart failure expected to continue to rise, CRS1 will only become more prevalent in the future. In this review we discuss the prevalence, proposed pathophysiology including hemodynamic and nonhemodynamic factors, prognosticating variables, data for different treatment strategies, ongoing clinical trials, and highlight questions and problems physicians will face moving forward in this common and challenging condition.
Pathogenesis of CRS1
Hemodynamic Effects
The early hypothesis for renal dysfunction in ADHF centered on hemodynamics, as reduced cardiac output was believed to decrease renal perfusion. However, analysis of invasive hemodynamics from patients with ADHF suggested that central venous pressure (CVP) was actually a better predictor of the development of CRS1 than cardiac output. In a single-center study conducted at the Cleveland Clinic, hemodynamics from 145 patients with ADHF were evaluated and surprisingly baseline cardiac index was greater in the patients with CRS1 than patients without renal dysfunction (2.0 ± 0.8 L/min/m2 vs 1.8 ± 0.4 L/min/m2; P = 0.008). However, baseline CVP was higher in the CRS1 group (18 ± 7 mm Hg vs 12 ± 6 mm Hg; P = 0.001), and there was a heightened risk of developing CRS1 as CVP increased. In fact, 75% of the patients with a CVP of > 24 mm Hg developed renal impairment [9]. In a retrospective study of the Evaluation Study of Congestive Heart Failure and Pulmonary Arterial Catheter Effectiveness (ESCAPE) trial, the only hemodynamic parameter that correlated with baseline creatinine was CVP. However, no invasive measures predicted worsening renal function during hospitalization [10]. Finally, an experiment that used isolated canine kidneys showed increased venous pressure acutely reduced urine production. Interestingly, this relationship was dependent on arterial pressure; as arterial flow decreased smaller increases in CVP were needed to reduce urine output [11]. Together, these data suggest increased CVP plays an important role in CRS1, but imply hemodynamics alone may not fully explain the pathophysiology of CRS1.
Inflammation
As information about how hemodynamics incompletely predict renal dysfunction in ADHF became available, alternative hypotheses were investigated to gain a deeper understanding of the pathophysiology underlying CRS1. A pathological role of inflammation in CRS1 has gained attention due to recent publications. First of all, serum levels of the pro-inflammatory cytokines TNF-a and IL-6 were elevated in patients with CRS1 when compared to health controls [12]. Interestingly, Virzi et al showed that the median value of IL-6 was 5 times higher in CRS1 patients when compared to ADHF patients without renal dysfunction [13]. The negative consequences of elevated serum cytokines were demonstrated when incubation of a human cell line of monocytes with serum from CRS1 patients induced apoptosis in 81% of cells compared to just 11% of cells with control serum [12]. It is possible that cytokine-induced apoptosis could occur in other cell types in different organs in patients with CRS1, which may contribute to both cardiac and renal dysfunction. Finally, analysis from a rat model of CRS1 revealed macrophage infiltration into the kidneys and increased numbers of activated monocytes in the peripheral blood. Interestingly, monocyte/macrophage depletion using liposome clodronate prevented chronic renal dysfunction in the rat model [14]. In summary, these data suggest inflammation contributes to CRS1 pathophysiology, but more experimental data is needed to determine if there is a causal relationship.
Oxidative Stress
Very recently, oxidative stress was proposed to play a role in CRS1. Virzi et al analyzed serum levels of markers of oxidative stress and compared ADHF patients without renal impairment to CRS1 patients. The markers of oxidative stress, which included myeloperoxidase, nitric oxide, copper/zinc superoxide dismutase, and endogenous peroxidase, were all significantly higher in CRS1 patients [13]. While provocative, the tissues responsible for the generation of these molecules and the subsequent effects have not yet been fully elucidated.

Prognostication
Severity of Acute Kidney Injury
Initial publications did not document a strong link between kidney injury and poor outcomes in ADHF. Firstly, Ather et al performed a single-centered study that investigated how change in renal function defined by change in creatinine, estimated GFR, and BUN affected outcomes one year post admission for ADHF. Kidney injury defined by a change in creatinine or in estimated GFR was not associated with increased risk of mortality, but a change in BUN was associated with increased mortality in a univariate analysis [15]. Testani et al retrospectively analyzed patients from the ESCAPE trial and found worsening renal function defined by a ≥ 20% reduction in estimated GFR was not significantly associated with 180-day mortality, but there was a trend towards higher mortality (hazard ration 1.4; P = 0.11) [16]. Importantly, neither of 2 these studies assessed how severity of AKI impacted outcomes, which may have contributed to the weak relationships observed.

Diuretic Responsiveness
![]()
Voors et al performed a retrospective analysis of diuretic responsiveness in 1161 patients from the Relaxin in Acute Heart Failure (RELAX-AHF) trial. Diuretic responsiveness was defined as weight change (kg) per diuretic dose (IV furosemide and PO furosemide) over 5 days and then patients were separated into tertiles. The lowest tertile group had an approximate 20% incidence of 60-day combined end-point of death, heart failure or renal failure readmission compared to less than 10% incidence in the middle and upper tertiles. Interestingly, when the effects of worsening renal function (WRF), defined as creatinine change of ≥ 0.3 mg/dL, were examined in patients stratified by diuretic response, WRF did not offer additional prognostic information [19].
Finally, Valenete et al analyzed diuretic response in 1745 patients from the PROTECT trial (Placebo-Controlled Randomized Study of the Selective A1-Adenosine Receptor Antagonist Rolofylline for Patients Hospitalized with Acute Decompensated Heart Failure and Volume Overload to Assess Treatment Effect on Congestion and Renal Function). Diuretic response was calculated using the weight change per 40 mg of furosemide, and as diuretic response declined there was increasing risk of 60-day rehospitalization and 180-day mortality rates. In fact, the lowest quintile responders had a 25% mortality rate at 180 days [20].
Emerging Biomarkers
Urine Neutrophil Gelatinase-Associated Lipocalin
Because previous studies showed urinary levels of NGAL was an earlier and more reliable marker of renal dysfunction than creatinine in AKI [21], it was studied as a possible biomarker for the development of CRS1 in ADHF. A single-centered study quantified levels of urine NGAL in 100 patients admitted with heart failure and then tracked the rates of acute kidney injury. Urine NGAL was elevated in patients that developed AKI and a cut-off value 12 ng/mL had a sensitivity of 79% and specificity of 67% for predicting CRS1 [22]. While promising, further studies are needed to better define the role of NGAL in CRS1.
Cystatin C
Cystatin C is a ubiquitously expressed cysteine protease that has a constant production rate and is freely filtered by the glomerulus without being secreted into the tubules, and has effectively prognosticated outcomes in ADHF [23]. Lassus et al showed an adjusted hazard ratio of 3.2 (2.0–5.3) for 12-month mortality when cystatin C levels were elevated. Moreover, patients with the highest tertitle of NT-proBNP and cystatin C had a 48.7% 1-year mortality. Interestingly, patients with an elevated cystatin C but normal creatinine had a 40.6% 1-year mortality compared to 12.6% for those with normal cystatin C and creatinine [24]. Furthermore, Arimoto et al showed elevated cystatin C predicted death or rehospitalization in a small cohort of ADHF patients in Japan [25]. Also, Naruse et al showed cystatin C was a better predictor of cardiac death than estimated GFR by the Modification of Diet in Renal Disease Study (MDRD) equation [26]. Finally, Manzano-Fernandez et al showed the highest tertile of cystatin C was a significant independent risk factor for 2-year death or rehospitalization while creatinine and MDRD estimates of GFR were not [27]. In agreement with Lassus et al, elevations in either 2 or 3 of cystatin C, troponin, and NT-proBNP predicted death or rehospitalization when compared to those with normal levels of these 3 markers [27]. In conclusion, cystatin C either alone or in combination with other biomarkers identifies high-risk patients.
Kidney Injury Molecule 1
Kidney injury molecule 1 (KIM-1) is a type-1 cell membrane glycoprotein expressed in regenerating proximal tubular cells but not under normal conditions [28]. Although associated with increased risk of hospitalization and mortality in chronic heart failure [29,30], elevated levels of urinary KIM-1 did not predict mortality in ADHF [31]. Further studies are needed to elucidate the utility of KIM-1 in CRS1.
Treatment Approaches
Diuretics
Loop diuretics are the main treatment for decongestion of patients with CRS1. To date, no clinical trial has compared the different loop diuretics (furosemide, bumetanide, torsemide, or ethacrynic acid) to each other, so there is no clear choice of which loop diuretic is the best. However, dosing scheme was investigated in the Dose Optimization Strategies Evaluation (DOSE) trial. In this trial, 308 patients were randomized in a 1:1:1:1 design in which patients were placed in groups with low-dose (equivalent to oral dose) or high-dose (2.5 times oral dose) intermittent parental therapy or alternatively low-dose or high-dose continuous drip therapy. There were no differences in dyspnea, fluid changes, change in creatinine, hospital length stay, or rehospitalization and death rates when the intermittent and drip approaches were compared. However, the high-dose arm had decreased dyspnea, increased volume removal, but there were more occurrences of AKIs when compared to the low-dose arm [32].
In clinical practice, if loop diuretic treatment does not result in the desired urine output, a second-site diuretic may be added to potentiate diuresis. Unfortunately, there is little data on this common clinical practice and thus the optimal choice of second site agent (chlorthiazide or metolazone) is unknown. Frequently, the deciding factor is based upon cost or concern that oral absorption of metolazone will be ineffective. However, Moranville et al recently performed a retrospective assessment comparing chlorthiazide (22 patients) to metolazone (33 patients) in ADHF patients with renal dysfunction defined by a creatinine clearance of 15–50 mL/min. There was a nonsignificant trend towards increased urine output in the metolazone group, no differences in the rates of adverse events, and the chlorthiazide group actually had a longer hospital stay [33]. While potentially promising results, the retrospective nature of the study made it difficult to determine if the differences were due to treatment approach or dissimilarities of patient illness. Nonetheless, physicians must remain vigilant when implementing the second-site diuretic approach because it can lead to marked diuretic response leading to metabolic derangements including hypokalemia, hyponatremia, hypomagnesaemia, and metabolic alkalosis.
Inotropes
The use of inotropic agents such as dobutamine or milrinone can be used to augment cardiac function when there is a known low-output state for better renal perfusion in CRS1. Unfortunately, there is little objective data available about the utility of this widely implemented approach. The Outcomes of a Prospective Trial of Intravenous Milrinone for Exacerbations of a Chronic Heart Failure (OPTIME-HF) trial did not show improved renal function with milrinone treatment [34]. The use of levosimendan, a cardiac calcium sensitizer that increases contractility not currently approved in the United States, was compared to dobutamine in the Survival of Patients With Acute Heart Failure in Need of Intravenous Inotropic Support (SURVIVE) trial, and there were no differences in rates of renal failure when the 2 groups were compared [35]. Nonetheless, if cardiac output is severely compromised, inotropes can be used for CRS1 treatment, but they should be used cautiously due the increased risks of lethal arrhythmias.
Dopamine
Use of low-dose dopamine to stimulate D1 and D2 receptors as a way to increase renal blood flow and promote increased glomerular filtration and urine production was extensively studied in ADHF. A small trial showed use of low dose dopamine had renal protective effects in a total of 20 patients [36]. However, when larger trials were conducted, such beneficial results were not consistently observed. The Dopamine in Acute Decompensated Heart Failure (DAD-HF I) trial compared low-dose furosemide plus low-dose dopamine (5 µg/kg/min) to high-dose furosemide alone in 60 patients. There were no differences in total diuresis, hospital stay, and 60-day mortality or rehospitalization rates, but there was a reduction in the renal dysfunction at the 24-hour time point in the dopamine-treated arm (6.7% versus 30%) [37]. The Dopamine in Acute Decompensated Heart Failure II trial randomized 161 ADHF patients to high-dose furosemide, low-dose furosemide and lose dose dopamine (5 µg/kg/min), or low-dose furosemide and assessed dyspnea, worsening renal function, length of stay, 60-day and one-year all-cause mortality and hospitalization for heart failure. Dopamine treatment did not improve any of the outcomes measured [38]. Finally, the most recent trial to examine the effects of dopamine was the Renal Optimization Strategies Evaluation (ROSE) trial. In this trial, there were 360 patients with ADHF randomized to nesiritide or dopamine versus placebo in a 2:1 design. When comparing dopamine (111 patients) treatment to placebo (115 patients), there were no differences in urine output, renal function as determined by cystatin C levels, or symptomatic improvements. However, there was more tachycardia in the dopamine group [39]. Currently, there is not strong evidence supporting routine use of dopamine in CRS1.
Nesiritide
Use of nesiritide, recombinant brain natriuretic peptide, was also investigated as a way to enhance urine production through the natriuretic effects of the peptide. The first attempt to explore this hypothesis was the B-Type Natriuretic Peptide in Cardiorenal Decompensation Syndrome (BNP-CARDS) trial. BNP-CARDS showed a 48-hour infusion of nesiritide (39 patients) or placebo (36 patients) in patients with ADHF and renal dysfunction (estimated GFR between 15–60 mL/min) did not reduce the incidence of worsening renal function as defined by a rise in serum creatinine by 20% [40]. A similar approach was implemented in the Acute Study of Clinical Effectiveness of Nesiritide in Decompensated Heart Failure (ASCEND-HF) trial which examined over 7000 patients with ADHF. 3496 patients were treated with nesiritide and 3511 patients were treated with placebo for 24 hours and up to 7 days. Nesiritide treatment did not alter dyspnea at 6 and 24 hours, improve renal function as determined by creatinine change, or alter the combined end-point of rehospitalization or death 30 at days [41]. The ROSE trial examined the effects of nesiritide (117 patients) versus placebo (115 patients) for urine production, change in renal function as defined by change in cystatin C, and decongestion (urinary sodium excretion, weight change, and change in NT-proBNP) at 72 hours. Nesiritide did not alter any of the outcomes investigated [39]. Finally, a single-centered study conducted at the Mayo Clinic examined the effects of nesiritide (37 patients) or placebo (35 patients) with ADHF and pre-existing renal dysfunction (estimated GFR between 20 and 60 mL/min). These investigators found nesiritide treatment resulted in less renal dysfunction as measured by creatinine and BUN, but no changes in diuretic responsiveness, duration of hospitalization, or rehospitalization rates. Nesiritide did reduce serum endothelin levels, but had no effect on ANP, NT-pro BNP, renin, angiotensin II, or aldosterone [42]. In summary, nesiritide does not appear to have significant renal protective effects in ADHF.
Adenosine A1 Receptor Antagonists
The use of adenosine receptor antagonists to prevent adenosine-mediated vasoconstriction of renal vasculature in ADHF has also been examined. The first study conducted was a small double-blind randomized-controlled trial that investigated the effects of rolofylline, an adenosine A-1 antagonist, in patients with ADHF and an estimated creatinine clearance of 20-80 mL/min. The study had 27 patients in the placebo arm, 29 patients that received 2.5 mg of rolofylline, 31 patients received 15 mg of rolofylline, 30 patients received 30 mg of rolofylline, and 29 patients received 60 mg of rolofylline, all of which was daily for up to 3 days. Rolofylline treatment increased urine output on day 1 and improved renal function on day 2 [43]. These positive results led to the Placebo-Controlled Randomized Study of Selective Adenosine A1 Receptor Antagonist Rolofylline for Patients with Acute Decompensated Heart Failure and Volume Overload to Assess Treatment Effect on Congestion and Renal Function (PROTECT) Trial. PROTECT assessed the effects of rolofylline (1356) or placebo (677) in patients with ADHF and an estimated creatinine clearance between 20 and 80 mL/min. There were no significant differences in renal function out to 14 days, but rolofylline led to more weight loss than placebo [44,45]. In a subgroup analysis of patients with severe baseline renal dysfunction (creatinine clearance of less than 30 mL/min), rolofylline reduced the combined 60-day end-point of hospitalization due to cardiovascular or renal cause and death [45]. Finally, the Effects of KW-3902 Injectable Emulsion on Heart Failure Signs and Symptoms, Diuresis, Renal Function, and Clinical Outcomes in Subjects Hospitalized with Worsening Renal Function and Heart Failure Requiring Intravenous Therapy (REACH-UP) trial probed the effects of rolofylline (36 patients) or placebo (40 patients) in patients with ADHF and renal impairment (creatinine clearance of 20-60 mL/min). Rolofylline treatment did not alter renal function, but there was a nonsignificant trend towards reduction in 60-day combined end-point of hospitalization due to renal or cardiovascular causes or death [46]. In summary, the use of rolofylline has not been conclusively associated with improved outcomes in CRS1.
Vasopressin Antagonists
The use of vasopressin antagonists to induce aquaphoresis and combat hyponatremia was studied in ADHF. Vasopressin antagonists were first investigated in the Acute and Chronic Therapeutic Impact of a Vasopressin Antagonist (ACTIV) trial. ACTIV involved 3 doses of tolvaptan (78 patients received 30 mg, 84 patients received 60 mg, and 77 patients received 90 mg) versus placebo (80 patients), and tolvaptan increased urine production and decreased body weight compared to placebo without compromising renal function. A post-hoc analysis of patients with renal dysfunction (BUN > 29 mg/dL) and severe volume overload revealed a survival benefit at 60 days [47]. The Efficacy of Vasopressin Antagonism in Heart Failure Outcome Study with Tolvaptan (EVERST) trial compared placebo (2061 patients) versus 30 mg/day of tolvaptan (2072 patients) within 48 hours after admission in an identical 2-trial design. Tolvaptan increased weight loss and reduced dyspnea acutely but did not alter all-cause mortality or cardiovascular or heart failure hospitalization rates out to 24 months post index hospitalization [48,49]. These data suggest vasopressin antagonists may potentiate diuresis acutely but likely do not improve long-term outcomes.
Corticosteroids
The use of corticosteroids in ADHF has been controversial as there were initial concerns that corticosteroids would increase fluid retention. However, corticosteroids augmented diuretic response and improved renal function in 13 ADHF patients who had inadequate response to sequential nephron blockage [50]. Furthermore, Zhang et al showed that prednisone treatment in 35 patients admitted with ADHF increased urinary volume, reduced dyspnea, reduced uric acid, and improved renal function [51]. These promising results led to the Cardiac Outcome Prevention Effectiveness of Glucocorticoids in Acute Decompensated Heart Failure (COPE-ADHF) trial. In this single-centered study, 102 patients with ADHF were randomized to either placebo [51] or corticosteroids [51] and the outcomes recorded included urinary volume, change in creatinine, and cardiovascular death at 30 days. Use of corticosteroids improved renal function, increased urine output, and reduced mortality (3/51 in corticosteroid group versus 10/51 in the placebo group) [52]. The mechanisms underlying the improvements with corticosteroids were not determined, but were hypothesized to be facilitation of natriuretic peptides or dilation of renal vasculature through activation of nitric oxide pathway or dopaminergic system.
Serelaxin
Serelaxin is a recombinantly expressed human relaxin-2, a peptide hormone present during pregnancy which facilitates physiological cardiovascular and renal adaptations [53–55], which showed potential benefits in CRS1. Analysis of the RELAX-AHF trial revealed serelaxin reduced incidence of worsening renal function at day 2 of treatment as defined by changes in serum creatinine, cystatin C, and BUN. Importantly, worsening renal function defined by cystatin C changes was associated with increased 180-day mortality in this analysis [56]. The mechanisms by which serelaxin prevented renal dysfunction are currently unknown as serelaxin treatment did not improve diuretic efficiency [19].
Ultrafiltration
Another treatment choice in CRS1 is mechanical removal of salt and water via ultrafiltration. Ultrafiltration showed early promise in Ultrafiltration Versus Intravenous Diuretics for Patients Hospitalized for Acute Decompensated Heart Failure trial (UNLOAD) trial. In this study, 200 patients with ADHF were randomized to either ultrafiltration or medical management with loop diuretics. Use of ultrafiltration increased volume removal without any differences in renal function and reduced rehospitalization rates at 90 days [57].
However, when ultrafiltration was employed specifically in CRS1 patients in the Cardiorenal Rescue Study in Acute Decompensated Heart Failure trial (CARESS-HF), UF was not superior to medical treatment. There were 188 patients studied in CARESS-HF, and in the ultrafiltration arm there was increased risk of renal dysfunction, no differences in volume removal, and no change in rehospitalization rates at 90 days [58]. When trying to reconcile UNLOAD and CARESS-HF, the medical treatment arm in CARESS-HF was much more standardized and aggressive and UNLOAD was earlier implementation of ultrafiltration, which may have explained the differences. Interestingly, ultrafiltration was hypothesized to be advantageous over diuretic therapy through reduced activation of the renin-angiotensin-aldosterone system, but analysis of the patients from CARESS-HF showed higher levels of plasma renin activity and no difference in aldosterone levels in ultrafiltration patients [59].
Two meta-analyses have examined the use of ultrafiltration versus medical management in ADHF and both showed ultrafiltration was more effective in volume removal than medical therapy but did not improve rehospitalization or mortality rates [60,61]. This fact combined with the risks of vascular access placement and bleeding from anticoagulation limits to routine use of ultrafiltration in CRS1.
Continuous Renal Replacement Therapy
Once renal function deteriorates to the point that renal replacement therapy is needed for both volume removal and solute clearance in CRS1, continuous renal replacement therapy (CRRT) may be implemented. Unfortunately, there are few available data for this group of advanced CRS1 patients to guide physicians. There was a single-centered study conducted in Egypt that randomized 40 ADHF patients to either IV furosemide or CRRT. The patients treated with CRRT had greater weight loss and decreased length of stay in the ICU, but there were no differences in dialysis dependence rates or 30-day mortality [62]. Two single-centered studies reported outcomes associated with advanced CRS1 requiring CRRT. In a study conducted at the Cleveland Clinic, 63 patients with CRS1 were treated with ultrafiltration, of which 37 were converted to CRRT due to worsening renal function. Of the 37 patients treated with CRRT, 16 died in the hospital and 4 were discharged with hospice care [63]. In another retrospective study performed at the University of Alabama-Birmingham, use of rescue CRRT in advanced CRS1 was examined in 37 patients. 23 patients died during hospitalization and 2 were discharged to hospice care [64]. Combination of the Cleveland Clinic and University of Alabama-Birmingham studies revealed patients requiring CRRT in the setting of advanced CRS1 had an in-hospital mortality or palliative discharge rate of 60.8% (45/74). Clearly, this population needs further investigation to prevent such poor outcomes.
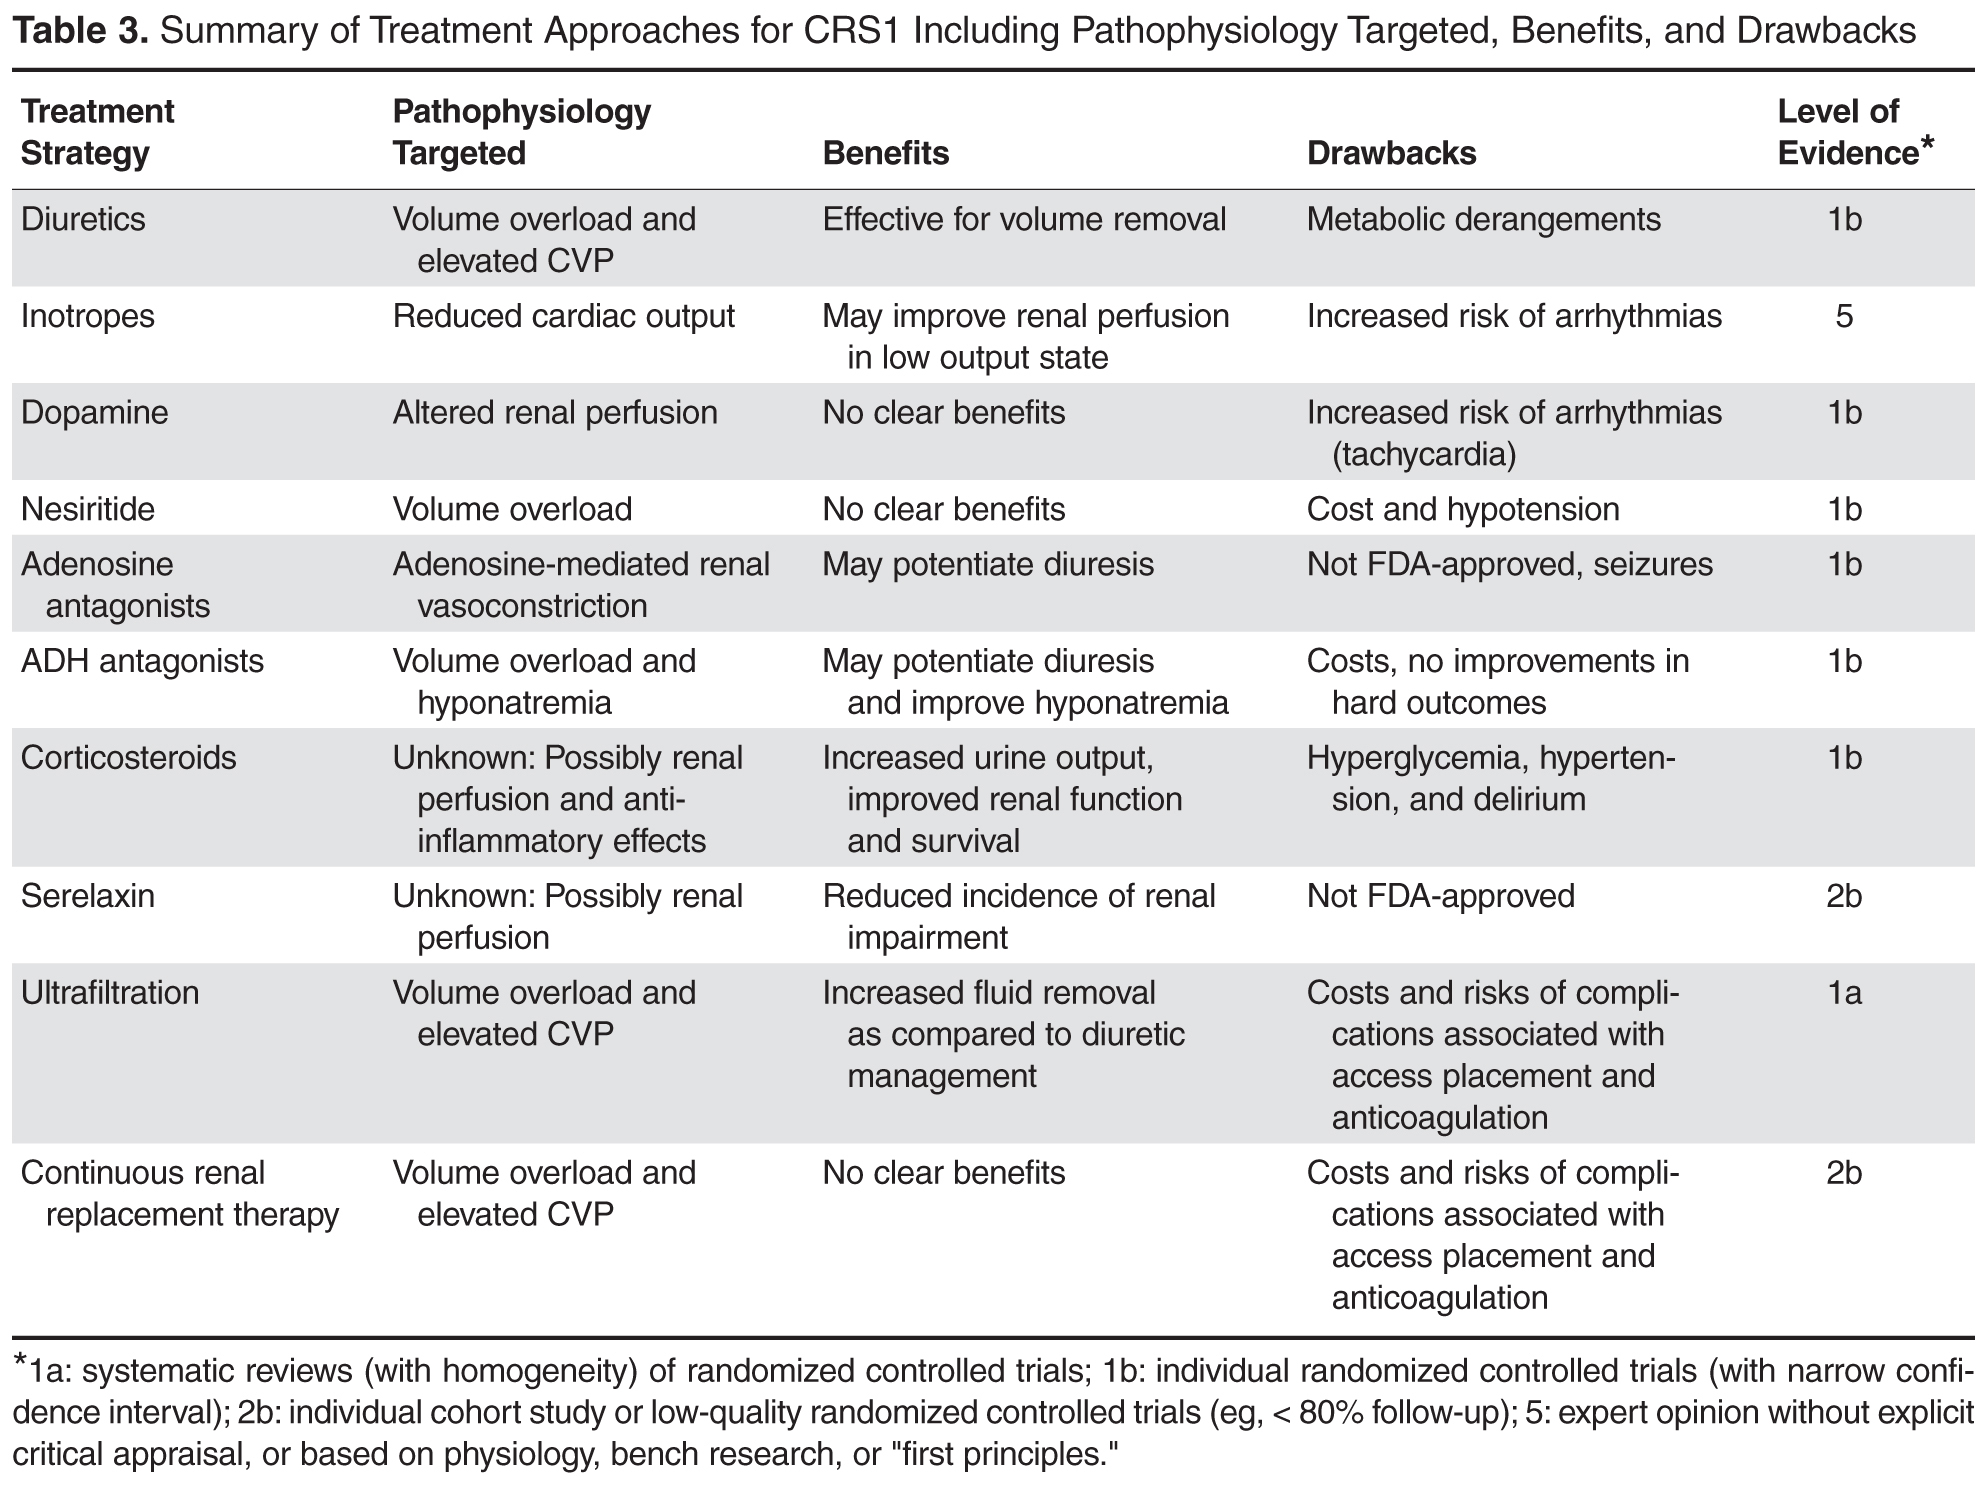
Future Treatment Options
Ongoing and Unreported Clinical Trials
Unfortunately, none of the current treatments for CRS1 have definitive improvements in outcomes, but there are several ongoing clinical trials which will hopefully identify novel treatment strategies. First of all, the Acetazolamide and Spironolactone to Increase Natriuresis in Congestive Heart Failure (Diuresis-CHF) trial is being conducted in Belgium. This study will examine the effects of acetazolamide with low dose diuretic versus high dose diuretics in one aim and the effects of upfront spironolactone in another. The outcomes analyzed will include total natriuresis, potassium homeostasis, NT-proBNP changes, change in renal function, peak serum levels of renin and aldosterone, weight change, urine volume, and change in edema (NCT01973335). The Protocolized Diuretic Strategy in Cardiorenal Failure (ProDius) trial is being performed at the University of Pittsburgh, and will determine the effects of a protocolized diuretic approach to target 3-5 liters of urine production a day versus standard therapy and will track the change in body weight, length of hospitalization, reshospitalization rates, mortality rates, venous compliance of internal jugular vein, clinical decongestion, change in renal function, and urine output (NCT01921829). The Levosimendan versus Dobutamine for Renal Function in Heart Failure (ELDOR) study is ongoing in Sweden and will probe the acute effects of levosimendan and dobutamine on renal perfusion. The endpoints will include changes in renal blood flow, GFR, renal vascular resistance, central hemodynamics, renal oxygen extraction and consumptions, and filtration fraction (NCT02133105). Finally, the Safety and Efficacy of Low Dose Hypertonic Saline and High Dose Furosemide for Congestive Heart Failure (REaCH) trial probed the effects of combination of hypertonic saline and furosemide versus furosemide in patients with ADHF and renal impairment defined by a GFR<60 mL/min. The outcomes were change in renal function, diuretic response, length of hospital stay, readmission rates, weight loss, BNP levels, and included a cost analysis. The study was completed but results are not currently available (NCT01028170)
Should Inflammation Be Targeted in CRS1?
Although proposed to play a role in the pathophysiology of CRS1, inflammation has not been explicitly targeted as a treatment for CRS1. One possible way to combat inflammation could be inhibition of the IL-6 pathway, which is support by preclinical work as previous studies showed IL-6 knockout mice were resistant to HgCl2-induced renal injury and death [65] and IL-6 has negative inotropic effects in both isolated cardiomyocytes [66] and intact animals [67]. Thus, IL-6 antagonism may improve both cardiac and renal function, an ideal scenario for CRS1 patients. The availability of tocilizumab, an FDA-approved humanized antibody to the IL-6 receptor, may allow for investigation of this hypothesis in the future. Although not examined in the COPE-ADHF trial, an alternative explanation for the improvements associated with corticosteroids treatment were the anti-inflammatory effects. If this were true, corticosteroids would represent a relatively cheap treatment option for CRS1 patients, but more studies need to be conducted before this approach is widely implemented. Finally, use of cytokine profiling may be used to enrich a population of CRS1 patients that could be investigated in future clinical trials using anti-inflammatory medications.
Unanswered Questions Moving Forward
Severity of AKI and Treatment Effects
An important unknown that warrants further investigation is if the severity of AKI should dictate treatment choice in CRS1. As discussed above, increasing severity of AKI resulted in elevated risk of adverse events, but it remains unknown whether different treatments offer benefits for more or less severe renal impairment. Perhaps, future studies aimed at defining outcomes from different treatment strategies stratified by severity of renal dysfunction may reveal which patients benefit from the various treatment options for CRS1.
How Do We Best Define Renal Dysfunction in CRS1?
Currently, there is no accepted definition of renal dysfunction in CRS1. As discussed above, using the AKIN, KDIGO, or RIFLE scoring systems or diuretic responsiveness effectively differentiated outcomes in patients with CRS1. However, an agreed-upon definition would likely benefit the field going forward so this population could be systematically investigated in future studies.
Conclusion
In summary, CRS1 is a common clinical entity associated with poor patient outcomes. A complex pathophysiology marked by reduced cardiac output, increased central venous pressure, inflammation, and oxidative stress underlies the disease process. Unfortunately, no current treatment approach shows consistent improvements in outcomes, highlighting the urgent need for further research to reduce the burden that CRS1 imposes.
Corresponding author: Kurt W. Prins, MD, PhD, MMC 580 Mayo, 420 Delaware St SE, Minneapolis, MN 55455, [email protected].
Funding/support: Dr. Prins is funded by NIH F32 grant HL129554 and Dr. Thenappen is funded by AHA Scientist Development Grant 15SDG25560048.
1. Mozaffarian D, Benjamin EJ, Go AS,et al. Heart disease and stroke statistics--2015 update: A report from the american heart association. Circulation 2015;131:e29–322.
2. Gheorghiade M, Vaduganathan M, Fonarow GC, Bonow RO. Rehospitalization for heart failure: problems and perspectives. J Am Coll Cardiol 2013;61:391–403.
3. Jencks SF, Williams MV, Coleman EA. Rehospitalizations among patients in the medicare fee-for-service program. N Engl J Med 2009;360:1418–28.
4. Fonarow GC, Adams KF Jr, Abraham WT, et al and ADHERE Scientific Advisory Committee, Study Group, and Investigators. Risk stratification for in-hospital mortality in acutely decompensated heart failure: Classification and regression tree analysis. JAMA 2005;293:572–80.
5. Abraham WT, Fonarow GC, Albert NM, et al. Predictors of in-hospital mortality in patients hospitalized for heart failure: Insights from the organized program to initiate lifesaving treatment in hospitalized patients with heart failure (OPTIMIZE-HF). J Am Coll Cardiol 2008;52:347–56.
6. Ronco C, Haapio M, House AA, et al. Cardiorenal syndrome. J Am Coll Cardiol 2008:52:1527–39.
7. Roy AK, Mc Gorrian C, Treacy C, et al. A comparison of traditional and novel definitions (RIFLE, AKIN, and KDIGO) of acute kidney injury for the prediction of outcomes in acute decompensated heart failure. Cardiorenal Med 2013;3:26–37.
8. Li Z, Cai L, Liang X, et al. Identification and predicting short-term prognosis of early cardiorenal syndrome type 1: KDIGO is superior to RIFLE or AKIN. PLoS One 2014;9:e114369.
9. Mullens W, Abrahams Z, Francis GS, et al. Importance of venous congestion for worsening of renal function in advanced decompensated heart failure. J Am Coll Cardiol 2009:53:589–96.
10. Nohria A, Hasselblad V, Stebbins A, et al. Cardiorenal interactions: Insights from the ESCAPE trial. J Am Coll Cardiol 2008:51:1268–74.
11. Winton FR. The influence of venous pressure on the isolated mammalian kidney. J Physiol 1931;72:49–61.
12. Virzi GM, Torregrossa R, Cruz DN, et al. Cardiorenal syndrome type 1 may be immunologically mediated: A pilot evaluation of monocyte apoptosis. Cardiorenal Med 2012;2:33–42.
13. Virzi GM, Clementi A, de Cal M, et al. Oxidative stress: Dual pathway induction in cardiorenal syndrome type 1 pathogenesis. Oxid Med Cell Longev 2015;391790.
14. Cho E, Kim M, Ko YS, et al. Role of inflammation in the pathogenesis of cardiorenal syndrome in a rat myocardial infarction model. Nephrol Dial Transplant 2013;28:2766–78.
15. Ather S, Bavishi C, McCauley MD, et al. Worsening renal function is not associated with response to treatment in acute heart failure. Int J Cardiol 2013;167:1912–7.
16. Testani JM, McCauley BD, Kimmel SE, Shannon RP. Characteristics of patients with improvement or worsening in renal function during treatment of acute decompensated heart failure. Am J Cardiol 2010;106:1763–69.
17. Hata N, Yokoyama S, Shinada T, et al. Acute kidney injury and outcomes in acute decompensated heart failure: Evaluation of the RIFLE criteria in an acutely ill heart failure population. Eur J Heart Fail 2010;12:32–7.
18. Testani JM, Brisco MA, Turner JM, et al. Loop diuretic efficiency: A metric of diuretic responsiveness with prognostic importance in acute decompensated heart failure. Circ Heart Fail 2014;7:261–70.
19. Voors AA, Davison BA, Teerlink JR, et al. Diuretic response in patients with acute decompensated heart failure: Characteristics and clinical outcome--an analysis from RELAX-AHF. Eur J Heart Fail 2014;16:1230–40.
20. Valente MA, Voors AA, Damman K, et al. Diuretic response in acute heart failure: Clinical characteristics and prognostic significance. Eur Heart J 2014;35:1284–93.
21. Devarajan P. Neutrophil gelatinase-associated lipocalin: A troponin-like biomarker for human acute kidney injury. Nephrology (Carlton) 2010;15:419–28.
22. Soyler C, Tanriover MD, Ascioglu S, et al. Urine neutrophil gelatinase-associated lipocalin levels predict acute kidney injury in acute decompensated heart failure patients. Ren Fail 2015;5.
23. Brisco MA,Testani JM. Novel renal biomarkers to assess cardiorenal syndrome. Curr Heart Fail Rep 2014;11;485–99.
24. Lassus J, Harjola VP, Sund R, et al. and FINN-AKVA Study group. Prognostic value of cystatin C in acute heart failure in relation to other markers of renal function and NT-proBNP. Eur Heart J 2007;28:1841–7.
25. Arimoto T, Takeishi Y, Niizeki T, et al. Cystatin C, a novel measure of renal function, is an independent predictor of cardiac events in patients with heart failure. J Card Fail 2005;11:595–601.
26. Naruse H, Ishii J, Kawai T, et al. Cystatin C in acute heart failure without advanced renal impairment. Am J Med 2009;122:566–73.
27. Manzano-Fernandez S, Boronat-Garcia M, Albaladejo-Oton MD, et al. Complementary prognostic value of cystatin C, N-terminal pro-B-type natriuretic peptide and cardiac troponin T in patients with acute heart failure. Am J Cardiol 2009;103:1753–9.
28. Bonventre JV, Yang L. Kidney injury molecule-1. Curr Opin Crit Care 2010;16:556–61.
29. Damman K, Van Veldhuisen DJ, Navis G, et al. Tubular damage in chronic systolic heart failure is associated with reduced survival independent of glomerular filtration rate. Heart 2010;96:1297–302.
30. Jungbauer CG, Birner C, Jung B, et al. Kidney injury molecule-1 and N-acetyl-beta-D-glucosaminidase in chronic heart failure: Possible biomarkers of cardiorenal syndrome. Eur J Heart Fail 2011;13:1104–10.
31. Verbrugge FH, Dupont M, Shao Z, et al. Novel urinary biomarkers in detecting acute kidney injury, persistent renal impairment, and all-cause mortality following decongestive therapy in acute decompensated heart failure. J Card Fail 2013;19:621–8.
32. Felker GM, Lee KL, Bull DA, et al. Diuretic strategies in patients with acute decompensated heart failure. N Engl J Med 2011;364:797–805.
33. Moranville MP, Choi S, Hogg J, et al. Comparison of metolazone versus chlorothiazide in acute decompensated heart failure with diuretic resistance. Cardiovasc Ther 2015;33;42–9.
34. Cuffe MS, Califf RM, Adams KF Jr, et al. Short-term intravenous milrinone for acute exacerbation of chronic heart failure: A randomized controlled trial. JAMA 2002;287:1541–7.
35. Mebazaa A, Nieminen MS, Packer M, et al. Levosimendan vs dobutamine for patients with acute decompensated heart failure: The SURVIVE randomized trial. JAMA 2007;297:1883–91.
36. Varriale P, Mossavi A. The benefit of low-dose dopamine during vigorous diuresis for congestive heart failure associated with renal insufficiency: Does it protect renal function? Clin Cardiol 1997;20:627–30.
37. Giamouzis G, Butler J, Starling RC, et al. Impact of dopamine infusion on renal function in hospitalized heart failure patients: Results of the dopamine in acute decompensated heart failure (DAD-HF) trial. J Card Fail 2010;16:922–30.
38. Triposkiadis FK, Butler J, Karayannis G, et al. Efficacy and safety of high dose versus low dose furosemide with or without dopamine infusion: The dopamine in acute decompensated heart failure II (DAD-HF II) trial. Int J Cardiol 2014;172:115–21.
39. Chen HH, Anstrom KJ, Givertz MM, et al. Low-dose dopamine or low-dose nesiritide in acute heart failure with renal dysfunction: The ROSE acute heart failure randomized trial. JAMA 2013;310:2533–43.
40. Witteles RM, Kao D, Christopherson D, et al. Impact of nesiritide on renal function in patients with acute decompensated heart failure and pre-existing renal dysfunction a randomized, double-blind, placebo-controlled clinical trial. J Am Coll Cardiol 2007;50:1835–40.
41 O'Connor CM, Starling RC, Hernandez AF, et al. Effect of nesiritide in patients with acute decompensated heart failure. N Engl J Med 2011;365:32–43.
42. Owan TE, Chen HH, Frantz RP, et al. The effects of nesiritide on renal function and diuretic responsiveness in acutely decompensated heart failure patients with renal dysfunction. J Card Fail 2008;14:267–75.
43. Givertz MM, Massie BM, Fields TK, et al and CKI-201 and CKI-202 Investigators. The effects of KW-3902, an adenosine A1-receptor antagonist,on diuresis and renal function in patients with acute decompensated heart failure and renal impairment or diuretic resistance. J Am Coll Cardiol 2007;50:1551–60.
44. Massie BM, O'Connor CM, Metra M, et al. Rolofylline, an adenosine A1-receptor antagonist, in acute heart failure. N Engl J Med 2010;363:1419–28.
45. Voors AA, Dittrich HC, Massie BM, et al. Effects of the adenosine A1 receptor antagonist rolofylline on renal function in patients with acute heart failure and renal dysfunction: Results from PROTECT (placebo-controlled randomized study of the selective adenosine A1 receptor antagonist rolofylline for patients hospitalized with acute decompensated heart failure and volume overload to assess treatment effect on congestion and renal function). J Am Coll Cardiol 2011;57:1899–907.
46. Gottlieb SS, Givertz MM, Metra M, et al. The effects of adenosine A(1) receptor antagonism in patients with acute decompensated heart failure and worsening renal function: The REACH UP study. J Card Fail 2010;16:714–9.
47. Gheorghiade M, Gattis WA, O'Connor CM, et al. Effects of tolvaptan, a vasopressin antagonist, in patients hospitalized with worsening heart failure: A randomized controlled trial. JAMA 2004;291:1963–71.
48. Gheorghiade M, Konstam MA, Burnett JC Jr, et al. Short-term clinical effects of tolvaptan, an oral vasopressin antagonist, in patients hospitalized for heart failure: The EVEREST clinical status trials. JAMA 2007;297:1332–43.
49. Konstam MA, Gheorghiade M, Burnett JC Jr, et al. Effects of oral tolvaptan in patients hospitalized for worsening heart failure: The EVEREST outcome trial. JAMA 2007;297:1319–31.
50. Liu C, Liu G, Zhou C, et al. Potent diuretic effects of prednisone in heart failure patients with refractory diuretic resistance. Can J Cardiol 2007;23:865–8.
51. Zhang H, Liu C, Ji Z, et al. Prednisone adding to usual care treatment for refractory decompensated congestive heart failure. Int Heart J 2008;49:587–95.
52. Liu C, Liu K and COPE-ADHF Study Group. Cardiac outcome prevention effectiveness of glucocorticoids in acute decompensated heart failure: COPE-ADHF study. J Cardiovasc Pharmacol 2014;63:333–8.
53. Teichman SL, Unemori E, Teerlink JR, et al. Relaxin: Review of biology and potential role in treating heart failure. Curr Heart Fail Rep 2010;7:75–82.
54. Conrad KP, Shroff SG. Effects of relaxin on arterial dilation, remodeling, and mechanical properties. Curr Hypertens Rep 2011;13:409–20.
55. Du XJ, Bathgate RA, Samuel CS, et al. Cardiovascular effects of relaxin: From basic science to clinical therapy. Nat Rev Cardiol 2010;7:48–58.
56. Metra M, Cotter G, Davison BA, et al. Effect of serelaxin on cardiac, renal, and hepatic biomarkers in the relaxin in acute heart failure (RELAX-AHF) development program: Correlation with outcomes. J Am Coll Cardiol 2013;61:196-206.
57. Costanzo MR, Guglin ME, Saltzberg MT, et al. Ultrafiltration versus intravenous diuretics for patients hospitalized for acute decompensated heart failure. J Am Coll Cardiol 2007;49:675–83.
58. Bart BA, Goldsmith SR, Lee KL, et al. Ultrafiltration in decompensated heart failure with cardiorenal syndrome. N Engl J Med 2012;367:2296–304.
59. Mentz RJ, Stevens SR, DeVore AD, et al. Decongestion strategies and renin-angiotensin-aldosterone system activation in acute heart failure. JACC Heart Fail 2015;3:97–107.
60. Ebrahim B, Sindhura K, Okoroh J, et al. Meta-analysis of ultrafiltration versus diuretics treatment option for overload volume reduction in patients with acute decompensated heart failure. Arq Bras Cardiol 2015;104:417–25.
61. Kwong JS, Yu CM. Ultrafiltration for acute decompensated heart failure: A systematic review and meta-analysis of randomized controlled trials. Int J Cardiol 2014;172:395–402.
62. Badawy SS, Fahmy A. Efficacy and cardiovascular tolerability of continuous veno-venous hemodiafiltration in acute decompensated heart failure: A randomized comparative study. J Crit Care 2012;27:106.e7-106.13.
63. Patarroyo M, Wehbe E, Hanna M, et al. Cardiorenal outcomes after slow continuous ultrafiltration therapy in refractory patients with advanced decompensated heart failure. J Am Coll Cardiol 2012;60:1906–12.
64. Prins KW, Wille KM, Tallaj JA, Tolwani AJ. Assessing continuous renal replacement therapy as a rescue strategy in cardiorenal syndrome 1. Clin Kidney J 2015;8:87–92.
65. Nechemia-Arbely Y, Barkan D, Pizov G, et al. IL-6/IL-6R axis plays a critical role in acute kidney injury. J Am Soc Nephrol 2008;19:1106–15.
66. Pathan N, Franklin JL, Eleftherohorinou H, et al. Myocardial depressant effects of interleukin 6 in meningococcal sepsis are regulated by p38 mitogen-activated protein kinase. Crit Care Med 2011;39:1692–711.
67. Janssen SP, Gayan-Ramirez G, Van den Bergh A, et al. Interleukin-6 causes myocardial failure and skeletal muscle atrophy in rats. Circulation 2005;111:996–1005.
68. Bellomo R, Ronco C, Kellum JA and Acute Dialysis Quality Initiative workgroup. Acute renal failure - definition, outcome measures, animal models, fluid therapy and information technology needs: The second international consensus conference of the acute dialysis quality initiative (ADQI) group. Crit Care 2004;8:R204-12.
69. Mehta RL, Kellum JA, Shah SV, et al and Acute Kidney Injury Network. Acute kidney injury network: Report of an initiative to improve outcomes in acute kidney injury. Crit Care 2007;11:R31.
70. Kidney Disease: Improving Global Outcomes (KDIGO) Acute Kidney Injury Work Group. KDIGO clinical practice guidelines for acute kidney injury. Kidney Inter Suppl 2012;2:19–36.
From the Cardiovascular Division, Department of Internal Medicine, University of Minnesota, Minneapolis, MN.
Abstract
- Objective: To present a review of cardiorenal syndrome type 1 (CRS1).
- Methods: Review of the literature.
- Results: Acute kidney injury occurs in approximately one-third of patients with acute decompensated heart failure (ADHF) and the resultant condition was named CRS1. A growing body of literature shows CRS1 patients are at high risk for poor outcomes, and thus there is an urgent need to understand the pathophysiology and subsequently develop effective treatments. In this review we discuss prevalence, proposed pathophysiology including hemodynamic and nonhemodynamic factors, prognosticating variables, data for different treatment strategies, and ongoing clinical trials and highlight questions and problems physicians will face moving forward with this common and challenging condition.
- Conclusion: Further research is needed to understand the pathophysiology of this complex clinical entity and to develop effective treatments.
Acute decompensated heart failure (ADHF) is an epidemic facing physicians throughout the world. In the United States alone, ADHF accounts for over 1 million hospitalizations annually, with costs in 2012 reaching $30.7 billion [1]. Despite the advances in chronic heart failure management, ADHF continues to be associated with poor outcomes as exemplified by 30-day readmission rates of over 20% and in-hospital mortality rates of 5% to 6%, both of which have not significantly improved over the past 20 years [2,3]. One of the strongest predictors of adverse outcomes in ADHF is renal dysfunction. An analysis from the Acute Decompensated Heart Failure National Registry (ADHERE) revealed the combination of renal dysfunction (creatinine > 2.75 mg/dL and blood urea nitrogen (BUN) > 43 mg/dL) and hypotension (systolic blood pressure (SBP) < 115 mm Hg) upon admission was associated with an in-hospital mortality of > 20% [4]. The Organized Program to Initiate Lifesaving Treatment in Hospitalized Patients with Heart Failure (OPTIMIZE-HF) registry documented a 16.3% in-hospital mortality when patients had a SBP < 100 mm Hg and creatinine > 2.0 mg/dL at admission [5].
The presence of acute kidney injury in the setting of ADHF is a very common occurrence and was termed cardiorenal syndrome type 1 (CRS1) [6]. The prevalence of CRS1 in single-centered studies ranged from 32% to 40% of all ADHF admissions [7,8]. If this estimate holds true throughout the United States, there would be 320,000 to 400,000 hospitalizations for CRS1 annually, highlighting the magnitude of this problem. Moreover, with the number of patients with heart failure expected to continue to rise, CRS1 will only become more prevalent in the future. In this review we discuss the prevalence, proposed pathophysiology including hemodynamic and nonhemodynamic factors, prognosticating variables, data for different treatment strategies, ongoing clinical trials, and highlight questions and problems physicians will face moving forward in this common and challenging condition.
Pathogenesis of CRS1
Hemodynamic Effects
The early hypothesis for renal dysfunction in ADHF centered on hemodynamics, as reduced cardiac output was believed to decrease renal perfusion. However, analysis of invasive hemodynamics from patients with ADHF suggested that central venous pressure (CVP) was actually a better predictor of the development of CRS1 than cardiac output. In a single-center study conducted at the Cleveland Clinic, hemodynamics from 145 patients with ADHF were evaluated and surprisingly baseline cardiac index was greater in the patients with CRS1 than patients without renal dysfunction (2.0 ± 0.8 L/min/m2 vs 1.8 ± 0.4 L/min/m2; P = 0.008). However, baseline CVP was higher in the CRS1 group (18 ± 7 mm Hg vs 12 ± 6 mm Hg; P = 0.001), and there was a heightened risk of developing CRS1 as CVP increased. In fact, 75% of the patients with a CVP of > 24 mm Hg developed renal impairment [9]. In a retrospective study of the Evaluation Study of Congestive Heart Failure and Pulmonary Arterial Catheter Effectiveness (ESCAPE) trial, the only hemodynamic parameter that correlated with baseline creatinine was CVP. However, no invasive measures predicted worsening renal function during hospitalization [10]. Finally, an experiment that used isolated canine kidneys showed increased venous pressure acutely reduced urine production. Interestingly, this relationship was dependent on arterial pressure; as arterial flow decreased smaller increases in CVP were needed to reduce urine output [11]. Together, these data suggest increased CVP plays an important role in CRS1, but imply hemodynamics alone may not fully explain the pathophysiology of CRS1.
Inflammation
As information about how hemodynamics incompletely predict renal dysfunction in ADHF became available, alternative hypotheses were investigated to gain a deeper understanding of the pathophysiology underlying CRS1. A pathological role of inflammation in CRS1 has gained attention due to recent publications. First of all, serum levels of the pro-inflammatory cytokines TNF-a and IL-6 were elevated in patients with CRS1 when compared to health controls [12]. Interestingly, Virzi et al showed that the median value of IL-6 was 5 times higher in CRS1 patients when compared to ADHF patients without renal dysfunction [13]. The negative consequences of elevated serum cytokines were demonstrated when incubation of a human cell line of monocytes with serum from CRS1 patients induced apoptosis in 81% of cells compared to just 11% of cells with control serum [12]. It is possible that cytokine-induced apoptosis could occur in other cell types in different organs in patients with CRS1, which may contribute to both cardiac and renal dysfunction. Finally, analysis from a rat model of CRS1 revealed macrophage infiltration into the kidneys and increased numbers of activated monocytes in the peripheral blood. Interestingly, monocyte/macrophage depletion using liposome clodronate prevented chronic renal dysfunction in the rat model [14]. In summary, these data suggest inflammation contributes to CRS1 pathophysiology, but more experimental data is needed to determine if there is a causal relationship.
Oxidative Stress
Very recently, oxidative stress was proposed to play a role in CRS1. Virzi et al analyzed serum levels of markers of oxidative stress and compared ADHF patients without renal impairment to CRS1 patients. The markers of oxidative stress, which included myeloperoxidase, nitric oxide, copper/zinc superoxide dismutase, and endogenous peroxidase, were all significantly higher in CRS1 patients [13]. While provocative, the tissues responsible for the generation of these molecules and the subsequent effects have not yet been fully elucidated.
Prognostication
Severity of Acute Kidney Injury
Initial publications did not document a strong link between kidney injury and poor outcomes in ADHF. Firstly, Ather et al performed a single-centered study that investigated how change in renal function defined by change in creatinine, estimated GFR, and BUN affected outcomes one year post admission for ADHF. Kidney injury defined by a change in creatinine or in estimated GFR was not associated with increased risk of mortality, but a change in BUN was associated with increased mortality in a univariate analysis [15]. Testani et al retrospectively analyzed patients from the ESCAPE trial and found worsening renal function defined by a ≥ 20% reduction in estimated GFR was not significantly associated with 180-day mortality, but there was a trend towards higher mortality (hazard ration 1.4; P = 0.11) [16]. Importantly, neither of 2 these studies assessed how severity of AKI impacted outcomes, which may have contributed to the weak relationships observed.
Diuretic Responsiveness
![]()
Voors et al performed a retrospective analysis of diuretic responsiveness in 1161 patients from the Relaxin in Acute Heart Failure (RELAX-AHF) trial. Diuretic responsiveness was defined as weight change (kg) per diuretic dose (IV furosemide and PO furosemide) over 5 days and then patients were separated into tertiles. The lowest tertile group had an approximate 20% incidence of 60-day combined end-point of death, heart failure or renal failure readmission compared to less than 10% incidence in the middle and upper tertiles. Interestingly, when the effects of worsening renal function (WRF), defined as creatinine change of ≥ 0.3 mg/dL, were examined in patients stratified by diuretic response, WRF did not offer additional prognostic information [19].
Finally, Valenete et al analyzed diuretic response in 1745 patients from the PROTECT trial (Placebo-Controlled Randomized Study of the Selective A1-Adenosine Receptor Antagonist Rolofylline for Patients Hospitalized with Acute Decompensated Heart Failure and Volume Overload to Assess Treatment Effect on Congestion and Renal Function). Diuretic response was calculated using the weight change per 40 mg of furosemide, and as diuretic response declined there was increasing risk of 60-day rehospitalization and 180-day mortality rates. In fact, the lowest quintile responders had a 25% mortality rate at 180 days [20].
Emerging Biomarkers
Urine Neutrophil Gelatinase-Associated Lipocalin
Because previous studies showed urinary levels of NGAL was an earlier and more reliable marker of renal dysfunction than creatinine in AKI [21], it was studied as a possible biomarker for the development of CRS1 in ADHF. A single-centered study quantified levels of urine NGAL in 100 patients admitted with heart failure and then tracked the rates of acute kidney injury. Urine NGAL was elevated in patients that developed AKI and a cut-off value 12 ng/mL had a sensitivity of 79% and specificity of 67% for predicting CRS1 [22]. While promising, further studies are needed to better define the role of NGAL in CRS1.
Cystatin C
Cystatin C is a ubiquitously expressed cysteine protease that has a constant production rate and is freely filtered by the glomerulus without being secreted into the tubules, and has effectively prognosticated outcomes in ADHF [23]. Lassus et al showed an adjusted hazard ratio of 3.2 (2.0–5.3) for 12-month mortality when cystatin C levels were elevated. Moreover, patients with the highest tertitle of NT-proBNP and cystatin C had a 48.7% 1-year mortality. Interestingly, patients with an elevated cystatin C but normal creatinine had a 40.6% 1-year mortality compared to 12.6% for those with normal cystatin C and creatinine [24]. Furthermore, Arimoto et al showed elevated cystatin C predicted death or rehospitalization in a small cohort of ADHF patients in Japan [25]. Also, Naruse et al showed cystatin C was a better predictor of cardiac death than estimated GFR by the Modification of Diet in Renal Disease Study (MDRD) equation [26]. Finally, Manzano-Fernandez et al showed the highest tertile of cystatin C was a significant independent risk factor for 2-year death or rehospitalization while creatinine and MDRD estimates of GFR were not [27]. In agreement with Lassus et al, elevations in either 2 or 3 of cystatin C, troponin, and NT-proBNP predicted death or rehospitalization when compared to those with normal levels of these 3 markers [27]. In conclusion, cystatin C either alone or in combination with other biomarkers identifies high-risk patients.
Kidney Injury Molecule 1
Kidney injury molecule 1 (KIM-1) is a type-1 cell membrane glycoprotein expressed in regenerating proximal tubular cells but not under normal conditions [28]. Although associated with increased risk of hospitalization and mortality in chronic heart failure [29,30], elevated levels of urinary KIM-1 did not predict mortality in ADHF [31]. Further studies are needed to elucidate the utility of KIM-1 in CRS1.
Treatment Approaches
Diuretics
Loop diuretics are the main treatment for decongestion of patients with CRS1. To date, no clinical trial has compared the different loop diuretics (furosemide, bumetanide, torsemide, or ethacrynic acid) to each other, so there is no clear choice of which loop diuretic is the best. However, dosing scheme was investigated in the Dose Optimization Strategies Evaluation (DOSE) trial. In this trial, 308 patients were randomized in a 1:1:1:1 design in which patients were placed in groups with low-dose (equivalent to oral dose) or high-dose (2.5 times oral dose) intermittent parental therapy or alternatively low-dose or high-dose continuous drip therapy. There were no differences in dyspnea, fluid changes, change in creatinine, hospital length stay, or rehospitalization and death rates when the intermittent and drip approaches were compared. However, the high-dose arm had decreased dyspnea, increased volume removal, but there were more occurrences of AKIs when compared to the low-dose arm [32].
In clinical practice, if loop diuretic treatment does not result in the desired urine output, a second-site diuretic may be added to potentiate diuresis. Unfortunately, there is little data on this common clinical practice and thus the optimal choice of second site agent (chlorthiazide or metolazone) is unknown. Frequently, the deciding factor is based upon cost or concern that oral absorption of metolazone will be ineffective. However, Moranville et al recently performed a retrospective assessment comparing chlorthiazide (22 patients) to metolazone (33 patients) in ADHF patients with renal dysfunction defined by a creatinine clearance of 15–50 mL/min. There was a nonsignificant trend towards increased urine output in the metolazone group, no differences in the rates of adverse events, and the chlorthiazide group actually had a longer hospital stay [33]. While potentially promising results, the retrospective nature of the study made it difficult to determine if the differences were due to treatment approach or dissimilarities of patient illness. Nonetheless, physicians must remain vigilant when implementing the second-site diuretic approach because it can lead to marked diuretic response leading to metabolic derangements including hypokalemia, hyponatremia, hypomagnesaemia, and metabolic alkalosis.
Inotropes
The use of inotropic agents such as dobutamine or milrinone can be used to augment cardiac function when there is a known low-output state for better renal perfusion in CRS1. Unfortunately, there is little objective data available about the utility of this widely implemented approach. The Outcomes of a Prospective Trial of Intravenous Milrinone for Exacerbations of a Chronic Heart Failure (OPTIME-HF) trial did not show improved renal function with milrinone treatment [34]. The use of levosimendan, a cardiac calcium sensitizer that increases contractility not currently approved in the United States, was compared to dobutamine in the Survival of Patients With Acute Heart Failure in Need of Intravenous Inotropic Support (SURVIVE) trial, and there were no differences in rates of renal failure when the 2 groups were compared [35]. Nonetheless, if cardiac output is severely compromised, inotropes can be used for CRS1 treatment, but they should be used cautiously due the increased risks of lethal arrhythmias.
Dopamine
Use of low-dose dopamine to stimulate D1 and D2 receptors as a way to increase renal blood flow and promote increased glomerular filtration and urine production was extensively studied in ADHF. A small trial showed use of low dose dopamine had renal protective effects in a total of 20 patients [36]. However, when larger trials were conducted, such beneficial results were not consistently observed. The Dopamine in Acute Decompensated Heart Failure (DAD-HF I) trial compared low-dose furosemide plus low-dose dopamine (5 µg/kg/min) to high-dose furosemide alone in 60 patients. There were no differences in total diuresis, hospital stay, and 60-day mortality or rehospitalization rates, but there was a reduction in the renal dysfunction at the 24-hour time point in the dopamine-treated arm (6.7% versus 30%) [37]. The Dopamine in Acute Decompensated Heart Failure II trial randomized 161 ADHF patients to high-dose furosemide, low-dose furosemide and lose dose dopamine (5 µg/kg/min), or low-dose furosemide and assessed dyspnea, worsening renal function, length of stay, 60-day and one-year all-cause mortality and hospitalization for heart failure. Dopamine treatment did not improve any of the outcomes measured [38]. Finally, the most recent trial to examine the effects of dopamine was the Renal Optimization Strategies Evaluation (ROSE) trial. In this trial, there were 360 patients with ADHF randomized to nesiritide or dopamine versus placebo in a 2:1 design. When comparing dopamine (111 patients) treatment to placebo (115 patients), there were no differences in urine output, renal function as determined by cystatin C levels, or symptomatic improvements. However, there was more tachycardia in the dopamine group [39]. Currently, there is not strong evidence supporting routine use of dopamine in CRS1.
Nesiritide
Use of nesiritide, recombinant brain natriuretic peptide, was also investigated as a way to enhance urine production through the natriuretic effects of the peptide. The first attempt to explore this hypothesis was the B-Type Natriuretic Peptide in Cardiorenal Decompensation Syndrome (BNP-CARDS) trial. BNP-CARDS showed a 48-hour infusion of nesiritide (39 patients) or placebo (36 patients) in patients with ADHF and renal dysfunction (estimated GFR between 15–60 mL/min) did not reduce the incidence of worsening renal function as defined by a rise in serum creatinine by 20% [40]. A similar approach was implemented in the Acute Study of Clinical Effectiveness of Nesiritide in Decompensated Heart Failure (ASCEND-HF) trial which examined over 7000 patients with ADHF. 3496 patients were treated with nesiritide and 3511 patients were treated with placebo for 24 hours and up to 7 days. Nesiritide treatment did not alter dyspnea at 6 and 24 hours, improve renal function as determined by creatinine change, or alter the combined end-point of rehospitalization or death 30 at days [41]. The ROSE trial examined the effects of nesiritide (117 patients) versus placebo (115 patients) for urine production, change in renal function as defined by change in cystatin C, and decongestion (urinary sodium excretion, weight change, and change in NT-proBNP) at 72 hours. Nesiritide did not alter any of the outcomes investigated [39]. Finally, a single-centered study conducted at the Mayo Clinic examined the effects of nesiritide (37 patients) or placebo (35 patients) with ADHF and pre-existing renal dysfunction (estimated GFR between 20 and 60 mL/min). These investigators found nesiritide treatment resulted in less renal dysfunction as measured by creatinine and BUN, but no changes in diuretic responsiveness, duration of hospitalization, or rehospitalization rates. Nesiritide did reduce serum endothelin levels, but had no effect on ANP, NT-pro BNP, renin, angiotensin II, or aldosterone [42]. In summary, nesiritide does not appear to have significant renal protective effects in ADHF.
Adenosine A1 Receptor Antagonists
The use of adenosine receptor antagonists to prevent adenosine-mediated vasoconstriction of renal vasculature in ADHF has also been examined. The first study conducted was a small double-blind randomized-controlled trial that investigated the effects of rolofylline, an adenosine A-1 antagonist, in patients with ADHF and an estimated creatinine clearance of 20-80 mL/min. The study had 27 patients in the placebo arm, 29 patients that received 2.5 mg of rolofylline, 31 patients received 15 mg of rolofylline, 30 patients received 30 mg of rolofylline, and 29 patients received 60 mg of rolofylline, all of which was daily for up to 3 days. Rolofylline treatment increased urine output on day 1 and improved renal function on day 2 [43]. These positive results led to the Placebo-Controlled Randomized Study of Selective Adenosine A1 Receptor Antagonist Rolofylline for Patients with Acute Decompensated Heart Failure and Volume Overload to Assess Treatment Effect on Congestion and Renal Function (PROTECT) Trial. PROTECT assessed the effects of rolofylline (1356) or placebo (677) in patients with ADHF and an estimated creatinine clearance between 20 and 80 mL/min. There were no significant differences in renal function out to 14 days, but rolofylline led to more weight loss than placebo [44,45]. In a subgroup analysis of patients with severe baseline renal dysfunction (creatinine clearance of less than 30 mL/min), rolofylline reduced the combined 60-day end-point of hospitalization due to cardiovascular or renal cause and death [45]. Finally, the Effects of KW-3902 Injectable Emulsion on Heart Failure Signs and Symptoms, Diuresis, Renal Function, and Clinical Outcomes in Subjects Hospitalized with Worsening Renal Function and Heart Failure Requiring Intravenous Therapy (REACH-UP) trial probed the effects of rolofylline (36 patients) or placebo (40 patients) in patients with ADHF and renal impairment (creatinine clearance of 20-60 mL/min). Rolofylline treatment did not alter renal function, but there was a nonsignificant trend towards reduction in 60-day combined end-point of hospitalization due to renal or cardiovascular causes or death [46]. In summary, the use of rolofylline has not been conclusively associated with improved outcomes in CRS1.
Vasopressin Antagonists
The use of vasopressin antagonists to induce aquaphoresis and combat hyponatremia was studied in ADHF. Vasopressin antagonists were first investigated in the Acute and Chronic Therapeutic Impact of a Vasopressin Antagonist (ACTIV) trial. ACTIV involved 3 doses of tolvaptan (78 patients received 30 mg, 84 patients received 60 mg, and 77 patients received 90 mg) versus placebo (80 patients), and tolvaptan increased urine production and decreased body weight compared to placebo without compromising renal function. A post-hoc analysis of patients with renal dysfunction (BUN > 29 mg/dL) and severe volume overload revealed a survival benefit at 60 days [47]. The Efficacy of Vasopressin Antagonism in Heart Failure Outcome Study with Tolvaptan (EVERST) trial compared placebo (2061 patients) versus 30 mg/day of tolvaptan (2072 patients) within 48 hours after admission in an identical 2-trial design. Tolvaptan increased weight loss and reduced dyspnea acutely but did not alter all-cause mortality or cardiovascular or heart failure hospitalization rates out to 24 months post index hospitalization [48,49]. These data suggest vasopressin antagonists may potentiate diuresis acutely but likely do not improve long-term outcomes.
Corticosteroids
The use of corticosteroids in ADHF has been controversial as there were initial concerns that corticosteroids would increase fluid retention. However, corticosteroids augmented diuretic response and improved renal function in 13 ADHF patients who had inadequate response to sequential nephron blockage [50]. Furthermore, Zhang et al showed that prednisone treatment in 35 patients admitted with ADHF increased urinary volume, reduced dyspnea, reduced uric acid, and improved renal function [51]. These promising results led to the Cardiac Outcome Prevention Effectiveness of Glucocorticoids in Acute Decompensated Heart Failure (COPE-ADHF) trial. In this single-centered study, 102 patients with ADHF were randomized to either placebo [51] or corticosteroids [51] and the outcomes recorded included urinary volume, change in creatinine, and cardiovascular death at 30 days. Use of corticosteroids improved renal function, increased urine output, and reduced mortality (3/51 in corticosteroid group versus 10/51 in the placebo group) [52]. The mechanisms underlying the improvements with corticosteroids were not determined, but were hypothesized to be facilitation of natriuretic peptides or dilation of renal vasculature through activation of nitric oxide pathway or dopaminergic system.
Serelaxin
Serelaxin is a recombinantly expressed human relaxin-2, a peptide hormone present during pregnancy which facilitates physiological cardiovascular and renal adaptations [53–55], which showed potential benefits in CRS1. Analysis of the RELAX-AHF trial revealed serelaxin reduced incidence of worsening renal function at day 2 of treatment as defined by changes in serum creatinine, cystatin C, and BUN. Importantly, worsening renal function defined by cystatin C changes was associated with increased 180-day mortality in this analysis [56]. The mechanisms by which serelaxin prevented renal dysfunction are currently unknown as serelaxin treatment did not improve diuretic efficiency [19].
Ultrafiltration
Another treatment choice in CRS1 is mechanical removal of salt and water via ultrafiltration. Ultrafiltration showed early promise in Ultrafiltration Versus Intravenous Diuretics for Patients Hospitalized for Acute Decompensated Heart Failure trial (UNLOAD) trial. In this study, 200 patients with ADHF were randomized to either ultrafiltration or medical management with loop diuretics. Use of ultrafiltration increased volume removal without any differences in renal function and reduced rehospitalization rates at 90 days [57].
However, when ultrafiltration was employed specifically in CRS1 patients in the Cardiorenal Rescue Study in Acute Decompensated Heart Failure trial (CARESS-HF), UF was not superior to medical treatment. There were 188 patients studied in CARESS-HF, and in the ultrafiltration arm there was increased risk of renal dysfunction, no differences in volume removal, and no change in rehospitalization rates at 90 days [58]. When trying to reconcile UNLOAD and CARESS-HF, the medical treatment arm in CARESS-HF was much more standardized and aggressive and UNLOAD was earlier implementation of ultrafiltration, which may have explained the differences. Interestingly, ultrafiltration was hypothesized to be advantageous over diuretic therapy through reduced activation of the renin-angiotensin-aldosterone system, but analysis of the patients from CARESS-HF showed higher levels of plasma renin activity and no difference in aldosterone levels in ultrafiltration patients [59].
Two meta-analyses have examined the use of ultrafiltration versus medical management in ADHF and both showed ultrafiltration was more effective in volume removal than medical therapy but did not improve rehospitalization or mortality rates [60,61]. This fact combined with the risks of vascular access placement and bleeding from anticoagulation limits to routine use of ultrafiltration in CRS1.
Continuous Renal Replacement Therapy
Once renal function deteriorates to the point that renal replacement therapy is needed for both volume removal and solute clearance in CRS1, continuous renal replacement therapy (CRRT) may be implemented. Unfortunately, there are few available data for this group of advanced CRS1 patients to guide physicians. There was a single-centered study conducted in Egypt that randomized 40 ADHF patients to either IV furosemide or CRRT. The patients treated with CRRT had greater weight loss and decreased length of stay in the ICU, but there were no differences in dialysis dependence rates or 30-day mortality [62]. Two single-centered studies reported outcomes associated with advanced CRS1 requiring CRRT. In a study conducted at the Cleveland Clinic, 63 patients with CRS1 were treated with ultrafiltration, of which 37 were converted to CRRT due to worsening renal function. Of the 37 patients treated with CRRT, 16 died in the hospital and 4 were discharged with hospice care [63]. In another retrospective study performed at the University of Alabama-Birmingham, use of rescue CRRT in advanced CRS1 was examined in 37 patients. 23 patients died during hospitalization and 2 were discharged to hospice care [64]. Combination of the Cleveland Clinic and University of Alabama-Birmingham studies revealed patients requiring CRRT in the setting of advanced CRS1 had an in-hospital mortality or palliative discharge rate of 60.8% (45/74). Clearly, this population needs further investigation to prevent such poor outcomes.
Future Treatment Options
Ongoing and Unreported Clinical Trials
Unfortunately, none of the current treatments for CRS1 have definitive improvements in outcomes, but there are several ongoing clinical trials which will hopefully identify novel treatment strategies. First of all, the Acetazolamide and Spironolactone to Increase Natriuresis in Congestive Heart Failure (Diuresis-CHF) trial is being conducted in Belgium. This study will examine the effects of acetazolamide with low dose diuretic versus high dose diuretics in one aim and the effects of upfront spironolactone in another. The outcomes analyzed will include total natriuresis, potassium homeostasis, NT-proBNP changes, change in renal function, peak serum levels of renin and aldosterone, weight change, urine volume, and change in edema (NCT01973335). The Protocolized Diuretic Strategy in Cardiorenal Failure (ProDius) trial is being performed at the University of Pittsburgh, and will determine the effects of a protocolized diuretic approach to target 3-5 liters of urine production a day versus standard therapy and will track the change in body weight, length of hospitalization, reshospitalization rates, mortality rates, venous compliance of internal jugular vein, clinical decongestion, change in renal function, and urine output (NCT01921829). The Levosimendan versus Dobutamine for Renal Function in Heart Failure (ELDOR) study is ongoing in Sweden and will probe the acute effects of levosimendan and dobutamine on renal perfusion. The endpoints will include changes in renal blood flow, GFR, renal vascular resistance, central hemodynamics, renal oxygen extraction and consumptions, and filtration fraction (NCT02133105). Finally, the Safety and Efficacy of Low Dose Hypertonic Saline and High Dose Furosemide for Congestive Heart Failure (REaCH) trial probed the effects of combination of hypertonic saline and furosemide versus furosemide in patients with ADHF and renal impairment defined by a GFR<60 mL/min. The outcomes were change in renal function, diuretic response, length of hospital stay, readmission rates, weight loss, BNP levels, and included a cost analysis. The study was completed but results are not currently available (NCT01028170)
Should Inflammation Be Targeted in CRS1?
Although proposed to play a role in the pathophysiology of CRS1, inflammation has not been explicitly targeted as a treatment for CRS1. One possible way to combat inflammation could be inhibition of the IL-6 pathway, which is support by preclinical work as previous studies showed IL-6 knockout mice were resistant to HgCl2-induced renal injury and death [65] and IL-6 has negative inotropic effects in both isolated cardiomyocytes [66] and intact animals [67]. Thus, IL-6 antagonism may improve both cardiac and renal function, an ideal scenario for CRS1 patients. The availability of tocilizumab, an FDA-approved humanized antibody to the IL-6 receptor, may allow for investigation of this hypothesis in the future. Although not examined in the COPE-ADHF trial, an alternative explanation for the improvements associated with corticosteroids treatment were the anti-inflammatory effects. If this were true, corticosteroids would represent a relatively cheap treatment option for CRS1 patients, but more studies need to be conducted before this approach is widely implemented. Finally, use of cytokine profiling may be used to enrich a population of CRS1 patients that could be investigated in future clinical trials using anti-inflammatory medications.
Unanswered Questions Moving Forward
Severity of AKI and Treatment Effects
An important unknown that warrants further investigation is if the severity of AKI should dictate treatment choice in CRS1. As discussed above, increasing severity of AKI resulted in elevated risk of adverse events, but it remains unknown whether different treatments offer benefits for more or less severe renal impairment. Perhaps, future studies aimed at defining outcomes from different treatment strategies stratified by severity of renal dysfunction may reveal which patients benefit from the various treatment options for CRS1.
How Do We Best Define Renal Dysfunction in CRS1?
Currently, there is no accepted definition of renal dysfunction in CRS1. As discussed above, using the AKIN, KDIGO, or RIFLE scoring systems or diuretic responsiveness effectively differentiated outcomes in patients with CRS1. However, an agreed-upon definition would likely benefit the field going forward so this population could be systematically investigated in future studies.
Conclusion
In summary, CRS1 is a common clinical entity associated with poor patient outcomes. A complex pathophysiology marked by reduced cardiac output, increased central venous pressure, inflammation, and oxidative stress underlies the disease process. Unfortunately, no current treatment approach shows consistent improvements in outcomes, highlighting the urgent need for further research to reduce the burden that CRS1 imposes.
Corresponding author: Kurt W. Prins, MD, PhD, MMC 580 Mayo, 420 Delaware St SE, Minneapolis, MN 55455, [email protected].
Funding/support: Dr. Prins is funded by NIH F32 grant HL129554 and Dr. Thenappen is funded by AHA Scientist Development Grant 15SDG25560048.
1. Mozaffarian D, Benjamin EJ, Go AS,et al. Heart disease and stroke statistics--2015 update: A report from the american heart association. Circulation 2015;131:e29–322.
2. Gheorghiade M, Vaduganathan M, Fonarow GC, Bonow RO. Rehospitalization for heart failure: problems and perspectives. J Am Coll Cardiol 2013;61:391–403.
3. Jencks SF, Williams MV, Coleman EA. Rehospitalizations among patients in the medicare fee-for-service program. N Engl J Med 2009;360:1418–28.
4. Fonarow GC, Adams KF Jr, Abraham WT, et al and ADHERE Scientific Advisory Committee, Study Group, and Investigators. Risk stratification for in-hospital mortality in acutely decompensated heart failure: Classification and regression tree analysis. JAMA 2005;293:572–80.
5. Abraham WT, Fonarow GC, Albert NM, et al. Predictors of in-hospital mortality in patients hospitalized for heart failure: Insights from the organized program to initiate lifesaving treatment in hospitalized patients with heart failure (OPTIMIZE-HF). J Am Coll Cardiol 2008;52:347–56.
6. Ronco C, Haapio M, House AA, et al. Cardiorenal syndrome. J Am Coll Cardiol 2008:52:1527–39.
7. Roy AK, Mc Gorrian C, Treacy C, et al. A comparison of traditional and novel definitions (RIFLE, AKIN, and KDIGO) of acute kidney injury for the prediction of outcomes in acute decompensated heart failure. Cardiorenal Med 2013;3:26–37.
8. Li Z, Cai L, Liang X, et al. Identification and predicting short-term prognosis of early cardiorenal syndrome type 1: KDIGO is superior to RIFLE or AKIN. PLoS One 2014;9:e114369.
9. Mullens W, Abrahams Z, Francis GS, et al. Importance of venous congestion for worsening of renal function in advanced decompensated heart failure. J Am Coll Cardiol 2009:53:589–96.
10. Nohria A, Hasselblad V, Stebbins A, et al. Cardiorenal interactions: Insights from the ESCAPE trial. J Am Coll Cardiol 2008:51:1268–74.
11. Winton FR. The influence of venous pressure on the isolated mammalian kidney. J Physiol 1931;72:49–61.
12. Virzi GM, Torregrossa R, Cruz DN, et al. Cardiorenal syndrome type 1 may be immunologically mediated: A pilot evaluation of monocyte apoptosis. Cardiorenal Med 2012;2:33–42.
13. Virzi GM, Clementi A, de Cal M, et al. Oxidative stress: Dual pathway induction in cardiorenal syndrome type 1 pathogenesis. Oxid Med Cell Longev 2015;391790.
14. Cho E, Kim M, Ko YS, et al. Role of inflammation in the pathogenesis of cardiorenal syndrome in a rat myocardial infarction model. Nephrol Dial Transplant 2013;28:2766–78.
15. Ather S, Bavishi C, McCauley MD, et al. Worsening renal function is not associated with response to treatment in acute heart failure. Int J Cardiol 2013;167:1912–7.
16. Testani JM, McCauley BD, Kimmel SE, Shannon RP. Characteristics of patients with improvement or worsening in renal function during treatment of acute decompensated heart failure. Am J Cardiol 2010;106:1763–69.
17. Hata N, Yokoyama S, Shinada T, et al. Acute kidney injury and outcomes in acute decompensated heart failure: Evaluation of the RIFLE criteria in an acutely ill heart failure population. Eur J Heart Fail 2010;12:32–7.
18. Testani JM, Brisco MA, Turner JM, et al. Loop diuretic efficiency: A metric of diuretic responsiveness with prognostic importance in acute decompensated heart failure. Circ Heart Fail 2014;7:261–70.
19. Voors AA, Davison BA, Teerlink JR, et al. Diuretic response in patients with acute decompensated heart failure: Characteristics and clinical outcome--an analysis from RELAX-AHF. Eur J Heart Fail 2014;16:1230–40.
20. Valente MA, Voors AA, Damman K, et al. Diuretic response in acute heart failure: Clinical characteristics and prognostic significance. Eur Heart J 2014;35:1284–93.
21. Devarajan P. Neutrophil gelatinase-associated lipocalin: A troponin-like biomarker for human acute kidney injury. Nephrology (Carlton) 2010;15:419–28.
22. Soyler C, Tanriover MD, Ascioglu S, et al. Urine neutrophil gelatinase-associated lipocalin levels predict acute kidney injury in acute decompensated heart failure patients. Ren Fail 2015;5.
23. Brisco MA,Testani JM. Novel renal biomarkers to assess cardiorenal syndrome. Curr Heart Fail Rep 2014;11;485–99.
24. Lassus J, Harjola VP, Sund R, et al. and FINN-AKVA Study group. Prognostic value of cystatin C in acute heart failure in relation to other markers of renal function and NT-proBNP. Eur Heart J 2007;28:1841–7.
25. Arimoto T, Takeishi Y, Niizeki T, et al. Cystatin C, a novel measure of renal function, is an independent predictor of cardiac events in patients with heart failure. J Card Fail 2005;11:595–601.
26. Naruse H, Ishii J, Kawai T, et al. Cystatin C in acute heart failure without advanced renal impairment. Am J Med 2009;122:566–73.
27. Manzano-Fernandez S, Boronat-Garcia M, Albaladejo-Oton MD, et al. Complementary prognostic value of cystatin C, N-terminal pro-B-type natriuretic peptide and cardiac troponin T in patients with acute heart failure. Am J Cardiol 2009;103:1753–9.
28. Bonventre JV, Yang L. Kidney injury molecule-1. Curr Opin Crit Care 2010;16:556–61.
29. Damman K, Van Veldhuisen DJ, Navis G, et al. Tubular damage in chronic systolic heart failure is associated with reduced survival independent of glomerular filtration rate. Heart 2010;96:1297–302.
30. Jungbauer CG, Birner C, Jung B, et al. Kidney injury molecule-1 and N-acetyl-beta-D-glucosaminidase in chronic heart failure: Possible biomarkers of cardiorenal syndrome. Eur J Heart Fail 2011;13:1104–10.
31. Verbrugge FH, Dupont M, Shao Z, et al. Novel urinary biomarkers in detecting acute kidney injury, persistent renal impairment, and all-cause mortality following decongestive therapy in acute decompensated heart failure. J Card Fail 2013;19:621–8.
32. Felker GM, Lee KL, Bull DA, et al. Diuretic strategies in patients with acute decompensated heart failure. N Engl J Med 2011;364:797–805.
33. Moranville MP, Choi S, Hogg J, et al. Comparison of metolazone versus chlorothiazide in acute decompensated heart failure with diuretic resistance. Cardiovasc Ther 2015;33;42–9.
34. Cuffe MS, Califf RM, Adams KF Jr, et al. Short-term intravenous milrinone for acute exacerbation of chronic heart failure: A randomized controlled trial. JAMA 2002;287:1541–7.
35. Mebazaa A, Nieminen MS, Packer M, et al. Levosimendan vs dobutamine for patients with acute decompensated heart failure: The SURVIVE randomized trial. JAMA 2007;297:1883–91.
36. Varriale P, Mossavi A. The benefit of low-dose dopamine during vigorous diuresis for congestive heart failure associated with renal insufficiency: Does it protect renal function? Clin Cardiol 1997;20:627–30.
37. Giamouzis G, Butler J, Starling RC, et al. Impact of dopamine infusion on renal function in hospitalized heart failure patients: Results of the dopamine in acute decompensated heart failure (DAD-HF) trial. J Card Fail 2010;16:922–30.
38. Triposkiadis FK, Butler J, Karayannis G, et al. Efficacy and safety of high dose versus low dose furosemide with or without dopamine infusion: The dopamine in acute decompensated heart failure II (DAD-HF II) trial. Int J Cardiol 2014;172:115–21.
39. Chen HH, Anstrom KJ, Givertz MM, et al. Low-dose dopamine or low-dose nesiritide in acute heart failure with renal dysfunction: The ROSE acute heart failure randomized trial. JAMA 2013;310:2533–43.
40. Witteles RM, Kao D, Christopherson D, et al. Impact of nesiritide on renal function in patients with acute decompensated heart failure and pre-existing renal dysfunction a randomized, double-blind, placebo-controlled clinical trial. J Am Coll Cardiol 2007;50:1835–40.
41 O'Connor CM, Starling RC, Hernandez AF, et al. Effect of nesiritide in patients with acute decompensated heart failure. N Engl J Med 2011;365:32–43.
42. Owan TE, Chen HH, Frantz RP, et al. The effects of nesiritide on renal function and diuretic responsiveness in acutely decompensated heart failure patients with renal dysfunction. J Card Fail 2008;14:267–75.
43. Givertz MM, Massie BM, Fields TK, et al and CKI-201 and CKI-202 Investigators. The effects of KW-3902, an adenosine A1-receptor antagonist,on diuresis and renal function in patients with acute decompensated heart failure and renal impairment or diuretic resistance. J Am Coll Cardiol 2007;50:1551–60.
44. Massie BM, O'Connor CM, Metra M, et al. Rolofylline, an adenosine A1-receptor antagonist, in acute heart failure. N Engl J Med 2010;363:1419–28.
45. Voors AA, Dittrich HC, Massie BM, et al. Effects of the adenosine A1 receptor antagonist rolofylline on renal function in patients with acute heart failure and renal dysfunction: Results from PROTECT (placebo-controlled randomized study of the selective adenosine A1 receptor antagonist rolofylline for patients hospitalized with acute decompensated heart failure and volume overload to assess treatment effect on congestion and renal function). J Am Coll Cardiol 2011;57:1899–907.
46. Gottlieb SS, Givertz MM, Metra M, et al. The effects of adenosine A(1) receptor antagonism in patients with acute decompensated heart failure and worsening renal function: The REACH UP study. J Card Fail 2010;16:714–9.
47. Gheorghiade M, Gattis WA, O'Connor CM, et al. Effects of tolvaptan, a vasopressin antagonist, in patients hospitalized with worsening heart failure: A randomized controlled trial. JAMA 2004;291:1963–71.
48. Gheorghiade M, Konstam MA, Burnett JC Jr, et al. Short-term clinical effects of tolvaptan, an oral vasopressin antagonist, in patients hospitalized for heart failure: The EVEREST clinical status trials. JAMA 2007;297:1332–43.
49. Konstam MA, Gheorghiade M, Burnett JC Jr, et al. Effects of oral tolvaptan in patients hospitalized for worsening heart failure: The EVEREST outcome trial. JAMA 2007;297:1319–31.
50. Liu C, Liu G, Zhou C, et al. Potent diuretic effects of prednisone in heart failure patients with refractory diuretic resistance. Can J Cardiol 2007;23:865–8.
51. Zhang H, Liu C, Ji Z, et al. Prednisone adding to usual care treatment for refractory decompensated congestive heart failure. Int Heart J 2008;49:587–95.
52. Liu C, Liu K and COPE-ADHF Study Group. Cardiac outcome prevention effectiveness of glucocorticoids in acute decompensated heart failure: COPE-ADHF study. J Cardiovasc Pharmacol 2014;63:333–8.
53. Teichman SL, Unemori E, Teerlink JR, et al. Relaxin: Review of biology and potential role in treating heart failure. Curr Heart Fail Rep 2010;7:75–82.
54. Conrad KP, Shroff SG. Effects of relaxin on arterial dilation, remodeling, and mechanical properties. Curr Hypertens Rep 2011;13:409–20.
55. Du XJ, Bathgate RA, Samuel CS, et al. Cardiovascular effects of relaxin: From basic science to clinical therapy. Nat Rev Cardiol 2010;7:48–58.
56. Metra M, Cotter G, Davison BA, et al. Effect of serelaxin on cardiac, renal, and hepatic biomarkers in the relaxin in acute heart failure (RELAX-AHF) development program: Correlation with outcomes. J Am Coll Cardiol 2013;61:196-206.
57. Costanzo MR, Guglin ME, Saltzberg MT, et al. Ultrafiltration versus intravenous diuretics for patients hospitalized for acute decompensated heart failure. J Am Coll Cardiol 2007;49:675–83.
58. Bart BA, Goldsmith SR, Lee KL, et al. Ultrafiltration in decompensated heart failure with cardiorenal syndrome. N Engl J Med 2012;367:2296–304.
59. Mentz RJ, Stevens SR, DeVore AD, et al. Decongestion strategies and renin-angiotensin-aldosterone system activation in acute heart failure. JACC Heart Fail 2015;3:97–107.
60. Ebrahim B, Sindhura K, Okoroh J, et al. Meta-analysis of ultrafiltration versus diuretics treatment option for overload volume reduction in patients with acute decompensated heart failure. Arq Bras Cardiol 2015;104:417–25.
61. Kwong JS, Yu CM. Ultrafiltration for acute decompensated heart failure: A systematic review and meta-analysis of randomized controlled trials. Int J Cardiol 2014;172:395–402.
62. Badawy SS, Fahmy A. Efficacy and cardiovascular tolerability of continuous veno-venous hemodiafiltration in acute decompensated heart failure: A randomized comparative study. J Crit Care 2012;27:106.e7-106.13.
63. Patarroyo M, Wehbe E, Hanna M, et al. Cardiorenal outcomes after slow continuous ultrafiltration therapy in refractory patients with advanced decompensated heart failure. J Am Coll Cardiol 2012;60:1906–12.
64. Prins KW, Wille KM, Tallaj JA, Tolwani AJ. Assessing continuous renal replacement therapy as a rescue strategy in cardiorenal syndrome 1. Clin Kidney J 2015;8:87–92.
65. Nechemia-Arbely Y, Barkan D, Pizov G, et al. IL-6/IL-6R axis plays a critical role in acute kidney injury. J Am Soc Nephrol 2008;19:1106–15.
66. Pathan N, Franklin JL, Eleftherohorinou H, et al. Myocardial depressant effects of interleukin 6 in meningococcal sepsis are regulated by p38 mitogen-activated protein kinase. Crit Care Med 2011;39:1692–711.
67. Janssen SP, Gayan-Ramirez G, Van den Bergh A, et al. Interleukin-6 causes myocardial failure and skeletal muscle atrophy in rats. Circulation 2005;111:996–1005.
68. Bellomo R, Ronco C, Kellum JA and Acute Dialysis Quality Initiative workgroup. Acute renal failure - definition, outcome measures, animal models, fluid therapy and information technology needs: The second international consensus conference of the acute dialysis quality initiative (ADQI) group. Crit Care 2004;8:R204-12.
69. Mehta RL, Kellum JA, Shah SV, et al and Acute Kidney Injury Network. Acute kidney injury network: Report of an initiative to improve outcomes in acute kidney injury. Crit Care 2007;11:R31.
70. Kidney Disease: Improving Global Outcomes (KDIGO) Acute Kidney Injury Work Group. KDIGO clinical practice guidelines for acute kidney injury. Kidney Inter Suppl 2012;2:19–36.