User login
The Use of a Telehealth Clinic to Support Patients Receiving Radiation Therapy at a Site Distant From Their PCP
Purpose: To try to integrate primary care support from the “spoke” facility during the treatment of patients receiving radiation treatments at the “hub” facility.
Background: Twenty percent of the patients receiving radiation therapy at Richard L. Roudebush VA Medical Center must relocate for up to several months in order to receive their daily treatments due to their distance from the tertiary radiation oncology unit. This makes it impossible for the patients to easily access their primary care provider (PCP) while they are out of town. Patients run out of routine medications, lose weight, have changes in renal function, and require changes in medication during this time; they must then access care via the hub emergency department (ED) or admission. In addition, the provider at the “spoke” is not necessarily in the loop regarding these patients.
Methods: We performed an analysis of the satisfaction with the current process, ED visits, and admissions of radiation oncology caregivers and patients using the Veterans House.
Results: Of patients treated with radiotherapy from April 2013, to April 1, 2014, 106 veterans stayed in the Veterans House. Patients who received palliative care with local PCPs were currently being treated at the time of the analysis or declined radiotherapy prior to starting treatment were excluded, leaving 61 patients. Of the 61 patients, there were a total of 48 ED visits and 24 admissions accounting for 168 patient-days in the hospital. A root cause analysis was performed on these 48 ED visits; 56% of those were felt to be preventable.
Discussion: After several PDSA (plan-do-study-act) cycles which did not work (involving hub PCPs, involving the ED), we were successful in setting up routine weekly telehealth visits between the patient in Indianapolis at the radiation oncology unit hub and the PCP in the distant facilities in Danville and Peoria, Illinois. This allowed the PCP to manage antihypertensives, diabetic medications, and so on, as the patient moved through the radiation process.
Implications: This pilot process should decrease ED visits and admissions during radiation therapy and also serve to tighten the relationship between the hub and spoke facilities during subspecialist treatment.
Urine drug screens: When might a test result be false-positive?
Mr. L, age 35, has an appointment at a mental health clinic for ongoing treatment of depression. His medication list includes atorvastatin, bupropion, lisinopril, and cranberry capsules for non-descriptive urinary issues. He has been treated for some time at a different outpatient facility; however he recently moved and changed clinics.
At this visit, his first, Mr. L receives a full physical exam, including a urine drug screen point-of-care (POC) test. He informs the nurse that he has an extensive history of drug abuse: “You name it, I’ve done it.” Although he experimented with many illicit substances, he acknowledges that “downers” were his favorite. He believes that his drug abuse could have caused his depression, but is proud to declare that he has been “clean” for 12 months and his depression is approaching remission.
However, the urine drug screen is positive for amphetamines. Mr. L vehemently swears that the test must be wrong, restating that he has been clean for 12 months. “Besides, I don’t even like ‘uppers’!” Because of Mr. L’s insistence, the clinician does a brief literature search about false-positive results in urine drug screening, which shows that, rarely, bupropion can trigger a false positive in the amphetamine immunoassay.
Could this be a false-positive result? Or is Mr. L not telling the truth?
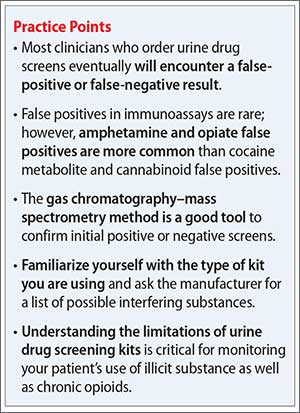
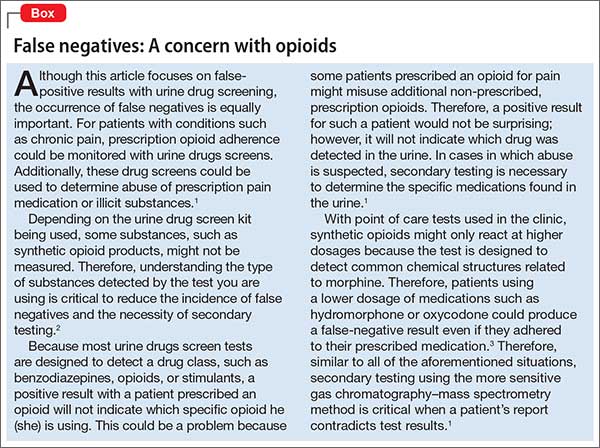
Because no clinical lab test is perfect, any clinician who runs urine drug screens will encounter a false-positive result. (See the Box,1-3 for discussion of false negatives.) Understanding how each test works—and potential sources of error— can help you evaluate test results and determine the best course of action.
There are 2 main methods involved in urine drug testing: in-office (POC) urine testing and laboratory-based testing. This article describes the differences between these tests and summarizes the potential for false-positive results.
In-office urine testing
POC tests in urine drug screens use a technique called “immunoassay,” which is quantitative and generally will detect the agent in urine for only 3 to 7 days after ingestion.4 This test relies on the principle of competitive binding: If a parent drug or metabolite is present in urine, it will bind to a specific antibody site on the test strip and produce a positive result.5 Other compounds that are similarly “shaped” on a molecular level also can bind to these antibody sites when present in sufficient quantity, producing a “cross reaction,” also called a “false-positive” result. The Table6 lists agents that can cross-react with immunoassay tests. In addition to the cross-reaction, false positives also can occur because of technician or clerical error— making it important to review the process by which the specimen was obtained and tested if a false-positive result is suspected, as in the case described here.7
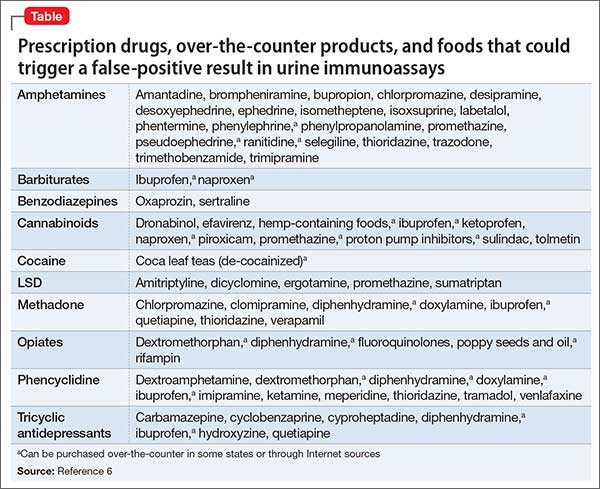
Different POC tests can have varying cross-reactivity patterns, based on the antibody used.8 In general, false positives in immunoassays are rare, but amphetamine and opiate false positives are more common than cocaine metabolite and cannabinoid false positives.9 The odds of a false positive vary, depending on the specificity of the immunoassay used and the substance under detection.6
A study that analyzed 10,000 POC urine drug screens found that 362 specimens tested positive for amphetamines, but that 128 of those did not test positive for amphetamines using more sensitive tests.10 Of these 128 false positives reported, 53 patients were taking bupropion at the time of the test.10 Therefore, clinicians should do a thorough patient medication review at the time of POC urine drug testing. In addition, consider identifying which type of test you are using at your practice site, and ask the manufacturer or lab to provide a list of known possible false positives.
Laboratory-based GC–MS testing
If a false positive is suspected on a POC immunoassay-based urine drug screen, results can be confirmed using gas chromatography–mass spectrometry (GC–MS). Although GC–MS is more accurate than an immunoassay, it also is more expensive and time-consuming.9
GC–MS breaks down a specimen into ionized fragments and separates them based on their mass–charge ratio. Because of this, GC–MS is able to identify the presence of a specific drug (eg, oxycodone) instead of a broad class (eg, opioid). The GC–MS method is a good tool to confirm initial positive screens when their integrity is in question because, unlike POC tests used during an office visit, GC–MS is not influenced by cross-reacting compounds.11-13
GC–MS is not error-free, however. For example, heroin and hydrocodone are metabolized into morphine and hydromorphone, respectively. Depending on when the specimen was collected, the metabolites, not the parents, might be the compounds identified, which might produce confusing results.
Clinical recommendations
When a POC drug screen is positive, confirming the result with GC–MS is good clinical practice. False positives can strain the relationship between patient and provider, thus compromising care. Examining the procedures that were used to obtain the specimen, as well as double-checking POC test results, is, when appropriate, good medicine.
CASE CONTINUED
Because Mr. L is adamant about his sobriety and the fact that his drugs of choice were sedatives, not stimulants, the clinician orders a second drug screen by GC–MS. The second screen is negative for substances of abuse; Mr. L’s clinician concludes that bupropion produced a false-positive result on the POC urine drug screen, confirming Mr. L’s assertions.
Related Resources
• Saitman A, Park HD, Fitzgerald RL. False-positive interferences of common urine drug screen immunoassays: a review. J Anal Toxicol. 2014;38(7):387-396.
• Tenore PL. Advanced urine toxicology testing. J Addict Dis. 2010;29(4):436-448.
Drug Brand Names
Amantadine • Symadine, Symmetrel
Amitriptyline • Elavil
Atorvastatin • Lipitor
Brompheniramine • Dimetane
Bupropion • Wellbutrin, Zyban
Carbamazepine • Carbatrol, Tegretol
Chlorpromazine • Thorazine
Clomipramine • Anafranil
Cyclobenzaprine • Amrix, Flexeril
Cyproheptadine • Periactin
Desipramine • Nopramin
Desoxyephedrine • Desoxyn
Dextromethorphan • Delsym, Robitussin
Dicyclomine • Bentyl, Dicyclocot
Diphenhydramine • Benadryl, Unisom
Doxylamine • Robitussin, NyQuil
Dronabinol • Marinol
Efavirenz • Sustiva
Ephedrine • Mistol, Va-Tro-Nol
Ergotamine • Ergomar, Cafergot
Hydrocodone • Vicodin
Hydromophone • Dilaudid, Palladone
Hydroxyzine • Atarax, Vistaril
Isometheptene • Amidrine, Migrend
Isoxsuprine • Vasodilan, Vasoprine
Ketoprofen • Orudis, Oruvail
Labetalol • Normodyne, Trandate
Lisinopril • Prinivil, Zestril
Meperidine • Demerol
Naproxen • Aleve, Naprosyn
Oxaprozin • Daypro
Oxycodone • Oxycontin, Percocet, Percodan, Roxicodone
Phentermine • Adipex, Phentrol
Phenylephrine • Sudafed PE, Neo-Synephrine
Piroxicam • Feldene
Promethazine • Phenergan
Pseudoephedrine • Sudafed, Dimetapp
Quetiapine • Seroquel
Ranitidine • Zantac
Rifampin • Rifadin, Rimactane
Selegiline • EMSAM
Sertraline • Zoloft
Sulindac • Clinoril
Sumatriptan • Imitrex
Thioridazine • Mellaril
Tolmetin • Tolectin
Trazodone • Desyrel, Oleptro
Trimethobenzamide • Benzacot, Tigan
Trimipramine • Surmontil
Verapamil • Calan, Isoptin
1. Cobaugh DJ, Gainor C, Gaston CL, et al. The opioid abuse and misuse epidemic: implications for pharmacists in hospitals and health systems. Am J Health Syst Pharm. 2014;71(18):1539-1554.
2. Gilbert JW, Wheeler GR, Mick GE, et al. Importance of urine drug testing in the treatment of chronic noncancer pain: implications of recent medicare policy changes in Kentucky. Pain Physician. 2010;13(2):167-186.
3. Michna E, Jamison RN, Pham LD, et al. Urine toxicology screening among chronic pain patients on opioid therapy: frequency and predictability of abnormal findings. Clin J Pain. 2007;23(2):173-179.
4. U.S. Department of Justice. Fact sheet: drug testing in the criminal justice system. https://www.ncjrs.gov/pdffiles/dtest. pdf. Published March 1992. Accessed July 29, 2015.
5. Australian Diagnostic Services. Technical information: testing principle’s. http://www.australiandrugtesting. com/#!technical-info/c14h4. Accessed November 5, 2014.
6. University of Illinois at Chicago College of Pharmacy. What drugs are likely to interfere with urine drug screens? http://dig.pharm.uic.edu/faq/2011/Feb/faq1.aspx. Accessed November 5, 2014.
7. Wolff K, Farrell M, Marsden J, et al. A review of biological indicators of illicit drug use, practical considerations and clinical usefulness. Addiction. 1999;94(9):1279-1298.
8. Gourlay D, Heit H, Caplan YH. Urine drug testing in primary care – dispelling the myths & designing strategies. PharmaCom Group. http://www.mc.uky.edu/equip-4-pcps/documents/ section8/urine%20drug%20testing%20in%20clinical%20 practice.pdf. Accessed August 6, 2015.
9. Standridge JB, Adams SM, Zotos AP. Urine drug screen: a valuable office procedure. Am Fam Physician. 2010;81(5): 635-640.
10. Casey ER, Scott MG, Tang S, et al. Frequency of false positive amphetamine screens due to bupropion using the Syva EMIT II immunoassay. J Med Toxicol. 2011;7(2):105-108.
11. Casavant MJ. Urine drug screening in adolescents. Pediatr Clin N Am. 2002;49(2):317-327.
12. Shults TF. The medical review officer handbook. 7th ed. Chapel Hill, NC: Quadrangle Research; 1999.
13. Baden LR, Horowitz G, Jacoby H, et al. Quinolones and false-positive urine screening for opiates by immunoassay technology. JAMA. 2001;286(24):3115-3119.
Mr. L, age 35, has an appointment at a mental health clinic for ongoing treatment of depression. His medication list includes atorvastatin, bupropion, lisinopril, and cranberry capsules for non-descriptive urinary issues. He has been treated for some time at a different outpatient facility; however he recently moved and changed clinics.
At this visit, his first, Mr. L receives a full physical exam, including a urine drug screen point-of-care (POC) test. He informs the nurse that he has an extensive history of drug abuse: “You name it, I’ve done it.” Although he experimented with many illicit substances, he acknowledges that “downers” were his favorite. He believes that his drug abuse could have caused his depression, but is proud to declare that he has been “clean” for 12 months and his depression is approaching remission.
However, the urine drug screen is positive for amphetamines. Mr. L vehemently swears that the test must be wrong, restating that he has been clean for 12 months. “Besides, I don’t even like ‘uppers’!” Because of Mr. L’s insistence, the clinician does a brief literature search about false-positive results in urine drug screening, which shows that, rarely, bupropion can trigger a false positive in the amphetamine immunoassay.
Could this be a false-positive result? Or is Mr. L not telling the truth?
Because no clinical lab test is perfect, any clinician who runs urine drug screens will encounter a false-positive result. (See the Box,1-3 for discussion of false negatives.) Understanding how each test works—and potential sources of error— can help you evaluate test results and determine the best course of action.
There are 2 main methods involved in urine drug testing: in-office (POC) urine testing and laboratory-based testing. This article describes the differences between these tests and summarizes the potential for false-positive results.
In-office urine testing
POC tests in urine drug screens use a technique called “immunoassay,” which is quantitative and generally will detect the agent in urine for only 3 to 7 days after ingestion.4 This test relies on the principle of competitive binding: If a parent drug or metabolite is present in urine, it will bind to a specific antibody site on the test strip and produce a positive result.5 Other compounds that are similarly “shaped” on a molecular level also can bind to these antibody sites when present in sufficient quantity, producing a “cross reaction,” also called a “false-positive” result. The Table6 lists agents that can cross-react with immunoassay tests. In addition to the cross-reaction, false positives also can occur because of technician or clerical error— making it important to review the process by which the specimen was obtained and tested if a false-positive result is suspected, as in the case described here.7
Different POC tests can have varying cross-reactivity patterns, based on the antibody used.8 In general, false positives in immunoassays are rare, but amphetamine and opiate false positives are more common than cocaine metabolite and cannabinoid false positives.9 The odds of a false positive vary, depending on the specificity of the immunoassay used and the substance under detection.6
A study that analyzed 10,000 POC urine drug screens found that 362 specimens tested positive for amphetamines, but that 128 of those did not test positive for amphetamines using more sensitive tests.10 Of these 128 false positives reported, 53 patients were taking bupropion at the time of the test.10 Therefore, clinicians should do a thorough patient medication review at the time of POC urine drug testing. In addition, consider identifying which type of test you are using at your practice site, and ask the manufacturer or lab to provide a list of known possible false positives.
Laboratory-based GC–MS testing
If a false positive is suspected on a POC immunoassay-based urine drug screen, results can be confirmed using gas chromatography–mass spectrometry (GC–MS). Although GC–MS is more accurate than an immunoassay, it also is more expensive and time-consuming.9
GC–MS breaks down a specimen into ionized fragments and separates them based on their mass–charge ratio. Because of this, GC–MS is able to identify the presence of a specific drug (eg, oxycodone) instead of a broad class (eg, opioid). The GC–MS method is a good tool to confirm initial positive screens when their integrity is in question because, unlike POC tests used during an office visit, GC–MS is not influenced by cross-reacting compounds.11-13
GC–MS is not error-free, however. For example, heroin and hydrocodone are metabolized into morphine and hydromorphone, respectively. Depending on when the specimen was collected, the metabolites, not the parents, might be the compounds identified, which might produce confusing results.
Clinical recommendations
When a POC drug screen is positive, confirming the result with GC–MS is good clinical practice. False positives can strain the relationship between patient and provider, thus compromising care. Examining the procedures that were used to obtain the specimen, as well as double-checking POC test results, is, when appropriate, good medicine.
CASE CONTINUED
Because Mr. L is adamant about his sobriety and the fact that his drugs of choice were sedatives, not stimulants, the clinician orders a second drug screen by GC–MS. The second screen is negative for substances of abuse; Mr. L’s clinician concludes that bupropion produced a false-positive result on the POC urine drug screen, confirming Mr. L’s assertions.
Related Resources
• Saitman A, Park HD, Fitzgerald RL. False-positive interferences of common urine drug screen immunoassays: a review. J Anal Toxicol. 2014;38(7):387-396.
• Tenore PL. Advanced urine toxicology testing. J Addict Dis. 2010;29(4):436-448.
Drug Brand Names
Amantadine • Symadine, Symmetrel
Amitriptyline • Elavil
Atorvastatin • Lipitor
Brompheniramine • Dimetane
Bupropion • Wellbutrin, Zyban
Carbamazepine • Carbatrol, Tegretol
Chlorpromazine • Thorazine
Clomipramine • Anafranil
Cyclobenzaprine • Amrix, Flexeril
Cyproheptadine • Periactin
Desipramine • Nopramin
Desoxyephedrine • Desoxyn
Dextromethorphan • Delsym, Robitussin
Dicyclomine • Bentyl, Dicyclocot
Diphenhydramine • Benadryl, Unisom
Doxylamine • Robitussin, NyQuil
Dronabinol • Marinol
Efavirenz • Sustiva
Ephedrine • Mistol, Va-Tro-Nol
Ergotamine • Ergomar, Cafergot
Hydrocodone • Vicodin
Hydromophone • Dilaudid, Palladone
Hydroxyzine • Atarax, Vistaril
Isometheptene • Amidrine, Migrend
Isoxsuprine • Vasodilan, Vasoprine
Ketoprofen • Orudis, Oruvail
Labetalol • Normodyne, Trandate
Lisinopril • Prinivil, Zestril
Meperidine • Demerol
Naproxen • Aleve, Naprosyn
Oxaprozin • Daypro
Oxycodone • Oxycontin, Percocet, Percodan, Roxicodone
Phentermine • Adipex, Phentrol
Phenylephrine • Sudafed PE, Neo-Synephrine
Piroxicam • Feldene
Promethazine • Phenergan
Pseudoephedrine • Sudafed, Dimetapp
Quetiapine • Seroquel
Ranitidine • Zantac
Rifampin • Rifadin, Rimactane
Selegiline • EMSAM
Sertraline • Zoloft
Sulindac • Clinoril
Sumatriptan • Imitrex
Thioridazine • Mellaril
Tolmetin • Tolectin
Trazodone • Desyrel, Oleptro
Trimethobenzamide • Benzacot, Tigan
Trimipramine • Surmontil
Verapamil • Calan, Isoptin
1. Cobaugh DJ, Gainor C, Gaston CL, et al. The opioid abuse and misuse epidemic: implications for pharmacists in hospitals and health systems. Am J Health Syst Pharm. 2014;71(18):1539-1554.
2. Gilbert JW, Wheeler GR, Mick GE, et al. Importance of urine drug testing in the treatment of chronic noncancer pain: implications of recent medicare policy changes in Kentucky. Pain Physician. 2010;13(2):167-186.
3. Michna E, Jamison RN, Pham LD, et al. Urine toxicology screening among chronic pain patients on opioid therapy: frequency and predictability of abnormal findings. Clin J Pain. 2007;23(2):173-179.
4. U.S. Department of Justice. Fact sheet: drug testing in the criminal justice system. https://www.ncjrs.gov/pdffiles/dtest. pdf. Published March 1992. Accessed July 29, 2015.
5. Australian Diagnostic Services. Technical information: testing principle’s. http://www.australiandrugtesting. com/#!technical-info/c14h4. Accessed November 5, 2014.
6. University of Illinois at Chicago College of Pharmacy. What drugs are likely to interfere with urine drug screens? http://dig.pharm.uic.edu/faq/2011/Feb/faq1.aspx. Accessed November 5, 2014.
7. Wolff K, Farrell M, Marsden J, et al. A review of biological indicators of illicit drug use, practical considerations and clinical usefulness. Addiction. 1999;94(9):1279-1298.
8. Gourlay D, Heit H, Caplan YH. Urine drug testing in primary care – dispelling the myths & designing strategies. PharmaCom Group. http://www.mc.uky.edu/equip-4-pcps/documents/ section8/urine%20drug%20testing%20in%20clinical%20 practice.pdf. Accessed August 6, 2015.
9. Standridge JB, Adams SM, Zotos AP. Urine drug screen: a valuable office procedure. Am Fam Physician. 2010;81(5): 635-640.
10. Casey ER, Scott MG, Tang S, et al. Frequency of false positive amphetamine screens due to bupropion using the Syva EMIT II immunoassay. J Med Toxicol. 2011;7(2):105-108.
11. Casavant MJ. Urine drug screening in adolescents. Pediatr Clin N Am. 2002;49(2):317-327.
12. Shults TF. The medical review officer handbook. 7th ed. Chapel Hill, NC: Quadrangle Research; 1999.
13. Baden LR, Horowitz G, Jacoby H, et al. Quinolones and false-positive urine screening for opiates by immunoassay technology. JAMA. 2001;286(24):3115-3119.

Needed: A biopsychosocial ‘therapeutic placenta’ for people with schizophrenia
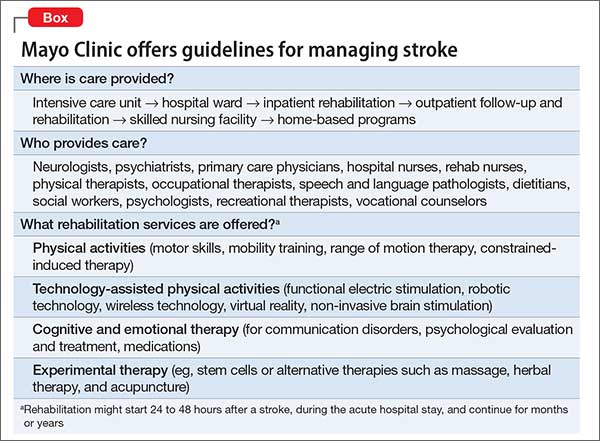
Consider stroke. Guidelines for acute treatment, access, intervention, prevention of post-hospitalization relapse, and rehabilitation are extensively spelled out and implemented.1 (The Box outlines Mayo Clinic guidelines for stroke management, as a demonstration of the comprehensiveness of the approach.)
Schizophrenia and related severe mental illnesses (SMI) need a similar all-inclusive system that seamlessly provides the myriad components of care needed for this vulnerable population. I propose the term “therapeutic placenta” to describe what people with a disabling SMI brain disorder deserve, just as stroke patients do.
Closing asylums: Psychosocial abruptio placentae
In a past Editorial,2 I described the appalling consequences of eliminating the asylum, an entity that I believe must be a key component of the SMI therapeutic placenta. The asylum is to schizophrenia as the skilled nursing home is to stroke. SMI patients suffered extensively when asylums were shut down; they lost a medical refuge with psychiatric and primary care, nursing and social work support, occupational and recreational therapies, and work therapy (farming, carpentry shop, cafeteria, laundry, etc.). For SMI, these services are the psychosocial counterpart of various physical rehabilitation therapies for stroke patients that no one would ever dare to eliminate.
Persons with schizophrenia and other SMI have suffered tragically with rupture of the main components of the therapeutic placenta that existed for decades before the advent of medications. The massive homelessness, widespread incarceration, persistent poverty, rampant access to alcohol and drugs of abuse, early death due to lack of primary care, and absence of meaningful opportunities for vocational rehabilitation are all consequences of a neglectful society that refuses to fund a therapeutic placenta for the SMI population.
The public mental health system in charge of SMI patients is broken, disconnected, and failing to provide the necessary components of a therapeutic placenta. It should not be surprising to witness the terribly stressful life and premature mortality of SMI patients, who are modern-day les misérables.
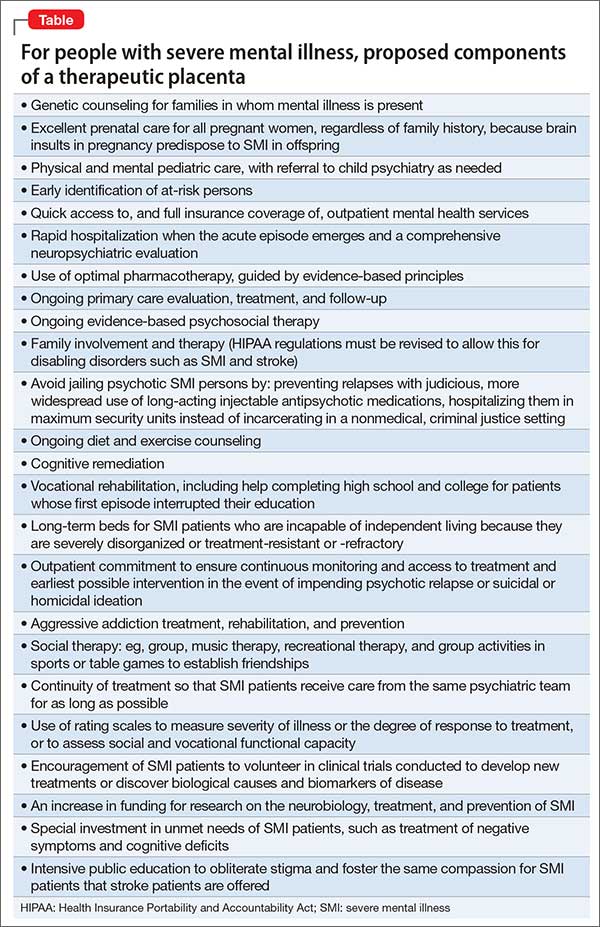
The Table lists what I consider to be the necessary spectrum of health care services through the life of an SMI patient that an optimal therapeutic placenta must provide until an effective prevention or a cure for SMI is discovered.
Reasons to be hopeful
Admittedly, encouraging steps are being made toward establishing a therapeutic placenta for SMI:
The RAISE Study3and Navigate Program4 demonstrate that implementing a comprehensive program of acute treatment and psychosocial interventions and rehabilitation yields better outcomes in SMI.
The Institute of Medicine released a landmark report on psychosocial interventions for mental illness and substance abuse disorders. It outlines a new model for establishing the effectiveness of intervention and the implementation of psychosocial strategies in clinical practice.5
The 21st Century Cures Act, if passed by Congress and signed by the President, will increase funding for the National Institutes of Health, which in turn will bolster the budgets of the National Institute of Mental Health, National Institute on Drug Abuse, and the National Institute on Alcohol Abuse and Alcoholism and enhance the chances of discovering better treatments and prevention of SMI.
The Helping Families in Mental Health Crisis Act, more directly relevant to mental health and psychiatry, proposes, if passed, to:
• enhance evidence-based and scientifically validated interventions in the public sector
• raise the profile of mental health within the federal government by creating a position of Assistant Secretary for Mental Health in the U.S. Department of Health and Human Services, who will have oversight of both research and mental health care within the federal government.
Unacceptable disparity must be remedied
Planning an effective therapeutic placenta is imperative if health care for SMI patients is to approach the comprehensive spectrum of treatment, rehabilitation, and prevention available to stroke patients. Although stroke is regarded as a sensory-motor brain disorder, it is also associated with mental symptoms, just as schizophrenia is associated with sensory-motor symptoms. Both are disabling brain disorders: one, physically and cognitively; the other, mentally and socially. Both require a therapeutic placenta: Stroke is supported by one; schizophrenia is not. This is an unacceptable disparity that must be addressed—soon.
1. Jauch EC, Saver JL, Adams HP Jr, et al; American Heart Association Stroke Council; Council on Cardiovascular Nursing; Council on Peripheral Vascular Disease; Council on Clinical Cardiology. Guidelines for the early management of patients with acute ischemic stroke: a guideline for healthcare professionals from the American Heart Association/American Stroke Association. Stroke. 2013;44(3):870-947.
2. Nasrallah HA. Bring back the asylums? Current Psychiatry. 2008;7(3):19-20.
3. Kane JM, Schooler NR, Marcy P, et al. The RAISE early treatment program for first-episode psychosis: background, rationale, and study design. J Clin Psychiatry. 2015;76(3):240-246.
4. Mueser KT, Penn DL, Addington J, et al. The NAVIGATE program for first-episode psychosis: rationale, overview, and description of psychosocial components. Psychiatr Serv. 2015;66(7):680-690.
5. The National Academy of Sciences. Psychosocial interventions for mental and substance use disorders: a framework for establishing evidence-based standards. Washington, DC. http:// iom.nationalacademies.org/Reports/2015/ Psychosocial-Interventions-Mental-Substance- Abuse-Disorders.aspx. Published July 14, 2015. Accessed September 3, 2015.
Consider stroke. Guidelines for acute treatment, access, intervention, prevention of post-hospitalization relapse, and rehabilitation are extensively spelled out and implemented.1 (The Box outlines Mayo Clinic guidelines for stroke management, as a demonstration of the comprehensiveness of the approach.)
Schizophrenia and related severe mental illnesses (SMI) need a similar all-inclusive system that seamlessly provides the myriad components of care needed for this vulnerable population. I propose the term “therapeutic placenta” to describe what people with a disabling SMI brain disorder deserve, just as stroke patients do.
Closing asylums: Psychosocial abruptio placentae
In a past Editorial,2 I described the appalling consequences of eliminating the asylum, an entity that I believe must be a key component of the SMI therapeutic placenta. The asylum is to schizophrenia as the skilled nursing home is to stroke. SMI patients suffered extensively when asylums were shut down; they lost a medical refuge with psychiatric and primary care, nursing and social work support, occupational and recreational therapies, and work therapy (farming, carpentry shop, cafeteria, laundry, etc.). For SMI, these services are the psychosocial counterpart of various physical rehabilitation therapies for stroke patients that no one would ever dare to eliminate.
Persons with schizophrenia and other SMI have suffered tragically with rupture of the main components of the therapeutic placenta that existed for decades before the advent of medications. The massive homelessness, widespread incarceration, persistent poverty, rampant access to alcohol and drugs of abuse, early death due to lack of primary care, and absence of meaningful opportunities for vocational rehabilitation are all consequences of a neglectful society that refuses to fund a therapeutic placenta for the SMI population.
The public mental health system in charge of SMI patients is broken, disconnected, and failing to provide the necessary components of a therapeutic placenta. It should not be surprising to witness the terribly stressful life and premature mortality of SMI patients, who are modern-day les misérables.
The Table lists what I consider to be the necessary spectrum of health care services through the life of an SMI patient that an optimal therapeutic placenta must provide until an effective prevention or a cure for SMI is discovered.
Reasons to be hopeful
Admittedly, encouraging steps are being made toward establishing a therapeutic placenta for SMI:
The RAISE Study3and Navigate Program4 demonstrate that implementing a comprehensive program of acute treatment and psychosocial interventions and rehabilitation yields better outcomes in SMI.
The Institute of Medicine released a landmark report on psychosocial interventions for mental illness and substance abuse disorders. It outlines a new model for establishing the effectiveness of intervention and the implementation of psychosocial strategies in clinical practice.5
The 21st Century Cures Act, if passed by Congress and signed by the President, will increase funding for the National Institutes of Health, which in turn will bolster the budgets of the National Institute of Mental Health, National Institute on Drug Abuse, and the National Institute on Alcohol Abuse and Alcoholism and enhance the chances of discovering better treatments and prevention of SMI.
The Helping Families in Mental Health Crisis Act, more directly relevant to mental health and psychiatry, proposes, if passed, to:
• enhance evidence-based and scientifically validated interventions in the public sector
• raise the profile of mental health within the federal government by creating a position of Assistant Secretary for Mental Health in the U.S. Department of Health and Human Services, who will have oversight of both research and mental health care within the federal government.
Unacceptable disparity must be remedied
Planning an effective therapeutic placenta is imperative if health care for SMI patients is to approach the comprehensive spectrum of treatment, rehabilitation, and prevention available to stroke patients. Although stroke is regarded as a sensory-motor brain disorder, it is also associated with mental symptoms, just as schizophrenia is associated with sensory-motor symptoms. Both are disabling brain disorders: one, physically and cognitively; the other, mentally and socially. Both require a therapeutic placenta: Stroke is supported by one; schizophrenia is not. This is an unacceptable disparity that must be addressed—soon.
1. Jauch EC, Saver JL, Adams HP Jr, et al; American Heart Association Stroke Council; Council on Cardiovascular Nursing; Council on Peripheral Vascular Disease; Council on Clinical Cardiology. Guidelines for the early management of patients with acute ischemic stroke: a guideline for healthcare professionals from the American Heart Association/American Stroke Association. Stroke. 2013;44(3):870-947.
2. Nasrallah HA. Bring back the asylums? Current Psychiatry. 2008;7(3):19-20.
3. Kane JM, Schooler NR, Marcy P, et al. The RAISE early treatment program for first-episode psychosis: background, rationale, and study design. J Clin Psychiatry. 2015;76(3):240-246.
4. Mueser KT, Penn DL, Addington J, et al. The NAVIGATE program for first-episode psychosis: rationale, overview, and description of psychosocial components. Psychiatr Serv. 2015;66(7):680-690.
5. The National Academy of Sciences. Psychosocial interventions for mental and substance use disorders: a framework for establishing evidence-based standards. Washington, DC. http:// iom.nationalacademies.org/Reports/2015/ Psychosocial-Interventions-Mental-Substance- Abuse-Disorders.aspx. Published July 14, 2015. Accessed September 3, 2015.
Online Refill Reduces Time Without Statins in Diabetes Patients
NEW YORK - Diabetes patients in the Kaiser Health System spent more days with their prescribed statins on hand if they used Kaiser's online refill tool, a study shows.
The researchers looked specifically at racial and ethnic minorities and found that while these groups had poorer medication adherence than white patients before using the online refills, using the online refills conferred the same benefit for every group.
"Many other systems are implementing online portals other than Kaiser," said lead author Dr. Courtney Lyles in a phone interview. "The key message that our study puts forward is that providing tools to help with medication adherence is critical."
Lyles, an affiliate investigator at the Kaiser Permanente Division of Research and assistant professor at the University of California, San Francisco, and her colleagues studied patients in the type 2 diabetes registry in Kaiser Permanente Northern California between 2006 and 2012.
All had access to online patient tools that allow for viewing medical history and visit summaries, viewing laboratory results, scheduling appointments, sending and receiving secure email messages with providers, and requesting prescription refills.
Patients could request a prescription refill online and receive the medication by mail or pick it up in person at the pharmacy.
The researchers compared diabetes patients with statin prescriptions who used the online refill tool to those who did not, and compared individual patients before and after they started using the online refills.
According to pharmacy data, at baseline, whites on average spent about 12% of the time without having the medicine on hand, compared to about 16% of the time for blacks and Latinos, and about 13% of the time for Asians and Filipinos.
But when patients switched from other refill habits to exclusively online refills, they reduced their time without statins by more than 3%, the researchers reported in an article online September 2 in the Journal of the American Medical Informatics Association.
Racial and ethnic minority patients are less likely to use online portals, even after adjusting for Internet access or use of Internet in everyday life, Lyles said.
"There is a concern that if particular populations are less likely to use these portals, then perhaps the benefits will be differential," she said. "But we found that racial minorities are less likely to use it overall, but have the same benefit in adherence."
Online portals do appear to make prescription refills more convenient, and people using the portals reduced the number of days without medication by 10 or 15 days per year, according to Dr. Jessica S. Ancker, a health care policy researcher at Weill Cornell Medical College in New York City, who was not part of the new study.
Healthcare organizations started offering online portals as a "leap of faith," assuming they would improve patient experiences, but without any concrete proof, she said.
"A new wave of research measures whether it's improving things," she said.
The Agency for Healthcare Research and Quality funded this research.
Pregnant cancer patients: Start treatment ASAP

Photo by Nina Matthews
VIENNA—Women who are pregnant when diagnosed with cancer should carry their child to term but start cancer treatment immediately, according to researchers.
A study of young children suggested that exposure to cancer treatment in utero did not have detrimental effects on a child’s mental development or heart function.
Premature delivery, on the other hand, was associated with delayed cognitive development.
“Our results show that fear of cancer treatment is no reason to terminate a pregnancy, that maternal treatment should not be delayed, and that chemotherapy can be given,” said Frederic Amant, MD, PhD, of University Hospitals Leuven in Belgium.
“The study also shows that children suffer more from prematurity than from chemotherapy, so avoiding prematurity is more important than avoiding chemotherapy.”
Dr Amant presented these findings at the 2015 European Cancer Congress. The study was also published in NEJM.
The study included 129 children born to mothers with cancer, matched with 129 children of the same gestational age who were born to mothers unaffected by cancer.
The most common malignancies were breast (n=69) and hematologic cancers. This included acute myeloid leukemia (n=4), acute lymphoblastic leukemia (n=1), chronic myeloid leukemia (n=1), Hodgkin lymphoma (n=8), and non-Hodgkin lymphoma (n=6).
The researchers assessed the children’s general health and mental development when they were 18 months and 3 years old. At the age of 3, 47 of the children also had their heart function checked with electrocardiograms and echocardiography.
Ninety-six children (74.4%) were exposed to chemotherapy (alone or in combination with other treatment) before birth, 11 children (8.5%) were exposed to radiotherapy (alone or in combination), 13 (10.1%) were exposed to surgery alone, and 2 (1.6%) were exposed to drugs other than chemotherapeutic agents. Fourteen (10.9%) mothers did not receive cancer treatment during pregnancy.
Mental development
“Compared to the control group of children, we found no significant differences in mental development among children exposed to chemotherapy, radiotherapy, surgery alone, or no treatment,” Dr Amant said. “Nor was the number of chemotherapy cycles during pregnancy, which ranged from 1 to 10, related to the outcome of the children.”
To measure cognitive development, the researchers used the Bayley Scales of Infant Development. The median score was 101 (range, 56-145) in children exposed to cancer treatment and 100 (range, 50-145) in unexposed children.
When compared to controls, there was no significant difference in Bayley II or III score for all children born to mothers with cancer (P=0.08), children exposed to any chemotherapy (P=0.43), children exposed to anthracyclines (P=0.43), children exposed to taxanes (P=0.57), children exposed to platinum derivatives (P=0.95), children exposed to radiotherapy (P=0.69), children exposed to surgery alone (P=0.13), and children whose mothers did not undergo treatment (P=0.08).
Premature birth
Conversely, Bayley scores tended to increase by an average of 2.9 points for every week in gestational age. This was after the researchers controlled for a child’s age, gender, country, ethnicity, and parental education level.
“Delayed development of mental processes appeared to be related to premature birth,” Dr Amant said.
Premature birth was more frequent among children born to mothers with cancer, regardless of whether or not they received prenatal treatment, than in the general population in the countries participating in this study (Belgium, The Netherlands, Italy, and the Czech Republic).
The children born to mothers with cancer had a median gestational age of 36 weeks, ranging from 27 to 41 weeks. Seventy-nine (61.2%) children were born preterm, compared to 7% to 8% in the general population.
“In most cases, they were born prematurely due to a medical decision to induce preterm so as to continue cancer treatment after the delivery,” Dr Amant said.
“In some cases, preterm delivery was spontaneous, and it is possible that cancer treatment plays a role in this. But we do not know what exactly triggers preterm delivery. It could be that chemotherapy induces preterm contractions or vaginal inflammation with preterm rupture of the membranes.”
Cardiac function
The researchers assessed cardiac function in 47 three-year-olds whose mothers had cancer and 47 control children.
There were no significant differences between the exposed and control children for most measures of cardiac function, such as heart rate, ejection fraction, fractional shortening, global longitudinal strain, and circumferential strain.
The only exceptions were diastolic blood pressure, which was higher among exposed children (P=0.001), and tissue Doppler imaging measurements of the basal segment of the interventricular septum. There were higher mean peak systolic and early diastolic velocities in the control group than the exposed group (P=0.003 for both comparisons).
The researchers noted, however, that the differences in tissue Doppler velocities were not present when comparing the control group and the 26 children who were exposed to anthracyclines.
Next steps
Last year, Dr Amant reported similarly favorable results in 54 children exposed to chemotherapy or radiation in utero. The new report is a continuation of this work.
“These latest results are, again, reassuring,” Dr Amant said. “But given that we have a larger group of children . . . , the current data are much more robust.”
However, he also pointed out that this study has some limitations.
“Our data include many types of chemotherapy, but we cannot guarantee that all types of chemotherapy are safe,” Dr Amant said. “We need to look at larger numbers of children and larger numbers exposed to each drug in order to be able to document the potential effects of individual drugs.”
“In addition, we cannot extrapolate to newer drugs, including targeted drugs. We need longer follow-up to see if there are any long-term toxic effects in cases where cisplatin was administered before birth.”
“For these reasons, we will continue to follow these children until the age of 18 years, and we will enlarge the group. This will allow us to document longer-term effects and to draw conclusions for specific drugs. In addition, we will investigate to what extent anticancer drugs are diluted in the body during pregnancy and also [examine] the psycho-emotional needs of mothers and their partners.” ![]()
Combo demonstrates potential in MM

ROME—Early results of a pilot study indicate that a 3-agent combination regimen can produce responses in patients with relapsed or refractory multiple myeloma (MM).
The treatment consists of carfilzomib, dexamethasone, and pelareorep (Reolysin), a proprietary isolate of human reovirus (Type 3 Dearing strain).
All 8 evaluable patients treated with this regimen experienced an objective response, although 1 patient later progressed.
The investigators said the regimen has been relatively well tolerated, but most patients experience flu-like symptoms over the first week of treatment. And cytopenias, especially thrombocytopenia, are common.
Douglas Sborov, MD, of The Ohio State University in Columbus, and his colleagues presented this research at the 15th International Myeloma Workshop (poster #379).
The investigators noted that this is the first time a pelareorep-based combination has been tested in relapsed MM patients. A previous single-agent study indicated that pelareorep was well tolerated, and preclinical research has shown that reovirus and carfilzomib synergize to kill MM cells.
To expand upon these results, Dr Sborov and colleagues began testing pelareorep with carfilzomib and dexamethasone in patients with relapsed/refractory MM. The ongoing study, known as NCI-9603, is sponsored by the National Cancer Institute.
Of the 8 patients enrolled thus far, 5 had intermediate- or high-risk disease at baseline, and 1 patient was dialysis-dependent. The median age was 63 (range, 43-70).
Patients had received a median of 2 prior lines of therapy (range, 1-6) and a median of 4 prior treatments (range, 2-8). All of the patients had received lenalidomide, 1 had received carfilzomib, and 4 were refractory to bortezomib.
For the current study, patients were assigned to receive dexamethasone, carfilzomib over 10 minutes, and pelareorep over 60 minutes on days 1, 2, 8, 9, 15, and 16. Treatment is set to repeat every 28 days in the absence of disease progression or unacceptable toxicity.
Patients who achieve a minimal response or better may reduce treatment to days 1, 8, and 15 after 4 courses and to days 1 and 15 after 12 courses.
Treatment results
The investigators said the treatment produced a significant (P=0.005) increase in caspase-3, a marker associated with apoptotic cell death.
The combination was also associated with an increased infiltration of CD8+ T cells and the significant (P=0.005) upregulation of PD-L1, suggesting the addition of a PD-1 or PD-L1 inhibitor might further optimize the regimen.
All 8 patients experienced an objective response to treatment, as measured by changes in blood monoclonal protein. Two patients had a very good partial response, 3 had a partial response, and 3 had a minor response.
Five of the patients remain on study. The dialysis-dependent patient discontinued treatment due to progression after 3 treatment cycles. And 2 patients discontinued treatment due to dose-limiting toxicities after 2 doses.
One of the patients with dose-limiting toxicities had grade 4 myocarditis, grade 3 left ventricular dysfunction, and grade 4 respiratory failure possibly attributable to pelareorep and carfilzomib. The other patient had lower gastrointestinal bleeding that was not attributed to treatment.
Adverse events in cycle 1 that were possibly, likely, or definitely attributed to treatment included hypertension (n=5), thrombocytopenia (n=4), anemia (n=4), dyspnea on exertion (n=4), fatigue (n=4), myalgia (n=3), fever (n=2), leukopenia (n=2), lymphopenia (n=2), nausea (n=2), and diarrhea (n=2).
For more details, visit the Oncolytics Biotech Inc. website to view the poster. Oncolytics is the company developing pelareorep. ![]()
CHMP recommends blinatumomab for ALL

The European Medicines Agency’s Committee for Medicinal Products for Human Use (CHMP) has recommended conditional marketing authorization for blinatumomab (Blincyto) to treat adults with relapsed or refractory Philadelphia chromosome-negative (Ph-) B-precursor acute lymphoblastic leukemia (ALL).
Blinatumomab is a bispecific T-cell engager (BiTE®) antibody construct that binds to CD19 on the surface of B cells and CD3 on the surface of T cells.
The product already has conditional approval in the US to treat patients with relapsed or refractory Ph- B-precursor ALL.
The CHMP’s positive opinion of blinatumomab will be reviewed by the European Commission (EC).
The EC usually follows the CHMP’s recommendations and is expected to deliver its final decision within 3 months. The EC’s decision will apply to the 28 member countries of the European Union, as well as Iceland, Lichtenstein, and Norway.
Conditional marketing authorizations are valid for 1 year, on a renewable basis. The holder is required to complete ongoing studies or conduct new studies with the goal of confirming that a drug’s benefit-risk balance is positive.
Conditional marketing authorization is converted to a full authorization once these commitments have been fulfilled.
The conditional marketing authorization application for blinatumomab is based on a pair of phase 2 trials—Study ‘211 and Study ‘206.
Study ‘211
Results of Study ‘211 were presented at EHA 2014. The trial included 189 patients with Ph- relapsed or refractory B-precursor ALL.
The primary endpoint was complete remission or complete remission with partial hematologic recovery (CR/CRh). About 43% of patients achieved this endpoint within 2 cycles of therapy.
According to researchers, the most serious adverse events in this study were infection (31.7%), neurologic events (16.4%), neutropenia/febrile neutropenia (15.3%), cytokine release syndrome (CRS, 0.5%), and tumor lysis syndrome (0.5%).
Study ‘206
Results of Study ‘206 were presented at ASCO 2012. The trial included 36 patients with relapsed or refractory B-precursor ALL.
In this trial, the CR/CRh rate was 69.4% (25/36), with 15 patients achieving a CR (41.7%), and 10 patients achieving CRh (27.8%).
The “medically important” adverse events in this study, according to researchers, were CRS (n=3), central nervous system (CNS) events (3 seizures and 3 cases of encephalopathy), and fungal infection resulting in death (n=1).
However, the researchers found they could prevent CRS with dexamethasone. In addition, the CNS events were reversible, and blinatumomab could be reintroduced in 4 of the 6 patients with CNS events.
Blinatumomab is under development by Amgen. For more details on the drug, visit www.blincyto.com. ![]()
CHMP recommends authorization for idarucizumab

Image by Andre E.X. Brown
The European Medicines Agency’s Committee for Medicinal Products for Human Use (CHMP) is recommending that idarucizumab receive marketing authorization in the European Union.
Idarucizumab (to be marketed as Praxbind) is a humanized antibody fragment designed to reverse the anticoagulant effects of dabigatran etexilate (Pradaxa).
Idarucizumab is intended for patients who must undergo emergency surgery/urgent procedures and those who experience uncontrolled or life-threatening bleeding while on dabigatran.
The CHMP’s positive opinion of idarucizumab will be reviewed by the European Commission (EC).
The EC usually follows the CHMP’s recommendations and is expected to deliver its final decision within 3 months. The EC’s decision will apply to the 28 member countries of the European Union, as well as Iceland, Lichtenstein, and Norway.
The CHMP’s positive opinion was based on results with idarucizumab in healthy volunteers and an interim analysis of the phase 3 RE-VERSE AD trial.
In the study of healthy volunteers, the pharmacokinetic profile of idarucizumab met the requirement for rapid peak exposure and rapid elimination, with no effect on pharmacodynamic parameters. And researchers said the drug was well tolerated.
In RE-VERSE AD, researchers evaluated idarucizumab in emergency settings. The drug normalized diluted thrombin time and ecarin clotting time in a majority of dabigatran-treated patients with uncontrolled or life-threatening bleeding complications and most patients who required emergency surgery or an invasive procedure.
The researchers said there were no safety concerns related to idarucizumab. However, 23% of patients in this trial experienced serious adverse events, 20% of patients died, and several patients had thrombotic or bleeding events.
Idarucizumab is being developed by Boehringer Ingelheim, the company that makes dabigatran.
Idarucizumab is currently under review by regulatory authorities worldwide, including the US Food and Drug Administration. Boehringer Ingelheim plans to submit idarucizumab in all countries where dabigatran is licensed. ![]()
Cardiac biomarkers predict cancer mortality
High circulating levels of six cardiovascular biomarkers predicted cancer mortality even before the start of treatment and regardless of tumor type or stage, according to a study published online Sept. 28 in Heart.
Cancer patients had high levels of these biomarkers even though they had no clinical signs of heart disease or concurrent infections, wrote Noemi Pavo of Medical University of Vienna. The findings suggest that these patients could benefit from enhanced heart failure therapies that go beyond the current focus on preventing cardiotoxic side effects of chemotherapy and radiotherapy, noted Dr. Pavo and her associates.
Cardiovascular hormone and peptide levels can rise during cancer treatment, but whether cancer itself affects these biomarkers has been unclear, the investigators said. Therefore, they prospectively measured levels of five cardiovascular hormones – NT-proBNP, MR-proANP, MR-proADM, CT-pro-ET, and copeptin – in addition to high-sensitive troponin, the proinflammatory markers interleukin 6 and C-reactive protein, and cytokines serum amyloid A, haptoglobin, and fibronectin, in 555 patients with newly diagnosed, as-yet-untreated cancer (Heart 2015 Sep 28. doi:10.1136/heartjnl-2015-307848).
A total of 186 patients (34%) died after an average of 25 months of follow-up, the researchers reported. Levels of all cardiovascular hormones and hsTnT increased with tumor stage progression. After the researchers controlled for age, tumor type, tumor stage, glomerular filtration rate, and cardiac status, rising levels of all five cardiac hormones and hsTnT independently predicted mortality, with adjusted hazard ratios ranging from 1.21 for CT-proET-1 and hsTnT to 1.54 for the natural logarithm of NT-proBNP, and P values ranging from .014 to less than.001.
“All of these markers are strongly related to mortality, implying a direct association with disease progression,” the researchers said. “While our endpoint [was] all-cause mortality, precise information about the percentage of cardiovascular-related death would certainly be of important clinical interest. Since post hoc interpretations of certifications of death are not reliable, the development of a cardiac disease during cancer progression should be documented in longitudinal studies in the future.”
An unrestricted grant from Thermo Fisher funded the study. The researchers declared no competing interests.
This study opens the potential for new management strategies integrating cardiology and oncology. Treating overt and perhaps subclinical cardiac dysfunction may improve outcomes in patients with cancer, and may possibly improve progression-free cancer survival based on optimizing cancer treatment and preventing interruptions. These biomarkers could serve as a surveillance strategy for both cardiologists and oncologists. It would be equally tantalizing to know whether treating the cancer effectively improves cardiac outcomes, but this will be more challenging to unravel if the cancer treatment imparts potential cardiotoxicity.
The key next stage will be to reproduce these findings in a prospectively designed multicenter study with larger numbers to validate the conclusion, collect the mode of death, and also to consider whether serial biomarker assessment adds further predictive power. Pavo et al. should be congratulated on bringing to our attention the widening complexity of biomarker biology and the potential to identify single biomarkers with the unique properties to predict both cardiovascular and oncology outcomes.
Dr. Alexander Lyon is at Imperial College and Royal Brompton Hospital in London. He reported receiving research funding and having consulting and advisory relationships with Pfizer, Onyx Pharmaceuticals, Ferring Pharmaceuticals, and Clinigen Group. These remarks are from his editorial (Heart 2015 Sep. 28. doi:10.1136/heartjnl-2015-308208).
High circulating levels of six cardiovascular biomarkers predicted cancer mortality even before the start of treatment and regardless of tumor type or stage, according to a study published online Sept. 28 in Heart.
Cancer patients had high levels of these biomarkers even though they had no clinical signs of heart disease or concurrent infections, wrote Noemi Pavo of Medical University of Vienna. The findings suggest that these patients could benefit from enhanced heart failure therapies that go beyond the current focus on preventing cardiotoxic side effects of chemotherapy and radiotherapy, noted Dr. Pavo and her associates.
Cardiovascular hormone and peptide levels can rise during cancer treatment, but whether cancer itself affects these biomarkers has been unclear, the investigators said. Therefore, they prospectively measured levels of five cardiovascular hormones – NT-proBNP, MR-proANP, MR-proADM, CT-pro-ET, and copeptin – in addition to high-sensitive troponin, the proinflammatory markers interleukin 6 and C-reactive protein, and cytokines serum amyloid A, haptoglobin, and fibronectin, in 555 patients with newly diagnosed, as-yet-untreated cancer (Heart 2015 Sep 28. doi:10.1136/heartjnl-2015-307848).
A total of 186 patients (34%) died after an average of 25 months of follow-up, the researchers reported. Levels of all cardiovascular hormones and hsTnT increased with tumor stage progression. After the researchers controlled for age, tumor type, tumor stage, glomerular filtration rate, and cardiac status, rising levels of all five cardiac hormones and hsTnT independently predicted mortality, with adjusted hazard ratios ranging from 1.21 for CT-proET-1 and hsTnT to 1.54 for the natural logarithm of NT-proBNP, and P values ranging from .014 to less than.001.
“All of these markers are strongly related to mortality, implying a direct association with disease progression,” the researchers said. “While our endpoint [was] all-cause mortality, precise information about the percentage of cardiovascular-related death would certainly be of important clinical interest. Since post hoc interpretations of certifications of death are not reliable, the development of a cardiac disease during cancer progression should be documented in longitudinal studies in the future.”
An unrestricted grant from Thermo Fisher funded the study. The researchers declared no competing interests.
FROM HEART
Key clinical point: High levels of cardiac hormones and peptides predicted mortality in patients with first-time, as-yet-untreated cancer.
Major finding: Rising levels of all biomarkers significantly predicted mortality, with adjusted hazard ratios ranging from 1.21 to 1.54.
Data source: Prospective observational study of 555 cancer patients.
Disclosures: An unrestricted grant from Thermo Fisher funded the study. The researchers declared no competing interests.
S. lugdunensis osteoarticular infection often linked to orthopedic devices
SAN DIEGO – Bone and joint infections caused by Staphylococcus lugdunensis are an underestimated hospital-acquired infection often associated with orthopedic devices, according to a multicenter study.
“Consider potential relapse even after 1 year of the end of antibiotic treatment and follow patients with bone and joint infections caused by S. lugdunensis for a minimum 2 years after the end of treatment,” lead study author Dr. Piseth Seng said in an interview at the annual Interscience Conference on Antimicrobial Agents and Chemotherapy.

S. lugdunensis is a virulent coagulase-negative staphylococcus which behaves like S. aureus. Prior to the current study, only 47 cases are believed to be published in the medical literature, according to Dr. Seng of the department of internal medicine at Assistance Publique des Hôpitaux de Marseille (France). The purpose of the current study was to report a series of 138 cases of S. lugdunensis osteoarticular infection managed in nine hospital centers and three private clinics in France from January 1995 to December 2014.
The mean age of patients was 61 years, and 68% were male. Of the 138 cases, 113 (82%) were associated with an orthopedic device, including 2 cases of infection after anterior cruciate ligament reconstruction, 66 cases of prosthetic joint infection, and 3 cases of vertebral orthopedic device infection. The majority of orthopedic device infections (88%) occurred more than 1 month after implantation, while the remaining 12% occurred within the first month of implantation.
The researchers identified 30 cases (22%) of bone and joint infection that occurred in the absence of an orthopedic device, including 7 cases of arthritis, 21 cases of osteitis, and 2 cases of vertebral osteomyelitis.
The majority of patients (91%) received a combination of antibiotic and surgical treatment, including amputation (6%), orthopedic prosthesis removal (14%), internal orthopedic device removal (23%), and surgical debridement and retention of the orthopedic device (41%). The proportion of S. lugdunensis strains with reduced susceptibility to antistaphylococcal agents was low. Resistant strains included five to oxacillin, four to fosfomycin, two to fusidic acid, two to co-trimoxazole, one to rifampicin, and one to clindamycin.
To date, relapses have occurred in 19% of the 123 patients in whom researchers have complete follow-up data. The readmission rate among these patients was 76%, and four (3%) died of their infection. “These relapses were not associated with risk factor or comorbidity or polymicrobial infection,” noted Dr. Seng, who characterized the incidence of bone and joint infections caused by S. lugdunensis as being under reported. “S. lugdunensis is known as an organism forming biofilms, but treatment options (surgical debridement or prosthesis removal) did not influence clinical outcomes.”
The mean time to relapse was 305 days and no risk factor or comorbidity was associated with relapse.
Dr. Seng acknowledged that the study was limited by its retrospective design. He and his associates reported having no financial disclosures.
SAN DIEGO – Bone and joint infections caused by Staphylococcus lugdunensis are an underestimated hospital-acquired infection often associated with orthopedic devices, according to a multicenter study.
“Consider potential relapse even after 1 year of the end of antibiotic treatment and follow patients with bone and joint infections caused by S. lugdunensis for a minimum 2 years after the end of treatment,” lead study author Dr. Piseth Seng said in an interview at the annual Interscience Conference on Antimicrobial Agents and Chemotherapy.
S. lugdunensis is a virulent coagulase-negative staphylococcus which behaves like S. aureus. Prior to the current study, only 47 cases are believed to be published in the medical literature, according to Dr. Seng of the department of internal medicine at Assistance Publique des Hôpitaux de Marseille (France). The purpose of the current study was to report a series of 138 cases of S. lugdunensis osteoarticular infection managed in nine hospital centers and three private clinics in France from January 1995 to December 2014.
The mean age of patients was 61 years, and 68% were male. Of the 138 cases, 113 (82%) were associated with an orthopedic device, including 2 cases of infection after anterior cruciate ligament reconstruction, 66 cases of prosthetic joint infection, and 3 cases of vertebral orthopedic device infection. The majority of orthopedic device infections (88%) occurred more than 1 month after implantation, while the remaining 12% occurred within the first month of implantation.
The researchers identified 30 cases (22%) of bone and joint infection that occurred in the absence of an orthopedic device, including 7 cases of arthritis, 21 cases of osteitis, and 2 cases of vertebral osteomyelitis.
The majority of patients (91%) received a combination of antibiotic and surgical treatment, including amputation (6%), orthopedic prosthesis removal (14%), internal orthopedic device removal (23%), and surgical debridement and retention of the orthopedic device (41%). The proportion of S. lugdunensis strains with reduced susceptibility to antistaphylococcal agents was low. Resistant strains included five to oxacillin, four to fosfomycin, two to fusidic acid, two to co-trimoxazole, one to rifampicin, and one to clindamycin.
To date, relapses have occurred in 19% of the 123 patients in whom researchers have complete follow-up data. The readmission rate among these patients was 76%, and four (3%) died of their infection. “These relapses were not associated with risk factor or comorbidity or polymicrobial infection,” noted Dr. Seng, who characterized the incidence of bone and joint infections caused by S. lugdunensis as being under reported. “S. lugdunensis is known as an organism forming biofilms, but treatment options (surgical debridement or prosthesis removal) did not influence clinical outcomes.”
The mean time to relapse was 305 days and no risk factor or comorbidity was associated with relapse.
Dr. Seng acknowledged that the study was limited by its retrospective design. He and his associates reported having no financial disclosures.
AT ICAAC 2015
Key clinical point: S. lugdunensis infections are often associated with orthopedic devices.
Major finding: Of 138 cases of S. lugdunensis osteoarticular infection, 113 (82%) were associated with an orthopedic device.
Data source: A retrospective study of 138 cases of S. lugdunensis osteoarticular infection managed in nine hospitals and three private clinics in France.
Disclosures: The researchers reported having no financial disclosures.