User login
Family Medicine’s Increasing Presence in Hospital Medicine
Years ago, I struggled with a difficult decision. Given the fact that the military disallowed dual training tracks, such as internal medicine/pediatrics (med/peds), I had to choose from internal medicine (IM), pediatrics (Peds), or family practice (FP) residencies. My personal history and experiential data remained incomplete and the view ahead blurry; still, the choice remained.
Over time, I’ve embraced the uncertainty inherent in most analyses. Such is the case with the current composition of specialties that make up hospital medicine nationwide. Available data remains in flux, yet I see apparent trends.
A new question in the 2014 State of Hospital Medicine (SOHM) report asked, “Did your hospital medicine group employ hospitalist physicians trained and certified in the following specialties…?” Strikingly, a full 59% of groups serving adult patients only reported having at least one family medicine-trained provider in their midst! And in these adult-only practices, 98% of groups utilized at least one internal medicine physician, 24% reported a med/peds doc, and none reported pediatricians.

Meanwhile, of 40 groups caring for children only, 95% reported using pediatrics, 2.5% internal medicine (huh?), 22.5% med/peds, and zero FPs. The 19 groups serving both adults and children revealed participation from all four nonsurgical hospitalist specialties (IM, peds, FP, med/peds).
So what is the specialty distribution of medical hospitalists overall? There’s no good data about this.
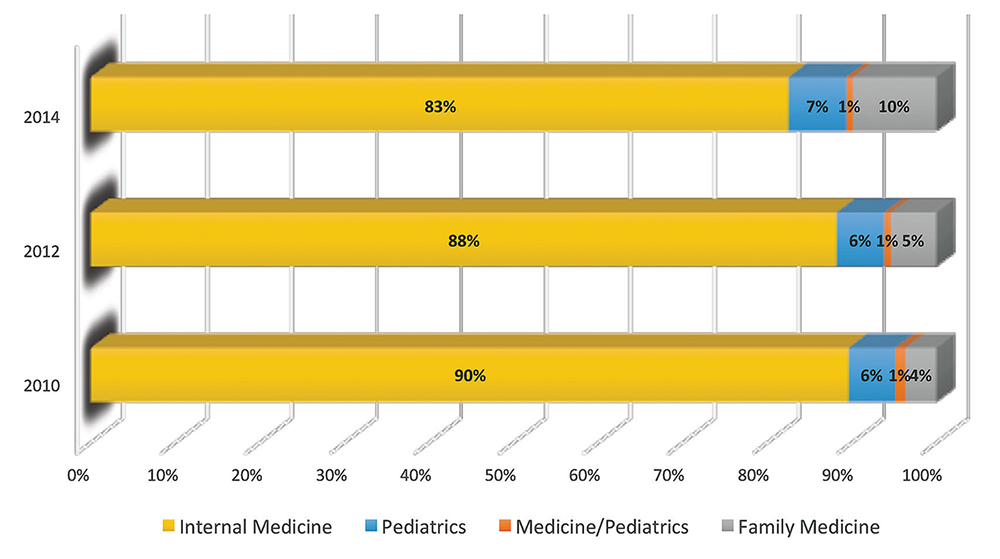
The 2014 Medical Group Management Association (MGMA) sample, licensed for use in SOHM, reported data for roughly 4,200 community hospital medicine providers: 82% were internal medicine, 10% family medicine, 7% pediatrics, and <1% med/peds. MGMA, however, cautions against assuming that this represents the entire population of hospitalists and their training. Although representative of the groups who participated in the survey, it may not be representative of groups that didn’t participate, and thus it would be misleading to suggest that this distribution holds true nationally.
In an effort to corroborate the MGMA distribution, I reviewed other compensation and productivity surveys; one such survey, conducted by the American Medical Group Association, reported hospitalists by training program. It contained over 3,700 community hospital providers—89% internal medicine, 6% family medicine, 5% pediatrics—but did not inquire about medicine/pediatrics.
Finally, if one combines the academic and community provider samples from MGMA (n=4,867), the distribution is 80% IM, 8.5% FP, 10% peds, and <1% med/peds.
Which of these, if any, is the actual distribution of nonprocedural hospitalists? Although we cannot know exactly, I believe something close to the following to be current state: internal medicine 80%, family medicine 10%, pediatrics 10%, and medicine/pediatrics <1%.
It is clear from survey trends that the proportion of family medicine providers is growing, while the internal medicine super-majority is shrinking somewhat. Pediatrics appears to remain stable as a proportion of the total, as does med/peds, with the latter unable to grow in numbers proportionally given the small number of providers nationally compared to the other three fields.
The growth of family medicine-trained hospitalists relates to the continued high demand for the profession, with such residents comprising the largest pool of available providers, second only to internal medicine.
Based on the SHM survey, family medicine hospitalists seem to practice similarly to IM; they generally see adults only. It appears that they are accepted into traditional adult hospitalist practices, readily contrasting with groups serving children, which report no FP participation. Meanwhile, med/peds hospitalists provide care across the spectrum of hospitalist groups, though they often report splitting their duties between adults-only services and pediatric services.
As for me, a generation removed from my election of a family practice internship and subsequent transition to internal medicine residency, I should not have worried so. Both paths can lead to hospital medicine.
Dr. Ahlstrom is a hospitalist at Indigo Health Partners in Traverse City, Mich., and a member of SHM’s Practice Analysis Committee.
Years ago, I struggled with a difficult decision. Given the fact that the military disallowed dual training tracks, such as internal medicine/pediatrics (med/peds), I had to choose from internal medicine (IM), pediatrics (Peds), or family practice (FP) residencies. My personal history and experiential data remained incomplete and the view ahead blurry; still, the choice remained.
Over time, I’ve embraced the uncertainty inherent in most analyses. Such is the case with the current composition of specialties that make up hospital medicine nationwide. Available data remains in flux, yet I see apparent trends.
A new question in the 2014 State of Hospital Medicine (SOHM) report asked, “Did your hospital medicine group employ hospitalist physicians trained and certified in the following specialties…?” Strikingly, a full 59% of groups serving adult patients only reported having at least one family medicine-trained provider in their midst! And in these adult-only practices, 98% of groups utilized at least one internal medicine physician, 24% reported a med/peds doc, and none reported pediatricians.
Meanwhile, of 40 groups caring for children only, 95% reported using pediatrics, 2.5% internal medicine (huh?), 22.5% med/peds, and zero FPs. The 19 groups serving both adults and children revealed participation from all four nonsurgical hospitalist specialties (IM, peds, FP, med/peds).
So what is the specialty distribution of medical hospitalists overall? There’s no good data about this.
The 2014 Medical Group Management Association (MGMA) sample, licensed for use in SOHM, reported data for roughly 4,200 community hospital medicine providers: 82% were internal medicine, 10% family medicine, 7% pediatrics, and <1% med/peds. MGMA, however, cautions against assuming that this represents the entire population of hospitalists and their training. Although representative of the groups who participated in the survey, it may not be representative of groups that didn’t participate, and thus it would be misleading to suggest that this distribution holds true nationally.
In an effort to corroborate the MGMA distribution, I reviewed other compensation and productivity surveys; one such survey, conducted by the American Medical Group Association, reported hospitalists by training program. It contained over 3,700 community hospital providers—89% internal medicine, 6% family medicine, 5% pediatrics—but did not inquire about medicine/pediatrics.
Finally, if one combines the academic and community provider samples from MGMA (n=4,867), the distribution is 80% IM, 8.5% FP, 10% peds, and <1% med/peds.
Which of these, if any, is the actual distribution of nonprocedural hospitalists? Although we cannot know exactly, I believe something close to the following to be current state: internal medicine 80%, family medicine 10%, pediatrics 10%, and medicine/pediatrics <1%.
It is clear from survey trends that the proportion of family medicine providers is growing, while the internal medicine super-majority is shrinking somewhat. Pediatrics appears to remain stable as a proportion of the total, as does med/peds, with the latter unable to grow in numbers proportionally given the small number of providers nationally compared to the other three fields.
The growth of family medicine-trained hospitalists relates to the continued high demand for the profession, with such residents comprising the largest pool of available providers, second only to internal medicine.
Based on the SHM survey, family medicine hospitalists seem to practice similarly to IM; they generally see adults only. It appears that they are accepted into traditional adult hospitalist practices, readily contrasting with groups serving children, which report no FP participation. Meanwhile, med/peds hospitalists provide care across the spectrum of hospitalist groups, though they often report splitting their duties between adults-only services and pediatric services.
As for me, a generation removed from my election of a family practice internship and subsequent transition to internal medicine residency, I should not have worried so. Both paths can lead to hospital medicine.
Dr. Ahlstrom is a hospitalist at Indigo Health Partners in Traverse City, Mich., and a member of SHM’s Practice Analysis Committee.
Society of Hospital Medicine Names 2015 Excellence Award Winners
OUTSTANDING SERVICE IN HOSPITAL MEDICINE

Dr. Sheehy has been a national role model for how SHM and its members can work together to achieve positive change in healthcare both in research and health policy. As a result of her published research on the “two-midnight rule” and observation status, Dr. Sheehy and SHM were invited to testify before the House Committee on Ways and Means Subcommittee on Health and the Senate Special Committee on Aging. In both of these instances, Dr. Sheehy shared the honor, bringing all of hospital medicine into the spotlight as a field of experts in this area.
EXCELLENCE IN RESEARCH

Dr. Brotman’s research has helped improve the care of thousands—if not millions—of hospitalized patients. He has achieved a prolific research portfolio while actively practicing as a hospitalist, as well as director of the hospitalist service at Johns Hopkins Hospital in Baltimore. His research has focused on VTE and patient education and communication. He has published more than 60 papers, multiple invited review articles, and a number of editorials. Since 1999, his research efforts have resulted in funding of more than $21 million.
CLINICAL EXCELLENCE

Dr. Kim has established one of the largest surgical consult and co-management services in the country, from the ground up, at an institution where many surgeons historically did not trust employed hospitalists. The success of the consult service required a total reorientation of institutional attitudes and culture, a feat Dr. Kim was able to achieve by providing superlative medical care to patients on nonmedical services. Dr. Kim is now nationally recognized as a leader in inpatient hospital care and a critical part of the neurosurgery team at Rush University Medical Center in Chicago.
EXCELLENCE IN TEACHING

Dr. Feldman founded new Urban Health residency training programs at Johns Hopkins. The medicine-pediatrics residency program and internal medicine primary care track admitted their first group of interns in July 2010 and 2011, respectively, and graduated those first cohorts last June. This medicine-pediatrics program is the first and only one of its kind in the nation. Dr. Feldman secured over $6 million in federal and foundation grant funding to support this endeavor.
At the same time, he led a team effort to build a perioperative and consultative medicine curriculum now known as “Consultative and Perioperative Medicine Essentials for Hospitalists,” which can be found at SHMconsults.com. With more than 18,000 users learning from more than 30 modules, this curriculum is now SHM’s flagship CME offering and a key resource for those preparing for the Focused Practice in Hospital Medicine exam. The curriculum has been built with over $1 million in industry grant funding.
EXCELLENCE IN HOSPITAL MEDICINE FOR NONPHYSICIANS

Cardin is deeply committed to collaborating with physicians on the integration of the role of NPs and PAs in hospital medicine, and in building a sense of community among NPs and PAs who are working in hospital medicine. She has worked toward these goals locally, regionally, and nationally through her participation and leadership in SHM.
As co-chair of the Quality Improvement Committee in the Section of Hospital Medicine at the University of Chicago, she has played a pivotal role in developing quality initiatives that directly benefit both her patients and providers in the section, including developing 360-degree evaluation tools and working on interdisciplinary projects, such as one that will enhance in-hospital glucose management. As an active member of the section’s Clinical Operations Committee, her input on ways to increase clinical efficiency, restructure services, and improve teamwork have led to improvements in the daily operations of her section.
At SHM, Tracy has provided leadership to NPs and PAs in her role as chair of the SHM NP-PA Committee. She is a core contributor to The Hospital Leader, SHM’s official blog, and was HM14 course director for the pre-course on the role of NPs and PAs in hospital medicine. This year, she was the first nonphysician to be nominated for the SHM board of directors.
EXCELLENCE IN HUMANITARIAN SERVICE

“Global Health Core,” organized by Phuoc Le, MD, MPH, has an established, clear agenda for clinical work, humanitarian aid, quality improvement, education, research, and fundraising. The group quickly grew from five to 12 faculty and brought focus to international efforts, with much of the work aimed at improving care at a particular hospital in Hinche (pronounced “Ench”), Haiti. Dr. Le and his team visit there, as well as other sites in Burundi and Liberia, several times a year, often taking residents and students as part of the University of California San Francisco’s Global Health Hospital Medicine Fellowship program. “Global Health Core” brought in supplies and medications after the 2010 earthquake and established a meaningful quality improvement program. They developed educational programs for trainees and created tighter partnerships with Partners in Health, and have begun to grow collaborations with several other university programs across the world.
Most recently, “Global Health Core” traveled to western Africa to care for patients inflicted with the Ebola virus, risking their lives for the care of the most vulnerable.
TEAM AWARD IN QUALITY IMPROVEMENT

Centripital, under the leadership of Jason Stein, MD, SFHM, is responsible for helping more than 50 hospital units around the world replicate the Accountable Care Unit (ACU) model of care. Dr. Stein is the inventor of the ACU and structured interdisciplinary bedside rounds, the author of an Accountable Care Unit implementation guide, and developer of the Structured Interdisciplinary Bedside Rounds certification program.
Centripital is a 501(c)(3) nonprofit based in Atlanta with the mission to train hospital professionals to work together in high-functioning, patient-centered teams. Centripital has helped more than 50 hospital units in 14 U.S. states and Australia replicate the ACU model by combining on-site educational sessions with mentored implementation. ACUs in the U.S. and Australia have been associated with improvements in a range of outcomes, including reduced in-hospital mortality, complications of care, length of stay, and average cost per case, along with increases in teamwork scores and patient satisfaction.
JUNIOR INVESTIGATOR AWARD

SHM’s Research Committee introduced a new award this year to recognize early-career hospitalist researchers who are leading the way in their field. Dr. Greysen is assistant professor at the UCSF School of Medicine and a hospitalist with training in social sciences and health outcomes research. His research focuses on transitions of care for hospitalized older adults and interventions to improve outcomes post-discharge. He is an active member in SHM’s research initiatives and associate editor for the Journal of Hospital Medicine.
OUTSTANDING SERVICE IN HOSPITAL MEDICINE
Dr. Sheehy has been a national role model for how SHM and its members can work together to achieve positive change in healthcare both in research and health policy. As a result of her published research on the “two-midnight rule” and observation status, Dr. Sheehy and SHM were invited to testify before the House Committee on Ways and Means Subcommittee on Health and the Senate Special Committee on Aging. In both of these instances, Dr. Sheehy shared the honor, bringing all of hospital medicine into the spotlight as a field of experts in this area.
EXCELLENCE IN RESEARCH
Dr. Brotman’s research has helped improve the care of thousands—if not millions—of hospitalized patients. He has achieved a prolific research portfolio while actively practicing as a hospitalist, as well as director of the hospitalist service at Johns Hopkins Hospital in Baltimore. His research has focused on VTE and patient education and communication. He has published more than 60 papers, multiple invited review articles, and a number of editorials. Since 1999, his research efforts have resulted in funding of more than $21 million.
CLINICAL EXCELLENCE
Dr. Kim has established one of the largest surgical consult and co-management services in the country, from the ground up, at an institution where many surgeons historically did not trust employed hospitalists. The success of the consult service required a total reorientation of institutional attitudes and culture, a feat Dr. Kim was able to achieve by providing superlative medical care to patients on nonmedical services. Dr. Kim is now nationally recognized as a leader in inpatient hospital care and a critical part of the neurosurgery team at Rush University Medical Center in Chicago.
EXCELLENCE IN TEACHING
Dr. Feldman founded new Urban Health residency training programs at Johns Hopkins. The medicine-pediatrics residency program and internal medicine primary care track admitted their first group of interns in July 2010 and 2011, respectively, and graduated those first cohorts last June. This medicine-pediatrics program is the first and only one of its kind in the nation. Dr. Feldman secured over $6 million in federal and foundation grant funding to support this endeavor.
At the same time, he led a team effort to build a perioperative and consultative medicine curriculum now known as “Consultative and Perioperative Medicine Essentials for Hospitalists,” which can be found at SHMconsults.com. With more than 18,000 users learning from more than 30 modules, this curriculum is now SHM’s flagship CME offering and a key resource for those preparing for the Focused Practice in Hospital Medicine exam. The curriculum has been built with over $1 million in industry grant funding.
EXCELLENCE IN HOSPITAL MEDICINE FOR NONPHYSICIANS
Cardin is deeply committed to collaborating with physicians on the integration of the role of NPs and PAs in hospital medicine, and in building a sense of community among NPs and PAs who are working in hospital medicine. She has worked toward these goals locally, regionally, and nationally through her participation and leadership in SHM.
As co-chair of the Quality Improvement Committee in the Section of Hospital Medicine at the University of Chicago, she has played a pivotal role in developing quality initiatives that directly benefit both her patients and providers in the section, including developing 360-degree evaluation tools and working on interdisciplinary projects, such as one that will enhance in-hospital glucose management. As an active member of the section’s Clinical Operations Committee, her input on ways to increase clinical efficiency, restructure services, and improve teamwork have led to improvements in the daily operations of her section.
At SHM, Tracy has provided leadership to NPs and PAs in her role as chair of the SHM NP-PA Committee. She is a core contributor to The Hospital Leader, SHM’s official blog, and was HM14 course director for the pre-course on the role of NPs and PAs in hospital medicine. This year, she was the first nonphysician to be nominated for the SHM board of directors.
EXCELLENCE IN HUMANITARIAN SERVICE
“Global Health Core,” organized by Phuoc Le, MD, MPH, has an established, clear agenda for clinical work, humanitarian aid, quality improvement, education, research, and fundraising. The group quickly grew from five to 12 faculty and brought focus to international efforts, with much of the work aimed at improving care at a particular hospital in Hinche (pronounced “Ench”), Haiti. Dr. Le and his team visit there, as well as other sites in Burundi and Liberia, several times a year, often taking residents and students as part of the University of California San Francisco’s Global Health Hospital Medicine Fellowship program. “Global Health Core” brought in supplies and medications after the 2010 earthquake and established a meaningful quality improvement program. They developed educational programs for trainees and created tighter partnerships with Partners in Health, and have begun to grow collaborations with several other university programs across the world.
Most recently, “Global Health Core” traveled to western Africa to care for patients inflicted with the Ebola virus, risking their lives for the care of the most vulnerable.
TEAM AWARD IN QUALITY IMPROVEMENT
Centripital, under the leadership of Jason Stein, MD, SFHM, is responsible for helping more than 50 hospital units around the world replicate the Accountable Care Unit (ACU) model of care. Dr. Stein is the inventor of the ACU and structured interdisciplinary bedside rounds, the author of an Accountable Care Unit implementation guide, and developer of the Structured Interdisciplinary Bedside Rounds certification program.
Centripital is a 501(c)(3) nonprofit based in Atlanta with the mission to train hospital professionals to work together in high-functioning, patient-centered teams. Centripital has helped more than 50 hospital units in 14 U.S. states and Australia replicate the ACU model by combining on-site educational sessions with mentored implementation. ACUs in the U.S. and Australia have been associated with improvements in a range of outcomes, including reduced in-hospital mortality, complications of care, length of stay, and average cost per case, along with increases in teamwork scores and patient satisfaction.
JUNIOR INVESTIGATOR AWARD
SHM’s Research Committee introduced a new award this year to recognize early-career hospitalist researchers who are leading the way in their field. Dr. Greysen is assistant professor at the UCSF School of Medicine and a hospitalist with training in social sciences and health outcomes research. His research focuses on transitions of care for hospitalized older adults and interventions to improve outcomes post-discharge. He is an active member in SHM’s research initiatives and associate editor for the Journal of Hospital Medicine.
Team Hospitalist Seats Seven New Members
Elizabeth A. Cook, MD

Dr. Cook has served as a hospitalist since 2001 and is medical director of the hospitalist division for Medical Associates of Central Virginia in Lynchburg, Va., where she provides management and coordination of care for acutely ill medical and surgical patients. She also serves as supervising physician at Matrix Medical Network, where she provides oversight to nurse practitioners through monthly chart reviews. Dr. Cook completed her medical degree at Vanderbilt University in Nashville and her internship at the University of North Carolina at Chapel Hill. Dr. Cook is board certified by the American Board of Family Medicine, is an SHM member, and serves on SHM’s Family Medicine Committee.
QUOTABLE: “I started as a hospitalist thinking it would be a transition to outpatient practice; however, I fell in love with the energy and experiences in the hospital. Being able to work closely with specialists, nursing, and other ancillary personnel to care for patients when they are most in need is both an opportunity and a privilege. I have moved into a leadership role, as well as returned to school for a masters in public health. I am excited about bringing my experience, passion, and interests to a role on the editorial board. I am also looking forward to working with other hospitalists outside my local area to move forward the practice of hospital medicine.”
Lisa Courtney, MBA, MSHA

Courtney serves as director of operations at Baptist Health Systems in Birmingham, Ala. She is responsible for accounts receivable management across a multi-hospital hospitalist program; develops, maintains, and attains budget objectives; and works with the medical directors and hospital staff on quality initiatives and process improvement opportunities.
QUOTABLE: “The hospitalist director position wasn’t a role I sought but one that I’m glad I accepted. My boss told me, ‘Hospitalist medicine is fun.’ It has taken a few years to stabilize staffing, but now I finally agree, hospitalist medicine is fun. … Hospitalists are an integral part of any healthcare system. They are vital in leading change and innovation to provide better care at lower cost. I feel blessed to be part of the team. As a new member of The Hospitalist’s editorial board, I hope to bring new ideas and topics to a broad audience while gaining the experience of working with some of the top physicians and administrative staff in their field.”
Joshua LaBrin, MD, SFHM

Dr. LaBrin is assistant clinical professor of internal medicine at the University of Utah at Salt Lake City. He also is a reviewer for Medical Education, Journal of Hospital Medicine, and Hospital Pediatrics. He completed his medical degree at Temple University in Philadelphia, Pa., and then his internship and residency at the University of Pittsburgh. He served as an HM fellow at Mayo Clinic in Rochester, Minn.
QUOTABLE: “Being a hospitalist made sense for me. I enjoy the intensive part of caring for the hospitalized setting in a team-based model. The dynamic nature of the hospital and the trainees never gets old. My mentors provided a glimpse of the impact and satisfaction I too could be a part of in hospital medicine.
James W. Levy, PA-C, SFHM

Levy serves as co-owner and vice president of human resources at iNDIGO Health Partners in Traverse City, Mich. He graduated from Indiana University in Bloomington and completed his PA training at Indiana University School of Medicine in Fort Wayne. He’d previously received certificates in emergency medical technology and operating room technology. He worked as a hospitalist from 1998 to 2013 and is a member of SHM’s NP/PA Committee.
QUOTABLE: “I believe the advent of hospitalist medicine is the single most important innovation I have seen in 40 years of patient care. Of the many rewards it has brought me, helping to assemble highly functioning hospitalist teams is the greatest. As a member of The Hospitalist’s editorial board, I hope to advance the cause of hospitalist medicine, in general, and especially as a way of benefitting small outlying hospitals and the patients they serve.”
Amanda T. Trask, MBA, MHA, SFHM

Trask is vice president for the national hospital medicine service line at Catholic Health Initiatives (CHI), a nonprofit, faith-based system operating in 19 states. Trask focuses on improving clinical and business outcomes through enhancing collaboration, improving processes, and optimizing current practices of hospitalist providers practicing in CHI hospitals. She earned her degrees at Georgia State University in Atlanta, where she was awarded the Public Health Service DHHS Traineeship Grant and several academic scholarships.
QUOTABLE: “Hospitalists have the opportunity to transform the delivery of acute care and beyond, as population health care models continue to advance. Being an administrative hospitalist leader allows me to be influential and involved in this transformation.
David Weidig, MD

Dr. Weidig is system director of hospital medicine for Aurora Health Care in Wisconsin. In 2007, he started the Aurora Hospital Medicine System with one program and six physicians; it has grown to 13 programs and over 150 FTEs. He is responsible for the co-development of the unit-based, RN-physician collaborative care model, recognized by the Robert Wood Johnson Foundation as a top intra-collaborative care model. Dr. Weidig completed his medical degree at Northwestern University in Chicago and his internal medicine residency at Scripps Mercy Hospital in San Diego. He served as president of SHM’s Pacific Northwest Chapter from 2005 to 2007 and is a member of the Multi-Site Hospitalist Leader Task Force.
QUOTABLE: “HM focuses on care delivery process improvement that has a dramatic effect both in efficiency and quality of outcomes. These improvements are reaching a scale that may be unprecedented in the history of U.S. healthcare. As a member of The Hospitalist’s editorial board, I hope to share ideas and work with others to further develop these care delivery models and enhance their effect.”
Robert Zipper, MD, MMM, SFHM

Dr. Zipper is a regional chief medical officer at Tacoma, Wash.-based Sound Physicians, where he provides operational oversight of Sound’s hospitalist, LTACH, post acute, and transitional care programs. He earned his master’s degree in medical management at Carnegie Mellon University in Pittsburgh, and his doctorate of medicine at Wayne State University in Detroit. He completed his internal medicine residency at Allegheny General Hospital in Pittsburgh. An active SHM member, he has served as chairman of the SHM Leadership Committee.
QUOTABLE: “My choice [to become a hospitalist] was more practical than anything else. I knew that I liked inpatient medicine, and I could not keep doing both inpatient and outpatient in the manner I was. I was forced to choose, and within a week of starting a focus on only hospital medicine, I knew it was the right one.”
Elizabeth A. Cook, MD
Dr. Cook has served as a hospitalist since 2001 and is medical director of the hospitalist division for Medical Associates of Central Virginia in Lynchburg, Va., where she provides management and coordination of care for acutely ill medical and surgical patients. She also serves as supervising physician at Matrix Medical Network, where she provides oversight to nurse practitioners through monthly chart reviews. Dr. Cook completed her medical degree at Vanderbilt University in Nashville and her internship at the University of North Carolina at Chapel Hill. Dr. Cook is board certified by the American Board of Family Medicine, is an SHM member, and serves on SHM’s Family Medicine Committee.
QUOTABLE: “I started as a hospitalist thinking it would be a transition to outpatient practice; however, I fell in love with the energy and experiences in the hospital. Being able to work closely with specialists, nursing, and other ancillary personnel to care for patients when they are most in need is both an opportunity and a privilege. I have moved into a leadership role, as well as returned to school for a masters in public health. I am excited about bringing my experience, passion, and interests to a role on the editorial board. I am also looking forward to working with other hospitalists outside my local area to move forward the practice of hospital medicine.”
Lisa Courtney, MBA, MSHA
Courtney serves as director of operations at Baptist Health Systems in Birmingham, Ala. She is responsible for accounts receivable management across a multi-hospital hospitalist program; develops, maintains, and attains budget objectives; and works with the medical directors and hospital staff on quality initiatives and process improvement opportunities.
QUOTABLE: “The hospitalist director position wasn’t a role I sought but one that I’m glad I accepted. My boss told me, ‘Hospitalist medicine is fun.’ It has taken a few years to stabilize staffing, but now I finally agree, hospitalist medicine is fun. … Hospitalists are an integral part of any healthcare system. They are vital in leading change and innovation to provide better care at lower cost. I feel blessed to be part of the team. As a new member of The Hospitalist’s editorial board, I hope to bring new ideas and topics to a broad audience while gaining the experience of working with some of the top physicians and administrative staff in their field.”
Joshua LaBrin, MD, SFHM
Dr. LaBrin is assistant clinical professor of internal medicine at the University of Utah at Salt Lake City. He also is a reviewer for Medical Education, Journal of Hospital Medicine, and Hospital Pediatrics. He completed his medical degree at Temple University in Philadelphia, Pa., and then his internship and residency at the University of Pittsburgh. He served as an HM fellow at Mayo Clinic in Rochester, Minn.
QUOTABLE: “Being a hospitalist made sense for me. I enjoy the intensive part of caring for the hospitalized setting in a team-based model. The dynamic nature of the hospital and the trainees never gets old. My mentors provided a glimpse of the impact and satisfaction I too could be a part of in hospital medicine.
James W. Levy, PA-C, SFHM
Levy serves as co-owner and vice president of human resources at iNDIGO Health Partners in Traverse City, Mich. He graduated from Indiana University in Bloomington and completed his PA training at Indiana University School of Medicine in Fort Wayne. He’d previously received certificates in emergency medical technology and operating room technology. He worked as a hospitalist from 1998 to 2013 and is a member of SHM’s NP/PA Committee.
QUOTABLE: “I believe the advent of hospitalist medicine is the single most important innovation I have seen in 40 years of patient care. Of the many rewards it has brought me, helping to assemble highly functioning hospitalist teams is the greatest. As a member of The Hospitalist’s editorial board, I hope to advance the cause of hospitalist medicine, in general, and especially as a way of benefitting small outlying hospitals and the patients they serve.”
Amanda T. Trask, MBA, MHA, SFHM
Trask is vice president for the national hospital medicine service line at Catholic Health Initiatives (CHI), a nonprofit, faith-based system operating in 19 states. Trask focuses on improving clinical and business outcomes through enhancing collaboration, improving processes, and optimizing current practices of hospitalist providers practicing in CHI hospitals. She earned her degrees at Georgia State University in Atlanta, where she was awarded the Public Health Service DHHS Traineeship Grant and several academic scholarships.
QUOTABLE: “Hospitalists have the opportunity to transform the delivery of acute care and beyond, as population health care models continue to advance. Being an administrative hospitalist leader allows me to be influential and involved in this transformation.
David Weidig, MD
Dr. Weidig is system director of hospital medicine for Aurora Health Care in Wisconsin. In 2007, he started the Aurora Hospital Medicine System with one program and six physicians; it has grown to 13 programs and over 150 FTEs. He is responsible for the co-development of the unit-based, RN-physician collaborative care model, recognized by the Robert Wood Johnson Foundation as a top intra-collaborative care model. Dr. Weidig completed his medical degree at Northwestern University in Chicago and his internal medicine residency at Scripps Mercy Hospital in San Diego. He served as president of SHM’s Pacific Northwest Chapter from 2005 to 2007 and is a member of the Multi-Site Hospitalist Leader Task Force.
QUOTABLE: “HM focuses on care delivery process improvement that has a dramatic effect both in efficiency and quality of outcomes. These improvements are reaching a scale that may be unprecedented in the history of U.S. healthcare. As a member of The Hospitalist’s editorial board, I hope to share ideas and work with others to further develop these care delivery models and enhance their effect.”
Robert Zipper, MD, MMM, SFHM
Dr. Zipper is a regional chief medical officer at Tacoma, Wash.-based Sound Physicians, where he provides operational oversight of Sound’s hospitalist, LTACH, post acute, and transitional care programs. He earned his master’s degree in medical management at Carnegie Mellon University in Pittsburgh, and his doctorate of medicine at Wayne State University in Detroit. He completed his internal medicine residency at Allegheny General Hospital in Pittsburgh. An active SHM member, he has served as chairman of the SHM Leadership Committee.
QUOTABLE: “My choice [to become a hospitalist] was more practical than anything else. I knew that I liked inpatient medicine, and I could not keep doing both inpatient and outpatient in the manner I was. I was forced to choose, and within a week of starting a focus on only hospital medicine, I knew it was the right one.”
Increased Diversity Strengthens Hospital Medicine
My path to the SHM presidency has been a long and winding one. After paying back some student loans courtesy of the U.S. Air Force, I joined a busy traditional family medicine practice. Routinely, we would have a census of 20-25 patients in our local community hospital on any given day, and we shared the hospital duties as the “hospital doc” for a week at a time. I truly enjoyed the hospital-based portion of my practice, and this eventually led me to start and build a hospitalist program at our small community hospital. I’ve been a hospitalist ever since and have never looked back.
My story is similar to the experiences of thousands of hospitalists across the country today. Many physicians who entered medical school with the intention of working in an office-based or traditional practice have been drawn into the fast-growing hospital medicine field—where they’ve happily stayed.
Today, according to our best estimates, there are more than 44,000 hospitalists practicing in the U.S. Most have come to the specialty from the internal medicine field, but that is rapidly changing. As the first hospitalist trained in family medicine to serve as SHM president, I couldn’t be more excited or encouraged by the increasing diversity in the types of healthcare practitioners who call themselves hospitalists.
A Changing Profession
Today’s hospitalists come from diverse training environments. In addition to internal medicine, hospitalists are trained in family medicine, pediatrics, intensive care, obstetrics and gynecology, surgery, orthopedics, neurology, oncology, and a variety of other specialties and subspecialties. The specialty hospitalist movement has grown on the back of the same forces that gave a dramatic push to the hospitalist movement over the past 15 years—in-house provider availability, the need for greater inpatient efficiency, the aging physician workforce, and the enormous difficulty of staying competent in both an ambulatory and inpatient setting, just to name a few. Needless to say, it’s become a well-established dynamic with evidence pointing to its long-term benefits for both patients and healthcare delivery systems.
In addition, as demand for hospitalist services continues to grow, hospitals and hospital medicine groups are increasingly adding nurse practitioners (NPs), physician assistants (PAs), and other advanced practice providers to their ranks. According to the 2014 State of Hospital Medicine Report, the use of NPs and PAs in hospital medicine programs serving adults has risen nearly 12% since 2012. Today, more than 65% of hospital medicine groups employ NPs or PAs.
Within SHM, we’re seeing these changes begin to play out in our membership makeup, as well. Though the vast majority of our 14,000 members are internal medicine physicians, more than 10% are hospitalists trained in family medicine (HTFMs), 3% are trained in pediatrics, and 3% are internal medicine/pediatrics. Our fastest growing segments are family medicine and NPs/PAs.
initiatives and educational programs in support of our mission...
Strength in Diversity
The expansion of the hospitalist field to include so many different kinds of providers is beneficial to both SHM and the broader profession.
On a macro level, the increasing diversity of the field has the potential to improve care for hospitalized patients. For example, when more hospital providers are based within the facility, there’s an opportunity for providers to develop improved relationships and communication, which leads to better patient handoffs and expedited care across the inpatient care continuum. Studies have shown that hospitalist practices have a positive impact on patient lengths of stay, readmission rates, and patient satisfaction scores.
Among our peers in healthcare, this diversity opens up opportunities for even more physicians and clinicians to work as hospitalists and improve care delivery in America’s hospitals. For instance, the American Academy of Family Physicians (AAFP) and SHM recently endorsed the growing contribution of hospitalists trained in family medicine. Together, our two organizations stated that “the opportunity to participate as a hospitalist should be granted to all physicians commensurate with their documented training and/or experience, demonstrated abilities and current competencies.”
SHM is stronger when we can draw upon a membership of varying types of training, opinions, and expertise in developing initiatives and educational programs in support of our mission to promote exceptional care for hospitalized patients. Diverse membership also provides an additional level of authority to our organization and is one of the reasons we are often invited to Washington, D.C., to testify in front of Congress about various medical topics. Because we represent many constituencies among physicians and maintain close working relationships with clinical and business leaders throughout the hospital, we can provide unique insight into healthcare reform, quality initiatives, and other issues shaping the healthcare industry today.
Expanding Membership
Although we are seeing the increasing diversity in the hospital medicine field play out in SHM membership, many specialty hospitalists, advanced practice providers, and even family medicine and pediatric physicians don’t yet consider SHM a professional “home.” And our membership ranks represent only a fraction of the hospitalists practicing across the country.
One of the goals for my presidency is to help spread the word that SHM isn’t just for internal medicine hospitalists—though they certainly make up a majority of our membership and we owe them a debt of gratitude for getting us to where we are today—but for all providers involved in the hospital-based care of patients. We are an organization that truly represents all of the professionals across the continuum of hospital-based medicine. We can be a valuable professional resource for the growing number of physicians, advanced practice providers, administrators, and other care providers who choose to focus their careers on the care of hospitalized patients.
Looking Ahead
Though I happened into the hospital medicine field by chance, making my career in the field was no accident. I’m proud to work in a specialty that is so uniquely positioned to enhance the care and experience for hospitalized patients. I’m excited to see so many providers from various fields of medicine choosing hospital-based practice.
I hope the trend will continue and that our organization will have the opportunity to welcome many of them in the months ahead.
Hospitalist Bob Wachter Tops Modern Healthcare’s Physician Leadership List
For the first time, a hospitalist tops Modern Healthcare’s 50 Most Influential Physician Executives and Leaders list.
The who’s who of standout physicians starts with HM pioneer Robert Wachter, MD, MHM, chief of the division of hospital medicine at the University of California San Francisco Medical Center, who's recognized for nearly two decades spent tackling topics that "challenge the status quo," writes Modern Healthcare.
The list features three hospitalists in total, including:
- Patrick Conway, MD, MSc, MHM, pediatric hospitalist, CMO for the Centers for Medicare & Medicaid Services (CMS), and CMS' acting deputy principal administrator for innovation and quality, ranked 11; and
- Vivek Murthy, MD, MBA, newly appointed U.S. Surgeon General and practicing hospitalist at Brigham and Women’s Hospital in Boston, ranked 16.
"Having three people on that list speaks volumes to our ability to identify those things that are issues in our healthcare system and impact them," says SHM President Robert Harrington Jr., MD, SFHM, chief medical officer at Reliant Post-Acute Care Solutions in Atlanta.
Dr. Harrington says that placing three hospitalists in the top 16 of a list like this one shows that while HM is a young specialty, it is at the nexus of dynamic change in care delivery.
"We've placed our bets in the right places when it comes to healthcare," he says. "[It] really is all about our patients, patient safety, quality, value."
Although Dr. Harrington likes the adulation the list can bring the specialty, he says if people move on and off of it, that's fine, too.
"As long as we continue to get a seat at the table in terms of healthcare policy formation and quality improvement organizations and patient safety organizations, and we continue to be respected in those arenas, for me, that’s what it’s about," he adds. "The list is nice, but the results are more important to us."
Visit our website for more information on hospitalist leadership.
Hospice, Palliative Care Groups Release Quality Care Measures

The American Academy of Hospice and Palliative Medicine (AAHPM) and the Hospice & Palliative Nurses Association (HPNA) recently published a list of performance measures to assess the quality of palliative and hospice patient care.
Refined over two years, the groups' Measuring What Matters recommendations [PDF] outline 10 clinically relevant measures to drive quality care. The list includes:
- Documenting patients’ preferences for life-sustaining treatments and their surrogate decision makers’ names;
- Screening patients for physical symptoms;
- Treating pain;
- Screening and managing dyspnea; and,
- Discussing patients' emotional and psychological needs.
"I'd say these things are relevant for hospitalists' patients, and for all seriously ill patients, whether or not a palliative care need has been identified," says Joe Rotella, MD, MBA, AAHPM's CMO and co-chair of the Measuring What Matters clinical user panel. The measures should make it possible to raise awareness about what constitutes quality of care for seriously ill patients and to compare quality between settings and between patients who receive palliative care and equally ill patients who do not, he notes.
The quality indicators, which have been reviewed by the National Quality Forum, focus on processes of providing palliative and hospice care and seek to achieve consistency in care quality among providers. For instance, do patients who screen positive for at least moderate pain receive treatments within 24 hours? Likewise, patients receiving hospice care should have a documented discussion of their spiritual concerns or of their preference not to have such a discussion, the recommendations state.
"It's worth looking at what really matters to these patients and maybe adapting a few measures for your hospital's quality improvement program," Dr. Rotella says.
Listen to our recent podcast on hospitalists and palliative care.
Recurrent Patellar Tendon Rupture in a Patient After Intramedullary Nailing of the Tibia: Reconstruction Using an Achilles Tendon Allograft
Ruptures of the patellar tendon usually occur in patients under age 40 years, with men having a higher incidence than women.1 History of local steroid injection,2,3 total knee arthroplasty,4-8 anterior cruciate ligament reconstruction with central third patellar tendon autograft,9-11 and a variety of systemic diseases are associated with an increased tendency to rupture.12-15 Primary acute ruptures of the patellar tendon can be difficult to repair because of the quality of remaining tissues. In cases of chronic tendon ruptures subject to delayed treatment, additional complications such as tissue contracture and scar-tissue formation are likely to exist.15-17
Complications after intramedullary (IM) nailing of the tibia include infection, compartment syndrome, deep vein thrombosis, thermal necrosis of the bone with alteration of its endosteal architecture, failure of the hardware, malunion, and nonunion.18 The most common complaint after IM nailing of the tibia is chronic anterior knee pain and symptoms similar to tendonitis; incidences as high as 86% have been reported.18-20 Extensive review of the literature found only 2 reports of patellar tendon rupture after IM nailing of the tibia; both cases used a patellar tendon–splitting approach. The first report described patellar tendon rupture 8 years after IM nailing of the tibia during a forced deep-flexion movement.21 Radiographic examination showed the IM nail positioned proud relative to the tibial plateau, impinging upon the patellar tendon. An intraoperative examination confirmed the radiographic findings and found rupture of the patellar tendon to be consistent with the exposed tip of the IM nail. The second report described patellar tendon rupture 2 months postoperatively in a patient with Ehlers-Danlos syndrome, a hereditary disorder characterized by alterations to muscle/tendon tissue and hyperextensible skin.22
Patellar tendon rupture after IM nailing of the tibia is a rare complication. Patellar tendon re-rupture after primary repair in a patient with history of IM tibial nailing has not been reported. This case outlines the progression of such a patient with a recurrent patellar tendon rupture that was successfully reconstructed using an Achilles tendon allograft. The patient’s surgical history of IM tibial nailing through a mid-patellar tendon–splitting approach 4 years prior to initial tendon rupture is noteworthy and potentially predisposed the patient to injury. The patient provided written informed consent for print and electronic publication of this case report.
Case Report
A 44-year-old woman, 5 ft, 3 in tall, and weighing 129 lb (body mass index, 22.8), with a history of osteoporosis and transverse myelitis, presented with pain and persistent swelling about the left knee. Her baseline ambulatory status required crutches because of decreased sensation and strength in her lower extremity in conjunction with a foot drop; she had mild quadriceps and hamstring muscle weakness but otherwise normal knee function. The patient had been seen 4 years earlier at our facility for IM fixation of a distal tibia fracture through a patellar tendon–splitting approach. The fracture was well healed and showed no signs of complication or nail migration; the nail was not proud.
Initially, the patient was admitted to another hospital through the emergency department for swelling and pain about the left knee. She was believed to have an infection and was placed on antibiotics by the primary care team. An orthopedic evaluation showed induration, edema, and warmth in the patellar tendon region of the left knee. Magnetic resonance imaging (MRI) showed a full-thickness patellar tendon rupture. Aspiration of the knee was performed and cultures were negative; white blood cell, erythrocyte sedimentation rate, and C-reactive protein values were normal. The risks and benefits of various treatments were discussed, and surgical intervention was elected to repair the patellar tendon.
Intraoperative findings showed a massive midsubstance rupture of the patellar tendon, accompanied by medial and lateral retinacular tears and a quadriceps tendon partial rupture; the central aspect of the quadriceps tendon attaching to the patella remained intact. The patella was retracted proximally; no evidence of active infection was present. Good-quality tissue remained attached to both the tibial tuberosity and the inferior pole of the patella. A No. 2 FiberWire suture (Arthrex, Inc, Naples, Florida) was used to run whip stitches in the distal end of the patellar tendon and a second No. 2 FiberWire suture was used to run whip stitches in the proximal aspect of the patellar tendon rupture. The 4 ends of the sutures were tied together, thus re-approximating the distal and proximal ends of the ruptured patellar tendon. No bone drilling was used because the midsubstance tear was amenable to good repair with reasonable expectation of healing based on tissue quality. The quadriceps tendon, which was partially torn, was repaired with a No. 1 Vicryl suture (Ethicon, Somerville, New Jersey). The medial and lateral retinacula were also repaired with a No. 1 Vicryl suture. The suturing scheme effectively re-approximated the knee extensor mechanism, and the patient was placed in a knee immobilizer that permitted no flexion for 6 weeks postoperatively.
After 3 months of gradual improvement with physical therapy, the patient returned for a follow-up visit, concerned that her knee function was beginning to decline. Physical examination showed patella alta with a thinned and diminutive palpable tendon in the patellar tendon region. She was capable of active flexion to 90º and extension to 50º, but beyond 50º, she was unable to actively extend; she was capable of full passive extension. MRI showed a repeat full-thickness patellar tendon tear with retraction from the inferior pole of the patella; previous tears to the quadriceps tendon were healed. Because of the recurrent nature of the injury, the patient’s physical examination, MRI findings, and anticipated poor quality of remaining tendon tissue, patellar tendon reconstruction using a cadaveric Achilles tendon allograft was recommended. The patient chose surgery for potential improvement in knee range of motion, active extension, and ambulation.
The previous anterior midline incision was used and carried down through the subcutaneous tissues where a complete rupture of the patellar tendon was identified. A limited amount of good-quality tendon tissue remained at the medial aspect of the tibial tuberosity. The remaining tissue located at the patella’s inferior pole was nonviable for use in surgical repair. Retinacular contractures were released to bring the patella distally; the trochlear groove was used as the anatomic landmark for the patella resting position. During reconstruction, the knee was placed into 30° of flexion, with the patella located in the trochlear groove, and the cadaveric Achilles tendon was placed on the midline of the patella, where measurements were done to assess proper length and tension (Figure 1).
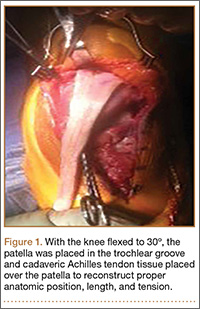
The patient’s remaining native tissue on the medial aspect of the tibial tuberosity was used to augment the Achilles tendon graft medially. The cadaveric Achilles tendon graft was primarily used to replace the central and lateral aspects of the patellar tendon. Additionally, the calcaneal bone segment at the end of the Achilles tendon graft was removed prior to use. Cadaveric and host tissues at the medial aspect of the tibial tuberosity were sutured together with a No. 1 Vicryl suture (Figure 2). The distal aspect of the cadaveric Achilles tendon was used to re-approximate the patient’s native patellar tendon insertion at the tibial tuberosity. To supplement the graft anchor, a Richards metallic ligament staple (Smith & Nephew, Memphis, Tennessee) was used to fix the distal aspect of the Achilles tendon graft into the tibial tuberosity.
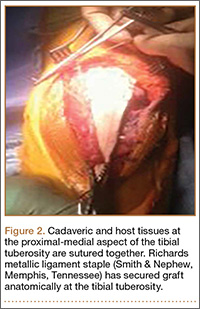
Proper tensioning of the graft was performed by visualizing patella tracking during the arc-of-knee motion and properly suturing the graft to allow for functional range. The proximal aspect of the cadaveric Achilles tendon was sutured into host tissues surrounding the superior pole of the patellar and quadriceps tendon. The edges of the graft were sutured with supplemental No. 1 Vicryl sutures (Figure 3).
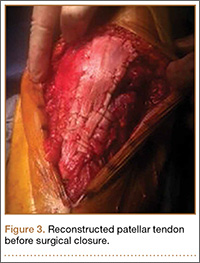
Before surgical closure, knee range of motion was checked and noted to be 0º to 100º. The repaired construct was stable and uncompromised throughout the entire range of motion. Patella tracking was central and significantly improved; knee stability was normal to varus and valgus stress.
The patient was placed in a knee immobilizer for 6 weeks before range of motion was allowed. Seven months postoperatively, the patient returned for a follow-up visit, ambulating with 2 forearm crutches, which was her baseline ambulatory status. Physical examination revealed passive range of motion from 0º to 130º, an extension lag of 10º, and 4/5 quadriceps strength. It was recommended the patient continue physical therapy to improve strength and range of motion.
Conclusion
This is the first report in the literature documenting a recurrent patellar tendon rupture after primary repair in a patient with a history of IM tibial nailing. It is also the first report of a cadaveric Achilles tendon allograft used as a solution to this problem. Complete reconstruction of the patellar tendon using an Achilles tendon allograft is a method commonly used for ruptures after total knee arthroplasty.4-7,23,24 This case report highlights the utility of a cadaveric Achilles tendon in the setting of a recurrent patellar tendon rupture with poor remaining tissue quality.
1. Scott WN, Insall JN. Injuries of the knee. In: Rockwood CA Jr, Green DP, Bucholz RW, eds. Fractures in Adults. 3rd ed. Philadelphia, PA: JB Lippincott; 1991: 1799-1914.
2. Clark SC, Jones MW, Choudhury RR, Smith E. Bilateral patellar tendon rupture secondary to repeated local steroid injections. J Accid Emerg Med. 1995;12(4):300-301.
3. Unverferth LJ, Olix ML. The effect of local steroid injections on tendon. J Sports Med. 1973;1(4):31-37.
4. Cadambi A, Engh GA. Use of a semitendinosus tendon autogenous graft for rupture of the patellar ligament after total knee arthroplasty. A report of seven cases. J Bone Joint Surg Am. 1992;74(7):974-979.
5. Emerson RH Jr, Head WC, Malinin TI. Reconstruction of patellar tendon rupture after total knee arthroplasty with an extensor mechanism allograft. Clin Orthop.1990;(260):154-161.
6. Gustillo RB, Thompson R. Quadriceps and patellar tendon ruptures following total knee arthroplasty. In: Rand JA, Dorr LD, eds. Total Arthroplasty of the Knee: Proceedings of the Knee Society, 1985-1986. Rockville, MD: Aspen; 1987: 41-70.
7. Rand JA, Morrey BF, Bryan RS. Patellar tendon rupture after total knee arthroplasty. Clin Orthop. 1989;(244):233-238.
8. Schoderbek RJ, Brown TE, Mulhall KJ, et al. Extensor mechanism disruption after total knee arthroplasty. Clin Orthop. 2006;446:176-185.
9. Bonamo JJ, Krinik RM, Sporn AA. Rupture of the patellar ligament after use of the central third for anterior cruciate reconstruction. A report of two cases. J Bone Joint Surg Am. 1984;66(8):1294-1297.
10. Marumoto JM, Mitsunaga MM, Richardson AB, Medoff RJ, Mayfield GW. Late patellar tendon ruptures after removal of the central third for anterior cruciate ligament reconstruction. A report of two cases. Am J Sports Med. 1996;24(5):698-701.
11. Mickelsen PL, Morgan SJ, Johnson WA, Ferrari JD. Patellar tendon rupture 3 years after anterior cruciate ligament reconstruction with a central one third bone-patellar tendon-bone graft. Arthroscopy. 2001;17(6):648-652.
12. Morgan J, McCarty DJ. Tendon ruptures in patients with systemic lupus erythematosus treated with corticosteroids. Arthritis Rheum. 1974;17(6):1033-1036.
13. Webb LX, Toby EB. Bilateral rupture of the patellar tendon in an otherwise healthy male patient following minor trauma. J Trauma. 1986;26(11):1045-1048.
14. Greis PE, Holmstrom MC, Lahav A. Surgical treatment options for patella tendon rupture, Part I: Acute. Orthopedics. 2005;28(7):672-679.
15. Greis PE, Lahav A, Holstrom MC. Surgical treatment options for patella tendon rupture, part II: chronic. Orthopedics. 2005;28(8):765-769.
16. Lewis PB, Rue JP, Bach BR Jr. Chronic patellar tendon rupture: surgical reconstruction technique using 2 Achilles tendon allografts. J Knee Surg. 2008;21(12):130-135.
17. McNally PD, Marcelli EA. Achilles tendon allograft of a chronic patellar tendon rupture. Arthroscopy. 1998;14(3):340-344.
18. Katsoulis E, Court-Brown C, Giannoudis PV. Incidence and atieology of anterior knee pain after intramedullary nailing of the femur and tibia. J Bone Joint Surg Br. 2006;88(5):576-580.
19. Brumback RJ, Uwagie-Ero S, Lakatos RP, et al. Intramedullary nailing of femoral shaft fractures. Part II: Fracture-healing with static interlocking fixation. J Bone Joint Surg Am. 1988;70(1):1453-1462.
20. Koval KJ, Clapper MF, Brumback RJ, et al. Complications of reamed intramedullary nailing of the tibia. J Orthop Trauma. 1991;5(2):184-189.
21. Kretzler JE, Curtin SL, Wegner DA, Baumgaertner MR, Galloway MT. Patella tendon rupture: a late complication of a tibial nail. Orthopedics. 1995;18(11):1109-1111.
22. Moroney P, McCarthy T, Borton D. Patellar tendon rupture post reamed intra-medullary tibial nail in a patient with Ehlers-Danlos syndrome. A case report. Eur J Orthop Surg Traumatol. 2004;14(1):50-51.
23. Crossett LS, Sinha RK, Sechriest VF, Rubash HE. Reconstruction of a ruptured patellar tendon with achilles tendon allograft following total knee arthroplasty. J Bone Joint Surg Am. 2002;84(8):1354-1361.
24. Falconiero RP, Pallis MP. Chronic rupture of a patellar tendon: a technique for reconstruction with Achilles allograft. Arthroscopy. 1996;12(5):623-626.
Ruptures of the patellar tendon usually occur in patients under age 40 years, with men having a higher incidence than women.1 History of local steroid injection,2,3 total knee arthroplasty,4-8 anterior cruciate ligament reconstruction with central third patellar tendon autograft,9-11 and a variety of systemic diseases are associated with an increased tendency to rupture.12-15 Primary acute ruptures of the patellar tendon can be difficult to repair because of the quality of remaining tissues. In cases of chronic tendon ruptures subject to delayed treatment, additional complications such as tissue contracture and scar-tissue formation are likely to exist.15-17
Complications after intramedullary (IM) nailing of the tibia include infection, compartment syndrome, deep vein thrombosis, thermal necrosis of the bone with alteration of its endosteal architecture, failure of the hardware, malunion, and nonunion.18 The most common complaint after IM nailing of the tibia is chronic anterior knee pain and symptoms similar to tendonitis; incidences as high as 86% have been reported.18-20 Extensive review of the literature found only 2 reports of patellar tendon rupture after IM nailing of the tibia; both cases used a patellar tendon–splitting approach. The first report described patellar tendon rupture 8 years after IM nailing of the tibia during a forced deep-flexion movement.21 Radiographic examination showed the IM nail positioned proud relative to the tibial plateau, impinging upon the patellar tendon. An intraoperative examination confirmed the radiographic findings and found rupture of the patellar tendon to be consistent with the exposed tip of the IM nail. The second report described patellar tendon rupture 2 months postoperatively in a patient with Ehlers-Danlos syndrome, a hereditary disorder characterized by alterations to muscle/tendon tissue and hyperextensible skin.22
Patellar tendon rupture after IM nailing of the tibia is a rare complication. Patellar tendon re-rupture after primary repair in a patient with history of IM tibial nailing has not been reported. This case outlines the progression of such a patient with a recurrent patellar tendon rupture that was successfully reconstructed using an Achilles tendon allograft. The patient’s surgical history of IM tibial nailing through a mid-patellar tendon–splitting approach 4 years prior to initial tendon rupture is noteworthy and potentially predisposed the patient to injury. The patient provided written informed consent for print and electronic publication of this case report.
Case Report
A 44-year-old woman, 5 ft, 3 in tall, and weighing 129 lb (body mass index, 22.8), with a history of osteoporosis and transverse myelitis, presented with pain and persistent swelling about the left knee. Her baseline ambulatory status required crutches because of decreased sensation and strength in her lower extremity in conjunction with a foot drop; she had mild quadriceps and hamstring muscle weakness but otherwise normal knee function. The patient had been seen 4 years earlier at our facility for IM fixation of a distal tibia fracture through a patellar tendon–splitting approach. The fracture was well healed and showed no signs of complication or nail migration; the nail was not proud.
Initially, the patient was admitted to another hospital through the emergency department for swelling and pain about the left knee. She was believed to have an infection and was placed on antibiotics by the primary care team. An orthopedic evaluation showed induration, edema, and warmth in the patellar tendon region of the left knee. Magnetic resonance imaging (MRI) showed a full-thickness patellar tendon rupture. Aspiration of the knee was performed and cultures were negative; white blood cell, erythrocyte sedimentation rate, and C-reactive protein values were normal. The risks and benefits of various treatments were discussed, and surgical intervention was elected to repair the patellar tendon.
Intraoperative findings showed a massive midsubstance rupture of the patellar tendon, accompanied by medial and lateral retinacular tears and a quadriceps tendon partial rupture; the central aspect of the quadriceps tendon attaching to the patella remained intact. The patella was retracted proximally; no evidence of active infection was present. Good-quality tissue remained attached to both the tibial tuberosity and the inferior pole of the patella. A No. 2 FiberWire suture (Arthrex, Inc, Naples, Florida) was used to run whip stitches in the distal end of the patellar tendon and a second No. 2 FiberWire suture was used to run whip stitches in the proximal aspect of the patellar tendon rupture. The 4 ends of the sutures were tied together, thus re-approximating the distal and proximal ends of the ruptured patellar tendon. No bone drilling was used because the midsubstance tear was amenable to good repair with reasonable expectation of healing based on tissue quality. The quadriceps tendon, which was partially torn, was repaired with a No. 1 Vicryl suture (Ethicon, Somerville, New Jersey). The medial and lateral retinacula were also repaired with a No. 1 Vicryl suture. The suturing scheme effectively re-approximated the knee extensor mechanism, and the patient was placed in a knee immobilizer that permitted no flexion for 6 weeks postoperatively.
After 3 months of gradual improvement with physical therapy, the patient returned for a follow-up visit, concerned that her knee function was beginning to decline. Physical examination showed patella alta with a thinned and diminutive palpable tendon in the patellar tendon region. She was capable of active flexion to 90º and extension to 50º, but beyond 50º, she was unable to actively extend; she was capable of full passive extension. MRI showed a repeat full-thickness patellar tendon tear with retraction from the inferior pole of the patella; previous tears to the quadriceps tendon were healed. Because of the recurrent nature of the injury, the patient’s physical examination, MRI findings, and anticipated poor quality of remaining tendon tissue, patellar tendon reconstruction using a cadaveric Achilles tendon allograft was recommended. The patient chose surgery for potential improvement in knee range of motion, active extension, and ambulation.
The previous anterior midline incision was used and carried down through the subcutaneous tissues where a complete rupture of the patellar tendon was identified. A limited amount of good-quality tendon tissue remained at the medial aspect of the tibial tuberosity. The remaining tissue located at the patella’s inferior pole was nonviable for use in surgical repair. Retinacular contractures were released to bring the patella distally; the trochlear groove was used as the anatomic landmark for the patella resting position. During reconstruction, the knee was placed into 30° of flexion, with the patella located in the trochlear groove, and the cadaveric Achilles tendon was placed on the midline of the patella, where measurements were done to assess proper length and tension (Figure 1).
The patient’s remaining native tissue on the medial aspect of the tibial tuberosity was used to augment the Achilles tendon graft medially. The cadaveric Achilles tendon graft was primarily used to replace the central and lateral aspects of the patellar tendon. Additionally, the calcaneal bone segment at the end of the Achilles tendon graft was removed prior to use. Cadaveric and host tissues at the medial aspect of the tibial tuberosity were sutured together with a No. 1 Vicryl suture (Figure 2). The distal aspect of the cadaveric Achilles tendon was used to re-approximate the patient’s native patellar tendon insertion at the tibial tuberosity. To supplement the graft anchor, a Richards metallic ligament staple (Smith & Nephew, Memphis, Tennessee) was used to fix the distal aspect of the Achilles tendon graft into the tibial tuberosity.
Proper tensioning of the graft was performed by visualizing patella tracking during the arc-of-knee motion and properly suturing the graft to allow for functional range. The proximal aspect of the cadaveric Achilles tendon was sutured into host tissues surrounding the superior pole of the patellar and quadriceps tendon. The edges of the graft were sutured with supplemental No. 1 Vicryl sutures (Figure 3).
Before surgical closure, knee range of motion was checked and noted to be 0º to 100º. The repaired construct was stable and uncompromised throughout the entire range of motion. Patella tracking was central and significantly improved; knee stability was normal to varus and valgus stress.
The patient was placed in a knee immobilizer for 6 weeks before range of motion was allowed. Seven months postoperatively, the patient returned for a follow-up visit, ambulating with 2 forearm crutches, which was her baseline ambulatory status. Physical examination revealed passive range of motion from 0º to 130º, an extension lag of 10º, and 4/5 quadriceps strength. It was recommended the patient continue physical therapy to improve strength and range of motion.
Conclusion
This is the first report in the literature documenting a recurrent patellar tendon rupture after primary repair in a patient with a history of IM tibial nailing. It is also the first report of a cadaveric Achilles tendon allograft used as a solution to this problem. Complete reconstruction of the patellar tendon using an Achilles tendon allograft is a method commonly used for ruptures after total knee arthroplasty.4-7,23,24 This case report highlights the utility of a cadaveric Achilles tendon in the setting of a recurrent patellar tendon rupture with poor remaining tissue quality.
1. Scott WN, Insall JN. Injuries of the knee. In: Rockwood CA Jr, Green DP, Bucholz RW, eds. Fractures in Adults. 3rd ed. Philadelphia, PA: JB Lippincott; 1991: 1799-1914.
2. Clark SC, Jones MW, Choudhury RR, Smith E. Bilateral patellar tendon rupture secondary to repeated local steroid injections. J Accid Emerg Med. 1995;12(4):300-301.
3. Unverferth LJ, Olix ML. The effect of local steroid injections on tendon. J Sports Med. 1973;1(4):31-37.
4. Cadambi A, Engh GA. Use of a semitendinosus tendon autogenous graft for rupture of the patellar ligament after total knee arthroplasty. A report of seven cases. J Bone Joint Surg Am. 1992;74(7):974-979.
5. Emerson RH Jr, Head WC, Malinin TI. Reconstruction of patellar tendon rupture after total knee arthroplasty with an extensor mechanism allograft. Clin Orthop.1990;(260):154-161.
6. Gustillo RB, Thompson R. Quadriceps and patellar tendon ruptures following total knee arthroplasty. In: Rand JA, Dorr LD, eds. Total Arthroplasty of the Knee: Proceedings of the Knee Society, 1985-1986. Rockville, MD: Aspen; 1987: 41-70.
7. Rand JA, Morrey BF, Bryan RS. Patellar tendon rupture after total knee arthroplasty. Clin Orthop. 1989;(244):233-238.
8. Schoderbek RJ, Brown TE, Mulhall KJ, et al. Extensor mechanism disruption after total knee arthroplasty. Clin Orthop. 2006;446:176-185.
9. Bonamo JJ, Krinik RM, Sporn AA. Rupture of the patellar ligament after use of the central third for anterior cruciate reconstruction. A report of two cases. J Bone Joint Surg Am. 1984;66(8):1294-1297.
10. Marumoto JM, Mitsunaga MM, Richardson AB, Medoff RJ, Mayfield GW. Late patellar tendon ruptures after removal of the central third for anterior cruciate ligament reconstruction. A report of two cases. Am J Sports Med. 1996;24(5):698-701.
11. Mickelsen PL, Morgan SJ, Johnson WA, Ferrari JD. Patellar tendon rupture 3 years after anterior cruciate ligament reconstruction with a central one third bone-patellar tendon-bone graft. Arthroscopy. 2001;17(6):648-652.
12. Morgan J, McCarty DJ. Tendon ruptures in patients with systemic lupus erythematosus treated with corticosteroids. Arthritis Rheum. 1974;17(6):1033-1036.
13. Webb LX, Toby EB. Bilateral rupture of the patellar tendon in an otherwise healthy male patient following minor trauma. J Trauma. 1986;26(11):1045-1048.
14. Greis PE, Holmstrom MC, Lahav A. Surgical treatment options for patella tendon rupture, Part I: Acute. Orthopedics. 2005;28(7):672-679.
15. Greis PE, Lahav A, Holstrom MC. Surgical treatment options for patella tendon rupture, part II: chronic. Orthopedics. 2005;28(8):765-769.
16. Lewis PB, Rue JP, Bach BR Jr. Chronic patellar tendon rupture: surgical reconstruction technique using 2 Achilles tendon allografts. J Knee Surg. 2008;21(12):130-135.
17. McNally PD, Marcelli EA. Achilles tendon allograft of a chronic patellar tendon rupture. Arthroscopy. 1998;14(3):340-344.
18. Katsoulis E, Court-Brown C, Giannoudis PV. Incidence and atieology of anterior knee pain after intramedullary nailing of the femur and tibia. J Bone Joint Surg Br. 2006;88(5):576-580.
19. Brumback RJ, Uwagie-Ero S, Lakatos RP, et al. Intramedullary nailing of femoral shaft fractures. Part II: Fracture-healing with static interlocking fixation. J Bone Joint Surg Am. 1988;70(1):1453-1462.
20. Koval KJ, Clapper MF, Brumback RJ, et al. Complications of reamed intramedullary nailing of the tibia. J Orthop Trauma. 1991;5(2):184-189.
21. Kretzler JE, Curtin SL, Wegner DA, Baumgaertner MR, Galloway MT. Patella tendon rupture: a late complication of a tibial nail. Orthopedics. 1995;18(11):1109-1111.
22. Moroney P, McCarthy T, Borton D. Patellar tendon rupture post reamed intra-medullary tibial nail in a patient with Ehlers-Danlos syndrome. A case report. Eur J Orthop Surg Traumatol. 2004;14(1):50-51.
23. Crossett LS, Sinha RK, Sechriest VF, Rubash HE. Reconstruction of a ruptured patellar tendon with achilles tendon allograft following total knee arthroplasty. J Bone Joint Surg Am. 2002;84(8):1354-1361.
24. Falconiero RP, Pallis MP. Chronic rupture of a patellar tendon: a technique for reconstruction with Achilles allograft. Arthroscopy. 1996;12(5):623-626.
Mycoplasma pneumoniae Infection in Adults With Acute and Chronic Urticaria
To the Editor:
Mycoplasma pneumoniae has been implicated as a cause of acute urticaria (AU) in children,1 but its role in adults with AU is unknown. The aim of this retrospective study was to compare the incidence of acute M pneumoniae infection in adults with AU and chronic urticaria (CU).
A chart review was performed on adult patients with AU and CU who presented at a private dermatology practice in Singapore. Acute M pneumoniae infection was diagnosed on the basis of a single indirect microparticle agglutinin assay (MAA) titer of 1:320 or higher. All statistical tests were performed using SPSS version 13.0. P=.05 was regarded as significant. Data from 49 adults with AU and 44 adults with CU were analyzed. The distribution of MAA titers in adults with AU and CU are shown in the Figure. Microparticle agglutinin assay was negative in 10 (20.4%) of 49 adults with AU. Fifteen (30.6%) of 49 adults with AU had evidence of acute M pneumoniae infection, as indicated by an MAA titer of 1:320 or higher. The remaining 24 (49.0%) had evidence of prior infection as indicated by titers above the manufacturer’s cutoff of 1:402 and below our cutoff for acute infection of 1:320 or higher. Microparticle agglutinin assay was negative in 11 (25%) of 44 adults with CU. Three (6.8%) adults with CU were diagnosed with acute M pneumoniae infection and 30 (68.2%) were diagnosed with prior infection. The incidence of acute M pneumoniae infection was 30.6% in adults with AU compared to 6.8% in adults with CU, and the difference was statistically significant (P=.004).
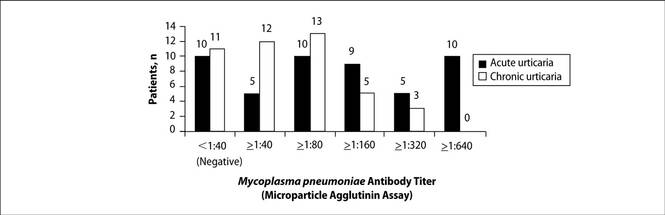
Extrapulmonary complications of M pneumoniae involving practically every organ system have been described and 25% of patients develop cutaneous symptoms3 including AU. In 2007, Kano et al4 reported M pneumoniae infection-induced erythema nodosum, anaphylactoid purpura, and AU in a family of 3. This report was interesting because it showed that M pneumoniae had the ability to elicit different cutaneous reactions depending on the maturity of the adaptive immunity of a host, even among individuals of a common genetic background. A Taiwanese study found that 21 (32%) of 65 children with AU had M pneumoniae infection as determined by a positive Mycoplasma IgM test or an equivocal Mycoplasma IgM coupled with positive cold agglutinin test results.1
In our study, we found serological evidence of acute M pneumoniae infection in 15 (30.6%) of 49 adults with AU compared to 3 (6.8%) of 44 adults with CU (P=.004), suggesting that M pneumoniae also may play a role in the etiology of adult AU. Diagnosis of acute M pneumoniae infection is challenging, as it is often impossible to obtain convalescent serum that will show the 4-fold rise in titer. Single MAA titers of 1:160 or higher have been recommended for diagnosis of acute infection,5 but because of higher background activity in Singapore, we used a higher titer (>1:320). However, in doing so, we could be underestimating the true incidence of acute M pneumoniae infections.
The role of M pneumoniae in CU is uncertain. A Thai study reported that 55% of 38 children with CU had elevated M pneumoniae titers but did not provide details of actual titers or define what they meant by elevated titers.6 The incidence of acute and prior infection in our patients with CU was 6.8% and 68.2%, respectively. Unfortunately, we cannot determine the significance of the 68.2% incidence rate of prior infection in the absence of a normal control population of patients without urticaria. Another limitation of this study is that we compared M pneumoniae infection rate in AU with CU on the assumption that infection is not likely to play a significant role in CU, which may not necessarily be the case. Tests for other etiologic agents, including viruses, also were not performed. Not withstanding these limitations, this study suggests that acute M pneumoniae infection is significantly more common in adults with AU than in adults with CU.
This study showed that M pneumoniae might play a role in the etiology of AU in adults and our findings need to be confirmed by prospective studies. Several more questions must be answered before deciding whether the current practice of treating AU symptomatically without investigation needs to be changed. First, does treatment of M pneumoniae infection have any influence on the course of AU? The fact that AU usually is self-limiting suggests that treatment may not influence the disease course. Second, does treatment of underlying M pneumoniae infection shorten the course of AU? Third, do AU patients with untreated M pneumoniae infection face a higher risk for developing CU? This question is intriguing for the following reasons: (1) 30% to 50% of CU cases are autoimmune in etiology7; (2) antibodies to galactocerebroside that cross-react with glycolipids on M pneumoniae have been detected in patients with M pneumoniae–associated Guillain-Barré syndrome, suggesting a form of molecular mimicry8; and (3) antinuclear antibody also has occasionally been detected in sera of patients with M pneumoniae.9 It would be interesting to test patients with autoimmune and nonautoimmune CU for evidence of M pneumoniae serology infection.
We hope that prospective studies will be conducted in the future to confirm our findings and answer some of the questions raised.
1. Wu CC, Kuo HC, Yu HR, et al. Association of acute urticaria with Mycoplasma pneumoniae infection in hospitalized children. Ann Allergy Asthma Immunol. 2009;103:134-139.
2. Serodia-Myco II [package insert]. Tokyo, Japan: Fujirebo; 2013.
3. Murray HW, Masur H, Senterfit LB, et al. The protean manifestations of Mycoplasma pneumoniae infection in adults. Am J Med. 1975;58:229-242.
4. Kano Y, Mitsuyama Y, Hirahara K, et al. Mycoplasma pneumoniae infection-induced erythema nodosum, anaphylactoid purpura, and acute urticaria in 3 people in a single family. J Am Acad Dermatol. 2007;57(suppl 2):S33-S35.
5. Daxboeck F, Krause R, Wenisch C. Laboratory diagnosis of Mycoplasma pneumoniae infection. Clin Microbiol Infect. 2003;9:263-273.
6. Pongpreuksa S, Boochoo S, Kulthanan K, et al. Chronic urticaria: what is worth doing in pediatric population? J Allergy Clin Immunol. 2004:S134.
7. Grattan CE. Autoimmune urticaria. Immunol Allergy Clin North Am. 2004;24:163-181.
8. Kusunoki S, Shiina M, Kanazawa I. Anti-Gal-C antibodies in GBS subsequent to mycoplasma infection: evidence of molecular mimicry. Neurology. 2001;57:736-738.
9. Arikan S, Ergüven S, Ustaçelebi S, et al. Detection of antinuclear antibody (ANA) in patients with Mycoplasmal Pneumonia. Turk J Med Sci. 1998;28:97-98.
To the Editor:
Mycoplasma pneumoniae has been implicated as a cause of acute urticaria (AU) in children,1 but its role in adults with AU is unknown. The aim of this retrospective study was to compare the incidence of acute M pneumoniae infection in adults with AU and chronic urticaria (CU).
A chart review was performed on adult patients with AU and CU who presented at a private dermatology practice in Singapore. Acute M pneumoniae infection was diagnosed on the basis of a single indirect microparticle agglutinin assay (MAA) titer of 1:320 or higher. All statistical tests were performed using SPSS version 13.0. P=.05 was regarded as significant. Data from 49 adults with AU and 44 adults with CU were analyzed. The distribution of MAA titers in adults with AU and CU are shown in the Figure. Microparticle agglutinin assay was negative in 10 (20.4%) of 49 adults with AU. Fifteen (30.6%) of 49 adults with AU had evidence of acute M pneumoniae infection, as indicated by an MAA titer of 1:320 or higher. The remaining 24 (49.0%) had evidence of prior infection as indicated by titers above the manufacturer’s cutoff of 1:402 and below our cutoff for acute infection of 1:320 or higher. Microparticle agglutinin assay was negative in 11 (25%) of 44 adults with CU. Three (6.8%) adults with CU were diagnosed with acute M pneumoniae infection and 30 (68.2%) were diagnosed with prior infection. The incidence of acute M pneumoniae infection was 30.6% in adults with AU compared to 6.8% in adults with CU, and the difference was statistically significant (P=.004).
Extrapulmonary complications of M pneumoniae involving practically every organ system have been described and 25% of patients develop cutaneous symptoms3 including AU. In 2007, Kano et al4 reported M pneumoniae infection-induced erythema nodosum, anaphylactoid purpura, and AU in a family of 3. This report was interesting because it showed that M pneumoniae had the ability to elicit different cutaneous reactions depending on the maturity of the adaptive immunity of a host, even among individuals of a common genetic background. A Taiwanese study found that 21 (32%) of 65 children with AU had M pneumoniae infection as determined by a positive Mycoplasma IgM test or an equivocal Mycoplasma IgM coupled with positive cold agglutinin test results.1
In our study, we found serological evidence of acute M pneumoniae infection in 15 (30.6%) of 49 adults with AU compared to 3 (6.8%) of 44 adults with CU (P=.004), suggesting that M pneumoniae also may play a role in the etiology of adult AU. Diagnosis of acute M pneumoniae infection is challenging, as it is often impossible to obtain convalescent serum that will show the 4-fold rise in titer. Single MAA titers of 1:160 or higher have been recommended for diagnosis of acute infection,5 but because of higher background activity in Singapore, we used a higher titer (>1:320). However, in doing so, we could be underestimating the true incidence of acute M pneumoniae infections.
The role of M pneumoniae in CU is uncertain. A Thai study reported that 55% of 38 children with CU had elevated M pneumoniae titers but did not provide details of actual titers or define what they meant by elevated titers.6 The incidence of acute and prior infection in our patients with CU was 6.8% and 68.2%, respectively. Unfortunately, we cannot determine the significance of the 68.2% incidence rate of prior infection in the absence of a normal control population of patients without urticaria. Another limitation of this study is that we compared M pneumoniae infection rate in AU with CU on the assumption that infection is not likely to play a significant role in CU, which may not necessarily be the case. Tests for other etiologic agents, including viruses, also were not performed. Not withstanding these limitations, this study suggests that acute M pneumoniae infection is significantly more common in adults with AU than in adults with CU.
This study showed that M pneumoniae might play a role in the etiology of AU in adults and our findings need to be confirmed by prospective studies. Several more questions must be answered before deciding whether the current practice of treating AU symptomatically without investigation needs to be changed. First, does treatment of M pneumoniae infection have any influence on the course of AU? The fact that AU usually is self-limiting suggests that treatment may not influence the disease course. Second, does treatment of underlying M pneumoniae infection shorten the course of AU? Third, do AU patients with untreated M pneumoniae infection face a higher risk for developing CU? This question is intriguing for the following reasons: (1) 30% to 50% of CU cases are autoimmune in etiology7; (2) antibodies to galactocerebroside that cross-react with glycolipids on M pneumoniae have been detected in patients with M pneumoniae–associated Guillain-Barré syndrome, suggesting a form of molecular mimicry8; and (3) antinuclear antibody also has occasionally been detected in sera of patients with M pneumoniae.9 It would be interesting to test patients with autoimmune and nonautoimmune CU for evidence of M pneumoniae serology infection.
We hope that prospective studies will be conducted in the future to confirm our findings and answer some of the questions raised.
1. Wu CC, Kuo HC, Yu HR, et al. Association of acute urticaria with Mycoplasma pneumoniae infection in hospitalized children. Ann Allergy Asthma Immunol. 2009;103:134-139.
2. Serodia-Myco II [package insert]. Tokyo, Japan: Fujirebo; 2013.
3. Murray HW, Masur H, Senterfit LB, et al. The protean manifestations of Mycoplasma pneumoniae infection in adults. Am J Med. 1975;58:229-242.
4. Kano Y, Mitsuyama Y, Hirahara K, et al. Mycoplasma pneumoniae infection-induced erythema nodosum, anaphylactoid purpura, and acute urticaria in 3 people in a single family. J Am Acad Dermatol. 2007;57(suppl 2):S33-S35.
5. Daxboeck F, Krause R, Wenisch C. Laboratory diagnosis of Mycoplasma pneumoniae infection. Clin Microbiol Infect. 2003;9:263-273.
6. Pongpreuksa S, Boochoo S, Kulthanan K, et al. Chronic urticaria: what is worth doing in pediatric population? J Allergy Clin Immunol. 2004:S134.
7. Grattan CE. Autoimmune urticaria. Immunol Allergy Clin North Am. 2004;24:163-181.
8. Kusunoki S, Shiina M, Kanazawa I. Anti-Gal-C antibodies in GBS subsequent to mycoplasma infection: evidence of molecular mimicry. Neurology. 2001;57:736-738.
9. Arikan S, Ergüven S, Ustaçelebi S, et al. Detection of antinuclear antibody (ANA) in patients with Mycoplasmal Pneumonia. Turk J Med Sci. 1998;28:97-98.
Patients’ Perceptions of the Costs of Total Hip and Knee Arthroplasty
Medical economics has been a major sociopolitical issue in the United States for the past 20 years, with concerns focused on increasing medical spending. These costs are projected to continue to rise, from 15.3% of gross domestic product in 2002 to 19.6% in 2017.1
Multiple steps have been taken to help reduce the cost of health care, many of which center on physician reimbursement. The Balanced Budget Act of 1997 worked to control Medicare spending by increasing reimbursement for clinic visits by setting reductions for procedural reimbursements. This specifically affects orthopedic surgeons, who between 1991 and 2002 experienced a 28% reduction in reimbursement, after inflation, for commonly performed orthopedic procedures, including hip and knee arthroplasty.2 Unfortunately, this system does not take into account the value of services as perceived by patients.
Total hip and knee arthroplasty (THA, TKA) are well-established surgical treatments for advanced osteoarthritis of the hip and knee, respectively. Much research has been done on patient satisfaction with these procedures and on their long-term results and cost-effectiveness. These procedures rank among the highest in patient satisfaction, and improvements in technique and technology have steadily improved long-term results. THA and TKA have proved to be cost-effective in appropriately indicated patients.
The demand for THA and TKA is projected to increase by 174% and 673%, respectively, from 2005 to 2030.3 Legislators, payers, health care providers, and patients are understandably concerned about the rising cost of health care and the implications for access to elective surgical procedures. In a recent study by Foran and colleagues,4 surveyed postoperative patients indicated that Medicare reimbursement was “much lower” for arthroplasty than it should be. In addition, they overestimated (compared with national averages) what Medicare reimburses for hip and knee arthroplasty. Many raised concerns that orthopedic surgeons might drop Medicare entirely.4
These misconceptions about reimbursement may stem partly from the inaccessibility of health care cost information. Rosenthal and colleagues5 recently queried a random selection of US hospitals and demonstrated the difficulty in obtaining THA pricing information.
In a system in which consumers and payers are often not one and the same, it is unclear if consumers understand the cost of their health care. We conducted a study to assess patients’ perceptions of the cost of total joint arthroplasty (TJA) and gain insight into their understanding of health care costs and their sense of the value of this elective surgical procedure.
Materials and Methods
After obtaining institutional review board approval and informed consent for this study, we surveyed 284 consecutive patients who underwent THA or TKA at an academic medical center. Patients had either primary or revision surgery performed (by Dr. Hallstrom or Dr. Urquhart) and were surveyed during their first (2-week) postoperative visit, between March 1, 2012 and December 20, 2012.
Surveys were labeled with patient identifiers to facilitate abstraction of data from electronic medical records. Operative reports and discharge summaries were reviewed for data that included sex, age, diagnosis, procedure, surgeon, implant, admission date, and length of stay.
The survey asked for demographic information, including level of education, insurance coverage, and annual household income, and included a question to verify the surgical procedure and a question to determine if the patient had reviewed a hospital billing statement pertaining to the patient’s admission. The survey also included these questions about reimbursement and cost:
- How much do you feel your orthopedic surgeon was reimbursed for your surgery? (EXCLUDING payments to the hospital)
- How much do you think your surgeon gets reimbursed to see you IN THE HOSPITAL after surgery?
- How much do you think your surgeon gets reimbursed per visit to see you IN CLINIC for follow-up during the first 3 months after surgery?
- How much do you think the implant used in your surgery cost?
- How much do you think the hospital was reimbursed for your surgery and admission to the hospital after surgery? (EXCLUDING payments to the surgeon)
- How much do you think it cost the hospital to provide your surgery and admission to the hospital after surgery?
Responses were limited to numeric currency format using a response area as shown in Figure 1. Overall patient satisfaction was elicited with use of a 5-point scale ranging from 1 (very unsatisfied) to 5 (very satisfied). Regarding type of implant used, patients could select from 6 prominent vendors or indicate “other” or “don’t know.” They were also asked which of several factors should primarily determine surgeon reimbursement: overall patient satisfaction, technical difficulty, amount of risk/possible harm, duration/amount of time, and rate of complications. A free-response comments section was provided at the end of the survey.

Data from the survey and the electronic medical records were collected using Research Electronic Data Capture (REDCap; Vanderbilt University, Nashville, Tennessee). Statistical analysis was performed with SAS Version 9.3 (SAS Institute, Cary, North Carolina). Data were screened before further analysis. Patients who provided nonnumeric responses in numeric response fields were excluded from further analysis. Numeric ranges were applied in subsequent analysis using the mean of the range. Implausible responses resulted in the removal of the entire encounter from subsequent analysis.
Demographic data used to define categories for further subgroup analysis are presented as percentages of the group. Medians, means, and interquartile ranges were calculated for all responses regarding reimbursement and cost. Differences in perceptions of reimbursement and cost based on subgroups, including procedure type, diagnosis, education level, and satisfaction, were calculated. Independent-samples Student t tests were used to determine the statistical significance of the differences detected.
Results
Of the 400 eligible patients seen at the first postoperative follow-up, 284 (71%) were enrolled in the study. Mean (SD) age was 62.6 (12.6) years. Of the 284 patients enrolled, 154 (54%) were female. Of the participants who reported their education and income, 125 (44%) had a bachelor’s degree or higher degree, and 68 (23.9%) reported income of more than $100,000 per year. The largest payers reported by patients were private insurance (80%) and Medicare (46%). Additional demographic details are listed in Table 1.

Of the 284 patients enrolled in the study, 159 (56%) had THA, and 88 (31%) had TKA (Table 2). Thirty-seven patients (13%) underwent revision procedures. Only 5 patients (2%) indicated they had reviewed their hospital billing statement from their most recent admission. Two hundred forty-two patients (85%) were satisfied or very satisfied with their procedure.
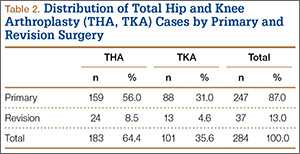
Regarding the implant used in their surgery, 216 patients (76%) indicated they did not know which company manufactured it. Of the 68 patients (24%) who named a manufacturer, 53 (78%) were correct in their selection (intraoperative records were checked). Patients indicated they thought the implant used in their surgery cost $6447 on average (95% CI, $5581-$7312).
On average, patients thought their surgeon was reimbursed $12,014 (95% CI, $10,845-$13,183) for their procedure, and they estimated that the hospital was reimbursed $28,392 (95% CI, $25,271-$31,512) for their perioperative care and that it cost the hospital $24,389 (95% CI, $21,612-$27,165) to provide it. Means, confidence intervals, medians, and interquartile ranges for parameters of reimbursement and cost are listed in Table 3. Seventy-one patients (25%) thought on average that the hospital took a net loss for each TJA performed, and 146 patients (51%) thought on average that the hospital generated a net profit for each TJA.
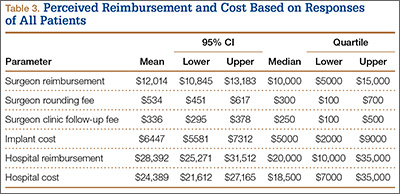
On average, patients thought surgeons were reimbursed $11,872 for a THA and $12,263 for a TKA. Patients also estimated a higher hospital cost (THA, $22,981; TKA, $26,998) and reimbursement (THA, $27,366; TKA, $30,230) after TKA than THA. These differences in perceptions of cost and reimbursement for THA and TKA appear in Table 4 and Figure 2.
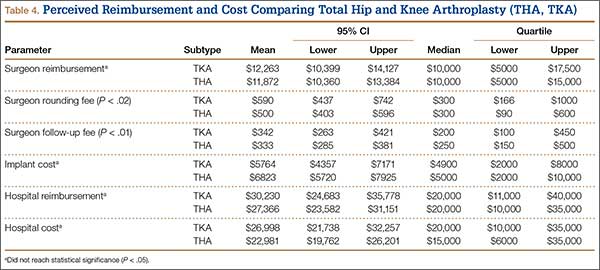
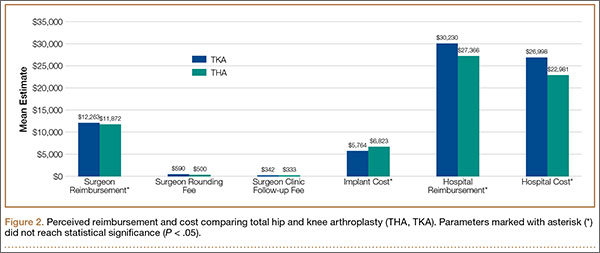
Statistically significant differences were also found in perceptions of cost and reimbursement based on level of education and overall patient satisfaction. Patients with a bachelor’s degree or higher estimated physician reimbursement at $11,006, whereas patients with a lower level of education estimated reimbursement at $12,890. In addition, patients with a lower level of education gave estimates of hospital cost and reimbursement that were $7698 and $10,799 higher, respectively, than the estimates given by patients with a higher level of education (Table 5, Figure 3). Patients who were satisfied or very satisfied with their overall TJA experience estimated surgeon reimbursement at $11,673. Patients who indicated they were unsatisfied, very unsatisfied, or neutral regarding their overall experience gave a higher estimate of surgeon reimbursement: $14,317 (Table 6, Figure 4).
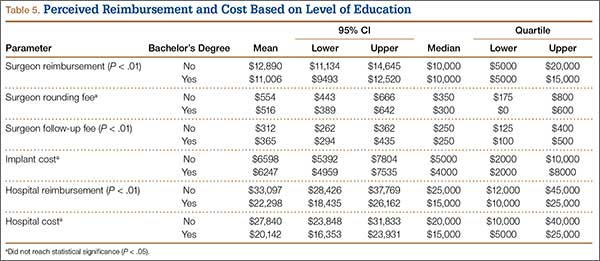
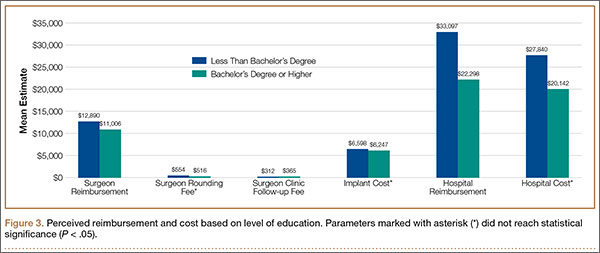

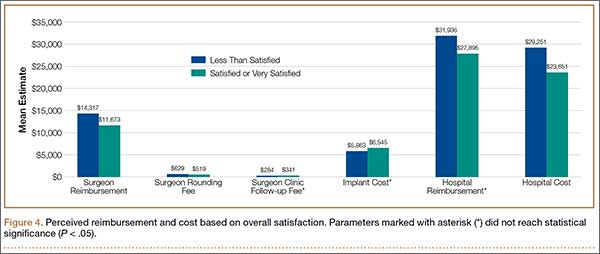
Because of the small number of enrolled patients who had revision surgery and the high variability in patient responses, there were no meaningful or statistically significant differences in perceptions of cost and reimbursement based on revision or primary surgery.
Patients also estimated substantial additional reimbursements to physicians for services included at no additional charge with the global surgical package. Median estimates were $300 for reimbursement to a physician making rounds in the hospital and $250 for reimbursement for an outpatient follow-up. Only 47 patients (17%) and 35 patients (12%) correctly indicated there is no additional payment for making rounds and outpatient follow-up, respectively. Estimates of these reimbursements varied by education level, procedure, and overall satisfaction (Tables 4–6).
Discussion
The sustainable growth rate (SGR) formula, part of the Balanced Budget Act of 1997, was constructed to manage health care costs in the context of overall economic growth. By 2001, Medicare health care expenditures had begun to outpace economic growth, and the SGR formula dictated a reduction in reimbursement to physicians. Each year over the past decade, Congress has passed legislation providing a temporary reprieve, staving off a drastic reduction of as much as 25% in 2010.6 Despite these adjustments, reimbursement continues to decrease because of overall inflation.
More worrisome is that “more than half of the nearly trillion dollar price tag for expanding coverage under the Affordable Care Act (ACA) will be paid by decreasing spending for the more than 46.3 million individuals covered by Medicare.”7 ACA provisions will also create an Independent Payment Advisory Board (IPAB) to oversee health care costs and reduce Medicare spending when it is expected to exceed target levels.8 As IPAB cannot recommend increasing revenues or changing benefits, and because it is initially prohibited from recommending decreasing payments to hospitals, the decreases will likely have the greatest impact on physician reimbursement.7-9
Health care policy has been a major campaign issue during recent US elections. The public and popular media remain engaged in this important discussion. Although patients, policymakers, and physicians are understandably concerned about cost and access to health care, it is unclear if patients understand the distribution of health care cost and reimbursement.
Other authors have studied patients’ perceptions of physician reimbursement for TJA. Hayden and colleagues10 surveyed 1000 residents of a Texas city. The 121 who responded to the survey thought that fair compensation for performing a TKA was $5080, on average.10 Although this was significantly higher than the actual Medicare reimbursement at the time, a later study, by Foran and colleagues,4 found patients’ estimates of both fair reimbursement and Medicare reimbursement for TJA to be even higher. Foran and colleagues4 surveyed 1120 patients who thought surgeons deserved to be paid $14,358 for THA and $13,322 for TKA, on average. These reimbursement values are nearly an order of magnitude higher than actual reimbursements. For Medicare payments, patients lowered their estimates to $8212 for THA and $7196 for TKA.4
To our knowledge, the present study is the first to use a “postconsumer” survey to assess patients’ perceptions of THA and TKA costs. Our results confirmed that patients substantially overestimated reimbursement for THA and TKA at $11,872 and $12,263, respectively, relative to the average Medicare reimbursements of $1467 and $1530, respectively.11 We also found that patients overestimated both hospital cost and reimbursement for THA at $22,981 and $27,366, respectively, relative to recently published hospital economic analyses showing THA cost and reimbursement to be $11,688 and $15,789, respectively.12 Few patients enrolled in our study demonstrated an understanding of the services included in the global surgical package. Only about 12% of patients correctly indicated there was no additional payment to the physician for initial follow-up appointments. However, patients were fairly accurate in their estimates of implant cost. On average, patients who underwent THA priced their implant at $6823, which is only about 9% higher than the reported median cost of $6072 to $6400.13,14
We also found significant differences in perceptions of cost based on level of education, joint replaced, and overall level of satisfaction. On average, patients with a bachelor’s degree or higher gave estimates of cost and reimbursement that were lower than those given by patients with a lower level of education. Estimates of physician reimbursement and hospital reimbursement and cost were higher from patients who had TKA than from patients who had THA.
Comparing perceptions of reimbursement for appendectomy and coronary artery bypass with perceptions for TJA, Foran and colleagues4 found that patients understood the relative complexity of each procedure, as evidenced by their estimates of fair reimbursement for each. However, in comparing patient estimates for the different components of cost and reimbursement for TJA, we found great variability in understanding. Patients in our study overestimated payments to the hospital by 73% but overestimated the cost of the THA implant by only 9%. However, the same patients overestimated physician reimbursement for THA by about 800%. If these patients’ estimates of reimbursement are considered surrogates for relative value, then physicians, based on actual payments, are grossly undervalued relative to implant manufacturers.
Our study had several limitations. First, the enrolled patients were all seen at one medical center, in Ann Arbor, Michigan, and our results may not be generalizable outside the region. Second, the survey respondents were postoperative patients who had an established relationship with the study’s principal investigators—a relationship that may have been a source of bias in the consideration of reimbursement as a function of value. Third, despite our efforts to carefully design a survey with open-ended responses, the order in which the survey questions were presented may have influenced patient responses. Fourth, the open-ended question design may have had an impact on responses where the correct answer would have required entering 0.00.
Despite these limitations, our study results demonstrated general public misconceptions about cost and reimbursement for common orthopedic procedures. Although more transparency in health care cost information may not immediately result in a more well-informed population,15 our patients, given the opportunity to develop an understanding of the economics of their own medical treatment, may become better prepared to make informed choices regarding changes in health care policy.
1. Kumar S, Ghildayal NS, Shah RN. Examining quality and efficiency of the U.S. healthcare system. Int J Health Care Qual Assur. 2011;24(5):366-388.
2. Hariri S, Bozic KJ, Lavernia C, Prestipino A, Rubash HE. Medicare physician reimbursement: past, present, and future. J Bone Joint Surg Am. 2007;89(11):2536-2546.
3. Kurtz S, Ong K, Lau E, Mowat F, Halpern M. Projections of primary and revision hip and knee arthroplasty in the United States from 2005 to 2030. J Bone Joint Surg Am. 2007;89(4):780-785.
4. Foran JR, Sheth NP, Ward SR, et al. Patient perception of physician reimbursement in elective total hip and knee arthroplasty. J Arthroplasty. 2012;27(5):703-709.
5. Rosenthal JA, Lu X, Cram P. Availability of consumer prices from US hospitals for a common surgical procedure. JAMA Intern Med. 2013;173(6):427-432.
6. US Senate Committee on Finance. H.R. 4994: the Medicare and Medicaid Extenders Act of 2010. http://www.finance.senate.gov/legislation/details/?id=9f97aa2e-5056-a032-52d4-8db158b12b11. Accessed March 25, 2015.
7. Zinberg JM. When patients call, will physicians respond? JAMA. 2011;305(19):2011-2012.
8. Jost TS. The Independent Payment Advisory Board. N Engl J Med. 2010;363(2):103-105.
9. US Department of Health and Human Services, Centers for Medicare & Medicaid Services. Estimated financial effects of the “Patient Protection and Affordable Care Act,” as amended. 2010. http://www.cms.gov/Research-Statistics-Data-and-Systems/Research/ActuarialStudies/downloads/PPACA_2010-04-22.pdf. Accessed March 25, 2015.
10. Hayden SA, Hayden D, White LW. The U.S. public’s perceived value of the surgeon’s fee for total knee replacement. Abstract presented at: 75th Annual Meeting of the American Academy of Orthopaedic Surgeons; March 5-9, 2008; San Francisco, CA. Abstract 214.
11. Centers for Medicare & Medicaid Services. Physician Fee Schedule Search Tool. http://www.cms.gov/apps/physician-fee-schedule/search/search-criteria.aspx. Accessed March 25, 2015.
12. Rana AJ, Iorio R, Healy WL. Hospital economics of primary THA decreasing reimbursement and increasing cost, 1990 to 2008. Clin Orthop. 2011;469(2):355-361.
13. Lavernia CJ, Hernandez VH, Rossi MD. Payment analysis of total hip replacement. Curr Opin Orthop. 2007;18(1):23-27.
14. Robinson JC, Pozen A, Tseng S, Bozic KJ. Variability in costs associated with total hip and knee replacement implants. J Bone Joint Surg Am. 2012;94(18):1693-1698.
15. Smolders JM, Van Loon CJ, Rijnberg WJ, Van Susante JL. Patients poorly estimate the overall costs of a total knee arthroplasty and strongly overestimate the surgeon’s fee. Acta Orthop Belg. 2007;73(3):339-344.
Medical economics has been a major sociopolitical issue in the United States for the past 20 years, with concerns focused on increasing medical spending. These costs are projected to continue to rise, from 15.3% of gross domestic product in 2002 to 19.6% in 2017.1
Multiple steps have been taken to help reduce the cost of health care, many of which center on physician reimbursement. The Balanced Budget Act of 1997 worked to control Medicare spending by increasing reimbursement for clinic visits by setting reductions for procedural reimbursements. This specifically affects orthopedic surgeons, who between 1991 and 2002 experienced a 28% reduction in reimbursement, after inflation, for commonly performed orthopedic procedures, including hip and knee arthroplasty.2 Unfortunately, this system does not take into account the value of services as perceived by patients.
Total hip and knee arthroplasty (THA, TKA) are well-established surgical treatments for advanced osteoarthritis of the hip and knee, respectively. Much research has been done on patient satisfaction with these procedures and on their long-term results and cost-effectiveness. These procedures rank among the highest in patient satisfaction, and improvements in technique and technology have steadily improved long-term results. THA and TKA have proved to be cost-effective in appropriately indicated patients.
The demand for THA and TKA is projected to increase by 174% and 673%, respectively, from 2005 to 2030.3 Legislators, payers, health care providers, and patients are understandably concerned about the rising cost of health care and the implications for access to elective surgical procedures. In a recent study by Foran and colleagues,4 surveyed postoperative patients indicated that Medicare reimbursement was “much lower” for arthroplasty than it should be. In addition, they overestimated (compared with national averages) what Medicare reimburses for hip and knee arthroplasty. Many raised concerns that orthopedic surgeons might drop Medicare entirely.4
These misconceptions about reimbursement may stem partly from the inaccessibility of health care cost information. Rosenthal and colleagues5 recently queried a random selection of US hospitals and demonstrated the difficulty in obtaining THA pricing information.
In a system in which consumers and payers are often not one and the same, it is unclear if consumers understand the cost of their health care. We conducted a study to assess patients’ perceptions of the cost of total joint arthroplasty (TJA) and gain insight into their understanding of health care costs and their sense of the value of this elective surgical procedure.
Materials and Methods
After obtaining institutional review board approval and informed consent for this study, we surveyed 284 consecutive patients who underwent THA or TKA at an academic medical center. Patients had either primary or revision surgery performed (by Dr. Hallstrom or Dr. Urquhart) and were surveyed during their first (2-week) postoperative visit, between March 1, 2012 and December 20, 2012.
Surveys were labeled with patient identifiers to facilitate abstraction of data from electronic medical records. Operative reports and discharge summaries were reviewed for data that included sex, age, diagnosis, procedure, surgeon, implant, admission date, and length of stay.
The survey asked for demographic information, including level of education, insurance coverage, and annual household income, and included a question to verify the surgical procedure and a question to determine if the patient had reviewed a hospital billing statement pertaining to the patient’s admission. The survey also included these questions about reimbursement and cost:
- How much do you feel your orthopedic surgeon was reimbursed for your surgery? (EXCLUDING payments to the hospital)
- How much do you think your surgeon gets reimbursed to see you IN THE HOSPITAL after surgery?
- How much do you think your surgeon gets reimbursed per visit to see you IN CLINIC for follow-up during the first 3 months after surgery?
- How much do you think the implant used in your surgery cost?
- How much do you think the hospital was reimbursed for your surgery and admission to the hospital after surgery? (EXCLUDING payments to the surgeon)
- How much do you think it cost the hospital to provide your surgery and admission to the hospital after surgery?
Responses were limited to numeric currency format using a response area as shown in Figure 1. Overall patient satisfaction was elicited with use of a 5-point scale ranging from 1 (very unsatisfied) to 5 (very satisfied). Regarding type of implant used, patients could select from 6 prominent vendors or indicate “other” or “don’t know.” They were also asked which of several factors should primarily determine surgeon reimbursement: overall patient satisfaction, technical difficulty, amount of risk/possible harm, duration/amount of time, and rate of complications. A free-response comments section was provided at the end of the survey.
Data from the survey and the electronic medical records were collected using Research Electronic Data Capture (REDCap; Vanderbilt University, Nashville, Tennessee). Statistical analysis was performed with SAS Version 9.3 (SAS Institute, Cary, North Carolina). Data were screened before further analysis. Patients who provided nonnumeric responses in numeric response fields were excluded from further analysis. Numeric ranges were applied in subsequent analysis using the mean of the range. Implausible responses resulted in the removal of the entire encounter from subsequent analysis.
Demographic data used to define categories for further subgroup analysis are presented as percentages of the group. Medians, means, and interquartile ranges were calculated for all responses regarding reimbursement and cost. Differences in perceptions of reimbursement and cost based on subgroups, including procedure type, diagnosis, education level, and satisfaction, were calculated. Independent-samples Student t tests were used to determine the statistical significance of the differences detected.
Results
Of the 400 eligible patients seen at the first postoperative follow-up, 284 (71%) were enrolled in the study. Mean (SD) age was 62.6 (12.6) years. Of the 284 patients enrolled, 154 (54%) were female. Of the participants who reported their education and income, 125 (44%) had a bachelor’s degree or higher degree, and 68 (23.9%) reported income of more than $100,000 per year. The largest payers reported by patients were private insurance (80%) and Medicare (46%). Additional demographic details are listed in Table 1.
Of the 284 patients enrolled in the study, 159 (56%) had THA, and 88 (31%) had TKA (Table 2). Thirty-seven patients (13%) underwent revision procedures. Only 5 patients (2%) indicated they had reviewed their hospital billing statement from their most recent admission. Two hundred forty-two patients (85%) were satisfied or very satisfied with their procedure.
Regarding the implant used in their surgery, 216 patients (76%) indicated they did not know which company manufactured it. Of the 68 patients (24%) who named a manufacturer, 53 (78%) were correct in their selection (intraoperative records were checked). Patients indicated they thought the implant used in their surgery cost $6447 on average (95% CI, $5581-$7312).
On average, patients thought their surgeon was reimbursed $12,014 (95% CI, $10,845-$13,183) for their procedure, and they estimated that the hospital was reimbursed $28,392 (95% CI, $25,271-$31,512) for their perioperative care and that it cost the hospital $24,389 (95% CI, $21,612-$27,165) to provide it. Means, confidence intervals, medians, and interquartile ranges for parameters of reimbursement and cost are listed in Table 3. Seventy-one patients (25%) thought on average that the hospital took a net loss for each TJA performed, and 146 patients (51%) thought on average that the hospital generated a net profit for each TJA.
On average, patients thought surgeons were reimbursed $11,872 for a THA and $12,263 for a TKA. Patients also estimated a higher hospital cost (THA, $22,981; TKA, $26,998) and reimbursement (THA, $27,366; TKA, $30,230) after TKA than THA. These differences in perceptions of cost and reimbursement for THA and TKA appear in Table 4 and Figure 2.
Statistically significant differences were also found in perceptions of cost and reimbursement based on level of education and overall patient satisfaction. Patients with a bachelor’s degree or higher estimated physician reimbursement at $11,006, whereas patients with a lower level of education estimated reimbursement at $12,890. In addition, patients with a lower level of education gave estimates of hospital cost and reimbursement that were $7698 and $10,799 higher, respectively, than the estimates given by patients with a higher level of education (Table 5, Figure 3). Patients who were satisfied or very satisfied with their overall TJA experience estimated surgeon reimbursement at $11,673. Patients who indicated they were unsatisfied, very unsatisfied, or neutral regarding their overall experience gave a higher estimate of surgeon reimbursement: $14,317 (Table 6, Figure 4).
Because of the small number of enrolled patients who had revision surgery and the high variability in patient responses, there were no meaningful or statistically significant differences in perceptions of cost and reimbursement based on revision or primary surgery.
Patients also estimated substantial additional reimbursements to physicians for services included at no additional charge with the global surgical package. Median estimates were $300 for reimbursement to a physician making rounds in the hospital and $250 for reimbursement for an outpatient follow-up. Only 47 patients (17%) and 35 patients (12%) correctly indicated there is no additional payment for making rounds and outpatient follow-up, respectively. Estimates of these reimbursements varied by education level, procedure, and overall satisfaction (Tables 4–6).
Discussion
The sustainable growth rate (SGR) formula, part of the Balanced Budget Act of 1997, was constructed to manage health care costs in the context of overall economic growth. By 2001, Medicare health care expenditures had begun to outpace economic growth, and the SGR formula dictated a reduction in reimbursement to physicians. Each year over the past decade, Congress has passed legislation providing a temporary reprieve, staving off a drastic reduction of as much as 25% in 2010.6 Despite these adjustments, reimbursement continues to decrease because of overall inflation.
More worrisome is that “more than half of the nearly trillion dollar price tag for expanding coverage under the Affordable Care Act (ACA) will be paid by decreasing spending for the more than 46.3 million individuals covered by Medicare.”7 ACA provisions will also create an Independent Payment Advisory Board (IPAB) to oversee health care costs and reduce Medicare spending when it is expected to exceed target levels.8 As IPAB cannot recommend increasing revenues or changing benefits, and because it is initially prohibited from recommending decreasing payments to hospitals, the decreases will likely have the greatest impact on physician reimbursement.7-9
Health care policy has been a major campaign issue during recent US elections. The public and popular media remain engaged in this important discussion. Although patients, policymakers, and physicians are understandably concerned about cost and access to health care, it is unclear if patients understand the distribution of health care cost and reimbursement.
Other authors have studied patients’ perceptions of physician reimbursement for TJA. Hayden and colleagues10 surveyed 1000 residents of a Texas city. The 121 who responded to the survey thought that fair compensation for performing a TKA was $5080, on average.10 Although this was significantly higher than the actual Medicare reimbursement at the time, a later study, by Foran and colleagues,4 found patients’ estimates of both fair reimbursement and Medicare reimbursement for TJA to be even higher. Foran and colleagues4 surveyed 1120 patients who thought surgeons deserved to be paid $14,358 for THA and $13,322 for TKA, on average. These reimbursement values are nearly an order of magnitude higher than actual reimbursements. For Medicare payments, patients lowered their estimates to $8212 for THA and $7196 for TKA.4
To our knowledge, the present study is the first to use a “postconsumer” survey to assess patients’ perceptions of THA and TKA costs. Our results confirmed that patients substantially overestimated reimbursement for THA and TKA at $11,872 and $12,263, respectively, relative to the average Medicare reimbursements of $1467 and $1530, respectively.11 We also found that patients overestimated both hospital cost and reimbursement for THA at $22,981 and $27,366, respectively, relative to recently published hospital economic analyses showing THA cost and reimbursement to be $11,688 and $15,789, respectively.12 Few patients enrolled in our study demonstrated an understanding of the services included in the global surgical package. Only about 12% of patients correctly indicated there was no additional payment to the physician for initial follow-up appointments. However, patients were fairly accurate in their estimates of implant cost. On average, patients who underwent THA priced their implant at $6823, which is only about 9% higher than the reported median cost of $6072 to $6400.13,14
We also found significant differences in perceptions of cost based on level of education, joint replaced, and overall level of satisfaction. On average, patients with a bachelor’s degree or higher gave estimates of cost and reimbursement that were lower than those given by patients with a lower level of education. Estimates of physician reimbursement and hospital reimbursement and cost were higher from patients who had TKA than from patients who had THA.
Comparing perceptions of reimbursement for appendectomy and coronary artery bypass with perceptions for TJA, Foran and colleagues4 found that patients understood the relative complexity of each procedure, as evidenced by their estimates of fair reimbursement for each. However, in comparing patient estimates for the different components of cost and reimbursement for TJA, we found great variability in understanding. Patients in our study overestimated payments to the hospital by 73% but overestimated the cost of the THA implant by only 9%. However, the same patients overestimated physician reimbursement for THA by about 800%. If these patients’ estimates of reimbursement are considered surrogates for relative value, then physicians, based on actual payments, are grossly undervalued relative to implant manufacturers.
Our study had several limitations. First, the enrolled patients were all seen at one medical center, in Ann Arbor, Michigan, and our results may not be generalizable outside the region. Second, the survey respondents were postoperative patients who had an established relationship with the study’s principal investigators—a relationship that may have been a source of bias in the consideration of reimbursement as a function of value. Third, despite our efforts to carefully design a survey with open-ended responses, the order in which the survey questions were presented may have influenced patient responses. Fourth, the open-ended question design may have had an impact on responses where the correct answer would have required entering 0.00.
Despite these limitations, our study results demonstrated general public misconceptions about cost and reimbursement for common orthopedic procedures. Although more transparency in health care cost information may not immediately result in a more well-informed population,15 our patients, given the opportunity to develop an understanding of the economics of their own medical treatment, may become better prepared to make informed choices regarding changes in health care policy.
1. Kumar S, Ghildayal NS, Shah RN. Examining quality and efficiency of the U.S. healthcare system. Int J Health Care Qual Assur. 2011;24(5):366-388.
2. Hariri S, Bozic KJ, Lavernia C, Prestipino A, Rubash HE. Medicare physician reimbursement: past, present, and future. J Bone Joint Surg Am. 2007;89(11):2536-2546.
3. Kurtz S, Ong K, Lau E, Mowat F, Halpern M. Projections of primary and revision hip and knee arthroplasty in the United States from 2005 to 2030. J Bone Joint Surg Am. 2007;89(4):780-785.
4. Foran JR, Sheth NP, Ward SR, et al. Patient perception of physician reimbursement in elective total hip and knee arthroplasty. J Arthroplasty. 2012;27(5):703-709.
5. Rosenthal JA, Lu X, Cram P. Availability of consumer prices from US hospitals for a common surgical procedure. JAMA Intern Med. 2013;173(6):427-432.
6. US Senate Committee on Finance. H.R. 4994: the Medicare and Medicaid Extenders Act of 2010. http://www.finance.senate.gov/legislation/details/?id=9f97aa2e-5056-a032-52d4-8db158b12b11. Accessed March 25, 2015.
7. Zinberg JM. When patients call, will physicians respond? JAMA. 2011;305(19):2011-2012.
8. Jost TS. The Independent Payment Advisory Board. N Engl J Med. 2010;363(2):103-105.
9. US Department of Health and Human Services, Centers for Medicare & Medicaid Services. Estimated financial effects of the “Patient Protection and Affordable Care Act,” as amended. 2010. http://www.cms.gov/Research-Statistics-Data-and-Systems/Research/ActuarialStudies/downloads/PPACA_2010-04-22.pdf. Accessed March 25, 2015.
10. Hayden SA, Hayden D, White LW. The U.S. public’s perceived value of the surgeon’s fee for total knee replacement. Abstract presented at: 75th Annual Meeting of the American Academy of Orthopaedic Surgeons; March 5-9, 2008; San Francisco, CA. Abstract 214.
11. Centers for Medicare & Medicaid Services. Physician Fee Schedule Search Tool. http://www.cms.gov/apps/physician-fee-schedule/search/search-criteria.aspx. Accessed March 25, 2015.
12. Rana AJ, Iorio R, Healy WL. Hospital economics of primary THA decreasing reimbursement and increasing cost, 1990 to 2008. Clin Orthop. 2011;469(2):355-361.
13. Lavernia CJ, Hernandez VH, Rossi MD. Payment analysis of total hip replacement. Curr Opin Orthop. 2007;18(1):23-27.
14. Robinson JC, Pozen A, Tseng S, Bozic KJ. Variability in costs associated with total hip and knee replacement implants. J Bone Joint Surg Am. 2012;94(18):1693-1698.
15. Smolders JM, Van Loon CJ, Rijnberg WJ, Van Susante JL. Patients poorly estimate the overall costs of a total knee arthroplasty and strongly overestimate the surgeon’s fee. Acta Orthop Belg. 2007;73(3):339-344.
Polydactyly of the Hand
Polydactyly is the presence of extra digits. Its incidence is likely underestimated because many practitioners treat simple “nubbins” without referring them to orthopedic specialists.1-3 Polydactyly can be detected by ultrasound as early as 14 weeks’ gestational age, with partial autoamputation seen in most isolated polydactylies.4 The thumb, responsible for 40% of hand function, must be able to oppose the other digits with a stable pinch.5 Polydactyly encumbers this motion when the duplicated digits deviate from normal alignment. Ezaki6 noted that the anatomy is better described as “split” than “duplicated.” There are many dichotomous ways to classify polydactyly: preaxial (radial) versus postaxial (ulnar), thumb versus triphalangeal, simple versus complex (Figure 1). Mixed polydactyly is defined as the presence of preaxial and postaxial polydactyly.7 Surgical management seeks to allow normal hand function and to restore cosmesis.
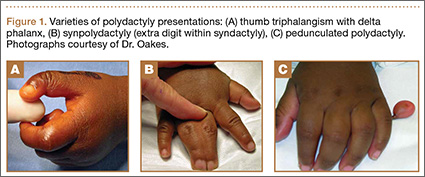
Epidemiology
Sun and colleagues8 reported the overall polydactyly incidence as 2 per 1000 live births in China from 1998 to 2009, with a slight male predominance; polydactyly was also 3 times more common than syndactyly in this population. Ivy,9 in a 5-year audit of Pennsylvania Department of Health records, found polydactyly to be the fourth most common congenital anomaly after clubfoot, cleft lip/palate, and spina bifida. Thumb duplication occurs in 0.08 to 1.4 per 1000 live births and is more common in American Indians and Asians than in other races.5,10 It occurs in a male-to-female ratio of 2.5 to 1 and is most often unilateral.5 Postaxial polydactyly is predominant in black infants; it is most often inherited in an autosomal dominant fashion, if isolated, or in an autosomal recessive pattern, if syndromic.1 A prospective San Diego study of 11,161 newborns found postaxial type B polydactyly in 1 per 531 live births (1 per 143 black infants, 1 per 1339 white infants); 76% of cases were bilateral, and 86% had a positive family history.3 In patients of non-African descent, it is associated with anomalies in other organs. Central duplication is rare and often autosomal dominant.5,10
Genetics and Development
As early as 1896, the heritability of polydactyly was noted.11 As of 2010, polydactyly has been associated with 310 diseases.12 Ninety-nine genes, most involved in regulation of anterior-posterior formation of the limb bud, have been implicated.12,13
The upper limb begins to form at day 26 in utero.14 Apoptosis in the interdigital necrotic zones results in the formation of individual digits. It is presumed that, in polydactyly, the involved tissue is hypoplastic because of an abnormal interaction between mesoderm and ectoderm.5 Presence of an apical ectodermal ridge determines the formation of a limb bud, and on it the zone of polarizing activity (ZPA) dictates preaxial and postaxial alignment.14,15 The ZPA is located on the posterior zone of the developing limb bud. The levels of GLI3, a zinc finger-containing DNA-binding protein, are highest in the anterior area, and HAND2, a basic helix-loop-helix DNA-binding protein, is found in the ZPA. This polarity promotes sonic hedgehog (Shh) gene expression in the posterior region, which in turn prevents GLI3 cleavage into its repressed form. GLI3R (repressed) and GLI3A (active) concentrations are highest, therefore, in the anterior and posterior portions of the bud, respectively. The GLI3A:GLI3R ratio is responsible for the identity and number of digits in the hand (ie, the thumb develops in regions of high GLI3R). GLI and Shh mutations lead to polydactylous hands with absent thumbs (Figure 2).16

Ciliopathies have also been shown to cause postaxial polydactyly, possibly because of the role that nonmotile cilia play in hedgehog signaling.17 Mutations in Shh genomic regulators cause preaxial polydactyly.18 HoxD activates Shh in the ZPA; HoxD13 mutations are associated with synpolydactyly.16,19 In each of these mutations, Shh production is altered, and some form of polydactyly results.
Associations
Many syndromes have been associated with polydactyly. Not all polydactyly is associated with other disorders, but the more complex the polydactyly, the more likely that other anomalies are present. Every patient who presents with polydactyly should have a full history taken and a physical examination performed (Figure 3). Any patient with syndromic findings or atypical presentations (eg, triphalangism, postaxial polydactyly in a patient of non-African descent, central and index polydactyly) should be referred to a geneticist.
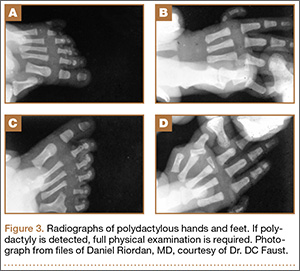
Classifications
The Wassel20 classification describes the anatomical presentation of thumb duplication on the basis of 70 cases in Iowa (Figures 4, 5; Table 1). Because some duplications fall outside the Wassel classification, many researchers have proposed modifications (Figure 6).21-25
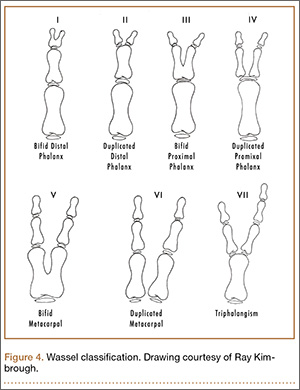
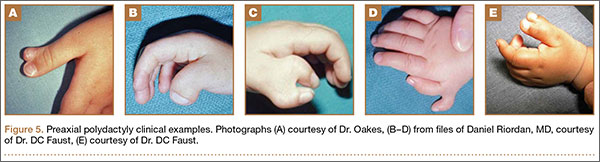

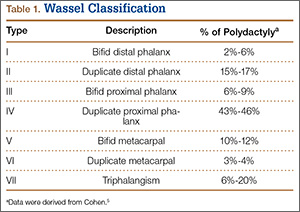
The Temtamy and McKusick10 classification, which is the product of geneticists, classifies duplications by grouping genetically related presentations (Table 2). It provides the most commonly used postaxial classification, with type A being a fully developed digit and type B a rudimentary and pedunculated digit, informally referred to as a nubbin. Type B is more common than type A. Given inheritance patterns, it is assumed that type A is likely multifactorial and type B autosomal dominant.10 Thumb polydactyly inheritance is still unclear. The other types of preaxial polydactyly and high degrees of polydactyly are rare but seem to be passed on in an autosomal dominant fashion on pedigree analysis.10
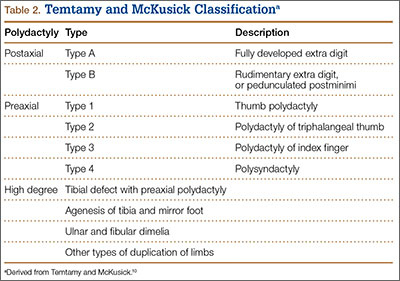
The Stelling and Turek classification presents the duplication from a tissue perspective: Type I duplication is a rudimentary mass devoid of other tissue elements; type II is a subtotal duplication with some normal structures; and type III is a duplication of the entire “osteoarticular column,” including the metacarpal.1 It is interesting to note that histology of type I duplications shows neuroma-like tissue.26-28 Again, normal is a relative term because, in polydactyly, the duplications are hypoplastic and deviated, with anomalous anatomy.
The Rayan classification describes ulnar polydactyly and was derived from a case study series of 148 patients in Oklahoma (Table 3).29
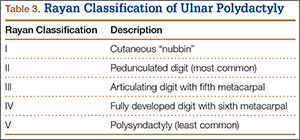
There are also some complex polydactylies that are not easily classified: ulnar dimelia, cleft hand, pentadactyly, and hyperphalangism. Ulnar dimelia, also known as “mirror hand,” is typically 7 digits with no thumb, but other variations are seen. The radius is often absent, and the elbow is abnormal. There is some debate about whether it is a fusion of 2 hands. Pentadactyly, or the 5-fingered hand, appears as 5 triphalangeal digits with no thumb (Figure 7).
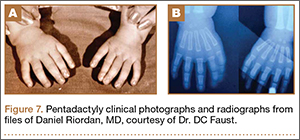
Isolated thumb triphalangism might appear similar to pentadactyly. Miura30,31 pointed out that the radial digit in the pentadactylous hand may be opposable (thumb-like) or nonopposable; in his studies, the patients with the opposable thumb had a metacarpal with a proximal epiphysis (Figure 8). Consequently, the triphalangeal thumb metacarpal with a distal epiphysis is true pentadactyly, whereas that with a proximal epiphysis is hyperphalangism (Figure 9). Treatment of these complex polydactylies involves the same underlying principles as for preaxial and postaxial polydactyly, albeit with additional proximal upper extremity considerations.
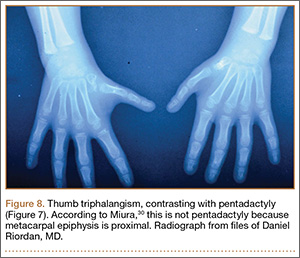
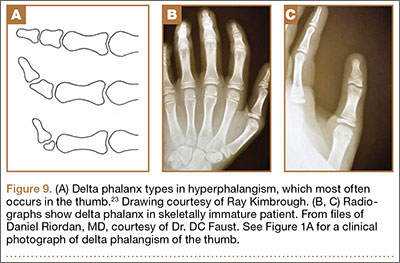
When to Operate (Timing)
Ezaki6 recommended surgical intervention at age 6 to 9 months, before fine motor skills have developed with the abnormal anatomy. Cortical learning occurs as the child begins prehensile activities before 6 months, but the risks of anesthesia outweigh functional benefits until the child is older. Waiting until 1 year of age is not uncommon, though surgery at an earlier age may be beneficial if the polydactyly affects hand function.32 It is not uncommon to wait with the more balanced thumb polydactylies to assess thumb function. Hypoplasia might also delay surgical intervention until there is enough tissue inventory for reconstruction. Wassel20 noted that surgical intervention ideally occurs before the supernumerary elements displace the normal elements, as tends to happen with growth. Suture ligation is an option in the neonatal unit for some pedunculated digits.33 Studies have shown satisfactory results in adults treated for polydactyly, if the patient presents later than expected.34
Surgical Considerations
Knavel recommended simple excision, stating that “ablation requires no ingenuity and creates no problems.”5 This belief, though true for some duplications, will not lead to the best outcome for more complex polydactylies. The goal of surgery is a stable and well-aligned thumb for pinch and prehensile activity, as well as a cosmetically pleasing hand. Incisions should not be made linearly along the axis of the digit, as the scar will cause deviation with growth.24
Wassel type I polydactyly might appear incidentally as a broad thumb, in which case it requires no intervention (Figure 10). However, in Wassel types I and II polydactyly with deformity, the Bilhaut-Cloquet procedure is useful for both bifid and duplicated phalanges (Figure 11).5,6,30,32,35 Collateral ligaments may need to be released in type II because of difficulty in opposing the tissue. Cosmetic results with Bilhaut-Cloquet are unpredictable. The original technique required symmetrically sized digits; results today have been improved with microtechniques and preservation of an entire nail.36 Another option is ablation of the more hypoplastic osseous element and soft-tissue augmentation of the residual digit. The theme of ablation and augmentation is seen throughout the literature for the surgical treatment of polydactyly (Figure 12).1
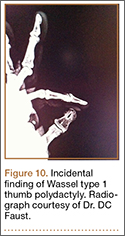
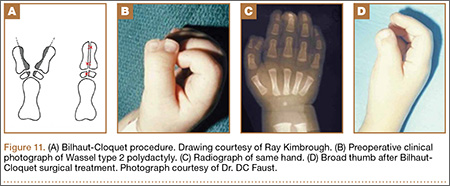
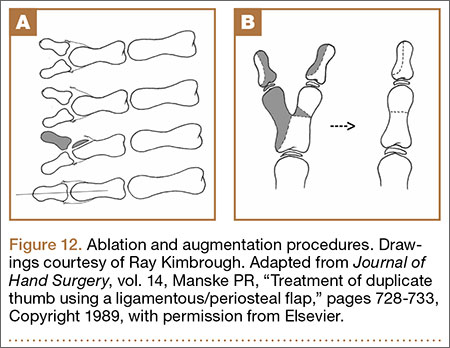
For type III polydactyly, the bifid proximal phalanx is narrowed by resection and realigned with osteotomy of the remaining diaphysis. Type IV polydactyly, the most common thumb duplication, often requires advancement of the abductor pollicis brevis to the base of the proximal phalanx to aid in metacarpophalangeal (MCP) stabilization, abduction, and opposition. The metacarpal head, if broad and with 2 facets, can be shaped to form a single articulating surface. The metacarpal, occasionally with the proximal phalanx, often requires realignment by closing wedge osteotomy. Last, tendons on the resected bony elements should be rebalanced on the remaining digit, and anomalous slips must be released. For instance, given a radial insertion of the long flexor tendon on the distal phalanx, the tendon should be moved centrally. A strong flexor or extensor tendon on the amputated digit should be transferred to the remaining digit.24
Types V and VI are treated similarly to type IV, with the addition of a first web space Z-plasty or web widening if there is thenar eminence contracture. Acral transposition has also been described, with transposition of the tip of the ablated digit in place of the tip of the kept digit; this technique is ideal if one digit has a more normal proximal part while the other has a more normal distal part (Figure 13).35
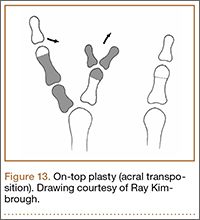
Type VII thumb polydactyly, the type most likely inherited and associated with other disorders, should be treated like type VI. The nail should be preserved; amputation of the distal phalanx is not advised. Resection of the delta phalanx or 1 interphalangeal (IP) joint is an option. Articular surfaces will remodel if done before the age of 1 year. If the thenar eminence is hypoplastic, then Huber transfer of the abductor digiti minimi should be considered.37 Resection of the triphalangeal thumb is also advised, even if the biphalangeal thumb is more hypoplastic, with transfer of the ligaments and tendons, as described earlier.5,6,24,30,32,35
Thumb triphalangism, if isolated, and hyperphalangism in the other digits, can be treated with resection of the delta phalanx or one of the IP joints if it is affecting function or cosmesis.1,6 Wood and Flatt23 recommended early resection of a thumb delta phalanx because of the likelihood of deviation that impedes thumb function. For children, they recommended delta phalanx resection and Kirschner wire fixation for 6 weeks; for adults, they recommended resection or fusion of the joint, with osteotomy as needed for deviation.23,24 For thumb triphalangism, multiple surgeries are the norm, as Wood24 reported in his study of 21 patients who underwent 78 operations in total.
Index polydactyly may present as a simple pedunculated skin tag, which can be simply excised, or as a more complex musculoskeletal duplication. More complex presentations can be treated with procedures similar to those used for the thumb. Typically, the additional digit is radially deviated and angulated, eventually leading to impingement of thumb pinch and the first web space. Ray amputation is also an option if no reconstructive surgery will produce the stable, sensate radial pinch that is essential to hand function.32
Ring-finger polydactyly and long-finger polydactyly are often complicated by some element of syndactyly, resulting in a relative paucity of skin (Figure 14). There is failure of both formation (hypoplasia) and differentiation (syndactyly). The hypoplasia particularly affects the function of these digits by tethering them; multiple surgeries to restore proper hand function are the norm.1 Reconstructive surgery for these digits requires preoperative tissue inventory followed by resection and augmentation; as in syndactyly, skin for coverage is at a premium. Creation of a 3-fingered hand is an option.23
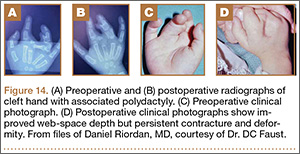
Temtamy and McKusick10 type A little-finger polydactyly is treated similarly to the thumb, with the caveat that hypothenar and intrinsic muscles that insert on the resected little finger are transferred to the remaining digit. In contrast to thumb polydactyly, the extrinsic musculature tends to be in good position. Suture ligation of type B polydactyly, as described by Flatt, is likely more common than orthopedists appreciate, as pediatricians and neonatal unit practitioners commonly perform this procedure in the nursery.1-3 It has been described with 2-0 Vicryl3 (Ethicon, Somerville, New Jersey) and 4-0 silk sutures,32 with the goal of necrosis and autoamputation. Parents should be told the finger generally falls off about 10 days (range, 4-21 days) after ligation.3 Multiple authors have cited a report of exsanguination from suture ligation, but we could not locate the primary source. It is advisable to wait until a patient is 6 months of age if planning to resect the nubbin in the operating room, given the anesthesia risk and the lack of functional impairment. Katz and Linder33 indicated they remove type B polydactyly in the nursery suite used for circumcisions; they use anesthetizing cream on the skin, and sharp excision with a scalpel, followed by direct pressure and Steri-Strip (3M, St. Paul, Minnesota) application. Suture ligation is recommended only if there is a narrow, thin (<2 mm) soft-tissue stalk; any broad or bony stalk necessitates surgical removal to avoid neuroma formation and failure of autonecrosis (Figure 15).27 Other options are a single swipe of a scalpel and elliptical excision; sharp transaction of the digital nerve with subsequent retraction is advised to avoid neuroma formation.2
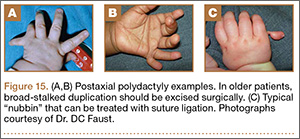
Barton described ulnar dimelia operations as “spare parts surgery.”1 Extra digits are ablated and a thumb created (Figure 16). The hand might have a digit in relatively good rotational position for thumbplasty, or the principles of pollicization may need to be used. If the patient is already using the hand, the surgeon should note which finger the patient uses as a thumb.24 Any accompanying wrist flexion contracture must be corrected with careful attention to musculotendinous balancing. Because the forearm and elbow, and occasionally even the more proximal limb, will be abnormal in this disorder, multiple surgeries are again the norm.1
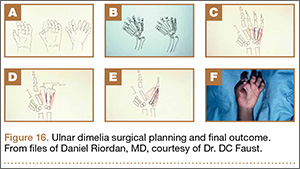
Pentadactyly is treated like thumb hypoplasia, with first web space creation.1
Complications
In polydactyly, a reoperation rate of up to 25% has been reported, with most reoperations performed because of residual or subsequent deformity.5,30,31,38 Risk factors for reoperation are type IV thumb duplication, preoperative “zigzag” deformity, and radially deviated thumb elements at presentation.5 The delta phalanx may not show on radiographs until the patient is 18 months old, but functional deformity will worsen as long as it is present. Zigzag deformity may be due to the delta phalanx or to musculotendinous imbalance, such as a radially inserted flexor pollicis longus (FPL) or lack of stable MCP abduction. Miura31 found that careful reconstruction of the joint capsule and thenar muscles from the ablated digit to the remnant digit is the key to a successful initial surgery. Lee and colleagues39 defined zigzag deformity as more than 20° MCP and IP angulation; for cases present before surgery, they recommended FPL relocation by the pullout technique in addition to osteotomies to prevent further interphalangeal deviation (Figures 17, 18).
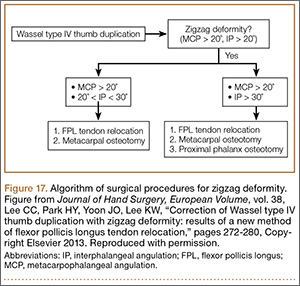
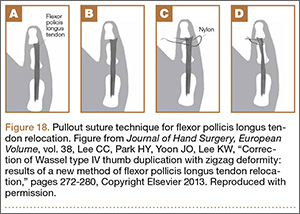
Abnormal physeal growth, joint instability, and stiffness can all occur. Stiffness is particularly difficult to treat but seldom presents a functional problem. Joint enlargement, which is not uncommon, results from either broad articular surfaces or retained cartilage from the perichondral ring after resection that later ossifies.5,38 Nubbin-type duplications may not fall off after suture ligation, necessitating further excision, and a cosmetic bump is seen after 40% of suture ligations.3 Patillo and Rayan28 and Rayan and Frey29 warned against suture ligation unless the nubbin has a small stalk because of the possibility of infection and gangrene. The excised nubbin tissue is histologically nervous, and there have been reports of painful neuromas in the remaining scar of a ligated nubbin that respond well to excision.26,27,40 It is thought that these painful lesions form because the ligature prevents the digital nerves to the vestigial digit from retracting.27 Nail deformity and IP joint stiffness are seen with the Bilhaut-Cloquet procedure, though often finger function remains satisfactory.
Conclusion
Polydactyly is a common congenital hand abnormality. Its true incidence is unknown because of inconsistent documentation. Surgeons must strive for a functional, cosmetic hand, given a diverse set of possible anomalies. Hypoplasia is the rule; tissue should be ablated and augmented as necessary. Musculotendinous insertions may need to be centralized. Patients’ family members should always be counseled that more surgery may be needed in the future, as further deformity can occur with growth. Surgically corrected thumb duplications will be stiffer, shorter, and thinner than their normal counterparts. Nail ridges are common. However, it should be noted that 88% of these patients are satisfied with their results.41 Some amount of contracture and abnormal function should be expected with index-, long-, and ring-finger duplications. The only remnant of type B postaxial duplications may be a slight discoloration or bump, though stiffness and deformity can happen with a type A deformity. A “duplicated” digit that requires surgical correction will never be completely normal, but acceptable function is routinely achievable.
1. Graham TJ, Ress AM. Finger polydactyly. Hand Clin. 1998;14(1):49-64.
2. Abzug JM, Kozin SH. Treatment of postaxial polydactyly type B. J Hand Surg Am. 2013;38(6):1223-1225.
3. Watson BT, Hennrikus WL. Postaxial type-B polydactyly—prevalence and treatment. J Bone Joint Surg Am. 1997;79(1):65-68.
4. Zimmer EZ, Bronshtein M. Fetal polydactyly diagnosis during early pregnancy: clinical applications. Am J Obstet Gynecol. 2000;183(3):755-758.
5. Cohen MS. Thumb duplication. Hand Clin. 1998;14(1):17-27.
6. Ezaki M. Radial polydactyly. Hand Clin. 1990;6(4):577-588.
7. Nathan PA, Keniston RC. Crossed polydactyly: case report and review of the literature. J Bone Joint Surg Am. 1975;57(6):847-849.
8. Sun G, Xu ZM, Liang JF, Li L, Tang DX. Twelve-year prevalence of common neonatal congenital malformations in Zhejiang Province, China. World J Pediatr. 2011;7(4):331-336.
9. Ivy RH. Congenital anomalies as recorded on birth certificates in the Division of Vital Statistics of the Pennsylvania Department of Health, for the period of 1951–1955, inclusive. Plast Reconstr Surg. 1957;20(5):400-411.
10. Temtamy SA, McKusick VA. Polydactyly as a part of syndromes. In: Bergsma D, ed. Mudge JR, Paul NW, Conde Greene S, associate eds. The Genetics of Hand Malformations. New York, NY: Liss. Birth Defects Original Article Series. 1978;14(3):364-439.
11. Gould W, Pyle L. Anomalies and Curiosities of Medicine. New York, NY: Bell; 1896.
12. Biesecker LG. Polydactyly: how many disorders and how many genes: 2010 update. Dev Dyn. 2011;250(5):931-942.
13. Grzeschik K. Human limb malformations; an approach to the molecular basis of development. Int J Dev Biol. 2001;46(7):983-991.
14. Zaleske DJ. Development of the upper limb. Hand Clin. 1985;1(3):383-390.
15. Beatty E. Upper limb tissue differentiation in the human embryo. Hand Clin. 1985;1(3):391-404.
16. Anderson E, Peluso S, Lettice LA, Hill RE. Human limb abnormalities caused by disruption of hedgehog signaling. Trends Genet. 2012;28(8):364-373.
17. Ware SM, Aygun MG, Heldebrandt F. Spectrum of clinical diseases caused by disorders of primary cilia. Proc Am Thorac Soc. 2011;8(5):444-450.
18. Lettice LA, Hill RE. Preaxial polydactyly: a model for defective long-range regulation in congenital abnormalities. Curr Opin Genet Dev. 2005;15(3):294-300.
19. Al-Qattan MA. Type II familial synpolydactyly: report on two families with an emphasis on variations of expression. Eur J Hum Genet. 2011;19(1):112-114.
20. Wassel HD. The results of surgery for polydactyly of the thumb. Clin Orthop. 1969;(64):175-193.
21. Blauth W, Olason AT. Classification of polydactyly of the hands and feet. Arch Orthop Trauma Surg. 1988;107(6):334-344.
22. Wood VE. Super digit. Hand Clin. 1990;6(4):673-684.
23. Wood VE, Flatt AE. Congenital triangular bones in the hand. J Hand Surg Am. 1977;2(3):179-193.
24. Wood VE. Polydactyly and the triphalangeal thumb. J Hand Surg Am. 1978;3(5):436-444.
25. Zuidam JM, Selles RW, Ananta M, Runia J, Hovius SER. A classification system of radial polydactyly: inclusion of triphalangeal thumb and triplication. J Hand Surg Am. 2008;33(3):373-377.
26. Leber GE, Gosain AK. Surgical excision of pedunculated supernumerary digits prevents traumatic amputation neuromas. Pediatr Dermatol. 2003;20(2):108-112.
27. Mullick S, Borschel GH. A selective approach to treatment of ulnar polydactyly: preventing painful neuroma and incomplete excision. Pediatr Dermatol. 2001;27(1):39-42.
28. Patillo D, Rayan GM. Complications of suture ligation ablation for ulnar polydactyly: a report of two cases. Hand (N Y). 2011;6(1):102-105.
29. Rayan GM, Frey B. Ulnar polydactyly. Plastic Reconstr Surg. 2001;107(6):1449-1454.
30. Miura T. Triphalangeal thumb. Plastic Reconstr Surg. 1976;58(5):587-594.
31. Miura T. Duplicated thumb. Plastic Reconstr Surg. 1982;69(3):470-481.
32. Simmons BP. Polydactyly. Hand Clin. 1985;1(3):545-566.
33. Katz K, Linder N. Postaxial type B polydactyly treated by excision in the neonatal nursery. J Pediatr Orthop. 2011;31(4):448-449.
34. Manohar A, Beard AJ. Outcome of reconstruction for duplication of the thumb in adults aged over 40. Hand Surg. 2011;16(2):207-210.
35. Watt AJ, Chung KC. Duplication. Hand Clin. 2009;25(2):215-228.
36. Tonkin MA. Thumb duplication: concepts and techniques. Clin Orthop Surg. 2012;4(1):1-17.
37. Huber E. Relief operation in the case of paralysis of the median nerve. J Hand Surg Eur. 2004;29(1):35-37.
38. Mih AD. Complications of duplicate thumb reconstruction. Hand Clin. 1998;14(1):143-149.
39. Lee CC, Park HY, Yoon JO, Lee KW. Correction of Wassel type IV thumb duplication with zigzag deformity: results of a new method of flexor pollicis longus tendon relocation. J Hand Surg Eur. 2013;38(3):272-280.
40. Hare PJ. Rudimentary polydactyly. Br J Dermatol. 1954;66(11):402-408.
41. Yen CH, Chan WL, Leung HB, Mak KH. Thumb polydactyly: clinical outcome after reconstruction. J Orthop Surg (Hong Kong). 2006;14(3):295-302.
42. Edmunds JO. A tribute to Daniel C. Riordan, MD (1917–2012). Tulane University School of Medicine, Department of Orthopaedics website. http://tulane.edu/som/departments/orthopaedics/news-and-events/danriordantribute.cfm. Accessed March 31, 2015.
43. Faust DC, Herms R. Daniel C. Riordan, MD, 1917–2012. J Hand Surg Am. 2013;38(1):202-205.
Polydactyly is the presence of extra digits. Its incidence is likely underestimated because many practitioners treat simple “nubbins” without referring them to orthopedic specialists.1-3 Polydactyly can be detected by ultrasound as early as 14 weeks’ gestational age, with partial autoamputation seen in most isolated polydactylies.4 The thumb, responsible for 40% of hand function, must be able to oppose the other digits with a stable pinch.5 Polydactyly encumbers this motion when the duplicated digits deviate from normal alignment. Ezaki6 noted that the anatomy is better described as “split” than “duplicated.” There are many dichotomous ways to classify polydactyly: preaxial (radial) versus postaxial (ulnar), thumb versus triphalangeal, simple versus complex (Figure 1). Mixed polydactyly is defined as the presence of preaxial and postaxial polydactyly.7 Surgical management seeks to allow normal hand function and to restore cosmesis.
Epidemiology
Sun and colleagues8 reported the overall polydactyly incidence as 2 per 1000 live births in China from 1998 to 2009, with a slight male predominance; polydactyly was also 3 times more common than syndactyly in this population. Ivy,9 in a 5-year audit of Pennsylvania Department of Health records, found polydactyly to be the fourth most common congenital anomaly after clubfoot, cleft lip/palate, and spina bifida. Thumb duplication occurs in 0.08 to 1.4 per 1000 live births and is more common in American Indians and Asians than in other races.5,10 It occurs in a male-to-female ratio of 2.5 to 1 and is most often unilateral.5 Postaxial polydactyly is predominant in black infants; it is most often inherited in an autosomal dominant fashion, if isolated, or in an autosomal recessive pattern, if syndromic.1 A prospective San Diego study of 11,161 newborns found postaxial type B polydactyly in 1 per 531 live births (1 per 143 black infants, 1 per 1339 white infants); 76% of cases were bilateral, and 86% had a positive family history.3 In patients of non-African descent, it is associated with anomalies in other organs. Central duplication is rare and often autosomal dominant.5,10
Genetics and Development
As early as 1896, the heritability of polydactyly was noted.11 As of 2010, polydactyly has been associated with 310 diseases.12 Ninety-nine genes, most involved in regulation of anterior-posterior formation of the limb bud, have been implicated.12,13
The upper limb begins to form at day 26 in utero.14 Apoptosis in the interdigital necrotic zones results in the formation of individual digits. It is presumed that, in polydactyly, the involved tissue is hypoplastic because of an abnormal interaction between mesoderm and ectoderm.5 Presence of an apical ectodermal ridge determines the formation of a limb bud, and on it the zone of polarizing activity (ZPA) dictates preaxial and postaxial alignment.14,15 The ZPA is located on the posterior zone of the developing limb bud. The levels of GLI3, a zinc finger-containing DNA-binding protein, are highest in the anterior area, and HAND2, a basic helix-loop-helix DNA-binding protein, is found in the ZPA. This polarity promotes sonic hedgehog (Shh) gene expression in the posterior region, which in turn prevents GLI3 cleavage into its repressed form. GLI3R (repressed) and GLI3A (active) concentrations are highest, therefore, in the anterior and posterior portions of the bud, respectively. The GLI3A:GLI3R ratio is responsible for the identity and number of digits in the hand (ie, the thumb develops in regions of high GLI3R). GLI and Shh mutations lead to polydactylous hands with absent thumbs (Figure 2).16
Ciliopathies have also been shown to cause postaxial polydactyly, possibly because of the role that nonmotile cilia play in hedgehog signaling.17 Mutations in Shh genomic regulators cause preaxial polydactyly.18 HoxD activates Shh in the ZPA; HoxD13 mutations are associated with synpolydactyly.16,19 In each of these mutations, Shh production is altered, and some form of polydactyly results.
Associations
Many syndromes have been associated with polydactyly. Not all polydactyly is associated with other disorders, but the more complex the polydactyly, the more likely that other anomalies are present. Every patient who presents with polydactyly should have a full history taken and a physical examination performed (Figure 3). Any patient with syndromic findings or atypical presentations (eg, triphalangism, postaxial polydactyly in a patient of non-African descent, central and index polydactyly) should be referred to a geneticist.
Classifications
The Wassel20 classification describes the anatomical presentation of thumb duplication on the basis of 70 cases in Iowa (Figures 4, 5; Table 1). Because some duplications fall outside the Wassel classification, many researchers have proposed modifications (Figure 6).21-25
The Temtamy and McKusick10 classification, which is the product of geneticists, classifies duplications by grouping genetically related presentations (Table 2). It provides the most commonly used postaxial classification, with type A being a fully developed digit and type B a rudimentary and pedunculated digit, informally referred to as a nubbin. Type B is more common than type A. Given inheritance patterns, it is assumed that type A is likely multifactorial and type B autosomal dominant.10 Thumb polydactyly inheritance is still unclear. The other types of preaxial polydactyly and high degrees of polydactyly are rare but seem to be passed on in an autosomal dominant fashion on pedigree analysis.10
The Stelling and Turek classification presents the duplication from a tissue perspective: Type I duplication is a rudimentary mass devoid of other tissue elements; type II is a subtotal duplication with some normal structures; and type III is a duplication of the entire “osteoarticular column,” including the metacarpal.1 It is interesting to note that histology of type I duplications shows neuroma-like tissue.26-28 Again, normal is a relative term because, in polydactyly, the duplications are hypoplastic and deviated, with anomalous anatomy.
The Rayan classification describes ulnar polydactyly and was derived from a case study series of 148 patients in Oklahoma (Table 3).29
There are also some complex polydactylies that are not easily classified: ulnar dimelia, cleft hand, pentadactyly, and hyperphalangism. Ulnar dimelia, also known as “mirror hand,” is typically 7 digits with no thumb, but other variations are seen. The radius is often absent, and the elbow is abnormal. There is some debate about whether it is a fusion of 2 hands. Pentadactyly, or the 5-fingered hand, appears as 5 triphalangeal digits with no thumb (Figure 7).
Isolated thumb triphalangism might appear similar to pentadactyly. Miura30,31 pointed out that the radial digit in the pentadactylous hand may be opposable (thumb-like) or nonopposable; in his studies, the patients with the opposable thumb had a metacarpal with a proximal epiphysis (Figure 8). Consequently, the triphalangeal thumb metacarpal with a distal epiphysis is true pentadactyly, whereas that with a proximal epiphysis is hyperphalangism (Figure 9). Treatment of these complex polydactylies involves the same underlying principles as for preaxial and postaxial polydactyly, albeit with additional proximal upper extremity considerations.
When to Operate (Timing)
Ezaki6 recommended surgical intervention at age 6 to 9 months, before fine motor skills have developed with the abnormal anatomy. Cortical learning occurs as the child begins prehensile activities before 6 months, but the risks of anesthesia outweigh functional benefits until the child is older. Waiting until 1 year of age is not uncommon, though surgery at an earlier age may be beneficial if the polydactyly affects hand function.32 It is not uncommon to wait with the more balanced thumb polydactylies to assess thumb function. Hypoplasia might also delay surgical intervention until there is enough tissue inventory for reconstruction. Wassel20 noted that surgical intervention ideally occurs before the supernumerary elements displace the normal elements, as tends to happen with growth. Suture ligation is an option in the neonatal unit for some pedunculated digits.33 Studies have shown satisfactory results in adults treated for polydactyly, if the patient presents later than expected.34
Surgical Considerations
Knavel recommended simple excision, stating that “ablation requires no ingenuity and creates no problems.”5 This belief, though true for some duplications, will not lead to the best outcome for more complex polydactylies. The goal of surgery is a stable and well-aligned thumb for pinch and prehensile activity, as well as a cosmetically pleasing hand. Incisions should not be made linearly along the axis of the digit, as the scar will cause deviation with growth.24
Wassel type I polydactyly might appear incidentally as a broad thumb, in which case it requires no intervention (Figure 10). However, in Wassel types I and II polydactyly with deformity, the Bilhaut-Cloquet procedure is useful for both bifid and duplicated phalanges (Figure 11).5,6,30,32,35 Collateral ligaments may need to be released in type II because of difficulty in opposing the tissue. Cosmetic results with Bilhaut-Cloquet are unpredictable. The original technique required symmetrically sized digits; results today have been improved with microtechniques and preservation of an entire nail.36 Another option is ablation of the more hypoplastic osseous element and soft-tissue augmentation of the residual digit. The theme of ablation and augmentation is seen throughout the literature for the surgical treatment of polydactyly (Figure 12).1
For type III polydactyly, the bifid proximal phalanx is narrowed by resection and realigned with osteotomy of the remaining diaphysis. Type IV polydactyly, the most common thumb duplication, often requires advancement of the abductor pollicis brevis to the base of the proximal phalanx to aid in metacarpophalangeal (MCP) stabilization, abduction, and opposition. The metacarpal head, if broad and with 2 facets, can be shaped to form a single articulating surface. The metacarpal, occasionally with the proximal phalanx, often requires realignment by closing wedge osteotomy. Last, tendons on the resected bony elements should be rebalanced on the remaining digit, and anomalous slips must be released. For instance, given a radial insertion of the long flexor tendon on the distal phalanx, the tendon should be moved centrally. A strong flexor or extensor tendon on the amputated digit should be transferred to the remaining digit.24
Types V and VI are treated similarly to type IV, with the addition of a first web space Z-plasty or web widening if there is thenar eminence contracture. Acral transposition has also been described, with transposition of the tip of the ablated digit in place of the tip of the kept digit; this technique is ideal if one digit has a more normal proximal part while the other has a more normal distal part (Figure 13).35
Type VII thumb polydactyly, the type most likely inherited and associated with other disorders, should be treated like type VI. The nail should be preserved; amputation of the distal phalanx is not advised. Resection of the delta phalanx or 1 interphalangeal (IP) joint is an option. Articular surfaces will remodel if done before the age of 1 year. If the thenar eminence is hypoplastic, then Huber transfer of the abductor digiti minimi should be considered.37 Resection of the triphalangeal thumb is also advised, even if the biphalangeal thumb is more hypoplastic, with transfer of the ligaments and tendons, as described earlier.5,6,24,30,32,35
Thumb triphalangism, if isolated, and hyperphalangism in the other digits, can be treated with resection of the delta phalanx or one of the IP joints if it is affecting function or cosmesis.1,6 Wood and Flatt23 recommended early resection of a thumb delta phalanx because of the likelihood of deviation that impedes thumb function. For children, they recommended delta phalanx resection and Kirschner wire fixation for 6 weeks; for adults, they recommended resection or fusion of the joint, with osteotomy as needed for deviation.23,24 For thumb triphalangism, multiple surgeries are the norm, as Wood24 reported in his study of 21 patients who underwent 78 operations in total.
Index polydactyly may present as a simple pedunculated skin tag, which can be simply excised, or as a more complex musculoskeletal duplication. More complex presentations can be treated with procedures similar to those used for the thumb. Typically, the additional digit is radially deviated and angulated, eventually leading to impingement of thumb pinch and the first web space. Ray amputation is also an option if no reconstructive surgery will produce the stable, sensate radial pinch that is essential to hand function.32
Ring-finger polydactyly and long-finger polydactyly are often complicated by some element of syndactyly, resulting in a relative paucity of skin (Figure 14). There is failure of both formation (hypoplasia) and differentiation (syndactyly). The hypoplasia particularly affects the function of these digits by tethering them; multiple surgeries to restore proper hand function are the norm.1 Reconstructive surgery for these digits requires preoperative tissue inventory followed by resection and augmentation; as in syndactyly, skin for coverage is at a premium. Creation of a 3-fingered hand is an option.23
Temtamy and McKusick10 type A little-finger polydactyly is treated similarly to the thumb, with the caveat that hypothenar and intrinsic muscles that insert on the resected little finger are transferred to the remaining digit. In contrast to thumb polydactyly, the extrinsic musculature tends to be in good position. Suture ligation of type B polydactyly, as described by Flatt, is likely more common than orthopedists appreciate, as pediatricians and neonatal unit practitioners commonly perform this procedure in the nursery.1-3 It has been described with 2-0 Vicryl3 (Ethicon, Somerville, New Jersey) and 4-0 silk sutures,32 with the goal of necrosis and autoamputation. Parents should be told the finger generally falls off about 10 days (range, 4-21 days) after ligation.3 Multiple authors have cited a report of exsanguination from suture ligation, but we could not locate the primary source. It is advisable to wait until a patient is 6 months of age if planning to resect the nubbin in the operating room, given the anesthesia risk and the lack of functional impairment. Katz and Linder33 indicated they remove type B polydactyly in the nursery suite used for circumcisions; they use anesthetizing cream on the skin, and sharp excision with a scalpel, followed by direct pressure and Steri-Strip (3M, St. Paul, Minnesota) application. Suture ligation is recommended only if there is a narrow, thin (<2 mm) soft-tissue stalk; any broad or bony stalk necessitates surgical removal to avoid neuroma formation and failure of autonecrosis (Figure 15).27 Other options are a single swipe of a scalpel and elliptical excision; sharp transaction of the digital nerve with subsequent retraction is advised to avoid neuroma formation.2
Barton described ulnar dimelia operations as “spare parts surgery.”1 Extra digits are ablated and a thumb created (Figure 16). The hand might have a digit in relatively good rotational position for thumbplasty, or the principles of pollicization may need to be used. If the patient is already using the hand, the surgeon should note which finger the patient uses as a thumb.24 Any accompanying wrist flexion contracture must be corrected with careful attention to musculotendinous balancing. Because the forearm and elbow, and occasionally even the more proximal limb, will be abnormal in this disorder, multiple surgeries are again the norm.1
Pentadactyly is treated like thumb hypoplasia, with first web space creation.1
Complications
In polydactyly, a reoperation rate of up to 25% has been reported, with most reoperations performed because of residual or subsequent deformity.5,30,31,38 Risk factors for reoperation are type IV thumb duplication, preoperative “zigzag” deformity, and radially deviated thumb elements at presentation.5 The delta phalanx may not show on radiographs until the patient is 18 months old, but functional deformity will worsen as long as it is present. Zigzag deformity may be due to the delta phalanx or to musculotendinous imbalance, such as a radially inserted flexor pollicis longus (FPL) or lack of stable MCP abduction. Miura31 found that careful reconstruction of the joint capsule and thenar muscles from the ablated digit to the remnant digit is the key to a successful initial surgery. Lee and colleagues39 defined zigzag deformity as more than 20° MCP and IP angulation; for cases present before surgery, they recommended FPL relocation by the pullout technique in addition to osteotomies to prevent further interphalangeal deviation (Figures 17, 18).
Abnormal physeal growth, joint instability, and stiffness can all occur. Stiffness is particularly difficult to treat but seldom presents a functional problem. Joint enlargement, which is not uncommon, results from either broad articular surfaces or retained cartilage from the perichondral ring after resection that later ossifies.5,38 Nubbin-type duplications may not fall off after suture ligation, necessitating further excision, and a cosmetic bump is seen after 40% of suture ligations.3 Patillo and Rayan28 and Rayan and Frey29 warned against suture ligation unless the nubbin has a small stalk because of the possibility of infection and gangrene. The excised nubbin tissue is histologically nervous, and there have been reports of painful neuromas in the remaining scar of a ligated nubbin that respond well to excision.26,27,40 It is thought that these painful lesions form because the ligature prevents the digital nerves to the vestigial digit from retracting.27 Nail deformity and IP joint stiffness are seen with the Bilhaut-Cloquet procedure, though often finger function remains satisfactory.
Conclusion
Polydactyly is a common congenital hand abnormality. Its true incidence is unknown because of inconsistent documentation. Surgeons must strive for a functional, cosmetic hand, given a diverse set of possible anomalies. Hypoplasia is the rule; tissue should be ablated and augmented as necessary. Musculotendinous insertions may need to be centralized. Patients’ family members should always be counseled that more surgery may be needed in the future, as further deformity can occur with growth. Surgically corrected thumb duplications will be stiffer, shorter, and thinner than their normal counterparts. Nail ridges are common. However, it should be noted that 88% of these patients are satisfied with their results.41 Some amount of contracture and abnormal function should be expected with index-, long-, and ring-finger duplications. The only remnant of type B postaxial duplications may be a slight discoloration or bump, though stiffness and deformity can happen with a type A deformity. A “duplicated” digit that requires surgical correction will never be completely normal, but acceptable function is routinely achievable.
1. Graham TJ, Ress AM. Finger polydactyly. Hand Clin. 1998;14(1):49-64.
2. Abzug JM, Kozin SH. Treatment of postaxial polydactyly type B. J Hand Surg Am. 2013;38(6):1223-1225.
3. Watson BT, Hennrikus WL. Postaxial type-B polydactyly—prevalence and treatment. J Bone Joint Surg Am. 1997;79(1):65-68.
4. Zimmer EZ, Bronshtein M. Fetal polydactyly diagnosis during early pregnancy: clinical applications. Am J Obstet Gynecol. 2000;183(3):755-758.
5. Cohen MS. Thumb duplication. Hand Clin. 1998;14(1):17-27.
6. Ezaki M. Radial polydactyly. Hand Clin. 1990;6(4):577-588.
7. Nathan PA, Keniston RC. Crossed polydactyly: case report and review of the literature. J Bone Joint Surg Am. 1975;57(6):847-849.
8. Sun G, Xu ZM, Liang JF, Li L, Tang DX. Twelve-year prevalence of common neonatal congenital malformations in Zhejiang Province, China. World J Pediatr. 2011;7(4):331-336.
9. Ivy RH. Congenital anomalies as recorded on birth certificates in the Division of Vital Statistics of the Pennsylvania Department of Health, for the period of 1951–1955, inclusive. Plast Reconstr Surg. 1957;20(5):400-411.
10. Temtamy SA, McKusick VA. Polydactyly as a part of syndromes. In: Bergsma D, ed. Mudge JR, Paul NW, Conde Greene S, associate eds. The Genetics of Hand Malformations. New York, NY: Liss. Birth Defects Original Article Series. 1978;14(3):364-439.
11. Gould W, Pyle L. Anomalies and Curiosities of Medicine. New York, NY: Bell; 1896.
12. Biesecker LG. Polydactyly: how many disorders and how many genes: 2010 update. Dev Dyn. 2011;250(5):931-942.
13. Grzeschik K. Human limb malformations; an approach to the molecular basis of development. Int J Dev Biol. 2001;46(7):983-991.
14. Zaleske DJ. Development of the upper limb. Hand Clin. 1985;1(3):383-390.
15. Beatty E. Upper limb tissue differentiation in the human embryo. Hand Clin. 1985;1(3):391-404.
16. Anderson E, Peluso S, Lettice LA, Hill RE. Human limb abnormalities caused by disruption of hedgehog signaling. Trends Genet. 2012;28(8):364-373.
17. Ware SM, Aygun MG, Heldebrandt F. Spectrum of clinical diseases caused by disorders of primary cilia. Proc Am Thorac Soc. 2011;8(5):444-450.
18. Lettice LA, Hill RE. Preaxial polydactyly: a model for defective long-range regulation in congenital abnormalities. Curr Opin Genet Dev. 2005;15(3):294-300.
19. Al-Qattan MA. Type II familial synpolydactyly: report on two families with an emphasis on variations of expression. Eur J Hum Genet. 2011;19(1):112-114.
20. Wassel HD. The results of surgery for polydactyly of the thumb. Clin Orthop. 1969;(64):175-193.
21. Blauth W, Olason AT. Classification of polydactyly of the hands and feet. Arch Orthop Trauma Surg. 1988;107(6):334-344.
22. Wood VE. Super digit. Hand Clin. 1990;6(4):673-684.
23. Wood VE, Flatt AE. Congenital triangular bones in the hand. J Hand Surg Am. 1977;2(3):179-193.
24. Wood VE. Polydactyly and the triphalangeal thumb. J Hand Surg Am. 1978;3(5):436-444.
25. Zuidam JM, Selles RW, Ananta M, Runia J, Hovius SER. A classification system of radial polydactyly: inclusion of triphalangeal thumb and triplication. J Hand Surg Am. 2008;33(3):373-377.
26. Leber GE, Gosain AK. Surgical excision of pedunculated supernumerary digits prevents traumatic amputation neuromas. Pediatr Dermatol. 2003;20(2):108-112.
27. Mullick S, Borschel GH. A selective approach to treatment of ulnar polydactyly: preventing painful neuroma and incomplete excision. Pediatr Dermatol. 2001;27(1):39-42.
28. Patillo D, Rayan GM. Complications of suture ligation ablation for ulnar polydactyly: a report of two cases. Hand (N Y). 2011;6(1):102-105.
29. Rayan GM, Frey B. Ulnar polydactyly. Plastic Reconstr Surg. 2001;107(6):1449-1454.
30. Miura T. Triphalangeal thumb. Plastic Reconstr Surg. 1976;58(5):587-594.
31. Miura T. Duplicated thumb. Plastic Reconstr Surg. 1982;69(3):470-481.
32. Simmons BP. Polydactyly. Hand Clin. 1985;1(3):545-566.
33. Katz K, Linder N. Postaxial type B polydactyly treated by excision in the neonatal nursery. J Pediatr Orthop. 2011;31(4):448-449.
34. Manohar A, Beard AJ. Outcome of reconstruction for duplication of the thumb in adults aged over 40. Hand Surg. 2011;16(2):207-210.
35. Watt AJ, Chung KC. Duplication. Hand Clin. 2009;25(2):215-228.
36. Tonkin MA. Thumb duplication: concepts and techniques. Clin Orthop Surg. 2012;4(1):1-17.
37. Huber E. Relief operation in the case of paralysis of the median nerve. J Hand Surg Eur. 2004;29(1):35-37.
38. Mih AD. Complications of duplicate thumb reconstruction. Hand Clin. 1998;14(1):143-149.
39. Lee CC, Park HY, Yoon JO, Lee KW. Correction of Wassel type IV thumb duplication with zigzag deformity: results of a new method of flexor pollicis longus tendon relocation. J Hand Surg Eur. 2013;38(3):272-280.
40. Hare PJ. Rudimentary polydactyly. Br J Dermatol. 1954;66(11):402-408.
41. Yen CH, Chan WL, Leung HB, Mak KH. Thumb polydactyly: clinical outcome after reconstruction. J Orthop Surg (Hong Kong). 2006;14(3):295-302.
42. Edmunds JO. A tribute to Daniel C. Riordan, MD (1917–2012). Tulane University School of Medicine, Department of Orthopaedics website. http://tulane.edu/som/departments/orthopaedics/news-and-events/danriordantribute.cfm. Accessed March 31, 2015.
43. Faust DC, Herms R. Daniel C. Riordan, MD, 1917–2012. J Hand Surg Am. 2013;38(1):202-205.