User login
Mouse model reveals insight into CLL relapse

Researchers say they have discovered why patients with chronic lymphocytic leukemia (CLL) often relapse.
Using a mouse model, the team demonstrated that crosstalk between leukemic cells and a group of stromal cells in the spleen is crucial for tumor growth.
The group also found a way to prevent leukemic cell proliferation and stop the cells from entering the spleen, thereby identifying new targets for future therapies in CLL.
Kristina Heinig, of Max Delbrück Center for Molecular Medicine in Berlin, Germany, and her colleagues reported these findings in Cancer Discovery.
The team theorized that the processes that normally regulate the migration of B lymphocytes into the B-cell follicle are also the reason for the migration of leukemia cells into the lymphoid organs. Hence, within the B-cell follicle, the survival and growth of malignant B cells may depend on the contact of leukemia cells with follicular dendritic cells (FDCs).
The researchers validated this theory with their mouse model. They found the chemokine CXCL13 and its receptor, CXCR5, on the surface of the leukemia cells are needed to ensure that leukemia cells can reach the spleen. With the aid of this homing receptor, the cancer cells are lured into the B-cell follicle of the spleen, where the FDCs secrete CXCL13.
When the researchers blocked CXCR5 in the mice, the leukemia cells could no longer migrate into the stromal cell niche and proliferated much more slowly.
In a second step, the group studied the consequences of the interaction between malignant B cells and the FDCs in the B-cell follicle. They found the close contact between the leukemia cells and the FDC network stimulates the cancer cells to increasingly produce another signaling substance, lymphotoxin.
The lymphotoxin binds to the lymphotoxin-beta receptor on the FDCs, which then increasingly secrete CXCL13. This creates a positive feedback loop because CXCL13 plays a major role in the recruitment of leukemia cells in the B-cell follicles.
The FDCs also provide growth factors that promote the proliferation of leukemia cells in the stromal niche.
When the researchers inhibited the binding of the lymphotoxin to the lymphotoxin-beta receptor on the FDCs with an immunologically active substance, they were able to end this ping-pong match between leukemia cells and the FDCs and dramatically reduce tumor growth.
The team thus identified two different targets that may complement the chemotherapy currently used to treat CLL. The first is blocking the chemokine/homing receptor CXCR5 on the leukemia cells, which prevents the cancer cells from lodging in the B-cell follicle.
The second is blocking the lymphotoxin-beta receptor on the FDCs so the reciprocal crosstalk between the leukemia cells and the FDCs is interrupted and tumor development is reduced.
From the results of their study, the researchers infer that chemotherapies already in clinical use combined with immune therapies that interrupt the crosstalk between leukemia cells and the FDCs may be beneficial.
This combination could prevent the residual leukemia cells that have escaped chemotherapy or radiation therapy from recovering in the stromal cell niche and from triggering a relapse. ![]()
Inpatient Pediatric Service Redesign
Given its positive effects on improving effectiveness and efficiency, Lean Six Sigma (LSS) is a business approach that is receiving a great deal of attention in the healthcare industry.[1, 2, 3, 4, 5, 6, 7] Although there are differences between Lean and Six Sigma, at their core they are both customer‐centered, quality methodologies designed to improve process efficiency and product quality through waste elimination, creating standardized work and reducing variation.[8]
Six Sigma is a rigorous problem‐focused process improvement method that focuses on defect removal, variation reduction, and customer satisfaction that relies heavily on statistical analysis. It includes 5 steps: define, measure, analyze, improvement, and control.[7, 8] Six Sigma assumes through variation reduction, defect removal, and meeting customer specifications, the performance of the organization can be improved and also meet the requirements of the customer.[8]
Lean is more process‐focused. It places emphasis on creating flow by removing waste and getting the steps of any given process in the right sequence.[8] In Lean terms, waste is defined as anything that the customer does not value and anything that is not done right the first time.[9] This category of waste is termed nonvalue adding and unnecessary. It is estimated that 30% to 50% of all steps of hospital processes are nonvalue adding and unnecessary, and therefore can be defined as waste.[10] Lean identifies 8 different types of nonvalue adding and unnecessary wastes. They are defects and rework, overproduction, waiting, nonutilization of resources, transport, inventory, motion, and extra processing. Waste creates delays that negatively impact patient care and reduce healthcare productivity.[10] Therefore, it makes sense to apply Lean concepts of waste identification and elimination to improve process efficiency. For example, when a facility is at or exceeds its bed capacity, any delay in discharge creates throughput delays throughout the hospital.[5] Discharge delays often result in emergency department (ED) overcrowding, and also affects a hospital's ability to accommodate internal downgrades and outside referrals in a timely fashion.[11, 12] However, because the sequence of steps of the discharge process is variable and not standardized, the goal to achieve early discharges remains elusive.[13]
There are emerging data to support that current rounding censuses exceed most hospitalist's abilities to deliver safe and efficient care.[12, 14, 15, 16] It is unclear what that threshold should be, but the current industry standard has nonacademic hospitalists seeing 15 patients per day. Therefore, high patient censuses could be contributing to delays in patient discharge times that effect hospital throughput. We speculated that by implementing a lean, quick‐strike approach[17] designed to improve the sequencing of housestaff, attending, and nursing work by eliminating the wastes of rework, waiting, extra processing, and nonutilization of physician resources by restaffing, we could improve patient discharge times. We augmented the intervention by creating standardized workflow expectations, a discharge checklist, and implemented daily interdisciplinary discharge planning huddles.
We hypothesized these interventions would improve the median time of discharge order entry and time of patient discharge. Primary outcome measures were: (1) the change in time of discharge order and discharge time and (2) the proportion of patients discharged before noon and 2 pm. Secondary outcomes that were used as balance measures were length of stay (LOS) and 7‐day, 14‐day, and 30‐day readmission rates.
METHODS
Study Design
This was a prospective quality improvement intervention with concurrent controls aimed to determine if discharge efficiency could be improved by load‐balancing our service line with existing faculty and residents, creating daily standard work using a discharge checklist and interdisciplinary huddles (see Supporting Figure 1 through Supporting Figure 3 in the online version of this article). All discharge data were collected as part of our medical center's Department of Logistics standard data collection procedures using solutions from TeleTracking Technologies, Inc. (Pittsburgh, PA). All patients discharged Monday through Friday from the pediatric hospitalist service prior to the 6‐month high‐census period (before intervention) and the 6‐month high‐census period (intervention period) were included in the study. To serve as our control, we collected the same discharge data during the same time periods for the remaining services of the children's hospital. This study was approved by Penn State Hershey Medical Center's institutional review board.
Study Setting
The study was conducted at the Penn State Hershey Children's Hospital (PSHCH), which is a physically free‐standing 133‐bed university‐based tertiary care hospital located in central Pennsylvania. The hospital has 36 pediatric medical/surgical beds located in 2 units (1 general and 1 intermediate care). PSHCH performs approximately 4100 admissions per year, of which approximately 1100 are performed by the Division of Pediatric Hospital Medicine. Our division is composed of 8 academic hospitalists with 1 to 20+ years' experience. Historically, the months of October through April are months when our service‐line has average daily censuses (ADC) that routinely exceed 12 patients per hospitalist. During these months, the median times patient discharge orders are placed and patient discharges occur historically approach 2 pm and 4 pm, respectively, and exceed our internal benchmark by 2 hours. Discharges from the remaining medical and surgical service lines at PSHCH that occurred Monday through Friday during the concurrent pre‐ and postintervention time periods served as the control group.
Needs Assessment and LSS
Traditionally, morning patient rounds are allotted approximately 180 minutes. Therefore, a rounding team can only be expected to spend 13 minutes or less per patient when the census exceeds 12 patients. The cycle time to perform 1 discharge using our electronic medical record is approximately 20 minutes, which is almost 10 minutes longer than the allotted time per patient. During high‐census months, our service averages 4 to 5 discharges per day. To accommodate performing discharges during rounds would require spending 80 to 100 minutes of the 180 available minutes. This would leave only 80 to 100 minutes to see the remaining 8 to 10 patients. As a result of these constraints, discharges are typically completed by the residents in unsupervised batches each afternoon following the noon conference (Figure 1A).

Because LSS focuses on eliminating nonvalue adding and unnecessary waste by load balancing processes and minimizing batching tasks,[8] this approach should lead one to question whether the current rounding model that requires 1 attending to see >12 high‐acuity patients with a maximum of 13 minutes per patient is system design flaw that leads to errors and inefficiency,[16] Theoretically, having an additional attending present would allow teams to resequence the work on smaller batches of patients and double the time to spend on each patient. This could create the opportunity to do value‐added work at the bedside in the presence of the family and nurse and eliminate the amount of nursing rework and time spent as work in progress on dischargeable patients (Figure 1).
Additionally, improving discharge efficiency creates virtual beds. Virtual beds permit hospitals to accommodate additional admissions despite operating with a fixed‐bed capacity. A way to calculate virtual beds is to calculate the reduction in LOS, and multiply that by the number of admissions per year divided by 36518 (see Supporting Figure 4 in the online version of this article). Our study was intended to determine the impact of discharge efficiency on this metric.
Intervention
We re‐structured our service line in a way that would balance both physician workload needs and patient expectations. To accomplish this, off service attendings were reallocated to round with a smaller resident team on fewer patients for the duration of the 6‐month study. Each member of the division agreed to work an average of 3 more weeks per year. One work day was estimated to be approximately 10 hours and 1 work week equaled 5 days, which asked for 150 hours of additional work per year. Because there increases in functional FTEs, the 2 teams consolidated into 1 team each weekend, to meet the group requirement that this model not result in additional weekend coverage. A balanced workload also theoretically allows the physician to spend more time at the bedside in direct patient care and resident education activities/observations.
In addition to reallocating physician and resident resources, our model created standard work expectations to reduce the variations in physician work sequences that can account for delayed discharge orders and delayed discharges, which is also an LSS principle. The intervention consisted of 3 changes: (1) fundamentally altering the composition of the rounding teams to optimize the provider: patient ratio; (2) defining rounding standards to expedite discharges; and (3) establishing a daily predischarge planning process.
The preintervention team typically had 1 attending, 1 to 2 senior residents, and 2 to 3 interns. The intervention period required creating 2 independently functioning teams, each composed of 1 hospitalist attending, and a minimum of 1 senior and 1 intern. The intervention occurred November through April, when the censuses predictably exceed 12 patients for the rounding attending. Because both teams functioned independently, all of the patients were divided equally between the 2 teams. Each team carried a panel of patients that included new, established, and dischargeable patients (Figure 1). We did not compare the number of provider handoffs before and during the intervention or time spent per patient.
Because the intervention required increasing the number of weeks on‐service by 2 to 3weeks per physician to reduce clinical work time, it meant redeploying previously off‐service attendings to coincide with peak demands. This aspect of the intervention made group buy‐in mandatory. The group agreed to distribute the predictably heavy workload that usually falls on 1 attending by adding a second attending for the busiest 6 months of the year. Our division voted unanimously to adopt this model despite the increase in service time, as long as weekend coverage was not increased.
As part of the intervention, we created standard work expectations within our division to (1) start rounds on dischargeable patients who were identified the prior evening during the (2) interdisciplinary huddle, and (3) have the entire departure process completed at the bedside using a discharge checklist (see Supporting Figure 1 through Figure 3 in the online version of this article). The expectations included a standard script for beginning rounds, selecting patients who could be discharged first, and completing all necessary discharge computer work at the bedside, before proceeding to the next patient. The daily predischarge huddle was instituted each afternoon to prepare discharges that were expected to occur the following day. The huddles were attended by care coordinators, social workers, and both medical teams. During the huddle, the team discussed anticipated discharges, scheduled follow‐up appointments and testing, faxed necessary prescriptions, and arranged any needed home services.
Inclusion and Exclusion Criteria for Patients
All patients discharged from the pediatric hospitalist inpatient service between Monday and Friday from April 8, 2013 to October 25, 2013 (preimplementation cohort) and October 28, 2013 to April 18, 2014 (postimplementation cohort) were eligible for inclusion. This included admitted patients and observation status patients. Patients discharged from the remaining PSHCH medical and surgical service lines were included in the control group analysis using the above criteria.
OUTCOME MEASURES
Throughput and Patient‐Level Outcomes
Primary outcomes included (1) time of electronic discharge order placement, (2) actual patient discharge time, (3) proportion of patients discharged before noon and 2 pm, (4) 7‐day, 14‐day, and 30‐day readmission rates, (5) length of stay (LOS), and (6) average daily census (ADC).
Statistical Analysis
The null hypothesis was that there would be no difference in discharge order time, discharge time, LOS, readmission rates, and daily discharges in the preintervention group compared to the intervention group. For time of order placement and actual patient discharge, the significance was assessed using Wilcoxon rank sum test and expressed as median time among the groups. Patient discharge before noon/2 pm was assessed by a logistic regression model. The predictor being the intervention group with the results expressed as odds ratios of discharge before noon/2 pm comparing the intervention group to the preintervention group. Readmission rates were assessed using a [2] test to see if there was a significant difference from what would be expected. Last, LOS and ADC were assessed by a Student t test and expressed as the means. The data were analyzed using SAS version 9.3 (SAS Institute, Cary, NC).
RESULTS
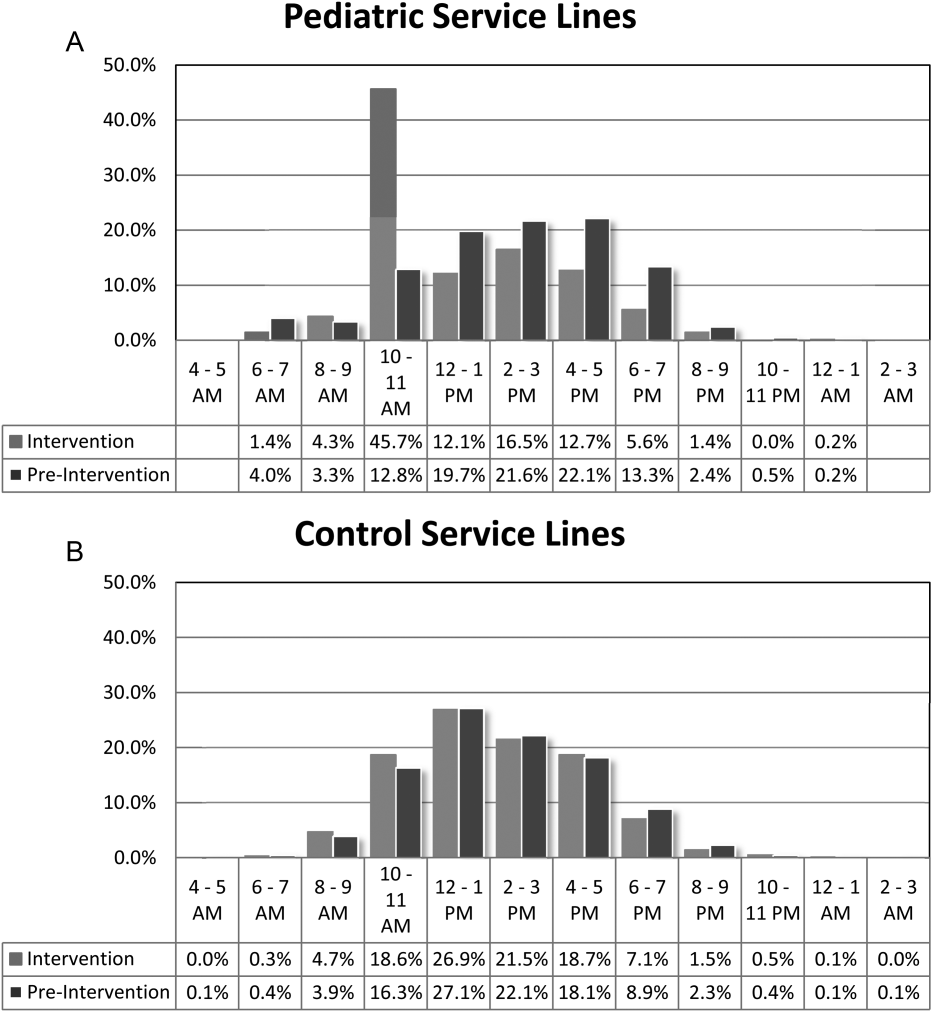
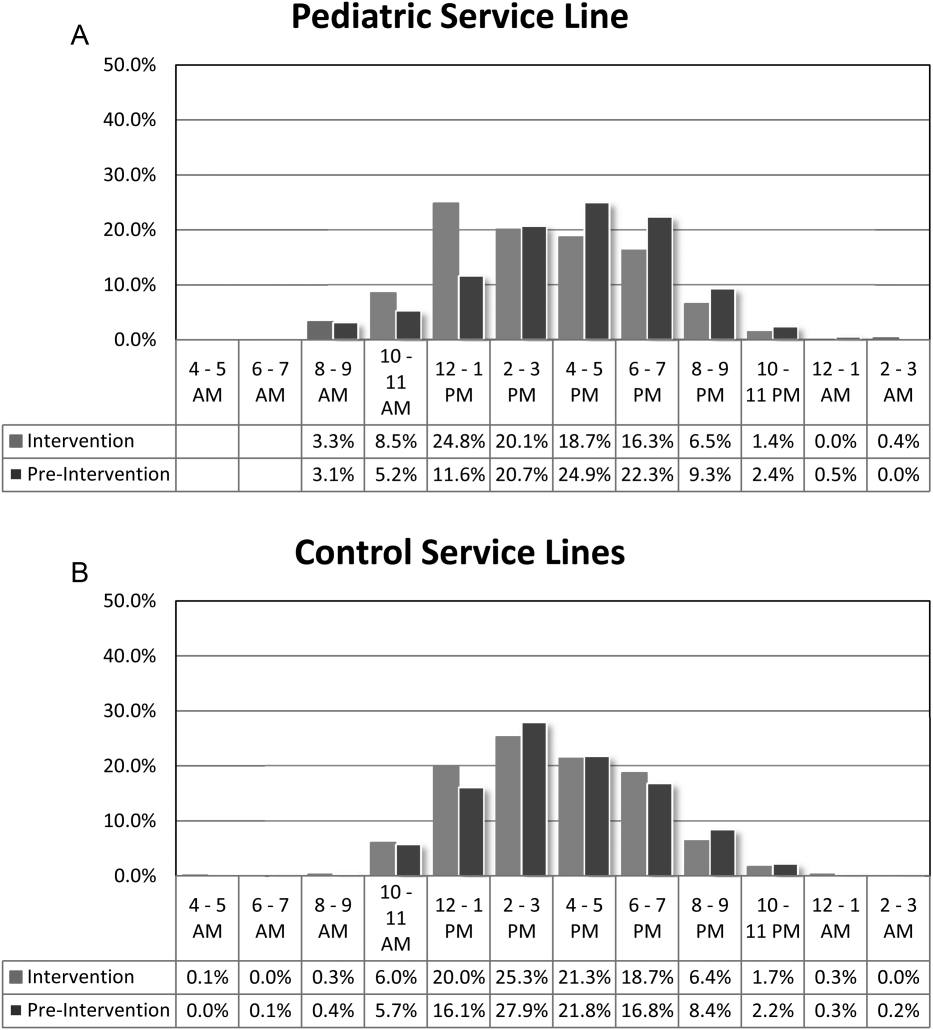
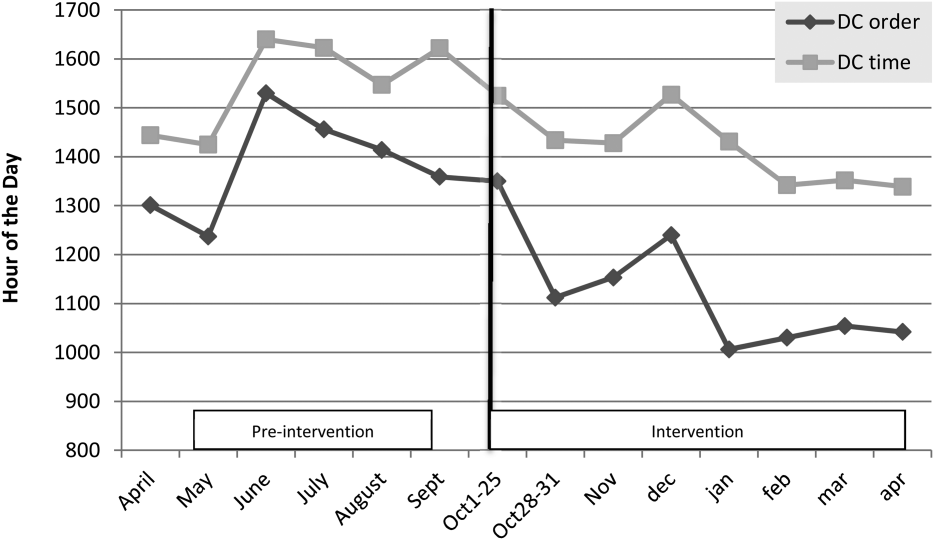
For our division's service line, both the ADC and number of patients discharged per day were significantly higher during the intervention months (Table 1). By comparison, the control group had a significantly lower ADC and lower average of discharges per day in the intervention time period. The new model permitted the teams to enter discharge orders earlier in the day, which ultimately lead to earlier patient discharges. The additive effect of the 3 interventions had a statistically significant effect on process efficiency metrics (Table 1). The median discharge order entry time decreased by 200 minutes from 14:05 to 10:45, and the median time of patient discharge decreased by 93 minutes from 15:48 to 14:15. By comparison, the median time of discharge order entry decreased 13:13 to 12:56 pm, but the median time of discharge increased 5 minutes 14:45 versus 14:50 in the control group. A significantly higher proportion of patients were discharged by noon (27% vs 14%; P<0.0001; odds ratio [OR]:2.2; 95% confidence interval [CI]: 1.6‐3.1) and by 2 pm during the intervention period (47% vs 30%; P<0.0001; OR: 2.1; 95% CI: 1.6‐2.7). There was no observed difference in the proportion of patients who were discharged by noon or 2 pm in the control group. Finally, in the intervention group, approximately 50% of patients had discharge orders entered before noon compared to 23% in the control group (Figure 2). The intervention demonstrated statistical significance in shifting the time of discharge order entry and the time of patient discharge when compared to the relatively less burdened PSHCH control group (Figures 2 and 3). As seen in Figure 4, the results were sustained for the duration of the study and appeared to improve throughout intervention. Finally, readmission rates at 7, 14, and 30 days postdischarge and LOS were not negatively affected (Table 1) in either the intervention or control group.
| Outcomes | Experimental Model | Control Group | ||||
|---|---|---|---|---|---|---|
| Preintervention, n=421 | Intervention, n=552 | P Value | Preintervention, n=1,390 | Intervention, n=1,146 | P Value | |
| Average daily census | 9.7 | 12.4 | <0.0001 | 45.9 | 43.4 | 0.002 |
| Discharges per day | 3.1 | 4.5 | <0.00001 | 9.5 | 9.2 | 0.419 |
| Average length of stay | 3.1 | 3.0 | 0.864 | 6.3 | 5.9 | 0.714 |
| Discharge order time, median | 14:05 | 10:45 | <0.0001 | 13:13 | 12:56 | 0.053 |
| Discharge from hospital, median | 15:48 | 14:15 | <0.0001 | 14:45 | 14:50 | 0.113 |
| Patients discharged before noon | 59 (14%) | 147 (27%) | <0.0001 | 176 (13%) | 170 (15%) | 0.138 |
| Patients discharged before 2 pm | 128 (30%) | 261 (47%) | <0.0001 | 519 (38%) | 447 (39%) | 0.512 |
| 7‐day readmission rates | 3.1% | 3.5% | 0.965 | 6.7% | 6.8% | 0.970 |
| 14‐day readmission rates | 5.8% | 5.8% | 0.981 | 12.0% | 13.5% | 0.301 |
| 30‐day readmission rates | 9.4% | 9.1% | 0.703 | 20.0% | 20.6% | 0.705 |
DISCUSSION
We demonstrated a statistically significant and what appears to be a sustainable improvement in median discharge order times, discharge times, and proportion of discharges by noon and 2 pm. Ours was the only service line in our medical center to achieve a median time discharge before our institution's internal metric of 2 pm and maintain it for 3 consecutive months. Additionally, the process demonstrated consistent performance independent of the varying styles and experience of the rounding attending during the busiest months of the year without incurring a negative impact on LOS or readmission rates.
Although our intervention demonstrated statistical significance in shifting the discharge distribution curves by almost 2 hours, more relevant is its potential clinical and financial impact. First, it puts our hospital in compliance with the Joint Commission's recommendations standard LD.04.03.1, stipulating that hospitals measure and set goals for mitigating and managing the flow of patients though the hospital. Second, our findings confirm the results of earlier studies suggesting that shifting discharge times could likely be achieved without the additional staff, but with alterations in staff shift scheduling.[11] Third, by doing required discharge work at the bedside and making it available earlier in the day, every day, we consistently reduced patient waiting along the entire supply chain.
Advancing the discharge time creates virtual beds that allow our facility to theoretically accommodate new patients. Using the calculation in the Methods section (see Supporting Figure 4 in the online version of this article) on how to calculate virtual beds, we determined that our intervention created between 0.30 and 0.38 virtual beds in a hospital with only 72 beds. We calculated that this would create 6.8 more open bed hours per day, 74 additional patient days per year, and assuming patients were waiting for the beds and rapid bed turnover, our intervention theoretically created the capacity to accommodate approximately 25 additional admissions per year (see Supporting Figure 4 in the online version of this article). As the only children's hospital in the region, this intervention will enable our organization to provide timelier access and possibly reduce time sensitive medical errors.
Timelier evaluations also have revenue potential by eliminating lost referrals, thus turning waste into value. When comparing the previous year's high‐census monthsOctober through Marchthere were 20 lost referrals due to lack of bed capacity, as compared to zero lost referrals during our intervention period. By accommodating these 20 additional admissions, we estimated this generated between $275,000 and $412,000 dollars in additional revenue without additional resources but simply staffing to demand.
Finally, when we looked at patient satisfaction metrics obtained through Press Ganey (PG), comparing the time periods we observed that overall satisfaction increased from the 91 percentile to the 94 percentile, trust in doctor increased from the 20 percentile to the 70 percentile, and would recommend this hospital to others increased from the 53 percentile to the 75 percentile. Interestingly, despite being a study that improved discharge efficiency, none of the discharge metrics gathered by PG improved. It is possible that this is a limitation of the PG survey, or could reflect the possibility that our new process exposed that our discharge order entry and discharge processes are misaligned.
When we surveyed the nursing staff and members of the division regarding whether or not to continue the intervention rounding model, 75% and 100%, respectively, voted in favor of continuing with the intervention model. Unfortunately, housestaff satisfaction was not measured for this study.
Despite more weeks in the hospital, but because there was better process sequencing, our providers indicated that because the workload of the primary attending was reduced and the workload for the additional attending was light, there was ample time to engage in afternoon nonclinical activities (Figure 1B). In fact, several division members assumed departmental and educational leadership positions, and others volunteered to facilitate highly valued, but unsubsidized, afternoon medical student and resident teaching sessions that occurred solely as a result of the resequenced and redistributed clinical load.
There are limitations to this study. First, because 3 interventions were implemented simultaneously, it is difficult to identify which component of the intervention was the primary driver for the measured differences. It is conceivable the proactive discharge planning that occurred during the afternoon predischarge planning huddles allowed the teams to complete discharge requirements the night before anticipated discharge therefore expediting the next morning's discharge. A second limitation was not simultaneously comparing the traditional rounding structure with the experimental model. One could argue that the improved efficiency we observed was not due to any of the interventions and represents secular trends that all residents' teams experience through the course of the year as they get more adept at performing patient discharges. However, when we compare our performance to the control group performance, this efficiency trend was not present. Additionally, it was possible that attendings were so result focused that they delayed discharges if the 2 pm discharge goal was missed for that day and planned for early discharges the following morning. If this behavior occurred, this would likely have been reflected as increases in our LOS data, however this was not observed. Third, because our preintervention data reflected discharge behaviors during a low‐census period, it is possible that there was less urgency to discharge patients when bed capacity issues did not exist. Comparing the intervention period to a period when censuses are similar would better address this issue. Finally, although we assert that attending workload is a fundamental waste‐producing constraint in the discharge process, this study did not determine what the optimal patient census should be.
Most hospitalists struggle with finding a balance of meeting patient quality and administrative productivity demands.[16] Hospitalists at academic medical centers have the added demand of maintaining their educational mission. Since 2001, the Institute of Medicine[19] has advocated process re‐engineering using more patient‐centered approaches. A recent study found that when hospitals reach capacity, the excess workload placed on internal medicine hospitalists reduces efficiency and increases costs.[16] Interestingly, in a study conducted by McMahon et al., they found that reducing team censuses by 50%, resident educational outcomes can be improved.[20] Similar to this study, our study reduced attending workload by 50% with the goal to assess the impact on discharge efficiency rather than educational outcomes. Also similar to that study, we radically altered the operational model in which physicians historically had functioned.[14, 20] Because the rounding structures in both studies reduced patient:provider ratios we believe that our model will successfully balance education, patient quality, and productivity.
LSS, when thoughtfully applied to the problems we face, could be part of the solution. It delivers quick results without large capital investments, by identifying and implementing high‐leverage changes that value a creative solution before a capital investment. One of the strengths of this model is that it does not require substantial financial investment to produce these outcomes. Because the morning clinical loads were more evenly distributed during the busiest months of the year, our division members were able to engage in nonclinical duties and teaching sessions, both of which often required afternoon commitments, but permitted us to balance work and professional achievement (Figure 1B). Finally, as part of any new process, one must consider the factors that influence its sustainability: provider level satisfaction, impact of the process change, and remuneration. Because the intervention reduced lost referrals, the departmental and institutional leadership agreed to financially incentivize the value‐generating potential this intervention had on increasing patient access by facilitating organizational throughput. Therefore, having met the three aforementioned elements, we believe this model is sustainable.
Although many studies remain results focused with aims at documenting how hospital processes fail when overburdened, our study takes a novel process‐focused approach to look at how processes can excel during periods of high demands, simply by reallocating existing resources.
Medicine is in the midst of multiple paradigm shifts involving resident work hour reduction, public safety reporting, reimbursement constraints, and value‐driven care, to name a few. Whether we take a resident or patient‐centered approach, it seems highly unlikely that the current approaches will meet these demands without making significant changes in how we deliver care. Next steps should include construction of a value stream map (VSM), with the input of all of the process stakeholders, that diagrams the entire discharge process. The VSM should highlight all nonvalue adding steps and eliminate them. They are likely a contributing cause to the disproportionate reduction in time of discharge order entry (200 minutes) versus actual discharge (93 minutes) seen in our study. Future work needs to establish the generalizability and sustainability of this model across other hospital service lines. Future studies should establish if this model has sustained impact on patient, provider, and resident satisfaction and overall system efficiency (ED boarding), with aims to quantify the revenue generating potential that occurs through waste elimination.
We close with the following thought: [T]o ask people to make different decisions without fundamentally changing the equation presented to them is wrong. If we wish to change the types of decisions our people make, we owe it to them to design and build processes that will put them in a position to succeed.[21]
Acknowledgements
The authors recognize the contributions made by members of the Division of Pediatric Hospital Medicine at PSHCH, without which this project would not have been possible. They are: Drs. Marta Biderman, Anika Kumar, Margaret Mikula, Chris O'Hara, Brandon Smith, and Ron Williams, and Heidi Wolf, and Lyndsay Gardener, CRNP. This project would not have been possible without the help from Brenda Ruhl, Manjula Narasimhan, and Heather Boyle from the Department of Logistics. Finally, the authors would like to thank the following for their thoughtful reviews of this manuscript: Drs. Lisa Scalzi, Barbara Ostrov, Jed Gonzalo, Chris Sciamanna, and Matt Wain.
Disclosures: Nothing to report.
- . Theory of constraints—a review of the philosophy and its applications. Int J Oper Prod Man. 1998;18(4):336–355.
- , , , et al. Use of lean and six sigma methodology to improve operating room efficiency in a high‐volume tertiary‐care academic medical center. J Am Coll Surg. 2011;213(1):83–92; discussion 93–84.
- , . The promise of Lean in health care. Mayo Clin Proc. 2013;88(1):74–82.
- , , . Assessing the evidence of Six Sigma and Lean in the health care industry. Qual Manag Health Care. 2010;19(3):211–225.
- , , , et al. Redesigning care at the Flinders Medical Centre: clinical process redesign using “lean thinking”. Med J Aust. 2008;188(6 suppl):S27–S31.
- , , , , . Impact of 5 years of lean six sigma in a University Medical Center. Qual Manag Health Care. 2012;21(4):262–268.
- , , , et al. A Lean Six Sigma quality improvement project to increase discharge paperwork completeness for admission to a comprehensive integrated inpatient rehabilitation program. Am J Med Qual. 2013;28(4):301–307.
- . How to compare Six Sigma, lean and the theory of constraints—a framework for choosing what's best for your organization. Qual Prog. 2002;35(3):73–78.
- , , , , . Application of lean manufacturing techniques in the Emergency Department. J Emerg Med. 2009;37(2):177–182.
- . Lean Hospitals: Improving Quality, Patient Safety, and Employee Engagement. 2nd ed. New York, NY: Productivity Press/Taylor 2012.
- , , , , , . The relationship between inpatient discharge timing and emergency department boarding. J Emerg Med. 2012;42(2):186–196.
- , , , . Unravelling relationships: Hospital occupancy levels, discharge timing and emergency department access block. Emerg Med Aust. 2012;24(5):510–517.
- . Need to speed up discharges? The pros and cons of putting discharges on the clock. Today's Hospitalist. 2013. Accessed November 2014. Available at: http://www.todayshospitalist.com/index.php?b=articles_read3(2):144–150.
- , . Hospitalist staffing requirements. Eff Clin Pract. 1999;2(3):126–130.
- , , , , . Effect of hospitalist workload on the quality and efficiency of care. JAMA Intern Med. 2014;174(5):786–793.
- . Accelerating Lean Six Sigma Results: How to Achieve Improvement Excellence in the New Economy. Plantation, FL: J. Ross Publishing; 2011.
- . “Virtual bed capacity” may offer revenue boost for hospitals. Healthcare Finance. Accessed October 2014. Available at: http://www.healthcarefinancenews.com/blog/virtual‐bed‐capacity‐may‐offer‐revenue‐boost‐hospitals. Published November 30, 2011.
- Institute of Medicine. Committee on Quality of Health Care in America. Crossing the Quality Chasm: A New Health System for the 21st Century. Washington, DC: National Academy Press; 2001.
- , , , , . Evaluation of a redesign initiative in an internal‐medicine residency. N Engl J Med. 2010;362(14):1304–1311.
- John Kim and Associates website. Available at: http://www.johnkimconsulting.com. Accessed June 2014.
Given its positive effects on improving effectiveness and efficiency, Lean Six Sigma (LSS) is a business approach that is receiving a great deal of attention in the healthcare industry.[1, 2, 3, 4, 5, 6, 7] Although there are differences between Lean and Six Sigma, at their core they are both customer‐centered, quality methodologies designed to improve process efficiency and product quality through waste elimination, creating standardized work and reducing variation.[8]
Six Sigma is a rigorous problem‐focused process improvement method that focuses on defect removal, variation reduction, and customer satisfaction that relies heavily on statistical analysis. It includes 5 steps: define, measure, analyze, improvement, and control.[7, 8] Six Sigma assumes through variation reduction, defect removal, and meeting customer specifications, the performance of the organization can be improved and also meet the requirements of the customer.[8]
Lean is more process‐focused. It places emphasis on creating flow by removing waste and getting the steps of any given process in the right sequence.[8] In Lean terms, waste is defined as anything that the customer does not value and anything that is not done right the first time.[9] This category of waste is termed nonvalue adding and unnecessary. It is estimated that 30% to 50% of all steps of hospital processes are nonvalue adding and unnecessary, and therefore can be defined as waste.[10] Lean identifies 8 different types of nonvalue adding and unnecessary wastes. They are defects and rework, overproduction, waiting, nonutilization of resources, transport, inventory, motion, and extra processing. Waste creates delays that negatively impact patient care and reduce healthcare productivity.[10] Therefore, it makes sense to apply Lean concepts of waste identification and elimination to improve process efficiency. For example, when a facility is at or exceeds its bed capacity, any delay in discharge creates throughput delays throughout the hospital.[5] Discharge delays often result in emergency department (ED) overcrowding, and also affects a hospital's ability to accommodate internal downgrades and outside referrals in a timely fashion.[11, 12] However, because the sequence of steps of the discharge process is variable and not standardized, the goal to achieve early discharges remains elusive.[13]
There are emerging data to support that current rounding censuses exceed most hospitalist's abilities to deliver safe and efficient care.[12, 14, 15, 16] It is unclear what that threshold should be, but the current industry standard has nonacademic hospitalists seeing 15 patients per day. Therefore, high patient censuses could be contributing to delays in patient discharge times that effect hospital throughput. We speculated that by implementing a lean, quick‐strike approach[17] designed to improve the sequencing of housestaff, attending, and nursing work by eliminating the wastes of rework, waiting, extra processing, and nonutilization of physician resources by restaffing, we could improve patient discharge times. We augmented the intervention by creating standardized workflow expectations, a discharge checklist, and implemented daily interdisciplinary discharge planning huddles.
We hypothesized these interventions would improve the median time of discharge order entry and time of patient discharge. Primary outcome measures were: (1) the change in time of discharge order and discharge time and (2) the proportion of patients discharged before noon and 2 pm. Secondary outcomes that were used as balance measures were length of stay (LOS) and 7‐day, 14‐day, and 30‐day readmission rates.
METHODS
Study Design
This was a prospective quality improvement intervention with concurrent controls aimed to determine if discharge efficiency could be improved by load‐balancing our service line with existing faculty and residents, creating daily standard work using a discharge checklist and interdisciplinary huddles (see Supporting Figure 1 through Supporting Figure 3 in the online version of this article). All discharge data were collected as part of our medical center's Department of Logistics standard data collection procedures using solutions from TeleTracking Technologies, Inc. (Pittsburgh, PA). All patients discharged Monday through Friday from the pediatric hospitalist service prior to the 6‐month high‐census period (before intervention) and the 6‐month high‐census period (intervention period) were included in the study. To serve as our control, we collected the same discharge data during the same time periods for the remaining services of the children's hospital. This study was approved by Penn State Hershey Medical Center's institutional review board.
Study Setting
The study was conducted at the Penn State Hershey Children's Hospital (PSHCH), which is a physically free‐standing 133‐bed university‐based tertiary care hospital located in central Pennsylvania. The hospital has 36 pediatric medical/surgical beds located in 2 units (1 general and 1 intermediate care). PSHCH performs approximately 4100 admissions per year, of which approximately 1100 are performed by the Division of Pediatric Hospital Medicine. Our division is composed of 8 academic hospitalists with 1 to 20+ years' experience. Historically, the months of October through April are months when our service‐line has average daily censuses (ADC) that routinely exceed 12 patients per hospitalist. During these months, the median times patient discharge orders are placed and patient discharges occur historically approach 2 pm and 4 pm, respectively, and exceed our internal benchmark by 2 hours. Discharges from the remaining medical and surgical service lines at PSHCH that occurred Monday through Friday during the concurrent pre‐ and postintervention time periods served as the control group.
Needs Assessment and LSS
Traditionally, morning patient rounds are allotted approximately 180 minutes. Therefore, a rounding team can only be expected to spend 13 minutes or less per patient when the census exceeds 12 patients. The cycle time to perform 1 discharge using our electronic medical record is approximately 20 minutes, which is almost 10 minutes longer than the allotted time per patient. During high‐census months, our service averages 4 to 5 discharges per day. To accommodate performing discharges during rounds would require spending 80 to 100 minutes of the 180 available minutes. This would leave only 80 to 100 minutes to see the remaining 8 to 10 patients. As a result of these constraints, discharges are typically completed by the residents in unsupervised batches each afternoon following the noon conference (Figure 1A).
Because LSS focuses on eliminating nonvalue adding and unnecessary waste by load balancing processes and minimizing batching tasks,[8] this approach should lead one to question whether the current rounding model that requires 1 attending to see >12 high‐acuity patients with a maximum of 13 minutes per patient is system design flaw that leads to errors and inefficiency,[16] Theoretically, having an additional attending present would allow teams to resequence the work on smaller batches of patients and double the time to spend on each patient. This could create the opportunity to do value‐added work at the bedside in the presence of the family and nurse and eliminate the amount of nursing rework and time spent as work in progress on dischargeable patients (Figure 1).
Additionally, improving discharge efficiency creates virtual beds. Virtual beds permit hospitals to accommodate additional admissions despite operating with a fixed‐bed capacity. A way to calculate virtual beds is to calculate the reduction in LOS, and multiply that by the number of admissions per year divided by 36518 (see Supporting Figure 4 in the online version of this article). Our study was intended to determine the impact of discharge efficiency on this metric.
Intervention
We re‐structured our service line in a way that would balance both physician workload needs and patient expectations. To accomplish this, off service attendings were reallocated to round with a smaller resident team on fewer patients for the duration of the 6‐month study. Each member of the division agreed to work an average of 3 more weeks per year. One work day was estimated to be approximately 10 hours and 1 work week equaled 5 days, which asked for 150 hours of additional work per year. Because there increases in functional FTEs, the 2 teams consolidated into 1 team each weekend, to meet the group requirement that this model not result in additional weekend coverage. A balanced workload also theoretically allows the physician to spend more time at the bedside in direct patient care and resident education activities/observations.
In addition to reallocating physician and resident resources, our model created standard work expectations to reduce the variations in physician work sequences that can account for delayed discharge orders and delayed discharges, which is also an LSS principle. The intervention consisted of 3 changes: (1) fundamentally altering the composition of the rounding teams to optimize the provider: patient ratio; (2) defining rounding standards to expedite discharges; and (3) establishing a daily predischarge planning process.
The preintervention team typically had 1 attending, 1 to 2 senior residents, and 2 to 3 interns. The intervention period required creating 2 independently functioning teams, each composed of 1 hospitalist attending, and a minimum of 1 senior and 1 intern. The intervention occurred November through April, when the censuses predictably exceed 12 patients for the rounding attending. Because both teams functioned independently, all of the patients were divided equally between the 2 teams. Each team carried a panel of patients that included new, established, and dischargeable patients (Figure 1). We did not compare the number of provider handoffs before and during the intervention or time spent per patient.
Because the intervention required increasing the number of weeks on‐service by 2 to 3weeks per physician to reduce clinical work time, it meant redeploying previously off‐service attendings to coincide with peak demands. This aspect of the intervention made group buy‐in mandatory. The group agreed to distribute the predictably heavy workload that usually falls on 1 attending by adding a second attending for the busiest 6 months of the year. Our division voted unanimously to adopt this model despite the increase in service time, as long as weekend coverage was not increased.
As part of the intervention, we created standard work expectations within our division to (1) start rounds on dischargeable patients who were identified the prior evening during the (2) interdisciplinary huddle, and (3) have the entire departure process completed at the bedside using a discharge checklist (see Supporting Figure 1 through Figure 3 in the online version of this article). The expectations included a standard script for beginning rounds, selecting patients who could be discharged first, and completing all necessary discharge computer work at the bedside, before proceeding to the next patient. The daily predischarge huddle was instituted each afternoon to prepare discharges that were expected to occur the following day. The huddles were attended by care coordinators, social workers, and both medical teams. During the huddle, the team discussed anticipated discharges, scheduled follow‐up appointments and testing, faxed necessary prescriptions, and arranged any needed home services.
Inclusion and Exclusion Criteria for Patients
All patients discharged from the pediatric hospitalist inpatient service between Monday and Friday from April 8, 2013 to October 25, 2013 (preimplementation cohort) and October 28, 2013 to April 18, 2014 (postimplementation cohort) were eligible for inclusion. This included admitted patients and observation status patients. Patients discharged from the remaining PSHCH medical and surgical service lines were included in the control group analysis using the above criteria.
OUTCOME MEASURES
Throughput and Patient‐Level Outcomes
Primary outcomes included (1) time of electronic discharge order placement, (2) actual patient discharge time, (3) proportion of patients discharged before noon and 2 pm, (4) 7‐day, 14‐day, and 30‐day readmission rates, (5) length of stay (LOS), and (6) average daily census (ADC).
Statistical Analysis
The null hypothesis was that there would be no difference in discharge order time, discharge time, LOS, readmission rates, and daily discharges in the preintervention group compared to the intervention group. For time of order placement and actual patient discharge, the significance was assessed using Wilcoxon rank sum test and expressed as median time among the groups. Patient discharge before noon/2 pm was assessed by a logistic regression model. The predictor being the intervention group with the results expressed as odds ratios of discharge before noon/2 pm comparing the intervention group to the preintervention group. Readmission rates were assessed using a [2] test to see if there was a significant difference from what would be expected. Last, LOS and ADC were assessed by a Student t test and expressed as the means. The data were analyzed using SAS version 9.3 (SAS Institute, Cary, NC).
RESULTS
For our division's service line, both the ADC and number of patients discharged per day were significantly higher during the intervention months (Table 1). By comparison, the control group had a significantly lower ADC and lower average of discharges per day in the intervention time period. The new model permitted the teams to enter discharge orders earlier in the day, which ultimately lead to earlier patient discharges. The additive effect of the 3 interventions had a statistically significant effect on process efficiency metrics (Table 1). The median discharge order entry time decreased by 200 minutes from 14:05 to 10:45, and the median time of patient discharge decreased by 93 minutes from 15:48 to 14:15. By comparison, the median time of discharge order entry decreased 13:13 to 12:56 pm, but the median time of discharge increased 5 minutes 14:45 versus 14:50 in the control group. A significantly higher proportion of patients were discharged by noon (27% vs 14%; P<0.0001; odds ratio [OR]:2.2; 95% confidence interval [CI]: 1.6‐3.1) and by 2 pm during the intervention period (47% vs 30%; P<0.0001; OR: 2.1; 95% CI: 1.6‐2.7). There was no observed difference in the proportion of patients who were discharged by noon or 2 pm in the control group. Finally, in the intervention group, approximately 50% of patients had discharge orders entered before noon compared to 23% in the control group (Figure 2). The intervention demonstrated statistical significance in shifting the time of discharge order entry and the time of patient discharge when compared to the relatively less burdened PSHCH control group (Figures 2 and 3). As seen in Figure 4, the results were sustained for the duration of the study and appeared to improve throughout intervention. Finally, readmission rates at 7, 14, and 30 days postdischarge and LOS were not negatively affected (Table 1) in either the intervention or control group.
| Outcomes | Experimental Model | Control Group | ||||
|---|---|---|---|---|---|---|
| Preintervention, n=421 | Intervention, n=552 | P Value | Preintervention, n=1,390 | Intervention, n=1,146 | P Value | |
| Average daily census | 9.7 | 12.4 | <0.0001 | 45.9 | 43.4 | 0.002 |
| Discharges per day | 3.1 | 4.5 | <0.00001 | 9.5 | 9.2 | 0.419 |
| Average length of stay | 3.1 | 3.0 | 0.864 | 6.3 | 5.9 | 0.714 |
| Discharge order time, median | 14:05 | 10:45 | <0.0001 | 13:13 | 12:56 | 0.053 |
| Discharge from hospital, median | 15:48 | 14:15 | <0.0001 | 14:45 | 14:50 | 0.113 |
| Patients discharged before noon | 59 (14%) | 147 (27%) | <0.0001 | 176 (13%) | 170 (15%) | 0.138 |
| Patients discharged before 2 pm | 128 (30%) | 261 (47%) | <0.0001 | 519 (38%) | 447 (39%) | 0.512 |
| 7‐day readmission rates | 3.1% | 3.5% | 0.965 | 6.7% | 6.8% | 0.970 |
| 14‐day readmission rates | 5.8% | 5.8% | 0.981 | 12.0% | 13.5% | 0.301 |
| 30‐day readmission rates | 9.4% | 9.1% | 0.703 | 20.0% | 20.6% | 0.705 |
DISCUSSION
We demonstrated a statistically significant and what appears to be a sustainable improvement in median discharge order times, discharge times, and proportion of discharges by noon and 2 pm. Ours was the only service line in our medical center to achieve a median time discharge before our institution's internal metric of 2 pm and maintain it for 3 consecutive months. Additionally, the process demonstrated consistent performance independent of the varying styles and experience of the rounding attending during the busiest months of the year without incurring a negative impact on LOS or readmission rates.
Although our intervention demonstrated statistical significance in shifting the discharge distribution curves by almost 2 hours, more relevant is its potential clinical and financial impact. First, it puts our hospital in compliance with the Joint Commission's recommendations standard LD.04.03.1, stipulating that hospitals measure and set goals for mitigating and managing the flow of patients though the hospital. Second, our findings confirm the results of earlier studies suggesting that shifting discharge times could likely be achieved without the additional staff, but with alterations in staff shift scheduling.[11] Third, by doing required discharge work at the bedside and making it available earlier in the day, every day, we consistently reduced patient waiting along the entire supply chain.
Advancing the discharge time creates virtual beds that allow our facility to theoretically accommodate new patients. Using the calculation in the Methods section (see Supporting Figure 4 in the online version of this article) on how to calculate virtual beds, we determined that our intervention created between 0.30 and 0.38 virtual beds in a hospital with only 72 beds. We calculated that this would create 6.8 more open bed hours per day, 74 additional patient days per year, and assuming patients were waiting for the beds and rapid bed turnover, our intervention theoretically created the capacity to accommodate approximately 25 additional admissions per year (see Supporting Figure 4 in the online version of this article). As the only children's hospital in the region, this intervention will enable our organization to provide timelier access and possibly reduce time sensitive medical errors.
Timelier evaluations also have revenue potential by eliminating lost referrals, thus turning waste into value. When comparing the previous year's high‐census monthsOctober through Marchthere were 20 lost referrals due to lack of bed capacity, as compared to zero lost referrals during our intervention period. By accommodating these 20 additional admissions, we estimated this generated between $275,000 and $412,000 dollars in additional revenue without additional resources but simply staffing to demand.
Finally, when we looked at patient satisfaction metrics obtained through Press Ganey (PG), comparing the time periods we observed that overall satisfaction increased from the 91 percentile to the 94 percentile, trust in doctor increased from the 20 percentile to the 70 percentile, and would recommend this hospital to others increased from the 53 percentile to the 75 percentile. Interestingly, despite being a study that improved discharge efficiency, none of the discharge metrics gathered by PG improved. It is possible that this is a limitation of the PG survey, or could reflect the possibility that our new process exposed that our discharge order entry and discharge processes are misaligned.
When we surveyed the nursing staff and members of the division regarding whether or not to continue the intervention rounding model, 75% and 100%, respectively, voted in favor of continuing with the intervention model. Unfortunately, housestaff satisfaction was not measured for this study.
Despite more weeks in the hospital, but because there was better process sequencing, our providers indicated that because the workload of the primary attending was reduced and the workload for the additional attending was light, there was ample time to engage in afternoon nonclinical activities (Figure 1B). In fact, several division members assumed departmental and educational leadership positions, and others volunteered to facilitate highly valued, but unsubsidized, afternoon medical student and resident teaching sessions that occurred solely as a result of the resequenced and redistributed clinical load.
There are limitations to this study. First, because 3 interventions were implemented simultaneously, it is difficult to identify which component of the intervention was the primary driver for the measured differences. It is conceivable the proactive discharge planning that occurred during the afternoon predischarge planning huddles allowed the teams to complete discharge requirements the night before anticipated discharge therefore expediting the next morning's discharge. A second limitation was not simultaneously comparing the traditional rounding structure with the experimental model. One could argue that the improved efficiency we observed was not due to any of the interventions and represents secular trends that all residents' teams experience through the course of the year as they get more adept at performing patient discharges. However, when we compare our performance to the control group performance, this efficiency trend was not present. Additionally, it was possible that attendings were so result focused that they delayed discharges if the 2 pm discharge goal was missed for that day and planned for early discharges the following morning. If this behavior occurred, this would likely have been reflected as increases in our LOS data, however this was not observed. Third, because our preintervention data reflected discharge behaviors during a low‐census period, it is possible that there was less urgency to discharge patients when bed capacity issues did not exist. Comparing the intervention period to a period when censuses are similar would better address this issue. Finally, although we assert that attending workload is a fundamental waste‐producing constraint in the discharge process, this study did not determine what the optimal patient census should be.
Most hospitalists struggle with finding a balance of meeting patient quality and administrative productivity demands.[16] Hospitalists at academic medical centers have the added demand of maintaining their educational mission. Since 2001, the Institute of Medicine[19] has advocated process re‐engineering using more patient‐centered approaches. A recent study found that when hospitals reach capacity, the excess workload placed on internal medicine hospitalists reduces efficiency and increases costs.[16] Interestingly, in a study conducted by McMahon et al., they found that reducing team censuses by 50%, resident educational outcomes can be improved.[20] Similar to this study, our study reduced attending workload by 50% with the goal to assess the impact on discharge efficiency rather than educational outcomes. Also similar to that study, we radically altered the operational model in which physicians historically had functioned.[14, 20] Because the rounding structures in both studies reduced patient:provider ratios we believe that our model will successfully balance education, patient quality, and productivity.
LSS, when thoughtfully applied to the problems we face, could be part of the solution. It delivers quick results without large capital investments, by identifying and implementing high‐leverage changes that value a creative solution before a capital investment. One of the strengths of this model is that it does not require substantial financial investment to produce these outcomes. Because the morning clinical loads were more evenly distributed during the busiest months of the year, our division members were able to engage in nonclinical duties and teaching sessions, both of which often required afternoon commitments, but permitted us to balance work and professional achievement (Figure 1B). Finally, as part of any new process, one must consider the factors that influence its sustainability: provider level satisfaction, impact of the process change, and remuneration. Because the intervention reduced lost referrals, the departmental and institutional leadership agreed to financially incentivize the value‐generating potential this intervention had on increasing patient access by facilitating organizational throughput. Therefore, having met the three aforementioned elements, we believe this model is sustainable.
Although many studies remain results focused with aims at documenting how hospital processes fail when overburdened, our study takes a novel process‐focused approach to look at how processes can excel during periods of high demands, simply by reallocating existing resources.
Medicine is in the midst of multiple paradigm shifts involving resident work hour reduction, public safety reporting, reimbursement constraints, and value‐driven care, to name a few. Whether we take a resident or patient‐centered approach, it seems highly unlikely that the current approaches will meet these demands without making significant changes in how we deliver care. Next steps should include construction of a value stream map (VSM), with the input of all of the process stakeholders, that diagrams the entire discharge process. The VSM should highlight all nonvalue adding steps and eliminate them. They are likely a contributing cause to the disproportionate reduction in time of discharge order entry (200 minutes) versus actual discharge (93 minutes) seen in our study. Future work needs to establish the generalizability and sustainability of this model across other hospital service lines. Future studies should establish if this model has sustained impact on patient, provider, and resident satisfaction and overall system efficiency (ED boarding), with aims to quantify the revenue generating potential that occurs through waste elimination.
We close with the following thought: [T]o ask people to make different decisions without fundamentally changing the equation presented to them is wrong. If we wish to change the types of decisions our people make, we owe it to them to design and build processes that will put them in a position to succeed.[21]
Acknowledgements
The authors recognize the contributions made by members of the Division of Pediatric Hospital Medicine at PSHCH, without which this project would not have been possible. They are: Drs. Marta Biderman, Anika Kumar, Margaret Mikula, Chris O'Hara, Brandon Smith, and Ron Williams, and Heidi Wolf, and Lyndsay Gardener, CRNP. This project would not have been possible without the help from Brenda Ruhl, Manjula Narasimhan, and Heather Boyle from the Department of Logistics. Finally, the authors would like to thank the following for their thoughtful reviews of this manuscript: Drs. Lisa Scalzi, Barbara Ostrov, Jed Gonzalo, Chris Sciamanna, and Matt Wain.
Disclosures: Nothing to report.
- . Theory of constraints—a review of the philosophy and its applications. Int J Oper Prod Man. 1998;18(4):336–355.
- , , , et al. Use of lean and six sigma methodology to improve operating room efficiency in a high‐volume tertiary‐care academic medical center. J Am Coll Surg. 2011;213(1):83–92; discussion 93–84.
- , . The promise of Lean in health care. Mayo Clin Proc. 2013;88(1):74–82.
- , , . Assessing the evidence of Six Sigma and Lean in the health care industry. Qual Manag Health Care. 2010;19(3):211–225.
- , , , et al. Redesigning care at the Flinders Medical Centre: clinical process redesign using “lean thinking”. Med J Aust. 2008;188(6 suppl):S27–S31.
- , , , , . Impact of 5 years of lean six sigma in a University Medical Center. Qual Manag Health Care. 2012;21(4):262–268.
- , , , et al. A Lean Six Sigma quality improvement project to increase discharge paperwork completeness for admission to a comprehensive integrated inpatient rehabilitation program. Am J Med Qual. 2013;28(4):301–307.
- . How to compare Six Sigma, lean and the theory of constraints—a framework for choosing what's best for your organization. Qual Prog. 2002;35(3):73–78.
- , , , , . Application of lean manufacturing techniques in the Emergency Department. J Emerg Med. 2009;37(2):177–182.
- . Lean Hospitals: Improving Quality, Patient Safety, and Employee Engagement. 2nd ed. New York, NY: Productivity Press/Taylor 2012.
- , , , , , . The relationship between inpatient discharge timing and emergency department boarding. J Emerg Med. 2012;42(2):186–196.
- , , , . Unravelling relationships: Hospital occupancy levels, discharge timing and emergency department access block. Emerg Med Aust. 2012;24(5):510–517.
- . Need to speed up discharges? The pros and cons of putting discharges on the clock. Today's Hospitalist. 2013. Accessed November 2014. Available at: http://www.todayshospitalist.com/index.php?b=articles_read3(2):144–150.
- , . Hospitalist staffing requirements. Eff Clin Pract. 1999;2(3):126–130.
- , , , , . Effect of hospitalist workload on the quality and efficiency of care. JAMA Intern Med. 2014;174(5):786–793.
- . Accelerating Lean Six Sigma Results: How to Achieve Improvement Excellence in the New Economy. Plantation, FL: J. Ross Publishing; 2011.
- . “Virtual bed capacity” may offer revenue boost for hospitals. Healthcare Finance. Accessed October 2014. Available at: http://www.healthcarefinancenews.com/blog/virtual‐bed‐capacity‐may‐offer‐revenue‐boost‐hospitals. Published November 30, 2011.
- Institute of Medicine. Committee on Quality of Health Care in America. Crossing the Quality Chasm: A New Health System for the 21st Century. Washington, DC: National Academy Press; 2001.
- , , , , . Evaluation of a redesign initiative in an internal‐medicine residency. N Engl J Med. 2010;362(14):1304–1311.
- John Kim and Associates website. Available at: http://www.johnkimconsulting.com. Accessed June 2014.
© 2014 Society of Hospital Medicine
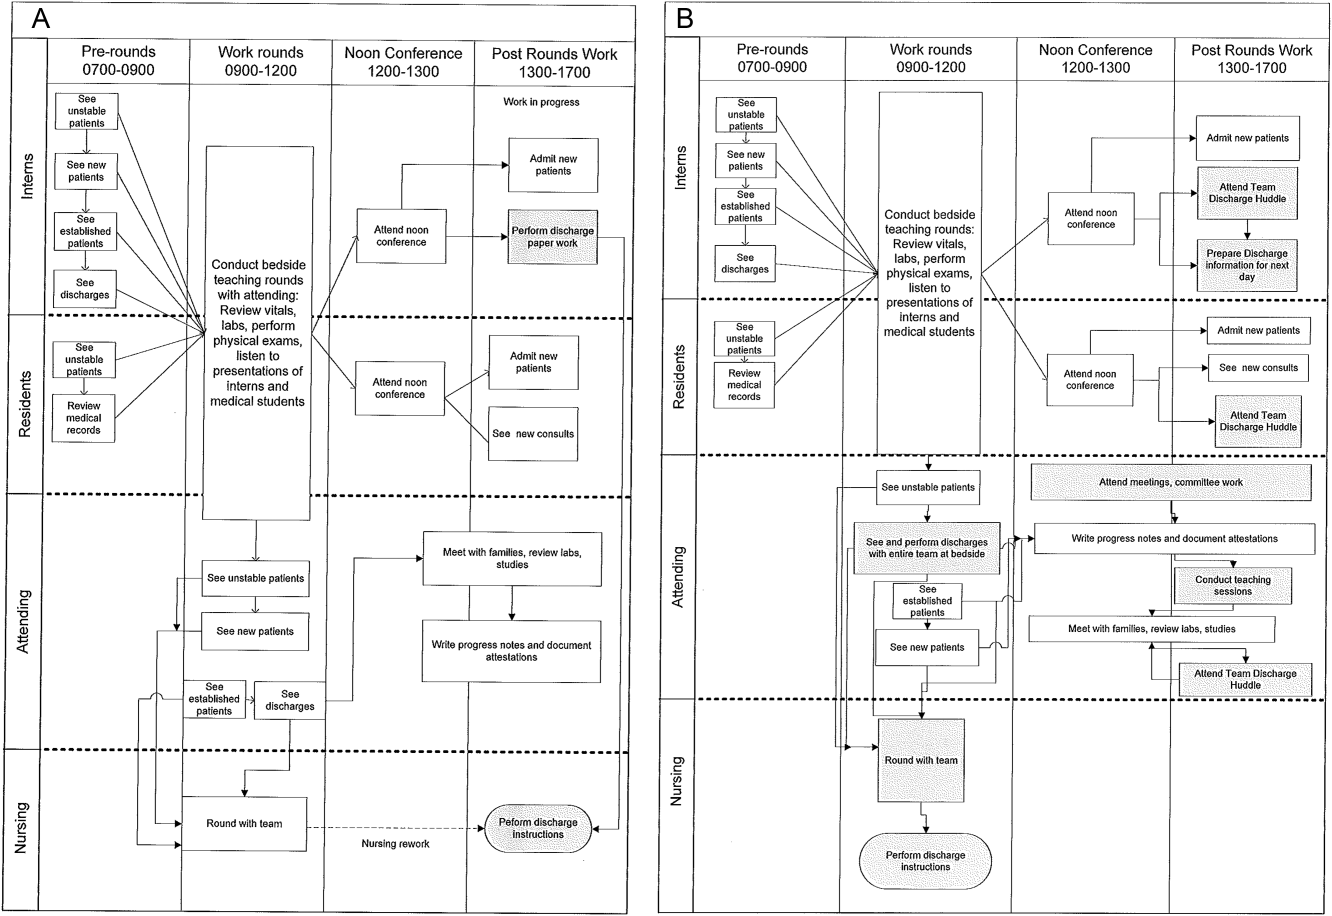
Ofatumumab maintenance halves risk of progression in relapsed CLL
SAN FRANCISCO – Ofatumumab maintenance therapy nearly doubled progression-free survival in patients with relapsed CLL, according to a preplanned interim analysis of the phase III PROLONG study.
At a median follow-up of 19.1 months, progression-free survival was 15.2 months with the standard approach of observation alone and 29.4 months with maintenance ofatumumab (Hazard ratio, 0.50; P < .0001).
Ofatumumab (Arzerra) also significantly increased the median time to next treatment from 31.1 months to 38 months (HR, 0.66; P = .0108), Dr. Marinus van Oers reported at the annual meeting of the American Society of Hematology.
The benefit in progression-free survival (PFS) with maintenance was “statistically significant and clinical relevant” and was present in all subgroups, he said. It was independent of age, gender, number and type of prior treatment, minimal residual disease status at study entry, and “response at study entry, although we have the impression that it’s more effective in patients on PR [partial response] than in patients on CR [complete response],” he added.
The rationale for the trial lies in the fact that despite recent advances, there is still no curative treatment for chronic lymphocytic leukemia (CLL). Ofatumumab, a type 1 CD20 monoclonal antibody, has a role as maintenance in follicular lymphoma (FL), which shares similarities in biological behavior with CLL. This role is debated, but a recent meta-analysis shows ofatumumab maintenance prolongs PFS and tends to prolong overall survival in relapsed patients with FL, Dr. van Oers of the Academic Medical Center in Amsterdam, The Netherlands, observed.
PROLONG randomized 474 patients with relapsed CLL to observation or ofatumumab 300 mg in week 1 and 1,000 mg in week 2, and every 8 weeks for 2 years. All patients were in second or third remission and within 3 months of response assessment after the last reinduction treatment. Patients with refractory disease or prior maintenance therapy or stem cell transplantation were excluded.
At baseline, the median age was about 65 years, 70% had at least two prior treatments, 80% were in partial remission from their last CLL treatment, and less than 10% had poor-risk cytogenetics 11p or 17p deletions. At the time of the analysis, 25% of patients had received all 13 cycles of ofatumumab.
Adverse events of any grade were increased with the addition of ofatumumab versus placebo (86% vs. 72%; P < .0001). Sixty percent were related to study treatment, but none resulted in study withdrawal, Dr. van Oers said. In all, 17 patients on the experimental arm dropped out due to physician decision or patient wish.
Among grade 3 events, neutropenia was significantly increased with maintenance therapy versus placebo (24% vs. 10%; P < .0001) and there was a non-significant increase in infections (13% vs. 8%). Five deaths occurred in the observation arm and two in the ofatumumab arm, one due to sepsis two months after the end of treatment and the other due to unrelated GI obstruction.
Median overall survival has not been reached for either arm (HR, 0.85; P = .487), he reported on behalf of HOVON and the NORDIC CLL group, co-developers of the study.
AT ASH 2014
Key clinical point: Maintenance ofatumumab cuts the risk of progression in half among patients with relapsed CLL.
Major finding: Progression-free survival was 15.2 months with observation alone and 29.4 months with maintenance ofatumumab (Hazard ratio, 0.50; P < .0001).
Data source: Randomized phase III trial in 474 patients with relapsed CLL.
Disclosures: GlaxoSmithKline sponsored the study. Dr. van Oers reported having no financial disclosures.
Brentuximab changes landscape for post-transplant Hodgkin’s lymphoma patients
SAN FRANCISCO – Early post-transplant brentuximab vedotin dramatically slows Hodgkin’s lymphoma progression in patients at high risk for relapse or progression, the phase III AETHERA study shows.
After a median follow-up of about 28 months, the primary end point of progression-free survival (PFS) per independent review increased from a median of 24 months with placebo and best supportive care (BSC) to 43 months with brentuximab and BSC (Hazard ratio, 0.57; P = .001).
Per investigator assessment, median PFS was 16 months with placebo and had not been reached with brentuximab (HR, 0.50),Dr. Craig Moskowitz reported at the annual meeting of the American Society of Hematology.

The benefit of brentuximab maintenance was consistent across every subgroup. Historically, roughly half of patients who undergo an autologous stem cell transplant will relapse.
“Once this study is published, in patients who met eligibility criteria to be on this study - and once again I’ll remind you that’s remission duration less than one year, disease outside the lymph node system, or primary refractory disease - in my opinion, this will be the standard of care,” Dr. Moskowitz said during a press briefing.
Brentuximab, an anti-CD30 antibody conjugate, is already approved in the U.S. for the management of Hodgkin’s lymphoma (HL) after failure of autologous stem cell transplantation (ASCT) or at least two prior lines of multi-agent chemotherapy in patients ineligible for ASCT.
Brentuximab is also indicated for systemic anaplastic large cell lymphoma after failure of at least one multi-agent chemotherapy regimen.
In September it was announced that AETHERA met its primary end point, but this was the first full look at the absolute survival rates and safety data.
The 2-year PFS rate for the brentuximab and placebo groups is now 63% vs. 51% per independent review and 65% vs. 45% per investigator.
“The bottom line is there’s a 20% difference in progression-free survival at 2 years upon investigator review. This has never been seen in patients with relapsed, refractory lymphoma, let alone Hodgkin lymphoma,” Dr. Moskowitz, clinical director of hematology oncology at Memorial Sloan-Kettering Cancer Center in New York City, said.
Overall survival data are immature, but was the same in both groups at 2 years (P = .62). The likelihood of showing a survival difference was not expected because 85% of patients who relapsed on the placebo arm crossed over to brentuximab, as allowed per protocol, and it’s known that brentuximab alone in auto-transplant failures improves outcomes by at least a year, he said. Also, twice as many patients who failed placebo received a second transplant.
Dr. Moskowitz stressed that nearly every patient in the trial had at least three risk factors that would place them at high risk of treatment failure and that studies have shown that for patients with this many risk factors, the chance of being cured by an auto-transplant is about 25%. The risk factors are: relapsed less than 12 months or refractory to frontline therapy, best response of partial remission or stable disease to most recent salvage therapy, extranodal disease at pre-ASCT relapse, B symptoms at pre-ASCT relapse, or two or more prior salvage therapies.
Press briefing moderator Dr. Brad Kahl of the University of Wisconsin-Madison, said Aethera is the first study to show a significant benefit for a post-transplant strategy.
“The biggest question in my mind is whether the application of maintenance brentuximab vedotin is just delaying the inevitable relapse, so the patients will still relapse, just later, or has the brentuximab taken patients who are destined to relapse and turned them into a cured patient,” Dr. Kahl said. “We don’t know the answer to that question. That will become apparent with more time.”
Dr. Moscowitz observed that relapses almost never happen after two year, adding, “So if you’re in remission at two years after stem cell transplantation for Hodgkin lymphoma, you are likely to be cured.”
AETHERA enrolled 329 patients with Hodgkin’s lymphoma and randomly assigned them after ASCT to brentuximab vedotin 1.8 mg/kg or placebo given every 3 weeks for up to 16 cycles, plus BSC. All patients were required to have achieved a complete response, partial remission, or stable disease to salvage therapy prior to ASCT. Their median age was 32 years and 53% were male.
Roughly 60% were refractory to upfront therapy, 43% in the brentuximab arm and 48% of controls had received 2 or more prior systemic therapies, and a third in each arm had extranodal involvement.
Consolidation therapy with brentuximab was generally well tolerated, Dr. Moskowitz said. Peripheral sensory neuropathy was the most common side effect, experienced at any grade in 67% on brentuximab vs. 19% of controls and at grade 3 in 13% vs. 1%. There were no grade 4 events and 85% of patients had resolution or improvement with dose reductions or stopping the drug.
Other adverse events in the brentuximab and control groups were neutropenia (35% vs. 12%), upper respiratory tract infections (26% vs. 23%), and fatigue (24% vs. 18%). Two patients died within 40 days of dosing with brentuximab, one from treatment-related acute respiratory distress syndrome associated with pneumonitis and one following an episode of treatment-related acute pancreatitis that had resolved at the time of death, he reported.
Based on the results, study sponsor Seattle Genetics is expected to seek approval for brentuximab in this consolidation setting in the first half of 2015, according to a statement from the company. The ongoing phase III ECHELON-1 and ECHELON 2 trials in HL and mature T-cell lymphomas are looking at the use of brentuximab in frontline disease.
SAN FRANCISCO – Early post-transplant brentuximab vedotin dramatically slows Hodgkin’s lymphoma progression in patients at high risk for relapse or progression, the phase III AETHERA study shows.
After a median follow-up of about 28 months, the primary end point of progression-free survival (PFS) per independent review increased from a median of 24 months with placebo and best supportive care (BSC) to 43 months with brentuximab and BSC (Hazard ratio, 0.57; P = .001).
Per investigator assessment, median PFS was 16 months with placebo and had not been reached with brentuximab (HR, 0.50),Dr. Craig Moskowitz reported at the annual meeting of the American Society of Hematology.
The benefit of brentuximab maintenance was consistent across every subgroup. Historically, roughly half of patients who undergo an autologous stem cell transplant will relapse.
“Once this study is published, in patients who met eligibility criteria to be on this study - and once again I’ll remind you that’s remission duration less than one year, disease outside the lymph node system, or primary refractory disease - in my opinion, this will be the standard of care,” Dr. Moskowitz said during a press briefing.
Brentuximab, an anti-CD30 antibody conjugate, is already approved in the U.S. for the management of Hodgkin’s lymphoma (HL) after failure of autologous stem cell transplantation (ASCT) or at least two prior lines of multi-agent chemotherapy in patients ineligible for ASCT.
Brentuximab is also indicated for systemic anaplastic large cell lymphoma after failure of at least one multi-agent chemotherapy regimen.
In September it was announced that AETHERA met its primary end point, but this was the first full look at the absolute survival rates and safety data.
The 2-year PFS rate for the brentuximab and placebo groups is now 63% vs. 51% per independent review and 65% vs. 45% per investigator.
“The bottom line is there’s a 20% difference in progression-free survival at 2 years upon investigator review. This has never been seen in patients with relapsed, refractory lymphoma, let alone Hodgkin lymphoma,” Dr. Moskowitz, clinical director of hematology oncology at Memorial Sloan-Kettering Cancer Center in New York City, said.
Overall survival data are immature, but was the same in both groups at 2 years (P = .62). The likelihood of showing a survival difference was not expected because 85% of patients who relapsed on the placebo arm crossed over to brentuximab, as allowed per protocol, and it’s known that brentuximab alone in auto-transplant failures improves outcomes by at least a year, he said. Also, twice as many patients who failed placebo received a second transplant.
Dr. Moskowitz stressed that nearly every patient in the trial had at least three risk factors that would place them at high risk of treatment failure and that studies have shown that for patients with this many risk factors, the chance of being cured by an auto-transplant is about 25%. The risk factors are: relapsed less than 12 months or refractory to frontline therapy, best response of partial remission or stable disease to most recent salvage therapy, extranodal disease at pre-ASCT relapse, B symptoms at pre-ASCT relapse, or two or more prior salvage therapies.
Press briefing moderator Dr. Brad Kahl of the University of Wisconsin-Madison, said Aethera is the first study to show a significant benefit for a post-transplant strategy.
“The biggest question in my mind is whether the application of maintenance brentuximab vedotin is just delaying the inevitable relapse, so the patients will still relapse, just later, or has the brentuximab taken patients who are destined to relapse and turned them into a cured patient,” Dr. Kahl said. “We don’t know the answer to that question. That will become apparent with more time.”
Dr. Moscowitz observed that relapses almost never happen after two year, adding, “So if you’re in remission at two years after stem cell transplantation for Hodgkin lymphoma, you are likely to be cured.”
AETHERA enrolled 329 patients with Hodgkin’s lymphoma and randomly assigned them after ASCT to brentuximab vedotin 1.8 mg/kg or placebo given every 3 weeks for up to 16 cycles, plus BSC. All patients were required to have achieved a complete response, partial remission, or stable disease to salvage therapy prior to ASCT. Their median age was 32 years and 53% were male.
Roughly 60% were refractory to upfront therapy, 43% in the brentuximab arm and 48% of controls had received 2 or more prior systemic therapies, and a third in each arm had extranodal involvement.
Consolidation therapy with brentuximab was generally well tolerated, Dr. Moskowitz said. Peripheral sensory neuropathy was the most common side effect, experienced at any grade in 67% on brentuximab vs. 19% of controls and at grade 3 in 13% vs. 1%. There were no grade 4 events and 85% of patients had resolution or improvement with dose reductions or stopping the drug.
Other adverse events in the brentuximab and control groups were neutropenia (35% vs. 12%), upper respiratory tract infections (26% vs. 23%), and fatigue (24% vs. 18%). Two patients died within 40 days of dosing with brentuximab, one from treatment-related acute respiratory distress syndrome associated with pneumonitis and one following an episode of treatment-related acute pancreatitis that had resolved at the time of death, he reported.
Based on the results, study sponsor Seattle Genetics is expected to seek approval for brentuximab in this consolidation setting in the first half of 2015, according to a statement from the company. The ongoing phase III ECHELON-1 and ECHELON 2 trials in HL and mature T-cell lymphomas are looking at the use of brentuximab in frontline disease.
AT ASH 2014
Key clinical point: Brentuximab vedotin given immediately post-transplant significantly improves progression-free survival in patients with Hodgkin’s lymphoma at high risk for progression.
Major finding: Median progression-free survival per independent review was 24 months with placebo vs. 43 months with brentuximab (HR, 0.57; P = .001).
Data source: Randomized, double-blind, phase III study in 329 patients with Hodgkin’s lymphoma.
Disclosures: Seattle Genetics sponsored the study. Dr. Moskowitz reported research funding from Genentech and Merck, and research funding from and consultancy for Seattle Genetics. Several co-authors reported financial ties with industry, including employment with or equity ownership in Seattle Genetics.
Ultrasound bests elastography for specificity of thyroid cancer diagnosis
CORONADO, CALIF.– Compared with elastography, ultrasound predictors of malignancy were more specific for presurgical diagnosis and in differentiating between benign and malignant thyroid nodules, results from a pooled analysis showed.
“Elastography is controversial,” Dr. Parisha Bhatia said in an interview during the annual meeting of the American Thyroid Association. “Some studies have reported that it has better sensitivity and specificity, compared with conventional ultrasound, but others have found it not to be helpful.”

In an effort to compare the efficacy of elastography and ultrasound in determining benign and malignant thyroid nodules, and to determine if elastography has a complementary role to fine needle aspiration (FNA), Dr. Bhatia and her associates searched Embase and PubMed databases for articles involving more than 50 nodules using specimen histology as the reference standard. They discovered 14 prospective studies and organized them into one of two groups. Group 1 included nodules with FNA cytology–proven “benign/malignant” result. Group 2 included nodules with FNA cytology as “intermediate.” The elasticity score was compared with ultrasound features such as taller than wide, irregular margins, internal vascularity, calcification, and absence of halo to determine validity measures and likelihood ratios.
Dr. Bhatia, an endocrine surgeon at Tulane University, New Orleans, reported on findings from 2,732 nodules in the pooled analysis. Of these, 64% were benign, 25% were malignant, and 11% were indeterminate.
In group 1, elastography showed a sensitivity of 75%, a specificity of 80%, a positive predictive value (PPV) of 61%, a negative predictive value (NPV) of 89%, and a likelihood ratio of 5.7, with a higher predictive value for nodules smaller than 1 cm in diameter (PPV of 79% and NPV of 83%). The strongest ultrasound-related predictor of malignancies was “taller than wide” (a specificity of 92%, a NPV of 51%, yet a sensitivity of only 24%), followed by irregular margins (a specificity of 91%, sensitivity of 48%, and a PPV of 64%). Combination of elastography and ultrasound had the highest sensitivity (96%) and NPV (96%), yet lower specificity (46%) and PPV (46%).
In group 2, elastography yielded a higher sensitivity (90%) and NPV (92%), while ultrasound features were highly specific, with the highest values for “taller than wide” shape (85%) in these thyroid nodules.
“Ultrasound predictors of malignancy prove to be more specific for presurgical diagnosis and differentiation of benign and malignant thyroid nodules,” the researchers wrote in their abstract. “When used as an adjunct, the higher sensitivity and NPV of combination of both the techniques can lead to better selection of candidates for FNA.”
Dr. Bhatia acknowledged certain limitations of the study, including the fact that the pooled data contained little information on indeterminate thyroid nodules. She reported having no financial disclosures.
On Twitter @dougbrunk
CORONADO, CALIF.– Compared with elastography, ultrasound predictors of malignancy were more specific for presurgical diagnosis and in differentiating between benign and malignant thyroid nodules, results from a pooled analysis showed.
“Elastography is controversial,” Dr. Parisha Bhatia said in an interview during the annual meeting of the American Thyroid Association. “Some studies have reported that it has better sensitivity and specificity, compared with conventional ultrasound, but others have found it not to be helpful.”
In an effort to compare the efficacy of elastography and ultrasound in determining benign and malignant thyroid nodules, and to determine if elastography has a complementary role to fine needle aspiration (FNA), Dr. Bhatia and her associates searched Embase and PubMed databases for articles involving more than 50 nodules using specimen histology as the reference standard. They discovered 14 prospective studies and organized them into one of two groups. Group 1 included nodules with FNA cytology–proven “benign/malignant” result. Group 2 included nodules with FNA cytology as “intermediate.” The elasticity score was compared with ultrasound features such as taller than wide, irregular margins, internal vascularity, calcification, and absence of halo to determine validity measures and likelihood ratios.
Dr. Bhatia, an endocrine surgeon at Tulane University, New Orleans, reported on findings from 2,732 nodules in the pooled analysis. Of these, 64% were benign, 25% were malignant, and 11% were indeterminate.
In group 1, elastography showed a sensitivity of 75%, a specificity of 80%, a positive predictive value (PPV) of 61%, a negative predictive value (NPV) of 89%, and a likelihood ratio of 5.7, with a higher predictive value for nodules smaller than 1 cm in diameter (PPV of 79% and NPV of 83%). The strongest ultrasound-related predictor of malignancies was “taller than wide” (a specificity of 92%, a NPV of 51%, yet a sensitivity of only 24%), followed by irregular margins (a specificity of 91%, sensitivity of 48%, and a PPV of 64%). Combination of elastography and ultrasound had the highest sensitivity (96%) and NPV (96%), yet lower specificity (46%) and PPV (46%).
In group 2, elastography yielded a higher sensitivity (90%) and NPV (92%), while ultrasound features were highly specific, with the highest values for “taller than wide” shape (85%) in these thyroid nodules.
“Ultrasound predictors of malignancy prove to be more specific for presurgical diagnosis and differentiation of benign and malignant thyroid nodules,” the researchers wrote in their abstract. “When used as an adjunct, the higher sensitivity and NPV of combination of both the techniques can lead to better selection of candidates for FNA.”
Dr. Bhatia acknowledged certain limitations of the study, including the fact that the pooled data contained little information on indeterminate thyroid nodules. She reported having no financial disclosures.
On Twitter @dougbrunk
AT THE ATA ANNUAL MEETING
Key clinical point: Ultrasound is more specific than elastography in helping clinicians make a presurgical diagnosis of thyroid cancer.
Major finding: Compared with elastography, ultrasound was more specific in presurgical diagnosis and in differentiating between benign and malignant thyroid nodules (specificity of 92% vs. 80%, respectively).
Data source: A pooled analysis of 14 prospective studies involving findings from 2,732 thyroid nodules.
Disclosures: Dr. Bhatia reported having no financial disclosures.

Children don’t have to belong to the clean plate club
It’s a scene you’re all too familiar with – you’ve gone to a lot of trouble to give your children a well-prepared and nutritious meal, but a lot of it never leaves the plate. It’s frustrating, and you worry about their health, but according to the Cornell Food and Brand Lab, this is not unusual behavior.
When an adult serves him or herself food, it almost all gets eaten, according to a study from Brian Wansink, Ph.D., director of the Cornell Food and Brand Lab in Ithaca, N.Y., with the average adult eating 92% of the food served. However, the same study also found that children eat only about 60% of the food they serve to themselves, indicating a broad difference in how adults and children approach food.

Adults know what they like, and if they try something new, they might only take a little bit in case they don’t like it. Children tend not to fully understand their limits and may take a lot of something they’ve never had before because it looks appetizing, try it, realize they don’t like it, and not finish it. “It’s natural, for them to make some mistakes and take a food they don’t like or to serve too much,” Dr. Wansink said.
Dr. Wansink noted that the children in the study were not eating with their parents, and perhaps they would have eaten more if their parents had been there, but not enough to account for the vast discrepancy between the two groups. Other possible factors in children eating less include uncertainty toward how much will make them full, whether or not they are eating with utensils, the presence of friends, and whether they are introverted or extroverted.
So for all the frustrated parents out there“who want his/her noncooperating children to be vegetable-eating members of the clean plate club,” there is good news in these results. “They show that children who only eat half to two-thirds of the food they serve themselves aren’t being wasteful, belligerent, or disrespectful,” Dr. Wansink concluded. It’s a matter of kids just being kids.
It’s a scene you’re all too familiar with – you’ve gone to a lot of trouble to give your children a well-prepared and nutritious meal, but a lot of it never leaves the plate. It’s frustrating, and you worry about their health, but according to the Cornell Food and Brand Lab, this is not unusual behavior.
When an adult serves him or herself food, it almost all gets eaten, according to a study from Brian Wansink, Ph.D., director of the Cornell Food and Brand Lab in Ithaca, N.Y., with the average adult eating 92% of the food served. However, the same study also found that children eat only about 60% of the food they serve to themselves, indicating a broad difference in how adults and children approach food.
Adults know what they like, and if they try something new, they might only take a little bit in case they don’t like it. Children tend not to fully understand their limits and may take a lot of something they’ve never had before because it looks appetizing, try it, realize they don’t like it, and not finish it. “It’s natural, for them to make some mistakes and take a food they don’t like or to serve too much,” Dr. Wansink said.
Dr. Wansink noted that the children in the study were not eating with their parents, and perhaps they would have eaten more if their parents had been there, but not enough to account for the vast discrepancy between the two groups. Other possible factors in children eating less include uncertainty toward how much will make them full, whether or not they are eating with utensils, the presence of friends, and whether they are introverted or extroverted.
So for all the frustrated parents out there“who want his/her noncooperating children to be vegetable-eating members of the clean plate club,” there is good news in these results. “They show that children who only eat half to two-thirds of the food they serve themselves aren’t being wasteful, belligerent, or disrespectful,” Dr. Wansink concluded. It’s a matter of kids just being kids.

PD-1 checkpoint inhibitors show mettle against relapsed Hodgkin’s lymphoma
SAN FRANCISCO– PD-1 checkpoint inhibitors, which have shown remarkable efficacy against advanced malignant melanoma, appear to hold similar promise in the treatment of relapsed or refractory Hodgkin’s lymphoma, results from two early studies suggest.
In a phase I study, the PD-1 blocking antibody nivolumab produced an 87% response rate in 23 heavily pre-treated patients with relapsed Hodgkin’s lymphoma (HL). In a separate phase Ib study, pembrolizumab, which blocks the PD-1 and PD-2 ligands, produced a 66% overall response rate, 21% complete remission rate, and 86% clinical benefit rate among 29 patients with HL for whom therapy with brentuximab vedotin (Adcetris) had failed.
The studies were presented at a media briefing prior to the presentation of data in oral sessions at the annual meeting of the American Society of Hematology.
“Classical Hodgkin lymphoma appears to be a tumor with genetically determined vulnerability to PD-1 blockade. We hope that PD-1 blockade in the future can become an important part of the treatment of patients with Hodgkin lymphoma,” said Dr. Phillipe Armand from the Dana-Farber Cancer Institute in Boston, an investigator for the nivolumab study.

Evidence from preclinical studies suggests that the Reed-Sternberg malignant cells characteristic of HL may use the PD-1 (programmed death 1) pathway to evade detection by immune cells, as suggested by pathologic studies showing the cells surrounded by an extensive but ineffective infiltrate of inflammatory cells.
“We’ve wondered for a long time how Hodgkin lymphoma could attract such a brisk immune response and yet have this immune response fail to kill the tumor,” he said.
Genetic Achilles heel
Genetic analyses had shown that HL frequently has a mutation that results in amplification of a region on chromosome 9 (9p24.1) which leads to increased expression of PD-1 ligands 1 and 2, and leads to a downregulation or weakening of the immune response. The mutation appears to work through the Janus kinase (JAK)-signal transducer and activator transcription (STAT) signalling. These findings suggested to researchers that classical HL has a genetically driven and, ideally, targetable dependence on the PD-1 pathway for survival, Dr. Armand explained.
To test this idea, he and colleagues studied 23 patients with relapsed or refractory HL that had been heavily pre-treated who were part of an independent expansion cohort of a study of nivolumab in hematologic malignancies. Of these patients, 78% were enrolled after a relapse following autologous stem cell transplantation, and 22% after treatment with brentuximab vedotin had failed.
The patients received nivolumab 3 mg/kg every 2 weeks until they had either a complete response, tumor progression, or excessive side effects. In all, 20 of the 23 patients (87%) had an objective response to the single-agent therapy, including 4 (17%) complete responses and 16 (70%) partial responses. The remaining three patients (13%) had stable disease.
The longest time on study at the data cutoff point was 72 weeks. Among all responders, 60% had a response by 8 weeks of therapy, 48% are ongoing, and 43% of patients are still on treatment.
Drug-related adverse events were reported in 18 patients, most commonly rash and decreased platelet count. Five patients had grade 3 events. There were no drug-related grade 4 events or deaths.
In an editorial accompanying the study, which was also published online in The New England Journal of Medicine, Dr. Mario Sznoll and Dr. Dan L. Longo from the Yale University School of Medicine in New Haven, Connecticut write that “with recent data showing impressive clinical activity of PD-1 or PD-L1 antagonists in subgroups of patients with a variety of different cancers, the critical and foundational role of immune interventions in cancer treatment is no longer deniable,” (NEJM, Dec. 6, 2014 [DOI: 10.1056/NEJMoa1411087]).
Pembrolizumab trial
Dr. Craig H. Moskowitz from Memorial Sloan-Kettering Cancer Center in New York City discussed results of the second study, dubbed KEYNOTE-013 (A Phase Ib Multi-Cohort Trial of MK-3475 in Subjects With Hematologic Malignancies).
In this study, patients with HL who were not transplant eligible or for whom transplant had failed and who either had a relapse or were refractory to therapy with brentuximab vedotin received 19 mg/kg IV infusion of pembrolizumab every 2 weeks until complete response, partial response/stable disease, or disease progression.

Of the 31 patients enrolled, 29 were available for the analysis. As of the data cutoff in November 2014, 6 patients (21%) had achieved a complete remission, and 13 (45%) had a partial response, for an overall response rate of 66%. The median time to response was 12 weeks, and as of the data cutoff 17 of 19 patients had ongoing responses. The median response duration has not yet been reached. An additional 6 patients (21%) had stable disease, leading to an overall clinical benefit rate (responses plus stable disease) of 86%.
The patients generally tolerated the drug well. There were 4 treatment-related adverse events in 3 patients, including axillary pain, hypoxia, joint swelling, and pneumonitis. There were no grade 4 treatment-related events or deaths.
Of the tumor samples evaluable, all expressed PD-L1, supporting the rationale for PD-1 blockade in this population, Dr. Moskowitz said.
The results of both his and Dr. Armand’s study support the continued development of PD-1 inhibitors in various subsets of patients with classical Hodgkin’s lymphoma, he said.
SAN FRANCISCO– PD-1 checkpoint inhibitors, which have shown remarkable efficacy against advanced malignant melanoma, appear to hold similar promise in the treatment of relapsed or refractory Hodgkin’s lymphoma, results from two early studies suggest.
In a phase I study, the PD-1 blocking antibody nivolumab produced an 87% response rate in 23 heavily pre-treated patients with relapsed Hodgkin’s lymphoma (HL). In a separate phase Ib study, pembrolizumab, which blocks the PD-1 and PD-2 ligands, produced a 66% overall response rate, 21% complete remission rate, and 86% clinical benefit rate among 29 patients with HL for whom therapy with brentuximab vedotin (Adcetris) had failed.
The studies were presented at a media briefing prior to the presentation of data in oral sessions at the annual meeting of the American Society of Hematology.
“Classical Hodgkin lymphoma appears to be a tumor with genetically determined vulnerability to PD-1 blockade. We hope that PD-1 blockade in the future can become an important part of the treatment of patients with Hodgkin lymphoma,” said Dr. Phillipe Armand from the Dana-Farber Cancer Institute in Boston, an investigator for the nivolumab study.
Evidence from preclinical studies suggests that the Reed-Sternberg malignant cells characteristic of HL may use the PD-1 (programmed death 1) pathway to evade detection by immune cells, as suggested by pathologic studies showing the cells surrounded by an extensive but ineffective infiltrate of inflammatory cells.
“We’ve wondered for a long time how Hodgkin lymphoma could attract such a brisk immune response and yet have this immune response fail to kill the tumor,” he said.
Genetic Achilles heel
Genetic analyses had shown that HL frequently has a mutation that results in amplification of a region on chromosome 9 (9p24.1) which leads to increased expression of PD-1 ligands 1 and 2, and leads to a downregulation or weakening of the immune response. The mutation appears to work through the Janus kinase (JAK)-signal transducer and activator transcription (STAT) signalling. These findings suggested to researchers that classical HL has a genetically driven and, ideally, targetable dependence on the PD-1 pathway for survival, Dr. Armand explained.
To test this idea, he and colleagues studied 23 patients with relapsed or refractory HL that had been heavily pre-treated who were part of an independent expansion cohort of a study of nivolumab in hematologic malignancies. Of these patients, 78% were enrolled after a relapse following autologous stem cell transplantation, and 22% after treatment with brentuximab vedotin had failed.
The patients received nivolumab 3 mg/kg every 2 weeks until they had either a complete response, tumor progression, or excessive side effects. In all, 20 of the 23 patients (87%) had an objective response to the single-agent therapy, including 4 (17%) complete responses and 16 (70%) partial responses. The remaining three patients (13%) had stable disease.
The longest time on study at the data cutoff point was 72 weeks. Among all responders, 60% had a response by 8 weeks of therapy, 48% are ongoing, and 43% of patients are still on treatment.
Drug-related adverse events were reported in 18 patients, most commonly rash and decreased platelet count. Five patients had grade 3 events. There were no drug-related grade 4 events or deaths.
In an editorial accompanying the study, which was also published online in The New England Journal of Medicine, Dr. Mario Sznoll and Dr. Dan L. Longo from the Yale University School of Medicine in New Haven, Connecticut write that “with recent data showing impressive clinical activity of PD-1 or PD-L1 antagonists in subgroups of patients with a variety of different cancers, the critical and foundational role of immune interventions in cancer treatment is no longer deniable,” (NEJM, Dec. 6, 2014 [DOI: 10.1056/NEJMoa1411087]).
Pembrolizumab trial
Dr. Craig H. Moskowitz from Memorial Sloan-Kettering Cancer Center in New York City discussed results of the second study, dubbed KEYNOTE-013 (A Phase Ib Multi-Cohort Trial of MK-3475 in Subjects With Hematologic Malignancies).
In this study, patients with HL who were not transplant eligible or for whom transplant had failed and who either had a relapse or were refractory to therapy with brentuximab vedotin received 19 mg/kg IV infusion of pembrolizumab every 2 weeks until complete response, partial response/stable disease, or disease progression.
Of the 31 patients enrolled, 29 were available for the analysis. As of the data cutoff in November 2014, 6 patients (21%) had achieved a complete remission, and 13 (45%) had a partial response, for an overall response rate of 66%. The median time to response was 12 weeks, and as of the data cutoff 17 of 19 patients had ongoing responses. The median response duration has not yet been reached. An additional 6 patients (21%) had stable disease, leading to an overall clinical benefit rate (responses plus stable disease) of 86%.
The patients generally tolerated the drug well. There were 4 treatment-related adverse events in 3 patients, including axillary pain, hypoxia, joint swelling, and pneumonitis. There were no grade 4 treatment-related events or deaths.
Of the tumor samples evaluable, all expressed PD-L1, supporting the rationale for PD-1 blockade in this population, Dr. Moskowitz said.
The results of both his and Dr. Armand’s study support the continued development of PD-1 inhibitors in various subsets of patients with classical Hodgkin’s lymphoma, he said.
Key clinical point: PD-1 checkpoint inhibition appears to be an effective strategy against treatment-refractory Hodgkin’s lymphoma.
Major finding: Nivolumab produced an 87% objective response rate and pembrolizumab a 66% response rate in patients with heavily pre-treated Hodgkin’s lymphoma.
Data source: A phase I study with 23 patients and a phase Ib study with 29 patients with relapsed or refractory Hodgkin’s lymphoma.
Disclosures: Dr. Armand’s study is supported by Bristol-Myers Squibb. He reported grant support from Bristol-Myers Squibb during the conduct of the study and personal fees from Merck outside the study. Dr. Moskowitz’ study is supported by Merck. He reported receiving research funding from the company. Dr. Sznol reported personal fees from Bristol-Myers Squibb, Dr. Longo reported no relevant disclosures.

Health Canada approves ibrutinib for CLL

Health Canada recently approved the Bruton tyrosine kinase inhibitor ibrutinib (Imbruvica) for the treatment of chronic lymphocytic leukemia (CLL).
The drug can now be used to treat CLL patients, including those with 17p deletion, who have received at least one prior therapy. It can also be used as frontline treatment in CLL patients with 17p deletion.
Health Canada’s approval of ibrutinib is based on results of the phase 3 RESONATE trial, which were presented at this year’s ASCO and EHA meetings.
The trial included 391 previously treated patients, 127 of whom had 17p deletion. Patients were randomized to receive ibrutinib or the anti-CD20 monoclonal antibody ofatumumab until disease progression or unacceptable toxicity.
The trial was stopped early after a pre-planned interim analysis showed that ibrutinib-treated patients experienced a 78% reduction in the risk of disease progression or death.
At the time of interim analysis, the patients’ median time on study was 9.4 months. The best overall response among evaluable patients was 78% in the ibrutinib arm and 11% in the ofatumumab arm.
Ibrutinib significantly prolonged progression-free and overall survival. The median progression-free survival was 8.1 months in the ofatumumab arm and was not reached in the ibrutinib arm (P<0.0001). The median overall survival was not reached in either arm, but the hazard ratio was 0.434 (P=0.0049).
Of the 127 patients with 17p deletion, those treated with ibrutinib experienced a 75% reduction in the risk of disease progression or death.
Adverse events occurred in 99% of patients in the ibrutinib arm and 98% of those in the ofatumumab arm. Grade 3/4 events occurred in 51% and 39%, respectively.
Atrial fibrillation, bleeding-related events, diarrhea, and arthralgia were more common in the ibrutinib arm. Infusion-related reactions, peripheral sensory neuropathy, urticaria, night sweats, and pruritus were more common in the ofatumumab arm.
Ibrutinib is being developed by Cilag GmbH International (a member of the Janssen Pharmaceutical Companies) and Pharmacyclics, Inc. Janssen will commercialize the drug in Canada, and Janssen affiliates will commercialize it around the world, except in the US, where Pharmacyclics and Janssen Biotech, Inc. co-market it. ![]()
People often dismiss cancer symptoms, survey suggests

Credit: NIH
People could be putting their lives at risk by dismissing potential warning signs of cancer as less serious symptoms, according to a study published in PLOS ONE.
In a survey of about 1700 people, more than half of respondents said they had experienced at least
one red-flag cancer “alarm” symptom—such as persistent, unexplained pain or an unexplained lump—during the previous 3 months, but
only 2% of them thought cancer was a possible cause.
The survey had been sent to people aged 50 and older who were registered with 3 London general practices. The questionnaire listed 17 symptoms, including 10 widely publicized potential cancer warning signs, such as an unexplained cough, bleeding, and a persistent change in bowel or bladder habits.
Cancer was not mentioned, but the survey asked which of the symptoms subjects had experienced, what they thought caused them, if they were concerned that symptoms were serious, and whether they had consulted their doctor.
Of the 1724 subjects who responded, 53% had experienced at least one cancer “alarm” symptom in the previous 3 months.
This included unexplained cough or hoarseness; persistent change in bowel habits; persistent, unexplained pain; persistent change in bladder habits; unexplained lump; a change in the appearance of a mole; a sore that does not heal; unexplained bleeding; unexplained weight loss; and persistent difficulty swallowing.
Persistent cough (20%) and persistent change in bowel habits (18%) were the most common symptoms. Difficulty swallowing and unexplained weight loss (both 4%) were least common.
Overall, subjects appraised the cancer warning “alarm” symptoms as more serious than “non-alarm” symptoms, such as sore throat and feeling tired. Fifty-nine percent of respondents said they contacted a doctor about their “alarm” symptoms.
However, subjects rarely attributed potential signs of cancer to the disease, putting them down to other reasons, such as age, infection, arthritis, piles, and cysts.
“Most people with potential warning symptoms don’t have cancer, but some will, and others may have other diseases that would benefit from early attention,” said study author Katriina Whitaker, PhD, of University College London in the UK.
“That’s why it’s important that these symptoms are checked out, especially if they don’t go away. But people could delay seeing a doctor if they don’t acknowledge cancer as a possible cause. It’s worrying that even the more obvious warning symptoms, such as unexplained lumps or changes to the appearance of a mole, were rarely attributed to cancer, although they are often well recognized in surveys that assess the public’s knowledge of the disease.”
“Even when people thought warning symptoms might be serious, cancer didn’t tend to spring to mind. This might be because people were frightened and reluctant to mention cancer, thought cancer wouldn’t happen to them, or believed other causes were more likely.” ![]()
Rivaroxaban matches warfarin’s total Afib costs
CHICAGO – Patients with atrial fibrillation who start treatment with a new oral anticoagulant may spend more on their medication than if they were prescribed generic warfarin, but their overall health care costs may wind up being about the same, based on an analysis of health care expense records for more than 4,500 U.S. patients.
“Despite higher anticoagulant costs, total all-cause and atrial fibrillation–related costs remain comparable” between patients prescribed warfarin and those who received the new oral anticoagulant rivaroxaban (Xarelto), said Concetta Crivera, Pharm.D., at the American Heart Association Scientific Sessions. Higher drug costs for daily treatment with rivaroxaban were offset by reduced hospital lengths of stays and hence reduced hospitalization costs, said Dr. Crivera, director of cardiovascular health economics and outcomes research at Janssen in Raritan, N.J., the company that markets rivaroxaban along with Bayer.
“I can believe that hospitalized days would be reduced because patients treated with rivaroxaban or any of the other new oral anticoagulants don’t need to remain in the hospital while you wait for their international normalized ratio to enter the therapeutic range,” which is what happens with patients treated with warfarin, commented Dr. Jeffrey Weitz, professor of medicine and director of the Juravinski Hospital and Cancer Centre of McMaster University in Hamilton, Ont.
The new findings by Dr. Crivera “are not definitive on their own, but they add to a growing body of data that indicate that all the new oral anticoagulants are cost effective,” said Dr. Weitz, who specializes in thrombosis and anticoagulants. “The worst time for a patient on warfarin is when they start treatment. You do a disservice to patients with new-onset atrial fibrillation by using warfarin, because some patients will get into the therapeutic range but others never will. That’s why the new oral anticoagulants are better, because everybody gets into therapeutic range,” he said in an interview.
Dr. Crivera and her associates conducted a retrospective study of health records for 2,253 patients with nonvalvular atrial fibrillation (AF) who started anticoagulation treatment with rivaroxaban during the period of November 2011 (when the drug received U.S. marketing approval) through December 2012. The data came from the patient records of Humana, a U.S. HMO and insurer that covers both commercially insured patients and those covered by Medicare. The researchers matched each of the patients initiating rivaroxaban treatment with a similar patient from the Humana database with nonvalvular AF who started on warfarin during the same period. The average age of patients in the study was about 74 years, and patients in the two groups were closely matched for their demographic and clinical characteristics, including comorbidities. Data on health care use were available for patients for an average of about 4 months following their start of anticoagulant treatment.
The analysis showed that during the first months on treatment, patients prescribed rivaroxaban averaged 2.11 days of hospitalization for an AF-related episode, compared with 3.02 days for those prescribed warfarin, a statistically significant difference. Hospitalizations for any cause averaged a total of 2.71 days in the rivaroxaban group and 3.87 days in the patients on warfarin, also a significant difference, Dr. Crivera reported.
This difference in days hospitalized translated into reduced hospitalization costs, a roughly $2,000 average difference per patient in actual hospitalization costs in favor of the rivaroxaban patients for all-cause hospitalizations, and an average $1,300 difference per patient for hospitalization costs directly related to AF.
Although the rivaroxaban patients spent an average of $2,700 more per patient on pharmaceuticals for all causes, and an average $2,200 more for AF-related drugs, the total average all-cause and AF-related costs for drugs, hospitalizations, outpatient visits, and emergency department visits were similar in the two subgroups: an average total of $17,590 per patient for the rivaroxaban patients and $18,676 for warfarin patients for all causes, and an average of $7,394 for the rivaroxaban patients and $7,319 for those on warfarin for AF-related care. The between-group differences for both sets of total costs were not statistically significant.
The study was sponsored by Janssen, which along with Bayer markets rivaroxaban (Xarelto). Dr. Crivera is a Janssen employee. Dr. Weitz has been an adviser or a consultant to Janssen and Bayer and to Boehringer Ingelheim, Bristol-Myers Squibb, Daiichi Sankyo, Johnson & Johnson, Merck, Pfizer, and Portola.
On Twitter @mitchelzoler
AT THE AHA SCIENTIFIC SESSIONS
Key clinical point: Patients with atrial fibrillation who started on rivaroxaban treatment had total hospitalization and drug costs that were similar to those of patients begun on warfarin.
Major finding: Rivaroxaban-treated patients averaged $17,590 in total all-cause hospitalization and drug costs, compared with $18,676 for warfarin-treated patients.
Data source: A retrospective, matched-cohort study of 4,506 U.S. patients with atrial fibrillation and newly initiated anticoagulant treatment using health records maintained by Humana.
Disclosures: The study was sponsored by Janssen, which along with Bayer markets rivaroxaban (Xarelto). Dr. Crivera is a Janssen employee. Dr. Weitz has been an adviser or a consultant to Janssen and Bayer and to Boehringer Ingelheim, Bristol-Myers Squibb, Daiichi Sankyo, Johnson & Johnson, Merck, Pfizer, and Portola.
