User login
New and Noteworthy Information—November 2014
Researchers found no long-term association of vaccines with multiple sclerosis (MS) or any other CNS demyelinating syndromes, according to a study published online ahead of print October 20 in JAMA Neurology. The investigators examined the relationship between vaccines and MS or other CNS demyelinating syndromes by using data from Kaiser Permanente Southern California members. The study authors identified 780 cases of CNS demyelinating syndromes and 3,885 controls; 92 cases and 459 controls were females between the ages of 9 and 26, which is the indicated age range for human papillomavirus (HPV) vaccination. The researchers found no associations between HepB vaccinations, HPV vaccination, or any vaccination and the risk of MS or CNS demyelinating syndromes for as long as three years later. Vaccination of any type was associated with increased risk of a CNS demyelinating syndrome onset within the first 30 days after vaccination only in patients younger than 50, but this association was not evident after 30 days.
Bariatric surgery is a potential risk factor for spontaneous intracranial hypotension, according to a study published online ahead of print October 22 in Neurology. Researchers compared a group of 338 patients with spontaneous intracranial hypotension to a control group of 245 people with unruptured intracranial aneurysms. Eleven of the 338 (3.3%) people with spontaneous intracranial hypotension had previously had bariatric surgery, compared with two of the 245 (0.8%) people with intracranial aneurysms. Of the 11 people with bariatric surgery and spontaneous intracranial hypotension, nine had no more symptoms after treatment, while symptoms persisted for two. The symptoms started from three months to 20 years after the bariatric surgery, and participants had lost an average of 116 pounds during that time.
Longitudinal measures of cortical atrophy were widely correlated with sleep quality, according to a study published September 9 in Neurology. The study included 147 adults, ages 20 and 84. Researchers examined the link between sleep difficulties, such as having trouble falling asleep or staying asleep at night, and brain volume. All participants underwent two MRI brain scans, an average of 3.5 years apart, before completing a questionnaire about their sleep habits. A total of 35% of the participants met the criteria for poor sleep quality, scoring an average of 8.5 out of 21 points on the sleep assessment. The researchers found that sleep difficulties were linked with a more rapid decline in brain volume during the course of the study in various brain regions, including within frontal, temporal, and parietal areas. The results were more pronounced in people older than 60.
An international group of researchers has established the first standardized guidelines for the collection of blood to test for early Alzheimer’s disease, as reported online ahead of print September 27 in Alzheimer’s & Dementia. These guidelines will be used in research for blood-based biomarkers of Alzheimer’s disease and will ensure that every laboratory is following the same protocol when collecting blood. The lack of readily available biomarkers is a significant hindrance toward progressing to effective therapeutic and preventative strategies for Alzheimer’s disease. Researchers have worked with representatives from the United States, Germany, Australia, England, and other countries to create these standards. “You can create a blood test in the lab, but if you don’t have a systemized way for collecting the blood, the test will never go into practice,” said the investigators.
A new study suggests a cause of amyotrophic lateral sclerosis (ALS), according to a study published online ahead of print October 14 in Proceedings of the National Academy of Sciences. Researchers used advanced biophysical methods to probe how different superoxide dismutase 1(SOD1) gene mutations in a genetic ALS hotspot affect SOD protein stability. Investigators examined how the aggregation dynamics of mutant SOD G93A differed from that of nonmutant SOD. They developed a method for gradually inducing SOD aggregation, which was measured with SAXS, a structural imaging system. The G93-mutant SODs appear to have looser, floppier structures that are more likely to drop their copper ions and are more likely to misfold and stick together in aggregates. “Our work supports a common theme whereby loss of protein stability leads to disease,” investigators said.
Long-term functional outcome and risk of fatal or disabling stroke are similar for stenting and endarterectomy for symptomatic carotid stenosis, according to a study published online ahead of print October 14 in the Lancet. Researchers followed 1,713 patients with carotid artery disease, of whom 855 were assigned to stenting and 858 to endarterectomy, for as long as 10 years. The median follow-up was 4.2 years. Both techniques were found to be equally good at preventing fatal and disabling strokes, but stented patients were slightly more likely to have minor strokes without long-term effects. The risk of any stroke in five years was 15.2% in the stenting group, compared with 9.4% in the endarterectomy group, but the additional strokes were minor and had no impact on long-term quality of life.
Researchers have found Class II evidence that serum metabolite profiles accurately distinguish patients with different subtypes and stages of multiple sclerosis (MS), according to a study published October 21 in Neurology. Investigators obtained serum samples from patients with primary progressive MS, secondary-progressive MS, and relapsing-remitting MS, patients with other neurodegenerative conditions, and from age-matched controls. Samples were analyzed by nuclear magnetic resonance, and partial least squares discriminant analysis models were derived to separate disease groups. The partial least squares discriminant analysis models for serum samples from patients with MS enabled reliable differentiation between relapsing-remitting MS and secondary-progressive MS. This approach identified significant differences between the metabolite profiles of each of the MS groups and the healthy controls, as well as predicting disease group membership with high sensitivity and specificity.
Parkinson’s disease pathogenic mutations have an age-dependent penetrance that could be ameliorated or exacerbated by modifier genes or environmental factors in different populations, according to a study published online ahead of print October 20 in JAMA Neurology. The investigators examined 49 previously published studies that included 709 participants and were found in ISI Web of Science and PubMed. They also analyzed extracted information about the number of mutation carriers within families and sporadic cases worldwide for pathogenic mutations in SNCA, LRRK2, VPS35, EIF4G1, and DNAJC13. The end-of-search date was January 31, 2014. In particular, penetrance of SNCA duplications were comparable to point mutations and driven by inclusion of SNCA p.A53T (mean age at onset, 45.9). Each penetrance estimate was given separately with 95% confidence intervals.
Spreading depolarizations can be measured after traumatic brain injury (TBI) by the placement of EEG electrodes on the scalp, according to a study published online ahead of print August 25 in Annals of Neurology. Eighteen patients requiring surgical treatment for TBI were monitored by invasive electrocorticography (ECoG) and noninvasive scalp EEG during intensive care. Spreading depolarizations were first identified in subdural recordings, and EEGs were then examined visually and quantitatively to identify correlates. A total of 455 spreading depolarizations occurred during 65.9 days of simultaneous ECoG and EEG monitoring. For 179 of 455 events (39%), depolarizations caused temporally isolated, transient depressions of spontaneous EEG amplitudes to 57% (median) of baseline power. For 62 of 179 (35%) events, isolated depressions showed a clear spread of depression between EEG channels with delays of 17 minutes (median).
A diet that includes walnuts may have a beneficial effect on reducing the risk, delaying the onset, and slowing the progression of, or preventing, Alzheimer’s disease, according to a study published October 21 in the Journal of Alzheimer’s Disease. The research group examined the effects of dietary supplementation on mice with 6% or 9% walnuts, which is equivalent to 1 ounce and 1.5 ounces per day, respectively, of walnuts in humans. The investigators found significant improvement in learning skills, memory, reducing anxiety, and motor development in mice fed a walnut-enriched diet. “These findings are very promising and help lay the groundwork for future human studies on walnuts and Alzheimer’s disease,” the investigators said.
Dopamine receptor agonist drugs are associated with impulse control disorders, such as pathologic gambling, hypersexuality, and compulsive shopping, according to a study that was published online ahead of print October 20 in JAMA Internal Medicine. Researchers conducted a retrospective disproportionality analysis that was based on the 2.7 million serious domestic and foreign adverse drug event reports between 2003 and 2012 that were extracted from the FDA Adverse Event Reporting System. The investigators identified 1,580 events indicating impulse control disorders from the United States and 21 other countries (710 for dopamine receptor agonist drugs and 870 for other drugs). The dopamine receptor agonist drugs had a strong signal associated with these impulse control disorders. The association was strongest for the dopamine agonists pramipexole and ropinirole, with preferential affinity for the dopamine D3 receptor. A signal was also seen for aripiprazole.
—Kimberly D. Williams

Cognitive Rest May Be Crucial After Concussion
SAN DIEGO—With all the media attention drawn to the effects of sports-related concussion in recent years, a significant portion of schools in the United States have adopted return-to-play guidelines, but only a minority have return-to-learn protocols in place, according to a physician speaking at the 2014 Annual Meeting of the American Academy of Pediatrics.
Literature on the topic is scarce, but one survey of school nurses in Illinois found that 57% of schools in that state had return-to-play protocols, while 30% had protocols in place for returning to the classroom, said Kelsey Logan, MD, Director of the Division of Sports Medicine at Cincinnati Children’s Hospital Medical Center. A survey of youth in Nebraska who had sustained concussions in sports found that a minority (42%) of their teachers provided extra assistance in the classroom following their injury.
Cognitive Activity Can Prolong Recovery
Limiting cognitive activities “is a big part of their stress in getting over their injury,” said Dr. Logan. “I talk to the families about decreasing their child’s emotional stress, and academics are largely a cause of this. They’re stressed from day one about the work they’re missing.… If we address those [concerns] up front, they tend to be a little less stressed.”
Increasing cognitive activity soon after a concussive injury “worsens symptoms and prolongs recovery,” noted Dr. Logan. “That often takes several conversations with patients and parents before they understand that concept. Many times parents want you to micromanage their kid’s day—tell them exactly what they can and can’t do. That’s not really our role. I cannot predict whether 15 versus 20 minutes of looking on a computer is going to make their symptoms worse. Understanding concepts is important. When you start to experience a big gap in energy and your symptoms get worse, you need to back off. Our goal is to determine the appropriate balance of cognitive activity and cognitive rest.”
Creating a Return-to-Learn Plan
Developing a return-to-learning plan following a concussion starts with an assessment of the patient’s symptoms, which vary from individual to individual. “You can’t predict exactly what a person’s going to go through,” said Dr. Logan, one of the authors of a guideline on return to learning that was published in Pediatrics in 2013. “It’s important to consider physical, cognitive, emotional, and sleep symptoms.... Some patients will have many emotional symptoms after a concussion; others won’t. This is why it’s so important for primary care pediatricians to be treating concussions because they know their patients.”
Dr. Logan recommends that patients and their families use checklists to document symptoms, track their severity and progression, and target symptoms to address with school personnel. The ideal role of family members and friends is to enforce rest and reduce stimulation, while the role of the medical team is to evaluate symptoms, prescribe physical and cognitive rest, and get input from family members and school personnel on the patient’s progress. The chief goal is to help the patient get the most out of the school day without worsening symptoms. This process starts with limitations on school time.
“For an athlete who has a constant headache, I would recommend that she stay out of school until she feels a little bit better,” said Dr. Logan. “There’s not a specific symptom score that she needs to meet to go back to school. It’s when the family and the patient feel that she can go to school and concentrate. You don’t want to throw that athlete back into a full school day right away. You want to start with a few hours of school, maybe a half-day, depending on symptoms.”
The Importance of Rest Breaks
Acutely concussed athletes can only concentrate for 30- to 45-minute blocks of time, added Dr. Logan, so “I like to prescribe rest breaks. I try to get them to recognize that if they go to a hard class like calculus and have to work hard for 45 minutes or so, they’re probably going to be fried for the next period, so there needs to be something a little less onerous like study hall, or lunch, where they can rest. They need to use common sense during the day.”
During office visits, Dr. Logan reviews the school day schedule with patients, “and we try to target different areas where they can feel comfortable to rest. I’m asking their opinion on where the best spots in their day are to get some rest. Because if I just say, ‘you’re going to do this, this, and this, what’s their likelihood of following through with those instructions? It’s really low.”
Reducing the Burden of Schoolwork
Dr. Logan recommends limiting computer time, reading, math, and note-taking during recovery, because each task tends to cause symptoms to worsen. “Having either the teacher’s notes supplied to them or having another student take notes for them may allow them to tolerate more class time than they would if they were trying to take notes,” said Dr. Logan. “Listen to lectures only.” At home, students should perform only activities that don’t exacerbate symptoms. This means limiting instant messaging, texting, watching TV, and playing video games.
A subset of concussed patients are overstimulated by light and sound, “so it’s important to ask about that and make adjustments in the school day,” said Dr. Logan. “This [approach] would involve reducing sound and light when you can and wearing sunglasses and earplugs.”
Dr. Logan recommends delaying tests that may fall in the time line of recovery, such as midterms, finals, or college-readiness tests such as the SAT. “A brain-injured person is not going to do well on any of these tests,” she said. “In notes to school personnel, write ‘no testing for now,’ or ‘postpone testing.’ ”
—Doug Brunk
Suggested Reading
Halstead ME, McAvoy K, Devore CD, et al. Returning to learning following a concussion. Pediatrics. 2013;132(5):948-957.
SAN DIEGO—With all the media attention drawn to the effects of sports-related concussion in recent years, a significant portion of schools in the United States have adopted return-to-play guidelines, but only a minority have return-to-learn protocols in place, according to a physician speaking at the 2014 Annual Meeting of the American Academy of Pediatrics.
Literature on the topic is scarce, but one survey of school nurses in Illinois found that 57% of schools in that state had return-to-play protocols, while 30% had protocols in place for returning to the classroom, said Kelsey Logan, MD, Director of the Division of Sports Medicine at Cincinnati Children’s Hospital Medical Center. A survey of youth in Nebraska who had sustained concussions in sports found that a minority (42%) of their teachers provided extra assistance in the classroom following their injury.
Cognitive Activity Can Prolong Recovery
Limiting cognitive activities “is a big part of their stress in getting over their injury,” said Dr. Logan. “I talk to the families about decreasing their child’s emotional stress, and academics are largely a cause of this. They’re stressed from day one about the work they’re missing.… If we address those [concerns] up front, they tend to be a little less stressed.”
Increasing cognitive activity soon after a concussive injury “worsens symptoms and prolongs recovery,” noted Dr. Logan. “That often takes several conversations with patients and parents before they understand that concept. Many times parents want you to micromanage their kid’s day—tell them exactly what they can and can’t do. That’s not really our role. I cannot predict whether 15 versus 20 minutes of looking on a computer is going to make their symptoms worse. Understanding concepts is important. When you start to experience a big gap in energy and your symptoms get worse, you need to back off. Our goal is to determine the appropriate balance of cognitive activity and cognitive rest.”
Creating a Return-to-Learn Plan
Developing a return-to-learning plan following a concussion starts with an assessment of the patient’s symptoms, which vary from individual to individual. “You can’t predict exactly what a person’s going to go through,” said Dr. Logan, one of the authors of a guideline on return to learning that was published in Pediatrics in 2013. “It’s important to consider physical, cognitive, emotional, and sleep symptoms.... Some patients will have many emotional symptoms after a concussion; others won’t. This is why it’s so important for primary care pediatricians to be treating concussions because they know their patients.”
Dr. Logan recommends that patients and their families use checklists to document symptoms, track their severity and progression, and target symptoms to address with school personnel. The ideal role of family members and friends is to enforce rest and reduce stimulation, while the role of the medical team is to evaluate symptoms, prescribe physical and cognitive rest, and get input from family members and school personnel on the patient’s progress. The chief goal is to help the patient get the most out of the school day without worsening symptoms. This process starts with limitations on school time.
“For an athlete who has a constant headache, I would recommend that she stay out of school until she feels a little bit better,” said Dr. Logan. “There’s not a specific symptom score that she needs to meet to go back to school. It’s when the family and the patient feel that she can go to school and concentrate. You don’t want to throw that athlete back into a full school day right away. You want to start with a few hours of school, maybe a half-day, depending on symptoms.”
The Importance of Rest Breaks
Acutely concussed athletes can only concentrate for 30- to 45-minute blocks of time, added Dr. Logan, so “I like to prescribe rest breaks. I try to get them to recognize that if they go to a hard class like calculus and have to work hard for 45 minutes or so, they’re probably going to be fried for the next period, so there needs to be something a little less onerous like study hall, or lunch, where they can rest. They need to use common sense during the day.”
During office visits, Dr. Logan reviews the school day schedule with patients, “and we try to target different areas where they can feel comfortable to rest. I’m asking their opinion on where the best spots in their day are to get some rest. Because if I just say, ‘you’re going to do this, this, and this, what’s their likelihood of following through with those instructions? It’s really low.”
Reducing the Burden of Schoolwork
Dr. Logan recommends limiting computer time, reading, math, and note-taking during recovery, because each task tends to cause symptoms to worsen. “Having either the teacher’s notes supplied to them or having another student take notes for them may allow them to tolerate more class time than they would if they were trying to take notes,” said Dr. Logan. “Listen to lectures only.” At home, students should perform only activities that don’t exacerbate symptoms. This means limiting instant messaging, texting, watching TV, and playing video games.
A subset of concussed patients are overstimulated by light and sound, “so it’s important to ask about that and make adjustments in the school day,” said Dr. Logan. “This [approach] would involve reducing sound and light when you can and wearing sunglasses and earplugs.”
Dr. Logan recommends delaying tests that may fall in the time line of recovery, such as midterms, finals, or college-readiness tests such as the SAT. “A brain-injured person is not going to do well on any of these tests,” she said. “In notes to school personnel, write ‘no testing for now,’ or ‘postpone testing.’ ”
—Doug Brunk
Suggested Reading
Halstead ME, McAvoy K, Devore CD, et al. Returning to learning following a concussion. Pediatrics. 2013;132(5):948-957.
Suggested Reading
Halstead ME, McAvoy K, Devore CD, et al. Returning to learning following a concussion. Pediatrics. 2013;132(5):948-957.
‘Chemo brain’ may have targetable causes
BOSTON – The risk for cognitive decline following cancer treatment varies by both cancer and therapy types, and can range from subtle changes to severe deficits, according to a researcher.
Patients who are older, have lower cognitive reserves, or have comorbidities such as cardiovascular disease or diabetes are at risk for cognitive problems following cancer treatment, said Tim A. Ahles, Ph.D., director of the Neurocognitive Research Laboratory, Memorial Sloan-Kettering Cancer Center, New York.
“I think it’s important that we identify these modifiable risk factors for intervention, and some of the nonmodifiable risk factors that inform decision making,” he said at the Palliative Care in Oncology Symposium.
“When we talk about cognitive function, we’re really talking about how does cancer and cancer treatment impact on memory, concentration, executive function, or ability to multitask, the speed at which we process information,” he said.
Oncologists have known for decades that brain tumors and their treatment have a negative effect on cognitive function, particularly among children under 5 years of age, whose developing brains are sensitive to treatments such as chemotherapy, surgery, radiation, and high-dose steroids.
There is also a dose-response effect, with high-dose chemotherapy such as ablative regimens used for bone-marrow transplantation being associated with higher probability of cognitive problems.
Dr. Ahles noted that about two-thirds of adult survivors of childhood cancers develop chronic illnesses within 30 years of diagnosis, including cardiac and pulmonary disease, and diabetes and endocrine dysfunction.
“It turns out they’re also at higher risk for cognitive issues,” including white matter abnormalities and microvascular stroke, he said.
The population of survivors of brain tumors and childhood cancers is dwarfed, however, by the large and growing population of breast, colorectal, lung, and prostate cancer patients who are diagnosed every year and exposed to adjuvant therapies, he added.
Aging and cognitive reserve
Evidence from breast cancer studies has shown that about 20%-25% of patients have lower than expected cognitive functioning – based on age, education, occupation, and other factors – before they embark on adjuvant therapy.
“That’s actually a risk factor for posttreatment cognitive decline, so there’s something that’s already going on that’s disrupting the cognitive information-processing system before we even start adjuvant treatment that may be critically important in terms of their outcomes as survivors,” Dr. Ahles said.
A significant subset of women in longitudinal studies of breast cancer survivors – about 15%-30% – experience long-term posttreatment cognitive problems, making it imperative for researchers and clinicians to identify risk factors for persistent cognitive decline, he said.
There is evidence to suggest that cancer treatments may interplay with biologic factors at the cellular level to increase the risk for cognitive loss. For example, aging is associated with reduction in brain volume, decrease in white matter integrity, and decreases in vascularization and neurotransmitter activity.
The effects of age on the brain are attenuated, however, among patients with higher cognitive reserves, defined as a combination of innate and developed cognitive capacity. Cognitive reserve is influenced by a number of factors, including genetics, education, occupational attainment, and lifestyle.
High cognitive reserve has been associated with later onset of Alzheimer’s disease symptoms and smaller changes in cognitive function with normal aging or following a brain injury, Dr. Ahles noted.
In a longitudinal study of cognitive changes associated with adjuvant therapy for breast cancer, Dr. Ahles and colleagues found that both age and pretreatment cognitive reserve were related to posttreatment decline in processing speed in women exposed to chemotherapy, compared with those who did not have chemotherapy or with healthy controls. In addition, chemotherapy had a short-term impact on verbal ability. The authors found evidence to suggest the patterns they saw may be related to the combination of chemotherapy and tamoxifen.
Part of the difficulty of studying cognitive decline among older patients is the higher prevalence of changes associated with aging. Dr. Ahles pointed to a French longitudinal study of women over 65 being treated for breast cancer, in which investigators found that 41% of the study population had cognitive impairment before starting on adjuvant therapy.
Older adults may be more frail, with diminished biological reserves and lower resistance to stressors caused by “cumulative declines across a variety of physiological systems making you more vulnerable to adverse events,” Dr. Ahles said.
Aging and genetics
Genes associated with cognitive aging are also risk factors for posttreatment cognitive decline, notably the genetic variants of APOE, including the epsilon 4 (APOE-e4) allele linked to increased risk for early-onset Alzheimer’s disease.
Dr. Ahles and colleagues had previously shown that APOE-e4 may be a biomarker for increased risk for chemotherapy-induced cognitive decline. The adverse effects of APOE-e4 appear to be mitigated somewhat by smoking, because it may correct for a deficit in nicotinic receptor density and dopamine levels in carriers.
Another genetic factor linked to postchemotherapy cognitive decline is the Val158Met polymorphism of the gene encoding for Catechol-O-methyltransferase (COMT), an enzyme that degrades neurotransmitters such as dopamine. Patients with this polymorphism have rapid dopamine metabolism, resulting in reduced dopamine activity.
These findings point to potential molecular mechanisms for cognitive changes associated with chemotherapy, and suggest that therapies targeted at neurotransmitter systems may ameliorate the effect, Dr. Ahles said.
He noted that animal studies have shown that fluoxetine (Prozac) prevents deficits in behavior and hippocampal function associated with 5-fluourauracil (5-FU), and that nicotine patches have been shown to improve cognitive functioning in patients with mild cognitive impairment.
The symposium was cosponsored by AAHPM, ASCO, ASTRO, and MASCC.
Key clinical point: Cognitive decline following chemotherapy may be an interplay of aging and drug-induced molecular changes.
Major finding: An estimated 20%-25% of women in breast cancer studies have lower than predicted cognitive function before starting chemotherapy.
Data source: Review of evidence on the association between cancer chemotherapy and cognitive decline.
Disclosures: Dr. Ahles’ work is supported by Memorial-Sloan Kettering Cancer Center. He reported having no relevant disclosures.
Air pollution not to blame for childhood leukemia, study suggests

The increased risk of leukemia reported among children born close to overhead power lines is likely not a result of alterations in air pollution, researchers have reported in the Journal of Radiological Protection.
The group found little evidence to support the “corona-ion hypothesis” which has been cited as a possible explanation for the excess of childhood leukemia cases close to high-voltage overhead power lines in the UK prior to the 1980s.
The hypothesis is based on the fact that high-voltage overhead power lines create charged particles in the surrounding air.
These ionized particles, known as corona ions, can be blown away by the wind and attach to air pollutants, such as those from traffic or smoking.
The corona-ion hypothesis suggests these electrically charged pollutants are more likely to be retained in the airways or lungs, and this could lead to serious health effects, including childhood leukemia.
The researchers previously showed that, on average, there has been no increased risk of leukemia among children born near high-voltage power lines in recent decades. However, the same piece of research confirmed an increased risk prior to the 1980s, which has yet to be explained.
To investigate this theory, John Swanson, of National Grid in London, and his colleagues used data from 7347 children in England and Wales who were born and diagnosed with leukemia between 1968 and 2008, and who lived within 600 m of a high-voltage overhead power line.
The researchers calculated the exposure of each of the subjects to corona ions using a model based on: the voltage of the power line; the distance from the line; how the concentration of corona ions varied with distance from the power lines; and, using data from various meteorological stations, the amount of time and speed that wind blew in each direction around the power lines.
The results did not suggest that exposure to corona ions explained the pattern of increased leukemia rates close to high-voltage overhead power lines previously found in earlier decades.
“We found in earlier studies that, for previous decades, childhood leukemia rates were higher near power lines,” said Kathryn Bunch, of the University of Oxford.
“This new paper seems to show that this wasn’t caused by corona ions, but it leaves us still searching for the true cause, and we are undertaking further investigations of the variation in risk over time.” ![]()
New agents challenge role of transplant in high-risk CLL
Credit: Chad McNeeley
NEW YORK—The role of allogeneic hematopoietic stem cell transplant (HSCT) for patients with high-risk chronic lymphocytic leukemia (CLL) is changing in the age of targeted therapy.
While allogeneic HSCT has been considered standard treatment for these patients, the question arises whether it will maintain its position in the era “of all these wonderful new drugs,” said David Maloney, MD, PhD, of the Fred Hutchinson Cancer Research Center in Seattle, Washington.
Dr Maloney undertook to convince the audience at the Lymphoma & Myeloma 2014 congress that there is still a role for allogeneic transplant in CLL patients.
He noted that early allogeneic transplant trials used myeloablative conditioning regimens, which were “prohibitively toxic.” They have now given way to reduced-intensity regimens.
“But the breakthrough came about when it was realized that the reason that allogeneic transplant could cure patients with CLL had really nothing to do with their conditioning regimen . . . ,” he said. “[I]t was probably the donor T cells providing immunologic activity and graft-vs-host activity that was actually able to provide graft-vs-tumor activity and cure patients.”
Seattle regimen
Dr Maloney described the reduced-intensity regimen used in Seattle—fludarabine and 2 Gy total body irradiation. The single dose of radiation is typically 1/6 of what a myeloablative regimen would be.
“This is truly an outpatient regimen,” he said. “Most patients, 50%, get through this without ever being in the hospital.”
Follow-up at 5 years showed overall survival to be 43%, progression-free survival 36%, complete responses 52%, and relapse 34%.
“This may not look very good,” Dr Maloney said, but these are fludarabine-refractory CLL patients whose expected median survival is around 12 months.
Dr Maloney noted that approximately the same outcomes were achieved whether the graft was from a matched related or unrelated donor, and cytogenetics really didn’t play a huge role in outcome.
The biggest factor affecting outcome was lymph node size. Patients with nodes 5 cm or larger did very poorly. And patients with lymph nodes smaller than 5 cm, irrespective of white cell count or bone marrow infiltration, actually did quite well in comparison to the group with large lymph nodes.
“So the graft-vs-tumor activity seems to be limited in its ability to get rid of bulky lymphadenopathy in this population,” Dr Maloney said.
Prior alemtuzumab therapy was also associated with the worst outcome in terms of relapse and disease progression.
Patients without comorbidities and without bulky lymphadenopathy have a very good outcome, Dr Maloney noted, saying, “You can cure 60% to 70% with an allogeneic transplant.”
He also pointed out that many groups are now doing this type of transplant with related and unrelated donors.
Transplant vs new agents
In addition to offering a potential cure, allogeneic transplant may provide better-functioning hematopoietic and immune systems after transplant than before, especially in those patients who received FCR (fludarabine, mitoxantrone, and rituximab) or other treatments.
Transplant, while potentially curative with a high complete response rate, has early non-relapse mortality around 15% to 20%.
“So this makes it hard to position in this era of pills that you can take,” Dr Maloney said.
He pointed out that while ibrutinib and idelalisib have excellent outcomes and overall survival, “these studies are very, very early . . . but obviously extremely promising.”
A group of European physicians recently published a position paper proposing a treatment algorithm that includes transplant for high-risk CLL patients. The algorithm indicates that relapsed/refractory patients should try the novel agents first.
Then, if patients respond, they can continue with the novel agent or proceed to transplant. Patients with lower-risk disease or those who are a higher transplant risk should probably continue on the novel agent.
Those who are younger with higher-risk disease, such as a 17p deletion, or who are a low transplant risk may be willing to choose transplant earlier.
Patients who do not respond to the novel agents can consider transplant or an alternative salvage regimen.
“[O]bviously, this is extremely controversial,” Dr Maloney said, “and what everyone is going to do is use these new agents to push transplant further down the road. And I think that’s appropriate.”
At the very least, Dr Maloney believes patients deserve a discussion of options early on.
He added that chimeric antigen receptor (CAR) T cells “will likely bump transplant even down another notch” because patients are likely to be willing to take the risk of CAR T cells before they’ll take the risk of chronic graft-vs-host disease with an unrelated donor.” ![]()
Emergency Departments Monitored, Investigated by Hospital Committees, Governmental Agencies

Why is it that there are no focused looks into the ED? We all know, as hospitalists, that the ED locks us into many admissions. Yet I see no initiatives through the Centers for Medicare and Medicaid Services (CMS) going after the ED for wanting patients admitted rather than trying to get these patients sent home for outpatient therapy.
–Ray Nowaczyk, DO
Dr. Hospitalist responds:
Au contraire, my fellow hospitalist! The ED is monitored and investigated by many hospital committees and governmental agencies. Although we physicians, and I’m sure most hospitals, have always acknowledged our responsibilities to take care of patients during an emergency, this responsibility was enshrined in legalese in 1986 with the passage of the Emergency Medical Treatment and Active Labor Act (EMTALA), also known as the “antidumping law.” Since its passage, any hospital that receives Medicare or Medicaid funding, which includes almost all of them, is at risk of being fined or losing this vital source of funding if this law is violated.
EMTALA essentially states that any patient who presents to the ED must be provided a screening exam and treatment for any “emergent medical condition” (including labor), regardless of the individual’s ability to pay. The hospital is then required to provide “stabilizing” treatment for these patients or transfer them to another facility where this treatment can be provided. Furthermore, hospitals that refuse to accept these patients in transfer without valid reasons (e.g. no open beds) can be charged with an EMTALA violation.
As you well know, what is considered stabilized or at baseline by one clinician can be seen as unstable or requiring urgent care by another. The real day-to-day practice of medicine often defies evidence-based logic and forces us to make decisions based on many clinical and nonclinical variables.
These situations are further compounded by recent CMS attempts to hold hospitals publicly accountable for ED throughput by posting these measures on its website. Along with other metrics, the citizenry can now see how long it takes an ED patient to be seen by a health professional, receive pain medication if they have a broken bone, receive appropriate treatment and be sent home, or, if admitted, how long it takes to get into a bed.
This information makes it clearer that in situations of clinical uncertainty, it may be easier for many ED physicians to admit than to discharge. The “treat-‘em or street-‘em” mentality of triaging patients, of course, varies from doc to doc and can definitely create antipathy towards physicians in the ED. As much as I may disagree with some of our ED doc’s admissions, I always—OK, maybe not always—try to assume they have the patient’s best interest at heart.
Once admitted, the onus is placed on us, as hospitalists, to determine whether the patient requires ongoing inpatient care, can be cared for in an “observation” capacity, or should be discharged. We all have received calls from a nurse informing us that the patient “does not meet inpatient criteria”—even if the patient is hypotensive with systemic inflammatory response syndrome and lactic acidosis. Oh, if we could only send them back to the ED!
Do you have a problem or concern that you’d like Dr. Hospitalist to address? Email your questions to [email protected].

Hospitals' Observation Status Designation May Trigger Malpractice Claims

I’m convinced that observation status is rapidly becoming a meaningful factor in patients’ decision to file a malpractice lawsuit.
First, let me concede that I don’t know of any hard data to support my claim. I even asked the nation’s largest malpractice insurer about this, and they didn’t have any data on it. I think that is because observation status has only become a really big issue in the last couple of years, and since it typically takes several years for a malpractice suit to conclude, it just hasn’t found its way onto their radar yet.
But I’m pretty sure that will change within the next few years.
Implications
As any seasoned practitioner in our field knows, all outpatient and inpatient physician charges for Medicare patients, along with those of other licensed practitioners, are billed through Medicare Part B. After meeting a deductible, patients with traditional fee-for-service Medicare are generally responsible for 20% of all approved Part B charges, with no upper limit. For patients seen by a large number of providers while hospitalized, this 20% can really add up. Some patients have a secondary insurance that pays for this.
Hospital charges for patients on inpatient status are billed through Medicare Part A. Patients have an annual Part A deductible, and only in the case of very long inpatient stays will they have to pay more than that for inpatient care each year.
But hospital charges for patients on observation status are billed through Part B. And because hospital charges add up so quickly, the 20% of this that the patient is responsible for can be a lot of money—thousands of dollars, even for stays of less than 24 hours. Understandably, patients are not at all happy about this.
Let’s say you’re admitted overnight on observation status and your doctor orders your usual Advair inhaler. You use it once. Most hospitals aren’t able to ensure compliance with regulations around dispensing medications for home use like a pharmacy, so they won’t let you take the inhaler home. A few weeks later you’re stunned to learn that the hospital charged $10,000 for all services provided, and you’re responsible for 20% of the allowable amount PLUS the cost of all “self administered” drugs, like inhalers, eye drops, and calcitonin nasal spray. You look over your bill to see that you’re asked to pay $350 for the inhaler you used once and couldn’t even take home with you! Many self-administered medications, including eye drops and calcitonin nasal spray, result in similarly alarming charges to patients.
On top of the unpleasant surprise of a large hospital bill, Medicare won’t pay for skilled nursing facility (SNF) care for patients who are on observation status. That is, observation is not a “qualifying” stay for beneficiaries to access their SNF benefit.
It is easy to see why patients are unhappy about observation status.
The Media Message
News media are making the public aware of the potentially high financial costs they face if placed on observation status. But, too often, they oversimplify the issue, making it seem as though the choice of observation vs. inpatient status is entirely up to the treating doctor.
Saying that this decision is entirely up to the doctor is a lot like saying it is entirely up to you to determine how fast you drive on a freeway. In a sense that is correct, because no one else is in your car to control how fast you go and, in theory, you could choose to go 100 mph or 30 mph. The only problem is that it wouldn’t be long before you’d be in trouble with the law. So you don’t have complete autonomy to choose your speed; you have to comply with the laws. The same is true for doctors choosing observation status. We must comply with regulations in choosing the status or face legal consequences like fines or accusations of fraud.
Most news stories, like this one from NBC news (www.nbcnews.com/video/nightly-news/54511352#54511352) in February, are generally accurate but leave out the important fact that hospitals and doctors have little autonomy to choose the status the patient prefers. Instead, media often simply encourage patients on observation status to argue for a change to inpatient status and “be persistent.” More and more often, patients and families are arguing with the treating doctor; in many cases, that is a hospitalist.
Complaints Surge
At the 2014 SHM annual meeting last spring in Las Vegas, I spoke with many hospitalists who said that, increasingly, they are targets of observation-status complaints. One hospitalist group recently had each doctor list his or her top three frustrations with work; difficult and stressful conversations about observation status topped the list.
Patient anger regarding observation status can turn a satisfied patient into an angry one. We all know that unhappy patients are the ones most likely to pursue malpractice lawsuits. While anger over observation status doesn’t equal medical malpractice, it can change a patient’s opinion of our care, which may in some cases result in a malpractice claim.
Solutions
Medicare is unlikely to do away with observation status, so the best way to prevent complaints is to ensure that all its implications are explained to patients and families, ideally before they’re put into the hospital (e.g., while still in the ED). I think it is best if this message is delivered by someone other than the treating doctor(s): For example, a case manager might handle the discussion. Of course, patients and families are often too overwhelmed in the ED to absorb this information, so the message may need to be repeated later.
Maybe everyone should tell observation patients, “We’re going to observe you” without using any form of the word “admission.” And having these patients stay in distinct observation units probably reduces misunderstandings and complaints compared to the common practice of mixing these patients in “regular” hospital floors housing those on inpatient status.
Unfortunately, I couldn’t find research data to support this idea.
I bet some hospitals have even more elegant and effective ways to reduce misunderstandings and complaints around observation status. I’d love to hear from you if you know of any. E-mail me at [email protected].
Physician Tips Help Hone Clinicians' Practice Management, Decision-Making Skills
At A Glance

Title: Becoming a Consummate Clinician: What Every Student, House Officer and Hospital Practitioner Needs to Know.
Authors: Ary L. Goldberger, MD, and Zachary D. Goldberger, MD, MS, eds.
Published: 2012
Pages: 224
EDITOR’S NOTE: Second in an occasional series of reviews of the Hospital Medicine: Current Concepts series by members of Team Hospitalist.
Summary
The third installment in the Hospital Medicine: Current Concepts series, Becoming a Consummate Clinician is written in two parts. Part 1, “Medical Musts and Must-Nots,” is focused on the basics of being a clinician: gathering an appropriate history, performing an effective physical examination, and formulating differential diagnoses. This section in particular is geared toward house officers and attending physicians on teaching teams. While the audience here is primarily clinicians on a teaching service, there is good advice for those in any practice setting about avoiding common mistakes and developing clinical sagacity.
In this first section, we are given advisement on treatment of and with medications. Regardless of a clinician’s level of experience, it is worth reading this text to review and internalize these authors’ advice regarding medication pitfalls. Simply putting this advice into one’s daily practice of medicine will take any practitioner a long way toward becoming a “consummate clinician.”
Part 2, “Medical Masteries,” logically builds upon material presented in Part 1. The final section of the book addresses aspects of critical analysis of medical data and encourages engagement of critical thinking skills in all aspects of clinical decision-making. Specific topics addressed include reducing medical errors, reevaluating evidence-based medicine, deconstructing several widely cited medical aphorisms, identifying sources of cognitive errors, and transforming information into understanding.
The authors devoted the final chapter to the discussion of “What is disease?” and “What is health?” which, quite frankly, adds little value to the book.
Drs. Goldberger and Goldberger discuss what they term the “interstitial curriculum”—what is not explicitly taught but should be. Included in the “interstitial curriculum” is examination of cognitive errors and how we are more apt to make these in the era of “high-throughput” patient care. Another topic included in their “interstitial curriculum” is the paucity of attention paid to addressing uncertainty in all aspects of medicine. These topics are worth the cost of this book, even if it only helps promote awareness of these important ideas and bring the discussion to a larger audience.
The complementary processes of constantly rethinking assumptions, researching information, and reformulating basic mechanisms are fundamental to practicing all types of medicine successfully. Such processes also help to avoid potentially lethal errors and help to rigorously and compassionately advance the inseparable sciences of prevention and healing. The deep and multidimensional challenges are central to the ongoing pursuit of becoming the consummate clinician.”
Analysis
There are times in this book, particularly in the beginning, when the reader feels this text was written for the benefit of the house officer and those practitioners serving on inpatient teaching services. Continued reading, however, finds brilliant advice for clinicians in all practice settings and in all stages of their careers.
The encouragement of all readers to rethink everything we assume to be true and to seek a deeper understanding of what we “know” is priceless.
The quotes included throughout the book were both valuable and enjoyable. The authors included quotes from Plutarch to Hector Barbosa from Pirates of the Caribbean. One quote that is particularly germane to the practice of hospital medicine in this age of the Hospital Consumer Assessment of Healthcare Providers and Systems comes from Sir William Osler:
“Remember…that every patient upon whom you wait will examine you critically and form an estimate of you by the way in which you conduct yourself at the bedside. Skill and nicety in manipulation, in the simple act of feeling the pulse or in the performance of any minor operation, will do more towards establishing confidence in you than a string of diplomas, or the reputation of extensive hospital experience.”
Conversely, the computer-generated graphics added no value and were, in fact, a detractor. Hopefully, the next edition will not feature the sophomorically rendered bridge advising us to “bridge the classroom-to-clinic gap,” the flamingo, or the zigzagging line, among others.
Dr. Lindsey is chief operations officer and strategist of Synergy Surgicalists, and a member of Team Hospitalist.
At A Glance
Title: Becoming a Consummate Clinician: What Every Student, House Officer and Hospital Practitioner Needs to Know.
Authors: Ary L. Goldberger, MD, and Zachary D. Goldberger, MD, MS, eds.
Published: 2012
Pages: 224
EDITOR’S NOTE: Second in an occasional series of reviews of the Hospital Medicine: Current Concepts series by members of Team Hospitalist.
Summary
The third installment in the Hospital Medicine: Current Concepts series, Becoming a Consummate Clinician is written in two parts. Part 1, “Medical Musts and Must-Nots,” is focused on the basics of being a clinician: gathering an appropriate history, performing an effective physical examination, and formulating differential diagnoses. This section in particular is geared toward house officers and attending physicians on teaching teams. While the audience here is primarily clinicians on a teaching service, there is good advice for those in any practice setting about avoiding common mistakes and developing clinical sagacity.
In this first section, we are given advisement on treatment of and with medications. Regardless of a clinician’s level of experience, it is worth reading this text to review and internalize these authors’ advice regarding medication pitfalls. Simply putting this advice into one’s daily practice of medicine will take any practitioner a long way toward becoming a “consummate clinician.”
Part 2, “Medical Masteries,” logically builds upon material presented in Part 1. The final section of the book addresses aspects of critical analysis of medical data and encourages engagement of critical thinking skills in all aspects of clinical decision-making. Specific topics addressed include reducing medical errors, reevaluating evidence-based medicine, deconstructing several widely cited medical aphorisms, identifying sources of cognitive errors, and transforming information into understanding.
The authors devoted the final chapter to the discussion of “What is disease?” and “What is health?” which, quite frankly, adds little value to the book.
Drs. Goldberger and Goldberger discuss what they term the “interstitial curriculum”—what is not explicitly taught but should be. Included in the “interstitial curriculum” is examination of cognitive errors and how we are more apt to make these in the era of “high-throughput” patient care. Another topic included in their “interstitial curriculum” is the paucity of attention paid to addressing uncertainty in all aspects of medicine. These topics are worth the cost of this book, even if it only helps promote awareness of these important ideas and bring the discussion to a larger audience.
The complementary processes of constantly rethinking assumptions, researching information, and reformulating basic mechanisms are fundamental to practicing all types of medicine successfully. Such processes also help to avoid potentially lethal errors and help to rigorously and compassionately advance the inseparable sciences of prevention and healing. The deep and multidimensional challenges are central to the ongoing pursuit of becoming the consummate clinician.”
Analysis
There are times in this book, particularly in the beginning, when the reader feels this text was written for the benefit of the house officer and those practitioners serving on inpatient teaching services. Continued reading, however, finds brilliant advice for clinicians in all practice settings and in all stages of their careers.
The encouragement of all readers to rethink everything we assume to be true and to seek a deeper understanding of what we “know” is priceless.
The quotes included throughout the book were both valuable and enjoyable. The authors included quotes from Plutarch to Hector Barbosa from Pirates of the Caribbean. One quote that is particularly germane to the practice of hospital medicine in this age of the Hospital Consumer Assessment of Healthcare Providers and Systems comes from Sir William Osler:
“Remember…that every patient upon whom you wait will examine you critically and form an estimate of you by the way in which you conduct yourself at the bedside. Skill and nicety in manipulation, in the simple act of feeling the pulse or in the performance of any minor operation, will do more towards establishing confidence in you than a string of diplomas, or the reputation of extensive hospital experience.”
Conversely, the computer-generated graphics added no value and were, in fact, a detractor. Hopefully, the next edition will not feature the sophomorically rendered bridge advising us to “bridge the classroom-to-clinic gap,” the flamingo, or the zigzagging line, among others.
Dr. Lindsey is chief operations officer and strategist of Synergy Surgicalists, and a member of Team Hospitalist.

Interplay Between Physician Employment Agreement, Hospital Medical Staff Bylaws Important

If you are a physician considering employment with a hospital or private practice in which hospital medical staff privileges will be needed or you are currently employed by a hospital or private practice and have medical staff privileges, it is imperative that you understand your rights as an employee and as a member of the hospital’s medical staff, along with the interplay between those two roles.
Employment Agreement and Hospital Medical Staff Bylaws
As an employee of a hospital or private practice, you will have an employment agreement that governs the terms of your employment. In addition, if you are on the hospital’s medical staff, you will also be subject to the hospital’s medical staff bylaws, which govern the terms of your staff membership and clinical privileges.
At the onset of an employment relationship, many physicians focus on the terms of their employment agreements, often ignoring the terms of the medical staff bylaws. This could lead to unexpected surprises, usually toward the end of the employment relationship, because both documents need to be read in conjunction with each other.
Beware of conflicting terms in your employment agreement on the one hand and the medical staff bylaws on the other. Although an employment agreement may include seemingly beneficial terms, hidden language often has the effect of negating its terms by qualifying the employment agreement with language contained in the bylaws. Examples include:
—“In the event of a conflict between the terms of the Physician’s Employment Agreement and the Medical Staff Bylaws, the Medical Staff Bylaws shall control.”
—“Subject to the Medical Staff Bylaws, Physician may …”
—“Except as otherwise stated in the Medical Staff Bylaws, Physician may …”
—“Except as permitted by the Medical Staff Bylaws, Physician may not …”
Termination of Medical Staff Privileges: Impact on Employment Agreement
Whether you are employed by a hospital or a private practice, your employment is likely at risk if your hospital medical staff privileges are suspended, revoked, or restricted. Even if your medical staff privileges are later reinstated, the initial suspension may trigger termination of your employment agreement.
Therefore, it is important to understand your due process rights, outlined in the hospital’s medical staff bylaws, as to how your privileges can be suspended, revoked, or restricted, as well as the procedure the hospital must undergo to make such a decision.
Medical staff bylaws also include a procedure for due process, including fair hearings and appeal mechanisms for medical staff decisions, such as privilege suspension, revocation, and restrictions.
Termination of Employment: Impact on Medical Staff Privileges
For hospital employees and most hospital-based physicians, termination of your employment agreement, whether for cause or without cause, may be automatic grounds for termination of your staff privileges. In such a case, your due process rights under the medical staff bylaws as they relate to your staff privileges are waived, and you will not be afforded the fair hearing and appeal procedure typically available to office-based physicians on the hospital’s medical staff.
Also, your employment agreement may contractually require you to resign from the hospital’s medical staff upon termination of the employment relationship. For example:
“Physician covenants and agrees that upon termination of Physician’s employment with Employer (whether for cause or without cause), Physician will resign from the medical staff of Hospital X, thereby relinquishing any right to due process pursuant to the medical staff bylaws.”
Some employment agreements may go even further and prohibit you from re-applying for medical staff privileges at that hospital for a stated period of time. For example:
“Physician further agrees that Physician shall not re-apply for medical staff privileges at Hospital X within two (2) years following the later of the termination of Physician’s employment or the effective date of termination of such medical staff privileges at Hospital X.”
Don’t forget about the hospital’s medical staff bylaws when entertaining an employment relationship with a hospital or private practice. The hospital’s medical staff bylaws should be reviewed in conjunction with the employment agreement.
Steven M. Harris, Esq., is a nationally recognized healthcare attorney and a member of the law firm McDonald Hopkins LLC in Chicago. Write to him at [email protected].

Avoid Billing, Coding Discrepancies When Documenting Patient History

- Continue to educate physicians on proper billing for E/M services;
- Encourage its contractors to review physicians’ billing for E/M services; and
- Review physicians who bill higher level E/M codes for appropriate action.1
When documenting patient history, physicians must be aware of the common discrepancies that occur. Although the physician becomes familiar with the patient as he/she provides care throughout the hospitalization, the auditor must acquaint himself or herself with the patient using only the limited information provided in the progress note.
When documentation is requested by the payer for a specific service date, only the documentation from that service date is considered. Be sure that the information is adequate to support both clinical care and the reported service level.
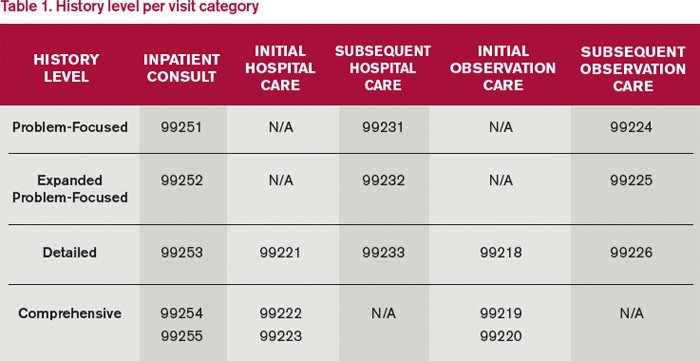
Patient History Requirements
Chief complaint. The chief complaint (CC) is the reason for the visit as stated in the patient’s own words. Every encounter, regardless of visit type, must include a CC. The physician must personally document and/or validate the CC with reference to a specific condition or symptom (e.g. patient complains of abdominal pain).
- Incomplete CC example: “Follow-up”;
- Better CC example: “Follow-up for severe abdominal cramping.”
History of present illness. The history of present illness (HPI) describes the development or progression of the patient’s current problem(s). The traditional HPI elements recognized in the 1995 documentation guidelines are location, quality, severity, duration, timing, context, modifying factors, and associated signs/symptoms.2,3
The physician must obtain and personally document the HPI. He/she also has the option to link to the HPI documented by residents (i.e., residents, fellows, interns) in compliance with the teaching physician rules or nonphysician practitioners (i.e., nurse practitioners and physician assistants) as defined by the split-shared billing rules. An auditor will not accept HPI information if the physician attempts to link to any other individual, even if that person may be qualified to obtain this (e.g. registered nurse, medical assistant) or is a student (e.g. medical students, nurse practitioner students).
Because auditors recognize both 1995 and 1997 documentation guidelines, they must also recognize the HPI differences. The 1997 HPI format promotes the status of the patient’s chronic or inactive conditions.4 The physician receives one credit for each chronic condition that is noted, along with documentation of what has occurred since the last physician encounter as it relates to the chronic condition (e.g. “patient has a history of chronic obstructive bronchitis without acute exacerbation in past six months”).
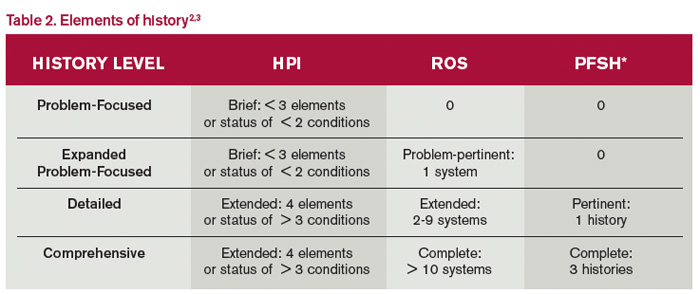
Physicians may utilize either style of HPI documentation, and auditors must review provider records against each set of guidelines. The final audited result reflects the highest visit level supported by either set of guidelines. For example, if physician documentation yields an “extended” HPI when 1995 guidelines are used but only a “brief” HPI (see Table 2) when 1997 guidelines are reviewed, the auditor awards the physician credit for the “extended” HPI.
- 1995 example: “The patient has intermittent (duration), sharp (quality) pain in the right upper quadrant (location) without associated nausea, vomiting, or diarrhea (associated signs/symptoms).”
- 1997 example: “Diabetes controlled by oral medication; hyperlipidemia stable on simvastatin with increased dietary efforts; hypertension stable with pressures ranging from 130-140/80-90 overnight” (status of three chronic conditions).
Review of systems. A review of systems (ROS) is a series of questions inquiring about additional signs, symptoms, or problems currently or previously experienced by the patient as related to the CC or presenting problem. The recognized systems are constitutional; eyes; ears, nose, mouth, throat; cardiovascular; respiratory; gastrointestinal; genitourinary; musculoskeletal; integumentary (including skin and/or breast); neurological; psychiatric; endocrine; hematologic/lymphatic; and allergic/immunologic.2,3
The physician may choose to document the ROS by making a notation for individual systems: “no fever/chills (constitutional) or blurred vision (eyes); no chest pain (cardiovascular) or shortness of breath (respiratory); intermittent nausea (gastrointestinal) and occasional runny nose (ears, nose, mouth, throat).” Alternatively, the physician may inquire about all of the systems but only document the positive and pertinent negative findings related to the CC, along with an additional comment that “all other systems are negative.” Most Medicare audit contractors currently accept this method as long as all systems were reviewed.5,6,7,8,9
Be advised that ROS information can be documented by anyone, including the patient. The physician must remember to reference ROS information that is completed by individuals other than residents or nonphysician practitioners (the physician is already required to reference the documentation of the latter individuals under the Teaching Physician Rules or Split-Shared Billing Rules).
Past, family, and social histories. Documentation of past, family, and social histories (PFSH) involves data obtained about the patient’s previous illness or medical conditions/therapies, family occurrences with illness, and relevant patient activities. An auditor credits the physician for a single comment correlated to each history for the PFSH. Using the term “noncontributory” (N/C) with any of the histories can result in downcoding. Many contractors do not allow this statement due to previous misunderstandings over its use.
- Incomplete PFSH example: “Patient is status-post cholecystectomy in August 2013; family history N/C; patient is former smoker” (Note: “family history N/C” is not accepted by most contractors).
- Better PFSH example: “Patient currently on Prilosec 20 mg daily; family history of Barrett’s Esophagus; no tobacco or alcohol use.”
PFSH data can also be documented by anyone, including the patient, and the physician must reference the PFSH information in his own progress note. Re-documenting the PFSH is not necessary unless a revision is required. PFSH documentation is only required for initial care services (i.e., initial hospital care, initial observation care, consultations). It is not required for subsequent care services, unless additional pertinent information that impacts care is obtained during the hospital stay.
Common Problems to Avoid
Information cannot be obtained. Some contractors will not penalize the physician for the inability to ascertain complete historical information as long as there is evidenced documentation of an attempt to obtain the information. When the physician cannot extract historical information from the patient directly and no other source is available, the physician documents that he is “unable to obtain” the history. Additionally, the physician must provide a comment to explain why the information is unobtainable (e.g. patient confused, no caregiver present) along with the available information from the limited resources (e.g. emergency medical technicians, records from previous hospitalizations at the same facility).
Previous information referenced. When referencing items from a previous encounter, be sure to include the referenced information when documentation is requested by the payer. Per CMS guidelines, the ROS and/or PFSH obtained during an earlier encounter does not need to be re-recorded if there is evidence that the physician reviewed and updated the previous information. The review and update may be documented by either describing any new ROS and/or PFSH information or noting that there has been no change in the information and noting the date and location of the earlier ROS and/or PFSH.2
Pre-op clearance and HPI deficiencies. HPI is typically not as deficient as the ROS or family history elements; however, HPI underdocumentation is mostly associated with encounters for pre-op clearance. The physician may state that “patient requires pre-op clearance for left knee repair.” In the absence of any comorbidities or acute illness, HPI documentation may be missing. The physician should remember to identify the details of the presenting problem: “Patient runs five miles daily. Knee felt unstable after running two weeks ago. Swelling and intermittent sharp pain 7/10. Patient has been taking ibuprofen daily without relief.”
Not medically necessary. Remember not to document any elements for the purpose of “getting paid.” Only document information that is clinically relevant, lends to the quality of care provided, or demonstrates the delivery of healthcare services. This prevents accusations of fraud and abuse, promotes billing compliance, and supports medical necessity for the services provided.
Varying levels of history. E/M services are selected based on the content of the three “key” components: history, exam, and decision-making (or visit time). If counseling and/or coordination of care does not encompass >50% of the physician’s total visit time or the service is not exclusively designated as a time-based service (e.g. critical care and discharge day management), the physician’s service time is not considered.
Documentation for each of the three key components must support the reported visit level when reporting initial hospital care and consultations (for those payers who still recognize consultation codes). Subsequent hospital care (e.g. 99233) only requires supportive documentation from two key components. Medical decision-making should be one of the two supporting components in order to demonstrate the medical necessity and nature of the presenting problem; the other supporting component can be history or exam.
Each visit category (e.g. initial hospital care or subsequent hospital care) and service level (e.g. 99221-99233) identifies corresponding documentation requirements. Failure to document any essential element in a given visit level (e.g. family history required for a comprehensive history when billing for 99222 and 99223) may result in service denial or downcoding (e.g. 99221). Be aware of what an auditor expects when reviewing patient history (see Table 1).
There are four levels of history: problem-focused, expanded problem-focused, detailed, and comprehensive. An auditor determines the number of history elements documented in the progress note (see Table 2). The history level corresponds to the lowest documented element. For example, if physician documentation includes four HPI elements, eight ROS, and a comment in each of the PFSHs, the history level is equivalent to “detailed.” The history would support initial hospital care 99221 or subsequent hospital care 99233.
Carol Pohlig is a billing and coding expert with the University of Pennsylvania Medical Center, Philadelphia. She is also on the faculty of SHM’s inpatient coding course.
References
- Levinson DR. Department of Health and Human Services, Office of Inspector General: Coding Trends of Medicare Evaluation and Management Services. May 2012. Available at: oig.hhs.gov/oei/reports/oei-04-10-00180.pdf. Accessed October 4, 2014.
- Centers for Medicare and Medicaid Services. 1995 Documentation Guidelines for Evaluation and Management Services. Available at: www.cms.gov/Outreach-and-Education/Medicare-Learning-Network-MLN/MLNEdWebGuide/Downloads/95Docguidelines.pdf. Accessed October 4, 2014.
- Abraham M, Ahlman J, Boudreau A, Connelly J, Levreau-Davis L. CPT 2013 Professional Edition (Current Procedural Terminology). Chicago: American Medical Association Press; 2012:4-10.
- Centers for Medicare and Medicaid Services. 1997 Documentation Guidelines for Evaluation and Management Services. Available at: www.cms.gov/Outreach-and-Education/Medicare-Learning-Network-MLN/MLNEdWebGuide/Downloads/97Docguidelines.pdf. Accessed October 4, 2014.
- Noridian Healthcare Solutions. Medicare Part B: Evaluation and Management Workshop Questions and Answers. Available at: www.noridianmedicare.com/cgi-bin/coranto/viewnews.cgi?id=EkZpEVAyylqZyOfqel&tmpl=part_b_viewnews&style=part_ab_viewnews Accessed on October 4, 2014.
- WPS Medicare Health Insurance. J5 MAC Part B: Documentation (Q&As). Available at: www.wpsmedicare.com/j5macpartb/resources/provider_types/evalmngmntqa.shtml. Accessed October 4, 2014.
- NHIC, Corp. Building Your Medicare Knowledge: Advanced Building Blocks. Available at: www.medicarenhic.com/providers/pubs/AdvdBuildBlocks061212.pdf.
- Palmetto GBA. Jurisdiction 11 Part B: History Component. Available at: www.palmettogba.com/Palmetto/Providers.nsf/docsCat/Jurisdiction%2011%20Part%20B~EM%20Help%20Center~General%20Articles~History%20Component?open&Expand=1. Accessed October 4, 2014.
- Novitas Solutions. Frequently Asked Questions: Evaluation and Management Services (Part B). Available at: https://www.novitas-solutions.com/faq/partb/pet/lpet-evaluation_management_services.html. Accessed October 4, 2014.
- Continue to educate physicians on proper billing for E/M services;
- Encourage its contractors to review physicians’ billing for E/M services; and
- Review physicians who bill higher level E/M codes for appropriate action.1
When documenting patient history, physicians must be aware of the common discrepancies that occur. Although the physician becomes familiar with the patient as he/she provides care throughout the hospitalization, the auditor must acquaint himself or herself with the patient using only the limited information provided in the progress note.
When documentation is requested by the payer for a specific service date, only the documentation from that service date is considered. Be sure that the information is adequate to support both clinical care and the reported service level.
Patient History Requirements
Chief complaint. The chief complaint (CC) is the reason for the visit as stated in the patient’s own words. Every encounter, regardless of visit type, must include a CC. The physician must personally document and/or validate the CC with reference to a specific condition or symptom (e.g. patient complains of abdominal pain).
- Incomplete CC example: “Follow-up”;
- Better CC example: “Follow-up for severe abdominal cramping.”
History of present illness. The history of present illness (HPI) describes the development or progression of the patient’s current problem(s). The traditional HPI elements recognized in the 1995 documentation guidelines are location, quality, severity, duration, timing, context, modifying factors, and associated signs/symptoms.2,3
The physician must obtain and personally document the HPI. He/she also has the option to link to the HPI documented by residents (i.e., residents, fellows, interns) in compliance with the teaching physician rules or nonphysician practitioners (i.e., nurse practitioners and physician assistants) as defined by the split-shared billing rules. An auditor will not accept HPI information if the physician attempts to link to any other individual, even if that person may be qualified to obtain this (e.g. registered nurse, medical assistant) or is a student (e.g. medical students, nurse practitioner students).
Because auditors recognize both 1995 and 1997 documentation guidelines, they must also recognize the HPI differences. The 1997 HPI format promotes the status of the patient’s chronic or inactive conditions.4 The physician receives one credit for each chronic condition that is noted, along with documentation of what has occurred since the last physician encounter as it relates to the chronic condition (e.g. “patient has a history of chronic obstructive bronchitis without acute exacerbation in past six months”).
Physicians may utilize either style of HPI documentation, and auditors must review provider records against each set of guidelines. The final audited result reflects the highest visit level supported by either set of guidelines. For example, if physician documentation yields an “extended” HPI when 1995 guidelines are used but only a “brief” HPI (see Table 2) when 1997 guidelines are reviewed, the auditor awards the physician credit for the “extended” HPI.
- 1995 example: “The patient has intermittent (duration), sharp (quality) pain in the right upper quadrant (location) without associated nausea, vomiting, or diarrhea (associated signs/symptoms).”
- 1997 example: “Diabetes controlled by oral medication; hyperlipidemia stable on simvastatin with increased dietary efforts; hypertension stable with pressures ranging from 130-140/80-90 overnight” (status of three chronic conditions).
Review of systems. A review of systems (ROS) is a series of questions inquiring about additional signs, symptoms, or problems currently or previously experienced by the patient as related to the CC or presenting problem. The recognized systems are constitutional; eyes; ears, nose, mouth, throat; cardiovascular; respiratory; gastrointestinal; genitourinary; musculoskeletal; integumentary (including skin and/or breast); neurological; psychiatric; endocrine; hematologic/lymphatic; and allergic/immunologic.2,3
The physician may choose to document the ROS by making a notation for individual systems: “no fever/chills (constitutional) or blurred vision (eyes); no chest pain (cardiovascular) or shortness of breath (respiratory); intermittent nausea (gastrointestinal) and occasional runny nose (ears, nose, mouth, throat).” Alternatively, the physician may inquire about all of the systems but only document the positive and pertinent negative findings related to the CC, along with an additional comment that “all other systems are negative.” Most Medicare audit contractors currently accept this method as long as all systems were reviewed.5,6,7,8,9
Be advised that ROS information can be documented by anyone, including the patient. The physician must remember to reference ROS information that is completed by individuals other than residents or nonphysician practitioners (the physician is already required to reference the documentation of the latter individuals under the Teaching Physician Rules or Split-Shared Billing Rules).
Past, family, and social histories. Documentation of past, family, and social histories (PFSH) involves data obtained about the patient’s previous illness or medical conditions/therapies, family occurrences with illness, and relevant patient activities. An auditor credits the physician for a single comment correlated to each history for the PFSH. Using the term “noncontributory” (N/C) with any of the histories can result in downcoding. Many contractors do not allow this statement due to previous misunderstandings over its use.
- Incomplete PFSH example: “Patient is status-post cholecystectomy in August 2013; family history N/C; patient is former smoker” (Note: “family history N/C” is not accepted by most contractors).
- Better PFSH example: “Patient currently on Prilosec 20 mg daily; family history of Barrett’s Esophagus; no tobacco or alcohol use.”
PFSH data can also be documented by anyone, including the patient, and the physician must reference the PFSH information in his own progress note. Re-documenting the PFSH is not necessary unless a revision is required. PFSH documentation is only required for initial care services (i.e., initial hospital care, initial observation care, consultations). It is not required for subsequent care services, unless additional pertinent information that impacts care is obtained during the hospital stay.
Common Problems to Avoid
Information cannot be obtained. Some contractors will not penalize the physician for the inability to ascertain complete historical information as long as there is evidenced documentation of an attempt to obtain the information. When the physician cannot extract historical information from the patient directly and no other source is available, the physician documents that he is “unable to obtain” the history. Additionally, the physician must provide a comment to explain why the information is unobtainable (e.g. patient confused, no caregiver present) along with the available information from the limited resources (e.g. emergency medical technicians, records from previous hospitalizations at the same facility).
Previous information referenced. When referencing items from a previous encounter, be sure to include the referenced information when documentation is requested by the payer. Per CMS guidelines, the ROS and/or PFSH obtained during an earlier encounter does not need to be re-recorded if there is evidence that the physician reviewed and updated the previous information. The review and update may be documented by either describing any new ROS and/or PFSH information or noting that there has been no change in the information and noting the date and location of the earlier ROS and/or PFSH.2
Pre-op clearance and HPI deficiencies. HPI is typically not as deficient as the ROS or family history elements; however, HPI underdocumentation is mostly associated with encounters for pre-op clearance. The physician may state that “patient requires pre-op clearance for left knee repair.” In the absence of any comorbidities or acute illness, HPI documentation may be missing. The physician should remember to identify the details of the presenting problem: “Patient runs five miles daily. Knee felt unstable after running two weeks ago. Swelling and intermittent sharp pain 7/10. Patient has been taking ibuprofen daily without relief.”
Not medically necessary. Remember not to document any elements for the purpose of “getting paid.” Only document information that is clinically relevant, lends to the quality of care provided, or demonstrates the delivery of healthcare services. This prevents accusations of fraud and abuse, promotes billing compliance, and supports medical necessity for the services provided.
Varying levels of history. E/M services are selected based on the content of the three “key” components: history, exam, and decision-making (or visit time). If counseling and/or coordination of care does not encompass >50% of the physician’s total visit time or the service is not exclusively designated as a time-based service (e.g. critical care and discharge day management), the physician’s service time is not considered.
Documentation for each of the three key components must support the reported visit level when reporting initial hospital care and consultations (for those payers who still recognize consultation codes). Subsequent hospital care (e.g. 99233) only requires supportive documentation from two key components. Medical decision-making should be one of the two supporting components in order to demonstrate the medical necessity and nature of the presenting problem; the other supporting component can be history or exam.
Each visit category (e.g. initial hospital care or subsequent hospital care) and service level (e.g. 99221-99233) identifies corresponding documentation requirements. Failure to document any essential element in a given visit level (e.g. family history required for a comprehensive history when billing for 99222 and 99223) may result in service denial or downcoding (e.g. 99221). Be aware of what an auditor expects when reviewing patient history (see Table 1).
There are four levels of history: problem-focused, expanded problem-focused, detailed, and comprehensive. An auditor determines the number of history elements documented in the progress note (see Table 2). The history level corresponds to the lowest documented element. For example, if physician documentation includes four HPI elements, eight ROS, and a comment in each of the PFSHs, the history level is equivalent to “detailed.” The history would support initial hospital care 99221 or subsequent hospital care 99233.
Carol Pohlig is a billing and coding expert with the University of Pennsylvania Medical Center, Philadelphia. She is also on the faculty of SHM’s inpatient coding course.
References
- Levinson DR. Department of Health and Human Services, Office of Inspector General: Coding Trends of Medicare Evaluation and Management Services. May 2012. Available at: oig.hhs.gov/oei/reports/oei-04-10-00180.pdf. Accessed October 4, 2014.
- Centers for Medicare and Medicaid Services. 1995 Documentation Guidelines for Evaluation and Management Services. Available at: www.cms.gov/Outreach-and-Education/Medicare-Learning-Network-MLN/MLNEdWebGuide/Downloads/95Docguidelines.pdf. Accessed October 4, 2014.
- Abraham M, Ahlman J, Boudreau A, Connelly J, Levreau-Davis L. CPT 2013 Professional Edition (Current Procedural Terminology). Chicago: American Medical Association Press; 2012:4-10.
- Centers for Medicare and Medicaid Services. 1997 Documentation Guidelines for Evaluation and Management Services. Available at: www.cms.gov/Outreach-and-Education/Medicare-Learning-Network-MLN/MLNEdWebGuide/Downloads/97Docguidelines.pdf. Accessed October 4, 2014.
- Noridian Healthcare Solutions. Medicare Part B: Evaluation and Management Workshop Questions and Answers. Available at: www.noridianmedicare.com/cgi-bin/coranto/viewnews.cgi?id=EkZpEVAyylqZyOfqel&tmpl=part_b_viewnews&style=part_ab_viewnews Accessed on October 4, 2014.
- WPS Medicare Health Insurance. J5 MAC Part B: Documentation (Q&As). Available at: www.wpsmedicare.com/j5macpartb/resources/provider_types/evalmngmntqa.shtml. Accessed October 4, 2014.
- NHIC, Corp. Building Your Medicare Knowledge: Advanced Building Blocks. Available at: www.medicarenhic.com/providers/pubs/AdvdBuildBlocks061212.pdf.
- Palmetto GBA. Jurisdiction 11 Part B: History Component. Available at: www.palmettogba.com/Palmetto/Providers.nsf/docsCat/Jurisdiction%2011%20Part%20B~EM%20Help%20Center~General%20Articles~History%20Component?open&Expand=1. Accessed October 4, 2014.
- Novitas Solutions. Frequently Asked Questions: Evaluation and Management Services (Part B). Available at: https://www.novitas-solutions.com/faq/partb/pet/lpet-evaluation_management_services.html. Accessed October 4, 2014.