User login
FDA lifts clinical hold on imetelstat
The US Food and Drug Administration (FDA) has removed the full clinical hold placed on the investigational new drug application for the telomerase inhibitor imetelstat.
The hold, which was placed in March, suspended a phase 2 study of imetelstat in patients with essential thrombocythemia (ET) or polycythemia vera (PV), as well as a phase 2 study of the drug in patients with multiple myeloma (MM).
The hold also delayed a planned phase 2 trial in patients with myelofibrosis (MF).
And it temporarily suspended an investigator-sponsored trial of imetelstat in MF. The FDA lifted the hold on the investigator-sponsored trial in June.
The FDA halted these trials due to reports of persistent, low-grade liver function test (LFT) abnormalities observed in the phase 2 study of ET/PV patients and the potential risk of chronic liver injury following long-term exposure to imetelstat. The FDA expressed concern about whether these LFT abnormalities are reversible.
Now, data provided by the Geron Corporation, the company developing imetelstat, has convinced the FDA to lift the hold on all trials.
The FDA said the proposed clinical development plan for imetelstat, which is focused on high-risk myeloid disorders such as MF, is acceptable. Geron Corporation has said it does not intend to conduct further studies with, or develop imetelstat for, patients with ET or PV.
To address the clinical hold, the FDA required Geron to provide follow-up information from imetelstat-treated patients who experienced LFT abnormalities until such abnormalities resolved to normal or baseline.
Geron obtained follow-up information from patients in the previously ongoing company-sponsored phase 2 trials in ET/PV and MM. These data were submitted to the FDA as part of the company’s complete response.
The company’s analysis of these data showed that, in the ET/PV trial, LFT abnormalities resolved to normal or baseline in 14 of 18 follow-up patients. For the remaining 4 patients, at the time of the data cut-off, 3 patients showed improvement in LFT abnormalities, and 1 patient had unresolved LFT abnormalities. Two of the remaining 4 patients continue in follow-up.
In the MM trial, LFT abnormalities resolved to normal or baseline in all 9 follow-up patients. In addition, no emergent hepatic adverse events were reported during follow-up for either study.
The FDA also requested information regarding the reversibility of liver toxicity after chronic imetelstat administration in animals. Geron submitted data from its non-clinical toxicology studies, which included a 6-month study in mice and a 9-month study in cynomolgus monkeys.
In these studies, no clinical pathology changes indicative of hepatocellular injury were observed, and no clear signal of LFT abnormalities were identified.
With the clinical hold lifted, a multicenter phase 2 trial in MF is projected to begin in the first half of 2015. ![]()
Brentuximab tops chemo in HL, doc says

NEW YORK—Brentuximab vendotin—not conventional chemotherapy—is the second-line regimen of choice for recurrent Hodgkin lymphoma (HL) patients prior to stem cell transplant, according to a speaker at the Lymphoma & Myeloma 2014 congress.
Catherine Diefenbach, MD, of New York University’s Langone Medical Center in New York, argued that conventional chemotherapy, the existing paradigm for first salvage therapy, does not maximize a cure or minimize toxicity, is inconvenient, and is not cost-effective.
She noted that a quarter of HL patients relapse or have a primary refractory diagnosis.
“These are young patients,” Dr Diefenbach said. “Autologous stem cell transplant [ASCT] cures only half of them. There is no other established curative salvage therapy.”
She noted that the median time to progression with relapse after transplant is 3.8 months in patients treated with subsequent therapy, with a median survival of 26 months.
After ASCT, the median progression-free survival with relapse is 1.3 years. And about three-quarters of relapses occur within the first year.
“Achieving a complete response [CR] before ASCT is the most important factor in determining long-term disease-free survival and to maximizing transplant-related benefit,” Dr Diefenbach said. “High overall response rates [ORRs] do not equal high CR. Only one-third of patients achieve a CR [with chemotherapy].”
She said studies have shown that chemotherapy with ICE (ifosfamide, carboplatin, and etoposide) leads to a 3-year event-free survival rate of 22%. Post-ASCT, event-free survival increases to more than 52%.
The overall survival post-ASCT is 44%. The median survival of patients who do not get therapy is 3.7 months. Myelosuppression and deaths are common.
“Conventional chemotherapy fails,” Dr Diefenbach continued. “There is inadequate disease control, unacceptable toxicity, it’s not cost-effective, requires patients to be hospitalized, and there is no clear standard of care.”
On the other hand, brentuximab as first salvage is highly active with minimal adverse events in relapsed HL.
“Rash is the only grade 3-4 toxicity,” Dr Diefenbach said. “There are no significant cytopenias [and] no febrile neutropenia. Growth factor support is not required, and it’s administered outpatient.”
Using brentuximab as second-line therapy results in an ORR of 85.7% and a CR of 50%, she added. And ASCT after brentuximab shows similar successes and toxicities.
Brentuximab followed by ICE leads to high rates of PET normalization, allows successful transplantation of virtually all evaluable patients, and poses no issues with stem cell collection.
Furthermore, studies show a 92% disease-free survival, with minimal toxicity at 10 months of follow-up.
In conclusion, Dr Diefenbach said, “Maximizing disease control prior to ASCT will maximize cure from ASCT. Brentuximab vedotin is a novel agent that leads to a high ORR and high CR rate with low toxicity and outpatient administration. In contrast, conventional chemotherapy fails to provide a high CR rate, has unacceptable toxicity, and there is no single standard of care.”
For an opposing opinion on salvage in HL, see “Speaker adovcates chemo-based salvage in HL.” ![]()
Transfusions benefit adults with sickle cell disease
PHILADELPHIA—Blood transfusions can provide pain relief in adults with sickle cell disease (SCD) who have failed treatment with hydroxyurea, a pilot study suggests.
Patients had fewer visits to the emergency department (ED) and fewer hospital admissions for pain control after they received chronic transfusions for pain prophylaxis than they did prior to receiving transfusions.
Matthew S. Karafin, MD, of the Blood Center of Wisconsin in Milwaukee, presented these results at the AABB Annual Meeting 2014 (abstract S42-030G).
“Pain in adults with sickle cell disease is probably one of the most important things that we deal with in our clinics,” he began. “It is the leading cause of morbidity in this population.”
Dr Karafin also noted that adults with SCD seem to experience pain differently from children, reporting more of a constant pain, as opposed to the episodic pain observed in kids. And although previous studies have suggested that transfusions do provide pain relief in SCD, most of those studies have focused on children.
So Dr Karafin and his colleagues set out to determine the impact of prophylactic transfusions on the rate of serious pain episodes in adults with SCD. The team retrospectively analyzed a cohort of patients who received chronic transfusions at 3- to 8-week intervals from January 2009 to October 2013.
The researchers defined chronic transfusions as receiving blood—either simple transfusions or red cell exchanges—in an outpatient setting 3 days a week with the goal of controlling hemoglobin (Hb) S percentage, maintaining it at less than 30%.
Patients had to have at least 1 ED or hospital visit for severe pain per month prior to starting transfusions, they were required to have failed hydroxyurea therapy, and they had to have at least 3 months both on and off chronic transfusions. The patients could have no other reason for receiving chronic transfusions (ie, no previous stroke).
So the study included 17 patients, 12 of whom were female. Fifteen (88.1%) had Hb SS disease, and 2 had Hb SC disease. Their median age was 26 (range, 20-54).
“We were able to record 541 total ED admissions over the study period and 404 total hospital admissions,” Dr Karafin said. “The median study evaluation period pre-transfusion was about 3.5 years, and we were able to study [patients for] a median of more than a year for the post-transfusion protocol period.”
Dr Karafin also noted that most of the patients were not transfusion-naïve, but they received significantly more units after being placed on the transfusion protocol.
The median number of red cell units received per 100 days was 1.2 (range, 0-7.2) pre-transfusion and 10.2 (range, 6.7-24.3) post-transfusion (P=0.0003). Nine of the patients received simple transfusions, and 8 received red cell exchanges.
There was a significant difference in the median Hb S pre- and post-transfusion—79% (range, 26.5%-89.6%) and 30.2% (range, 10.9%-57.4%), respectively (P=0.0003).
But there was no significant difference in median ferritin levels—1128.2 ng/mL (range, 65.4-11,130) and 2632.8 ng/mL (range, 16.7-8023.6), respectively (P=0.18). Dr Karafin said this could be explained by the fact that patients were not transfusion-naïve prior to starting the protocol.
Similarly, the median new alloantibody rate per 100 units was 0 both pre- and post-transfusion. This may be due to the fact that all patients received C-, E-, and KEL-matched blood, as well as the freshest available units, Dr Karafin said.
He and his colleagues also found that the median ED admission rate was significantly lower post-transfusion compared to pre-transfusion—0.79 (range, 0-6.6) and 2 (range, 0.4-11) visits every 100 days, respectively (P=0.04).
Thirteen patients (76.5%) had a reduced ED visit rate after chronic transfusion, and there was a 60.5% reduction in the ED visit rate overall.
Likewise, the median hospital admission rate decreased from 1.7 per 100 days (range, 0.05-5.8) pre-transfusion to 1.3 per 100 days (range, 0.2-3.2) post-transfusion (P=0.004).
Fifteen patients (88.2%) had reduced hospital admissions after chronic transfusion, and there was a 20.3% reduction in hospital admissions overall.
Dr Karafin noted that this study had a number of limitations, including a small number of patients, its retrospective nature, and the fact that it was conducted at a comprehensive SCD clinic.
“However, limitations aside, we found significant evidence to support that the findings observed in children seem to be similar in the adult population,” he said.
Namely, chronic transfusions can prevent serious pain episodes in adults with SCD who have failed treatment with hydroxyurea. ![]()
Speaker advocates chemo-based salvage in HL

Credit: Rhoda Baer
NEW YORK—Physicians should use chemotherapy-based approaches—not brentuximab vedotin—as second-line therapy for recurrent
Hodgkin lymphoma (HL) prior to transplant, according to a speaker at the Lymphoma & Myeloma 2014 congress.
Nina Wagner-Johnston, MD, of Washington University in St Louis, Missouri, provided the meeting’s audience with a handful of arguments to support chemotherapy-based salvage regimens and a number of reasons why brentuximab is not ideal as salvage therapy in HL.
First, there is data supporting the use of chemotherapy-based salvage regimens in these patients, but the brentuximab data is lacking.
“Other issues include chemosensitivity, stem cell collection, unknown progressive multifocal leukoencephalopathy (PML) risk with brentuximab pre-ASCT [autologous stem cell transplant], cost, and alternative roles for brentuximab to enhance cure upfront post-ASCT maintenance,” Dr Wagner-Johnston said.
She also noted that chemotherapy-based salvage regimens yield high response rates with adequate stem cell collections.
“The vast majority of patients proceed to ASCT, 86% with ICE chemotherapy [ifosfamide, carboplatin, and etoposide],” she said. “Many are cured with a chemotherapy-based approach, with a 5-year PFS [progression-free survival] of 50% to 60%, with a low incidence of febrile neutropenia.”
Dr Wagner-Johnston also raised the possibility that giving patients brentuximab prior to ASCT might increase the risk of PML. The risk is already increased with lymphoma and ASCT. And in cases of PML in which patients are treated with brentuximab, the onset is rapid, with a median of about 2 months after initiation.
Furthermore, the cost of therapy clearly favors chemotherapy over brentuximab, she said. Three cycles of brentuximab at 1.8 mg/kg cost more than $58,000, and 2 cycles of brentuximab (3 weeks on, 1 week off) at 1.2 mg/kg cost more than $78,000.
In comparison, 3 cycles of ICE cost less than $38,000 and 3 cycles of ESHAP (etoposide, methylprednisolone, high-dose cytarabine, and cisplatin) cost $17,000. These costs do not account for the increased risk of febrile neutropenia.
Dr Wagner-Johnston expressed other concerns about brentuximab as well.
“Brentuximab is probably not effective to pursue as a single agent,” she said. “The addition of brentuximab to chemotherapy increases toxicity and cost. Continuous progressions years after ASCT call into question a 2-year benchmark and further highlight the importance of a maintenance approach.”
There are several unanswered pivotal questions about brentuximab, Dr Wagner-Johnston continued.
“Is brentuximab sensitivity equivalent to chemosensitivity?” she asked. “Does improved CR [complete response] rate with brentuximab-based treatment equate to better outcomes? Is the likelihood of cure higher with brentuximab-based approaches?”
She said brentuximab may be best in the upfront setting. There are more upfront cures in the highest-risk group with this novel agent, and it may allow a greater number of patients to avoid the toxicity of ASCT.
Brentuximab has demonstrated safety in phase 1/2 studies, Dr Wagner-Johnston said, adding “we await data from an ongoing phase 3 trial to determine a PFS benefit with brentuximab.”
Furthermore, post-ASCT maintenance with brentuximab may be a better alternative than salvage brentuximab pre-ASCT. In the relapsed setting, the median duration of response for brentuximab is short (6.7 months in a phase 2 study) after a median of 9 cycles.
In the phase 3 placebo-controlled trial of maintenance brentuximab following ASCT, “an interim analysis based on safety and utility recommends continuation,” Dr Wagner-Johnston said.
In conclusion, she said, “Before letting brentuximab take over, we need to confirm its safety, efficacy, and determine the best positioning of brentuximab to enhance outcomes. In the meantime, stick with what we know works.”
For the dissenting opinion on salvage in HL, see “Brentuximab tops chemo in HL, doc says.” ![]()
The economics of gynecologic surgery: 13 coding tips to ensure fair payment
The payment structure for physicians is changing. Our government, the American public, purchasers, and employers are unhappy with the fee-for-service system as it currently exists, and are pushing to drive the system into what is called “value-based purchasing.”
But what is value?
One way to define it is quality divided by cost—but how do we measure quality?
At present, insurers are measuring your quality based on some nebulous definition created at United Healthcare or Blue Cross Blue Shield—looking specifically at your “efficiency,” based on the costs attributed to you, as revealed in the codes you and others submit to payers.
Let’s say you perform minimally invasive surgery, and the referring physician ordered a lot of tests before sending the patient to you. Are you aware that all of those costs may be attributed to you in an administrative system?
ACOG is working hard to establish clinical systems rather than administrative ones to determine the true cost of care. We may want to think of obstetrics and gynecology as primary care and take advantage of advanced payment models and the opportunities afforded to accountable care organizations, but the truth is, insurers frequently do not consider us primary care. Although some of us may develop medical homes for women’s health care, we are unlikely to collect a per-patient, per-month income like primary care physicians do. That means that we need to be more assertive in negotiating contracts with insurers.
In this article, I offer recommendations for such negotiations and explain how to determine what you can and cannot accept in terms of payment.
You are the responsible party
Some of us do our own coding and some of us do not. However, if that coding is inaccurate, it is the physician who goes to jail, not the coder. You are personally responsible and liable for the coding submitted under your provider number.
Clearly, we need to do a better job of advocating for ourselves. We need to lobby. Legislators and bureaucrats are less likely to target people who have strong lobbyists working consistently on their behalf.
Accountable care organizations may have some leverage in negotiating lower prices, and some market forces may come into play in large systems. It remains to be seen which models will succeed as new payment structures develop. The overarching question: What can we do today to optimize our payments, given the system that we have? Here are 13 tactics that can enhance your bottom line.
1. Know the rules
To play the game, you must know the rules. You need to know what systems payers are using to determine your reimbursement—and you have to understand those systems as well as, or better than, the payers do. Then you’ll be able to use them to your advantage.
Payers are well aware that we don’t like to focus on this end of practice, that what we really want to do is spend the day practicing medicine. However, we need to learn these details because we’re leaving money on the table every single day.
2. Educate yourself
With the change to the International Classification of Diseases (ICD) scheduled to take effect on October 1, 2015, many of us are worried that payers are going to reject our claims because of our lack of familiarity with ICD-10.
Rest assured. There are crosswalks from ICD-9 to ICD-10. ACOG has published an information sheet for both obstetrics and gynecology that pairs typically used ICD-9 codes with their ICD-10 counterparts. And because it is published by ACOG, payers will find it hard to claim that it’s inaccurate.
ACOG also offers half-day courses on ICD-10 coding for both physicians and staff.
3. Record your decision-making process
When I audit medical charts, I often discover that this process has been neglected. Instead, the coder has relied on documentation from the electronic health record and a basic description of the treatment plan. But a plan is just that—what someone intends to do. It doesn’t convey the decision-making that underlies it. What was the differential diagnosis? What did you discuss with the patient? These details are critical for appropriate coding of the level of service—whether it’s high, intermediate, or low.
4. Refine your approach to coding
Recognize that the system is currently set up to pay physicians for the services we provide—and that service must be justified by the appropriate diagnosis code. Tougher cases, or high-risk patients, tend to have longer surgeries and hospital stays, and their outcomes often are not as good as those of more typical patients. They may have more complications because they’re obese or have severe diabetes, for example. If so, it is critical that these other conditions—obesity and severe diabetes—be included with the principal diagnosis code so that risk stratification is possible. Otherwise, we will be held to the same standard as someone treating a routine, low-risk case.
Risk stratification is being performed according to algorithms in the payers’ software—and payers are unlikely to share the details with us. However, the only real data payers have to run through these algorithms come from diagnosis coding. Even though you’re not required to code for variables such as obesity and diabetes in order to get paid for what you do, you do need to use those additional codes to make risk stratification possible—so that you don’t get inappropriately placed into a group of low-risk providers when you are treating a higher-risk cohort.
5. Develop an understanding of RVUs
Another variable that changes regularly is relative value units (RVUs) under Medicare rules. ACOG’s Committee on Health Economics and Coding—which enjoys the participation of AAGL, the American Urogynecologic Society (AUGS), the Society of Gynecologic Surgeons (SGS), and the Society of Gynecologic Oncology (SGO), as well as other organizations—tries to maintain the RVUs as up to date and appropriate as possible relative to other services in the fee schedule.
For example, about 10 years ago many urogynecologic procedures were getting bundled together when they were performed at the same time. We had only one or two ICD-9 codes to describe prolapse, with no separate codes to describe whether it affected the anterior, apical, or posterior compartment, even though we performed different procedures in the individual compartments. Payers were mapping all prolapse procedures to the same diagnosis code. So ACOG went to the National Center for Health Statistics, where ICD-9 coding was done—and developed a series of about 10 codes to describe the different areas that prolapse could affect.
That kind of nuanced coding is continuing today. In fact, we have a long list of areas to go forward with now that ICD-10 is scheduled to take effect. A good example involves new Pap smear guidelines, which recommend testing every 3 or 5 years except for patients who have undergone hysterectomy for benign disease. How do you code for a patient who has had a hysterectomy? There was no code for a woman with an absent cervix, so we created a “V-code,” a code classification for factors that influence health status, so that it is possible to explain why a Pap smear was not performed.
As we go forward into a value-based system, specialists like us likely will be negotiating contracts according to RVU-based payments. That’s why it’s important for you to understand the resource-based relative value scale (RBRVS). It has three components: a work component, which makes up about 52% of the total RVUs; a practice expense, which makes up more than 45% of total RVUS; and, finally, a malpractice component, a small percentage. There also is a geographic adjustment and a uniform conversion factor.
When you hear about the sustainable growth rate (SGR) fix, and the fact that we’re going to see a 20% or 24% reduction in payment, that talk is referring to a reduction in the conversion factor. Each component of the RVU is adjusted for geography and then multiplied by the dollar conversion factor to calculate the total RVUs. The work, practice, and malpractice components vary by where the service is provided.
Let’s use placement of Essure inserts as an example. If you perform the procedure in the hospital, then the hospital buys the equipment, including the hysteroscope and light source. The hospital also pays for the room and staff and manages equipment sterilization. If, on the other hand, you perform the procedure in your office, all those responsibilities are yours. If it’s done in your office, you get paid more but it also costs you more.
The Relative Value Update Committee, or RUC, plays a major role in determining RVUs. This committee is composed of 31 clinicians, including nonphysician providers, psychologists, and nurses who deliver services under the Medicare fee schedule. The RUC makes recommendations to the Centers for Medicare and Medicaid Services (CMS), but it is the Secretary of Health and Human Services who determines the final rule on RVUs.
Approximately 75% to 95% of the recommendations of the RUC are accepted by the Secretary and become law. So it’s not the RUC or the American Medical Association (AMA) that determines RVUs; in the long run, it is CMS and the Secretary of Health and Human Services. We are fortunate that, when CMS assigns RVUs we’re not happy with, we have an opportunity to appeal.
Under Medicare, all physician payments are based on the same conversion factor, regardless of specialty. That’s not necessarily true for other payers, who may, essentially, do whatever they wish. These other payers frequently will contract at higher or lower rates, depending on how prevalent a specialist is in the community. Sometimes they use a higher conversion factor for surgical specialists than they use for primary care.
6. Find out which RVUs the payer is using
When you negotiate contracts with payers, and you are in private practice or part of a medical practice, it’s important to know what year’s RVUs the payer is using, as RVUs vary from year to year. For example, if the payer is using the RBRVS from 2002, it is paying you less than you should be getting. So when you look at a contract, you should determine not only whether the payer is anchoring your payment to the RBRVS but also whether it is keeping up with current RVUs as well. What dollar conversion factor is the payer using? What global periods—the same as CMS, or something different?
7. Determine what global period is in play
Some private payers use 6 postoperative weeks as the global period for a surgical procedure, whereas Medicare uses 90 days. You need to know which period is in play so that you don’t leave money on the table if you see the patient within 90 days but more than 6 weeks postoperatively.
Current Procedural Terminology (CPT) has global surgical packages that include a 10-day or 90-day period. But those periods do not include services provided more than 24 hours before the procedure. They don’t include the administration of anesthesia or conscious sedation. And they don’t include management of complications, exacerbations, or recurrences. Nor do they include additional services that might be necessary due to the presence of another disease or injury.
Under Medicare, the rules are different. Medicare preoperative services begin 1 day before surgery. However, any preoperative intervention is included whether it’s performed 1 day or 1 week before surgery. If it’s simply a preoperative physical examination for the patient and you aren’t performing significant evaluation and management, it’s included in the global package, along with all the intraoperative work. In addition, under Medicare, you don’t get paid for the management of complications unless a return to the operating room is required.
8. Learn to use modifiers
As ObGyns, we often see patients for multiple conditions or problem reports, so you need to be aware that if a patient is within a global period and you do not submit a bill with a modifier to indicate special circumstances, the intervention will be bundled into the global and you will not get paid for it. Modifiers are two-digit codes that describe these separate services. They provide critical information to payers so that their computer programs separate these services out for payment.
Major surgical procedures don’t include unrelated procedures that are performed at the same time of surgery. Nor do they include visits that take place during the global period that are unrelated to the original surgery. For example, if a patient presents with a breast lump after you performed a hysterectomy, and you do a work-up, you deserve full payment for that evaluation and management service. If you don’t use a modifier, however, you won’t get that payment.
9. Don’t be passive when payers won’t pay
Let’s say you contract with HMOs or independent practice associations (IPAs), and they’re not compensating you for the extra things you’re doing and are failing to recognize surgical modifiers. What can you do about it?
You need to develop a profile of your typical patient. Because these organizations are individualizing it—they are saying that, in a typical scenario, this is the type of work you do. So these organizations offer a different kind of contract. Nevertheless, you can use your coding to help you determine what a fair payment should be, by going through your billing to determine what you’ve spent.
10. Analyze payer bundling
Medicare put in place a correct coding initiative (CCI) that lists services typically provided by the same person on the same day of service. The aim: to prevent separate payment for these services. These are “bundled” services. The CCI bundles are revised every quarter. They are listed on the ACOG Web site under “practice management.”
On October 1, 2014, the CCI inappropriately bundled pelvic organ prolapse repair procedures into the vaginal hysterectomy codes. ACOG, AUGS, SGS, and AAGL are arguing vehemently as this article is going to press to ensure that these damaging bundles are rescinded.
Private payers can bundle anything, and it may or may not make sense or be fair. One ACOG resource is the book Ob/Gyn Coding Manual: Components of Correct Procedural Coding, which is revised every year. It has a tear-out page for every procedure code and will help you determine whether or not a bundle is appropriate.
You need to know about bundling and dispute resolution. Why? Because it is possible to insert clauses into your contract that give you some rights. Insurers have all the clout and you have nothing unless you fight for it.
You may see clauses such as “the company reserves the right to re-bundle to the primary procedure....” You shouldn’t tolerate that. Rather, you want to say, “the company will use CCI bundled rules” so that you at least know what the rules are.
11. Don’t be afraid to revise a contract
If we have to hold a payer harmless, the payer should hold us harmless as well. If we consult an insurer’s Web site to confirm that a patient is covered, and we take her to surgery because we have evidence she has insurance, the insurer shouldn’t be able to rescind payment 6 months later because the patient didn’t pay for her insurance that month. That’s not fair. The company told you she was covered, and you deserve to get paid for that surgery because you are relying on information from the company itself. So when you sign a contract, you need to ensure that you are being held harmless as well as the insurer.
12. Calculate your own RVUs
Use your claims software for data. Consult the Federal Register or ACOG to determine the total number of RVUs for a given CPT code. Multiply the RVUs by the quantity for each code. Let’s say it’s an evaluation and management visit, code 99213, and you’ve done 50 this month. That’s 50 multiplied by 1.3 RVUs. Add all the codes together, then use your monthly profit and loss statement to determine what your expenses are. Divide your total expenses by the total number of RVUs to determine your practice cost per RVU. You then can decide on a conversion factor you can tolerate, and you can use this information when contracting with IPAs, HMOs, and other insurers.
13. Spend money to make money
There are many coding resources available to you. Coding is well worth what you spend on it because you can get it back in a heartbeat.
This information may not be easy to master, but it’s critically important for your economic survival—to get what’s rightfully yours and get paid fairly for what you do.
Share your thoughts on this article! Send your Letter to the Editor to [email protected]. Please include your name and the city and state in which you practice.

Barbara S. Levy, MD
Dr. Levy is Vice President for Health Policy at the American Congress of Obstetricians and Gynecologists. She also chairs the AMA Specialty Society Resource-Based Relative Value Update Committee, or RUC.
The author reports no financial relationships relevant to this article.
Barbara S. Levy, MD
Dr. Levy is Vice President for Health Policy at the American Congress of Obstetricians and Gynecologists. She also chairs the AMA Specialty Society Resource-Based Relative Value Update Committee, or RUC.
The author reports no financial relationships relevant to this article.
Barbara S. Levy, MD
Dr. Levy is Vice President for Health Policy at the American Congress of Obstetricians and Gynecologists. She also chairs the AMA Specialty Society Resource-Based Relative Value Update Committee, or RUC.
The author reports no financial relationships relevant to this article.
The payment structure for physicians is changing. Our government, the American public, purchasers, and employers are unhappy with the fee-for-service system as it currently exists, and are pushing to drive the system into what is called “value-based purchasing.”
But what is value?
One way to define it is quality divided by cost—but how do we measure quality?
At present, insurers are measuring your quality based on some nebulous definition created at United Healthcare or Blue Cross Blue Shield—looking specifically at your “efficiency,” based on the costs attributed to you, as revealed in the codes you and others submit to payers.
Let’s say you perform minimally invasive surgery, and the referring physician ordered a lot of tests before sending the patient to you. Are you aware that all of those costs may be attributed to you in an administrative system?
ACOG is working hard to establish clinical systems rather than administrative ones to determine the true cost of care. We may want to think of obstetrics and gynecology as primary care and take advantage of advanced payment models and the opportunities afforded to accountable care organizations, but the truth is, insurers frequently do not consider us primary care. Although some of us may develop medical homes for women’s health care, we are unlikely to collect a per-patient, per-month income like primary care physicians do. That means that we need to be more assertive in negotiating contracts with insurers.
In this article, I offer recommendations for such negotiations and explain how to determine what you can and cannot accept in terms of payment.
You are the responsible party
Some of us do our own coding and some of us do not. However, if that coding is inaccurate, it is the physician who goes to jail, not the coder. You are personally responsible and liable for the coding submitted under your provider number.
Clearly, we need to do a better job of advocating for ourselves. We need to lobby. Legislators and bureaucrats are less likely to target people who have strong lobbyists working consistently on their behalf.
Accountable care organizations may have some leverage in negotiating lower prices, and some market forces may come into play in large systems. It remains to be seen which models will succeed as new payment structures develop. The overarching question: What can we do today to optimize our payments, given the system that we have? Here are 13 tactics that can enhance your bottom line.
1. Know the rules
To play the game, you must know the rules. You need to know what systems payers are using to determine your reimbursement—and you have to understand those systems as well as, or better than, the payers do. Then you’ll be able to use them to your advantage.
Payers are well aware that we don’t like to focus on this end of practice, that what we really want to do is spend the day practicing medicine. However, we need to learn these details because we’re leaving money on the table every single day.
2. Educate yourself
With the change to the International Classification of Diseases (ICD) scheduled to take effect on October 1, 2015, many of us are worried that payers are going to reject our claims because of our lack of familiarity with ICD-10.
Rest assured. There are crosswalks from ICD-9 to ICD-10. ACOG has published an information sheet for both obstetrics and gynecology that pairs typically used ICD-9 codes with their ICD-10 counterparts. And because it is published by ACOG, payers will find it hard to claim that it’s inaccurate.
ACOG also offers half-day courses on ICD-10 coding for both physicians and staff.
3. Record your decision-making process
When I audit medical charts, I often discover that this process has been neglected. Instead, the coder has relied on documentation from the electronic health record and a basic description of the treatment plan. But a plan is just that—what someone intends to do. It doesn’t convey the decision-making that underlies it. What was the differential diagnosis? What did you discuss with the patient? These details are critical for appropriate coding of the level of service—whether it’s high, intermediate, or low.
4. Refine your approach to coding
Recognize that the system is currently set up to pay physicians for the services we provide—and that service must be justified by the appropriate diagnosis code. Tougher cases, or high-risk patients, tend to have longer surgeries and hospital stays, and their outcomes often are not as good as those of more typical patients. They may have more complications because they’re obese or have severe diabetes, for example. If so, it is critical that these other conditions—obesity and severe diabetes—be included with the principal diagnosis code so that risk stratification is possible. Otherwise, we will be held to the same standard as someone treating a routine, low-risk case.
Risk stratification is being performed according to algorithms in the payers’ software—and payers are unlikely to share the details with us. However, the only real data payers have to run through these algorithms come from diagnosis coding. Even though you’re not required to code for variables such as obesity and diabetes in order to get paid for what you do, you do need to use those additional codes to make risk stratification possible—so that you don’t get inappropriately placed into a group of low-risk providers when you are treating a higher-risk cohort.
5. Develop an understanding of RVUs
Another variable that changes regularly is relative value units (RVUs) under Medicare rules. ACOG’s Committee on Health Economics and Coding—which enjoys the participation of AAGL, the American Urogynecologic Society (AUGS), the Society of Gynecologic Surgeons (SGS), and the Society of Gynecologic Oncology (SGO), as well as other organizations—tries to maintain the RVUs as up to date and appropriate as possible relative to other services in the fee schedule.
For example, about 10 years ago many urogynecologic procedures were getting bundled together when they were performed at the same time. We had only one or two ICD-9 codes to describe prolapse, with no separate codes to describe whether it affected the anterior, apical, or posterior compartment, even though we performed different procedures in the individual compartments. Payers were mapping all prolapse procedures to the same diagnosis code. So ACOG went to the National Center for Health Statistics, where ICD-9 coding was done—and developed a series of about 10 codes to describe the different areas that prolapse could affect.
That kind of nuanced coding is continuing today. In fact, we have a long list of areas to go forward with now that ICD-10 is scheduled to take effect. A good example involves new Pap smear guidelines, which recommend testing every 3 or 5 years except for patients who have undergone hysterectomy for benign disease. How do you code for a patient who has had a hysterectomy? There was no code for a woman with an absent cervix, so we created a “V-code,” a code classification for factors that influence health status, so that it is possible to explain why a Pap smear was not performed.
As we go forward into a value-based system, specialists like us likely will be negotiating contracts according to RVU-based payments. That’s why it’s important for you to understand the resource-based relative value scale (RBRVS). It has three components: a work component, which makes up about 52% of the total RVUs; a practice expense, which makes up more than 45% of total RVUS; and, finally, a malpractice component, a small percentage. There also is a geographic adjustment and a uniform conversion factor.
When you hear about the sustainable growth rate (SGR) fix, and the fact that we’re going to see a 20% or 24% reduction in payment, that talk is referring to a reduction in the conversion factor. Each component of the RVU is adjusted for geography and then multiplied by the dollar conversion factor to calculate the total RVUs. The work, practice, and malpractice components vary by where the service is provided.
Let’s use placement of Essure inserts as an example. If you perform the procedure in the hospital, then the hospital buys the equipment, including the hysteroscope and light source. The hospital also pays for the room and staff and manages equipment sterilization. If, on the other hand, you perform the procedure in your office, all those responsibilities are yours. If it’s done in your office, you get paid more but it also costs you more.
The Relative Value Update Committee, or RUC, plays a major role in determining RVUs. This committee is composed of 31 clinicians, including nonphysician providers, psychologists, and nurses who deliver services under the Medicare fee schedule. The RUC makes recommendations to the Centers for Medicare and Medicaid Services (CMS), but it is the Secretary of Health and Human Services who determines the final rule on RVUs.
Approximately 75% to 95% of the recommendations of the RUC are accepted by the Secretary and become law. So it’s not the RUC or the American Medical Association (AMA) that determines RVUs; in the long run, it is CMS and the Secretary of Health and Human Services. We are fortunate that, when CMS assigns RVUs we’re not happy with, we have an opportunity to appeal.
Under Medicare, all physician payments are based on the same conversion factor, regardless of specialty. That’s not necessarily true for other payers, who may, essentially, do whatever they wish. These other payers frequently will contract at higher or lower rates, depending on how prevalent a specialist is in the community. Sometimes they use a higher conversion factor for surgical specialists than they use for primary care.
6. Find out which RVUs the payer is using
When you negotiate contracts with payers, and you are in private practice or part of a medical practice, it’s important to know what year’s RVUs the payer is using, as RVUs vary from year to year. For example, if the payer is using the RBRVS from 2002, it is paying you less than you should be getting. So when you look at a contract, you should determine not only whether the payer is anchoring your payment to the RBRVS but also whether it is keeping up with current RVUs as well. What dollar conversion factor is the payer using? What global periods—the same as CMS, or something different?
7. Determine what global period is in play
Some private payers use 6 postoperative weeks as the global period for a surgical procedure, whereas Medicare uses 90 days. You need to know which period is in play so that you don’t leave money on the table if you see the patient within 90 days but more than 6 weeks postoperatively.
Current Procedural Terminology (CPT) has global surgical packages that include a 10-day or 90-day period. But those periods do not include services provided more than 24 hours before the procedure. They don’t include the administration of anesthesia or conscious sedation. And they don’t include management of complications, exacerbations, or recurrences. Nor do they include additional services that might be necessary due to the presence of another disease or injury.
Under Medicare, the rules are different. Medicare preoperative services begin 1 day before surgery. However, any preoperative intervention is included whether it’s performed 1 day or 1 week before surgery. If it’s simply a preoperative physical examination for the patient and you aren’t performing significant evaluation and management, it’s included in the global package, along with all the intraoperative work. In addition, under Medicare, you don’t get paid for the management of complications unless a return to the operating room is required.
8. Learn to use modifiers
As ObGyns, we often see patients for multiple conditions or problem reports, so you need to be aware that if a patient is within a global period and you do not submit a bill with a modifier to indicate special circumstances, the intervention will be bundled into the global and you will not get paid for it. Modifiers are two-digit codes that describe these separate services. They provide critical information to payers so that their computer programs separate these services out for payment.
Major surgical procedures don’t include unrelated procedures that are performed at the same time of surgery. Nor do they include visits that take place during the global period that are unrelated to the original surgery. For example, if a patient presents with a breast lump after you performed a hysterectomy, and you do a work-up, you deserve full payment for that evaluation and management service. If you don’t use a modifier, however, you won’t get that payment.
9. Don’t be passive when payers won’t pay
Let’s say you contract with HMOs or independent practice associations (IPAs), and they’re not compensating you for the extra things you’re doing and are failing to recognize surgical modifiers. What can you do about it?
You need to develop a profile of your typical patient. Because these organizations are individualizing it—they are saying that, in a typical scenario, this is the type of work you do. So these organizations offer a different kind of contract. Nevertheless, you can use your coding to help you determine what a fair payment should be, by going through your billing to determine what you’ve spent.
10. Analyze payer bundling
Medicare put in place a correct coding initiative (CCI) that lists services typically provided by the same person on the same day of service. The aim: to prevent separate payment for these services. These are “bundled” services. The CCI bundles are revised every quarter. They are listed on the ACOG Web site under “practice management.”
On October 1, 2014, the CCI inappropriately bundled pelvic organ prolapse repair procedures into the vaginal hysterectomy codes. ACOG, AUGS, SGS, and AAGL are arguing vehemently as this article is going to press to ensure that these damaging bundles are rescinded.
Private payers can bundle anything, and it may or may not make sense or be fair. One ACOG resource is the book Ob/Gyn Coding Manual: Components of Correct Procedural Coding, which is revised every year. It has a tear-out page for every procedure code and will help you determine whether or not a bundle is appropriate.
You need to know about bundling and dispute resolution. Why? Because it is possible to insert clauses into your contract that give you some rights. Insurers have all the clout and you have nothing unless you fight for it.
You may see clauses such as “the company reserves the right to re-bundle to the primary procedure....” You shouldn’t tolerate that. Rather, you want to say, “the company will use CCI bundled rules” so that you at least know what the rules are.
11. Don’t be afraid to revise a contract
If we have to hold a payer harmless, the payer should hold us harmless as well. If we consult an insurer’s Web site to confirm that a patient is covered, and we take her to surgery because we have evidence she has insurance, the insurer shouldn’t be able to rescind payment 6 months later because the patient didn’t pay for her insurance that month. That’s not fair. The company told you she was covered, and you deserve to get paid for that surgery because you are relying on information from the company itself. So when you sign a contract, you need to ensure that you are being held harmless as well as the insurer.
12. Calculate your own RVUs
Use your claims software for data. Consult the Federal Register or ACOG to determine the total number of RVUs for a given CPT code. Multiply the RVUs by the quantity for each code. Let’s say it’s an evaluation and management visit, code 99213, and you’ve done 50 this month. That’s 50 multiplied by 1.3 RVUs. Add all the codes together, then use your monthly profit and loss statement to determine what your expenses are. Divide your total expenses by the total number of RVUs to determine your practice cost per RVU. You then can decide on a conversion factor you can tolerate, and you can use this information when contracting with IPAs, HMOs, and other insurers.
13. Spend money to make money
There are many coding resources available to you. Coding is well worth what you spend on it because you can get it back in a heartbeat.
This information may not be easy to master, but it’s critically important for your economic survival—to get what’s rightfully yours and get paid fairly for what you do.
Share your thoughts on this article! Send your Letter to the Editor to [email protected]. Please include your name and the city and state in which you practice.

Flight plan for robotic surgery credentialing: New AAGL guidelines
The AAGL, formerly the American Association of Gynecologic Laparoscopists, has approved the first-ever set of privileging and credentialing guidelines for robotic surgery.1
Why has this prestigious minimally invasive surgery organization done that?
Maybe you’ve seen the Internet and TV ads and billboard trucks driving outside of many major medical society meetings recently, advertising “1-800-BAD-Robot.”2 You also are probably aware of recent articles in the headlines of national periodicals like the Wall Street Journal claiming that robotic surgery can be harmful.3
And yet, robotic gynecologic surgery has grown at an unprecedented rate since its approval by the US Food and Drug Administration (FDA) in April 2005. Recent data from the Nationwide Inpatient Sample from the Agency for Healthcare Research and Quality indicate that robot-assisted hysterectomies have increased at a dramatic rate.4 In a recent study of the FDA’s MAUDE (Manufacturer and User Facility Device Experience) database, investigators found that more than 30% of injuries during robotic surgery are related to operator error or robot failure, but the majority of problems are not associated with the technology.5
In this article, I use the aviation industry as an example of a sector that has gotten safety right. By emulating many of its standards, our specialty can make great strides toward patient safety and improved outcomes. I also outline the main points of the new AAGL guidelines and the rationale behind them.1 See, for example, the summary box on page 46.

A “shining example”
The robot clearly is an enabling technology. With its high-definition 3D vision and scaled motion with wristed instruments, surgeons are more comfortable performing many complex gynecologic procedures that previously would have required open surgery to safely accomplish … but the da Vinci Robot does not make a poor surgeon a great surgeon.
Hospitals now are being sued for allowing surgeons to perform robotic surgery on patients without documenting adequate surgeon training or providing consistent oversight.6 This new technology has outpaced the ability of hospital medical staffs to establish practice guidelines and rules to ensure patient safety.
The aviation industry is a shining example of a highly reliable industry. Each day, thousands of commercial aircraft fly all over the world with amazing safety. Most of the time, the pilot and copilot have never flown together. However, each crew member knows his or her role precisely and clearly understands what is expected. Crew members must meet standards that transcend all airlines and all aircraft.7 They all practice communication and undergo standardized training, including simulation, prior to taking off with live passengers on board.
In addition, all pilots must demonstrate their proficiency and competence on a regular basis—by exhibiting actual safe flight performance (over multiple takeoffs and landings) and undergoing check rides with flight examiners and practicing routine and emergency procedures on flight simulators. Airline passengers have come to expect that all pilots are equally proficient and safe. Shouldn’t patients be able to expect the same from their surgeons and hospitals? And yet there is no national or local organization that ensures that all surgeons are equally safe in the operating room. That responsibility is too often left up to the courts.
Three requirements of robotic credentialing
In 2008, the MultiCare Health System in the Pacific Northwest adopted a unique system of robotic credentialing that was based on the aviation model.8 This model has three main components, which are identical to the guidelines imposed on pilots:
- Surgeons selected for training should be likely to be successful in performing robotic surgeries safely and efficiently.
- Practice makes perfect. There should be a minimum number of procedures performed on a regular basis to ensure that the surgeon maintains his or her psychomotor (hand-eye coordination) skills. The aviation world calls this concept “currency.”
- Surgeons, like pilots, should be required to demonstrate their competency in operating the robot on a regular basis.
Adoption of these tried-and-true safety principles would ensure that hospitals exercise their responsibility to protect patients who undergo robotic surgeries in their systems.
The AAGL’s Robotics Special Interest Group, formed in 2010, is now the largest special interest group in the organization. The group was initially tasked to develop evidence-based guidelines for robotic surgery training and credentialing. Using the aviation industry’s model, the group developed a basic template of robotic surgery credentialing and privileging guidelines that can be used anywhere in the world. This proposal is not meant to be a standard-of-care definition; rather, it is intended simply as a starting point.
Key components of new AAGL robotic surgery credentialing and privileging guidelines1
Initial training
- Train only surgeons who have an adequate case volume to get through the learning curve. Recommended: at least 20 major cases per year.
- Current training pathways include computer-based learning, case observations, pig labs, simulation, and proctored cases. More intense validated simulation training could replace pig labs.
- Surgeons should initially perform only simple, basic procedures with surgeon first-assists until they develop the necessary skills to safely operate the robotic console and start performing more complex cases.
Annual currency
- Surgeons should perform at least 20 major cases per year, with at least one case every 8 weeks.
- If surgeons operate less frequently, proficiency should be verified on a simulator before operation on a live patient.
Annual recertification
- All surgeons should demonstrate competency annually on a simulator, regardless of case volume.
Initial training involves a long learning curve
There is a long learning curve for surgeons to become competent in robotic surgery. In initial studies of experienced advanced laparoscopic surgeons, investigators found that learning curves could involve 50 cases or more.9,10 In a recent study of gynecologic oncologists and urogynecologists at the Mayo Clinic, researchers found that it took 91 cases for experienced surgeons to become proficient on the robot.11
ObGyns in the United States are doing fewer hysterectomies than they used to.12 Many surgeons now perform fewer than 10 hysterectomies per year. These surgeons clearly have worse outcomes than surgeons who operate more frequently.13–15 Therefore, these new guidelines suggest that hospitals should choose to train only surgeons who have a case volume that will allow them to get through their learning curve in a short time and continue to have enough surgeries to maintain their skills. These guidelines recommend that surgeons who are candidates for robotic surgery training already perform a minimum of 20 major gynecologic operations per year.
It is important to learn to walk before you run. New student pilots start out with single-engine propeller planes before graduating to multi-engine props, jets, and commercial aircraft. Similarly, new medical students start out with easy surgical tasks before training for more complex procedures. This approach seems like common sense, although many surgeons may feel that, after orienting on the robot, they can start doing complex cases right away, as the robot enables them to do better and more precise surgery. Nothing could be further from the truth.
It is very important that new robotic surgeons start with easy, basic cases to completely familiarize themselves with the operation of the robot console before attempting more complex and difficult cases.
There is no absolute number of cases that ensures competency with the robot; the number depends on the surgeon’s case load, surgical prowess, and psychomotor skills. A surgeon should be restricted to simple cases initially, and should have an experienced robot-credentialed surgeon operating with him or her during this initial learning period.
Practice makes perfect
Musicians will tell you that the more often you practice, the more skilled you become. This is true for anyone whose job requires special training. It would be naïve to assume that surgeons can maintain optimal skills for robotic surgery by performing only a few cases each year.
Psychomotor skill degradation has been explored in relation to various surgical skills. The more complex the skill, the more likely that skill set will deteriorate without use. In recent studies, investigators have shown that robotic surgery skills begin to decline significantly after only 2 weeks of inactivity, and that skills continue to degrade without use.16,17
Based on this information, the currency requirement for surgeons to maintain privileges was set at 20 cases per year—fewer than two cases per month. Although the members of the Robotics Special Interest Group strongly agree that
maintenance of privileges should not be based entirely on an arbitrary currency number, as Tracy and colleagues also argue in a recent publication,18 it is clear that frequent performance of robotic surgery by high-volume surgeons clearly is more efficient and safer, with lower total operative times and complication rates, than robotic surgery performed by lower-volume surgeons.8
Currency is a well-accepted safety standard in aviation, and pilots know the importance of frequent practice and repetition in the cockpit under real-world conditions.
Ensure annual competency
Although a pilot must accomplish a minimum number of flying hours each year to maintain certification, this does not ensure that passengers will be safe. Pilots also must prove their competence by undergoing periodic check rides and demonstrating their skills on flight simulators.
Surgeons also can use these models to verify competency. Proctors who are independently certified by the FDA or another government agency as examiners could observe and evaluate surgeons performing robotic surgery using standardized checklists and grading forms. If done locally, care must be taken to assure standardization, as local hospital politics could interfere.
The only other methods currently available to verify surgeon competency are to demonstrate proficiency on simulation and to review outcomes data, looking for outliers in important areas such as complications, robotic console times, total operative times, length of stay, etc.
Simulation offers a standardized, independent method to monitor competency.19 A passing test score on a robotic simulator exercise could be a way for a surgeon to prove his or her competency. Basic robotic skills such as camera control and clutching, energy use, and sewing and needle control can be practiced on a robotic simulator.
Virtual cases such as hysterectomy and myomectomy are not yet available on the simulator, nor are cases involving typical complications. These are being developed, however, and will be available shortly.
Several gynecologic resident and fellowship training programs are using simulation to train novice surgeons, and some community hospitals are using simulation as an annual requirement for all practicing surgeons to demonstrate proficiency, similar to pilots.8 Some newer validated training protocols require a surgeon to demonstrate mastery of a particular robotic skill by achieving passing scores at least five times, with at least two consecutive passing scores.20,21
As simulators evolve, they will continue to be incorporated into training, used for surgeon warm-up before surgery, as refreshers for surgeons after a period of robotic inactivity, and for annual recertification.
When robotic surgery leads to legal trouble
A recent medical malpractice case highlights the importance of having guidelines in place to protect patients. In Bremerton, Washington, in 2008,1 a urologist performed his first nonproctored robotic prostatectomy. The challenging and difficult procedure took more than 13 hours; he converted to an open procedure after 7 hours. The patient developed significant postoperative complications and died.1
In the litigation that followed, the surgeon was sued for negligence and for failing to disclose that this was his first solo robot-assisted surgery. The surgeon settled, as did the hospital, which was sued for not supervising the surgeon and failing to ensure that he could use the robot safely. The family also sued Intuitive Surgical, the manufacturer of the da Vinci Robot, for failing to provide adequate training to the surgeon.2
The jury ruled in favor of the manufacturer, stating that the verification of adequate surgeon training was the responsibility of the hospital and specialty medical societies, not the industry.
References
- Estate of Fred Taylor v. Intuitive Surgical Inc., 09-2-03136-5, Superior Court, State of Washington, Kitsap County (Port Orchard).
- Ostrom C. Failed robotic surgery focus of Kitsap trial. Seattle Times. http://seattletimes.com/html/localnews/2020918732_robottrialxml.html Published May 3, 2013. Accessed October 10, 2014.
A word to the wise
If hospital departments really want to ensure that they are doing all that they can to make robotic surgeries safe for their patients, they will utilize the recent guidelines approved by AAGL. In order for these guidelines to work, hospital systems need to commit resources for medical staff oversight, including a robotics peer-review committee with a physician chairman and adequate medical staff support to monitor physicians and manage those who cannot meet these goals.
There clearly will be push-back from surgeons who feel that it is unfair to restrict their ability to perform surgery just because their volumes are low or they can’t master the simulation exercises. However, in the final analysis, would we want the airlines to employ pilots who fly only a couple of times a year or who can’t master the required simulation skills to safely operate a commercial passenger jet?
The important question is, what is our focus? Is it to be “fair” to all surgeons, or is it to provide the best and safest outcomes for our patients? As surgeons, we each need to remember the oath we took when we became physicians to “First, do no harm.” By following these new AAGL robotic surgery guidelines, we will reassure our patients that we, as physicians, do take that oath seriously.
INSTANT POLL
For credentialing and privileging of robotic gynecologic surgery, do you agree that the following points are essential components of the process?
1. Surgeons should be selected for training who are most likely to be successful in performing robotic surgeries safely and efficiently.
2. There should be a minimum number of procedures performed on a regular basis to ensure that the surgeon maintains his or her psychomotor (hand-eye coordination) skills.
3. Surgeons, like pilots, should be required to demonstrate their competency in operating the robot on a regular basis.
Answer:
a. Yes, I agree.
b. No, I believe this approach is too restrictive.
c. No, I believe this approach is not restrictive enough.
To vote, please visit obgmanagement.com and look for “Quick Poll” on the right side of the homepage.
Share your thoughts on this article! Send your Letter to the Editor to [email protected]. Please include your name and the city and state in which you practice.
1. Guidelines for privileging for robotic-assisted gynecologic laparoscopy. J Minim Invasive Gynecol. 2014;21(2):157–167.
2. Becnel Law Firm LLC. Bad Robot Surgery. http://badrobotsurgery.com. Accessed October 10, 2014.
3. Burton TM. Report raises concern on robotic surgery device. Wall Street Journal. http://online.wsj.com/news/articles/SB10001424052702304672404579186190568061568 Published November 8, 2013. Accessed October 10, 2014.
4. Rosero E, Kho K, Joshi G, Giesecke M, Schaffer J. Comparison of robotic and laparoscopic hysterectomy for benign gynecologic disease. Obstet Gynecol. 2013;122(4):778–786.
5. Fuchs Weizman N, Cohen S, Manoucheri E, Wang K, Einarsson J. Surgical errors associated with robotic surgery in gynecology: a review of the FDA MAUDE database. J Minim Invasive Gynecol. 2013;20(6):S171.
6. Lee YL, Kilic G, Phelps J. Medicolegal review of liability risks for gynecologists stemming from lack of training in robotic assisted surgery. J Minim Invasive Gynecol. 2011;18(4):512–515.
7. Federal Aviation Administration. Pilot Regulations. http://www.faa.gov/pilots/regs/. Updated March 20, 2013. Accessed October 10, 2014.
8. Lenihan JP. Navigating credentialing, privileging, and learning curves in robotics with an evidence- and experience-based approach. Clin Obstet Gynecol. 2011;54(3):382–390.
9. Lenihan J, Kovanda C, Kreaden U. What is the learning curve for robotic Gyn surgery? J Minim Invasive Gynecol. 2008;15(5):589–594.
10. Payne T, Dauterive F. A comparison of total laparoscopic hysterectomy to robotically assisted hysterectomy: surgical outcomes in a community practice. J Minim Invasive Gynecol. 2008;15(3):286–291.
11. Woelk J, Casiano E, Weaver A, Gostout B, Trabuco E, Gebhart A. The learning curve of robotic hysterectomy. Obstet Gynecol. 2013;121(1):87–96.
12. Wright JD, Herzog TJ, Tsui J, et al. Nationwide trends in the performance of inpatient hysterectomy in the United States. Obstet Gynecol. 2013;122(2 pt 1):233–241.
13. Boyd LR, Novetsky AP, Curtin JP. Effect of surgical volume on route of hysterectomy and short-term morbidity. Obstet Gynecol. 2010;116(4):909–915.
14. Wallenstein MR, Ananth CV, Kim JH, et al. Effects of surgical volumes on outcomes for laparoscopic hysterectomy for benign conditions. Obstet Gynecol. 2012;119(4):710–716.
15. Doll K, Milad M, Gossett D. Surgeon volume and outcomes in benign hysterectomy. J Minim Invasive Gynecol. 2013;20(5):554–561.
16. Jenison E, Gil K, Lendvay T, Guy M. Robotic surgical skills: acquisition, maintenance and degradation. JSLS. 2012;16(2):218–228.
17. Guseila L, Jenison E. Maintaining robotic surgical skills during periods of robotic inactivity. J Robotic Surg. 2014;8(3):261–268.
18. Tracy E, Zephyrin L, Rosman D, Berkowitz L. Credentialing based on surgical volume. Physician workforce challenges, and patient access. Obstet Gynecol. 2013;122(5):947–951.
19. Brand T. Madigan Protocol – Si Version. Mimic Technologies Web site. http://www.mimicsimulation.com/training/mshare/curriculum/?id=17. Accessed October 10, 2014.
20. Culligan P, Salamon C. Validation of a robotic simulator: transferring simulator skills to the operating room. Validation of a robotic surgery simulator protocol—transfer of simulator skills to the operating room. Fem Pelvic Med Recon Surg. 2014;20(1):48–51.
21. Culligan P. Morristown Protocol (Morristown Memorial Hospital). Mimic Technologies Web site. http://www.mimicsimulation.com/training/mshare/curriculum/?id=11. Accessed October 10, 2014.

John P. Lenihan Jr, MD
Dr. Lenihan is Clinical Associate Professor of Obstetrics and Gynecology at the University of Washington School of Medicine and Medical Director of Robotics and Minimally Invasive Surgery at MultiCare Health Systems in Tacoma, Washington.
The author reports that he is a speaker and Epicenter surgeon for Intuitive Surgical.
The AAGL, formerly the American Association of Gynecologic Laparoscopists, has approved the first-ever set of privileging and credentialing guidelines for robotic surgery.1
Why has this prestigious minimally invasive surgery organization done that?
Maybe you’ve seen the Internet and TV ads and billboard trucks driving outside of many major medical society meetings recently, advertising “1-800-BAD-Robot.”2 You also are probably aware of recent articles in the headlines of national periodicals like the Wall Street Journal claiming that robotic surgery can be harmful.3
And yet, robotic gynecologic surgery has grown at an unprecedented rate since its approval by the US Food and Drug Administration (FDA) in April 2005. Recent data from the Nationwide Inpatient Sample from the Agency for Healthcare Research and Quality indicate that robot-assisted hysterectomies have increased at a dramatic rate.4 In a recent study of the FDA’s MAUDE (Manufacturer and User Facility Device Experience) database, investigators found that more than 30% of injuries during robotic surgery are related to operator error or robot failure, but the majority of problems are not associated with the technology.5
In this article, I use the aviation industry as an example of a sector that has gotten safety right. By emulating many of its standards, our specialty can make great strides toward patient safety and improved outcomes. I also outline the main points of the new AAGL guidelines and the rationale behind them.1 See, for example, the summary box on page 46.
A “shining example”
The robot clearly is an enabling technology. With its high-definition 3D vision and scaled motion with wristed instruments, surgeons are more comfortable performing many complex gynecologic procedures that previously would have required open surgery to safely accomplish … but the da Vinci Robot does not make a poor surgeon a great surgeon.
Hospitals now are being sued for allowing surgeons to perform robotic surgery on patients without documenting adequate surgeon training or providing consistent oversight.6 This new technology has outpaced the ability of hospital medical staffs to establish practice guidelines and rules to ensure patient safety.
The aviation industry is a shining example of a highly reliable industry. Each day, thousands of commercial aircraft fly all over the world with amazing safety. Most of the time, the pilot and copilot have never flown together. However, each crew member knows his or her role precisely and clearly understands what is expected. Crew members must meet standards that transcend all airlines and all aircraft.7 They all practice communication and undergo standardized training, including simulation, prior to taking off with live passengers on board.
In addition, all pilots must demonstrate their proficiency and competence on a regular basis—by exhibiting actual safe flight performance (over multiple takeoffs and landings) and undergoing check rides with flight examiners and practicing routine and emergency procedures on flight simulators. Airline passengers have come to expect that all pilots are equally proficient and safe. Shouldn’t patients be able to expect the same from their surgeons and hospitals? And yet there is no national or local organization that ensures that all surgeons are equally safe in the operating room. That responsibility is too often left up to the courts.
Three requirements of robotic credentialing
In 2008, the MultiCare Health System in the Pacific Northwest adopted a unique system of robotic credentialing that was based on the aviation model.8 This model has three main components, which are identical to the guidelines imposed on pilots:
- Surgeons selected for training should be likely to be successful in performing robotic surgeries safely and efficiently.
- Practice makes perfect. There should be a minimum number of procedures performed on a regular basis to ensure that the surgeon maintains his or her psychomotor (hand-eye coordination) skills. The aviation world calls this concept “currency.”
- Surgeons, like pilots, should be required to demonstrate their competency in operating the robot on a regular basis.
Adoption of these tried-and-true safety principles would ensure that hospitals exercise their responsibility to protect patients who undergo robotic surgeries in their systems.
The AAGL’s Robotics Special Interest Group, formed in 2010, is now the largest special interest group in the organization. The group was initially tasked to develop evidence-based guidelines for robotic surgery training and credentialing. Using the aviation industry’s model, the group developed a basic template of robotic surgery credentialing and privileging guidelines that can be used anywhere in the world. This proposal is not meant to be a standard-of-care definition; rather, it is intended simply as a starting point.
Key components of new AAGL robotic surgery credentialing and privileging guidelines1
Initial training
- Train only surgeons who have an adequate case volume to get through the learning curve. Recommended: at least 20 major cases per year.
- Current training pathways include computer-based learning, case observations, pig labs, simulation, and proctored cases. More intense validated simulation training could replace pig labs.
- Surgeons should initially perform only simple, basic procedures with surgeon first-assists until they develop the necessary skills to safely operate the robotic console and start performing more complex cases.
Annual currency
- Surgeons should perform at least 20 major cases per year, with at least one case every 8 weeks.
- If surgeons operate less frequently, proficiency should be verified on a simulator before operation on a live patient.
Annual recertification
- All surgeons should demonstrate competency annually on a simulator, regardless of case volume.
Initial training involves a long learning curve
There is a long learning curve for surgeons to become competent in robotic surgery. In initial studies of experienced advanced laparoscopic surgeons, investigators found that learning curves could involve 50 cases or more.9,10 In a recent study of gynecologic oncologists and urogynecologists at the Mayo Clinic, researchers found that it took 91 cases for experienced surgeons to become proficient on the robot.11
ObGyns in the United States are doing fewer hysterectomies than they used to.12 Many surgeons now perform fewer than 10 hysterectomies per year. These surgeons clearly have worse outcomes than surgeons who operate more frequently.13–15 Therefore, these new guidelines suggest that hospitals should choose to train only surgeons who have a case volume that will allow them to get through their learning curve in a short time and continue to have enough surgeries to maintain their skills. These guidelines recommend that surgeons who are candidates for robotic surgery training already perform a minimum of 20 major gynecologic operations per year.
It is important to learn to walk before you run. New student pilots start out with single-engine propeller planes before graduating to multi-engine props, jets, and commercial aircraft. Similarly, new medical students start out with easy surgical tasks before training for more complex procedures. This approach seems like common sense, although many surgeons may feel that, after orienting on the robot, they can start doing complex cases right away, as the robot enables them to do better and more precise surgery. Nothing could be further from the truth.
It is very important that new robotic surgeons start with easy, basic cases to completely familiarize themselves with the operation of the robot console before attempting more complex and difficult cases.
There is no absolute number of cases that ensures competency with the robot; the number depends on the surgeon’s case load, surgical prowess, and psychomotor skills. A surgeon should be restricted to simple cases initially, and should have an experienced robot-credentialed surgeon operating with him or her during this initial learning period.
Practice makes perfect
Musicians will tell you that the more often you practice, the more skilled you become. This is true for anyone whose job requires special training. It would be naïve to assume that surgeons can maintain optimal skills for robotic surgery by performing only a few cases each year.
Psychomotor skill degradation has been explored in relation to various surgical skills. The more complex the skill, the more likely that skill set will deteriorate without use. In recent studies, investigators have shown that robotic surgery skills begin to decline significantly after only 2 weeks of inactivity, and that skills continue to degrade without use.16,17
Based on this information, the currency requirement for surgeons to maintain privileges was set at 20 cases per year—fewer than two cases per month. Although the members of the Robotics Special Interest Group strongly agree that
maintenance of privileges should not be based entirely on an arbitrary currency number, as Tracy and colleagues also argue in a recent publication,18 it is clear that frequent performance of robotic surgery by high-volume surgeons clearly is more efficient and safer, with lower total operative times and complication rates, than robotic surgery performed by lower-volume surgeons.8
Currency is a well-accepted safety standard in aviation, and pilots know the importance of frequent practice and repetition in the cockpit under real-world conditions.
Ensure annual competency
Although a pilot must accomplish a minimum number of flying hours each year to maintain certification, this does not ensure that passengers will be safe. Pilots also must prove their competence by undergoing periodic check rides and demonstrating their skills on flight simulators.
Surgeons also can use these models to verify competency. Proctors who are independently certified by the FDA or another government agency as examiners could observe and evaluate surgeons performing robotic surgery using standardized checklists and grading forms. If done locally, care must be taken to assure standardization, as local hospital politics could interfere.
The only other methods currently available to verify surgeon competency are to demonstrate proficiency on simulation and to review outcomes data, looking for outliers in important areas such as complications, robotic console times, total operative times, length of stay, etc.
Simulation offers a standardized, independent method to monitor competency.19 A passing test score on a robotic simulator exercise could be a way for a surgeon to prove his or her competency. Basic robotic skills such as camera control and clutching, energy use, and sewing and needle control can be practiced on a robotic simulator.
Virtual cases such as hysterectomy and myomectomy are not yet available on the simulator, nor are cases involving typical complications. These are being developed, however, and will be available shortly.
Several gynecologic resident and fellowship training programs are using simulation to train novice surgeons, and some community hospitals are using simulation as an annual requirement for all practicing surgeons to demonstrate proficiency, similar to pilots.8 Some newer validated training protocols require a surgeon to demonstrate mastery of a particular robotic skill by achieving passing scores at least five times, with at least two consecutive passing scores.20,21
As simulators evolve, they will continue to be incorporated into training, used for surgeon warm-up before surgery, as refreshers for surgeons after a period of robotic inactivity, and for annual recertification.
When robotic surgery leads to legal trouble
A recent medical malpractice case highlights the importance of having guidelines in place to protect patients. In Bremerton, Washington, in 2008,1 a urologist performed his first nonproctored robotic prostatectomy. The challenging and difficult procedure took more than 13 hours; he converted to an open procedure after 7 hours. The patient developed significant postoperative complications and died.1
In the litigation that followed, the surgeon was sued for negligence and for failing to disclose that this was his first solo robot-assisted surgery. The surgeon settled, as did the hospital, which was sued for not supervising the surgeon and failing to ensure that he could use the robot safely. The family also sued Intuitive Surgical, the manufacturer of the da Vinci Robot, for failing to provide adequate training to the surgeon.2
The jury ruled in favor of the manufacturer, stating that the verification of adequate surgeon training was the responsibility of the hospital and specialty medical societies, not the industry.
References
- Estate of Fred Taylor v. Intuitive Surgical Inc., 09-2-03136-5, Superior Court, State of Washington, Kitsap County (Port Orchard).
- Ostrom C. Failed robotic surgery focus of Kitsap trial. Seattle Times. http://seattletimes.com/html/localnews/2020918732_robottrialxml.html Published May 3, 2013. Accessed October 10, 2014.
A word to the wise
If hospital departments really want to ensure that they are doing all that they can to make robotic surgeries safe for their patients, they will utilize the recent guidelines approved by AAGL. In order for these guidelines to work, hospital systems need to commit resources for medical staff oversight, including a robotics peer-review committee with a physician chairman and adequate medical staff support to monitor physicians and manage those who cannot meet these goals.
There clearly will be push-back from surgeons who feel that it is unfair to restrict their ability to perform surgery just because their volumes are low or they can’t master the simulation exercises. However, in the final analysis, would we want the airlines to employ pilots who fly only a couple of times a year or who can’t master the required simulation skills to safely operate a commercial passenger jet?
The important question is, what is our focus? Is it to be “fair” to all surgeons, or is it to provide the best and safest outcomes for our patients? As surgeons, we each need to remember the oath we took when we became physicians to “First, do no harm.” By following these new AAGL robotic surgery guidelines, we will reassure our patients that we, as physicians, do take that oath seriously.
INSTANT POLL
For credentialing and privileging of robotic gynecologic surgery, do you agree that the following points are essential components of the process?
1. Surgeons should be selected for training who are most likely to be successful in performing robotic surgeries safely and efficiently.
2. There should be a minimum number of procedures performed on a regular basis to ensure that the surgeon maintains his or her psychomotor (hand-eye coordination) skills.
3. Surgeons, like pilots, should be required to demonstrate their competency in operating the robot on a regular basis.
Answer:
a. Yes, I agree.
b. No, I believe this approach is too restrictive.
c. No, I believe this approach is not restrictive enough.
To vote, please visit obgmanagement.com and look for “Quick Poll” on the right side of the homepage.
Share your thoughts on this article! Send your Letter to the Editor to [email protected]. Please include your name and the city and state in which you practice.
1. Guidelines for privileging for robotic-assisted gynecologic laparoscopy. J Minim Invasive Gynecol. 2014;21(2):157–167.
2. Becnel Law Firm LLC. Bad Robot Surgery. http://badrobotsurgery.com. Accessed October 10, 2014.
3. Burton TM. Report raises concern on robotic surgery device. Wall Street Journal. http://online.wsj.com/news/articles/SB10001424052702304672404579186190568061568 Published November 8, 2013. Accessed October 10, 2014.
4. Rosero E, Kho K, Joshi G, Giesecke M, Schaffer J. Comparison of robotic and laparoscopic hysterectomy for benign gynecologic disease. Obstet Gynecol. 2013;122(4):778–786.
5. Fuchs Weizman N, Cohen S, Manoucheri E, Wang K, Einarsson J. Surgical errors associated with robotic surgery in gynecology: a review of the FDA MAUDE database. J Minim Invasive Gynecol. 2013;20(6):S171.
6. Lee YL, Kilic G, Phelps J. Medicolegal review of liability risks for gynecologists stemming from lack of training in robotic assisted surgery. J Minim Invasive Gynecol. 2011;18(4):512–515.
7. Federal Aviation Administration. Pilot Regulations. http://www.faa.gov/pilots/regs/. Updated March 20, 2013. Accessed October 10, 2014.
8. Lenihan JP. Navigating credentialing, privileging, and learning curves in robotics with an evidence- and experience-based approach. Clin Obstet Gynecol. 2011;54(3):382–390.
9. Lenihan J, Kovanda C, Kreaden U. What is the learning curve for robotic Gyn surgery? J Minim Invasive Gynecol. 2008;15(5):589–594.
10. Payne T, Dauterive F. A comparison of total laparoscopic hysterectomy to robotically assisted hysterectomy: surgical outcomes in a community practice. J Minim Invasive Gynecol. 2008;15(3):286–291.
11. Woelk J, Casiano E, Weaver A, Gostout B, Trabuco E, Gebhart A. The learning curve of robotic hysterectomy. Obstet Gynecol. 2013;121(1):87–96.
12. Wright JD, Herzog TJ, Tsui J, et al. Nationwide trends in the performance of inpatient hysterectomy in the United States. Obstet Gynecol. 2013;122(2 pt 1):233–241.
13. Boyd LR, Novetsky AP, Curtin JP. Effect of surgical volume on route of hysterectomy and short-term morbidity. Obstet Gynecol. 2010;116(4):909–915.
14. Wallenstein MR, Ananth CV, Kim JH, et al. Effects of surgical volumes on outcomes for laparoscopic hysterectomy for benign conditions. Obstet Gynecol. 2012;119(4):710–716.
15. Doll K, Milad M, Gossett D. Surgeon volume and outcomes in benign hysterectomy. J Minim Invasive Gynecol. 2013;20(5):554–561.
16. Jenison E, Gil K, Lendvay T, Guy M. Robotic surgical skills: acquisition, maintenance and degradation. JSLS. 2012;16(2):218–228.
17. Guseila L, Jenison E. Maintaining robotic surgical skills during periods of robotic inactivity. J Robotic Surg. 2014;8(3):261–268.
18. Tracy E, Zephyrin L, Rosman D, Berkowitz L. Credentialing based on surgical volume. Physician workforce challenges, and patient access. Obstet Gynecol. 2013;122(5):947–951.
19. Brand T. Madigan Protocol – Si Version. Mimic Technologies Web site. http://www.mimicsimulation.com/training/mshare/curriculum/?id=17. Accessed October 10, 2014.
20. Culligan P, Salamon C. Validation of a robotic simulator: transferring simulator skills to the operating room. Validation of a robotic surgery simulator protocol—transfer of simulator skills to the operating room. Fem Pelvic Med Recon Surg. 2014;20(1):48–51.
21. Culligan P. Morristown Protocol (Morristown Memorial Hospital). Mimic Technologies Web site. http://www.mimicsimulation.com/training/mshare/curriculum/?id=11. Accessed October 10, 2014.

Optimal obstetric care for women aged 40 and older
CASE: Preterm labor in an older woman
G.S. is a 41-year-old G1P0 with a several-year history of infertility and a medical history of chronic hypertension. She undergoes in vitro fertilization (IVF) using her own oocytes, with transfer of two embryos. Early ultrasonography (US) confirms a diamniotic/dichorionic twin gestation. She undergoes chorionic villus sampling (CVS) during the first trimester, with normal fetal karyotypes noted.
For her chronic hypertension, the patient is treated with oral labetalol 200 mg twice daily, beginning in the first trimester. Results of a baseline comprehensive metabolic profile and complete blood count, and electrocardiogram are normal. Baseline 24-hour urine study results reveal no significant proteinuria and a normal creatinine clearance.
At 18 weeks’ gestation, US results show normal growth and amniotic fluid volume for each fetus, with no anomalies detected. Because of a gradual increase in the patient’s blood pressure, her labetalol dose is increased to 400 mg orally thrice daily. Her urine protein output remains negative on dipstick, and US every 4 weeks until 28 weeks’ gestation continues to show normal fetal growth and amniotic fluid volume.
At 33 weeks’ gestation, the patient presents with regular uterine activity. Nonstress tests for both fetuses are reactive. She is given a 1-L intravenous (IV) fluid bolus of lactated Ringers solution, as well as subcutaneous terbutaline sulfate every 15 minutes for four doses, without resolution of the uterine contractions. Her pulse has increased to 120 bpm.
How do you manage this patient’s care?
Nine times as many women aged 35 and older gave birth to their first child in 2012 than did women of the same age 40 years ago, according to the most recent data from the National Center for Health Statistics.1 The rate of first births for women aged 40 to 44 remained essentially stable during the 1970s and early 1980s but increased more than fourfold from 1985 through 2012—from 0.5 to 2.3 per 1,000 women.1 Clearly, more women are delaying childbearing to a later age by personal choice for reasons such as completion of education and career advancement.2
The path to late motherhood is not without thorns, however. Heightened risks associated with increasing maternal age include:
- fetal aneuploidy
- fetal malformation
- gestational diabetes
- chronic and gestational hypertension
- antepartum hemorrhage
- placenta previa
- prelabor rupture of membranes
- preterm labor.3,4
Women with advanced age at conception also are more likely to have a multifetal gestation because of the need for assisted reproduction and are more likely to require cesarean delivery5 as a result of abnormal placentation, fetal malpresentation, an abnormal pattern of labor, or increased use of oxytocin in labor. In addition, they are more likely to experience rupture of the sphincter, postpartum hemorrhage, and thromboembolism.3 Advanced maternal age also is associated with a higher risk of stillbirth throughout gestation, with the peak risk period reported to occur at 37 to 41 weeks.6
Maternal age-related risks of autosomal trisomies (especially Down syndrome) are well understood and have been quantified for singleton and twin gestations. TABLE 1 shows the risks at term for singleton and twin gestations for at least one chromosomally abnormal fetus by maternal age (40–46 years) and race.7
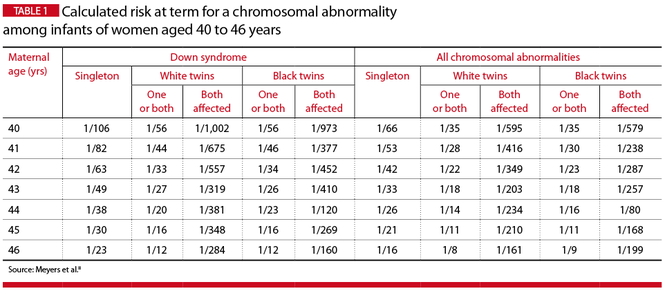
Preconception considerations
Aging and fertility
These combined result of aging of the ovary and uterus and an escalating risk of underlying medical comorbidities has a detrimental effect on fertility.8 Although assisted reproductive technologies are helpful, they cannot guarantee a live birth or completely compensate for an age-related decline in fertility.9
Many IVF programs refuse infertility treatment to women over age 43 or 44 who want to use their own oocytes. The reason: low pregnancy rates. The use of donor oocytes, however, increases the risks of gestational hypertension and preeclampsia. And if assisted reproductive technologies are needed, the risk for multifetal pregnancy increases.
Women of advanced maternal age are likely to have an older spouse or partner. There is no clearly accepted definition of advanced paternal age, but it is most often defined as an age of 40 years or older at the time of conception. Advanced paternal age has been associated with a higher risk for autism spectrum disorder and schizophrenia, as well as mutations in the FGFR2 and FGFR3 genes that result in skeletal dysplasias and craniosynostosis syndromes.10
Medical conditions are more common
Women of advanced maternal age have an increased rate of such prepregnancy chronic medical complications as diabetes, chronic hypertension, obesity, and renal and cardiac disease. Therefore, it is best to optimize control of these chronic illnesses prior to conception to minimize the risks of miscarriage, fetal anomalies, and gestational hypertension and preeclampsia.
Preeclampsia. Although daily low-dose (60–81 mg) aspirin has been used to reduce the risk of preeclampsia, current recommendations from the American College of Obstetricians and Gynecologists (ACOG) suggest that this therapy be reserved for women with a medical history of early-onset preeclampsia or those who have had preeclampsia in more than one pregnancy.11
Impact of obesity. We recently examined the influence of age and obesity on pregnancy outcomes of nulliparous women aged 40 or older at delivery.12 The study included women aged 20 to 29 years (n = 52,249) and 40 or older (n = 1,231) who delivered singleton infants. Women who reported medical disorders, tobacco use, or conception with assisted reproductive technology were excluded.
In the older age group (≥40 years), obese women had significantly higher rates of cesarean delivery, gestational hypertension, preeclampsia, gestational diabetes, preterm delivery before 37 weeks’ gestation, and preterm delivery before 28 weeks, and their infants had higher rates of admission to the neonatal intensive care unit (NICU), compared with nonobese women (FIGURE).
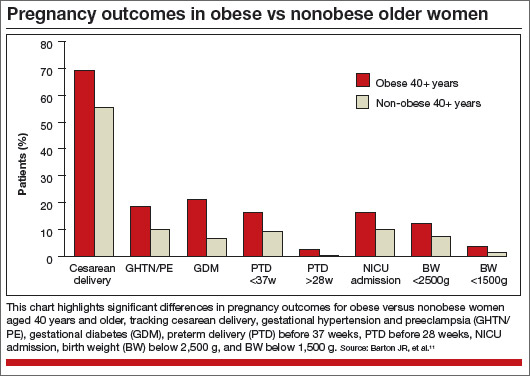
It would appear, however, that healthy, obese women who delay pregnancy until the age of 40 or later may modify their risk for cesarean delivery, gestational diabetes mellitus, and gestational hypertension and preeclampsia by reducing their body mass index to nonobese levels prior to conception.
In addition to maternal risks for women of advanced maternal age, there are risks to the fetus and neonate, as well as a risk of placental abnormalities. These risks are summarized in TABLE 2.
Placental
- Molar or partial molar pregnancy
- Fetus or twins with a complete mole
- Placenta previa, vasa previa
Fetal/neonatal
- Aneuploidy
- Selective fetal growth restriction in twin gestation
- Twin-twin transfusion syndrome
- Preterm birth
- Perinatal death
Antepartum
- Gestational diabetes
- Insulin-dependent diabetes
- Gestational hypertension and preeclampsia
- Cholestasis of pregnancy
- Acute fatty liver of pregnancy
- Venous thromboembolism
- Preterm labor, preterm premature rupture
of membranes
Intrapartum
- Dysfunctional labor
- Malpresentation
- Cesarean delivery
Postpartum
- Venous thromboembolism
- Postpartum hemorrhage
Folic acid supplementation can reduce some risks
The potential benefit of folic acid supplementation to reduce the risk of fetal open neural tube defects is well documented. More recent data suggest that folic acid also is associated with a reduction in the risks of congenital heart defects, abdominal wall defects, cleft lip and palate, and spontaneous abortion. Supplementation should be initiated at least 3 months prior to conception and continued through the first trimester.
The first trimester
Early pregnancy loss is a risk
Women of advanced maternal age are more likely than younger women to experience early pregnancy loss. This risk is due to higher rates of fetal aneuploidy as well as declining ovarian and uterine function and a higher rate of ectopic pregnancy.
In the First and Second Trimester Evaluation of Risk (FASTER) trial, in which investigators reported pregnancy outcomes by maternal age for 36,056 pregnancies, the rate of spontaneous abortion after 10 weeks of gestation was 0.8% among women younger than 35 years, compared with 2.2% for women aged 40 or older.4
The likelihood of multiple gestation increases
The background risk of multiple births is higher in women of advanced maternal age, compared with younger women. This risk increases further with fertility treatment.
Multiple gestations at any age are associated with increased risks for preterm birth and very-low–birthweight infants. Potential maternal risks are listed in TABLE 3.
- Hypertension (2.5 times the risk of a singleton gestation)
- Abruption (3.0 times the risk)
- Anemia (2.5 times the risk)
- Urinary tract infection (1.5 times the risk)
- Preeclampsia (risk of 26%–75%) (occurs at earlier gestation) — HELLP syndrome (risk of 9%)
- Abruption (20%) (10 times the risk of a singleton gestation)
- Anemia (24%)
- Preterm premature rupture of membranes (24%)
- Gestational diabetes (14%)
- Acute fatty liver (4%) (1 in 10,000 singletons)
- Postpartum hemorrhage (9%)
To reduce the number of multiple gestations with assisted reproduction, consider elective single embryo transfer, especially if the mother has significant underlying medical complications.
Multiple gestations present difficult management issues in older women. Strategies shown to prevent preterm delivery in singleton gestations, including weekly 17-hydroxyprogesterone injections and cervical cerclage, are not effective in multiple gestations. Moreover, many of these therapies—including bed rest—increase the risk of thromboembolic events in multiple gestations, particularly when the mother is of advanced age.
Maternal adaptations in multiple gestations also may be poorly tolerated by older patients, particularly cardiac changes that markedly increase stroke volume, heart rate, cardiac output, and plasma volume.
The range of genetic screening and testing options has broadened
Options include first-trimester CVS, which provides information about the fetal chromosomal complement but not the presence of a fetal open neural tube defect. The procedure-related rate of fetal loss with CVS is quoted as 1%.
Options for genetic testing in the second trimester include transabdominal amniocentesis. A procedure-related fetal loss rate of 1 in 500 to 1 in 1,600 is quoted for midtrimester amniocentesis.
A relatively new screening option is analysis of cell-free fetal DNA in maternal blood, which can be performed after 10 weeks’ gestation in singleton and multiple gestations. This directed analysis measures the relative proportions of chromosomes. The detection rate for fetal Down syndrome using cell-free fetal DNA is greater than 98%, with a false-positive rate of less than 0.5%. However, this screening is unreliable in triplet gestations.
Other screening options include US and biochemical screening to detect fetal aneuploidy and open neural tube defects during the second trimester. These options should be included in counseling of the patient.
Second and third trimesters
Gestational hypertension and preeclampsia are significant risks
Older pregnant women have an incidence of gestational hypertension and preeclampsia 2 to 4 times as high as that of patients younger than 30 years.13 The underlying risk for preeclampsia is further increased if coexisting medical disorders such as diabetes or chronic hypertension are present. Moreover, the risk for preeclampsia increases to 10% to 20% in twin gestations and 25% to 60% in triplet gestations. Le Ray and colleagues reported that, if oocyte donation is used with IVF in women older than age 43, the risk for preeclampsia triples.14
We previously studied 379 women aged 35 and older who had mild gestational hypertension remote from term, comparing them with their younger adult counterparts in a matched cohort design.15 Outpatient management produced similar maternal outcomes in both groups, but older women had a statistically insignificant increase in the rate of stillbirth (5 vs 0; P = .063).15
Gestational diabetes risk doubles
The rates of both diabetes mellitus and gestational diabetes increase with advanced maternal age. Data from the FASTER consortium included an adjusted odds ratio of 2.4 for gestational diabetes in women aged 40 or older, compared with a younger control group.4 This increased risk may be a consequence of greater maternal habitus as well as declining insulin sensitivity.
Diabetes increases the risks of macrosomia, cesarean birth, and gestational hypertension. Among women with pregestational diabetes, the risks of congenital heart disease and fetal neural tube defects increase threefold. Because of this increased risk, perinatal screening is indicated for both anomalies in older women.
Pulmonary complications increase
Another risk facing women of advanced maternal age—particularly those carrying a multiple gestation—is pulmonary edema, owing to the increased cardiac output, heart rate, and blood volume, the decreased systemic vascular resistance, and the physiologic anemia of pregnancy. These risks rise further in women who develop preterm labor that requires therapy and in those who develop gestational hypertension and/or preeclampsia. Judicious use of IV fluids, particularly those with lower sodium concentrations, can reduce the risk of pulmonary complications.
Women who develop pulmonary edema have an increased risk of peripartum cardiomyopathy.16
Preterm delivery is more common
Cleary-Goodman and colleagues noted an increased incidence of preterm delivery in women aged 40 and older, compared with women younger than age 35, but no increase in spontaneous preterm labor.4 Advanced maternal age appears to be associated with an increased risk of preterm birth largely as a consequence of underlying complications of fetal growth restriction and maternal disease, including hypertension. Because preterm birth is an important contributor to perinatal morbidity and mortality, steroids should be administered for fetal lung maturity whenever preterm labor is diagnosed before 34 weeks’ gestation.
Risk of placenta previa is 1.1%
Joseph and colleagues found the risk of placenta previa to be 1.1% in women aged 40 and older, compared with 0.3% in women aged 25 to 29 years.17 This increased risk likely is a consequence not only of maternal age but increased parity and a history of prior uterine surgery. If transabdominal US results are suspicious for placenta previa, transvaginal US is indicated for confirmation. Additional US assessment of the cord insertion site to the placenta also should be performed to rule out vasa previa.
Look for neonatal complications
Ziadeh and colleagues found that, although maternal morbidity was increased in older women, the overall neonatal outcome did not appear to be affected.18 However, we noted a higher rate of neonatal complications in women aged 40 or older, including higher NICU admission rates and more low-birth–weight infants.11
In addition, Odibo and colleagues found advanced maternal age to be an independent risk factor for intrauterine growth restriction (IUGR).19 In that study, the odds ratio for IUGR was 3.2 (95% confidence interval [CI], 1.9–5.4) for a maternal age of 40 years or older, compared with a control group. For that reason, they recommend routine screening for IUGR in all pregnant women of advanced age.
Stillbirth risk peaks at 37 to 41 weeks
In a review of more than 5.4 million singleton pregnancies without reported congenital anomalies, Reddy and colleagues found an association between advanced maternal age and stillbirth, with a higher risk of stillbirth at 37 to 41 weeks’ gestation.6 This effect of maternal age persisted despite adjusting for medical disease, parity, and race/ethnicity.
Many women older than age 40 have independent medical or fetal indications for antenatal testing. Some experts have suggested antepartum surveillance starting at 37 weeks for women of advanced maternal age; they argue that the risk of stillbirth at this gestational age is similar in frequency to other high-risk conditions for which testing is performed routinely. However, the National Institute of Child Health and Human Development (NICHD) workshop on antepartum fetal monitoring found insufficient evidence that antenatal testing for the sole indication of advanced maternal age reduces stillbirth or improves perinatal outcomes.20
If increased antenatal testing is indicated for a high-risk condition or electively chosen given advanced age, it should include electronic fetal monitoring as well as amniotic fluid volume assessment. Because the risk of fetal loss sharply increased at 40 weeks’ gestation in the study by Reddy and colleagues,6 women older than age 40 should be considered for delivery by 40 weeks’ gestation in the presence of good dating criteria.
Some clinicians also would consider delivery by 39 weeks’ gestation with good dating criteria if the Bishop score is favorable.
Risks of labor and delivery
Multiple variables contribute to a higher cesarean delivery rate
The risk of cesarean delivery increases with advancing maternal age.5,11 This increased risk is a consequence of multiple variables, including the rate of previous cesarean delivery, malpresentation, underlying complications such as preeclampsia and diabetes, and a higher prevalence of dysfunctional labor.21 Further, Vaughn and colleagues noted that the cesarean delivery rate increases in direct proportion to age, with a rate of 54.4% in women older than age 40.5
As Cohen pointed out in a commentary accompanying a study of dysfunctional labor in women of advancing age, “the notion of a premium baby (ie, that the fetus of a woman with a reduced likelihood of having another pregnancy is somehow more deserving of being spared the rigours of labour than the fetus of a young woman) may play a role” in the high rate of cesarean delivery.21,22
Postpartum hemorrhage risk may be lower in older women
Advanced maternal age is assumed to be a risk factor for postpartum hemorrhage.23 The increased risk was thought to be related to the increased incidence of multiple underlying factors, such as cesarean delivery, multiple gestation, and hypertensive disorders of pregnancy.
However, in a retrospective cohort study, Lao and colleagues found that advanced maternal age (≥35 years) served only as a surrogate factor for postpartum hemorrhage due to associated risk factors, obstetric complications, and interventions.24 After multivariate analysis, aging was associated with a decreased rate of postpartum hemorrhage, which declined progressively from ages 25 to 40 years and older, compared with women aged 20 to 24.24
Nevertheless, medical interventions should be readily available at the time of delivery for treatment of uterine atony, especially with multiple gestation and grand multiparity.
Case: Resolved
The patient is admitted to the hospital, where she is given IV magnesium sulfate (6-g load followed by an infusion of 3 g/hr) and betamethasone for fetal lung maturity enhancement. She continues to receive IV fluids as well (125 mL/hr lactated Ringers solution). Uterine activity abates.
IV magnesium sulfate is continued for 36 hours, but urine protein output is not monitored. Her heart rate ranges from 105 to 115 bpm, and blood pressure from 130/80 mm Hg to 138/88 mm Hg. Forty-eight hours after admission, she reports a gradual onset of tightness of the chest and breathlessness. She is agitated, with a pulse of 130 bpm, 30 respirations/min, and room air pulse oximetry of 90%. Rales are noted upon auscultation of both lungs. A radiograph of the chest demonstrates bilateral air-space disease consistent with pulmonary edema. IV furosemide and oxygen (by mask) are provided, with some respiratory improvement.
The patient then reports leakage of amniotic fluid, and preterm rupture of membranes is confirmed on examination. Because steroids for fetal lung maturity have been administered, and given improvement in her pulmonary edema and a footling breech presentation for Twin A, cesarean delivery is performed.
The patient’s immediate postoperative course is uncomplicated. On postoperative day 2, however, she develops recurrent pulmonary edema, as confirmed by physical examination and chest radiograph. She also reports headache, and her blood pressure rises to 164/114 mm Hg—findings consistent with postpartum preeclampsia. Magnesium sulfate and antihypertensive therapy are initiated, along with IV furosemide and oxygen, which improves her respiratory status.
An echocardiogram to rule out peripartum dilated cardiomyopathy finds no evidence of a dilated left ventricle, and the calculated left ventricular ejection fraction (55%) is normal.
After diuresis and improvement in her blood pressure, she is discharged home. By the time of her follow-up office visit 7 days later, her blood pressure has normalized on labetalol therapy.
For an overview of evaluation and management of pregnant women aged 40 or older, see TABLE 4.
Preconception
- Identify risk factors (ie, diabetes, obesity, hypertension, cardiac dysfunction, family history
- Review outcome of previous pregnancy, if applicable
- Review risks (multiple gestation, birth defects) associated with assisted reproductive technologies if they were needed to achieve pregnancy
- Optimize maternal health
- Begin folic acid supplementation
- Encourage smoking cessation
- If the patient is ≥45 years old:
– Electrocardiogram
– Glucose screening (fasting plasma glucose or hemoglobin A1c)
– Echocardiogram for patients with chronic hypertension
First trimester
- Ultrasonography for dating and to assess fetal number and chorionicity
- Baseline metabolic profile and complete blood count
- Baseline urinalysis
- Continue folic acid supplementation
- Offer first-trimester genetic testing or other genetic screening
Second trimester
- If first-trimester genetic testing is declined, offer second-trimester testing or screening
- Detailed fetal anomaly evaluation by ultrasound
- Fetal echocardiogram if pregnancy was achieved by in vitro fertilization or if it is a monochorionic twin gestation
- Screen for gestational diabetes
Third trimester
- Increased antenatal testing for routine indications, including hypertension, diabetes, and lupus
- Ultrasonography for growth and later ultrasonographic findings of fetal aneuploidy
- Consider delivery
Share your thoughts on this article! Send your Letter to the Editor to [email protected]. Please include your name and the city and state in which you practice.
1. Mathews TJ, Hamilton BE. First births to older women continue to rise. National Center for Health Statistics. NCHS Data Brief No. 152. May 2014. http://www.cdc.gov/nchs/data/databriefs/db152.pdf. Accessed October 3, 2014.
2. Mills M, Rindfuss RR, McDonald P, te Velde E. Why do people postpone parenthood? Reasons and social policy incentives. Hum Reprod Update. 2011;17(6):848–860.
3. Ziadeh SM. Maternal and perinatal outcome in nulliparous women aged 35 and older. Gynecol Obstet Invest. 2002;54(1):6–10.
4. Cleary-Goldman J, Malone FD, Vidaver J, et al; FASTER Consortium. Impact of maternal age on obstetric outcome. Obstet Gynecol. 2005;105(5 pt 1):983–990.
5. Vaughn DA, Cleary BJ, Murphy DJ. Delivery outcomes for nulliparous women at the extremes of maternal age—a cohort study. BJOG. 2014;121(3):261–268.
6. Reddy UM, Ko CW, Willinger M. Maternal age and the risk of stillbirth through pregnancy in the United States. Am J Obstet Gynecol. 2006;195(3):764–770.
7. Meyers C, Adam R, Dungan J, Prenger V. Aneuploidy in twin gestations: when is maternal age advanced? Obstet Gynecol. 1997;89(2):248–251.
8. Nelson SM, Telfer EE, Anderson RA. The ageing ovary and uterus: new biological insights. Hum Reprod Update. 2013;19(1):67–83.
9. Johnson JA, Tough S. Delayed child-bearing. J Obstet Gynaecol Can. 2012;34(1):80–93.
10. Goriely A, Wilkie AO. Paternal age effect mutations and selfish spermatogonial selection: causes and consequences for human disease. Am J Hum Genet. 2012;90(2):175–200.
11. Barton JR, Sibai AJ, Istwan NB, Rhea DJ, Desch CN, Sibai BM. Spontaneously conceived pregnancy after 40: influence of age and obesity on outcome. Am J Perinatol. 2014;31(9):795–798.
12. Roberts JM, August PA, Bakris JR, et al. Hypertension in pregnancy. Report of the American College of Obstetricians and Gynecologists Task Force on Hypertension in Pregnancy. Obstet Gynecol. 2013;122(5):1122–1131.
13. Jahromi BN, Husseini Z. Pregnancy outcome at maternal age 40 and older. Taiwan J Obstet Gynecol. 2008;47(3):318–321.
14. Le Ray C, Scherier S, Anselem O, et al. Association between oocyte donation and maternal and perinatal outcomes in women aged 43 years or older. Hum Reprod. 2012;27(3):896–901.
15. Barton JR, Bergauer NK, Jacques DL, Coleman SK, Stanziano GJ, Sibai BM. Does advanced maternal age affect pregnancy outcome in women with mild hypertension remote from term? Am J Obstet Gynecol. 1997;176(6):1236–1243.
16. Habli M, O’Brien T, Nowack E, et al. Peripartum cardiomyopathy: prognostic factors for long-term maternal outcome. Am J Obstet Gynecol. 2008;199(4):415.e1–e5.
17. Joseph KS, Allen AC, Dodds L, Turner LA, Scott H, Liston R. The perinatal effects of delayed childbearing. Obstet Gynecol. 2005;105(6):1410–1418.
18. Ziadeh S, Yahaya A. Pregnancy outcome at age 40 and older. Arch Gynecol Obstet. 2001;265(1):30–33.
19. Odibo AO, Nelson D, Stamilio DM, Sehdev HM, Macones GA. Advanced maternal age is an independent risk factor for intrauterine growth restriction. Am J Perinatol. 2006;23(5):325–328.
20. Signore C, Freeman RK, Spong CY. Antenatal testing—a reevaluation: executive summary of a Eunice Kennedy Shriver National Institute of Child Health and Human Development workshop. Obstet Gynecol. 2009;113(3):687–701.
21. Cohen WR, Newman L, Friedman EA. Risk of labor abnormalities with advancing maternal age. Obstet Gynecol. 1980;55(4):414–416.
22. Cohen WR. Does maternal age affect pregnancy outcome? BJOG. 2014;121(3):252–254.
23. Bateman BT, Berman MF, Riley LE, Leffert LR. The epidemiology of postpartum hemorrhage in a large, nationwide sample of deliveries. Anesth Analg. 2010;110(5):1368–1373.
24. Lao TT, Sahota DS, Cheng YK, Law LW, Leung TY. Advanced maternal age and postpartum hemorrhage—risk factor or red herring? J Matern Fetal Neonatal Med. 2014;27(3):243–246.
John R. Barton, MD, and Baha M. Sibai, MD

Dr. Barton is Director of Maternal-Fetal Medicine at Baptist Health Lexington in Lexington, Kentucky.

Dr. Sibai is Professor of Maternal-Fetal Medicine (MFM) and Director of the MFM Fellowship Program, Department of Obstetrics, Gynecology, and Reproductive Sciences, at the University of Texas Medical School at Houston, Texas.
Dr. Barton reports that he receives grant or research support from Alere, and that he is on the clinical advisory board of NX PharmaGen Inc.
Dr. Sibai reports no financial relationships relevant to this article.
John R. Barton, MD, and Baha M. Sibai, MD
Dr. Barton is Director of Maternal-Fetal Medicine at Baptist Health Lexington in Lexington, Kentucky.
Dr. Sibai is Professor of Maternal-Fetal Medicine (MFM) and Director of the MFM Fellowship Program, Department of Obstetrics, Gynecology, and Reproductive Sciences, at the University of Texas Medical School at Houston, Texas.
Dr. Barton reports that he receives grant or research support from Alere, and that he is on the clinical advisory board of NX PharmaGen Inc.
Dr. Sibai reports no financial relationships relevant to this article.
CASE: Preterm labor in an older woman
G.S. is a 41-year-old G1P0 with a several-year history of infertility and a medical history of chronic hypertension. She undergoes in vitro fertilization (IVF) using her own oocytes, with transfer of two embryos. Early ultrasonography (US) confirms a diamniotic/dichorionic twin gestation. She undergoes chorionic villus sampling (CVS) during the first trimester, with normal fetal karyotypes noted.
For her chronic hypertension, the patient is treated with oral labetalol 200 mg twice daily, beginning in the first trimester. Results of a baseline comprehensive metabolic profile and complete blood count, and electrocardiogram are normal. Baseline 24-hour urine study results reveal no significant proteinuria and a normal creatinine clearance.
At 18 weeks’ gestation, US results show normal growth and amniotic fluid volume for each fetus, with no anomalies detected. Because of a gradual increase in the patient’s blood pressure, her labetalol dose is increased to 400 mg orally thrice daily. Her urine protein output remains negative on dipstick, and US every 4 weeks until 28 weeks’ gestation continues to show normal fetal growth and amniotic fluid volume.
At 33 weeks’ gestation, the patient presents with regular uterine activity. Nonstress tests for both fetuses are reactive. She is given a 1-L intravenous (IV) fluid bolus of lactated Ringers solution, as well as subcutaneous terbutaline sulfate every 15 minutes for four doses, without resolution of the uterine contractions. Her pulse has increased to 120 bpm.
How do you manage this patient’s care?
Nine times as many women aged 35 and older gave birth to their first child in 2012 than did women of the same age 40 years ago, according to the most recent data from the National Center for Health Statistics.1 The rate of first births for women aged 40 to 44 remained essentially stable during the 1970s and early 1980s but increased more than fourfold from 1985 through 2012—from 0.5 to 2.3 per 1,000 women.1 Clearly, more women are delaying childbearing to a later age by personal choice for reasons such as completion of education and career advancement.2
The path to late motherhood is not without thorns, however. Heightened risks associated with increasing maternal age include:
- fetal aneuploidy
- fetal malformation
- gestational diabetes
- chronic and gestational hypertension
- antepartum hemorrhage
- placenta previa
- prelabor rupture of membranes
- preterm labor.3,4
Women with advanced age at conception also are more likely to have a multifetal gestation because of the need for assisted reproduction and are more likely to require cesarean delivery5 as a result of abnormal placentation, fetal malpresentation, an abnormal pattern of labor, or increased use of oxytocin in labor. In addition, they are more likely to experience rupture of the sphincter, postpartum hemorrhage, and thromboembolism.3 Advanced maternal age also is associated with a higher risk of stillbirth throughout gestation, with the peak risk period reported to occur at 37 to 41 weeks.6
Maternal age-related risks of autosomal trisomies (especially Down syndrome) are well understood and have been quantified for singleton and twin gestations. TABLE 1 shows the risks at term for singleton and twin gestations for at least one chromosomally abnormal fetus by maternal age (40–46 years) and race.7
Preconception considerations
Aging and fertility
These combined result of aging of the ovary and uterus and an escalating risk of underlying medical comorbidities has a detrimental effect on fertility.8 Although assisted reproductive technologies are helpful, they cannot guarantee a live birth or completely compensate for an age-related decline in fertility.9
Many IVF programs refuse infertility treatment to women over age 43 or 44 who want to use their own oocytes. The reason: low pregnancy rates. The use of donor oocytes, however, increases the risks of gestational hypertension and preeclampsia. And if assisted reproductive technologies are needed, the risk for multifetal pregnancy increases.
Women of advanced maternal age are likely to have an older spouse or partner. There is no clearly accepted definition of advanced paternal age, but it is most often defined as an age of 40 years or older at the time of conception. Advanced paternal age has been associated with a higher risk for autism spectrum disorder and schizophrenia, as well as mutations in the FGFR2 and FGFR3 genes that result in skeletal dysplasias and craniosynostosis syndromes.10
Medical conditions are more common
Women of advanced maternal age have an increased rate of such prepregnancy chronic medical complications as diabetes, chronic hypertension, obesity, and renal and cardiac disease. Therefore, it is best to optimize control of these chronic illnesses prior to conception to minimize the risks of miscarriage, fetal anomalies, and gestational hypertension and preeclampsia.
Preeclampsia. Although daily low-dose (60–81 mg) aspirin has been used to reduce the risk of preeclampsia, current recommendations from the American College of Obstetricians and Gynecologists (ACOG) suggest that this therapy be reserved for women with a medical history of early-onset preeclampsia or those who have had preeclampsia in more than one pregnancy.11
Impact of obesity. We recently examined the influence of age and obesity on pregnancy outcomes of nulliparous women aged 40 or older at delivery.12 The study included women aged 20 to 29 years (n = 52,249) and 40 or older (n = 1,231) who delivered singleton infants. Women who reported medical disorders, tobacco use, or conception with assisted reproductive technology were excluded.
In the older age group (≥40 years), obese women had significantly higher rates of cesarean delivery, gestational hypertension, preeclampsia, gestational diabetes, preterm delivery before 37 weeks’ gestation, and preterm delivery before 28 weeks, and their infants had higher rates of admission to the neonatal intensive care unit (NICU), compared with nonobese women (FIGURE).
It would appear, however, that healthy, obese women who delay pregnancy until the age of 40 or later may modify their risk for cesarean delivery, gestational diabetes mellitus, and gestational hypertension and preeclampsia by reducing their body mass index to nonobese levels prior to conception.
In addition to maternal risks for women of advanced maternal age, there are risks to the fetus and neonate, as well as a risk of placental abnormalities. These risks are summarized in TABLE 2.
Placental
- Molar or partial molar pregnancy
- Fetus or twins with a complete mole
- Placenta previa, vasa previa
Fetal/neonatal
- Aneuploidy
- Selective fetal growth restriction in twin gestation
- Twin-twin transfusion syndrome
- Preterm birth
- Perinatal death
Antepartum
- Gestational diabetes
- Insulin-dependent diabetes
- Gestational hypertension and preeclampsia
- Cholestasis of pregnancy
- Acute fatty liver of pregnancy
- Venous thromboembolism
- Preterm labor, preterm premature rupture
of membranes
Intrapartum
- Dysfunctional labor
- Malpresentation
- Cesarean delivery
Postpartum
- Venous thromboembolism
- Postpartum hemorrhage
Folic acid supplementation can reduce some risks
The potential benefit of folic acid supplementation to reduce the risk of fetal open neural tube defects is well documented. More recent data suggest that folic acid also is associated with a reduction in the risks of congenital heart defects, abdominal wall defects, cleft lip and palate, and spontaneous abortion. Supplementation should be initiated at least 3 months prior to conception and continued through the first trimester.
The first trimester
Early pregnancy loss is a risk
Women of advanced maternal age are more likely than younger women to experience early pregnancy loss. This risk is due to higher rates of fetal aneuploidy as well as declining ovarian and uterine function and a higher rate of ectopic pregnancy.
In the First and Second Trimester Evaluation of Risk (FASTER) trial, in which investigators reported pregnancy outcomes by maternal age for 36,056 pregnancies, the rate of spontaneous abortion after 10 weeks of gestation was 0.8% among women younger than 35 years, compared with 2.2% for women aged 40 or older.4
The likelihood of multiple gestation increases
The background risk of multiple births is higher in women of advanced maternal age, compared with younger women. This risk increases further with fertility treatment.
Multiple gestations at any age are associated with increased risks for preterm birth and very-low–birthweight infants. Potential maternal risks are listed in TABLE 3.
- Hypertension (2.5 times the risk of a singleton gestation)
- Abruption (3.0 times the risk)
- Anemia (2.5 times the risk)
- Urinary tract infection (1.5 times the risk)
- Preeclampsia (risk of 26%–75%) (occurs at earlier gestation) — HELLP syndrome (risk of 9%)
- Abruption (20%) (10 times the risk of a singleton gestation)
- Anemia (24%)
- Preterm premature rupture of membranes (24%)
- Gestational diabetes (14%)
- Acute fatty liver (4%) (1 in 10,000 singletons)
- Postpartum hemorrhage (9%)
To reduce the number of multiple gestations with assisted reproduction, consider elective single embryo transfer, especially if the mother has significant underlying medical complications.
Multiple gestations present difficult management issues in older women. Strategies shown to prevent preterm delivery in singleton gestations, including weekly 17-hydroxyprogesterone injections and cervical cerclage, are not effective in multiple gestations. Moreover, many of these therapies—including bed rest—increase the risk of thromboembolic events in multiple gestations, particularly when the mother is of advanced age.
Maternal adaptations in multiple gestations also may be poorly tolerated by older patients, particularly cardiac changes that markedly increase stroke volume, heart rate, cardiac output, and plasma volume.
The range of genetic screening and testing options has broadened
Options include first-trimester CVS, which provides information about the fetal chromosomal complement but not the presence of a fetal open neural tube defect. The procedure-related rate of fetal loss with CVS is quoted as 1%.
Options for genetic testing in the second trimester include transabdominal amniocentesis. A procedure-related fetal loss rate of 1 in 500 to 1 in 1,600 is quoted for midtrimester amniocentesis.
A relatively new screening option is analysis of cell-free fetal DNA in maternal blood, which can be performed after 10 weeks’ gestation in singleton and multiple gestations. This directed analysis measures the relative proportions of chromosomes. The detection rate for fetal Down syndrome using cell-free fetal DNA is greater than 98%, with a false-positive rate of less than 0.5%. However, this screening is unreliable in triplet gestations.
Other screening options include US and biochemical screening to detect fetal aneuploidy and open neural tube defects during the second trimester. These options should be included in counseling of the patient.
Second and third trimesters
Gestational hypertension and preeclampsia are significant risks
Older pregnant women have an incidence of gestational hypertension and preeclampsia 2 to 4 times as high as that of patients younger than 30 years.13 The underlying risk for preeclampsia is further increased if coexisting medical disorders such as diabetes or chronic hypertension are present. Moreover, the risk for preeclampsia increases to 10% to 20% in twin gestations and 25% to 60% in triplet gestations. Le Ray and colleagues reported that, if oocyte donation is used with IVF in women older than age 43, the risk for preeclampsia triples.14
We previously studied 379 women aged 35 and older who had mild gestational hypertension remote from term, comparing them with their younger adult counterparts in a matched cohort design.15 Outpatient management produced similar maternal outcomes in both groups, but older women had a statistically insignificant increase in the rate of stillbirth (5 vs 0; P = .063).15
Gestational diabetes risk doubles
The rates of both diabetes mellitus and gestational diabetes increase with advanced maternal age. Data from the FASTER consortium included an adjusted odds ratio of 2.4 for gestational diabetes in women aged 40 or older, compared with a younger control group.4 This increased risk may be a consequence of greater maternal habitus as well as declining insulin sensitivity.
Diabetes increases the risks of macrosomia, cesarean birth, and gestational hypertension. Among women with pregestational diabetes, the risks of congenital heart disease and fetal neural tube defects increase threefold. Because of this increased risk, perinatal screening is indicated for both anomalies in older women.
Pulmonary complications increase
Another risk facing women of advanced maternal age—particularly those carrying a multiple gestation—is pulmonary edema, owing to the increased cardiac output, heart rate, and blood volume, the decreased systemic vascular resistance, and the physiologic anemia of pregnancy. These risks rise further in women who develop preterm labor that requires therapy and in those who develop gestational hypertension and/or preeclampsia. Judicious use of IV fluids, particularly those with lower sodium concentrations, can reduce the risk of pulmonary complications.
Women who develop pulmonary edema have an increased risk of peripartum cardiomyopathy.16
Preterm delivery is more common
Cleary-Goodman and colleagues noted an increased incidence of preterm delivery in women aged 40 and older, compared with women younger than age 35, but no increase in spontaneous preterm labor.4 Advanced maternal age appears to be associated with an increased risk of preterm birth largely as a consequence of underlying complications of fetal growth restriction and maternal disease, including hypertension. Because preterm birth is an important contributor to perinatal morbidity and mortality, steroids should be administered for fetal lung maturity whenever preterm labor is diagnosed before 34 weeks’ gestation.
Risk of placenta previa is 1.1%
Joseph and colleagues found the risk of placenta previa to be 1.1% in women aged 40 and older, compared with 0.3% in women aged 25 to 29 years.17 This increased risk likely is a consequence not only of maternal age but increased parity and a history of prior uterine surgery. If transabdominal US results are suspicious for placenta previa, transvaginal US is indicated for confirmation. Additional US assessment of the cord insertion site to the placenta also should be performed to rule out vasa previa.
Look for neonatal complications
Ziadeh and colleagues found that, although maternal morbidity was increased in older women, the overall neonatal outcome did not appear to be affected.18 However, we noted a higher rate of neonatal complications in women aged 40 or older, including higher NICU admission rates and more low-birth–weight infants.11
In addition, Odibo and colleagues found advanced maternal age to be an independent risk factor for intrauterine growth restriction (IUGR).19 In that study, the odds ratio for IUGR was 3.2 (95% confidence interval [CI], 1.9–5.4) for a maternal age of 40 years or older, compared with a control group. For that reason, they recommend routine screening for IUGR in all pregnant women of advanced age.
Stillbirth risk peaks at 37 to 41 weeks
In a review of more than 5.4 million singleton pregnancies without reported congenital anomalies, Reddy and colleagues found an association between advanced maternal age and stillbirth, with a higher risk of stillbirth at 37 to 41 weeks’ gestation.6 This effect of maternal age persisted despite adjusting for medical disease, parity, and race/ethnicity.
Many women older than age 40 have independent medical or fetal indications for antenatal testing. Some experts have suggested antepartum surveillance starting at 37 weeks for women of advanced maternal age; they argue that the risk of stillbirth at this gestational age is similar in frequency to other high-risk conditions for which testing is performed routinely. However, the National Institute of Child Health and Human Development (NICHD) workshop on antepartum fetal monitoring found insufficient evidence that antenatal testing for the sole indication of advanced maternal age reduces stillbirth or improves perinatal outcomes.20
If increased antenatal testing is indicated for a high-risk condition or electively chosen given advanced age, it should include electronic fetal monitoring as well as amniotic fluid volume assessment. Because the risk of fetal loss sharply increased at 40 weeks’ gestation in the study by Reddy and colleagues,6 women older than age 40 should be considered for delivery by 40 weeks’ gestation in the presence of good dating criteria.
Some clinicians also would consider delivery by 39 weeks’ gestation with good dating criteria if the Bishop score is favorable.
Risks of labor and delivery
Multiple variables contribute to a higher cesarean delivery rate
The risk of cesarean delivery increases with advancing maternal age.5,11 This increased risk is a consequence of multiple variables, including the rate of previous cesarean delivery, malpresentation, underlying complications such as preeclampsia and diabetes, and a higher prevalence of dysfunctional labor.21 Further, Vaughn and colleagues noted that the cesarean delivery rate increases in direct proportion to age, with a rate of 54.4% in women older than age 40.5
As Cohen pointed out in a commentary accompanying a study of dysfunctional labor in women of advancing age, “the notion of a premium baby (ie, that the fetus of a woman with a reduced likelihood of having another pregnancy is somehow more deserving of being spared the rigours of labour than the fetus of a young woman) may play a role” in the high rate of cesarean delivery.21,22
Postpartum hemorrhage risk may be lower in older women
Advanced maternal age is assumed to be a risk factor for postpartum hemorrhage.23 The increased risk was thought to be related to the increased incidence of multiple underlying factors, such as cesarean delivery, multiple gestation, and hypertensive disorders of pregnancy.
However, in a retrospective cohort study, Lao and colleagues found that advanced maternal age (≥35 years) served only as a surrogate factor for postpartum hemorrhage due to associated risk factors, obstetric complications, and interventions.24 After multivariate analysis, aging was associated with a decreased rate of postpartum hemorrhage, which declined progressively from ages 25 to 40 years and older, compared with women aged 20 to 24.24
Nevertheless, medical interventions should be readily available at the time of delivery for treatment of uterine atony, especially with multiple gestation and grand multiparity.
Case: Resolved
The patient is admitted to the hospital, where she is given IV magnesium sulfate (6-g load followed by an infusion of 3 g/hr) and betamethasone for fetal lung maturity enhancement. She continues to receive IV fluids as well (125 mL/hr lactated Ringers solution). Uterine activity abates.
IV magnesium sulfate is continued for 36 hours, but urine protein output is not monitored. Her heart rate ranges from 105 to 115 bpm, and blood pressure from 130/80 mm Hg to 138/88 mm Hg. Forty-eight hours after admission, she reports a gradual onset of tightness of the chest and breathlessness. She is agitated, with a pulse of 130 bpm, 30 respirations/min, and room air pulse oximetry of 90%. Rales are noted upon auscultation of both lungs. A radiograph of the chest demonstrates bilateral air-space disease consistent with pulmonary edema. IV furosemide and oxygen (by mask) are provided, with some respiratory improvement.
The patient then reports leakage of amniotic fluid, and preterm rupture of membranes is confirmed on examination. Because steroids for fetal lung maturity have been administered, and given improvement in her pulmonary edema and a footling breech presentation for Twin A, cesarean delivery is performed.
The patient’s immediate postoperative course is uncomplicated. On postoperative day 2, however, she develops recurrent pulmonary edema, as confirmed by physical examination and chest radiograph. She also reports headache, and her blood pressure rises to 164/114 mm Hg—findings consistent with postpartum preeclampsia. Magnesium sulfate and antihypertensive therapy are initiated, along with IV furosemide and oxygen, which improves her respiratory status.
An echocardiogram to rule out peripartum dilated cardiomyopathy finds no evidence of a dilated left ventricle, and the calculated left ventricular ejection fraction (55%) is normal.
After diuresis and improvement in her blood pressure, she is discharged home. By the time of her follow-up office visit 7 days later, her blood pressure has normalized on labetalol therapy.
For an overview of evaluation and management of pregnant women aged 40 or older, see TABLE 4.
Preconception
- Identify risk factors (ie, diabetes, obesity, hypertension, cardiac dysfunction, family history
- Review outcome of previous pregnancy, if applicable
- Review risks (multiple gestation, birth defects) associated with assisted reproductive technologies if they were needed to achieve pregnancy
- Optimize maternal health
- Begin folic acid supplementation
- Encourage smoking cessation
- If the patient is ≥45 years old:
– Electrocardiogram
– Glucose screening (fasting plasma glucose or hemoglobin A1c)
– Echocardiogram for patients with chronic hypertension
First trimester
- Ultrasonography for dating and to assess fetal number and chorionicity
- Baseline metabolic profile and complete blood count
- Baseline urinalysis
- Continue folic acid supplementation
- Offer first-trimester genetic testing or other genetic screening
Second trimester
- If first-trimester genetic testing is declined, offer second-trimester testing or screening
- Detailed fetal anomaly evaluation by ultrasound
- Fetal echocardiogram if pregnancy was achieved by in vitro fertilization or if it is a monochorionic twin gestation
- Screen for gestational diabetes
Third trimester
- Increased antenatal testing for routine indications, including hypertension, diabetes, and lupus
- Ultrasonography for growth and later ultrasonographic findings of fetal aneuploidy
- Consider delivery
Share your thoughts on this article! Send your Letter to the Editor to [email protected]. Please include your name and the city and state in which you practice.
1. Mathews TJ, Hamilton BE. First births to older women continue to rise. National Center for Health Statistics. NCHS Data Brief No. 152. May 2014. http://www.cdc.gov/nchs/data/databriefs/db152.pdf. Accessed October 3, 2014.
2. Mills M, Rindfuss RR, McDonald P, te Velde E. Why do people postpone parenthood? Reasons and social policy incentives. Hum Reprod Update. 2011;17(6):848–860.
3. Ziadeh SM. Maternal and perinatal outcome in nulliparous women aged 35 and older. Gynecol Obstet Invest. 2002;54(1):6–10.
4. Cleary-Goldman J, Malone FD, Vidaver J, et al; FASTER Consortium. Impact of maternal age on obstetric outcome. Obstet Gynecol. 2005;105(5 pt 1):983–990.
5. Vaughn DA, Cleary BJ, Murphy DJ. Delivery outcomes for nulliparous women at the extremes of maternal age—a cohort study. BJOG. 2014;121(3):261–268.
6. Reddy UM, Ko CW, Willinger M. Maternal age and the risk of stillbirth through pregnancy in the United States. Am J Obstet Gynecol. 2006;195(3):764–770.
7. Meyers C, Adam R, Dungan J, Prenger V. Aneuploidy in twin gestations: when is maternal age advanced? Obstet Gynecol. 1997;89(2):248–251.
8. Nelson SM, Telfer EE, Anderson RA. The ageing ovary and uterus: new biological insights. Hum Reprod Update. 2013;19(1):67–83.
9. Johnson JA, Tough S. Delayed child-bearing. J Obstet Gynaecol Can. 2012;34(1):80–93.
10. Goriely A, Wilkie AO. Paternal age effect mutations and selfish spermatogonial selection: causes and consequences for human disease. Am J Hum Genet. 2012;90(2):175–200.
11. Barton JR, Sibai AJ, Istwan NB, Rhea DJ, Desch CN, Sibai BM. Spontaneously conceived pregnancy after 40: influence of age and obesity on outcome. Am J Perinatol. 2014;31(9):795–798.
12. Roberts JM, August PA, Bakris JR, et al. Hypertension in pregnancy. Report of the American College of Obstetricians and Gynecologists Task Force on Hypertension in Pregnancy. Obstet Gynecol. 2013;122(5):1122–1131.
13. Jahromi BN, Husseini Z. Pregnancy outcome at maternal age 40 and older. Taiwan J Obstet Gynecol. 2008;47(3):318–321.
14. Le Ray C, Scherier S, Anselem O, et al. Association between oocyte donation and maternal and perinatal outcomes in women aged 43 years or older. Hum Reprod. 2012;27(3):896–901.
15. Barton JR, Bergauer NK, Jacques DL, Coleman SK, Stanziano GJ, Sibai BM. Does advanced maternal age affect pregnancy outcome in women with mild hypertension remote from term? Am J Obstet Gynecol. 1997;176(6):1236–1243.
16. Habli M, O’Brien T, Nowack E, et al. Peripartum cardiomyopathy: prognostic factors for long-term maternal outcome. Am J Obstet Gynecol. 2008;199(4):415.e1–e5.
17. Joseph KS, Allen AC, Dodds L, Turner LA, Scott H, Liston R. The perinatal effects of delayed childbearing. Obstet Gynecol. 2005;105(6):1410–1418.
18. Ziadeh S, Yahaya A. Pregnancy outcome at age 40 and older. Arch Gynecol Obstet. 2001;265(1):30–33.
19. Odibo AO, Nelson D, Stamilio DM, Sehdev HM, Macones GA. Advanced maternal age is an independent risk factor for intrauterine growth restriction. Am J Perinatol. 2006;23(5):325–328.
20. Signore C, Freeman RK, Spong CY. Antenatal testing—a reevaluation: executive summary of a Eunice Kennedy Shriver National Institute of Child Health and Human Development workshop. Obstet Gynecol. 2009;113(3):687–701.
21. Cohen WR, Newman L, Friedman EA. Risk of labor abnormalities with advancing maternal age. Obstet Gynecol. 1980;55(4):414–416.
22. Cohen WR. Does maternal age affect pregnancy outcome? BJOG. 2014;121(3):252–254.
23. Bateman BT, Berman MF, Riley LE, Leffert LR. The epidemiology of postpartum hemorrhage in a large, nationwide sample of deliveries. Anesth Analg. 2010;110(5):1368–1373.
24. Lao TT, Sahota DS, Cheng YK, Law LW, Leung TY. Advanced maternal age and postpartum hemorrhage—risk factor or red herring? J Matern Fetal Neonatal Med. 2014;27(3):243–246.
The Extracorporeal C-Incision Tissue Extraction (ExCITE) technique
As a result of recent concerns regarding the use of power morcellation, clinicians have been faced with the need to develop alternative techniques for contained tissue extraction during minimally invasive gynecologic procedures such as myomectomy and hysterectomy.
The following video represents a refined and reproducible approach that incorporates a containment bag (Anchor Medical) and a self-retaining retractor (Applied Medical) in order to meet the following objectives:
- tissue extraction without the need for power morcellation
- specimen containment to avoid intraperitoneal spillage
- ability to continue to offer minimally invasive surgical options to patients through a safe and standardized approach to tissue extraction.
The example case is real-time, contained, intact removal of an 8-cm, 130-g fibroid.

I hope you enjoy the featured opening session on best tissue extraction standards at the AAGL Global Congress on Minimally Invasive Gynecology in Vancouver and stop by to visit me at the OBG Management booth.
— Dr. Arnold Advincula, AAGL 2014 Scientific Program Chair
Share your thoughts on this video! Send your Letter to the Editor to [email protected]. Please include your name and the city and state in which you practice.
As a result of recent concerns regarding the use of power morcellation, clinicians have been faced with the need to develop alternative techniques for contained tissue extraction during minimally invasive gynecologic procedures such as myomectomy and hysterectomy.
The following video represents a refined and reproducible approach that incorporates a containment bag (Anchor Medical) and a self-retaining retractor (Applied Medical) in order to meet the following objectives:
- tissue extraction without the need for power morcellation
- specimen containment to avoid intraperitoneal spillage
- ability to continue to offer minimally invasive surgical options to patients through a safe and standardized approach to tissue extraction.
The example case is real-time, contained, intact removal of an 8-cm, 130-g fibroid.
I hope you enjoy the featured opening session on best tissue extraction standards at the AAGL Global Congress on Minimally Invasive Gynecology in Vancouver and stop by to visit me at the OBG Management booth.
— Dr. Arnold Advincula, AAGL 2014 Scientific Program Chair
Share your thoughts on this video! Send your Letter to the Editor to [email protected]. Please include your name and the city and state in which you practice.

2014 Update on pelvic floor dysfunction
Constipation is estimated to affect up to 27% of the general population and is more common in women, with a 2:1 female-to-male ratio.1 Because gynecologists are frequently the main care provider for many women, understanding the diagnosis and treatment options for constipation is important. Additionally, gynecologists must manage bowel function during the perioperative period.
The diagnosis of constipation is based on the Rome III criteria.2 Besides frequency of bowel movements (BMs), these criteria include evacuation symptoms and the presence of hard stools (TABLE 1). These symptoms can result from delay in colonic transit or outlet dysfunction. Constipation may be secondary to medical illness, such as central or peripheral neurologic disease, diabetes mellitus, hypothyroidism, or medications. Evaluation begins with a careful history and vaginal and perianal/anal examination.3 Initially, a trial of fiber supplementation with or without over-the-counter (OTC) laxatives may be tried (TABLE 2). If patients have an inadequate response to this therapy, further evaluation may be pursued (ALGORITHM).
------
| TABLE1 Rome III criteria for functional constipation in adults* |
1. Must include ≥2 of the following signs
2. Loose stools are rarely present without the use of laxatives 3. Insufficient criteria for irritable bowel syndrome |
| *At least 3 months, with symptoms beginning ≥6 months before diagnosis. |
--------
| TABLE 2 Common treatments for constipation |
Bulk-forming laxatives absorb water, increasing fecal mass
Surfactant agents lower the surface tension of stool, allowing water to enter the stool
Osmotic laxatives contain poorly/nonabsorbed substances, leading to intestinal water secretion
Stimulant laxatives increase colonic transit and alter electrolyte transport across the colonic mucosa
|
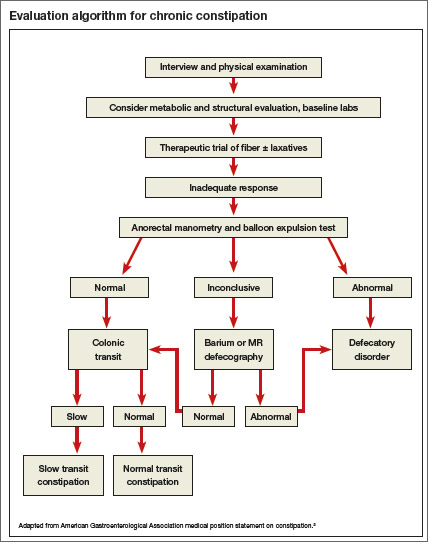
In this article, we review the results of randomized trials comparing the efficacy of OTC medical treatments for constipation, including daily, low-dose polyethylene glycol (PEG) and probiotics. Additionally, we review key trials evaluating perioperative bowel management prior to laparoscopic gynecologic and vaginal surgery.
LONG-TERM PEG USAGE SAFE AND EFFECTIVE?
Corazziari E, Badiali D, Bazzocchi G, et al. Long-term efficacy, safety, and tolerability of low daily doses of isosmotic polyethylene glycol electrolyte balanced solution (PMF-100) in the treatment of functional chronic constipation. Gut. 2000;46(4):522–526.
In this multicenter, randomized, double-blind, placebo-controlled, parallel trial, investigators evaluated the safety, efficacy, and tolerability of a daily low-dose PEG-based osmotic diuretic.
Details of the study
Seventy-eight patients (80% of them female) aged 18 to 75 years with chronic constipation, defined by Rome III diagnostic criteria, underwent a 4-week “run-in” period, with a standardized daily diet of fiber 15 g, water 1500 mL, and twice-daily PMF-100 (PEG/osmotic solution). Patients were randomized if they responded to the regimen, with response defined as having at least two BMs per week and no defecatory disturbance or at least three BMs per week with or without defecatory disturbance. Eight patients were not randomized, one due to nonresponsiveness. Study patients completed 20 weeks of either twice-daily PMF-100 or placebo. Patients, at their own discretion, decreased the frequency of the study drug based on the frequency of their BMs. Use of another laxative was not allowed unless a BM had not occurred over a 5-day period.
The combined primary outcome was at least three BMs per week, no defecatory disturbances, and no additional laxative use. Secondary outcomes (frequency of BMs and defecatory disturbances) were assessed using a bowel diary.
No differences were noted in baseline measurements between the two groups. Of the PMF-100 group, 70% completed the study, compared with 30% of the placebo group (P<.01). Nonresponse to treatment was the reason for dropout in 7% and 46% of patients, respectively (P<.005). Other causes of withdrawal did not differ between the groups.
At the end of the 20 weeks, 77% of patients in the PMF-100 group reported remission, compared with 20% in the placebo group (P<.001). During the study, the PMF-100 group reported more BMs per week (7.4 vs 4.3; P<.001). Furthermore, the treatment group was less likely to report straining at defecation, hard/pellet stools, and need for use of additional laxatives. Adverse events (nausea, anal pain/itching, hematochezia, epigastric pain, and fecal incontinence) were similar between groups. There were no differences in laboratory values.
Study strengths
This was a well-designed trial showing the safety, efficacy, and tolerability of a daily low-dose PEG-based osmotic diuretic. The population was mainly women with functional chronic constipation, similar to a gynecologic population. The results of this trial are consistent with what has been shown for other trials various PEG preparations.4,5
WHAT THIS EVIDENCE MEANS FOR PRACTICE
Women who fail initial fiber therapy may respond to daily low-dose PEG on a continuous basis. Resolution of constipation and defecatory symptoms is likely and should be seen within 1 month. Therapy can be continued safely for at least 6 months.
--------------
NEW AND TRENDY OTC TREATMENT OPTION
Del Piano M, Carmagnola S, Anderloni A, et al. The use of probiotics in healthy volunteers with evacuation disorders and hard stools: a double-blind, randomized, placebo-controlled study. J Clin Gastroenterol. 2010;44(suppl 1):S30–S34.
Factors such as age, unhealthy diet, and use of prescription drugs alter the intestinal bacterial flora. As patients strive for a more holistic approach to their health, interest is growing in the benefit of probiotics for treating chronic constipation. To explore the value of such probiotics, Del Piano and colleagues conducted a three-armed, randomized, double-blind placebo-controlled trial of two different probiotic preparations and a placebo among patients aged 24 to 71 years with evacuation disorders and constipation.
Details of the study
One probiotic preparation (A) was composed of Lactobacillus plantarum and Bifidobacterium breve at a concentration of 2.5×10⁹ cfu per day; the other (B) was composed of Bifidobacterium animalis subspecies lactis at a concentration of 5×10⁹ cfu per day. Patients took their preparation for 30 days and recorded data on weekly defecations (primary outcome), along with feces consistency, ease of expulsion, sensation emptying, anal itching/burning/pain with defecation, and abdominal bloating (secondary outcomes).
A total of 300 patients were enrolled in the study; 50% were female. No difference was noted in baseline symptoms among the three groups. No change from baseline was noted in BMs per week within the placebo group during the 30 days (5.6 vs 5.8, respectively). However, both probiotic preparations resulted in increased bowel frequency by day 30 (5.3 vs 7.3 BMs per week for probiotic A [P<.001] and 5.8 vs 6.9 BMs per week for probiotic B [P<.001]).
When comparing each probiotic with the placebo at days 15 and 30, a statistically significant increase in bowel frequency was found with each probiotic preparation. Furthermore, all secondary outcomes improved during the 30 days with the probiotic preparations but not the placebo. There was a statistically significant improvement in these variables when either probiotic was compared with placebo. No adverse events were reported.
Strengths and limitations
This randomized, double-blind, placebo-controlled trial showed improvement in bowel frequency, based on a bowel diary, with two different probiotic preparations when compared with placebo. The study population did not have to meet Rome III criteria for constipation, and baseline frequency of BMs was high. Patients did report subjective improvement in their defecatory symptoms with both probiotic preparations, but use of validated questionnaires would have strengthened this finding.
WHAT THIS EVIDENCE MEANS FOR PRACTICE
Patients with mild constipation and defecatory complaints may benefit from the addition of a probiotic preparation. However, more thorough studies need to be performed to characterize the true extent of probiotics’ benefits.
--------------
BOWEL PREP BEFORE LAPAROSCOPIC GYNECOLOGIC SURGERY
Siedhoff MT, Clark LH, Hobbs KA, Findley AD, Moulder JK, Garrett JM. Mechanic bowel preparation before laparoscopic hysterectomy: a randomized controlled trial. Obstet Gynecol. 2014;123(3):562–567.
Over the past decade, extrapolation of data from colorectal surgery literature, showing no benefit from preoperative mechanical bowel preparation,6 has led to less frequent use of mechanical bowel preparations for open benign gynecologic surgery. Nevertheless, there has been slower adoption of this practice with laparoscopic and vaginal surgery. In a recent study, Siedhoff and colleagues explored surgeons’ assessments of surgical field exposure in patients who did and did not complete preoperative mechanical bowel preparation.
Details of the study
This was a single-masked, randomized, controlled trial involving women undergoing laparoscopic hysterectomy for benign indications. Patients were randomly assigned to either a sodium phosphate enema the night before surgery and, if their stool was not clear, another enema on the morning of surgery versus no preparation. All patients had clear liquids the day prior to surgery, then fasted beginning at midnight. The surgeon was blinded to the randomization.
The primary outcome was a questionnaire completed by the surgeon that assessed surgical field exposure. Secondarily, patients completed a questionnaire addressing symptoms (cramps, hunger, bloating, embarrassment, insomnia, weakness, dizziness, thirst, nausea, and incontinence).
Baseline characteristics of the 160 randomized patients did not differ between the two groups. Analysis was on an intent-to-treat basis, but only two patients did not complete the bowel preparation. Overall, the study population had a mean age of 41 and body mass index of 33.5 kg/m2. No differences were noted in surgical characteristics between the two groups, including complication rate. The mean surgery time was 139 minutes with a mean estimated blood loss of 61 mL and a mean uterine weight of 385 g.
The surgeon’s assessment of the surgical field did not differ between the two groups. This finding also held true when subgroup analysis was performed for obesity, endometriosis, irritable bowel syndrome or inflammatory bowel disease, and chronic constipation. Interestingly, the odds of the surgeon guessing whether a patient had had a preparation were 50:50. The only difference in patient symptoms was an increase in insomnia in the no-preparation group.
Minor drawback
This well-performed trial demonstrated no significant value for mechanical bowel preparation before benign laparoscopic hysterectomy in a young population. How these results might extrapolate to an older population who may have a higher rate of prior pelvic surgery or diverticular disease is uncertain.
WHAT THIS EVIDENCE MEANS FOR PRACTICE
Women undergoing laparoscopic hysterectomy for a benign indication may forego a mechanical bowel preparation as such preparation did not improve the surgical field.
--------------
BOWEL PREP BEFORE VAGINAL SURGERY
Ballard AC, Parker-Autry CY, Markland AD, Varner RE, Huisingh C, Richter HE. Bowel preparation before vaginal prolapse surgery: a randomized controlled trial. Obstet Gynecol. 2014;123(2 pt 1):232–238.
In this single-masked, randomized controlled trial in women undergoing reconstructive vaginal prolapse surgery, Ballard and colleagues randomly assigned patients to either a clear liquid diet with two saline enemas the day before surgery or a regular diet the day before surgery.
Details of the study
All 150 patients were instructed to fast beginning at midnight the night before surgery, and the surgeon was blinded to randomization. The study’s primary outcome was the surgeon’s perception of the operative field assessed by a questionnaire. The secondary outcome was the patient’s satisfaction with their preoperative regimen as reported on validated questionnaires.
An intent-to-treat analysis was performed (mean age, 60 years); 84% of patients assigned to bowel preparation completed more than 50% of the enemas. Baseline characteristics and surgical procedures were similar between groups. Approximately 33% of patients underwent hysterectomy concomitantly with the prolapse repair. Operative time, estimated blood loss, and bowel injury were similar between the two groups.
No difference between groups was noted in the surgeons’ assessment of the surgical field—which was rated as excellent or good in 85% of patients who underwent the bowel preparation compared with 90% in the no-preparation group (P = .3). Additionally, no difference was noted in the presence of rectal stool or gas by inspection and palpation. Patient satisfaction was significantly lower among those who underwent bowel preparation compared with patients who did not. Patients undergoing bowel preparation were more likely to have abdominal fullness or bloating (P = .004), abdominal cramps or pain (P<.001), anal irritation (P<.001), and hunger pains (P<.001).
Prep group saw no benefit and decreased satisfaction
This well-performed clinical trial showed that the use of mechanical bowel preparation did not significantly improve surgeons’ intraoperative acceptability of the operative field during vaginal prolapse surgery. However, approximately 25% of patients underwent sacrospinous suspensions; therefore, intraperitoneal access was not necessary in these patients. The study results demonstrated decreased patient satisfaction and more distressing bowel symptoms in patients who underwent a mechanical bowel preparation with an enema.
WHAT THIS EVIDENCE MEANS FOR PRACTICE
Use of a mechanical bowel preparation is not necessary to improve the surgical field in vaginal prolapse surgery. Not having patients undergo a bowel preparation will improve patients’ assessment of their preparation for surgery.
--------------
Share your thoughts on this article! Send your Letter to the Editor to [email protected]. Please include your name and the city and state in which you practice.
- Higgins PD, Johanson JF. Epidemiology of constipation in North America: a systematic review. Am J Gastroenterol. 2004;99(4):750–759.
- Longstreth GF, Thompson WG, Chey WD, Houghton LA, Mearin F, Spiller RC. Functional bowel disorders. Gastroenterology. 2006;130(5):1480–1491.
- Bharucha AE, Dorn SD, Lembo A, Pressman A. American Gastroenterological Association medical position statement on constipation. Gastroenterology. 2013;144(1):211–217.
- American College of Gastroenterology Chronic Constipation Task Force. An evidence-based approach to the management of chronic constipation in North America. Am J Gastroenterol. 2005;100(suppl 1):S1–S22.
- Ramkumar D, Rao SS. Efficacy and safety of traditional medical therapies for chronic constipation: systematic review. Am J Gastroenterol. 2005;100(4):936–971.
- Guenaga KF, Matos D, Wille-Jørgensen P. Mechanical bowel preparation for elective colorectal surgery. Cochrane Database Syst Rev. 2011;(9):CD001544.

Dr. Polin is Fellow, Female Pelvic Medicine and Reconstructive Surgery, and Clinical Instructor, Obstetrics and Gynecology, Department of Obstetrics and Gynecology, at Duke University in Durham, North Carolina.

Dr. Amundsen is Professor and Female Pelvic Medicine and Reconstructive Surgery Fellowship Director, Department of Obstetrics and Gynecology, at Duke University.
Dr. Polin reports no financial relationships relevant to this article. Dr. Amundsen reports that she receives grant or research support from the National Institutes of Health.
Dr. Polin is Fellow, Female Pelvic Medicine and Reconstructive Surgery, and Clinical Instructor, Obstetrics and Gynecology, Department of Obstetrics and Gynecology, at Duke University in Durham, North Carolina.
Dr. Amundsen is Professor and Female Pelvic Medicine and Reconstructive Surgery Fellowship Director, Department of Obstetrics and Gynecology, at Duke University.
Dr. Polin reports no financial relationships relevant to this article. Dr. Amundsen reports that she receives grant or research support from the National Institutes of Health.
Constipation is estimated to affect up to 27% of the general population and is more common in women, with a 2:1 female-to-male ratio.1 Because gynecologists are frequently the main care provider for many women, understanding the diagnosis and treatment options for constipation is important. Additionally, gynecologists must manage bowel function during the perioperative period.
The diagnosis of constipation is based on the Rome III criteria.2 Besides frequency of bowel movements (BMs), these criteria include evacuation symptoms and the presence of hard stools (TABLE 1). These symptoms can result from delay in colonic transit or outlet dysfunction. Constipation may be secondary to medical illness, such as central or peripheral neurologic disease, diabetes mellitus, hypothyroidism, or medications. Evaluation begins with a careful history and vaginal and perianal/anal examination.3 Initially, a trial of fiber supplementation with or without over-the-counter (OTC) laxatives may be tried (TABLE 2). If patients have an inadequate response to this therapy, further evaluation may be pursued (ALGORITHM).
------
| TABLE1 Rome III criteria for functional constipation in adults* |
1. Must include ≥2 of the following signs
2. Loose stools are rarely present without the use of laxatives 3. Insufficient criteria for irritable bowel syndrome |
| *At least 3 months, with symptoms beginning ≥6 months before diagnosis. |
--------
| TABLE 2 Common treatments for constipation |
Bulk-forming laxatives absorb water, increasing fecal mass
Surfactant agents lower the surface tension of stool, allowing water to enter the stool
Osmotic laxatives contain poorly/nonabsorbed substances, leading to intestinal water secretion
Stimulant laxatives increase colonic transit and alter electrolyte transport across the colonic mucosa
|
In this article, we review the results of randomized trials comparing the efficacy of OTC medical treatments for constipation, including daily, low-dose polyethylene glycol (PEG) and probiotics. Additionally, we review key trials evaluating perioperative bowel management prior to laparoscopic gynecologic and vaginal surgery.
LONG-TERM PEG USAGE SAFE AND EFFECTIVE?
Corazziari E, Badiali D, Bazzocchi G, et al. Long-term efficacy, safety, and tolerability of low daily doses of isosmotic polyethylene glycol electrolyte balanced solution (PMF-100) in the treatment of functional chronic constipation. Gut. 2000;46(4):522–526.
In this multicenter, randomized, double-blind, placebo-controlled, parallel trial, investigators evaluated the safety, efficacy, and tolerability of a daily low-dose PEG-based osmotic diuretic.
Details of the study
Seventy-eight patients (80% of them female) aged 18 to 75 years with chronic constipation, defined by Rome III diagnostic criteria, underwent a 4-week “run-in” period, with a standardized daily diet of fiber 15 g, water 1500 mL, and twice-daily PMF-100 (PEG/osmotic solution). Patients were randomized if they responded to the regimen, with response defined as having at least two BMs per week and no defecatory disturbance or at least three BMs per week with or without defecatory disturbance. Eight patients were not randomized, one due to nonresponsiveness. Study patients completed 20 weeks of either twice-daily PMF-100 or placebo. Patients, at their own discretion, decreased the frequency of the study drug based on the frequency of their BMs. Use of another laxative was not allowed unless a BM had not occurred over a 5-day period.
The combined primary outcome was at least three BMs per week, no defecatory disturbances, and no additional laxative use. Secondary outcomes (frequency of BMs and defecatory disturbances) were assessed using a bowel diary.
No differences were noted in baseline measurements between the two groups. Of the PMF-100 group, 70% completed the study, compared with 30% of the placebo group (P<.01). Nonresponse to treatment was the reason for dropout in 7% and 46% of patients, respectively (P<.005). Other causes of withdrawal did not differ between the groups.
At the end of the 20 weeks, 77% of patients in the PMF-100 group reported remission, compared with 20% in the placebo group (P<.001). During the study, the PMF-100 group reported more BMs per week (7.4 vs 4.3; P<.001). Furthermore, the treatment group was less likely to report straining at defecation, hard/pellet stools, and need for use of additional laxatives. Adverse events (nausea, anal pain/itching, hematochezia, epigastric pain, and fecal incontinence) were similar between groups. There were no differences in laboratory values.
Study strengths
This was a well-designed trial showing the safety, efficacy, and tolerability of a daily low-dose PEG-based osmotic diuretic. The population was mainly women with functional chronic constipation, similar to a gynecologic population. The results of this trial are consistent with what has been shown for other trials various PEG preparations.4,5
WHAT THIS EVIDENCE MEANS FOR PRACTICE
Women who fail initial fiber therapy may respond to daily low-dose PEG on a continuous basis. Resolution of constipation and defecatory symptoms is likely and should be seen within 1 month. Therapy can be continued safely for at least 6 months.
--------------
NEW AND TRENDY OTC TREATMENT OPTION
Del Piano M, Carmagnola S, Anderloni A, et al. The use of probiotics in healthy volunteers with evacuation disorders and hard stools: a double-blind, randomized, placebo-controlled study. J Clin Gastroenterol. 2010;44(suppl 1):S30–S34.
Factors such as age, unhealthy diet, and use of prescription drugs alter the intestinal bacterial flora. As patients strive for a more holistic approach to their health, interest is growing in the benefit of probiotics for treating chronic constipation. To explore the value of such probiotics, Del Piano and colleagues conducted a three-armed, randomized, double-blind placebo-controlled trial of two different probiotic preparations and a placebo among patients aged 24 to 71 years with evacuation disorders and constipation.
Details of the study
One probiotic preparation (A) was composed of Lactobacillus plantarum and Bifidobacterium breve at a concentration of 2.5×10⁹ cfu per day; the other (B) was composed of Bifidobacterium animalis subspecies lactis at a concentration of 5×10⁹ cfu per day. Patients took their preparation for 30 days and recorded data on weekly defecations (primary outcome), along with feces consistency, ease of expulsion, sensation emptying, anal itching/burning/pain with defecation, and abdominal bloating (secondary outcomes).
A total of 300 patients were enrolled in the study; 50% were female. No difference was noted in baseline symptoms among the three groups. No change from baseline was noted in BMs per week within the placebo group during the 30 days (5.6 vs 5.8, respectively). However, both probiotic preparations resulted in increased bowel frequency by day 30 (5.3 vs 7.3 BMs per week for probiotic A [P<.001] and 5.8 vs 6.9 BMs per week for probiotic B [P<.001]).
When comparing each probiotic with the placebo at days 15 and 30, a statistically significant increase in bowel frequency was found with each probiotic preparation. Furthermore, all secondary outcomes improved during the 30 days with the probiotic preparations but not the placebo. There was a statistically significant improvement in these variables when either probiotic was compared with placebo. No adverse events were reported.
Strengths and limitations
This randomized, double-blind, placebo-controlled trial showed improvement in bowel frequency, based on a bowel diary, with two different probiotic preparations when compared with placebo. The study population did not have to meet Rome III criteria for constipation, and baseline frequency of BMs was high. Patients did report subjective improvement in their defecatory symptoms with both probiotic preparations, but use of validated questionnaires would have strengthened this finding.
WHAT THIS EVIDENCE MEANS FOR PRACTICE
Patients with mild constipation and defecatory complaints may benefit from the addition of a probiotic preparation. However, more thorough studies need to be performed to characterize the true extent of probiotics’ benefits.
--------------
BOWEL PREP BEFORE LAPAROSCOPIC GYNECOLOGIC SURGERY
Siedhoff MT, Clark LH, Hobbs KA, Findley AD, Moulder JK, Garrett JM. Mechanic bowel preparation before laparoscopic hysterectomy: a randomized controlled trial. Obstet Gynecol. 2014;123(3):562–567.
Over the past decade, extrapolation of data from colorectal surgery literature, showing no benefit from preoperative mechanical bowel preparation,6 has led to less frequent use of mechanical bowel preparations for open benign gynecologic surgery. Nevertheless, there has been slower adoption of this practice with laparoscopic and vaginal surgery. In a recent study, Siedhoff and colleagues explored surgeons’ assessments of surgical field exposure in patients who did and did not complete preoperative mechanical bowel preparation.
Details of the study
This was a single-masked, randomized, controlled trial involving women undergoing laparoscopic hysterectomy for benign indications. Patients were randomly assigned to either a sodium phosphate enema the night before surgery and, if their stool was not clear, another enema on the morning of surgery versus no preparation. All patients had clear liquids the day prior to surgery, then fasted beginning at midnight. The surgeon was blinded to the randomization.
The primary outcome was a questionnaire completed by the surgeon that assessed surgical field exposure. Secondarily, patients completed a questionnaire addressing symptoms (cramps, hunger, bloating, embarrassment, insomnia, weakness, dizziness, thirst, nausea, and incontinence).
Baseline characteristics of the 160 randomized patients did not differ between the two groups. Analysis was on an intent-to-treat basis, but only two patients did not complete the bowel preparation. Overall, the study population had a mean age of 41 and body mass index of 33.5 kg/m2. No differences were noted in surgical characteristics between the two groups, including complication rate. The mean surgery time was 139 minutes with a mean estimated blood loss of 61 mL and a mean uterine weight of 385 g.
The surgeon’s assessment of the surgical field did not differ between the two groups. This finding also held true when subgroup analysis was performed for obesity, endometriosis, irritable bowel syndrome or inflammatory bowel disease, and chronic constipation. Interestingly, the odds of the surgeon guessing whether a patient had had a preparation were 50:50. The only difference in patient symptoms was an increase in insomnia in the no-preparation group.
Minor drawback
This well-performed trial demonstrated no significant value for mechanical bowel preparation before benign laparoscopic hysterectomy in a young population. How these results might extrapolate to an older population who may have a higher rate of prior pelvic surgery or diverticular disease is uncertain.
WHAT THIS EVIDENCE MEANS FOR PRACTICE
Women undergoing laparoscopic hysterectomy for a benign indication may forego a mechanical bowel preparation as such preparation did not improve the surgical field.
--------------
BOWEL PREP BEFORE VAGINAL SURGERY
Ballard AC, Parker-Autry CY, Markland AD, Varner RE, Huisingh C, Richter HE. Bowel preparation before vaginal prolapse surgery: a randomized controlled trial. Obstet Gynecol. 2014;123(2 pt 1):232–238.
In this single-masked, randomized controlled trial in women undergoing reconstructive vaginal prolapse surgery, Ballard and colleagues randomly assigned patients to either a clear liquid diet with two saline enemas the day before surgery or a regular diet the day before surgery.
Details of the study
All 150 patients were instructed to fast beginning at midnight the night before surgery, and the surgeon was blinded to randomization. The study’s primary outcome was the surgeon’s perception of the operative field assessed by a questionnaire. The secondary outcome was the patient’s satisfaction with their preoperative regimen as reported on validated questionnaires.
An intent-to-treat analysis was performed (mean age, 60 years); 84% of patients assigned to bowel preparation completed more than 50% of the enemas. Baseline characteristics and surgical procedures were similar between groups. Approximately 33% of patients underwent hysterectomy concomitantly with the prolapse repair. Operative time, estimated blood loss, and bowel injury were similar between the two groups.
No difference between groups was noted in the surgeons’ assessment of the surgical field—which was rated as excellent or good in 85% of patients who underwent the bowel preparation compared with 90% in the no-preparation group (P = .3). Additionally, no difference was noted in the presence of rectal stool or gas by inspection and palpation. Patient satisfaction was significantly lower among those who underwent bowel preparation compared with patients who did not. Patients undergoing bowel preparation were more likely to have abdominal fullness or bloating (P = .004), abdominal cramps or pain (P<.001), anal irritation (P<.001), and hunger pains (P<.001).
Prep group saw no benefit and decreased satisfaction
This well-performed clinical trial showed that the use of mechanical bowel preparation did not significantly improve surgeons’ intraoperative acceptability of the operative field during vaginal prolapse surgery. However, approximately 25% of patients underwent sacrospinous suspensions; therefore, intraperitoneal access was not necessary in these patients. The study results demonstrated decreased patient satisfaction and more distressing bowel symptoms in patients who underwent a mechanical bowel preparation with an enema.
WHAT THIS EVIDENCE MEANS FOR PRACTICE
Use of a mechanical bowel preparation is not necessary to improve the surgical field in vaginal prolapse surgery. Not having patients undergo a bowel preparation will improve patients’ assessment of their preparation for surgery.
--------------
Share your thoughts on this article! Send your Letter to the Editor to [email protected]. Please include your name and the city and state in which you practice.
- Higgins PD, Johanson JF. Epidemiology of constipation in North America: a systematic review. Am J Gastroenterol. 2004;99(4):750–759.
- Longstreth GF, Thompson WG, Chey WD, Houghton LA, Mearin F, Spiller RC. Functional bowel disorders. Gastroenterology. 2006;130(5):1480–1491.
- Bharucha AE, Dorn SD, Lembo A, Pressman A. American Gastroenterological Association medical position statement on constipation. Gastroenterology. 2013;144(1):211–217.
- American College of Gastroenterology Chronic Constipation Task Force. An evidence-based approach to the management of chronic constipation in North America. Am J Gastroenterol. 2005;100(suppl 1):S1–S22.
- Ramkumar D, Rao SS. Efficacy and safety of traditional medical therapies for chronic constipation: systematic review. Am J Gastroenterol. 2005;100(4):936–971.
- Guenaga KF, Matos D, Wille-Jørgensen P. Mechanical bowel preparation for elective colorectal surgery. Cochrane Database Syst Rev. 2011;(9):CD001544.
IN THIS ARTICLE
- Long-term PEG usage safe and effective?
- New and trendy OTC treatment option
- Bowel prep before laparoscopic gynecologic surgery
- Bowel prep before vaginal surgery

Road maps
One of the greatest challenges you may face as a pediatrician is in helping your patients and families navigate the mental health system. Nearly 20% of children will experience a psychiatric illness before they turn 18, and a quarter of those will go on to experience a persistent or severe psychiatric illness. Whether a patient is experiencing symptoms that are mild or severe, their parents are likely to come to you first for an assessment and for help in finding a referral to the appropriate specialist.
Unlike the smooth process to refer to a neurologist or orthopedist, accessing treatment for mental health problems is often confusing and frustrating. Because of reimbursement that is below the cost of providing care, many community hospitals have closed their divisions of child and adolescent psychiatry, and academic medical centers often have a long wait for a provider. If you go through a patient’s insurance, usually the list of providers is woefully out-of-date, with most of them not accepting new referrals or insurance or both. If mental health services are “carved out” to cut costs, the primary insurer has no direct control of mental health services, and the carve out company is looking for providers willing to accept lower reimbursement and limit longer-term treatments. Faced with reimbursement and administrative demands by the carve out company, child psychiatrists, psychologists, and social workers that once staffed these services have chosen fee-for-service private offices that do not accept any insurance, leaving many communities without access to adequate resources. In private practice, these providers are busy, face no administrative demands to justify their work, and earn two or three times what insurers reimburse.

So families often turn to their schools and their pediatricians when faced with a mood, anxiety, or behavioral problem. While there is no straightforward solution to this problem of access, we have put together a “road map” to what services might be available and to help you in your approach to these patients.
It is first important to consider that mental health and developmental questions are now a major part of pediatric primary care. The majority of your visits will be well child care and psychosocial. So a part, maybe a third or half of mental health concerns might now be considered a routine part of primary care. Many practices are now doing psychosocial screening and more states are mandating reimbursement of this screening. Typically screening includes a CHATfor autism (Checklist for Autism in Toddlers), a developmental screen if indicated, a Pediatric Symptom Checklist for school-age children and adolescents, a Hamilton Rating Scale for Depression in adolescents, and a CRAFFTfor adolescent substance abuse. Some practices include a Hamilton or other depression screen for mothers of newborns and toddlers as maternal depression has a serious impact on the child and is responsive to treatment. If screening is reimbursed, some of that money could go to fund an on-site social worker, who can also bill for patient contact services, and thus provide the practice with an on-site mental health presence at break-even cost. This social worker may be expert in referring to local resources, may be trained in psychotherapy, or may even lead groups for parents of recent divorce, new mothers, facing attention-deficit/hyperactivity disorder (ADHD), etc.
The best place to start for a family with psychosocial concerns is to do a brief review of your patient’s day to day functioning – school, friends, family, activities, and mood. What is your best assessment of the problem, how much of the child and family’s life is affected, and how severe is the problem? There are many mental health problems for which the first-line treatment is a trial of medication according to an algorithm that you can use following American Academy of Pediatrics guidelines. For example, if considering stimulant treatment for a 7-year-old with possible attention difficulties, you can use broad screening instruments like the Pediatric Symptom Checklist or Childhood Behavior Checklist as well as the Vanderbilt Assessment Scales or Conners questionnaire that are specific for ADHD. Many pediatricians also are comfortable treating adolescent depression with medication and with comanagement from a social worker with a master’s degree or a doctorate level psychologist. Of course, treating depression requires a more careful interview, consideration of suicide risk, and more frequent follow-up visits.

As first-line treatment for depression and anxiety usually starts with psychotherapy, it is important to consider how you will access this component of mental health care. For those that don’t have a licensed clinical social worker on-site providing cognitive-behavioral therapy, many busy pediatric practices will establish a relationship with a therapist or group that has agreed to accept their referrals and accepts insurance reimbursement. If you are not fortunate enough to already have such a relationship, it can be fruitful to speak with colleagues in a busier practice about whom they use. It also can be fruitful to reach out to the graduate programs in psychology (PhD or PsyD programs) or social work in your community, to find out if they have a referral service or would like to connect recent graduates trying to establish themselves with referring pediatricians. Having a resource located in your office (employed by you or renting space) is ideal.
When a patient is presenting with a more complex set of symptoms or fails to respond to your initial treatments, then you will want to locate an appropriate referral to a child psychiatrist. If your group is affiliated with an academic medical center, find out what the procedure is for referring to their child psychiatrists or to the child psychiatry trainees. Often there is easy availability early in the academic year (summer), when children are less likely to present with problems and a new crop of trainees has arrived. Academic medical centers also will often be a hub for a lot of research activity, and research programs are usually eager to enroll patients without regard to their insurance. Good studies will provide patients with a formalized assessment that will clarify the diagnostic picture, ensuring that a child is on the path to the right treatment. Cultivating a connection with the research coordinator can ensure that your group knows about opportunities for free care that is easier to access than most.
Many states require schools to provide testing to clarify whether psychiatric symptoms, developmental issues, or learning disabilities are affecting a student’s ability to perform in school. Your office can educate parents that they should go to the school with their concerns and request a formal assessment. If testing indicates a condition, the school system is often required to provide appropriate educational services, such as tutoring for learning disabilities, occupational therapy, and social skills support for children on the autism spectrum, and even counseling for children with anxiety, mood, and behavioral issues. Often, the school psychologist or social worker will be a valuable resource in providing direct care to children or helping you and the parents identify excellent treaters in the community. For children with severe and persistent psychiatric illness, many states require that schools provide or pay for the services that are necessary to educate each child. This can mean anything from paying for an after school social skills group to paying for a therapeutic boarding school. In these cases, it is often helpful to have established a relationship with an educational consultant. These are usually social workers with expertise in mental health issues and the state’s educational system and regulations, and they will partner with parents for a modest fee to educate and empower parents so that they might get appropriate services from their schools. Again, it can be fruitful to speak with trusted colleagues and find one who has identified a local consultant that they trust.
Some states and counties have tried to address the problem of accessing psychiatric care for children, but often these are programs that have not been adequately marketed to pediatricians or families, so they may be under utilized. In Massachusetts and Connecticut, there is the state Child Psychiatry Access Project, which provides all pediatricians with free access to a consulting child psychiatrist by phone. It requires that pediatricians are willing to treat children themselves with the support and guidance of a consulting child psychiatrist, but it will also provide a face-to-face diagnostic evaluation of that child by a child psychiatrist so that they can in turn provide the best guidance to the pediatrician. And it provides a care coordinator who will help to identify appropriate treaters, such as a cognitive-behavioral therapist or a psychopharmacologist who accept the family’s insurance, when the pediatrician is unable to provide the recommended treatment. An online investigation through your state’s or county’s Office of Mental Health or your local Medical Society can help your office identify what resources may exist in your community.
Finally, your most critical task after a parent has come to you with concerns about their child’s mood, thinking, or behavior, may be in educating and supporting those parents. Prepare the parents by explaining to them how the mental health system is more fragmented and frustrating than most other medical specialties. Remind them that psychiatric symptoms and illnesses are eminently treatable, and it will be worth patiently navigating this complex system to eventually access the right care for their child. It can be helpful to suggest to them that if they can possibly afford to pay out-of-pocket for the appropriate care, it will make excellent treatment much easier to access in a timely way. It can be meaningful for parents to hear from you that it is worthwhile for them to call or write their insurance company and complain if that company has restricted access to child psychiatric care. They are, after all, the customers of their insurance company, and it is the silence, shame, and stigma surrounding psychiatric illness that has enabled insurance companies to restrict access to effective care. Finally, it can be very powerful to connect parents with support or advocacy organizations that will help them in navigating this system and in speaking up to their insurance companies, state health, or education agencies or in the press in ways that will diminish the stigma that still surrounds these problems. The National Alliance on Mental Illness (www.nami.org), The Bazelon Center for Mental Health Law (www.bazelon.org), and the American Academy of Child and Adolescent Psychiatry (www.aacap.org) all have excellent online resources that also help identify local organizations and resources for parents. If insurance companies refused to pay for potentially life-saving chemotherapy for a pediatric cancer, you can imagine that there would be many parents protesting to those insurers, to the news, and even to their local or state governments. Mental health care should be no different, as the problems can be as disabling and life-threatening and effective treatments and even cures exist.
Dr. Swick is an attending psychiatrist in the division of child psychiatry at Massachusetts General Hospital, Boston, and director of the Parenting at a Challenging Time (PACT) Program at the Vernon Cancer Center at Newton Wellesley Hospital, also in Boston. Dr. Jellinek is professor of psychiatry and of pediatrics at Harvard Medical School, Boston. E-mail them at [email protected].
One of the greatest challenges you may face as a pediatrician is in helping your patients and families navigate the mental health system. Nearly 20% of children will experience a psychiatric illness before they turn 18, and a quarter of those will go on to experience a persistent or severe psychiatric illness. Whether a patient is experiencing symptoms that are mild or severe, their parents are likely to come to you first for an assessment and for help in finding a referral to the appropriate specialist.
Unlike the smooth process to refer to a neurologist or orthopedist, accessing treatment for mental health problems is often confusing and frustrating. Because of reimbursement that is below the cost of providing care, many community hospitals have closed their divisions of child and adolescent psychiatry, and academic medical centers often have a long wait for a provider. If you go through a patient’s insurance, usually the list of providers is woefully out-of-date, with most of them not accepting new referrals or insurance or both. If mental health services are “carved out” to cut costs, the primary insurer has no direct control of mental health services, and the carve out company is looking for providers willing to accept lower reimbursement and limit longer-term treatments. Faced with reimbursement and administrative demands by the carve out company, child psychiatrists, psychologists, and social workers that once staffed these services have chosen fee-for-service private offices that do not accept any insurance, leaving many communities without access to adequate resources. In private practice, these providers are busy, face no administrative demands to justify their work, and earn two or three times what insurers reimburse.
So families often turn to their schools and their pediatricians when faced with a mood, anxiety, or behavioral problem. While there is no straightforward solution to this problem of access, we have put together a “road map” to what services might be available and to help you in your approach to these patients.
It is first important to consider that mental health and developmental questions are now a major part of pediatric primary care. The majority of your visits will be well child care and psychosocial. So a part, maybe a third or half of mental health concerns might now be considered a routine part of primary care. Many practices are now doing psychosocial screening and more states are mandating reimbursement of this screening. Typically screening includes a CHATfor autism (Checklist for Autism in Toddlers), a developmental screen if indicated, a Pediatric Symptom Checklist for school-age children and adolescents, a Hamilton Rating Scale for Depression in adolescents, and a CRAFFTfor adolescent substance abuse. Some practices include a Hamilton or other depression screen for mothers of newborns and toddlers as maternal depression has a serious impact on the child and is responsive to treatment. If screening is reimbursed, some of that money could go to fund an on-site social worker, who can also bill for patient contact services, and thus provide the practice with an on-site mental health presence at break-even cost. This social worker may be expert in referring to local resources, may be trained in psychotherapy, or may even lead groups for parents of recent divorce, new mothers, facing attention-deficit/hyperactivity disorder (ADHD), etc.
The best place to start for a family with psychosocial concerns is to do a brief review of your patient’s day to day functioning – school, friends, family, activities, and mood. What is your best assessment of the problem, how much of the child and family’s life is affected, and how severe is the problem? There are many mental health problems for which the first-line treatment is a trial of medication according to an algorithm that you can use following American Academy of Pediatrics guidelines. For example, if considering stimulant treatment for a 7-year-old with possible attention difficulties, you can use broad screening instruments like the Pediatric Symptom Checklist or Childhood Behavior Checklist as well as the Vanderbilt Assessment Scales or Conners questionnaire that are specific for ADHD. Many pediatricians also are comfortable treating adolescent depression with medication and with comanagement from a social worker with a master’s degree or a doctorate level psychologist. Of course, treating depression requires a more careful interview, consideration of suicide risk, and more frequent follow-up visits.
As first-line treatment for depression and anxiety usually starts with psychotherapy, it is important to consider how you will access this component of mental health care. For those that don’t have a licensed clinical social worker on-site providing cognitive-behavioral therapy, many busy pediatric practices will establish a relationship with a therapist or group that has agreed to accept their referrals and accepts insurance reimbursement. If you are not fortunate enough to already have such a relationship, it can be fruitful to speak with colleagues in a busier practice about whom they use. It also can be fruitful to reach out to the graduate programs in psychology (PhD or PsyD programs) or social work in your community, to find out if they have a referral service or would like to connect recent graduates trying to establish themselves with referring pediatricians. Having a resource located in your office (employed by you or renting space) is ideal.
When a patient is presenting with a more complex set of symptoms or fails to respond to your initial treatments, then you will want to locate an appropriate referral to a child psychiatrist. If your group is affiliated with an academic medical center, find out what the procedure is for referring to their child psychiatrists or to the child psychiatry trainees. Often there is easy availability early in the academic year (summer), when children are less likely to present with problems and a new crop of trainees has arrived. Academic medical centers also will often be a hub for a lot of research activity, and research programs are usually eager to enroll patients without regard to their insurance. Good studies will provide patients with a formalized assessment that will clarify the diagnostic picture, ensuring that a child is on the path to the right treatment. Cultivating a connection with the research coordinator can ensure that your group knows about opportunities for free care that is easier to access than most.
Many states require schools to provide testing to clarify whether psychiatric symptoms, developmental issues, or learning disabilities are affecting a student’s ability to perform in school. Your office can educate parents that they should go to the school with their concerns and request a formal assessment. If testing indicates a condition, the school system is often required to provide appropriate educational services, such as tutoring for learning disabilities, occupational therapy, and social skills support for children on the autism spectrum, and even counseling for children with anxiety, mood, and behavioral issues. Often, the school psychologist or social worker will be a valuable resource in providing direct care to children or helping you and the parents identify excellent treaters in the community. For children with severe and persistent psychiatric illness, many states require that schools provide or pay for the services that are necessary to educate each child. This can mean anything from paying for an after school social skills group to paying for a therapeutic boarding school. In these cases, it is often helpful to have established a relationship with an educational consultant. These are usually social workers with expertise in mental health issues and the state’s educational system and regulations, and they will partner with parents for a modest fee to educate and empower parents so that they might get appropriate services from their schools. Again, it can be fruitful to speak with trusted colleagues and find one who has identified a local consultant that they trust.
Some states and counties have tried to address the problem of accessing psychiatric care for children, but often these are programs that have not been adequately marketed to pediatricians or families, so they may be under utilized. In Massachusetts and Connecticut, there is the state Child Psychiatry Access Project, which provides all pediatricians with free access to a consulting child psychiatrist by phone. It requires that pediatricians are willing to treat children themselves with the support and guidance of a consulting child psychiatrist, but it will also provide a face-to-face diagnostic evaluation of that child by a child psychiatrist so that they can in turn provide the best guidance to the pediatrician. And it provides a care coordinator who will help to identify appropriate treaters, such as a cognitive-behavioral therapist or a psychopharmacologist who accept the family’s insurance, when the pediatrician is unable to provide the recommended treatment. An online investigation through your state’s or county’s Office of Mental Health or your local Medical Society can help your office identify what resources may exist in your community.
Finally, your most critical task after a parent has come to you with concerns about their child’s mood, thinking, or behavior, may be in educating and supporting those parents. Prepare the parents by explaining to them how the mental health system is more fragmented and frustrating than most other medical specialties. Remind them that psychiatric symptoms and illnesses are eminently treatable, and it will be worth patiently navigating this complex system to eventually access the right care for their child. It can be helpful to suggest to them that if they can possibly afford to pay out-of-pocket for the appropriate care, it will make excellent treatment much easier to access in a timely way. It can be meaningful for parents to hear from you that it is worthwhile for them to call or write their insurance company and complain if that company has restricted access to child psychiatric care. They are, after all, the customers of their insurance company, and it is the silence, shame, and stigma surrounding psychiatric illness that has enabled insurance companies to restrict access to effective care. Finally, it can be very powerful to connect parents with support or advocacy organizations that will help them in navigating this system and in speaking up to their insurance companies, state health, or education agencies or in the press in ways that will diminish the stigma that still surrounds these problems. The National Alliance on Mental Illness (www.nami.org), The Bazelon Center for Mental Health Law (www.bazelon.org), and the American Academy of Child and Adolescent Psychiatry (www.aacap.org) all have excellent online resources that also help identify local organizations and resources for parents. If insurance companies refused to pay for potentially life-saving chemotherapy for a pediatric cancer, you can imagine that there would be many parents protesting to those insurers, to the news, and even to their local or state governments. Mental health care should be no different, as the problems can be as disabling and life-threatening and effective treatments and even cures exist.
Dr. Swick is an attending psychiatrist in the division of child psychiatry at Massachusetts General Hospital, Boston, and director of the Parenting at a Challenging Time (PACT) Program at the Vernon Cancer Center at Newton Wellesley Hospital, also in Boston. Dr. Jellinek is professor of psychiatry and of pediatrics at Harvard Medical School, Boston. E-mail them at [email protected].