User login
David Henry's JCSO podcast, September 2014
Among the items featured in Dr David Henry’s monthly podcast for The Journal of Community and Supportive Oncology, is a report on bacteremia in adult cancer patients with apparently stable febrile neutropenia and another on practice gaps and barriers optimal care in patients with CML, ALL, or B-cell lymphomas. Also featured is a report on treatment patterns and clinical effectiveness in patients who are treated in the community setting for metastatic castrate-resistant prostate cancer after first-line docetaxel, as well as a Case Report on a patient with metastatic melanoma presenting as disseminated sporotrichosis.
Among the items featured in Dr David Henry’s monthly podcast for The Journal of Community and Supportive Oncology, is a report on bacteremia in adult cancer patients with apparently stable febrile neutropenia and another on practice gaps and barriers optimal care in patients with CML, ALL, or B-cell lymphomas. Also featured is a report on treatment patterns and clinical effectiveness in patients who are treated in the community setting for metastatic castrate-resistant prostate cancer after first-line docetaxel, as well as a Case Report on a patient with metastatic melanoma presenting as disseminated sporotrichosis.
Among the items featured in Dr David Henry’s monthly podcast for The Journal of Community and Supportive Oncology, is a report on bacteremia in adult cancer patients with apparently stable febrile neutropenia and another on practice gaps and barriers optimal care in patients with CML, ALL, or B-cell lymphomas. Also featured is a report on treatment patterns and clinical effectiveness in patients who are treated in the community setting for metastatic castrate-resistant prostate cancer after first-line docetaxel, as well as a Case Report on a patient with metastatic melanoma presenting as disseminated sporotrichosis.
Multifocal Intraosseous Ganglioneuroma
Acute Achilles Tendon Ruptures: A Comparison of Minimally Invasive and Open Approach Repairs Followed by Early Rehabilitation
VIDEO: CLEOPATRA combo extends survival in HER2-positive metastatic breast cancer
MADRID – The final overall survival analysis of the CLEOPATRA trial showed an unprecedented 15.7-month increase in overall survival for women with HER2-positive metastatic breast cancer.
The results were achieved by adding pertuzumab to first-line trastuzumab and docetaxel chemotherapy (56.5 months vs. 40.8 months; hazard ratio, 0.68; P = .0002).
Importantly, the survival improvement came without excessive toxicity, including cardiac events, lead author Dr. Sandra Swain reported during a presidential symposium at the European Society for Medical Oncology Congress.
The results, now with a median follow-up of 50 months, build on those previously reported from CLEOPATRA, showing a survival trend favoring the combination of two targeted agents with chemotherapy in the first interim analysis and a statistically significant overall survival advantage at 30 months in a second interim analysis.
In a video interview at the meeting, Dr. Swain, medical director of the Washington Cancer Institute, Medstar Washington Hospital Center, discusses the results and their implications for care.
The video associated with this article is no longer available on this site. Please view all of our videos on the MDedge YouTube channel
AT ESMO 2014
Key clinical point: CLEOPATRA establishes pertuzumab and trastuzumab plus chemotherapy as the standard of care in metastatic HER2-positive breast cancer.
Major finding: Overall survival was 40.8 months with trastuzumab plus chemotherapy, and 56.5 months with the addition of pertuzumab.
Data source: Phase III double-blind trial in 808 women with HER2-positive metastatic breast cancer.
Disclosures: The study was funded by Hoffman-La Roche, Genentech. Dr. Swain reported serving as an uncompensated consultant for Genentech/Roche. Her institution has received research funding from Genentech/Roche, Pfizer, Puma, Sanofi-Aventis, and Bristol-Myers Squibb. Several of her coauthors reported financial relationships with several drug firms.

Combo shows potential as frontline therapy in PTCL

Credit: NIH
MADRID—Follow-up data from a phase 1 trial suggest brentuximab vedotin plus chemotherapy may be a feasible frontline option for patients with peripheral T-cell lymphoma (PTCL).
At the ESMO 2014 Congress, investigators presented a 2-year durability analysis from a trial of brentuximab vedotin plus cyclophosphamide, doxorubicin, and prednisone (BV+CHP) in patients newly diagnosed with PTCL.
The estimated 2-year overall survival rate was 80% in these patients. And the median progression-free survival was not reached.
Michelle Fanale, MD, of The University of Texas MD Anderson Cancer Center in Houston, and her colleagues reported these results as abstract 944O.
The research was sponsored by Seattle Genetics Inc. and Takeda Pharmaceuticals International, the companies co-developing brentuximab vedotin (Adcetris).
In this trial, patients received 1 of 2 treatment regimens. The first was sequential treatment (once every 3 weeks) with brentuximab vedotin at 1.8 mg/kg for 2 cycles, followed by cyclophosphamide, doxorubicin, vincristine, and prednisone (CHOP) for 6 cycles.
The second was combination BV+CHP every 3 weeks for 6 cycles. Patients who achieved at least a partial response after 6 cycles of treatment were eligible to receive continued single-agent brentuximab vedotin for up to 10 additional 3-week cycles.
Earlier results with both treatment regimens were published in the Journal of Clinical Oncology. At ESMO, Dr Fanale presented 2-year results among the 26 patients who received BV+CHP.
The median patient age was 56 years. Nineteen patients had systemic anaplastic large-cell lymphoma (sALCL), including 16 patients (62%) with ALK-negative disease.
Two patients had PTCL not otherwise specified, 2 had angioimmunoblastic T-cell lymphoma, 2 had adult T-cell leukemia/lymphoma, and 1 had enteropathy-associated T-cell lymphoma. The majority of patients had advanced-stage disease and/or were considered high risk.
All 26 patients had an objective response to BV+CHP, including 23 patients (88%) with a complete response. All 23 patients who achieved a complete remission demonstrated normalized glucose uptake by PET.
The median observation time was 27.1 months from the first dose of therapy. The estimated 2-year progression-free survival rate was 54%, with no patients receiving a consolidative stem cell transplant. And the estimated 2-year overall survival rate was 80%.
The most common treatment-emergent adverse events of any grade occurring in more than 40% of patients were peripheral sensory neuropathy, nausea, fatigue, hair loss, diarrhea, and shortness of breath.
Based on the results of this study, Seattle Genetics and Takeda initiated a global phase 3 study called ECHELON-2. This randomized, double-blind, placebo-controlled, multicenter trial was designed to investigate BV+CHP vs CHOP as frontline therapy in patients with CD30-positive PTCL.
The study is currently enrolling patients. It is expected to enroll 300 patients, who will be randomized to receive either treatment every 3 weeks for 6 to 8 cycles. ![]()
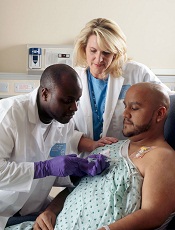
Drug can prevent chemo-induced nausea, vomiting
Credit: Rhoda Baer
MADRID—A small molecule called rolapitant can prevent nausea and vomiting in patients receiving cisplatin-based chemotherapy, results of a phase 3 trial suggest.
When given prior to chemotherapy, rolapitant induced a complete response in about 70% of patients.
These patients had no emesis after chemotherapy and did not require any rescue medication.
“This agent makes a significant difference in the way people tolerate their chemotherapy,” said Martin Chasen, MD, of Ottawa Hospital Cancer Centre in Canada.
“Patients experienced no loss in quality of life, and, in fact, many saw meaningful improvements. One of the patients in the rolapitant cohort reported that he had just finished 18 holes of golf one week after receiving chemotherapy. This is in sharp contrast to many patients on current standard anti-emetics that are too ill to get out of bed within a week after each cycle of cisplatin.”
Dr Chasen and his colleagues reported these results at the ESMO 2014 Congress (abstract LBA47_PR).
The team had set out to evaluate rolapitant, a novel antagonist of the NK-1 receptor, for the prevention of severe nausea and vomiting often experienced by patients receiving cisplatin-based chemotherapy, which may cause dose reductions and treatment discontinuation.
The trial included 532 patients who were randomized 1:1 to receive rolapitant plus granisetron/dexamethasone or placebo plus granisetron/dexamethasone prior to chemotherapy.
The primary endpoint was complete response (defined as the patient having no emesis and not requiring any rescue medication) in the delayed phase (>24-120 hours) post-chemotherapy. Key secondary endpoints included complete response during the acute phase (0-24 hours) and overall (0-120 hours).
The trial met its primary endpoint, with 72.7% of patients receiving rolapitant achieving a complete response in the delayed phase, compared to 58.4% of those receiving placebo (P<0.001).
Rolapitant also improved the complete response rate compared to placebo in the acute phase—83.7% and 73.7%, respectively (P=0.005).
Overall, the complete response rates were 70.1% and 56.5%, respectively (P=0.001).
Patients receiving rolapitant tended to report that chemotherapy had less of an impact on their daily quality of life, although the difference between the treatment arms was not significant—72.8% vs 67.8% (P=0.231).
“Rolapitant demonstrated a significant effect in both the acute and delayed phases,” Dr Chasen noted. “Our primary endpoint was achieved in the delayed phase—an incredible result.”
“We know that the NK-1 receptor in the brain must be blocked to control nausea and vomiting. Rolapitant is an exceptionally long-term receptor blocker that binds to the receptor and remains in place for up to 120 hours, therefore not allowing the chemotherapy to induce nausea and vomiting.”
Dr Chasen added that rolapitant may prove effective in patients receiving less emetogenic cancer treatments as well. ![]()
Research could aid platelet production
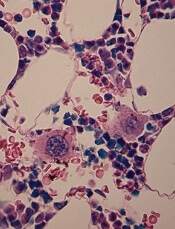
in the bone marrow
Scientists say they’ve shed new light on the mechanism of platelet formation, paving the way to accelerating and enhancing platelet production using stem cells.
The group uncovered their findings by studying the effects of shear stress on megakaryocyte maturation and the formation of preplatelets, platelet-like particles, and megakaryocyte microparticles.
“Until recently, these microparticles were viewed as inconsequential cell debris,” said Terry Papoutsakis, PhD, of the University of Delaware in Newark.
“We now know that they play a significant biological role in platelet formation. The enhanced generation of preplatelets and platelet-like particles under shear stress correlates with physiological observations—in healthy adults, both acute and prolonged exercise leads to elevated platelet counts.”
“Now, these findings can be used to develop better bioreactor technologies for producing platelets, preplatelets, platelet-like particles, and megakaryocyte microparticles for transfusion medicine, using stem cells as starting material.”
Dr Papoutsakis and his colleagues described these findings in Blood.
The researchers discovered that shear stress accelerated DNA synthesis of immature megakaryocytes, and this was dependent upon exposure time and the shear stress level.
Physiological shear stress increased the formation of preplatelets and platelet-like particles up to 10.8-fold. And it increased megakaryocyte microparticle production up to 47-fold. Platelet-like particles generated under shear flow showed improved function.
Experiments also revealed that phosphatidylserine exposure and caspase-3 activation were enhanced by shear stress. But inhibiting caspase-3 reduced the formation of preplatelets, platelet-like particles, and megakaryocyte microparticles.
Finally, the researchers found that coculturing megakaryocyte microparticles with hematopoietic stem and progenitor cells promoted differentiation to mature megakaryocytes that synthesized α- and dense-granules, and formed preplatelets without exogenous thrombopoietin.
The team noted that, unlike platelets themselves, these microparticles can be frozen, which will enable them to be stored and used for platelet production on an as-needed basis.
“Knowing that these microparticles have a biological function opens the door to other applications, including genetic therapies,” Dr Papoutsakis said. “We’re hopeful that our discovery can break the vicious cycle of [immune thrombocytopenia] as well as other conditions that cause reduced platelet count and cause life-threatening bleeding.” ![]()
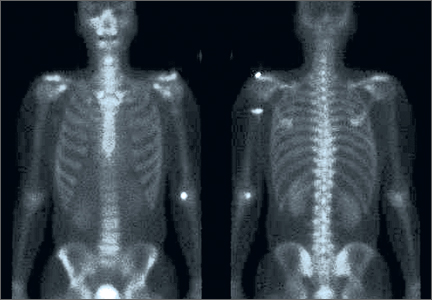
Hypercalcemia may be indicator for hematologic cancers
Credit: Graham Colm
Hypercalcemia could be an early indication of cancer, according to a study published in the British Journal of Cancer.
The connection between hypercalcemia and cancer is well known, but this study shows the condition can predate cancer diagnosis in primary care.
The association between hypercalcemia and cancers was particularly strong in men. And myeloma and other hematologic malignancies were among the most common cancers associated with hypercalcemia.
“All previous studies on hypercalcemia and cancer had been carried out with patients who had already been diagnosed with cancer; hypercalcemia was seen as a late effect of the cancer,” said study author Fergus Hamilton, of the University of Bristol in the UK.
“We wanted to look at the issue from a different perspective and find out if high calcium levels in blood could be used as an early indicator of cancer and, therefore, in the diagnosis of cancer.”
So the researchers analyzed the electronic records of 54,267 patients with elevated calcium levels and found that hypercalcemia was strongly associated with cancer, especially in males.
The positive predictive values for cancer in men were 11.5% for calcium levels between 2.60 and 2.79 mmol l-1, 27.9% for 2.8-2.99 mmol l-1, and 50% for >3.0 mmol l-1. In women, the corresponding values were 4.1%, 8.7%, and 16.7%, respectively.
In men, the most common cancers associated with hypercalcemia were lung (34%), prostate (21%), colorectal (8%), myeloma (8%), and other hematologic cancers (8%). There were 12 other cancer types recorded as well (19%).
In women, the most common cancers were myeloma (24%), breast (18%), other hematologic cancers (10%), lung (8%), and metastatic cancer with unknown primary (8%). There were 16 other cancers recorded among women (32%).
The researchers found no difference in calcium levels among the different cancers.
“We were surprised by the gender difference,” Dr Hamilton said. “There are a number of possible explanations for this, but we think it might be because women are much more likely to have hyperparathyroidism, another cause of hypercalcemia. Men rarely get this condition, so their hypercalcemia is more likely to be due to cancer.” ![]()
Diabetes Mellitus and Skin Infections
Diabetes mellitus is one of the most common comorbid conditions among patients hospitalized for acute bacterial skin infections.[1, 2, 3, 4, 5, 6] Acute bacterial skin infections in diabetics represent a spectrum of conditions ranging from cellulitis or cutaneous abscess to more complicated infections such as infected ulcers or deep tissue infections. Although most skin infections in diabetics are caused by gram‐positive pathogens (Staphylococcus aureus and streptococci), the risk of gram‐negative pathogens is increased in certain complicated infections such as diabetic foot infections.[7] For such complicated infections, national guidelines therefore recommend broad‐spectrum empiric antibiotic therapy.[7]
The role of gram‐negative pathogens has not been clearly established in diabetics with cellulitis or cutaneous abscess not associated with an infected ulcer or diabetic foot infection. National guidelines for the treatment of cellulitis and abscess recommend antibiotic therapy targeted toward S aureus and streptococcal species irrespective of the presence of diabetes mellitus.[8, 9] However, in a recent multicenter study of patients hospitalized with acute bacterial skin infections in which cases involving infected ulcers or deep tissue infection were excluded, diabetes mellitus was an independent predictor of use of antibiotics with broad gram‐negative activity.[2] This suggests that either gram‐negative pathogens are more common or providers perceive gram‐negative pathogens to be more common among diabetics with otherwise uncomplicated cellulitis or abscess.
A better understanding of the relationship between the microbiology and antibiotic prescribing practices for diabetics with cellulitis or abscess is therefore necessary to promote the most appropriate spectrum of therapy for these patients. We evaluated a large cohort of patients hospitalized with acute bacterial skin infections in order to: (1) compare the microbiology of diabetics and nondiabetics with cellulitis or cutaneous abscess not associated with an ulcer or deep tissue infection; and (2) compare antibiotic prescribing practices among diabetics and nondiabetics. We hypothesized that diabetics would have a similar spectrum of microorganisms as nondiabetics but would be more frequently treated with antibiotics with broad gram‐negative activity.
METHODS
Study Design
This was a secondary analysis of 2 published retrospective studies of patients hospitalized for cellulitis or cutaneous abscess between January 1, 2007 and May 31, 2012.[2, 10] For the purposes of this study, the terms cellulitis and abscess will refer to infections not involving an infected ulcer, osteomyelitis, or other deep tissue infection.
Study Setting and Population
The first of the 2 cohorts analyzed for the present study included patients hospitalized with cellulitis, abscess, or wound infection at 7 academic or community hospitals in Colorado.[2] The second cohort included patients hospitalized with cellulitis or abscess at a single academic medical center (1 of the 7 hospitals above) in Denver, Colorado.[10] The methods of these studies have been reported in detail elsewhere.[2, 10, 11] Briefly, potential cases were identified using International Classification of Diseases, 9th Revision, Clinical Modification codes. The main inclusion and exclusion criteria of the 2 studies were similar. In both studies, cases were excluded that involved infected ulcers or suspected or confirmed deep tissue involvement (eg, osteomyelitis, myositis, fasciitis). Cases were also excluded that involved other infections where empiric antibiotic therapy with gram‐negative activity is standard including infected human or animal bites, periorbital or orbital infections, and perineal infections. The combined cohort in the present study therefore represented a group of patients hospitalized with relatively uncomplicated cellulitis or cutaneous abscess.
Definitions and Study Outcomes
Only 1 of the 2 studies from which the current cohort was derived distinguished between nonpurulent cellulitis, purulent cellulitis, and wound infection.[2] In the other study, cases were more broadly defined as either cellulitis or cutaneous abscess.[10] Infected ulcers and deep tissue infections were excluded from both studies. In combining the data into the current cohort, all nondrainable infections (purulent or nonpurulent cellulitis and wound infection) were categorized generally as cellulitis. All cases with documentation of an abscess in the medical record were categorized as cutaneous abscess. Presence of diabetes mellitus was based on provider documentation of the condition during the hospitalization. Microbiological cultures were obtained at the discretion of treating providers. Exposure to antibiotics with a broad spectrum of gram‐negative activity was defined as receipt of 2 or more calendar days of ‐lactam/‐lactamase inhibitor combinations, second‐ through fifth‐generation cephalosporins, fluoroquinolones, carbapenems, tigecycline, aminoglycosides, or colistin.[2]
The follow‐up periods differed slightly between the 2 studies used to derive the current cohort. In 1 study, all clinical encounters within 30 days of hospital discharge were reviewed to assess clinical outcomes.[10] In the other, clinical encounters within 45 days from the date of hospitalization were reviewed.[2] Clinical failure was defined as any of the following within the 30‐ or 45‐day follow‐up periods, respectively: (1) treatment failure, defined as a change in antibiotic therapy or unplanned drainage procedure due to inadequate clinical response more than 5 days[2] or 7 days[10] after hospital admission; (2) recurrence, defined as reinitiation of antibiotics for skin infection after completion of the initial treatment course; or (3) rehospitalization due to skin infection.[11]
Statistical Analysis
Because the clinical factors, microbiology, and treatment of cellulitis and cutaneous abscesses differ, analyses were performed for the total cohort and stratified by type of infection. Microorganisms cultured, antibiotic selection, and treatment duration were compared between diabetics and nondiabetics using the Wilcoxon rank sum test, 2, or Fisher exact test, as appropriate.
Because we hypothesized that the presence of diabetes mellitus in patients with cellulitis or abscess leads to use of broad gram‐negative therapy, we developed a multivariable logistic regression model to identify factors independently associated with exposure to antibiotics with broad gram‐negative activity. We also developed a linear regression model to explore the relationship between diabetes mellitus and duration of antibiotic therapy after adjusting for covariates. To develop these models, we first performed bivariate analyses and retained variables with a P value 0.25 in the regression models. Variables that did not meet the P value threshold but were considered to be clinically relevant covariates were also included in the model. We assessed for effect modification, multicollinearity, and goodness of fit when developing the models. We used SAS version 9.3 (SAS Institute, Cary, NC) for data analysis.
RESULTS
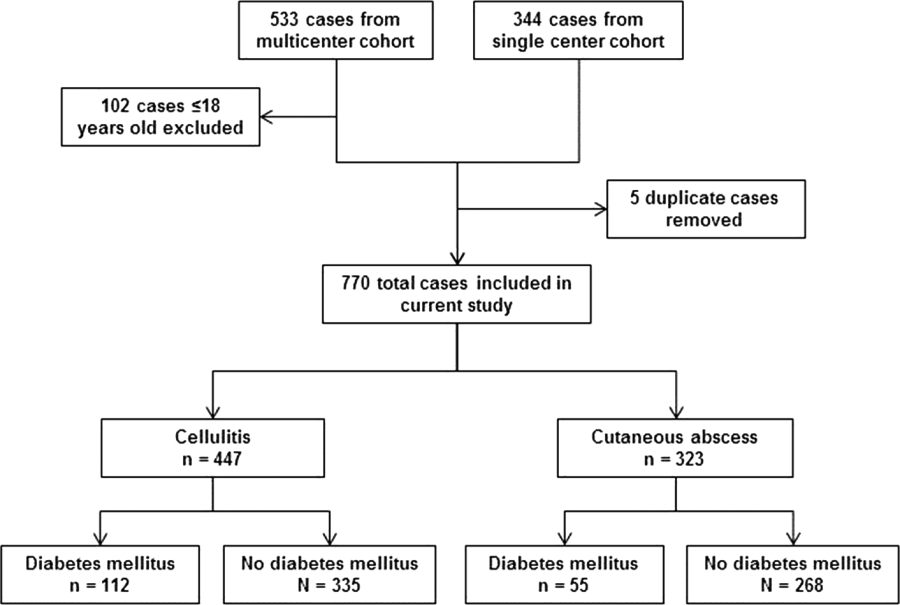
After excluding 102 pediatric cases and removing 5 duplicate cases, 770 total cases were included for analysis: 447 involved cellulitis and 323 involved cutaneous abscess (Figure 1). Overall, 167 (22%) patients had diabetes mellitus. Diabetics were significantly more likely than nondiabetics to have cellulitis as the presenting infection (67% of cases vs 56%, P=0.008) and to have lower extremity involvement (48% vs 33%, P<0.001) (Table 1). Diabetics were also older (median age 55 years vs 48 years, P<0.001), more likely to have cirrhosis or prior skin infection, and less likely to be injection‐drug users or human immunodeficiency virus (HIV) infected. Demographic and clinical characteristics among diabetics and nondiabetics stratified by the categorizations of cellulitis and cutaneous abscess are presented in the Supporting Information, Appendix Table 1, in the online version of this article.
| Diabetes Mellitus, N=167 | No Diabetes Mellitus, N=603 | |
|---|---|---|
| ||
| Type of infection | ||
| Cellulitis | 112 (67) | 335 (56)a |
| Cutaneous abscess | 55 (33) | 268 (44) |
| Age, y, median (IQR) | 55 (4763) | 48 (3658)a |
| Male | 102 (61) | 405 (67) |
| Injection drug use | 9 (5) | 117 (19)a |
| Alcohol abuse or dependence | 15 (9) | 86 (14) |
| Cirrhosis | 11 (7) | 17 (3)a |
| HIV infection | 0 | 29 (5)a |
| Dialysis dependence | 4 (2) | 5 (1) |
| Peripheral arterial disease | 4 (2) | 5 (1) |
| Saphenous vein harvest | 7 (4) | 11 (2) |
| Prior skin infection | 56 (34) | 125 (21)a |
| Prior MRSA infection or colonization | 20 (12) | 50 (8) |
| Anatomical location | ||
| Lower extremity | 80 (48) | 200 (33)a |
| Upper extremity | 6 (4) | 79 (13)a |
| Head and neck | 14 (8) | 38 (6) |
| Buttock or inguinal | 8 (5) | 35 (6) |
| Chest, abdomen, back, or axilla | 9 (5) | 25 (4) |
| Multiple distinct sites | 7 (4) | 34 (6) |
| Medical primary service | 139 (83) | 395 (66)a |
| Consultation requested | 99 (59) | 294 (49)a |
| Surgery | 58 (35) | 152 (25)a |
| Internal medicine | 18 (11) | 47 (8) |
| Infectious diseases | 41 (25) | 149 (25) |
| Failed initial outpatient antibiotic therapy | 52 (31) | 186 (31) |
| Fever (temperature 38.0C) | 20 (12) | 102 (17) |
| Leukocytosis (WBC >10,000 cells/mm3) | 78 (47) | 311 (52) |
The frequency of use of microbiological cultures was similar among diabetics and nondiabetics (Table 2). In cases of cellulitis, a microorganism was identified in 18% of diabetics and 12% of nondiabetics (P=0.09). In cases of cutaneous abscess, a microorganism was identified more commonly (69% and 74%, respectively, P=0.50). Among cases where a microorganism was identified, aerobic gram‐positive organisms were isolated in 90% of diabetics and 92% of nondiabetics (P=0.59). Aerobic gram‐negative organisms were isolated in 7% of diabetics and 12% of nondiabetics (P=0.28). Specific gram‐negative organisms isolated are shown in the Supporting Information, Appendix Table 2, in the online version of this article; no cases in diabetics involved Pseudomonas aeruginosa. The comparison of microbiological data among diabetics and nondiabetics was similar when stratified by cellulitis versus cutaneous abscess (Table 2).
| Cellulitis | Cutaneous Abscess | All Cases | |||||||
|---|---|---|---|---|---|---|---|---|---|
| Diabetes Mellitus, N=112 | No Diabetes Mellitus, N=335 | P | Diabetes Mellitus, N=55 | No Diabetes Mellitus, N=268 | P | Diabetes Mellitus, N=167 | No Diabetes Mellitus, N=603 | P | |
| |||||||||
| Any microbiological culture obtaineda | 82 (73) | 234 (70) | 46 (84) | 239 (89) | 128 (77) | 473 (78) | |||
| Wound drainage or swab | 19 (17) | 36 (11) | 1 (2) | 8 (3) | 20 (12) | 44 (7) | |||
| Abscess material | 1 (1) | 3 (1) | 39 (71) | 205 (76) | 40 (24) | 208 (34) | |||
| Tissueb | 2 (2) | 17 (5) | 1 (2) | 8 (3) | 3 (2) | 25 (4) | |||
| Blood | 73 (65) | 212 (63) | 26 (47) | 121 (45) | 99 (59) | 333 (55) | |||
| Any microorganism identifiedc | 20 (18) | 39 (12) | 0.09 | 38 (69) | 197 (74) | 0.50 | 58 (35) | 236 (39) | 0.30 |
| Aerobic gram‐positive | 15 (75) | 36 (92) | 0.11 | 37 (97) | 182 (92) | 0.48 | 52 (90) | 218 (92) | 0.59 |
| Staphylococcus aureus | 11 (55) | 26 (67) | 0.38 | 28 (74) | 132 (67) | 0.42 | 39 (67) | 158 (67) | 0.97 |
| Methicillin‐susceptible | 4 (20) | 15 (38) | 0.15 | 12 (32) | 42 (21) | 0.17 | 16 (28) | 57 (24) | 0.59 |
| Methicillin‐resistant | 5 (25) | 11 (28) | 1.00 | 14 (37) | 85 (43) | 0.47 | 19 (33) | 96 (41) | 0.27 |
| Susceptibility not performed | 2 (10) | 0 | 0.11 | 2 (5) | 5 (3) | 0.32 | 4 (7) | 5 (2) | 0.08 |
| Streptococcal species | 6 (30) | 15 (38) | 0.52 | 12 (32) | 69 (35) | 0.68 | 18 (31) | 84 (36) | 0.51 |
| ‐hemolytic streptococcus | 3 (15) | 13 (33) | 0.13 | 6 (16) | 32 (16) | 0.94 | 9 (16) | 45 (19) | 0.53 |
| Streptococcus anginosus/Streptococcus milleri group | 1 (5) | 0 | 0.34 | 2 (5) | 29 (15) | 0.11 | 3 (5) | 29 (12) | 0.12 |
| Other ‐hemolytic streptococcus | 2 (10) | 2 (5) | 0.60 | 4 (11) | 12 (6) | 0.30 | 6 (10) | 14 (6) | 0.25 |
| Other streptococcus | 0 | 0 | 1 (3) | 3 (2) | 0.51 | 1 (2) | 3 (1) | 0.59 | |
| Staphylococcus aureus or streptococci | 15 (75) | 35 (90) | 0.25 | 37 (97) | 182 (92) | 0.48 | 52 (90) | 217 (92) | 0.60 |
| Enterococcus species | 0 | 2 (5) | 0.54 | 0 | 4 (2) | 1.00 | 0 | 6 (3) | 0.60 |
| Aerobic gram‐negative | 2 (10) | 7 (18) | 0.70 | 2 (5) | 21 (11) | 0.39 | 4 (7) | 28 (12) | 0.28 |
| Anaerobic organism(s) | 2 (10) | 3 (8) | 1.00 | 8 (21) | 30 (15) | 0.37 | 10 (17) | 33 (14) | 0.53 |
| Mixed skin or oral flora | 1 (5) | 1 (3) | 1.00 | 0 | 1 (1) | 1.00 | 1 (2) | 2 (1) | 0.48 |
| Other | 1 (5) | 3 (8) | 1.00 | 2 (5) | 3 (2) | 0.19 | 3 (5) | 6 (3) | 0.39 |
| Polymicrobial | 3 (15) | 17 (45) | 0.03 | 11 (29) | 47 (24) | 0.51 | 14 (24) | 64 (27) | 0.65 |
| Positive blood cultured | 4 (5) | 8 (4) | 0.51 | 2 (8) | 3 (2) | 0.21 | 6 (6) | 11 (3) | 0.24 |
Antibiotic utilization is summarized in Table 3. Among patients who were started on antibiotic therapy in the emergency department or urgent care, the initial regimen included an agent with broad gram‐negative activity in 31% of both diabetics and nondiabetics (P=0.97). During the entire hospital stay (including the emergency department or urgent care), diabetics were significantly more likely to be treated with ‐lactam/‐lactamase inhibitor combinations (42% vs 33%, P=0.04). At the time of hospital discharge, diabetics were more likely to be prescribed fluoroquinolones (11% vs 5%, P=0.01) (Table 3) particularly for cases of cellulitis (13% vs 6%, P=0.008) (see Supporting Information, Appendix Table 3, in the online version of this article). Diabetics were somewhat more likely to be prescribed parenteral antibiotics (10% vs 6%, P=0.07) after discharge. When considering both inpatient and discharge therapy, more diabetics than nondiabetics were exposed to at least 2 calendar days of broad gram‐negative therapy (54% vs 44%, P=0.02) and more were prescribed an antipseudomonal agent (38% vs 25%, P=0.002). In the group of patients who received at least 1 dose of an antibiotic with broad gram‐negative activity, broad gram‐negative agents accounted for 33% of the total days of therapy prescribed for diabetics and 32% for nondiabetics. Overall prescribing patterns were similar when stratified by cellulitis versus cutaneous abscess (see Supporting Information, Appendix Table 3, in the online version of this article).
| Diabetes Mellitus, N=167 | No Diabetes Mellitus, N=603 | P | |
|---|---|---|---|
| |||
| Individual antibiotics prescribed during the inpatient stayab | |||
| Vancomycin | 142 (85) | 504 (84) | 0.65 |
| Clindamycin | 27 (16) | 131 (22) | 0.12 |
| Parenteral ‐lactam/‐lactamase inhibitor | 70 (42) | 200 (33) | 0.04 |
| Second‐generation or higher cephalosporin | 13 (8) | 51 (8) | 0.78 |
| Cefazolin | 17 (10) | 91 (15) | 0.11 |
| Carbapenem | 9 (5) | 34 (6) | 0.90 |
| Fluoroquinolone | 20 (12) | 53 (9) | 0.21 |
| Daptomycin | 8 (5) | 24 (4) | 0.64 |
| Linezolid | 2 (1) | 8 (1) | 1.00 |
| Other ‐lactam | 6 (4) | 30 (5) | 0.45 |
| Trimethoprim‐sulfamethoxazole | 12 (7) | 30 (5) | 0.27 |
| Doxycycline | 15 (9) | 44 (7) | 0.47 |
| Cephalexin | 7 (4) | 22 (4) | 0.74 |
| Amoxicillin‐clavulanate | 11 (7) | 24 (4) | 0.15 |
| Antibiotics prescribed at hospital dischargeb | 163 (98) | 580 (96) | 0.38 |
| Clindamycin | 20 (12) | 95 (16) | 0.23 |
| Trimethoprim‐sulfamethoxazole | 52 (31) | 215 (36) | 0.28 |
| Doxycycline | 32 (19) | 91 (15) | 0.20 |
| Cephalexin | 12 (7) | 46 (8) | 0.85 |
| Amoxicillin‐clavulanate | 24 (14) | 82 (14) | 0.80 |
| Fluoroquinolone | 18 (11) | 32 (5) | 0.01 |
| Linezolid | 8 (5) | 19 (3) | 0.31 |
| Other oral ‐lactam | 3 (2) | 28 (5) | 0.10 |
| Other oral antibiotic | 1 (1) | 2 (0.3) | 0.52 |
| Vancomycin | 8 (5) | 15 (2) | 0.13 |
| Daptomycin | 5 (3) | 10 (2) | 0.34 |
| Other parenteral antibiotic | 4 (2) | 11 (2) | 0.75 |
| Antibiotic with broad gram‐negative activity initiated in emergency department or urgent care | 46/149 (31) | 174/561 (31) | 0.97 |
| Exposed to any antibiotic with broad gram‐negative activityc | 101 (62) | 311 (53) | 0.048 |
| Exposed to any antibiotic with antipseudomonal activity | 62 (38) | 149 (25) | 0.002 |
| Exposed to at least 2 calendar days of antibiotics with broad gram‐negative activityc | 89 (54) | 259 (44) | 0.02 |
| Treatment durationd | |||
| Total duration of therapy, d, median (IQR) | 13 (1015) | 12 (1015) | 0.09 |
| Duration of inpatient therapy, d, median (IQR) | 4 (36) | 4 (35) | 0.03 |
| Duration of therapy after discharge, d, median (IQR) | 8 (710) | 8 (710) | 0.58 |
After adjusting for covariates in the logistic regression model, diabetes mellitus was an independent predictor of exposure to broad gram‐negative therapy (see Supporting Information, Appendix Table 4, in the online version of this article). In addition to diabetes mellitus, culture of an aerobic gram‐negative microorganism, infectious diseases service consultation, presence of fever, and nonmedical admitting services were significantly associated with exposure to broad gram‐negative therapy. Prior methicillin‐resistant S aureus infection or colonization and HIV infection were inversely associated. Compared with nondiabetics, the total duration of antibiotic therapy in diabetics was somewhat longer (median 13 days vs 12 days, P=0.09) (Table 3). After adjusting for covariates in the linear regression model, there was a significant association between diabetes mellitus and treatment duration. On average, diabetics were treated 1 day (95% confidence interval: 0.2‐1.7 days) longer than nondiabetics.
Compared with nondiabetics, diabetics were more likely to have an outpatient follow‐up visit (73% vs 61%, P=0.002) and to be rehospitalized for any reason after discharge (16% vs 9%, P=0.02) (Table 4). Diabetics were overall more likely to be classified as clinical failure (15% vs 9%, P=0.02); this difference was driven by the cellulitis subgroup (19% vs 10%, P=0.01).
| Cellulitis | Cutaneous Abscess | All Cases | |||||||
|---|---|---|---|---|---|---|---|---|---|
| Diabetes Mellitus, N=112 | No Diabetes Mellitus, N=335 | P | Diabetes Mellitus, N=55 | No Diabetes Mellitus, N=268 | P | Diabetes Mellitus, N=167 | No Diabetes Mellitus, N=603 | P | |
| |||||||||
| Survived to discharge | 111 (99) | 335 (100) | 0.25 | 55 (100) | 268 (100) | 166 (99) | 603 (100) | 0.22 | |
| Outpatient follow‐up documented | 82 (74) | 204 (61) | 0.01 | 40 (73) | 161 (60) | 0.08 | 122 (73) | 365 (61) | 0.002 |
| Rehospitalized | 22 (20) | 34 (10) | 0.008 | 4 (7) | 21 (8) | 1.00 | 26 (16) | 55 (9) | 0.02 |
| Clinical failure | 21 (19) | 34 (10) | 0.01 | 4 (7) | 20 (7) | 1.00 | 25 (15) | 54 (9) | 0.02 |
| Treatment failure | 7 (6) | 17 (5) | 0.62 | 2 (4) | 7 (3) | 0.65 | 9 (5) | 24 (4) | 0.42 |
| Recurrence | 10 (9) | 16 (5) | 0.10 | 1 (2) | 11 (4) | 0.70 | 11 (7) | 27 (4) | 0.26 |
| Rehospitalization due to skin infection | 14 (13) | 17 (5) | 0.01 | 3 (5) | 11 (4) | 0.71 | 17 (10) | 28 (5) | 0.01 |
| Length of stay, d, median (IQR) | 4 (36) | 4 (35) | 0.03 | 4 (36) | 4 (35) | 0.28 | 4 (36) | 4 (35) | 0.02 |
DISCUSSION
Diabetes mellitus is a common comorbidity in patients with acute bacterial skin infections. In this large cohort of patients hospitalized for cellulitis or cutaneous abscess, where those with infected ulcers or deep tissue infections were excluded, microbiological findings in cases associated with positive cultures were similar among diabetics and nondiabetics. Although aerobic gram‐negative microorganisms were not more likely to be identified in diabetics, diabetics were significantly more likely to be exposed to at least 2 calendar days of antibiotics with broad gram‐negative activity. After adjusting for covariates, diabetes mellitus was independently associated with exposure to broad gram‐negative therapy.
To our knowledge, this is the first study to compare the microbiology of cellulitis and cutaneous abscess among diabetics and nondiabetics. Lipsky and colleagues previously described the microbiology of a cohort of diabetic patients hospitalized with a broader range of skin infections including cellulitis, infected ulcers, and surgical site infections.[12] Similar to our findings, gram‐negative pathogens were uncommonly isolated in that study; however, in the absence of a comparator group, whether diabetics were at higher risk for gram‐negative involvement than nondiabetics was not known. Similar to the study by Lipsky and colleagues, most studies of skin infections in diabetics have included a relatively heterogeneous group of infections.[12, 13, 14, 15] The present study therefore contributes to the literature by providing a focused comparison of the microbiology of inpatient cellulitis and abscess in the absence of complicating factors such as an infected ulcer or deep tissue involvement. We found that among cases with a positive culture (13% of cases in the cellulitis group and 73% in the abscess group), the microbiology was similar among diabetics and nondiabetics. Although a microorganism was identified in only a minority of cases of cellulitis, our findings do not support the need for broad gram‐negative therapy in diabetics with cellulitis not associated with an ulcer or deep tissue infection. In diabetics with an abscess, antibiotics with broad gram‐negative activity do not appear to be indicated.
The present study also adds to the literature by providing a detailed comparison of antibiotic utilization patterns among diabetics and nondiabetics. We demonstrated that diabetics were more likely to have significant exposure to antibiotics with broad gram‐negative activity, particularly antipseudomonal agents (the broadest‐spectrum antibiotics). Because initiation of broad gram‐negative therapy in the emergency department or urgent care was not more common among diabetics, the increased use of these agents among diabetics appeared to be driven by inpatient providers. It is also notable that of patients who received any antibiotic with broad gram‐negative activity, these agents accounted for similar proportions of the total days of therapy in both diabetics and nondiabetics. In aggregate, our findings demonstrate that diabetics are more likely to be started on antibiotics with broad gram‐negative activity by inpatient providers, diabetics are not necessarily continued on longer durations of broad gram‐negative therapy once started, and the total amount of exposure to broad gram‐negative agents is substantial.
Overall, our findings suggest that inpatient providers perceive diabetics with cellulitis or abscess to be at increased risk for gram‐negative pathogens. This perhaps reflects an extrapolation of recommendations to use broad‐spectrum empiric therapy in diabetics with certain complicated skin infections.[7] However, for patients with cellulitis or cutaneous abscess, Infectious Diseases Society of America (IDSA) guidelines recommend antibiotic therapy targeted toward S aureus and streptococcal species; there is no suggestion to use a broader spectrum of therapy in diabetics.[8, 9] Our findings therefore highlight an important opportunity to improve antibiotic selection for all patients hospitalized with cellulitis and abscess, but particularly diabetics. It is also noteworthy that by linear regression, diabetes mellitus was independently associated with longer treatment durations. Although the average increase in treatment duration was small (1 day), this finding adds to the evidence that the presence of diabetes mellitus alters providers' treatment approach to cellulitis or abscess.
We found that despite more frequent treatment with broad gram‐negative therapy, diabetics were more likely than nondiabetics to be classified as clinical failures. It is important to point out that diabetics were also more likely than nondiabetics to have postdischarge outpatient follow‐up visits, raising the possibility of biased ascertainment of clinical failure events in this group. However, we also demonstrated that diabetics with cellulitis were more likely to be rehospitalized than nondiabetics. This is similar to a finding by Suaya and colleagues who showed that diabetics with skin infections were about twice as likely to be rehospitalized as nondiabetics.[13] One could hypothesize that the increased frequency of clinical failure events among diabetics was due to their older age, hyperglycemia, or vascular insufficiency; however, other factors may have contributed. For example, providers may have mistaken residual erythema for ongoing or recurrent cellulitis, or the diagnosis of cellulitis could have been incorrect to begin with. Additionally, there may have been uncertainty about the microbiology of cellulitis because the infecting pathogen was not usually identified. These factors may have led to alterations in treatment that would have resulted in a classification of clinical failure, and it is possible that providers had a lower threshold to alter treatment in diabetics. It is therefore not clear whether our findings represent a true difference in clinical outcomes between diabetics or nondiabetics. Regardless, in cases associated with a positive culture, our microbiological results do not support that the difference in clinical failure between diabetics and nondiabetics with cellulitis was related to a different spectrum of microorganisms.
In addition to the limitations outlined previously[2, 10] and above, the present study has at least 5 additional limitations. First, this was a secondary analysis of studies that were not designed to evaluate the effect of diabetes mellitus on the microbiology and treatment of skin infections. For example, hemoglobin A1C values were not collected; therefore, we could not examine whether the microbiology and antibiotic prescribing practices differed based on control of diabetes mellitus. Second, there were minor differences in inclusion and exclusion criteria between the 2 cohorts included in this study. Because the proportion of patients with diabetes mellitus was similar among both cohorts, and comparisons were not made between the cohorts, this should not have impacted our results. Third, the broad categorization of cellulitis used when combining the 2 cohorts raised the possibility of differences in infection characteristics between diabetics and nondiabetics (eg, presence of a wound) that could have confounded our findings regarding use of gram‐negative therapy. In the larger of the 2 cohorts from which the combined cohort was derived, only 17 (3%) of 533 patients had wound infections, whereas those with infected ulcers or suspected deep‐tissue infection were excluded from both cohorts. Furthermore, in the combined cohort, the increased frequency of broad gram‐negative therapy among diabetics was also observed in the cutaneous abscess group. It is therefore unlikely that the categorization of cellulitis had a significant impact on our results. Fourth, given the observational nature of the study, the microbiological data were subject to limitations. Importantly, because the infecting pathogen was identified in only 13% of cases of cellulitis, firm conclusions regarding the microbiology of cellulitis cannot be drawn. Finally, the small number of gram‐negative organisms isolated precluded comparisons of specific pathogens among diabetics and nondiabetics. In addition, because a number of gram‐negative organisms were isolated from wound cultures, it is not known whether they were clinically relevant or simply represented colonization.
In conclusion, in cases of cellulitis or abscess associated with a positive culture, gram‐negative microorganisms were not isolated more commonly among diabetics compared with nondiabetics. However, in general, diabetics were more likely to be treated with broad gram‐negative therapy suggesting that, particularly for cutaneous abscesses, this prescribing practice may not be warranted. These findings support current IDSA guidelines that recommend antibiotic therapy targeted toward gram‐positive pathogens for cellulitis or abscess, irrespective of the presence of diabetes mellitus.[8, 9] Because nearly one‐fourth of patients hospitalized with cellulitis or abscess are diabetic, these findings have relevance for national antimicrobial stewardship efforts aimed at curbing antimicrobial resistance through reducing use of antibiotics with broad gram‐negative activity in hospitals.[16]
Disclosures: This work was supported by the National Institute of Allergy and Infectious Diseases, National Institute of Health (TCJ: K23 AI099082). D.M.P. reports potential conflicts of interests with Optimer, Cubist, and Forest Pharmaceuticals. The authors report no other conflicts of interest.
- , , , et al. Increased risk of common infections in patients with type 1 and type 2 diabetes mellitus. Clin Infect Dis. 2005;41(3):281–288.
- , , , et al. Antibiotic prescribing practices in a multicenter cohort of patients hospitalized for acute bacterial skin and skin structure infection. Infect Control Hosp Epidemiol. 2014;35(10):1241–1250.
- , , , . The role of beta‐hemolytic streptococci in causing diffuse, nonculturable cellulitis: a prospective investigation. Medicine. 2010;89(4):217–226.
- , , , et al. Factors associated with complications and mortality in adult patients hospitalized for infectious cellulitis. Eur J Clin Microbiol Infect Dis. 2003;22(3):151–157.
- , , , et al. Epidemiology and outcomes of complicated skin and soft tissue infections in hospitalized patients. J Clin Microbiol. 2012;50(2):238–245.
- , , , , , . Current management of patients hospitalized with complicated skin and soft tissue infections across Europe (2010–2011): assessment of clinical practice patterns and real‐life effectiveness of antibiotics from the REACH study. Clin Microbiol Infect. 2013;19(9):E377–E385.
- , , , et al. 2012 Infectious Diseases Society of America clinical practice guideline for the diagnosis and treatment of diabetic foot infections. Clin Infect Dis. 2012;54(12):e132–e173.
- , , , et al. Clinical practice guidelines by the Infectious Diseases Society Of America for the treatment of methicillin‐resistant Staphylococcus aureus infections in adults and children: executive summary. Clin Infect Dis. 2011;52(3):285–292.
- , , , et al. Practice guidelines for the diagnosis and management of skin and soft tissue infections: 2014 update by the Infectious Diseases Society Of America. Clin Infect Dis. 2014;59(2):e10–e52.
- , , , et al. Decreased antibiotic utilization after implementation of a guideline for inpatient cellulitis and cutaneous abscess. Arch Intern Med. 2011;171(12):1072–1079.
- , , , , , . Skin and soft‐tissue infections requiring hospitalization at an academic medical center: opportunities for antimicrobial stewardship. Clin Infect Dis. 2010;51(8):895–903.
- , , , , , . Skin and soft tissue infections in hospitalised patients with diabetes: culture isolates and risk factors associated with mortality, length of stay and cost. Diabetologia. 2010;53(5):914–923.
- , , , . Skin and soft tissue infections and associated complications among commercially insured patients aged 0–64 years with and without diabetes in the U.S. PLoS One. 2013;8(4):e60057.
- , , . A post hoc subgroup analysis of meropenem versus imipenem/cilastatin in a multicenter, double‐blind, randomized study of complicated skin and skin‐structure infections in patients with diabetes mellitus. Clin Ther. 2006;28(8):1164–1174.
- , , , . Treating diabetic foot infections with sequential intravenous to oral moxifloxacin compared with piperacillin‐tazobactam/amoxicillin‐clavulanate. J Antimicr Chemo. 2007;60(2):370–376.
- , , , et al. Vital signs: improving antibiotic use among hospitalized patients. MMWR Morb Mortal Wkly Rep. 2014;63(9):194–200.
Diabetes mellitus is one of the most common comorbid conditions among patients hospitalized for acute bacterial skin infections.[1, 2, 3, 4, 5, 6] Acute bacterial skin infections in diabetics represent a spectrum of conditions ranging from cellulitis or cutaneous abscess to more complicated infections such as infected ulcers or deep tissue infections. Although most skin infections in diabetics are caused by gram‐positive pathogens (Staphylococcus aureus and streptococci), the risk of gram‐negative pathogens is increased in certain complicated infections such as diabetic foot infections.[7] For such complicated infections, national guidelines therefore recommend broad‐spectrum empiric antibiotic therapy.[7]
The role of gram‐negative pathogens has not been clearly established in diabetics with cellulitis or cutaneous abscess not associated with an infected ulcer or diabetic foot infection. National guidelines for the treatment of cellulitis and abscess recommend antibiotic therapy targeted toward S aureus and streptococcal species irrespective of the presence of diabetes mellitus.[8, 9] However, in a recent multicenter study of patients hospitalized with acute bacterial skin infections in which cases involving infected ulcers or deep tissue infection were excluded, diabetes mellitus was an independent predictor of use of antibiotics with broad gram‐negative activity.[2] This suggests that either gram‐negative pathogens are more common or providers perceive gram‐negative pathogens to be more common among diabetics with otherwise uncomplicated cellulitis or abscess.
A better understanding of the relationship between the microbiology and antibiotic prescribing practices for diabetics with cellulitis or abscess is therefore necessary to promote the most appropriate spectrum of therapy for these patients. We evaluated a large cohort of patients hospitalized with acute bacterial skin infections in order to: (1) compare the microbiology of diabetics and nondiabetics with cellulitis or cutaneous abscess not associated with an ulcer or deep tissue infection; and (2) compare antibiotic prescribing practices among diabetics and nondiabetics. We hypothesized that diabetics would have a similar spectrum of microorganisms as nondiabetics but would be more frequently treated with antibiotics with broad gram‐negative activity.
METHODS
Study Design
This was a secondary analysis of 2 published retrospective studies of patients hospitalized for cellulitis or cutaneous abscess between January 1, 2007 and May 31, 2012.[2, 10] For the purposes of this study, the terms cellulitis and abscess will refer to infections not involving an infected ulcer, osteomyelitis, or other deep tissue infection.
Study Setting and Population
The first of the 2 cohorts analyzed for the present study included patients hospitalized with cellulitis, abscess, or wound infection at 7 academic or community hospitals in Colorado.[2] The second cohort included patients hospitalized with cellulitis or abscess at a single academic medical center (1 of the 7 hospitals above) in Denver, Colorado.[10] The methods of these studies have been reported in detail elsewhere.[2, 10, 11] Briefly, potential cases were identified using International Classification of Diseases, 9th Revision, Clinical Modification codes. The main inclusion and exclusion criteria of the 2 studies were similar. In both studies, cases were excluded that involved infected ulcers or suspected or confirmed deep tissue involvement (eg, osteomyelitis, myositis, fasciitis). Cases were also excluded that involved other infections where empiric antibiotic therapy with gram‐negative activity is standard including infected human or animal bites, periorbital or orbital infections, and perineal infections. The combined cohort in the present study therefore represented a group of patients hospitalized with relatively uncomplicated cellulitis or cutaneous abscess.
Definitions and Study Outcomes
Only 1 of the 2 studies from which the current cohort was derived distinguished between nonpurulent cellulitis, purulent cellulitis, and wound infection.[2] In the other study, cases were more broadly defined as either cellulitis or cutaneous abscess.[10] Infected ulcers and deep tissue infections were excluded from both studies. In combining the data into the current cohort, all nondrainable infections (purulent or nonpurulent cellulitis and wound infection) were categorized generally as cellulitis. All cases with documentation of an abscess in the medical record were categorized as cutaneous abscess. Presence of diabetes mellitus was based on provider documentation of the condition during the hospitalization. Microbiological cultures were obtained at the discretion of treating providers. Exposure to antibiotics with a broad spectrum of gram‐negative activity was defined as receipt of 2 or more calendar days of ‐lactam/‐lactamase inhibitor combinations, second‐ through fifth‐generation cephalosporins, fluoroquinolones, carbapenems, tigecycline, aminoglycosides, or colistin.[2]
The follow‐up periods differed slightly between the 2 studies used to derive the current cohort. In 1 study, all clinical encounters within 30 days of hospital discharge were reviewed to assess clinical outcomes.[10] In the other, clinical encounters within 45 days from the date of hospitalization were reviewed.[2] Clinical failure was defined as any of the following within the 30‐ or 45‐day follow‐up periods, respectively: (1) treatment failure, defined as a change in antibiotic therapy or unplanned drainage procedure due to inadequate clinical response more than 5 days[2] or 7 days[10] after hospital admission; (2) recurrence, defined as reinitiation of antibiotics for skin infection after completion of the initial treatment course; or (3) rehospitalization due to skin infection.[11]
Statistical Analysis
Because the clinical factors, microbiology, and treatment of cellulitis and cutaneous abscesses differ, analyses were performed for the total cohort and stratified by type of infection. Microorganisms cultured, antibiotic selection, and treatment duration were compared between diabetics and nondiabetics using the Wilcoxon rank sum test, 2, or Fisher exact test, as appropriate.
Because we hypothesized that the presence of diabetes mellitus in patients with cellulitis or abscess leads to use of broad gram‐negative therapy, we developed a multivariable logistic regression model to identify factors independently associated with exposure to antibiotics with broad gram‐negative activity. We also developed a linear regression model to explore the relationship between diabetes mellitus and duration of antibiotic therapy after adjusting for covariates. To develop these models, we first performed bivariate analyses and retained variables with a P value 0.25 in the regression models. Variables that did not meet the P value threshold but were considered to be clinically relevant covariates were also included in the model. We assessed for effect modification, multicollinearity, and goodness of fit when developing the models. We used SAS version 9.3 (SAS Institute, Cary, NC) for data analysis.
RESULTS
After excluding 102 pediatric cases and removing 5 duplicate cases, 770 total cases were included for analysis: 447 involved cellulitis and 323 involved cutaneous abscess (Figure 1). Overall, 167 (22%) patients had diabetes mellitus. Diabetics were significantly more likely than nondiabetics to have cellulitis as the presenting infection (67% of cases vs 56%, P=0.008) and to have lower extremity involvement (48% vs 33%, P<0.001) (Table 1). Diabetics were also older (median age 55 years vs 48 years, P<0.001), more likely to have cirrhosis or prior skin infection, and less likely to be injection‐drug users or human immunodeficiency virus (HIV) infected. Demographic and clinical characteristics among diabetics and nondiabetics stratified by the categorizations of cellulitis and cutaneous abscess are presented in the Supporting Information, Appendix Table 1, in the online version of this article.
| Diabetes Mellitus, N=167 | No Diabetes Mellitus, N=603 | |
|---|---|---|
| ||
| Type of infection | ||
| Cellulitis | 112 (67) | 335 (56)a |
| Cutaneous abscess | 55 (33) | 268 (44) |
| Age, y, median (IQR) | 55 (4763) | 48 (3658)a |
| Male | 102 (61) | 405 (67) |
| Injection drug use | 9 (5) | 117 (19)a |
| Alcohol abuse or dependence | 15 (9) | 86 (14) |
| Cirrhosis | 11 (7) | 17 (3)a |
| HIV infection | 0 | 29 (5)a |
| Dialysis dependence | 4 (2) | 5 (1) |
| Peripheral arterial disease | 4 (2) | 5 (1) |
| Saphenous vein harvest | 7 (4) | 11 (2) |
| Prior skin infection | 56 (34) | 125 (21)a |
| Prior MRSA infection or colonization | 20 (12) | 50 (8) |
| Anatomical location | ||
| Lower extremity | 80 (48) | 200 (33)a |
| Upper extremity | 6 (4) | 79 (13)a |
| Head and neck | 14 (8) | 38 (6) |
| Buttock or inguinal | 8 (5) | 35 (6) |
| Chest, abdomen, back, or axilla | 9 (5) | 25 (4) |
| Multiple distinct sites | 7 (4) | 34 (6) |
| Medical primary service | 139 (83) | 395 (66)a |
| Consultation requested | 99 (59) | 294 (49)a |
| Surgery | 58 (35) | 152 (25)a |
| Internal medicine | 18 (11) | 47 (8) |
| Infectious diseases | 41 (25) | 149 (25) |
| Failed initial outpatient antibiotic therapy | 52 (31) | 186 (31) |
| Fever (temperature 38.0C) | 20 (12) | 102 (17) |
| Leukocytosis (WBC >10,000 cells/mm3) | 78 (47) | 311 (52) |
The frequency of use of microbiological cultures was similar among diabetics and nondiabetics (Table 2). In cases of cellulitis, a microorganism was identified in 18% of diabetics and 12% of nondiabetics (P=0.09). In cases of cutaneous abscess, a microorganism was identified more commonly (69% and 74%, respectively, P=0.50). Among cases where a microorganism was identified, aerobic gram‐positive organisms were isolated in 90% of diabetics and 92% of nondiabetics (P=0.59). Aerobic gram‐negative organisms were isolated in 7% of diabetics and 12% of nondiabetics (P=0.28). Specific gram‐negative organisms isolated are shown in the Supporting Information, Appendix Table 2, in the online version of this article; no cases in diabetics involved Pseudomonas aeruginosa. The comparison of microbiological data among diabetics and nondiabetics was similar when stratified by cellulitis versus cutaneous abscess (Table 2).
| Cellulitis | Cutaneous Abscess | All Cases | |||||||
|---|---|---|---|---|---|---|---|---|---|
| Diabetes Mellitus, N=112 | No Diabetes Mellitus, N=335 | P | Diabetes Mellitus, N=55 | No Diabetes Mellitus, N=268 | P | Diabetes Mellitus, N=167 | No Diabetes Mellitus, N=603 | P | |
| |||||||||
| Any microbiological culture obtaineda | 82 (73) | 234 (70) | 46 (84) | 239 (89) | 128 (77) | 473 (78) | |||
| Wound drainage or swab | 19 (17) | 36 (11) | 1 (2) | 8 (3) | 20 (12) | 44 (7) | |||
| Abscess material | 1 (1) | 3 (1) | 39 (71) | 205 (76) | 40 (24) | 208 (34) | |||
| Tissueb | 2 (2) | 17 (5) | 1 (2) | 8 (3) | 3 (2) | 25 (4) | |||
| Blood | 73 (65) | 212 (63) | 26 (47) | 121 (45) | 99 (59) | 333 (55) | |||
| Any microorganism identifiedc | 20 (18) | 39 (12) | 0.09 | 38 (69) | 197 (74) | 0.50 | 58 (35) | 236 (39) | 0.30 |
| Aerobic gram‐positive | 15 (75) | 36 (92) | 0.11 | 37 (97) | 182 (92) | 0.48 | 52 (90) | 218 (92) | 0.59 |
| Staphylococcus aureus | 11 (55) | 26 (67) | 0.38 | 28 (74) | 132 (67) | 0.42 | 39 (67) | 158 (67) | 0.97 |
| Methicillin‐susceptible | 4 (20) | 15 (38) | 0.15 | 12 (32) | 42 (21) | 0.17 | 16 (28) | 57 (24) | 0.59 |
| Methicillin‐resistant | 5 (25) | 11 (28) | 1.00 | 14 (37) | 85 (43) | 0.47 | 19 (33) | 96 (41) | 0.27 |
| Susceptibility not performed | 2 (10) | 0 | 0.11 | 2 (5) | 5 (3) | 0.32 | 4 (7) | 5 (2) | 0.08 |
| Streptococcal species | 6 (30) | 15 (38) | 0.52 | 12 (32) | 69 (35) | 0.68 | 18 (31) | 84 (36) | 0.51 |
| ‐hemolytic streptococcus | 3 (15) | 13 (33) | 0.13 | 6 (16) | 32 (16) | 0.94 | 9 (16) | 45 (19) | 0.53 |
| Streptococcus anginosus/Streptococcus milleri group | 1 (5) | 0 | 0.34 | 2 (5) | 29 (15) | 0.11 | 3 (5) | 29 (12) | 0.12 |
| Other ‐hemolytic streptococcus | 2 (10) | 2 (5) | 0.60 | 4 (11) | 12 (6) | 0.30 | 6 (10) | 14 (6) | 0.25 |
| Other streptococcus | 0 | 0 | 1 (3) | 3 (2) | 0.51 | 1 (2) | 3 (1) | 0.59 | |
| Staphylococcus aureus or streptococci | 15 (75) | 35 (90) | 0.25 | 37 (97) | 182 (92) | 0.48 | 52 (90) | 217 (92) | 0.60 |
| Enterococcus species | 0 | 2 (5) | 0.54 | 0 | 4 (2) | 1.00 | 0 | 6 (3) | 0.60 |
| Aerobic gram‐negative | 2 (10) | 7 (18) | 0.70 | 2 (5) | 21 (11) | 0.39 | 4 (7) | 28 (12) | 0.28 |
| Anaerobic organism(s) | 2 (10) | 3 (8) | 1.00 | 8 (21) | 30 (15) | 0.37 | 10 (17) | 33 (14) | 0.53 |
| Mixed skin or oral flora | 1 (5) | 1 (3) | 1.00 | 0 | 1 (1) | 1.00 | 1 (2) | 2 (1) | 0.48 |
| Other | 1 (5) | 3 (8) | 1.00 | 2 (5) | 3 (2) | 0.19 | 3 (5) | 6 (3) | 0.39 |
| Polymicrobial | 3 (15) | 17 (45) | 0.03 | 11 (29) | 47 (24) | 0.51 | 14 (24) | 64 (27) | 0.65 |
| Positive blood cultured | 4 (5) | 8 (4) | 0.51 | 2 (8) | 3 (2) | 0.21 | 6 (6) | 11 (3) | 0.24 |
Antibiotic utilization is summarized in Table 3. Among patients who were started on antibiotic therapy in the emergency department or urgent care, the initial regimen included an agent with broad gram‐negative activity in 31% of both diabetics and nondiabetics (P=0.97). During the entire hospital stay (including the emergency department or urgent care), diabetics were significantly more likely to be treated with ‐lactam/‐lactamase inhibitor combinations (42% vs 33%, P=0.04). At the time of hospital discharge, diabetics were more likely to be prescribed fluoroquinolones (11% vs 5%, P=0.01) (Table 3) particularly for cases of cellulitis (13% vs 6%, P=0.008) (see Supporting Information, Appendix Table 3, in the online version of this article). Diabetics were somewhat more likely to be prescribed parenteral antibiotics (10% vs 6%, P=0.07) after discharge. When considering both inpatient and discharge therapy, more diabetics than nondiabetics were exposed to at least 2 calendar days of broad gram‐negative therapy (54% vs 44%, P=0.02) and more were prescribed an antipseudomonal agent (38% vs 25%, P=0.002). In the group of patients who received at least 1 dose of an antibiotic with broad gram‐negative activity, broad gram‐negative agents accounted for 33% of the total days of therapy prescribed for diabetics and 32% for nondiabetics. Overall prescribing patterns were similar when stratified by cellulitis versus cutaneous abscess (see Supporting Information, Appendix Table 3, in the online version of this article).
| Diabetes Mellitus, N=167 | No Diabetes Mellitus, N=603 | P | |
|---|---|---|---|
| |||
| Individual antibiotics prescribed during the inpatient stayab | |||
| Vancomycin | 142 (85) | 504 (84) | 0.65 |
| Clindamycin | 27 (16) | 131 (22) | 0.12 |
| Parenteral ‐lactam/‐lactamase inhibitor | 70 (42) | 200 (33) | 0.04 |
| Second‐generation or higher cephalosporin | 13 (8) | 51 (8) | 0.78 |
| Cefazolin | 17 (10) | 91 (15) | 0.11 |
| Carbapenem | 9 (5) | 34 (6) | 0.90 |
| Fluoroquinolone | 20 (12) | 53 (9) | 0.21 |
| Daptomycin | 8 (5) | 24 (4) | 0.64 |
| Linezolid | 2 (1) | 8 (1) | 1.00 |
| Other ‐lactam | 6 (4) | 30 (5) | 0.45 |
| Trimethoprim‐sulfamethoxazole | 12 (7) | 30 (5) | 0.27 |
| Doxycycline | 15 (9) | 44 (7) | 0.47 |
| Cephalexin | 7 (4) | 22 (4) | 0.74 |
| Amoxicillin‐clavulanate | 11 (7) | 24 (4) | 0.15 |
| Antibiotics prescribed at hospital dischargeb | 163 (98) | 580 (96) | 0.38 |
| Clindamycin | 20 (12) | 95 (16) | 0.23 |
| Trimethoprim‐sulfamethoxazole | 52 (31) | 215 (36) | 0.28 |
| Doxycycline | 32 (19) | 91 (15) | 0.20 |
| Cephalexin | 12 (7) | 46 (8) | 0.85 |
| Amoxicillin‐clavulanate | 24 (14) | 82 (14) | 0.80 |
| Fluoroquinolone | 18 (11) | 32 (5) | 0.01 |
| Linezolid | 8 (5) | 19 (3) | 0.31 |
| Other oral ‐lactam | 3 (2) | 28 (5) | 0.10 |
| Other oral antibiotic | 1 (1) | 2 (0.3) | 0.52 |
| Vancomycin | 8 (5) | 15 (2) | 0.13 |
| Daptomycin | 5 (3) | 10 (2) | 0.34 |
| Other parenteral antibiotic | 4 (2) | 11 (2) | 0.75 |
| Antibiotic with broad gram‐negative activity initiated in emergency department or urgent care | 46/149 (31) | 174/561 (31) | 0.97 |
| Exposed to any antibiotic with broad gram‐negative activityc | 101 (62) | 311 (53) | 0.048 |
| Exposed to any antibiotic with antipseudomonal activity | 62 (38) | 149 (25) | 0.002 |
| Exposed to at least 2 calendar days of antibiotics with broad gram‐negative activityc | 89 (54) | 259 (44) | 0.02 |
| Treatment durationd | |||
| Total duration of therapy, d, median (IQR) | 13 (1015) | 12 (1015) | 0.09 |
| Duration of inpatient therapy, d, median (IQR) | 4 (36) | 4 (35) | 0.03 |
| Duration of therapy after discharge, d, median (IQR) | 8 (710) | 8 (710) | 0.58 |
After adjusting for covariates in the logistic regression model, diabetes mellitus was an independent predictor of exposure to broad gram‐negative therapy (see Supporting Information, Appendix Table 4, in the online version of this article). In addition to diabetes mellitus, culture of an aerobic gram‐negative microorganism, infectious diseases service consultation, presence of fever, and nonmedical admitting services were significantly associated with exposure to broad gram‐negative therapy. Prior methicillin‐resistant S aureus infection or colonization and HIV infection were inversely associated. Compared with nondiabetics, the total duration of antibiotic therapy in diabetics was somewhat longer (median 13 days vs 12 days, P=0.09) (Table 3). After adjusting for covariates in the linear regression model, there was a significant association between diabetes mellitus and treatment duration. On average, diabetics were treated 1 day (95% confidence interval: 0.2‐1.7 days) longer than nondiabetics.
Compared with nondiabetics, diabetics were more likely to have an outpatient follow‐up visit (73% vs 61%, P=0.002) and to be rehospitalized for any reason after discharge (16% vs 9%, P=0.02) (Table 4). Diabetics were overall more likely to be classified as clinical failure (15% vs 9%, P=0.02); this difference was driven by the cellulitis subgroup (19% vs 10%, P=0.01).
| Cellulitis | Cutaneous Abscess | All Cases | |||||||
|---|---|---|---|---|---|---|---|---|---|
| Diabetes Mellitus, N=112 | No Diabetes Mellitus, N=335 | P | Diabetes Mellitus, N=55 | No Diabetes Mellitus, N=268 | P | Diabetes Mellitus, N=167 | No Diabetes Mellitus, N=603 | P | |
| |||||||||
| Survived to discharge | 111 (99) | 335 (100) | 0.25 | 55 (100) | 268 (100) | 166 (99) | 603 (100) | 0.22 | |
| Outpatient follow‐up documented | 82 (74) | 204 (61) | 0.01 | 40 (73) | 161 (60) | 0.08 | 122 (73) | 365 (61) | 0.002 |
| Rehospitalized | 22 (20) | 34 (10) | 0.008 | 4 (7) | 21 (8) | 1.00 | 26 (16) | 55 (9) | 0.02 |
| Clinical failure | 21 (19) | 34 (10) | 0.01 | 4 (7) | 20 (7) | 1.00 | 25 (15) | 54 (9) | 0.02 |
| Treatment failure | 7 (6) | 17 (5) | 0.62 | 2 (4) | 7 (3) | 0.65 | 9 (5) | 24 (4) | 0.42 |
| Recurrence | 10 (9) | 16 (5) | 0.10 | 1 (2) | 11 (4) | 0.70 | 11 (7) | 27 (4) | 0.26 |
| Rehospitalization due to skin infection | 14 (13) | 17 (5) | 0.01 | 3 (5) | 11 (4) | 0.71 | 17 (10) | 28 (5) | 0.01 |
| Length of stay, d, median (IQR) | 4 (36) | 4 (35) | 0.03 | 4 (36) | 4 (35) | 0.28 | 4 (36) | 4 (35) | 0.02 |
DISCUSSION
Diabetes mellitus is a common comorbidity in patients with acute bacterial skin infections. In this large cohort of patients hospitalized for cellulitis or cutaneous abscess, where those with infected ulcers or deep tissue infections were excluded, microbiological findings in cases associated with positive cultures were similar among diabetics and nondiabetics. Although aerobic gram‐negative microorganisms were not more likely to be identified in diabetics, diabetics were significantly more likely to be exposed to at least 2 calendar days of antibiotics with broad gram‐negative activity. After adjusting for covariates, diabetes mellitus was independently associated with exposure to broad gram‐negative therapy.
To our knowledge, this is the first study to compare the microbiology of cellulitis and cutaneous abscess among diabetics and nondiabetics. Lipsky and colleagues previously described the microbiology of a cohort of diabetic patients hospitalized with a broader range of skin infections including cellulitis, infected ulcers, and surgical site infections.[12] Similar to our findings, gram‐negative pathogens were uncommonly isolated in that study; however, in the absence of a comparator group, whether diabetics were at higher risk for gram‐negative involvement than nondiabetics was not known. Similar to the study by Lipsky and colleagues, most studies of skin infections in diabetics have included a relatively heterogeneous group of infections.[12, 13, 14, 15] The present study therefore contributes to the literature by providing a focused comparison of the microbiology of inpatient cellulitis and abscess in the absence of complicating factors such as an infected ulcer or deep tissue involvement. We found that among cases with a positive culture (13% of cases in the cellulitis group and 73% in the abscess group), the microbiology was similar among diabetics and nondiabetics. Although a microorganism was identified in only a minority of cases of cellulitis, our findings do not support the need for broad gram‐negative therapy in diabetics with cellulitis not associated with an ulcer or deep tissue infection. In diabetics with an abscess, antibiotics with broad gram‐negative activity do not appear to be indicated.
The present study also adds to the literature by providing a detailed comparison of antibiotic utilization patterns among diabetics and nondiabetics. We demonstrated that diabetics were more likely to have significant exposure to antibiotics with broad gram‐negative activity, particularly antipseudomonal agents (the broadest‐spectrum antibiotics). Because initiation of broad gram‐negative therapy in the emergency department or urgent care was not more common among diabetics, the increased use of these agents among diabetics appeared to be driven by inpatient providers. It is also notable that of patients who received any antibiotic with broad gram‐negative activity, these agents accounted for similar proportions of the total days of therapy in both diabetics and nondiabetics. In aggregate, our findings demonstrate that diabetics are more likely to be started on antibiotics with broad gram‐negative activity by inpatient providers, diabetics are not necessarily continued on longer durations of broad gram‐negative therapy once started, and the total amount of exposure to broad gram‐negative agents is substantial.
Overall, our findings suggest that inpatient providers perceive diabetics with cellulitis or abscess to be at increased risk for gram‐negative pathogens. This perhaps reflects an extrapolation of recommendations to use broad‐spectrum empiric therapy in diabetics with certain complicated skin infections.[7] However, for patients with cellulitis or cutaneous abscess, Infectious Diseases Society of America (IDSA) guidelines recommend antibiotic therapy targeted toward S aureus and streptococcal species; there is no suggestion to use a broader spectrum of therapy in diabetics.[8, 9] Our findings therefore highlight an important opportunity to improve antibiotic selection for all patients hospitalized with cellulitis and abscess, but particularly diabetics. It is also noteworthy that by linear regression, diabetes mellitus was independently associated with longer treatment durations. Although the average increase in treatment duration was small (1 day), this finding adds to the evidence that the presence of diabetes mellitus alters providers' treatment approach to cellulitis or abscess.
We found that despite more frequent treatment with broad gram‐negative therapy, diabetics were more likely than nondiabetics to be classified as clinical failures. It is important to point out that diabetics were also more likely than nondiabetics to have postdischarge outpatient follow‐up visits, raising the possibility of biased ascertainment of clinical failure events in this group. However, we also demonstrated that diabetics with cellulitis were more likely to be rehospitalized than nondiabetics. This is similar to a finding by Suaya and colleagues who showed that diabetics with skin infections were about twice as likely to be rehospitalized as nondiabetics.[13] One could hypothesize that the increased frequency of clinical failure events among diabetics was due to their older age, hyperglycemia, or vascular insufficiency; however, other factors may have contributed. For example, providers may have mistaken residual erythema for ongoing or recurrent cellulitis, or the diagnosis of cellulitis could have been incorrect to begin with. Additionally, there may have been uncertainty about the microbiology of cellulitis because the infecting pathogen was not usually identified. These factors may have led to alterations in treatment that would have resulted in a classification of clinical failure, and it is possible that providers had a lower threshold to alter treatment in diabetics. It is therefore not clear whether our findings represent a true difference in clinical outcomes between diabetics or nondiabetics. Regardless, in cases associated with a positive culture, our microbiological results do not support that the difference in clinical failure between diabetics and nondiabetics with cellulitis was related to a different spectrum of microorganisms.
In addition to the limitations outlined previously[2, 10] and above, the present study has at least 5 additional limitations. First, this was a secondary analysis of studies that were not designed to evaluate the effect of diabetes mellitus on the microbiology and treatment of skin infections. For example, hemoglobin A1C values were not collected; therefore, we could not examine whether the microbiology and antibiotic prescribing practices differed based on control of diabetes mellitus. Second, there were minor differences in inclusion and exclusion criteria between the 2 cohorts included in this study. Because the proportion of patients with diabetes mellitus was similar among both cohorts, and comparisons were not made between the cohorts, this should not have impacted our results. Third, the broad categorization of cellulitis used when combining the 2 cohorts raised the possibility of differences in infection characteristics between diabetics and nondiabetics (eg, presence of a wound) that could have confounded our findings regarding use of gram‐negative therapy. In the larger of the 2 cohorts from which the combined cohort was derived, only 17 (3%) of 533 patients had wound infections, whereas those with infected ulcers or suspected deep‐tissue infection were excluded from both cohorts. Furthermore, in the combined cohort, the increased frequency of broad gram‐negative therapy among diabetics was also observed in the cutaneous abscess group. It is therefore unlikely that the categorization of cellulitis had a significant impact on our results. Fourth, given the observational nature of the study, the microbiological data were subject to limitations. Importantly, because the infecting pathogen was identified in only 13% of cases of cellulitis, firm conclusions regarding the microbiology of cellulitis cannot be drawn. Finally, the small number of gram‐negative organisms isolated precluded comparisons of specific pathogens among diabetics and nondiabetics. In addition, because a number of gram‐negative organisms were isolated from wound cultures, it is not known whether they were clinically relevant or simply represented colonization.
In conclusion, in cases of cellulitis or abscess associated with a positive culture, gram‐negative microorganisms were not isolated more commonly among diabetics compared with nondiabetics. However, in general, diabetics were more likely to be treated with broad gram‐negative therapy suggesting that, particularly for cutaneous abscesses, this prescribing practice may not be warranted. These findings support current IDSA guidelines that recommend antibiotic therapy targeted toward gram‐positive pathogens for cellulitis or abscess, irrespective of the presence of diabetes mellitus.[8, 9] Because nearly one‐fourth of patients hospitalized with cellulitis or abscess are diabetic, these findings have relevance for national antimicrobial stewardship efforts aimed at curbing antimicrobial resistance through reducing use of antibiotics with broad gram‐negative activity in hospitals.[16]
Disclosures: This work was supported by the National Institute of Allergy and Infectious Diseases, National Institute of Health (TCJ: K23 AI099082). D.M.P. reports potential conflicts of interests with Optimer, Cubist, and Forest Pharmaceuticals. The authors report no other conflicts of interest.
- , , , et al. Increased risk of common infections in patients with type 1 and type 2 diabetes mellitus. Clin Infect Dis. 2005;41(3):281–288.
- , , , et al. Antibiotic prescribing practices in a multicenter cohort of patients hospitalized for acute bacterial skin and skin structure infection. Infect Control Hosp Epidemiol. 2014;35(10):1241–1250.
- , , , . The role of beta‐hemolytic streptococci in causing diffuse, nonculturable cellulitis: a prospective investigation. Medicine. 2010;89(4):217–226.
- , , , et al. Factors associated with complications and mortality in adult patients hospitalized for infectious cellulitis. Eur J Clin Microbiol Infect Dis. 2003;22(3):151–157.
- , , , et al. Epidemiology and outcomes of complicated skin and soft tissue infections in hospitalized patients. J Clin Microbiol. 2012;50(2):238–245.
- , , , , , . Current management of patients hospitalized with complicated skin and soft tissue infections across Europe (2010–2011): assessment of clinical practice patterns and real‐life effectiveness of antibiotics from the REACH study. Clin Microbiol Infect. 2013;19(9):E377–E385.
- , , , et al. 2012 Infectious Diseases Society of America clinical practice guideline for the diagnosis and treatment of diabetic foot infections. Clin Infect Dis. 2012;54(12):e132–e173.
- , , , et al. Clinical practice guidelines by the Infectious Diseases Society Of America for the treatment of methicillin‐resistant Staphylococcus aureus infections in adults and children: executive summary. Clin Infect Dis. 2011;52(3):285–292.
- , , , et al. Practice guidelines for the diagnosis and management of skin and soft tissue infections: 2014 update by the Infectious Diseases Society Of America. Clin Infect Dis. 2014;59(2):e10–e52.
- , , , et al. Decreased antibiotic utilization after implementation of a guideline for inpatient cellulitis and cutaneous abscess. Arch Intern Med. 2011;171(12):1072–1079.
- , , , , , . Skin and soft‐tissue infections requiring hospitalization at an academic medical center: opportunities for antimicrobial stewardship. Clin Infect Dis. 2010;51(8):895–903.
- , , , , , . Skin and soft tissue infections in hospitalised patients with diabetes: culture isolates and risk factors associated with mortality, length of stay and cost. Diabetologia. 2010;53(5):914–923.
- , , , . Skin and soft tissue infections and associated complications among commercially insured patients aged 0–64 years with and without diabetes in the U.S. PLoS One. 2013;8(4):e60057.
- , , . A post hoc subgroup analysis of meropenem versus imipenem/cilastatin in a multicenter, double‐blind, randomized study of complicated skin and skin‐structure infections in patients with diabetes mellitus. Clin Ther. 2006;28(8):1164–1174.
- , , , . Treating diabetic foot infections with sequential intravenous to oral moxifloxacin compared with piperacillin‐tazobactam/amoxicillin‐clavulanate. J Antimicr Chemo. 2007;60(2):370–376.
- , , , et al. Vital signs: improving antibiotic use among hospitalized patients. MMWR Morb Mortal Wkly Rep. 2014;63(9):194–200.
© 2014 Society of Hospital Medicine