User login
Commentary to "5 Points on Total Ankle Arthroplasty"
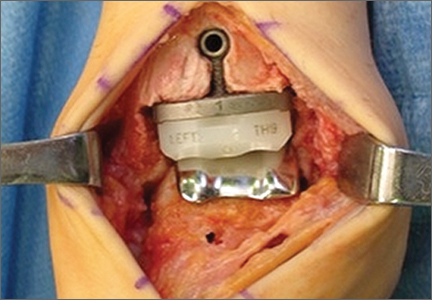
There are considerable differences in the design and implantation technique of the current total ankle implants available in the United States, eg, mobile vs. fixed bearing, intramedullary vs. extramedullary guidance, anterior vs. lateral surgical approach, flat vs. curved bone cuts, natural articular design with minimal bone resection (Zimmer Trabecular Metal Total Ankle; Zimmer, Warsaw, Indiana) vs. larger implant construct with more bone resection (Inbone II; Figure 2). There is no evidence that one implant design is superior, and, as the authors conclude, “Direct comparisons between TAA [total ankle arthroplasty] implant systems are needed to determine what clinical benefits are achieved with each design and what contributes to these differences.”
Hsu AR, Anderson RB, Cohen BE. Total Ankle Arthroplasty. Am J Orthop. 2014;43(10):451-457.
5 Points on Total Ankle Arthroplasty
Rivaroxaban rivals standard for VTE in cancer

Credit: CDC
MADRID—A pooled analysis of 2 studies suggests rivaroxaban prevents recurrent venous thromboembolism (VTE) in cancer patients as effectively as standard therapy, while conferring a lower risk of major bleeding.
The analysis included data from the EINSTEIN-DVT and EINSTEIN-PE trials, which were funded by the companies developing rivaroxaban (Xarelto), Bayer HealthCare Pharmaceuticals and Janssen Research & Development, LLC.
The results were published in Lancet Haematology and presented at the ESMO 2014 Congress (abstract LBA48).
The EINSTEIN-PE study included 3449 subjects with acute symptomatic pulmonary embolism (PE), with or without symptomatic deep vein thrombosis (DVT), who received anticoagulant therapy for 6 or 12 months.
The EINSTEIN-DVT study included 4833 patients who had acute symptomatic DVT, but no symptoms of PE, and received treatment for 3, 6, or 12 months.
In both studies, patients received either oral rivaroxaban (15 mg twice daily for 3 weeks, followed by 20 mg once daily) or standard therapy—enoxaparin (1.0 mg/kg twice daily) followed by a vitamin K antagonist (warfarin or acenocoumarol).
A total of 8281 patients were randomized in these studies—4150 to rivaroxaban and 4131 to standard therapy. Of the 655 patients (7.9%) with active cancer, 462 (5.6%) had cancer at baseline, and 193 (2.3%) were diagnosed during the study.
For this analysis, Martin H. Prins, MD, PhD, of Maastricht University Medical Center in The Netherlands, and his colleagues compared the 2 treatments in patients with active cancer.
VTE recurred in 4.5% (16/354) of the patients who were randomized to rivaroxaban and 6.6% (20/301) of patients randomized to standard therapy (hazard ratio [HR]=0.67).
The mortality rate was 16.4% (58/354) among patients randomized to rivaroxaban and 17.6% (53/301) among those randomized to standard therapy (HR=0.93).
Major bleeding occurred in 2.3% (8/353) of patients who received rivaroxaban and 5% (15/298) who received standard therapy (HR=0.42). And clinically relevant bleeding occurred in 13.6% (48/353) and 16.4% (49/298), respectively (HR=0.80).
Given these results, Dr Prins and his colleagues concluded that rivaroxaban can be considered an alternative to standard therapy in patients with cancer-associated VTE.
The team also said there is a need for a head-to-head comparison of rivaroxaban and long-term low-molecular-weight heparin in this patient population. ![]()
FDA approves cancer drugs faster, study shows

MADRID—The US Food and Drug Administration (FDA) tends to approve cancer drugs faster than Health Canada and the European Medicines Agency (EMA),
according to a study presented at the ESMO 2014 Congress.
On average, the FDA approved antineoplastic agents about 6 to 8 months faster than the EMA and Health Canada, researchers found.
One of the drugs studied had been FDA-approved for more than 4.5 years before the EMA and Health Canada authorized its use.
The researchers said these results suggest a need for a coordinated international approach to reduce the disparity in approval times.
“There needs to be a dialogue amongst industry, regulatory agencies, patient bodies, [the] research community, and oncology professionals on how best we can reduce the time to approval while ensuring safety for approved drugs,” said study investigator Sunil Verma, MD, of Sunnybrook Odette Cancer Center in Toronto, Canada.
A previous study, published in NEJM in 2012, showed that, between 2001 and 2010, the FDA tended to approve all types of drugs faster than the EMA and Health Canada.
Dr Verma and Nardin Samuel, an MD/PhD student at the University of Toronto, focused their study on cancer drugs and presented their findings at ESMO as abstract 1036O_PR.
The pair analyzed approval data for 41 antineoplastic agents and found the average time to FDA approval for these drugs was 6 months shorter than for the EMA and 7.6 months shorter than for Health Canada.
Azacitidine, which is approved to treat hematologic malignancies, had the greatest delay between FDA and Health Canada approval, at 66.1 months. The EMA approved azacitidine 10.3 months earlier than Health Canada but 55.8 months after the FDA.
The fastest approval time among the drugs studied was for cabazitaxel, which was approved for metastatic prostate cancer by the FDA just 17 days after the drug’s manufacturer filed for approval. In Canada and the European Union, the times to approval for cabazitaxel were 11.63 months and 11.03 months, respectively.
“It is not clear why there were these differences, but they are of some concern . . . ,” said David Cameron, MD, of the Edinburgh Cancer Research Centre in the UK, who was not involved in this research.
“[T]hey suggest that, in the absence of data to the contrary, there may be bureaucratic rather than medical/scientific reasons for differential geographical approval timelines, which, of course, will lead to differential geographical benefits from new agents.”
Dr Cameron added that more work is needed to understand the reasons for these differences, as well as assess any potential impact on patients. ![]()
Telemetry Order Duration Reductions
The Society of Hospital Medicine's Adult Choosing Wisely measures include not ordering continuous telemetry monitoring outside of the ICU [intensive care unit] without using a protocol that governs continuation.[1] Current guidelines for cardiac monitoring use recommend minimum durations for all adult class I and most class II indications.[2] However, telemetry ordering often fails to include timing or criteria for discontinuation. We determined the impact of a reduction in telemetry order duration within our hospital, hypothesizing this reduction would lead to earlier reassessment of telemetry need and therefore decrease overall utilization.
METHODS
Setting
Durham Veterans Affairs Medical Center (DVAMC) is a 151‐bed tertiary care hospital within Veterans Affairs (VA) Integrated Services Network Region 6 (VISN 6) serving as the primary VA hospital for >54,000 patients and a referral hospital for VISN 6. Twenty‐five telemetry units are available for use on 2 wards with 48 potential telemetry beds. All nonintensive care wards contain general medical and surgical patients, without a primary inpatient cardiology service. Most orders are written by housestaff supervised by attending physicians.
Intervention
Prior to our intervention, the maximum allowable duration of telemetry orders was 72 hours. The duration was enforced by nursing staff automatically discontinuing telemetry not renewed within 72 hours. For our intervention, we reduced the duration of telemetry within our electronic ordering system in November 2013 so that orders had to be renewed within 48 hours or they were discontinued. No education regarding appropriate telemetry use was provided. This intervention was created as a quality‐improvement (QI) project affecting all telemetry use within DVAMC and was exempt from institutional review board review.
Outcomes
Outcomes included the mean number of telemetry orders per week, mean duration of telemetry orders, mean duration of telemetry per episode, and the ratio of time on telemetry relative to the total length of stay. As a balancing measure, we examined rates of rapid response and code blue events. All measures were compared for 12 weeks before and 16 weeks after the intervention. Telemetry orders and durations were obtained using the Corporate Data Warehouse.
Analysis
All outcome measurements were continuous variables and compared using the Student t test in Stata version 9.2 (StataCorp, College Station, TX).
RESULTS
Following the intervention, overall order duration decreased by 33% from 66.68.3 hours to 44.52.3 hours per order (P0.01), mirroring the reduction in the maximum telemetry order duration from 72 to 48 hours (Table 1). However, an increase in telemetry order frequency after the intervention resulted in no significant change in telemetry duration per episode or the proportion of the hospitalization on telemetry (59.3 vs 56.3 hours per patient, P=0.43; and 66.4% vs 66.2% of hospitalization, P=0.58). Rapid response and code blue events did not differ significantly relative to the intervention (2.8 events per week before and 3.1 events per week after, P=0.63).
| Before Intervention | After Intervention | P Value | |
|---|---|---|---|
| |||
| No. of hospitalizations with telemetry ordered | 557 | 684 | NA |
| No. of telemetry orders | 952 | 1515 | NA |
| Average no. of orders per week (SD) | 79.3 (9.2) | 94.7 (25.9) | 0.06 |
| Hours of telemetry per order (SD) | 66.6 (8.3) | 44.5 (2.3) | 0.01 |
| Duration of telemetry per patient, h | 59.3 | 56.3 | 0.43 |
| % of hospitalizations receiving telemetry per patient | 66.4% | 66.2% | 0.90 |
| RRT/code blue events per week | 2.8 | 3.1 | 0.63 |
DISCUSSION
Overall, telemetry utilization was unchanged in spite of an intervention successfully reducing telemetry order duration. Providers responded to this decreased order duration by increasing renewal orders, leaving the amount of time patients spent on telemetry unchanged.
Little primary evidence underlies the American Heart Association recommendations for duration of telemetry in general ward patients.[2] The existing literature documents the timing in which arrhythmias occur after cardiac surgery or myocardial infarction, and therefore is limited in guiding patient care outside intensive care unit settings.[3, 4] As such, hospitalists and inpatient providers have little data directing additional telemetry decisions for these patients, and none for patients requiring telemetry for other indications.
As interventions focusing solely on telemetry duration may not lead to changes in usage patterns, reducing telemetry utilization may require active stewardship. For example, explicit justification may be needed for renewal of telemetry orders. Similarly, education on appropriate telemetry indications in tandem with electronic ordering changes may be more likely to change behavior. Alternatively, incorporating data identifying chest pain patients at very low risk of developing arrhythmias or cardiac complications, based on published risk scores at the time of ordering, may lead to better decision making in initiating telemetry.[5, 6]
This QI project had several limitations. First, the intervention occurred in a facility with a previous telemetry order duration limit. In hospitals without a current duration limitation, some reduction in overall telemetry utilization may be possible. Second, this project was a nonrandom before/after study and potentially subject to bias due to confounding. However, our limited number of telemetry resources, the relatively low number of inpatient teams at our facility, and the inability to target geographic locations for team admissions would have made a cluster‐randomized trial impractical. Third, rationales for telemetry ordering were unknown, as well as drivers for increased orders after the intervention. Better understanding these factors could lead to targeted interventions in some settings.
CONCLUSION
In conclusion, a QI initiative reducing telemetry order duration did not reduce overall telemetry utilization but increased the number of telemetry orders written. Interventions incorporating appropriate telemetry indications or event risks may be required to change ordering behaviors.
Disclosure: Nothing to report.
- Society of Hospital Medicine. Society of Hospital Medicine–adult hospital medicine: five things physicians and patients should question. Available at: http://www.choosingwisely.org/doctor‐patient‐lists/society‐of‐hospital‐medicine‐adult‐hospital‐medicine. Accessed June 4, 2014.
- , , , et al. Practice standards for electrocardiographic monitoring in hospital settings: an American Heart Association scientific statement from the Councils on Cardiovascular Nursing, Clinical Cardiology, and Cardiovascular Disease in the Young: endorsed by the International Society of Computerized Electrocardiology and the American Association of Critical‐Care Nurses. Circulation. 2004;110(17):2721–2746.
- , , , . Hazards of postoperative atrial arrhythmias. Ann Thorac Surg. 1993;56(3):539–549.
- , , , et al. Time‐based risk assessment after myocardial infarction. Implications for timing of discharge and applications to medical decision‐making. Eur Heart J. 2003;24(2):182–189.
- , , , et al. Emergency department admissions to inpatient cardiac telemetry beds: a prospective cohort study of risk stratification and outcomes. Am J Med. 2001;110(1):7–11.
- , , , . Lack of utility of telemetry monitoring for identification of cardiac death and life‐threatening ventricular dysrhythmias in low‐risk patients with chest pain. Ann Emerg Med. 2004;43(1):71–76.
The Society of Hospital Medicine's Adult Choosing Wisely measures include not ordering continuous telemetry monitoring outside of the ICU [intensive care unit] without using a protocol that governs continuation.[1] Current guidelines for cardiac monitoring use recommend minimum durations for all adult class I and most class II indications.[2] However, telemetry ordering often fails to include timing or criteria for discontinuation. We determined the impact of a reduction in telemetry order duration within our hospital, hypothesizing this reduction would lead to earlier reassessment of telemetry need and therefore decrease overall utilization.
METHODS
Setting
Durham Veterans Affairs Medical Center (DVAMC) is a 151‐bed tertiary care hospital within Veterans Affairs (VA) Integrated Services Network Region 6 (VISN 6) serving as the primary VA hospital for >54,000 patients and a referral hospital for VISN 6. Twenty‐five telemetry units are available for use on 2 wards with 48 potential telemetry beds. All nonintensive care wards contain general medical and surgical patients, without a primary inpatient cardiology service. Most orders are written by housestaff supervised by attending physicians.
Intervention
Prior to our intervention, the maximum allowable duration of telemetry orders was 72 hours. The duration was enforced by nursing staff automatically discontinuing telemetry not renewed within 72 hours. For our intervention, we reduced the duration of telemetry within our electronic ordering system in November 2013 so that orders had to be renewed within 48 hours or they were discontinued. No education regarding appropriate telemetry use was provided. This intervention was created as a quality‐improvement (QI) project affecting all telemetry use within DVAMC and was exempt from institutional review board review.
Outcomes
Outcomes included the mean number of telemetry orders per week, mean duration of telemetry orders, mean duration of telemetry per episode, and the ratio of time on telemetry relative to the total length of stay. As a balancing measure, we examined rates of rapid response and code blue events. All measures were compared for 12 weeks before and 16 weeks after the intervention. Telemetry orders and durations were obtained using the Corporate Data Warehouse.
Analysis
All outcome measurements were continuous variables and compared using the Student t test in Stata version 9.2 (StataCorp, College Station, TX).
RESULTS
Following the intervention, overall order duration decreased by 33% from 66.68.3 hours to 44.52.3 hours per order (P0.01), mirroring the reduction in the maximum telemetry order duration from 72 to 48 hours (Table 1). However, an increase in telemetry order frequency after the intervention resulted in no significant change in telemetry duration per episode or the proportion of the hospitalization on telemetry (59.3 vs 56.3 hours per patient, P=0.43; and 66.4% vs 66.2% of hospitalization, P=0.58). Rapid response and code blue events did not differ significantly relative to the intervention (2.8 events per week before and 3.1 events per week after, P=0.63).
| Before Intervention | After Intervention | P Value | |
|---|---|---|---|
| |||
| No. of hospitalizations with telemetry ordered | 557 | 684 | NA |
| No. of telemetry orders | 952 | 1515 | NA |
| Average no. of orders per week (SD) | 79.3 (9.2) | 94.7 (25.9) | 0.06 |
| Hours of telemetry per order (SD) | 66.6 (8.3) | 44.5 (2.3) | 0.01 |
| Duration of telemetry per patient, h | 59.3 | 56.3 | 0.43 |
| % of hospitalizations receiving telemetry per patient | 66.4% | 66.2% | 0.90 |
| RRT/code blue events per week | 2.8 | 3.1 | 0.63 |
DISCUSSION
Overall, telemetry utilization was unchanged in spite of an intervention successfully reducing telemetry order duration. Providers responded to this decreased order duration by increasing renewal orders, leaving the amount of time patients spent on telemetry unchanged.
Little primary evidence underlies the American Heart Association recommendations for duration of telemetry in general ward patients.[2] The existing literature documents the timing in which arrhythmias occur after cardiac surgery or myocardial infarction, and therefore is limited in guiding patient care outside intensive care unit settings.[3, 4] As such, hospitalists and inpatient providers have little data directing additional telemetry decisions for these patients, and none for patients requiring telemetry for other indications.
As interventions focusing solely on telemetry duration may not lead to changes in usage patterns, reducing telemetry utilization may require active stewardship. For example, explicit justification may be needed for renewal of telemetry orders. Similarly, education on appropriate telemetry indications in tandem with electronic ordering changes may be more likely to change behavior. Alternatively, incorporating data identifying chest pain patients at very low risk of developing arrhythmias or cardiac complications, based on published risk scores at the time of ordering, may lead to better decision making in initiating telemetry.[5, 6]
This QI project had several limitations. First, the intervention occurred in a facility with a previous telemetry order duration limit. In hospitals without a current duration limitation, some reduction in overall telemetry utilization may be possible. Second, this project was a nonrandom before/after study and potentially subject to bias due to confounding. However, our limited number of telemetry resources, the relatively low number of inpatient teams at our facility, and the inability to target geographic locations for team admissions would have made a cluster‐randomized trial impractical. Third, rationales for telemetry ordering were unknown, as well as drivers for increased orders after the intervention. Better understanding these factors could lead to targeted interventions in some settings.
CONCLUSION
In conclusion, a QI initiative reducing telemetry order duration did not reduce overall telemetry utilization but increased the number of telemetry orders written. Interventions incorporating appropriate telemetry indications or event risks may be required to change ordering behaviors.
Disclosure: Nothing to report.
- Society of Hospital Medicine. Society of Hospital Medicine–adult hospital medicine: five things physicians and patients should question. Available at: http://www.choosingwisely.org/doctor‐patient‐lists/society‐of‐hospital‐medicine‐adult‐hospital‐medicine. Accessed June 4, 2014.
- , , , et al. Practice standards for electrocardiographic monitoring in hospital settings: an American Heart Association scientific statement from the Councils on Cardiovascular Nursing, Clinical Cardiology, and Cardiovascular Disease in the Young: endorsed by the International Society of Computerized Electrocardiology and the American Association of Critical‐Care Nurses. Circulation. 2004;110(17):2721–2746.
- , , , . Hazards of postoperative atrial arrhythmias. Ann Thorac Surg. 1993;56(3):539–549.
- , , , et al. Time‐based risk assessment after myocardial infarction. Implications for timing of discharge and applications to medical decision‐making. Eur Heart J. 2003;24(2):182–189.
- , , , et al. Emergency department admissions to inpatient cardiac telemetry beds: a prospective cohort study of risk stratification and outcomes. Am J Med. 2001;110(1):7–11.
- , , , . Lack of utility of telemetry monitoring for identification of cardiac death and life‐threatening ventricular dysrhythmias in low‐risk patients with chest pain. Ann Emerg Med. 2004;43(1):71–76.
Compound can inhibit metastasis in multiple myeloma

Credit: Daniel E. Sabath
A novel compound can prevent metastasis in mouse models of multiple myeloma (MM), according to research published in Cell Reports.
Investigators discovered that this compound, olaptesed pegol, can inhibit stromal cell-derived factor-1 (SDF-1), which attracts certain cells to new locations within the bone marrow.
By blocking the activity of SDF-1, olaptesed pegol renders the bone marrow uninviting to MM cells and prevents metastasis.
“Metastasis remains one of the most formidable complications we face as cancer researchers and physicians,” said study author Irene Ghobrial, MD, of the Dana-Farber Cancer Institute in Boston.
“Improvements in the treatment of metastatic cancers have, for the most part, not been nearly as dramatic as in primary disease.”
Dr Ghobrial and her colleagues studied MM because it is metastatic by nature. Myeloma cells originate in the bone marrow, depart for the bloodstream, and eventually return to the bones, where they form numerous colonies.
The team found that mice with advanced stages of MM had higher levels of SDF-1 at sites in the bones where metastasis had occurred.
“We reasoned that by neutralizing SDF-1, we could change the bone marrow environment to make it less receptive for multiple myeloma cells, reduce myeloma cells’ affinity for the marrow, and thereby inhibit the progression of the disease,” said Aldo Roccaro, MD, PhD, also of Dana-Farber.
Working with the German biotechnology company NOXXON Pharma, the investigators tested olaptesed pegol (a PEGylated mirror-image L-oligonucleotide), which binds to SDF-1.
The team found that olaptesed pegol modulates bone marrow niches and prevents MM cells from homing and engrafting to bone.
This slowed disease progression and prolonged survival in the animals, both compared to control mice and mice treated with AMD3100.
The investigators said it isn’t completely clear what becomes of the blood-borne MM cells that are prevented from metastasizing.
“We know that myeloma cells can’t survive for long if they’re circulating in the blood and can’t adhere to other tissue,” Dr Ghobrial said. “We saw no evidence that they had metastasized and begun to grow in other tissue either.”
“Our findings clearly document a therapeutic effect of olaptesed pegol in a mouse model of advanced myeloma. It is now being tested in a clinical trial of multiple myeloma patients, with more trials to come.” ![]()
Preventing cancer-related infection

Credit: CDC/Kimberly Smith
and Christine Ford
NEW YORK—Hand washing is still the single most effective method to prevent the transmission of infection, but additional measures can reduce the risk of cancer-related infections, according to a speaker at the NCCN 9th Annual Congress: Hematologic Malignancies.
In her presentation, Laura Zitella, RN, of the Stanford Cancer Institute in California, discussed current recommendations for pharmacologic and non-pharmacologic infection prophylaxis.
She noted that NCCN Guidelines on the Prevention and Treatment of Cancer-Related Infections state that the highest risk of infection is in patients undergoing allogeneic hematopoietic stem cell transplant (HSCT), acute leukemia patients undergoing induction or consolidation therapy, patients receiving alemtuzumab therapy, patients with graft-vs-host disease (GVHD) treated with high-dose steroids, and patients with neutropenia anticipated to last greater than 10 days.
Antibiotic prophylaxis
Prior to 2005, Zitella said, no survival benefit was observed for antibiotic prophylaxis. All of this changed with the results of a meta-analysis. The analysis included 95 randomized, controlled trials and 9283 patients, the majority having acute leukemia or undergoing HSCT.
For the first time, antibiotic prophylaxis was shown to confer a survival benefit. In neutropenic patients, prophylaxis reduced overall mortality by 33% and infection-related mortality by 42%, compared with placebo or no treatment.
Prophylaxis is not recommended for low-risk neutropenic patients, Zitella said, because it is not proven to decrease morality.
And the drugs of choice are levofloxacin (500-750 mg PO daily) or ciprofloxacin (500-750 mg PO twice daily).
Colony-stimulating factors
Consensus guidelines for the use of colony-stimulating factors (CSFs) are a compilation of ASCO, EORTC, ESMO, and NCCN guidelines.
CSFs may be used prophylactically to prevent chemotherapy-induced neutropenia, febrile neutropenia, and infection. They reduce the duration of hospitalization, the duration of parenteral antibiotics, and have shown a survival benefit.
CSFs are recommended if the risk of febrile neutropenia is 20% or greater. CSFs are not routinely recommended for patients undergoing radiation treatment, acute myeloid leukemia induction, or patients with Hodgkin lymphoma.
Antifungal prophylaxis
Zitella noted that fluconazole is the best-studied antifungal prophylaxis and is recommended as the primary prophylaxis for HSCT patients.
In double-blind, placebo-controlled trials, fluconazole reduced mucosal candidiasis and invasive Candida infections in patients undergoing HSCT. And it improved survival at day 110 after transplant.
Posaconazole prophylaxis has proven effective in patients with acute myeloid leukemia or myelodysplastic syndromes undergoing intensive chemotherapy. The drug reduced invasive fungal infections, including aspergillosis, and improved survival.
For patients with GVHD on immunosuppressive therapy, posaconazole and fluconazole prophylaxis were equivalent in preventing invasive fungal infections. However, posaconazole reduced the incidence of invasive aspergillosis and fungal-related mortality.
The NCCN guidelines, Zitella said, spell out which antifungal agents should be used for each disease or therapeutic intervention.
Antiviral prophylaxis
HSV and VZV
Patients requiring antiviral prophylaxis for herpes simplex virus (HSV) and varicella zoster virus (VZV) should be seropositive and have acute leukemia, GVHD treated with steroids, prior HSV reactivation under treatment, or have undergone HSCT.
Zitella pointed out that patients treated with proteasome inhibitors, such as bortezomib, alemtuzumab, or purine analaogs, such as fludarabine, are more at risk and should also receive antiviral prophylaxis.
Recommended drugs include valacyclovir, acyclovir, or famciclovir.
CMV
Cytomegalovirus-positive (CMV+) patients at high risk include those who have received an allogeneic HSCT or treatment with alemtuzumab.
Zitella explained that for these patients, prophylaxis is uncommon, and a pre-emptive strategy should be used, including testing 3 to 6 months after transplant or in the setting of GVHD and 2 months after alemtuzumab therapy.
CMV viremia should be treated with valganciclovir, ganciclovir, foscarnet, or cidofovir.
HBV
Zitella noted that 30% of the world population has been infected with hepatitis B virus (HBV), and reactivation during cancer treatment can lead to fulminant hepatitis and death.
NCCN recommends that patients undergoing immunosuppressive therapy, allogeneic HSCT candidates, patients receiving anti-CD20 monoclonal antibodies, those treated with alemtuzumab, and patients receiving systemic therapy who have an obvious risk factor for HBV infection should be tested.
Entecavir, tenofovir, adefovir, telbivudine, or lamivudine may be used to prevent HBV reactivation.
Pneumocystis pneumonia prophylaxis
Patients undergoing allogeneic HSCT, patients with acute lymphoblastic leukemia, those treated with alemtuzumab, and those with a CD4 count below 200 cells/mcL should receive pneumocystis pneumonia prophylaxis.
Trimethorpim/sulfamethoxazole is the drug of choice. Atovaquone, dapsone, and inhaled or IV pentamidine are alternatives.
Vaccines
Zitella pointed out that recommended vaccines include influenza, pneumococcal, and tetanus, diphtheria, and acellular pertussis.
She cautioned that live attenuated vaccines should not be given to cancer patients. Other vaccines to avoid include smallpox; measles, mumps, and rubella; varicella zoster; rotavirus; yellow fever; oral typhoid; BCG; and oral polio vaccine.
Neutropenic precautions
Low microbial diets are a hot topic among patients undergoing cancer treatment, Zitella said. Fresh fruits and vegetables used to be restricted, but no studies show that dietary restrictions decrease the risk of infection.
Zitella stressed, however, that standard food safety recommendations of the USDA/FDA should be followed.
She also noted that HEPA filtration is protective against molds in high-risk patients, antiseptic bathing has contradictory evidence, the benefit of laminar airflow is unclear, and protective isolation has not been proven to reduce the risk of infection. ![]()
Pneumonia Guideline Therapy Outcomes
Community‐acquired pneumonia (CAP) is a common and serious infection in children. With more than 150,000 children requiring hospitalization annually, CAP is the fifth most prevalent and the second most costly diagnosis of all pediatric hospitalizations in the United States.[1, 2, 3]
In August 2011, the Pediatric Infectious Diseases Society (PIDS) and the Infectious Diseases Society of America (IDSA) published an evidence‐based guideline for the management of CAP in children. This guideline recommended that fully immunized children without underlying complications who require hospitalization receive an aminopenicillin as first‐line antibiotic therapy.[4] Additionally, the guideline recommends empirically adding a macrolide to an aminopenicillin when atypical pneumonia is a diagnostic consideration.
This recommendation was a substantial departure from practice for hospitals nationwide, as a multicenter study of children's hospitals (20052010) demonstrated that <10% of patients diagnosed with CAP received aminopenicillins as empiric therapy.[5] Since publication of the PIDS/IDSA guidelines, the use of aminopenicillins has increased significantly across institutions, but the majority of hospitalized patients still receive broad‐spectrum cephalosporin therapy for CAP.[6]
At baseline, 30% of patients hospitalized with CAP received guideline‐recommended antibiotic therapy at our institution. Through the use of quality‐improvement methods, the proportion of patients receiving guideline‐recommended therapy increased to 100%.[7] The objective of this study was to ensure that there were not unintended negative consequences to guideline implementation. Specifically, we sought to identify changes in length of stay (LOS), hospital costs, and treatment failures associated with use of guideline‐recommended antibiotic therapy for children hospitalized with uncomplicated CAP.
METHODS
Study Design and Study Population
This retrospective cohort study included children age 3 months to 18 years, hospitalized with CAP, between May 2, 2011 and July 30, 2012, at Cincinnati Children's Hospital Medical Center (CCHMC), a 512‐bed free‐standing children's hospital. The CCHMC Institutional Review Board approved this study with a waiver of informed consent.
Patients were eligible for inclusion if they were admitted to the hospital for inpatient or observation level care with a primary or secondary International Classification of Disease, 9th Revision discharge diagnosis code of pneumonia (480.02, 480.89, 481, 482.0, 482.30‐2, 482.41‐2, 482.83, 482.8990, 483.8, 484.3, 485, 486, 487.0) or effusion/empyema (510.0, 510.9, 511.01, 511.89, 513).[8] Patients with complex chronic conditions[9] were excluded. Medical records of eligible patients (n=260) were reviewed by 2 members of the study team to ensure that patients fell into the purview of the guideline. Patients who did not receive antibiotics (n=11) or for whom there was documented concern for aspiration (n=1) were excluded. Additionally, patients with immunodeficiency (n=1) or who had not received age‐appropriate vaccinations (n=2), and patients who required intensive care unit admission on presentation (n=17) or who had a complicated pneumonia, defined by presence of moderate or large pleural effusion at time of admission (n=8), were also excluded.[7] Finally, for patients with multiple pneumonia admissions, only the index visit was included; subsequent visits occurring within 30 days of discharge were considered readmissions.
Treatment Measure
The primary exposure of interest was empiric antibiotic therapy upon hospital admission. Antibiotic therapy was classified as guideline recommended or nonguideline recommended. Guideline‐recommended therapy was defined as follows:
- For children without drug allergies: ampicillin (200 mg/kg/day intravenously) or amoxicillin (90 mg/kg/day orally);
- For children with penicillin allergy: ceftriaxone (50100 mg/kg/day intravenously or intramuscularly) or cefdinir (14 mg/kg/day orally);
- For children with penicillin and cephalosporin allergy: clindamycin (40 mg/kg/day orally or intravenously); and
- Or azithromycin (10 mg/kg/day orally or intravenously on day 1) in combination with antibiotic category 1 or 2 or 3 above.
Outcome Measures
The primary outcomes examined were hospital LOS, total cost of hospitalization, and inpatient pharmacy costs. LOS was measured in hours and defined as the difference in time between departure from and arrival to the inpatient unit. Total cost of index hospitalization included both direct and indirect costs, obtained from the Centers for Medicare & Medicaid Services' Relative Value Units data for Current Procedural Terminology codes.[10]
Secondary outcomes included broadening of antibiotic therapy during the hospital course, pneumonia‐related emergency department (ED) revisits within 30 days, and pneumonia‐related inpatient readmissions within 30 days. Broadening of antibiotic therapy was defined as addition of a second antibiotic (eg, adding azithromycin on day 3 of hospitalization) or change in empiric antibiotic to a class with broader antimicrobial activity (eg, ampicillin to ceftriaxone) at any time during hospitalization. As our study population included only patients with uncomplicated pneumonia at the time of admission, this outcome was used to capture possible treatment failure. ED revisits and inpatient readmissions were reviewed by 3 investigators to identify pneumonia‐related visits. To encompass all possible treatment failures, all respiratory‐related complaints (eg, wheezing, respiratory distress) were considered as pneumonia‐related. Disagreements were resolved by group discussion.
Covariates
Severity of illness on presentation was evaluated using the Emergency Severity Index version 4,[11] abnormal vital signs on presentation (as defined by Pediatric Advanced Life Support age‐specific criteria[12]), and need for oxygen in the first 24 hours of hospitalization. Supplemental oxygen is administered for saturations <91% per protocol at our institution. The patient's highest Pediatric Early Warning Scale score[13] during hospitalization was used as a proxy for disease severity. Exam findings on presentation (eg, increased respiratory effort, rales, wheezing) were determined through chart review. Laboratory tests and radiologic imaging variables included complete blood cell count, blood culture, chest radiograph, chest ultrasound, and chest computed tomography. Abnormal white blood cell count was defined as <5000 or >15,000 cells/mL, the defined reference range for the CCHMC clinical laboratory.
Data Analysis
Continuous variables were described using median and interquartile range (IQR) and compared across groups using Wilcoxon rank sum test due to non‐normal distributions. Categorical variables were described by counts and frequencies and compared using the 2 test.
Multivariable linear regression analysis was performed to assess the independent effect of receipt of empiric guideline‐recommended antibiotic therapy on outcomes of LOS and costs while adjusting for covariates. As LOS and costs were non‐normally distributed, we logarithmically transformed these values to use as the dependent variables in our models. The resulting coefficients were back‐transformed to reflect the percent change in LOS and costs incurred between subjects who received empiric guideline therapy compared with those who did not.[14] Covariates were chosen a priori due to their clinical and biological relevance to the outcomes of LOS (eg, wheezing on presentation and need for supplemental oxygen), total cost of hospitalization (eg, LOS and need for repeat imaging), and inpatient pharmacy costs (eg, LOS and wheezing on presentation) (Table 1).
| Characteristic | Overall Cohort, n=220 | Guideline Therapy, n=166 | Nonguideline Therapy, n=54 | P Value |
|---|---|---|---|---|
| ||||
| Age, y, median (IQR) | 2.9 (1.36.3) | 2.5 (1.35.2) | 5.6 (2.38.8) | <0.01* |
| Male, no. (%) | 122 (55.5%) | 89 (53.6%) | 33 (61.1%) | 0.34 |
| Emergency Severity Index, no. (%) | 0.11 | |||
| 2 | 90 (40.9%) | 73 (44.0%) | 17 (31.5%) | |
| 3 | 116 (52.7%) | 85 (51.2%) | 31 (57.4%) | |
| 4 | 14 (6.4%) | 8 (4.8%) | 6 (11.1%) | |
| Abnormal vital signs on presentation, no. (%) | ||||
| Fever | 99 (45.0%) | 80 (48.2%) | 19 (35.2%) | 0.10 |
| Tachycardia | 100 (45.5%) | 76 (45.8%) | 24 (44.4%) | 0.86 |
| Tachypnea | 124 (56.4%) | 100 (60.2%) | 24 (44.4%) | 0.04* |
| Hypotension | 0 | 0 | 0 | |
| Hypoxia | 27 (12.3%) | 24 (14.5%) | 3 (5.6%) | 0.08 |
| Physical exam on presentation, no. (%) | ||||
| Increased respiratory effort | 146 (66.4%) | 111 (66.9%) | 35 (64.8%) | 0.78 |
| Distressed | 110 (50.0%) | 86 (51.8%) | 24 (44.4%) | 0.35 |
| Retraction | 103 (46.8%) | 81 (48.8%) | 22 (40.7%) | 0.30 |
| Grunting | 17 (7.7%) | 14 (8.4%) | 3 (5.6%) | 0.49 |
| Nasal flaring | 19 (8.6%) | 17 (10.2%) | 2 (3.7%) | 0.14 |
| Rales | 135 (61.4%) | 99 (59.6%) | 36 (66.7%) | 0.36 |
| Wheeze | 91 (41.4%) | 66 (39.8%) | 25 (46.3%) | 0.40 |
| Decreased breath sounds | 89 (40.5%) | 65 (39.2%) | 24 (44.4%) | 0.49 |
| Dehydration | 21 (9.6%) | 13 (7.8%) | 8 (14.8%) | 0.13 |
| PEWS 5 during admission, no. (%) | 43 (19.6%) | 34 (20.5%) | 9 (16.7%) | 0.54 |
| Oxygen requirement in first 24 hours, no. (%) | 114 (51.8%) | 90 (53.6%) | 24 (46.2%) | 0.35 |
| Complete blood count obtained, no. (%) | 99 (45.0%) | 72 (43.4%) | 27 (50.0%) | 0.40 |
| Abnormal white blood cell count | 35 (35.7%) | 23 (32.4%) | 12 (44.4%) | 0.27 |
| Blood culture obtained, no. (%) | 104 (47.3%) | 80 (48.2%) | 24 (44.4%) | 0.63 |
| Positive | 2 (1.9%) | 1 (1.3%) | 1 (4.2%) | 0.36 |
| Chest radiograph available, no. (%) | 214 (97.3%) | 161 (97.0%) | 53 (98.2%) | 0.65 |
| Infiltrate | 178 (83.2%) | 139 (86.3%) | 39 (73.6%) | 0.03* |
| Bilateral | 29 (16.3%) | 20 (14.4%) | 9 (23.1%) | 0.19 |
| Multilobar | 46 (25.8%) | 33 (23.7%) | 13 (33.3%) | 0.23 |
| Effusion | 24 (11.2%) | 16 (9.9%) | 8 (15.1%) | 0.30 |
| Additional imaging, no. (%) | ||||
| Repeat chest radiograph | 26 (11.8%) | 17 (10.2%) | 9 (16.7%) | 0.20 |
| Chest ultrasound | 4 (1.8%) | 3 (1.8%) | 1 (1.9%) | 0.98 |
| Chest CT | 2 (0.9%) | 1 (0.6%) | 1 (1.9%) | 0.40 |
| Antibiotic, no. (%) | <0.01* | |||
| Aminopenicillin | 140 (63.6%) | 140 (84.3%) | 0 (0%) | |
| Third‐generation cephalosporin | 37 (16.8%) | 8 (4.8%) | 29 (53.7%) | |
| Macrolide monotherapy | 18 (8.2%) | 0 (0%) | 18 (33.3%) | |
| Clindamycin | 2 (0.9%) | 1 (0.6%) | 1 (1.9%) | |
| Levofloxacin | 1 (0.5%) | 0 (0%) | 1 (1.9%) | |
| Aminopenicillin+macrolide | 16 (7.3%) | 16 (9.6%) | 0 (0%) | |
| Cephalosporin+macrolide | 6 (2.7%) | 1 (0.6%) | 5 (9.3%) | |
Secondary outcomes of broadened antibiotic therapy, ED revisits, and hospital readmissions were assessed using the Fisher exact test. Due to the small number of events, we were unable to evaluate these associations in models adjusted for potential confounders.
All analyses were performed with SAS version 9.3 (SAS Institute, Cary, NC), and P values <0.05 were considered significant.
RESULTS
Of the 220 unique patients included, 122 (55%) were male. The median age was 2.9 years (IQR: 1.36.3 years). Empiric guideline‐recommended therapy was prescribed to 168 (76%) patients (Table 1). Aminopenicillins were the most common guideline‐recommended therapy, accounting for 84% of guideline‐recommended antibiotics. An additional 10% of patients received the guideline‐recommended combination therapy with an aminopenicillin and a macrolide. Nonguideline‐recommended therapy included third‐generation cephalosporin antibiotics (54%) and macrolide monotherapy (33%).
Those who received empiric guideline‐recommended antibiotic therapy were similar to those who received nonguideline‐recommended therapy with respect to sex, Emergency Severity Index, physical exam findings on presentation, oxygen requirement in the first 24 hours, abnormal laboratory findings, presence of effusion on chest radiograph, and need for additional imaging (Table 1). However, patients in the guideline‐recommended therapy group were significantly younger (median 2.5 years vs 5.6 years, P0.01), more likely to have elevated respiratory rate on presentation (60.2% vs 44.4%, P=0.04), and more likely to have an infiltrate on chest radiograph (86.3% vs 73.6%, P=0.03) (Table 1). Patients who received nonguideline‐recommended macrolide monotherapy had a median age of 7.4 years (IQR: 5.89.8 years).
Median hospital LOS for the total cohort was 1.3 days (IQR: 0.91.9 days) (Table 2). There were no differences in LOS between patients who received and did not receive guideline‐recommended therapy in the unadjusted or the adjusted model (Table 3).
| Outcome | Guideline Therapy, n=166 | Nonguideline Therapy, n=54 | P Value |
|---|---|---|---|
| |||
| Length of stay, d, median (IQR) | 1.3 (0.91.9) | 1.3 (0.92.0) | 0.74 |
| Total costs, median, (IQR) | $4118 ($2,647$6,004) | $4045 ($2,829$6,200) | 0.44 |
| Pharmacy total costs, median, (IQR) | $84 ($40$179) | $106 ($58$217) | 0.12 |
| Broadened therapy, no. (%) | 10 (6.0%) | 4 (7.4%) | 0.75 |
| Emergency department revisit, no. (%) | 7 (4.2%) | 2 (3.7%) | 1.00 |
| Readmission, no. (%) | 1 (0.6%) | 1 (1.9%) | 0.43 |
| Outcome | Unadjusted Coefficient (95% CI) | Adjusted Coefficient (95% CI) | Adjusted % Change in Outcome (95% CI)* |
|---|---|---|---|
| |||
| Length of stay | 0.06 (0.27 to 0.15) | 0.06 (0.25 to 0.12) | 5.8 (22.1 to 12.8) |
| Total costs | 0.18 (0.40 to 0.04) | 0.11 (0.32 to 0.09) | 10.9 (27.4 to 9.4) |
| Pharmacy total costs | 0.44 (0.46 to 0.02) | 0.16 (0.57 to 0.24) | 14.8 (43.4 to 27.1) |
Median total costs of the index hospitalization for the total cohort were $4097 (IQR: $2657$6054), with median inpatient pharmacy costs of $92 (IQR: $40$183) (Table 2). There were no differences in total or inpatient pharmacy costs for patients who received guideline‐recommended therapy compared with those who did not in unadjusted or adjusted analyses. Fourteen patients (6.4%) had antibiotic therapy broadened during hospitalization, 10 were initially prescribed guideline‐recommended therapy, and 4 were initially prescribed nonguideline‐recommended therapy (Table 4).
| Initial Therapy | Reasons for Antibiotic Change Identified From Chart Review |
|---|---|
| Guideline=10 | Ampicillin to ceftriaxone: |
| 1 patient with clinical worsening | |
| 1 patient with coincident urinary tract infection due to resistant organism | |
| 4 patients without evidence of clinical worsening or documentation of rationale | |
| Addition of a macrolide: | |
| 3 patients without evidence of clinical worsening or documentation of rationale | |
| Addition of clindamycin: | |
| 1 patient with clinical worsening | |
| Nonguideline=4 | Ceftriaxone to clindamycin: |
| 1 patient with clinical worsening | |
| Addition of a macrolide: | |
| 1 patient with clinical worsening | |
| 1 patients without evidence of clinical worsening or documentation of rationale | |
| Addition of clindamycin: | |
| 1 patient with clinical worsening |
Of the 9 pneumonia‐related ED revisits within 30 days of discharge, 7 occurred in patients prescribed empiric guideline‐recommended therapy (Table 5). No ED revisit resulted in hospital readmission or antibiotic change related to pneumonia. Two ED revisits resulted in new antibiotic prescriptions for diagnoses other than pneumonia.
| Revisit | Initial Therapy | Day Postdischarge | Clinical Symptoms at Return Visit | Clinical Diagnosis | Antibiotic Prescription |
|---|---|---|---|---|---|
| |||||
| ED | Guideline | 3 | Poor oral intake and fever | Pneumonia | Continued prior antibiotic |
| ED | Guideline | 8 | Recurrent cough and fever | Resolving pneumonia | Continued prior antibiotic |
| ED | Guideline | 13 | Follow‐up | Resolved pneumonia | No further antibiotic |
| ED | Guideline | 16 | Increased work of breathing | Reactive airway disease | No antibiotic |
| ED | Guideline | 20 | Persistent cough | Viral illness | No antibiotic |
| ED | Guideline | 22 | Recurrent cough and congestion | Sinusitis | Augmentin |
| ED | Guideline | 26 | Increased work of breathing | Reactive airway disease | No antibiotic |
| ED | Nonguideline | 16 | Recurrent fever | Acute otitis media | Amoxicillin |
| ED | Nonguideline | 20 | Recurrent cough and fever | Viral illness | No antibiotic |
| Admission | Guideline | 3 | Increased work of breathing | Pneumonia | IV ampicillin |
| Admission | Nonguideline | 9 | Refusal to take oral clindamycin | Pneumonia | IV clindamycin |
Two patients were readmitted for a pneumonia‐related illness within 30 days of discharge; 1 had received guideline‐recommended therapy (Table 5). Both patients were directly admitted to the inpatient ward without an associated ED visit. Antibiotic class was not changed for either patient upon readmission, despite the decision to convert to intravenous form.
DISCUSSION
In this retrospective cohort study, patients who received empiric guideline‐recommended antibiotic therapy on admission for CAP had no difference in LOS, total cost of hospitalization, or inpatient pharmacy costs compared with those who received therapy that varied from guideline recommendations. Our study suggests that prescribing narrow‐spectrum therapy and, in some circumstances, combination therapy, as recommended by the 2011 PIDS/IDSA pneumonia guideline, did not result in negative unintended consequences.
In our study, children receiving guideline‐recommended therapy were younger, more likely to have elevated respiratory rate on presentation, and more likely to have an infiltrate on chest radiograph. We hypothesize the age difference is a reflection of common use of nonguideline macrolide monotherapy in the older, school‐age child, as macrolides are commonly used for coverage of Mycoplasma pneumonia in older children with CAP.[15] Children receiving macrolide monotherapy were older than those receiving guideline‐recommended therapy (median age of 7.4 years and 2.5 years, respectively). We also hypothesize that some providers may prescribe macrolide monotherapy to children deemed less ill than expected for CAP (eg, normal percutaneous oxygen saturation). This hypothesis is supported by the finding that 60% of patients who had a normal respiratory rate and received nonguideline therapy were prescribed macrolide monotherapy. We did control for the characteristics that varied between the two treatment groups in our models to eliminate potential confounding.
One prior study evaluated the effects of guideline implementation in CAP. In evaluation of a clinical practice guideline that recommended ampicillin as first‐line therapy for CAP, no significant difference was found following guideline introduction in the number of treatment failures (defined as the need to broaden therapy or development of complicated pneumonia within 48 hours or 30‐day inpatient readmission).[16] Our study builds on these findings by directly comparing outcomes between recipients of guideline and nonguideline therapy, which was not done in the prestudy or poststudy design of prior work.[16] We believe that classifying patients based on empiric therapy received rather than timing of guideline introduction thoroughly examines the effect of following guideline recommendations. Additionally, outcomes other than treatment failures were examined in our study including LOS, costs, and ED revisits.
Our results are similar to other observational studies that compared narrow‐ and broad‐spectrum antibiotics for children hospitalized with CAP. Using administrative data, Williams et al. found no significant difference in LOS or cost between narrow‐ and broad‐spectrum intravenous antibiotic recipients ages 6 months to 18 years at 43 children's hospitals.[17] Queen et al. compared narrow‐ and broad‐spectrum antibiotic therapy for children ages 2 months to 18 years at 4 children's hospitals.[18] Differences in average daily cost were not significant, but children who received narrow‐spectrum antibiotics had a significantly shorter LOS. Finally, an observational study of 319 Israeli children <2 years of age found no significant difference in duration of oxygen requirement, LOS, or need for change in antibiotic therapy between the 66 children prescribed aminopenicillins and the 253 children prescribed cefuroxime.[19] These studies suggest that prescribing narrow‐spectrum antimicrobial therapy, as per the guideline recommendations, results in similar outcomes to broad‐spectrum antimicrobial therapy.
Our study adds to prior studies that compared narrow‐ and broad‐spectrum therapy by comparing outcomes associated with guideline‐recommended therapy to nonguideline therapy. We considered antibiotic therapy as guideline recommended if appropriately chosen per the guideline, not just by simple classification of antibiotic. For example, the use of a cephalosporin in a patient with aminopenicillin allergy was considered guideline‐recommended therapy. We chose to classify the exposure of empiric antibiotic therapy in this manner to reflect true clinical application of the guideline, as not all children are able to receive aminopenicillins. Additionally, as our study stemmed from our prior improvement work aimed at increasing guideline adherent therapy,[7] we have a higher frequency of narrow‐spectrum antibiotic use than prior studies. In our study, almost two‐thirds of patients received narrow‐spectrum therapy, whereas narrow‐spectrum use in prior studies ranged from 10% to 33%.[17, 18, 19] Finally, we were able to confirm the diagnosis of pneumonia via medical record review and to adjust for severity of illness using clinical variables including vital signs, physical exam findings, and laboratory and radiologic study results.
This study must be interpreted in the context of several limitations. First, our study population was defined through discharge diagnosis codes, and therefore dependent on the accuracy of coding. However, we minimized potential for misclassification through use of a previously validated approach to identify patients with CAP and through medical record review to confirm the diagnosis. Second, we may be unable to detect very small differences in outcomes given limited power, specifically for outcomes of LOS, ED revisits, hospital readmissions, and need to broaden antibiotic therapy. Third, residual confounding may be present. Although we controlled for many clinical variables in our analyses, antibiotic prescribing practices may be influenced by unmeasured factors. The potential of system level confounding is mitigated by standardized care for patients with CAP at our institution. Prior system‐level changes using quality‐improvement science have resulted in a high level of adherence with guideline‐recommended antimicrobials as well as standardized medical discharge criteria.[7, 20] Additionally, nonmedical factors may influence LOS, limiting its use as an outcome measure. This limitation was minimized in our study by standardizing medical discharge criteria. Prior work at our institution demonstrated that the majority of patients, including those with CAP, were discharged within 2 hours of meeting medical discharge criteria.[20] Fourth, discharged patients who experienced adverse outcomes may have received care at a nearby adult emergency department or at their pediatrician's office. Although these events would not have been captured in our electronic health record, serious complications due to treatment failure (eg, empyema) would require hospitalization. As our hospital is the only children's hospital in the Greater Cincinnati metropolitan area, these patents would receive care at our institution. Therefore, any misclassification of revisits or readmissions is likely to be minimal. Finally, study patients were admitted to a large tertiary academic children's hospital, warranting further investigation to determine if these findings can be translated to smaller community settings.
In conclusion, receipt of guideline‐recommended antibiotic therapy for patients hospitalized with CAP was not associated with increases in LOS, total costs of hospitalization, or inpatient pharmacy costs. Our findings highlight the importance of changing antibiotic prescribing practices to reflect guideline recommendations, as there was no evidence of negative unintended consequences with our local practice change.
Acknowledgments
Disclosures: Dr. Ambroggio and Dr. Thomson were supported by funds from the NRSA T32HP10027‐14. Dr. Shah was supported by funds from NIAID K01A173729. The authors report no conflicts of interest.
- , , , , , . Ambulatory visit rates and antibiotic prescribing for children with pneumonia, 1994–2007. Pediatrics. 2011;127(3):411–418.
- , , , , . National hospitalization trends for pediatric pneumonia and associated complications. Pediatrics. 2010;126(2):204–213.
- , , , et al. Prioritization of comparative effectiveness research topics in hospital pediatrics. Arch Pediatr Adolesc Med. 2012;166(12):1155–1164.
- , , , et al. The management of community‐acquired pneumonia in infants and children older than 3 months of age: clinical practice guidelines by the Pediatric Infectious Diseases Society and the Infectious Diseases Society of America. Clin Infect Dis. 2011;53(7):e25–e76.
- , , , et al. Variability in processes of care and outcomes among children hospitalized with community‐acquired pneumonia. Pediatr Infect Dis J. 2012;31(10):1036–1041.
- , , , et al. Impact of IDSA/PIDS guidelines on treatment of community‐acquired pneumonia in hospitalized children. Clin Infect Dis. 2014;58(6):834–838.
- , , , et al. Quality improvement methods increase appropriate antibiotic prescribing for childhood pneumonia. Pediatrics. 2013;131(5):e1623–e1631.
- , , , et al. Identifying pediatric community‐acquired pneumonia hospitalizations: accuracy of administrative billing codes. JAMA Pediatr. 2013;167(9):851–858.
- , , , , , . Deaths attributed to pediatric complex chronic conditions: national trends and implications for supportive care services. Pediatrics. 2001;107(6):E99.
- Centers for Medicare 2011.
- , , , et al. Pediatric advanced life support: 2010 American Heart Association guidelines for cardiopulmonary resuscitation and emergency cardiovascular care. Pediatrics. 2010;126(5):e1361–e1399.
- , , , , . Prospective evaluation of a pediatric inpatient early warning scoring system. J Spec Pediatr Nurs. 2009;14(2):79–85.
- , , , . Regression Methods in Biostatistics: Linear, Logistic, Survival, and Repeated Measures Models. New York, NY: Springer; 2005.
- , , , , . Treatment of mycoplasma pneumonia: a systematic review. Pediatrics. 2014;133(6):1081–1090.
- , , , , , . Impact of a guideline on management of children hospitalized with community‐acquired pneumonia. Pediatrics. 2012;129(3):e597–e604.
- , , , et al. Narrow vs broad‐spectrum antimicrobial therapy for children hospitalized with pneumonia. Pediatrics. 2013;132(5):e1141–e1148.
- , , , et al. Comparative effectiveness of empiric antibiotics for community‐acquired pneumonia. Pediatrics. 2014;133(1):e23–e29.
- , , , et al. Antibiotic treatment of children with community‐acquired pneumonia: comparison of penicillin or ampicillin versus cefuroxime. Pediatr Pulmonol. 2013;48(1):52–58.
- , , , et al. Using quality improvement to optimise paediatric discharge efficiency. BMJ Qual Saf. 2014;23(5):428–436.
Community‐acquired pneumonia (CAP) is a common and serious infection in children. With more than 150,000 children requiring hospitalization annually, CAP is the fifth most prevalent and the second most costly diagnosis of all pediatric hospitalizations in the United States.[1, 2, 3]
In August 2011, the Pediatric Infectious Diseases Society (PIDS) and the Infectious Diseases Society of America (IDSA) published an evidence‐based guideline for the management of CAP in children. This guideline recommended that fully immunized children without underlying complications who require hospitalization receive an aminopenicillin as first‐line antibiotic therapy.[4] Additionally, the guideline recommends empirically adding a macrolide to an aminopenicillin when atypical pneumonia is a diagnostic consideration.
This recommendation was a substantial departure from practice for hospitals nationwide, as a multicenter study of children's hospitals (20052010) demonstrated that <10% of patients diagnosed with CAP received aminopenicillins as empiric therapy.[5] Since publication of the PIDS/IDSA guidelines, the use of aminopenicillins has increased significantly across institutions, but the majority of hospitalized patients still receive broad‐spectrum cephalosporin therapy for CAP.[6]
At baseline, 30% of patients hospitalized with CAP received guideline‐recommended antibiotic therapy at our institution. Through the use of quality‐improvement methods, the proportion of patients receiving guideline‐recommended therapy increased to 100%.[7] The objective of this study was to ensure that there were not unintended negative consequences to guideline implementation. Specifically, we sought to identify changes in length of stay (LOS), hospital costs, and treatment failures associated with use of guideline‐recommended antibiotic therapy for children hospitalized with uncomplicated CAP.
METHODS
Study Design and Study Population
This retrospective cohort study included children age 3 months to 18 years, hospitalized with CAP, between May 2, 2011 and July 30, 2012, at Cincinnati Children's Hospital Medical Center (CCHMC), a 512‐bed free‐standing children's hospital. The CCHMC Institutional Review Board approved this study with a waiver of informed consent.
Patients were eligible for inclusion if they were admitted to the hospital for inpatient or observation level care with a primary or secondary International Classification of Disease, 9th Revision discharge diagnosis code of pneumonia (480.02, 480.89, 481, 482.0, 482.30‐2, 482.41‐2, 482.83, 482.8990, 483.8, 484.3, 485, 486, 487.0) or effusion/empyema (510.0, 510.9, 511.01, 511.89, 513).[8] Patients with complex chronic conditions[9] were excluded. Medical records of eligible patients (n=260) were reviewed by 2 members of the study team to ensure that patients fell into the purview of the guideline. Patients who did not receive antibiotics (n=11) or for whom there was documented concern for aspiration (n=1) were excluded. Additionally, patients with immunodeficiency (n=1) or who had not received age‐appropriate vaccinations (n=2), and patients who required intensive care unit admission on presentation (n=17) or who had a complicated pneumonia, defined by presence of moderate or large pleural effusion at time of admission (n=8), were also excluded.[7] Finally, for patients with multiple pneumonia admissions, only the index visit was included; subsequent visits occurring within 30 days of discharge were considered readmissions.
Treatment Measure
The primary exposure of interest was empiric antibiotic therapy upon hospital admission. Antibiotic therapy was classified as guideline recommended or nonguideline recommended. Guideline‐recommended therapy was defined as follows:
- For children without drug allergies: ampicillin (200 mg/kg/day intravenously) or amoxicillin (90 mg/kg/day orally);
- For children with penicillin allergy: ceftriaxone (50100 mg/kg/day intravenously or intramuscularly) or cefdinir (14 mg/kg/day orally);
- For children with penicillin and cephalosporin allergy: clindamycin (40 mg/kg/day orally or intravenously); and
- Or azithromycin (10 mg/kg/day orally or intravenously on day 1) in combination with antibiotic category 1 or 2 or 3 above.
Outcome Measures
The primary outcomes examined were hospital LOS, total cost of hospitalization, and inpatient pharmacy costs. LOS was measured in hours and defined as the difference in time between departure from and arrival to the inpatient unit. Total cost of index hospitalization included both direct and indirect costs, obtained from the Centers for Medicare & Medicaid Services' Relative Value Units data for Current Procedural Terminology codes.[10]
Secondary outcomes included broadening of antibiotic therapy during the hospital course, pneumonia‐related emergency department (ED) revisits within 30 days, and pneumonia‐related inpatient readmissions within 30 days. Broadening of antibiotic therapy was defined as addition of a second antibiotic (eg, adding azithromycin on day 3 of hospitalization) or change in empiric antibiotic to a class with broader antimicrobial activity (eg, ampicillin to ceftriaxone) at any time during hospitalization. As our study population included only patients with uncomplicated pneumonia at the time of admission, this outcome was used to capture possible treatment failure. ED revisits and inpatient readmissions were reviewed by 3 investigators to identify pneumonia‐related visits. To encompass all possible treatment failures, all respiratory‐related complaints (eg, wheezing, respiratory distress) were considered as pneumonia‐related. Disagreements were resolved by group discussion.
Covariates
Severity of illness on presentation was evaluated using the Emergency Severity Index version 4,[11] abnormal vital signs on presentation (as defined by Pediatric Advanced Life Support age‐specific criteria[12]), and need for oxygen in the first 24 hours of hospitalization. Supplemental oxygen is administered for saturations <91% per protocol at our institution. The patient's highest Pediatric Early Warning Scale score[13] during hospitalization was used as a proxy for disease severity. Exam findings on presentation (eg, increased respiratory effort, rales, wheezing) were determined through chart review. Laboratory tests and radiologic imaging variables included complete blood cell count, blood culture, chest radiograph, chest ultrasound, and chest computed tomography. Abnormal white blood cell count was defined as <5000 or >15,000 cells/mL, the defined reference range for the CCHMC clinical laboratory.
Data Analysis
Continuous variables were described using median and interquartile range (IQR) and compared across groups using Wilcoxon rank sum test due to non‐normal distributions. Categorical variables were described by counts and frequencies and compared using the 2 test.
Multivariable linear regression analysis was performed to assess the independent effect of receipt of empiric guideline‐recommended antibiotic therapy on outcomes of LOS and costs while adjusting for covariates. As LOS and costs were non‐normally distributed, we logarithmically transformed these values to use as the dependent variables in our models. The resulting coefficients were back‐transformed to reflect the percent change in LOS and costs incurred between subjects who received empiric guideline therapy compared with those who did not.[14] Covariates were chosen a priori due to their clinical and biological relevance to the outcomes of LOS (eg, wheezing on presentation and need for supplemental oxygen), total cost of hospitalization (eg, LOS and need for repeat imaging), and inpatient pharmacy costs (eg, LOS and wheezing on presentation) (Table 1).
| Characteristic | Overall Cohort, n=220 | Guideline Therapy, n=166 | Nonguideline Therapy, n=54 | P Value |
|---|---|---|---|---|
| ||||
| Age, y, median (IQR) | 2.9 (1.36.3) | 2.5 (1.35.2) | 5.6 (2.38.8) | <0.01* |
| Male, no. (%) | 122 (55.5%) | 89 (53.6%) | 33 (61.1%) | 0.34 |
| Emergency Severity Index, no. (%) | 0.11 | |||
| 2 | 90 (40.9%) | 73 (44.0%) | 17 (31.5%) | |
| 3 | 116 (52.7%) | 85 (51.2%) | 31 (57.4%) | |
| 4 | 14 (6.4%) | 8 (4.8%) | 6 (11.1%) | |
| Abnormal vital signs on presentation, no. (%) | ||||
| Fever | 99 (45.0%) | 80 (48.2%) | 19 (35.2%) | 0.10 |
| Tachycardia | 100 (45.5%) | 76 (45.8%) | 24 (44.4%) | 0.86 |
| Tachypnea | 124 (56.4%) | 100 (60.2%) | 24 (44.4%) | 0.04* |
| Hypotension | 0 | 0 | 0 | |
| Hypoxia | 27 (12.3%) | 24 (14.5%) | 3 (5.6%) | 0.08 |
| Physical exam on presentation, no. (%) | ||||
| Increased respiratory effort | 146 (66.4%) | 111 (66.9%) | 35 (64.8%) | 0.78 |
| Distressed | 110 (50.0%) | 86 (51.8%) | 24 (44.4%) | 0.35 |
| Retraction | 103 (46.8%) | 81 (48.8%) | 22 (40.7%) | 0.30 |
| Grunting | 17 (7.7%) | 14 (8.4%) | 3 (5.6%) | 0.49 |
| Nasal flaring | 19 (8.6%) | 17 (10.2%) | 2 (3.7%) | 0.14 |
| Rales | 135 (61.4%) | 99 (59.6%) | 36 (66.7%) | 0.36 |
| Wheeze | 91 (41.4%) | 66 (39.8%) | 25 (46.3%) | 0.40 |
| Decreased breath sounds | 89 (40.5%) | 65 (39.2%) | 24 (44.4%) | 0.49 |
| Dehydration | 21 (9.6%) | 13 (7.8%) | 8 (14.8%) | 0.13 |
| PEWS 5 during admission, no. (%) | 43 (19.6%) | 34 (20.5%) | 9 (16.7%) | 0.54 |
| Oxygen requirement in first 24 hours, no. (%) | 114 (51.8%) | 90 (53.6%) | 24 (46.2%) | 0.35 |
| Complete blood count obtained, no. (%) | 99 (45.0%) | 72 (43.4%) | 27 (50.0%) | 0.40 |
| Abnormal white blood cell count | 35 (35.7%) | 23 (32.4%) | 12 (44.4%) | 0.27 |
| Blood culture obtained, no. (%) | 104 (47.3%) | 80 (48.2%) | 24 (44.4%) | 0.63 |
| Positive | 2 (1.9%) | 1 (1.3%) | 1 (4.2%) | 0.36 |
| Chest radiograph available, no. (%) | 214 (97.3%) | 161 (97.0%) | 53 (98.2%) | 0.65 |
| Infiltrate | 178 (83.2%) | 139 (86.3%) | 39 (73.6%) | 0.03* |
| Bilateral | 29 (16.3%) | 20 (14.4%) | 9 (23.1%) | 0.19 |
| Multilobar | 46 (25.8%) | 33 (23.7%) | 13 (33.3%) | 0.23 |
| Effusion | 24 (11.2%) | 16 (9.9%) | 8 (15.1%) | 0.30 |
| Additional imaging, no. (%) | ||||
| Repeat chest radiograph | 26 (11.8%) | 17 (10.2%) | 9 (16.7%) | 0.20 |
| Chest ultrasound | 4 (1.8%) | 3 (1.8%) | 1 (1.9%) | 0.98 |
| Chest CT | 2 (0.9%) | 1 (0.6%) | 1 (1.9%) | 0.40 |
| Antibiotic, no. (%) | <0.01* | |||
| Aminopenicillin | 140 (63.6%) | 140 (84.3%) | 0 (0%) | |
| Third‐generation cephalosporin | 37 (16.8%) | 8 (4.8%) | 29 (53.7%) | |
| Macrolide monotherapy | 18 (8.2%) | 0 (0%) | 18 (33.3%) | |
| Clindamycin | 2 (0.9%) | 1 (0.6%) | 1 (1.9%) | |
| Levofloxacin | 1 (0.5%) | 0 (0%) | 1 (1.9%) | |
| Aminopenicillin+macrolide | 16 (7.3%) | 16 (9.6%) | 0 (0%) | |
| Cephalosporin+macrolide | 6 (2.7%) | 1 (0.6%) | 5 (9.3%) | |
Secondary outcomes of broadened antibiotic therapy, ED revisits, and hospital readmissions were assessed using the Fisher exact test. Due to the small number of events, we were unable to evaluate these associations in models adjusted for potential confounders.
All analyses were performed with SAS version 9.3 (SAS Institute, Cary, NC), and P values <0.05 were considered significant.
RESULTS
Of the 220 unique patients included, 122 (55%) were male. The median age was 2.9 years (IQR: 1.36.3 years). Empiric guideline‐recommended therapy was prescribed to 168 (76%) patients (Table 1). Aminopenicillins were the most common guideline‐recommended therapy, accounting for 84% of guideline‐recommended antibiotics. An additional 10% of patients received the guideline‐recommended combination therapy with an aminopenicillin and a macrolide. Nonguideline‐recommended therapy included third‐generation cephalosporin antibiotics (54%) and macrolide monotherapy (33%).
Those who received empiric guideline‐recommended antibiotic therapy were similar to those who received nonguideline‐recommended therapy with respect to sex, Emergency Severity Index, physical exam findings on presentation, oxygen requirement in the first 24 hours, abnormal laboratory findings, presence of effusion on chest radiograph, and need for additional imaging (Table 1). However, patients in the guideline‐recommended therapy group were significantly younger (median 2.5 years vs 5.6 years, P0.01), more likely to have elevated respiratory rate on presentation (60.2% vs 44.4%, P=0.04), and more likely to have an infiltrate on chest radiograph (86.3% vs 73.6%, P=0.03) (Table 1). Patients who received nonguideline‐recommended macrolide monotherapy had a median age of 7.4 years (IQR: 5.89.8 years).
Median hospital LOS for the total cohort was 1.3 days (IQR: 0.91.9 days) (Table 2). There were no differences in LOS between patients who received and did not receive guideline‐recommended therapy in the unadjusted or the adjusted model (Table 3).
| Outcome | Guideline Therapy, n=166 | Nonguideline Therapy, n=54 | P Value |
|---|---|---|---|
| |||
| Length of stay, d, median (IQR) | 1.3 (0.91.9) | 1.3 (0.92.0) | 0.74 |
| Total costs, median, (IQR) | $4118 ($2,647$6,004) | $4045 ($2,829$6,200) | 0.44 |
| Pharmacy total costs, median, (IQR) | $84 ($40$179) | $106 ($58$217) | 0.12 |
| Broadened therapy, no. (%) | 10 (6.0%) | 4 (7.4%) | 0.75 |
| Emergency department revisit, no. (%) | 7 (4.2%) | 2 (3.7%) | 1.00 |
| Readmission, no. (%) | 1 (0.6%) | 1 (1.9%) | 0.43 |
| Outcome | Unadjusted Coefficient (95% CI) | Adjusted Coefficient (95% CI) | Adjusted % Change in Outcome (95% CI)* |
|---|---|---|---|
| |||
| Length of stay | 0.06 (0.27 to 0.15) | 0.06 (0.25 to 0.12) | 5.8 (22.1 to 12.8) |
| Total costs | 0.18 (0.40 to 0.04) | 0.11 (0.32 to 0.09) | 10.9 (27.4 to 9.4) |
| Pharmacy total costs | 0.44 (0.46 to 0.02) | 0.16 (0.57 to 0.24) | 14.8 (43.4 to 27.1) |
Median total costs of the index hospitalization for the total cohort were $4097 (IQR: $2657$6054), with median inpatient pharmacy costs of $92 (IQR: $40$183) (Table 2). There were no differences in total or inpatient pharmacy costs for patients who received guideline‐recommended therapy compared with those who did not in unadjusted or adjusted analyses. Fourteen patients (6.4%) had antibiotic therapy broadened during hospitalization, 10 were initially prescribed guideline‐recommended therapy, and 4 were initially prescribed nonguideline‐recommended therapy (Table 4).
| Initial Therapy | Reasons for Antibiotic Change Identified From Chart Review |
|---|---|
| Guideline=10 | Ampicillin to ceftriaxone: |
| 1 patient with clinical worsening | |
| 1 patient with coincident urinary tract infection due to resistant organism | |
| 4 patients without evidence of clinical worsening or documentation of rationale | |
| Addition of a macrolide: | |
| 3 patients without evidence of clinical worsening or documentation of rationale | |
| Addition of clindamycin: | |
| 1 patient with clinical worsening | |
| Nonguideline=4 | Ceftriaxone to clindamycin: |
| 1 patient with clinical worsening | |
| Addition of a macrolide: | |
| 1 patient with clinical worsening | |
| 1 patients without evidence of clinical worsening or documentation of rationale | |
| Addition of clindamycin: | |
| 1 patient with clinical worsening |
Of the 9 pneumonia‐related ED revisits within 30 days of discharge, 7 occurred in patients prescribed empiric guideline‐recommended therapy (Table 5). No ED revisit resulted in hospital readmission or antibiotic change related to pneumonia. Two ED revisits resulted in new antibiotic prescriptions for diagnoses other than pneumonia.
| Revisit | Initial Therapy | Day Postdischarge | Clinical Symptoms at Return Visit | Clinical Diagnosis | Antibiotic Prescription |
|---|---|---|---|---|---|
| |||||
| ED | Guideline | 3 | Poor oral intake and fever | Pneumonia | Continued prior antibiotic |
| ED | Guideline | 8 | Recurrent cough and fever | Resolving pneumonia | Continued prior antibiotic |
| ED | Guideline | 13 | Follow‐up | Resolved pneumonia | No further antibiotic |
| ED | Guideline | 16 | Increased work of breathing | Reactive airway disease | No antibiotic |
| ED | Guideline | 20 | Persistent cough | Viral illness | No antibiotic |
| ED | Guideline | 22 | Recurrent cough and congestion | Sinusitis | Augmentin |
| ED | Guideline | 26 | Increased work of breathing | Reactive airway disease | No antibiotic |
| ED | Nonguideline | 16 | Recurrent fever | Acute otitis media | Amoxicillin |
| ED | Nonguideline | 20 | Recurrent cough and fever | Viral illness | No antibiotic |
| Admission | Guideline | 3 | Increased work of breathing | Pneumonia | IV ampicillin |
| Admission | Nonguideline | 9 | Refusal to take oral clindamycin | Pneumonia | IV clindamycin |
Two patients were readmitted for a pneumonia‐related illness within 30 days of discharge; 1 had received guideline‐recommended therapy (Table 5). Both patients were directly admitted to the inpatient ward without an associated ED visit. Antibiotic class was not changed for either patient upon readmission, despite the decision to convert to intravenous form.
DISCUSSION
In this retrospective cohort study, patients who received empiric guideline‐recommended antibiotic therapy on admission for CAP had no difference in LOS, total cost of hospitalization, or inpatient pharmacy costs compared with those who received therapy that varied from guideline recommendations. Our study suggests that prescribing narrow‐spectrum therapy and, in some circumstances, combination therapy, as recommended by the 2011 PIDS/IDSA pneumonia guideline, did not result in negative unintended consequences.
In our study, children receiving guideline‐recommended therapy were younger, more likely to have elevated respiratory rate on presentation, and more likely to have an infiltrate on chest radiograph. We hypothesize the age difference is a reflection of common use of nonguideline macrolide monotherapy in the older, school‐age child, as macrolides are commonly used for coverage of Mycoplasma pneumonia in older children with CAP.[15] Children receiving macrolide monotherapy were older than those receiving guideline‐recommended therapy (median age of 7.4 years and 2.5 years, respectively). We also hypothesize that some providers may prescribe macrolide monotherapy to children deemed less ill than expected for CAP (eg, normal percutaneous oxygen saturation). This hypothesis is supported by the finding that 60% of patients who had a normal respiratory rate and received nonguideline therapy were prescribed macrolide monotherapy. We did control for the characteristics that varied between the two treatment groups in our models to eliminate potential confounding.
One prior study evaluated the effects of guideline implementation in CAP. In evaluation of a clinical practice guideline that recommended ampicillin as first‐line therapy for CAP, no significant difference was found following guideline introduction in the number of treatment failures (defined as the need to broaden therapy or development of complicated pneumonia within 48 hours or 30‐day inpatient readmission).[16] Our study builds on these findings by directly comparing outcomes between recipients of guideline and nonguideline therapy, which was not done in the prestudy or poststudy design of prior work.[16] We believe that classifying patients based on empiric therapy received rather than timing of guideline introduction thoroughly examines the effect of following guideline recommendations. Additionally, outcomes other than treatment failures were examined in our study including LOS, costs, and ED revisits.
Our results are similar to other observational studies that compared narrow‐ and broad‐spectrum antibiotics for children hospitalized with CAP. Using administrative data, Williams et al. found no significant difference in LOS or cost between narrow‐ and broad‐spectrum intravenous antibiotic recipients ages 6 months to 18 years at 43 children's hospitals.[17] Queen et al. compared narrow‐ and broad‐spectrum antibiotic therapy for children ages 2 months to 18 years at 4 children's hospitals.[18] Differences in average daily cost were not significant, but children who received narrow‐spectrum antibiotics had a significantly shorter LOS. Finally, an observational study of 319 Israeli children <2 years of age found no significant difference in duration of oxygen requirement, LOS, or need for change in antibiotic therapy between the 66 children prescribed aminopenicillins and the 253 children prescribed cefuroxime.[19] These studies suggest that prescribing narrow‐spectrum antimicrobial therapy, as per the guideline recommendations, results in similar outcomes to broad‐spectrum antimicrobial therapy.
Our study adds to prior studies that compared narrow‐ and broad‐spectrum therapy by comparing outcomes associated with guideline‐recommended therapy to nonguideline therapy. We considered antibiotic therapy as guideline recommended if appropriately chosen per the guideline, not just by simple classification of antibiotic. For example, the use of a cephalosporin in a patient with aminopenicillin allergy was considered guideline‐recommended therapy. We chose to classify the exposure of empiric antibiotic therapy in this manner to reflect true clinical application of the guideline, as not all children are able to receive aminopenicillins. Additionally, as our study stemmed from our prior improvement work aimed at increasing guideline adherent therapy,[7] we have a higher frequency of narrow‐spectrum antibiotic use than prior studies. In our study, almost two‐thirds of patients received narrow‐spectrum therapy, whereas narrow‐spectrum use in prior studies ranged from 10% to 33%.[17, 18, 19] Finally, we were able to confirm the diagnosis of pneumonia via medical record review and to adjust for severity of illness using clinical variables including vital signs, physical exam findings, and laboratory and radiologic study results.
This study must be interpreted in the context of several limitations. First, our study population was defined through discharge diagnosis codes, and therefore dependent on the accuracy of coding. However, we minimized potential for misclassification through use of a previously validated approach to identify patients with CAP and through medical record review to confirm the diagnosis. Second, we may be unable to detect very small differences in outcomes given limited power, specifically for outcomes of LOS, ED revisits, hospital readmissions, and need to broaden antibiotic therapy. Third, residual confounding may be present. Although we controlled for many clinical variables in our analyses, antibiotic prescribing practices may be influenced by unmeasured factors. The potential of system level confounding is mitigated by standardized care for patients with CAP at our institution. Prior system‐level changes using quality‐improvement science have resulted in a high level of adherence with guideline‐recommended antimicrobials as well as standardized medical discharge criteria.[7, 20] Additionally, nonmedical factors may influence LOS, limiting its use as an outcome measure. This limitation was minimized in our study by standardizing medical discharge criteria. Prior work at our institution demonstrated that the majority of patients, including those with CAP, were discharged within 2 hours of meeting medical discharge criteria.[20] Fourth, discharged patients who experienced adverse outcomes may have received care at a nearby adult emergency department or at their pediatrician's office. Although these events would not have been captured in our electronic health record, serious complications due to treatment failure (eg, empyema) would require hospitalization. As our hospital is the only children's hospital in the Greater Cincinnati metropolitan area, these patents would receive care at our institution. Therefore, any misclassification of revisits or readmissions is likely to be minimal. Finally, study patients were admitted to a large tertiary academic children's hospital, warranting further investigation to determine if these findings can be translated to smaller community settings.
In conclusion, receipt of guideline‐recommended antibiotic therapy for patients hospitalized with CAP was not associated with increases in LOS, total costs of hospitalization, or inpatient pharmacy costs. Our findings highlight the importance of changing antibiotic prescribing practices to reflect guideline recommendations, as there was no evidence of negative unintended consequences with our local practice change.
Acknowledgments
Disclosures: Dr. Ambroggio and Dr. Thomson were supported by funds from the NRSA T32HP10027‐14. Dr. Shah was supported by funds from NIAID K01A173729. The authors report no conflicts of interest.
- , , , , , . Ambulatory visit rates and antibiotic prescribing for children with pneumonia, 1994–2007. Pediatrics. 2011;127(3):411–418.
- , , , , . National hospitalization trends for pediatric pneumonia and associated complications. Pediatrics. 2010;126(2):204–213.
- , , , et al. Prioritization of comparative effectiveness research topics in hospital pediatrics. Arch Pediatr Adolesc Med. 2012;166(12):1155–1164.
- , , , et al. The management of community‐acquired pneumonia in infants and children older than 3 months of age: clinical practice guidelines by the Pediatric Infectious Diseases Society and the Infectious Diseases Society of America. Clin Infect Dis. 2011;53(7):e25–e76.
- , , , et al. Variability in processes of care and outcomes among children hospitalized with community‐acquired pneumonia. Pediatr Infect Dis J. 2012;31(10):1036–1041.
- , , , et al. Impact of IDSA/PIDS guidelines on treatment of community‐acquired pneumonia in hospitalized children. Clin Infect Dis. 2014;58(6):834–838.
- , , , et al. Quality improvement methods increase appropriate antibiotic prescribing for childhood pneumonia. Pediatrics. 2013;131(5):e1623–e1631.
- , , , et al. Identifying pediatric community‐acquired pneumonia hospitalizations: accuracy of administrative billing codes. JAMA Pediatr. 2013;167(9):851–858.
- , , , , , . Deaths attributed to pediatric complex chronic conditions: national trends and implications for supportive care services. Pediatrics. 2001;107(6):E99.
- Centers for Medicare 2011.
- , , , et al. Pediatric advanced life support: 2010 American Heart Association guidelines for cardiopulmonary resuscitation and emergency cardiovascular care. Pediatrics. 2010;126(5):e1361–e1399.
- , , , , . Prospective evaluation of a pediatric inpatient early warning scoring system. J Spec Pediatr Nurs. 2009;14(2):79–85.
- , , , . Regression Methods in Biostatistics: Linear, Logistic, Survival, and Repeated Measures Models. New York, NY: Springer; 2005.
- , , , , . Treatment of mycoplasma pneumonia: a systematic review. Pediatrics. 2014;133(6):1081–1090.
- , , , , , . Impact of a guideline on management of children hospitalized with community‐acquired pneumonia. Pediatrics. 2012;129(3):e597–e604.
- , , , et al. Narrow vs broad‐spectrum antimicrobial therapy for children hospitalized with pneumonia. Pediatrics. 2013;132(5):e1141–e1148.
- , , , et al. Comparative effectiveness of empiric antibiotics for community‐acquired pneumonia. Pediatrics. 2014;133(1):e23–e29.
- , , , et al. Antibiotic treatment of children with community‐acquired pneumonia: comparison of penicillin or ampicillin versus cefuroxime. Pediatr Pulmonol. 2013;48(1):52–58.
- , , , et al. Using quality improvement to optimise paediatric discharge efficiency. BMJ Qual Saf. 2014;23(5):428–436.
© 2014 Society of Hospital Medicine
Memory problems more common in psychogenic nonepileptic seizures plus PTSD
Individuals suffering from psychogenic nonepileptic seizures with posttraumatic stress disorder have significant verbal and visual memory impairments, and a greater likelihood of a history of substance abuse than individuals without PTSD, even if those individuals have a history of trauma, investigators have found in a case-control study.
“Up to 90% of patients with PNESs [psychogenic nonepileptic seizures] have been reported to have histories of significant traumatic experiences, with particularly high instances of childhood sexual and physical abuse, compared with control groups and the general population,” wrote Lorna Myers, Ph.D., of the Northeast Regional Epilepsy Group, New York, and her associates.
Those with psychogenic nonepileptic seizures and PTSD had the highest rates of psychiatric medication use, substance abuse, history of rape, and history of physical abuse, compared with individuals who had psychogenic nonepileptic seizures without a diagnosis of PTSD but with a history of trauma, and individuals with psychogenic nonepileptic seizures and no history of trauma, according to the study (Epilepsy & Behavior 2014;37:82-6).
Investigators for the study – which enrolled 17 people with psychogenic nonepileptic seizures and PTSD, 29 people with psychogenic nonepileptic seizures and a history of trauma but no PTSD, and 17 individuals with psychogenic nonepileptic seizures but no PTSD or trauma history – also found that those with psychogenic nonepileptic seizures and PTSD scored lowest in delayed narrative memory, and showed the highest scores for self-perceived verbal memory, visuospatial memory, and overall Memory Complaints Inventory.
Dr. Myers and her associates cited several limitations. For example, they did not collect data on the patients’ ethnic or racial backgrounds, which suggests that information on “PNES pathology and neuropsychological functions” might have been missed.
The authors declared no conflicts of interest.
FROM EPILEPSY & BEHAVIOR
Key clinical point: Individuals with psychogenic nonepileptic seizures and PTSD have worse memory problems and higher rates of substance abuse.
Major finding: Substance abuse, memory problems, and history of trauma were more likely in psychogenic nonepileptic seizures plus PTSD than without PTSD.
Data source: Case-control study among 17 people with psychogenic nonepileptic seizures and PTSD, 29 people with psychogenic nonepileptic seizures and a history of trauma but no PTSD, and 17 individuals with psychogenic nonepileptic seizures but no PTSD or trauma history.
Disclosures: The authors declared no conflicts of interest.
BEST PRACTICES IN: Infant Feeding
Medical Education Library
A Best Practices Supplement to Pediatric News®. This supplement was sponsored by Perrigo Nutritionals.

Topics
- Introduction
- Store Brands and Advertised Brands
- FDA Regulation of Formula
- Formula Selection
- The Problem of Infant Formula Dilution
- Is Switching Formula Safe?
- Conclusion
Faculty/Faculty Disclosure
Joel R. Rosh, MD
Director, Pediatric
Gastroenterology
Goryeb Children’s
Hospital/Atlantic Health
Morristown, NJ
Professor of Pediatrics
Icahn School of Medicine
at Mount Sinai
New York, NY
Dr. Rosh discloses that he is on an advisory board for Perrigo Nutritionals.
Medical Education Library
A Best Practices Supplement to Pediatric News®. This supplement was sponsored by Perrigo Nutritionals.
Topics
- Introduction
- Store Brands and Advertised Brands
- FDA Regulation of Formula
- Formula Selection
- The Problem of Infant Formula Dilution
- Is Switching Formula Safe?
- Conclusion
Faculty/Faculty Disclosure
Joel R. Rosh, MD
Director, Pediatric
Gastroenterology
Goryeb Children’s
Hospital/Atlantic Health
Morristown, NJ
Professor of Pediatrics
Icahn School of Medicine
at Mount Sinai
New York, NY
Dr. Rosh discloses that he is on an advisory board for Perrigo Nutritionals.