User login
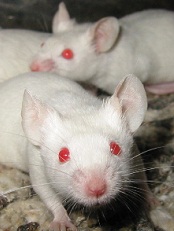
Rodents to the rescue: Bart Weetjens and the tuberculosis-sniffing rats
I’ve just come across a really interesting project that I think we can all get behind: tuberculosis-sniffing rats.
It started with land mines. In many war-torn regions in Africa, people cannot access their land for agriculture because it is riddled with mines left over from previous conflicts. Bart Weetjens, a Belgian product development engineer with some experience of the difficulties of living in rural Africa, came across American experiments from the 1970s using gerbils to sniff out explosives. This inspired him to look into using rats to sniff out land mines. In 1997, he founded a nonprofit called Anti-Persoonsmijnen Ontmijnende Product Ontwikkeling (APOPO) and received funding from the Belgian government to pursue his research.
Weetjens settled on using African giant pouch rats to sniff out land mines. The rats were inexpensive, intelligent, plentiful, sociable, trainable, and, most importantly, light enough to not set the land mines off. In 2003, they first tested the rats on real fields with real land mines in Mozambique. Now, they’ve received the backing of international peace agencies and have, to date, rendered safe 2.5 million square-meters of land area in Mozambique, effectively returning 100,000 people to their lands.
Given the success of this project, and the prevalence of pulmonary tuberculosis (TB) in the same communities affected by land mines, Weetjens thought of expanding the project into detection of tuberculosis from sputum samples. The premise is that Mycobacterium tuberculosis emits volatile organic compounds that the rats, with more genetic material dedicated to olfaction than any other mammal, might be able to detect.
It’s a fascinating demonstration of the intersection between science fiction and reality. You have to watch the videos to believe it, but the organization has trained several dozen rats in Tanzania and Mozambique to sniff out TB. It takes the rats 20 msec to sniff out and correctly identify a sample. The rats are able to process in 7 minutes the number of samples that a lab technician (or a lab "rat," if you will) would take a day to process using conventional light microscopy methods. In Dar es Salaam, using samples from more than 10,500 people from five hospitals, they increased the case detection rate by 44% over that of conventional microscopy. This method has a sensitivity of about 85% and a specificity of 90% – about the same rates as a 10-mm positive tuberculin test (Am. J. Trop. Med. Hyg. 2010;83:1308-10). It is even able to distinguish between M. tuberculosis and other mycobacterial species.
According to the World Health Organization, people with active tuberculosis can spread the disease to 10-15 close contacts in a year. WHO also says that TB is the second biggest infectious killer (behind HIV) worldwide, with over 1.3 million deaths in 2012. If these rats can really detect patients with TB at a much higher rate and with a greater sensitivity than standard microscopy, imagine the impact they would have on reducing the number of deaths worldwide from TB, especially in African nations where TB and HIV often co-occur, and access to health care is difficult.
APOPO’s project is a wonderful example of how simple innovations in science can have such a large footprint on global health. If you’re interested in learning more about APOPO, visit their website. You’ll find interesting videos and links to publications, plus ways to donate.
Dr. Chan practices rheumatology in Pawtucket, R.I.
Introspection – the Next Surgical Time-Out
The Town Hall Meeting held at the Annual Meeting of the American College of Surgeons in Washington, DC, on Oct. 8, entitled, "Introspection – the Next Surgical Time-Out," was cochaired by Geoffrey Dunn, M.D., FACS, and Ann Mosenthal, M.D., FACS, with panelists Dan Hinshaw, M.D., FACS, and David Page, M.D., FACS.
Well-attended, the discussion raised specific issues that addressed the growing need for surgeons to care for themselves in a sometimes chaotic and hostile practice environment. Given a reported 30%-40% burnout rate among surgeons, it was felt prudent to explore a side of the surgical personality too often resistant to self-examination. And like scheduled time-outs before starting a case in the OR, it was felt that a personal time-out before diving into the next procedure or busy office session might blunt the frustration born of time constraints and excessive documentation demands piling up on surgical practitioners of all stripes.
For example, an attendee raised the issue of humanizing the otherwise sterile EHR with personal patient information, perhaps insights about the interior life of the patient unrelated to the diagnosis. Another attendee addressed the need for surgeons to model compassion as well as their reactions to grief for learners at all levels. The notion of using videos to teach introspection was raised and discussed, as was the technique of "reflective" or free (uninhibited) writing and journaling as methods for probing one’s inner landscape and deeper feelings and emotions.
The panel addressed the paradox all surgeons face: the need to confront with objectivity organic surgical disease in all of its anatomic-pathologic complexity, employ technical skills in a time-compressed stressful operating room, interact with other caregivers involved in employing complex technology, and then step away from the operative field and become transformed into a compassionate physician. It is fitting that surgeons understand that draping a patient is both a requirement of sterile technique as well as a metaphorical "hiding of the humanity on the table" in order to shift gears and become engrossed "in the moment," to become focused on the mechanical tasks of cure and not distracted by emotional issues.
What challenges the surgeon in ways he or she may not have anticipated is the act of undraping a wounded human who now needs the surgeon’s empathetic attention as the blood stops flowing. Only self-reflection and a consideration of the profound challenges of these diametrically opposed sides of the surgical personality will sustain surgeons through endless daily lists of complex operations and their associated political, cultural, and psychological burdens. And when cure is no longer possible, confrontation with the patient’s imminent demise too often echoes the confrontation between the surgeon and his or her self-image of invincibility.
Also discussed were two recent changes in the matrix of modern surgical practice that were thought to positively shift the traditional image of surgeons as action hero with relative insensitivity to their patients’ suffering. These features include the minimally invasive surgery revolution which transformed the surgeon from blood-splattered aggressor to a delicate-handed laparoscopic wizard capable of heretofore unseen indirect motor skills maneuvers, a quiet ectomorphic individual rather than the traditional mesomorphic "linebacker" persona. The second change is the rise of women in surgery. Once derided, discouraged, and humiliated at every turn, women are now a valued cohort of colleagues whose innate caregiving skills are matched by an admirable and unflinching work ethic. Introspection seems more natural for women, something the macho surgical male ought to learn from.
Finally, introspection was seen to be somewhat like the "second effect" in opioid administration (hastening death is justifiable if the intent is to reduce suffering, not to cause death). Because although the intent of introspection is ultimately to improve the care of our patients, an unforeseen consequence of introspection may center on the arrival of profound insight into the meaning of the surgeon’s own life.
The potential role of artistic expression by surgeons such as painting or creative writing was entertained and will be further explored in a similar format at next year’s ACS meeting in San Francisco.
Dr. Page is professor of surgery at Tufts University School of Medicine, Boston, and director of Undergraduate Programs in the department of surgery, Baystate Medical Center, Springfield, Mass.
Inhibitor attacks PEL in vitro and in vivo
Credit: Aaron Logan
A small molecule targeting sphingosine kinase (SPHK) demonstrates considerable activity against virus-associated lymphoma, according to preclinical research published in Molecular Cancer Therapeutics.
The research focused on primary effusion lymphoma (PEL), a variant of diffuse large B-cell lymphoma etiologically linked to Kaposi’s sarcoma-associated herpesvirus (KSHV).
Investigators found that SPHK generates biologically active sphingolipids that keep PEL cells alive.
“It is still early in our understanding of how these special lipids contribute to viral cancers, but this is a major potential advance,” said senior study author Christopher Parsons, MD, of Louisiana State University Health Sciences Center in New Orleans.
“There are no therapies available to fight viral tumors by selectively blocking these pathways, all while not harming normal, uninfected cells.”
So the researchers decided to test ABC294640, a novel small molecule that selectively targets SPHK, in cells from PEL patients and mouse models of PEL.
ABC294640 induced dose-dependent apoptosis in a number of KSHV+ PEL cell lines: KSHV+/EBV- BCBL-1 cells, KSHV+/EBV+ BC-1 cells, KSHV+/EBV- BC-3 cells, and KSHV+/EBV- BCP-1 cells. But the drug showed little to no activity in KSHV-/EBV- BL-41 cells.
Further analyses revealed that ABC294640 induces apoptosis through suppression of KSHV-associated signal transduction.
The investigators observed dose-dependent suppression of ERK, Akt, and NF-kB p65 phosphorylation, as well as cleavage of caspase-3 and caspase-9, in BCBL-1 cells exposed to the drug. But the same effects did not occur in drug-resistant BL-41 cells.
Overexpression of either ERK or p65 in BCBL-1 cells partially suppressed apoptosis induced by ABC294640. And when the researchers used RNAi to target SPHK2, PEL cells exhibited reduced activation of ERK, Akt, and p65 phosphorylation, as well as a 5- to 6-fold increase in apoptosis.
Additionally, the team found that ABC294640 suppressed PEL progression and induced regression of PEL tumors in vivo.
The investigators injected BCL-1 cells into NOD/SCID mice and observed PEL expansion within 3 to 4 weeks. However, when they administered ABC294640 within 24 hours of PEL cell injections, they observed significant reductions in tumor expansion.
The researchers also evaluated ABC294640 activity after PEL tumors had been established. And treated mice showed significant tumor regression compared to untreated mice.
The investigators said these results suggest ABC294640 should be evaluated in clinical trials of KSHV-associated lymphoma.
“Our research thus far indicates that this molecule is safe, with the potential to stand alone as a single, orally administered drug,” Dr Parsons said. ![]()
Group discovers how drugs fight APL

Credit: The Armed Forces
Institute of Pathology
Results of a new study appear to explain how retinoic acid and arsenic trioxide work against acute promyelocytic leukemia (APL).
Researchers found that retinoic acid, either alone or in combination with arsenic trioxide, causes a cascade of molecular events that lead to cellular senescence.
And this halts APL-initiating activity in patient samples and mouse models of the disease.
The team said this mechanism could be activated to fight malignancies other than APL as well.
Hugues de Thé, MD, PhD, of Université Paris Diderot in France, and his colleagues described this research in Nature Medicine.
The group knew that APL is driven by the promyelocytic leukemia-retinoic acid receptor fusion protein (PML-RARA), which interferes with nuclear receptor signaling and PML nuclear body assembly.
Furthermore, APL can be cured by retinoic acid and arsenic trioxide (alone or in combination), both of which trigger PML-RARA degradation through non-overlapping pathways.
However, exactly how these treatments work in APL has been unclear. Dr de Thé’s research indicates that both drugs incite a cascade of events leading to senescence.
The researchers found evidence suggesting that a functional PML-transformation-related protein 53 (Trp53) axis is required to halt APL-initiating activity.
When retinoic acid induces PML-RARA degradation, normal PML elicits nuclear body reformation and prompts a Trp53 response that exhibits features of senescence. And this halts APL-initiating activity.
In addition, normal PML seems to play a role in the synergy between retinoic acid and arsenic trioxide. The researchers discovered that arsenic increases retinoic acid-induced PML-RARA degradation.
But arsenic also appears to cooperate with retinoic acid to cure APL by binding PML, accelerating nuclear body reformation, and enhancing downstream TP53 signaling.
The researchers said it seems likely that the same PML/p53 pathway can be activated in cancers other than PML as well. ![]()
Compound active against a range of cancers
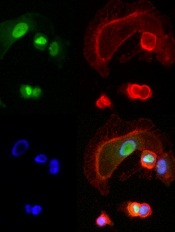
expressing NFAT3c-GFP
A little-studied chemical compound has “wide and potent” anticancer activity, investigators have reported in Cancer Cell.
The compound, BMH-21, works by inhibiting the RNA polymerase transcription pathway (Pol I), thereby preventing cancer cell communication and replication.
“Without this transcription machinery, cancer cells cannot function,” said study author Marikki Laiho, MD, PhD, of the Johns Hopkins University School of Medicine in Baltimore, Maryland.
She and her colleagues homed in on BMH-21 by screening a library of chemical compounds thought to have potential for anticancer activity.
Specifically, the team looked at the compounds’ ability to interfere with transcription in the National Cancer Institute’s collection of 60 human tumor cell lines (known as NCI-60).
BMH-21 demonstrated activity against all 9 cancer types studied—leukemia and melanoma, as well as breast, CNS, colon, lung, ovarian, prostate, and renal cancers.
The drug also repressed tumor growth in mouse models of colon cancer and melanoma.
Additional analyses showed that BMH-21 inhibited Pol I transcription and caused disintegration of the nucleolus. The drug activated loss of the Pol I catalytic subunit RPA194, which led to disassembly of the Pol I holocomplex from the ribosomal DNA.
And the loss of RPA194, which was a result of increased proteasome-mediated turnover, was associated with decreased cancer cell viability.
Dr Laiho and her colleagues are continuing studies of BMH-21 in animal models to confirm the drug’s anticancer activity, identify any toxicities associated with the compound, and determine the optimal dose.
And because Pol I activity is frequently deregulated in cancers, the investigators believe BMH-21 could have therapeutic potential for many malignancies.
Dr Laiho is currently collaborating with experts in multiple myeloma, medullary thyroid cancer, and prostate cancer to explore the drug’s activity in these malignancies. ![]()
E coli has applications for malaria vaccine

Credit: USDA
E coli bacteria may enable inexpensive production of a transmission-blocking malaria vaccine, according to a paper published in Infection and Immunity.
Scientists used E coli to create a new process to purify and refold codon harmonized recombinant Pfs25 (CHrPfs25).
Pfs25 is a sexual-stage antigen of Plasmodium falciparum expressed on the surface of zygote and ookinete forms of the parasite.
Research has shown that monoclonal antibodies directed against native Pfs25 can prevent development of P falciparum oocysts in the midgut of the mosquito.
So Pfs25 is a potential vaccine candidate, but producing it has proven challenging and costly.
“Malaria affects the poorest of the poor,” said study author Nirbhay Kumar, PhD, of Tulane University School of Public Health and Tropical Medicine in New Orleans, Louisiana.
“And if you are trying to make a vaccine for those billions of people who are at risk, you need to make it cheaper to manufacture. We think that producing this protein in bacteria will make it very cost-effective for large-scale vaccine production.”
To create the vaccine for the current study, Dr Kumar and his colleagues expressed CHrPfs25 in E coli, purified the protein after simple oxidative refolding steps, and formulated it in several adjuvants.
The team then tested the final product in mice. Antibodies present after vaccination recognized native Pfs25 on the surface of live gametes of P falciparum and demonstrated complete malaria transmission-blocking activity.
The transmission-blocking efficacy of CHrPfs25 was 100% whether the researchers were testing Anopheles gambiae mosquitoes or Anopheles stephensi mosquitoes.
Dr Kumar said the next step for this research will be to develop a version of the vaccine that can be used in clinical trials.
Transmission-blocking vaccines, though not yet widely tested in humans, have the potential to be used in conjunction with more traditional malaria vaccines and other interventions—such as malaria drugs and bed nets—to fight the disease and ultimately aid in the gradual elimination of malaria parasites. ![]()
Burnout and Work‐Life Balance
An increasingly robust body of literature has identified burnout as a substantial problem for physicians across specialties and practice settings.[1, 2, 3, 4] Burnout, a work‐related condition characterized by emotional exhaustion, depersonalization, and lack of a sense of personal accomplishment,[5] has been tied to negative consequences for patients, physicians, and the medical profession including medical errors,[6] poor physician health,[7, 8] and decreased professionalism.[9] Studies of burnout among general internists have pointed to time pressures, lack of work control, and difficult patient encounters as possible contributors.[10, 11]
Burnout has been demonstrated to affect a sizable proportion of hospitalists, with prevalence estimates from prior studies varying from 12.9% to 27.2%, although nearly all studies of US hospitalists have relied on single‐item instruments.[12, 13, 14, 15] Hospital‐based physicians have represented a rapidly expanding segment of the internist workforce for more than a decade,[14] but studies of the impact of inpatient vs outpatient practice location on burnout and career satisfaction are limited. A meta‐analysis of the impact of practice location on burnout relied almost exclusively on noncomparative studies from outside the United States.[15] A recent study of US physician burnout and satisfaction with work‐life balance showed that general internists expressed below average satisfaction with work‐life balance and had the second highest rate of burnout among 24 specialties.[4] However, this report did not differentiate between general internists working in inpatient vs outpatient settings.
We therefore examined burnout, satisfaction with work‐life balance, and other aspects of well‐being among internal medicine hospitalists relative to outpatient general internists, using a national sample developed in partnership with the American Medical Association.
METHODS
Physician Sample
As described previously,[4] the American Medical Association Physician Masterfile, a nearly complete record of US physicians, was used to generate a sample of physicians inclusive of all specialty disciplines. The 27,276 physicians who opened at least 1 invitation e‐mail were considered to have received the invitation to participate in the study. Participation was voluntary, and all responses were anonymous. For this analysis, internal medicine hospitalists were compared with general internists reporting primarily outpatient practices. The physician sample provided information on demographics (age, sex, and relationship status) and on characteristics of their practice. Burnout, symptoms of depression, suicidal ideation in the past 12 months, quality of life (QOL), satisfaction with work‐life balance, and certain health behaviors were evaluated as detailed below.
Burnout
Burnout among physicians was measured using the Maslach Burnout Inventory (MBI), a validated 22‐item questionnaire considered the gold standard tool for measuring burnout.[5, 16] The MBI has subscales to evaluate each domain of burnout: emotional exhaustion, depersonalization, and low personal accomplishment. Because other burnout studies have focused on the presence of high levels of emotional exhaustion or depersonalization as the foundation of burnout in physicians,[17, 18, 19] we considered physicians with a high score on the depersonalization or emotional exhaustion subscales to have at least 1 manifestation of professional burnout.
Symptoms of Depression and Suicidal Ideation
Symptoms of depression were assessed using the 2‐item Primary Care Evaluation of Mental Disorders,[20] a standardized and validated assessment for depression screening that performs as well as longer instruments.[21] Recent suicidal ideation was evaluated by asking participants, During the past 12 months, have you had thoughts of taking your own life? This item was designed to measure somewhat recent, but not necessarily active, suicidal ideation. These questions have been used extensively in other studies.[22, 23, 24, 25]
Quality of Life and Fatigue
Overall QOL and mental, physical, and emotional QOL were measured by a single‐item linear analog scale assessment. This instrument measured QOL on a 0 (as bad as it can be) to 10 (as good as it can be) scale validated across a wide range of medical conditions and populations.[26, 27, 28] Fatigue was measured using a similar standardized linear analog scale assessment question, for which respondents indicated their level of fatigue during the past week.[29] The impact of fatigue on daily activities such as driving was also evaluated.
Satisfaction With Work‐Life Balance and Career Plans
Satisfaction with work‐life balance was assessed by the item, My work schedule leaves me enough time for my personal/family life, with response options strongly agree, agree, neutral, disagree, or strongly disagree. Individuals who indicated strongly agree or agree were considered to be satisfied with their work‐life balance, whereas those who indicated strongly disagree or disagree were considered to be dissatisfied with their work‐life balance. Experience of work‐home conflicts was assessed as in prior research.[4] Participants were also asked about plans to change jobs or careers.
Health Behaviors
A limited set of health and wellness behaviors was addressed in the survey to provide insight into other aspects of physician well‐being. These included whether respondents had a primary care provider and questions concerning routine screening and alcohol and substance use. Alcohol use was assessed using the Alcohol Use Disorders Identification Test, version C (AUDIT‐C).[30] An AUDIT‐C score of at least 4 for men and at least 3 for women indicates alcohol misuse, and a score of at least 5 for men and at least 4 for women indicates alcohol abuse and possible dependence.[30]
Statistical Analysis
Standard descriptive summary statistics were used to characterize the physician samples. Associations between variables were evaluated using the Kruskal‐Wallis test (for continuous variables) or [2] test (for categorical variables). All tests were 2‐sided, with a type I error level of 0.05. Multivariate analysis of differences between hospitalists and outpatient general internists was performed using multiple linear or logistic regression for continuous or categorical data, respectively. Covariates in these models included age, sex, weekly work hours, and practice setting. All of the analyses were performed using SAS version 9.2 (SAS Institute, Inc., Cary, NC).
RESULTS
In the full survey across all specialties, 7288 physicians (26.7%) provided survey responses.[4] There were 448 outpatient internists and 130 internal medicine hospitalists who agreed to participate. Demographically, hospitalists were younger, worked longer hours, and were less likely to work in private practice than outpatient general internists (Table 1).
| Characteristic | Hospitalists (n=130) | Outpatient General Internists (n=448) | P |
|---|---|---|---|
| |||
| Sex, n (%) | 0.56 | ||
| Male | 86 (66.2%) | 284 (63.4%) | |
| Female | 44 (33.8%) | 164 (36.6%) | |
| Age, mean (SD) | 46.9 (12.4) | 53.6 (10.2) | <0.001 |
| Median | 45.0 | 55.0 | |
| Years in practice, mean (SD) | 14.0 (12.0) | 21.6 (10.7) | <0.001 |
| Median | 10.0 | 22.0 | |
| Hours worked per week, mean (SD) | 55.0 (18.1) | 50.0 (15.1) | 0.04 |
| Median | 50.0 | 50.0 | |
| Practice setting, n (%) | <0.001 | ||
| Private practice/hospital | 36 (31.0%) | 303 (69.2%) | |
| Academic medical center | 37 (31.9%) | 41 (9.4%) | |
| Other (including veterans hospital and active military practice) | 43 (37.1%) | 94 (21.5%) | |
Distress and Well‐Being Variables
High levels of emotional exhaustion affected 43.8% of hospitalists and 48.1% of outpatient general internists (odds ratio [OR]: 0.91, 95% confidence interval [CI]: 0.56‐1.48), and high levels of depersonalization affected 42.3% of hospitalists and 32.7% of outpatient general internists (OR: 1.42, 95% CI: 0.86‐2.35). Overall burnout affected 52.3% of hospitalists and 54.5% of outpatient general internists (OR: 0.96, 95% CI: 0.58‐1.57). None of these factors differed statistically in multivariate models adjusted for factors known to be associated with burnout, including sex, age, weekly work hours, and practice setting (P=0.71, 0.17, and 0.86, respectively; Table 2). However, low levels of personal accomplishment were reported by 20.3% of hospitalists and 9.6% of outpatient general internists (OR: 1.93, 95% CI: 1.023.65, P=0.04).
| Variable | Hospitalists (n=130) | Outpatient General Internists (n=448) | Pa |
|---|---|---|---|
| |||
| Burnout | |||
| Emotional exhaustion high (27) | 57/130 (43.8%) | 215/447 (48.1%) | 0.71 |
| Mean (SD) | 24.7 (12.5) | 25.4 (14.0) | |
| Median | 24.9 | 26.0 | |
| Depersonalization high (10) | 55/130 (42.3%) | 146/447 (32.7%) | 0.17 |
| Mean (SD) | 9.1 (6.9) | 7.5 (6.3) | |
| Median | 7.0 | 6.0 | |
| Personal accomplishment low (33) | 26/128 (20.3%) | 43/446 (9.6%) | 0.04 |
| Mean (SD) | 39.0 (7.6) | 41.4 (6.0) | |
| Median | 41.0 | 43.0 | |
| High burnout (EE27 or DP10) | 68/130 (52.3%) | 244/448 (54.5%) | 0.86 |
| Depression | |||
| Depression screen + | 52/129 (40.3%) | 176/440 (40.0%) | 0.73 |
| Suicidal thoughts in past 12 months | 12/130 (9.2%) | 26/445 (5.8%) | 0.15 |
| Quality of life | |||
| Overall mean (SD) | 7.3 (2.0) | 7.4 (1.8) | 0.85 |
| Median | 8.0 | 8.0 | |
| Low (<6) | 21/130 (16.2%) | 73/448 (16.3%) | |
| Mental mean (SD) | 7.2 (2.1) | 7.3 (2.0) | 0.89 |
| Median | 8.0 | 8.0 | |
| Low (<6) | 23/130 (17.7%) | 92/448 (20.5%) | |
| Physical mean (SD) | 6.7 (2.3) | 6.9 (2.1) | 0.45 |
| Median | 7.0 | 7.0 | |
| Low (<6) | 35/130 (26.9%) | 106/448 (23.7%) | |
| Emotional mean (SD) | 7.0 (2.3) | 6.9 (2.2) | 0.37 |
| Median | 7.0 | 7.0 | |
| Low (<6) | 30/130 (23.1%) | 114/448 (25.4%) | |
| Fatigue | |||
| Mean (SD) | 5.8 (2.4) | 5.9 (2.4) | 0.57 |
| Median | 6.0 | 6.0 | |
| Fallen asleep while driving (among regular drivers only) | 11/126 (8.7%) | 19/438 (4.3%) | 0.23 |
Approximately 40% of physicians in both groups screened positive for depression (OR: 0.92, 95% CI: 0.56‐1.51, P=0.73). In addition, 9.2% of hospitalists reported suicidal ideation in the last 12 months compared to 5.8% of outpatient internists (OR: 1.86, 95% CI: 0.80‐4.33, P=0.15) (Table 2).
Overall QOL and QOL in mental, physical, and emotional domains were nearly identical in the 2 groups (Table 2). Fatigue was also similar for hospitalists and outpatient general internists, and 8.5% of hospitalists reported falling asleep in traffic while driving compared to 4.2% of outpatient internists (OR: 1.76, 95% CI: 0.70‐4.44, P=0.23).
Work‐Life Balance and Career Variables
Experience of recent work‐home conflicts was similar for hospitalists and outpatient general internists (Table 3). However, hospitalists were more likely to agree or strongly agree that their work schedule leaves enough time for their personal life and family (50.0% vs 42.0%, OR: 2.06, 95% CI: 1.22‐3.47, P=0.007).
| Variable | Hospitalists (n=130) | Outpatient General Internists (n=448) | Pa |
|---|---|---|---|
| |||
| Work‐home conflict in last 3 weeks | 62/128 (48.4%) | 183/443 (41.3%) | 0.64 |
| Work‐home conflict resolved in favor of: | 0.79 | ||
| Work | 37/118 (31.4%) | 131/405 (32.2%) | |
| Home | 15/118 (12.7%) | 43/405 (10.6%) | |
| Meeting both needs | 66/118 (55.9%) | 231/405 (57.0%) | |
| Work schedule leaves enough time for personal life/family | 0.007 | ||
| Strongly agree | 20 (15.4%) | 70 (15.7%) | |
| Agree | 45 (34.6%) | 117 (26.3%) | |
| Neutral | 21 (16.2%) | 66 (14.8%) | |
| Disagree | 27 (20.8%) | 119 (26.7%) | |
| Strongly disagree | 17 (13.1%) | 73 (16.4%) | |
| Missing | 0 | 3 | |
| Likelihood of leaving current practice | 0.002 | ||
| Definite | 17 (13.1%) | 34 (7.6%) | |
| Likely | 21 (16.2%) | 53 (11.9%) | |
| Moderate | 21 (16.2%) | 67 (15.0%) | |
| Slight | 38 (29.2%) | 128 (28.7%) | |
| None | 33 (25.4%) | 164 (36.8%) | |
| Missing | 0 | 2 | |
| Would choose to become physician again | 81/130 (62.3%) | 306/441 (69.4%) | 0.86 |
Hospitalists were more likely to express interest in leaving their current practice in the next 2 years, with 13.1% vs 7.6% reporting definite plans to leave and 29.2% vs 19.5% reporting at least likely plans to leave (OR: 2.31, 95% CI: 1.35‐3.97, P=0.002). Among those reporting a likely or definite plan to leave, hospitalists were more likely to plan to look for a different practice and continue to work as a physician (63.2% vs 39.1%), whereas outpatient general internists were more likely to plan to leave medical practice (51.9% vs 22.0%, P=0.004). Hospitalists with plans to reduce their work hours were more likely than their outpatient colleagues to express an interest in administrative and leadership roles (19.4% vs 12.1%) or research and educational roles (9.7% vs 4.0%, P=0.05).
Health Behavior Variables
Hospitalists were less likely to report having a primary care provider in the adjusted analyses (55.0% vs 70.3%, OR: 0.49, 95% CI: 0.29‐0.83, P=0.008). Use of illicit substances was uncommon in both groups (94.6% of hospitalists and 96.0% of outpatient general internists reported never using an illicit substance (OR: 0.87, 95% CI: 0.31‐2.49, P=0.80). Symptoms of alcohol abuse were similar between the 2 groups (11.7% and 13.3%, respectively, OR: 0.64, 95% CI: 0.30‐1.35, P=0.24), but symptoms of alcohol misuse were more common among outpatient general internists (34.2% vs 21.9%, OR: 1.75, 95% CI: 1.013.03, P=0.047).
DISCUSSION
The primary result of this national study applying well‐validated metrics is that the overall rates of burnout among hospitalists and outpatient general internal medicine physicians were similar, as were rates of positive depression screening and QOL. Although these groups did not differ, the absolute rates of distress found in this study were high. Prior research has suggested that possible explanations for these high rates of distress include excessive workload, loss of work‐associated control and meaning, and difficulties with work‐home balance.[4] The present study, in the context of prior work showing that general internists have higher rates of burnout than almost any other specialty, suggests that the front‐line nature of the work of both hospitalists and outpatient general internists may exacerbate these previously cited factors. These results suggest that efforts to address physician well‐being are critically needed for both inpatient and outpatient physicians.
Despite the noted similarities, differences between hospitalists and outpatient general internists in certain aspects of well‐being merit further attention. For example, the lower rate of personal accomplishment among hospitalists relative to outpatient generalists is consistent with prior evidence.[15] The reasons for this difference are unknown, but the relative youth and inexperience of the hospitalists may be a factor. US hospitalists have been noted to feel like glorified residents in at least 1 report,[31] a factor that might also negatively impact personal accomplishment.
It is also worthwhile to place the burnout results for both groups in context with prior studies. Although we found high rates of burnout among outpatient physicians, our outpatient sample's mean MBI subset scores are not higher than previous samples of American[32] and Canadian[33] outpatient physicians, suggesting that this finding is neither new nor artifactual. Placing the hospitalist sample in perspective is more difficult, as very few studies have administered the MBI to US hospitalists, and those that have either administered 1 component only to an exclusive academic sample[34] or administered it to a small mixture of hospitalists and intensivists.[35] The prevalence of burnout we report for our hospitalist sample is higher than that reported by studies that utilized single‐item survey items1214; it is likely that the higher prevalence we report relates more to a more detailed assessment of the components of burnout than to a temporal trend, although this cannot be determined definitively from the data available.
The finding that 9.2% of hospitalists and 5.8% of outpatient general internists reported suicidal thoughts in the past 12 months is alarming, though consistent with prior data on US surgeons.[35] Although the higher rate of suicidal thoughts among hospitalists was not statistically significant, a better understanding of the factors associated with physician suicidality should be the focus of additional research.
Hospitalists were more likely than outpatient internists to report plans to leave their current practice in this study, although their plans after leaving differed. The fact that they were more likely to report plans to find a different role in medicine (rather than to leave medicine entirely or retire) is likely a function of age and career stage. The finding that hospitalists with an interest in changing jobs were more likely than their outpatient colleagues to consider administrative, leadership, education, and research roles may partially reflect the greater number of hospitalists at academic medical centers in this study, but suggests that hospitalists may indeed benefit from the availability of opportunities that have been touted as part of hospitalist diastole.[36]
Finally, rates of alcohol misuse and abuse found in this study were consistent with those reported in prior studies.[37, 38, 39] These rates support ongoing efforts to address alcohol‐related issues among physicians. In addition, the proportion of outpatient general internists and hospitalists reporting having a primary care provider was similar to that seen in prior research.[40] The fact that 1 in 3 physicians in this study did not have a primary care provider suggests there is great room for improvement in access to and prioritization of healthcare for physicians in general. However, it is noteworthy that hospitalists were less likely than outpatient general internists to have a primary care provider even after adjusting for their younger age as a group. The reasons behind this discrepancy are unclear but worthy of further investigation.
Several limitations of our study should be considered. The response rate for the entire study sample was 26.7%, which is similar to other US national physician surveys in this topic area.[41, 42, 43] Demographic comparisons with national data suggest the respondents were reasonably representative of physicians nationally,[4] and all analyses were adjusted for recognized demographic factors affecting our outcomes of interest. We found no statistically significant differences in demographics of early responders compared with late responders (a standard approach to evaluate for response bias),[14, 31] further supporting that responders were representative of US physicians. Despite this, response bias remains possible. For example, it is unclear if burned out physicians might be more likely to respond (eg, due to the personal relevance of the survey topic) or less likely to respond (eg, due to being too overwhelmed to open or complete the survey).
A related limitation is the relatively small number of hospitalists included in this sample, which limits the power of the study to detect differences between the study groups. The hospitalists in this study were also relatively experienced, with a median of 10 years in practice, although the overall demographics match closely to a recent national survey of hospitalists. Although age was considered in the analyses, this study may not fully characterize burnout patterns among very junior or very senior hospitalists. In addition, although analyses were adjusted for observed differences between the study groups for a number of covariates, there may be differences between the study groups in other, unmeasured factors that could act as confounders of the observed results. For example, the allocation of each individual's time to different activities (eg, clinical, research, education, administration), workplace flexibility and control, and meaning may all contribute to distress and well‐being, and could not be assessed in this study.
In conclusion, the degree of burnout, depression, and suicidal ideation in both hospitalists and outpatient general internists is similar and substantial. Urgent attention directed at better understanding the causes of distress and identifying solutions for all internists is needed.
Acknowledgements
The authors acknowledge the role of the American Medical Association in completing this study.
Disclosures: The views expressed in this article are those of the authors and do not represent the views of, and should not be attributed to, the American Medical Association. The authors report no conflicts of interest.
- , , , , , . Stress symptoms, burnout and suicidal thoughts in Finnish physicians. Soc Psychiatry Psychiatr Epidemiol. 1990;25:81–86.
- , , , , , ; Society of General Internal Medicine (SGIM) Career Satisfaction Study Group (CSSG). Predicting and preventing physician burnout: results from the United States and the Netherlands. Am J Med. 2001;111:170–175.
- , , , et al. Burnout among psychiatrists in Milan: a multicenter study. Psychiatr Serv. 2009;60:985–988.
- , , , et al. Burnout and satisfaction with work‐life balance among US physicians relative to the general US population. Arch Intern Med. 2012;172:1377–1385.
- , . The measurement of experienced burnout. J Occup Behav. 1981;2:99–113.
- , , , et al. Burnout and medical errors among American surgeons. Ann Surg. 2010;251:995–1000.
- , , . Physician wellness: a missing quality indicator. Lancet. 2009;374:1714–1721.
- , , , , . Changes in mental health of UK hospital consultants since the mid‐1990s. Lancet. 2005;366:742–744.
- , , , et al. Relationship between burnout and professional conduct and attitudes among US medical students. JAMA. 2010;304:1173–1180.
- , , , et al.; MEMO (Minimizing Error, Maximizing Outcomes) Investigators. Working conditions in primary care: physician reactions and care quality. Ann Intern Med. 2009;151:28–36.
- , , , , , ; MEMO Investigators. Burden of difficult encounters in primary care: data from the Minimizing Error, Maximizing Outcomes study. Arch Intern Med. 2009;169:410–414.
- , , , , . Characteristics and work experiences of hospitalists in the United States. Arch Intern Med. 2001;161(6):851–858.
- , , , , , . Career satisfaction and burnout in academic hospital medicine. Arch Intern Med. 2011;25:171(8):782–785.
- , , , , ; Society of Hospital Medicine Career Satisfaction Task Force. Job characteristics, satisfaction, and burnout across hospitalist practice models. J Hosp Med. 2012;7:402–410.
- , , , , . Burnout in inpatient‐based vs outpatient‐based physicians: a systematic review and meta‐analysis. J Hosp Med. 2013;8:653–664.
- , , . Maslach Burnout Inventory Manual. 3rd ed. Palo Alto, CA: Consulting Psychologists Press; 1996.
- . Resident burnout. JAMA. 2004;292(23):2880–2889.
- , , , . Burnout and self‐reported patient care in an internal medicine residency program. Ann Intern Med. 2002;136:358–367.
- , , , . Evolution of sleep quantity, sleep deprivation, mood disturbances, empathy, and burnout among interns. Acad Med. 2006;81:82–85.
- , , , et al. Utility of a new procedure for diagnosing mental disorders in primary care: the PRIME‐MD 1000 study. JAMA. 1994;272:1749–1756.
- , , , . Case‐finding instruments for depression: two questions are as good as many. J Gen Intern Med. 1997;12:439–445.
- , , , . Attempted suicide among young adults: progress toward a meaningful estimate of prevalence. Am J Psychiatry. 1992;149:41–44.
- , , . Prevalence of and risk factors for lifetime suicide attempts in the National Comorbidity Survey. Arch Gen Psychiatry. 1999;56:617–626.
- , , , , . Trends in suicide ideation, plans, gestures, and attempts in the United States, 1990–1992 to 2001–2003. JAMA. 2005;293:2487–2495.
- , , . Identifying suicidal ideation in general medical patients. JAMA. 1994;272:1757–1762.
- , , , . Health state valuations from the general public using the visual analogue scale. Qual Life Res. 1996;5:521–531.
- , , , et al. The well‐being and personal wellness promotion strategies of medical oncologists in the North Central Cancer Treatment Group. Oncology. 2005;68:23–32.
- , , , et al. Impacting quality of life for patients with advanced cancer with a structured multidisciplinary intervention: a randomized controlled trial. J Clin Oncol. 2006;24:635–642.
- , , , , . Association of resident fatigue and distress with perceived medical errors. JAMA. 2009;302:294–300.
- , , , , . The AUDIT alcohol consumption questions (AUDIT‐C): an effective brief screening test for problem drinking. Arch Intern Med. 1998;158:1789–1795.
- , , , , . Worklife and satisfaction of hospitalists: toward flourishing careers. J Gen Intern Med. 2012;27(1):28–36.
- , , , et al. Association of an educational program in mindful communication with burnout, empathy, and attitudes among primary care physicians. JAMA. 2009;302(12):1284–1293.
- , , . Stress, burnout, and strategies for reducing them: what's the situation among Canadian family physicians? Can Fam Physician. 2008;54(2):234–235.
- , , , et al. Emotional exhaustion, life stress, and perceived control among medicine ward attending physicians: a randomized trial of 2‐ versus 4‐week ward rotations [abstract]. J Hosp Med. 2011;6(4 suppl 2):S43–S44.
- , , , et al. Special report: suicidal ideation among American surgeons. Arch Surg. 2011;146:54–62.
- , , , . Preparing for “diastole”: advanced training opportunities for academic hospitalists. J Hosp Med. 2006;1:368–377.
- , , , et al. Prevalence of substance use among US physicians. JAMA. 1992;267:2333–2339.
- , , , , . Preventive, lifestyle, and personal health behaviors among physicians. Acad Psychiatry. 2009;33:289–295.
- , , , et al. Prevalence of alcohol use disorders among American surgeons. Arch Surg. 2012;147:168–174.
- , , , . Physician, heal thyself? Regular source of care and use of preventive health services among physicians. Arch Intern Med. 2000;160:3209–3214.
- , , . Prevalence of burnout in the U.S. oncologic community: results of a 2003 survey. J Oncol Pract. 2005;1(4):140–147.
- , , , et al. Career satisfaction, practice patterns and burnout among surgical oncologists: report on the quality of life of members of the Society of Surgical Oncology. Ann Surg Oncol. 2007;14:3042–3053.
- , , , et al. Burnout and career satisfaction among American surgeons. Ann Surg. 2009;250(3):463–471.
An increasingly robust body of literature has identified burnout as a substantial problem for physicians across specialties and practice settings.[1, 2, 3, 4] Burnout, a work‐related condition characterized by emotional exhaustion, depersonalization, and lack of a sense of personal accomplishment,[5] has been tied to negative consequences for patients, physicians, and the medical profession including medical errors,[6] poor physician health,[7, 8] and decreased professionalism.[9] Studies of burnout among general internists have pointed to time pressures, lack of work control, and difficult patient encounters as possible contributors.[10, 11]
Burnout has been demonstrated to affect a sizable proportion of hospitalists, with prevalence estimates from prior studies varying from 12.9% to 27.2%, although nearly all studies of US hospitalists have relied on single‐item instruments.[12, 13, 14, 15] Hospital‐based physicians have represented a rapidly expanding segment of the internist workforce for more than a decade,[14] but studies of the impact of inpatient vs outpatient practice location on burnout and career satisfaction are limited. A meta‐analysis of the impact of practice location on burnout relied almost exclusively on noncomparative studies from outside the United States.[15] A recent study of US physician burnout and satisfaction with work‐life balance showed that general internists expressed below average satisfaction with work‐life balance and had the second highest rate of burnout among 24 specialties.[4] However, this report did not differentiate between general internists working in inpatient vs outpatient settings.
We therefore examined burnout, satisfaction with work‐life balance, and other aspects of well‐being among internal medicine hospitalists relative to outpatient general internists, using a national sample developed in partnership with the American Medical Association.
METHODS
Physician Sample
As described previously,[4] the American Medical Association Physician Masterfile, a nearly complete record of US physicians, was used to generate a sample of physicians inclusive of all specialty disciplines. The 27,276 physicians who opened at least 1 invitation e‐mail were considered to have received the invitation to participate in the study. Participation was voluntary, and all responses were anonymous. For this analysis, internal medicine hospitalists were compared with general internists reporting primarily outpatient practices. The physician sample provided information on demographics (age, sex, and relationship status) and on characteristics of their practice. Burnout, symptoms of depression, suicidal ideation in the past 12 months, quality of life (QOL), satisfaction with work‐life balance, and certain health behaviors were evaluated as detailed below.
Burnout
Burnout among physicians was measured using the Maslach Burnout Inventory (MBI), a validated 22‐item questionnaire considered the gold standard tool for measuring burnout.[5, 16] The MBI has subscales to evaluate each domain of burnout: emotional exhaustion, depersonalization, and low personal accomplishment. Because other burnout studies have focused on the presence of high levels of emotional exhaustion or depersonalization as the foundation of burnout in physicians,[17, 18, 19] we considered physicians with a high score on the depersonalization or emotional exhaustion subscales to have at least 1 manifestation of professional burnout.
Symptoms of Depression and Suicidal Ideation
Symptoms of depression were assessed using the 2‐item Primary Care Evaluation of Mental Disorders,[20] a standardized and validated assessment for depression screening that performs as well as longer instruments.[21] Recent suicidal ideation was evaluated by asking participants, During the past 12 months, have you had thoughts of taking your own life? This item was designed to measure somewhat recent, but not necessarily active, suicidal ideation. These questions have been used extensively in other studies.[22, 23, 24, 25]
Quality of Life and Fatigue
Overall QOL and mental, physical, and emotional QOL were measured by a single‐item linear analog scale assessment. This instrument measured QOL on a 0 (as bad as it can be) to 10 (as good as it can be) scale validated across a wide range of medical conditions and populations.[26, 27, 28] Fatigue was measured using a similar standardized linear analog scale assessment question, for which respondents indicated their level of fatigue during the past week.[29] The impact of fatigue on daily activities such as driving was also evaluated.
Satisfaction With Work‐Life Balance and Career Plans
Satisfaction with work‐life balance was assessed by the item, My work schedule leaves me enough time for my personal/family life, with response options strongly agree, agree, neutral, disagree, or strongly disagree. Individuals who indicated strongly agree or agree were considered to be satisfied with their work‐life balance, whereas those who indicated strongly disagree or disagree were considered to be dissatisfied with their work‐life balance. Experience of work‐home conflicts was assessed as in prior research.[4] Participants were also asked about plans to change jobs or careers.
Health Behaviors
A limited set of health and wellness behaviors was addressed in the survey to provide insight into other aspects of physician well‐being. These included whether respondents had a primary care provider and questions concerning routine screening and alcohol and substance use. Alcohol use was assessed using the Alcohol Use Disorders Identification Test, version C (AUDIT‐C).[30] An AUDIT‐C score of at least 4 for men and at least 3 for women indicates alcohol misuse, and a score of at least 5 for men and at least 4 for women indicates alcohol abuse and possible dependence.[30]
Statistical Analysis
Standard descriptive summary statistics were used to characterize the physician samples. Associations between variables were evaluated using the Kruskal‐Wallis test (for continuous variables) or [2] test (for categorical variables). All tests were 2‐sided, with a type I error level of 0.05. Multivariate analysis of differences between hospitalists and outpatient general internists was performed using multiple linear or logistic regression for continuous or categorical data, respectively. Covariates in these models included age, sex, weekly work hours, and practice setting. All of the analyses were performed using SAS version 9.2 (SAS Institute, Inc., Cary, NC).
RESULTS
In the full survey across all specialties, 7288 physicians (26.7%) provided survey responses.[4] There were 448 outpatient internists and 130 internal medicine hospitalists who agreed to participate. Demographically, hospitalists were younger, worked longer hours, and were less likely to work in private practice than outpatient general internists (Table 1).
| Characteristic | Hospitalists (n=130) | Outpatient General Internists (n=448) | P |
|---|---|---|---|
| |||
| Sex, n (%) | 0.56 | ||
| Male | 86 (66.2%) | 284 (63.4%) | |
| Female | 44 (33.8%) | 164 (36.6%) | |
| Age, mean (SD) | 46.9 (12.4) | 53.6 (10.2) | <0.001 |
| Median | 45.0 | 55.0 | |
| Years in practice, mean (SD) | 14.0 (12.0) | 21.6 (10.7) | <0.001 |
| Median | 10.0 | 22.0 | |
| Hours worked per week, mean (SD) | 55.0 (18.1) | 50.0 (15.1) | 0.04 |
| Median | 50.0 | 50.0 | |
| Practice setting, n (%) | <0.001 | ||
| Private practice/hospital | 36 (31.0%) | 303 (69.2%) | |
| Academic medical center | 37 (31.9%) | 41 (9.4%) | |
| Other (including veterans hospital and active military practice) | 43 (37.1%) | 94 (21.5%) | |
Distress and Well‐Being Variables
High levels of emotional exhaustion affected 43.8% of hospitalists and 48.1% of outpatient general internists (odds ratio [OR]: 0.91, 95% confidence interval [CI]: 0.56‐1.48), and high levels of depersonalization affected 42.3% of hospitalists and 32.7% of outpatient general internists (OR: 1.42, 95% CI: 0.86‐2.35). Overall burnout affected 52.3% of hospitalists and 54.5% of outpatient general internists (OR: 0.96, 95% CI: 0.58‐1.57). None of these factors differed statistically in multivariate models adjusted for factors known to be associated with burnout, including sex, age, weekly work hours, and practice setting (P=0.71, 0.17, and 0.86, respectively; Table 2). However, low levels of personal accomplishment were reported by 20.3% of hospitalists and 9.6% of outpatient general internists (OR: 1.93, 95% CI: 1.023.65, P=0.04).
| Variable | Hospitalists (n=130) | Outpatient General Internists (n=448) | Pa |
|---|---|---|---|
| |||
| Burnout | |||
| Emotional exhaustion high (27) | 57/130 (43.8%) | 215/447 (48.1%) | 0.71 |
| Mean (SD) | 24.7 (12.5) | 25.4 (14.0) | |
| Median | 24.9 | 26.0 | |
| Depersonalization high (10) | 55/130 (42.3%) | 146/447 (32.7%) | 0.17 |
| Mean (SD) | 9.1 (6.9) | 7.5 (6.3) | |
| Median | 7.0 | 6.0 | |
| Personal accomplishment low (33) | 26/128 (20.3%) | 43/446 (9.6%) | 0.04 |
| Mean (SD) | 39.0 (7.6) | 41.4 (6.0) | |
| Median | 41.0 | 43.0 | |
| High burnout (EE27 or DP10) | 68/130 (52.3%) | 244/448 (54.5%) | 0.86 |
| Depression | |||
| Depression screen + | 52/129 (40.3%) | 176/440 (40.0%) | 0.73 |
| Suicidal thoughts in past 12 months | 12/130 (9.2%) | 26/445 (5.8%) | 0.15 |
| Quality of life | |||
| Overall mean (SD) | 7.3 (2.0) | 7.4 (1.8) | 0.85 |
| Median | 8.0 | 8.0 | |
| Low (<6) | 21/130 (16.2%) | 73/448 (16.3%) | |
| Mental mean (SD) | 7.2 (2.1) | 7.3 (2.0) | 0.89 |
| Median | 8.0 | 8.0 | |
| Low (<6) | 23/130 (17.7%) | 92/448 (20.5%) | |
| Physical mean (SD) | 6.7 (2.3) | 6.9 (2.1) | 0.45 |
| Median | 7.0 | 7.0 | |
| Low (<6) | 35/130 (26.9%) | 106/448 (23.7%) | |
| Emotional mean (SD) | 7.0 (2.3) | 6.9 (2.2) | 0.37 |
| Median | 7.0 | 7.0 | |
| Low (<6) | 30/130 (23.1%) | 114/448 (25.4%) | |
| Fatigue | |||
| Mean (SD) | 5.8 (2.4) | 5.9 (2.4) | 0.57 |
| Median | 6.0 | 6.0 | |
| Fallen asleep while driving (among regular drivers only) | 11/126 (8.7%) | 19/438 (4.3%) | 0.23 |
Approximately 40% of physicians in both groups screened positive for depression (OR: 0.92, 95% CI: 0.56‐1.51, P=0.73). In addition, 9.2% of hospitalists reported suicidal ideation in the last 12 months compared to 5.8% of outpatient internists (OR: 1.86, 95% CI: 0.80‐4.33, P=0.15) (Table 2).
Overall QOL and QOL in mental, physical, and emotional domains were nearly identical in the 2 groups (Table 2). Fatigue was also similar for hospitalists and outpatient general internists, and 8.5% of hospitalists reported falling asleep in traffic while driving compared to 4.2% of outpatient internists (OR: 1.76, 95% CI: 0.70‐4.44, P=0.23).
Work‐Life Balance and Career Variables
Experience of recent work‐home conflicts was similar for hospitalists and outpatient general internists (Table 3). However, hospitalists were more likely to agree or strongly agree that their work schedule leaves enough time for their personal life and family (50.0% vs 42.0%, OR: 2.06, 95% CI: 1.22‐3.47, P=0.007).
| Variable | Hospitalists (n=130) | Outpatient General Internists (n=448) | Pa |
|---|---|---|---|
| |||
| Work‐home conflict in last 3 weeks | 62/128 (48.4%) | 183/443 (41.3%) | 0.64 |
| Work‐home conflict resolved in favor of: | 0.79 | ||
| Work | 37/118 (31.4%) | 131/405 (32.2%) | |
| Home | 15/118 (12.7%) | 43/405 (10.6%) | |
| Meeting both needs | 66/118 (55.9%) | 231/405 (57.0%) | |
| Work schedule leaves enough time for personal life/family | 0.007 | ||
| Strongly agree | 20 (15.4%) | 70 (15.7%) | |
| Agree | 45 (34.6%) | 117 (26.3%) | |
| Neutral | 21 (16.2%) | 66 (14.8%) | |
| Disagree | 27 (20.8%) | 119 (26.7%) | |
| Strongly disagree | 17 (13.1%) | 73 (16.4%) | |
| Missing | 0 | 3 | |
| Likelihood of leaving current practice | 0.002 | ||
| Definite | 17 (13.1%) | 34 (7.6%) | |
| Likely | 21 (16.2%) | 53 (11.9%) | |
| Moderate | 21 (16.2%) | 67 (15.0%) | |
| Slight | 38 (29.2%) | 128 (28.7%) | |
| None | 33 (25.4%) | 164 (36.8%) | |
| Missing | 0 | 2 | |
| Would choose to become physician again | 81/130 (62.3%) | 306/441 (69.4%) | 0.86 |
Hospitalists were more likely to express interest in leaving their current practice in the next 2 years, with 13.1% vs 7.6% reporting definite plans to leave and 29.2% vs 19.5% reporting at least likely plans to leave (OR: 2.31, 95% CI: 1.35‐3.97, P=0.002). Among those reporting a likely or definite plan to leave, hospitalists were more likely to plan to look for a different practice and continue to work as a physician (63.2% vs 39.1%), whereas outpatient general internists were more likely to plan to leave medical practice (51.9% vs 22.0%, P=0.004). Hospitalists with plans to reduce their work hours were more likely than their outpatient colleagues to express an interest in administrative and leadership roles (19.4% vs 12.1%) or research and educational roles (9.7% vs 4.0%, P=0.05).
Health Behavior Variables
Hospitalists were less likely to report having a primary care provider in the adjusted analyses (55.0% vs 70.3%, OR: 0.49, 95% CI: 0.29‐0.83, P=0.008). Use of illicit substances was uncommon in both groups (94.6% of hospitalists and 96.0% of outpatient general internists reported never using an illicit substance (OR: 0.87, 95% CI: 0.31‐2.49, P=0.80). Symptoms of alcohol abuse were similar between the 2 groups (11.7% and 13.3%, respectively, OR: 0.64, 95% CI: 0.30‐1.35, P=0.24), but symptoms of alcohol misuse were more common among outpatient general internists (34.2% vs 21.9%, OR: 1.75, 95% CI: 1.013.03, P=0.047).
DISCUSSION
The primary result of this national study applying well‐validated metrics is that the overall rates of burnout among hospitalists and outpatient general internal medicine physicians were similar, as were rates of positive depression screening and QOL. Although these groups did not differ, the absolute rates of distress found in this study were high. Prior research has suggested that possible explanations for these high rates of distress include excessive workload, loss of work‐associated control and meaning, and difficulties with work‐home balance.[4] The present study, in the context of prior work showing that general internists have higher rates of burnout than almost any other specialty, suggests that the front‐line nature of the work of both hospitalists and outpatient general internists may exacerbate these previously cited factors. These results suggest that efforts to address physician well‐being are critically needed for both inpatient and outpatient physicians.
Despite the noted similarities, differences between hospitalists and outpatient general internists in certain aspects of well‐being merit further attention. For example, the lower rate of personal accomplishment among hospitalists relative to outpatient generalists is consistent with prior evidence.[15] The reasons for this difference are unknown, but the relative youth and inexperience of the hospitalists may be a factor. US hospitalists have been noted to feel like glorified residents in at least 1 report,[31] a factor that might also negatively impact personal accomplishment.
It is also worthwhile to place the burnout results for both groups in context with prior studies. Although we found high rates of burnout among outpatient physicians, our outpatient sample's mean MBI subset scores are not higher than previous samples of American[32] and Canadian[33] outpatient physicians, suggesting that this finding is neither new nor artifactual. Placing the hospitalist sample in perspective is more difficult, as very few studies have administered the MBI to US hospitalists, and those that have either administered 1 component only to an exclusive academic sample[34] or administered it to a small mixture of hospitalists and intensivists.[35] The prevalence of burnout we report for our hospitalist sample is higher than that reported by studies that utilized single‐item survey items1214; it is likely that the higher prevalence we report relates more to a more detailed assessment of the components of burnout than to a temporal trend, although this cannot be determined definitively from the data available.
The finding that 9.2% of hospitalists and 5.8% of outpatient general internists reported suicidal thoughts in the past 12 months is alarming, though consistent with prior data on US surgeons.[35] Although the higher rate of suicidal thoughts among hospitalists was not statistically significant, a better understanding of the factors associated with physician suicidality should be the focus of additional research.
Hospitalists were more likely than outpatient internists to report plans to leave their current practice in this study, although their plans after leaving differed. The fact that they were more likely to report plans to find a different role in medicine (rather than to leave medicine entirely or retire) is likely a function of age and career stage. The finding that hospitalists with an interest in changing jobs were more likely than their outpatient colleagues to consider administrative, leadership, education, and research roles may partially reflect the greater number of hospitalists at academic medical centers in this study, but suggests that hospitalists may indeed benefit from the availability of opportunities that have been touted as part of hospitalist diastole.[36]
Finally, rates of alcohol misuse and abuse found in this study were consistent with those reported in prior studies.[37, 38, 39] These rates support ongoing efforts to address alcohol‐related issues among physicians. In addition, the proportion of outpatient general internists and hospitalists reporting having a primary care provider was similar to that seen in prior research.[40] The fact that 1 in 3 physicians in this study did not have a primary care provider suggests there is great room for improvement in access to and prioritization of healthcare for physicians in general. However, it is noteworthy that hospitalists were less likely than outpatient general internists to have a primary care provider even after adjusting for their younger age as a group. The reasons behind this discrepancy are unclear but worthy of further investigation.
Several limitations of our study should be considered. The response rate for the entire study sample was 26.7%, which is similar to other US national physician surveys in this topic area.[41, 42, 43] Demographic comparisons with national data suggest the respondents were reasonably representative of physicians nationally,[4] and all analyses were adjusted for recognized demographic factors affecting our outcomes of interest. We found no statistically significant differences in demographics of early responders compared with late responders (a standard approach to evaluate for response bias),[14, 31] further supporting that responders were representative of US physicians. Despite this, response bias remains possible. For example, it is unclear if burned out physicians might be more likely to respond (eg, due to the personal relevance of the survey topic) or less likely to respond (eg, due to being too overwhelmed to open or complete the survey).
A related limitation is the relatively small number of hospitalists included in this sample, which limits the power of the study to detect differences between the study groups. The hospitalists in this study were also relatively experienced, with a median of 10 years in practice, although the overall demographics match closely to a recent national survey of hospitalists. Although age was considered in the analyses, this study may not fully characterize burnout patterns among very junior or very senior hospitalists. In addition, although analyses were adjusted for observed differences between the study groups for a number of covariates, there may be differences between the study groups in other, unmeasured factors that could act as confounders of the observed results. For example, the allocation of each individual's time to different activities (eg, clinical, research, education, administration), workplace flexibility and control, and meaning may all contribute to distress and well‐being, and could not be assessed in this study.
In conclusion, the degree of burnout, depression, and suicidal ideation in both hospitalists and outpatient general internists is similar and substantial. Urgent attention directed at better understanding the causes of distress and identifying solutions for all internists is needed.
Acknowledgements
The authors acknowledge the role of the American Medical Association in completing this study.
Disclosures: The views expressed in this article are those of the authors and do not represent the views of, and should not be attributed to, the American Medical Association. The authors report no conflicts of interest.
- , , , , , . Stress symptoms, burnout and suicidal thoughts in Finnish physicians. Soc Psychiatry Psychiatr Epidemiol. 1990;25:81–86.
- , , , , , ; Society of General Internal Medicine (SGIM) Career Satisfaction Study Group (CSSG). Predicting and preventing physician burnout: results from the United States and the Netherlands. Am J Med. 2001;111:170–175.
- , , , et al. Burnout among psychiatrists in Milan: a multicenter study. Psychiatr Serv. 2009;60:985–988.
- , , , et al. Burnout and satisfaction with work‐life balance among US physicians relative to the general US population. Arch Intern Med. 2012;172:1377–1385.
- , . The measurement of experienced burnout. J Occup Behav. 1981;2:99–113.
- , , , et al. Burnout and medical errors among American surgeons. Ann Surg. 2010;251:995–1000.
- , , . Physician wellness: a missing quality indicator. Lancet. 2009;374:1714–1721.
- , , , , . Changes in mental health of UK hospital consultants since the mid‐1990s. Lancet. 2005;366:742–744.
- , , , et al. Relationship between burnout and professional conduct and attitudes among US medical students. JAMA. 2010;304:1173–1180.
- , , , et al.; MEMO (Minimizing Error, Maximizing Outcomes) Investigators. Working conditions in primary care: physician reactions and care quality. Ann Intern Med. 2009;151:28–36.
- , , , , , ; MEMO Investigators. Burden of difficult encounters in primary care: data from the Minimizing Error, Maximizing Outcomes study. Arch Intern Med. 2009;169:410–414.
- , , , , . Characteristics and work experiences of hospitalists in the United States. Arch Intern Med. 2001;161(6):851–858.
- , , , , , . Career satisfaction and burnout in academic hospital medicine. Arch Intern Med. 2011;25:171(8):782–785.
- , , , , ; Society of Hospital Medicine Career Satisfaction Task Force. Job characteristics, satisfaction, and burnout across hospitalist practice models. J Hosp Med. 2012;7:402–410.
- , , , , . Burnout in inpatient‐based vs outpatient‐based physicians: a systematic review and meta‐analysis. J Hosp Med. 2013;8:653–664.
- , , . Maslach Burnout Inventory Manual. 3rd ed. Palo Alto, CA: Consulting Psychologists Press; 1996.
- . Resident burnout. JAMA. 2004;292(23):2880–2889.
- , , , . Burnout and self‐reported patient care in an internal medicine residency program. Ann Intern Med. 2002;136:358–367.
- , , , . Evolution of sleep quantity, sleep deprivation, mood disturbances, empathy, and burnout among interns. Acad Med. 2006;81:82–85.
- , , , et al. Utility of a new procedure for diagnosing mental disorders in primary care: the PRIME‐MD 1000 study. JAMA. 1994;272:1749–1756.
- , , , . Case‐finding instruments for depression: two questions are as good as many. J Gen Intern Med. 1997;12:439–445.
- , , , . Attempted suicide among young adults: progress toward a meaningful estimate of prevalence. Am J Psychiatry. 1992;149:41–44.
- , , . Prevalence of and risk factors for lifetime suicide attempts in the National Comorbidity Survey. Arch Gen Psychiatry. 1999;56:617–626.
- , , , , . Trends in suicide ideation, plans, gestures, and attempts in the United States, 1990–1992 to 2001–2003. JAMA. 2005;293:2487–2495.
- , , . Identifying suicidal ideation in general medical patients. JAMA. 1994;272:1757–1762.
- , , , . Health state valuations from the general public using the visual analogue scale. Qual Life Res. 1996;5:521–531.
- , , , et al. The well‐being and personal wellness promotion strategies of medical oncologists in the North Central Cancer Treatment Group. Oncology. 2005;68:23–32.
- , , , et al. Impacting quality of life for patients with advanced cancer with a structured multidisciplinary intervention: a randomized controlled trial. J Clin Oncol. 2006;24:635–642.
- , , , , . Association of resident fatigue and distress with perceived medical errors. JAMA. 2009;302:294–300.
- , , , , . The AUDIT alcohol consumption questions (AUDIT‐C): an effective brief screening test for problem drinking. Arch Intern Med. 1998;158:1789–1795.
- , , , , . Worklife and satisfaction of hospitalists: toward flourishing careers. J Gen Intern Med. 2012;27(1):28–36.
- , , , et al. Association of an educational program in mindful communication with burnout, empathy, and attitudes among primary care physicians. JAMA. 2009;302(12):1284–1293.
- , , . Stress, burnout, and strategies for reducing them: what's the situation among Canadian family physicians? Can Fam Physician. 2008;54(2):234–235.
- , , , et al. Emotional exhaustion, life stress, and perceived control among medicine ward attending physicians: a randomized trial of 2‐ versus 4‐week ward rotations [abstract]. J Hosp Med. 2011;6(4 suppl 2):S43–S44.
- , , , et al. Special report: suicidal ideation among American surgeons. Arch Surg. 2011;146:54–62.
- , , , . Preparing for “diastole”: advanced training opportunities for academic hospitalists. J Hosp Med. 2006;1:368–377.
- , , , et al. Prevalence of substance use among US physicians. JAMA. 1992;267:2333–2339.
- , , , , . Preventive, lifestyle, and personal health behaviors among physicians. Acad Psychiatry. 2009;33:289–295.
- , , , et al. Prevalence of alcohol use disorders among American surgeons. Arch Surg. 2012;147:168–174.
- , , , . Physician, heal thyself? Regular source of care and use of preventive health services among physicians. Arch Intern Med. 2000;160:3209–3214.
- , , . Prevalence of burnout in the U.S. oncologic community: results of a 2003 survey. J Oncol Pract. 2005;1(4):140–147.
- , , , et al. Career satisfaction, practice patterns and burnout among surgical oncologists: report on the quality of life of members of the Society of Surgical Oncology. Ann Surg Oncol. 2007;14:3042–3053.
- , , , et al. Burnout and career satisfaction among American surgeons. Ann Surg. 2009;250(3):463–471.
© 2014 Society of Hospital Medicine
Swollen Tongue in an Immune-Compromised Host
Cosmetic Corner: Dermatologists Weigh in on Scar Treatments
To improve patient care and outcomes, leading dermatologists offered their recommendations on the top scar treatments. Consideration must be given to:
Valeant Consumer Products, a division of Valeant Pharmaceuticals North America LLC
“Biafine Topical Emulsion has a very nice effect on scars and erthema.”—Jeffrey M. Weinberg, MD, New York, New York
• BioCorneum HC
Enaltus, LLC
“I like Biocorneum HC for hypertrophic scars. It is a silicone gel scar cream with sunscreen and low-potency steroid. It is a good combination product and patients like it.”—Amy J. Derick, MD, Barrington, Illinois
Enaltus, LLC
Recommended by Anthony M. Rossi, MD, New York, New York
Mertz Pharmaceuticals, LLC
Recommended by Kenneth Beer, MD, Miami, Florida
Cutis invites readers to send us their recommendations. Over-the-counter antifungals, antiperspirants, and sunless tanners will be featured in upcoming editions of Cosmetic Corner. Please e-mail your recommendation(s) to the Editorial Office.
Disclaimer: Opinions expressed herein do not necessarily reflect those of Cutis or Frontline Medical Communications Inc. and shall not be used for product endorsement purposes. Any reference made to a specific commercial product does not indicate or imply that Cutis or Frontline Medical Communications Inc. endorses, recommends, or favors the product mentioned. No guarantee is given to the effects of recommended products.