User login
Genetic events drive ALL subtype
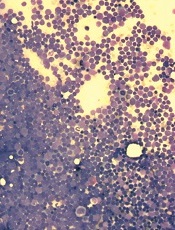
a patient with ALL
Investigators have identified the genetic events leading to leukemic transformation in ETV6-RUNX1 acute lymphoblastic leukemia (ALL), according to a paper published in Nature Genetics.
Previous studies have shown that, for 1 in 4 ALL patients, a key factor driving the disease is a chromosomal translocation that creates the ETV6-RUNX1 fusion gene.
However, the gene cannot cause overt leukemia on its own. Additional mutations are required for ALL to develop.
In this study, researchers found that RAG proteins—which rearrange the genome in normal immune cells to generate antibody diversity—can also rearrange the DNA of genes involved in cancer.
And this leads to ALL in individuals with the ETV6-RUNX1 fusion gene.
“For the first time, we see the combined events that are driving this treatable but highly devastating disease,” said lead study author Elli Papaemmanuil, PhD, of the Wellcome Trust Sanger Institute in Hinxton, UK.
“We now have a better understanding of the natural history of this disease and the critical events—from the initial acquisition of the fusion ETV6-RUNX1 to the sequential acquisition of RAG-mediated genome alterations—that ultimately result in this childhood leukemia.”
To unearth this discovery, the investigators sequenced the genomes of 57 ALL patients with the fusion gene. The team found that genomic rearrangements, and deletions in particular, were the predominant drivers of leukemia.
All samples showed evidence of events involving the RAG proteins. The proteins use a unique sequence of DNA letters as a signpost to direct them to antibody regions.
The researchers discovered that remnants of this sequence lay close to more than 50% of the cancer-driving genetic rearrangements. And this process often prompted the loss of the very genes required for normal immune cell development.
It is the deletion of these genes that, in combination with the fusion gene, leads to ALL, the investigators said. And the genetic signature linking the RAG proteins to genomic instability is not found in other types of leukemia or other common cancers.
“In this childhood leukemia, we see that the very process required to make normal antibodies is co-opted by the leukemia cells to knock out other genes with unprecedented specificity,” said Peter Campbell, PhD, also of the Wellcome Trust Sanger Institute.
To better understand the events that led to ALL development, the researchers used single-cell genomics to analyze samples from 2 patients. The team found that the cancer-causing process they identified occurs many times and results in continuous diversification of the leukemia.
“It may seem surprising that evolution should have provided a mechanism for diversifying antibodies that can collaterally damage genes that then contribute to cancer,” said Mel Greaves, PhD, of The Institute of Cancer Research in London, UK.
“But this only happens because the fusion gene that initiates the disease ‘traps’ cells in a normally very transient window of cell development where the RAG enzymes are active, teasing out their imperfect specificity.”
The researchers are now planning to investigate how the RAG-mediated genomic instability accrues in cells with the ETV6-RUNX1 fusion gene and what role this process plays in patients who relapse. ![]()
Antipsychotic drug is active against T-ALL

Experiments in zebrafish have shown that a 50-year-old antipsychotic medication called perphenazine can actively combat T-cell acute lymphoblastic leukemia (T-ALL).
The drug works by turning on a cancer-suppressing enzyme called PP2A and causing malignant tumor cells to self-destruct.
The findings suggest that developing medications that activate PP2A, while avoiding perphenazine’s psychotropic effects, could help clinicians make much-needed headway against T-ALL and perhaps other tumors as well.
Alejandro Gutierrez, MD, of the Dana-Farber Cancer Institute in Boston, and his colleagues detailed this research in The Journal of Clinical Investigation.
The researchers screened a library of 4880 compounds—including FDA-approved drugs whose patents had expired, small molecules, and natural products—in a model of T-ALL engineered using zebrafish.
One of the strongest hits in the zebrafish screen was perphenazine. The drug is a member of the phenothiazines family of antipsychotic medications, which can block dopamine receptors.
The investigators verified perphenazine’s anti-leukemic potential in vitro in several mouse and human T-ALL cell lines. Biochemical studies indicated that perphenazine’s anti-tumor activity is independent of its psychotropic activity and that it attacks T-ALL cells by turning on PP2A.
The fact that perphenazine works by reactivating a protein shut down in cancer cells is novel in the drug development field.
“We rarely find potential drug molecules that activate an enzyme,” Dr Gutierrez explained. “Most new drugs deactivate some protein or signal that the cancer cell requires to survive. But, here, perphenazine is restoring the activity of PP2A in the T-ALL cell.”
The researchers are now working to better understand the interactions between PP2A and perphenazine. They also want to search for or develop molecules that bind to and activate the enzyme more tightly and specifically to avoid perphenazine’s psychiatric effects.
“The challenge is to use medicinal chemistry to develop new PP2A inhibitors similar to perphenazine and the other phenothiazines, but to dial down dopamine interactions and accentuate those with PP2A,” said study author A. Thomas Look, MD, also of Dana-Farber.
He added that future PP2A inhibitors could be important additions to the oncologist’s arsenal. When used in combination with other drugs, the inhibitors might “make a real difference” for patients with T-ALL.
The investigators also believe the benefits of PP2A-activating drugs could extend beyond T-ALL.
“The proteins that PP2A suppresses, such as Myc and Akt, are involved in many tumors,” Dr Look noted. “We are optimistic that PP2A activators will have quite broad activity against different kinds of cancer, and we’re anxious to study the pathway in other malignancies as well.” ![]()
Deaths from leukemia, NHL declining in the UK

Credit: National Cancer
Institute-Mathews Media Group
Deaths from leukemia and non-Hodgkin lymphoma (NHL) are on the decline in the UK, but these malignancies are still among the leading causes of cancer death, a new analysis suggests.
Leukemia and NHL are among the 10 most common causes of cancer death for men and women in the UK, according to data from 2011.
But deaths from these malignancies have decreased from the number of deaths seen in the early 2000s.
These findings, published on the Cancer Research UK website, are similar to the results of a recent report on cancer deaths in the US.
The Cancer Research UK analysis showed that the death rate from cancer has dropped by more than a fifth since the 1990s.
In 1990, 220 in every 100,000 people died of cancer. But by 2011, the death rate had fallen 22%—to 170 per 100,000 people. The cancer mortality rate fell by 20% for women and 26% for men.
“Today, cancer is not the death sentence people once believed it to be,” said Harpal Kumar, Cancer Research UK chief executive.
“As these new figures show, mortality rates from this much-feared disease are dropping significantly . . . . But while we’re heading in the right direction, too many lives are still being lost to the disease, highlighting how much more work there is to do.”
NHL and leukemia stats
The analysis showed that, in men, the 3-year mortality rate for NHL decreased by 16% from 2000-2002 to 2009-2012. And the 3-year mortality rate for leukemia decreased by 6%.
In women, the 3-year mortality rate for NHL decreased by 18% from 2000-2002 to 2009-2012. And the 3-year mortality rate for leukemia decreased by 9%.
But the 2011 data showed that both types of cancer are among the 10 most common causes of cancer death in both men and women.
Among women, 2156 patients died of NHL (7th leading cause of cancer death), and 1994 patients died of leukemia (8th leading cause).
Among men, 2609 patients died of leukemia (8th leading cause of cancer death), and 2490 died of NHL (10th leading cause).
For more details on cancer mortality, including projections up to the year 2030, visit the Cancer Research UK website. ![]()
Benefit of Teamwork Training
Teamwork is tightly linked to patient safety for hospitalized patients. Barriers to teamwork in hospital settings abound, including large team sizes and dynamic team membership because of the need to provide care 24 hours a day, 7 days a week. Team members are often dispersed across clinical service areas and care for multiple patients at the same time. Compounding the potential for these structural barriers to impede teamwork, professionals seldom receive any formal training to enhance teamwork skills, and students and trainees have relatively few interactions during their formative years with individuals outside of their own profession. In this issue of the Journal of Hospital Medicine, Tofil et al. describe the effect of a novel interprofessional training program to improve teamwork among medical and nursing students at the University of Alabama.[1] The curriculum included 4, 1‐hour simulation sessions and resulted in improved ratings of self‐efficacy with communication and teamwork attitudes. The authors report that the curriculum has continued and expanded to include other health professionals.
Beyond the short‐term results, the curriculum developed by Tofil and colleagues may have lasting effects on individual participants. Students, exposed to one another during a particularly impressionable period of their professional development, may develop better appreciation for the priorities, responsibilities, needs, and expertise of others. The experience may inoculate them from adopting unfavorable behaviors and attitudes that are common among practicing clinicians and comprise the hidden curriculum, which often undermines the goals of the formal curriculum.[2] An early, positive experience with other team members may be especially important for medical students, as physicians tend to be relatively unaware of deficiencies in interprofessional collaboration.[3]
Though undoubtedly valuable to the learners and contributing to our collective knowledge on the subject, the study by Tofil and colleagues includes limitations common to teamwork training curricula.[4] To make the potential of teamwork training a reality in improving patient outcomes, we must first revisit some key teamwork concepts and principles of curriculum development. Baker and colleagues define a team as consisting of 2 or more individuals, who have specific roles, perform interdependent tasks, are adaptable, and share a common goal.[5] For a team to be successful, individual team members must have specific knowledge, skills, and attitudes (ie, competencies).[6] For team training curricula to be successful, existing frameworks like TeamSTEPPS (Team Strategies and Tools to Enhance Performance and Patient Safety) should be used to define learning objectives.[7] Because teamwork is largely behavioral and affective, simulation is the most appropriate instruction method. Simulation involves deliberate practice and expert feedback so that learners can iteratively enhance teamwork skills. Other instructional methods (eg, didactics, video observation and debriefing, brief role play without feedback) are too weak to be effective.
Importantly, Tofil and colleagues used an accepted teamwork framework to develop learning objectives, simulation as the instructional method, and an interprofessional team (ie, a physician, nurse, and an adult learning professional with simulation expertise) to perform simulation debriefings. However, for team training to achieve its full potential, leaders of future efforts need to aim for higher level outcomes. Positive reactions are encouraging, but what we really want to know is that learners truly adopted new skills and attitudes, applied them in real‐world clinical settings, and that patients benefited from them. These are high but achievable goals and absolutely necessary to advance the credibility of team training. Relatively few studies have evaluated the impact of team training on patient outcomes, and the available evidence is equivocal.[8, 9] The intensity and duration of deliberate practice during simulation exercises must be sufficient to change ingrained behaviors and to ensure transfer of enhanced skills to the clinical setting if our goal is to improve patient outcomes.
Leaders of future efforts must also develop innovative simulation exercises that reflect the real‐life challenges and contexts for medical teamwork including dispersion of team members, challenges of communication in hierarchical teams, and competing demands under increasing time pressure. Simulated communication events could include a nurse deciding whether and how to contact a physician not immediately present (and vice versa). Sessions should include interruptions and require participants to multitask to replicate the clinical environment. Notably, simulation exercises provide an opportunity for assessment using a behaviorally anchored rating scale, which is often impractical in real clinical settings because team members are seldom in the same place at the same time. Booster simulation sessions should be provided to ensure skills do not decay over time. In situ simulation (ie, simulation events in the real clinical setting) offers the ability to reveal latent conditions impeding the efficiency or quality of communication among team members.
Most importantly, simulation‐based teamwork training must be combined with system redesign and improvement. Enhanced communication skills will only go so far if team members never have a chance to use them. Leaders should work with their hospitals to remove systemic barriers to teamwork. Opportunities for improvement include geographic localization of physicians, assigning patients to nurses to maximize homogeneity of team members, optimizing interprofessional rounds, and leveraging information and communication technologies. Simulation training should be seen as a complement to these interventions rather than a substitute.
Challenges to teamwork are multifactorial and therefore require multifaceted interventions. Simulation is essential to enhance teamwork skills and attitudes. For efforts to translate into improved patient outcomes, leaders must use innovative approaches and combine simulation training with system redesign and improvement.
- , , , et al. Interprofessional simulation training improves knowledge and teamwork in nursing and medical students during internal medicine clerkship. J Hosp Med. 2014;9(3):189–192.
- . Beyond curriculum reform: confronting medicine's hidden curriculum. Acad Med. 1998;73(4):403–407.
- , , , , , . Teamwork on inpatient medical units: assessing attitudes and barriers. Qual Saf Health Care. 2010;19(2):117–121.
- , , . Contributions of simulation‐based training to teamwork. In: Baker DP, Battles JB, King HB, Wears RL, eds. Improving Patient Safety Through Teamwork and Team Training. New York, NY: Oxford University Press; 2013:218–227.
- , , . Teamwork as an essential component of high‐reliability organizations. Health Serv. Res. 2006;41(4 pt 2):1576–1598.
- , , , , . The role of teamwork in the professional education of physicians: current status and assessment recommendations. Jt Comm J Qual Patient Saf. 2005;31(4):185–202.
- , , , et al. TeamSTEPPS: Team Strategies and Tools to Enhance Performance and Patient Safety Advances in Patient Safety: New Directions and Alternative Approaches. Vol. 3. Performance and Tools. Rockville, MD: Agency for Healthcare Research and Quality; 2008.
- , , , et al. Effects of a multicentre teamwork and communication programme on patient outcomes: results from the Triad for Optimal Patient Safety (TOPS) project. BMJ Qual Saf. 2012;21(2):118–126.
- , , , . Simulation exercises as a patient safety strategy: a systematic review. Ann Intern Med. 2013;158(5 pt 2):426–432.
Teamwork is tightly linked to patient safety for hospitalized patients. Barriers to teamwork in hospital settings abound, including large team sizes and dynamic team membership because of the need to provide care 24 hours a day, 7 days a week. Team members are often dispersed across clinical service areas and care for multiple patients at the same time. Compounding the potential for these structural barriers to impede teamwork, professionals seldom receive any formal training to enhance teamwork skills, and students and trainees have relatively few interactions during their formative years with individuals outside of their own profession. In this issue of the Journal of Hospital Medicine, Tofil et al. describe the effect of a novel interprofessional training program to improve teamwork among medical and nursing students at the University of Alabama.[1] The curriculum included 4, 1‐hour simulation sessions and resulted in improved ratings of self‐efficacy with communication and teamwork attitudes. The authors report that the curriculum has continued and expanded to include other health professionals.
Beyond the short‐term results, the curriculum developed by Tofil and colleagues may have lasting effects on individual participants. Students, exposed to one another during a particularly impressionable period of their professional development, may develop better appreciation for the priorities, responsibilities, needs, and expertise of others. The experience may inoculate them from adopting unfavorable behaviors and attitudes that are common among practicing clinicians and comprise the hidden curriculum, which often undermines the goals of the formal curriculum.[2] An early, positive experience with other team members may be especially important for medical students, as physicians tend to be relatively unaware of deficiencies in interprofessional collaboration.[3]
Though undoubtedly valuable to the learners and contributing to our collective knowledge on the subject, the study by Tofil and colleagues includes limitations common to teamwork training curricula.[4] To make the potential of teamwork training a reality in improving patient outcomes, we must first revisit some key teamwork concepts and principles of curriculum development. Baker and colleagues define a team as consisting of 2 or more individuals, who have specific roles, perform interdependent tasks, are adaptable, and share a common goal.[5] For a team to be successful, individual team members must have specific knowledge, skills, and attitudes (ie, competencies).[6] For team training curricula to be successful, existing frameworks like TeamSTEPPS (Team Strategies and Tools to Enhance Performance and Patient Safety) should be used to define learning objectives.[7] Because teamwork is largely behavioral and affective, simulation is the most appropriate instruction method. Simulation involves deliberate practice and expert feedback so that learners can iteratively enhance teamwork skills. Other instructional methods (eg, didactics, video observation and debriefing, brief role play without feedback) are too weak to be effective.
Importantly, Tofil and colleagues used an accepted teamwork framework to develop learning objectives, simulation as the instructional method, and an interprofessional team (ie, a physician, nurse, and an adult learning professional with simulation expertise) to perform simulation debriefings. However, for team training to achieve its full potential, leaders of future efforts need to aim for higher level outcomes. Positive reactions are encouraging, but what we really want to know is that learners truly adopted new skills and attitudes, applied them in real‐world clinical settings, and that patients benefited from them. These are high but achievable goals and absolutely necessary to advance the credibility of team training. Relatively few studies have evaluated the impact of team training on patient outcomes, and the available evidence is equivocal.[8, 9] The intensity and duration of deliberate practice during simulation exercises must be sufficient to change ingrained behaviors and to ensure transfer of enhanced skills to the clinical setting if our goal is to improve patient outcomes.
Leaders of future efforts must also develop innovative simulation exercises that reflect the real‐life challenges and contexts for medical teamwork including dispersion of team members, challenges of communication in hierarchical teams, and competing demands under increasing time pressure. Simulated communication events could include a nurse deciding whether and how to contact a physician not immediately present (and vice versa). Sessions should include interruptions and require participants to multitask to replicate the clinical environment. Notably, simulation exercises provide an opportunity for assessment using a behaviorally anchored rating scale, which is often impractical in real clinical settings because team members are seldom in the same place at the same time. Booster simulation sessions should be provided to ensure skills do not decay over time. In situ simulation (ie, simulation events in the real clinical setting) offers the ability to reveal latent conditions impeding the efficiency or quality of communication among team members.
Most importantly, simulation‐based teamwork training must be combined with system redesign and improvement. Enhanced communication skills will only go so far if team members never have a chance to use them. Leaders should work with their hospitals to remove systemic barriers to teamwork. Opportunities for improvement include geographic localization of physicians, assigning patients to nurses to maximize homogeneity of team members, optimizing interprofessional rounds, and leveraging information and communication technologies. Simulation training should be seen as a complement to these interventions rather than a substitute.
Challenges to teamwork are multifactorial and therefore require multifaceted interventions. Simulation is essential to enhance teamwork skills and attitudes. For efforts to translate into improved patient outcomes, leaders must use innovative approaches and combine simulation training with system redesign and improvement.
- , , , et al. Interprofessional simulation training improves knowledge and teamwork in nursing and medical students during internal medicine clerkship. J Hosp Med. 2014;9(3):189–192.
- . Beyond curriculum reform: confronting medicine's hidden curriculum. Acad Med. 1998;73(4):403–407.
- , , , , , . Teamwork on inpatient medical units: assessing attitudes and barriers. Qual Saf Health Care. 2010;19(2):117–121.
- , , . Contributions of simulation‐based training to teamwork. In: Baker DP, Battles JB, King HB, Wears RL, eds. Improving Patient Safety Through Teamwork and Team Training. New York, NY: Oxford University Press; 2013:218–227.
- , , . Teamwork as an essential component of high‐reliability organizations. Health Serv. Res. 2006;41(4 pt 2):1576–1598.
- , , , , . The role of teamwork in the professional education of physicians: current status and assessment recommendations. Jt Comm J Qual Patient Saf. 2005;31(4):185–202.
- , , , et al. TeamSTEPPS: Team Strategies and Tools to Enhance Performance and Patient Safety Advances in Patient Safety: New Directions and Alternative Approaches. Vol. 3. Performance and Tools. Rockville, MD: Agency for Healthcare Research and Quality; 2008.
- , , , et al. Effects of a multicentre teamwork and communication programme on patient outcomes: results from the Triad for Optimal Patient Safety (TOPS) project. BMJ Qual Saf. 2012;21(2):118–126.
- , , , . Simulation exercises as a patient safety strategy: a systematic review. Ann Intern Med. 2013;158(5 pt 2):426–432.
Interprofessional IM Simulation Course
Medical simulation is an effective tool in teaching health professions students.[1] It allows a wide range of experiences to be practiced including rare but crucial cases, skills training, counseling cases, and integrative medical cases.[2, 3, 4, 5, 6] Simulation also allows healthcare professionals to work and learn side by side as they do in actual patient‐care situations.
Previous studies have confirmed the effectiveness of high‐fidelity simulation in improving nursing students' and medical students' knowledge and communication skills.[7, 8, 9, 10, 11] However, only a few are designed where different professions learn together. Robertson et al. found that a simulation and modified Team Strategies and Tools to Enhance Performance and Patient Safety (TeamSTEPPs) curriculum was successful in improving nursing students' and medical students' communication skills, including an improvement in identification of effective team skills and attitudes toward working together as a team.[12] Stewart et al. also found communication, teamwork skills, and knowledge was improved with nursing students and medical students using pediatric simulation.[13] We hypothesized that simulation training would improve both nursing students' and medical students' medical knowledge, communication skills, and understanding of each profession's role in patient care.
METHODS
Aligning with the University of Alabama at Birmingham School of Medicine calendar, starting in May 2011, weekly simulations were introduced to the current curriculum of the 8‐week internal medicine clerkship for third‐year medical students. Due to differences in academic calendars, the senior nursing students did not start on a recurring basis until July 2011. The first two months served as a pilot phase to assess the validity of the pre‐ and post‐tests as well as the simulation scenarios. Data from this period were used for quality purposes and not in the final data analysis. Data were collected for this study from July 2011 through April 2012. The institutional review board of the University of Alabama at Birmingham approved this study.
Third‐year School of Medicine (SOM) students and senior baccalaureate nursing students participated in four every‐other‐week 1‐hour simulation sessions during the medical students' 8‐week internal medicine clerkship. Each scenario's participants consisted of three nursing students and five or six medical students, with five or six additional medical students observing in the control room. All students participated in the debriefing. Each cohort worked together for the four scenarios in an attempt to build camaraderie over time. Scenarios occurred over approximately 20 minutes, with the remaining 40 minutes used for debriefing. Debriefing with good judgment utilizing advocacy inquiry questioning was our debriefing model,[14] and each scenario's debriefers included at least one physician, one nurse, and one adult learning professional with simulation expertise. All debriefing sessions started with reactions, followed by an exploration phase and finally a summary phase. Debriefings were guided by a debriefing script highlighting key teaching points. TeamSTEPPS was used as the structure of team‐based learning.
Scenarios included acute myocardial infarction, pancreatitis with hyperkalemia, upper gastrointestinal bleed, and chronic obstructive pulmonary disease exacerbation with allow natural death order. Learning objectives for each case focused on teamwork and communication as well as exploring the differential diagnosis. For each scenario, physical exam findings, laboratory results, radiographs, and electrocardiogram results were developed and reviewed by experts for clarity and accuracy. All cases were programmed utilizing Laerdal (Laerdal Medical Corp., Wappinger Falls, NY) programming software and SimMan Essential mannequin (Laerdal Medical Corp.). All scenarios occurred in a simulated emergency department room for patients being admitted to the inpatient internal medicine service.
Identical pre‐ and post‐tests were given to medical and nursing students. Case‐specific knowledge was assessed with multiple choice items. Self‐efficacy related to professional roles and attitudes toward team communication were each assessed with a 6‐item evaluation using anchored 5‐point Likert response scales (see Supporting Information, Table 1, in the online version of this article). Self‐efficacy items formed a scale, whereas attitude items assessed individual dimensions. These measures were pilot tested with 34 matched pre‐ and post‐tests from medical and nursing students. Pilot data were only for quality purposes and are not in the final data analysis.
| Medicine, n=72 | Nursing, n=28 | |||||
|---|---|---|---|---|---|---|
| Pretest | Post‐test | P Value | Pretest | Post‐test | P Value | |
| ||||||
| Knowledge, meanSD | 5317% | 7015% | 0.0001 | 3215% | 4316% | 0.003 |
| Communication self‐efficacy, mean (SD), range, 030 | 18.9 (3.3) | 23.7 (3.7) | 0.0001 | 19.6 (2.7) | 24.5 (2.5) | 0.0001 |
| Attitudes | ||||||
| Working well in a medical team is a crucial part of my job. | 100%, n=72 | 97%, n=69 | NC | 100%, n=28 | 100%, n=28 | NC |
| In an emergency situation, patient care is more important than patient safety. | 25%, n=18 | 25%, n=18 | 0.025 | 21%, n=6 | 29%, n=8 | 0.032 |
| In an emergency situation, providing immediate care is more important than assigning medical team roles. | 35%, n=25 | 29%, n=21 | 0.067 | 39%, n=11 | 36%, n=10 | 0.340 |
| Closing the loop in communication is important even when it slows down patient care. | 67%, n=48 | 80%, n=58 | 0.005 | 54%, n=15 | 79%, n=22 | 0.212 |
| The highest ranking physician has the most important role on the medical team. | 33%, n=24 | 26%, n=19 | 0.0001 | 0%, n=0 | 4%, n=1 | 0.836 |
| Multidisciplinary care, where each team member is responsible for their area of expertise, is more productive than cross‐integrated care where roles are less defined. | 63%, n=45 | 71%, n=51 | 0.037 | 68%, n=19 | 71%, n=20 | 0.827 |
The self‐efficacy scale was examined for clarity and discrimination with Cronbach's . Individual attitudes were examined for response variation. Knowledge questions were examined for evidence of change. Two questions were dropped from the pilot measure (1 for inappropriate material given the case and 1 for ceiling scores at pretest), and one question was reworded to include ethics, resulting in the final version of the pretest. This pretest was completed at the medical student clerkship orientation and the nursing student introduction prior to any simulation scenario. After each debriefing, all students completed an anonymous evaluation survey about the simulation and debriefing consisting of nine questions with a 5‐point Likert response scale. The survey also included open‐ended questions related to the simulation's effectiveness and areas for improvement. At the end of the 8‐week clerkship after the final scenario, the post‐test and postcourse surveys were completed. All data were anonymous but coded with unique ID numbers to allow for comparing individual change in scores.
Statistics
Quantitative statistical analysis was performed using SPSS version 21.0 (SPSS Inc., Chicago, IL). All tests were 2‐tailed, with significance set at P=0.05. Paired t tests were used to determine differences between pre‐ and post‐test self‐efficacy for participants. A series of attitudinal statements were examined with [2] tests; response categories were collapsed due to the sparse n in some cells (strongly agree and somewhat agree=agree; strongly disagree and somewhat disagree=disagree). Significance was set at P=0.05, and the self‐efficacy scale was examined for internal consistency with Cronbach's . Reported knowledge scores are based on percentage correct; self‐efficacy results are reported as a total score for all items.
RESULTS
A total of 108 students, 78 medical students and 30 nursing students, participated in this study. Paired pre‐ and post‐tests available for 72 medical students and 28 nursing students were included in the analyses (Table 1). Knowledge scores improved significantly and similarly for medical students by 9.4% and School of Nursing (SON) students by 10.4%. The self‐efficacy scale (range, 030) had moderate to good internal consistency (Cronbach's range was 0.68 [pretest] to 0.82 [post‐test]). Both medical students and nursing students demonstrated significant improvements in the self‐efficacy scale mean scores, with increases of 4.8 points (P0.0001) and 4.9 points (P0.0001), respectively. Both medical student and nursing student groups showed the greatest change in confidence to correct another healthcare provider at bedside in a collaborative manner (=0.97 and =1.2, respectively). SOM students showed a large change in confidence to always close the loop in patient care (=0.93), whereas SON students showed a large change in confidence to always figure out role on a medical team without explicit directions (=1.1).
Results of the postsimulation evaluations indicate that students felt the activity was applicable to their field (mean=4.93/5 medicine, 4.99/5 nursing) and a beneficial educational experience (mean=4.90/5 medicine, 4.95/5 nursing). Among the open‐ended responses, the most frequent positive response for both groups was increased medical knowledge (37% of all medical students' comments, 30% nursing students). An improved sense of teamwork and team communication were the second and third most common positive comments for both groups (17% medicine, 19% nursing and 16% medicine, 15% nursing, respectively). The most commonly recognized area for improvement among medical students was medical knowledge (24%). The most commonly cited area for improvement among nursing students was communication within the team (19%).
DISCUSSION
Immersive interprofessional simulations can be successfully implemented with third‐year medical students and senior nursing students. The participants, regardless of profession, had a significant improvement in clinical knowledge. These participants also improved their attitudes toward interprofessional teamwork and role clarity.
Our results also showed that both groups of students had the greatest improvement in confidence to correct another healthcare provider at bedside in a collaborative manner. The debriefing team consisted of professionals from both nursing and medicine, which allowed for time to be spent on both the knowledge objectives of the case as well as the communication aspects of the team.
Combining learners with equivalent levels of knowledge and hands‐on experience from different professions is challenging and requires early planning. The nursing student participants were in their final of five semesters before completing baccalaureate requirements, and the medical students were in their third of four years of school. This grouping of medical and nursing students worked well. Medical students had more book knowledge, whereas nursing students had more hands‐on experience, such as administering medications and oxygen, but less specific clinical knowledge. Therefore, each group complemented the other.
Although this study was initially funded by an internal grant, the simulation course described in this report is now required for medical students during their internal medicine clerkship and nursing students during their final semester. The course has expanded from one hour each week to two hours each week and now includes eight cases instead of four. Other disciplines such as respiratory therapy and social work are now involved, and the interprofessional debriefing continues to be a part of every case with faculty from each discipline serving as content experts, and a PhD educator serving as the lead debriefer. The expansion of this course was due to faculty from each discipline observing students in action and attending the debriefing to witness the rich discussion that occurs after every case. Faculty who observed the course had the opportunity to talk to learners after the debriefing and get their feedback on the learning experience and on working with other disciplines. These faculty have become champions for simulation education within their own schools and now serve as content experts for the simulations. Aside from developing champions within each discipline and debriefers from each field, another key factor of success was giving nursing students credit for clinical time. This required nursing course directors to rethink their course structure.
The study has several limitations. Knowledge learned during the 2‐month period between the pre‐ and post‐test was not solely related to that learned during the simulation. The rise in level in the post‐test results could indicate that the questions had substantial ceiling effects. This study assessed self‐reported confidence and not qualitative improvements in medical care. Our self‐efficacy and communication surveys were created for this study and have not been previously validated. Our study was also conducted at 1 institution with strong institutional support for both simulation and interprofessional education, and its reproducibility at other institutions is unknown.
CONCLUSIONS
Interprofessional simulation training for nursing and medical students can potentially increase communication self‐efficacy as well as improve team role attitudes. By instituting a high‐fidelity simulation curriculum similar to the one used in this study, students could be exposed to other disciplines and professions in a safe and realistic environment. Further research is needed to demonstrate the effectiveness of interprofessional training in additional areas and to evaluate effects of early interprofessional training on healthcare outcomes.
Disclosures
This study was funded by the Health Services Foundation General Endowment Fund, University of Alabama at Birmingham, Birmingham, Alabama. The abstract only was presented at the 13th Annual International Meeting on Simulation in Healthcare, January 2630, 2013, Orlando, Florida. No author has any conflict of interest or financial disclosures except Dr. Tofil, who was reimbursed by Laerdal for travel expenses for a Laerdal‐sponsored meeting in the fall of 2011 and 2013 while giving an independently produced lecture on pediatric simulation. No fees were paid.
- , , , et al. Technology‐enhanced simulation for health professions education: a systematic review and meta‐analysis. JAMA. 2011;306(9):978–988.
- , , , , . Initiation of a mock code program at a children's hospital. Med Teach. 2009;31(6):e241–e247.
- , , , et al. Simulation‐based mock codes significantly correltate with improved patient cardiopulmonary arrest survival rates. Pediatr Crit Care Med. 2011;12(1):33–38.
- , , , . Long‐term educational impact of a simulator curriculum on medical student education in an internal medicine clerkship. Simul Healthc. 2010;5:75–81.
- , , . Improving medical student toxicology knowledge and self‐confidence using mannequin simulation. Hawaii Med J. 2010;69:4–7.
- , , , . Simulation technology: a comparison of experiential and visual learning for undergraduate medical students. Anesthesiology. 2002;96:10–16.
- , , , . Effectiveness of intermediate‐fidelity simulation training technology in undergraduate nursing education. J Adv Nurs. 2006;54(3):359–369.
- , , , , , . Simulation in medical school education: review for emergency medicine. West J Emerg Med. 2011;12(4):461–466.
- , , , , . Man versus machine: the preferred modality. Clin Teach. 2012;9(6):387–391.
- , , , , . High‐fidelity simulation is superior to case‐based discussion in teaching the management of shock. Med Teach. 2013;35(3):e1003–e1010.
- , , , , . Preparing medical students for clinical decision making: a pilot study exploring how students make decisions and the perceived impact of a clinical decision making teaching intervention. Med Teach. 2012;34(7):e508–e517.
- , , , , , . The use of simulation and a modified TeamSTEPPS curriculum for medical and nursing student team training. Simul Healthc. 2010;5(6):332–337.
- , , . Undergraduate interprofessional education using high‐fidelity paediatric simulation. Clin Teach. 2010;7(2):90–96.
- , , , , . Debriefing with good judgment: combining rigorous feedback with genuine inquiry. Anesthesiol Clin. 2007;25(2):361–376.
Medical simulation is an effective tool in teaching health professions students.[1] It allows a wide range of experiences to be practiced including rare but crucial cases, skills training, counseling cases, and integrative medical cases.[2, 3, 4, 5, 6] Simulation also allows healthcare professionals to work and learn side by side as they do in actual patient‐care situations.
Previous studies have confirmed the effectiveness of high‐fidelity simulation in improving nursing students' and medical students' knowledge and communication skills.[7, 8, 9, 10, 11] However, only a few are designed where different professions learn together. Robertson et al. found that a simulation and modified Team Strategies and Tools to Enhance Performance and Patient Safety (TeamSTEPPs) curriculum was successful in improving nursing students' and medical students' communication skills, including an improvement in identification of effective team skills and attitudes toward working together as a team.[12] Stewart et al. also found communication, teamwork skills, and knowledge was improved with nursing students and medical students using pediatric simulation.[13] We hypothesized that simulation training would improve both nursing students' and medical students' medical knowledge, communication skills, and understanding of each profession's role in patient care.
METHODS
Aligning with the University of Alabama at Birmingham School of Medicine calendar, starting in May 2011, weekly simulations were introduced to the current curriculum of the 8‐week internal medicine clerkship for third‐year medical students. Due to differences in academic calendars, the senior nursing students did not start on a recurring basis until July 2011. The first two months served as a pilot phase to assess the validity of the pre‐ and post‐tests as well as the simulation scenarios. Data from this period were used for quality purposes and not in the final data analysis. Data were collected for this study from July 2011 through April 2012. The institutional review board of the University of Alabama at Birmingham approved this study.
Third‐year School of Medicine (SOM) students and senior baccalaureate nursing students participated in four every‐other‐week 1‐hour simulation sessions during the medical students' 8‐week internal medicine clerkship. Each scenario's participants consisted of three nursing students and five or six medical students, with five or six additional medical students observing in the control room. All students participated in the debriefing. Each cohort worked together for the four scenarios in an attempt to build camaraderie over time. Scenarios occurred over approximately 20 minutes, with the remaining 40 minutes used for debriefing. Debriefing with good judgment utilizing advocacy inquiry questioning was our debriefing model,[14] and each scenario's debriefers included at least one physician, one nurse, and one adult learning professional with simulation expertise. All debriefing sessions started with reactions, followed by an exploration phase and finally a summary phase. Debriefings were guided by a debriefing script highlighting key teaching points. TeamSTEPPS was used as the structure of team‐based learning.
Scenarios included acute myocardial infarction, pancreatitis with hyperkalemia, upper gastrointestinal bleed, and chronic obstructive pulmonary disease exacerbation with allow natural death order. Learning objectives for each case focused on teamwork and communication as well as exploring the differential diagnosis. For each scenario, physical exam findings, laboratory results, radiographs, and electrocardiogram results were developed and reviewed by experts for clarity and accuracy. All cases were programmed utilizing Laerdal (Laerdal Medical Corp., Wappinger Falls, NY) programming software and SimMan Essential mannequin (Laerdal Medical Corp.). All scenarios occurred in a simulated emergency department room for patients being admitted to the inpatient internal medicine service.
Identical pre‐ and post‐tests were given to medical and nursing students. Case‐specific knowledge was assessed with multiple choice items. Self‐efficacy related to professional roles and attitudes toward team communication were each assessed with a 6‐item evaluation using anchored 5‐point Likert response scales (see Supporting Information, Table 1, in the online version of this article). Self‐efficacy items formed a scale, whereas attitude items assessed individual dimensions. These measures were pilot tested with 34 matched pre‐ and post‐tests from medical and nursing students. Pilot data were only for quality purposes and are not in the final data analysis.
| Medicine, n=72 | Nursing, n=28 | |||||
|---|---|---|---|---|---|---|
| Pretest | Post‐test | P Value | Pretest | Post‐test | P Value | |
| ||||||
| Knowledge, meanSD | 5317% | 7015% | 0.0001 | 3215% | 4316% | 0.003 |
| Communication self‐efficacy, mean (SD), range, 030 | 18.9 (3.3) | 23.7 (3.7) | 0.0001 | 19.6 (2.7) | 24.5 (2.5) | 0.0001 |
| Attitudes | ||||||
| Working well in a medical team is a crucial part of my job. | 100%, n=72 | 97%, n=69 | NC | 100%, n=28 | 100%, n=28 | NC |
| In an emergency situation, patient care is more important than patient safety. | 25%, n=18 | 25%, n=18 | 0.025 | 21%, n=6 | 29%, n=8 | 0.032 |
| In an emergency situation, providing immediate care is more important than assigning medical team roles. | 35%, n=25 | 29%, n=21 | 0.067 | 39%, n=11 | 36%, n=10 | 0.340 |
| Closing the loop in communication is important even when it slows down patient care. | 67%, n=48 | 80%, n=58 | 0.005 | 54%, n=15 | 79%, n=22 | 0.212 |
| The highest ranking physician has the most important role on the medical team. | 33%, n=24 | 26%, n=19 | 0.0001 | 0%, n=0 | 4%, n=1 | 0.836 |
| Multidisciplinary care, where each team member is responsible for their area of expertise, is more productive than cross‐integrated care where roles are less defined. | 63%, n=45 | 71%, n=51 | 0.037 | 68%, n=19 | 71%, n=20 | 0.827 |
The self‐efficacy scale was examined for clarity and discrimination with Cronbach's . Individual attitudes were examined for response variation. Knowledge questions were examined for evidence of change. Two questions were dropped from the pilot measure (1 for inappropriate material given the case and 1 for ceiling scores at pretest), and one question was reworded to include ethics, resulting in the final version of the pretest. This pretest was completed at the medical student clerkship orientation and the nursing student introduction prior to any simulation scenario. After each debriefing, all students completed an anonymous evaluation survey about the simulation and debriefing consisting of nine questions with a 5‐point Likert response scale. The survey also included open‐ended questions related to the simulation's effectiveness and areas for improvement. At the end of the 8‐week clerkship after the final scenario, the post‐test and postcourse surveys were completed. All data were anonymous but coded with unique ID numbers to allow for comparing individual change in scores.
Statistics
Quantitative statistical analysis was performed using SPSS version 21.0 (SPSS Inc., Chicago, IL). All tests were 2‐tailed, with significance set at P=0.05. Paired t tests were used to determine differences between pre‐ and post‐test self‐efficacy for participants. A series of attitudinal statements were examined with [2] tests; response categories were collapsed due to the sparse n in some cells (strongly agree and somewhat agree=agree; strongly disagree and somewhat disagree=disagree). Significance was set at P=0.05, and the self‐efficacy scale was examined for internal consistency with Cronbach's . Reported knowledge scores are based on percentage correct; self‐efficacy results are reported as a total score for all items.
RESULTS
A total of 108 students, 78 medical students and 30 nursing students, participated in this study. Paired pre‐ and post‐tests available for 72 medical students and 28 nursing students were included in the analyses (Table 1). Knowledge scores improved significantly and similarly for medical students by 9.4% and School of Nursing (SON) students by 10.4%. The self‐efficacy scale (range, 030) had moderate to good internal consistency (Cronbach's range was 0.68 [pretest] to 0.82 [post‐test]). Both medical students and nursing students demonstrated significant improvements in the self‐efficacy scale mean scores, with increases of 4.8 points (P0.0001) and 4.9 points (P0.0001), respectively. Both medical student and nursing student groups showed the greatest change in confidence to correct another healthcare provider at bedside in a collaborative manner (=0.97 and =1.2, respectively). SOM students showed a large change in confidence to always close the loop in patient care (=0.93), whereas SON students showed a large change in confidence to always figure out role on a medical team without explicit directions (=1.1).
Results of the postsimulation evaluations indicate that students felt the activity was applicable to their field (mean=4.93/5 medicine, 4.99/5 nursing) and a beneficial educational experience (mean=4.90/5 medicine, 4.95/5 nursing). Among the open‐ended responses, the most frequent positive response for both groups was increased medical knowledge (37% of all medical students' comments, 30% nursing students). An improved sense of teamwork and team communication were the second and third most common positive comments for both groups (17% medicine, 19% nursing and 16% medicine, 15% nursing, respectively). The most commonly recognized area for improvement among medical students was medical knowledge (24%). The most commonly cited area for improvement among nursing students was communication within the team (19%).
DISCUSSION
Immersive interprofessional simulations can be successfully implemented with third‐year medical students and senior nursing students. The participants, regardless of profession, had a significant improvement in clinical knowledge. These participants also improved their attitudes toward interprofessional teamwork and role clarity.
Our results also showed that both groups of students had the greatest improvement in confidence to correct another healthcare provider at bedside in a collaborative manner. The debriefing team consisted of professionals from both nursing and medicine, which allowed for time to be spent on both the knowledge objectives of the case as well as the communication aspects of the team.
Combining learners with equivalent levels of knowledge and hands‐on experience from different professions is challenging and requires early planning. The nursing student participants were in their final of five semesters before completing baccalaureate requirements, and the medical students were in their third of four years of school. This grouping of medical and nursing students worked well. Medical students had more book knowledge, whereas nursing students had more hands‐on experience, such as administering medications and oxygen, but less specific clinical knowledge. Therefore, each group complemented the other.
Although this study was initially funded by an internal grant, the simulation course described in this report is now required for medical students during their internal medicine clerkship and nursing students during their final semester. The course has expanded from one hour each week to two hours each week and now includes eight cases instead of four. Other disciplines such as respiratory therapy and social work are now involved, and the interprofessional debriefing continues to be a part of every case with faculty from each discipline serving as content experts, and a PhD educator serving as the lead debriefer. The expansion of this course was due to faculty from each discipline observing students in action and attending the debriefing to witness the rich discussion that occurs after every case. Faculty who observed the course had the opportunity to talk to learners after the debriefing and get their feedback on the learning experience and on working with other disciplines. These faculty have become champions for simulation education within their own schools and now serve as content experts for the simulations. Aside from developing champions within each discipline and debriefers from each field, another key factor of success was giving nursing students credit for clinical time. This required nursing course directors to rethink their course structure.
The study has several limitations. Knowledge learned during the 2‐month period between the pre‐ and post‐test was not solely related to that learned during the simulation. The rise in level in the post‐test results could indicate that the questions had substantial ceiling effects. This study assessed self‐reported confidence and not qualitative improvements in medical care. Our self‐efficacy and communication surveys were created for this study and have not been previously validated. Our study was also conducted at 1 institution with strong institutional support for both simulation and interprofessional education, and its reproducibility at other institutions is unknown.
CONCLUSIONS
Interprofessional simulation training for nursing and medical students can potentially increase communication self‐efficacy as well as improve team role attitudes. By instituting a high‐fidelity simulation curriculum similar to the one used in this study, students could be exposed to other disciplines and professions in a safe and realistic environment. Further research is needed to demonstrate the effectiveness of interprofessional training in additional areas and to evaluate effects of early interprofessional training on healthcare outcomes.
Disclosures
This study was funded by the Health Services Foundation General Endowment Fund, University of Alabama at Birmingham, Birmingham, Alabama. The abstract only was presented at the 13th Annual International Meeting on Simulation in Healthcare, January 2630, 2013, Orlando, Florida. No author has any conflict of interest or financial disclosures except Dr. Tofil, who was reimbursed by Laerdal for travel expenses for a Laerdal‐sponsored meeting in the fall of 2011 and 2013 while giving an independently produced lecture on pediatric simulation. No fees were paid.
- , , , et al. Technology‐enhanced simulation for health professions education: a systematic review and meta‐analysis. JAMA. 2011;306(9):978–988.
- , , , , . Initiation of a mock code program at a children's hospital. Med Teach. 2009;31(6):e241–e247.
- , , , et al. Simulation‐based mock codes significantly correltate with improved patient cardiopulmonary arrest survival rates. Pediatr Crit Care Med. 2011;12(1):33–38.
- , , , . Long‐term educational impact of a simulator curriculum on medical student education in an internal medicine clerkship. Simul Healthc. 2010;5:75–81.
- , , . Improving medical student toxicology knowledge and self‐confidence using mannequin simulation. Hawaii Med J. 2010;69:4–7.
- , , , . Simulation technology: a comparison of experiential and visual learning for undergraduate medical students. Anesthesiology. 2002;96:10–16.
- , , , . Effectiveness of intermediate‐fidelity simulation training technology in undergraduate nursing education. J Adv Nurs. 2006;54(3):359–369.
- , , , , , . Simulation in medical school education: review for emergency medicine. West J Emerg Med. 2011;12(4):461–466.
- , , , , . Man versus machine: the preferred modality. Clin Teach. 2012;9(6):387–391.
- , , , , . High‐fidelity simulation is superior to case‐based discussion in teaching the management of shock. Med Teach. 2013;35(3):e1003–e1010.
- , , , , . Preparing medical students for clinical decision making: a pilot study exploring how students make decisions and the perceived impact of a clinical decision making teaching intervention. Med Teach. 2012;34(7):e508–e517.
- , , , , , . The use of simulation and a modified TeamSTEPPS curriculum for medical and nursing student team training. Simul Healthc. 2010;5(6):332–337.
- , , . Undergraduate interprofessional education using high‐fidelity paediatric simulation. Clin Teach. 2010;7(2):90–96.
- , , , , . Debriefing with good judgment: combining rigorous feedback with genuine inquiry. Anesthesiol Clin. 2007;25(2):361–376.
Hospital Safety Grade
The Institute of Medicine (IOM) reported over a decade ago that between 44,000 and 98,000 deaths occurred every year due to preventable medical errors.[1] The report sparked an intense interest in identifying, measuring, and reporting hospital performance in patient safety.[2] The report also sparked the implementation of many initiatives aiming to improve patient safety.[3] Despite these efforts, there is still much room for improvement in the area of patient safety.[4] As the public has become more aware of patient safety issues, there has been an increased demand for information on hospital safety. The Leapfrog Group, a leading organization that examines and reports on hospital performance in patient safety, cites the IOM report as providing the focus that their newly formed organization required.[5]
Using 26 national measures of safety, The Leapfrog Group calculates a numeric Hospital Safety Score for over 2,600 acute care hospitals in the United States.[6] The primary data used to calculate this score are collected through the Leapfrog Hospital Survey, the Agency for Healthcare Research and Quality, the Centers for Disease Control and Prevention, and the Centers for Medicare and Medicaid Services (CMS). The American Hospital Association's (AHA) Annual Survey is used as a secondary data source as necessary. The Leapfrog Group conducts the survey annually, and substantial efforts are put forth to invite hospital administrators to participate in the survey. Participation in the Leapfrog survey is optional and free of charge.
Leapfrog recently moved a step further in their evaluation of hospital safety by releasing the Hidden Surcharge Calculator to enable employers to estimate the hidden surcharge they pay for their employees and dependents because of hospital errors.[7] The calculation depends largely on the letter grade (AF) that the hospital received from Leapfrog's Hospital Safety Score. For example, Leapfrog estimated a commercially insured patient admitted to a hospital with a grade of C or lower would incur $1845 additional cost per admission than if the same patient was admitted to a hospital with a grade of A.[7] The Leapfrog group encourages employers and payers to use this information to adjust benefits structures so that employees are discouraged from using hospitals that receive lower hospital safety scores. Leapfrog also encourages payers to negotiate lower reimbursement rates for hospitals with lower hospital safety scores.
The accuracy of Leapfrog's hospital safety grades warrants attention because of the methodology used to score hospitals that do not participate in the Leapfrog Survey. One common barrier that prevents hospitals from participating is the amount of effort required to complete the annual survey, including extensive inputs from hospital executives and staff. According to Leapfrog, 4 to 6 days are required for a hospital to compile the necessary survey data.[8] Leapfrog estimates a 90‐minute commitment for the hospital chief executive officer or designated administrator to enter the information into the online questionnaire. This is a significant commitment for many hospitals. As a result, among the approximately 2600 acute care hospitals covered by Leapfrog's 2012 to 2013 safety grading, only 1100 (or 42.3%) actually participated in the Leapfrog hospital survey. This limits Leapfrog's ability to provide accurate scores and assign fair safety grades to many hospitals.
METHODS
Leapfrog Hospital Safety Score
Leapfrog's designated Hospital Safety Score is determined by 26 measures. The set of safety measures and their relative weight are determined by a 9‐member Leapfrog expert panel of patient safety experts.[9] The hospital safety score is divided equally into 2 domains of safety measures: process/structural and outcomes.[6] The process measures represent how often a hospital gives patients recommended treatment for a given medical condition or procedure, whereas structural measures represent the environment in which patients receive care.[10] The process/structural measures include computerized physician order entry (CPOE), intensive care unit (ICU) physician staffing (IPS), 8 Leapfrog safety practices, and 5 surgical care improvement project measures. The outcome measures represent what happens to a patient while receiving care. The outcomes domain includes 5 hospital‐acquired conditions and 6 patient safety indicators. A score is assigned and weighted for each measure. All scores are then summed to produce a single number denoting the safety performance score received by each hospital. Every hospital is assigned 1 of 5 letter grades depending on how the hospital's numeric score stands in safety performance relative to all other hospitals. The letter grade A denotes the best hospital safety performance, followed in order by letter grades B through F. The cutoffs for A and B grades represent the first and second quartile of hospital safety scores. The cutoff for the C grade represents the hospitals that were between the mean and 1.5 standard deviations below the mean. The cutoff for the D grade represents the hospitals that were between 1.5 and 3.0 standard deviations below the mean. F grades indicate safety scores more than 3.0 standard deviations below the mean.[11]
Nonparticipating Hospitals
The Leapfrog Survey contributes values for 11 of the 26 measures utilized to calculate the Hospital Safety Score. The score of a nonparticipating hospital will not reflect 8 of these 11 measures. For the 3 remaining measures, CPOE, IPS, and central line‐associated blood stream infection, secondary data from the AHA Survey, AHA Information Technology Supplement Survey, and CMS Hospital Compare were used as proxies, respectively (Table 1). The use of a proxy effectively limits the maximum score attainable by nonparticipating hospitals. For instance, 2 of these 3 measures, CPOE and IPS, are calculated on different scales depending on hospital survey participation status. For CPOE, nonparticipating hospitals are limited to a maximum of 65 out of 100 points; for IPS, they are limited to 85 out of 100 points.[6] Because the actual weight for each of these proxy measures is increased for nonparticipating hospitals in the calculation of the final score, their effective impact is exacerbated. The weight of CPOE and IPS measures in the overall weighted score are increased from 6.1% and 7.0% to 11.0% and 12.6%, respectively.
| Participants | Nonparticipants | |
|---|---|---|
| ||
| Process/structural measures (50% of score) | ||
| Computerized Physician Order Entry | 2012 Leapfrog Hospital Survey | 2010 IT Supplement (AHA) |
| ICU Physician Staffing (IPS) | 2012 Leapfrog Hospital Survey | 2011 AHA Annual Survey |
| Safe Practice 1: Leadership Structures and Systems | 2012 Leapfrog Hospital Survey | Excluded |
| Safe Practice 2: Culture Measurement, Feedback, and Intervention | 2012 Leapfrog Hospital Survey | Excluded |
| Safe Practice 3: Teamwork Training and Skill Building | 2012 Leapfrog Hospital Survey | Excluded |
| Safe Practice 4: Identification and Mitigation of Risks and Hazards | 2012 Leapfrog Hospital Survey | Excluded |
| Safe Practice 9: Nursing Workforce | 2012 Leapfrog Hospital Survey | Excluded |
| Safe Practice 17: Medication Reconciliation | 2012 Leapfrog Hospital Survey | Excluded |
| Safe Practice 19: Hand Hygiene | 2012 Leapfrog Hospital Survey | Excluded |
| Safe Practice 23: Care of the Ventilated Patient | 2012 Leapfrog Hospital Survey | Excluded |
| SCIP‐INF‐1: Antibiotic Within 1 Hour | CMS Hospital Compare | CMS Hospital Compare |
| SCIP‐INF‐2: Antibiotic Selection | CMS Hospital Compare | CMS Hospital Compare |
| SCIP‐INF‐3: Antibiotic Discontinued After 24 Hours | CMS Hospital Compare | CMS Hospital Compare |
| SCIP‐INF‐9: Catheter Removal | CMS Hospital Compare | CMS Hospital Compare |
| SCIP‐VTE‐2: VTE Prophylaxis | CMS Hospital Compare | CMS Hospital Compare |
| Outcome measures (50% of score) | ||
| HAC: Foreign Object Retained | CMS HACs | CMS HACs |
| HAC: Air Embolism | CMS HACs | CMS HACs |
| HAC: Pressure Ulcers | CMS HACs | CMS HACs |
| HAC: Falls and Trauma | CMS HACs | CMS HACs |
| Central Line‐Associated Bloodstream Infection | 2012 Leapfrog Hospital Survey | CMS HAIs |
| PSI 4: Death Among Surgical Inpatients With Serious Treatable Complications | CMS Hospital Compare | CMS Hospital Compare |
| PSI 6: Collapsed Lung Due to Medical Treatment | CMS Hospital Compare | CMS Hospital Compare |
| PSI 12: Postoperative PE/DVT | CMS Hospital Compare | CMS Hospital Compare |
| PSI 14: Wounds Split Open After Surgery | CMS Hospital Compare | CMS Hospital Compare |
| PSI 15: Accidental Cuts or Tears From Medical Treatment | CMS Hospital Compare | CMS Hospital Compare |
Study Sample
We examined the Leapfrog safety grades for top hospitals," as ranked by U.S. News & World Report. Included in this sample were the top 15 ranked hospitals in each of the specialties, excluding those specialties whose ranks are based solely on reputation. Hospitals ranked in more than 1 specialty were only included once in the sample. This resulted in a final study sample of 35 top hospitals. Eighteen of these top hospitals participated in the Leapfrog Survey, whereas 17 did not.
Utilizing Leapfrog's spring 2013 methodology,[6] the Hospital Safety Scores for the 35 top hospitals were calculated. The mean safety score for the 18 participating hospitals was then compared with the mean score for the 17 nonparticipating hospitals. Finally, the safety scores for each of the 17 nonparticipating hospitals, listed in Table 2, were estimated as if they had participated in the Leapfrog Survey. To do this, we assumed that the 17 nonparticipating hospitals could each earn average scores for the CPOE, IPS, and 8 process/structural Leapfrog measures as received by their 18 participating counterparts.
| Participants | Leapfrog Grade | Nonparticipants | Leapfrog Grade |
|---|---|---|---|
| |||
| Brigham and Women's Hospital, Boston, MA | A | Abbott Northwestern Hospital, Minneapolis, MN | A |
| Duke University Medical Center, Durham, NC | A | Barnes‐Jewish Hospital/Washington University, St. Louis, MO | C |
| Massachusetts General Hospital, Boston, MA | B | Baylor University Medical Center, Dallas, TX | C |
| Mayo Clinic, Rochester, MN | A | Cedars‐Sinai Medical Center, Los Angeles, CA | C |
| Methodist Hospital, Houston, TX | A | Cleveland Clinic, Cleveland, OH | C |
| Northwestern Memorial Hospital, Chicago, IL | A | Florida Hospital, Orlando, FL | B |
| Ronald Reagan UCLA Medical Center, Los Angeles, CA | D | Hospital of the University of Pennsylvania, Philadelphia, PA | A |
| Rush University Medical Center, Chicago, IL | A | Indiana University Health, Indianapolis, IN | A |
| St. Francis Hospital, Roslyn, NY | A | Mount Sinai Medical Center, New York, NY | B |
| St. Joseph's Hospital and Medical Center, Phoenix, AZ | B | New York‐Presbyterian Hospital, New York, NY | C |
| Stanford Hospital and Clinics, Stanford, CA | A | NYU Langone Medical Center, New York, NY | A |
| Thomas Jefferson University Hospital, Philadelphia, PA | C | Ochsner Medical Center, New Orleans, LA | A |
| UCSF Medical Center, San Francisco, CA | B | Tampa General Hospital, Tampa, FL | C |
| University Hospitals Case Medical Center, Cleveland, OH | A | University of Iowa Hospitals and Clinics, Iowa City, IA | C |
| University of Michigan Hospitals and Health Centers, Ann Arbor, MI | A | University of Kansas Hospital, Kansas City, KS | A |
| University of Washington Medical Center, Seattle, WA | C | UPMC, Pittsburgh, PA | B |
| Vanderbilt University Medical Center, Nashville, TN | A | Yale‐New Haven Hospital, New Haven, CT | B |
| Wake Forest Baptist Medical Center, Winston‐Salem, NC | A | ||
RESULTS
Out of these 35 top hospitals, those that participated in the Leapfrog Survey generally received higher scores than the nonparticipants (Table 2). The group of participating hospitals received an average grade of A (mean safety score, 3.165; standard error of the mean [SE], 0.081), whereas the nonparticipating hospitals received an average grade of B (mean safety score, 3.012; SE, 0.047). These grades were consistent whether mean or median scores were used.
To further examine the potential bias against nonparticipating hospitals, the safety scores for each of the 17 nonparticipating hospitals were estimated as if they had participated in the Leapfrog Survey. The letter grade of this group increased from an average of B (mean safety score, 3.012; SE, 0.047) to an average of A (mean safety score, 3.216; SE, 0.046). Among the 17 nonparticipating hospitals, 15 showed an increase in safety score, of which 8 hospitals rescored a change in score significant enough to receive 1 or 2 letter grades higher (Table 3). Only 2 hospitals had slight decreases in safety score, without any impact on letter grade.
| Hospital | Original Score (Grade) | Estimated Scorea (Grade) |
|---|---|---|
| ||
| Abbott Northwestern Hospital, Minneapolis, MN | 3.17 (A) | 3.44 (A) |
| Barnes‐Jewish Hospital/Washington University, St. Louis, MO | 2.83 (C) | 3.11 (B) |
| Baylor University Medical Center, Dallas, TX | 2.90 (C) | 3.25 (A) |
| Cedars‐Sinai Medical Center, Los Angeles, CA | 2.92 (C) | 3.30 (A) |
| Cleveland Clinic, Cleveland, OH | 2.76 (C) | 2.78 (C) |
| Florida Hospital, Orlando, FL | 2.98 (B) | 3.38 (A) |
| Hospital of the University of Pennsylvania, Philadelphia, PA | 3.29 (A) | 3.26 (A) |
| Indiana University Health, Indianapolis, IN | 3.14 (A) | 3.37 (A) |
| Mount Sinai Medical Center, New York, NY | 3.01 (B) | 3.02 (B) |
| New York‐Presbyterian Hospital, New York, NY | 2.76 (C) | 3.15 (A) |
| NYU Langone Medical Center, New York, NY | 3.26 (A) | 3.30 (A) |
| Ochsner Medical Center, New Orleans, LA | 3.19 (A) | 3.59 (A) |
| Tampa General Hospital, Tampa, FL | 2.86 (C) | 3.05 (B) |
| University of Iowa Hospitals and Clinics, Iowa City, IA | 2.70 (C) | 3.00 (B) |
| University of Kansas Hospital, Kansas City, KS | 3.29 (A) | 3.35 (A) |
| UPMC, Pittsburgh, PA | 3.04 (B) | 3.24 (A) |
| Yale‐New Haven Hospital, New Haven, CT | 3.10 (B) | 3.08 (B) |
We applied the same methods to test the top 17 Honor Roll Hospitals as designated by US News & World Report; among them, half are participating hospitals and another half nonparticipating hospitals. One hospital, Johns Hopkins Hospital was not scored by Leapfrog because no relevant Medicare data are available for Leapfrog to calculate its safety score. For this reason, Johns Hopkins was excluded from our comparison. The results persist even with this smaller sample of top hospitals. The group of 8 participating hospitals had an average grade of A (mean safety score, 3.145; SE, 0.146), whereas another 8 nonparticipating hospitals received an average grade of B (mean safety score, 3.011; SE, 0.075).
DISCUSSION
The Leapfrog Group's intent to provide patient safety information to patients, physicians, healthcare purchasers, and hospital executives should be commended. However, the current methodology may disadvantage nonparticipating hospitals. The combination of lower maximum scores and increased weight of the CPOE and IPS scores may result in a lower hospital safety score than is justified. Nonparticipating hospitals may also face more intensive pressure from employers and payors to lower their reimbursement rates due to the newly released Leapfrog Hidden Surcharge Calculator.
Leapfrog acknowledges that the more data points a hospital has to be scored on, the better its opportunity to achieve a higher score.[8] This justification may lead to bias against nonparticipating hospitals. On the other hand, it is possible that hospitals with good safety records are more likely to participate in the Leapfrog Survey than those with poorer safety records. Without detailed nonresponse analysis from Leapfrog, it is impossible to know if there is a selection bias. Regardless, the Leapfrog result can subsequently misguide the payment rate negotiation between insurers and hospitals.
With this consideration in mind, Leapfrog should explicitly acknowledge the limitations of its methodology and consider revising it in future studies. For example, Leapfrog could only report on those measures for which there are data available for both participating and nonparticipating hospitals. Pending this revision, every effort must be made to distinguish between participating and nonparticipating hospitals. The outcomes of Leapfrog's hospital safety grades are made available online to consumers without distinguishing between participating and nonparticipating hospitals. The only method to differentiate the categories is to examine the data sources in detail amid a large volume of data. It is unlikely that consumers comparing hospital safety grades will take note of this caveat. Thus, Leapfrog's grading system can drastically misrepresent many nonparticipating hospitals' patient safety performances.
This study of The Leapfrog Group's Hospital Safety Score is not without limitations. The small sample utilized in this study limited the power of statistical testing. The difference in mean scores between participating and nonparticipating hospitals is not statistically significant. However, The Leapfrog Group uses specific numerical cutoff points for each letter grade classification. In this classification system statistical significance is not considered when assigning hospitals with different letter grades. It was clear that nonparticipating hospitals were more likely to receive lower letter grades than participating hospitals.
The small sample also posed challenges when attempting to account for missing data when comparing participating hospitals versus nonparticipating hospitals. Although a multiple imputation approach may have been ideal to address this, the small sample size coupled with the large amount of missing data (58% of hospitals did not participate in the Leapfrog Survey) led us to question the accuracy of this approach in this situation.[12] Instead, a crude, mean imputation approach was utilized, relying on the assumption that nonresponding hospitals had the same mean performance as responding hospitals on those domains where data were missing. In this study, we purposely selected a sample of hospitals from U.S. News & World Report's top hospitals. We believe the mean imputation approach, although not perfect, is appropriate for this sample of hospitals. Future study, however, should examine if hospitals that anticipated lower performance scores would be less likely to participate in the Leapfrog Survey. This would help strengthen Leapfrog's methodology in dealing with nonresponsive hospitals.
ACKNOWLEDGMENTS
Disclosures: Harold Paz is the CEO of Penn State Hershey Medical Center, which did not participate in the Leapfrog Survey. The authors have no financial conflicts of interest to report.
- , , . To Err Is Human: Building a Safer Health System. Washington, DC: National Academy Press; 2000.
- , , , , . The “To Err is Human” report and the patient safety literature. Qual Saf Health Care. 2006;15(3):174–178.
- , . A call to excellence. Health Aff (Millwood). 2003;22(2):113–115.
- US Department of Health and Human Services. Adverse events in hospitals: national incidence among Medicare beneficiaries. Available at: http://oig.hhs.gov/oei/reports/oei‐06‐09‐00090.pdf. Published November 2010. Accessed on August 2, 2013.
- The Leapfrog Group. The Leapfrog Group—fact sheet 2013. Available at: https://leapfroghospitalsurvey.org/web/wp‐content/uploads/Fsleapfrog.pdf. Accessed October 9, 2013.
- The Leapfrog Group. Hospital Safety score scoring methodology. Available at: http://www.hospitalsafetyscore.org/media/file/HospitalSafetyScore_ScoringMethodology_May2013.pdf. Published May 2013. Accessed June 17, 2013.
- The Leapfrog Group. The Hidden Surcharge Americans Pay for Hospital Errors 2013. Available at: http://www.leapfroggroup.org/employers_purchasers/HiddenSurchargeCalculator. Accessed August 2, 2013.
- The Leapfrog Group. 2013 Leapfrog Hospital Survey Reference Book 2013. https://leapfroghospitalsurvey.org/web/wp‐content/uploads/reference.pdf. Published April 1, 2013. Accessed June 17, 2013.
- , , , et al. Safety in numbers: the development of Leapfrog's composite patient safety score for U.S. hospitals [published online ahead of print September 27, 2013]. J Patient Saf. doi: 10.1097/PTS.0b013e3182952644.
- The Leapfrog Group. Measures in detail. Available at: http://www. hospitalsafetyscore.org/about‐the‐score/measures‐in‐detail. Accessed June 17, 2013.
- The Leapfrog Group. Explanation of safety score grades. Available at: http://www.hospitalsafetyscore.org/media/file/ExplanationofSafety ScoreGrades_May2013.pdf. Published May 2013. Accessed June 17, 2013.
- , , , et al. Multiple imputation for missing data in epidemiological and clinical research: potential and pitfalls. BMJ. 2009;338:b2393.
The Institute of Medicine (IOM) reported over a decade ago that between 44,000 and 98,000 deaths occurred every year due to preventable medical errors.[1] The report sparked an intense interest in identifying, measuring, and reporting hospital performance in patient safety.[2] The report also sparked the implementation of many initiatives aiming to improve patient safety.[3] Despite these efforts, there is still much room for improvement in the area of patient safety.[4] As the public has become more aware of patient safety issues, there has been an increased demand for information on hospital safety. The Leapfrog Group, a leading organization that examines and reports on hospital performance in patient safety, cites the IOM report as providing the focus that their newly formed organization required.[5]
Using 26 national measures of safety, The Leapfrog Group calculates a numeric Hospital Safety Score for over 2,600 acute care hospitals in the United States.[6] The primary data used to calculate this score are collected through the Leapfrog Hospital Survey, the Agency for Healthcare Research and Quality, the Centers for Disease Control and Prevention, and the Centers for Medicare and Medicaid Services (CMS). The American Hospital Association's (AHA) Annual Survey is used as a secondary data source as necessary. The Leapfrog Group conducts the survey annually, and substantial efforts are put forth to invite hospital administrators to participate in the survey. Participation in the Leapfrog survey is optional and free of charge.
Leapfrog recently moved a step further in their evaluation of hospital safety by releasing the Hidden Surcharge Calculator to enable employers to estimate the hidden surcharge they pay for their employees and dependents because of hospital errors.[7] The calculation depends largely on the letter grade (AF) that the hospital received from Leapfrog's Hospital Safety Score. For example, Leapfrog estimated a commercially insured patient admitted to a hospital with a grade of C or lower would incur $1845 additional cost per admission than if the same patient was admitted to a hospital with a grade of A.[7] The Leapfrog group encourages employers and payers to use this information to adjust benefits structures so that employees are discouraged from using hospitals that receive lower hospital safety scores. Leapfrog also encourages payers to negotiate lower reimbursement rates for hospitals with lower hospital safety scores.
The accuracy of Leapfrog's hospital safety grades warrants attention because of the methodology used to score hospitals that do not participate in the Leapfrog Survey. One common barrier that prevents hospitals from participating is the amount of effort required to complete the annual survey, including extensive inputs from hospital executives and staff. According to Leapfrog, 4 to 6 days are required for a hospital to compile the necessary survey data.[8] Leapfrog estimates a 90‐minute commitment for the hospital chief executive officer or designated administrator to enter the information into the online questionnaire. This is a significant commitment for many hospitals. As a result, among the approximately 2600 acute care hospitals covered by Leapfrog's 2012 to 2013 safety grading, only 1100 (or 42.3%) actually participated in the Leapfrog hospital survey. This limits Leapfrog's ability to provide accurate scores and assign fair safety grades to many hospitals.
METHODS
Leapfrog Hospital Safety Score
Leapfrog's designated Hospital Safety Score is determined by 26 measures. The set of safety measures and their relative weight are determined by a 9‐member Leapfrog expert panel of patient safety experts.[9] The hospital safety score is divided equally into 2 domains of safety measures: process/structural and outcomes.[6] The process measures represent how often a hospital gives patients recommended treatment for a given medical condition or procedure, whereas structural measures represent the environment in which patients receive care.[10] The process/structural measures include computerized physician order entry (CPOE), intensive care unit (ICU) physician staffing (IPS), 8 Leapfrog safety practices, and 5 surgical care improvement project measures. The outcome measures represent what happens to a patient while receiving care. The outcomes domain includes 5 hospital‐acquired conditions and 6 patient safety indicators. A score is assigned and weighted for each measure. All scores are then summed to produce a single number denoting the safety performance score received by each hospital. Every hospital is assigned 1 of 5 letter grades depending on how the hospital's numeric score stands in safety performance relative to all other hospitals. The letter grade A denotes the best hospital safety performance, followed in order by letter grades B through F. The cutoffs for A and B grades represent the first and second quartile of hospital safety scores. The cutoff for the C grade represents the hospitals that were between the mean and 1.5 standard deviations below the mean. The cutoff for the D grade represents the hospitals that were between 1.5 and 3.0 standard deviations below the mean. F grades indicate safety scores more than 3.0 standard deviations below the mean.[11]
Nonparticipating Hospitals
The Leapfrog Survey contributes values for 11 of the 26 measures utilized to calculate the Hospital Safety Score. The score of a nonparticipating hospital will not reflect 8 of these 11 measures. For the 3 remaining measures, CPOE, IPS, and central line‐associated blood stream infection, secondary data from the AHA Survey, AHA Information Technology Supplement Survey, and CMS Hospital Compare were used as proxies, respectively (Table 1). The use of a proxy effectively limits the maximum score attainable by nonparticipating hospitals. For instance, 2 of these 3 measures, CPOE and IPS, are calculated on different scales depending on hospital survey participation status. For CPOE, nonparticipating hospitals are limited to a maximum of 65 out of 100 points; for IPS, they are limited to 85 out of 100 points.[6] Because the actual weight for each of these proxy measures is increased for nonparticipating hospitals in the calculation of the final score, their effective impact is exacerbated. The weight of CPOE and IPS measures in the overall weighted score are increased from 6.1% and 7.0% to 11.0% and 12.6%, respectively.
| Participants | Nonparticipants | |
|---|---|---|
| ||
| Process/structural measures (50% of score) | ||
| Computerized Physician Order Entry | 2012 Leapfrog Hospital Survey | 2010 IT Supplement (AHA) |
| ICU Physician Staffing (IPS) | 2012 Leapfrog Hospital Survey | 2011 AHA Annual Survey |
| Safe Practice 1: Leadership Structures and Systems | 2012 Leapfrog Hospital Survey | Excluded |
| Safe Practice 2: Culture Measurement, Feedback, and Intervention | 2012 Leapfrog Hospital Survey | Excluded |
| Safe Practice 3: Teamwork Training and Skill Building | 2012 Leapfrog Hospital Survey | Excluded |
| Safe Practice 4: Identification and Mitigation of Risks and Hazards | 2012 Leapfrog Hospital Survey | Excluded |
| Safe Practice 9: Nursing Workforce | 2012 Leapfrog Hospital Survey | Excluded |
| Safe Practice 17: Medication Reconciliation | 2012 Leapfrog Hospital Survey | Excluded |
| Safe Practice 19: Hand Hygiene | 2012 Leapfrog Hospital Survey | Excluded |
| Safe Practice 23: Care of the Ventilated Patient | 2012 Leapfrog Hospital Survey | Excluded |
| SCIP‐INF‐1: Antibiotic Within 1 Hour | CMS Hospital Compare | CMS Hospital Compare |
| SCIP‐INF‐2: Antibiotic Selection | CMS Hospital Compare | CMS Hospital Compare |
| SCIP‐INF‐3: Antibiotic Discontinued After 24 Hours | CMS Hospital Compare | CMS Hospital Compare |
| SCIP‐INF‐9: Catheter Removal | CMS Hospital Compare | CMS Hospital Compare |
| SCIP‐VTE‐2: VTE Prophylaxis | CMS Hospital Compare | CMS Hospital Compare |
| Outcome measures (50% of score) | ||
| HAC: Foreign Object Retained | CMS HACs | CMS HACs |
| HAC: Air Embolism | CMS HACs | CMS HACs |
| HAC: Pressure Ulcers | CMS HACs | CMS HACs |
| HAC: Falls and Trauma | CMS HACs | CMS HACs |
| Central Line‐Associated Bloodstream Infection | 2012 Leapfrog Hospital Survey | CMS HAIs |
| PSI 4: Death Among Surgical Inpatients With Serious Treatable Complications | CMS Hospital Compare | CMS Hospital Compare |
| PSI 6: Collapsed Lung Due to Medical Treatment | CMS Hospital Compare | CMS Hospital Compare |
| PSI 12: Postoperative PE/DVT | CMS Hospital Compare | CMS Hospital Compare |
| PSI 14: Wounds Split Open After Surgery | CMS Hospital Compare | CMS Hospital Compare |
| PSI 15: Accidental Cuts or Tears From Medical Treatment | CMS Hospital Compare | CMS Hospital Compare |
Study Sample
We examined the Leapfrog safety grades for top hospitals," as ranked by U.S. News & World Report. Included in this sample were the top 15 ranked hospitals in each of the specialties, excluding those specialties whose ranks are based solely on reputation. Hospitals ranked in more than 1 specialty were only included once in the sample. This resulted in a final study sample of 35 top hospitals. Eighteen of these top hospitals participated in the Leapfrog Survey, whereas 17 did not.
Utilizing Leapfrog's spring 2013 methodology,[6] the Hospital Safety Scores for the 35 top hospitals were calculated. The mean safety score for the 18 participating hospitals was then compared with the mean score for the 17 nonparticipating hospitals. Finally, the safety scores for each of the 17 nonparticipating hospitals, listed in Table 2, were estimated as if they had participated in the Leapfrog Survey. To do this, we assumed that the 17 nonparticipating hospitals could each earn average scores for the CPOE, IPS, and 8 process/structural Leapfrog measures as received by their 18 participating counterparts.
| Participants | Leapfrog Grade | Nonparticipants | Leapfrog Grade |
|---|---|---|---|
| |||
| Brigham and Women's Hospital, Boston, MA | A | Abbott Northwestern Hospital, Minneapolis, MN | A |
| Duke University Medical Center, Durham, NC | A | Barnes‐Jewish Hospital/Washington University, St. Louis, MO | C |
| Massachusetts General Hospital, Boston, MA | B | Baylor University Medical Center, Dallas, TX | C |
| Mayo Clinic, Rochester, MN | A | Cedars‐Sinai Medical Center, Los Angeles, CA | C |
| Methodist Hospital, Houston, TX | A | Cleveland Clinic, Cleveland, OH | C |
| Northwestern Memorial Hospital, Chicago, IL | A | Florida Hospital, Orlando, FL | B |
| Ronald Reagan UCLA Medical Center, Los Angeles, CA | D | Hospital of the University of Pennsylvania, Philadelphia, PA | A |
| Rush University Medical Center, Chicago, IL | A | Indiana University Health, Indianapolis, IN | A |
| St. Francis Hospital, Roslyn, NY | A | Mount Sinai Medical Center, New York, NY | B |
| St. Joseph's Hospital and Medical Center, Phoenix, AZ | B | New York‐Presbyterian Hospital, New York, NY | C |
| Stanford Hospital and Clinics, Stanford, CA | A | NYU Langone Medical Center, New York, NY | A |
| Thomas Jefferson University Hospital, Philadelphia, PA | C | Ochsner Medical Center, New Orleans, LA | A |
| UCSF Medical Center, San Francisco, CA | B | Tampa General Hospital, Tampa, FL | C |
| University Hospitals Case Medical Center, Cleveland, OH | A | University of Iowa Hospitals and Clinics, Iowa City, IA | C |
| University of Michigan Hospitals and Health Centers, Ann Arbor, MI | A | University of Kansas Hospital, Kansas City, KS | A |
| University of Washington Medical Center, Seattle, WA | C | UPMC, Pittsburgh, PA | B |
| Vanderbilt University Medical Center, Nashville, TN | A | Yale‐New Haven Hospital, New Haven, CT | B |
| Wake Forest Baptist Medical Center, Winston‐Salem, NC | A | ||
RESULTS
Out of these 35 top hospitals, those that participated in the Leapfrog Survey generally received higher scores than the nonparticipants (Table 2). The group of participating hospitals received an average grade of A (mean safety score, 3.165; standard error of the mean [SE], 0.081), whereas the nonparticipating hospitals received an average grade of B (mean safety score, 3.012; SE, 0.047). These grades were consistent whether mean or median scores were used.
To further examine the potential bias against nonparticipating hospitals, the safety scores for each of the 17 nonparticipating hospitals were estimated as if they had participated in the Leapfrog Survey. The letter grade of this group increased from an average of B (mean safety score, 3.012; SE, 0.047) to an average of A (mean safety score, 3.216; SE, 0.046). Among the 17 nonparticipating hospitals, 15 showed an increase in safety score, of which 8 hospitals rescored a change in score significant enough to receive 1 or 2 letter grades higher (Table 3). Only 2 hospitals had slight decreases in safety score, without any impact on letter grade.
| Hospital | Original Score (Grade) | Estimated Scorea (Grade) |
|---|---|---|
| ||
| Abbott Northwestern Hospital, Minneapolis, MN | 3.17 (A) | 3.44 (A) |
| Barnes‐Jewish Hospital/Washington University, St. Louis, MO | 2.83 (C) | 3.11 (B) |
| Baylor University Medical Center, Dallas, TX | 2.90 (C) | 3.25 (A) |
| Cedars‐Sinai Medical Center, Los Angeles, CA | 2.92 (C) | 3.30 (A) |
| Cleveland Clinic, Cleveland, OH | 2.76 (C) | 2.78 (C) |
| Florida Hospital, Orlando, FL | 2.98 (B) | 3.38 (A) |
| Hospital of the University of Pennsylvania, Philadelphia, PA | 3.29 (A) | 3.26 (A) |
| Indiana University Health, Indianapolis, IN | 3.14 (A) | 3.37 (A) |
| Mount Sinai Medical Center, New York, NY | 3.01 (B) | 3.02 (B) |
| New York‐Presbyterian Hospital, New York, NY | 2.76 (C) | 3.15 (A) |
| NYU Langone Medical Center, New York, NY | 3.26 (A) | 3.30 (A) |
| Ochsner Medical Center, New Orleans, LA | 3.19 (A) | 3.59 (A) |
| Tampa General Hospital, Tampa, FL | 2.86 (C) | 3.05 (B) |
| University of Iowa Hospitals and Clinics, Iowa City, IA | 2.70 (C) | 3.00 (B) |
| University of Kansas Hospital, Kansas City, KS | 3.29 (A) | 3.35 (A) |
| UPMC, Pittsburgh, PA | 3.04 (B) | 3.24 (A) |
| Yale‐New Haven Hospital, New Haven, CT | 3.10 (B) | 3.08 (B) |
We applied the same methods to test the top 17 Honor Roll Hospitals as designated by US News & World Report; among them, half are participating hospitals and another half nonparticipating hospitals. One hospital, Johns Hopkins Hospital was not scored by Leapfrog because no relevant Medicare data are available for Leapfrog to calculate its safety score. For this reason, Johns Hopkins was excluded from our comparison. The results persist even with this smaller sample of top hospitals. The group of 8 participating hospitals had an average grade of A (mean safety score, 3.145; SE, 0.146), whereas another 8 nonparticipating hospitals received an average grade of B (mean safety score, 3.011; SE, 0.075).
DISCUSSION
The Leapfrog Group's intent to provide patient safety information to patients, physicians, healthcare purchasers, and hospital executives should be commended. However, the current methodology may disadvantage nonparticipating hospitals. The combination of lower maximum scores and increased weight of the CPOE and IPS scores may result in a lower hospital safety score than is justified. Nonparticipating hospitals may also face more intensive pressure from employers and payors to lower their reimbursement rates due to the newly released Leapfrog Hidden Surcharge Calculator.
Leapfrog acknowledges that the more data points a hospital has to be scored on, the better its opportunity to achieve a higher score.[8] This justification may lead to bias against nonparticipating hospitals. On the other hand, it is possible that hospitals with good safety records are more likely to participate in the Leapfrog Survey than those with poorer safety records. Without detailed nonresponse analysis from Leapfrog, it is impossible to know if there is a selection bias. Regardless, the Leapfrog result can subsequently misguide the payment rate negotiation between insurers and hospitals.
With this consideration in mind, Leapfrog should explicitly acknowledge the limitations of its methodology and consider revising it in future studies. For example, Leapfrog could only report on those measures for which there are data available for both participating and nonparticipating hospitals. Pending this revision, every effort must be made to distinguish between participating and nonparticipating hospitals. The outcomes of Leapfrog's hospital safety grades are made available online to consumers without distinguishing between participating and nonparticipating hospitals. The only method to differentiate the categories is to examine the data sources in detail amid a large volume of data. It is unlikely that consumers comparing hospital safety grades will take note of this caveat. Thus, Leapfrog's grading system can drastically misrepresent many nonparticipating hospitals' patient safety performances.
This study of The Leapfrog Group's Hospital Safety Score is not without limitations. The small sample utilized in this study limited the power of statistical testing. The difference in mean scores between participating and nonparticipating hospitals is not statistically significant. However, The Leapfrog Group uses specific numerical cutoff points for each letter grade classification. In this classification system statistical significance is not considered when assigning hospitals with different letter grades. It was clear that nonparticipating hospitals were more likely to receive lower letter grades than participating hospitals.
The small sample also posed challenges when attempting to account for missing data when comparing participating hospitals versus nonparticipating hospitals. Although a multiple imputation approach may have been ideal to address this, the small sample size coupled with the large amount of missing data (58% of hospitals did not participate in the Leapfrog Survey) led us to question the accuracy of this approach in this situation.[12] Instead, a crude, mean imputation approach was utilized, relying on the assumption that nonresponding hospitals had the same mean performance as responding hospitals on those domains where data were missing. In this study, we purposely selected a sample of hospitals from U.S. News & World Report's top hospitals. We believe the mean imputation approach, although not perfect, is appropriate for this sample of hospitals. Future study, however, should examine if hospitals that anticipated lower performance scores would be less likely to participate in the Leapfrog Survey. This would help strengthen Leapfrog's methodology in dealing with nonresponsive hospitals.
ACKNOWLEDGMENTS
Disclosures: Harold Paz is the CEO of Penn State Hershey Medical Center, which did not participate in the Leapfrog Survey. The authors have no financial conflicts of interest to report.
- , , . To Err Is Human: Building a Safer Health System. Washington, DC: National Academy Press; 2000.
- , , , , . The “To Err is Human” report and the patient safety literature. Qual Saf Health Care. 2006;15(3):174–178.
- , . A call to excellence. Health Aff (Millwood). 2003;22(2):113–115.
- US Department of Health and Human Services. Adverse events in hospitals: national incidence among Medicare beneficiaries. Available at: http://oig.hhs.gov/oei/reports/oei‐06‐09‐00090.pdf. Published November 2010. Accessed on August 2, 2013.
- The Leapfrog Group. The Leapfrog Group—fact sheet 2013. Available at: https://leapfroghospitalsurvey.org/web/wp‐content/uploads/Fsleapfrog.pdf. Accessed October 9, 2013.
- The Leapfrog Group. Hospital Safety score scoring methodology. Available at: http://www.hospitalsafetyscore.org/media/file/HospitalSafetyScore_ScoringMethodology_May2013.pdf. Published May 2013. Accessed June 17, 2013.
- The Leapfrog Group. The Hidden Surcharge Americans Pay for Hospital Errors 2013. Available at: http://www.leapfroggroup.org/employers_purchasers/HiddenSurchargeCalculator. Accessed August 2, 2013.
- The Leapfrog Group. 2013 Leapfrog Hospital Survey Reference Book 2013. https://leapfroghospitalsurvey.org/web/wp‐content/uploads/reference.pdf. Published April 1, 2013. Accessed June 17, 2013.
- , , , et al. Safety in numbers: the development of Leapfrog's composite patient safety score for U.S. hospitals [published online ahead of print September 27, 2013]. J Patient Saf. doi: 10.1097/PTS.0b013e3182952644.
- The Leapfrog Group. Measures in detail. Available at: http://www. hospitalsafetyscore.org/about‐the‐score/measures‐in‐detail. Accessed June 17, 2013.
- The Leapfrog Group. Explanation of safety score grades. Available at: http://www.hospitalsafetyscore.org/media/file/ExplanationofSafety ScoreGrades_May2013.pdf. Published May 2013. Accessed June 17, 2013.
- , , , et al. Multiple imputation for missing data in epidemiological and clinical research: potential and pitfalls. BMJ. 2009;338:b2393.
Discovery may aid vaccine design for P vivax malaria

attached to syncytiotrophoblast
Credit: Fabio T.M. Costa
Plasmodium vivax malaria attacks red blood cells by clamping down on the cells with a pair of proteins, researchers have found.
Earlier studies suggested that a single P vivax protein binds to a protein on the surface of red blood cells.
But the new study showed that binding is a 2-step process that involves 2 copies of a parasite protein coming together like tongs around 2 copies of a host protein.
The researchers believe this discovery, detailed in PLOS Pathogens, could help scientists design better vaccines and treatments for P vivax, which is common in India, Southeast Asia, and South America.
“More people live at risk of infection by this strain of malaria than any other,” said senior study author Niraj Tolia, PhD, of the Washington University School of Medicine in St Louis, Missouri.
“We now are using what we have learned to create vaccines tailored to stop the infectious process by preventing the parasite from attaching to red blood cells.”
Dr Tolia and his colleagues knew that P vivax Duffy binding protein (DBP) recognizes the receptor Duffy antigen/receptor for chemokines (DARC) during the parasite’s invasion of red blood cells. But the team wanted to identify binding contacts during invasion and determine the molecular basis of DBP receptor recognition.
So they conducted structural studies on the minimal binding domain of DBP in complex with the minimal region from DARC. And they found that 2 DBP molecules bind 2 DARC molecules.
The researchers also performed erythrocyte binding assays with binding site mutants and identified essential receptor contacts.
“It’s a very intricate and chemically strong interaction that was not easily understood before,” Dr Tolia said. “We have had hints that other forms of malaria, including the African strain, may be binding in a similar fashion to host cells, but this is one of the first definitive proofs of this kind of attack.”
Dr Tolia suspects that blocking any of the proteins with drugs or vaccines will stop the infectious process.
“For example, some people have a mutation that eliminates the protein on red blood cell surfaces that P vivax binds to, and they tend to be resistant to the parasite,” he said. “This is why this strain isn’t prevalent in Africa. Evolutionary pressure has caused most of the populations there to stop making this protein.”
Dr Tolia and his colleagues also found evidence that other people with immunity to P vivax have developed naturally occurring antibodies that attach to a key part of the parasite’s binding protein, preventing infection.
“The parasite protein is very large, and human antibodies bind to it at many different points along its length,” Dr Tolia explained. “We have observed that the ones that are most effective, so far, are the antibodies that bind to the protein at the region highlighted by our new research.” ![]()
Team identifies mutations that may drive FL
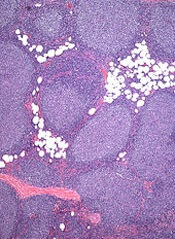
Genetic profiling has provided a clearer picture of follicular lymphoma (FL) development and progression, according to research published in Nature Genetics.
Investigators performed whole-genome and whole-exome sequencing of samples from FL patients and found a number of mutations that appeared to be responsible for disease onset.
The team also identified mutations that seemed to drive FL toward a more aggressive form.
They said these findings provide a number of new therapeutic targets that may stop FL from becoming aggressive or developing resistance to treatment.
“Resistance to treatment is a major problem for follicular lymphoma patients, as they often respond well to treatment and later relapse,” said study author Jude Fitzgibbon, PhD, of Barts Cancer Institute in London, England.
“[This] gives the cancer multiple opportunities to evolve into a more aggressive and more difficult-to-treat form of the disease. We’ve been able to chronicle the chain of genetic events that leads to aggressive forms of the disease. If we can develop treatments to prevent some of these changes from taking place, we should be able to stop the cancer in its tracks.”
Dr Fitzgibbon and his colleagues performed whole-genome or whole-exome sequencing of sequential FL and transformed FL pairs and matched germline samples from 10 FL cases with deep-targeted sequencing of 28 genes in an extension cohort.
Among the 10 cases, the researchers identified 1560 protein-altering variants affecting 908 genes, including missense changes (84.8%), short indels (8.9%), and nonsense mutations (6.3%).
Patterns of evolution
The investigators constructed phylogenetic trees for the 10 FL cases and discovered a common progenitor clone (CPC), as well as 2 patterns of evolution.
Eight of the cases exhibited evolution through a “rich” ancestral CPC, showing high clonal semblance between the FL and transformed-FL tumors. The other 2 cases showed evolution through a “sparse” CPC, with only 4 nonsynonymous mutations shared by the FL and transformed-FL samples.
These 2 patterns of evolution shared mutations in 3 genes—KMT2D, TNFRSF14, and CREBBP. According to the researchers, this suggests tumor dependency on these alterations during lymphomagenesis and progression.
Mutation prevalence, timing
The investigators then set out to determine the prevalence of the mutations they identified in the 10 cases. They performed deep-targeted resequencing of 28 candidate genes in an extension cohort of 100 independent FL biopsies and 32 paired FL-transformed FL cases (including the 10 index cases).
More than 70% of cases had concurrent mutations in at least 2 of the histone-modifying enzymes screened (CREBBP, EZH2, MEF2B, and KMT2D).
Twenty-eight percent of cases had mutations affecting at least one histone H1 gene. HIST1H1C and HIST1H1E were the most frequently mutated.
The researchers also saw frequent mutations in components of the JAK-STAT signaling pathway, including STAT6 (12%) and SOCS1 (8%).
They found mutually exclusive mutations in the NF-κB signaling pathway in a third of FLs, including CARD11 (11%) and TNFAIP3 (11%).
And 17% of cases had mutations in genes important for B-cell development, including Ebf1.
Finally, the investigators set out to differentiate early genetic events from late ones. They found that mutations in histone-modifying genes—KMT2D, CREBBP, and EZH2—as well as mutations in STAT6 and TNFRSF14 were predominantly clonal events.
On the other hand, mutations in EBF1 and regulators of NF-κB signaling—MYD88 and TNFAIP3—were gained at transformation.
“This study has uncovered some of the key molecular changes taking place [in FL] and offers new targets for treating the disease,” said Nell Barrie, of Cancer Research UK, the organization that funded this study.
“Research into the genetics that underpin cancer is helping us to better know the enemy and find new ways in which we might beat it.” ![]()
Vive la difference
The scenario was familiar. Henry looked peeved. Mary looked anxious. Henry spoke first.
"This spot on my nose has been there for months," he said. "I’m concerned because we’ll be in the sun in Aruba next week."
I examined Henry. "It’s not skin cancer," I said. "Just leave it alone, and it’ll be fine.
"Of course," I went on, "you’ll want to take sensible sun precautions while you’re on vacation, a hat, sunscreen, and so forth." That’s when Mary spoke up.
"You know, Doctor," she said, "Henry does not take sensible sun precautions."
"Yes I do!" Henry objected. "At 10 every morning I leave the beach ..." Mary interrupted him. "He abuses the sun, even though I remind him every day." You could tell by Henry’s hangdog expression that "every day" was no exaggeration.
In its many forms, the eternal battle of the sexes has been examined in countless books, plays, movies, and sitcoms. Gender stereotypes don’t tell the whole story, but without some truth they wouldn’t become stereotypes. There is no getting around the fact that men and women often have their own ways of looking at the world. One part of the world they see differently is health in general and skin health in particular.
I don’t know what life is like on other planets, but if it’s true that men are from Mars and women are from Venus, then it follows that:
• People on Venus follow instructions, eat right, and take care of things so they don’t get out of control. People on Mars can’t be bothered with stuff like that.
• People on Venus wash regularly and use good products. On Mars they don’t much care.
• Venusians moisturize and use sunscreen. Not Martians.
Mini-dramas like that of Henry and Mary play themselves out in our offices all the time. Women take health maintenance more seriously than men do (or than men like to pretend they do.) Proper face washing (in adolescents), regular mole checks (in adults), and careful sun care (especially among the older set) are common flashpoints of gender disagreement. By and large, women feel responsible to make sure men do the right thing, while men just want to be left alone. "I’m only here because..." says the man, but I cut him off. I know why he’s here. It’s just a question of which woman got him there. Real men, you see, don’t ask directions or visit doctors.
One of the right things that women feel obliged to encourage is moisturizing. Men are functional: We shop when we need something and we moisturize when we feel dry. Women think you should moisturize every day, regardless, to make skin healthier and ward off aging.
Maybe so, maybe not, but we men as a group really dislike the feel of lotions on our skin and resist applying them. We find the sensation unpleasant, and anyhow don’t get why we should bother in the first place. Women in turn can’t figure why men should be so cussedly defiant about doing what seems to them not just worthwhile but delightful.
Men, accompanied by women or sent in by them against their better judgment, often make a great show of being put upon. They shrug, roll their eyes, and look irritated, much as they did when they were 8 years old and their mother said, "Tell him, Doctor. Tell him to eat his vegetables. Tell him to wash his face." Now that he’s grown up, her plea is more likely to be, "Tell him, Doctor. Tell him he has to get his spots checked and put sunscreen on every day. Maybe he’ll listen to you. I tell him all the time but he never listens to me." When that happens, I try to split the difference when I can and let both parties save face. After all, they have to live with each other, not with me.
Besides, men’s little secret is that we expect the women in our lives to take care of us and make sure we do the right things that we can’t be bothered to do for ourselves. For many couples, that’s the unspoken deal. We men know it, but we keep it quiet, even from ourselves. Shh, don’t tell anybody ...
Besides, we don’t even have to ask directions anymore. We’ve got GPS!
Dr. Rockoff practices dermatology in Brookline, Mass. He is on the clinical faculty at Tufts University School of Medicine, Boston, and has taught senior medical students and other trainees for 30 years. Dr. Rockoff has contributed to the Under My Skin column in Skin & Allergy News since January 2002. Skin & Allergy News is a publication of Frontline Medical Communications.

Zinc oxide, part 2
Nanotechnology, which applies gathered knowledge on the characteristics of matter to design new products on the nanoscale (<1,000 nm), emerged in the 1980s and has made great strides since then. Dermatology is a prime area of interest for nanotech applications, as numerous products using nanotechnology have been marketed. In fact, the sixth-largest U.S. patent holder in nanotechnology is a cosmetics company (Skin Therapy Lett. 2010;15:1-4). The newest generation of skin products is characterized by improved skin penetration (Arch. Dermatol. Res. 2011;303:533-50), and these products may have a role in enhancing the treatment of several skin disorders; however, toxicological studies must establish the safety of formulations increasingly likely to penetrate multiple skin layers.
Zinc oxide (ZnO) and titanium dioxide (TiO2) are two of the most prominent ingredients in the dermatologic armamentarium that are used in micro- and nanoparticle forms. Efficacy has been well established for these ingredients as inorganic sunscreens, but their relative safety has been debated and remains somewhat controversial. This column discusses findings regarding the safety of ZnO nanoparticles.
Elevated risk
Absorption and effects of zinc ions. In a small study (n = 20) in humans conducted in 2010, Gulson et al. found that small amounts of zinc from ZnO in sunscreens applied for five consecutive days outdoors were absorbed in the skin, with levels of the stable isotope tracer (68)Zn in blood and urine from females receiving the nano sunscreen higher than in males receiving the same sunscreen and higher than in all participants who received the bulk sunscreen (Toxicol. Sci. 2010;118:140-9).
In 2010, Martorano et al. examined the separation of zinc ions from ZnO in commercial sunscreens under UVB exposure and studied the effects of zinc ion accumulation in human epidermal keratinocytes. They noted that UVB light exposure led to a significant concentration-dependent and radiation intensity–dependent rise in zinc ion levels. In turn, a late- or delayed-type cytotoxicity in human epidermal keratinocytes was observed, as was the induction of reactive oxygen species (ROS) in the keratinocytes. The investigators concluded that UVB exposure leads to an elevation in zinc ion dissociation in ZnO sunscreen, yielding cytotoxic effects and oxidative stress (J. Cosmet. Dermatol. 2010;9:276-86).
Genotoxic potential. As Wang and Tooley aptly noted, the concerns regarding the safety of nanoparticles in sunscreens pertain to potential toxicity and capacity to penetrate the skin (Sem. Cutan. Med. Surg. 2011;30:210-13).
In a 2010 in vitro study of the toxicity of ZnO and TiO2 on keratinocytes over short- and long-term application periods, Kocbek et al. found that ZnO nanoparticles conferred more adverse effects than TiO2, with ZnO inhibiting cell viability above 15 mcg/mL after brief exposure while TiO2 exerted no effect up to 100 mcg/mL. Prolonged exposure to ZnO nanoparticles at 10 mcg/mL yielded diminished mitochondrial activity as well as changes in cell morphology and cell-cycle distribution; no such changes were associated with TiO2 nanoparticles. The researchers also reported more nanotubular intercellular structures in keratinocytes exposed to either nanoparticle type as compared to unexposed cells and nanoparticles present in vesicles within the cell cytoplasm. Finally, they observed that partially soluble ZnO spurred the synthesis of ROS, as opposed to insoluble TiO2. They concluded that their findings of an adverse effect on human keratinocytes suggest that long-term exposure to ZnO and TiO2 nanoparticles poses a possible health risk (Small 2010;6:1908-17).
In early 2011, Sharma et al. studied the cytotoxic and genotoxic potential of ZnO nanoparticles in the human liver carcinoma cell line HepG2, given what they argued was the pervasiveness of ZnO in consumer products and industrial applications and the concomitant likelihood of transmission to the liver. Their various assays revealed a significant concentration- and time-dependent toxicity after 12 and 24 hours at 14 and 20 mcg/mL, as well as a significant surge in DNA damage in cells exposed to ZnO nanoparticles for 6 hours (J. Biomed. Nanotechnol. 2011;7:98-9).
Previously, in 2009, Sharma et al. had investigated the potential genotoxicity of ZnO nanoparticles in the human epidermal cell line A431. They found concentration- and time-dependent decreases in cell viability as well as DNA damage potential, as revealed by Comet assay results. In addition, oxidative stress was provoked by ZnO nanoparticles, as evidenced by significant reductions in glutathione, catalase, and superoxide dismutase. The investigators urged caution related to dermatologic formulations containing ZnO nanoparticles, suggesting that their findings indicate a genotoxic potential in human epidermal cells, possibly mediated via lipid peroxidation and oxidative stress (Toxicol. Lett. 2009;185:211-8).
In May 2011, Sharma et al. investigated the biological interactions of ZnO nanoparticles in human epidermal keratinocytes, where electron microscopy showed the internalization of the nanoparticles after 6 hours of exposure at a concentration of 14 mcg/mL. Various assays revealed a time- and concentration-dependent suppression of mitochondrial activity as well as DNA damage in cells, compared with controls. The investigators concluded that ZnO nanoparticles are internalized by human epidermal keratinocytes and provoke a cytotoxic and genotoxic response, providing reason for caution when using consumer products containing nanoparticles. Specifically, they warned that any disruptions in the stratum corneum (SC) could allow the exposure of internal cells to nanoparticles (J. Nanosci. Nanotechnol. 2011;11:3782-8).
Also, in a recent study of the interactions of ZnO nanoparticles with the tumor suppressor p53, Ng et al. found that the p53 pathway was activated in BJ cells (skin fibroblasts) upon treatment with ZnO nanoparticles, leading to a reduction in cell numbers. One implication of this response, the researchers concluded, was that in cells lacking robust p53, the protective response can be turned toward carcinogenesis due to exposure to DNA damage–inducing agents like ZnO nanoparticles (Biomaterials 2011;32:8218-25).
Weight of evidence
However, several researchers contend that current data strongly suggest that nanosized ZnO and TiO2 do not, in fact, pose such risks (Photodermatol. Photoimmunol. Photomed. 2011;27:58-67; Int. J. Dermatol. 2011;50:247-54; Sem. Cutan. Med. Surg. 2011;30:210-13).
In 2009, in response to increasing concerns about the potential adverse effects of ZnO- and TiO2-coated nanoparticles used in physical sunblocks, Filipe et al. evaluated the localization and possible skin penetration of these nanoparticles in three sunscreen formulations under realistic in vivo conditions in normal and altered skin. They tested a hydrophobic formulation containing coated 20-nm TiO2 nanoparticles and two commercially available formulations containing TiO2 alone or in combination with ZnO. The goal was to assess how consumers actually use sunscreens in comparison to the recommended standard condition for the sun protection factor test. Traces of the physical blockers could only be detected at the skin surface and uppermost area of the SC in normal human skin after a 2-hour exposure. No ZnO or TiO2 nanoparticles could be detected in layers deeper than the SC after 48 hours of exposure. The investigators concluded that significant penetration by ZnO or TiO2 nanoparticles into keratinocytes is unlikely (Skin Pharmacol. Physiol. 2009;22:266-75).
According to a safety review by Schilling et al., the current evidence implies that there are minimal risks to human health posed from the use of ZnO or TiO2 nanoparticles at concentrations of up to 25% in cosmetic preparations or sunscreens, regardless of coatings or crystalline structure. The researchers observed that these nanoparticles incorporated in topical products occur as aggregates of primary particles 30-150 nm in size that bond in a way that leaves them impervious to the force of product application. Consequently, their structure is unaffected, and no primary particles are released (Photochem. Photobiol. Sci. 2010;9:495-509).
Newman et al. reviewed studies and position statements from 1980 to 2008 in order to characterize the safety, use, and regulatory conditions related to nanosized ZnO and TiO2 in sunscreens. They reported that, while no data suggested significant penetration of the particles beyond the SC, there is a need for additional studies simulating real-world conditions, especially related to UV exposure and sunburned skin (J. Am. Acad. Dermatol. 2009;61:685-92).
In 2011, Monteiro-Riviere et al. performed in vitro and in vivo studies in which pigs received moderate sunburn from UVB exposure. The researchers found that UVB-damaged skin slightly mediated ZnO or TiO2 nanoparticle penetration in multiple tested sunscreen formulations, but they observed no transdermal absorption (Toxicol. Sci. 2011;123:264-80).
Conclusion
Zinc oxide has long been used as one of the two primary inorganic physical sunscreens. Its use in nanoparticle form has appeared effective, but the different physicochemical qualities of the metal oxide in nanosized form have prompted questions regarding safety. Current data suggest minimal risk to intact skin, but additional studies are needed.
Dr. Baumann is chief executive officer of the Baumann Cosmetic & Research Institute in Miami Beach. She founded the cosmetic dermatology center at the University of Miami in 1997. Dr. Baumann wrote the textbook "Cosmetic Dermatology: Principles and Practice" (McGraw-Hill, April 2002), and a book for consumers, "The Skin Type Solution" (Bantam, 2006). She has contributed to the Cosmeceutical Critique column in Skin & Allergy News since January 2001 and joined the editorial advisory board in 2004. Dr. Baumann has received funding for clinical grants from Allergan, Aveeno, Avon Products, Galderma, Mary Kay, Medicis Pharmaceuticals, Neutrogena, Philosophy, Stiefel, Topix Pharmaceuticals, and Unilever.