User login
Team reproduces HSPCs in artificial bone marrow

artificial bone marrow
Credit: C. Lee-Thedieck
Researchers say they have developed artificial bone marrow analogs that can be used to reproduce hematopoietic stem and progenitor cells (HSPCs).
The team created macroporous hydrogel scaffolds that mimic the stem cell niche of the bone marrow.
When they introduced mesenchymal stem cells (MSCs) from actual bone marrow into the analogs, the MSCs promoted HSPC proliferation.
In fact, the MSCs preserved HSPC stemness more effectively in the analogs than in standard 2-dimensional cell culture systems.
Annamarija Raic, of the Max Planck Institute for Intelligent Systems in Stuttgart, Germany, and her colleagues reported these results in Biomaterials.
The researchers noted that reproducing functional HSPCs in the lab has proven challenging. The cells cannot be cultured in vitro for a feasible period of time without differentiating.
So the team set out to create a culture system that mimics the important physical and biological parameters of the stem cell niche: the 3D architecture, the adhesive extracellular matrix, soluble factors, and the stromal cell compartment.
They used salt leaching technology to produce poly(ethylene glycol) diacrylate hydrogel scaffolds that could soak cells into their pores. To biofunctionalize the scaffolds, the investigators added an RGD peptide carrying an acrylate moiety.
They then introduced 3 different cell types into the scaffolds—the human osteosarcoma cell line CAL72, MSCs from bone marrow, and MSCs from umbilical cord blood—to see which best supported the proliferation of CD34+ HSPCs isolated from cord blood.
Each of the cell types supported HSPC proliferation, but bone marrow MSCs were the most effective. The researchers therefore decided to use bone marrow MSCs when they compared their 3D scaffolds to a 2D culture system.
The bone marrow MSCs had a beneficial effect on HSPC proliferation in the 2D cell cultures. Over 4 days, HSPCs divided 1 to 2 times more often when they were cultured with bone marrow MSCs than without the cells.
In the 3D scaffolds, HSPC proliferation was comparable or slightly lower than that observed in the 2D cultures. However, the scaffolds had a higher percentage of CD34+ HSPCs after 4 days.
The investigators therefore concluded that their hydrogel scaffolds meet the basic requirements for creating artificial stem cell niches. ![]()
Overview of HIV and AIDS

NK cells target malaria-infected RBCs

Credit: Bjorn Onfelt/Dan Davis
The parasites that cause malaria are adapted to the hosts they infect, so studying the disease in mice doesn’t necessarily reveal information that translates to human disease.
But scientists believe they may have overcome this limitation. They’ve developed a strain of mice that mimics many features of the human immune system and can be infected with Plasmodium falciparum.
Using this strain, the researchers discovered that natural killer (NK) cells preferentially interact with and kill infected red blood cells (RBCs) in a contact-dependent manner.
The group recounted this discovery in PNAS.
“Human malaria studies have been hampered by a lack of animal models,” said study author Jianzhu Chen, PhD, of the Singapore-MIT Alliance for Research and Technology in Singapore.
“This [research] paves the way to start dissecting how the host human immune system interacts with the pathogen.”
Scientists studying malaria in mice previously generated mice with human RBCs. But these mice have compromised immune systems, so they can’t be used to study the immune response to malaria infection.
Over the past several years, Dr Chen and his colleagues have developed strains of mice that have the human cells necessary for a comprehensive immune response.
To generate these cells, the researchers deliver human hematopoietic stem cells, along with cytokines that help them mature into B and T cells, NK cells, and macrophages. These mice have already proven useful to study other diseases, such as dengue fever.
To adapt the mice for the study of malaria, the scientists injected them with human RBCs every day for a week, at which point 25% of their RBCs were human. And this was enough for the malaria parasite to cause an infection.
The researchers investigated the role of NK cells and macrophages during the first 2 days of malaria infection. And they found that eliminating macrophages had very little impact on the immune response during those early stages.
However, in mice lacking NK cells, parasite levels went up 7-fold, suggesting that NK cells are critical to controlling infection early on.
To further investigate the role of NK cells, the scientists placed human NK cells in a sample of infected and uninfected RBCs. The NK cells randomly interacted with both types of cells, but they latched onto infected cells much longer, eventually killing them.
The researchers also identified a cell adhesion protein called LFA-1 that helps NK cells bind to RBCs. They are now studying this process in more detail and trying to determine what other molecules, including those produced by the malaria parasite, might be involved.
Dr Chen and his colleagues also hope to use these mice to study experimental malaria vaccines or drugs. And in another future study, they plan to inject the mice with RBCs from patients with sickle cell anemia to investigate how the sickle-shaped cells help people survive malaria infection. ![]()
States’ restrictions hinder ACA rollout

Credit: Rhoda Baer
As implementation of the Affordable Care Act (ACA) continues, a new report indicates that most community health centers across the US are attempting to help uninsured individuals obtain health insurance.
But health centers in certain states are hampered in their outreach and enrollment efforts and are significantly less optimistic about the impact of health reform in their communities.
“These findings show the effects of state policies that are designed to stand in the way of health reform,” said study author Sara Rosenbaum, of the George Washington University School of Public Health and Health Services in Washington, DC.
“These restrictive policies are measurably impairing community-level efforts to cover the uninsured. Without the Medicaid expansion or comprehensive enrollment assistance, millions of people in medically underserved communities could go without the benefits provided under the Affordable Care Act.”
Using data from a nationwide survey, Rosenbaum and her colleagues examined the early outreach and enrollment efforts of 606 community health centers across the US.
The data showed that, by early October 2013, virtually all of the responding health centers had received enhanced outreach funding.
And three quarters of them had already instituted expanded outreach and enrollment assistance efforts, such as one-on-one assistance with online and paper applications for health insurance, and enrollment help in multiple languages.
The researchers also compared health center outreach and enrollment in the 21 states (and Washington DC) that have embraced health reform to health centers in 9 states that have resisted or rejected key parts of the ACA.
The 9 “restrictive” states were those that had rejected an expansion of Medicaid and adopted policies or Navigator laws that make it harder to provide assistance to the uninsured.
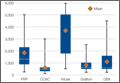
The comparison showed that community health centers in the restrictive states had significantly more limited outreach and enrollment resources and had significantly fewer enrollment staff. Restrictive states had an average of 3 full-time enrollment staff members, compared to 6 staff members in full-implementation states.
Furthermore, health centers in restrictive states were significantly less likely than those in full-implementation states to be assessing patient eligibility for insurance coverage—59% and 79%, respectively.
And health centers in the 9 restrictive states were significantly less optimistic about the potential impact of the ACA on their patients.
In restrictive states, nearly 1 in 6 health center leaders expected at least half of their patients to remain uninsured. In full-implementation states, only 2% of leaders said the same.
For more details, see the full report, “Assessing the Potential Impact of State Policies on Community Health Centers’ Outreach and Enrollment Activities.” ![]()
Credit: Rhoda Baer
As implementation of the Affordable Care Act (ACA) continues, a new report indicates that most community health centers across the US are attempting to help uninsured individuals obtain health insurance.
But health centers in certain states are hampered in their outreach and enrollment efforts and are significantly less optimistic about the impact of health reform in their communities.
“These findings show the effects of state policies that are designed to stand in the way of health reform,” said study author Sara Rosenbaum, of the George Washington University School of Public Health and Health Services in Washington, DC.
“These restrictive policies are measurably impairing community-level efforts to cover the uninsured. Without the Medicaid expansion or comprehensive enrollment assistance, millions of people in medically underserved communities could go without the benefits provided under the Affordable Care Act.”
Using data from a nationwide survey, Rosenbaum and her colleagues examined the early outreach and enrollment efforts of 606 community health centers across the US.
The data showed that, by early October 2013, virtually all of the responding health centers had received enhanced outreach funding.
And three quarters of them had already instituted expanded outreach and enrollment assistance efforts, such as one-on-one assistance with online and paper applications for health insurance, and enrollment help in multiple languages.
The researchers also compared health center outreach and enrollment in the 21 states (and Washington DC) that have embraced health reform to health centers in 9 states that have resisted or rejected key parts of the ACA.
The 9 “restrictive” states were those that had rejected an expansion of Medicaid and adopted policies or Navigator laws that make it harder to provide assistance to the uninsured.
The comparison showed that community health centers in the restrictive states had significantly more limited outreach and enrollment resources and had significantly fewer enrollment staff. Restrictive states had an average of 3 full-time enrollment staff members, compared to 6 staff members in full-implementation states.
Furthermore, health centers in restrictive states were significantly less likely than those in full-implementation states to be assessing patient eligibility for insurance coverage—59% and 79%, respectively.
And health centers in the 9 restrictive states were significantly less optimistic about the potential impact of the ACA on their patients.
In restrictive states, nearly 1 in 6 health center leaders expected at least half of their patients to remain uninsured. In full-implementation states, only 2% of leaders said the same.
For more details, see the full report, “Assessing the Potential Impact of State Policies on Community Health Centers’ Outreach and Enrollment Activities.” ![]()
Thinking about the institution of marriage – Part II
An earlier column reviewed the institution of marriage up to the middle of the last century. Since the 1950s, postmodernism has been gathering momentum, beginning as a critique of art, architecture, philosophy, and how we think about society and culture. Views on many aspects of our lives, as we live it, began to change.
Postmodernism stands in contrast to the "modern’ " or scientific view that touts a singularity of truth and a singular view of the world. Social construction is a type of postmodern theory that states that truth, reality, and knowledge are based in the social context of that particular person. This aspect of postmodernism is most applicable to mental health professionals assessing and treating patients, and to families in specific social and cultural contexts.
A postmodern view of the family considers the traditional view of the family, the "nuclear family," as only one view. Other forms of family and other views of marriage that had been marginalized, considered deviant and nonconforming, are now brought forward and considered as viable alternatives. Postmodernism discards many assumptions that we have been taught. One assumption that is being reexamined, for example, is that sexual nonexclusivity or extra-relationship sex, or romantic involvements are symptoms of troubled relationships or forms of sexual acting out.
Another assumption that needs to be reexamined is the notion that family structures found in other cultures are "abnormal" or dysfunctional. These assumptions are not necessarily true or false but require assessment in context of the relationship at hand. Postmodernism challenges us to assess each family variation on its own merit.
Beginnings
In the 20th century, Monica McGoldrick, Ph.D., one of the strong voices in family therapy, advocated for increased sensitivity to cultural variation. Her book, "Ethnicity and Family Therapy" (New York: The Guilford Press, 2005), describes characteristics of common ethnicities in American society.
Family therapists have attempted to address "nontraditional" families with articles, for example, about raising a biracial child, what to do if your child identifies as gay, etc. Most older articles focused on helping families "cope" with the nontraditional. Family therapists are now more willing to acknowledge "difference" as a normal rather than a pathological variant, and to recognize strengths inherent in diversity.
Acknowledging diversity
Marlene F. Watson, Ph.D., brings a nuanced understanding of the African American family, detailing the effect of slavery on the individuals in the family, and how internalized racism can be recognized and managed in family therapy (e-book, "Facing the Black Shadow," 2013). This is an important book for therapists, especially those who come from traditional families, as it articulates the reality of African American lives in a way that therapists can apply to clinical practice.
Dr. Watson illustrates through case examples how internalized racism affects marriages, and offers effective ways to help couples negotiate and overcome the negative aspects of their heritage. A postmodern stance also will help the couple recognize the resilience and strengths that are inherent in overcoming adversity.
Linda M. Burton, Ph.D., and Cecily R. Hardaway, Ph.D., highlight the role of "othermothers" in raising children in low-income families, be they white, Latino, or African American. They define "othermothering" as a form of coparenting, distinct from stepparenting. Women othermother children who are their romantic partners’ children from previous and concurrent relationships. Compared to stepfamilies, these multiple partner fertility relationships are more prevalent among young couples with limited financial resources, contentious relationships, and serial childbearing through serial repartnering.
In general, low-income women and women of color take on this style of coparenting to help the biological parents of relatives and friends who have limited social and psychological capital to protect and raise "good children"(Fam. Process. 2012;51:343-59). Family therapists will become much more effective if they understand and recognize that the motivation behind this form of mothering fosters resilience in the mothers. The more we know and understand alternate family structures, the more we can work toward building and sustaining resilience.
Assimilation has for many decades been the main focus of political and therapeutic endeavors. In postmodern times, transnationalism described a new way of thinking about relationships that extend across national boundaries and cultures (Fam. Process. 2007;46:157-71).
Immigrants maintain connections with their countries of origin with children who are parented by grandparents, or other relatives, perhaps in several countries at the same time. Family members use Skype, often daily, to connect with the matriarch or patriarch "back home."
Postmodern theories of social justice and cultural diversity work well with immigrants, bringing multiple perspectives into the treatment room. Immigrants bring many complex and diverse values in relation to marriage, gender, parenting, and religious practices. A social justice approach focuses on the racism and discrimination that is common in the lives of immigrants. Marriage might take place across nations, be arranged, or might be mixed race or mixed nationalities. Therapy that acknowledges these complexities will be most helpful. We still need to think further about global family life, how relationships evolve over long distances, and how to develop systemic and transnational interventions for separations and reunifications.
Sex and marriage
Nelson Mandela’s father had four wives, and he reported in an interview that he considered all of them his mothers and gained support from them all.
Polygamy has flourished in Africa and Asia for centuries, and more than 40 countries recognize polygamous marriages. In the former Soviet republic of Kazakhstan, rich Kazakhs used to buy second wives from parents, often in exchange for livestock. Since Kazakhstan’s independence in 1991, polygamy, although illegal, has again become common practice and is a status symbol for rich Kazakhs. Polygamy reportedly also is a way out of poverty for young women who save money and support their relatives back home
In the United Kingdom, polygamy has become more common in Muslim communities. Successful British Muslim women, who have delayed marriage to build careers, may choose to become a co-wife. They choose to share a husband in a relationship that they see as sanctioned by Islam. These women retain an independent lifestyle. "I didn’t want a full-time husband," one Muslim woman noted in an interview.
In the United States, the practice of polygamy was officially ended in the Mormon church in 1890. Nevertheless, several small "fundamentalist" groups continue the practice. One family of 14 wives and 17 children, the Browns of Nevada, are stars of a reality show that they reportedly hope educates the public about the choice.
Polyandry, a woman with multiple husbands, is described in many cultures. This practice frequently involves the marriage of all brothers in a family to the same wife, which allows family-owned land to remain undivided. In some cultures, such as the Inuit, a man might arrange a second husband (frequently his brother) for his wife because he knows that, when he is absent, the second husband will protect his wife. Should she become pregnant while he is gone, it would be by someone he had approved in advance.
Penn State’s Stephen Beckerman, Ph.D., and his colleagues, in their study of the Bari people of Venezuela, found that children understood to have two fathers are significantly more likely to survive to age 15 than are children with only one. This is called "informal polyandry," because while the two fathers might not be formally married to and living with the mother in all cases, the society around them officially recognizes both men as legitimate mates to the mother, and father to her child.
Polyamory, the practice of open, multiple-partner relationships, is a structure that is increasingly common in Western countries, according to sociologist Elisabeth Sheff, Ph.D. Dr. Sheff’s 15 years of research leads her to believe that polyamory is a "legitimate relationship style that can be tremendously rewarding for adults and provide excellent nurturing for children."
She said she has found that children aged 5-8 do not seem to care about how the adults relate to one another, as long as they are taken care of. Overall, such children seem to fare well as long as they live in stable, loving homes.
Making this practice work, she acknowledges, is "time consuming and potentially fraught with emotional booby traps." People in polyamorous relationships emphasize that their relationships are about emotional connections with others, as opposed to primarily physical relationships.
The term polyfidelity, a subset of polyamory, was coined in the 1970s by members of the Kerista commune, which started in New York City in 1956. Polyfidelity is a concept in which clusters of friends form nonmonogamous sexual relationships. Under this family structure, group members do not relate sexually to anyone outside of the family group.
Although mainstream Judaism does not accept polyamory, some people do consider themselves Jewish and polyamorous. Sharon Kleinbaum, the senior rabbi at Congregation Beit Simchat Torah in New York, has said that polyamory is a choice that does not preclude a Jewishly observant, socially conscious life. Some polyamorous Jews also point to biblical patriarchs having multiple wives and concubines as evidence that polyamorous relationships can be sacred in Judaism.
Jim Fleckenstein, director of the Institute for 21st-Century Relationships, has said that the polyamory movement has been driven by science fiction and feminism. He states that disillusionment with monogamy occurs "because of widespread cheating and divorce."
One fact going for the polys (as they are often known), is the belief that polyamory is more honest and less hypocritical than monogamy with secret affairs. A manual, "What Psychology Professionals Should Know About Polyamory," for psychotherapists who deal with polyamorous clients, was published in September 2009 by the National Coalition for Sexual Freedom.
The late Michael Shernoff, who was an openly gay psychotherapist, wrote that nonmonogamy is "a well-accepted part of gay subculture," and that somewhere between 30% and 67% of men in male couples reported being in a sexually nonmonogamous relationship. A majority of male couples are not sexually exclusive, but describe themselves as emotionally monogamous.
Mr. Shernoff stated: One of the biggest differences between male couples and mixed-sex couples is that many, but by no means all, within the gay community have an easier acceptance of sexual nonexclusivity than does heterosexual society in general. Research confirms that nonmonogamy in and of itself does not create a problem for male couples when it has been openly negotiated (Fam. Process. 2006;45:407-18).
The role of affairs in marriage can now be subjected to a more nuanced discussion, after digesting the above views and practice of marriage. What is the meaning of an affair? What is an open relationship? What are the models of intimacy? Is an affair a breach in the couple’s definition of intimacy? What are the rules? How does a couple define an affair within the context of their own relationship?
Conclusion
Postmodernism provides family therapists a new set of theories and a new language for describing the variety of families. As Jacqueline Hudak, Ph.D., and Shawn V. Giammattei, Ph.D., have written: "As family therapists, we are uniquely poised to transform the meanings attached to ‘marriage’ and ‘family,’ to focus on the quality of relationships rather than on the gender of a partner or the assumption of particular roles" ("Expanding Our Social Justice Practices: Advances in Theory and Practice," Washington: American Family Therapy Academy, Winter 2010).
The traditional view of marriage is referred to as "heteronormativity" and is defined by the belief that a viable family consists of "a heterosexual mother and a father raising heterosexual children together" ("Handbook of Qualitative Research," Thousand Oaks, Calif.:Sage, 2000). Despite the above expansion of views on marriage and families, heteronormativity remains the current organizing principle of family theory, practice, research, and training. It will take many decades to shift the dominant paradigm. Developing awareness, and listening to families and couples is the first step.
Dr. Heru is with the department of psychiatry at the University of Colorado at Denver, Aurora. She is editor of the recently published book, "Working With Families in Medical Settings: A Multidisciplinary Guide for Psychiatrists and Other Health Professionals" (New York: Routledge, 2013).
Cost Estimates of Biologic Implants Among Orthopedic Surgeons
Cutting: Putting the pieces together
Cutting, otherwise known as nonsuicidal self-injury (NSSI), is a frightening and complex disorder that is prevalent among adolescents, but poorly understood. Typically, pediatricians see distraught parents who, unaware that their children were even depressed, have discovered that they engage in self-harming activities. Quick answers are needed, and with most psychology services being overwhelmed, an immediate evaluation is unlikely. Therefore, it is important to have a clear understanding and resources available to help defuse the situation.
For most, it is hard to understand why young people would want to inflict bodily harm on themselves. The questions that always arise are, was this a suicide attempt? Or, was it a cry for help? Well, the answer to both is quite surprisingly "no," at least in the majority of cases.
Cutting, or NSSI, is an unhealthy reaction to anxiety, pain, frustration, or stress. It is an impulsive behavior that is not necessarily associated with intent to die.
A 2007 study showed that 46% of 633 9th and 10th graders admitted to a least one episode of cutting, burning, scratching, or hitting themselves in response to emotional stress (Psychol. Med. 2007;37:1183-92).
The prevalence of NSSI among adolescents is reported to be 14%-15% and declines to 4% by adulthood (J. Youth Adolesc. 2002;31:67-77). There is no significant gender difference, but the method of self-harm for females tends to be cutting, whereas males are more likely to hit or burn themselves.
So why do people want to inflect pain on themselves? Well, there is a physiologic basis for the most common reason, which is termed affect regulation. Although not completely understood, it is believed that by eliciting pain, endorphins are released, and there is an immediate relief of anxiety, pain, or stress. Most "cutters" report infrequent episodes, but some do become addicted to the sensation, and the episodes increase.
Another reason for cutting is self-punishment. Young people who suffer from low self-esteem, or self-degradation, may use self-harm to express anger toward themselves.
A surprising finding was that interpersonal influence was one of the least common reasons given for self-harm. It is not a common method for a "cry for help" or attention as is a suicide attempt. People who cut are looking for an immediate relief from the emotional stress they are feeling. In fact, many are very secretive about this behavior, and it usually goes unnoticed for several months to years.
Although NSSI can occur independently of any psychological dysfunction, it has been found to have a comorbidity with borderline personality disorder (BPD), anxiety, and depression. All of these disorders are associated with negative emotional stress. Sexual abuse and self-harm are associated because they have the same psychological risk factors but not a cause and effect relationship with NSSI (J. Clin. Psychol. 2007;63:1045-56).
One of the biggest risk factors for suicide is the frequency of the cutting. Addiction to the behavior resulting in daily or weekly episodes does significantly increase the risk of a suicide attempt. Therefore, anyone who presents with a history of cutting should have a Suicide Risk Assessment completed.
First-line treatment for nonsuicidal self-harm is psychotherapy, for example, cognitive-behavioral therapy. Pharmacotherapy of comorbid conditions such as depression and anxiety can be helpful in reducing symptoms, and therefore reducing episodes.
Understanding the psychology behind self-harm will be very helpful in educating and calming families through this difficult situation. Being able to direct the patient to the appropriate resources will expedite evaluation and treatment. Such resources include www.selfinjury.com, www.helpguide.org/mental/self_injury.htm, and www.selfinjury.bctr.cornell.edu.
Dr. Pearce is a pediatrician in Frankfort, Ill. E-mail her at [email protected].
Brief Action Planning to Facilitate Behavior Change and Support Patient Self-Management
From the New York University School of Medicine, New York, NY (Drs. Gutnick and Jay), University of Colorado Health Sciences Center, Denver, CO (Dr. Reims), University of British Columbia, BC, Canada (Dr. Davis), University College London, London, UK (Dr. Gainforth), and Stonybrook University School of Medicine, Stonybrook, NY (Dr. Cole [Emeritus]).
Abstract
- Objective: To describe Brief Action Planning (BAP), a structured, stepped-care self-management support technique for chronic illness care and disease prevention.
- Methods: A review of the theory and research supporting BAP and the questions and skills that comprise the technique with provision of a clinical example.
- Results: BAP facilitates goal setting and action planning to build self-efficacy for behavior change. It is grounded in the principles and practice of Motivational Interviewing and evidence-based constructs from the behavior change literature. Comprised of a series of 3 questions and 5 skills, BAP can be implemented by medical teams to help meet the self-management support objectives of the Patient-Centered Medical Home.
- Conclusion: BAP is a useful self-management support technique for busy medical practices to promote health behavior change and build patient self-efficacy for improved long-term clinical outcomes in chronic illness care and disease prevention.
Chronic disease is prevalent and time consuming, challenging, and expensive to manage [1]. Half of all adult primary care patients have more than 2 chronic diseases, and 75% of US health care dollars are spent on chronic illness care [2]. Given the health and financial impact of chronic disease, and recognizing that patients make daily decisions that affect disease control, efforts are needed to assist and empower patients to actively self-manage health behaviors that influence chronic illness outcomes. Patients who are supported to actively self-manage their own chronic illnesses have fewer symptoms, improved quality of life, and lower use of health care resources [3]. Historically, providers have tried to influence chronic illness self-management by advising behavior change (eg, smoking cessation, exercise) or telling patients to take medications; yet clinicians often become frustrated when patients do not “adhere” to their professional advice [4,5]. Many times, patients want to make changes that will improve their health but need support—commonly known as self-management support—to be successful.
Involving patients in decision making, emphasizing problem solving, setting goals, creating action plans (ie, when, where and how to enact a goal-directed behavior), and following up on goals are key features of successful self-management support methods [3,6–8]. Multiple approaches from the behavioral change literature, such as the 5 A’s (Assess, Advise, Agree, Assist, Arrange) [9], Motivational Interviewing (MI), and chronic disease self-management programs [10] have been used to provide more effective guidance for patients and their caregivers. However, the practicalities of these approaches in clinical settings have been questioned. The 5A’s, a counseling framework that is used to guide providers in health behavior change counseling, can feel overwhelming because it encompasses several different aspects of counseling [11,12]. Likewise, MI and adaptations of MI, which have been shown to outperform traditional “advice giving” in treatment of a broad range of behaviors and chronic conditions [13–16], have been critiqued since fidelity to this approach often involves multiple sessions of training, practice, and feedback to achieve proficiency [15,17,18]. Finally, while chronic disease self-management programs have been shown to be effective when used by peers in the community [10], similar results in primary care are not well established.
Given the challenges of providers practicing, learning, and using each of these approaches, efforts to develop an approach that supports patients to make behavioral changes that can be implemented in typical practice settings are needed. In addition, health delivery systems are transforming to team-based models with emphasis on leveraging each team member’s expertise and licensure [19]. In acknowledgement of these evolving practice realities, the National Committee for Quality Assurance (NCQA) included development and documentation of patient self-management plans and goals as a critical factor for achieving NCQA Patient-Centered Medical Home (PCMH) recognition [20]. Successful PCMH transformation therefore entails clinical practices developing effective and time efficient ways to incorporate self-management support strategies, a new service for many, into their care delivery systems often without additional staffing.
In this paper, we describe an evidence-informed, efficient self-management support technique called Brief Action Planning (BAP) [21–24]. BAP evolved into its current form through ongoing collaborative efforts of 4 of the authors (SC, DG, CD, KR) and is based on a foundation of original work by Steven Cole with contributions from Mary Cole in 2002 [25]. This technique addresses many of the barriers providers have cited to providing self-management support, as it can be used routinely by both individual providers and health care teams to facilitate patient-centered goal setting and action planning. BAP integrates principles and practice of MI with goal setting and action planning concepts from the self-management support, self-efficacy, and behavior change literature. In addition to reviewing the principles and theory that inform BAP, we introduce the steps of BAP and discuss practical considerations for incorporating BAP into clinical practice. In particular, we include suggestions about how BAP can be used in team-based clinical practice settings within the PCMH. Finally, we present a common clinical scenario to demonstrate BAP and provide resource links to online videos of BAP encounters. Throughout the paper, we use the word “clinician” to refer to professionals or other trained personnel using BAP, and “patient” to refer to those experiencing BAP, recognizing that other terms may be preferred in different settings.
What is BAP?
BAP is a highly structured, stepped-care, self-management support technique. Composed of a series of 3 questions and 5 skills (reviewed in detail below), BAP can be used to facilitate goal setting and action planning to build self-efficacy in chronic illness management and disease prevention [21–24]. The overall goal of BAP is to assist an individual to create an action plan for a self-management behavior that they feel confident that they can achieve. BAP is currently being used in diverse care settings including primary care, home health care, rehabilitation, mental health and public health to assist and empower patients to self-manage chronic illnesses and disabilities including diabetes, depression, spinal cord injury, arthritis, and hypertension. BAP is also being used to assist patients to develop action plans for disease prevention. For example, the Bellevue Hospital Personalized Prevention clinic, a pilot clinic that uses a mathematical model [26] to help patients and providers collaboratively prioritize prevention focus and strategies, systematically utilizes BAP as its self-management support technique for patient-centered action planning. At this time, BAP has been incorporated into teaching curriculums at multiple medical schools, presented at major national health care/academic conferences and is being increasingly integrated into health delivery systems across the United States and Canada to support patient self-management for NCQA-PCMH transformation. We have also developed a series of standardized programing to support fidelity in BAP skills development including a multidisciplinary introductory training curriculum, telephonic coaching, interactive web-based training tools, and a structured “Train the Trainer” curriculum [27]. In addition, a set of guidelines designed to ensure fidelity in BAP research has been developed [27].
Underlying Principles of BAP
BAP is grounded in the principles and practice of MI and the psychology of behavior change. Within behavior change, we draw primarily on self-efficacy and action planning theory and research. We discuss the key concepts in detail below.
The Spirit of MI
MI Spirit (Compassion, Acceptance, Partnership and Evocation) is an important overarching tenet for BAP. Compassionately supporting self-management with MI spirit involves a partnership with the patient rather than a prescription for change and the assurance that the clinician has the patients best interest always in mind (Compassion) [17]. Exemplifying “spirit” accepts that the ultimate choice to change is the patient’s alone (Acceptance) and acknowledges that individuals bring expertise about themselves and their lives to the conversation (Evocation). Adherence to “MI spirit” itself has been associated with positive behavior change outcomes in patients [5,28–32]. Demonstrating MI spirit throughout the change conversation is an essential foundational principle of BAP.
Action Planning and Self-Efficacy
In addition to the spirit of MI, BAP integrates 2 evidence-based constructs from the behavior change literature: action planning and self-efficacy [4,6,33–36]. Action planning requires that individuals specify when, where and how to enact a goal-directed behavior (eg, self-management behaviors). Action planning has been shown to mediate the intention-behavior relationship thereby increasing the likelihood that an individual’s intentions will lead to behavior change [37,38]. Given the demonstrated potential of action planning for ensuring individuals achieve their health goals, the BAP framework aspires to assist patients to create an action plan.
BAP also aims to build patients’ self-efficacy to enact the goals outlined in their action plans. Self-efficacy refers to a patient’s confidence in their ability to enact a behavior [33]. Several reviews of the literature have suggested a strong relationship between self-efficacy and adoption of healthy behaviors such as smoking cessation, weight control, contraception, alcohol abuse and physical activity [39–42]. Furthermore, Lorig et al demonstrated that the process of action planning itself contributes to enhanced self-efficacy [8]. BAP aims to build self-efficacy and ultimately change patients’ behaviors by helping patients to set an action plan that they feel confident in their ability to achieve.
Description of the BAP Steps
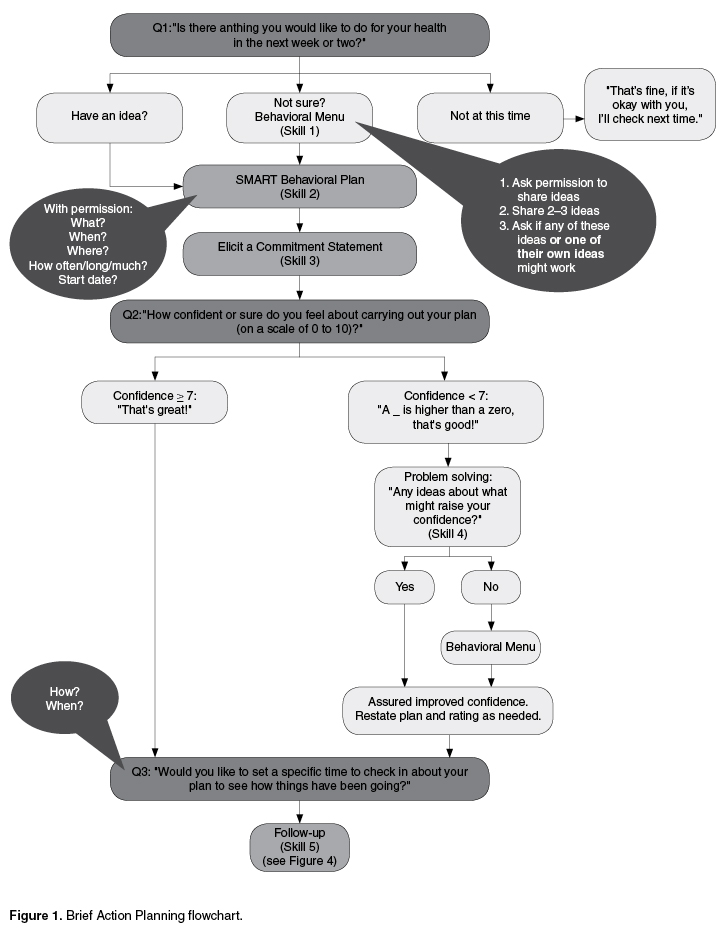
Three questions and 3 of the BAP skills (ie, SMART plan, eliciting a commitment statement, and follow-up) are applied during every BAP interaction, while 2 skills (ie, behavioral menu and problem solving for low confidence) are used as needed. The distinct functions and the evidence supporting the 3 questions and 5 BAP skills are described below.
Question 1: Eliciting a Behavioral Focus or Goal
Once engagement has been established and the clinician determines the patient is ready for self-management planning to occur, the first question of BAP can be asked: “Is there anything you would like to do for your health in the next week or two?” 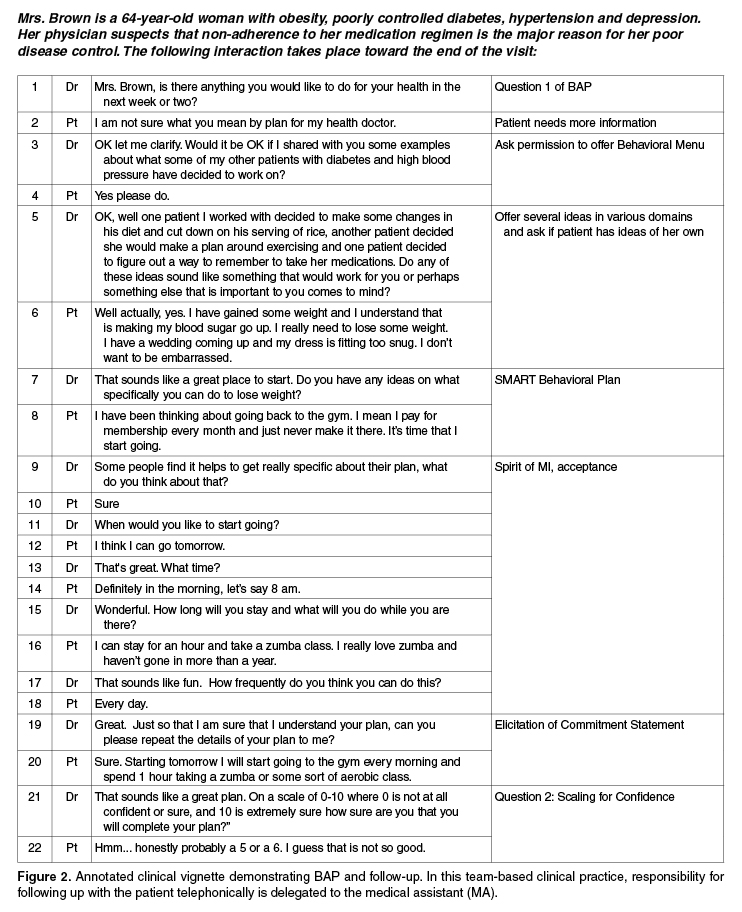
Although technically Question 1 is a closed-ended question (in that it can be answered “yes” or “no”), in actual practice it generates productive discussions about change. 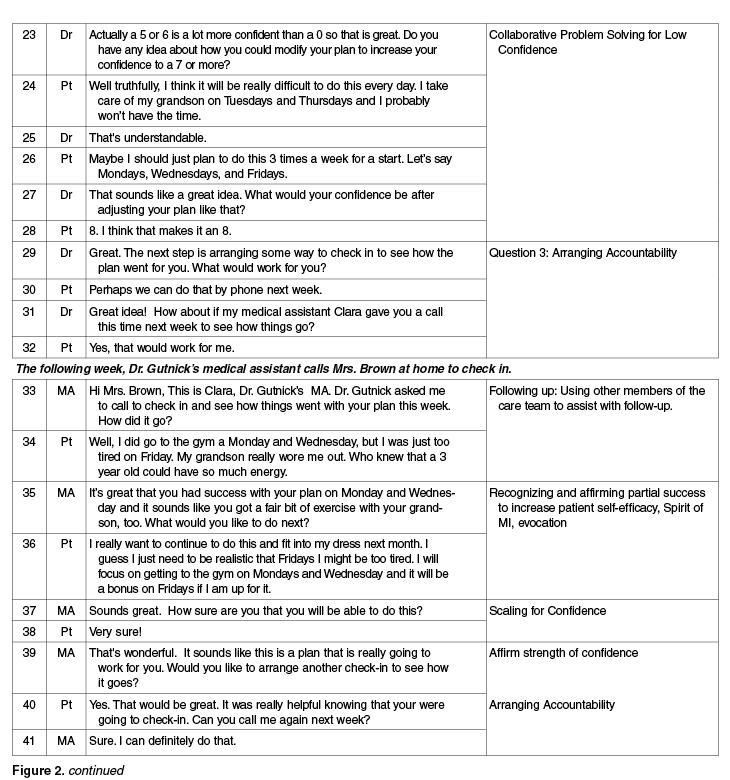
1) Have an Idea. A group of patients immediately present an idea that they are ready to do or are ready to consider doing. For these patients, clinicians can proceed directly to Skill 2—SMART Behavioral Planning; that is, asking patients directly if they are ready to turn their idea into a concrete plan. Some evidence suggests that further discussion, assessment, or even additional "motivational" exploration in patients who are ready to make a plan and already have an idea may actually decrease motivation for change [17, 32].
2) Not Sure. Another group of patients may want or need suggestions before committing to something specific they want to work on. For these patients, clinicians should use the opportunity to offer a Behavioral Menu (Skill 1).
3) No or Not at This Time. A third group of patients may not be interested or ready to make a change at this time or at all. Some in this group may be healthy or already self-managing effectively and have no need to make a plan, in which case the clinician acknowledges their active self-management and moves to the next part of the visit. Others in this group may have considerable ambivalence about change or face complex situations where other priorities take precedence. Clinicians frequently label these individuals as "resistant." The Spirit of MI can be very useful when working with these patients to accept and respect their autonomy while encouraging ongoing partnership at a future time. For example, a clinician may say “It sounds like you are not interested in making a plan for your health right now. Would it be OK if I ask you about this again at our next visit?” Pushing forward to make a "plan for change" when a patient is not ready decreases both motivation for change as well as the likelihood for a successful outcome [32].
Other patients may benefit from additional motivational approaches to further explore change and ambivalence. If the clinician does not have these skills, patients may be seamlessly transitioned to another resource within or external to the care team.
Skill 1: Offering a Behavioral Menu
If in response to Question 1 an individual is unable to come up with an idea of their own or needs more information, then offering a Behavioral Menu may be helpful [44,45]. Consistent with the “Spirit of MI,” BAP attempts to elicit ideas from the individual themselves; however, it is important to recognize that some people require assistance to identify possible actions. A behavioral menu is comprised of 2 or 3 suggestions or ideas that will ideally trigger individuals to discover an idea of their own. There are 3 distinct evidence-based steps to follow when presenting a Behavioral Menu.
1) Ask permission to offer a behavioral menu. Asking permission to share ideas respects patient autonomy and prevents the provider from inadvertently assuming an expert role. For example: “Would it be OK if I shared with you some examples of what some other patients I work with have done?”
2) Offer 2 to 3 general yet varied ideas all at once (Figure 2, entry 5). It helps to mention things that other patients have decided to do with some success. Using this approach avoids the clinician assuming too much about the patient or allowing the patient to reject the ideas. It is important to remember that the list is to prompt ideas, not to find a perfect solution [17]. For example: “One patient I work with decided to join a gym and start exercising, another decided to pick up an old hobby he used to enjoy doing and another patient decided to schedule some time with a friend she hadn’t seen in a while.”
3) Ask if any of the ideas appeal to the individual as something that might work for them or if the patient has an idea of his/her own (Figure 2, entry 5). Evocation from the Spirit of MI is built in with this prompt [17]. For example: “These are some ideas that have worked for other patients I work with, do they trigger any ideas that might work for you?”
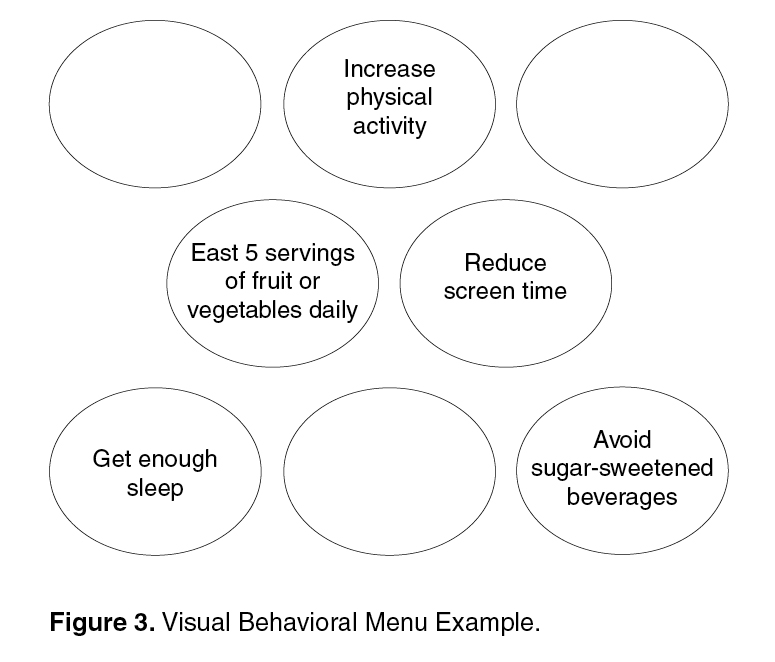
Skill 2: SMART Planning
Once an individual decides on an area of focus, the clinician partners with the patient to clarify the details and create an action plan to achieve their goal. Given that individuals are more likely to successfully achieve goals that are specific, proximal, and achievable as opposed to vague and distal [46,47], the clinician works with patient to ensure that the patient’s goal is SMART (specific, measurable, achievable, relevant and time-bound). The term SMART has its roots in the business management literature [48] as an adaptation of Locke’s pioneering research (1968) on goal setting and motivation [49]. In particular, Locke and Latham’s theory of Goal Setting and Task performance, states that “specific and achievable” goals are more likely to be successfully reached [47,50].
We suggest helping the patient to make smart goals by eliciting answers to questions applicable to the plan, such as “what?” “where?” “when?” “how long?” “how often?” “how much?” and “when will you start?” [51]. A resulting plan might be “I will walk for 20 minutes, in my neighborhood, every Monday, Wednesday and Friday before dinner.”
Skill 3: Elicit a Commitment Statement
Once the individual has developed a specific plan, the next step of BAP is for the clinician to ask him or her to “tell back” the specifics of the plan. The provider might say something like, “Just to make sure we understand each other, would you repeat back what you’ve decided to do?” The act of “repeating back” organizes the details of the plan in the persons mind and may lead to an unconscious self-reflection about the feasibility of the plan [43,52], which then sets the stage for Question 2 of BAP (Scaling for Confidence). Commitment predicts subsequent behavior change, and the strength of the commitment language is the strongest predictor of success on an action plan [43,52,53]. For example saying “I will” is stronger than saying “I will try.”
Question 2: Scaling for Confidence
After a commitment statement has been elicited, the second question of BAP is asked. “How confident or sure do you feel about carrying out your plan on a scale from 0 to 10, where 0 is not confident at all and 10 is totally confident or sure?” Confidence scaling is a common tool used in behavioral interventions, MI, and chronic disease self-management programs [17,51]. Question 2 assesses an individual’s self-efficacy to complete the plan and facilitates discussion about potential barriers to implementation in order to increase the likelihood of success of a personal action plan.
For patients who have difficulty grasping the concept of a numerical scale, the word “sure” can be substituted for “confident” and a Likert scale including the terms “not at all sure,” “somewhat sure,” and “very sure” substituted for the numerical confidence ruler, ie, “How sure are you that you will be able to carry out your plan? Not at all sure, somewhat sure, or very sure?” Alternatively, people of different cultural backgrounds may find it easier to grasp the concept using familiar images or experiences. For example, Native Americans from the Southwest have adapted the scale to depict a series of images ranging from planting a corn seed to harvesting a crop or climbing a ladder, while in some Latino cultures the image of climbing a mountain (“How far up the mountain are you?”) is useful to demonstrate “level of confidence” concept [54].
Skill 4: Problem Solving for Low Confidence
When confidence is relatively low (ie, below 7), we suggest collaborative problem solving as the next step [8,51]. Low confidence or self-efficacy for plan completion is a concern since low self-efficacy predicts non-completion [8]. Successfully implementing the action plan, no matter how small, increases confidence and self-efficacy for engaging in the behavior [8].
There are several steps that a clinician follows when collaboratively problem-solving with a patient with low confidence (Figure 1).
• Recognize that a low confidence level is greater than no confidence at all. By affirming the strength of a patient’s confidence rather than negatively focusing on a low level of confidence, the provider emphasizes the patient’s strengths.
• Collaboratively explore ways that the plan could be modified in order to improve confidence. A Behavioral Menu can be offered if needed. For example, a clinician might say something like: “That’s great that your confidence level is a 5. A 5 is a lot higher than a 1. People are more likely to have success with their action plans when confidence levels are 7 or more. Do you have any ideas of how you might be able to increase your level confidence to a 7 or more?”
• If the patient has no ideas, ask permission to offer a Behavioral Menu: “Would it be ok to share some ideas about how other patients I’ve worked with have increased their confidence level?” If the patient agrees, then say... “Some people modify their plans to make them easier, some choose a less ambitious goal or adjust the frequency of their plan, and some people involve a friend or family member. Perhaps one of these ideas seems like a good one for you or maybe you have another idea?”
Question 3: Arranging Accountability
Once the details of the plan have been determined and confidence level for success is high, the next step is to ask Question 3: “Would you like to set a specific time to check in about your plan to see how things are going?” This question encourages a patient to be accountable for their plan, and reinforces the concept that the physician and care team consider the plan to be important. Research supports that people are more likely to follow through with a plan if they choose to report back their progress [43] and suggests that checking-in frequently earlier in the process is helpful [55]. Ideally the clinician and patient should agree on a time to check in on the plan within a week or two (Figure 2, entry 29).
Accountability in the form of a check-in may be arranged with the clinical provider, another member of the healthcare team or a support person of the patient’s choice (eg, spouse, friend). The patient may also choose to be accountable to themselves by using a calendar or a goal setting application on their smart phone device or computer.
Skill 5: Follow-up
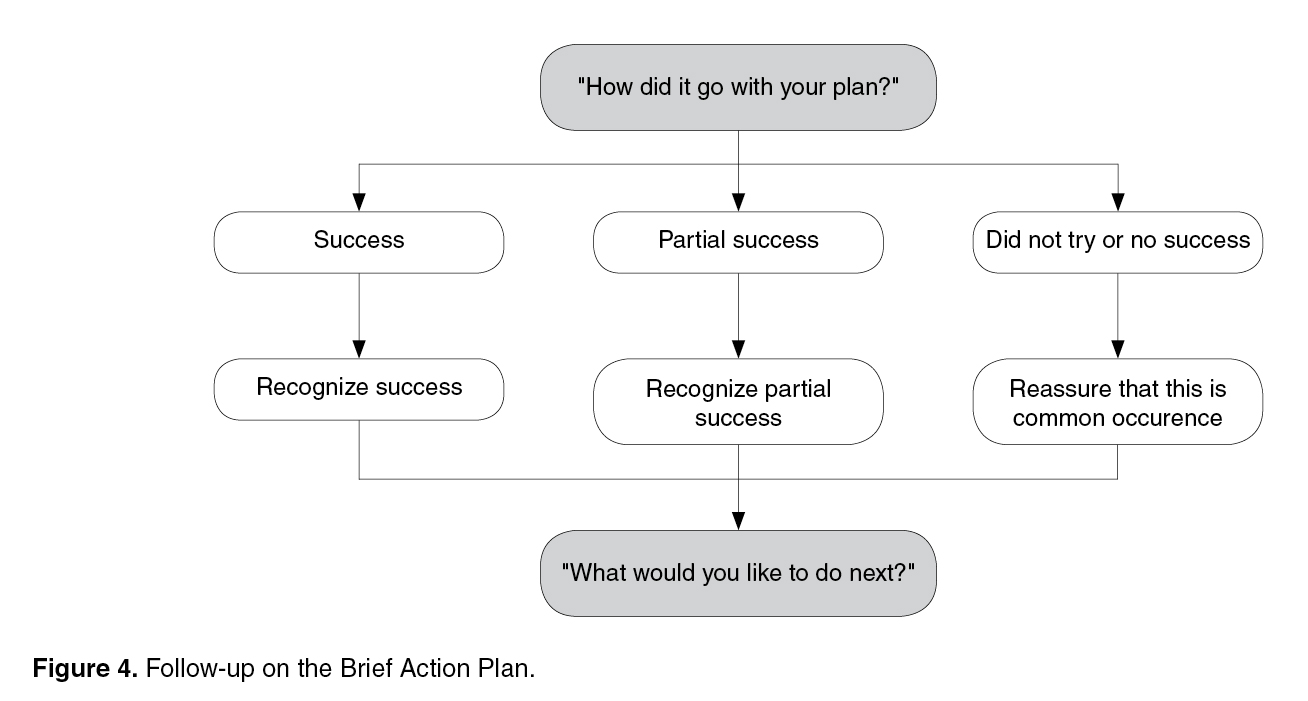
The purpose of the check-in is for learning and adjustment of the plan as well as to provide support regardless of outcome. Checking-in encourages reflection on challenges and barriers as well as successes. Patients should be given guidance to think through what worked for them and what did not. Focusing just on “success” of the plan will be less helpful. If follow-up is not done with the care team in the near term, checking-in can be accomplished at the next scheduled visit. Patient portals provide another opportunity for patients to dialogue with the care team about their plan.
Experiential Insights from Clinical Experience Using BAP
The authors collective experience to date indicates that between 50% to 75% of individuals who are asked Question 1 go on to develop an action plan for change with relatively little need for additional skills. In other studies of action planning in primary care, 83% of patients made action plans during a visit, and at 3-week follow-up 53% had completed their action plan [56]. A recent study of action planning using an online self-management support program reported that action plans were successfully completed (49%), partially completed (40%) or incomplete (11% of the time) [35].
Another caveat to consider is that the process of planning is more important that the actual plan itself. It is imperative to allow the patient, not the clinician, to determine the plan. For example, a patient with multiple poorly controlled chronic illnesses including depression may decide to focus his action plan around cleaning out his car rather than disease control such as dietary modification, medication adherence or exercise. The clinician may initially fail to view this as a good use of clinician time or healthcare resources since it seems unrelated to health. However, successful completion of an action plan is not the only objective of action planning. Building self-efficacy, which may lead to additional action planning around health, is more important [4,46]. The challenge is therefore for the clinician to take a step back, relinquish the “expert role,” and support the goal setting process regardless of the plan. In this example, successfully cleaning out his car may increase the patient’s self-efficacy to control other aspects of his life including diet and the focus of future plans may shift [4].
When to Use BAP
Opportunities for patient engagement in action planning occur when addressing chronic illness concerns as well as during discussions about health maintenance and preventive care. BAP can be considered as part of any routine clinical agenda unless patient preferences or clinical acuity preclude it. As with most clinical encounters, the flow is often negotiated at the beginning of the visit. BAP can be accomplished at any time that works best for the flow and substance of the visit, but a few patterns have emerged based on our experience.
BAP fits naturally into the part of the visit when the care plan is being discussed. The term “care plan” is commonly used to describe all of the care that will be provided until the next visit. Care plans can include additional recommendations for testing or screening, therapeutic adjustments and or referrals for additional expertise. Ideally the patients “agreed upon” contribution to their care should also be captured and documented in their care plan. This is often described as the patients “self-management goal.” For patients who are ready to make a specific plan to change behavior, BAP is an efficient way to support patients to craft an action plan that can then be incorporated into the overall care plan.
Another variation of when to use BAP is the situation when the patient has had a prior action plan and is being seen for a recheck visit. Discussing the action plan early in the visit agenda focuses attention on the work patients have put into following their plan. Descriptions of success lead readily to action plans for the future. Time spent discussing failures or partial success is valuable to problem solve as well as to affirm continued efforts to self-manage.
BAP can also be used between scheduled visits. The check-in portion of BAP is particularly amenable to follow-up by phone or by another supporter. A pre-arranged follow-up 1 to 2 weeks after creation of a new action plan [8] provides encouragement to patients working on their plan and also helps identify those who need more support.
Finally, BAP can be completed over multiple visits. For patients who are thinking about change but are not yet committed to planning, a brief suggestion about the value of action planning with a behavioral menu may encourage additional self-reflection. Many times patients return to the next visit with clear ideas about changes that would be important for them to make.
Fitting BAP into a 20-Minute Visit
Using BAP is a time-efficient way to provide self-management support within the context of a 20-minute visit with engaged patients who are ready to set goals for health. With practice, clinicians can often conduct all the steps within 3 to 5 minutes. However, patients and clinicians often have competing demands and agendas and may not feel that they have time to conduct all the steps. Thus, utilizing other members of the health care team to deliver some or all of BAP can facilitate implementation.
Teams have been creative in their approach to BAP implementation but 2 common models involve a multidisciplinary approach to BAP. In one model, the clinician assesses the patient readiness to make a specific action plan by asking Question 1, usually after the current status of key problems have been addressed and discussions begin about the interim plan of care. If the patient indicates interest, another staff member trained in BAP, such as an medical assistant, health coach or nurse, guides the development of the specific plan, completes the remaining steps and inputs the patient’s BAP into the care plan.
In another commonly deployed model, the front desk clerk or medical assistant helps to get the patient thinking by asking Question 1 and perhaps by providing a behavioral menu. When the clinician sees the patient, he follows up on the behavior change the patient has chosen and affirms the choice. Clinicians often flex seamlessly with other team members to complete the action plan depending on the schedule and current patient flow.
Regardless of how the workflows are designed, BAP implementation requires staff that can provide BAP with fidelity, effective communication among team members involved in the process and a standardized approach to documentation of the specific action plan, plan for check-in and notes about follow-up. Care teams commonly test different variations of personnel and workflows to find what works best for their particular practice.
Implementing BAP to Support PCMH Transformation
To support PCMH transformation substantial changes are needed to make care more proactive, more patient-centered and more accountable. One of the common elements for PCMH recognition regardless of sponsor is to enhance self-management support [20,57,58]. Practices pursuing PCMH designation are searching for effective evidence-based approaches to provide self-management support and guide action planning for patients. The authors suggest implementation of BAP as a potential strategy to enhance self-management support. In addition to facilitating meeting the actual PCMH criteria, BAP is aligned with the transitions in care delivery that are an important part of the transformation including reliance on team-based care and meaningful engagement of patients in their care [59,60].
In our experience, BAP is introduced incrementally into a practice initially focusing on one or two patient segments and then including more as resources allow. Successful BAP implementation begins with an organizational commitment to self-management support, decisions about which populations would benefit most from self-management support and BAP, training of key staff and clearly defined workflows that ensure reliable BAP provision.
BAP’s stepped-care design makes it easy to teach to all team members and as described above, team-based delivery of BAP functions well in those situations where clinicians and trained ancillary staff can “hand off” the process at any time to optimize the value to the patient while respecting inherent time constraints.
Documentation of the actual goal and follow-up is an important component to fully leverage BAP. Goals captured in a template generate actionable lists for action plan follow-up. Since EHRs vary considerably in their capacity to capture goals, teams adding BAP to their workflow will benefit from discussion of standardized documentation practices and forms.
Summary
Brief Action Planning is a self-management support technique that can be used in busy clinical settings to support patient self-management through patient-centered goal setting. Each step of BAP is based on principles grounded in evidence. Health care teams can learn BAP and integrate it into clinical delivery systems to support self-management for PCMH transformation.
Corresponding author: Damara Gutnick, MD, New York University School of Medicine, New York, NY, [email protected].
Financial disclosures: None.
1. Hoffman C, Rice D, Sung HY. Persons withnic conditions. Their prevalence and costs. JAMA 1996;276(18):1473–9.
2. Institute of Medicine. Living well with chro:ic illness: a call for public health action. Washington (DC); The National Academies Press; 2012.
3. De Silva D. Evidence: helping people help themselves. London: The Health Foundation Inspiring Improvement; 2011.
4. Bodenheimer T, Lorig K, Holman H, Grumbach K. Patient self-management of chronic disease in primary care. JAMA 2002;288:2469–75.
5. Miller W, Benefield R, Tonigan J. Enhancing motivation for change in problem drinking: A controlled comparison of two therapist styles. J Consul Clin Psychol 1993;61:455–461.
6. Lorig K, Holman H. Self-management education: history, definition, outcomes, and mechanisms. Ann Behav Med 2003;26:1–7.
7. Artinian NT, Fletcher GF, Mozaffarian D, et al. Interventions to promote physical activity and dietary lifestyle changes for cardiovascular risk factor reduction in adults: a scientific statement from the American Heart Association. Circulation 2010;122:406–41.
8. Lorig K, Laurent DD, Plant K, Krishnan E, Ritter PL. The components of action planning and their associations with behavior and health outcomes. Chronic Illn 2013. Available at www.ncbi.nlm.nih.gov/pubmed/23838837.
9. Schlair S, Moore S, Mcmacken M, Jay M. How to deliver high-quality obesity counseling in primary care using the 5As framework. J Clin Outcomes Manag 2012;19:221–9.
10. Lorig KR, Ritter P, Stewart a L, et al. Chronic disease self-management program: 2-year health status and health care utilization outcomes. Med Care 2001;39:1217–23.
11. Jay MR, Gillespie CC, Schlair SL, et al. The impact of primary care resident physician training on patient weight loss at 12 months. Obesity 2013;21:45–50.
12. Goldstein MG, Whitlock EP, DePue J. Multiple behavioral risk factor interventions in primary care. Summary of research evidence. Am J Prev Med 2004;27:61–79.
13. Lundahl B, Moleni T, Burke BL, et al. Motivational interviewing in medical care settings: a systematic review and meta-analysis of randomized controlled trials. Patient Educ Couns 2013;93:157–68.
14. Rubak S, Sandbæk A, Lauritzen T, Christensen B. Motivational Interviewing: a systematic review and meta-analysis. Br J Gen Pract 2005;55:305–12.
15. Dunn C, Deroo L, Rivara F. The use of brief interventions adapted from motivational interviewing across behavioral domains: a systematic review. Addiction 2001;96:1725–42.
16. Heckman CJ, Egleston BL, Hofmann MT. Efficacy of motivational interviewing for smoking cessation: a systematic review and meta-analysis. Tob Control 2010;19:410–6.
17. Miller WR, Rollnick S. Motivational interviewing: helping people change. 3rd ed. New York: Guilford Press; 2013.
18. Resnicow K, DiIorio C, Soet J, et al. Motivational interviewing in health promotion: it sounds like something is changing. Health Psychol 2002;21:444–451.
19. Doherty RB, Crowley RA. Principles supporting dynamic clinical care teams: an American College of Physicians position paper. Ann Intern Med 2013;159:620–6.
20. NCQA PCMH 2011 Standards, Elements and Factors. Documentation Guideline/Data Sources. 4A: Provide self-care support and community resources. Available at www.ncqa.org/portals/0/Programs/Recognition/PCMH_2011_Data_Sources_6.6.12.pdf.
21. Reims K, Gutnick D, Davis C, Cole S. Brief action planning white paper. 2012. Available at www.centrecmi.ca.
22. Cole S, Davis C, Cole M, Gutnick D. Motivational interviewing and the patient centered medical home: a strategic approach to self-management support in primary care. In: Patient-Centered Primary Care Collaborative. Health IT in the patient centered medical home. October 2010. Available at www.pcpcc.net/guide/health-it-pcmh.
23. Cole S, Cole M, Gutnick D, Davis C. Function three: collaborate for management. In: Cole S, Bird J, editors. The medical interview: the three function approach. 3rd ed. Philadelphia:Saunders; 2014.
24. Cole S, Gutnick D, Davis C, Cole M. Brief action planning (BAP): a self-management support tool. In: Bickley L. Bates’ guide to physical examination and history taking. 11th ed. Philadelphia: Lippincott Williams and Wilkins; 2013.
25. AMA Physician tip sheet for self-management support. Available at www.ama-assn.org/ama1/pub/upload/mm/433/phys_tip_sheet.pdf.
26. Taksler G, Keshner M, Fagerlin A. Personalized estimates of benefit from preventive care guidelines. Ann Intern Med 2013;159:161–9.
27. Centre for Comprehensive Motivational Interventions [website]. Available at www.centreecmi.com.
28. Del Canale S, Louis DZ, Maio V, et al. The relationship between physician empathy and disease complications: an empirical study of primary care physicians and their diabetic patients in Parma, Italy. Acad Med 2012;87:1243–9.
29. Moyers TB, Miller WR, Hendrickson SML. How does motivational interviewing work? Therapist interpersonal skill predicts client involvement within motivational interviewing sessions. J Consult Clin Psychol 2005;73:590–8.
30. Hojat M, Louis DZ, Markham FW, et al. Physicians’ empathy and clinical outcomes for diabetic patients. Acad Med 2011;86:359–64.
31. Heisler M, Bouknight RR, Hayward RA, et al. The relative importance of physician communication, participatory decision making, and patient understanding in diabetes self-management. J Gen Intern Med 2002;17:243–52.
32. Miller WR, Rollnick S. Ten things that motivational interviewing is not. Behav Cogn Psychother 2009;37:129–40.
33. Bandura A. Self-efficacy: toward a unifying theory of behavioral change. Psychol Rev 1977;85:191–215.
34. Kiesler, Charles A. The psychology of commitment: experiments linking behavior to belief. New York: Academic Press;1971.
35. Lorig K, Laurent DD, Plant K, et al. The components of action planning and their associations with behavior and health outcomes. Chronic Illn 2013.
36. MacGregor K, Handley M, Wong S, et al. Behavior-change action plans in primary care: a feasibility study of clinicians. J Am Board Fam Med 19:215–23.
37. Gollwitzer P. Implementation intentions. Am Psychol 1999;54:493–503.
38. Gollwitzer P, Sheeran P. Implementation intensions and goal achievement: A meta-analysis of effects and processes. Adv Exp Soc Psychology 2006;38:69–119.
39. Stretcher V, De Vellis B, Becker M, Rosenstock I. The role of self-efficacy in achieving behavior change. Health Educ Q 1986;13:73–92.
40. Ajzen I. Constructing a theory of planned behavior questionnaire. Available at people.umass.edu/aizen/pdf/tpb.measurement.pdf.
41. Rogers RW. Protection motivation theory of fear appeals and attitude-change. J Psychol 1975;91:93–114.
42. Schwarzer R. Modeling health behavior change: how to predict and modify the adoption and maintenance of health behaviors. Appl Psychol An Int Rev 2008;57:1–29.
43. Cialdini R. Influence: science and practice. 5th ed. Boston:Allyn and Bacon; 2008.
44. Stott NC, Rollnick S, Rees MR, Pill RM. Innovation in clinical method: diabetes care and negotiating skills. Fam Pract 1995;12:413–8.
45. Miller WR, Rollnick S, Butler C. Motivational interviewing in health care. New York: Guilford Press; 2008.
46. Bodenheimer T, Handley M. Goal-setting for behavior change in primary care: an exploration and status report. Patient Educ Couns 2009;76:174–80.
47. Locke EA, Latham GP. Building a practically useful theory of goal setting and task motivation. Am Psychol 2002;57:705–17.
48. Doran G. There’s a S.M.A.R.T. way to write management’s goals and objectives. Manag Rev 1981;70:35–6.
49. Locke EA. Toward a theory of task motivation and incentives. Organ Behav Hum Perform 1968;3:157–89.
50. Locke EA, Latham GP, Erez M. The determinants of goal commitment. Acad Manag Rev 1988;13:23–39.
51. Lorig K, Homan H, Sobel D, et al. Living a healthy life with chronic conditions. 4th ed. Boulder: Bull Publishing; 2012.
52. Amrhein PC, Miller WR, Yahne CE, et al. Client commitment language during motivational interviewing predicts drug use outcomes. J Consult Clin Psychol 2003;71:862–78.
53. Ahaeonovich E, Amrhein PC, Bisaha A, et al. Cognition, commitment language and behavioral change among cocaine-dependent patients. Psychol Addict Behav 2008;22:557–62.
54. Gutnick D. Centre for Comprehensive Motivational Interventions community of practice webinar. Brief action planning and culture: developing culturally specific confidence rules. 2012. Available at www.centrecmi.ca.
55. Artinian NT, Fletcher GF, Mozaffarian D, et al. Interventions to promote physical activity and dietary lifestyle changes for cardiovascular risk factor reduction in adults. A scientific statement from the American Heart Association. Circulation 2010;122:406–41.
56. Handley M, MacGregor K, Schillinger D, et al. Using action plans to help primary care patients adopt healthy behaviors: a descriptive study. J Am Board Fam Med 2006;19:224–31.
57. Joint Commision. Primary care medical home option-additional requirements. Available at www.jointcommission.org/assets/1/18/PCMH_new_stds_by_5_characteristics.pdf.
58. Oregon Health Policy and Research. Standards for patient centered medical home recognition. Available at www.oregon.gov/oha/OHPR/pages/healthreform/pcpch/standards.aspx.
59. Nutting PA, Crabtree BF, Miller WL, et al. Journey to the patient-centered medical home: a qualitative analysis of the experiences of practices in the national demonstration project. Am Fam Med 2010;8(Suppl 1):S45–S56.
60. Stewart EE, Nutting PA, Crabtree BF, et al. Implementing the patient-centered medical home: observation and description of the National Demonstration Project. Am Fam Med 2010;8(Suppl 1):S21–S32.
From the New York University School of Medicine, New York, NY (Drs. Gutnick and Jay), University of Colorado Health Sciences Center, Denver, CO (Dr. Reims), University of British Columbia, BC, Canada (Dr. Davis), University College London, London, UK (Dr. Gainforth), and Stonybrook University School of Medicine, Stonybrook, NY (Dr. Cole [Emeritus]).
Abstract
- Objective: To describe Brief Action Planning (BAP), a structured, stepped-care self-management support technique for chronic illness care and disease prevention.
- Methods: A review of the theory and research supporting BAP and the questions and skills that comprise the technique with provision of a clinical example.
- Results: BAP facilitates goal setting and action planning to build self-efficacy for behavior change. It is grounded in the principles and practice of Motivational Interviewing and evidence-based constructs from the behavior change literature. Comprised of a series of 3 questions and 5 skills, BAP can be implemented by medical teams to help meet the self-management support objectives of the Patient-Centered Medical Home.
- Conclusion: BAP is a useful self-management support technique for busy medical practices to promote health behavior change and build patient self-efficacy for improved long-term clinical outcomes in chronic illness care and disease prevention.
Chronic disease is prevalent and time consuming, challenging, and expensive to manage [1]. Half of all adult primary care patients have more than 2 chronic diseases, and 75% of US health care dollars are spent on chronic illness care [2]. Given the health and financial impact of chronic disease, and recognizing that patients make daily decisions that affect disease control, efforts are needed to assist and empower patients to actively self-manage health behaviors that influence chronic illness outcomes. Patients who are supported to actively self-manage their own chronic illnesses have fewer symptoms, improved quality of life, and lower use of health care resources [3]. Historically, providers have tried to influence chronic illness self-management by advising behavior change (eg, smoking cessation, exercise) or telling patients to take medications; yet clinicians often become frustrated when patients do not “adhere” to their professional advice [4,5]. Many times, patients want to make changes that will improve their health but need support—commonly known as self-management support—to be successful.
Involving patients in decision making, emphasizing problem solving, setting goals, creating action plans (ie, when, where and how to enact a goal-directed behavior), and following up on goals are key features of successful self-management support methods [3,6–8]. Multiple approaches from the behavioral change literature, such as the 5 A’s (Assess, Advise, Agree, Assist, Arrange) [9], Motivational Interviewing (MI), and chronic disease self-management programs [10] have been used to provide more effective guidance for patients and their caregivers. However, the practicalities of these approaches in clinical settings have been questioned. The 5A’s, a counseling framework that is used to guide providers in health behavior change counseling, can feel overwhelming because it encompasses several different aspects of counseling [11,12]. Likewise, MI and adaptations of MI, which have been shown to outperform traditional “advice giving” in treatment of a broad range of behaviors and chronic conditions [13–16], have been critiqued since fidelity to this approach often involves multiple sessions of training, practice, and feedback to achieve proficiency [15,17,18]. Finally, while chronic disease self-management programs have been shown to be effective when used by peers in the community [10], similar results in primary care are not well established.
Given the challenges of providers practicing, learning, and using each of these approaches, efforts to develop an approach that supports patients to make behavioral changes that can be implemented in typical practice settings are needed. In addition, health delivery systems are transforming to team-based models with emphasis on leveraging each team member’s expertise and licensure [19]. In acknowledgement of these evolving practice realities, the National Committee for Quality Assurance (NCQA) included development and documentation of patient self-management plans and goals as a critical factor for achieving NCQA Patient-Centered Medical Home (PCMH) recognition [20]. Successful PCMH transformation therefore entails clinical practices developing effective and time efficient ways to incorporate self-management support strategies, a new service for many, into their care delivery systems often without additional staffing.
In this paper, we describe an evidence-informed, efficient self-management support technique called Brief Action Planning (BAP) [21–24]. BAP evolved into its current form through ongoing collaborative efforts of 4 of the authors (SC, DG, CD, KR) and is based on a foundation of original work by Steven Cole with contributions from Mary Cole in 2002 [25]. This technique addresses many of the barriers providers have cited to providing self-management support, as it can be used routinely by both individual providers and health care teams to facilitate patient-centered goal setting and action planning. BAP integrates principles and practice of MI with goal setting and action planning concepts from the self-management support, self-efficacy, and behavior change literature. In addition to reviewing the principles and theory that inform BAP, we introduce the steps of BAP and discuss practical considerations for incorporating BAP into clinical practice. In particular, we include suggestions about how BAP can be used in team-based clinical practice settings within the PCMH. Finally, we present a common clinical scenario to demonstrate BAP and provide resource links to online videos of BAP encounters. Throughout the paper, we use the word “clinician” to refer to professionals or other trained personnel using BAP, and “patient” to refer to those experiencing BAP, recognizing that other terms may be preferred in different settings.
What is BAP?
BAP is a highly structured, stepped-care, self-management support technique. Composed of a series of 3 questions and 5 skills (reviewed in detail below), BAP can be used to facilitate goal setting and action planning to build self-efficacy in chronic illness management and disease prevention [21–24]. The overall goal of BAP is to assist an individual to create an action plan for a self-management behavior that they feel confident that they can achieve. BAP is currently being used in diverse care settings including primary care, home health care, rehabilitation, mental health and public health to assist and empower patients to self-manage chronic illnesses and disabilities including diabetes, depression, spinal cord injury, arthritis, and hypertension. BAP is also being used to assist patients to develop action plans for disease prevention. For example, the Bellevue Hospital Personalized Prevention clinic, a pilot clinic that uses a mathematical model [26] to help patients and providers collaboratively prioritize prevention focus and strategies, systematically utilizes BAP as its self-management support technique for patient-centered action planning. At this time, BAP has been incorporated into teaching curriculums at multiple medical schools, presented at major national health care/academic conferences and is being increasingly integrated into health delivery systems across the United States and Canada to support patient self-management for NCQA-PCMH transformation. We have also developed a series of standardized programing to support fidelity in BAP skills development including a multidisciplinary introductory training curriculum, telephonic coaching, interactive web-based training tools, and a structured “Train the Trainer” curriculum [27]. In addition, a set of guidelines designed to ensure fidelity in BAP research has been developed [27].
Underlying Principles of BAP
BAP is grounded in the principles and practice of MI and the psychology of behavior change. Within behavior change, we draw primarily on self-efficacy and action planning theory and research. We discuss the key concepts in detail below.
The Spirit of MI
MI Spirit (Compassion, Acceptance, Partnership and Evocation) is an important overarching tenet for BAP. Compassionately supporting self-management with MI spirit involves a partnership with the patient rather than a prescription for change and the assurance that the clinician has the patients best interest always in mind (Compassion) [17]. Exemplifying “spirit” accepts that the ultimate choice to change is the patient’s alone (Acceptance) and acknowledges that individuals bring expertise about themselves and their lives to the conversation (Evocation). Adherence to “MI spirit” itself has been associated with positive behavior change outcomes in patients [5,28–32]. Demonstrating MI spirit throughout the change conversation is an essential foundational principle of BAP.
Action Planning and Self-Efficacy
In addition to the spirit of MI, BAP integrates 2 evidence-based constructs from the behavior change literature: action planning and self-efficacy [4,6,33–36]. Action planning requires that individuals specify when, where and how to enact a goal-directed behavior (eg, self-management behaviors). Action planning has been shown to mediate the intention-behavior relationship thereby increasing the likelihood that an individual’s intentions will lead to behavior change [37,38]. Given the demonstrated potential of action planning for ensuring individuals achieve their health goals, the BAP framework aspires to assist patients to create an action plan.
BAP also aims to build patients’ self-efficacy to enact the goals outlined in their action plans. Self-efficacy refers to a patient’s confidence in their ability to enact a behavior [33]. Several reviews of the literature have suggested a strong relationship between self-efficacy and adoption of healthy behaviors such as smoking cessation, weight control, contraception, alcohol abuse and physical activity [39–42]. Furthermore, Lorig et al demonstrated that the process of action planning itself contributes to enhanced self-efficacy [8]. BAP aims to build self-efficacy and ultimately change patients’ behaviors by helping patients to set an action plan that they feel confident in their ability to achieve.
Description of the BAP Steps
Three questions and 3 of the BAP skills (ie, SMART plan, eliciting a commitment statement, and follow-up) are applied during every BAP interaction, while 2 skills (ie, behavioral menu and problem solving for low confidence) are used as needed. The distinct functions and the evidence supporting the 3 questions and 5 BAP skills are described below.
Question 1: Eliciting a Behavioral Focus or Goal
Once engagement has been established and the clinician determines the patient is ready for self-management planning to occur, the first question of BAP can be asked: “Is there anything you would like to do for your health in the next week or two?”
Although technically Question 1 is a closed-ended question (in that it can be answered “yes” or “no”), in actual practice it generates productive discussions about change.
1) Have an Idea. A group of patients immediately present an idea that they are ready to do or are ready to consider doing. For these patients, clinicians can proceed directly to Skill 2—SMART Behavioral Planning; that is, asking patients directly if they are ready to turn their idea into a concrete plan. Some evidence suggests that further discussion, assessment, or even additional "motivational" exploration in patients who are ready to make a plan and already have an idea may actually decrease motivation for change [17, 32].
2) Not Sure. Another group of patients may want or need suggestions before committing to something specific they want to work on. For these patients, clinicians should use the opportunity to offer a Behavioral Menu (Skill 1).
3) No or Not at This Time. A third group of patients may not be interested or ready to make a change at this time or at all. Some in this group may be healthy or already self-managing effectively and have no need to make a plan, in which case the clinician acknowledges their active self-management and moves to the next part of the visit. Others in this group may have considerable ambivalence about change or face complex situations where other priorities take precedence. Clinicians frequently label these individuals as "resistant." The Spirit of MI can be very useful when working with these patients to accept and respect their autonomy while encouraging ongoing partnership at a future time. For example, a clinician may say “It sounds like you are not interested in making a plan for your health right now. Would it be OK if I ask you about this again at our next visit?” Pushing forward to make a "plan for change" when a patient is not ready decreases both motivation for change as well as the likelihood for a successful outcome [32].
Other patients may benefit from additional motivational approaches to further explore change and ambivalence. If the clinician does not have these skills, patients may be seamlessly transitioned to another resource within or external to the care team.
Skill 1: Offering a Behavioral Menu
If in response to Question 1 an individual is unable to come up with an idea of their own or needs more information, then offering a Behavioral Menu may be helpful [44,45]. Consistent with the “Spirit of MI,” BAP attempts to elicit ideas from the individual themselves; however, it is important to recognize that some people require assistance to identify possible actions. A behavioral menu is comprised of 2 or 3 suggestions or ideas that will ideally trigger individuals to discover an idea of their own. There are 3 distinct evidence-based steps to follow when presenting a Behavioral Menu.
1) Ask permission to offer a behavioral menu. Asking permission to share ideas respects patient autonomy and prevents the provider from inadvertently assuming an expert role. For example: “Would it be OK if I shared with you some examples of what some other patients I work with have done?”
2) Offer 2 to 3 general yet varied ideas all at once (Figure 2, entry 5). It helps to mention things that other patients have decided to do with some success. Using this approach avoids the clinician assuming too much about the patient or allowing the patient to reject the ideas. It is important to remember that the list is to prompt ideas, not to find a perfect solution [17]. For example: “One patient I work with decided to join a gym and start exercising, another decided to pick up an old hobby he used to enjoy doing and another patient decided to schedule some time with a friend she hadn’t seen in a while.”
3) Ask if any of the ideas appeal to the individual as something that might work for them or if the patient has an idea of his/her own (Figure 2, entry 5). Evocation from the Spirit of MI is built in with this prompt [17]. For example: “These are some ideas that have worked for other patients I work with, do they trigger any ideas that might work for you?”
Skill 2: SMART Planning
Once an individual decides on an area of focus, the clinician partners with the patient to clarify the details and create an action plan to achieve their goal. Given that individuals are more likely to successfully achieve goals that are specific, proximal, and achievable as opposed to vague and distal [46,47], the clinician works with patient to ensure that the patient’s goal is SMART (specific, measurable, achievable, relevant and time-bound). The term SMART has its roots in the business management literature [48] as an adaptation of Locke’s pioneering research (1968) on goal setting and motivation [49]. In particular, Locke and Latham’s theory of Goal Setting and Task performance, states that “specific and achievable” goals are more likely to be successfully reached [47,50].
We suggest helping the patient to make smart goals by eliciting answers to questions applicable to the plan, such as “what?” “where?” “when?” “how long?” “how often?” “how much?” and “when will you start?” [51]. A resulting plan might be “I will walk for 20 minutes, in my neighborhood, every Monday, Wednesday and Friday before dinner.”
Skill 3: Elicit a Commitment Statement
Once the individual has developed a specific plan, the next step of BAP is for the clinician to ask him or her to “tell back” the specifics of the plan. The provider might say something like, “Just to make sure we understand each other, would you repeat back what you’ve decided to do?” The act of “repeating back” organizes the details of the plan in the persons mind and may lead to an unconscious self-reflection about the feasibility of the plan [43,52], which then sets the stage for Question 2 of BAP (Scaling for Confidence). Commitment predicts subsequent behavior change, and the strength of the commitment language is the strongest predictor of success on an action plan [43,52,53]. For example saying “I will” is stronger than saying “I will try.”
Question 2: Scaling for Confidence
After a commitment statement has been elicited, the second question of BAP is asked. “How confident or sure do you feel about carrying out your plan on a scale from 0 to 10, where 0 is not confident at all and 10 is totally confident or sure?” Confidence scaling is a common tool used in behavioral interventions, MI, and chronic disease self-management programs [17,51]. Question 2 assesses an individual’s self-efficacy to complete the plan and facilitates discussion about potential barriers to implementation in order to increase the likelihood of success of a personal action plan.
For patients who have difficulty grasping the concept of a numerical scale, the word “sure” can be substituted for “confident” and a Likert scale including the terms “not at all sure,” “somewhat sure,” and “very sure” substituted for the numerical confidence ruler, ie, “How sure are you that you will be able to carry out your plan? Not at all sure, somewhat sure, or very sure?” Alternatively, people of different cultural backgrounds may find it easier to grasp the concept using familiar images or experiences. For example, Native Americans from the Southwest have adapted the scale to depict a series of images ranging from planting a corn seed to harvesting a crop or climbing a ladder, while in some Latino cultures the image of climbing a mountain (“How far up the mountain are you?”) is useful to demonstrate “level of confidence” concept [54].
Skill 4: Problem Solving for Low Confidence
When confidence is relatively low (ie, below 7), we suggest collaborative problem solving as the next step [8,51]. Low confidence or self-efficacy for plan completion is a concern since low self-efficacy predicts non-completion [8]. Successfully implementing the action plan, no matter how small, increases confidence and self-efficacy for engaging in the behavior [8].
There are several steps that a clinician follows when collaboratively problem-solving with a patient with low confidence (Figure 1).
• Recognize that a low confidence level is greater than no confidence at all. By affirming the strength of a patient’s confidence rather than negatively focusing on a low level of confidence, the provider emphasizes the patient’s strengths.
• Collaboratively explore ways that the plan could be modified in order to improve confidence. A Behavioral Menu can be offered if needed. For example, a clinician might say something like: “That’s great that your confidence level is a 5. A 5 is a lot higher than a 1. People are more likely to have success with their action plans when confidence levels are 7 or more. Do you have any ideas of how you might be able to increase your level confidence to a 7 or more?”
• If the patient has no ideas, ask permission to offer a Behavioral Menu: “Would it be ok to share some ideas about how other patients I’ve worked with have increased their confidence level?” If the patient agrees, then say... “Some people modify their plans to make them easier, some choose a less ambitious goal or adjust the frequency of their plan, and some people involve a friend or family member. Perhaps one of these ideas seems like a good one for you or maybe you have another idea?”
Question 3: Arranging Accountability
Once the details of the plan have been determined and confidence level for success is high, the next step is to ask Question 3: “Would you like to set a specific time to check in about your plan to see how things are going?” This question encourages a patient to be accountable for their plan, and reinforces the concept that the physician and care team consider the plan to be important. Research supports that people are more likely to follow through with a plan if they choose to report back their progress [43] and suggests that checking-in frequently earlier in the process is helpful [55]. Ideally the clinician and patient should agree on a time to check in on the plan within a week or two (Figure 2, entry 29).
Accountability in the form of a check-in may be arranged with the clinical provider, another member of the healthcare team or a support person of the patient’s choice (eg, spouse, friend). The patient may also choose to be accountable to themselves by using a calendar or a goal setting application on their smart phone device or computer.
Skill 5: Follow-up
The purpose of the check-in is for learning and adjustment of the plan as well as to provide support regardless of outcome. Checking-in encourages reflection on challenges and barriers as well as successes. Patients should be given guidance to think through what worked for them and what did not. Focusing just on “success” of the plan will be less helpful. If follow-up is not done with the care team in the near term, checking-in can be accomplished at the next scheduled visit. Patient portals provide another opportunity for patients to dialogue with the care team about their plan.
Experiential Insights from Clinical Experience Using BAP
The authors collective experience to date indicates that between 50% to 75% of individuals who are asked Question 1 go on to develop an action plan for change with relatively little need for additional skills. In other studies of action planning in primary care, 83% of patients made action plans during a visit, and at 3-week follow-up 53% had completed their action plan [56]. A recent study of action planning using an online self-management support program reported that action plans were successfully completed (49%), partially completed (40%) or incomplete (11% of the time) [35].
Another caveat to consider is that the process of planning is more important that the actual plan itself. It is imperative to allow the patient, not the clinician, to determine the plan. For example, a patient with multiple poorly controlled chronic illnesses including depression may decide to focus his action plan around cleaning out his car rather than disease control such as dietary modification, medication adherence or exercise. The clinician may initially fail to view this as a good use of clinician time or healthcare resources since it seems unrelated to health. However, successful completion of an action plan is not the only objective of action planning. Building self-efficacy, which may lead to additional action planning around health, is more important [4,46]. The challenge is therefore for the clinician to take a step back, relinquish the “expert role,” and support the goal setting process regardless of the plan. In this example, successfully cleaning out his car may increase the patient’s self-efficacy to control other aspects of his life including diet and the focus of future plans may shift [4].
When to Use BAP
Opportunities for patient engagement in action planning occur when addressing chronic illness concerns as well as during discussions about health maintenance and preventive care. BAP can be considered as part of any routine clinical agenda unless patient preferences or clinical acuity preclude it. As with most clinical encounters, the flow is often negotiated at the beginning of the visit. BAP can be accomplished at any time that works best for the flow and substance of the visit, but a few patterns have emerged based on our experience.
BAP fits naturally into the part of the visit when the care plan is being discussed. The term “care plan” is commonly used to describe all of the care that will be provided until the next visit. Care plans can include additional recommendations for testing or screening, therapeutic adjustments and or referrals for additional expertise. Ideally the patients “agreed upon” contribution to their care should also be captured and documented in their care plan. This is often described as the patients “self-management goal.” For patients who are ready to make a specific plan to change behavior, BAP is an efficient way to support patients to craft an action plan that can then be incorporated into the overall care plan.
Another variation of when to use BAP is the situation when the patient has had a prior action plan and is being seen for a recheck visit. Discussing the action plan early in the visit agenda focuses attention on the work patients have put into following their plan. Descriptions of success lead readily to action plans for the future. Time spent discussing failures or partial success is valuable to problem solve as well as to affirm continued efforts to self-manage.
BAP can also be used between scheduled visits. The check-in portion of BAP is particularly amenable to follow-up by phone or by another supporter. A pre-arranged follow-up 1 to 2 weeks after creation of a new action plan [8] provides encouragement to patients working on their plan and also helps identify those who need more support.
Finally, BAP can be completed over multiple visits. For patients who are thinking about change but are not yet committed to planning, a brief suggestion about the value of action planning with a behavioral menu may encourage additional self-reflection. Many times patients return to the next visit with clear ideas about changes that would be important for them to make.
Fitting BAP into a 20-Minute Visit
Using BAP is a time-efficient way to provide self-management support within the context of a 20-minute visit with engaged patients who are ready to set goals for health. With practice, clinicians can often conduct all the steps within 3 to 5 minutes. However, patients and clinicians often have competing demands and agendas and may not feel that they have time to conduct all the steps. Thus, utilizing other members of the health care team to deliver some or all of BAP can facilitate implementation.
Teams have been creative in their approach to BAP implementation but 2 common models involve a multidisciplinary approach to BAP. In one model, the clinician assesses the patient readiness to make a specific action plan by asking Question 1, usually after the current status of key problems have been addressed and discussions begin about the interim plan of care. If the patient indicates interest, another staff member trained in BAP, such as an medical assistant, health coach or nurse, guides the development of the specific plan, completes the remaining steps and inputs the patient’s BAP into the care plan.
In another commonly deployed model, the front desk clerk or medical assistant helps to get the patient thinking by asking Question 1 and perhaps by providing a behavioral menu. When the clinician sees the patient, he follows up on the behavior change the patient has chosen and affirms the choice. Clinicians often flex seamlessly with other team members to complete the action plan depending on the schedule and current patient flow.
Regardless of how the workflows are designed, BAP implementation requires staff that can provide BAP with fidelity, effective communication among team members involved in the process and a standardized approach to documentation of the specific action plan, plan for check-in and notes about follow-up. Care teams commonly test different variations of personnel and workflows to find what works best for their particular practice.
Implementing BAP to Support PCMH Transformation
To support PCMH transformation substantial changes are needed to make care more proactive, more patient-centered and more accountable. One of the common elements for PCMH recognition regardless of sponsor is to enhance self-management support [20,57,58]. Practices pursuing PCMH designation are searching for effective evidence-based approaches to provide self-management support and guide action planning for patients. The authors suggest implementation of BAP as a potential strategy to enhance self-management support. In addition to facilitating meeting the actual PCMH criteria, BAP is aligned with the transitions in care delivery that are an important part of the transformation including reliance on team-based care and meaningful engagement of patients in their care [59,60].
In our experience, BAP is introduced incrementally into a practice initially focusing on one or two patient segments and then including more as resources allow. Successful BAP implementation begins with an organizational commitment to self-management support, decisions about which populations would benefit most from self-management support and BAP, training of key staff and clearly defined workflows that ensure reliable BAP provision.
BAP’s stepped-care design makes it easy to teach to all team members and as described above, team-based delivery of BAP functions well in those situations where clinicians and trained ancillary staff can “hand off” the process at any time to optimize the value to the patient while respecting inherent time constraints.
Documentation of the actual goal and follow-up is an important component to fully leverage BAP. Goals captured in a template generate actionable lists for action plan follow-up. Since EHRs vary considerably in their capacity to capture goals, teams adding BAP to their workflow will benefit from discussion of standardized documentation practices and forms.
Summary
Brief Action Planning is a self-management support technique that can be used in busy clinical settings to support patient self-management through patient-centered goal setting. Each step of BAP is based on principles grounded in evidence. Health care teams can learn BAP and integrate it into clinical delivery systems to support self-management for PCMH transformation.
Corresponding author: Damara Gutnick, MD, New York University School of Medicine, New York, NY, [email protected].
Financial disclosures: None.
1. Hoffman C, Rice D, Sung HY. Persons withnic conditions. Their prevalence and costs. JAMA 1996;276(18):1473–9.
2. Institute of Medicine. Living well with chro:ic illness: a call for public health action. Washington (DC); The National Academies Press; 2012.
3. De Silva D. Evidence: helping people help themselves. London: The Health Foundation Inspiring Improvement; 2011.
4. Bodenheimer T, Lorig K, Holman H, Grumbach K. Patient self-management of chronic disease in primary care. JAMA 2002;288:2469–75.
5. Miller W, Benefield R, Tonigan J. Enhancing motivation for change in problem drinking: A controlled comparison of two therapist styles. J Consul Clin Psychol 1993;61:455–461.
6. Lorig K, Holman H. Self-management education: history, definition, outcomes, and mechanisms. Ann Behav Med 2003;26:1–7.
7. Artinian NT, Fletcher GF, Mozaffarian D, et al. Interventions to promote physical activity and dietary lifestyle changes for cardiovascular risk factor reduction in adults: a scientific statement from the American Heart Association. Circulation 2010;122:406–41.
8. Lorig K, Laurent DD, Plant K, Krishnan E, Ritter PL. The components of action planning and their associations with behavior and health outcomes. Chronic Illn 2013. Available at www.ncbi.nlm.nih.gov/pubmed/23838837.
9. Schlair S, Moore S, Mcmacken M, Jay M. How to deliver high-quality obesity counseling in primary care using the 5As framework. J Clin Outcomes Manag 2012;19:221–9.
10. Lorig KR, Ritter P, Stewart a L, et al. Chronic disease self-management program: 2-year health status and health care utilization outcomes. Med Care 2001;39:1217–23.
11. Jay MR, Gillespie CC, Schlair SL, et al. The impact of primary care resident physician training on patient weight loss at 12 months. Obesity 2013;21:45–50.
12. Goldstein MG, Whitlock EP, DePue J. Multiple behavioral risk factor interventions in primary care. Summary of research evidence. Am J Prev Med 2004;27:61–79.
13. Lundahl B, Moleni T, Burke BL, et al. Motivational interviewing in medical care settings: a systematic review and meta-analysis of randomized controlled trials. Patient Educ Couns 2013;93:157–68.
14. Rubak S, Sandbæk A, Lauritzen T, Christensen B. Motivational Interviewing: a systematic review and meta-analysis. Br J Gen Pract 2005;55:305–12.
15. Dunn C, Deroo L, Rivara F. The use of brief interventions adapted from motivational interviewing across behavioral domains: a systematic review. Addiction 2001;96:1725–42.
16. Heckman CJ, Egleston BL, Hofmann MT. Efficacy of motivational interviewing for smoking cessation: a systematic review and meta-analysis. Tob Control 2010;19:410–6.
17. Miller WR, Rollnick S. Motivational interviewing: helping people change. 3rd ed. New York: Guilford Press; 2013.
18. Resnicow K, DiIorio C, Soet J, et al. Motivational interviewing in health promotion: it sounds like something is changing. Health Psychol 2002;21:444–451.
19. Doherty RB, Crowley RA. Principles supporting dynamic clinical care teams: an American College of Physicians position paper. Ann Intern Med 2013;159:620–6.
20. NCQA PCMH 2011 Standards, Elements and Factors. Documentation Guideline/Data Sources. 4A: Provide self-care support and community resources. Available at www.ncqa.org/portals/0/Programs/Recognition/PCMH_2011_Data_Sources_6.6.12.pdf.
21. Reims K, Gutnick D, Davis C, Cole S. Brief action planning white paper. 2012. Available at www.centrecmi.ca.
22. Cole S, Davis C, Cole M, Gutnick D. Motivational interviewing and the patient centered medical home: a strategic approach to self-management support in primary care. In: Patient-Centered Primary Care Collaborative. Health IT in the patient centered medical home. October 2010. Available at www.pcpcc.net/guide/health-it-pcmh.
23. Cole S, Cole M, Gutnick D, Davis C. Function three: collaborate for management. In: Cole S, Bird J, editors. The medical interview: the three function approach. 3rd ed. Philadelphia:Saunders; 2014.
24. Cole S, Gutnick D, Davis C, Cole M. Brief action planning (BAP): a self-management support tool. In: Bickley L. Bates’ guide to physical examination and history taking. 11th ed. Philadelphia: Lippincott Williams and Wilkins; 2013.
25. AMA Physician tip sheet for self-management support. Available at www.ama-assn.org/ama1/pub/upload/mm/433/phys_tip_sheet.pdf.
26. Taksler G, Keshner M, Fagerlin A. Personalized estimates of benefit from preventive care guidelines. Ann Intern Med 2013;159:161–9.
27. Centre for Comprehensive Motivational Interventions [website]. Available at www.centreecmi.com.
28. Del Canale S, Louis DZ, Maio V, et al. The relationship between physician empathy and disease complications: an empirical study of primary care physicians and their diabetic patients in Parma, Italy. Acad Med 2012;87:1243–9.
29. Moyers TB, Miller WR, Hendrickson SML. How does motivational interviewing work? Therapist interpersonal skill predicts client involvement within motivational interviewing sessions. J Consult Clin Psychol 2005;73:590–8.
30. Hojat M, Louis DZ, Markham FW, et al. Physicians’ empathy and clinical outcomes for diabetic patients. Acad Med 2011;86:359–64.
31. Heisler M, Bouknight RR, Hayward RA, et al. The relative importance of physician communication, participatory decision making, and patient understanding in diabetes self-management. J Gen Intern Med 2002;17:243–52.
32. Miller WR, Rollnick S. Ten things that motivational interviewing is not. Behav Cogn Psychother 2009;37:129–40.
33. Bandura A. Self-efficacy: toward a unifying theory of behavioral change. Psychol Rev 1977;85:191–215.
34. Kiesler, Charles A. The psychology of commitment: experiments linking behavior to belief. New York: Academic Press;1971.
35. Lorig K, Laurent DD, Plant K, et al. The components of action planning and their associations with behavior and health outcomes. Chronic Illn 2013.
36. MacGregor K, Handley M, Wong S, et al. Behavior-change action plans in primary care: a feasibility study of clinicians. J Am Board Fam Med 19:215–23.
37. Gollwitzer P. Implementation intentions. Am Psychol 1999;54:493–503.
38. Gollwitzer P, Sheeran P. Implementation intensions and goal achievement: A meta-analysis of effects and processes. Adv Exp Soc Psychology 2006;38:69–119.
39. Stretcher V, De Vellis B, Becker M, Rosenstock I. The role of self-efficacy in achieving behavior change. Health Educ Q 1986;13:73–92.
40. Ajzen I. Constructing a theory of planned behavior questionnaire. Available at people.umass.edu/aizen/pdf/tpb.measurement.pdf.
41. Rogers RW. Protection motivation theory of fear appeals and attitude-change. J Psychol 1975;91:93–114.
42. Schwarzer R. Modeling health behavior change: how to predict and modify the adoption and maintenance of health behaviors. Appl Psychol An Int Rev 2008;57:1–29.
43. Cialdini R. Influence: science and practice. 5th ed. Boston:Allyn and Bacon; 2008.
44. Stott NC, Rollnick S, Rees MR, Pill RM. Innovation in clinical method: diabetes care and negotiating skills. Fam Pract 1995;12:413–8.
45. Miller WR, Rollnick S, Butler C. Motivational interviewing in health care. New York: Guilford Press; 2008.
46. Bodenheimer T, Handley M. Goal-setting for behavior change in primary care: an exploration and status report. Patient Educ Couns 2009;76:174–80.
47. Locke EA, Latham GP. Building a practically useful theory of goal setting and task motivation. Am Psychol 2002;57:705–17.
48. Doran G. There’s a S.M.A.R.T. way to write management’s goals and objectives. Manag Rev 1981;70:35–6.
49. Locke EA. Toward a theory of task motivation and incentives. Organ Behav Hum Perform 1968;3:157–89.
50. Locke EA, Latham GP, Erez M. The determinants of goal commitment. Acad Manag Rev 1988;13:23–39.
51. Lorig K, Homan H, Sobel D, et al. Living a healthy life with chronic conditions. 4th ed. Boulder: Bull Publishing; 2012.
52. Amrhein PC, Miller WR, Yahne CE, et al. Client commitment language during motivational interviewing predicts drug use outcomes. J Consult Clin Psychol 2003;71:862–78.
53. Ahaeonovich E, Amrhein PC, Bisaha A, et al. Cognition, commitment language and behavioral change among cocaine-dependent patients. Psychol Addict Behav 2008;22:557–62.
54. Gutnick D. Centre for Comprehensive Motivational Interventions community of practice webinar. Brief action planning and culture: developing culturally specific confidence rules. 2012. Available at www.centrecmi.ca.
55. Artinian NT, Fletcher GF, Mozaffarian D, et al. Interventions to promote physical activity and dietary lifestyle changes for cardiovascular risk factor reduction in adults. A scientific statement from the American Heart Association. Circulation 2010;122:406–41.
56. Handley M, MacGregor K, Schillinger D, et al. Using action plans to help primary care patients adopt healthy behaviors: a descriptive study. J Am Board Fam Med 2006;19:224–31.
57. Joint Commision. Primary care medical home option-additional requirements. Available at www.jointcommission.org/assets/1/18/PCMH_new_stds_by_5_characteristics.pdf.
58. Oregon Health Policy and Research. Standards for patient centered medical home recognition. Available at www.oregon.gov/oha/OHPR/pages/healthreform/pcpch/standards.aspx.
59. Nutting PA, Crabtree BF, Miller WL, et al. Journey to the patient-centered medical home: a qualitative analysis of the experiences of practices in the national demonstration project. Am Fam Med 2010;8(Suppl 1):S45–S56.
60. Stewart EE, Nutting PA, Crabtree BF, et al. Implementing the patient-centered medical home: observation and description of the National Demonstration Project. Am Fam Med 2010;8(Suppl 1):S21–S32.
Interventions can ease insomnia in cancer patients

Credit: RelaxingMusic
A new study suggests cancer patients struggling with insomnia can choose between 2 behavioral interventions to obtain relief: cognitive behavioral therapy for insomnia (CBT-I) and mindfulness-based stress reduction (MBSR).
CBT-I is the gold standard of care, but the research showed that MBSR can also help improve sleep for cancer patients.
CBT-I involves stimulus control, sleep restriction, cognitive therapy, and relaxation training. When combined, these strategies target and reduce sleep-related physiologic and cognitive arousal to re-establish restorative sleep.
MBSR provides patients with psychoeducation on the relationship between stress and health. It also employs meditation techniques and gentle yoga to support mindful awareness and help patients respond better to stress.
Previous research has shown that MBSR can reduce distress and improve psychological well-being in patients with cancer. But this is the first study to directly compare MBSR to CBT-I in cancer patients.
The results are published in the Journal of Clinical Oncology.
“Insomnia and disturbed sleep are significant problems that can affect approximately half of all cancer patients,” said lead study author Sheila Garland, PhD, of Abramson Cancer Center at the University of Pennsylvania in Philadelphia.
“If not properly addressed, sleep disturbances can negatively influence therapeutic and supportive care measures for these patients, so it’s critical that clinicians can offer patients reliable, effective, and tailored interventions.”
With this in mind, Dr Garland and her colleagues tested behavioral interventions for insomnia in 111 patients recruited from a cancer center in Calgary, Alberta, Canada. Patients were randomized to either a CBT-I program (n=47) or an MBSR program (n=64) for 8 weeks.
Thirty-two patients completed the CBT-I program, and 40 completed the MBSR program. The researchers assessed patients immediately after program completion (at 2 months) and at 5 months from baseline.
Immediately after completion, MBSR was less effective than CBT-I at improving insomnia severity (P=0.35). But at the 5-month follow-up point, MBSR proved noninferior to CBT-I (P=0.02).
Patients in the CBT-I group showed greater overall improvement in subjectively measured sleep onset latency, sleep efficiency, sleep quality, and dysfunctional sleep beliefs than patients in the MBSR group.
But both groups showed progressive improvement over time when it came to subjectively measured total sleep time, wake after sleep onset, stress, and mood disturbance.
“That MBSR can produce similar improvements to CBT-I and that both [interventions] can effectively reduce stress and mood disturbance expands the available treatment options for insomnia in cancer patients,” Dr Garland said.
“This study suggests that we should not apply a ‘one-size-fits-all model’ to the treatment of insomnia and emphasizes the need to individualize treatment based on patient characteristics and preferences.” ![]()
Controlling cells after transplant

Credit: Umberto Salvagnin
Scientists say they have devised a method for engineering cells that are more easily controlled after transplantation.
The team loaded cells with microparticles that release phenotype-altering agents for days to weeks after transplantation.
With this method, the researchers were able to control cells’ secretome, viability, proliferation, and differentiation. The approach was also successful in delivering drugs and other factors to the cell’s microenvironment.
The scientists described this method in Nature Protocols.
They provided step-by-step instructions for generating micrometer-sized agent-doped poly(lactic-co-glycolic) acid (PLGA) particles using a single-emulsion evaporation technique, engineering cultured cells, and confirming particle internalization.
“Once those particles are internalized into the cells, which can take on the order of 6 to 24 hours, we can deliver the transplant immediately or even cryopreserve the cells,” said study author Jeffrey Karp, PhD, of the Harvard Stem Cell Institute in Cambridge, Massachusetts.
“When the cells are thawed at the patient’s bedside, they can be administered, and the agents will start to be released inside the cells to control differentiation, immune modulation, or matrix production, for example.”
Of course, it could take more than a decade for this type of cell therapy to be a common medical practice. But Dr Karp and his colleagues detailed this research in Nature Protocols to encourage others in the scientific community to use the technique and potentially speed up the pace of this research.
The team’s paper shows the range of different cell types that can be particle-engineered, including stem cells, immune cells, and pancreatic cells.
“With this versatile platform . . . , we’ve demonstrated the ability to track cells in the body, control stem cell differentiation, and even change the way cells interact with immune cells,” said study author James Ankrum, PhD, who was a graduate student in Dr Karp’s lab when this research was conducted but is now at the University of Minnesota in Minneapolis.
“We’re excited to see what applications other researchers will imagine using this platform.” ![]()