User login
New and Noteworthy Information—December 2013
Mild traumatic brain injury (TBI) may be associated with increased cortical fractional anisotropy, but not with cortical or subcortical atrophy, according to research published online ahead of print November 20 in Neurology. Investigators evaluated 50 patients and 50 sex-, age-, and education-matched controls with a clinical and neuroimaging battery approximately 14 days after TBI. A total of 26 patients returned for follow-up four months after injury. Patients had increased fractional anisotropy in the bilateral superior frontal cortex during the semiacute phase of injury. Fractional anisotropy in the left superior frontal cortex remained elevated at four months after injury. The researchers found no significant differences between patients and matched controls on neuropsychologic testing or measures of gray matter atrophy or mean diffusivity at either time point.
Researchers detailed the early clinical course, morbidity, and mortality of the 2012 outbreak of fungal infections associated with methylprednisolone injections in two articles published October 24, 2013, in the New England Journal of Medicine. As of July 1, 2013, a total of 749 cases of infection had been reported in 20 states, including 61 deaths. Of 728 patients for whom data were available, 31% had meningitis and no other documented infection. Of 328 patients without peripheral joint infection who were included in one investigation, 81% had CNS infection, and 19% had non-CNS infections only. The investigators found evidence of Exserohilum rostratum in 36% of patients for whom samples were available. Patients’ median age was 64, and the median incubation period was 47 days. Forty patients had a stroke.
An algorithm may accurately predict time to death, institutionalization, and need for full-time care in patients with Alzheimer’s disease, according to an article published online ahead of print September 24 in the Journal of Alzheimer’s Disease. Investigators followed two study cohorts with mild Alzheimer’s disease for 10 years. The first cohort included 252 patients, and the second included 254 patients. Participants underwent semiannual assessments that included cognition, functional capacity, and medical, psychiatric, and neurologic information. For each of the three outcome measures, the predicted survival curves were well within the 95% confidence intervals of the observed survival curves. The actual and predicted survival curves were statistically equivalent. The algorithm can be adapted to predict other important disease end points, according to the researchers.
High pulse pressure may be associated with increased CSF phosphorylated tau and decreased β-amyloid 1–42 (Aβ1–42) in cognitively normal older adults, according to research published online ahead of print November 13 in Neurology. A total of 177 cognitively normal, stroke-free older adults underwent blood pressure assessment for determination of pulse pressure, as well as lumbar puncture for measurement of CSF Aβ1–42 and phosphorylated tau. High pulse pressure was associated with increased phosphorylated tau, reduced Aβ1–42, and increased phosphorylated tau to Aβ1–42 ratio. After controlling for covariates, the investigators found that pulse pressure remained associated with phosphorylated tau and phosphorylated tau to Aβ1–42 ratio, but was no longer associated with Aβ1–42. The relationship between pulse pressure and CSF biomarkers is age-dependent, said the researchers.
Acute stroke care in hospitals with neurology residency programs may be associated with an increased use of thrombolytics, investigators reported online ahead of print November 1 in Neurology. The disparities between the thrombolysis rates in hospitals with neurology residency programs and those in other teaching hospitals and nonteaching hospitals may be greater among elderly patients. Researchers retrospectively studied a nationally representative sample of patients with ischemic stroke. A total of 712,433 individuals from 6,839 hospital samples were included. Of these patients, 10.1%, 29.1%, and 60.8% were treated in hospitals with neurology residency programs, other teaching hospitals, and nonteaching hospitals, respectively. Patients in hospitals with neurology residency programs received thrombolysis more frequently (3.74%) than those in other teaching hospitals (2.28%) and those in nonteaching hospitals (1.44%).
The FDA has approved Aptiom (eslicarbazepine acetate) as an add-on medication to treat partial-onset seizures associated with epilepsy. In three large, phase III safety and efficacy trials that included more than 1,400 patients with inadequately controlled partial-onset seizures, eslicarbazepine acetate was associated with statistically significant reductions in standardized seizure frequency, compared with placebo. Significantly more patients who received eslicarbazepine acetate had a reduction in seizure frequency of 50% or more, compared with controls. The most common side effects include dizziness, somnolence, nausea, headache, diplopia, vomiting, fatigue, vertigo, ataxia, and blurred vision. Eslicarbazepine acetate will not be classified as a controlled substance. Sunovion (Marlborough, Massachusetts) markets the drug and expects it to be available in the US during the second quarter of 2014.
The FDA has approved the NeuroPace RNS System, a device intended to reduce the frequency of seizures in patients with epilepsy who have not responded well to medications. The device consists of a small neurostimulator implanted within the skull. The neurostimulator is connected to one or two electrodes that are placed where the seizures are suspected to originate within the brain or on the surface of the brain. When it detects abnormal electrical activity, the neurostimulator delivers electrical stimulation to normalize brain activity and prevent seizures. In a randomized study of 191 patients, the average number of seizures per month was reduced by approximately 38% at three months in patients in whom the device was turned on. The RNS System is manufactured by NeuroPace (Mountainview, California).
Reducing blood pressure with antihypertensive medications may not decrease the likelihood of death and major disability among patients with acute ischemic stroke, according to a study published online ahead of print November 17 in JAMA. Researchers studied 4,071 patients with nonthrombolyzed ischemic stroke within 48 hours of onset and elevated systolic blood pressure. Patients were randomized to receive antihypertensive treatment or to discontinue all antihypertensive medications during hospitalization. Mean systolic blood pressure was reduced from 166.7 mm Hg to 144.7 mm Hg within 24 hours in the antihypertensive treatment group and from 165.6 mm Hg to 152.9 mm Hg in the control group within 24 hours after randomization. The researchers found no difference in the rates of death and major disability between the treatment groups.
Persons with high urinary concentrations of tungsten may have an increased risk of stroke, according to a study published November 11 in PLOS One. Investigators analyzed associations between tungsten, commonly used in mobile phones and computers, and cardiovascular disease or stroke using crude and adjusted logistic regression models in a cohort of 8,614 adults (ages 18 to 74) with 193 reported stroke diagnoses and 428 reported diagnoses of cardiovascular disease. The researchers also stratified the data to characterize associations in a subset of individuals between ages 18 and 50. Elevated tungsten concentrations were strongly associated with an increase in the prevalence of stroke, independent of typical risk factors (odds ratio: 1.66). The association between tungsten and stroke in the young age category was still evident (odds ratio: 2.17).
Traumatic brain injury (TBI) may be associated with increased amyloid deposition, according to research published online ahead of print November 11 in JAMA Neurology. Investigators used carbon 11-labeled Pittsburgh Compound B ([11C]PiB) PET to image amyloid deposition in 11 controls and 15 patients between one and 361 days after TBI. Compared with the controls, the patients with TBI had significantly increased [11C]PiB distribution volume ratios in cortical gray matter and the striatum, but not in the thalamus or white matter. The investigators observed increases in [11C]PiB distribution volume ratios in patients with TBI across most cortical subregions. The increases were replicated using comparisons of standardized uptake value ratios and could not be accounted for by methodologic confounders.
Compared with persons who speak only one language, bilingual individuals may have a delayed onset of dementia, according to a study published online ahead of print November 6 in Neurology. Investigators reviewed case records of 648 patients with dementia (391 bilinguals) diagnosed in a specialist clinic. They compared age at onset of first symptoms between monolingual and bilingual groups and examined the influence of the number of languages spoken, education, occupation, and other potentially interacting variables. Bilingual patients developed dementia 4.5 years later than the monolingual patients. The researchers found a significant difference in age at onset of Alzheimer’s disease dementia, frontotemporal dementia, and vascular dementia. The age difference was also observed in illiterate patients. The investigators found no additional benefit to speaking more than two languages.
Temporal lobe epilepsy (TLE) may entail altered structural connectivity in the brain, according to a study published online ahead of print November 8 in Radiology. Investigators analyzed 60-direction diffusion-tensor imaging and magnetization-prepared rapid acquisition gradient-echo (MP-RAGE) MRI volumes for 24 patients with left TLE and 24 healthy control subjects. MP-RAGE volumes were segmented into 1,015 regions of interest that spanned the entire brain. Patients with TLE had 22% to 45% reduced distant connectivity in the medial orbitofrontal cortex, temporal cortex, posterior cingulate cortex, and precuneus, compared with healthy subjects. Local connectivity, as measured by means of network efficiency, was increased by 85% to 270% in the medial and lateral frontal cortices, insular cortex, posterior cingulate cortex, precuneus, and occipital cortex in patients with TLE, compared with healthy subjects.
Gray matter damage may be a key factor associated with long-term accumulation of disability and cognitive impairment in multiple sclerosis (MS), according to research published November 12 in Neurology. Investigators obtained conventional and magnetization transfer (MT) MRI brain scans at baseline and at 12 months for 73 patients with MS, who were followed prospectively with clinical visits and rating of the Expanded Disability Status Scale (EDSS) score and the MS severity score for a median of 13.3 years. At 13-year follow-up, 66% of patients had significant worsening of disability, and 37% had worse cognition. The multivariable model identified baseline gray matter fraction as the only predictor of disability worsening. Baseline disease duration and average gray matter lesion MT ratio were independent variables associated with cognitive deterioration.
—Erik Greb
Senior Associate Editor
Man, 55, With Mild Chest Discomfort
A 55-year-old white man with controlled hypertension and hypercholesterolemia awoke with mild chest discomfort that he believed was mild gastroesophageal reflux. He denied radiation of pain to the shoulders, arms, back, or neck; dyspnea; palpitations; diaphoresis; nausea/vomiting; cough; or fever, during the first 30 hours of discomfort. There was no change in discomfort with deep breath, palpation of the chest, or administration of antacids. Minimal, short-lived improvement was noted with belching.
The patient had no trouble sleeping in the prone position and did not notice an increase in discomfort or unusual difficulty during his daily vigorous 30-minute aerobic workout. In fact, his symptoms seemed to improve or disappear during exercise. The patient denied any recent illness or exposure to sick people, had not traveled outside the United States, and had not been exposed to radiation of the chest wall. At the end of the second day of discomfort, the patient noted irregular palpitations with mild shortness of breath and was transported to the hospital for evaluation. He denied being a cigarette smoker or illicit drug user.
The patient had no history of MI or diabetes. The patient’s father had an MI in his 80s, and two uncles died suddenly in their 50s of “massive heart attacks.” His mother, who had died of sepsis of uncertain etiology approximately 10 days earlier, also had hypertension and hypercholesterolemia but no history of coronary artery disease (CAD). Both of the patient’s adult daughters had been diagnosed with celiac disease in the preceding three years. His elder daughter had also been diagnosed with type 1 diabetes within the past two years.
On examination, the patient was afebrile, with a blood pressure of 143/87 mm Hg; pulse, 53 beats/min; and respiratory rate, 17 breaths/min. The patient’s weight was 204 lb and his height, 75 in (BMI, 25.5). The patient was in no apparent distress. Head, eyes, ears, nose, and throat were unremarkable. There was no significant jugular venous distention. The carotid pulses were full, and no bruits were appreciated. S1 and S2 sounds were within normal limits. No murmurs or S3 or S4 gallops were appreciated. The chest was clear on auscultation. Results of the abdominal exam were negative, no edema was noted in the extremities, and pulses were symmetrical.
ECG demonstrated subtle ST-segment elevation in leads I and aVL with a prominent R wave in lead V1. This pattern was interpreted as consistent with an acute inferolateral MI. A baseline ECG, previously obtained by the patient’s internist, had been interpreted as normal.
Peak troponin level was 55 ng/mL (normal, < 0.03 ng/mL); total creatine kinase (CK), 807 U/L (reference range, 20 to 259 U/L); and mass CK-MB fraction, 44 ng/mL (0.1 to 6.6 ng/mL). Total cholesterol was 105 mg/dL, with both LDL- and HDL-cholesterol fractions at 46 mg/dL. A complete blood count without differential revealed a total white blood cell count of 53,000/µL. Hemoglobin and hematocrit were both low (12.3 g/dL and 34.5%, respectively). All indices were within normal limits, as was the platelet count. Glucose, blood urea nitrogen, creatinine, potassium chloride bicarbonate, and calcium were all within normal limits. The sodium level was slightly low (132 mEq/L). Emergency catheterization revealed an ejection fraction of 45% (reference range, 55% to 70%), with mild-to-moderate diffuse hypokinesis but normal coronary arteries.
The patient was diagnosed with myocarditis, likely of viral origin.
DISCUSSION
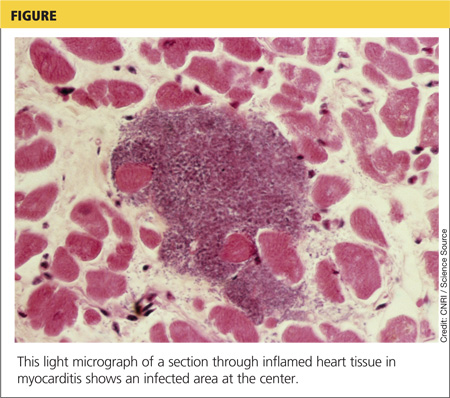
Although the incidence of myocarditis in the US is difficult to assess, autopsy reports implicate it in 8.6% to 12% of cases of sudden cardiac death in young adults,1,2 and a large prospective series implicated myocarditis in 9% of cases of dilated cardiomyopathy.3 Myocarditis is considered to be at one extreme of a spectrum of perimyocardial processes that result in inflammation of the myocardium (see figure), pericardium, or both.4
The underlying pathology involves an acute injury to the myocyte. This activates the innate and humoral immune systems, resulting in severe inflammation. The immune reaction eventually subsides, and the myocardium recovers. In certain patients, however, myocardial inflammation persists, resulting in ongoing myocyte damage, relentless symptomatic heart failure, or even death.5
Although a variety of diagnostic criteria have been developed and employed, the diagnosis of myocarditis is often one of exclusion. First proposed in 1986, the Dallas criteria—a histopathologic classification for myocarditis diagnosis—are based on endomyocardial biopsy, with inflammatory cellular infiltrate (with or without associated myocyte necrosis) visible on conventionally stained myocardial tissue sections.5 However, this method poses significant practical limitations, including low sensitivity (43% to 64%) and complication and death rates of 6% and 0.4%, respectively.5,6
An empiric diagnosis of myocarditis is often based on a combination of clinical findings including altered ECG, increase in myocardial enzymes, and lack of significant CAD.6 The recommended diagnostic cardiac magnetic resonance (CMR) imaging criteria for clinically suspected myocardial inflammation (ie, the Lake Louise Criteria) include at least two of the following:7
• Regional or global myocardial signal intensity increase in T2-weighted images.
• Increased global myocardial early gadolinium enhancement ratio between myocardium and skeletal muscle in gadolinium-enhanced T1-weighted images.
• At least one focal lesion with nonischemic regional distribution in inversion recovery–prepared gadolinium-enhanced T1-weighted images (“late gadolinium enhancement”).
Because of its reported high sensitivity and specificity (100% and 90%, respectively), CMR was used in the case patient to confirm the diagnosis of myocarditis.8 Specifically, CMR with contrast demonstrated normal left ventricular cavity size and mild reduction in overall left ventricular systolic function, with a visually estimated left ventricular ejection fraction of 45% to 50%. Regional hypokinesis of the mid-inferior wall and apical inferior septum was noted. Delayed contrast imaging demonstrated extensive non-CAD scarring and fibrosis, involving the basal anterior wall, basal inferior wall, and basal and midlateral wall in a pattern consistent with acute myocarditis.
Just as there is variability in the specific criteria by which the diagnosis of myocarditis can be made, the array of clinical findings with which it can manifest range from fatigue and other nonspecific symptoms to fulminant congestive heart failure and sudden death.6 Often, but not always, a viral prodrome precedes the onset of “cardiac symptoms” (eg, chest pain, dyspnea, palpitations, or syncope).5 This patient’s multiple risk factors for CAD and a suggestive, albeit atypical, history of chest discomfort, palpitations, and shortness of breath helped to focus the clinicians’ evaluation on the heart.
Potential Causes
Once a diagnosis of myocarditis is rendered, the next challenge is distinguishing its specific source from a plethora of potential etiologies, including infection, toxic exposure, or hypersensitivity/autoimmune reaction. Viral infections (mostly herpes, parvovirus, and cytomegalovirus) are thought to cause most cases of myocarditis in developed countries.5,9
Viral myocarditis results when viruses enter cardiac myocytes and incite a cytotoxic effect with activation of the immune response, including expression of interferon , natural killer cells, and release of nitric oxide. The majority of patients recover, but some develop an adaptive immune response, which further causes cardiac damage. In this response, antibodies to viral and to some cardiac proteins are produced, and effector T lymphocytes proliferate. Viral genome or inflammatory mechanisms may persist, contributing to ventricular dysfunction leading to heart failure and arrhythmias.10
Celiac disease is a chronic gastroenterologic disease caused by an immune response to a gluten protein. Damage to the brush border of the small intestine results in an inability to absorb fat, protein, vitamins, and minerals. Intermittent diarrhea, abdominal pain, and bloating are most commonly reported, but celiac disease may also manifest less obviously with iron deficiency anemia, joint pain, muscle cramps, osteoporosis, and neuropathy.11 Iron deficiency anemia that is refractory to iron replacement may offer insight into diagnosing myocarditis due to celiac disease.12 Although studies have found that more than 4% of patients with myocarditis also had celiac disease, none had the classic GI symptoms of celiac disease.12
Takotsubo cardiomyopathy is a transient left ventricular apical ballooning syndrome of unknown etiology. (For more information, see Fasolino T. Takotsubo cardiomyopathy: a clinical overview). Patients who have experienced emotional or physiologic stress and postmenopausal women appear to be at greatest risk. The clinical symptoms mimic MI, including chest pain with ST-segment elevation in the precordial leads on ECG13 and minor elevation of the cardiac enzyme and biomarker levels.14 However, patients experiencing this stress cardiomyopathy lack evidence of atherosclerotic CAD.15 An echocardiogram or CMR imaging reveals characteristic wall motion hypokinesis, akinesis, or dyskinesis of the left ventricular apex and mid-ventricle that help to differentiate it from other forms of myocarditis.15,16 Patient prognosis is favorable, with 95% of patients experiencing a full recovery; left ventricular dysfunction usually begins to improve in a few weeks.13,14
Sarcoidosis is a systemic disease resulting in noncaseating granulomas in multiple organs.17 Initial presentation typically includes bilateral hilar adenopathy, pulmonary reticular opacities, and/or skin, joint, or eye lesions.18 Patients with cardiac sarcoidosis most commonly present with conduction disturbances and ventricular arrhythmias.17 Although frequently absent, clinical symptoms may include palpitations, syncope, dizziness, or chest pain and clinical heart failure.17,18 It is difficult to distinguish cardiac sarcoidosis from other forms of myocarditis unless signs of systemic sarcoidosis are evident. A patient with suspected cardiac sarcoidosis should have an ECG to detect subclinical conduction abnormalities.17 The patient should wear a Holter monitor for 24 hours to screen for cardiac involvement, and echocardiography should be performed to define cardiac abnormalities.19
Giant-cell myocarditis (GCM) is a rare, rapidly progressive, and frequently fatal myocardial disease. Based on endomyocardial or surgical biopsy, GCM is histologically defined by multinucleated giant cells, a lymphocytic inflammatory infiltrate, and myocyte necrosis. It is often found in association with various immune-related systemic disorders.20 Patients present with heart failure, ventricular arrhythmias, and atrioventricular block that fails to improve with standard therapy.21
Treatment and Management
The typical management of acute myocarditis includes supportive care for left ventricular dysfunction and arrhythmia control.22 Many of the standard heart failure therapies—β-blockers, ACE inhibitors, angiotensin receptor blockers, and aldosterone antagonists—are efficacious; several, at least in animal models, appear to exert anti-inflammatory as well as the standard cardiovascular effects.23
Caution is advised regarding the selection of specific therapies. For example, in one study, metoprolol produced deleterious effects in acute murine Coxsackie virus myocarditis; inflammation, necrosis, and mortality significantly increased in the treatment group, compared with the placebo group.23
Information on the effects of particular therapies for specific etiologies of myocarditis are limited, but some evidence supports immunosuppressive and immune-modulating therapies for chronic, virus-negative inflammatory cardiomyopathy. Immunosuppressive therapy is also beneficial for acute GCM and sarcoidosis.23 For patients with myocarditis associated with celiac disease, a gluten-free diet alone or in combination with immunosuppressive agents can significantly improve clinical outcomes.12
OUTCOME FOR THE CASE PATIENT
Because the patient was already taking a statin and an ACE inhibitor for hypercholesterolemia and hypertension, respectively, as well as one baby aspirin per day, only a β-blocker was added to his discharge medication regimen.
Three months after hospital discharge, the patient underwent repeat CMR imaging. The ejection fraction had markedly improved to the 55%-to-60% range, although extensive midmyocardial-to-epicardial scarring in a multifocal pattern, primarily involving the basilar anterior and anterolateral wall, was still present, as was a small focus of an active (albeit healing) process in the inferior wall. Clinically, the patient was doing reasonably well and was vigorously exercising daily without dizziness, syncope, chest discomfort, or shortness of breath.
However, within several weeks of discharge, the patient reported having one two-hour episode of frequent palpitations at rest. Since that episode, palpitations have occurred infrequently. A 48-hour Holter monitor was ordered to better evaluate the palpitations and showed only rare premature ventricular contractions and isolated premature atrial contractions; no complex ectopy was noted. A follow-up stress echocardiogram was scheduled for 12 months, assuming the patient was free of clinical signs and symptoms of heart failure and arrhythmias at that time.
CONCLUSION
Myocarditis can manifest with a broad spectrum of signs and symptoms that may make its identification difficult, especially if a cardiac source is not initially considered in the differential diagnosis. However, for patients who present with elevated biomarkers and normal coronary artery anatomy, the identification of myocarditis is relatively easy; the difficulty in this circumstance relates to the identification of the specific etiology of the myocarditis.
The long-term prognosis for myocarditis is frequently good and the treatment straightforward, using medications that are modeled after standard heart failure therapy. However, depending on the etiology, specific treatment may be advisable—or required—in order to improve outcomes.
References
1. Fabre A, Sheppard MN. Sudden adult death syndrome and other nonischaemic causes of sudden cardiac death: a UK experience. Heart. 2006;92:316-320.
2. Doolan A, Semsarian C, Langlois N. Causes of sudden cardiac death in young Australians. Med J Aust. 2004;180:110-112.
3. Felker GM, Hu W, Hare JM, Hruban RH, et al. The spectrum of dilated cardiomyopathy: the Johns Hopkins experience with 1,278 patients. Medicine (Baltimore). 1999;78:270-283.
4. Leitman M, Tyomkin V, Peleg E, et al. Left ventricular function in acute inflammatory peri-myocardial diseases—new insights and long-term follow-up. Cardiovasc Ultrasound. 2012;10:42.
5. Blauwet LA, Cooper LT. Myocarditis. Prog Cardiovasc Dis. 2010;52:274-288.
6. Testani JM, Kolansky DM, Litt H, Gerstenfeld EP. Focal myocarditis mimicking acute ST-elevation myocardial infarction: diagnosis using cardiac magnetic resonance imaging. Tex Heart Inst J. 2006;33:256-259.
7. Friedrich MG, Sechtem U, Schulz-Menger J, et al. Cardiovascular magnetic resonance in myocarditis: a JACC white paper. J Am Coll Cardiol. 2009;53: 1475-1487.
8. Olimulder MA, van Es J, Galjee MA. The importance of cardiac MRI as a diagnostic tool in viral myocarditis-induced cardiomyopathy. Neth Heart J. 2009;17:481-486.
9. Mavrogeni S, Bratis K, Markussis V, et al. The diagnostic role of cardiac magnetic resonance imaging in detecting myocardial inflammation in systemic lupus erythematosus. Differentiation from viral myocarditis. Lupus. 2013;22:34-43.
10. Schultz JC, Hilliard AA, Cooper LT, Rihal CS. Diagnosis and treatment of viral myocarditis. Mayo Clin Proc. 2009;84:1001-1009.
11. Schuppan D, Dieterich W. Pathogenesis, epidemiology, and clinical manifestations of celiac disease in adults (2013). www.uptodate.com/contents/pathogenesis-epidemiology-and-clinical-manifestations-of-celiac-disease-in-adults. Accessed November 14, 2013.
12. Frustaci A, Cuoco L, Chimenti C, et al. Celiac disease associated with autoimmune myocarditis. Circulation. 2002;105:2611-2618.
13. Thakar S, Chandra P, Hollander G, Lichstein E. Electrocardiographic changes in Takotsubo cardiomyopathy. Pacing Clin Electrophysiol. 2011;34:
1278-1282.
14. Fefer P, Chelvanathan A, Dick A, et al. Takotsubo cardiomyopathy and left ventricular outflow tract obstruction. J Interv Cardiol. 2009;22:444-452.
15. Stensaeth KH, Fossum E, Hoffmann P, et al. Takotsubo cardiomyopathy in acute coronary syndrome; clinical features and contribution of cardiac magnetic resonance during the acute and convalescent phase. Scand Cardiovasc J. 2011;45:77-85.
16. Omerovic E. How to think about stress-induced cardiomyopathy?—Think “out of the box”! Scand Cardiovasc J. 2011;45:67-71.
17. McKenna WJ. Cardiac sarcoidosis (2013). www.uptodate.com/contents/cardiac-sarcoidosis. Accessed November 14, 2013.
18. King TE Jr. Clinical manifestations and diagnosis of sarcoidosis (2013). www.uptodate.com/contents/clinical-manifestations-and-diagnosis-of-sarcoidosis. Accessed November 14, 2013.
19. Bussinguer M, Danielian A, Sharma O. Cardiac sarcoidosis: diagnosis and management. Curr Treat Options Cardiovasc Med. 2012;14:652-664.
20. Cooper LT Jr, Berry GJ, Shabetai R; Multicenter Giant Cell Myocarditis Study Group Investigators. Idiopathic giant-cell myocarditis—natural history and treatment. N Engl J Med. 1997;336(26):1860-1866.
21. Kandolin R, Lehtonen J, Salmenkivi K, et al. Diagnosis, treatment, and outcome of giant-cell myocarditis in the era of combined immunosuppression. Circ Heart Fail. 2013;6:15-22.
22. Htwe TH, Khardori NM. Cardiac emergencies: infective endocarditis, pericarditis, and myocarditis. Med Clin North Am. 2012;96:1149-1169.
23. Kindermann I, Barth C, Mahfoud F, et al. Update on myocarditis. J Am Coll Cardiol. 2012;59:779-792.
A 55-year-old white man with controlled hypertension and hypercholesterolemia awoke with mild chest discomfort that he believed was mild gastroesophageal reflux. He denied radiation of pain to the shoulders, arms, back, or neck; dyspnea; palpitations; diaphoresis; nausea/vomiting; cough; or fever, during the first 30 hours of discomfort. There was no change in discomfort with deep breath, palpation of the chest, or administration of antacids. Minimal, short-lived improvement was noted with belching.
The patient had no trouble sleeping in the prone position and did not notice an increase in discomfort or unusual difficulty during his daily vigorous 30-minute aerobic workout. In fact, his symptoms seemed to improve or disappear during exercise. The patient denied any recent illness or exposure to sick people, had not traveled outside the United States, and had not been exposed to radiation of the chest wall. At the end of the second day of discomfort, the patient noted irregular palpitations with mild shortness of breath and was transported to the hospital for evaluation. He denied being a cigarette smoker or illicit drug user.
The patient had no history of MI or diabetes. The patient’s father had an MI in his 80s, and two uncles died suddenly in their 50s of “massive heart attacks.” His mother, who had died of sepsis of uncertain etiology approximately 10 days earlier, also had hypertension and hypercholesterolemia but no history of coronary artery disease (CAD). Both of the patient’s adult daughters had been diagnosed with celiac disease in the preceding three years. His elder daughter had also been diagnosed with type 1 diabetes within the past two years.
On examination, the patient was afebrile, with a blood pressure of 143/87 mm Hg; pulse, 53 beats/min; and respiratory rate, 17 breaths/min. The patient’s weight was 204 lb and his height, 75 in (BMI, 25.5). The patient was in no apparent distress. Head, eyes, ears, nose, and throat were unremarkable. There was no significant jugular venous distention. The carotid pulses were full, and no bruits were appreciated. S1 and S2 sounds were within normal limits. No murmurs or S3 or S4 gallops were appreciated. The chest was clear on auscultation. Results of the abdominal exam were negative, no edema was noted in the extremities, and pulses were symmetrical.
ECG demonstrated subtle ST-segment elevation in leads I and aVL with a prominent R wave in lead V1. This pattern was interpreted as consistent with an acute inferolateral MI. A baseline ECG, previously obtained by the patient’s internist, had been interpreted as normal.
Peak troponin level was 55 ng/mL (normal, < 0.03 ng/mL); total creatine kinase (CK), 807 U/L (reference range, 20 to 259 U/L); and mass CK-MB fraction, 44 ng/mL (0.1 to 6.6 ng/mL). Total cholesterol was 105 mg/dL, with both LDL- and HDL-cholesterol fractions at 46 mg/dL. A complete blood count without differential revealed a total white blood cell count of 53,000/µL. Hemoglobin and hematocrit were both low (12.3 g/dL and 34.5%, respectively). All indices were within normal limits, as was the platelet count. Glucose, blood urea nitrogen, creatinine, potassium chloride bicarbonate, and calcium were all within normal limits. The sodium level was slightly low (132 mEq/L). Emergency catheterization revealed an ejection fraction of 45% (reference range, 55% to 70%), with mild-to-moderate diffuse hypokinesis but normal coronary arteries.
The patient was diagnosed with myocarditis, likely of viral origin.
DISCUSSION
Although the incidence of myocarditis in the US is difficult to assess, autopsy reports implicate it in 8.6% to 12% of cases of sudden cardiac death in young adults,1,2 and a large prospective series implicated myocarditis in 9% of cases of dilated cardiomyopathy.3 Myocarditis is considered to be at one extreme of a spectrum of perimyocardial processes that result in inflammation of the myocardium (see figure), pericardium, or both.4
The underlying pathology involves an acute injury to the myocyte. This activates the innate and humoral immune systems, resulting in severe inflammation. The immune reaction eventually subsides, and the myocardium recovers. In certain patients, however, myocardial inflammation persists, resulting in ongoing myocyte damage, relentless symptomatic heart failure, or even death.5
Although a variety of diagnostic criteria have been developed and employed, the diagnosis of myocarditis is often one of exclusion. First proposed in 1986, the Dallas criteria—a histopathologic classification for myocarditis diagnosis—are based on endomyocardial biopsy, with inflammatory cellular infiltrate (with or without associated myocyte necrosis) visible on conventionally stained myocardial tissue sections.5 However, this method poses significant practical limitations, including low sensitivity (43% to 64%) and complication and death rates of 6% and 0.4%, respectively.5,6
An empiric diagnosis of myocarditis is often based on a combination of clinical findings including altered ECG, increase in myocardial enzymes, and lack of significant CAD.6 The recommended diagnostic cardiac magnetic resonance (CMR) imaging criteria for clinically suspected myocardial inflammation (ie, the Lake Louise Criteria) include at least two of the following:7
• Regional or global myocardial signal intensity increase in T2-weighted images.
• Increased global myocardial early gadolinium enhancement ratio between myocardium and skeletal muscle in gadolinium-enhanced T1-weighted images.
• At least one focal lesion with nonischemic regional distribution in inversion recovery–prepared gadolinium-enhanced T1-weighted images (“late gadolinium enhancement”).
Because of its reported high sensitivity and specificity (100% and 90%, respectively), CMR was used in the case patient to confirm the diagnosis of myocarditis.8 Specifically, CMR with contrast demonstrated normal left ventricular cavity size and mild reduction in overall left ventricular systolic function, with a visually estimated left ventricular ejection fraction of 45% to 50%. Regional hypokinesis of the mid-inferior wall and apical inferior septum was noted. Delayed contrast imaging demonstrated extensive non-CAD scarring and fibrosis, involving the basal anterior wall, basal inferior wall, and basal and midlateral wall in a pattern consistent with acute myocarditis.
Just as there is variability in the specific criteria by which the diagnosis of myocarditis can be made, the array of clinical findings with which it can manifest range from fatigue and other nonspecific symptoms to fulminant congestive heart failure and sudden death.6 Often, but not always, a viral prodrome precedes the onset of “cardiac symptoms” (eg, chest pain, dyspnea, palpitations, or syncope).5 This patient’s multiple risk factors for CAD and a suggestive, albeit atypical, history of chest discomfort, palpitations, and shortness of breath helped to focus the clinicians’ evaluation on the heart.
Potential Causes
Once a diagnosis of myocarditis is rendered, the next challenge is distinguishing its specific source from a plethora of potential etiologies, including infection, toxic exposure, or hypersensitivity/autoimmune reaction. Viral infections (mostly herpes, parvovirus, and cytomegalovirus) are thought to cause most cases of myocarditis in developed countries.5,9
Viral myocarditis results when viruses enter cardiac myocytes and incite a cytotoxic effect with activation of the immune response, including expression of interferon , natural killer cells, and release of nitric oxide. The majority of patients recover, but some develop an adaptive immune response, which further causes cardiac damage. In this response, antibodies to viral and to some cardiac proteins are produced, and effector T lymphocytes proliferate. Viral genome or inflammatory mechanisms may persist, contributing to ventricular dysfunction leading to heart failure and arrhythmias.10
Celiac disease is a chronic gastroenterologic disease caused by an immune response to a gluten protein. Damage to the brush border of the small intestine results in an inability to absorb fat, protein, vitamins, and minerals. Intermittent diarrhea, abdominal pain, and bloating are most commonly reported, but celiac disease may also manifest less obviously with iron deficiency anemia, joint pain, muscle cramps, osteoporosis, and neuropathy.11 Iron deficiency anemia that is refractory to iron replacement may offer insight into diagnosing myocarditis due to celiac disease.12 Although studies have found that more than 4% of patients with myocarditis also had celiac disease, none had the classic GI symptoms of celiac disease.12
Takotsubo cardiomyopathy is a transient left ventricular apical ballooning syndrome of unknown etiology. (For more information, see Fasolino T. Takotsubo cardiomyopathy: a clinical overview). Patients who have experienced emotional or physiologic stress and postmenopausal women appear to be at greatest risk. The clinical symptoms mimic MI, including chest pain with ST-segment elevation in the precordial leads on ECG13 and minor elevation of the cardiac enzyme and biomarker levels.14 However, patients experiencing this stress cardiomyopathy lack evidence of atherosclerotic CAD.15 An echocardiogram or CMR imaging reveals characteristic wall motion hypokinesis, akinesis, or dyskinesis of the left ventricular apex and mid-ventricle that help to differentiate it from other forms of myocarditis.15,16 Patient prognosis is favorable, with 95% of patients experiencing a full recovery; left ventricular dysfunction usually begins to improve in a few weeks.13,14
Sarcoidosis is a systemic disease resulting in noncaseating granulomas in multiple organs.17 Initial presentation typically includes bilateral hilar adenopathy, pulmonary reticular opacities, and/or skin, joint, or eye lesions.18 Patients with cardiac sarcoidosis most commonly present with conduction disturbances and ventricular arrhythmias.17 Although frequently absent, clinical symptoms may include palpitations, syncope, dizziness, or chest pain and clinical heart failure.17,18 It is difficult to distinguish cardiac sarcoidosis from other forms of myocarditis unless signs of systemic sarcoidosis are evident. A patient with suspected cardiac sarcoidosis should have an ECG to detect subclinical conduction abnormalities.17 The patient should wear a Holter monitor for 24 hours to screen for cardiac involvement, and echocardiography should be performed to define cardiac abnormalities.19
Giant-cell myocarditis (GCM) is a rare, rapidly progressive, and frequently fatal myocardial disease. Based on endomyocardial or surgical biopsy, GCM is histologically defined by multinucleated giant cells, a lymphocytic inflammatory infiltrate, and myocyte necrosis. It is often found in association with various immune-related systemic disorders.20 Patients present with heart failure, ventricular arrhythmias, and atrioventricular block that fails to improve with standard therapy.21
Treatment and Management
The typical management of acute myocarditis includes supportive care for left ventricular dysfunction and arrhythmia control.22 Many of the standard heart failure therapies—β-blockers, ACE inhibitors, angiotensin receptor blockers, and aldosterone antagonists—are efficacious; several, at least in animal models, appear to exert anti-inflammatory as well as the standard cardiovascular effects.23
Caution is advised regarding the selection of specific therapies. For example, in one study, metoprolol produced deleterious effects in acute murine Coxsackie virus myocarditis; inflammation, necrosis, and mortality significantly increased in the treatment group, compared with the placebo group.23
Information on the effects of particular therapies for specific etiologies of myocarditis are limited, but some evidence supports immunosuppressive and immune-modulating therapies for chronic, virus-negative inflammatory cardiomyopathy. Immunosuppressive therapy is also beneficial for acute GCM and sarcoidosis.23 For patients with myocarditis associated with celiac disease, a gluten-free diet alone or in combination with immunosuppressive agents can significantly improve clinical outcomes.12
OUTCOME FOR THE CASE PATIENT
Because the patient was already taking a statin and an ACE inhibitor for hypercholesterolemia and hypertension, respectively, as well as one baby aspirin per day, only a β-blocker was added to his discharge medication regimen.
Three months after hospital discharge, the patient underwent repeat CMR imaging. The ejection fraction had markedly improved to the 55%-to-60% range, although extensive midmyocardial-to-epicardial scarring in a multifocal pattern, primarily involving the basilar anterior and anterolateral wall, was still present, as was a small focus of an active (albeit healing) process in the inferior wall. Clinically, the patient was doing reasonably well and was vigorously exercising daily without dizziness, syncope, chest discomfort, or shortness of breath.
However, within several weeks of discharge, the patient reported having one two-hour episode of frequent palpitations at rest. Since that episode, palpitations have occurred infrequently. A 48-hour Holter monitor was ordered to better evaluate the palpitations and showed only rare premature ventricular contractions and isolated premature atrial contractions; no complex ectopy was noted. A follow-up stress echocardiogram was scheduled for 12 months, assuming the patient was free of clinical signs and symptoms of heart failure and arrhythmias at that time.
CONCLUSION
Myocarditis can manifest with a broad spectrum of signs and symptoms that may make its identification difficult, especially if a cardiac source is not initially considered in the differential diagnosis. However, for patients who present with elevated biomarkers and normal coronary artery anatomy, the identification of myocarditis is relatively easy; the difficulty in this circumstance relates to the identification of the specific etiology of the myocarditis.
The long-term prognosis for myocarditis is frequently good and the treatment straightforward, using medications that are modeled after standard heart failure therapy. However, depending on the etiology, specific treatment may be advisable—or required—in order to improve outcomes.
References
1. Fabre A, Sheppard MN. Sudden adult death syndrome and other nonischaemic causes of sudden cardiac death: a UK experience. Heart. 2006;92:316-320.
2. Doolan A, Semsarian C, Langlois N. Causes of sudden cardiac death in young Australians. Med J Aust. 2004;180:110-112.
3. Felker GM, Hu W, Hare JM, Hruban RH, et al. The spectrum of dilated cardiomyopathy: the Johns Hopkins experience with 1,278 patients. Medicine (Baltimore). 1999;78:270-283.
4. Leitman M, Tyomkin V, Peleg E, et al. Left ventricular function in acute inflammatory peri-myocardial diseases—new insights and long-term follow-up. Cardiovasc Ultrasound. 2012;10:42.
5. Blauwet LA, Cooper LT. Myocarditis. Prog Cardiovasc Dis. 2010;52:274-288.
6. Testani JM, Kolansky DM, Litt H, Gerstenfeld EP. Focal myocarditis mimicking acute ST-elevation myocardial infarction: diagnosis using cardiac magnetic resonance imaging. Tex Heart Inst J. 2006;33:256-259.
7. Friedrich MG, Sechtem U, Schulz-Menger J, et al. Cardiovascular magnetic resonance in myocarditis: a JACC white paper. J Am Coll Cardiol. 2009;53: 1475-1487.
8. Olimulder MA, van Es J, Galjee MA. The importance of cardiac MRI as a diagnostic tool in viral myocarditis-induced cardiomyopathy. Neth Heart J. 2009;17:481-486.
9. Mavrogeni S, Bratis K, Markussis V, et al. The diagnostic role of cardiac magnetic resonance imaging in detecting myocardial inflammation in systemic lupus erythematosus. Differentiation from viral myocarditis. Lupus. 2013;22:34-43.
10. Schultz JC, Hilliard AA, Cooper LT, Rihal CS. Diagnosis and treatment of viral myocarditis. Mayo Clin Proc. 2009;84:1001-1009.
11. Schuppan D, Dieterich W. Pathogenesis, epidemiology, and clinical manifestations of celiac disease in adults (2013). www.uptodate.com/contents/pathogenesis-epidemiology-and-clinical-manifestations-of-celiac-disease-in-adults. Accessed November 14, 2013.
12. Frustaci A, Cuoco L, Chimenti C, et al. Celiac disease associated with autoimmune myocarditis. Circulation. 2002;105:2611-2618.
13. Thakar S, Chandra P, Hollander G, Lichstein E. Electrocardiographic changes in Takotsubo cardiomyopathy. Pacing Clin Electrophysiol. 2011;34:
1278-1282.
14. Fefer P, Chelvanathan A, Dick A, et al. Takotsubo cardiomyopathy and left ventricular outflow tract obstruction. J Interv Cardiol. 2009;22:444-452.
15. Stensaeth KH, Fossum E, Hoffmann P, et al. Takotsubo cardiomyopathy in acute coronary syndrome; clinical features and contribution of cardiac magnetic resonance during the acute and convalescent phase. Scand Cardiovasc J. 2011;45:77-85.
16. Omerovic E. How to think about stress-induced cardiomyopathy?—Think “out of the box”! Scand Cardiovasc J. 2011;45:67-71.
17. McKenna WJ. Cardiac sarcoidosis (2013). www.uptodate.com/contents/cardiac-sarcoidosis. Accessed November 14, 2013.
18. King TE Jr. Clinical manifestations and diagnosis of sarcoidosis (2013). www.uptodate.com/contents/clinical-manifestations-and-diagnosis-of-sarcoidosis. Accessed November 14, 2013.
19. Bussinguer M, Danielian A, Sharma O. Cardiac sarcoidosis: diagnosis and management. Curr Treat Options Cardiovasc Med. 2012;14:652-664.
20. Cooper LT Jr, Berry GJ, Shabetai R; Multicenter Giant Cell Myocarditis Study Group Investigators. Idiopathic giant-cell myocarditis—natural history and treatment. N Engl J Med. 1997;336(26):1860-1866.
21. Kandolin R, Lehtonen J, Salmenkivi K, et al. Diagnosis, treatment, and outcome of giant-cell myocarditis in the era of combined immunosuppression. Circ Heart Fail. 2013;6:15-22.
22. Htwe TH, Khardori NM. Cardiac emergencies: infective endocarditis, pericarditis, and myocarditis. Med Clin North Am. 2012;96:1149-1169.
23. Kindermann I, Barth C, Mahfoud F, et al. Update on myocarditis. J Am Coll Cardiol. 2012;59:779-792.
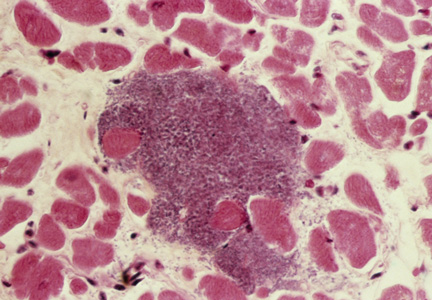
Best age to begin screening mammograms: How I manage my patients
Controversy has surrounded the utility of screening mammograms, particularly in women in their 40s. In 2009, the US Preventive Services Task Force recommended that screening mammography begin at age 50 and that women aged 50 to 74 receive a mammogram every 2 years.1 However, the American Cancer Society2 and other professional groups continue to recommend that annual screening begin at age 40, leading to controversy and confusion among women’s health clinicians and our patients.
In a recent study, Webb and colleagues3 used registry data based on a health plan in a single US city to assess the cause of death and mammogram history of 1,705 women who died following a diagnosis of invasive breast cancer from 1990 to 1999. They confirmed that 609 of these deaths were from breast cancer. How many of these patients were screened?
What did they find?
The investigators found that 29% of the 609 women who died from breast cancer had been screened for it—19% of the cancers that caused death were screen-detected and 10% were interval cancers. (Interval cancers were defined as symptomatic or palpable tumors that presented less than 2 years after the prior screening mammogram.) That means that 71% of 609 deaths from breast cancer were among unscreened women, with 6% of the fatal cancers diagnosed more than 2 years after the last mammogram and 65% never found upon screening because screening did not occur.
Among deaths caused (n = 609) and not caused (n = 905) by breast cancer, the median age at diagnosis was 49 and 72 years, respectively. Investigators concluded that regular screening of women younger than age 50 years would lower the death rate from breast cancer.
Related Article: Biennial vs annual mammography: How I manage my patients Andrew M. Kaunitz, MD (June 2013)
Let’s not jump to any conclusions
Although some may find the report by Webb and colleagues persuasive, I am concerned about this study’s limitations, of which there are a few. First, analyses that focus on women diagnosed with breast cancers do not allow comparison of outcomes among screened and unscreened populations.
Moreover, this report provides no information on treatment received by screened and unscreened women. It is likely that women who have never been screened, or who have been screened only infrequently, are considerably less affluent and less educated than women who are regularly screened. Accordingly, upon noting a palpable breast mass, unscreened women may be less likely to seek timely medical attention than regularly screened women, leading to differences in breast cancer outcomes, which are independent of screening history.
How I counsel my patients
For now, I will continue to be laissez-fare in my recommendations about screening mammograms for average-risk women in their 40s by supporting their individual preferences about when to initiate such screening.
- Screening for breast cancer, Topic Page. US Preventive Services Task Force. http://www.uspreventiveservicestaskforce.org/uspstf/uspsbrca.htm. Updated July 2010. Accessed October 28, 2013.
- American Cancer Society Guidelines for the Early Detection of Cancer: Breast cancer. American Cancer Society Web site. http://www.cancer.org/healthy/findcancerearly/cancerscreeningguidelines/american-cancer-society-guidelines-for-the-early-detection-of-cancer. Updated May 3, 2013. Accessed October 28, 2013.
- Webb ML, Cady B, Michaelson JS, et al. A failure analysis of invasive breast cancer: Most deaths from disease occur in women not regularly screened [published online ahead of print September 9, 2013]. Cancer. doi:10.1002/cncr.28199.

Andrew M. Kaunitz, MD
Dr. Kaunitz is Professor and Associate Chairman, Department of Obstetrics and Gynecology, University of Florida College of Medicine-Jacksonville. He serves on the OBG Management Board of Editors.
The author reports no financial relationships relevant to this article.
Andrew M. Kaunitz, MD
Dr. Kaunitz is Professor and Associate Chairman, Department of Obstetrics and Gynecology, University of Florida College of Medicine-Jacksonville. He serves on the OBG Management Board of Editors.
The author reports no financial relationships relevant to this article.
Andrew M. Kaunitz, MD
Dr. Kaunitz is Professor and Associate Chairman, Department of Obstetrics and Gynecology, University of Florida College of Medicine-Jacksonville. He serves on the OBG Management Board of Editors.
The author reports no financial relationships relevant to this article.
Controversy has surrounded the utility of screening mammograms, particularly in women in their 40s. In 2009, the US Preventive Services Task Force recommended that screening mammography begin at age 50 and that women aged 50 to 74 receive a mammogram every 2 years.1 However, the American Cancer Society2 and other professional groups continue to recommend that annual screening begin at age 40, leading to controversy and confusion among women’s health clinicians and our patients.
In a recent study, Webb and colleagues3 used registry data based on a health plan in a single US city to assess the cause of death and mammogram history of 1,705 women who died following a diagnosis of invasive breast cancer from 1990 to 1999. They confirmed that 609 of these deaths were from breast cancer. How many of these patients were screened?
What did they find?
The investigators found that 29% of the 609 women who died from breast cancer had been screened for it—19% of the cancers that caused death were screen-detected and 10% were interval cancers. (Interval cancers were defined as symptomatic or palpable tumors that presented less than 2 years after the prior screening mammogram.) That means that 71% of 609 deaths from breast cancer were among unscreened women, with 6% of the fatal cancers diagnosed more than 2 years after the last mammogram and 65% never found upon screening because screening did not occur.
Among deaths caused (n = 609) and not caused (n = 905) by breast cancer, the median age at diagnosis was 49 and 72 years, respectively. Investigators concluded that regular screening of women younger than age 50 years would lower the death rate from breast cancer.
Related Article: Biennial vs annual mammography: How I manage my patients Andrew M. Kaunitz, MD (June 2013)
Let’s not jump to any conclusions
Although some may find the report by Webb and colleagues persuasive, I am concerned about this study’s limitations, of which there are a few. First, analyses that focus on women diagnosed with breast cancers do not allow comparison of outcomes among screened and unscreened populations.
Moreover, this report provides no information on treatment received by screened and unscreened women. It is likely that women who have never been screened, or who have been screened only infrequently, are considerably less affluent and less educated than women who are regularly screened. Accordingly, upon noting a palpable breast mass, unscreened women may be less likely to seek timely medical attention than regularly screened women, leading to differences in breast cancer outcomes, which are independent of screening history.
How I counsel my patients
For now, I will continue to be laissez-fare in my recommendations about screening mammograms for average-risk women in their 40s by supporting their individual preferences about when to initiate such screening.
- Screening for breast cancer, Topic Page. US Preventive Services Task Force. http://www.uspreventiveservicestaskforce.org/uspstf/uspsbrca.htm. Updated July 2010. Accessed October 28, 2013.
- American Cancer Society Guidelines for the Early Detection of Cancer: Breast cancer. American Cancer Society Web site. http://www.cancer.org/healthy/findcancerearly/cancerscreeningguidelines/american-cancer-society-guidelines-for-the-early-detection-of-cancer. Updated May 3, 2013. Accessed October 28, 2013.
- Webb ML, Cady B, Michaelson JS, et al. A failure analysis of invasive breast cancer: Most deaths from disease occur in women not regularly screened [published online ahead of print September 9, 2013]. Cancer. doi:10.1002/cncr.28199.
Hereditary Hemochromatosis as a Cause of Hypogonadism
JR, a 34-year-old Caucasian man, was in his normal state of good health until several months ago, when he developed fatigue, low libido, and insomnia. He reports normal erectile function, adding that he fathered a child at age 24. His medical history and remaining review of systems are negative. Physical exam is unremarkable. His BMI is 23.
Labwork reveals low free and total testosterone levels with low FSH and LH levels. Thyroid-stimulating hormone, free T4, and prolactin levels are within normal range, comprehensive metabolic panel is unremarkable, and pituitary MRI is negative. The complete blood count reveals slightly elevated hemoglobin and hematocrit, prompting ordering of iron studies that reveal elevated ferritin and serum iron levels and elevated percent transferrin saturation. Lab values are shown in the table.
Based on his elevated ferritin and transferrin saturation levels, JR undergoes genetic testing for hereditary hemochromatosis (HH) with C282Y and H63D mutation analysis. He is found to have the homozygous C282Y genotype (C282Y/C282Y) for HH.
JR establishes care with a hematologist and is advised to receive therapeutic phlebotomy until his ferritin level is between 10 and 50 ng/mL. An abdominal ultrasound, ordered to screen for hepatomegaly, yields normal results. JR elects not to receive testosterone replacement therapy.
Three months later, labwork reveals a free testosterone level of 120 pg/mL with normal hemoglobin and hematocrit levels, normal transaminases, a ferritin level of 28 ng/mL, and a percent transferrin saturation of 31%. Additional values are shown in the table.
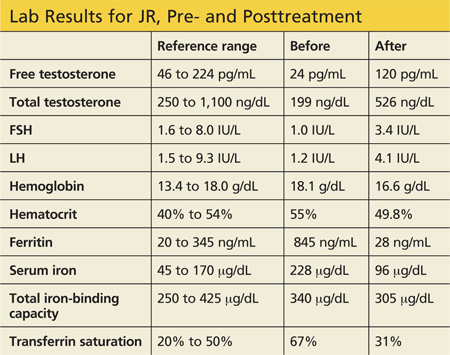
BACKGROUND AND GENETICS
Hereditary hemochromatosis is an autosomal recessive iron storage disorder in which intestinal iron absorption is markedly increased. This results in iron overload and excessive iron deposition in numerous tissues, glands, and organs.1
In patients with HH, a genetic defect causes abnormal expression of the HFE protein that regulates hepcidin production. Hepcidin is an iron regulatory hormone, secreted by hepatocytes, that decreases intestinal iron absorption in response to excess iron.2 Ninety percent of individuals affected by HH are homozygous for mutation at amino acid position 282 on the HFE gene, which causes an inappropriate decrease in hepcidin expression in response to elevated iron levels.2,3 Only 10% of individuals homozygous for the C282Y mutation actually develop clinically apparent end-organ damage.2
Being a carrier (heterozygous) for the C282Y mutation confers significantly lower risk for iron overload. The second most common mutation in the HFE gene, H63D, is associated with a milder phenotype. Those with compound heterozygosity for C282Y/H63D or homozygosity for H63D typically experience either mild or no detectable symptoms.1,3
There can be mutations in other genes involved in iron metabolism, but these represent more rare forms of hemochromatosis. Conditions such as thalassemia, sideroblastic anemia, porphyria cutanea tarda, and chronic liver disease may also be associated with iron overload.1,3
HH is most common in white populations of northern European descent. Multiple factors—including dietary iron intake, alcohol consumption, blood donation, blood loss associated with menstruation, and pregnancy—affect the expression of clinical features of hemochromatosis. Men are 24 times more likely than women to express clinical features of hemochromatosis.2 Approximately 70% of affected patients develop symptoms between ages 40 and 60.1
CLINICAL MANIFESTATIONS
The liver is typically the first organ affected, and hepatomegaly is present in 95% of symptomatic patients, even in the presence of normal transaminase levels.1 A bronzed, metallic, or slate gray skin coloration can occur due to increased iron deposition in the dermis. Arthralgias in the hands, wrists, hips, knees, and ankles are present in up to 50% of patients with hemochromatosis. Cardiac manifestations include restrictive cardiomyopathy, congestive heart failure, and arrhythmias.1
Iron deposition in the beta cells of the pancreas causes diabetes1 and in the pituitary causes hypogonadotropic hypogonadism in both men and women, resulting in decreased libido, amenorrhea, testicular atrophy, gynecomastia, and reduced body hair. Primary testicular dysfunction may occur due to iron deposition in the testicles.1,4 In the thyroid gland, iron deposition can lead to abnormal function. Secondary hypothyroidism is rare in the setting of iron overload, although iron deposition occasionally occurs in pituitary thyrotrophs (usually only to a mild degree). Adrenal insufficiency and hypoparathyroidism may also result from iron overload.5
CLINICAL STUDIES TO ASSESS IRON STORES
When assessing tissue iron stores, it is important to measure the serum iron level, total iron-binding capacity, and ferritin in the fasting state.2 This information can be used to calculate the percent transferrin saturation. If the serum ferritin is elevated (> 300 ng/mL in men and > 200 ng/mL in women) and/or the transferrin saturation is greater than 45%, referral to hematology or hepatology is recommended, along with genetic testing for hemochromatosis.1,2
Once the diagnosis of hemochromatosis has been confirmed, CT or MRI can be used to assess for increased density of the liver.1 Liver biopsy can determine the degree of fibrosis and is often considered in patients with more extreme elevations of serum ferritin levels and/or hepatomegaly. Liver biopsy is the only reliable method for determining whether hepatic cirrhosis, which increases risk for hepatocellular carcinoma, is present.1
TREATMENT
All patients with homozygous HH and evidence of iron overload require treatment, regardless of symptoms. Phlebotomy is the standard of care, due to its low cost and relative safety. Chelating agents are a second-line option when contraindications to phlebotomy (eg, anemia) exist.1,2
Alcohol consumption, especially in the presence of iron overload or liver disease, should be avoided, as it can increase risk for cirrhosis by nearly tenfold.1 Dietary modification is typically unnecessary, aside from the avoidance of iron and vitamin C supplementation.2 Patients should also eliminate raw shellfish from their diet, as they may carry bacteria that can cause potentially fatal infection (since high iron levels impair hepcidin bactericidal activity).2
The management of hepatic failure, cardiac failure, and diabetes in patients with HH is similar to conventional management of these conditions.1 With phlebotomy, the liver and spleen often decrease in size, liver function improves, skin pigmentation lightens, cardiac failure may be reversed, and diabetes control often improves.1,2 Testosterone levels may normalize after phlebotomy, especially if HH is diagnosed in the early stages. In more advanced cases, testosterone replacement therapy in combination with aggressive phlebotomy may be necessary.4
CONCLUSION
A high index of suspicion is required to diagnose hemochromatosis early. HH should be considered in the differential diagnosis for patients with hypogonadotropic hypogonadism, abnormal iron studies, elevated transaminase levels, and a family history of hemochromatosis.
Once the diagnosis is established, all first-degree relatives should be screened.1 Early therapy is crucial to prevent complications from iron overload.
REFERENCES
1. Powell LW. Hemochromatosis. In: Fauci AS, Braunwald E, Kasper DL, et al (eds). Harrison’s Principles of Internal Medicine. 17th ed. New York, NY: McGraw-Hill; 2008:2429-2433.
2. Crownover BK, Carlton JC. Hereditary hemochromatosis. Am Fam Phys. 2013;87(3):183-190.
3. Camaschella C. Understanding iron homeostasis through genetic analysis of hemochromatosis and related disorders. Blood. 2005;106(12):3710-3717.
4. McDermott JH, Walsh CH. Hypogonadism in hereditary hemochromatosis. J Clin Endocrinol Metab. 2005;90(4):2451-2455.
5. Hudec M, Grigerova M, Walsh CH. Secondary hypothyroidism in hereditary hemochromatosis: recovery after iron depletion. Thyroid. 2008;18(2):255-257.
JR, a 34-year-old Caucasian man, was in his normal state of good health until several months ago, when he developed fatigue, low libido, and insomnia. He reports normal erectile function, adding that he fathered a child at age 24. His medical history and remaining review of systems are negative. Physical exam is unremarkable. His BMI is 23.
Labwork reveals low free and total testosterone levels with low FSH and LH levels. Thyroid-stimulating hormone, free T4, and prolactin levels are within normal range, comprehensive metabolic panel is unremarkable, and pituitary MRI is negative. The complete blood count reveals slightly elevated hemoglobin and hematocrit, prompting ordering of iron studies that reveal elevated ferritin and serum iron levels and elevated percent transferrin saturation. Lab values are shown in the table.
Based on his elevated ferritin and transferrin saturation levels, JR undergoes genetic testing for hereditary hemochromatosis (HH) with C282Y and H63D mutation analysis. He is found to have the homozygous C282Y genotype (C282Y/C282Y) for HH.
JR establishes care with a hematologist and is advised to receive therapeutic phlebotomy until his ferritin level is between 10 and 50 ng/mL. An abdominal ultrasound, ordered to screen for hepatomegaly, yields normal results. JR elects not to receive testosterone replacement therapy.
Three months later, labwork reveals a free testosterone level of 120 pg/mL with normal hemoglobin and hematocrit levels, normal transaminases, a ferritin level of 28 ng/mL, and a percent transferrin saturation of 31%. Additional values are shown in the table.
BACKGROUND AND GENETICS
Hereditary hemochromatosis is an autosomal recessive iron storage disorder in which intestinal iron absorption is markedly increased. This results in iron overload and excessive iron deposition in numerous tissues, glands, and organs.1
In patients with HH, a genetic defect causes abnormal expression of the HFE protein that regulates hepcidin production. Hepcidin is an iron regulatory hormone, secreted by hepatocytes, that decreases intestinal iron absorption in response to excess iron.2 Ninety percent of individuals affected by HH are homozygous for mutation at amino acid position 282 on the HFE gene, which causes an inappropriate decrease in hepcidin expression in response to elevated iron levels.2,3 Only 10% of individuals homozygous for the C282Y mutation actually develop clinically apparent end-organ damage.2
Being a carrier (heterozygous) for the C282Y mutation confers significantly lower risk for iron overload. The second most common mutation in the HFE gene, H63D, is associated with a milder phenotype. Those with compound heterozygosity for C282Y/H63D or homozygosity for H63D typically experience either mild or no detectable symptoms.1,3
There can be mutations in other genes involved in iron metabolism, but these represent more rare forms of hemochromatosis. Conditions such as thalassemia, sideroblastic anemia, porphyria cutanea tarda, and chronic liver disease may also be associated with iron overload.1,3
HH is most common in white populations of northern European descent. Multiple factors—including dietary iron intake, alcohol consumption, blood donation, blood loss associated with menstruation, and pregnancy—affect the expression of clinical features of hemochromatosis. Men are 24 times more likely than women to express clinical features of hemochromatosis.2 Approximately 70% of affected patients develop symptoms between ages 40 and 60.1
CLINICAL MANIFESTATIONS
The liver is typically the first organ affected, and hepatomegaly is present in 95% of symptomatic patients, even in the presence of normal transaminase levels.1 A bronzed, metallic, or slate gray skin coloration can occur due to increased iron deposition in the dermis. Arthralgias in the hands, wrists, hips, knees, and ankles are present in up to 50% of patients with hemochromatosis. Cardiac manifestations include restrictive cardiomyopathy, congestive heart failure, and arrhythmias.1
Iron deposition in the beta cells of the pancreas causes diabetes1 and in the pituitary causes hypogonadotropic hypogonadism in both men and women, resulting in decreased libido, amenorrhea, testicular atrophy, gynecomastia, and reduced body hair. Primary testicular dysfunction may occur due to iron deposition in the testicles.1,4 In the thyroid gland, iron deposition can lead to abnormal function. Secondary hypothyroidism is rare in the setting of iron overload, although iron deposition occasionally occurs in pituitary thyrotrophs (usually only to a mild degree). Adrenal insufficiency and hypoparathyroidism may also result from iron overload.5
CLINICAL STUDIES TO ASSESS IRON STORES
When assessing tissue iron stores, it is important to measure the serum iron level, total iron-binding capacity, and ferritin in the fasting state.2 This information can be used to calculate the percent transferrin saturation. If the serum ferritin is elevated (> 300 ng/mL in men and > 200 ng/mL in women) and/or the transferrin saturation is greater than 45%, referral to hematology or hepatology is recommended, along with genetic testing for hemochromatosis.1,2
Once the diagnosis of hemochromatosis has been confirmed, CT or MRI can be used to assess for increased density of the liver.1 Liver biopsy can determine the degree of fibrosis and is often considered in patients with more extreme elevations of serum ferritin levels and/or hepatomegaly. Liver biopsy is the only reliable method for determining whether hepatic cirrhosis, which increases risk for hepatocellular carcinoma, is present.1
TREATMENT
All patients with homozygous HH and evidence of iron overload require treatment, regardless of symptoms. Phlebotomy is the standard of care, due to its low cost and relative safety. Chelating agents are a second-line option when contraindications to phlebotomy (eg, anemia) exist.1,2
Alcohol consumption, especially in the presence of iron overload or liver disease, should be avoided, as it can increase risk for cirrhosis by nearly tenfold.1 Dietary modification is typically unnecessary, aside from the avoidance of iron and vitamin C supplementation.2 Patients should also eliminate raw shellfish from their diet, as they may carry bacteria that can cause potentially fatal infection (since high iron levels impair hepcidin bactericidal activity).2
The management of hepatic failure, cardiac failure, and diabetes in patients with HH is similar to conventional management of these conditions.1 With phlebotomy, the liver and spleen often decrease in size, liver function improves, skin pigmentation lightens, cardiac failure may be reversed, and diabetes control often improves.1,2 Testosterone levels may normalize after phlebotomy, especially if HH is diagnosed in the early stages. In more advanced cases, testosterone replacement therapy in combination with aggressive phlebotomy may be necessary.4
CONCLUSION
A high index of suspicion is required to diagnose hemochromatosis early. HH should be considered in the differential diagnosis for patients with hypogonadotropic hypogonadism, abnormal iron studies, elevated transaminase levels, and a family history of hemochromatosis.
Once the diagnosis is established, all first-degree relatives should be screened.1 Early therapy is crucial to prevent complications from iron overload.
REFERENCES
1. Powell LW. Hemochromatosis. In: Fauci AS, Braunwald E, Kasper DL, et al (eds). Harrison’s Principles of Internal Medicine. 17th ed. New York, NY: McGraw-Hill; 2008:2429-2433.
2. Crownover BK, Carlton JC. Hereditary hemochromatosis. Am Fam Phys. 2013;87(3):183-190.
3. Camaschella C. Understanding iron homeostasis through genetic analysis of hemochromatosis and related disorders. Blood. 2005;106(12):3710-3717.
4. McDermott JH, Walsh CH. Hypogonadism in hereditary hemochromatosis. J Clin Endocrinol Metab. 2005;90(4):2451-2455.
5. Hudec M, Grigerova M, Walsh CH. Secondary hypothyroidism in hereditary hemochromatosis: recovery after iron depletion. Thyroid. 2008;18(2):255-257.
Growing Lesion Impedes Finger Flexion
ANSWER
The correct answer is implantation cyst (choice “b”). This type of cyst is typically caused by trauma (eg, a puncture wound), and its contents are in stark contrast to those of ganglion cysts (choice “a”), which are thick and clear.
Warts (choice “c”) are essentially an epidermal process, not subcutaneous. They almost always disrupt normal skin lines, which often curve around the wart—a finding that was missing in this case.
Acquired digital fibrokeratomas (choice “d”) are benign solid tumors frequently seen on fingers. However, they are more epidermal than intradermal and demonstrate a diagnostic feature called an epidermal collarette (missing in this case).
DISCUSSION
Sometimes called implantation dermoid cysts, these sacs have a well-defined white cyst wall and cheesy, often odoriferous contents. Although common on hands and fingers, they can occur in almost any location and as a result of many types of trauma.
This includes surgical trauma, which effectively implants surface adnexal tissue (eg, the sebaceous apparatus) where it can continue to produce and accumulate its cheesy contents over time. Patients often forget the trauma that caused the cyst, but it is still worth inquiring into.
Merely emptying the sac can confirm the diagnosis; however, this almost always results in recurrence. Fortunately, implantation cysts are usually easily removed with minimal risk to hand function.
As with almost any tissue removed from the body, the specimen needs to be sent for pathologic examination. In addition to the differential items already noted, a number of rare or unusual conditions can present in a similar fashion, including eccrine carcinoma and a variety of sarcomas.
This patient recovered from his surgery without complication. Pathologic examination confirmed the benign nature of the lesion.
For several years, a 45-year-old man has had an asymptomatic lesion on the volar aspect of his fourth finger. The lesion is growing and increasingly “in the way.” That, coupled with the patient’s concern about cancer or other serious disease, leads him to request referral to dermatology. There is no history of similar lesions anywhere on his body. Additional questioning reveals that several months prior to the lesion’s manifestation, the patient sustained a puncture wound to the same finger. Initially, the affected area was only a millimeter or two in size. X-rays ordered by his primary care provider did not indicate any bony abnormality, nor did they shed any light on the lesion itself. An impressive 2.6 cm in diameter, the lesion is prominent in vertical elevation as well. Motor and sensory function are found to be intact, although the bulk of the lesion prohibits full flexion of the finger. The lesion is opaque to attempted transillumination. No surface changes are apparent in the overlying skin. Skin lines are intact and parallel. The lesion is quite firm but compressible. The decision is made to excise the lesion, employing a digital block and tourniquet. A football-shaped ellipse of skin with 50° angles on the ends is removed from the surface, revealing a glistening white, smooth mass that comes out intact, with very little blunt dissection. Motor function is again assessed and found to be intact. The large angles in the ends of the ellipse allow the wound edges to be pulled together with interrupted vertical mattress sutures and no leftover redundant skin. The lesion is submitted intact for pathologic examination.

Neck Pain With No Palpable Tenderness
ANSWER
The image shows an acute fracture at the base of the odontoid with evidence of posterior displacement of the fracture fragment. Such fractures are typically unstable.
In addition, there is evidence of a fracture and subluxation at the C4/C5 level. However, given the degree of sclerosis and chronic changes present, this finding is likely an old one.
The patient was maintained in a collar on bedrest. Subsequently, he underwent odontoid pinning to stabilize the fractures.
A 65-year-old man presents with neck pain following a fall. Earlier this evening, he says, he fell off his porch (approximately four feet in height) and hit the top/front of his head on the ground. He denies any loss of consciousness, adding that he only came in for evaluation at the urging of his family. The patient denies any extremity weakness or paresthesias. He also denies any significant medical history, although his sister, who has accompanied him, states that he drinks alcohol “regularly and heavily.” Physical examination reveals a man who appears much older than his stated age and is uncomfortable, but not in obvious distress. His vital signs are normal. He is currently wearing a hard cervical collar. There is no palpable tenderness posteriorly along his cervical spine. He is able to move all of his extremities well. His strength is good, and his sensation is intact. A lateral radiograph of the patient’s cervical spine is shown. What is your impression?

Is Lingering “Flu” Responsible for Lethargy?
ANSWER
This ECG shows a junctional rhythm with a rate of 47 beats/min and an incomplete right bundle branch block (RBBB). The QRS complexes are narrow, indicating conduction originating at or above the atrioventricular (AV) node.
With the absence of a P wave for every QRS complex, the origin of each beat occurs at the level of the AV node, with depolarization of the ventricles via the normal conduction pathway. Intrinsic automaticity of the AV node results in a rate of 40 to 60 beats/min. There may be retrograde conduction from the AV node into the atria; however, it is not apparent in this ECG.
An incomplete RBBB is evidenced by a QRS complex with a duration > 100 ms and ≤ 120 ms with a terminal R wave (eg, rsR’) in lead V1 and a slurred S wave in leads I and V6 (more common with complete RBBB).
The presence of new-onset junctional rhythm with an incomplete RBBB is suspicious for conduction system disease. Given her symptomatic bradycardia, the patient underwent implantation of a dual-chamber permanent pacemaker. She has since returned to her normal activities.
Of note: Careful examination of the baseline in this tracing raises suspicion for atrial fibrillation (AF). However, according to her primary care provider, this patient had had no previous episodes of AF. Intracardiac electrograms taken during her pacemaker implantation ruled out this diagnosis.
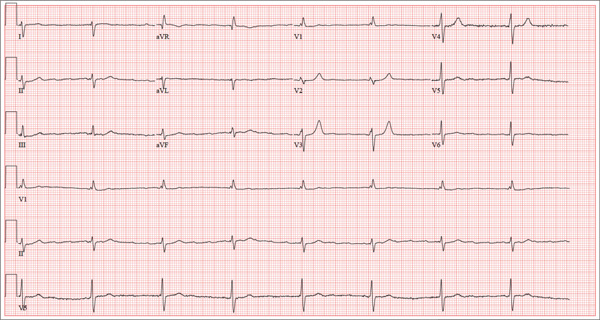
Accompanied by her daughter, whom she is visiting from out of town, a 72-year-old woman presents with a two-week history of lethargy. She says she had “the flu” three weeks ago and just can’t seem to recover from it. According to her daughter, she doesn’t appear ill but seems to tire very easily after simple tasks such as walking from her bedroom to the kitchen. The patient denies fever, chills, orthopnea, dyspnea, and cough. There have been no episodes of near-syncope or syncope. She repeatedly states that she is “just so tired.” Prior to the onset of her flulike symptoms, she was very active in her retirement community, dancing, gardening, and going on sponsored trips to a local casino without difficulty. She says she wouldn’t even attempt those activities in her current state, as any activity immediately exhausts her. Medical history is remarkable for hypertension, hypothyroidism, osteoarthritis, and diabetes. Surgical history is remarkable for a cholecystectomy, abdominal hysterectomy, and removal of several lipomas from her upper extremities. Her current medications include aspirin, hydrochlorothiazide, lisinopril, metformin, and levothyroxine. She is allergic to penicillin and sulfa, both of which cause hives and flushing. Social history reveals that she is a retired junior high school librarian, the mother of three living children, and a widow. She is a smoker, with a one-pack-per-day history from age 14 until her husband died four years ago. She quit at that time but has recently started again, smoking half a pack per day (but “only” when she goes to the casino). She does not use alcohol or recreational drugs. The review of systems is positive for corrective lenses and symptoms suggestive of a urinary tract infection. On physical exam, her blood pressure is 138/92 mm Hg; pulse, 50 beats/min; respiratory rate, 16 breaths/min-1; and temperature, 98.4°F. Her weight is 224 lb, and her height is 62 in. She walks with the assistance of a cane and appears tired and apprehensive. Pertinent physical findings include bilateral cataracts, clear lung fields, and a soft, early systolic murmur at the left lower sternal border. She has two well-healed scars on her abdomen and multiple well-healed scars on both upper extremities. Her hands show evidence of osteoarthritis, and she has limited range of motion but no pain in her right hip. The neurologic exam is grossly intact. Laboratory tests and an ECG are performed. The ECG findings include a ventricular rate of 47 beats/min; PR interval, not measured; QRS duration, 120 ms; QT/QTc interval, 454/401 ms; P axis, not measured; R axis, 171°; and T axis, 51°. What is your interpretation of this ECG—and does it provide an explanation for the patient’s recent lethargy?

Team creates faster method for diagnosing sepsis

for Staphylococcus infection
Credit: Bill Branson
A new technique could cut hours off the time it takes to diagnose blood infections, according to a report published in mBio.
The
method combines a selective lysis step in which blood cells are destroyed, a centrifugation step to collect any bacteria or
fungi, and a fluorescence step that reveals the “fingerprint” of any
pathogens present in the blood sample.
In tests, this method identified
the species of bacteria or fungi in 96.5% of positive blood culture
samples.
“The primary benefit of getting a rapid identification is making sure the patient is on the right [antibiotic] therapy and to quickly make any needed adjustments to the initial therapy,” said study author John Walsh, of bioMérieux, Inc. in Durham, North Carolina.
Walsh added that the current standard approach to diagnosing bloodstream infections—Gram staining and overnight sub-culture followed by phenotypic ID tests—has limitations that can prevent timely treatment.
Gram staining provides early, low-level information about the type of microorganism present, but it sometimes takes hours to deliver a result, and technicians can make mistakes in the process that provide misleading results.
Other, more specific identification methods are also available for diagnosis, but they can take at least a day or two to produce results, and many require expensive equipment.
So Walsh and his colleagues developed a new technique. With this method, a sample of positive blood culture is treated with lysis buffer, to “pop” the blood cells, then transferred to a specialized optical tube.
Next, the tube is centrifuged, which drives bacteria or fungi down through a liquid density cushion to form a pellet at the bottom of the tube.
Then comes the intrinsic fluorescence spectroscopy. The microbial pellet is irradiated with light ranging from the deep ultraviolet to infrared. This excites certain organic molecules in the microorganisms—tryptophan, NADH, FAD, porphyrins, and others—and causes them to fluoresce in a characteristic way depending on the identity of the microbe.
The exact pattern of fluorescence is then compared with a database of 37 common pathogens to identify the organism present.
“We’re using intrinsic fluorescence to identify the microorganisms,” Walsh noted. “It’s an innate property of most living organisms. Because it’s intrinsic, no reagents are needed for the identification step.”
This removes many of the opportunities for mistakes and lowers test costs, he added.
In tests, this method correctly identified the species in 96.5% of all samples. In the 2.7% of samples for which no species identity was provided, the system was able to correctly identify 67% to the family level, which is often enough information to select an effective therapy.
More than 1000 samples were tested, and the method never gave an incorrect result as to the family level or the Gram type.
Walsh and his colleagues are now working on automating this system with robotics to make it a fully hands-off process. He noted that blood cultures grow in their own time, often producing a positive result at an inconvenient time of the day for clinical labs, so automation could speed up diagnosis significantly.
“Our vision is to have a system that will automatically identify the blood culture isolate within 15 minutes of the culture being called positive,” Walsh said.
If a culture is positive at 2 am, automating this method could make it possible to identify the organism by 2:15 am and send an electronic report to a patient’s physician.
The researchers hope to begin testing and evaluating the feasibility of an automated form of the system in a clinical environment within months. ![]()
Point-Counterpoint: Type II Endoleaks - To treat or not to treat
The management of Type II endoleaks remains controversial. At the Charing Cross meeting this year Jean- Pierre Becquemin and Hence Vehagen debated whether Type II endoleaks should be treated. Dr. Verhagen suggested that results of endoleak treatment are so poor and the natural history of Type II endoleaks so benign that perhaps we shouldn’t even try to treat them. Dr. Becquemin felt that an attempt at treatment for some endoleaks was still necessary. This prompted our editors to suggest a U.S. version of the debate. As you will see both Dr. Geraghty and Dr. Kwolek feel that there is merit in pursuing treatment but with certain caveats. We appreciate their insight into this important subject.
– Dr. Russell Samson is the medical editor of Vascular Specialist.
A slow start can be salvaged
Our group recently published the midterm outcomes of our series of percutaneous glue and /or coil embolizations to treat type II endoleaks (T2EL) accompanied by continued aneurysm sac growth.1 Painstaking retrospective data collection, augmented by blinded review of all follow-up CT scans, demonstrated that at 23 months post intervention, T2EL had persisted or recurred in 72% of patients. Furthermore, the rate of aneurysm sac growth was not altered by the percutaneous intervention.
Other institutions have also reported significant rates of T2EL persistence/recurrence following embolization, and in the Cleveland Clinic experience, continued sac growth in excess of 5 mm in diameter was documented in 56% of patients who had undergone an attempt at T2EL ablation.2-4 In light of this data, one might logically question why I continue to support intervention in this setting.

The midterm reappraisals of T2EL interventions are certainly sobering. We can no longer accept apparent procedural success as a guarantee that these endoleaks will remain clinically and radiographically dormant. Yet these studies were not without their bright spots. In our series, diagnostic angiography (via transfemoral and translumbar approaches) detected occult type I or type III endoleaks in 21% of patients, prompting definitive repair by additional endograft placement. Similar angiographic elucidation of type I and III endoleaks was confirmed by the University of Chicago experience, with a 16% detection rate.2 The diagnosis and treatment of these highly pressurized leaks likely contributed to the low incidence of aneurysm rupture and aneurysm-related mortality seen in most of these series.
Bright spots aside, current midterm results for T2EL intervention leave much to be desired. I would contend, however, that these interventions should be refined, not abandoned. We now appreciate that T2EL mimic the behavior of complex arteriovenous malformations in several ways: the presence of multiple feeding and draining branches, the finding that solitary branch vessel embolization often leads to inflow recruitment from less prominent branches, and the presence of a nidus whose ablation is critical. In retrospect, then, it is not surprising that treatment approaches consisting of single-vessel coiling, or simple embolization of the nidus without concomitant treatment of all feeding branches, failed to produce the desired result. The aggressiveness of early T2EL embolization procedures may have been tempered by the potential for visceral and spinal cord complications.5,6 However, current midterm outcomes data suggest that predictable and durable success in T2EL treatment will require complete nidus ablation and occlusion of all arterial branches of the sac.
How can we pursue this more aggressive goal while maintaining an appropriate safety profile? In several instances, we have pursued this objective via staged interventions: initial angiographic coil/glue deployment, followed by laparoscopic clipping of persistent feeding vessels. The use of Onyx® (EV3-Covidien), as championed by Abularrage and Bosiers,7,8 offers the potential to achieve full treatment with a single intervention.
Advantages of Onyx include predictable polymerization times and lack of adhesion to the delivery catheter. These features permit deliberate and complete obliteration of the nidus, with intentional extension of the polymerizing mixture into the feeding vessels.
T2EL intervention has thus completed its first iteration. The value of routine angiographic examination is clear, particularly as regards the detection of occult type I and III endoleaks. Failure analysis of first-generation T2EL interventions suggests that incomplete obliteration of the endoleak complex (nidus and all feeding branches) sets the stage for vessel recruitment and reestablishment of sac flow. Promising alternative therapies have been identified, and we await their thorough evaluation.
Dr. Geraghty is an associate professor, surgery and radiology, in the division of general surgery, vascular surgery section at Washington University School of Medicine, St. Louis, Mo., and co-director of the Washington University Limb Preservation Center.
1. J Vasc Surg, 2012. 55(5): p. 1263-7.
2. J Vasc Interv Radiol, 2012. 23(7): p. 866-72; quiz 872.
3. J Endovasc Ther, 2012. 19(2): p. 182-92.
4. J Vasc Surg, 2012. 55(1): p. 33-40.
5. Ann Vasc Surg, 2012. 26(6): p. 860 e1-7.
6. J Vasc Interv Radiol, 2013. 24(1): p. 49-55.
7. J Vasc Surg, 2012. 56(3): p. 630-6.
8. J Cardiovasc Surg (Torino), 2013.
A call for a prospective randomized trial
While I agree with Dr. Geraghty’s comments concerning the initial poor results reported for the percutaneous treatment of Type II endoleaks,1 I disagree with comments made in April 2013 at the Charing Cross meeting by Dr. Hence Verhagen that there is "no need to worry about Type II endoleaks since they are low pressure."2
Early on in our experience we began measuring sac pressures after trans- lumbar catheterization and have found that some aneurysm sacs may in fact have systolic arterial pressures of 8-90 mm HG from large lumbar or IMA collaterals. Furthermore, we and others have described the treatment of patients with ruptured AAA after EVAR who upon open exploration where found to have large patent lumbar arteries as the sole etiology of the ruptured AAA.
Dr. Geraghty and Dr. Sarac at Cleveland Clinic have also described the important observation that these Type II endoleaks may be associated with a Type I or III endoleaks and thus put patients at even higher risk of rupture.3 The extent of these leaks may not be completely elucidated until the time of angiography, again emphasizing the importance of a more aggressive approach to diagnosis and treatment in patients with an enlarging aneurysm sac.
These authors have also appropriately pointed out that overall treatment success rates are low with persistence of type II endoleaks on long–term follow-up. While we initially described an overall success rate of 30%, our approach has changed over time to include direct access to the endoleak nidus with the injection of a flow directed glue (Onyx) to obliterate the flow channel and feeding vessels.
We have found this approach to be more successful than attempting to cannulate each of the feeding lumbar vessels or coil embolization of the aneurysm sac, and can be performed via either a translumbar or transarterial approach using SMA to IMA collaterals. While our success rate using this technique has improved to nearly 80%, several words of caution should be noted. 1) Onyx glue is approved for use in the treatment of intracerebral vascular malformations and does not have a peripheral indication at this time. 2) It is critically important that the interventionalist obtains access into the nidus/flow channel to allow the embolic agent to flow. Otherwise you are injecting glue directly into the sac thrombus and wasting time and an expensive embolic agent. 3) There are often multiple levels of lumbar vessels involved and we have found that we often have to go back several times at different levels to treat extensive Type II endoleaks. All of these observations emphasize the need to further study the treatment of Type II endoleaks and the need for a prospective randomized trial to better identify the best treatment options.
Dr. Kwolek is the director of the vascular and endovascular training program at Massachusetts General Hospital, Boston, and the chief of vascular surgery at Newton Wellesley Hospital.
1. J Vasc Surg, 2012. 55(5): p. 1263-7.
2. Management of Type II endoleaks divides the experts at CX 35. Vascular News International,58, May 2012, BIBA publishing.
3. J Vasc Surg, 2012. 55(1): p. 33-40.
4. J Vasc Surg, 2012. 56(3): p. 630-6.
The management of Type II endoleaks remains controversial. At the Charing Cross meeting this year Jean- Pierre Becquemin and Hence Vehagen debated whether Type II endoleaks should be treated. Dr. Verhagen suggested that results of endoleak treatment are so poor and the natural history of Type II endoleaks so benign that perhaps we shouldn’t even try to treat them. Dr. Becquemin felt that an attempt at treatment for some endoleaks was still necessary. This prompted our editors to suggest a U.S. version of the debate. As you will see both Dr. Geraghty and Dr. Kwolek feel that there is merit in pursuing treatment but with certain caveats. We appreciate their insight into this important subject.
– Dr. Russell Samson is the medical editor of Vascular Specialist.
A slow start can be salvaged
Our group recently published the midterm outcomes of our series of percutaneous glue and /or coil embolizations to treat type II endoleaks (T2EL) accompanied by continued aneurysm sac growth.1 Painstaking retrospective data collection, augmented by blinded review of all follow-up CT scans, demonstrated that at 23 months post intervention, T2EL had persisted or recurred in 72% of patients. Furthermore, the rate of aneurysm sac growth was not altered by the percutaneous intervention.
Other institutions have also reported significant rates of T2EL persistence/recurrence following embolization, and in the Cleveland Clinic experience, continued sac growth in excess of 5 mm in diameter was documented in 56% of patients who had undergone an attempt at T2EL ablation.2-4 In light of this data, one might logically question why I continue to support intervention in this setting.
The midterm reappraisals of T2EL interventions are certainly sobering. We can no longer accept apparent procedural success as a guarantee that these endoleaks will remain clinically and radiographically dormant. Yet these studies were not without their bright spots. In our series, diagnostic angiography (via transfemoral and translumbar approaches) detected occult type I or type III endoleaks in 21% of patients, prompting definitive repair by additional endograft placement. Similar angiographic elucidation of type I and III endoleaks was confirmed by the University of Chicago experience, with a 16% detection rate.2 The diagnosis and treatment of these highly pressurized leaks likely contributed to the low incidence of aneurysm rupture and aneurysm-related mortality seen in most of these series.
Bright spots aside, current midterm results for T2EL intervention leave much to be desired. I would contend, however, that these interventions should be refined, not abandoned. We now appreciate that T2EL mimic the behavior of complex arteriovenous malformations in several ways: the presence of multiple feeding and draining branches, the finding that solitary branch vessel embolization often leads to inflow recruitment from less prominent branches, and the presence of a nidus whose ablation is critical. In retrospect, then, it is not surprising that treatment approaches consisting of single-vessel coiling, or simple embolization of the nidus without concomitant treatment of all feeding branches, failed to produce the desired result. The aggressiveness of early T2EL embolization procedures may have been tempered by the potential for visceral and spinal cord complications.5,6 However, current midterm outcomes data suggest that predictable and durable success in T2EL treatment will require complete nidus ablation and occlusion of all arterial branches of the sac.
How can we pursue this more aggressive goal while maintaining an appropriate safety profile? In several instances, we have pursued this objective via staged interventions: initial angiographic coil/glue deployment, followed by laparoscopic clipping of persistent feeding vessels. The use of Onyx® (EV3-Covidien), as championed by Abularrage and Bosiers,7,8 offers the potential to achieve full treatment with a single intervention.
Advantages of Onyx include predictable polymerization times and lack of adhesion to the delivery catheter. These features permit deliberate and complete obliteration of the nidus, with intentional extension of the polymerizing mixture into the feeding vessels.
T2EL intervention has thus completed its first iteration. The value of routine angiographic examination is clear, particularly as regards the detection of occult type I and III endoleaks. Failure analysis of first-generation T2EL interventions suggests that incomplete obliteration of the endoleak complex (nidus and all feeding branches) sets the stage for vessel recruitment and reestablishment of sac flow. Promising alternative therapies have been identified, and we await their thorough evaluation.
Dr. Geraghty is an associate professor, surgery and radiology, in the division of general surgery, vascular surgery section at Washington University School of Medicine, St. Louis, Mo., and co-director of the Washington University Limb Preservation Center.
1. J Vasc Surg, 2012. 55(5): p. 1263-7.
2. J Vasc Interv Radiol, 2012. 23(7): p. 866-72; quiz 872.
3. J Endovasc Ther, 2012. 19(2): p. 182-92.
4. J Vasc Surg, 2012. 55(1): p. 33-40.
5. Ann Vasc Surg, 2012. 26(6): p. 860 e1-7.
6. J Vasc Interv Radiol, 2013. 24(1): p. 49-55.
7. J Vasc Surg, 2012. 56(3): p. 630-6.
8. J Cardiovasc Surg (Torino), 2013.
A call for a prospective randomized trial
While I agree with Dr. Geraghty’s comments concerning the initial poor results reported for the percutaneous treatment of Type II endoleaks,1 I disagree with comments made in April 2013 at the Charing Cross meeting by Dr. Hence Verhagen that there is "no need to worry about Type II endoleaks since they are low pressure."2
Early on in our experience we began measuring sac pressures after trans- lumbar catheterization and have found that some aneurysm sacs may in fact have systolic arterial pressures of 8-90 mm HG from large lumbar or IMA collaterals. Furthermore, we and others have described the treatment of patients with ruptured AAA after EVAR who upon open exploration where found to have large patent lumbar arteries as the sole etiology of the ruptured AAA.
Dr. Geraghty and Dr. Sarac at Cleveland Clinic have also described the important observation that these Type II endoleaks may be associated with a Type I or III endoleaks and thus put patients at even higher risk of rupture.3 The extent of these leaks may not be completely elucidated until the time of angiography, again emphasizing the importance of a more aggressive approach to diagnosis and treatment in patients with an enlarging aneurysm sac.
These authors have also appropriately pointed out that overall treatment success rates are low with persistence of type II endoleaks on long–term follow-up. While we initially described an overall success rate of 30%, our approach has changed over time to include direct access to the endoleak nidus with the injection of a flow directed glue (Onyx) to obliterate the flow channel and feeding vessels.
We have found this approach to be more successful than attempting to cannulate each of the feeding lumbar vessels or coil embolization of the aneurysm sac, and can be performed via either a translumbar or transarterial approach using SMA to IMA collaterals. While our success rate using this technique has improved to nearly 80%, several words of caution should be noted. 1) Onyx glue is approved for use in the treatment of intracerebral vascular malformations and does not have a peripheral indication at this time. 2) It is critically important that the interventionalist obtains access into the nidus/flow channel to allow the embolic agent to flow. Otherwise you are injecting glue directly into the sac thrombus and wasting time and an expensive embolic agent. 3) There are often multiple levels of lumbar vessels involved and we have found that we often have to go back several times at different levels to treat extensive Type II endoleaks. All of these observations emphasize the need to further study the treatment of Type II endoleaks and the need for a prospective randomized trial to better identify the best treatment options.
Dr. Kwolek is the director of the vascular and endovascular training program at Massachusetts General Hospital, Boston, and the chief of vascular surgery at Newton Wellesley Hospital.
1. J Vasc Surg, 2012. 55(5): p. 1263-7.
2. Management of Type II endoleaks divides the experts at CX 35. Vascular News International,58, May 2012, BIBA publishing.
3. J Vasc Surg, 2012. 55(1): p. 33-40.
4. J Vasc Surg, 2012. 56(3): p. 630-6.

How To Maximize a Minimal Incision
Mini-incision carotid surgery was first reported (not necessarily performed) by Ascher et al. in 2005. In light of this report and an ever-growing patient demand for minimally invasive procedures, it is surprising that this procedure has not been widely adopted by the vascular surgical community. The reasons for this are probably multifactorial and may include a concern that cranial nerve injuries are more likely to occur as well as an added difficulty in placing a shunt or sewing in a patch. These concerns are mitigated by a thorough knowledge of the usual and variant anatomy of this area and a broad experience in carotid surgery. If performed properly, mini-incision is not synonymous with mini exposure carotid surgery.

It is important to identify the carotid bifurcation with duplex ultrasound prior to making the skin incision. It is my preference to make a vertical skin incision which extends from approximately 2 cm above to below the carotid bifurcation at a slight outside to inside angle to the anterior border of the sternocleidomastoid muscle (some surgeons prefer a transverse skin incision). The platysma muscle is identified and divided for a short distance between forceps.
The edges of the platysma are grasped with DeBakey forceps while the skin is retracted as far inferiorly as possible.
The platysma is then divided to this point following which this is repeated at the superior aspect of the wound. The extended division of the platysma is what allows for an exposure equal to that of a much larger incision. Now adequate visualization of the common and internal carotid arteries is achieved by use of a small retractor applied alternately to the inferior and superior ends of the wound respectively.
Using this technique, I have easily been able to perform both standard and eversion endarterectomies (as in photo), place a shunt when necessary, and/or sew on a carotid patch.
Once completed the platysma is closed with an absorbable suture and skin is closed with an absorbable monofilament suture.
In my experience, patients have less postoperative pain than those with a larger neck incision. They are also exceptionally pleased with the small, barely visible, neck scar. Finally, I have used the mini-incision for my carotid surgeries for more than 10 years during which time no patient has suffered a permanent cranial nerve injury.
Dr. Dietzek is the chief of the vascular and endovascular surgery section and the Linda and Stephen R. Cohen chair in vascular surgery at Danbury Hospital, Danbury Conn. He is also a clinical associate professor of surgery at the University of Vermont College of Medicine in Burlington.
Editor’s Note: If you would like to submit a similarly useful Tips and Tricks, contact us at [email protected].
Mini-incision carotid surgery was first reported (not necessarily performed) by Ascher et al. in 2005. In light of this report and an ever-growing patient demand for minimally invasive procedures, it is surprising that this procedure has not been widely adopted by the vascular surgical community. The reasons for this are probably multifactorial and may include a concern that cranial nerve injuries are more likely to occur as well as an added difficulty in placing a shunt or sewing in a patch. These concerns are mitigated by a thorough knowledge of the usual and variant anatomy of this area and a broad experience in carotid surgery. If performed properly, mini-incision is not synonymous with mini exposure carotid surgery.
It is important to identify the carotid bifurcation with duplex ultrasound prior to making the skin incision. It is my preference to make a vertical skin incision which extends from approximately 2 cm above to below the carotid bifurcation at a slight outside to inside angle to the anterior border of the sternocleidomastoid muscle (some surgeons prefer a transverse skin incision). The platysma muscle is identified and divided for a short distance between forceps.
The edges of the platysma are grasped with DeBakey forceps while the skin is retracted as far inferiorly as possible.
The platysma is then divided to this point following which this is repeated at the superior aspect of the wound. The extended division of the platysma is what allows for an exposure equal to that of a much larger incision. Now adequate visualization of the common and internal carotid arteries is achieved by use of a small retractor applied alternately to the inferior and superior ends of the wound respectively.
Using this technique, I have easily been able to perform both standard and eversion endarterectomies (as in photo), place a shunt when necessary, and/or sew on a carotid patch.
Once completed the platysma is closed with an absorbable suture and skin is closed with an absorbable monofilament suture.
In my experience, patients have less postoperative pain than those with a larger neck incision. They are also exceptionally pleased with the small, barely visible, neck scar. Finally, I have used the mini-incision for my carotid surgeries for more than 10 years during which time no patient has suffered a permanent cranial nerve injury.
Dr. Dietzek is the chief of the vascular and endovascular surgery section and the Linda and Stephen R. Cohen chair in vascular surgery at Danbury Hospital, Danbury Conn. He is also a clinical associate professor of surgery at the University of Vermont College of Medicine in Burlington.
Editor’s Note: If you would like to submit a similarly useful Tips and Tricks, contact us at [email protected].