User login
Operation Critical
There is going to be a healthcare crisis in Haiti in the next few years if things don’t markedly improve, says Jocelyn David, MD, chief hospitalist at the Miami VA Healthcare System in Miami, who has traveled to the island nation four times since the Jan. 12 earthquake.
Dr. David returned on Aug. 15 from a four-day trip she took with the Haitian Resource Development Foundation to assess the needs of smaller hospitals outside the capital of Port-au-Prince.
"People are traveling from the capital to these hospitals because the hospitals in the city are overwhelmed and struggling due to a lack of funds," Dr. David says.
Some city hospitals, such as CDTI du Sacre Coeur Hospital, one of the country’s more modern medical facilities, have outright closed, she says.
“I was surprised that I didn’t see any improvement,” says Mario A. Reyes, MD, FAAP, FHM, director of Pediatric Hospital Medicine at Miami Children’s Hospital, who volunteered in Haiti in January and went back in August to visit the Children’s Hospital of the Hopital de l’Universite d’Etat d’Haiti (HUEH), the largest academic public pediatric hospital in the capital.
The Children's Hospital is uninhabitable; medical staff are treating patients in makeshift wood houses provided by the United Nations, he says. Children sleep in hospital beds without mattresses, and oxygen tanks are shared by four or five children. There are no ultrasounds, and ventilators, IV lines, and antibiotics are in short supply, he says.
"There is a frustration among Haitian physicians that things aren't being done as quickly as they should," Dr. Reyes says. "The needs are immense."
Dr. David plans another trip to Haiti in October to train healthcare providers in BLS, ALS, and intubations in order to expand the limited emergency care. Meanwhile, Dr. Reyes and a group of physicians who work at Miami Children's Hospital are organizing professional and academic trips to HUEH so physicians can lend their expertise.
"That's what the Haitian providers want," he says. "They want us to teach and work with them."
The first trip is planned for December, and the group hopes the American Academy of Pediatrics will endorse their effort, which likely will include donating medical equipment and developing a telemedicine program.
Pediatric hospitalists who are interested in joining one of the trips to the Children’s Hospital of the Hopital de l’Universite d’Etat d’Haiti can contact Dr. Reyes at 305-668-5500 or at [email protected].
Hospitalist Compensation and Productivity Figures Released by MGMA
Enter text here
Enter text here
Enter text here
FDA panel recommends dabigatran: 9-0
The advisory panel for the US Food and Drug Administration (FDA) voted unanimously on September 20 to recommend approval of dabigatran, an anticoagulant under investigation for the reduction of stroke risk and non-CNS systemic embolism in patients with atrial fibrillation.
The advisory board only voted that dabigatran works at least as well as warfarin. But unlike warfarin, dabigatran does not require laboratory monitoring. Therefore, dabigatran is less difficult to use than the current standard of care.
The decision was based on the randomized, noninferiority RE-LY (Randomized Evaluation of Long-Term Anticoagulation Therapy) trial of 18,000 patients. The trial compared unblinded warfarin administration with blinded doses of dabigatran at 110 mg and 150 mg.
The hazard ratio of dabigatran compared with warfarin was 0.66 (P<0.003) in the 150 mg dabigatran arm and 0.91 (P<0.0001) in the 110 mg dabigatran arm.
Bleeding risk remains the top safety concern. Receiving 150 mg of dabigatran seems to run the same risk as warfarin for bleeding complications, but in 110 mg doses of dabigatran, the risk was less than warfarin.
Conflict arose among committee members regarding whether or not to approve both doses. Some members disagreed, seeing that the 110 mg dose was only noninferior to warfarin, not superior. Other members believed that approving both doses would ensure wider use of the drug leading to the prevention of a greater number of strokes in atrial fibrillation patients.
There is one unexplained finding of the RE-LY study. Myocardial infarction rates were higher on dabigatran compared with warfarin. For every 1000 patients treated with dabigatran, there may be 2 more myocardial infarctions than in patients treated with warfarin.
The FDA often follows the advice of the panel of experts, although it is not required to. ![]()
Business Case for an Electronic Discharge Summary
Delivering the highest possible quality of care is among the top priorities of all medical centers. That said, any quality innovation must be seen as adding value from a variety of perspectives. Especially in the current economic climate, a sound business case is paramount to the advancement of any quality innovation. Given the nature of their work, hospitalists are ideally suited to undertake system improvement innovations. To assist hospitalists in successfully implementing quality and safety initiatives, we have designed a framework of elements required for a business case. We describe our experience developing and implementing an electronic discharge summary and utilize a structured framework to articulate the business case for its implementation.
Defining a Business Case Framework
A business case is a structured proposal outlining the qualitative and quantitative factors that justify a course of action. An effective business case for a quality improvement initiative articulates how both factors are aligned with preexisting organizational goals. In modeling the business case framework for the electronic discharge summary, Figure 1 outlines the qualitative and quantitative costs and benefits that can affect institutional decision making.

Organizational Aims and Financial Impact: Determining Costs and Benefits
Organizational goals drive decision making and resource allocation at all levels. As priorities change with time, understanding which predominate in an organization will be essential to building a business case. Institutions may be more willing to adopt expensive innovations if they are justified by progress toward the qualitative organizational goals. Figure 1 demonstrates several institutional goals both qualitative (provider satisfaction, quality improvement, and institutional reputation) and quantitative (cost avoidance, cost savings, and revenue generation) that could drive the decision making for an electronic discharge summary. After examining how an initiative aligns with institutional aims, the next step is to weigh the benefits against the potential costs. Costs in our example include not only the quantitative financial investment in information technology (IT) infrastructure, personnel and maintenance, but also may include qualitative costs such as loss of staff efficiency and redundant documentation. Costs and savings will be geographically variable and depend on the institutional framework, eg, the existing system for medical records, institutional patient payer mix, type of payment structure (global vs. utilization based*), and reimbursement rates. While it may be impractical to account for every cost and savings resulting from the project implementation, every effort should be made to account for the key variables that make up the cost‐benefit calculation.
The Business Case for an Electronic Discharge Summary at University of California San Francisco (UCSF)
Current State of Discharge Documentation a UCSF
UCSF Medical Center is a 600‐bed quaternary care academic institution that discharges approximately 100 patients per day. Our hospital discharge summary is used to document a patient's hospital course and post discharge plan, information necessary for continued care in the outpatient setting. Literature supports the potential for timely and relevant discharge summaries to improve care transitions, clinician satisfaction, and resource use.1 In 2008, however, the majority of our discharge summaries were completed greater than 14 days post discharge, in accordance with national practice.2 Despite Centers for Medicare & Medicaid Services (CMS) and the Joint Commission discharge summary standards regarding content,3, 4 most discharge summaries are composed using freeform dictation.2 Consequently, discharge summaries often lack critical information,57 and may not reach the correct outpatient provider in a timely manner.5, 811
Our Proposed Solution: E‐Discharge
As hospitals are increasingly implementing electronic medical records (EMR),12 there is a growing opportunity to efficiently and reliably incorporate information from the medical record into electronic or database assisted discharge materials. At UCSF the need to develop a system to document and communicate tests pending at discharge fueled the development of an electronic discharge summary. UCSF's vendor‐supplied EMR lacks the ability to integrate electronic patient data into a progress note or discharge summary in a manner usable for physicians. Instead physicians are required to use a telephone voice dictation system, which is subsequently transcribed to text within 1 to 3 days. A separate software platform tracks attending signature of the transcribed text and automatically triggers dissemination through computerized fax and campus mail. The turnaround time for a discharge summary can be as long as 3 weeks. With the time involved and high cost of implementing new or more sophisticated versions of EMR, we chose to design a solution that would improve care for our patients in a more immediate and cost neutral fashion. Our goal was to create an affordable, electronic, systematized solution to produce both timely and relevant discharge summaries, in the hopes of improving communications with providers and thus patient outcomes.
In earlier work, UCSF developed UCSF Note Writer, a template‐based documentation tool that uses web service to import data from the underlying database for provider documentation.13 As a standardized template has been shown to improve quality of communication to both patients and referring providers,1, 14, 15 we developed a template in UCSF Note Writer with both free text and auto‐populated fields for a discharge summary based on current guidelines.1619 We encouraged the documentation of medication changes, changes in functional status and pending tests.
The adoption of such an electronic format has also been shown to improve the efficiency of discharge documentation over conventional dictation and transcription.1, 2022 While this change may be institution dependent, we employed strategies such as allowing the discharge summary to be initiated and updated throughout the hospital admission and unifying the discharge summary with the last day's progress note to facilitate timeliness. To promote efficiency, we allowed providers to import pertinent labs, microbiology, and in the future, the importation of pending tests. While the electronic format in itself does not promote timeliness, it incorporates the discharge summary into physician daily workflow and enables efficiency in data gathering and transfer. For outpatient providers who can access the EMR, any delay or potential fault in the delivery of the discharge materials is eliminated, while outside providers can receive copies through other rapid and reliable modes of electronic delivery (eg, EMR inbox notification) with an appropriate infrastructure.
Application of the Business Framework to the Case for an Electronic Discharge
Considering the potential improvements in care delivery, the argument for an electronic discharge summary may seem self‐evident. To realize its implementation, however, it is necessary to consider other aspects of organizational decision making. We employed the following structure to articulate a robust and sound business case for e‐discharge.
Qualitative Benefits
Quality and Safety
Publically reported data are often derived from hospital chart abstraction and may impact accreditation, reputation, and pay for performance programs.18, 23, 24 The discharge summary is a readily available source of information regarding discharge medications, patient instruction, and communication regarding pending tests. As such, its quality should be a priority for hospital decision makers. Electronic discharge summaries have the potential to reduce adverse events in the high‐risk post‐hospitalization period.1, 25 As such they may improve outpatient physicians' ability to deliver relevant care, reduce preventable readmissions26 and reduce malpractice vulnerability27all key drivers in organizational decision making.
Patient Satisfaction
Patients want to feel prepared for discharge by understanding the continuity of their care from the hospital to the outpatient setting. Discharge preparedness, commonly queried and reported in national patient satisfaction surveys, is low.28 Many electronic discharge summary platforms allow for translation into tailored patient instructions available to the patient in real time, helping to ensure that patients receive quality discharge education.29
Referring Physician Satisfaction
Poor discharge communication reduces referring physicians' satisfaction, which may discourage them from referring patients to the hospital or organization, having broader financial implications.25, 30 Even for medical centers with a busy emergency department, outpatient physician referrals and recommendations make up over 50% of an institution's admissions.31 An electronic discharge summary available in the EMR at the time of discharge, electronically transmitted to referring providers can impact the referral patterns of community physicians.
Readmission
Now publicly reported, readmission rates are another benchmark by which to judge hospital care.32 Patients with discharge summaries that are unavailable to outpatient providers, a very common occurance,2 have a higher trend toward readmission.26 Improved quality of care at the time of discharge resulting in fewer readmissions will better position hospitals to contend with potential Medicare reforms.
Quantitative Benefits
IT Infrastructure: Transcription, Deficiency Tracking, Dissemination
Hospitals, including UCSF, use internal or external transcriptionists to transcribe dictated recordings into typed text at a substantial cost to large medical centers. Medical records staff also track both discharge summary completion and their dissemination to referring providers in compliance with regulatory mandates.4, 33 The use of electronic documentation that relies on physician‐direct entry and that automates dissemination and tracking of discharge documentation provides a potential cost savings to offset the costs of a new system. UCSF Medical Center discharges 100 patients per day and could conservatively avoid almost $500,000 in transcription costs annually (Text Box 1).34
Text Box 1
UCSF Transcription costs:
Average cost/line for transcribed text: $0.17
Average Lines in a discharge summary: 80
# pts discharged/day: 100
Yearly costs = $496,400
Billing
Delays in completion of discharge summaries result in billing delays when critical information required for coding is in the discharge summary. Deferred payment on long admissions can reach tens of thousands of dollars, representing a significant strain on medical center finances. Comprehensive electronic discharge materials may simplify coding through careful documentation and improve billing efficiency through rapid completion.
At our medical center, approximately 20% of billing is delayed due to incomplete discharge documentation. For a hospital that generates over $1.4 billion dollars in billing revenue per year, this can translate into significant financial losses. Hospitals may have to borrow money or draw from existing resources to cover operative deficits created by a delay in the receipt of large payment. Lenders charge approximately 1% to 2% annual interest rate, which translates into 0.2% to 0.4% in billed costs that the hospital gives away to their lenders. Hospitals would be well served by eliminating delays in billing to improve revenue flow (Text Box 2).
Text Box 2
UCSF Annual revenue: $1.4 Billion
Billing that requires discharge summary completion: 20%
Lender's interest rate: 12%
Lenders interest rate (12%) on delayed billing (20%) = 0.20.4% of total revenue
Assuming a 14 day delay in billing: 0.20.4% of total revenue ($1,400,000,000) for 14/365 days = $107,000$215,000
Qualitative Costs
Efficiency and Physician Time
Implementation of any new system is likely to result in initial diminished efficiency. If patient volume is stable, this may not translate into loss of revenue, but rather cause staff to change their workflow. For example, given the new inefficiency in charting, staff may spend less time on direct patient care tasks (Intravenous Catheter placement, FT placement, patient education, discharge instructions), thus increasing the qualitative costs to implementing the system.
To minimize these costs, we used a step wise phased role out starting with one pilot team, with a plan to expand to multiple teams prior to implementation on the entire medicine service. This allowed for the creation of one central and several ancillary physician champions to troubleshoot the new system to help minimize productivity losses. One of the largest concerns in the switch from voice dictation to physician‐direct entry into an electronic summary is the cost of physician time. System adjustments through several pilots helped ensure that the time investment of a novice user was not significantly greater than time previously spent dictating.
Quality of Documentation
Unanticipated consequences from a switch to an electronic platform must be considered, such as the possibility of longer more redundant discharge summaries. The amount of information available for automated import will vary by institutional preference, but the recipient's access to the EMR, primary physician preference, and technologic capabilities should be considered. At UCSF we made an effort to distill the information most important to subsequent care, disabling the importation of multiple days of radiology data and instead working to create a system for discharge medication importation. As with any electronic document, the medium also lends itself to cutting and pasting, which may lead to anachronistic information carried forward from hospital progress notes earlier in the stay.35, 36 The largest experience with this unintended consequence can be found in the Veteran's Affairs Health System EMR, which found that 9% of progress notes studied contained copied or duplicated text.37 The authors recommended that clear policies, programs to raise practitioner awareness, and the development of monitoring procedure be implemented coincident with electronic note‐writing capabilities.
Quantitative Costs
Quantitative Costs will be highly variable across institutions, geographical areas, and software platforms as the infrastructure of existing EMRs are highly variable. The cost of implementation depends heavily on whether inpatient documentation (and thus discharge documentation) is a feature of an institutional EMR, or whether a stand‐alone discharge documentation infrastructure is needed. An explanation of the differences between these types of EMRs and the importance to the cost of infrastructure implementation is further described in the following section. Rather than providing a direct accounting of costs, we have provided a tabular summary of costs that should be considered with the adoption of an electronic discharge summary based on the type of institutional EMR (Table 1).
| Voice Dictation | E‐Discharge in an EMR With Inpatient Documentation Abilities | E‐Discharge in an EMR Without Inpatient Documentation Abilities | |
|---|---|---|---|
| |||
| Infrastructure | |||
| Software | + | ||
| Hardware (sufficient computers and printers) | + | + | |
| Network connectivity | + | + | |
| Server capacity for system backup | + | + | |
| Interface with current EMR | + | ||
| Personnel | |||
| Physician champion | + | + | |
| Physician training | + | + | |
| Computer programmer | + | + | |
| Transcription | + | ||
| Deficiency tracking | + | ||
| Dissemination | + | ||
| Maintenance | |||
| Computer/printer maintenance | + | + | |
| Network maintenance | + | + | |
| Software add‐ons and updates | + | + | + |
Infrastructure
For most health care organizations, the transition to an EMR includes adoption of results reporting systems and computerized provider order entry; only a more select group of hospitals with a complete EMR electronically document inpatient care (eg, progress notes) through physician direct entry. While there is substantial literature regarding the benefits and pitfalls of adopting computerized order entry (CPOE),38, 39 there is less attention devoted to the costs of implementing large‐scale electronic documentation, including an electronic discharge summary, as opposed to paper notes or dictation.4042 Institutions using an EMR with electronic care documentation capability have already invested in the infrastructure to implement electronic discharge documentation, and can employ it at a modest cost. For these institutions, the infrastructure cost of the transition from paper charting or dictation to direct entry by physicians lies in ensuring sufficient computers and connectivity to handle the increased computer use. On the other hand, for those institutions where the EMR lacks this capability there are few freestanding documentation platforms available for purchase. The cost of implementing such a system is high, both for the purchase of additional software and the integration of that software in to the EMR supplied by the primary vendor. Other notable infrastructure costs to consider are ensuring sufficient network connectivity, computers and printers to accommodate increased use that will come with electronic note writing as well as server support for system backups.
Personnel
Engaging the right personnel will smooth the implementation of an electronic discharge summary. In addition to dedicated user training sessions, a physician champion who can promote and monitor user training on the new platform will facilitate prompt implementation. An IT support programmer should work with the physician champion to address concerns and troubleshoot problems. Additional personnel may also be needed to track progress in discharge summary adoption, quality and efficiency. Ideally these personnel can be funneled from those who work transcribing, disseminating and tracking completion of discharge summaries, positions that will be needed in a reduced capacity.
Maintenance
Increased IT infrastructure also means increased IT maintenance and upgrades of servers, network connectivity, computers and printers. Discussions with vendors regarding costs of maintenance, upgrades and add‐on features should be considered when adopting an electronic discharge summary platform.
Conclusion
While many QI initiatives have the potential to improve clinical care, resource limitations and competing priorities necessitate that hospital decision makers see the value of hospitalist driven improvements. A sound business case is the key to successfully influencing decision making and furthering necessary innovations. We have detailed the elements of a business case and applied them to a proposed innovationthe electronic discharge summary. While the cost of multifunctional EMR with full electronic care documentation may be impossible to implement given high initial costs and competing priorities, investing in an e‐discharge solution has real‐time benefits in the impact on patients, system improvements, qualitative benefits, and return on investment. Being able to articulate key qualitative and quantitative elements creates a sound business case that can be applied to QI initiatives in general, and assist hospitalists in garnering support and resources to continue to improve care.
Acknowledgements
The authors acknowledge Kathleen Kerr and the members of the BOOST collaborative for helping with background research and in creating the impetus for this work.
Global payments are fixed‐dollar payments for the care that patients may receive in a given time period, such as a month or year, whereas utilization based payments are payments based on the use of diagnostic and treatment modalities (eg, CT scans and blood cultures).
- ,,, et al.Creating a better discharge summary: Improvement in quality and timeliness using an electronic discharge summary.J Hosp Med.2009;4(4):219–225.
- ,,,,,.Deficits in communication and information transfer between hospital‐based and primary care physicians: implications for patient safety and continuity of care.JAMA.2007;297(8):831–841.
- Standard IM.6.10Hospital Accredidation Standards. In: Oakbrook Terrace,IL:Joint Commission Resources;2006:338–340.
- .Medical Record Services, Section 482.24. In: MacDonald I, ed.The CMS Hospital Conditions of Participation.First edition.United States:Hc Pro Inc.;2005:24–25.
- .Hospital discharge and death communications.Br J Hosp Med.1989;42(1):59–61.
- ,,,.Hospital discharge reports: content and design.Br Med J.1975;4(5994):443–446.
- ,,, et al.Patient safety concerns arising from test results that return after hospital discharge.Ann Intern Med.2005;143(2):121–128.
- .Delayed communication between hospitals and general practitioners: where does the problem lie?BMJ.1988;297(6640):28–29.
- .Study of “discharge communications” from hospital.Br Med J (Clin Res Ed).1986;293(6557):1283–1284.
- ,.Quality assessment of a discharge summary system.CMAJ.1995;152(9):1437–1442.
- ,,,.General practitioner‐hospital communications: a review of discharge summaries.J Qual Clin Pract.2001;21(4):104–108.
- .Stimulus bill spurs plans for rapid IT progress.Manag Care.2009;18(2):5–6.
- ,,, et al. UCSF Notewriter. Copyright Regents of the University of California.2006–year="2010"2010.
- ,,,,.Assessing quality and efficiency of discharge summaries.Am J Med Qual.2005;20(6):337–343.
- ,,,.Standardized or narrative discharge summaries. Which do family physicians prefer?Can Fam Physician.1998;44:62–69.
- ,,,.Standardized or narrative discharge summaries. Which do family physicians prefer?Can Fam Physician.1998;44:62–69.
- ,.What is necessary for high‐quality discharge summaries?Am J Med Qual.1999;14(4):160–169.
- ,,,,.Outpatient physicians' satisfaction with discharge summaries and perceived need for an electronic discharge summary.J Hosp Med.2006;1(5):317–320.
- ,.Are general practitioners satisfied with electronic discharge summaries?HIM J.2007;36(1):7–12.
- ,,,.Dictated versus database‐generated discharge summaries: a randomized clinical trial.CMAJ.1999;160(3):319–326.
- ,,,.Evaluation of computer generated neonatal discharge summaries.Arch Dis Child.1991;66(4 Spec No):433–436.
- ,,,,,.Evaluation of a computer‐generated discharge summary for patients with acute coronary syndromes.Br J Gen Pract.1998;48(429):1163–1164.
- The Common Wealth Fund. Why not the best org. Available at: http/www.whynotthebest.org. Updated 2009. Accessed May2010.
- ,.Pay for performance: an overview of the literature.Am J Med Qual.2009;24(2):140–163.
- ,,, et al.Adverse events among medical patients after discharge from hospital.CMAJ.2004;170(3):345–349.
- ,,,.Effect of discharge summary availability during post‐discharge visits on hospital readmission.J Gen Intern Med.2002;17(3):186–192.
- ,,, et al.Missed and delayed diagnoses in the ambulatory setting: a study of closed malpractice claims.Ann Intern Med.2006;145(7):488–496.
- ,,.Assessing the quality of preparation for posthospital care from the patient's perspective: the care transitions measure.Med Care.2005;43(3):246–255.
- ,,, et al.A reengineered hospital discharge program to decrease rehospitalization: a randomized trial.Ann Intern Med.2009;150(3):178–187.
- ,,,,.Adverse drug events occurring following hospital discharge.J Gen Intern Med.2005;20(4):317–323.
- ,,.Referring physician satisfaction: toward a better understanding of hospital referrals.J Hosp Mark.1998;12(2):95–111.
- U.S. Department of Health 7(3):269–272.
- .IT vulnerabilities highlighted by errors, malfunctions at veterans' medical centers.JAMA.2009;301(9):919–920.
- ,.Copy and paste: a remediable hazard of electronic health records.Am J Med.2009;122(6):495–496.
- ,,,.Are electronic medical records trustworthy? Observations on copying, pasting and duplication.AMIA Annu Symp Proc.2003:269–273.
- ,,, et al.Effects of computerized clinical decision support systems on practitioner performance and patient outcomes: a systematic review.JAMA.2005;293(10):1223–1238.
- ,,, et al.Role of computerized physician order entry systems in facilitating medication errors.JAMA.2005;293(10):1197–1203.
- ,,.The elements of electronic note style.J AHIMA.2003;74(2):68,70.
- ,,,,,.Impacts of computerized physician documentation in a teaching hospital: perceptions of faculty and resident physicians.J Am Med Inform Assoc.2004;11(4):300–309.
- ,,,.The transition to electronic documentation on a teaching hospital medical service.AMIA Annu Symp Proc.2006:629–633.
Delivering the highest possible quality of care is among the top priorities of all medical centers. That said, any quality innovation must be seen as adding value from a variety of perspectives. Especially in the current economic climate, a sound business case is paramount to the advancement of any quality innovation. Given the nature of their work, hospitalists are ideally suited to undertake system improvement innovations. To assist hospitalists in successfully implementing quality and safety initiatives, we have designed a framework of elements required for a business case. We describe our experience developing and implementing an electronic discharge summary and utilize a structured framework to articulate the business case for its implementation.
Defining a Business Case Framework
A business case is a structured proposal outlining the qualitative and quantitative factors that justify a course of action. An effective business case for a quality improvement initiative articulates how both factors are aligned with preexisting organizational goals. In modeling the business case framework for the electronic discharge summary, Figure 1 outlines the qualitative and quantitative costs and benefits that can affect institutional decision making.
Organizational Aims and Financial Impact: Determining Costs and Benefits
Organizational goals drive decision making and resource allocation at all levels. As priorities change with time, understanding which predominate in an organization will be essential to building a business case. Institutions may be more willing to adopt expensive innovations if they are justified by progress toward the qualitative organizational goals. Figure 1 demonstrates several institutional goals both qualitative (provider satisfaction, quality improvement, and institutional reputation) and quantitative (cost avoidance, cost savings, and revenue generation) that could drive the decision making for an electronic discharge summary. After examining how an initiative aligns with institutional aims, the next step is to weigh the benefits against the potential costs. Costs in our example include not only the quantitative financial investment in information technology (IT) infrastructure, personnel and maintenance, but also may include qualitative costs such as loss of staff efficiency and redundant documentation. Costs and savings will be geographically variable and depend on the institutional framework, eg, the existing system for medical records, institutional patient payer mix, type of payment structure (global vs. utilization based*), and reimbursement rates. While it may be impractical to account for every cost and savings resulting from the project implementation, every effort should be made to account for the key variables that make up the cost‐benefit calculation.
The Business Case for an Electronic Discharge Summary at University of California San Francisco (UCSF)
Current State of Discharge Documentation a UCSF
UCSF Medical Center is a 600‐bed quaternary care academic institution that discharges approximately 100 patients per day. Our hospital discharge summary is used to document a patient's hospital course and post discharge plan, information necessary for continued care in the outpatient setting. Literature supports the potential for timely and relevant discharge summaries to improve care transitions, clinician satisfaction, and resource use.1 In 2008, however, the majority of our discharge summaries were completed greater than 14 days post discharge, in accordance with national practice.2 Despite Centers for Medicare & Medicaid Services (CMS) and the Joint Commission discharge summary standards regarding content,3, 4 most discharge summaries are composed using freeform dictation.2 Consequently, discharge summaries often lack critical information,57 and may not reach the correct outpatient provider in a timely manner.5, 811
Our Proposed Solution: E‐Discharge
As hospitals are increasingly implementing electronic medical records (EMR),12 there is a growing opportunity to efficiently and reliably incorporate information from the medical record into electronic or database assisted discharge materials. At UCSF the need to develop a system to document and communicate tests pending at discharge fueled the development of an electronic discharge summary. UCSF's vendor‐supplied EMR lacks the ability to integrate electronic patient data into a progress note or discharge summary in a manner usable for physicians. Instead physicians are required to use a telephone voice dictation system, which is subsequently transcribed to text within 1 to 3 days. A separate software platform tracks attending signature of the transcribed text and automatically triggers dissemination through computerized fax and campus mail. The turnaround time for a discharge summary can be as long as 3 weeks. With the time involved and high cost of implementing new or more sophisticated versions of EMR, we chose to design a solution that would improve care for our patients in a more immediate and cost neutral fashion. Our goal was to create an affordable, electronic, systematized solution to produce both timely and relevant discharge summaries, in the hopes of improving communications with providers and thus patient outcomes.
In earlier work, UCSF developed UCSF Note Writer, a template‐based documentation tool that uses web service to import data from the underlying database for provider documentation.13 As a standardized template has been shown to improve quality of communication to both patients and referring providers,1, 14, 15 we developed a template in UCSF Note Writer with both free text and auto‐populated fields for a discharge summary based on current guidelines.1619 We encouraged the documentation of medication changes, changes in functional status and pending tests.
The adoption of such an electronic format has also been shown to improve the efficiency of discharge documentation over conventional dictation and transcription.1, 2022 While this change may be institution dependent, we employed strategies such as allowing the discharge summary to be initiated and updated throughout the hospital admission and unifying the discharge summary with the last day's progress note to facilitate timeliness. To promote efficiency, we allowed providers to import pertinent labs, microbiology, and in the future, the importation of pending tests. While the electronic format in itself does not promote timeliness, it incorporates the discharge summary into physician daily workflow and enables efficiency in data gathering and transfer. For outpatient providers who can access the EMR, any delay or potential fault in the delivery of the discharge materials is eliminated, while outside providers can receive copies through other rapid and reliable modes of electronic delivery (eg, EMR inbox notification) with an appropriate infrastructure.
Application of the Business Framework to the Case for an Electronic Discharge
Considering the potential improvements in care delivery, the argument for an electronic discharge summary may seem self‐evident. To realize its implementation, however, it is necessary to consider other aspects of organizational decision making. We employed the following structure to articulate a robust and sound business case for e‐discharge.
Qualitative Benefits
Quality and Safety
Publically reported data are often derived from hospital chart abstraction and may impact accreditation, reputation, and pay for performance programs.18, 23, 24 The discharge summary is a readily available source of information regarding discharge medications, patient instruction, and communication regarding pending tests. As such, its quality should be a priority for hospital decision makers. Electronic discharge summaries have the potential to reduce adverse events in the high‐risk post‐hospitalization period.1, 25 As such they may improve outpatient physicians' ability to deliver relevant care, reduce preventable readmissions26 and reduce malpractice vulnerability27all key drivers in organizational decision making.
Patient Satisfaction
Patients want to feel prepared for discharge by understanding the continuity of their care from the hospital to the outpatient setting. Discharge preparedness, commonly queried and reported in national patient satisfaction surveys, is low.28 Many electronic discharge summary platforms allow for translation into tailored patient instructions available to the patient in real time, helping to ensure that patients receive quality discharge education.29
Referring Physician Satisfaction
Poor discharge communication reduces referring physicians' satisfaction, which may discourage them from referring patients to the hospital or organization, having broader financial implications.25, 30 Even for medical centers with a busy emergency department, outpatient physician referrals and recommendations make up over 50% of an institution's admissions.31 An electronic discharge summary available in the EMR at the time of discharge, electronically transmitted to referring providers can impact the referral patterns of community physicians.
Readmission
Now publicly reported, readmission rates are another benchmark by which to judge hospital care.32 Patients with discharge summaries that are unavailable to outpatient providers, a very common occurance,2 have a higher trend toward readmission.26 Improved quality of care at the time of discharge resulting in fewer readmissions will better position hospitals to contend with potential Medicare reforms.
Quantitative Benefits
IT Infrastructure: Transcription, Deficiency Tracking, Dissemination
Hospitals, including UCSF, use internal or external transcriptionists to transcribe dictated recordings into typed text at a substantial cost to large medical centers. Medical records staff also track both discharge summary completion and their dissemination to referring providers in compliance with regulatory mandates.4, 33 The use of electronic documentation that relies on physician‐direct entry and that automates dissemination and tracking of discharge documentation provides a potential cost savings to offset the costs of a new system. UCSF Medical Center discharges 100 patients per day and could conservatively avoid almost $500,000 in transcription costs annually (Text Box 1).34
Text Box 1
UCSF Transcription costs:
Average cost/line for transcribed text: $0.17
Average Lines in a discharge summary: 80
# pts discharged/day: 100
Yearly costs = $496,400
Billing
Delays in completion of discharge summaries result in billing delays when critical information required for coding is in the discharge summary. Deferred payment on long admissions can reach tens of thousands of dollars, representing a significant strain on medical center finances. Comprehensive electronic discharge materials may simplify coding through careful documentation and improve billing efficiency through rapid completion.
At our medical center, approximately 20% of billing is delayed due to incomplete discharge documentation. For a hospital that generates over $1.4 billion dollars in billing revenue per year, this can translate into significant financial losses. Hospitals may have to borrow money or draw from existing resources to cover operative deficits created by a delay in the receipt of large payment. Lenders charge approximately 1% to 2% annual interest rate, which translates into 0.2% to 0.4% in billed costs that the hospital gives away to their lenders. Hospitals would be well served by eliminating delays in billing to improve revenue flow (Text Box 2).
Text Box 2
UCSF Annual revenue: $1.4 Billion
Billing that requires discharge summary completion: 20%
Lender's interest rate: 12%
Lenders interest rate (12%) on delayed billing (20%) = 0.20.4% of total revenue
Assuming a 14 day delay in billing: 0.20.4% of total revenue ($1,400,000,000) for 14/365 days = $107,000$215,000
Qualitative Costs
Efficiency and Physician Time
Implementation of any new system is likely to result in initial diminished efficiency. If patient volume is stable, this may not translate into loss of revenue, but rather cause staff to change their workflow. For example, given the new inefficiency in charting, staff may spend less time on direct patient care tasks (Intravenous Catheter placement, FT placement, patient education, discharge instructions), thus increasing the qualitative costs to implementing the system.
To minimize these costs, we used a step wise phased role out starting with one pilot team, with a plan to expand to multiple teams prior to implementation on the entire medicine service. This allowed for the creation of one central and several ancillary physician champions to troubleshoot the new system to help minimize productivity losses. One of the largest concerns in the switch from voice dictation to physician‐direct entry into an electronic summary is the cost of physician time. System adjustments through several pilots helped ensure that the time investment of a novice user was not significantly greater than time previously spent dictating.
Quality of Documentation
Unanticipated consequences from a switch to an electronic platform must be considered, such as the possibility of longer more redundant discharge summaries. The amount of information available for automated import will vary by institutional preference, but the recipient's access to the EMR, primary physician preference, and technologic capabilities should be considered. At UCSF we made an effort to distill the information most important to subsequent care, disabling the importation of multiple days of radiology data and instead working to create a system for discharge medication importation. As with any electronic document, the medium also lends itself to cutting and pasting, which may lead to anachronistic information carried forward from hospital progress notes earlier in the stay.35, 36 The largest experience with this unintended consequence can be found in the Veteran's Affairs Health System EMR, which found that 9% of progress notes studied contained copied or duplicated text.37 The authors recommended that clear policies, programs to raise practitioner awareness, and the development of monitoring procedure be implemented coincident with electronic note‐writing capabilities.
Quantitative Costs
Quantitative Costs will be highly variable across institutions, geographical areas, and software platforms as the infrastructure of existing EMRs are highly variable. The cost of implementation depends heavily on whether inpatient documentation (and thus discharge documentation) is a feature of an institutional EMR, or whether a stand‐alone discharge documentation infrastructure is needed. An explanation of the differences between these types of EMRs and the importance to the cost of infrastructure implementation is further described in the following section. Rather than providing a direct accounting of costs, we have provided a tabular summary of costs that should be considered with the adoption of an electronic discharge summary based on the type of institutional EMR (Table 1).
| Voice Dictation | E‐Discharge in an EMR With Inpatient Documentation Abilities | E‐Discharge in an EMR Without Inpatient Documentation Abilities | |
|---|---|---|---|
| |||
| Infrastructure | |||
| Software | + | ||
| Hardware (sufficient computers and printers) | + | + | |
| Network connectivity | + | + | |
| Server capacity for system backup | + | + | |
| Interface with current EMR | + | ||
| Personnel | |||
| Physician champion | + | + | |
| Physician training | + | + | |
| Computer programmer | + | + | |
| Transcription | + | ||
| Deficiency tracking | + | ||
| Dissemination | + | ||
| Maintenance | |||
| Computer/printer maintenance | + | + | |
| Network maintenance | + | + | |
| Software add‐ons and updates | + | + | + |
Infrastructure
For most health care organizations, the transition to an EMR includes adoption of results reporting systems and computerized provider order entry; only a more select group of hospitals with a complete EMR electronically document inpatient care (eg, progress notes) through physician direct entry. While there is substantial literature regarding the benefits and pitfalls of adopting computerized order entry (CPOE),38, 39 there is less attention devoted to the costs of implementing large‐scale electronic documentation, including an electronic discharge summary, as opposed to paper notes or dictation.4042 Institutions using an EMR with electronic care documentation capability have already invested in the infrastructure to implement electronic discharge documentation, and can employ it at a modest cost. For these institutions, the infrastructure cost of the transition from paper charting or dictation to direct entry by physicians lies in ensuring sufficient computers and connectivity to handle the increased computer use. On the other hand, for those institutions where the EMR lacks this capability there are few freestanding documentation platforms available for purchase. The cost of implementing such a system is high, both for the purchase of additional software and the integration of that software in to the EMR supplied by the primary vendor. Other notable infrastructure costs to consider are ensuring sufficient network connectivity, computers and printers to accommodate increased use that will come with electronic note writing as well as server support for system backups.
Personnel
Engaging the right personnel will smooth the implementation of an electronic discharge summary. In addition to dedicated user training sessions, a physician champion who can promote and monitor user training on the new platform will facilitate prompt implementation. An IT support programmer should work with the physician champion to address concerns and troubleshoot problems. Additional personnel may also be needed to track progress in discharge summary adoption, quality and efficiency. Ideally these personnel can be funneled from those who work transcribing, disseminating and tracking completion of discharge summaries, positions that will be needed in a reduced capacity.
Maintenance
Increased IT infrastructure also means increased IT maintenance and upgrades of servers, network connectivity, computers and printers. Discussions with vendors regarding costs of maintenance, upgrades and add‐on features should be considered when adopting an electronic discharge summary platform.
Conclusion
While many QI initiatives have the potential to improve clinical care, resource limitations and competing priorities necessitate that hospital decision makers see the value of hospitalist driven improvements. A sound business case is the key to successfully influencing decision making and furthering necessary innovations. We have detailed the elements of a business case and applied them to a proposed innovationthe electronic discharge summary. While the cost of multifunctional EMR with full electronic care documentation may be impossible to implement given high initial costs and competing priorities, investing in an e‐discharge solution has real‐time benefits in the impact on patients, system improvements, qualitative benefits, and return on investment. Being able to articulate key qualitative and quantitative elements creates a sound business case that can be applied to QI initiatives in general, and assist hospitalists in garnering support and resources to continue to improve care.
Acknowledgements
The authors acknowledge Kathleen Kerr and the members of the BOOST collaborative for helping with background research and in creating the impetus for this work.
Global payments are fixed‐dollar payments for the care that patients may receive in a given time period, such as a month or year, whereas utilization based payments are payments based on the use of diagnostic and treatment modalities (eg, CT scans and blood cultures).
- ,,, et al.Creating a better discharge summary: Improvement in quality and timeliness using an electronic discharge summary.J Hosp Med.2009;4(4):219–225.
- ,,,,,.Deficits in communication and information transfer between hospital‐based and primary care physicians: implications for patient safety and continuity of care.JAMA.2007;297(8):831–841.
- Standard IM.6.10Hospital Accredidation Standards. In: Oakbrook Terrace,IL:Joint Commission Resources;2006:338–340.
- .Medical Record Services, Section 482.24. In: MacDonald I, ed.The CMS Hospital Conditions of Participation.First edition.United States:Hc Pro Inc.;2005:24–25.
- .Hospital discharge and death communications.Br J Hosp Med.1989;42(1):59–61.
- ,,,.Hospital discharge reports: content and design.Br Med J.1975;4(5994):443–446.
- ,,, et al.Patient safety concerns arising from test results that return after hospital discharge.Ann Intern Med.2005;143(2):121–128.
- .Delayed communication between hospitals and general practitioners: where does the problem lie?BMJ.1988;297(6640):28–29.
- .Study of “discharge communications” from hospital.Br Med J (Clin Res Ed).1986;293(6557):1283–1284.
- ,.Quality assessment of a discharge summary system.CMAJ.1995;152(9):1437–1442.
- ,,,.General practitioner‐hospital communications: a review of discharge summaries.J Qual Clin Pract.2001;21(4):104–108.
- .Stimulus bill spurs plans for rapid IT progress.Manag Care.2009;18(2):5–6.
- ,,, et al. UCSF Notewriter. Copyright Regents of the University of California.2006–year="2010"2010.
- ,,,,.Assessing quality and efficiency of discharge summaries.Am J Med Qual.2005;20(6):337–343.
- ,,,.Standardized or narrative discharge summaries. Which do family physicians prefer?Can Fam Physician.1998;44:62–69.
- ,,,.Standardized or narrative discharge summaries. Which do family physicians prefer?Can Fam Physician.1998;44:62–69.
- ,.What is necessary for high‐quality discharge summaries?Am J Med Qual.1999;14(4):160–169.
- ,,,,.Outpatient physicians' satisfaction with discharge summaries and perceived need for an electronic discharge summary.J Hosp Med.2006;1(5):317–320.
- ,.Are general practitioners satisfied with electronic discharge summaries?HIM J.2007;36(1):7–12.
- ,,,.Dictated versus database‐generated discharge summaries: a randomized clinical trial.CMAJ.1999;160(3):319–326.
- ,,,.Evaluation of computer generated neonatal discharge summaries.Arch Dis Child.1991;66(4 Spec No):433–436.
- ,,,,,.Evaluation of a computer‐generated discharge summary for patients with acute coronary syndromes.Br J Gen Pract.1998;48(429):1163–1164.
- The Common Wealth Fund. Why not the best org. Available at: http/www.whynotthebest.org. Updated 2009. Accessed May2010.
- ,.Pay for performance: an overview of the literature.Am J Med Qual.2009;24(2):140–163.
- ,,, et al.Adverse events among medical patients after discharge from hospital.CMAJ.2004;170(3):345–349.
- ,,,.Effect of discharge summary availability during post‐discharge visits on hospital readmission.J Gen Intern Med.2002;17(3):186–192.
- ,,, et al.Missed and delayed diagnoses in the ambulatory setting: a study of closed malpractice claims.Ann Intern Med.2006;145(7):488–496.
- ,,.Assessing the quality of preparation for posthospital care from the patient's perspective: the care transitions measure.Med Care.2005;43(3):246–255.
- ,,, et al.A reengineered hospital discharge program to decrease rehospitalization: a randomized trial.Ann Intern Med.2009;150(3):178–187.
- ,,,,.Adverse drug events occurring following hospital discharge.J Gen Intern Med.2005;20(4):317–323.
- ,,.Referring physician satisfaction: toward a better understanding of hospital referrals.J Hosp Mark.1998;12(2):95–111.
- U.S. Department of Health 7(3):269–272.
- .IT vulnerabilities highlighted by errors, malfunctions at veterans' medical centers.JAMA.2009;301(9):919–920.
- ,.Copy and paste: a remediable hazard of electronic health records.Am J Med.2009;122(6):495–496.
- ,,,.Are electronic medical records trustworthy? Observations on copying, pasting and duplication.AMIA Annu Symp Proc.2003:269–273.
- ,,, et al.Effects of computerized clinical decision support systems on practitioner performance and patient outcomes: a systematic review.JAMA.2005;293(10):1223–1238.
- ,,, et al.Role of computerized physician order entry systems in facilitating medication errors.JAMA.2005;293(10):1197–1203.
- ,,.The elements of electronic note style.J AHIMA.2003;74(2):68,70.
- ,,,,,.Impacts of computerized physician documentation in a teaching hospital: perceptions of faculty and resident physicians.J Am Med Inform Assoc.2004;11(4):300–309.
- ,,,.The transition to electronic documentation on a teaching hospital medical service.AMIA Annu Symp Proc.2006:629–633.
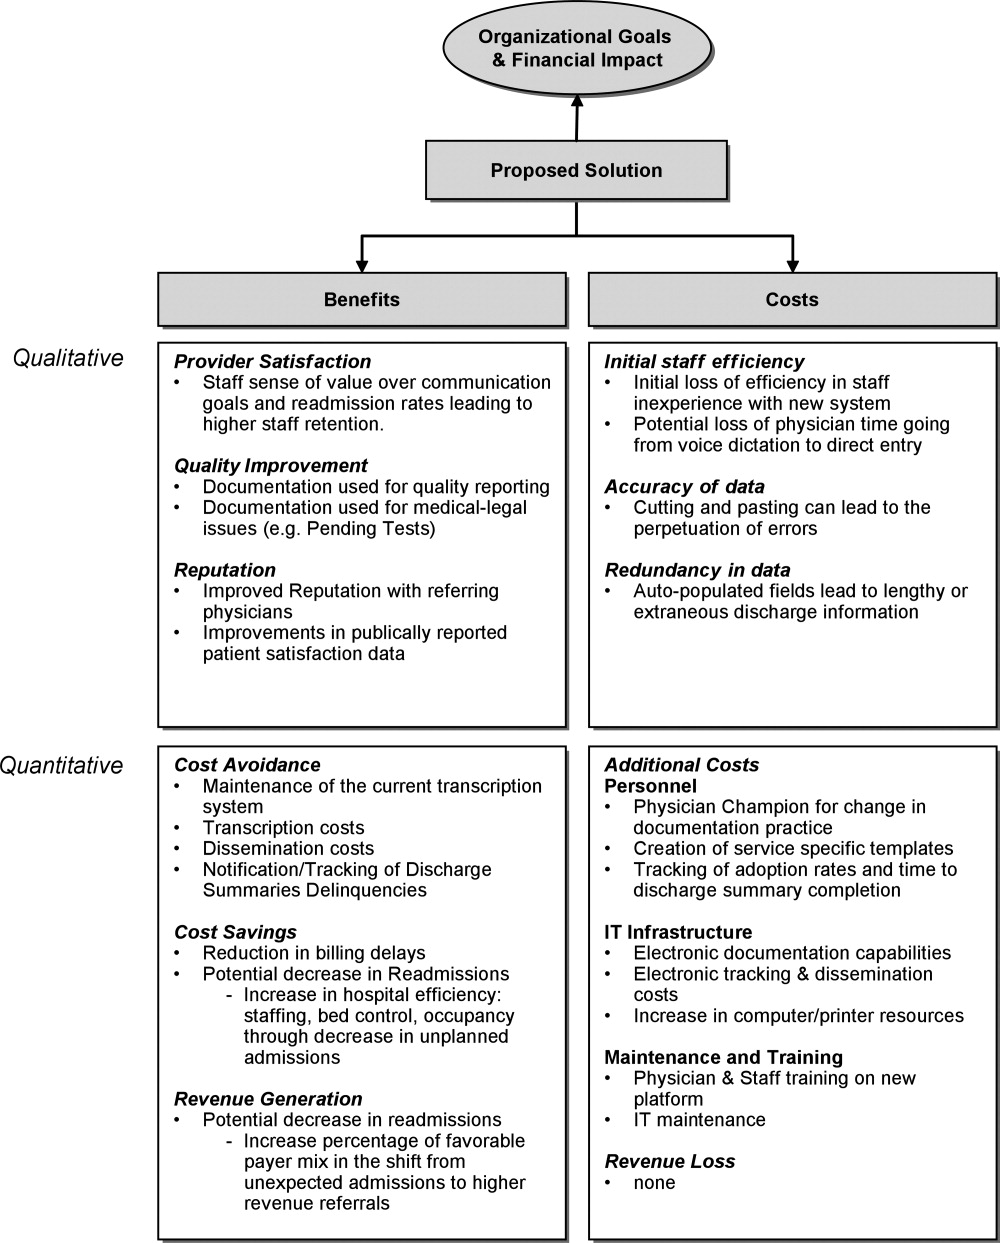
New Quality Target: Depression
Hospitalists might be able to help reduce their institutions' readmission rate by adding in targeted screenings for depressive symptoms, according to the author of a study in this month’s Journal of Hospital Medicine.
The report found that patients surveyed with said symptoms had a higher rate of readmission at 30 days after discharge (0.563 vs. 0.296) (DOI: 10.1002/jhm.673). Similar data were found at both 60 and 90 days after discharge.
Suzanne Mitchell, MD, MS, an instructor at Boston University School of Medicine/Boston Medical Center and one of the authors of the study, thinks the work should be a first step toward creating transitional-care programs that target depressive symptoms. “If we just screen and have nothing to offer, we’re not really helping patients out,” Dr. Mitchell says. “It’s an important piece to have some kind of program available to help bridge the transition process.”
Dr. Mitchell says that as more research associates depression with readmission rates, HM leaders will begin to see the value in creating programs to better communicate with patients about it. Ideas include follow-up phone calls with a PCP to discuss mental-health support options.
She adds that while hospitalists taking patient histories might glean information about depressive symptoms, HM groups can consider more targeted questions to determine a patient’s risk.
“Being able to open that conversation and having it on your radar is very important,” Dr. Mitchell says. “I find that if I don’t open the conversation, it doesn’t happen. But once I do, the patient is open to disclosing.”
In the Literature: Research You Need to Know
Clinical question: Does the incorporation of bar-code verification technology within an electronic medication-administration system (eMAR) reduce the rate of medication errors?
Background: More than a fourth of medication-related inpatient adverse events are due to errors. Bar-code verification technology reduces the incidence of such errors; however, the quantitative effect of implementing such technology is unknown.
Study design: Before-and-after quasi-experimental study.
Setting: Single academic tertiary-care medical center in Boston.
Synopsis: Investigators directly observed 14,041 medication administrations in patient units that did and did not have bar-code eMAR. They reported a 41.4% relative reduction (RR) in medication administration errors (11.5% error rate before versus 6.8% after adoption of this technology) and 50.8% RR in the rate of potential adverse drug events (3.1% versus 1.6%). Significant reductions in wrong medication, dose, and administration documentation errors were noted. Order transcription errors were completely eliminated (6% versus 0%). Although errors in medication administration timing fell by 27.3%, no significant difference in the number of potential adverse events related to timing errors was found.
The investigators estimated that approximately 145,000 potential adverse drug events would be prevented from amongst an annual 1.69 million medication orders.
Pre-existent computerized physician order entry and bar-code verification technology in the pharmacy at the study hospital might limit the generalization of these results. Additionally, potential, not actual, adverse drug events were reported. Lastly, the study compared early implementers with late implementers.
Bottom line: Bar-code verification technology substantially reduced the number of medication administration errors and associated adverse drug events and completely eliminated the occurrence of transcription errors.
Citation: Poon EG, Keohane CA, Yoon CS, et al. Effect of bar-code technology on the safety of medication administration. N Engl J Med. 2010;362(18):1698-1707.
Reviewed for TH eWire by Robert Chang, MD, Anita Hart, MD, Hae-won Kim, MD, Robert Paretti, MD, Helena Pasieka, MD, and Matt Smitherman, MD, University of Michigan, Ann Arbor.
For more physician reviews of HM-related research, visit our website.
Safety of Inferior Vena Cava Filters Questioned
An Archives of Internal Medicine report and a U.S. Food and Drug Administration (FDA) advisory that question the long-term safety of inferior vena cava (IVC) filters should give hospitalists pause, one HM leader says.
The Aug. 9 report (PDF) found that the Bard Recovery and Bard G2 filters “had high prevalences of fracture and embolization, with potentially life-threatening sequelae." An FDA advisory issued the same day as the study cautioned that retrievable filters are not always removed from patients once the risk of pulmonary embolism (PE) has subsided, further increasing the risks.
“We’re going to be thinking more than twice before we recommend when these filters are placed in and then thinking twice about when we get them out,” says Shaker Eid, MD, an instructor of medicine at Johns Hopkins University School of Medicine in Baltimore.
Dr. Eid, however, cautions HM leaders about being too fearful of the data. The Archives report, he notes, was a single-center study. And while the FDA reports that the use of filters grew exponentially from 1979 to 2007, new American College of Chest Physicians guidelines from 2008 have limited their use mostly to patients who cannot receive anticoagulation treatments, Dr. Eid notes.
In cases in which they are necessary to implant, or in instances in which a patient already has a permanent IVC filter implanted, Dr. Eid recommends hospitalists be diligent in working with the filter.
Hospitalists in the Developing World
Could U.S. hospitals learn from how HM is practiced in developing nations such as Ecuador? David Gaus, MD, MS, founder and director of Andean Health and Development (AHD), thinks so.
Dr. Gaus, who spends half the year as assistant clinical professor of medicine and teaching hospitalist at the University of Wisconsin and the other half with AHD in Ecuador, was inspired to pursue a medical degree by doing development work in Ecuador. When he returned to Ecuador in 1995 to be a doctor to the poor, he discovered a major gap in the healthcare system, between undertrained rural PCPs and the specialist-heavy medical practice in the country’s capital of Quito.
Under his leadership, AHD established a hospital in the rural community of Pedro Vicente Maldonado; it opened in 2000 and now is financially self-sufficient. “The focus was on the need for cost-effective, high-quality hospital services in a country with a dearth of hospitals,” he says.
At the hospital, family-practice physicians serve as hospitalists and deal with a wide spectrum of clinical needs ranging from car accidents and complicated pregnancies to snake bites and toxic organic phosphate herbicide exposure.
“Rural hospitals can’t afford five or six types of attendings, but if you have well-trained family practitioners backed by a general surgeon, they can handle most of the spectrum of clinical needs and the chaos management,” he says. Increasingly, those clinical needs include such chronic degenerative diseases as diabetes, hypertension, and arthritis, for which Ecuador’s cadre of rural PCPs are not trained.
Dr. Gaus is planning a second hospital in the larger Ecuadorean city of Santo Domingo (population 400,000), with the support of the Ministry of Public Health and the Social Security system. The new facility, using the same model and hospitalist roles, will open in 12 to 18 months and will increase the number of three-year family-practice residency slots from six to 20.
Sensitivity of Superficial Wound Culture
While a general consensus exists that surface wound cultures have less utility than deeper cultures, surface cultures are nevertheless routinely used to guide empiric antibiotic administration. This is due in part to the ease with which surface cultures are obtained and the delay in obtaining deeper wound and bone cultures. The Infectious Diseases Society of America (IDSA) recommends routine culture of all diabetic infections before initiating empiric antibiotic therapy, despite caveats regarding undebrided wounds.1 Further examination of 2 additional societies, the European Society of Clinical Microbiology and Infectious Diseases and the Australasian Society for Infectious Diseases, reveals that they also do not describe guidelines on the role of surface wound cultures in skin, and skin structure infection (SSSI) management.2, 3
Surface wound cultures are used to aid in diagnosis and appropriate antibiotic treatment of lower extremity foot ulcers.4 Contaminated cultures from other body locations have shown little utility and may be wasteful of resources.5, 6 We hypothesize that given commensal skin flora, coupled with the additional flora that colonizes (chronic) lower extremity wounds, surface wound cultures provide poor diagnostic accuracy for determining the etiology of acute infection. In contrast, many believe that deep tissue cultures obtained at time of debridement or surgical intervention may provide more relevant information to guide antibiotic therapy, thus serving as a gold standard.13, 7, 8 Nevertheless, with the ease of obtaining these superficial cultures and the promptness of the results, surface wound cultures are still used as a surrogate for the information derived from deeper cultures.
Purpose
The frequency at which superficial wound cultures correlate with the data obtained from deeper cultures is needed to interpret the posttest likelihood of infection. However, the sensitivity and specificity of superficial wound culture as a diagnostic test is unclear. The purpose of this study is to conduct a systematic review of the existing literature in order to investigate the relationship between superficial wound cultures and the etiology of SSSI. Accordingly, we aim to describe any role that surface wound cultures may play in the treatment of lower extremity ulcers.
Materials and Methods
Data Sources
We identified eligible articles through an electronic search of the following databases: Medline through PubMed, Excerpta Medica Database (EMBASE), Cumulative Index of Nursing and Allied Health Literature (CINAHL), and Scopus. We also hand searched the reference lists of key review articles identified by the electronic search and the reference lists of all eligible articles (Figure 1).

Study Selection
The search strategy was limited to English articles published between January 1960 and August 2009. A PubMed search identified titles that contained the following keywords combined with OR: surface wound cultures, extremity ulcer, leg ulcer, foot ulcer, superficial ulcer, Ulcer [MeSH], deep tissue, superficial swab, soft tissue infection, Wounds and Injuries [MeSH], wound swab, deep swab, diabetic ulcer, Microbiology [MeSH], Microbiological Techniques [MeSH]. Medical Subject Headings [MeSH] were used as indicated and were exploded to include subheadings and maximize results. This search strategy was adapted to search the other databases.
Data Extraction
Eligible studies were identified in 2 phases. In the first phase, 2 authors (AY and CC) independently reviewed potential titles of citations for eligibility. Citations were returned for adjudication if disagreement occurred. If agreement could not be reached, the article was retained for further review. In the second phase, 2 authors (AY and CC) independently reviewed the abstracts of eligible titles. In situations of disagreement, abstracts were returned for adjudication and if necessary were retained for further review. Once all eligible articles were identified, 2 reviewers (AY and CL) independently abstracted the information within each article using a pre‐defined abstraction tool. A third investigator (CC) reviewed all the abstracted articles for verification.
We initially selected articles that involved lower extremity wounds. Articles were included if they described superficial wound cultures along with an alternative method of culture for comparison. Alternative culture methods were defined as cultures derived from needle aspiration, wound base biopsy, deep tissue biopsy, surgical debridement, or bone biopsy. Further inclusion criteria required that articles have enough microbiology data to calculate sensitivity and specificity values for superficial wound swabs.
For the included articles, 2 reviewers (AY, CC) abstracted information pertaining to microbiology data from superficial wound swabs and alternative comparison cultures as reported in each article in the form of mean number of isolates recovered. Study characteristics and patient demographics were also recorded.
When not reported in the article, calculation of test sensitivity and specificity involved identifying true and false‐positive tests as well as true and false‐negative tests. Articles were excluded if they did not contain sufficient data to calculate true/false‐positive and true/false‐negative tests. For all articles, we used the formulae [(sensitivity) (1‐specificity)] and [(1‐sensitivity) (specificity)] to calculate positive and negative likelihood ratios (LRs), respectively.
Data Synthesis and Statistical Analysis
Test sensitivity, specificity, positive and negative LR from all articles were pooled using a random‐effects meta‐analysis model (DerSimonian and Laird method). This method considers heterogeneity both within and between studies to calculate the range of possible true effects.9 For situations in which significant heterogeneity is anticipated, the random‐effects model is most conservative and appropriate.9, 10
We also compared the mean number of organisms isolated from wound cultures to the mean number of organisms isolated from alternative culture methods using the nonparametric Wilcoxon rank sum test. Inter‐rater reliability was assessed using the kappa statistic. We assessed potential publication bias by visually examining a funnel plot as described by Egger et al.11 We report 95% confidence intervals, medians with interquartile ranges, and p‐values where appropriate. All data analyses were performed using Stata 9.2 (STATA Corporation, College Station, TX, 2007).
Results
Of 9032 unique citations, eight studies met all inclusion criteria (Figure 1). Inter‐rater reliability was substantial (Kappa = 0.78).12 Areas of initial disagreement generally involved whether a study adequately described an appropriate alternative culture method for comparison or whether data available in an article was sufficient for sensitivity and specificity calculation. Consensus was achieved once the full article was retrieved, reviewed and discussed.
The 8 studies evaluated in the review included a total number of 615 patients or samples (Table 1). Diabetic wounds were described in four studies.1316 Two studies described wounds associated with peripheral vascular disease,13, 17 while four involved traumatic wounds.13, 1719 One study did not identify the clinical circumstances concerning the wounds.20
| Study ID | n | Sensitivity | Specificity | Positive LR | Negative LR |
|---|---|---|---|---|---|
| |||||
| Machowiak et al. (1978)17 | 183* | 0.26 | 0.56 | 0.59 | 1.32 |
| Sharp et al. (1979)15 | 58 | 0.53 | 0.62 | 1.38 | 0.77 |
| Wheat et al. (1986)16 | 26 | 0.35 | 0.32 | 0.51 | 2.06 |
| Zuluaga et al. (2006)19 | 100 | 0.20 | 0.67 | 0.60 | 1.20 |
| Zuluaga et al. (2002)18 | 50 | 0.22 | 0.54 | 0.47 | 1.45 |
| Gardner et al. (2007)13 | 83 | 0.90 | 0.57 | 2.09 | 0.18 |
| Slater et al. (2004)14 | 60 | 0.93 | 0.96 | 23.3 | 0.07 |
| Mousa (1997)20 | 55 | 0.89 | 0.96 | 20.6 | 0.12 |
| Pooled values (95% CI) | 0.49 (0.37‐0.61) | 0.62 (0.51‐0.74) | 1.1 (0.71‐1.5) | 0.67 (0.52‐0.82) | |
The studies used several different methods for obtaining superficial cultures. Six studies obtained purulent wound drainage material through the application of sterile swabs.1316, 18, 19 One study obtained purulent drainage material using needle aspiration.18 Two studies obtained culture material from sinus tracts associated with the wounds, one through sinus tract washings17 and another by obtaining sinus tract discharge material.20
The types of comparison cultures used were equally divided between deep tissue biopsies1316 and bone biopsies,1720 each accounting for 50% (4 of 8) of studies.
In assessing the data from the eight studies, the pooled test sensitivity for superficial wound swabs was 49% (95% confidence interval [CI], 37‐61%) (Figure 2). The pooled specificity for superficial wound swabs was 62% (95% CI, 51‐74%), while the pooled positive and negative LRs were 1.1 (95% CI, 0.71‐1.5) and 0.67 (95% CI, 0.52‐0.82), respectively (Figure 2).

The median number of bacterial isolates reported for each culture type, superficial and comparison culture, was collected from each study (Table 2). The median value for number of bacterial isolates identified by superficial culture was 2.7 (interquartile range [IQR] 1.8‐3.2). The median value for number of bacterial isolates identified by comparison culture was 2.2 (IQR 1.7‐2.9). A Wilcoxon rank sum analysis showed that the number of isolates for surface wound cultures was not significantly different than the number of isolates for comparison cultures (P = 0.75) (Table 1).
| Study ID | # of Isolates (Swab) | # of Isolates (Comparison) | Prior Antibiotics? |
|---|---|---|---|
| |||
| Machowiak et al. (1978)17 | * | * | Treated, but details not reported |
| Sharp et al. (1979)15 | 2.3 | 2.2 | Treated, but details not reported |
| Wheat et al. (1986)16 | 3.3 | 3.4 | Not described |
| Zuluaga et al. (2006)19 | 1.3 | 1.6 | Antibiotics stopped 48 hours prior |
| Zuluaga et al. (2002)18 | 1.1 | 1.4 | 52% on antibiotics, stopped 48 hours prior |
| Gardner et al. (2007)13 | 3.0 | 3.1 | 42% on antibiotics |
| Slater et al. (2004)14 | 2.7 | 2.5 | 27% on prior antibiotics |
| Mousa (1997)20 | 3.6 | 1.9 | Treated, but details not reported |
| Median (IQR) | 2.7 (1.8‐3.2) | 2.2 (1.7‐2.9) | |
Discussion
In performing this review, we discovered ambiguity in the literature regarding the utility of surface wound cultures. Some studies obtained findings to suggest the utility of surface wound cultures,8, 14, 17 while other studies in our review16, 18, 19 provided evidence against them. This variability confirmed the need for a meta‐analytic approach as provided by this review.
While we have tried to minimize bias through a well‐established methodology, we acknowledge that certain methodological limitations should be considered in interpreting the results. There may be publication bias in reviews that include only published articles; a funnel plot of sensitivity vs. sample size showed some asymmetry, suggesting bias. Our search strategy was limited to English‐only articles, which may result in publication bias.
Further, this review included a group of studies that were heterogeneous in several regards. Differences exist in culturing methods and laboratory technology, as exemplified by the variety of superficial culture methods used. We were not able to account for these laboratory differences, as methodologies in obtaining and isolating bacteria were not uniformly well described.
Additionally, the studies classified organisms in different ways. Three studies categorized organisms according to Gram's stain characteristics.13, 16, 18 One study described organisms primarily in terms of aerobic or anaerobic respiration.15 Two studies14, 19 discussed pathogens both in terms of respiration (aerobic/anaerobic) and Gram's stain characteristic, while another 2 studies17, 20 did not describe organisms in either terms. These inconsistencies limited our ability to provide sensitivity and specificity information for specific subclasses of organisms.
The clinical conditions in each study surrounding the wounds were also heterogeneous: most significantly in the issue of prior antibiotic administration. All but 1 study16 indicated that the patients had received antibiotics prior to having cultures obtained. The type of antibiotics (narrow‐spectrum or broad‐spectrum), the route of administration, and the cessation of antibiotics in relation to obtaining swabs and cultures all varied widely or were not well described. This degree of ambiguity will necessarily impact both the reliability of data regarding microbial growth as well as the component flora.
The inclusion of higher quality studies is likely to result in a more reliable meta‐analysis.21 We had hoped that antibiotic trials would contain uniform outcomes and thus strengthen our meta‐analysis through the inclusion of randomized‐controlled studies. Unfortunately, the majority of antibiotic trials did not use superficial wound cultures, did not report mean number of isolates, or did not provide microbiological data in sufficient detail to calculate concordance ratesand therefore, did not meet eligibility criteria. Randomized‐controlled trials were a minority among our included articles; the majority of study designs were retrospective cohorts and case‐controlled studies.
Despite these limitations, we were able to conclude that superficial wound culture provides mediocre sensitivity (49%) and specificity (62%). The positive LR of 1.1 is unhelpful in decision making, having a CI that includes 1. Interestingly, the negative LR of 0.67 could be somewhat helpful in medical decision making, modifying the pretest probability and assisting in ruling out a deeper bacterial infection. Although, according to Fagan's nomogram, a negative LR of 0.67 has only a mild effect on pretest odds.22
The bacterial bioburden assessed by the number of isolates obtained by culture method serves as a proxy for reliability of culture results14, 23 by suggesting that fewer organisms isolated from deep tissue or bone samples reflects a less contaminated specimen. Our assessment of the bioburden found that the median number of isolates was slightly higher in surface cultures than deeper cultures, though not to a significant degree (P = 0.75). This indicates that the degree of contamination in superficial cultures was neither significantly worse nor better than deep cultures.
We attempted to define a role for surface wound cultures; however, we found that these did not show any greater utility than deep cultures for identifying the microbiologic etiology of diabetic wound infections. While the negative LR provides some quantitative verification of the common clinical practice that a negative culture argues against infection, the finding is not especially robust.
Although for this meta‐analysis we grouped all organisms in the same way, we recognize that the sensitivity and specificity may differ according to various subclasses of bacteria. Interpretations of culture results also vary (eg, Gram positive vs. negative; aerobic vs. anaerobic); practitioners will not interpret superficial cultures of coagulase‐negative Staphylococcus in the same way as Pseudomonas. However, this study seeks to establish a reasonable starting point for the medical decision‐making process by providing quantitative values in an area with previously conflicting data. We anticipate that as laboratory techniques improve and research into superficial wounds continues, greater sensitivity of superficial wound cultures will result.
Ultimately, physicians use culture data to target therapy in an effort to use the least toxic and most effective antimicrobial agent possible to successfully treat infections. Clinical outcomes were not described in all included articles; in those that did, the endpoints were too dissimilar for meaningful comparison. Limiting our review to studies reporting treatment outcomes would have resulted in too few included studies. Thus, we were unable able to assess whether superficial wound cultures were associated with improved patient‐oriented outcomes in this meta‐analysis.
There is a significant paucity of trials evaluating the accurate concordance of superficial swabs to deep tissue culture. The current data shows poor sensitivity and specificity of superficial culture methods. The presumption that deeper cultures (such as a bone biopsy) should result in a less contaminated sample and more targeted culture results was also not borne out in our review. When presented with a patient with a wound infection, physicians mentally supply a pretest (or a pretreatment) probability as to the microbiologic etiology of the infection. Careful history will, of course, be critical in identifying extenuating circumstance or unusual exposures. From our meta‐analysis, we cannot recommend the routine use of superficial wound cultures to guide initial antibiotic therapy as this may result in poor resource utilization.5 While clinical outcomes from the use of routine superficial cultures are unclear, we suggest greater use of local antibiograms and methicillin‐resistant Staphylococcus aureus (MRSA) prevalence data to determine resistance patterns and guide the selection of empiric therapies.
- ,,, et al.Diagnosis and treatment of diabetic foot infections.Clin Infect Dis.2004;39:885–910.
- AASID,Australasian Society for Infectious Diseases—Standards, Practice Guidelines (Skin and Soft Tissue Infections): Institute for Safe Medication Practices;2006.
- ESCMID,European Society of Clinical Microbiology 2006.
- ,,,.Methicillin‐resistant Staphylococcus aureus in community‐acquired skin infections.Emerg Infect Dis.2005;11:928–930.
- ,,.Contaminant blood cultures and resource utilization. The true consequences of false‐positive results.JAMA.1991;265:365–369.
- ,,,,,.Cost‐effectiveness of blood cultures for adult patients with cellulitis.Clin Infect Dis.1999;29:1483–1488.
- ,,,,,.Managing skin and soft tissue infections: expert panel recommendations on key decision points.J Antimicrob Chemother.2003;52 Suppl 1:i3‐i17.
- ,,, et al.Deep tissue biopsy vs. superficial swab culture monitoring in the microbiological assessment of limb‐threatening diabetic foot infection.Diabet Med.2001;18:822–827.
- ,.Meta‐analysis in clinical trials.Control Clin Trials.1986;7:177–188.
- ,,.Quantitative synthesis in systematic reviews.Ann Intern Med.1997;127:820–826.
- ,,,.Bias in meta‐analysis detected by a simple, graphical test.BMJ.1997;315:629–634.
- .Practical statistics for medical research.London, UK:Chapman 1991:403–409.
- ,,,,,.Diagnostic validity of three swab techniques for identifying chronic wound infection.Wound Repair Regen.2006;14(5):548–57.
- ,,, et al.Swab cultures accurately identify bacterial pathogens in diabetic foot wounds not involving bone.Diabet Med.2004;21:705–709.
- ,,,,.Microbiology of superficial and deep tissues in infected diabetic gangrene.Surg Gynecol Obstet.1979;149:217–219.
- ,,, et al.Diabetic foot infections. Bacteriologic analysis.Arch Intern Med.1986;146:1935–1940.
- ,,.Diagnostic value of sinus‐tract cultures in chronic osteomyelitis.JAMA.1978;239:2772–2775.
- ,,,.Lack of microbiological concordance between bone and non‐bone specimens in chronic osteomyelitis: an observational study.BMC Infect Dis.2002;2:8.
- ,,,,,.Etiologic diagnosis of chronic osteomyelitis: a prospective study.Arch Intern Med.2006;166:95–100.
- .Evaluation of sinus‐track cultures in chronic bone infection.J Bone Joint Surg Br.1997;79:567–569.
- ,,, et al.Meta‐analysis of observational studies in epidemiology: a proposal for reporting.JAMA.2000;283:2008–2012.
- ,Letter: nomogram for Bayes theorem.N Engl J Med.1975;293:257.
- ,,,,,.Quantitative swab culture versus tissue biopsy: a comparison in chronic wounds.Ostomy Wound Manage.2001;47:34–37.
While a general consensus exists that surface wound cultures have less utility than deeper cultures, surface cultures are nevertheless routinely used to guide empiric antibiotic administration. This is due in part to the ease with which surface cultures are obtained and the delay in obtaining deeper wound and bone cultures. The Infectious Diseases Society of America (IDSA) recommends routine culture of all diabetic infections before initiating empiric antibiotic therapy, despite caveats regarding undebrided wounds.1 Further examination of 2 additional societies, the European Society of Clinical Microbiology and Infectious Diseases and the Australasian Society for Infectious Diseases, reveals that they also do not describe guidelines on the role of surface wound cultures in skin, and skin structure infection (SSSI) management.2, 3
Surface wound cultures are used to aid in diagnosis and appropriate antibiotic treatment of lower extremity foot ulcers.4 Contaminated cultures from other body locations have shown little utility and may be wasteful of resources.5, 6 We hypothesize that given commensal skin flora, coupled with the additional flora that colonizes (chronic) lower extremity wounds, surface wound cultures provide poor diagnostic accuracy for determining the etiology of acute infection. In contrast, many believe that deep tissue cultures obtained at time of debridement or surgical intervention may provide more relevant information to guide antibiotic therapy, thus serving as a gold standard.13, 7, 8 Nevertheless, with the ease of obtaining these superficial cultures and the promptness of the results, surface wound cultures are still used as a surrogate for the information derived from deeper cultures.
Purpose
The frequency at which superficial wound cultures correlate with the data obtained from deeper cultures is needed to interpret the posttest likelihood of infection. However, the sensitivity and specificity of superficial wound culture as a diagnostic test is unclear. The purpose of this study is to conduct a systematic review of the existing literature in order to investigate the relationship between superficial wound cultures and the etiology of SSSI. Accordingly, we aim to describe any role that surface wound cultures may play in the treatment of lower extremity ulcers.
Materials and Methods
Data Sources
We identified eligible articles through an electronic search of the following databases: Medline through PubMed, Excerpta Medica Database (EMBASE), Cumulative Index of Nursing and Allied Health Literature (CINAHL), and Scopus. We also hand searched the reference lists of key review articles identified by the electronic search and the reference lists of all eligible articles (Figure 1).
Study Selection
The search strategy was limited to English articles published between January 1960 and August 2009. A PubMed search identified titles that contained the following keywords combined with OR: surface wound cultures, extremity ulcer, leg ulcer, foot ulcer, superficial ulcer, Ulcer [MeSH], deep tissue, superficial swab, soft tissue infection, Wounds and Injuries [MeSH], wound swab, deep swab, diabetic ulcer, Microbiology [MeSH], Microbiological Techniques [MeSH]. Medical Subject Headings [MeSH] were used as indicated and were exploded to include subheadings and maximize results. This search strategy was adapted to search the other databases.
Data Extraction
Eligible studies were identified in 2 phases. In the first phase, 2 authors (AY and CC) independently reviewed potential titles of citations for eligibility. Citations were returned for adjudication if disagreement occurred. If agreement could not be reached, the article was retained for further review. In the second phase, 2 authors (AY and CC) independently reviewed the abstracts of eligible titles. In situations of disagreement, abstracts were returned for adjudication and if necessary were retained for further review. Once all eligible articles were identified, 2 reviewers (AY and CL) independently abstracted the information within each article using a pre‐defined abstraction tool. A third investigator (CC) reviewed all the abstracted articles for verification.
We initially selected articles that involved lower extremity wounds. Articles were included if they described superficial wound cultures along with an alternative method of culture for comparison. Alternative culture methods were defined as cultures derived from needle aspiration, wound base biopsy, deep tissue biopsy, surgical debridement, or bone biopsy. Further inclusion criteria required that articles have enough microbiology data to calculate sensitivity and specificity values for superficial wound swabs.
For the included articles, 2 reviewers (AY, CC) abstracted information pertaining to microbiology data from superficial wound swabs and alternative comparison cultures as reported in each article in the form of mean number of isolates recovered. Study characteristics and patient demographics were also recorded.
When not reported in the article, calculation of test sensitivity and specificity involved identifying true and false‐positive tests as well as true and false‐negative tests. Articles were excluded if they did not contain sufficient data to calculate true/false‐positive and true/false‐negative tests. For all articles, we used the formulae [(sensitivity) (1‐specificity)] and [(1‐sensitivity) (specificity)] to calculate positive and negative likelihood ratios (LRs), respectively.
Data Synthesis and Statistical Analysis
Test sensitivity, specificity, positive and negative LR from all articles were pooled using a random‐effects meta‐analysis model (DerSimonian and Laird method). This method considers heterogeneity both within and between studies to calculate the range of possible true effects.9 For situations in which significant heterogeneity is anticipated, the random‐effects model is most conservative and appropriate.9, 10
We also compared the mean number of organisms isolated from wound cultures to the mean number of organisms isolated from alternative culture methods using the nonparametric Wilcoxon rank sum test. Inter‐rater reliability was assessed using the kappa statistic. We assessed potential publication bias by visually examining a funnel plot as described by Egger et al.11 We report 95% confidence intervals, medians with interquartile ranges, and p‐values where appropriate. All data analyses were performed using Stata 9.2 (STATA Corporation, College Station, TX, 2007).
Results
Of 9032 unique citations, eight studies met all inclusion criteria (Figure 1). Inter‐rater reliability was substantial (Kappa = 0.78).12 Areas of initial disagreement generally involved whether a study adequately described an appropriate alternative culture method for comparison or whether data available in an article was sufficient for sensitivity and specificity calculation. Consensus was achieved once the full article was retrieved, reviewed and discussed.
The 8 studies evaluated in the review included a total number of 615 patients or samples (Table 1). Diabetic wounds were described in four studies.1316 Two studies described wounds associated with peripheral vascular disease,13, 17 while four involved traumatic wounds.13, 1719 One study did not identify the clinical circumstances concerning the wounds.20
| Study ID | n | Sensitivity | Specificity | Positive LR | Negative LR |
|---|---|---|---|---|---|
| |||||
| Machowiak et al. (1978)17 | 183* | 0.26 | 0.56 | 0.59 | 1.32 |
| Sharp et al. (1979)15 | 58 | 0.53 | 0.62 | 1.38 | 0.77 |
| Wheat et al. (1986)16 | 26 | 0.35 | 0.32 | 0.51 | 2.06 |
| Zuluaga et al. (2006)19 | 100 | 0.20 | 0.67 | 0.60 | 1.20 |
| Zuluaga et al. (2002)18 | 50 | 0.22 | 0.54 | 0.47 | 1.45 |
| Gardner et al. (2007)13 | 83 | 0.90 | 0.57 | 2.09 | 0.18 |
| Slater et al. (2004)14 | 60 | 0.93 | 0.96 | 23.3 | 0.07 |
| Mousa (1997)20 | 55 | 0.89 | 0.96 | 20.6 | 0.12 |
| Pooled values (95% CI) | 0.49 (0.37‐0.61) | 0.62 (0.51‐0.74) | 1.1 (0.71‐1.5) | 0.67 (0.52‐0.82) | |
The studies used several different methods for obtaining superficial cultures. Six studies obtained purulent wound drainage material through the application of sterile swabs.1316, 18, 19 One study obtained purulent drainage material using needle aspiration.18 Two studies obtained culture material from sinus tracts associated with the wounds, one through sinus tract washings17 and another by obtaining sinus tract discharge material.20
The types of comparison cultures used were equally divided between deep tissue biopsies1316 and bone biopsies,1720 each accounting for 50% (4 of 8) of studies.
In assessing the data from the eight studies, the pooled test sensitivity for superficial wound swabs was 49% (95% confidence interval [CI], 37‐61%) (Figure 2). The pooled specificity for superficial wound swabs was 62% (95% CI, 51‐74%), while the pooled positive and negative LRs were 1.1 (95% CI, 0.71‐1.5) and 0.67 (95% CI, 0.52‐0.82), respectively (Figure 2).
The median number of bacterial isolates reported for each culture type, superficial and comparison culture, was collected from each study (Table 2). The median value for number of bacterial isolates identified by superficial culture was 2.7 (interquartile range [IQR] 1.8‐3.2). The median value for number of bacterial isolates identified by comparison culture was 2.2 (IQR 1.7‐2.9). A Wilcoxon rank sum analysis showed that the number of isolates for surface wound cultures was not significantly different than the number of isolates for comparison cultures (P = 0.75) (Table 1).
| Study ID | # of Isolates (Swab) | # of Isolates (Comparison) | Prior Antibiotics? |
|---|---|---|---|
| |||
| Machowiak et al. (1978)17 | * | * | Treated, but details not reported |
| Sharp et al. (1979)15 | 2.3 | 2.2 | Treated, but details not reported |
| Wheat et al. (1986)16 | 3.3 | 3.4 | Not described |
| Zuluaga et al. (2006)19 | 1.3 | 1.6 | Antibiotics stopped 48 hours prior |
| Zuluaga et al. (2002)18 | 1.1 | 1.4 | 52% on antibiotics, stopped 48 hours prior |
| Gardner et al. (2007)13 | 3.0 | 3.1 | 42% on antibiotics |
| Slater et al. (2004)14 | 2.7 | 2.5 | 27% on prior antibiotics |
| Mousa (1997)20 | 3.6 | 1.9 | Treated, but details not reported |
| Median (IQR) | 2.7 (1.8‐3.2) | 2.2 (1.7‐2.9) | |
Discussion
In performing this review, we discovered ambiguity in the literature regarding the utility of surface wound cultures. Some studies obtained findings to suggest the utility of surface wound cultures,8, 14, 17 while other studies in our review16, 18, 19 provided evidence against them. This variability confirmed the need for a meta‐analytic approach as provided by this review.
While we have tried to minimize bias through a well‐established methodology, we acknowledge that certain methodological limitations should be considered in interpreting the results. There may be publication bias in reviews that include only published articles; a funnel plot of sensitivity vs. sample size showed some asymmetry, suggesting bias. Our search strategy was limited to English‐only articles, which may result in publication bias.
Further, this review included a group of studies that were heterogeneous in several regards. Differences exist in culturing methods and laboratory technology, as exemplified by the variety of superficial culture methods used. We were not able to account for these laboratory differences, as methodologies in obtaining and isolating bacteria were not uniformly well described.
Additionally, the studies classified organisms in different ways. Three studies categorized organisms according to Gram's stain characteristics.13, 16, 18 One study described organisms primarily in terms of aerobic or anaerobic respiration.15 Two studies14, 19 discussed pathogens both in terms of respiration (aerobic/anaerobic) and Gram's stain characteristic, while another 2 studies17, 20 did not describe organisms in either terms. These inconsistencies limited our ability to provide sensitivity and specificity information for specific subclasses of organisms.
The clinical conditions in each study surrounding the wounds were also heterogeneous: most significantly in the issue of prior antibiotic administration. All but 1 study16 indicated that the patients had received antibiotics prior to having cultures obtained. The type of antibiotics (narrow‐spectrum or broad‐spectrum), the route of administration, and the cessation of antibiotics in relation to obtaining swabs and cultures all varied widely or were not well described. This degree of ambiguity will necessarily impact both the reliability of data regarding microbial growth as well as the component flora.
The inclusion of higher quality studies is likely to result in a more reliable meta‐analysis.21 We had hoped that antibiotic trials would contain uniform outcomes and thus strengthen our meta‐analysis through the inclusion of randomized‐controlled studies. Unfortunately, the majority of antibiotic trials did not use superficial wound cultures, did not report mean number of isolates, or did not provide microbiological data in sufficient detail to calculate concordance ratesand therefore, did not meet eligibility criteria. Randomized‐controlled trials were a minority among our included articles; the majority of study designs were retrospective cohorts and case‐controlled studies.
Despite these limitations, we were able to conclude that superficial wound culture provides mediocre sensitivity (49%) and specificity (62%). The positive LR of 1.1 is unhelpful in decision making, having a CI that includes 1. Interestingly, the negative LR of 0.67 could be somewhat helpful in medical decision making, modifying the pretest probability and assisting in ruling out a deeper bacterial infection. Although, according to Fagan's nomogram, a negative LR of 0.67 has only a mild effect on pretest odds.22
The bacterial bioburden assessed by the number of isolates obtained by culture method serves as a proxy for reliability of culture results14, 23 by suggesting that fewer organisms isolated from deep tissue or bone samples reflects a less contaminated specimen. Our assessment of the bioburden found that the median number of isolates was slightly higher in surface cultures than deeper cultures, though not to a significant degree (P = 0.75). This indicates that the degree of contamination in superficial cultures was neither significantly worse nor better than deep cultures.
We attempted to define a role for surface wound cultures; however, we found that these did not show any greater utility than deep cultures for identifying the microbiologic etiology of diabetic wound infections. While the negative LR provides some quantitative verification of the common clinical practice that a negative culture argues against infection, the finding is not especially robust.
Although for this meta‐analysis we grouped all organisms in the same way, we recognize that the sensitivity and specificity may differ according to various subclasses of bacteria. Interpretations of culture results also vary (eg, Gram positive vs. negative; aerobic vs. anaerobic); practitioners will not interpret superficial cultures of coagulase‐negative Staphylococcus in the same way as Pseudomonas. However, this study seeks to establish a reasonable starting point for the medical decision‐making process by providing quantitative values in an area with previously conflicting data. We anticipate that as laboratory techniques improve and research into superficial wounds continues, greater sensitivity of superficial wound cultures will result.
Ultimately, physicians use culture data to target therapy in an effort to use the least toxic and most effective antimicrobial agent possible to successfully treat infections. Clinical outcomes were not described in all included articles; in those that did, the endpoints were too dissimilar for meaningful comparison. Limiting our review to studies reporting treatment outcomes would have resulted in too few included studies. Thus, we were unable able to assess whether superficial wound cultures were associated with improved patient‐oriented outcomes in this meta‐analysis.
There is a significant paucity of trials evaluating the accurate concordance of superficial swabs to deep tissue culture. The current data shows poor sensitivity and specificity of superficial culture methods. The presumption that deeper cultures (such as a bone biopsy) should result in a less contaminated sample and more targeted culture results was also not borne out in our review. When presented with a patient with a wound infection, physicians mentally supply a pretest (or a pretreatment) probability as to the microbiologic etiology of the infection. Careful history will, of course, be critical in identifying extenuating circumstance or unusual exposures. From our meta‐analysis, we cannot recommend the routine use of superficial wound cultures to guide initial antibiotic therapy as this may result in poor resource utilization.5 While clinical outcomes from the use of routine superficial cultures are unclear, we suggest greater use of local antibiograms and methicillin‐resistant Staphylococcus aureus (MRSA) prevalence data to determine resistance patterns and guide the selection of empiric therapies.
- ,,, et al.Diagnosis and treatment of diabetic foot infections.Clin Infect Dis.2004;39:885–910.
- AASID,Australasian Society for Infectious Diseases—Standards, Practice Guidelines (Skin and Soft Tissue Infections): Institute for Safe Medication Practices;2006.
- ESCMID,European Society of Clinical Microbiology 2006.
- ,,,.Methicillin‐resistant Staphylococcus aureus in community‐acquired skin infections.Emerg Infect Dis.2005;11:928–930.
- ,,.Contaminant blood cultures and resource utilization. The true consequences of false‐positive results.JAMA.1991;265:365–369.
- ,,,,,.Cost‐effectiveness of blood cultures for adult patients with cellulitis.Clin Infect Dis.1999;29:1483–1488.
- ,,,,,.Managing skin and soft tissue infections: expert panel recommendations on key decision points.J Antimicrob Chemother.2003;52 Suppl 1:i3‐i17.
- ,,, et al.Deep tissue biopsy vs. superficial swab culture monitoring in the microbiological assessment of limb‐threatening diabetic foot infection.Diabet Med.2001;18:822–827.
- ,.Meta‐analysis in clinical trials.Control Clin Trials.1986;7:177–188.
- ,,.Quantitative synthesis in systematic reviews.Ann Intern Med.1997;127:820–826.
- ,,,.Bias in meta‐analysis detected by a simple, graphical test.BMJ.1997;315:629–634.
- .Practical statistics for medical research.London, UK:Chapman 1991:403–409.
- ,,,,,.Diagnostic validity of three swab techniques for identifying chronic wound infection.Wound Repair Regen.2006;14(5):548–57.
- ,,, et al.Swab cultures accurately identify bacterial pathogens in diabetic foot wounds not involving bone.Diabet Med.2004;21:705–709.
- ,,,,.Microbiology of superficial and deep tissues in infected diabetic gangrene.Surg Gynecol Obstet.1979;149:217–219.
- ,,, et al.Diabetic foot infections. Bacteriologic analysis.Arch Intern Med.1986;146:1935–1940.
- ,,.Diagnostic value of sinus‐tract cultures in chronic osteomyelitis.JAMA.1978;239:2772–2775.
- ,,,.Lack of microbiological concordance between bone and non‐bone specimens in chronic osteomyelitis: an observational study.BMC Infect Dis.2002;2:8.
- ,,,,,.Etiologic diagnosis of chronic osteomyelitis: a prospective study.Arch Intern Med.2006;166:95–100.
- .Evaluation of sinus‐track cultures in chronic bone infection.J Bone Joint Surg Br.1997;79:567–569.
- ,,, et al.Meta‐analysis of observational studies in epidemiology: a proposal for reporting.JAMA.2000;283:2008–2012.
- ,Letter: nomogram for Bayes theorem.N Engl J Med.1975;293:257.
- ,,,,,.Quantitative swab culture versus tissue biopsy: a comparison in chronic wounds.Ostomy Wound Manage.2001;47:34–37.
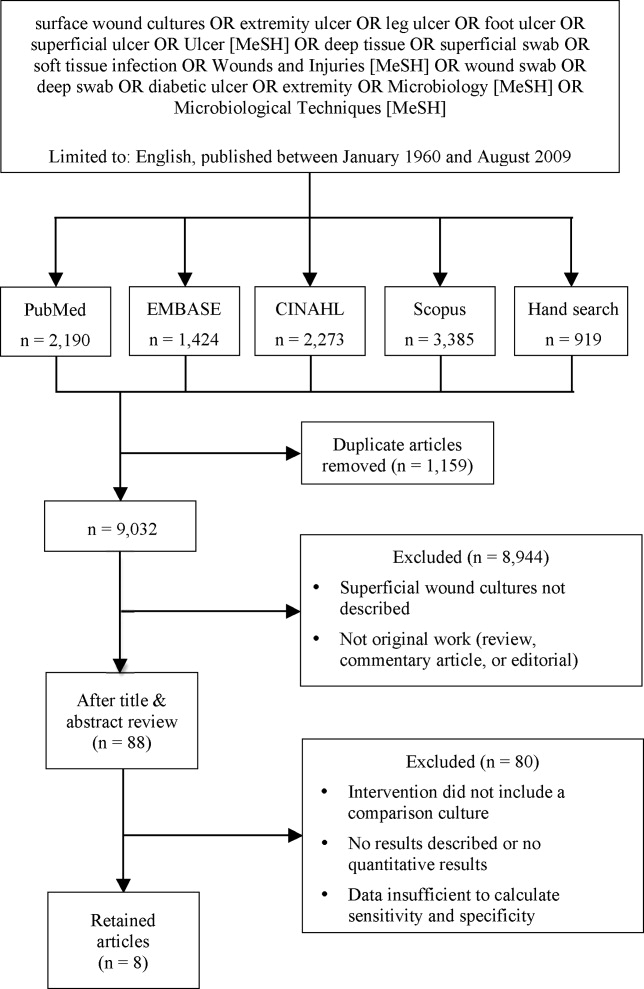
Pott's Puffy Tumor
A 6‐year‐old girl with a history of bilateral myringotomies, tonsillectomy, and adenoidectomy 6 and 8 months prior, presented with forehead swelling. Eight days prior, she developed right ear pain, sore throat and fever followed by eye pain and headache for which she was evaluated and diagnosed with viral illness. On the day of presentation she awoke with forehead swelling, persistent headache, and recurrent fever.
On exam she was afebrile. Central forehead swelling was noted without overlying erythema or fluctulence (Figure 1). Neurologic exam was normal. Noncontrast computed tomography (CT) scan of the head showed pan sinusitis with an extra‐axial fluid collection in the left frontal region (Figure 2).

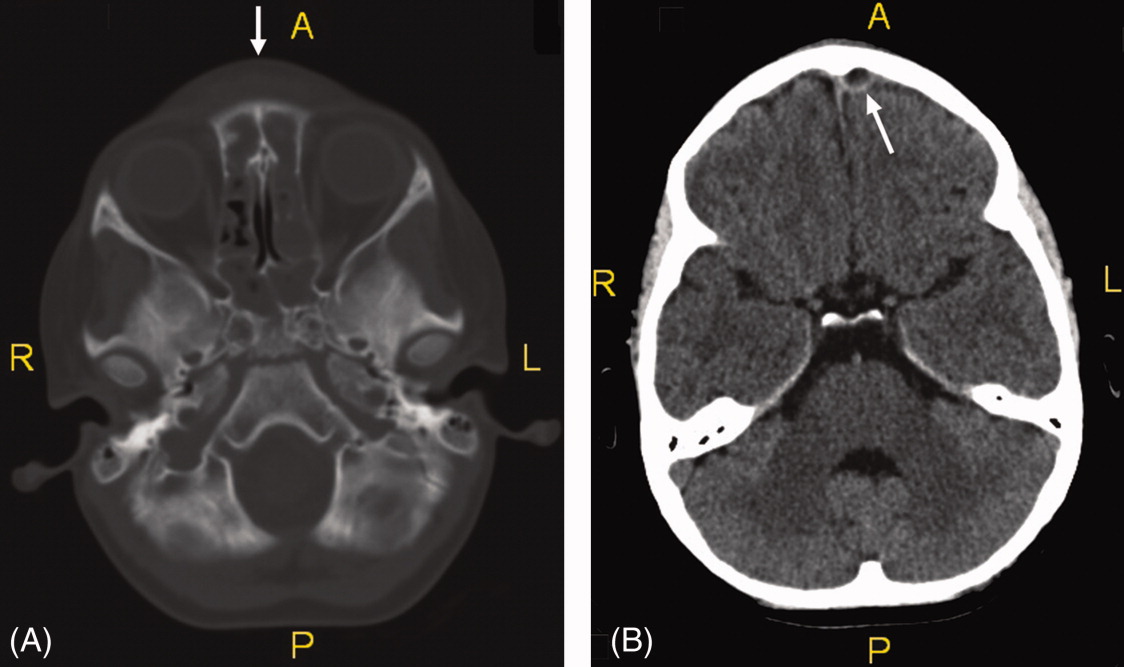
Vancomycin, ceftriaxone, and metronidazole were started empirically. She underwent bilateral maxillary antrostomy, total ethmoidectomy, and burr‐hole evacuation of the epidural abscess. Operative specimen cultures grew out Group A streptococci, after‐which antibiotic therapy was narrowed down to ampicillin/sulbactam alone.
Pott's puffy tumor, or osteomyelitis of the frontal bone with subperiosteal abscess formation, is rare in children less than 7 years of age and usually the result of a delay in diagnosis or inadequate treatment of rhinosinusitis.1 Risk factors include frontal sinusitis, head trauma, and less commonly, cocaine use, dental infection, or delayed neurosurgical or sinus surgery complications.2, 3 Fever, vomiting, forehead tenderness, and headache are the most common complaints, though seizure and focal neurologic findings have been described.2 CT scanning is the imaging modality of choice. Most commonly cultured organisms include Streptococci, Haemophilus influenzae, Bacteroides, and less commonly, Staphylococcus aureus.2, 4 Treatment includes empiric broad‐spectrum antibiotics that penetrate the blood‐brain barrier with early surgical drainage of the abscess and debridement of the osteomyelitic bone.4
- ,.Simultaneous intracranial and orbital complications of acute rhinosinusitis in children.Int J Pediatr Otorhinolaryngol.2004;68:619–625.
- ,,, et al.Pott's puffy tumor in children.Childs Nerv Syst.2010;26(1):53–60.
- ,,,,.A Pott's Puffy Tumour as a late complication of a frontal sinus reconstruction: case report and literature review.Rhinology.2009;47(4):470–475.
- ,,.An unusual cause of headache: Pott's puffy tumour.Eur J Emerg Med.2007;14(3):170–173.
A 6‐year‐old girl with a history of bilateral myringotomies, tonsillectomy, and adenoidectomy 6 and 8 months prior, presented with forehead swelling. Eight days prior, she developed right ear pain, sore throat and fever followed by eye pain and headache for which she was evaluated and diagnosed with viral illness. On the day of presentation she awoke with forehead swelling, persistent headache, and recurrent fever.
On exam she was afebrile. Central forehead swelling was noted without overlying erythema or fluctulence (Figure 1). Neurologic exam was normal. Noncontrast computed tomography (CT) scan of the head showed pan sinusitis with an extra‐axial fluid collection in the left frontal region (Figure 2).
Vancomycin, ceftriaxone, and metronidazole were started empirically. She underwent bilateral maxillary antrostomy, total ethmoidectomy, and burr‐hole evacuation of the epidural abscess. Operative specimen cultures grew out Group A streptococci, after‐which antibiotic therapy was narrowed down to ampicillin/sulbactam alone.
Pott's puffy tumor, or osteomyelitis of the frontal bone with subperiosteal abscess formation, is rare in children less than 7 years of age and usually the result of a delay in diagnosis or inadequate treatment of rhinosinusitis.1 Risk factors include frontal sinusitis, head trauma, and less commonly, cocaine use, dental infection, or delayed neurosurgical or sinus surgery complications.2, 3 Fever, vomiting, forehead tenderness, and headache are the most common complaints, though seizure and focal neurologic findings have been described.2 CT scanning is the imaging modality of choice. Most commonly cultured organisms include Streptococci, Haemophilus influenzae, Bacteroides, and less commonly, Staphylococcus aureus.2, 4 Treatment includes empiric broad‐spectrum antibiotics that penetrate the blood‐brain barrier with early surgical drainage of the abscess and debridement of the osteomyelitic bone.4
- ,.Simultaneous intracranial and orbital complications of acute rhinosinusitis in children.Int J Pediatr Otorhinolaryngol.2004;68:619–625.
- ,,, et al.Pott's puffy tumor in children.Childs Nerv Syst.2010;26(1):53–60.
- ,,,,.A Pott's Puffy Tumour as a late complication of a frontal sinus reconstruction: case report and literature review.Rhinology.2009;47(4):470–475.
- ,,.An unusual cause of headache: Pott's puffy tumour.Eur J Emerg Med.2007;14(3):170–173.