User login
What Should I Do If I Get a Needlestick?
Case
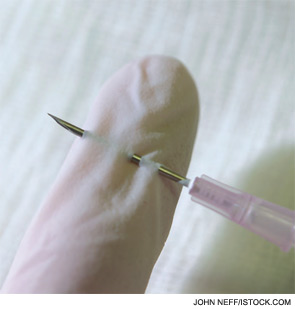
While placing a central line, you sustain a needlestick. You’ve washed the area thoroughly with soap and water, but you are concerned about contracting a bloodborne pathogen. What is the risk of contracting such a pathogen, and what can be done to reduce this risk?
Overview
Needlestick injuries are a common occupational hazard in the hospital setting. According to the International Health Care Worker Safety Center (IHCWSC), approximately 295,000 hospital-based healthcare workers experience occupational percutaneous injuries annually. In 1991, Mangione et al surveyed internal-medicine house staff and found an annual incidence of 674 needlestick injuries per 1,000 participants.1 Other retrospective data estimate this risk to be as high as 839 per 1,000 healthcare workers annually.2 Evidence from the Centers for Disease Control and Prevention (CDC) in 2004 suggests that because these are only self-reported injuries, the annual incidence of such injuries is in fact much higher than the current estimates suggest.2,3,4
More than 20 bloodborne pathogens (see Table 1, right) might be transmitted from contaminated needles or sharps, including human immunodeficiency virus (HIV), hepatitis B virus (HBV), and hepatitis C virus (HCV). A quick and appropriate response to a needlestick injury can greatly decrease the risk of disease transmission following an occupational exposure to potentially infectious materials.
Review of the Data
After any needlestick injury, an affected healthcare worker should wash the area with soap and water immediately. There is no contraindication to using antiseptic solutions, but there is also no evidence to suggest that this reduces the rates of disease transmission.
As decisions for post-exposure prophylaxis often need to be made within hours, a healthcare worker should seek care in the facility areas responsible for managing occupational exposures. Healthcare providers should always be encouraged and supported to report all sharps-related injuries to such departments.
The source patient should be identified and evaluated for potentially transmissible diseases, including HIV, HBV, and HCV. If indicated, the source patient should then undergo appropriate serological testing, and any indicated antiviral prophylaxis should be initiated (see Table 2, p. 19).
Risk of Seroconversion
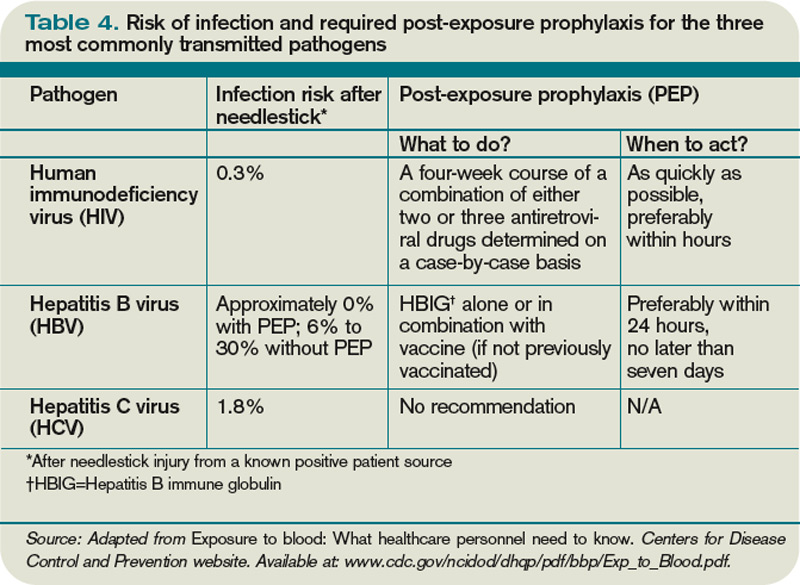
For all bloodborne pathogens, a needlestick injury carries a greater risk for transmission than other occupational exposures (e.g. mucous membrane exposure). If a needlestick injury occurs in the setting of an infected patient source, the risk of disease transmission varies for HIV, HBV, and HCV (see Table 3, p. 19). In general, risk for seroconversion is increased with a deep injury, an injury with a device visibly contaminated with the source patient’s blood, or an injury involving a needle placed in the source patient’s artery or vein.3,5,6
Human immunodeficiency virus. Contracting HIV after needlestick injury is rare. From 1981 to 2006, the CDC documented only 57 cases of HIV/AIDS in healthcare workers following occupational exposure and identified an additional “possible” 140 cases post-exposure.5,6 Of the 57 documented cases, 48 sustained a percutaneous injury.
Following needlestick injury involving a known HIV-positive source, the one-year risk of seroconversion has been estimated to be 0.3%.5,6 In 1997, Cardo and colleagues identified four factors associated with increased risk for seroconversion after a needlestick/sharps injury from a known positive-HIV source:
- Deep injury;
- Injury with a device visibly contaminated with the source patient’s blood;
- A procedure involving a needle placed in the source patient’s artery or vein; and
- Exposure to a source patient who died of AIDS in the two months following the occupational exposure.5
Hepatitis B virus. Wides-pread immunization of healthcare workers has led to a dramatic decline in occupationally acquired HBV. The CDC estimated that in 1985, approximately 12,500 new HBV infections occurred in healthcare workers.3 This estimate plummeted to approximately 500 new occupationally acquired HBV infections in 1997.3
Despite this, hospital-based healthcare personnel remain at risk for HBV transmission after a needlestick injury from a known positive patient source. Few studies have evaluated the occupational risk of HBV transmission after a needlestick injury. Buergler et al reported that following a needlestick injury involving a known HBV-positive source, the one-year risk of seroconversion was 0.76% to 7.35% for nonimmunized surgeons, and 0.23% to 2.28% for nonimmunized anesthesiologists.7
In the absence of post-exposure prophylaxis, an exposed healthcare worker has a 6% to 30% risk of becoming infected with HBV.3,8 The risk is greatest if the patient source is known to be hepatitis B e antigen-positive, a marker for greater disease infectivity. When given within one week of injury, post-exposure prophylaxis (PEP) with multiple doses of hepatitis B immune globulin (HBIG) provides an estimated 75% protection from transmission.
Healthcare workers who have received the hepatitis B vaccine and developed immunity have virtually no risk for infection.6,7
Hepatitis C virus. Prospective evaluation has demonstrated that the average risk of HCV transmission after percutaneous exposure to a known HCV-positive source is from 0% to 7%.3 The Italian Study Group on Occupational Risk of HIV and Other Bloodborne Infections evaluated HCV seroconversion within six months of a reported exposure with enzyme immunoassay and immunoblot assay. In this study, the authors found a seroconversion rate of 1.2%.9
Further, they suggested that HCV seroconversion only occurred from hollow-bore needles, as no seroconversions were noted in healthcare workers who sustained injuries with solid sharp objects.
Post-Exposure Management
The CDC does not recommend prophylaxis when source fluids make contact with intact skin. However, if a percutaneous occupational exposure has occurred, PEPs exist for HIV and HBV but not for HCV.3,6 If a source patient’s HIV, HBV, and HCV statuses are unknown, occupational-health personnel can interview the patient to evaluate his or her risks and initiate testing. Specific information about the time and nature of exposure should be documented.
When testing is indicated, it should be done following institutional and state-specific exposure-control policies and informed consent guidelines. In all situations, the decision to begin antiviral PEP should be carefully considered, weighing benefits of PEP versus the risks and toxicity of treatment.
Human immunodeficiency virus. If a source patient is known to be HIV-positive, has a positive rapid HIV test, or if HIV status cannot be quickly determined, PEP is indicated. Healthcare providers should be aware of rare cases in which the source patient initially tested HIV-seronegative but was subsequently found to have primary HIV infection.
Per 2004 CDC recommendations, PEP is indicated for all healthcare workers who sustain a percuanteous injury from a known HIV-positive source.3,8 For a less severe injury (e.g. solid needle or superficial injury), PEP with either a basic two-drug or three-drug regimen is indicated, depending on the source patient’s viral load.3,5,6,8
If the source patient has unknown HIV status, two-drug PEP is indicated based on the source patient’s HIV risk factors. In such patients, rapid HIV testing also is indicated to aid in determining the need for PEP. When the source HIV status is unknown, PEP is indicated in settings where exposure to HIV-infected persons is likely.
If PEP is indicated, it should be started as quickly as possible. The 2005 U.S. Public Health Service Recommendations for PEP recommend initiating two nucleosides for low-risk exposures and two nucleosides plus a boosted protease inhibitor for high-risk exposures.
Examples of commonly used dual nucleoside regimens are Zidovudine plus Lamivudine (coformulated as Combivir) or Tenofovir plus Emtricitabine (coformulated as Truvada). Current recommendations indicate that PEP should be continued for four weeks, with concurrent clinical and laboratory evaluation for drug toxicity.
Hepatitis B virus. Numerous prospective studies have evaluated the post-exposure effectiveness of HBIG. When administered within 24 hours of exposure, HBIG might offer immediate passive protection against HBV infection. Additionally, if initiated within one week of percutaneous injury with a known HBV-positive source, multiple doses of HGIB provide an estimated 75% protection from transmission.
Although the combination of HBIG and the hepatitis vaccine B series has not been evaluated as PEP in the occupational setting, evidence in the perinatal setting suggests this regimen is more effective than HBIG alone.3,6,8
Hepatitis C virus. No PEP exists for HCV, and current recommendations for post-exposure management focus on early identification and treatment of chronic disease. There are insufficient data for a treatment recommendation for patients with acute HCV infection with no evidence of disease; the appropriate dosing of such a regimen is unknown. Further, evidence suggests that treatment started early in the course of chronic infection could be just as effective and might eliminate the need to treat persons whose infection will spontaneously resolve.7
Back to the Case
Your needlestick occurred while using a hollow-bore needle to cannulate a source patient’s vein, placing you at higher risk for seroconversion. You immediately reported the exposure to the department of occupational health at your hospital. The source patient’s HIV, HBV, and HCV serological statuses were tested, and the patient was found to be HBV-positive. After appropriate counseling, you decide to receive HGIB prophylaxis to reduce your chances of becoming infected with HBV infection.
Bottom Line
Healthcare workers who suffer occupational needlestick injuries require immediate identification and attention to avoid transmission of such infectious diseases as HIV, HBV, and HCV. Source patients should undergo rapid serological testing to determine appropriate PEP. TH
Dr. Zehnder is a hospitalist in the Section of Hospital Medicine at the University of Colorado Denver.
References
- Mangione CM, Gerberding JL, Cummings, SR. Occupational exposure to HIV: Frequency and rates of underreporting of percutaneous and mucocutaneous exposures by medical housestaff. Am J Med. 1991;90(1):85-90.
- Lee JM, Botteman MF, Nicklasson L, et al. Needlestick injury in acute care nurses caring for patients with diabetes mellitus: a retrospective study. Curr Med Res Opinion. 2005;21(5):741-747.
- Workbook for designing, implementing, and evaluating a sharps injury prevention program. Centers for Disease Control and Prevention website. Available at: www.cdc.gov/sharpssafety/pdf/WorkbookComplete.pdf. Accessed Sept. 13, 2010.
- Lee JM, Botteman MF, Xanthakos N, Nicklasson L. Needlestick injuries in the United States. Epidemiologic, economic, and quality of life issues. AAOHN J. 2005;53(3):117-133.
- Cardo DM, Culver DH, Ciesielski CA, et al. A case-control study of HIV seroconversion in health care workers after percutaneous exposure. Centers for Disease Control and Prevention Needlestick Surveillance Group. N Engl J Med. 1997;337(21):1485-1490.
- Exposure to blood: What healthcare personnel need to know. CDC website. Available at: www.cdc.gov/ncidod /dhqp/pdf/bbp/Exp_to_Blood.pdf. Accessed Aug. 31, 2010.
- Buergler JM, Kim R, Thisted RA, Cohn SJ, Lichtor JL, Roizen MF. Risk of human immunodeficiency virus in surgeons, anesthesiologists, and medical students. Anesth Analg. 1992;75(1):118-124.
- Updated U.S. Public Health Service guidelines for the management of occupational exposures to HBV, HCV, and HIV and recommendations for postexposure prophylaxis. CDC website. Available at: www.cdc.gov/mmwr/preview/mmwrhtml/rr5011a1.htm. Accessed Aug. 31, 2010.
- Puro V, Petrosillo N, Ippolito G. Risk of hepatitis C seroconversion after occupational exposure in health care workers. Italian Study Group on Occupational Risk of HIV and Other Bloodborne Infections. Am J Infect Control. 1995;23(5):273-277.
Case
While placing a central line, you sustain a needlestick. You’ve washed the area thoroughly with soap and water, but you are concerned about contracting a bloodborne pathogen. What is the risk of contracting such a pathogen, and what can be done to reduce this risk?
Overview
Needlestick injuries are a common occupational hazard in the hospital setting. According to the International Health Care Worker Safety Center (IHCWSC), approximately 295,000 hospital-based healthcare workers experience occupational percutaneous injuries annually. In 1991, Mangione et al surveyed internal-medicine house staff and found an annual incidence of 674 needlestick injuries per 1,000 participants.1 Other retrospective data estimate this risk to be as high as 839 per 1,000 healthcare workers annually.2 Evidence from the Centers for Disease Control and Prevention (CDC) in 2004 suggests that because these are only self-reported injuries, the annual incidence of such injuries is in fact much higher than the current estimates suggest.2,3,4
More than 20 bloodborne pathogens (see Table 1, right) might be transmitted from contaminated needles or sharps, including human immunodeficiency virus (HIV), hepatitis B virus (HBV), and hepatitis C virus (HCV). A quick and appropriate response to a needlestick injury can greatly decrease the risk of disease transmission following an occupational exposure to potentially infectious materials.
Review of the Data
After any needlestick injury, an affected healthcare worker should wash the area with soap and water immediately. There is no contraindication to using antiseptic solutions, but there is also no evidence to suggest that this reduces the rates of disease transmission.
As decisions for post-exposure prophylaxis often need to be made within hours, a healthcare worker should seek care in the facility areas responsible for managing occupational exposures. Healthcare providers should always be encouraged and supported to report all sharps-related injuries to such departments.
The source patient should be identified and evaluated for potentially transmissible diseases, including HIV, HBV, and HCV. If indicated, the source patient should then undergo appropriate serological testing, and any indicated antiviral prophylaxis should be initiated (see Table 2, p. 19).
Risk of Seroconversion
For all bloodborne pathogens, a needlestick injury carries a greater risk for transmission than other occupational exposures (e.g. mucous membrane exposure). If a needlestick injury occurs in the setting of an infected patient source, the risk of disease transmission varies for HIV, HBV, and HCV (see Table 3, p. 19). In general, risk for seroconversion is increased with a deep injury, an injury with a device visibly contaminated with the source patient’s blood, or an injury involving a needle placed in the source patient’s artery or vein.3,5,6
Human immunodeficiency virus. Contracting HIV after needlestick injury is rare. From 1981 to 2006, the CDC documented only 57 cases of HIV/AIDS in healthcare workers following occupational exposure and identified an additional “possible” 140 cases post-exposure.5,6 Of the 57 documented cases, 48 sustained a percutaneous injury.
Following needlestick injury involving a known HIV-positive source, the one-year risk of seroconversion has been estimated to be 0.3%.5,6 In 1997, Cardo and colleagues identified four factors associated with increased risk for seroconversion after a needlestick/sharps injury from a known positive-HIV source:
- Deep injury;
- Injury with a device visibly contaminated with the source patient’s blood;
- A procedure involving a needle placed in the source patient’s artery or vein; and
- Exposure to a source patient who died of AIDS in the two months following the occupational exposure.5
Hepatitis B virus. Wides-pread immunization of healthcare workers has led to a dramatic decline in occupationally acquired HBV. The CDC estimated that in 1985, approximately 12,500 new HBV infections occurred in healthcare workers.3 This estimate plummeted to approximately 500 new occupationally acquired HBV infections in 1997.3
Despite this, hospital-based healthcare personnel remain at risk for HBV transmission after a needlestick injury from a known positive patient source. Few studies have evaluated the occupational risk of HBV transmission after a needlestick injury. Buergler et al reported that following a needlestick injury involving a known HBV-positive source, the one-year risk of seroconversion was 0.76% to 7.35% for nonimmunized surgeons, and 0.23% to 2.28% for nonimmunized anesthesiologists.7
In the absence of post-exposure prophylaxis, an exposed healthcare worker has a 6% to 30% risk of becoming infected with HBV.3,8 The risk is greatest if the patient source is known to be hepatitis B e antigen-positive, a marker for greater disease infectivity. When given within one week of injury, post-exposure prophylaxis (PEP) with multiple doses of hepatitis B immune globulin (HBIG) provides an estimated 75% protection from transmission.
Healthcare workers who have received the hepatitis B vaccine and developed immunity have virtually no risk for infection.6,7
Hepatitis C virus. Prospective evaluation has demonstrated that the average risk of HCV transmission after percutaneous exposure to a known HCV-positive source is from 0% to 7%.3 The Italian Study Group on Occupational Risk of HIV and Other Bloodborne Infections evaluated HCV seroconversion within six months of a reported exposure with enzyme immunoassay and immunoblot assay. In this study, the authors found a seroconversion rate of 1.2%.9
Further, they suggested that HCV seroconversion only occurred from hollow-bore needles, as no seroconversions were noted in healthcare workers who sustained injuries with solid sharp objects.
Post-Exposure Management
The CDC does not recommend prophylaxis when source fluids make contact with intact skin. However, if a percutaneous occupational exposure has occurred, PEPs exist for HIV and HBV but not for HCV.3,6 If a source patient’s HIV, HBV, and HCV statuses are unknown, occupational-health personnel can interview the patient to evaluate his or her risks and initiate testing. Specific information about the time and nature of exposure should be documented.
When testing is indicated, it should be done following institutional and state-specific exposure-control policies and informed consent guidelines. In all situations, the decision to begin antiviral PEP should be carefully considered, weighing benefits of PEP versus the risks and toxicity of treatment.
Human immunodeficiency virus. If a source patient is known to be HIV-positive, has a positive rapid HIV test, or if HIV status cannot be quickly determined, PEP is indicated. Healthcare providers should be aware of rare cases in which the source patient initially tested HIV-seronegative but was subsequently found to have primary HIV infection.
Per 2004 CDC recommendations, PEP is indicated for all healthcare workers who sustain a percuanteous injury from a known HIV-positive source.3,8 For a less severe injury (e.g. solid needle or superficial injury), PEP with either a basic two-drug or three-drug regimen is indicated, depending on the source patient’s viral load.3,5,6,8
If the source patient has unknown HIV status, two-drug PEP is indicated based on the source patient’s HIV risk factors. In such patients, rapid HIV testing also is indicated to aid in determining the need for PEP. When the source HIV status is unknown, PEP is indicated in settings where exposure to HIV-infected persons is likely.
If PEP is indicated, it should be started as quickly as possible. The 2005 U.S. Public Health Service Recommendations for PEP recommend initiating two nucleosides for low-risk exposures and two nucleosides plus a boosted protease inhibitor for high-risk exposures.
Examples of commonly used dual nucleoside regimens are Zidovudine plus Lamivudine (coformulated as Combivir) or Tenofovir plus Emtricitabine (coformulated as Truvada). Current recommendations indicate that PEP should be continued for four weeks, with concurrent clinical and laboratory evaluation for drug toxicity.
Hepatitis B virus. Numerous prospective studies have evaluated the post-exposure effectiveness of HBIG. When administered within 24 hours of exposure, HBIG might offer immediate passive protection against HBV infection. Additionally, if initiated within one week of percutaneous injury with a known HBV-positive source, multiple doses of HGIB provide an estimated 75% protection from transmission.
Although the combination of HBIG and the hepatitis vaccine B series has not been evaluated as PEP in the occupational setting, evidence in the perinatal setting suggests this regimen is more effective than HBIG alone.3,6,8
Hepatitis C virus. No PEP exists for HCV, and current recommendations for post-exposure management focus on early identification and treatment of chronic disease. There are insufficient data for a treatment recommendation for patients with acute HCV infection with no evidence of disease; the appropriate dosing of such a regimen is unknown. Further, evidence suggests that treatment started early in the course of chronic infection could be just as effective and might eliminate the need to treat persons whose infection will spontaneously resolve.7
Back to the Case
Your needlestick occurred while using a hollow-bore needle to cannulate a source patient’s vein, placing you at higher risk for seroconversion. You immediately reported the exposure to the department of occupational health at your hospital. The source patient’s HIV, HBV, and HCV serological statuses were tested, and the patient was found to be HBV-positive. After appropriate counseling, you decide to receive HGIB prophylaxis to reduce your chances of becoming infected with HBV infection.
Bottom Line
Healthcare workers who suffer occupational needlestick injuries require immediate identification and attention to avoid transmission of such infectious diseases as HIV, HBV, and HCV. Source patients should undergo rapid serological testing to determine appropriate PEP. TH
Dr. Zehnder is a hospitalist in the Section of Hospital Medicine at the University of Colorado Denver.
References
- Mangione CM, Gerberding JL, Cummings, SR. Occupational exposure to HIV: Frequency and rates of underreporting of percutaneous and mucocutaneous exposures by medical housestaff. Am J Med. 1991;90(1):85-90.
- Lee JM, Botteman MF, Nicklasson L, et al. Needlestick injury in acute care nurses caring for patients with diabetes mellitus: a retrospective study. Curr Med Res Opinion. 2005;21(5):741-747.
- Workbook for designing, implementing, and evaluating a sharps injury prevention program. Centers for Disease Control and Prevention website. Available at: www.cdc.gov/sharpssafety/pdf/WorkbookComplete.pdf. Accessed Sept. 13, 2010.
- Lee JM, Botteman MF, Xanthakos N, Nicklasson L. Needlestick injuries in the United States. Epidemiologic, economic, and quality of life issues. AAOHN J. 2005;53(3):117-133.
- Cardo DM, Culver DH, Ciesielski CA, et al. A case-control study of HIV seroconversion in health care workers after percutaneous exposure. Centers for Disease Control and Prevention Needlestick Surveillance Group. N Engl J Med. 1997;337(21):1485-1490.
- Exposure to blood: What healthcare personnel need to know. CDC website. Available at: www.cdc.gov/ncidod /dhqp/pdf/bbp/Exp_to_Blood.pdf. Accessed Aug. 31, 2010.
- Buergler JM, Kim R, Thisted RA, Cohn SJ, Lichtor JL, Roizen MF. Risk of human immunodeficiency virus in surgeons, anesthesiologists, and medical students. Anesth Analg. 1992;75(1):118-124.
- Updated U.S. Public Health Service guidelines for the management of occupational exposures to HBV, HCV, and HIV and recommendations for postexposure prophylaxis. CDC website. Available at: www.cdc.gov/mmwr/preview/mmwrhtml/rr5011a1.htm. Accessed Aug. 31, 2010.
- Puro V, Petrosillo N, Ippolito G. Risk of hepatitis C seroconversion after occupational exposure in health care workers. Italian Study Group on Occupational Risk of HIV and Other Bloodborne Infections. Am J Infect Control. 1995;23(5):273-277.
Back to Basics
Let’s examine a documentation case for hospitalists providing daily care: A 65-year-old male patient is admitted with a left hip fracture. The patient also has hypertension and Type 2 diabetes, which might complicate his care. The orthopedic surgeon manages the patient’s perioperative course for the fracture while the hospitalist provides daily post-op care for hypertension and diabetes.
A common scenario is the hospitalist will provide concurrent care, along with a varying number of specialists, depending on the complexity of the patient’s presenting problems and existing comorbidities. Payors define concurrent care as more than one physician providing care to the same patient on the same date, or during the same hospitalization. Payors often consider two key principles before reimbursing concurrent care:
- Does the patient’s condition warrant more than one physician? and
- Are the services provided by each physician reasonable and necessary?1
When more than one medical condition exists and each physician actively treats the condition related to their expertise, each physician can demonstrate medical necessity. As in the above example, the orthopedic surgeon cares for the patient’s fracture while the hospitalist oversees diabetes and hypertension management. Claim submission follows the same logic. Report each subsequent hospital care code (99231-99233) with the corresponding diagnosis each physician primarily manages (i.e., orthopedic surgeon: 9923x with 820.8; hospitalist: 9923x with 250.00, 401.1).
When each physician assigns a different primary diagnosis code to the visit code, each is more likely to receive payment. Because each of these physicians are in different specialties and different provider groups, most payors do not require modifier 25 (separately identifiable E/M service on the same day as a procedure or other service) appended to the visit code. However, some managed-care payors require each physician to append modifier 25 to the concurrent E/M visit code (i.e., 99232-25) despite claim submission under different tax identification numbers.
Unfortunately, the physicians might not realize this until a claim rejection has been issued. Furthermore, payors might want to see the proof before rendering payment. In other words, they pay the first claim received and deny any subsequent claim in order to confirm medical necessity of the concurrent visit. Appeal denied such claims rejections with supporting documentation that distinguishes each physician visit, if possible. This assists the payors in understanding each physician’s contribution to care.
Reasons for Denial
Concurrent care services are more easily distinguished when separate diagnoses are reported with each service. Conversely, payors are likely to deny services that are hard to differentiate. Furthermore, payors frequently deny concurrent care services for the following reasons:
- Services exceed normal frequency or duration for a given condition without documented circumstances requiring additional care; or
- Services by one physician duplicate or overlap those of another provider without recognizable distinction.2
For example, a hospitalist might be involved in the post-op care of patients with fractures and no other identifiable chronic or acute conditions or complications. In these cases, the hospitalist’s continued involvement might constitute a facility policy (e.g., quality of care, risk reduction, etc.) rather than active clinical management. Claim submission could erroneously occur with each physician reporting 9923x for 820.8. Payors deny medically unnecessary services, or request refunds for inappropriate payments.
Hospitalists might attempt to negotiate other terms with the facility to account for the unpaid time and effort directed toward these types of cases.
Group Practice
Physicians in the same group practice with the same specialty designation must report, and are paid, as a single physician. Multiple visits to the same patient can occur on the same day by members of the same group (e.g., hospitalist A evaluates the patient in the morning, and hospitalist B reviews test results and the resulting course of treatment in the afternoon). However, only one subsequent hospital care service can be reported for the day.
The hospitalists should select the visit level representative of the combined services and submit one appropriately determined code (e.g., 99233), thereby capturing the medically necessary efforts of each physician. To complicate matters, the hospitalists must determine which name to report on the claim: the physician who provided the first encounter, or the physician who provided the most extensive or best-documented encounter.
Tracking productivity for these cases proves challenging. Some practices develop an internal accounting system and credit each physician for their medically necessary efforts (a labor-intensive task for administrators and physicians). TH
Carol Pohlig is a billing and coding expert with the University of Pennsylvania Medical Center in Philadelphia. She is faculty for SHM’s inpatient coding course.
References
- Medicare Benefit Policy Manual: Concurrent Care. Chapter 15, Section 30.E. CMS website. Available at: www.cms.gov/manuals/Downloads/bp102c15.pdf. Accessed July 9, 2010.
- Medicare Claims Processing Manual: Physicians in Group Practice. Chapter 12, Section 30.6.5. CMS website. Available at: www.cms.gov/manuals/downloads/clm104c12.pdf. Accessed July 9, 2010.
- Pohlig, C. Daily care conundrums. The Hospitalist website. Available at: www.the-hospitalist.org/details/article/188735/Daily_Care_Conundrums_.html. Accessed July 9, 2010.
- Medicare Claims Processing Manual: Hospital Visits Same Day But by Different Physicians. Chapter 12, Section 30.6.9.C. CMS website. Available at: www.cms.gov/manuals/downloads/clm104c12.pdf. Accessed July 9, 2010.
- Abraham M, Beebe M, Dalton J, Evans D, Glenn R. Current Procedural Terminology Professional Edition. Chicago: American Medical Association Press; 2010:15.
Endangered Species?
The 1961 classic “The Ecology of Medical Care,” published in the New England Journal of Medicine, mapped out the broad features of the American healthcare landscape.1 For every 1,000 adult, the study suggested, 750 reported an illness, 250 consulted a doctor, and nine were admitted to a hospital in any given month. The subsequent arrival of Medicare and Medicaid fundamentally changed the U.S. healthcare system. And yet an updated version of the study, released in 2001, yielded surprisingly similar numbers, with 800 residents experiencing symptoms, 217 visiting a physician’s office, and eight being hospitalized in an average month.2
“It helps kind of put in perspective where the bulk of care really occurs,” says Ann O’Malley, MD, a senior researcher at the Washington, D.C.-based Center for Studying Health System Change. “It’s in outpatient provider offices, mostly primary-care provider offices.”
Dr. O’Malley and a host of other observers, however, are warning that the keystone members of this healthcare ecosystem are in serious trouble. As organizations such as SHM have likewise made clear, the accelerating shortage of general internists, family practitioners, and other PCPs has created sizable cracks in the supports of the entire healthcare infrastructure.
How big are the cracks? The number of medical school students pursuing a primary-care career has dropped by more than half since 1997, according to the American Academy of Family Physicians. And with the number of medical students entering the field unable to keep up with attrition, the remaining doctors are facing increasingly difficult working conditions. “Overloaded primary-care practices, whose doctors are aptly compared to hamsters on a treadmill, struggle to provide prompt access and high-quality care,” asserted a 2009 op-ed in the New England Journal of Medicine.3 The result: a vicious circle of decline leading to an anticipated shortfall of roughly 21,000 PCPs by 2015, according to the Association of American Medical Colleges.
Many primary-care providers had already stopped taking new patients when June’s Medicare reimbursement rate fiasco allowed the sustainable growth rate (SGR) formula’s mandated 21.2 percent rate cut to temporarily go into effect. Legislators eventually plugged the hole, but not before a new round of jitters seized the nation’s physicians, and reports proliferated throughout the summer about Medicare beneficiaries being unable to find a doctor willing to see them. The recession hasn’t helped, with more privately insured patients waiting longer to see their doctors to avoid copays, and with hospital emergency departments becoming de facto primary-care centers for those patients who have waited too long or have no other alternatives.
Uneven Challenges
Not only is there an acute shortage of primary-care physicians, Dr. O’Malley says, but there is also a distinctly uneven distribution throughout the country. For hospitalists, she says, the implications could be profound. “Hospitalists are increasingly going to be evaluated around issues such as avoiding hospital readmissions and [reducing] length of stay,” she says, “and if they want to improve both of those things, one of the keys is improving chronic care management in the outpatient setting, and improving follow-up post discharge.”
Both metrics will require the involvement of outpatient care providers, underscoring the importance of good communication and mutual respect. Despite the longstanding support of hospitalists for their primary-care counterparts, however, leaders are still being forced to address the perception that HM is somehow bad for what ails PCPs.
In a recent online article posted on the Becker’s Hospital Review website, SHM President Jeff Wiese, MD, SFHM, responded to one such criticism: that hospitalists make primary care less attractive for physicians. Hospitalists are not to blame for the decrease in interest, he asserted, but are actually complementary to the PCP role. And with millions more Americans about to be newly insured, that complementary relationship will be even more important. “It’s a tremendous waste of resources to use a primary-care provider for [a hospital visit]. We need to move into proactive mode, not reactive mode,” Dr. Wiese said. “More PCPs are going to need even more time in the clinic to handle the increased number of patients, and you lose the luxury to run back and forth between the clinic and the hospital. For those that can develop a trusting relationship with a hospitalist, you can work together to see more patients and provide more care.”
So what’s the real root of the problem? Money. According to recent surveys, PCPs earn about half the salary of dermatologists and an even smaller fraction of an average cardiologist’s pay. With medical school debt routinely reaching $200,000, Dr. O’Malley and other analysts say, many doctors simply can’t afford to go into primary care.
“It all comes down to payment, basically,” she says. “At present, our payment system for physician services and for medical procedures is quite skewed. It overcompensates for certain types of diagnostics and procedures, and it undercompensates for the more cognitive type of care that primary-care providers provide.”
The Road Ahead
Fortunately, some relief is trickling in. One measure strongly supported by SHM and included in the Affordable Care Act is a 10% Medicare reimbursement bonus for primary care delivered by qualified doctors, slated to begin next year. In June, U.S. Department of Health and Human Services Secretary Kathleen Sebelius announced a separate, $250 million initiative to boost the primary-care workforce. The money would help train PCPs by creating more residency slots, and offer new support for physician assistants, nurses, and nurse practitioners. Among the measures included in last year’s stimulus package, an expansion of the National Health Service Corps will provide more debt-relief opportunities for PCPs. And in mid-September, HHS tapped stimulus funds to award another $50.3 million for primary care training programs and loan repayment.
The Obama administration has claimed its combined actions “will support the training and development of more than 16,000 new primary-care providers over the next five years,” according to a June 16 HHS press release.
Observers say those measures alone are unlikely to be enough to stem the tide, however. “It’s definitely a step in the right direction,” Dr. O’Malley says of the Medicare bonus. “I don’t think it’s going to solve the primary-care workforce issue, because a 10% bonus, given how low primary-care physician salaries are compared to their specialist counterparts, is not going to be that much of an increase. Among the physicians that I’ve talked to and other healthcare providers, few feel that that’s sufficient enough to really encourage a lot of people to pursue primary care.”
Several other efforts now underway might help:
- Texas Tech University Health Sciences Center unveiled a new Family Medicine Accelerated Track program, which will allow primary-care medical students to complete a degree in three years. Certain students will receive a one-year scholarship, meaning that overall debt for some could be half that of the standard four-year program.
- Reid Hospital and Health Care Services in Richmond, Ind., successfully reversed a downward trend in primary-care referrals by forming its own nonprofit subsidiary corporation, Reid Physician Associates. The nonprofit will include about 50 employed outpatient providers by year’s end to complement the 233-bed hospital’s inpatient staff.
- Danville, Pa.-based Geisinger Health System has begun paying the salaries of extra nurses for both in-network and independent primary-care practices. The nurses manage patients’ chronic conditions, ensure that they are following prescribed treatments, and communicate with hospitalists and other providers about transitions of care. Although still in its early stages, the experiment suggests the nurses are helping to spot problems, prevent unnecessary hospitalizations, and save money.
The Geisinger experiment is among the first steps toward a patient-centered medical home model of care. An eventual Medicare-led expansion of such medical homes and accountable-care organizations, now in the early experimental stages, could provide even more direct support to PCPs. To be successful, though, Dr. O’Malley says the models will need to focus on paying providers fairly for the value they bring to the system. “Obviously, payment reform is what we need if we’re ever going to develop a sustainable primary-care workforce in this country,” she says. TH
Bryn Nelson is a freelance medical writer based in Seattle.
References
- White KL, Williams TF, Greenberg BG. The ecology of medical care. N Engl J Med. 1961;265:885-992.
- Green LA, Fryer GE Jr., Yawn BP, Lanier D, Dovey SM. The ecology of medical care revisited. N Engl J Med. 2001;344(26):2021-2025.
- Bodenheimer T, Grumbach K, Berenson RA. A lifeline for primary care. N Engl J Med. 2009;360(26):2693-2696.
Management Material
Eric Howell, MD, SFHM, is the first to admit how quickly it happened. Shortly after he became a hospitalist in 2000 at Johns Hopkins Bayview Medical Center in Baltimore, lower- and midlevel managers began to notice the quality of his daily clinical work. They reported their observations up the line, and soon Dr. Howell was rewarded with a small leadership role. He succeeded in that role, was given more responsibility, and in six short years he had worked his way up the management chain, becoming director of the medical center’s HM division.
“In hospital medicine, it’s fairly common to see young physicians stepping up into management,” says Patrick Cawley, MD, SFHM, a former SHM president who now directs the hospitalist program at the Medical University of South Carolina in Charleston and serves as medical director of the Medical University Hospital Authority. “The bottom line is they are there and they are getting noticed.”
On average, it takes about five years for a hospitalist to move into management; the average time for physicians in more established medical fields is 15 years or more, Dr. Cawley says. Part of the reason for the quick management rise in HM has to do with demographics. Because most hospitalists are younger, there is greater occasion for younger physicians who want to be in management to advance, says Timothy Keogh, PhD, an adjunct associate professor in the Department of Health Systems Management at Tulane University’s School of Public Health and Tropical Medicine in New Orleans, where he also directs the Master of Health Administration Program.
Another reason is that because hospitalists work in the hospital every day, they have innumerable opportunities to make an impression, Dr. Cawley says. They also know hospital culture, which gives them an advantage. “This is why hospitalists often get leadership positions,” he says. “Only by knowing the culture can you change the culture.”
Take the First Step
Although hospitalists are well positioned to assume management positions, it doesn’t mean an opportunity is going to fall into your lap. The best recipe for getting recognized—and promoted—is “doing the job you are currently doing really well,” Dr. Howell explains. “You have to do a good job on the basics.”
Often, physicians have their eye on a long-term goal and forget to focus on succeeding at their present work, Dr. Howell adds. That includes building relationships with lower- and mid-level managers like charge nurses, unit directors, and social work managers. That said, hospitalists who want to advance have to be proactive, Dr. Keogh says.
“Leadership is not only about hard work; leadership is about seeing the big picture and going above and beyond,” says Dr. Keogh, who is a member of the SHM Leadership Academy faculty.
The best place to show initiative is on a committee, and the easiest place to start is on a quality-improvement (QI) committee, Dr. Cawley says. If hospitalists are successful in that capacity, they can move on to peer review and credentials committees. From there, the next steps could be becoming first an officer, and then president, of the hospital’s medical staff.
“If you have the leadership skills, you can move up relatively quickly,” Dr. Cawley says. “Some people don’t need a lot of leadership training because they have it innately. But this isn’t true of the vast majority of people.”
Training Opportunities
The good news for the vast majority of hospitalists seeking a managerial role is that opportunities for training abound.
Fellowships are a good idea, but it’s critical that hospitalists interested in management choose the right one, Dr. Howell says. Select a fellowship program that focuses on areas important to the hospital—say, QI projects, patient-care initiatives, and system improvement.
Hospitalist Paul Grant, MD, considers the one-year HM fellowship he completed at the Cleveland Clinic Foundation an asset because he was able to gain expertise in perioperative medicine. The fellowship has served him well at the University of Michigan Health System in Ann Arbor, where he is director of perioperative medicine and consultative medicine.
“The fellowship really gives me an advantage,” says Dr. Grant, who notes he would like to assume a larger management role in the future.
Upward-thinking hospitalists should know something about budgeting, Dr. Keogh points out. Taking a budgetary course or two at a local community or technical college will not only provide a hospitalist the basics needed to understand and prepare budgets, but it also will demonstrate their willingness to master new skills that are important at the next level, he says.
An advanced degree, such as an MBA, a master’s degree in public health (MPH), or a master’s degree in medical management (MMM), can set hospitalists apart from their colleagues, Dr. Keogh says. These courses teach hospitalists how to excel at communication, how to implement change, and how to develop effective strategies.
Hospitalists can gain management-related skills from leadership courses tailored to physicians and healthcare professionals. SHM hosts two Leadership Academies per year (www.hospitalmedicine.org/leadership), and the American College of Physician Executives (www.acpe.org) and the American College of Healthcare Executives (www.ache.org) also offer leadership training, Dr. Cawley says.
Improve Weaknesses
You might want to consider communicating with upper-level managers (e.g., CMO, chief of staff, or vice president of medical affairs), but proceed cautiously, because there are right ways and wrong ways of reaching out. If you have a suggestion, ask to meet with an upper-level manager face to face to present the idea.
“Leadership is personal,” Dr. Cawley explains. “I think e-mails aren’t as effective as coming to sit down and converse.”
E-mail, however, can be used effectively to report on your project’s success. For example, Dr. Howell says he sent an e-mail about quality indicators to the president of the Johns Hopkins health system. When things went well—as they usually did—the president saw it. When things didn’t go as well, Dr. Howell put together a corrective action plan and e-mailed it along with the indicators to show he was aware of the situation and already had a plan in place to fix it.
“A lot of times [hospitalists] won’t be able to get to the next level and they’ll wonder why,” Dr. Cawley says. “They need to ask somebody they trust to give them an honest evaluation of what they’re doing well and what they may need to improve.”
Hospitalists must be open to constructive criticism, as honest assessments of your work aren’t going to be 100% complimentary. At times, they will be critical.
“Dealing with the feedback can be difficult, but ultimately it helps the hospitalist progress,” Dr. Cawley says. TH
Lisa Ryan is a freelance writer based in New Jersey.
Should hospitalists accept gifts from pharmaceutical, medical device, and biotech companies?

Recent discussions on conflicts of interest in medical publications underscore the significance of the important yet fragile relationship between the pharmaceutical industry and healthcare professionals. Among these is an examination of how academic departments can maintain a relationship with the industry.1 This study suggests that if appropriate boundaries are established between industry and academia, it is possible to collaborate. However, part of the policy in this investigation included “elimination of industry-supplied meals, gifts, and favors.”2
The Institute of Medicine’s “Conflict of Interest in Medical Research, Education, and Practice” included groundbreaking recommendations.3 Among them was a call for professionals to adopt a policy that prohibits “the acceptance of items of material value from pharmaceutical, medical device, and biotechnology companies, except in specified situations.”3
Our nation has been embroiled in a healthcare debate. Questions of right versus privilege, access versus affordability, and, of course, the perpetual political overlay have monopolized most of the discourse. Some contend that healthcare reform will redefine the current relationship between pharma and physicians . . . and not a moment too soon.
Lest there be ambiguity, though, the medical profession remains a noble vocation. This notwithstanding, until 2002, physicians freely participated in golf outings, received athletic tickets, and dined at five-star restaurants. But after the pharmaceutical industry smartly adopted voluntary guidelines that restrict gifting to doctors, we are left with drug samples and, of course, the “free lunch.” Certainly, pharma can claim it has made significant contributions to furthering medical education and research. Many could argue the tangible negative effects that would follow if the funding suddenly were absent.
But let’s not kid ourselves: There is a good reason the pharmaceutical industry spends more than $12 billion per year on marketing to doctors.4 In 2006, Rep. Henry Waxman (D-Calif.) said, “It is obvious that drug companies provide these free lunches so their sales reps can get the doctor’s ear and influence the prescribing practices.”2 Most doctors would never admit any such influence. It would be, however, disingenuous for any practicing physician to say there is none.
A randomized trial conducted by Adair et al concluded the “access to drug samples in clinic influences resident prescribing decisions. This could affect resident education and increase drug costs for patients.”5 An earlier study by Chew et al concluded “the availability of drug samples led physicians to dispense and subsequently prescribe drugs that differ from their preferred drug choice. Physicians most often report using drug samples to avoid cost to the patient.”6
Sure, local culture drives some prescribing practice, but one must be mindful of the reality that the pharmaceutical industry has significant influence. Plus, free drug samples help patients in the short term. Once the samples are gone, an expensive prescription for that new drug will follow. It’s another win for the industry and another loss for the patient and the healthcare system.
Many studies have shown that gifting exerts influence, even if doctors are unwilling to admit it. But patients and doctors alike would like to state with clarity of conscience that the medication prescribed is only based on clinical evidence, not influence. TH
Dr. Pyke is a hospitalist at Geisinger Wyoming Valley Medical Systems in Mountain Top, Pa.
References
- Dubovsky SL, Kaye DL, Pristach CA, DelRegno P, Pessar L, Stiles K. Can academic departments maintain industry relationships while promoting physician professionalism? Acad Med. 2010;85(1):68-73.
- Salganik MW, Hopkins JS, Rockoff JD. Medical salesmen prescribe lunches. Catering trade feeds on rep-doctor meals. The Baltimore Sun. July 29, 2006.
- Institute of Medicine Conflict of Interest in Medical Research, Education and Practice Full Recommendations. 4-28-09.
- Wolfe SM. Why do American drug companies spend more than $12 billion a year pushing drugs? Is it education or promotion? J Gen Intern Med. 2007;11(10):637-639.
- Adair RF, Holmgren LR. Do drug samples influence resident prescribing behavior? A randomized trial. Am J Med. 2005;118(8):881-884.
- Chew LD, O’Young TS, Hazlet TK, Bradley KA, Maynard C, Lessler DS. A physician survey of the effect of drug sample availability on physicians’ behavior. J Gen Intern Med. 2000;15(7):478-483.
Should hospitalists accept gifts from pharmaceutical, medical device, and biotech companies?

The pharmaceutical industry is big business, and its goal is to make money. If the industry can convince physicians to prescribe its medicines, then it makes more money.
Although pharmaceutical representatives brief physicians on new medications in an effort to encourage the use of their brand-name products, they also provide substantive information on the drugs that serves an educational purpose.
In the past, pharmaceutical companies—along with the medical device and biotechnology industries—showered physicians with expensive gifts, raising ethical questions about physicians’ obligation to the drug companies. Fair enough. These excessive practices were identified and curtailed—to my knowledge—some years ago.
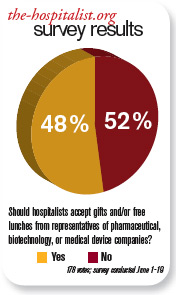
Watchdog groups, however, have continued to call into question every suggestion of “being in the pay” of big pharma. Everything from a plastic pen to a piece of pizza is suspect. There is considerable concern that practicing clinicians are influenced by the smallest gesture, while many large medical institutions continue to accept pharmaceutical-company-funded research grants. If big-pharma investment in research does not corrupt institutions, why is it assumed that carrying a pharmaceutical pen has such a pernicious effect on clinicians?
As a corollary to this question, does anyone really want to discontinue these important research studies just because they are funded by industry dollars?
Listening to drug representatives—even being seen in the vicinity—raises the eyebrows of purists. Do we really want physicians completely divorced from all pharmaceutical company education and communication? Do we feel there is zero benefit to hearing about new medications from the company’s viewpoint?
If physicians completely shut out the representatives, it would be expected that pharmaceutical companies would direct their efforts elsewhere—most likely, to consumers. Is that a better and healthier scenario?
Clearly, there is potential for abuse in pharmaceutical gifts to physicians. The practice should be controlled and monitored. The suspicions raised by purist groups that physicians’ prescribing habits are unalterably biased after a five-minute pharmaceutical representative detail and a chicken sandwich is hyperbole. The voice of reason is silenced in the midst of the inquisition.
In the academic setting, fear of being accused of “bought bias” has physicians clearing their pockets of tainted pens and checking their desks for corrupting paraphernalia. The positive aspects of pharma-sponsored programs and medical lectures are lost for fear of appearing to be complicit with drug companies.
The Aristotelian Golden Mean is superior to extreme positions, and I submit that the best road is the center. Listen to what the drug company representatives have to say, just like you listen to a car salesman: You can learn from both—as long as you research the data and form your own opinion. TH
Dr. Brezina is a hospitalist at Durham Regional Hospital in North Carolina.
The pharmaceutical industry is big business, and its goal is to make money. If the industry can convince physicians to prescribe its medicines, then it makes more money.
Although pharmaceutical representatives brief physicians on new medications in an effort to encourage the use of their brand-name products, they also provide substantive information on the drugs that serves an educational purpose.
In the past, pharmaceutical companies—along with the medical device and biotechnology industries—showered physicians with expensive gifts, raising ethical questions about physicians’ obligation to the drug companies. Fair enough. These excessive practices were identified and curtailed—to my knowledge—some years ago.
Watchdog groups, however, have continued to call into question every suggestion of “being in the pay” of big pharma. Everything from a plastic pen to a piece of pizza is suspect. There is considerable concern that practicing clinicians are influenced by the smallest gesture, while many large medical institutions continue to accept pharmaceutical-company-funded research grants. If big-pharma investment in research does not corrupt institutions, why is it assumed that carrying a pharmaceutical pen has such a pernicious effect on clinicians?
As a corollary to this question, does anyone really want to discontinue these important research studies just because they are funded by industry dollars?
Listening to drug representatives—even being seen in the vicinity—raises the eyebrows of purists. Do we really want physicians completely divorced from all pharmaceutical company education and communication? Do we feel there is zero benefit to hearing about new medications from the company’s viewpoint?
If physicians completely shut out the representatives, it would be expected that pharmaceutical companies would direct their efforts elsewhere—most likely, to consumers. Is that a better and healthier scenario?
Clearly, there is potential for abuse in pharmaceutical gifts to physicians. The practice should be controlled and monitored. The suspicions raised by purist groups that physicians’ prescribing habits are unalterably biased after a five-minute pharmaceutical representative detail and a chicken sandwich is hyperbole. The voice of reason is silenced in the midst of the inquisition.
In the academic setting, fear of being accused of “bought bias” has physicians clearing their pockets of tainted pens and checking their desks for corrupting paraphernalia. The positive aspects of pharma-sponsored programs and medical lectures are lost for fear of appearing to be complicit with drug companies.
The Aristotelian Golden Mean is superior to extreme positions, and I submit that the best road is the center. Listen to what the drug company representatives have to say, just like you listen to a car salesman: You can learn from both—as long as you research the data and form your own opinion. TH
Dr. Brezina is a hospitalist at Durham Regional Hospital in North Carolina.
To Err is Human

The challenges facing SHM are very different than they were 10 years ago. In the 1990s, the focus was on building a society that would represent the needs of the practicing hospitalist. Converting NAIP, with its 200 members, to SHM, with its now 10,000 members, was certainly no easy task, but the society then enjoyed some luxuries no longer afforded to an organization the size of the modern-day SHM. Early on, SHM was far from the public eye, escaping public scrutiny for each of its actions. With only a few hundred members, the society was intimate: Almost every member knew of every action before it happened. And the agenda, compared with today’s standards, was reasonably focused.
But times are different now. The organization is much larger and complex, and the challenges we now face are collectively a product of our success. SHM is squarely in the spotlight; every decision is closely monitored by the public eye. We now have a voice such that when we speak, people listen. But with greatness comes responsibility, and because we are in the spotlight, we must be especially careful in how we speak, lest the message be misunderstood. Further, with more than 10,000 members, 50 full-time staff, 44 committees, and nearly 500 physician volunteers, the organization no longer has the luxury of every action being known by every member prior to its enactment.
More challenging still is our agenda, which has grown to be a diverse and far-reaching strategy. While impressive and admirable, the size of this “footprint” creates new challenges in balancing the need to be “nimble” (i.e., being able to act quickly enough to be timely and effective) versus being “thorough” (i.e., ensuring that each action is appropriately vetted prior to execution).
I suspect that there are few practicing hospitalists who have not read To Err is Human or Crossing the Quality Chasm.1,2 Both make this essential point about quality: In complex systems, mistakes are bound to happen. And when errors do occur, each member of the team must be ready to take responsibility for the mistake, and immediately begin seeking systematic solutions to ensure that it does not happen again. SHM’s focus is to advance quality for all hospitalized patients. But an organization can only be effective if it emulates the principles that it hopes its members will individually espouse.
So let me start with this: There have been mistakes along the way.
That’s the hard truth. I believe that none of the mistakes have been intentional; rather, these missteps have been a product of an organization that has grown so fast, and whose success has gained so much public attention, that its infrastructure has struggled to keep pace with its growth. Any hospitalist who has seen his or her service size double in the span of a year or two knows of what I speak: As growth occurs, the approach to dealing with daily business has to evolve to meet new demands. If it does not, errors result.
One of the areas in which SHM’s growth has outpaced its policies and procedures regards SHM’s relationship with industry. I will say from the outset that having relationships with industry is not in and of itself a mistake. The reality is that without such relationships, in the setting of a landscape where governmental and philanthropic funding is disproportionately in deficit to the need, it would be almost impossible to advance the quality initiatives that have defined SHM’s success. SHM has, and will likely continue to have, relationships with industry. But requisite for having these relationships, especially for an organization that is a national leader, is going above and beyond the minimum standards to ensure transparency and ethics.
Two years ago, SHM began the arduous process of reviewing its partnerships and how it interacts with industry. I am pleased to announce that this has culminated in the Council of Medical Specialty Societies (CMSS; www.cmss.org) asking SHM to apply to become an affiliate member. Acceptance of SHM into CMSS is evidence of SHM’s demonstrated compliance with CMSS’s requirements, with respect to industry relationships, disclosure of conflicts of interest, and other measures of organizational transparency, all of which can be found at www.hospitalmedicine.org/industry.
But meeting the minimum standards has never been sufficient for SHM. The cost of greatness is responsibility, and as a national leader, SHM has a responsibility to ensure that its approaches to potential conflicts of interest and external relationships are above reproach.
COI Disclosure
The conflict of interest statements for each board member have long been posted on the SHM website. In an effort to go above and beyond the minimum standards, the format of the disclosure form has been revised, making it the most compete and detailed COI disclosure form of any physician organization in the country. In the coming months, SHM will make even tighter restrictions regarding disclosing potential conflicts of interest. While board members are required to report any and all financial receipts, the amended version will require board members who receive any contribution in excess of $5,000 to provide a detailed narrative as to what was required in service for the receipt of those funds. Further, to ensure collective accountability, any board member may call upon any other board member to provide a similarly detailed description of any item on his or her COI disclosure form.
Recognizing that other leaders in the organization might also have influence over important decisions, thereby being at risk for a conflict of interest, SHM is one of the first physician organizations to require public reporting of COI disclosures for all editors, course directors, and senior staff.
Next year, all committee chairs and quality-improvement (QI) project leaders will be required to submit similar COI disclosures.
But reporting potential conflicts is one thing; ensuring that those with significant conflicts are not put in a position of inescapable conflict of interest by virtue of their appointments is another. To be proactive, the executive committee has a designated meeting each year to individually review each nominee being considered for election to the board, committee chairs, editors, and course directors prior to their appointment.
The society will enforce CMSS Standard 1.4, which prohibits key society leaders (president, past-president, president-elect, CEO, editors, course directors) from having direct financial relationships with companies during his or her term of service. All people seeking such positions will be required to attest, at the time of the nomination, to cease all direct financial relationships prior to seeking office; failure to do so will negate their candidacy for the position they seek.
External Communications Regarding Industry
It is one thing to have potential conflicts disclosed on a website; it is quite another to ensure, with 100% confidence, that all recipients of all communications from SHM are aware of this website. Reminding all representatives of SHM to alert communication recipients to our potential conflicts of interest is a good start, but in quality parlance, this is tantamount to “telling people to try harder,” which is rarely an effective strategy to ensure 100% compliance. In response, SHM has designed a fail-safe systems solution to ensure that every communication alerts the recipient to SHM’s potential conflicts of interest. Beginning this year, SHM letterheads and e-mail, used for all written communications with external parties, will carry the following statement on the bottom of each page: “To Learn More About SHM’s Relationship with Industry Partners, Visit www.hospitalmedicine.org/industry.”
One of SHM’s missteps over the years has been the failure to distinguish external communications regarding pharmaceuticals/devices as being different from the organization’s other nonpharmaceutical communications. This unintentional oversight has been a product of the exponential increase in the society’s external communications during the past 10 years. But nonetheless, the distinction between these types of communications is important, especially for a society that receives industry support for its quality initiatives.
At the August board meeting in Chicago, a special ad hoc committee was appointed to develop specific policies regarding SHM’s communication strategy. This committee will bring to the board in November the following policy for approval: “Before SHM makes a specific comment, writes a letter, or posts an official statement on the SHM website about a pharmaceutical agent, a medical device, a specific disease state, or any medical IT services or products, the communication must be approved by the Executive Committee and reflected in the minutes of the Executive Committee. At the President’s discretion, the proposed communication will be brought to the entire Board for discussion and approval.”
As noted below, all agendas and decisions by the executive committee are communicated to the board, further ensuring accountability and oversight for any such decision.
Choices and Definitions
In the early years, all external relationships were initiated by SHM. Because SHM was a relative unknown on the national scene, if a relationship was to be entertained, it was based on SHM’s initiative to do so. Naturally, the smaller number of relationships, and the fact that the choice and nature of the relationship were initiated by SHM, made it easier to define the scope of such relationships. But now things are different: SHM’s agenda now encompasses a vast set of domains, and SHM is regularly on the receiving end of invitations to establish relationships with other organizations. Once again, as a leader of medical specialty organizations, SHM’s policies and procedures have to adapt to fit the needs of a larger and more diverse organization.
An intense amount of work has been devoted to evolving the mechanism by which SHM chooses and defines its relationships. An ad hoc committee from the board of directors has defined the 10 principles of SHM’s business relationships (see “10 Principles of SHM Business Relationships,” p. 42). In November, the board will adopt policies and procedures that will ensure that SHM will continue to only enter into relationships with external organizations with which it shares common interests or goals for advancing the quality and safety of patient care. SHM will continue to avoid influence from external organizations with respect to the policies, conduct, actions, and priorities of SHM.
Further, by policy, SHM will continue to reserve absolute control over all content and speakers at its educational conferences; content will continue to not be influenced by brand or product consideration during development or revisions. All potential partners will be informed from the outset that a partnership with SHM does not imply that SHM endorses the policies, values, and missions of the partner organization; any significant deviation from the values and mission of SHM will dissolve the partnership. SHM will establish from the outset that a partnership does not imply SHM’s support or endorsement of any products from a partner. As noted above, transparency of these relationships will be of paramount importance: All relationships, including the dollar amounts received as a product of those relationships, will be posted on SHM’s website.
Transparency in Decision-Making
As noted from the outset, the benefit of small organizations with limited agendas is that every member knows every decision. With limited decisions to be made, the vetting and review process is virtually assured. As organizations grow, as agendas expand exponentially, and as the pace quickens, the multiperson review of each decision becomes difficult to assure. The result is that errors start to appear—not due to intentional wrongdoing, but because the luxury of intense oversight is lost as the organization expands. For an organization to grow and still maintain oversight of its decision-making process, it is vital that the organization evolve to develop new methods of accountability and transparency.
To meet this need, SHM has enacted a change in its communication infrastructure to ensure “double-checks” for all of the important organizational decisions. An SHM leadership and staff “wiki” has been developed to promote and ensure transparency of all organizational decisions. Because it is accessible only to the SHM staff, board, and committee chairs, the wiki is invisible to the SHM membership. Nonetheless, you should know of this important innovation.
The wiki requires that all committee chairs post the results of their committee activities. This ensures that staff and committee leadership are on the same page, ensures that other committees are not duplicating work, augments collaboration across committees, and, most importantly, ensures collective accountability for each decision made.
Technology-based innovations have been enacted to improve the transparency of the executive leadership of the organization. The board of directors meets four times a year; the purpose of the board is to ensure oversight for all SHM decisions. Because the board comprises exclusively volunteer members meeting only four times a year, it is practically impossible for the board to approve every decision made by an organization as large as SHM. To ensure the necessary efficiency and effectiveness (i.e., being sufficiently “nimble” to act on important issues in between scheduled board meetings), the executive committee (EC) was established years ago. The EC, comprised of the president, the past-president, the president-elect, and the CEO, meets every two weeks via teleconference to review and approve all essential SHM decisions.
As an innovation to augment accountability and transparency, the agenda and minutes of the EC are now posted on the SHM board portal, allowing all board members to review and comment upon the decisions made by the president, the CEO, or the EC as a whole. Any board member, at any time, can request that the full board be convened to review an agenda item or decision.
And underlying all of these initiatives to improve an already exceptional organization are the tireless efforts of the SHM staff. Though there are nearly 50 staff members now, each continues to do the work of multiple people. SHM is arguably the fastest-growing organization in history, and advancing the organization to level after level has been an exceptional challenge. But regardless of the challenge, SHM leadership and staff has come through. I have no doubt that during this next chapter in SHM’s history, the result will be the same.
SHM is committed to advancing quality. Intrinsic to the “culture of quality” is the commitment to honesty, transparency, and ethics. Any permutation of the society that does not fully exemplify these standards will be ineffective in accomplishing our wished-for goal. In short, the actions of the society must model those that we wish to inspire in the day-to-day practice of our members. Although the unprecedented growth of the society is responsible for errors in the past, the importance of admitting our shortcomings is no less significant. We’ve had some missteps along the way, and while these mistakes are a product of events preceding my tenure, it does not matter. As president of the organization, I am taking responsibility for them, with a pledge to devote all time and energy, with all due speed, to finding systematic solutions that will prevent these errors from happening again.
And let me be even more honest. As we go forward, there are probably going to be more missteps; such is the nature of a growing and active organization. I cannot promise an error-free organization, but I can promise that if and when errors are made in the future, the same intensity will be applied to seek systematic solutions to ensure that we continue to evolve in becoming an organization that is emblematic of quality. Such is the promise of SHM; such is the promise of the hospitalist. TH
Dr. Wiese is president of SHM.
References
- Kohn LT, Corrigan JM, Donaldson MS, et al. To Err Is Human: Building a Safer Health System. Washington, D.C.: National Academies Press; 2000.
- Institute of Medicine Committee on Quality Health Care in America. Crossing the Quality Chasm: A New Health System for the 21st Century. Washington, D.C.: National Academies Press; 2001.
28,999 and Me
How many people have to die before you’ll pay attention? Like many of you, I read the article but it didn’t really stick. Rather, I filed it in the “interesting tidbits” folder on my brain’s hard drive. Somehow 29,000 people with cancer just didn’t register as a big number.
Until I thought I could be one of them.
The Number
I was harried, running late for a meeting, questioning my decision to try to shoehorn a PCP appointment into my lunch break. Then again, this was a routine follow-up of some labs and I, of course, am the picture of health. Well, I am if you exclude my LDL. It turns out that on a check 12 months earlier, my LDL was found to be running a few heart attacks higher than normal. I took this as a sign, combined with my ballooning waist, middle-ish age, and nagging wife, that I needed to do something.
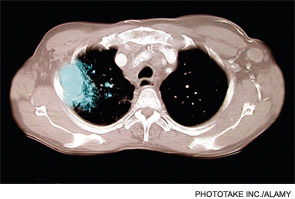
Still, I wasn’t ready for “something” to include an anticholesterol medication. Instead, I chose the masochistic route and hit the treadmill. And the bike. And a little less of the dinner plate. As a result, I had lost 30 pounds, a handful of pant sizes and, while I wasn’t exactly “in shape,” I did find myself shaped a little less like the Michelin Man.
Triumphantly, I was returning to vanquish my tormentor—the PCP who foolhardily recommended I start a medication.
Sitting in the office awaiting the news of my post-weight-loss cholesterol, my grin was wide and smug—and apparently still overflowing with LDL. I was devastated. 259? I lose weight and my LDL actually goes up!?! I could feel the foam cells in my coronary plaques twitch with delight as they mockingly gorged on chylomicrons.
Undeterred, I inquired what my options were, secretly hoping the answer would be more red wine. Emboldened by my supersaturated serum, my PCP declared it was time for a statin. Alternatively, he noted that I could get a CT angiogram of my coronaries and, if they were clean, I potentially could bypass drug therapy. Thoughts of avoided myalgias happily flittered across my mind until they stumbled onto the number 29,000. It was then that I recalled the recent Archives of Internal Medicine paper.1
The Study
Using risk models based on the known biological effects of radiation, researchers estimated that approximately 29,000 people would develop cancer from the radiation associated with CT scans in 2007 alone. To arrive at this number, the authors used data showing that 1.5% to 2% of all U.S. cancers could be traced to the radiation from CT scans.
Not surprisingly, the most commonly utilized CT scans—namely, abdominal (14,000 a year), chest (4,100 a year), and head (4,000 a year)—accounted for the most morbidity. However, CT angiography, with its super-high dose of radiation, was projected to contribute 2,700 cancers a year. Apparently, my PCP didn’t read this article.
In terms of types of malignancy, lung cancer leads the list with 6,200 projected CT-induced cancers per year, followed by colon cancer (3,500 a year) and leukemia (2,800 a year).
The Names
If the numbers from this study hold, then about 1 in every 2,000 CT scans results in a new cancer. That would mean that I’ve dished out several cancers during my practice. In fact, I’ve ordered many thousand CT scans over my career—give or take a cancer. So my pen has, statistically, caused approximately three cancers.
I wondered which three patients it was. Was it Mr. Reynolds, who would’ve very likely died had we not diagnosed his post-operative abdominal abscess? Perhaps it was Mr. Jenson, who surely would have fared poorly if his pulmonary embolism had not been diagnosed and treated. Maybe it was Mrs. Hernandez, who wouldn’t have received thrombolytics for her stroke without a head CT.
Yes, I might have played a role in causing cancer in these three patients, but I did so knowing that I also saved, or at least improved, their lives. Most patients would accept that calculus.
But what if it were a different three? What if my cancer was that head CT I ordered for Mr. Davidson’s confusion, even though I know that head scans are rarely helpful in the evaluation of delirium? Perhaps my cancer-causer was that abdominal CT scan for Mrs. Ramirez’s chronic pain, which was clearly referable to her irritable bowel syndrome. Maybe it will be that CT scan I ordered last week because the patient insisted it be done, even though I strongly suspected, correctly, that it wouldn’t alter my management.
Which three would it be?
The Questions
This triggered more questions. How many of the 70 million-plus CT scans we order every year really are necessary? How many could be avoided by a robust physical examination, crisper clinical reasoning, or an alternate test? Do our patients really know the risk of these “innocuous” tests? Do we?
And, more personally, what if my PCP was still sitting on two? Would I be his number three?
Moving forward, I vow to remember 29,000. It will remain in the forefront of my mind, constantly badgering me about the next CT scan I order. To be sure, I will continue to order CTs—a lot of CTs. However, I will do so through the prism of the following query. If a patient developed a cancer from the CT scan I was about to order, could I sincerely look them in the eye and tell them I would do the test again?
And I’m agitated by one final question. How is that it took my own carcinogenic brush with CT scans for me to realize the gravity of 29,000? It’s not that 29,000 is not a big number. In fact, it’s precisely because it is a big number that we miss its importance. It’s too easy to hide behind the anonymity of the number. Because in the end, numbers don’t have names until the name is yours. TH
Dr. Glasheen is associate professor of medicine at the University of Colorado Denver, where he serves as director of the Hospital Medicine Program and the Hospitalist Training Program, and as associate program director of the Internal Medicine Residency Program.
Reference
- Berrington de González A, Mahesh M, Kim KP, et al. Projected cancer risks from computed tomographic scans performed in the United States in 2007. Arch Intern Med. 2009;169(22):2071-2077.
How many people have to die before you’ll pay attention? Like many of you, I read the article but it didn’t really stick. Rather, I filed it in the “interesting tidbits” folder on my brain’s hard drive. Somehow 29,000 people with cancer just didn’t register as a big number.
Until I thought I could be one of them.
The Number
I was harried, running late for a meeting, questioning my decision to try to shoehorn a PCP appointment into my lunch break. Then again, this was a routine follow-up of some labs and I, of course, am the picture of health. Well, I am if you exclude my LDL. It turns out that on a check 12 months earlier, my LDL was found to be running a few heart attacks higher than normal. I took this as a sign, combined with my ballooning waist, middle-ish age, and nagging wife, that I needed to do something.
Still, I wasn’t ready for “something” to include an anticholesterol medication. Instead, I chose the masochistic route and hit the treadmill. And the bike. And a little less of the dinner plate. As a result, I had lost 30 pounds, a handful of pant sizes and, while I wasn’t exactly “in shape,” I did find myself shaped a little less like the Michelin Man.
Triumphantly, I was returning to vanquish my tormentor—the PCP who foolhardily recommended I start a medication.
Sitting in the office awaiting the news of my post-weight-loss cholesterol, my grin was wide and smug—and apparently still overflowing with LDL. I was devastated. 259? I lose weight and my LDL actually goes up!?! I could feel the foam cells in my coronary plaques twitch with delight as they mockingly gorged on chylomicrons.
Undeterred, I inquired what my options were, secretly hoping the answer would be more red wine. Emboldened by my supersaturated serum, my PCP declared it was time for a statin. Alternatively, he noted that I could get a CT angiogram of my coronaries and, if they were clean, I potentially could bypass drug therapy. Thoughts of avoided myalgias happily flittered across my mind until they stumbled onto the number 29,000. It was then that I recalled the recent Archives of Internal Medicine paper.1
The Study
Using risk models based on the known biological effects of radiation, researchers estimated that approximately 29,000 people would develop cancer from the radiation associated with CT scans in 2007 alone. To arrive at this number, the authors used data showing that 1.5% to 2% of all U.S. cancers could be traced to the radiation from CT scans.
Not surprisingly, the most commonly utilized CT scans—namely, abdominal (14,000 a year), chest (4,100 a year), and head (4,000 a year)—accounted for the most morbidity. However, CT angiography, with its super-high dose of radiation, was projected to contribute 2,700 cancers a year. Apparently, my PCP didn’t read this article.
In terms of types of malignancy, lung cancer leads the list with 6,200 projected CT-induced cancers per year, followed by colon cancer (3,500 a year) and leukemia (2,800 a year).
The Names
If the numbers from this study hold, then about 1 in every 2,000 CT scans results in a new cancer. That would mean that I’ve dished out several cancers during my practice. In fact, I’ve ordered many thousand CT scans over my career—give or take a cancer. So my pen has, statistically, caused approximately three cancers.
I wondered which three patients it was. Was it Mr. Reynolds, who would’ve very likely died had we not diagnosed his post-operative abdominal abscess? Perhaps it was Mr. Jenson, who surely would have fared poorly if his pulmonary embolism had not been diagnosed and treated. Maybe it was Mrs. Hernandez, who wouldn’t have received thrombolytics for her stroke without a head CT.
Yes, I might have played a role in causing cancer in these three patients, but I did so knowing that I also saved, or at least improved, their lives. Most patients would accept that calculus.
But what if it were a different three? What if my cancer was that head CT I ordered for Mr. Davidson’s confusion, even though I know that head scans are rarely helpful in the evaluation of delirium? Perhaps my cancer-causer was that abdominal CT scan for Mrs. Ramirez’s chronic pain, which was clearly referable to her irritable bowel syndrome. Maybe it will be that CT scan I ordered last week because the patient insisted it be done, even though I strongly suspected, correctly, that it wouldn’t alter my management.
Which three would it be?
The Questions
This triggered more questions. How many of the 70 million-plus CT scans we order every year really are necessary? How many could be avoided by a robust physical examination, crisper clinical reasoning, or an alternate test? Do our patients really know the risk of these “innocuous” tests? Do we?
And, more personally, what if my PCP was still sitting on two? Would I be his number three?
Moving forward, I vow to remember 29,000. It will remain in the forefront of my mind, constantly badgering me about the next CT scan I order. To be sure, I will continue to order CTs—a lot of CTs. However, I will do so through the prism of the following query. If a patient developed a cancer from the CT scan I was about to order, could I sincerely look them in the eye and tell them I would do the test again?
And I’m agitated by one final question. How is that it took my own carcinogenic brush with CT scans for me to realize the gravity of 29,000? It’s not that 29,000 is not a big number. In fact, it’s precisely because it is a big number that we miss its importance. It’s too easy to hide behind the anonymity of the number. Because in the end, numbers don’t have names until the name is yours. TH
Dr. Glasheen is associate professor of medicine at the University of Colorado Denver, where he serves as director of the Hospital Medicine Program and the Hospitalist Training Program, and as associate program director of the Internal Medicine Residency Program.
Reference
- Berrington de González A, Mahesh M, Kim KP, et al. Projected cancer risks from computed tomographic scans performed in the United States in 2007. Arch Intern Med. 2009;169(22):2071-2077.
Volume Control, Part II

Last month I began looking at ways hospitalist practices can manage unpredictable increases in patient volume, also known as surge staffing. I provided my view of a “jeopardy” system and a patient volume cap for hospitalists. While both are potentially very effective, they have a high cost and in my view are imperfect solutions. This month I’ll examine some less common strategies to provide surge staffing. Although less popular, I think these options are more valuable.
Schedule More Providers
I’ve worked with a lot of practices and am struck by how patient volume for nearly all of them falls within a reasonably predictable range. While no one can predict with certainty which days will be unusually busy or slow, nearly all practices have a range of daily encounters that is roughly half to 1 1/2 of the mean. For example, if a practice has a mean of 60 billable encounters per day, it probably ranges from about 30 to 90 encounters on any given day. (The larger the practice, the more likely they are to conform to this range. Small practices, with average daily encounters fewer than 20, have a much wider range of daily volumes as a percent of the mean.)
Despite knowing that volumes will vary unpredictably, most practices provide the same fixed “dose” of provider staffing every day—that is, the single most common model for staffing and scheduling is to provide a fixed number of day-shift doctors (“rounders”) who work a fixed number of hours. For example, with an average of 60 billable encounters a day, a hospitalist group might decide to staff with four day-shift rounders working 12-hour shifts. This equates to a fixed 48 hours of daytime staffing. This is reasonable until the busy days arrive. Those four doctors will be much busier than average when there are 90 patients to see in a day, and will probably have a hard time seeing 22 or 23 patients each during their 12-hour shift. If such a busy day occurs more than a couple of times annually, then the practice should probably make some changes.
One approach to solving this type of staffing predicament is to add a fifth day-shift rounder. In other words, when making staffing decisions, consider giving more weight to the busiest days than the average day. This sounds fine until thinking about the practice budget. It will be pretty expensive to add doctors every day just so there are enough on duty when things get really busy. But if the hospitalists are willing to accept reduced compensation, then it might be financially reasonable to go ahead and add staff. This is easiest to do when the hospitalists are paid a significant (e.g. ≥50%) portion of their income based on their productivity, which will enable the hospitalists themselves to have a lot of say about when it is time to add staff. (Being paid on a nearly fixed annual salary means that it is the finance person who usually has the say about when it is time to add staff. And you can bet he’ll be making staffing decisions based on the average daily encounters, rather than the busy days.)
My own preference would be to do just that: Accept a reduction in compensation in return for protection against really busy and stressful days. I’m not suggesting others should agree with me, and in my experience, most don’t. (My own practice partners don’t agree with me on this one.) So I’m not really recommending it as a best practice, but I want to ensure that you don’t forget it is an option. And keep in mind you could adjust staffing by degrees; some settings might add a half-time physician or a nonphysician provider to try to find the sweet spot between having enough staff on duty every day to handle surges in volume and the cost of that staffing to the employer—or the hospitalists themselves.
Of course, if I were willing to reduce my compensation and average daily workload, then I would expect to be freed from the expectation that all rounding doctors work 12-hour shifts. Let’s turn our attention to the interplay between fixed day-shift durations and surge staffing.
Fixed-Shift Schedules Inhibit Surge Capacity
I think it usually is best to avoid fixed durations for day shifts. It might be necessary to require at least one daytime rounder to stay at least until a specified time (e.g. the arrival of the night-shift doctor), but in most cases it is reasonable for some rounders to leave when their work is done. They might need to continue responding to pages until the start of the night shift, but it usually isn’t necessary to have all rounders in the hospital until a predetermined end of the shift.
The problem is that when shifts have a fixed duration, the providers will focus on the start and stop time of their shift and might be unwilling to work beyond it. If instead there are no clearly fixed start and stop times for each day shift, then the hospitalists are likely to be willing to simply work longer on busy days, as long as they can work shorter on slow days. This is probably the most effective method of surge capacity, and it fits well with staffing each day with more providers than are required for the average patient volume.
Simply having the rounding doctors work longer on busy days must be done within reason. And there is a really wide range of opinion about what is reasonable. I think it is reasonable if a hospitalist works two or three hours longer than usual for three or four consecutive busy days, as long as the hospitalist is allowed to work less on days that are not very busy. But just what is a reasonable maximum daily amount of work for even one day is a topic that can lead to passionate debate. You’ll have to decide the details of what is and isn’t acceptable in your group.
Unit-Based Assignments
Aside from fixed-duration day shifts, unit-based assignment of hospitalists is the most common practice inhibiting surge capacity. Not long ago I worked with a practice that followed very strict unit-based assignments, which significantly inhibited “load-leveling,” and thus surge capacity. On any given day the patient volume for the whole practice might be very reasonable, but because it was never distributed evenly among the rounders, there was a very good chance that at least one doctor was drowning in work. And because of the strict approach, the other doctors didn’t come to the rescue.
I think the only reasonable approach is to deviate from such a strict unit-based assignment, at least a little. One rounder could be a utility doctor who doesn’t have her own unit and instead roams throughout the hospital, having been assigned patients based on the workload of each of her unit-based colleagues. TH
Dr. Nelson has been a practicing hospitalist since 1988 and is cofounder and past president of SHM. He is a principal in Nelson Flores Hospital Medicine Consultants (www.nelsonflores.com) and codirector and faculty for SHM’s “Best Practices in Managing a Hospital Medicine Program” course. This column represents his views and is not intended to reflect an official position of SHM.
Should HM Redefine Its Role as Provider and Adjust Expectations for Inpatient Care?

Did you happen to read a recent New York Times article (www.nytimes.com/2010/05/27/us/27hosp.html) about hospitalists? I thought the article was great, but I was surprised by some of the negative reader feedback. What did you think?
George Eppley, MD
Reed, Ga.
Dr. Hospitalist responds: I read the NYT article by Jane Gross, “New Breed of Specialist Steps in for Family Doctor,” which was published May 26. The accompanying reader comment section is available at http://newoldage.blogs.nytimes.com/2010/05/26/in-hospitals-new-fingers -on-the-pulse/?ref=us.
The article provides the statistics that all of us in HM have come to know: HM is the fastest-growing medical specialty in the U.S. and, over the past decade, the number of hospitalists in the U.S. has grown from hundreds to 30,000. Gross talks about the care a hospitalist at the Hospital of the University of Pennsylvania provides for her patient. She highlights the challenges of transitions of care and references the work being done by hospitalists and SHM to make sure patients are making safe transitions. While the article was largely supportive of HM, she does provide a shade of balance when she mentions the risks to the patient when hospitalists fail to do their job when it comes to communication.
As a practicing hospitalist, I kind of wished I had stopped reading at the end of the article. I honestly did not like most of what I read in the reader comment section. Although the article was a feel-good story, I think it is fair to say the reader comments were largely negative. I understand that readers with negative experiences with hospitalists might be more likely to post a comment; nevertheless, some of the comments are hard to ignore—mainly because I suspect some of it is true.
One reader from Raleigh, N.C., wrote, “Hospitalists proved inept at contacting the patients’ existing doctors or even talking to the patients. Then, on discharge to nursing homes for further recovery, the ball was dropped further, with very poor communication of medication dosages, etc.” Yikes! What happened to the communication and the medication reconciliation process?
A reader from Massachusetts wrote about “the hospitalist … (who) ordered five blood draws in the space of several hours to replicate tests that had already been taken by the primary-care physician before admission.” So, not only are hospitalists poor communicators and do not do a good job with transitions of care, but their care is also driving up the cost of healthcare needlessly?
The most positive comments seem to come from outpatient providers and, quite honestly, I found them lukewarm at best. A PCP from Charleston, S.C., wrote, “I no longer have to cancel the appointments of the patients at the last minute in order to attend to an emergency occurring outside my office. It is a very efficient system.” Glad to hear the hospitalist relationship is working out for you, Dr. PCP, but as a patient in the hospital, I am worried more about the competency of this doctor, whom I have never met before this hospitalization, as opposed to how this doctor is going to make you more “efficient” in your office practice.
I came away with several thoughts after reading the article and the comments.
First, we need to set the right expectations. Is this the equivalent of the star athlete who makes a brash statement followed shortly thereafter by the statement, “I was misquoted”? Well … maybe. Are we who we say we are? The headline is “New Breed of Specialist Steps in for Family Doctor.”
As a practicing hospitalist, I never describe myself as replacing the family doctor, because this is the worst position I could put myself in. A patient might have a relationship with a family doctor for three or four decades. This family doctor might not only care for this patient, but also his children and grandchildren. The patient visits the family doctor at least once a year for a checkup. But when the patient is as sick as they have ever been in their life and needs their family doctor whom they trust, I am supposed to “step in” for this family doctor? Good luck trying to meet that standard. It’s like putting me next to Justin Timberlake on stage at a teenybopper concert. Who do you think is going to look better in that sort of comparison?
We, as hospitalists, should never allow anyone to think we are replacing their family doctor. We are here to work with the family doctor to provide the best care possible. Do surgeons, medical subspecialists, or ED doctors “replace” the family doctor? No way! They are working with the family doctor. Perhaps the problem here is that we have not set the appropriate expectations for our patients.
Next, we need to be clear in saying what we say we do or doing we what we say we do. A line in this article bothers me more than any of the reader comments: “The most compelling argument in favor of hospitalists, who are now in 5,000 institutions, from academic giants like the Hospital of the University of Pennsylvania to small community hospitals to innovators like the Mayo and Cleveland Clinics—is that they are there all the time.”
Why does it bother me so much? It is troubling because it is misleading and might simply be untrue. Many hospitalists are not there “all the time.” While many of our hospitalist programs have providers in the hospital 24 hours a day, many do not. I know a number of hospitalists who make rounds at multiple hospitals throughout the day. Are they really hospitalists or are they inpatient rounders?
Hospitalists are physicians defined by their location, not unlike ED physicians. Do we have ED doctors going from hospital to hospital, leaving nurses alone to care for patients when they are at another hospital? So what do we expect from our hospitalists? Should they be in the hospital 24/7? That would seem to be more consistent with the thought that “they are there all the time.” Remember, Gross did not say hospitalists are “reachable” all the time. She did say hospitalists are “on top of everything that happens to a patient—from entry through treatment and discharge.” It is time that we, as hospitalists, uniformly meet those expectations. Patients all over the country are figuring out that not all hospitalists are doing what they are supposed to do when it comes to communications and establishing safe transitions of care. Remember the adage: It does not take many rotten apples to spoil the barrel.
Last, let us talk more about how hospitalists can provide patient-centric care, as opposed to cost savings and carrying out President Obama’s marching orders. The article describes how a study published in the Journal of the American Medical Association found that patients have a reduced length of stay in the hospital when cared for by hospitalists; how hospitalists are being viewed as leaders in healthcare reform; and how the hospitalist spends her nonclinical time “design(ing) computer programs to contain costs.” Do not get me wrong. I am supportive as anyone of the notion that hospitalists should provide cost-effective care. But the reality is that our patients’ No. 1 priority is to believe that their doctor is providing the best care possible. They do not want to feel someone is short-changing them.
Talk all you want to insurers and hospitals about cost savings, but when speaking with patients, I think it makes more sense to discuss the quality as opposed to cost of care. Ask your next patient whether they give a hoot what you do when you are not caring for them. TH