User login
Dying Wish
Most Americans surveyed about their preferred place of death say they want to die at home.1 Nevertheless, many dying people are not able to realize this wish. One 2003 study found that nearly 90% of terminally ill cancer patients asked to choose where they would prefer to die cited their homes. Only one-third of those patients were able to make this desire a reality.2
The reasons behind the divergence between preference and actual place of death are complicated, says Rachelle Bernacki, MD, MS, assistant clinical professor, Geriatrics and Palliative Care, and a palliative care specialist with the University of California, San Francisco Medical Center Hospitalist Service. “I think most people envision … [dying] at home, but sometimes that’s just not feasible, for multiple reasons. When the reality sets in, there has to be a good plan in place at home—meaning, enough people and resources to keep that person at home.”
Is Death Imminent?
Dr. Bernacki points out that many studies on dying preferences are conducted when the patient is not ill or actively dying. The scenario becomes much more complex when patients are in crisis or on an end-of-life trajectory. In initial assessments, hospitalists should try not only to ascertain the patient’s health status but also to ask respectfully about their goals for care.
“It might not be appropriate [to ask] every patient, ‘Where do you want to die?’ ” suggests Dr. Bernacki. It can be appropriate, though, to ask patients about their experiences with their current illness and to talk about some of the goals they hope to achieve in the next week or month.
Although it is not possible to predict exactly how long a person will survive, the signs of critical illness can provide an appropriate window in which the physician can ask a patient, “If you were to die, where would you want to be, and what is most important to you?”
—Rachelle Bernacki, MD, MS, assistant clinical professor, Geriatrics and Palliative Care, UCSF Medical Center Hospitalist Service
Practitioners skilled in end-of-life care cite several attributes characteristic of patients who are actively dying, such as:
- Refusal of food and liquids;
- Decreased level of awareness;
- Dyspnea (shortness of breath), including erratic breathing patterns;
- Mottled skin that is colder to the touch, along with blue toes; and
- Abnormal breathing sounds due to secretions in the lungs.
Honor Their Choices
Researchers cite many factors that determine whether a terminally ill cancer patient dies in the home or in an institution, including gender, race, marital status, income level, and available health system resources. In a Yale (New Haven, Conn.) epidemiological study, men, unmarried people, and those living in low-income areas were at higher risk for institutionalized deaths.3
Dr. Bernacki has found that the two most important determinants of whether a patient will go home to die are the patient’s condition and their resources at home. Sometimes transporting a patient is not practical because the patient may be so close to dying that there is a risk of death en route. Or the patient’s symptoms may not be controlled with oral pain medications and may require frequent IV dosing, in which case discharge is not feasible. Barriers at the home site include the lack of an identified primary caregiver and the unavailability of qualified hospice personnel and/or medical supplies.
For in-depth learning about palliative care topics, be sure to visit these sessions at the upcoming SHM Annual Meeting in Dallas, May 23-25:
- Palliative Pain Management: Thurs., May 24, 10:35-11:50;
- Non-Pain Symptom Management: Thurs., May 24, 1:10-2:25;
- Ethical and Legal Considerations of Palliative Care and End-of-Life Care: Thurs., May 24, 2:45-4:00;
- Prognostication and PC Management of the Non-Cancer Diagnosis: Fri., May 25, 10:15-11:35; and
- Communication Skills and How to Conduct Family/Care Conferences: Fri., May 25, 1:35-2:55.
When the Hospital Is Preferred
In some situations, says Dr. Bernacki, “some family members feel very uncomfortable with the thought of their loved one dying at home.” Sometimes the disease process advances so quickly that the palliative care team cannot titrate the pain medicines to the right amount to allow discharge. Family members can become alarmed and may feel ill-prepared to handle difficult symptoms of the dying patient, such as uncontrolled nausea or dyspnea.
“So we have to just make an educated guess as to how long we think they have and how important it is to that patient or that family to be at home.” Often, the care team and family realize that it makes more sense not to move the patient but rather to try and make everything as comfortable as possible in the hospital.
The UCSF Palliative Care Service team, established by Steve Pantilat, MD, associate professor of clinical medicine, Department of Medicine, University of California, San Francisco, has access to two in-hospital comfort care suites, where family members can stay with their loved ones at all times.4 Dr. Pantilat is also the past-president of SHM and the Alan M. Kates and John M. Burnard Endowed Chair in Palliative Care at UCSF.
In all cases, says Dr. Bernacki, hospitalists dealing with dying patients should remain cognizant that they are treating not only the patients but the family members as well. “Part of palliative care is making sure that the daughters, sons, and spouses are all well cared for,” she emphasizes. Ascertaining goals and negotiating what’s possible are the keys to good palliative care. TH
Gretchen Henkel writes frequently for The Hospitalist.
References
- Tang ST, McCorkle R, Bradley EH. Determinants of death in an inpatient hospice for terminally ill cancer patients. Palliat Support Care. 2004 Dec;2(4):361-370.
- Tang ST, McCorkle R. Determinants of congruence between the preferred and actual place of death for terminally ill cancer patients. J Palliat Care. 2003;19:230-237.
- Gallo WT, Baker MJ, Bradley EH. Factors associated with home versus institutional death among cancer patients in Connecticut. J Am Geriatr Soc. 2001 Jun;49(6):771-777. Comment in J Am Geriatr Soc. 2001 Jun; 49(6):831-832.
- Auerbach AD, Pantilat SZ. End-of-life care in a voluntary hospitalist model: effects on communication, processes of care, and patient symptoms. Am J Med. 2004 May 15;116(10):669-675.
Palliative Care Patience
As hospital-based palliative care programs continue to grow, palliative care specialists are eager to dispel misconceptions about their work.1 Quality palliative care management at the end of life is often mistakenly perceived as synonymous with adequate pain control, but controlling pain is just one of the facets of effectively moderating the intensity of patients’ and families’ suffering.
The cases narrated here illustrate some of the other common themes of good palliative care management at the end of life: aggressive symptom management, interdisciplinary teamwork, and attention to patients’ and families’ spiritual concerns. Active, respectful listening can help to identify and alleviate obstacles to a more humane end-of-life journey.
Time to Process the Big Picture
State-of-the-art medical therapy does not always address dying patients’ suffering, says Melissa Mahoney, MD, assistant professor of medicine at Emory University and co-director of the Palliative Care Consult Service at Emory Crawford Long Hospital in Atlanta. She experienced this firsthand with a request to consult with a 60-year-old woman who had been in and out of sub-acute rehabilitation facilities seeking pain relief for her spinal stenosis. During a recent rehab facility stay, she had become septic and was transferred to the hospital for dialysis and other treatments. When Dr. Mahoney met the patient, the woman had been saying that she wanted to die, and her family was supportive of her wishes.
During her first conversation with the patient, however, Dr. Mahoney was able to discern that when she said she wanted to die, the patient meant, “I’m in so much pain that I don’t want to live this way.” The first step for the palliative care team was to begin patient-controlled analgesia (PCA) with IV hydromorphone hydrochloride in an attempt to control her pain. The PCA worked—dramatically.
“The next day,” recalls Dr. Mahoney, “she was like a new person. She was able to cope with the idea of dialysis and was able to talk with her family and put things in perspective.”
The palliative care team followed the woman for months, as she continued a cycle of readmissions to both the sub-acute facility and the hospital. The difference from the previous scenario, however, was that the team could offer aggressive symptom management while encouraging the patient and her family to revisit quality of life issues. She eventually died in the hospital, but Dr. Mahoney believes that the palliative care team’s interventions and emphasis on communication helped the patient and her family to cope with the situation more effectively.
With pain under control, patients can begin to address such questions as What’s important to me now? How do I want to spend my days? Who would I want to speak for me if I can’t speak for myself? What are my end-of-life wishes?’
“None of those higher-level discussions can take place until someone can physically handle them,” emphasizes Dr. Mahoney. “The palliative care approach puts the focus back on the patient and on the family and away from the disease. It seeks to treat the person and hopefully ease suffering through the illness.”
Goals of Care Change with Time
Howard R. Epstein, MD, medical director, Care Management and Palliative Care at Regions Hospital in St. Paul, Minn., and a member of the SHM Palliative Care Task Force, notes that good palliative care incorporates ongoing discussions about patients’ and families’ goals of care. “Following diagnosis of a life-threatening illness, the initial goal might be ‘I want to be cured,’ ” he says. “But, if the disease progresses, then you need to have another discussion about goals of care. Hopefully, this is part of the process all along.”
Dr. Epstein participated in a particularly memorable case last fall, consulting with a patient who had metastatic renal cancer. Surgery had left him with an abdominal abscess, which surgeons were proposing to address with another procedure in order to prevent a potentially fatal infection. The palliative care team was called in to help Mr. A, who was only 50, decide on a care plan. During the care conference, says Dr. Epstein, Mr. A was alert and joking with his wife and indicated that he would rather go home with hospice care than undergo another surgery.
The team asked Mr. A about his goals. “He didn’t know how much time he had left,” recalls Dr. Epstein, “although he had a specific goal in mind: One of his four sons was getting married, and he wanted to be there for that. They were a very close-knit family.” Mr. A had been intensely engaged as a father all through his sons’ school years. They ranged in age from 19 to 30, and Mr. A was determined to remain close with them throughout his dying process.
The care team facilitated his return home with a PCA pump for pain and a link with a visiting hospice nurse and social worker. The case was followed by a reporter from the St. Paul Pioneer Press, and it was in those articles that Dr. Epstein learned more of Mr. A’s story. For instance, extended family members were pitching in to remodel the house; Mrs. A would have to sell it to cover her husband’s medical bills after he died. The engaged son later had to tell his father that his fiancée had canceled the wedding. Mr. A was able to allay his son’s guilt and fear about the canceled wedding and to be the kind of supportive father he had always been.
Because his goal of living until the wedding had changed, Mr. A was then able to focus on his other goal: having family with him as he died at home. And, indeed, Mr. A died a peaceful death a few weeks later surrounded by his whole family.
A Ship without a Captain
Pediatric hospitalists who handle palliative care recognize that, unlike adults’ end-of-life trajectories, which are usually a straight line, the trajectories of children with complex medical conditions tend to be more erratic between diagnosis and cure or death. As a result, their families spend a longer time relating to the medical system. The job of the palliative care team is to acknowledge the family’s experience and reframe that experience into a more egalitarian and satisfying one, including a comprehensive plan of care, says Margaret Hood, MD, senior pediatric hospitalist at MultiCare’s Mary Bridge Children’s Hospital in Tacoma, Wash. Thus, the interdisciplinary team at Mary Bridge meets with the family around a round table, where everyone’s input is given equal respect and weight.
Dr. Hood recalls one case that was brought to her attention by a social worker. Amy (not her real name) had been born prematurely and had endured many medical problems in her first four years. Then, at age four, she started walking and talking; by age seven, she was reading at the fifth grade level. From ages seven to 10, Amy had minor problems, but she began deteriorating at age 10, when it was found that she had mitochondrial disease. The family had taken her to many specialists without any resolution to her problem and had been charging medical treatments to their credit cards. The social worker was concerned that the family would be devastated by bankruptcy.
The palliative care team organized a care conference attended by Amy’s primary care physician, palliative care team members, and other specialists. Although the care conference resulted in small adjustments to her care plan—a change in medication and the addition of one diagnostic test—the true change came when Amy’s mother turned to Dr. Hood and said, “You know, I thought you’d given up on us.”
That’s when it occurred to Dr. Hood that families like these, visiting specialist after specialist for their child’s complex medical conditions, are “on ‘a ship without a captain.’ Whether or not their children have life-limiting illnesses, they need a captain of the ship to help them navigate their journey,” she says.
Amy’s mother had been under the impression that the physicians were telling her there was nothing else to hope for. “You don’t give up hope,” asserts Dr. Hood. “You just change what you’re hoping for.”
Amy died three months after the palliative care conference, but took a Make-A-Wish Foundation trip to Disneyland and celebrated Christmas at home with her family. Her last wish, after Christmas, was to avoid re-entering the hospital, and this was honored as well.
There May Be More Time to Live
Attention to nuances embedded in patients’ stated wishes can sometimes result in a reversal of expectations about end of life. Stephanie Grossman, MD, assistant professor of medicine and co-director of the Palliative Care Program for Emory University Hospital and Emory Crawford Long Hospital in Atlanta, was called by the hospitalist service last year to help facilitate transfer of a patient to hospice care.
In her 70s, the active woman had come to the hospital because a tumor mass was eroding through her breast tissue. The woman was avoiding treatment, including a biopsy, and appeared to be resolved to her fate. Based on her conversation with the emergency department (ED) attending, hospice was discussed and recommended; the patient was admitted primarily for IV antibiotics and care of her wound. In discussing goals of care with the patient, however, Dr. Grossman was able to elicit her reasons for refusing treatment. Ten years earlier, the patient had watched her daughter suffer with aggressive chemotherapy and radiation for her breast cancer. She told Dr. Grossman, “I’ve lived my life; I don’t want to go through all that.”
Knowing that breast cancer treatments have evolved in the past decade, Dr. Grossman asked the woman whether she would agree to a consultation with an oncologist to find out about less toxic treatment, including hormonal therapy. Subsequently, the patient decided to undergo a lumpectomy to increase her options. Dr. Grossman also prescribed a mild pain reliever for the woman, who had expressed fears about becoming addicted to pain medication (a common misperception in elderly patients). Upon discharge, the patient was feeling better physically, and she was optimistic about her future.
Despite the perceptions of the ED staff, the patient had not been hospice-appropriate. “No one had ever offered her the alternatives. In her mind, she saw chemotherapy as this terrible thing, and she just didn’t want to have that,” says Dr. Grossman. “So by listening to her we found out why she didn’t want chemotherapy, and we were able to encourage her to talk with the oncologist and the surgeon.”
I’m Afraid of What Comes after This Life
“Sometimes you find that patients and families are making decisions purely in a spiritual context,” notes Dr. Mahoney. “Until you know that, you can deliver clear and concise medical information and opinions and they won’t hear it. They may respect your opinion, but they will not take that into consideration when they’re making the decisions about themselves or a loved one because their spiritual belief system supersedes that factual information.”
Last year, Dr. Mahoney encountered a woman her late 50s with metastatic cancer. Her mother had died young of the same disease. The patient knew her disease was advanced and that she was facing the same thing her mother had faced. She, too, was leaving behind her daughters.
The patient, recalls Dr. Mahoney, had not filled out an advance directive and was having a difficult time talking with her family about her situation. It is Dr. Mahoney’s practice in such settings to ask people about their hopes and their fears, “because you can really gauge how someone sees their illness by asking those questions.”
The woman responded that she was very afraid of dying. “When I hear that answer, my next question is, ‘What do you fear? Do you fear that you might suffer?’ She said, ‘Oh no, no, I’m not afraid of that at all. Actually, I’ve sinned a lot in my life, and I’m afraid of what comes after this life.’ ”
Realizing that the woman was suffering spiritually, Dr. Mahoney called in her team’s chaplain to meet with the patient. During that meeting, the patient revealed to Chaplain Sandra Schaap that she had been the one to remove her mother from life support (her mother had not left an advance directive either). She was plagued by the fear of how she would be judged for that act. The chaplain was able to offer some comfort by sharing a benediction, which stated (among other things) that Christ would complete what we have left undone in this life.
“That conversation helped the patient see that she needed to complete her own advance directive so that her daughters wouldn’t go through the same thing that she had with her own mother,” says Dr. Mahoney.
Although Dr. Mahoney did not see the woman again, “I think we certainly set the framework for her and her family to be able to cope with what was coming. In the traditional medical model of disease treatment, I’m not sure that kind of detail would have come out. This woman would have left the hospital still carrying around that burden and [would have] had a very different life from that point,” she says.
Conclusion
“Every patient and family has a story of their illness and how it has impacted their lives,” Dr. Mahoney emphasizes. “Many times people are in the hospital for an acute problem, but they’ve suffered with an illness for years. There is a real opportunity to allow patients and families to tell their stories. People are often relieved when someone listens and can help put things in perspective. Palliative care specialists, by actively listening to patient and family concerns, can help relieve suffering on a physical, spiritual, and emotional level even when cure is not possible.” TH
In this issue Gretchen Henkel also writes about hospitalists who are overcommitted.
Reference
- Center to Advance Palliative Care. The case for hospital-based palliative care. Available at: www.capc.org/building-a-hospital-based-palliative-care-program/case/support-from-capc/capc_publications/making-the-case.pdf. Accessed on February 20, 2007.
Island Visionary
It may be isolated in the middle of the vast Pacific Ocean, but physicians and patients at The Queen’s Medical Center (QMC) in Honolulu, Hawaii, consider themselves anything but stranded.
The only hospital in the nation started by a monarchy, Queen’s is an example of the evolution of medicine and healthcare delivery—from the natural herbal remedies used by native Hawaiians to the world-class medical tools it employs today.
Founded in 1859 by Queen Emma and King Kamehameha IV, The Queen’s Hospital (as it was called at the time) has become an inimitable asset to the medical community, to the nation’s medical history, and most importantly, to the people who call Hawaii home. Today, more than ever, the hospital relies on its history and its commitment to the vision of its founders to guide its day-to-day operations and to survive the ever-increasing challenges that come with being an American hospital in 2007.


For Queen’s, navigating the new healthcare reality is helped by lessons from the past, hospital leaders say. And what a past there is to call upon.
Foreign Influences
In the mid-19th century, Hawaiians were struggling to survive a host of diseases brought in by foreigners. Prior to the arrival of Captain James Cook in 1778 (to what he called the Sandwich Isles) Hawaiians were free of diseases such as influenza, chicken pox, measles, syphilis, gonorrhea, scarlet fever, and typhoid. Because Hawaiians had no resistance to these diseases the population had diminished to 73,000—down from 250,000 in the 1700s by the mid-1800s.
Unfortunately, two additional diseases were introduced to Hawaii: the bubonic plague, which ultimately destroyed up to half of the population, and a smallpox epidemic that resulted in 2,500 fatalities—a death rate of 39%.
Royal Visionary
Faced with the decimation of their people, Emma Rooke—as she was known before her marriage to the king—had a vision. Inspired by her physician father and supported by her husband-to-be, King Kamehameha IV, Emma launched an effort to fund and build a hospital. In his first speech to the parliament of the kingdom of Hawaii in 1855, the king said the hospital was needed “to stay the wasting hand that is destroying our people.”
Four years later, with $6,000 from the parliament and more than $13,000 that the king and queen had personally solicited, The Queen’s Hospital opened its doors.
Bridging the gap between Western medicine and ancient Hawaiian healing traditions proved no easy task. The hospital tried to ease Hawaiians’ anxiety about the new medicines by integrating traditional healing methods with Western medical care, running a kokua system for 26 years. Instead of a nurse, a kokua—or helper who lived in the hospital—would provide care, putting the patient to bed with her own quilt, for example, and then clearing a sleeping space on the floor by the bed to sleep on near the patient. There were no single rooms, and, in an effort to make the Hawaiians feel at home, the hospital served Hawaiian food.
Now Serving Today’s Population
Today, QMC still considers care for native Hawaiians central to its mission. And that commitment to its heritage courses through the veins of the organization.
Its efforts include research into cardiac disparities in native Hawaiian communities and prevention and education outreach about diabetes and other prevalent conditions. The QMC also operates The Queen Emma Clinics, which serve many native Hawaiian patients. In addition, it is a sister company to Molokai General Hospital, which fulfills a vital role in providing healthcare services to the close-knit community of the island of Molokai, whose residents are predominantly native Hawaiian.
QMC is the largest private hospital in Hawaii and all of the Pacific Islands, with 505 acute care beds and 28 sub-acute beds, more than 3,000 employees, and more than 1,200 physicians on staff. Its oncology program includes TomoTherapy, and construction of a new Cancer Center will soon be underway. The Queen’s Neuroscience Institute is the only Joint Commission on Accreditation of Healthcare Organizations (JCAHO)-certified stroke center in Hawaii. In addition, QMC serves as a Level II Trauma Center, providing care to the vast majority of trauma patients on Oahu, as well as more serious trauma patients flown in by medical air transport from the neighbor islands throughout the state. Its latest equipment addition, the da Vinci (robotic) Surgical System, has the potential to improve the outcomes of patients undergoing both prostate and bariatric surgery.
The Queen’s Hospitalists
QMC also has an established hospitalist program. Starting in 1998 with three “in-house physicians,” as they were called before the program was formally created in 2001, hospitalists provide critical continuity-oriented inpatient services—true to the spirit of the kokua that Queen’s continues to hold dear. The program has grown to include 15 full-time and six half-time nocturnists and expects to continue adding positions at a rate of two to three per year.
The custom of caring for native Hawaiians and all of the people of Hawaii is rooted in royalty. Despite the arrival of statehood, marked by the state capitol, which today sits just across the sprawling “Great Lawn” of the medical center’s campus, Queen’s physicians and administrators say—unwaveringly and earnestly—that there remains a sense of duty to Queen Emma and King Kamehameha IV and to the royal legacy they left.
Healthcare today may have a different, high-tech face, but members of the Queen’s ohana (family) insist that that only means they have an even greater obligation to carry out their founders’ dream for health in the islands—for native Hawaiians, other residents, and visitors alike. And they continue to do so in their founders’ names. TH
Pollard is the manager of public affairs for Queen’s Health Systems.
It may be isolated in the middle of the vast Pacific Ocean, but physicians and patients at The Queen’s Medical Center (QMC) in Honolulu, Hawaii, consider themselves anything but stranded.
The only hospital in the nation started by a monarchy, Queen’s is an example of the evolution of medicine and healthcare delivery—from the natural herbal remedies used by native Hawaiians to the world-class medical tools it employs today.
Founded in 1859 by Queen Emma and King Kamehameha IV, The Queen’s Hospital (as it was called at the time) has become an inimitable asset to the medical community, to the nation’s medical history, and most importantly, to the people who call Hawaii home. Today, more than ever, the hospital relies on its history and its commitment to the vision of its founders to guide its day-to-day operations and to survive the ever-increasing challenges that come with being an American hospital in 2007.
For Queen’s, navigating the new healthcare reality is helped by lessons from the past, hospital leaders say. And what a past there is to call upon.
Foreign Influences
In the mid-19th century, Hawaiians were struggling to survive a host of diseases brought in by foreigners. Prior to the arrival of Captain James Cook in 1778 (to what he called the Sandwich Isles) Hawaiians were free of diseases such as influenza, chicken pox, measles, syphilis, gonorrhea, scarlet fever, and typhoid. Because Hawaiians had no resistance to these diseases the population had diminished to 73,000—down from 250,000 in the 1700s by the mid-1800s.
Unfortunately, two additional diseases were introduced to Hawaii: the bubonic plague, which ultimately destroyed up to half of the population, and a smallpox epidemic that resulted in 2,500 fatalities—a death rate of 39%.
Royal Visionary
Faced with the decimation of their people, Emma Rooke—as she was known before her marriage to the king—had a vision. Inspired by her physician father and supported by her husband-to-be, King Kamehameha IV, Emma launched an effort to fund and build a hospital. In his first speech to the parliament of the kingdom of Hawaii in 1855, the king said the hospital was needed “to stay the wasting hand that is destroying our people.”
Four years later, with $6,000 from the parliament and more than $13,000 that the king and queen had personally solicited, The Queen’s Hospital opened its doors.
Bridging the gap between Western medicine and ancient Hawaiian healing traditions proved no easy task. The hospital tried to ease Hawaiians’ anxiety about the new medicines by integrating traditional healing methods with Western medical care, running a kokua system for 26 years. Instead of a nurse, a kokua—or helper who lived in the hospital—would provide care, putting the patient to bed with her own quilt, for example, and then clearing a sleeping space on the floor by the bed to sleep on near the patient. There were no single rooms, and, in an effort to make the Hawaiians feel at home, the hospital served Hawaiian food.
Now Serving Today’s Population
Today, QMC still considers care for native Hawaiians central to its mission. And that commitment to its heritage courses through the veins of the organization.
Its efforts include research into cardiac disparities in native Hawaiian communities and prevention and education outreach about diabetes and other prevalent conditions. The QMC also operates The Queen Emma Clinics, which serve many native Hawaiian patients. In addition, it is a sister company to Molokai General Hospital, which fulfills a vital role in providing healthcare services to the close-knit community of the island of Molokai, whose residents are predominantly native Hawaiian.
QMC is the largest private hospital in Hawaii and all of the Pacific Islands, with 505 acute care beds and 28 sub-acute beds, more than 3,000 employees, and more than 1,200 physicians on staff. Its oncology program includes TomoTherapy, and construction of a new Cancer Center will soon be underway. The Queen’s Neuroscience Institute is the only Joint Commission on Accreditation of Healthcare Organizations (JCAHO)-certified stroke center in Hawaii. In addition, QMC serves as a Level II Trauma Center, providing care to the vast majority of trauma patients on Oahu, as well as more serious trauma patients flown in by medical air transport from the neighbor islands throughout the state. Its latest equipment addition, the da Vinci (robotic) Surgical System, has the potential to improve the outcomes of patients undergoing both prostate and bariatric surgery.
The Queen’s Hospitalists
QMC also has an established hospitalist program. Starting in 1998 with three “in-house physicians,” as they were called before the program was formally created in 2001, hospitalists provide critical continuity-oriented inpatient services—true to the spirit of the kokua that Queen’s continues to hold dear. The program has grown to include 15 full-time and six half-time nocturnists and expects to continue adding positions at a rate of two to three per year.
The custom of caring for native Hawaiians and all of the people of Hawaii is rooted in royalty. Despite the arrival of statehood, marked by the state capitol, which today sits just across the sprawling “Great Lawn” of the medical center’s campus, Queen’s physicians and administrators say—unwaveringly and earnestly—that there remains a sense of duty to Queen Emma and King Kamehameha IV and to the royal legacy they left.
Healthcare today may have a different, high-tech face, but members of the Queen’s ohana (family) insist that that only means they have an even greater obligation to carry out their founders’ dream for health in the islands—for native Hawaiians, other residents, and visitors alike. And they continue to do so in their founders’ names. TH
Pollard is the manager of public affairs for Queen’s Health Systems.
The HCAP Handicap
In February 2005, the American Thoracic Society (ATS) and the Infectious Disease Society of America (IDSA) released their joint guidelines for the management of nosocomial pneumonia.1 This impressive document was an extensive revision of guidelines released in 1996.2 These revised guidelines were widely anticipated because during the intervening nine-year span two trends had evolved. First, academic interest in nosocomial pneumonias grew dramatically. This is best illustrated by the exponential growth in the rate of scholarly publications regarding nosocomial pneumonia. A simple PubMed search of “nosocomial pneumonia” shows a six-fold increase in the number of publications devoted to this topic during the time that elapsed between the two sets of guidelines. (See Figure 1, p. 28.) Second, antimicrobial susceptibility to antibiotic therapy rapidly worsened, with many facilities reporting routine resistance in their intensive care units.
Given the growth in related scholarly activity, the 2005 guidelines are both comprehensive and lengthy—some 28 pages in total. The authors meticulously reviewed the nosocomial pneumonia literature, dividing it into manageable and clinically relevant subtopics: epidemiology, pathogenesis, modifiable risk factors, diagnostic testing, diagnostic strategies, antibiotic treatment, and response to therapy. The obvious strengths of the guidelines include that they were written by a collection of authoritative experts representing collaboration between the ATS and the IDSA and that they result in a collection of practical, evidence-based recommendations.
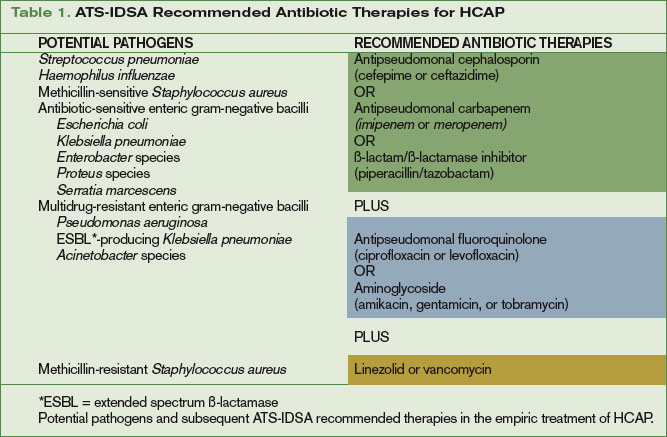
One of the most significant aspects of these guidelines is that they defined a “new” entity: healthcare-associated pneumonia (HCAP). The authors recognize HCAP patients as a unique population because they are at increased risk of harboring resistant pathogens. As defined by the guidelines, HCAP patients include those admitted for more than 48 hours in the past 90 days, those who reside in a nursing home or receive home infusion therapy or wound care, those who are on chronic hemodialysis, or patients who have a family member with a multidrug-resistant pathogen. Although not explicitly stated by the guidelines, it’s worth noting that the recommendations provided were intended to apply only to hospitalized patients with pneumonia.
Looking at the ATS-IDSA definition of HCAP, it is clear that the largest subset of HCAP patients is nursing home residents with pneumonia. Although these patients have historically been treated with agents recommended in community-acquired pneumonia (CAP) guidelines, they more closely resemble hospital-acquired pneumonia (HAP) and ventilator-associated pneumonia (VAP) patients in terms of their comorbidities, the presence of catheters and lines, and their prior exposure to antibiotics. Because these patients live longer and have more comorbid disease their care has become increasingly complex, often involving frequent transfers to hospitals or providers’ offices. Not surprisingly, long-term-care facility residents have become a reservoir for multidrug-resistant pathogens.3,4 This patient population will become increasingly important; the number of geriatric Americans is projected to continue to grow for the next 20 years.
Because increased mortality in pneumonia is strongly linked to initially inappropriate antibiotic therapy, the guidelines recommend much broader antibiotic coverage for the newly defined HCAP population.5,6 In the recent past, these patients have been most frequently treated with a third-generation cephalosporin and macrolide combination or a respiratory fluoroquinolone as monotherapy. Given the risk of multidrug-resistant pathogens in HCAP, these regimens are deemed inadequate by the current guidelines, which recommend a combination of:
- An antipseudomonal cephalosporin, an antipseudomonal carbapenem, or a ß-lactam/ß-lactamase inhibitor combination; plus
- An antipseudomonal fluoroquinolone or an aminoglycoside; plus
- Vancomycin or linezolid. (See Table 1, above.)
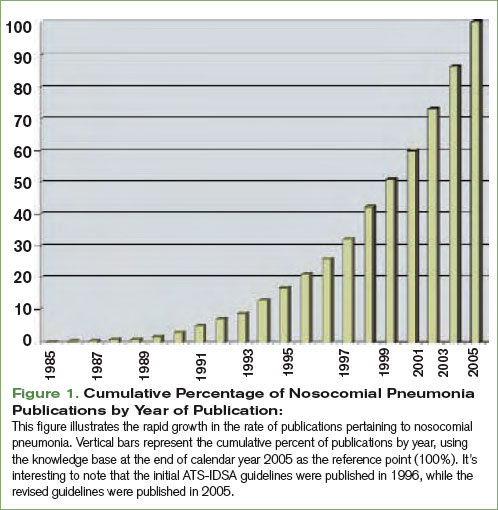
Controversies Surrounding the Guidelines
Although the revised guidelines were generally greeted with enthusiasm, several authors quickly pointed out that the evidence base supporting HCAP has significant limitations.7-9 Most importantly, studies dealing specifically with HCAP as it is defined by the guidelines are lacking. A review of the ATS-IDSA guidelines’ references reveals that only seven publications deal specifically with HCAP, and all of these focus on nursing home-acquired pneumonia.10-16 Also note that these seven studies use widely discrepant definitions of pneumonia, have varying microbiologic criteria, and include varying numbers of hospitalized and non-hospitalized patients. In addition to these limitations, much of the epidemiology of HCAP pathogens has been extrapolated from diseases other than pneumonia.
Given the paucity of supporting data, it is unclear how similar the subgroups lumped together under the HCAP umbrella really are. Intuitively all of these patients are at increased risk for colonization with resistant pathogens, given their frequent contact with the healthcare system and/or its extenders. The repeated observation that the presence of any one of the factors defining HCAP—recent admission, nursing-home-residence, renal failure, and so on—is associated with increased mortality in patients with nosocomial infections strengthens this assumption.17-19
There are data that challenge the conclusion that such nosocomial pathogens are a frequent enough cause of pneumonia in these patients to merit routine empiric therapy, however. In one large retrospective database review, hemodialysis patients admitted for pneumonia had a spectrum of causative pathogens that was a hybrid of community- and nosocomial-acquired microbes.20 Similarly, in a large systematic review of nursing-home acquired pneumonia studies published between 1978-1994, the causative pathogens were a diverse blend of community- and nosocomial-acquired organisms.21 Both of these studies were retrospective analyses that were limited by the availability and quality of the previously collected microbiology data.
The only study looking specifically at the epidemiology of HCAP as defined by the ATS-IDSA guidelines was published in December 2005—10 months after the guidelines themselves.22 This study raises the possibility that earlier epidemiology studies of pneumonia may suffer from obsolescence, given recent trends in worsening microbial resistance and an increasingly complex medical system.
The authors of this large (n=4,453), retrospective, multi-center database analysis concluded that HCAP was justified as a new category of pneumonia based on the observation that the pathogens causing HCAP were more similar to HAP and VAP than they were to CAP. For instance, in HCAP, Staphylococcus and Pseudomonas species were isolated in 46.7% and 25.3% of patients, while in CAP patients, these organisms were recovered in 25.5% and 17.1%, respectively. Conversely, Streptococcus pneumoniae and Haemophilus species predominated in CAP (16.6% and 16.6%) but were less common in HCAP (5.5% and 5.8%), HAP (3.1% and 5.6%), and VAP (5.8% and 12.2%). Compared with CAP HCAP was also associated with more severe disease, a higher mortality rate, a prolonged length of stay, and significantly increased costs.
Although not particularly germane to hospitalists, these recommendations were also found to be problematic for patients who were not hospitalized. Even for individuals residing in chronic-care facilities, the use of multiple broad-spectrum agents being given by IV would pose a logistic disaster that would quickly overwhelm staff. Safety issues would also likely abound, given the need for IV lines, pumps, and tubing in a patient population that would have a high density of cognitive deficits and a relatively unfavorable nurse-to-resident ratio. Further, the concept of empiric broad-spectrum therapy mandates subsequent de-escalation based on microbiology specimens obtained at the time of initiating antibiotics. It has been repeatedly illustrated that obtaining high-quality specimens outside the hospital setting is difficult. As a result, most non-hospitalized patients would be started on broad-spectrum therapy without any realistic possibility for de-escalation, a situation that would only accelerate the selection pressure on resistant organisms.
The guidelines are also vague regarding whether Legionella should be empirically treated in patients with HCAP. While this pathogen has long been accepted as a common and under-diagnosed cause of community-acquired pneumonia, the epidemiology of Legionella pneumophila (Legionnaires’ disease) in nosocomial pneumonia is more controversial. Although it is likely a relatively common cause of endemic nosocomial infections, the initial reports of Legionnaires’ disease have left the misperception that this pathogen is only a cause of epidemic disease.23-26 In the 2005 ATS-IDSA guidelines, Legionella is listed as a “potential pathogen.” Yet it would only be treated if a macrolide (e.g., azithromycin) or a fluoroquinolone (e.g., ciprofloxacin or levofloxacin) were prescribed.
The current guidelines do not specifically comment on the optimal duration of HCAP therapy or the assessment of HCAP patients not responding to therapy, likely because these areas have not been studied. Regardless, there is ever increasing support for shortening the duration of antibiotic therapies in clinically responding patients regardless of the subset of nosocomial pneumonia. As such, the duration of therapy should likely be closer to seven days than the conventional 14- to 21-day courses of therapy. In the absence of evidence to the contrary, the 2005 guidelines imply that the evaluation of HCAP patients who are not responding to therapy should be the same as for patients with other nosocomial pneumonias not responding to antibiotic therapy.
Although only briefly addressed in the guidelines, the importance of incorporating local microbiologic data cannot be overemphasized. Just as antimicrobial sensitivities vary within institutions, there is likely to be comparable variability between settings in which each subset of HCAP patients comes into contact with the healthcare system.27,28 Although, ideally, every long-term care facility would have its own, frequently updated, antibiogram, this is not feasible either logistically or financially. Due to these limitations, hospital antibiograms are typically employed as a surrogate whenever these patients are hospitalized. Given the similarity of HCAP pathogens to nosocomial organisms, individualized intensive care unit-specific antibiograms will likely better reflect the resistant pathogens of highest concern when prescribing empiric therapy.22,27,28
The implication of the severity of illness in prescribing initial antibiotic therapy is another poorly studied and controversial topic. Because HCAP likely includes a broad spectrum of potential pathogens—both community-acquired and nosocomial—it has been proposed that the presenting severity of illness may be a surrogate marker for the etiologic organisms. This philosophy proposes that less severely ill patients are more likely to have community-acquired organisms that may be successfully treated with more narrow spectrum agents, while those with a higher severity of illness are more likely to have nosocomial pathogens that should be empirically given broad spectrum agents. This topic is not addressed by the current ATS-IDSA guidelines.
Conclusions
The ATS-IDSA nosocomial pneumonia guidelines’ recent definition of HCAP and the attendant recommendations regarding therapies are welcome additions for clinicians who have long struggled with how best to treat these patients. It is important to realize the limitations behind the assertions made in this important document, however. First and foremost, the knowledge base on this topic is limited, and many conclusions are based on expert opinion or extrapolation of concepts relating to other nosocomial infections. What little knowledge is available comes almost exclusively from nursing-home-acquired pneumonia. This is problematic because these studies are plagued with issues regarding their limited or poor-quality microbiologic data.
In several areas, including the need for Legionella therapy, the implications of severity of illness, and the assessment of response to therapy, the data are entirely lacking. As a result, the recommendations for hospital-acquired pneumonia are generally followed in these instances. These facts highlight the need for increased epidemiologic HCAP data to optimize antibiograms, to promote adequate empiric antibiotic therapy, to assess the obsolescence of older trials, and to investigate the similarities and differences among the heterogeneous groups of patients included in the present definition. TH
Drs. Morrow and Malesker both work at Creighton University Medical Center, Omaha, Neb.
References
- American Thoracic Society. Infectious Diseases Society of America. Guidelines for the management of adults with hospital-acquired, ventilator-associated, and healthcare-associated pneumonia. Am J Respir Crit Care Med. 2005 Feb 15;171(4):388-416. Comment in Am J Respir Crit Care Med. 2006 Jan 1;173(1):131-3; author reply 133.
- American Thoracic Society. Hospital-acquired pneumonia in adults: diagnosis, assessment of severity, initial antimicrobial therapy, and preventive strategies. A consensus statement, November 1995. Am J Respir Crit Care Med. 1996 May;153(5):1711-1725.
- Pop-Vicas AE, D’Agata EM. The rising influx of multidrug-resistant gram-negative bacilli into a tertiary care hospital. Clin Infect Dis. 2005 Jun 15;40(12):1792-1798. Epub 2005 May 6.
- Pop-Vicas AE. Debilitated elderly in long-term care facility (LTCF)—a major reservoir of colonization with multidrug-resistant gram-negative (MDRGN) pathogens. Paper presented at: 44th Annual Meeting of the Infectious Diseases Society of America. October 2006. Toronto, Ontario, Canada.
- Alvarez-Lerma F. Modification of empiric antibiotic treatment in patients with pneumonia acquired in the intensive care unit. ICU-Acquired Pneumonia Study Group. Intensive Care Med. 1996 May;22(5):387-394.
- Celis R, Torres A, Gatell JM, et al. Nosocomial pneumonia. A multivariate analysis of risk and prognosis. Chest. 1988 Feb;93(2):318-324.
- Hiramatsu K, Niederman MS. Health-care-associated pneumonia: a new therapeutic paradigm. Chest. 2005 Dec;128(6):3784-3787.
- Fujitani S, Yu VL. A new category – healthcare-associated pneumonia: a good idea, but problems with its execution. Eur J Clin Microbiol Infect Dis. 2006 Oct;25(10):627-631.
- Guay DR. Guidelines for the management of adults with health care-associated pneumonia: implications for nursing facility residents. Consult Pharm. 2006 Sep;21(9):719-725.
- Hutt E, Kramer AM. Evidence-based guidelines for management of nursing home-acquired pneumonia. J Fam Pract. 2002 Aug;51(8):709-716.
- Mylotte JM. Nursing-home acquired pneumonia. Clin Infect Dis. 2002 Nov 15;35(10):1205-1211. Epub 2002 Oct 28. Comment in Clin Infect Dis. 2003 Jul 1; 37(1):148-9; author reply 149-150.
- El-Solh AA, Sikka P, Ramadan F, et al. Etiology of severe pneumonia in the very elderly. Am J Respir Crit Care Med. 2001 Mar;163(3 Pt 1):645-651.
- El-Solh AA, Aquilina AT, Dhillon RS, et al. Impact of invasive strategy on management of antimicrobial treatment failure in institutionalized older people with severe pneumonia. Am J Respir Crit Care Med. 2002 Oct 15;166(8):1038-1043.
- Lim WS, Macfarlane JT. A prospective comparison of nursing home acquired pneumonia with community acquired pneumonia. Eur Respir J. 2001Aug;18(2):362-368.
- Patriarca PA, Weber JA, Parker RA, et al. Efficacy of influenza vaccine in nursing homes. Reduction in illness and complications during an influenza A (H3N2) epidemic. JAMA. 1985 Feb 22;253(8):1136-1139.
- Lee C, Loeb M, Phillips A, et al. Zanamivir use during transmission of amantadine-resistant influenza A in a nursing home. Infect Control Hosp Epidemiol. 2000 Nov;21(11):700-704.
- Gaynes R. Health care-associated bloodstream infections: a change in thinking. Ann Intern Med. 2002 Nov 19;137(10):850-851.
- Friedman ND, Kaye KS, Stout JE, et al. Healthcare-associated bloodstream infections in adults: a reason to change the accepted definition of community-acquired infections. Ann Intern Med. 2002 Nov 19;137(10):791-797.
- Trouillet JL, Chastre J, Vuagnat A, et al. Ventilator-associated pneumonia caused by potentially drug-resistant bacteria. Am J Respir Crit Care Med. 1998 Feb;157(2):531-539.
- Slinin Y, Foley RN, Collins AJ. Clinical epidemiology of pneumonia in hemodialysis patients: the USRDS waves 1, 3, and 4 study. Kidney Int. 2006 Sep;70(6):1135-1141.
- Muder RR. Pneumonia in residents of long-term care facilities: epidemiology, etiology, management, and prevention. Am J Med. 1998 Oct;105(4):319-330.
- Kollef MH, Shorr A, Tabak YP, et al. Epidemiology and outcomes of health-care-associated pneumonia: results from a large US database of culture-positive pneumonia. Chest. 2005 Dec;128(6):3854-3862. Erratum in Chest. 2006 Mar; 129(3): 831. Comment in Chest. 2005 Dec; 128(6):3784-3787; Chest. 2006 Aug; 130(2):623.
- Fiore AE, Butler JC, Emori TG, et al. A survey of methods used to detect nosocomial legionellosis among participants in the National Nosocomial Infections Surveillance System. Infect Control Hosp Epidemiol. 1999 Jun;20(6):412-416.
- Korvick J, Yu VL, Fang GD. Legionella species as hospital-acquired respiratory pathogens. Semin Respir Infect. 1987 Mar;2(1):34-47.
- Haley CE, Cohen ML, Halter J, et al. Nosocomial Legionnaires’ disease: a continuing common-source epidemic at Wadsworth Medical Center. Ann Intern Med. 1979 Apr;90(4):583-586.
- Dondero TJ Jr, Rendtorff RC, Mallison GF, et al. An outbreak of Legionnaires’ disease associated with a contaminated air-conditioning cooling tower. N Engl J Med. 1980 Feb 14;302(7):365-370.
- Rello J, Sa-Borges M, Correa H. Variations in etiology of ventilator-associated pneumonia across four treatment sites: implications for antimicrobial prescribing practices. Am J Respir Crit Care Med. 1999 Aug;160(2):608-613.
- Namias N, Samiian L, Nino D, et al. Incidence and susceptibility of pathogenic bacteria vary between intensive care units within a single hospital: implications for empiric antibiotic strategies. J Trauma. 2000 Oct;49(4):638-645.
In February 2005, the American Thoracic Society (ATS) and the Infectious Disease Society of America (IDSA) released their joint guidelines for the management of nosocomial pneumonia.1 This impressive document was an extensive revision of guidelines released in 1996.2 These revised guidelines were widely anticipated because during the intervening nine-year span two trends had evolved. First, academic interest in nosocomial pneumonias grew dramatically. This is best illustrated by the exponential growth in the rate of scholarly publications regarding nosocomial pneumonia. A simple PubMed search of “nosocomial pneumonia” shows a six-fold increase in the number of publications devoted to this topic during the time that elapsed between the two sets of guidelines. (See Figure 1, p. 28.) Second, antimicrobial susceptibility to antibiotic therapy rapidly worsened, with many facilities reporting routine resistance in their intensive care units.
Given the growth in related scholarly activity, the 2005 guidelines are both comprehensive and lengthy—some 28 pages in total. The authors meticulously reviewed the nosocomial pneumonia literature, dividing it into manageable and clinically relevant subtopics: epidemiology, pathogenesis, modifiable risk factors, diagnostic testing, diagnostic strategies, antibiotic treatment, and response to therapy. The obvious strengths of the guidelines include that they were written by a collection of authoritative experts representing collaboration between the ATS and the IDSA and that they result in a collection of practical, evidence-based recommendations.
One of the most significant aspects of these guidelines is that they defined a “new” entity: healthcare-associated pneumonia (HCAP). The authors recognize HCAP patients as a unique population because they are at increased risk of harboring resistant pathogens. As defined by the guidelines, HCAP patients include those admitted for more than 48 hours in the past 90 days, those who reside in a nursing home or receive home infusion therapy or wound care, those who are on chronic hemodialysis, or patients who have a family member with a multidrug-resistant pathogen. Although not explicitly stated by the guidelines, it’s worth noting that the recommendations provided were intended to apply only to hospitalized patients with pneumonia.
Looking at the ATS-IDSA definition of HCAP, it is clear that the largest subset of HCAP patients is nursing home residents with pneumonia. Although these patients have historically been treated with agents recommended in community-acquired pneumonia (CAP) guidelines, they more closely resemble hospital-acquired pneumonia (HAP) and ventilator-associated pneumonia (VAP) patients in terms of their comorbidities, the presence of catheters and lines, and their prior exposure to antibiotics. Because these patients live longer and have more comorbid disease their care has become increasingly complex, often involving frequent transfers to hospitals or providers’ offices. Not surprisingly, long-term-care facility residents have become a reservoir for multidrug-resistant pathogens.3,4 This patient population will become increasingly important; the number of geriatric Americans is projected to continue to grow for the next 20 years.
Because increased mortality in pneumonia is strongly linked to initially inappropriate antibiotic therapy, the guidelines recommend much broader antibiotic coverage for the newly defined HCAP population.5,6 In the recent past, these patients have been most frequently treated with a third-generation cephalosporin and macrolide combination or a respiratory fluoroquinolone as monotherapy. Given the risk of multidrug-resistant pathogens in HCAP, these regimens are deemed inadequate by the current guidelines, which recommend a combination of:
- An antipseudomonal cephalosporin, an antipseudomonal carbapenem, or a ß-lactam/ß-lactamase inhibitor combination; plus
- An antipseudomonal fluoroquinolone or an aminoglycoside; plus
- Vancomycin or linezolid. (See Table 1, above.)
Controversies Surrounding the Guidelines
Although the revised guidelines were generally greeted with enthusiasm, several authors quickly pointed out that the evidence base supporting HCAP has significant limitations.7-9 Most importantly, studies dealing specifically with HCAP as it is defined by the guidelines are lacking. A review of the ATS-IDSA guidelines’ references reveals that only seven publications deal specifically with HCAP, and all of these focus on nursing home-acquired pneumonia.10-16 Also note that these seven studies use widely discrepant definitions of pneumonia, have varying microbiologic criteria, and include varying numbers of hospitalized and non-hospitalized patients. In addition to these limitations, much of the epidemiology of HCAP pathogens has been extrapolated from diseases other than pneumonia.
Given the paucity of supporting data, it is unclear how similar the subgroups lumped together under the HCAP umbrella really are. Intuitively all of these patients are at increased risk for colonization with resistant pathogens, given their frequent contact with the healthcare system and/or its extenders. The repeated observation that the presence of any one of the factors defining HCAP—recent admission, nursing-home-residence, renal failure, and so on—is associated with increased mortality in patients with nosocomial infections strengthens this assumption.17-19
There are data that challenge the conclusion that such nosocomial pathogens are a frequent enough cause of pneumonia in these patients to merit routine empiric therapy, however. In one large retrospective database review, hemodialysis patients admitted for pneumonia had a spectrum of causative pathogens that was a hybrid of community- and nosocomial-acquired microbes.20 Similarly, in a large systematic review of nursing-home acquired pneumonia studies published between 1978-1994, the causative pathogens were a diverse blend of community- and nosocomial-acquired organisms.21 Both of these studies were retrospective analyses that were limited by the availability and quality of the previously collected microbiology data.
The only study looking specifically at the epidemiology of HCAP as defined by the ATS-IDSA guidelines was published in December 2005—10 months after the guidelines themselves.22 This study raises the possibility that earlier epidemiology studies of pneumonia may suffer from obsolescence, given recent trends in worsening microbial resistance and an increasingly complex medical system.
The authors of this large (n=4,453), retrospective, multi-center database analysis concluded that HCAP was justified as a new category of pneumonia based on the observation that the pathogens causing HCAP were more similar to HAP and VAP than they were to CAP. For instance, in HCAP, Staphylococcus and Pseudomonas species were isolated in 46.7% and 25.3% of patients, while in CAP patients, these organisms were recovered in 25.5% and 17.1%, respectively. Conversely, Streptococcus pneumoniae and Haemophilus species predominated in CAP (16.6% and 16.6%) but were less common in HCAP (5.5% and 5.8%), HAP (3.1% and 5.6%), and VAP (5.8% and 12.2%). Compared with CAP HCAP was also associated with more severe disease, a higher mortality rate, a prolonged length of stay, and significantly increased costs.
Although not particularly germane to hospitalists, these recommendations were also found to be problematic for patients who were not hospitalized. Even for individuals residing in chronic-care facilities, the use of multiple broad-spectrum agents being given by IV would pose a logistic disaster that would quickly overwhelm staff. Safety issues would also likely abound, given the need for IV lines, pumps, and tubing in a patient population that would have a high density of cognitive deficits and a relatively unfavorable nurse-to-resident ratio. Further, the concept of empiric broad-spectrum therapy mandates subsequent de-escalation based on microbiology specimens obtained at the time of initiating antibiotics. It has been repeatedly illustrated that obtaining high-quality specimens outside the hospital setting is difficult. As a result, most non-hospitalized patients would be started on broad-spectrum therapy without any realistic possibility for de-escalation, a situation that would only accelerate the selection pressure on resistant organisms.
The guidelines are also vague regarding whether Legionella should be empirically treated in patients with HCAP. While this pathogen has long been accepted as a common and under-diagnosed cause of community-acquired pneumonia, the epidemiology of Legionella pneumophila (Legionnaires’ disease) in nosocomial pneumonia is more controversial. Although it is likely a relatively common cause of endemic nosocomial infections, the initial reports of Legionnaires’ disease have left the misperception that this pathogen is only a cause of epidemic disease.23-26 In the 2005 ATS-IDSA guidelines, Legionella is listed as a “potential pathogen.” Yet it would only be treated if a macrolide (e.g., azithromycin) or a fluoroquinolone (e.g., ciprofloxacin or levofloxacin) were prescribed.
The current guidelines do not specifically comment on the optimal duration of HCAP therapy or the assessment of HCAP patients not responding to therapy, likely because these areas have not been studied. Regardless, there is ever increasing support for shortening the duration of antibiotic therapies in clinically responding patients regardless of the subset of nosocomial pneumonia. As such, the duration of therapy should likely be closer to seven days than the conventional 14- to 21-day courses of therapy. In the absence of evidence to the contrary, the 2005 guidelines imply that the evaluation of HCAP patients who are not responding to therapy should be the same as for patients with other nosocomial pneumonias not responding to antibiotic therapy.
Although only briefly addressed in the guidelines, the importance of incorporating local microbiologic data cannot be overemphasized. Just as antimicrobial sensitivities vary within institutions, there is likely to be comparable variability between settings in which each subset of HCAP patients comes into contact with the healthcare system.27,28 Although, ideally, every long-term care facility would have its own, frequently updated, antibiogram, this is not feasible either logistically or financially. Due to these limitations, hospital antibiograms are typically employed as a surrogate whenever these patients are hospitalized. Given the similarity of HCAP pathogens to nosocomial organisms, individualized intensive care unit-specific antibiograms will likely better reflect the resistant pathogens of highest concern when prescribing empiric therapy.22,27,28
The implication of the severity of illness in prescribing initial antibiotic therapy is another poorly studied and controversial topic. Because HCAP likely includes a broad spectrum of potential pathogens—both community-acquired and nosocomial—it has been proposed that the presenting severity of illness may be a surrogate marker for the etiologic organisms. This philosophy proposes that less severely ill patients are more likely to have community-acquired organisms that may be successfully treated with more narrow spectrum agents, while those with a higher severity of illness are more likely to have nosocomial pathogens that should be empirically given broad spectrum agents. This topic is not addressed by the current ATS-IDSA guidelines.
Conclusions
The ATS-IDSA nosocomial pneumonia guidelines’ recent definition of HCAP and the attendant recommendations regarding therapies are welcome additions for clinicians who have long struggled with how best to treat these patients. It is important to realize the limitations behind the assertions made in this important document, however. First and foremost, the knowledge base on this topic is limited, and many conclusions are based on expert opinion or extrapolation of concepts relating to other nosocomial infections. What little knowledge is available comes almost exclusively from nursing-home-acquired pneumonia. This is problematic because these studies are plagued with issues regarding their limited or poor-quality microbiologic data.
In several areas, including the need for Legionella therapy, the implications of severity of illness, and the assessment of response to therapy, the data are entirely lacking. As a result, the recommendations for hospital-acquired pneumonia are generally followed in these instances. These facts highlight the need for increased epidemiologic HCAP data to optimize antibiograms, to promote adequate empiric antibiotic therapy, to assess the obsolescence of older trials, and to investigate the similarities and differences among the heterogeneous groups of patients included in the present definition. TH
Drs. Morrow and Malesker both work at Creighton University Medical Center, Omaha, Neb.
References
- American Thoracic Society. Infectious Diseases Society of America. Guidelines for the management of adults with hospital-acquired, ventilator-associated, and healthcare-associated pneumonia. Am J Respir Crit Care Med. 2005 Feb 15;171(4):388-416. Comment in Am J Respir Crit Care Med. 2006 Jan 1;173(1):131-3; author reply 133.
- American Thoracic Society. Hospital-acquired pneumonia in adults: diagnosis, assessment of severity, initial antimicrobial therapy, and preventive strategies. A consensus statement, November 1995. Am J Respir Crit Care Med. 1996 May;153(5):1711-1725.
- Pop-Vicas AE, D’Agata EM. The rising influx of multidrug-resistant gram-negative bacilli into a tertiary care hospital. Clin Infect Dis. 2005 Jun 15;40(12):1792-1798. Epub 2005 May 6.
- Pop-Vicas AE. Debilitated elderly in long-term care facility (LTCF)—a major reservoir of colonization with multidrug-resistant gram-negative (MDRGN) pathogens. Paper presented at: 44th Annual Meeting of the Infectious Diseases Society of America. October 2006. Toronto, Ontario, Canada.
- Alvarez-Lerma F. Modification of empiric antibiotic treatment in patients with pneumonia acquired in the intensive care unit. ICU-Acquired Pneumonia Study Group. Intensive Care Med. 1996 May;22(5):387-394.
- Celis R, Torres A, Gatell JM, et al. Nosocomial pneumonia. A multivariate analysis of risk and prognosis. Chest. 1988 Feb;93(2):318-324.
- Hiramatsu K, Niederman MS. Health-care-associated pneumonia: a new therapeutic paradigm. Chest. 2005 Dec;128(6):3784-3787.
- Fujitani S, Yu VL. A new category – healthcare-associated pneumonia: a good idea, but problems with its execution. Eur J Clin Microbiol Infect Dis. 2006 Oct;25(10):627-631.
- Guay DR. Guidelines for the management of adults with health care-associated pneumonia: implications for nursing facility residents. Consult Pharm. 2006 Sep;21(9):719-725.
- Hutt E, Kramer AM. Evidence-based guidelines for management of nursing home-acquired pneumonia. J Fam Pract. 2002 Aug;51(8):709-716.
- Mylotte JM. Nursing-home acquired pneumonia. Clin Infect Dis. 2002 Nov 15;35(10):1205-1211. Epub 2002 Oct 28. Comment in Clin Infect Dis. 2003 Jul 1; 37(1):148-9; author reply 149-150.
- El-Solh AA, Sikka P, Ramadan F, et al. Etiology of severe pneumonia in the very elderly. Am J Respir Crit Care Med. 2001 Mar;163(3 Pt 1):645-651.
- El-Solh AA, Aquilina AT, Dhillon RS, et al. Impact of invasive strategy on management of antimicrobial treatment failure in institutionalized older people with severe pneumonia. Am J Respir Crit Care Med. 2002 Oct 15;166(8):1038-1043.
- Lim WS, Macfarlane JT. A prospective comparison of nursing home acquired pneumonia with community acquired pneumonia. Eur Respir J. 2001Aug;18(2):362-368.
- Patriarca PA, Weber JA, Parker RA, et al. Efficacy of influenza vaccine in nursing homes. Reduction in illness and complications during an influenza A (H3N2) epidemic. JAMA. 1985 Feb 22;253(8):1136-1139.
- Lee C, Loeb M, Phillips A, et al. Zanamivir use during transmission of amantadine-resistant influenza A in a nursing home. Infect Control Hosp Epidemiol. 2000 Nov;21(11):700-704.
- Gaynes R. Health care-associated bloodstream infections: a change in thinking. Ann Intern Med. 2002 Nov 19;137(10):850-851.
- Friedman ND, Kaye KS, Stout JE, et al. Healthcare-associated bloodstream infections in adults: a reason to change the accepted definition of community-acquired infections. Ann Intern Med. 2002 Nov 19;137(10):791-797.
- Trouillet JL, Chastre J, Vuagnat A, et al. Ventilator-associated pneumonia caused by potentially drug-resistant bacteria. Am J Respir Crit Care Med. 1998 Feb;157(2):531-539.
- Slinin Y, Foley RN, Collins AJ. Clinical epidemiology of pneumonia in hemodialysis patients: the USRDS waves 1, 3, and 4 study. Kidney Int. 2006 Sep;70(6):1135-1141.
- Muder RR. Pneumonia in residents of long-term care facilities: epidemiology, etiology, management, and prevention. Am J Med. 1998 Oct;105(4):319-330.
- Kollef MH, Shorr A, Tabak YP, et al. Epidemiology and outcomes of health-care-associated pneumonia: results from a large US database of culture-positive pneumonia. Chest. 2005 Dec;128(6):3854-3862. Erratum in Chest. 2006 Mar; 129(3): 831. Comment in Chest. 2005 Dec; 128(6):3784-3787; Chest. 2006 Aug; 130(2):623.
- Fiore AE, Butler JC, Emori TG, et al. A survey of methods used to detect nosocomial legionellosis among participants in the National Nosocomial Infections Surveillance System. Infect Control Hosp Epidemiol. 1999 Jun;20(6):412-416.
- Korvick J, Yu VL, Fang GD. Legionella species as hospital-acquired respiratory pathogens. Semin Respir Infect. 1987 Mar;2(1):34-47.
- Haley CE, Cohen ML, Halter J, et al. Nosocomial Legionnaires’ disease: a continuing common-source epidemic at Wadsworth Medical Center. Ann Intern Med. 1979 Apr;90(4):583-586.
- Dondero TJ Jr, Rendtorff RC, Mallison GF, et al. An outbreak of Legionnaires’ disease associated with a contaminated air-conditioning cooling tower. N Engl J Med. 1980 Feb 14;302(7):365-370.
- Rello J, Sa-Borges M, Correa H. Variations in etiology of ventilator-associated pneumonia across four treatment sites: implications for antimicrobial prescribing practices. Am J Respir Crit Care Med. 1999 Aug;160(2):608-613.
- Namias N, Samiian L, Nino D, et al. Incidence and susceptibility of pathogenic bacteria vary between intensive care units within a single hospital: implications for empiric antibiotic strategies. J Trauma. 2000 Oct;49(4):638-645.
Final Exam?
You enter a patient’s room with all your senses on alert. You absorb the environment quickly—even before addressing the patient. It is perhaps these “small moments in medicine,” the under-the-radar information, that a physician may best remember about individual people or cases, says Andrew Bomback, MD, a first-year fellow in nephrology at the University of North Carolina at Chapel Hill. “Not the details of a specific disease state,” he elaborates, “but the visceral memory, such as how someone smells.”
In his article, “The Physical Exam and the Sense of Smell,” published in the New England Journal of Medicine in January 2006, Dr. Bomback writes that his training by doctors who “preached the gospel of the physical exam” was intended so that he and his fellow students “would not forget that the best doctors help their patients with their eyes, ears, and hands, not just with numbers posted on a computer screen.”1
Those small moments are often usurped from doctors as they deal with the demands and obligations of their jobs in an often-hurried environment. Let’s face it, he says, “The physical exam has just been truncated to very brief encounters.”
In fact, facing this dilemma is one of the first remedies he would prescribe. In response to the article, “I got a lot of nice letters from [physicians] who related similar incidents that happened in their training, where they used smell to learn more about a patient,” he says.
In contrast, he also received “somewhat negative letters where the message from those mostly retired physicians was, ‘You’re just not spending enough time with patients.’ I think that is a very unrealistic piece of advice,” says Dr. Bomback. “It would be very interesting to see whether they could carry the pager of a hospitalist or resident for 12 hours and actually be able to do what that hospitalist or resident does.”
Physicians today must first acknowledge the reality “that we don’t have as much time as we need,” says Dr. Bomback. “And once you admit that you’re not going to be able to spend as much time as you ideally would like … that we only have a 12-hour work shift if you are a hospitalist or a 30-hour call shift if you are a resident,” you have to maximize the time with the patient by giving “a focused physical that it is well done, accurate, and respectful to the patient.”
—Tim Creamer, MD, director, hospital medicine program, Community General Hospital, Syracuse, NY
Crisis or Evolution?
Sandeep Jauhar, MD, director of the Heart Failure Program at Long Island Jewish Medical Center, New Hyde Park, N.Y., also had an article in last year’s NEJM “Perspective” series.1-4 In that piece, “The Demise of the Physical Exam,”2 Dr. Jauhar posed a question: Is the demise of physical diagnosis a crisis or a natural evolution? Now, a year later, The Hospitalist asked him that same question.
“I don’t view it as a crisis,” he says, “but maybe that’s because of my vantage point as a cardiologist. Cardiology is very technology-driven; very few diagnoses are made on the basis of the physical exam.”
Dr. Jauhar believes that the greatest benefit of performing a thorough physical exam is not necessarily to pin down a diagnosis, though it can expedite that process, but to limit the tests that are ordered.
William Dickey, MD, hospitalist and director of quality at Abbott Northwestern Medical Center, Minneapolis, Minn., agrees that the decision of what testing to do, if any, is still guided by the physical exam.
“The high-tech diagnostic testing doesn’t demean the importance of the exam of all,” he says, but its role may have changed.
Are the intricate skills of performing a physical exam imperative, or have they mostly been replaced by technology? “I would say they’re not fully imperative under the assumption that you have the technology and you want to get the job done,” says Dr. Bomback. “Are they desired? Absolutely. A good physical exam and a remarkable finding are about showing what goes on inside the body and manifests itself outside the body.”
The ability to adequately hear a heart murmur or detect tetany is based on the physiologic understanding of why that murmur occurs or how calcium metabolism works. With that in mind, Dr. Bomback believes all patients would want their doctors to have those skills. “But,” he quickly qualifies, “could you have a functioning doctor get through his or her workday without knowing that? Absolutely. Could a cardiologist treat CHF without being able to hear a murmur? Of course. … So it’s desirable, but it’s not totally necessary.”
One reason for the desirability of maintaining those skills, which require physicians to “get up close,” as Dr. Dickey puts it, pertains to the importance of touching, seeing, and listening and to the quality of the patient-physician interaction itself.4 All the physicians interviewed for this article concur that getting that physical sense of the patient will tell you things that other information will not, and involving this true sensitivity in the interaction will most likely put the patient at greater ease.
“Because, in addition to all the information that a physician can discover from doing a physical exam, there is also a sense of rapport that the physical exam builds,” says C. Martin Buchanan, MD, FACP, a hospitalist at Penrose Hospital in Colorado Springs, Colo. “The therapy of being there, being present at the patient’s side, touching the patient, doing something for them, having a kind of healing energy, if you will, that we … transmit to the patient and [which essentially communicates], ‘I’m here to help you, I accept you as a human being even though you’re ill; I’m willing to touch you, and I’m here to help you feel better.’”
Not a Demise, but Compromised
“The physical exam is compromised during patient assessment because of where it ranks in importance,” says Tim Creamer, MD, director of the hospital medicine program at Community General Hospital in Syracuse, N.Y. “There are people who say that history is 80% of the diagnosis, which makes the physical exam 20% of the diagnosis. Although you try to emphasize that diagnostics, such as X-rays and labs, should only confirm your history and physical, we still depend too much on the technology to diagnose for us.”
The physical exam is not emphasized after medical school, says Dr. Creamer, who teaches second-year family practice residents. The emphasis now has become the patient-doctor interface: educating and talking with the patient and family. “And even in the lay literature, they encourage consumers to ‘Get your doctor to spend time with you,’” he says. “They mean talking to you, not checking your neck veins for A, C, and V waves.” Hospitalists may also minimize the physical exam, he adds, “because we feel pressured to maximize the talking and listening.”
The Focused Physical
The newest title in the 2006 edition of the Medical Knowledge Self-Assessment Program (MKSAP), published by the American College of Physicians, “Foundations of Internal Medicine,” includes an extensive discussion about the evidence-based physical exam. A good deal of recent research has addressed the topic of which physical findings are truly important to assess various conditions.
“If internists will pay attention to what’s in the medical literature about reliable physical findings,” says Dr. Buchanan, “we can tailor our physical exam a bit better, make more efficient use of the [interview] time, and provide very useful information for our diagnostic assessment and treatment planning.”
The MKSAP-14 offers 11 print books, a CD-ROM, and a new online version. Information is available at www.acponline.org/catalog/mksap/14/.
Powers of Observation
Performing a good physical exam is “something that we all aspire to and something we always try to improve,” says Dr. Bomback. “Anytime I hear of someone with a good physical exam finding I will try to see that patient.” It’s one of the reasons he likes working in an academic center. “There are always interesting cases, and there is always someone who wants to teach someone else what they’re seeing. It’s a constant learning process.”
Dr. Creamer agrees. He used to veer from his day-to-day routine and “follow around Max Kutzer, an internist at Crouse Hospital here at Syracuse, who practiced for years and who taught the physical exam to medical students at Harvard in 1954,” a time—he points out—when little-to-no diagnostic technology existed. Accompanying this master of medical observation, he says, was a Zen-like experience. The elder doctor “would walk to a patient’s doorway and stand there and watch the person breathe and watch how disheveled the bed was, whether the chair had been sat in, and [after] a couple of minutes he would walk out and say, ‘Now tell me what you noticed.’ ”
Dr. Creamer remembers naming “two or three things. But [Dr. Kutzer] would say, ‘OK, but let me tell you 10 more.’ ” Dr. Kutzer, now 96 and still productive, Dr. Creamer says, has written a book, Observation and the Physical Exam, which is in the editing stage.
Because physicians are pressed for time, those powers of observation may be, if not lost, at least largely neglected or ignored. “But I still do those things,” says Dr. Creamer. “I’ll walk to the door and watch a person breathe while they’re sleeping … . You lose the anxiety overtones when you’re watching someone sleeping. ... In order to learn, you need to listen. Listening takes time. You’ve got to step back and take the time to learn, and that’s where it gets tricky.”
Dr. Bomback believes technology will never replace the power of observation. “Those are the unique skills that come with being a hospitalist or any physician … and a lot of the reason why most people become physicians,” he says. “It is a skill that [they have had] from early on. It’s empathy, that you can observe a patient and understand what’s going on—maybe not completely, and not totally consciously, but there is an empathic sensation.”
Conclusion
The traditional use of the physical exam may have changed, but its value is still important to patient care.
“The physical exam is part of the culture of medicine,” says Dr. Jauhar. “It may have started to lose some of its utility as we get more technology, but it can limit the use of technology and help us make diagnoses more quickly.”
Providers might also sometimes be in a place “where you don’t have a CT scan or an MRI machine,” he adds. The provider discovers things that machines can’t supply, and the contributions of even a brief physical exam can communicate humanity to the patient.
“I have always wondered how physicians can do telemedicine,” says Dr. Dickey, “because there is something about being there and being with the patient in terms of judging the severity of illness that is very important.”
“For all these reasons, it’s important for hospitalists to maintain their skills,” says Dr. Jauhar, “because otherwise we’re losing a big part of what it is to be a doctor. We’re just becoming technicians.” TH
Andrea Sattinger is a frequent contributor to The Hospitalist.
References
- Bomback A. The physical exam and the sense of smell. N Engl J Med. 2006 Jan 26;354(4):327-329.
- Jauhar S. The demise of the physical exam. N Engl J Med. 2006;354(6):548-551.
- Markel H. The stethoscope and the art of listening. N Engl J Med. 2006;354(6):551-553.
- Treadway K. Becoming a physician: heart sounds. N Engl J Med. 2006 Mar 16;354(11):1112-1113.
The A to Z of Intellectual Disability
It is estimated that 17% of children in the United States have a developmental disability and that 1% to 2% of children are diagnosed with mental retardation.1 Of interest to hospitalists: Those with intellectual disability (ID) use healthcare services more than those in the general population.
During a 12-month period, 16% of adults with ID were hospitalized, and 30% were seen in an emergency department (ED).2 Because the average age at death in this population has increased—to 66.1 years in one study—hospitalists must become familiar with the medical management of these patients.3 Achieving comprehensive care presents a challenge because of the atypical presentation of symptoms and the behavioral and communication problems found in many hospitalized patients with ID.
In this article, I will address some of the major clinical issues hospitalists confront when caring for this population.
Where to Begin
One key to understanding how to care for this population is ascertaining whether there is underlying etiology of ID. A diagnosis can be established in approximately 50% of patients who have ID.4 For example, patients with Down syndrome are more likely to have celiac disease, hypothyroidism, leukemia, atlantoaxial subluxation, obstructive sleep apnea, Alzheimer’s dementia, seizure disorder, and behavioral and psychiatric disorders than are patients in the general population.5
Table 1 (see p. 21) lists common medical conditions found in patients with ID. Hospitalists should make it a priority to obtain a comprehensive medical record from the patient’s healthcare provider or to gather the necessary information from a caregiver who knows the patient well; this person may assist the hospitalist in interpreting mannerisms of the nonverbal patient that reflect symptoms such as pain.
Swallowing Difficulties: Problems and Solutions
The risk of aspiration and subsequent mortality because of oral dysfunction and dysphagia is increased in patients with profound ID. The presence of choking and coughing during feeds identifies patients at significant risk of asphyxiation.6
In one study involving patients with severe ID, the absence of respiratory distress during meals or the lack of chronic lung disease identified 85% of patients who did not aspirate.7 Clinical assessment by speech-language therapists and the use of video fluoroscopy may be helpful in patients who experience either frequent aspiration pneumonias or episodes of coughing or choking during feeds. Cramming food into the mouth, eating too fast, and losing the bolus into the pharynx prematurely were factors predictive of asphyxiation risk.6 Speech-language therapists and nutritionists may assist hospitalists by recommending diet and feeding modifications that ensure the safe speed and size of bolus delivery, along with adjustment in food textures to reduce the risk of asphyxiation.
Patients with swallowing difficulties are also vulnerable to dehydration and malnutrition. In fact, more than 60% of children and adults with ID are underweight, with a body mass index less than or equal to 20. Food-intake surveys have demonstrated adequate protein intake but reduced fat, carbohydrate, and energy-food intake. Increasing energy-dense fats and sugar-containing foods, while monitoring for adequate fluid intake, is recommended in these individuals.8
In patients who have worsening dysphagia associated with pneumonia, insertion of an enteral feeding tube, such as a percutaneous endoscopic gastrostomy (PEG) tube, can provide adequate nutrition and may reduce the risk of future episodes of pneumonia (although this practice is controversial).
In one study, there was a 45% reduction in the incidence of pneumonia in the year following feeding-tube insertion.9 Other investigators have not found that gastrostomy tubes prevent pneumonia, however.10 Instead, the presence or absence of gastroesophageal reflux and whether or not the patient has a prior history of aspiration pneumonia seem to be more important factors in determining if episodes of pneumonia will occur after feeding-tube placement.
The prevalence of gastroesophageal reflux (GER) in 435 institutionalized patients with IQ <50 ID was 48.2%.11 Almost 70% of patients with GER had reflux esophagitis, while 14% had Barrett’s esophagus, and 3.9% had peptic strictures. Bui and colleagues studied 105 ID patients with feeding gastrostomy, 45 of whom had dysphagia but no history of aspiration pneumonia and 60 who had recurrent aspiration, either alone or with dysphagia.12 Only two of 45 (4.4%) patients with dysphagia alone developed aspiration pneumonia, while 15 of 60 (25.0%) with a prior history of aspiration pneumonia had a future event.12
Continued aspiration pneumonia may be due to oral secretions and gastric contents entering the respiratory tract. Preoperative GER has been associated with postoperative aspiration pneumonia.10 Elevating the head of the bed, avoiding bolus feeding, treating constipation, discontinuing feeding promptly in cases of respiratory distress or increased gastric residual volume, and treating gastroesophageal reflux pharmacologically may decrease further pneumonia events in these patients.9
Treating Seizures
Another common issue hospitalists must be attuned to in adult patients with ID is epilepsy. Prevalent in as many as 40% of adult patients with mental retardation and cerebral palsy, uncontrolled epilepsy has been associated with increased mortality.13,14 Clinical guidelines for the management of epilepsy in this population have been published.15 Recommended first-line treatments of generalized seizures include sodium valproate and lamotrigine. If these medications are unsuccessful, or if side effects prohibit continued usage, then topiramate and carbamazepine are suggested. Do not use carbamazepine in myoclonic or absence seizures. Lennox-Gastaut syndrome can be treated with lamotrigine, while topiramate and felbamate can be used as add-on therapy to reduce atonic seizures.
For treatment of partial seizures, valproate, carbamazepine, and lamotrigine are recommended first-line treatments. Levetiracetam can be used as add-on therapy. The guidelines suggest that studies of add-on therapy failed to differentiate among lamotrigine, gabapentin, topiramate and tiagabine.
Adjust the initial anti-epileptic drug (AED) to the maximum tolerated dose before slowly introducing a second AED without tapering the first. If the patient responds to the second drug, consider a gradual tapering of the first drug. It is not uncommon for multiple AEDs to be used in patients with ID. In patients referred to a specialized epilepsy clinic, over 80% were on two or more AEDs; 43% became seizure-free for a year or more, while another 40% of patients had a 50% or greater reduction in seizure frequency.16
AEDs that induce the cytochrome P-450 system—particularly phenytoin—phenobarbital, and carbamazepine, have been associated with low bone mineral density (BMD) in patients with ID.17 Additional risk factors for low BMD, such as hypogonadism, low body mass, decreased mobility, and vitamin D deficiency may contribute to the increased incidence of non-traumatic fractures found in institutionalized adults with ID.18,19 In one study, the annual incidence of non-traumatic fracture was 7.3% among 391 institutionalized adults.18
In another study, however, researchers found that although 57% of patients who suffered a fracture were vitamin-D deficient there was no significant association between vitamin D deficiency and fractures.20 Although there are no specific guidelines designed to evaluate and treat bone-health-related issues in adults with ID, it seems prudent to ensure adequate calcium and vitamin D intake, to encourage exercise if possible, and, in patients who suffer non-traumatic fractures, to evaluate for osteoporosis and give appropriate therapy according to the recommendations of the National Institutes of Health Consensus Development Panel on Osteoporosis Prevention, Diagnosis, and Therapy.21
Self-Injurious Behavior and the Risk of Polypharmacy
Adults with ID who are nonverbal may demonstrate self-injurious behavior (SIB) as a manifestation of pain from fracture, constipation, or other medical illnesses. The prevalence of SIB in this population ranges from 2% to 50%.22 Psychotropic medications are frequently used to protect patients from self-injury.23 The challenge for hospitalists is to keep patients from injuring themselves without masking underlying pathologic conditions.
Several hypotheses have tried to explain why patients engage in SIB: These include increased level of endogenous opioids leading to pain insensitivity, opioid release due to low endogenous opioid levels caused by the SIB itself, and reaction to pain. Breau and colleagues concluded that children with ID who suffered chronic pain self-injured less body surface area and fewer body sites than children without chronic pain. Patients without chronic pain who engaged in SIB were more likely to self-injure their heads and hands.22
If a medical etiology cannot be ascertained for aggressive, self-injurious, and destructive behavior, psychotropic agents are frequently employed, with rates that range from 18% to 49% in patients with ID.24 These medications should be prescribed in a start-low/go-slow manner and only after a thorough assessment has been performed and the physician has determined that the behavior cannot be redirected and poses an imminent risk to the patient.25
Because of ID patients’ decreased communication skills, polypharmacy is a significant risk; side effects of psychotropic agents may be mistakenly treated with additional agents. According to Janowsky and colleagues, the mean lowest effective dose of conventional antipsychotics such as haloperidol was 5.9 mg/day to maintain symptom suppression of maladaptive behavior, with relapse of symptoms occurring at a mean dose of 3.8 mg/day in an ID population.23 Atypical antipsychotics are now more widely used in adults with ID, and although they are less likely to cause extrapyramidal side effects, they can still lead to weight gain, sedation, increased lipid levels, and activation of diabetes mellitus. In one study, low dose risperidone (2 mg/day) reduced aberrant behavior by half in 57% of patients with ID. Increased appetite and weight gain were common side effects.26
Other agents such as benzodiazepines have been reported to have behavioral side effects as high as 13% when used in patients with ID; in one study, time to onset of side effects averaged 23 days.27 This may erroneously lead outpatient physicians to prescribe additional agents to counteract the behavioral side effects of the drugs that were initiated in the hospital. If you prescribe benzodiazepines then the patient’s side effects may be mitigated by using lower doses of lorazepam (3 mg/day or less). You may also consider naltrexone to treat patients with SIB. A review of 86 ID patients with SIB concluded that naltrexone was effective in reducing self-injury in 80% of subjects, with nearly half of the patients experiencing a 50% reduction in these types of behavior. The dose most studied was 50 mg.28
Palliative Care
Hospitalists should also be familiar with the palliative-care needs of patients with ID. A recent survey of directors providing services to older adults with ID identified the following as frequently cited obstacles to end-of-life care: availability of direct care staff, availability of nursing/medical staff, staff untrained in end-of-life care, anxiety about responding to families, and liability concerns.29
Because many patients with ID are unable to make medical decisions about their care, a surrogate (e.g., a family member, a judicially appointed guardian, or a court) must decide to initiate or maintain medical interventions. The prevailing standard that applies to surrogate decision-making in the ID population is identifying the patient’s best interests. The medical course chosen may not necessarily be the best option, but it should not be “antithetical to the patient’s interests as to constitute neglect or abuse.”30
A clinical scenario hospitalists may face in patients with profound ID that addresses this legal reasoning involves seeing a patient with respiratory distress in the ED who needs intubation and mechanical ventilation to have a chance at survival. Later, this patient is found to have metastatic cancer and is in significant pain and discomfort. Applying the best interests standard, the hospitalist may elect to intubate and treat the patient. Once the cancer is discovered, however, the physician does not insist that the patient undergo invasive treatment and, instead, focuses his/her efforts on providing palliative care.
Conclusion
As the number of patients with ID transitioning from pediatrics to medicine increases, hospitalists will be looked upon to develop a comprehensive approach to ensure their overall well-being. A systematic approach to caring for hospitalized adults is suggested in Table 2 (see p. 22). TH
Dr. Geskey is assistant professor, Pediatrics and Medicine, Penn State, Milton S. Hershey Medical Center, Penn State College of Medicine, Department of Pediatrics & Internal Medicine.
References
- Boyle CA, Decouflé P, Yeargin-Allsopp M. Prevalence and health impact of developmental disabilities in US children. Pediatrics. 1994;93(3):399-403.
- Janicki MP, Davidson PW, Henderson CM, et al. Health characteristics and health services utilization in older adults with intellectual disabilities living in community residences. J Intellect Disabil Res. 2002;46:287-298.
- Janicki MP, Dalton AJ, Henderson CM, et al. Mortality and morbidity among older adults with intellectual disability: health services considerations. Disabil Rehabil. 1999;21(5-6):284-294.
- van Karnebeek CD, Scheper FY, Abeling NG, et al. Etiology of mental retardation in children referred to a tertiary care center: a prospective study. Am J Ment Retard. 2005;110(4):253-267.
- Roizen NJ, Patterson D. Down’s syndrome. Lancet. 2003 Apr;361(9365):1281-1289. Comment in Lancet, 2003 Jul; 362(9365):1281-80-81.
- Samuels R, Chadwick DD. Predictors of asphyxiation risk in adults with intellectual disabilities and dysphagia. J Intellect Disabil Res. 2006 May;50(Pt 5):362-370.
- Rogers B, Stratton P, Msall M, et al. Long-term morbidity and management strategies of tracheal aspiration in adults with severe developmental disabilities. Am J Ment Retard. 1994 Jan:98(4):490-498.
- Kennedy M, McCombie L, Dawes P, et al. Nutritional support for patients with intellectual disability and nutrition/dysphagia disorders in community care. J Intellect Disabil Res. 1997 Oct;41(Pt 5):430-436.
- Gray DS, Kimmel D. Enteral tube feeding and pneumonia. Am J Ment Retard. 2006 Mar;111(2):113-120.
- Hassett JM, Sunby C, Flint LM. No elimination of aspiration pneumonia in neurologically disabled patients with feeding gastrostomy. Surg Gynecol Obstet. 1988 Nov;167(5):383-388.
- Böhmer CJM, Niezen-de Boer MC, Klinkenberg-Knol EC, et al. The prevalence of gastroesophageal reflux disease in institutionalized intellectually disabled individuals. Am J Gastroenterol. 1999;94(3):804-810.
- Bui HD, Dang CV, Chaney RH, et al. Does gastrostomy and fundoplication prevent aspiration pneumonia in mentally retarded persons? Am J Ment Retard. 1989 Jul;94(1):16-19.
- McDermott S, Moran R, Platt T, et al. Prevalence of epilepsy in adults with mental retardation and related disabilities in primary care. Am J Ment Retard. 2005 Jan;110(1):48-56.
- Forsgren L, Edvinsson SO, Nyström L, et al. Influence of epilepsy on mortality in mental retardation: an epidemiologic study. Epilepsia. 1996;37(19):956-963.
- Working group of the International Association of the Scientific Study of Intellectual Disability. Clinical guidelines for the management of epilepsy in adults with an intellectual disability. Seizure. 2001 Sep;10(6):401-409.
- Kelly K, Stephen LJ, Brodie MJ. Pharmacological outcomes in people with mental retardation and epilepsy. Epilepsy Behav. 2004 Feb;5(1):67-71.
- Sheth RD. Metabolic concerns associated with antiepileptic drugs. Neurology. 2004;63(Suppl 4):S24-29.
- Ryder KM, Williams J, Womack C, et al. Appendicular fractures: a significant problem among institutionalized adults with developmental disabilities. Am J Ment Retard. 2003 Sep;108(5):340-346.
- Jaffe JS, Timell AM, Elolia R, et al. Risk factors for low bone mineral density in individuals residing in a facility for the people with intellectual disability. J Intellect Disabil Res. 2005Jun;49(Pt 6):457-462.
- Vanlint S, Nugent N. Vitamin D and fractures in people with intellectual disability. J Intellect Disabil Res. 2006 Oct; 50(Pt 10):761-767.
- NIH Consensus Development Panel on Osteoporosis Prevention, Diagnosis, and Therapy. Osteoporosis prevention, diagnosis, and therapy. JAMA. 2001;285:785-795.
- Breau LM, Camfield CS, Symons FJ, et al. Relation between pain and self-injurious behavior in nonverbal children with severe cognitive impairments. J Pediatr. 2003 May;142(5):498-503.
- Janowsky DS, Barnhill LJ, Shetty M, et al. Minimally effective doses of conventional antipsychotic medications used to treat aggression, self-injurious and destructive behaviors in mentally retarded adults. J Clin Psychopharmacol. 2005 Feb;25(1):19-25.
- Valdovinos MG, Schroeder SR, Kim G. Prevalence and correlates of psychotropic medication use among adults with developmental disabilities: 1970-2000. Int Rev Res Ment Retard. 2003;26:175-220.
- Szymanski L, King BH. Summary of the Practice Parameters for the Assessment and Treatment of Children, Adolescents, and Adults with Mental Retardation and Comorbid Mental Disorders. American Academy of Child and Adolescent Psychiatry. J Am Acad Child Adolesc Psychiatry. 1999;38:1606-1610.
- Hellings JA, Zarcone JR, Reese RM, et al. A crossover study of risperidone in children, adolescents and adults with mental retardation. J Autism Dev Disord. 2006;36(3):401-411.
- Kalachnik JE, Hanzel TE, Sevenich R, et al. Benzodiazepine behavioral side effects: review and implications for individuals with mental retardation. Am J Ment Retard. 2002 Sep;107(5):376-410.
- Symons FJ, Thompson A, Rodriguez MC. Self-injurious behavior and the efficacy of naltrexone treatment: a quantitative synthesis. Ment Retard Dev Disabil Res Rev. 2004;10(3):193-200.
- Botsford AL. Status of end of life care in organizations providing services for older people with a developmental disability. Am J Ment Retard. 2004;109(5):421-428.
- Cantor NL. The bane of surrogate decision-making defining the best interests of never-competent persons. J Leg Med. 2005 Jun;26(2):155-205.
Inflammatory Findings
Mrs. K, an 81-year-old golf-enthusiast admitted with congestive heart failure, now refuses to walk and complains of ankle pain. When you see her, she refuses to let even a bedsheet near her left ankle, and she claims that you did this to her.
Unfortunately, she’s probably right. Mrs. K also has a history of podagra, and she developed an acute gouty monoarthritis after receiving treatment with diuretics and aspirin. Gout—along with the other causes of inpatient acute monoarthritis (pseudogout, septic arthritis, and trauma)—are increasingly common diagnoses in the geriatric patient population. Because the elderly are uniquely predisposed to losing functional independence following an acute attack, making a timely diagnosis is particularly important in this age group. And though the patient’s clinical features may point toward an etiology, making the correct diagnosis ultimately depends on the results of the joint tap.
Gout
Gout occurs in patients with high serum levels of uric acid, though not all hyperuricemic patients develop gout. Among elderly hospitalized patients with hyperuricemia, approximately 65% have significant renal impairment, and others have advanced hypertension, coronary artery disease, and congestive heart failure. Over time, high serum uric acid levels may lead to the deposition of monosodium urate crystals in the joints; these lesions are the precursors of a gouty attack.
Gouty attacks occur when crystal deposits become inflamed. The inflammation may be triggered by a medication-induced change in uric acid concentration or by a medical condition, including acute illness, trauma, surgery, and dehydration. (See Table 1, p.18.) Though some elderly patients with acute gouty arthritis will manifest confusion or a sudden change in ambulatory status, most will present with a monoarthritis and a rise in temperature. Gout is suspected clinically when the first metatarsal phalangeal joint is involved (podagra), but other commonly involved joints include the ankle and the knee. Uric acid levels in the blood are usually elevated but can also temporarily normalize or even dip low during attacks. An X-ray of the involved joint may be normal or may already show the characteristic erosive lesion of gout, the “overhanging edge.”
Making the correct diagnosis is dependent upon visualizing intracellular, needle-shaped, negatively birefringent crystals in the synovial fluid. After the fluid is removed from the affected joint, it should be examined under polarized light within two hours; if more time is needed, the fluid can be refrigerated for up to 12 hours. Co-infection of a gouty joint has been described in the elderly population, and the synovial fluid should be sent to the laboratory for a cell count, Gram’s stain, and culture, as well as glucose and lactate levels. (See Table 2, below.)
Direct in-hospital treatment of gout toward alleviating the current attack, preventing future attacks, and providing appropriate antibiotic coverage in suspected co-infected cases until joint culture results are finalized. Treatment options for the acute attack include NSAIDs and corticosteroids—either oral or intra-articular. Hourly oral colchicine is not a good option for an elderly patient because the diarrhea that ensues is particularly disruptive. Nor is IV colchicine a good option thanks to its side-effect profile that renders it unusable in patients with reduced renal function. The treatment of hyperuricemia with allopurinol should not be undertaken during the acute attack because any change in the serum uric acid concentration will serve only to exacerbate the current inflammation.
Anti-inflammatory doses of NSAIDs are effective and will shorten the duration of symptoms substantially. Seven to 10 days of indomethacin at a dose of 50 mg taken orally three times daily is the traditional choice, and though it is generally conceded that ibuprofen and naproxen also work well, no comparative trials have been performed. Elderly patients are at increased risk for adverse effects from NSAIDs, particularly those patients with severely reduced renal function, gastropathy, asthma, congestive heart failure, or other intravascularly depleted states. Gastric mucosal protection, using proton-pump inhibitors, and careful monitoring of fluid status, renal function, and mental status are of particular concern in this population.

Because recent research indicates that COX-2 inhibitors have thrombotic potential and are contraindicated in patients at high risk for cardiovascular events or stroke, the extent to which they can be used in an elderly patient with an acute gouty attack is limited. A traditional NSAID in combination with a proton-pump inhibitor may be as effective as a COX-2 inhibitor in reducing the risk of gastroduodenal toxicity, however.
Corticosteroids—given either orally or intra-articularly—are an appropriate treatment for patients who can’t tolerate an NSAID. As long as a septic joint has been excluded, an intra-articular injection of 40–80 mg triamcinolone acetonide or 40 mg of methylprednisolone acetate will result in major improvement within 24 hours for most patients. Another option is a seven- to 10-day course of oral prednisone, starting with 40 mg on day one and reducing the dosage by 5 mg/day. Elderly patients taking oral prednisone should also receive adequate calcium, vitamin D, and a proton pump inhibitor for gastrointestinal protection, as well as close monitoring of blood pressure, glucose, and mental status.
If a patient has a history of frequent attacks or tophi, has a serum uric acid level higher than 12 mg/dl, or is consistently receiving high doses of diuretics, that person is at high risk for subsequent attacks and should receive prophylactic treatment with either a low-dose daily NSAID or a renally dosed oral colchicine.
Pseudogout
Pseudogout is the articular manifestation of calcium pyrophosphate dihydrate (CPPD) deposition, and this process is associated with aging as well as with various endocrinopathies, the most common of which is hyperparathyroidism. (See Table 3, below.) The shedding of CPPD crystals initiates an inflammatory process, and these crystals invoke an inflammatory response in much the same manner as uric acid crystals.
While the precipitants of a pseudogout attack are less well defined than those of gout, dehydration and joint surgery have both been identified as predisposing factors. The acute monoarticular pain and swelling (the knee is most common, followed by the ankle and then any other synovial joint) that ensues usually has a more insidious onset, and an X-ray may show chondrocalcinosis within the joint space. The diagnosis is confirmed by the demonstration of intracellular CPPD crystals in the aspirated joint fluid. Though less easily seen than monosodium urate crystals, rhomboidal crystals that display weakly positive birefringence under polarized light will be revealed with careful observation. Vitally important to the diagnosis of any crystal-associated arthritis is the exclusion of septic arthritis. To this end, conduct synovial fluid and blood cultures even if the suspicion of sepsis is low.
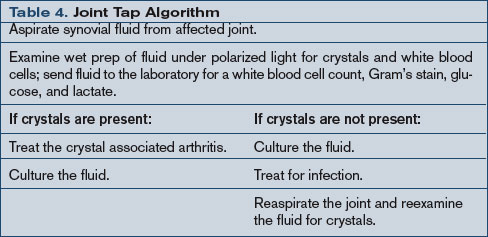
Treatment goals for pseudogout center on the abatement of the current arthritis and the exclusion of an infected joint or a concurrent metabolic syndrome. NSAIDs are the mainstay of therapy for the management of pseudogout; they are prescribed in anti-inflammatory doses similar to those used in the treatment of gout. Corticosteroids can also be used, particularly an intra-articular injection, as long as infection has been excluded. As with any crystal arthropathy, a septic joint should be considered and treated in high-risk patients even before the results of the joint fluid cultures are available. (See Table 4, above.)
Septic Arthritis
Even with timely antibacterial treatment, an elderly patient with a septic joint has a 7% to 32% mortality rate. Staphylococcus and Streptococcus are the most commonly cultured pathogens, but consider E. coli, Pseudomonas, and Klebsiella species in patients with diabetes mellitus, malignancy, or other debilitating chronic syndromes; less common agents include tuberculosis and gonococcus. Fever may be present, but a recent study revealed that fewer than 60% of geriatric patients with septic arthritis presented with a febrile illness. Thus, systemic features are not reliable enough to warrant making or excluding the diagnosis of septic arthritis without examination of the synovial fluid. (See Table 5, below.)
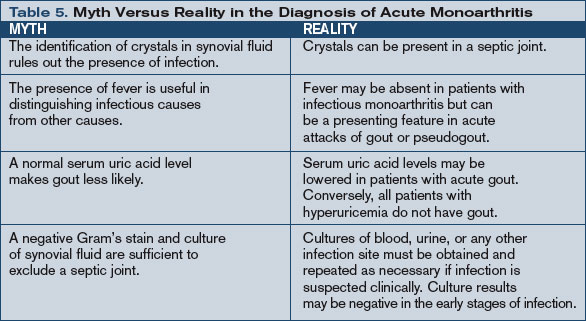
Send synovial fluid for leukocyte count, Gram’s stain, and culture in all suspected cases, and several studies suggest that the diagnostic yield may be improved with direct inoculation of fluid into blood culture vials or isolator tubes. Synovial fluid will also show very low glucose (less than 25% of simultaneous plasma glucose) and very high lactate (greater than 10 mm/l) in the untreated bacterial septic joint.
Treatment of a septic joint includes both appropriate antimicrobial therapy and joint drainage. Three weeks of parenteral antimicrobial therapy directed against the isolated pathogen is usually sufficient once the affected joint has been drained. Surgical drainage is indicated in joints—like the hip—that are difficult to aspirate or monitor. Other indications include pus in the synovial fluid, spread of infection to the soft tissues, or an inadequate clinical response to appropriate antibiotics after five to seven days. Otherwise, daily aspiration is the treatment of choice for an uncomplicated infected joint. Additionally, as is true in any acute monoarthritis, bed rest and optimal joint positioning are required to prevent the occurrence of joint deformation and harmful contractures. TH
Dr. Landis is a rheumatologist and a freelance writer.
Special thanks to Bradley Flansbaum, MD, for his assistance with this article.
References
- Tenenbaum J. Inflammatory musculoskeletal conditions in older adults. Geriatr Aging. 2005;8(3):14-17.
- Bieber JD, Terkeltaub RA. Gout: on the brink of novel therapeutic options for an ancient disease. Arthritis Rheum. 2004 Aug;50(8):2400-2414.
- Terkeltaub RA. Clinical practice. Gout. N Engl J Med. 2003 Oct 23;349(17):1647-1655.
- Leirisalo-Repo M. Early arthritis and infection. Curr Opin Rheumatol. 2005 Jul;17(4):433-439.
- Siva C, Velazquez C, Mody A, et al. Diagnosing acute monoarthritis in adults: a practical approach for the family physician. Am Fam Physician. 2003 Jul 1;68(1):83-90.
Mrs. K, an 81-year-old golf-enthusiast admitted with congestive heart failure, now refuses to walk and complains of ankle pain. When you see her, she refuses to let even a bedsheet near her left ankle, and she claims that you did this to her.
Unfortunately, she’s probably right. Mrs. K also has a history of podagra, and she developed an acute gouty monoarthritis after receiving treatment with diuretics and aspirin. Gout—along with the other causes of inpatient acute monoarthritis (pseudogout, septic arthritis, and trauma)—are increasingly common diagnoses in the geriatric patient population. Because the elderly are uniquely predisposed to losing functional independence following an acute attack, making a timely diagnosis is particularly important in this age group. And though the patient’s clinical features may point toward an etiology, making the correct diagnosis ultimately depends on the results of the joint tap.
Gout
Gout occurs in patients with high serum levels of uric acid, though not all hyperuricemic patients develop gout. Among elderly hospitalized patients with hyperuricemia, approximately 65% have significant renal impairment, and others have advanced hypertension, coronary artery disease, and congestive heart failure. Over time, high serum uric acid levels may lead to the deposition of monosodium urate crystals in the joints; these lesions are the precursors of a gouty attack.
Gouty attacks occur when crystal deposits become inflamed. The inflammation may be triggered by a medication-induced change in uric acid concentration or by a medical condition, including acute illness, trauma, surgery, and dehydration. (See Table 1, p.18.) Though some elderly patients with acute gouty arthritis will manifest confusion or a sudden change in ambulatory status, most will present with a monoarthritis and a rise in temperature. Gout is suspected clinically when the first metatarsal phalangeal joint is involved (podagra), but other commonly involved joints include the ankle and the knee. Uric acid levels in the blood are usually elevated but can also temporarily normalize or even dip low during attacks. An X-ray of the involved joint may be normal or may already show the characteristic erosive lesion of gout, the “overhanging edge.”
Making the correct diagnosis is dependent upon visualizing intracellular, needle-shaped, negatively birefringent crystals in the synovial fluid. After the fluid is removed from the affected joint, it should be examined under polarized light within two hours; if more time is needed, the fluid can be refrigerated for up to 12 hours. Co-infection of a gouty joint has been described in the elderly population, and the synovial fluid should be sent to the laboratory for a cell count, Gram’s stain, and culture, as well as glucose and lactate levels. (See Table 2, below.)
Direct in-hospital treatment of gout toward alleviating the current attack, preventing future attacks, and providing appropriate antibiotic coverage in suspected co-infected cases until joint culture results are finalized. Treatment options for the acute attack include NSAIDs and corticosteroids—either oral or intra-articular. Hourly oral colchicine is not a good option for an elderly patient because the diarrhea that ensues is particularly disruptive. Nor is IV colchicine a good option thanks to its side-effect profile that renders it unusable in patients with reduced renal function. The treatment of hyperuricemia with allopurinol should not be undertaken during the acute attack because any change in the serum uric acid concentration will serve only to exacerbate the current inflammation.
Anti-inflammatory doses of NSAIDs are effective and will shorten the duration of symptoms substantially. Seven to 10 days of indomethacin at a dose of 50 mg taken orally three times daily is the traditional choice, and though it is generally conceded that ibuprofen and naproxen also work well, no comparative trials have been performed. Elderly patients are at increased risk for adverse effects from NSAIDs, particularly those patients with severely reduced renal function, gastropathy, asthma, congestive heart failure, or other intravascularly depleted states. Gastric mucosal protection, using proton-pump inhibitors, and careful monitoring of fluid status, renal function, and mental status are of particular concern in this population.
Because recent research indicates that COX-2 inhibitors have thrombotic potential and are contraindicated in patients at high risk for cardiovascular events or stroke, the extent to which they can be used in an elderly patient with an acute gouty attack is limited. A traditional NSAID in combination with a proton-pump inhibitor may be as effective as a COX-2 inhibitor in reducing the risk of gastroduodenal toxicity, however.
Corticosteroids—given either orally or intra-articularly—are an appropriate treatment for patients who can’t tolerate an NSAID. As long as a septic joint has been excluded, an intra-articular injection of 40–80 mg triamcinolone acetonide or 40 mg of methylprednisolone acetate will result in major improvement within 24 hours for most patients. Another option is a seven- to 10-day course of oral prednisone, starting with 40 mg on day one and reducing the dosage by 5 mg/day. Elderly patients taking oral prednisone should also receive adequate calcium, vitamin D, and a proton pump inhibitor for gastrointestinal protection, as well as close monitoring of blood pressure, glucose, and mental status.
If a patient has a history of frequent attacks or tophi, has a serum uric acid level higher than 12 mg/dl, or is consistently receiving high doses of diuretics, that person is at high risk for subsequent attacks and should receive prophylactic treatment with either a low-dose daily NSAID or a renally dosed oral colchicine.
Pseudogout
Pseudogout is the articular manifestation of calcium pyrophosphate dihydrate (CPPD) deposition, and this process is associated with aging as well as with various endocrinopathies, the most common of which is hyperparathyroidism. (See Table 3, below.) The shedding of CPPD crystals initiates an inflammatory process, and these crystals invoke an inflammatory response in much the same manner as uric acid crystals.
While the precipitants of a pseudogout attack are less well defined than those of gout, dehydration and joint surgery have both been identified as predisposing factors. The acute monoarticular pain and swelling (the knee is most common, followed by the ankle and then any other synovial joint) that ensues usually has a more insidious onset, and an X-ray may show chondrocalcinosis within the joint space. The diagnosis is confirmed by the demonstration of intracellular CPPD crystals in the aspirated joint fluid. Though less easily seen than monosodium urate crystals, rhomboidal crystals that display weakly positive birefringence under polarized light will be revealed with careful observation. Vitally important to the diagnosis of any crystal-associated arthritis is the exclusion of septic arthritis. To this end, conduct synovial fluid and blood cultures even if the suspicion of sepsis is low.
Treatment goals for pseudogout center on the abatement of the current arthritis and the exclusion of an infected joint or a concurrent metabolic syndrome. NSAIDs are the mainstay of therapy for the management of pseudogout; they are prescribed in anti-inflammatory doses similar to those used in the treatment of gout. Corticosteroids can also be used, particularly an intra-articular injection, as long as infection has been excluded. As with any crystal arthropathy, a septic joint should be considered and treated in high-risk patients even before the results of the joint fluid cultures are available. (See Table 4, above.)
Septic Arthritis
Even with timely antibacterial treatment, an elderly patient with a septic joint has a 7% to 32% mortality rate. Staphylococcus and Streptococcus are the most commonly cultured pathogens, but consider E. coli, Pseudomonas, and Klebsiella species in patients with diabetes mellitus, malignancy, or other debilitating chronic syndromes; less common agents include tuberculosis and gonococcus. Fever may be present, but a recent study revealed that fewer than 60% of geriatric patients with septic arthritis presented with a febrile illness. Thus, systemic features are not reliable enough to warrant making or excluding the diagnosis of septic arthritis without examination of the synovial fluid. (See Table 5, below.)
Send synovial fluid for leukocyte count, Gram’s stain, and culture in all suspected cases, and several studies suggest that the diagnostic yield may be improved with direct inoculation of fluid into blood culture vials or isolator tubes. Synovial fluid will also show very low glucose (less than 25% of simultaneous plasma glucose) and very high lactate (greater than 10 mm/l) in the untreated bacterial septic joint.
Treatment of a septic joint includes both appropriate antimicrobial therapy and joint drainage. Three weeks of parenteral antimicrobial therapy directed against the isolated pathogen is usually sufficient once the affected joint has been drained. Surgical drainage is indicated in joints—like the hip—that are difficult to aspirate or monitor. Other indications include pus in the synovial fluid, spread of infection to the soft tissues, or an inadequate clinical response to appropriate antibiotics after five to seven days. Otherwise, daily aspiration is the treatment of choice for an uncomplicated infected joint. Additionally, as is true in any acute monoarthritis, bed rest and optimal joint positioning are required to prevent the occurrence of joint deformation and harmful contractures. TH
Dr. Landis is a rheumatologist and a freelance writer.
Special thanks to Bradley Flansbaum, MD, for his assistance with this article.
References
- Tenenbaum J. Inflammatory musculoskeletal conditions in older adults. Geriatr Aging. 2005;8(3):14-17.
- Bieber JD, Terkeltaub RA. Gout: on the brink of novel therapeutic options for an ancient disease. Arthritis Rheum. 2004 Aug;50(8):2400-2414.
- Terkeltaub RA. Clinical practice. Gout. N Engl J Med. 2003 Oct 23;349(17):1647-1655.
- Leirisalo-Repo M. Early arthritis and infection. Curr Opin Rheumatol. 2005 Jul;17(4):433-439.
- Siva C, Velazquez C, Mody A, et al. Diagnosing acute monoarthritis in adults: a practical approach for the family physician. Am Fam Physician. 2003 Jul 1;68(1):83-90.
Status Report
The mission of the University HealthSystem Consortium, based in Chicago, is “to advance knowledge, foster collaboration, and promote change to help members succeed in their respective markets. UHC’s vision is to be a catalyst for change, accelerating the achievement of clinical and operational excellence.” (www.uhc.edu).
As part of UHC’s improvement and effectiveness initiatives, a benchmarking project (“Role of the Hospitalist 2006 Benchmarking Project Performance Scorecard”) was undertaken during the summer and fall of 2006 to examine what hospitalists nationwide do, as well as how they are incorporated into patient care and how they are funded by member hospitals. The benchmarking project articulated how hospitalist programs are measured and what they do to add value to their member organizations.
Methods
A seven-person steering committee was selected to provide guidance. Under the direction of Danielle Carrier, MBA, project manager, Operations Improvement; UHC, the committee developed a survey of hospitalist program characteristics, hospitalist value self-assessment, and hospitalist innovative strategies. Twenty-three member organizations participated.
Results
The most common reason for starting a hospitalist program was improving efficiency and reducing length of stay through enhanced on-site availability; however, the impetus for hospitalist services has changed in 81% of responding organizations. The most common changes were increasing the focus on teaching and academic pursuits, quality, and safety, and providing coverage for services to facilitate Accreditation Council for Graduate Medical Education (ACGME) compliance, including co-management of surgical patients. The direction of change differed by the age of the program and the hospitalist model (teaching, non-teaching, and mixed models).
The benchmarking project articulated the value that hospitalist programs bring to their organizations:
- Quality improvement initiatives (development of protocols or pathways, standardization of care, medication reconciliation, enhanced glycemic control, and physician availability at care transitions such as ICU and emergency department [ED], as well as for pre-operative consults);
- Development of new services (palliative care programs, surgical co-management); and
- Improvement of the educational process (through more contact with faculty, multidisciplinary team rounding, curriculum development around the core competencies, hospitalist training programs, and practice-based learning).
Of the respondents, 95% report that hospitalists assume leadership roles in quality and safety initiatives. For the key stakeholders (senior administrator or department chair) the aspects of the hospitalist program that bring the most value are quality of care and safety, throughput and LOS, and expanded admission capacity and coverage.
Measures of success include length of stay, relative value units and service workload, teaching evaluations, admission and consult volume, costs and cost savings, core measures and national quality indicators, patient satisfaction, referring physician satisfaction, and academic productivity.
Information on hospitalist program funding indicated the following:
- Sole funding of salaries by the hospital: 45% of respondents; and
- Joint funding (hospital and another organization such as a medical school, a practice plan, or a clinical department): 50% of respondents.
Although no organization offers incentives for the program itself, 35% of organizations offer incentives for individual hospitalists. Incentives for individual hospitalists include productivity and relative value units, LOS, budget, quality measures, and weekend work. Two-thirds of organizations with individual incentives reported that the incentives have altered behavior or helped achieve program objectives.
The survey of workload and schedule was notable for the following:
- An annual average of 10 weeks of protected non-direct patient-care time per hospitalist is offered at 52% percent of programs;
- A full-time hospitalist spends an average of 23 weeks attending on inpatient units; and
- Time spent on average for hospitalists: 2.5% administrative, 4.9% quality, 5.3% research, 14.9% teaching, 2.6% outpatient care.
Areas in which the hospitalist program needs to play a stronger or increased role include quality improvement and patient safety, non-internal medicine services, clinical education, research, and leadership within the health system. There was no major variation among hospital administrator and chair of medicine responses. Program directors of three years or less identified quality improvement and standardizing care as areas that need more emphasis. Program directors of more than three years identified quality, research, and health system leadership as areas they’d like to gain a more significant role.
The most common impediment to the continuation and growth of hospitalist programs: attracting and retaining physicians, given the ratio of salary to workload, the level of burnout, and the lack of a defined career path. Attracting quality candidates with academic skills and/or the ability to lead and manage change was identified as a major impediment.
Challenges included:
- Cultural and political issues;
- Inadequate commitment or support for the program;
- Lack of understanding with regard to the role of the hospitalist and the true value of the program;
- Lack of organizational clarity of program goals, expectations, and measures of success; and
- Improvement of academic and scholarly aspects of the program.
Conclusions
The “Role of the Hospitalist 2006 Benchmarking Project Performance Scorecard.” reported on the need to proactively manage the program direction and growth by developing and expanding lines of business, which may include:
- Non-internal medicine services such as co-management models, pre-operative clinics, and anticoagulation clinics;
- Palliative care services;
- Quality and safety improvement efforts;
- Facilitation of admissions from the emergency department and transfers both within and outside the network; and
- Care of extended care facility patients.
Hospitalist program satisfaction in academic models may be enhanced by increasing the academic and research presence and by supporting the role of the hospitalist in quality improvement. In addition, the project identifies the need to effectively manage increasing demand for hospitalists for other service lines.
Articulating the hospitalist program’s value is the first step in obtaining the resources to proactively manage the program’s direction and growth. UHC recommends clearly defining the hospitalist program goals, expectations, and measures of success. This requires obtaining input and buy-in from all key stakeholders and developing measures for all key aspects of the program, including intangible contributions. Key stakeholders should meet regularly with hospitalists to discuss program accomplishments. Hospitalist program representatives should assume leadership roles within the hospital and medical staff. For example, hospitalists should become members of the medical staff executive committee and the hospital’s operational committee, interwoven into the fabric of the hospital. It is also important to identify and monitor measures to support program funding and support, as well as to create a business case for new program roles.
Enhancing hospitalist career development and advancement is central to the recruitment and retention of experienced hospitalists. Development of effective recruitment and retention strategies includes creating a hospitalist career path, offering protected time for non-direct patient care activities, implementing innovative strategies to manage night and weekend coverage, defining and monitoring workload indicators, building reward and recognition programs, and implementing incentive programs. Training and education curriculum should focus on the needs of hospitalists and should include modules in areas of program growth such as palliative care and surgical co-management. TH
Reasons to Research

If you’re a community-based hospitalist who hasn’t conducted research since your residency or medical school, you may want to consider undertaking a research project to broaden your career and your skill set.
Why Add Research to Your Workload?
If you’re a non-researcher, why would you want to add this new component to an already busy workload?
“I think there are a number of reasons why a hospitalist might want to get involved in doing research,” says Peter Lindenauer, MD, MSc, FACP, medical director, Clinical and Quality Informatics, Baystate Health in Springfield, Mass., and assistant professor of medicine at Tufts University School of Medicine in Boston. You may decide to undertake research because you’re curious about a specific area and want to make some new discoveries—and expand the general body of knowledge in that area. Or you may undertake a research project, says Dr. Lindenauer, because of “a desire to help your patients more specifically—to provide better care based on your own research findings.”
But some non-academic hospitalists may decide to lead a research project for more personal reasons. “I’m someone whose career has benefited from doing research,” admits Dr. Lindenauer, pointing out that a published research study brings recognition to the study author. “It can help you establish a professional niche. By doing research, you can become a highly visible member of our professional society.”
And a more basic reason, says Dr. Lindenauer, is that “research is something that can provide diversification to your work life, and it can bring professional satisfaction. It spices up one’s career.”
QI: The Perfect Fit
A full-time hospitalist who is a novice or an inexperienced researcher obviously isn’t in a position to lead a multi-center, randomized trial or conduct extensive lab work. There is another type of research, however, that seems the perfect fit for a community-based hospitalist.
“Rather than setting the bar at an unattainable level, hospitalists should consider getting involved in quality improvement research, since hospitalists are often ideally suited to participate [in] and lead the interventions themselves,” says Dr. Lindenauer. “It’s not the only kind of research, but it’s a natural, given the roles that hospitalists play. However, hospitalists can be involved in clinical trials, in analyses of secondary data, and even in doing intervention studies at their own institutions.”
And a quality improvement project, if conducted correctly, is likely to be accepted for publication and/or presentation. “While QI research is somewhat different than traditional, clinical research, there’s an increasing interest in seeing [QI] research published in established medical journals,” explains Dr. Lindenauer. “Some hospitalists have been very successful at doing this and [in] publishing the results and … giving presentations.”
Steps to Get Started
So how should you go about setting up your first QI research project?
Your first step—and possibly the most important—is selecting a research topic. “It’s important to come up with good research questions,” says Dr. Lindenauer. “One framework for choosing a topic is the acronym FINER, which stands for: [is it] feasible, interesting, novel, ethical, and relevant?”
Once you have a likely focus for quality improvement, outline how you mean to go about the project. “You have to choose a study plan and make sure the plan matches the question,” says Dr. Lindenauer.
When you have a basic idea for your project, says Dr. Lindenauer, “You have to find time in an already busy life, and you have to find support.” For one thing, very few questions can be answered by a single physician. For another, you’ll need your hospital’s buy-in.
“For QI research, it’s natural to go to your hospital’s quality improvement department,” says Dr. Lindenauer. “Ask the director of the department to sit down, and then find out what’s on the hospital’s agenda. You’ll need to find some common ground, some overlap between your interests and the hospital’s. Support is so important, and given all the external pressures for improving quality, it’s unlikely that your quality improvement department will support a project that doesn’t align with their plans or focus. So align your interests with those of the hospital and go from there.”
Ideally, you’ll also find some mentorship before or during your first project. “At a community hospital, where no faculty is available, you must identify potential mentors from outside your hospital,” says Dr. Lindenauer. “Find faculty at a university that your hospital is affiliated with or someone who was a mentor to you during your residency or medical school. And sometimes a quality improvement department can supply a mentor.”
Lastly, “find some degree of training,” advises Dr. Lindenauer. “SHM has regularly offered workshops as a first step to starting research. Other societies offer short, intensive training—or a fellowship. If you get … charged up doing research, find a fellowship.”
Build in Review by an IRB
There’s one more crucial step involved in setting up and conducting a QI research project, assuming you want to get your results published: “You should notify [your institutional review board] and have them look at your project,” says Dr. Lindenauer. “The best time to do this is during the conceptualization, once you have your research protocol.”
You should take care of this on your own because your QI department isn’t likely to think it’s necessary. “There’s often a disconnect between the perceived need for the involvement of the IRB between researchers and QI folks,” explains Dr. Lindenauer. “Usually, QI departments don’t tend to seek IRB review for their projects. But if you’re contemplating publishing your research—which is typically the ultimate goal to a research project—this always requires IRB review. This is true even though the case is often that QI projects are exempt.”
One place to begin your education on QI research is on SHM’s Web site, under “Quality & Safety,” where you can browse quality improvement tools and several quality improvement resource rooms. TH
Jane Jerrard has written for The Hospitalist since 2005.
Don't Commit to Overcommit
There is never enough time, unless you’re serving it. —Malcolm Forbes (1919-1990)
Has this ever happened to you? You agree—months in advance—to write an article for The Hospitalist, thinking you will have plenty of time to research and write it. You hurriedly enter the item on your calendar and turn back to all your current commitments. Later, as the date approaches, you realize that you’re running out of time to do justice to the article to which you had committed.
Psychologists have explored the common human problem of overbooking and have found many contributing dynamics. A 2005 study in the Journal of Experimental Psychology suggested one explanation: Most of us, when accepting invitations weeks or months in advance, tend to view the future as more open and less busy than the present. “The nature of time fools us and we ‘forget’ about how things fill our days,” comment study authors Gal Zauberman and John Lynch.1
How do hospitalists weigh competing demands on their time? For answers to this question, naturally we asked several already-busy hospitalists to discuss the issue. They shared some lessons learned and a few strategies for managing their most precious commodity.
No Mystery
“Many things take longer than they’re supposed to,” points out S. Trent Rosenbloom, MD, MPH, a former hospitalist and currently assistant professor in the departments of Biomedical Informatics, Internal Medicine and Pediatrics, and the School of Nursing at Vanderbilt University Medical Center in Nashville, Tenn.
His situation on the morning of our interview necessitated a reschedule due to a longer-than-anticipated smog check the afternoon before. “I told myself, next year, I’ll take care of this before the deadline,” he says. “But I always end up doing this at the last minute because everything else gets in the way.”
“This interview is another example: overcommitting once more,” writes Michael J. Hovan, MD, when he agrees via e-mail to a telephone interview about the problem of overscheduling. Like most hospitalists, Dr. Hovan works with a perpetually full plate. He is inpatient director for the Hospital Family Medicine Service and assistant professor at Mayo Medical School in the Division of Family and Community Medicine at the Mayo Clinic in Scottsdale/Phoenix. Like his colleagues, Dr. Hovan has had to struggle with juggling multiple roles.
“The hospital is a far different practice environment than it was just a few years ago,” he remarks. The high intensity of patient management is now coupled with increasing administrative complexities due to a more heavily regulated environment.
As a relatively new specialty, hospital medicine requires more attention in order to establish its visibility and viability. Dr. Hovan feels this pressure keenly because, as a family medicine hospitalist, he’s in a minority position. (The majority of hospitalists trained in internal medicine, according to SHM’s 2006 Annual Survey.2)
“It’s even more important for my department, in a tertiary academic center, to maintain a visible presence on particular committees,” he says. The result of all these necessary roles? “There really are no weekends or defined time off,” says Dr. Hovan. “I’d estimate that 20% of what I do is done ‘off the clock.’ I have taken the Mayo computers to Hawaii, to family ski vacations, and [to] far less exotic locales away from the hospital setting.”
“Medicine Is Stressful”
Mary A. Dallas, MD, formerly medical director of the hospitalist service and currently medical information officer for Presbyterian Healthcare Services, an integrated healthcare delivery network in Albuquerque, N.M., noticed certain trends when she was creating schedules with the hospitalist group.
“Things sound really good on paper,” she says. “The reality is, the intensity of work is high, and sometimes you forget about that when you’re creating schedules. You might have set yourself up for three overnight shifts in order to compress work hours and expand off-time, and by the end of the second shift, you are really tired.”
Another factor is that employers expect hospitalists to see patients until the end of their shifts, and that’s when the off the clock paperwork occurs. A 40-hour workweek can easily balloon into 50 hours or more.
Physicians may also neglect to build in the emotional toll of their jobs when blocking in future schedules. “Medicine is stressful,” comments Sylvia C.W. McKean, MD, FACP, medical director, Brigham and Women’s Hospital/Faulkner Hospitalist Service in Boston. “It’s stressful to see people suffer and to deal with families who are stressed and sometimes not perfectly functional.”
In addition, she says, “Excellence in teaching and excellence in patient care require communication, and communication takes time. If physicians are up all night taking calls and then working all day so that there is continuity in patient care, you have to grapple with the issue of physician fatigue.”
And Then There Are Committees
Even though committee participation is technically considered “volunteer” time, physicians who are elected chiefs of their hospital sections are automatically expected to participate. It behooves hospitalists to participate in committee work at their institutions, believes Dr. Dallas, because this is often where governance decisions are made about how they will practice in the hospital.
Tom Baudendistel, MD, is associate residency program director at California Pacific Medical Center, a community-based hospital in San Francisco operated by Sutter Health. The hospitalists in his group are very involved in committee work. “The committees are important, and we want the administration to match our faces to our names, especially when it comes to budget negotiation time,” he explains. “That is a direct benefit of being visible participants in committees.”
Committee participation may be handled differently in purely academic settings. The time Dr. Rosenbloom spends in committees related to department support is credited to his work schedule. The problem comes when, once again, that participation takes more time than expected. One of his weekly committees routinely runs a half hour longer than its one-and-a-half hour time slot and requires five to eight hours of preparatory work. As is common with his peers, Dr. Rosenbloom has sometimes used his allotted consulting time to cover extra commitments related to his primary job.
Temptations to Say Yes
Invitations to participate in extra administrative or educational duties often naturally flow to productive people, observes Dr. Dallas. “You may be dragged into a lot of different work that you didn’t necessarily need to be into,” she says. “You just have to step back periodically and ask, ‘Is this right for me? Am I the right person to be involved? Are there other people who can do this? And then, say no. Really, that’s OK!” (See “Triage What’s Important,” p. 15, for tips.]
“It’s easy to get overloaded,” admits Dr. Baudendistel. “I certainly found myself overextended more often earlier in my career.” Saying yes to additional commitments can be related to workplace power dynamics, he believes. “When people who are in positions above you approach you about a project that is going to take time—whether or not it’s your passion or skill set—there is pressure to want to please that person. Saying no is a skill, and if you say ‘absolutely not’ early on in your career, you will not be asked to do other things. You may be shooting yourself in the foot.”
Defining Trails
It’s natural enough for hospitalists to feel optimistic about the openness of the future, says Dr. Hovan. Hospitalists may feel that the time investments they make now to nurture their profession within their institutions are temporary and may not always be as intense. The hope is that “the specialty is going to be more mature and [will] become more self-sustaining in the near future. Yet you glimpse over the horizon, and that’s not really true,” he says ruefully. “Everything in hospital medicine has nascency about it. There are no established trails. When we define one role, another one emerges.”
Many hospitalist services, for example, are now expanding beyond the medical floor to the surgical floor to perform consults to provide post-surgical management of medical issues.
Dr. McKean sees the “overwhelming demand for service” as one of hospital medicine’s trickiest challenges. “Basically, because hospitalists are young and energetic and wanting to please, it’s very easy for them to feel like they have to meet all the service obligations.” But this propensity can derail the overall mission of and vision for the hospitalist service if physicians do not set clear goals for themselves and their groups.
Physician, Know Thyself
Building in time to set and re-examine career goals is a skill that hospitalists should practice regularly, says Dr. McKean: “I learned the hard way that a hospitalist’s most important strategy is to be very self-reflective.”
She confesses that, in the past, she has often said yes to the point that her obligations became unmanageable. She advises young hospitalists to reflect on what is important to them and also “to recognize that during different times in their lives, they’re going to either have less free time or more free time, depending upon their families and other demands. So what might seem like a great opportunity might be an unrealistic one when you have three children under the age of five.” On the other hand, someone who is single might set a goal to make as much money as possible in the short term by taking on additional work shifts.
Dr. McKean also suggests that young hospitalists seek out not just one but multiple mentors. For example, “someone who wants to be a superstar in hospital medicine relating to quality improvement might naturally pick as a mentor somebody who is already doing quality improvement.”
A person who is having difficulty juggling family roles in addition to intensive work schedules might want to seek out someone who has … grappled successfully with those issues. Hospitalists should also consider seeking mentors outside the discipline of medicine—those in business, for instance, can contribute valuable insights to someone seeking a career in hospital administration.
Given the nature of hospital medicine, guarding one’s time will always be a concern, agree most of those interviewed for this article. “I think the juggling act is always there,” says Dr. Baudendistel. “There are usually up to six or more balls that you can simultaneously be juggling: administrative duties, family obligations, society commitments, teaching duties, your own academic agenda, and your professional agenda. You just have to know which ones are your priorities. And, sometimes, you have to acknowledge that maybe it’s time to say no or to stop doing one of those things.” TH
Contributing Writer Gretchen Henkel thanks the hospitalists who reshuffled their commitments in order to discuss overbooking with her and thanks her editor, Lisa Dionne, for the two extensions that allowed her to complete this assignment.
References
- Zauberman G, Lynch JG Jr. Resource slack and propensity to discount delayed investments of time versus money. J Exp Psychol Gen. 2005 Feb;134(1):23-37.
- Society of Hospital Medicine 2005-2006 Survey: State of the Hospital Medicine Movement. 2006. Available at: www.hospitalmedicine.org. Last accessed February 19, 2007.