User login
Radiologic Images for Hospitalists
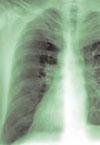
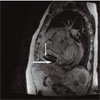
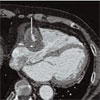
Patient History: A 68-year-old patient with systemic lupus erythematosus (SLE) has been referred for the evaluation of an asymptomatic right atrial mass found on an outside cardiac echocardiogram.
Salient findings: SSFGRE cardiac gated magnetic resonance and computed tomography of the heart with contrast demonstrate a large (3 cm x 4.5 cm) fusiform aneurysm of the right coronary artery (RCA). This should account for the atrial mass seen on the outside echocardiogram. Although there is marked circumferential mural thrombus (see horizontal arrows in Figs. 1 and 2, above), the vessel lumen is widely patent (see vertical arrows in Figs. 1 and 2, above), as evidenced by free flow of contrast within the center of the RCA.
Patient population and natural history of disease: Coronary artery aneurysms are defined as dilatation of the artery to greater than 1.5% to 2.0% of the normal artery diameter; however, they can be much larger. Coronary artery aneurysms are rare, occurring in 1.4 to 2.0% of the general population and in up to 5.3% of those undergoing cardiac catheterization. In North America, the most common etiology of coronary artery aneurysms is atherosclerosis. In Japan, the most common cause is likely Kawasaki disease. Other etiologies include congenital connective tissue diseases such as Marfan syndrome and Ehlers-Danlos syndrome, dissection, infections such as syphilis, vasculitis, and post-coronary intervention. The RCA is most commonly involved, followed by the left anterior descending artery (LAD). Consequences include thrombus formation and rupture with subsequent infarction, ischemia, and/or tamponade. SLE may be the culprit in this patient’s RCA aneurysm.
Management: Coronary artery aneurysms are often diagnosed incidentally, and rupture is rare. If symptoms of ischemia or impending rupture occur, bypass can be performed in selected patients. Some physicians advocate surgery in all patients with aneurysms that are greater than three to four times the normal native vessel diameter. Studies are limited, however, and treatment is often based on anecdotal evidence. Without symptoms and with a widely patent vessel lumen, as in this patient, many would advocate medical management with an antiplatelet +/- anticoagulant regimen. Some studies have shown an association of abdominal aortic aneurysm (AAA) in patients with coronary artery aneurysms and, therefore, advocate screening for AAA in these patients.
Take-home points:
- Coronary artery aneurysms are typically found incidentally, and rupture is rare;
- Surgery is indicated for symptoms of cardiac ischemia or in cases where there is concern for impending rupture; and
- Coronary artery aneurysms are associated with atherosclerosis, Kawasaki disease, connective tissue diseases, and post-coronary interventions. TH
Helena Summers is a radiology resident and Erik Summers is a hospitalist at the Mayo Clinic College of Medicine in Rochester, Minn.
References
- Collins MJ, Borges AJ, Singh G, et al. A giant coronary artery aneurysm in the right coronary artery. Cardiovasc Pathol. 2006 May-Jun;15(3):150-152.
- Mariscalco G, Mantovani V, Ferrarese S, et al. Coronary artery aneurysm: management and association with abdominal aortic aneurysm. Cardiovasc Pathol. 2006 Mar-Apr;15(2):100-104.
Federal Flu Fighters

Experts say that a pandemic flu outbreak will hit the United States—a pandemic large enough to stretch our healthcare resources to the breaking point and overwhelm hospitals.
“They say it’s not if, but when,” says James C. Pile, MD, FACP, Division of Hospital Medicine, Case Western Reserve University, MetroHealth Medical Center, Cleveland, Ohio, an infectious diseases specialist with a longstanding interest in bioterrorism/pandemic preparedness, and former editor of The Hospitalist.
Your Government at Work
The federal government is taking a lead role in preparing for this outbreak or outbreaks. President George W. Bush issued a National Strategy for Pandemic Influenza in November 2005, which focuses on measures to slow or stop the spread of a pandemic flu and on “sustaining infrastructure and mitigating impact to the economy and the functioning of society.”
That strategy charges the Department of Health and Human Services (HHS) with leading federal pandemic preparedness. The HHS is working with state and local agencies on planning and has made $600 million available for state and local preparedness efforts, including the exercising of pandemic plans across communities and at all levels of government.
Total congressional funding for pandemic flu preparedness, says Dr. Pile, is “somewhere in the neighborhood of $5 billion dollars.”
A Working Plan
In May 2006, President Bush released the Implementation Plan for the National Strategy, which stipulates more than 300 actions for federal departments and agencies and sets clear expectations for state and local governments. It also provides guidance for all federal departments and agencies on the development of their own plans.
The latest update on the Implementation Plan (released in December 2006) lists dozens of action items, including:
- The Department of Homeland Security will provide emergency response element training (e.g., incident management, triage, security, and communications) and provide assistance, when requested, to state, local, and public health entities within six months.
- HHS will work with state and local governments to develop protocols for the distribution of critical medical materials such as ventilators in times of medical emergency, also within six months.
- HHS will prepare guidance for local Medical Reserve Corps coordinators describing the role of the Corps during a pandemic. The Medical Reserve Corps comprises teams of local volunteer medical and public health professionals who can contribute their skills and expertise during times of need.
For the latest details on the Implementation Plan and the status of these and other action items, visit www.pandemicflu.gov.
Federal, State, and Local–A Crucial Mix
In addition to providing overall planning and support, says Dr. Pile, “the federal government will also be responsible for helping to supply assets to states and regions that may be overwhelmed” during a pandemic flu outbreak.
Specifically, the government oversees the Strategic National Stockpile (SNS) program, which manages large quantities of medicine and medical supplies. These materials are stockpiled, ready to use in the event of a public health emergency. When federal and local authorities agree that the SNS is needed, supplies will be delivered to any state within 12 hours. Each state has plans to distribute so-called push packs of medicine and medical supplies to affected communities as quickly as possible.
“I’m not sure the federal government will be able to reliably deliver these push packs in a timely manner in the event of a severe, multi-state pandemic,” says Dr. Pile. “During Hurricane Katrina, which certainly posed challenges different from a pandemic flu outbreak but also included a number of similarities, we saw the struggle of the national government to react quickly.” He believes that the stockpiles may not be adequate in a worst-case scenario, such as a pandemic flu on the scale of the 1918 flu epidemic.
“It’s clear there just aren’t enough mechanical ventilators in the country to provide adequate surge capacity in the event of a severe pandemic, with best estimates of 80,000 to 105,000 ventilators nationally, most of which are in use at any given time,” he says.
Another issue is how much help the federal government can actually provide in the event of a pandemic flu. “Some government agencies and individuals have stressed that if there is a really catastrophic national influenza pandemic, the cavalry is not necessarily going to be coming,” says Dr. Pile. “Individual hospitals and regions will very possibly need to rely on their intrinsic resources, at least initially.”
So when a pandemic flu outbreak begins, where can hospitals find support? “HHS will take the lead role at the federal level,” says Dr. Pile. “State departments of health will oversee the response for each state. And at the city and municipal level, it will vary.”
The Role of Hospitalists
At this point, while all levels of government are still shaping plans for handling pandemic flu, what should hospitalists do?
“Hopefully, they’re involved in planning within their own institutions and regionally,” says Dr. Pile. “If not, that’s a great role for them. However, a lot of the people involved in [pandemic flu response] planning are not familiar with hospitalists.”
Woodruff J. English II, MD, hospitalist and co-director of Hospitalist Program, Providence St. Vincent Medical Center, Portland, Ore., is in charge of emergency preparedness, including pandemic flu, for his institution. He worked with his state department of health and the CDC. After conducting a tabletop exercise, Providence St. Vincent Medical Center has a plan in place that includes a number of tents that can set up as triage space for admitting and screening patients, plans to secure the hospital against riots and looters, staffing issues, and much more. “We’re figuring out what questions to ask; I wouldn’t say we’re prepared,” says Dr. English. “We’re taking a careful look at how we do business.”
When a pandemic flu outbreak does occur, hospitalists throughout affected areas will definitely be involved.
“They’d play a front and center role,” speculates Dr. Pile. “Critical care would be rolled out of the critical care unit into other areas of the hospital. Clearly, there wouldn’t be enough critical care physicians, so hospitalists would have to step in.”
At this stage of the government’s Implementation Plan, your hospital medicine program may be called upon to help create your hospital’s preparedness plan for pandemic flu. If you haven’t been asked, check with your director or administrator to see if such a plan exists, perhaps as part of a general emergency preparedness plan.
With the support of the federal and state government, your hospital should be able to take some steps toward preparing for a major outbreak of pandemic flu. TH
Jane Jerrard writes “Public Policy” for The Hospitalist.
An Information Services Update

As I sit here brainstorming the latest and greatest news from SHM and the folks at Information Services, it surprised me to realize that I have been with SHM for exactly two years.
When I look back at some of our accomplishments—launching a brand new SHM Web site, creating six new Web-based resource rooms around specific disease states, launching an online career center for hospitalists, and opening a hospitalist legislative advocacy center—I can’t help but think about the talented people who have brought us this far and how they will make your experience with SHM even more valuable and exciting in the years to come.
Our interactive designer, Bruce Hansen, came to SHM with a variety of skills and life experiences, including time spent working with the Peace Corps in the Ukraine. Bruce is our ace Web guru at SHM, and not only is he responsible for SHM’s Web site, but he also leads the development of the resource rooms that many of our members have come to use as a resource in their daily professional lives. Through Bruce’s leadership and intense dedication to making our Web site as easy for each of you to use as possible, you will begin to see dramatic improvements in the format of SHM’s Web site homepage. Coming in the summer of 2007, we will also be launching improvements on how to navigate and move through the Web site, making it much easier to get to the information you need.
In the Web-sphere, cool graphics and easy-to-use links are important, but content is king, and that has been the primary focus of our project assistant, Lubna Manna. Lubna came to SHM with a background in creating programs for PDAs and phones, which she will be drawing from as SHM begins to introduce resources for iPods and other handheld devices. In addition to helping many of our members with questions about our Web site, Lubna has been working with the staff at SHM to find new and dynamic ways to present the information you need, when you need it, through our Web site. Understanding how many of you currently use our Web site has given us a glimpse into what matters most, and Lubna is finding ways to change how and where we deliver information via the Web to make sure it is easy for you to find the information you need.
Our most recent addition to the Information Services team, Travis Kamps, our Web production assistant, is a wizard of sorts when it comes to anything new or cool on the Web or in other technologies. Over the next couple of months, Travis will work hand in hand with Bruce to create resource rooms that are easier to use and provide you with ways to access these quality improvement resources, whether you are just starting out in QI or are an old pro. With Travis’ help and guidance, we will also begin to see how the Internet and SHM can foster an online community in which hospitalists can network, share ideas and questions, and create a collaborative environment from which all of our members can benefit.
Of course, in any organization, there are many things that go on behind the scenes that others don’t see or know about. Have you ever wondered where all the maintenance and support staff at Disneyworld work? Believe it or not, they are just below your feet as you stroll down Main Street. In Information Services, a lot of what we do is just below your feet or behind the scenes, but we are here, and we are dedicated to finding new, creative, and innovative ways to ensure that you get the biggest bang for your buck from your SHM membership.
In the coming months, you will see improvements to your membership experience through the Web site, at the 2007 Annual Meeting, and in the products and services that are all part of your SHM membership. We are always trying to find new ways to provide you with the resources you need to make a difference in your hospital and in the healthcare that you provide. With your help and support, I am confident that the next two years will be exciting and valuable to you. TH
Focus on Research

As hospital medicine progresses, it is important that our new specialty be seen as a true academic discipline—not just as a service specialty. Starting our own journal, the Journal of Hospital Medicine, in 2006 was an important step. While there are a growing number of hospitalist researchers around the country, it is important that SHM promote and support further development of researchers in hospital medicine.
This year, SHM’s research efforts will include the development of a wide research network, support for individual and organizational research initiatives, and a focus on strengthening the internal research organization. These efforts will necessarily be broad and will cut across and incorporate the efforts that are already underway in the areas of education and quality.
Goals for SHM Research Efforts
- Increase extramural research funding to SHM and its members;
- Contribute to the growing number of SHM members choosing the society for the career development and research opportunities it offers; and
- Improve visibility and credibility for SHM nationally (e.g., hospitalists in prominent academic leadership positions and on national panels).
The development of a wide research network will include the identification of researchers in the SHM membership with common research interests. A preliminary list has been generated from an e-mail sent to all SHM members in November 2006 promoting two NIH opportunities to study venous thromboembolism (VTE) and asking for a response from members interested in receiving similar information. A monthly grant opportunity bulletin is planned for release to this audience. As this Research Forum develops, a type of research dating service could match research interests and experience with those interested in funding such projects.
An important networking activity is finding ways to link academic and community sites. One possible mechanism to enable such collaboration is an Internet-based tool for abstracting information from a medical chart. The resulting data could be shared and used to validate quality measures, tailor therapies, or assess the prevalence of disease. Also, an inter-society Academic Summit is planned to investigate areas in which collaboration with other professional societies would be appropriate. Be sure to voice your opinions during the Special Interest Forum on Research at the 2007 Annual Meeting on May 24, 2007, in Dallas.
Support for individual and organizational research initiatives will take the form of identifying opportunities and showcasing more opportunities for research at national conferences and local meetings. By working closely to identify commonalities with the Hospital Quality and Patient Safety (HQPS) Committee around research, implementation, and education, this support is designed to be seamless and coordinated. Currently under consideration is the development of research pages on the SHM Web site to highlight ongoing research efforts, possibly including a searchable, online catalog or a database of research opportunities. As time allows, assistance with individual grant applications will be offered.
By focusing on strengthening the internal SHM research organization, an increasingly visible research committee will present a consistent message of support for research and will hopefully empower individual hospital researchers to access the resources of SHM in all possible ways, from using the resource rooms on the SHM Web site to reading the Journal of Hospital Medicine to attending chapter meetings. Strengthening the internal research infrastructure will extend the sphere of influence and raise the profile of SHM as hospitalists appear on national panels, co-authoring key papers, and participating in other research communities. Increased visibility will lead to more support for training, fellowships, and pilot grant programs for promising potential projects in high-priority areas such as health services, quality improvement, clinical epidemiologic studies (clinical trial, genomics, biomarkers), and educational and health technology research.
In 2007, expect to see a new emphasis on research at SHM. We’ll be busy developing funding streams to increase investment in promising researchers, particularly those whose projects may lead to grants and/or collaboration with other SHM researchers. Look for surveys designed to assess the unique academic and research needs of hospitalists and to find new opportunities to get involved in research at SHM conferences and the annual meeting. These efforts will be successful if they lead to an increase in the quality and the quantity of the dialogue around research in hospital medicine. Please contact Carolyn Brennan, director of Research Program Development, at [email protected] for more information or to get involved.
February Leadership Academy
SHM hosted another sold-out Level I Leadership Academy in sunny Orlando at the Gaylord Palms Resort and Convention Center. The meeting attracted more than 130 hospital medicine leaders who gathered to learn—among many things—how to evaluate personal leadership strengths and weaknesses and how to apply this knowledge to everyday leadership and management challenges.
Nationally respected speakers Mike Guthrie, MD; David Javitch, PhD; Jack Silversin, DMD; Tim Keogh, PhD; Eric Howell, MD; Larry Wellikson, MD; and Russell Holman, MD, led the group in discussions on a variety of different leadership topics. Dr. Keogh kept attendees intrigued by tackling the wide range of personality traits in the industry and instructing attendees in how to work effectively with others by using his DiSC survey. As always, the group was enthusiastic and worked collaboratively during Dr. Silversin’s infamous broken squares activity, in which attendees are involved in an eye-opening experience on effective communication.
“This is our fifth time hosting this course and, every time, I’m amazed to see how enthusiastic attendees are about what they have learned and how they plan to go back and improve their organizations,” says Dr. Holman, SHM Leadership Academy Course Director and president-elect of SHM.
Leadership Academy Level I is a great networking opportunity designed to provide leaders in hospital medicine with the tangible skills and resources required to successfully lead and manage hospitalist programs now and in the future. The intimate setting allows for small group sessions in which attendees have a chance to interact with faculty and share real-life situations from their own institutions. In addition to Level I, SHM will host the advanced course, Leadership Academy Level II, in the fall. This course will allow attendees to expand and enhance the skills learned in Level I and features keynote speaker Leonard Marcus, PhD, who defined the term “Meta-Leadership” in hospital medicine.
Don’t miss out on your chance to become a leader in hospital medicine. Mark your calendar for our next Leadership Academy, November 12-15, 2007, in San Antonio.
A Fond Farewell
Whatever with the past has gone, the best is always yet to come.
—Lucy Larcom, 19th century poet and writer
It is hard to believe, but this is my last column to write as president of SHM. It has been another remarkable year for hospital medicine. The field continues to grow, and that presents our growing organization with many challenges. Once again, we are rising to the challenge, and it has been a big year at SHM. Most of what we have done has had very little to do with me, but is the result of tremendous work by our many members and our staff.
Just a few highlights of the last 12 months:
- The number of hospitalists surpassed 20,000;
- The number of Hospital Medicine Groups (HMGs) grew to more than 2,000;
- Registration for the SHM Annual Meeting exceeded 1,000 for the first time;
- Almost 200 abstracts were submitted to the SHM Poster Competition;
- The Journal of Hospital Medicine (JHM) published its first issue in 2006 and within a year took its place with established journals by being listed by the National Library of Medicine in PubMed; and
- In a landmark decision, the ABIM Board approved Focused Recognition of Hospital Medicine as part of Internal Medicine Maintenance of Certification.
The board spent two days with our key committee chairmen and staff to examine our current projects and direction. This will lay the groundwork for continuing the dialogue about how we can best serve our members and be prepared to meet the needs of the sea change in healthcare.
- Don Berwick invited SHM leadership to represent the only medical professional society on stage at the Institute for Healthcare Improvement (IHI) Annual Convention as IHI announced its latest national quality improvement campaign;
- SHM embarked on a unique effort to use one-on-one hospitalist leader mentoring to push the implementation of quality improvement to the front lines;
- The SHM board approved funds for a study that will examine the feasibility of a foundation to support research and education in hospital medicine;
- SHM became a player in advocacy when almost 100 hospitalists met with their legislators in Washington, D.C.;
- More than 400 SHM members used the Legislative Action Center to write to their legislators as SHM lobbied Congress to improve Medicare reimbursement; and
- SHM grew into a solid organization with more than $5 million in revenues.
We continue to receive grant funding to support our efforts in quality improvement and to export our resources to the front lines of healthcare. A growing number of organizations recognize our expanding role in caring for the country’s patients. We have a reputation for moving relentlessly forward. This makes us different than many other organizations. It is a characteristic that we need to hold onto as the organization grows and ages.
My best wishes to the next slate of officers and to all of our members. Thank you for the opportunity; it’s been a privilege. There are more great things to come! TH
Dr. Gorman is the outgoing president of SHM.