User login
How to manage hypothyroid disease in pregnancy
The authors report no financial relationships relevant to this article.
A pregnant woman whose thyroid gland isn’t doing its job presents a serious management problem for her obstetrician. If she has overt hypothyroidism, seen in between 0.3% and 2.5% of pregnancies, active intervention is required to prevent serious damage to the fetus.1,2 Even if she has subclinical disease, seen in 2% to 3% of pregnancies, current research indicates that intervention may be indicated.
Fetal thyroxine requirements increase as early as 5 weeks of gestation, when the fetus is still dependent on maternal thyroxine. A deficiency of maternal thyroxine can have severe adverse outcomes, affecting the course of the pregnancy and the neurologic development of the fetus. To prevent such sequelae, patients who were on thyroid medication before pregnancy should increase the dosage by 30% once pregnancy is confirmed, and hypothyroidism that develops in pregnancy should be managed aggressively and meticulously.
Here, we’ll examine the published research to advise you on evidence-based approaches for diagnosis and management of this complex condition.
Maternal thyroid function
An elaborate negative-feedback loop prevails before pregnancy
In a nonpregnant woman, thyroid function is controlled by a negative-feedback loop that works like this:
- The hypothalamus releases thyroid-releasing hormone (TRH)
- TRH acts on the pituitary gland to release thyroid-stimulating hormone (TSH)
- TSH, in turn, acts on the thyroid gland to release the thyroid hormones iodothyronine (T3) and thyroxine (T4) that regulate metabolism
- TRH and TSH concentrations are inversely related to T3 and T4 concentrations. That is, the more TRH and TSH circulating in the blood stream, the less T3 and T4 will be produced by the thyroid gland3
- Almost all (approximately 99%) circulating T3 and T4 is bound to a protein called thyroxine-binding globulin (TBG). Only 1% of these hormones circulate in the free form, and only the free forms are biologically active.3
This relationship is illustrated in FIGURE 1.
FIGURE 1 Thyroid physiology and the impact of pregnancy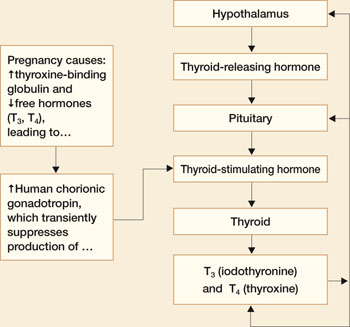
Pregnancy reduces free forms of T3 and T4, and increases TSH slightly
Pregnancy alters thyroid function in significant ways:
- Increases in circulating estrogen lead to the production of more TBG
- When TBG increases, more T3 and T4 are bound and fewer free forms of these hormones are available
- Because the total T3 (TT3) and total free T4 (TT4) are decreased in pregnancy, they are not good measures of thyroid function. Maternal thyroid function in pregnancy should be monitored using free T4 (FT4) and TSH levels
- Increased TBG also leads to a slight increase in TSH between the first trimester and term
- Human chorionic gonadotropin (hCG) concentrations also increase in pregnancy. Because hCG has thyrotropin-like activity, these higher levels cause a transient decrease in TSH by suppression of TSH production between approximately 8 and 14 weeks of gestation.
Fetal thyroid function
During early gestation, the fetus receives thyroid hormone from the mother.1 Maternal T4 crosses the placenta actively—the only hormone that does so.4 The fetus’s need for thyroxine starts to increase as early as 5 weeks of gestation.5
Fetal thyroid development does not begin until 10 to 12 weeks of gestation, and then continues until term. The fetus relies on maternal T4 exclusively before 12 weeks and partially thereafter for normal fetal neurologic development. It follows that maternal hypothyroidism could be detrimental to fetal development if not detected and corrected very early in gestation.
How (and whom) to screen for maternal hypothyroidism
Routine screening has been recommended for women who have infertility, menstrual disorders, or type 1 diabetes mellitus, and for pregnant women who have signs and symptoms of deficient thyroid function.6 In recent years, some authors have recommended screening all pregnant women for thyroid dysfunction, but such recommendations remain controversial.3,7,8 Routine screening is not endorsed by the American College of Obstetricians and Gynecologists.6
Symptoms overlap typical conditions of pregnancy
The difficulty here is that the characteristic signs and symptoms of hypothyroidism are very similar to physiologic conditions seen in most pregnancies. They include fatigue, constipation, cold intolerance, muscle cramps, hair loss, dry skin, brittle nails, weight gain, intellectual slowness, bradycardia, depression, insomnia, periorbital edema, myxedema, and myxedema coma.6 A side-by-side comparison of pregnancy conditions and hypothyroidism symptoms is provided in TABLE 1.
TABLE 1
Distinguishing hypothyroidism from a normal gestation can be challenging
| SYMPTOM | HYPOTHYROIDISM | PREGNANCY |
|---|---|---|
| Fatigue | • | • |
| Constipation | • | • |
| Hair loss | • | |
| Dry skin | • | |
| Brittle nails | • | |
| Weight gain | • | • |
| Fluid retention | • | • |
| Bradycardia | • | • |
| Goiter | • | |
| Carpal tunnel syndrome | • | • |
Which laboratory tests are informative?
Because screening is controversial and symptomatology does not reliably distinguish hypothyroidism from normal pregnancy, laboratory tests are the standard for diagnosis. Overt hypothyroidism is diagnosed in a symptomatic patient by elevated TSH level and low levels of FT4 and free T3 (FT3). Subclinical hypothyroidism is defined as elevated TSH with normal FT4 and FT3 in an asymptomatic patient. Level changes characteristic of normal pregnancy, overt hypothyroidism, and subclinical hypothyroidism are given in TABLE 2.6
TABLE 2
Laboratory diagnosis of hypothyroidism
| MATERNAL CONDITION | TSH | FREE T3 | FREE T4 | TOTAL T3 | TOTAL T4 |
|---|---|---|---|---|---|
| Normal pregnancy | No change | No change | ↑ | ↑ | ↑ |
| Hypothyroidism | ↑ | ↓ | ↓ | ↓ | ↓ |
| Subclinical hypothyroidism | ↑ | No change | No change | ↓ | ↓ |
| Adapted from American College of Obstetricians and Gynecologists6 | |||||
What causes hypothyroidism?
The most common cause of hypothyroidism in most of the world is iodine deficiency. In developed countries, however, where lack of iodine in the diet is not a problem, Hashimoto’s thyroiditis, also known as chronic autoimmune thyroiditis, is the most common cause. Hashimoto’s thyroiditis is characterized by the presence of antithyroid antibodies, including both thyroid antimicrosomial and antithyroglobulin antibodies. Both iodine deficiency and Hashimoto’s thyroiditis are associated with goiter.5 Other causes of hypothyroidism include radioactive iodine therapy for Graves’ disease, a condition we will discuss in Part 2 of this series in February; thyroidectomy; viral thyroiditis; pituitary tumors; Sheehan’s syndrome; and a number of medications.
Causes of hypothyroidism are summarized in TABLE 3.3
TABLE 3
Causes of hypothyroidism
| Iodine deficiency |
| Hashimoto’s thyroiditis |
| Radioactive iodine therapy |
| Thyroidectomy |
| Viral thyroiditis |
| Sheehan’s syndrome |
Medications
|
Effects vary by medication
Medications alter thyroid function in different ways. Iodine and lithium inhibit thyroid function and, along with dopamine antagonists, increase TSH levels. Conversely, thioamides, glucocorticoids, dopamine agonists, and somatostatins decrease TSH levels. Finally, ferrous sulfate, sucrafate, cholestyramine, and aluminum hydroxide antacids all inhibit gastrointestinal absorption of thyroid hormone and therefore should not be taken within 4 hours of thyroid medication.6
Maternal hypothyroidism: Effects on fetus, newborn
The impact of maternal hypothyroidism on the fetus depends on the severity of the condition.
- Uncontrolled hypothyroidism. The consequences of this condition can be dire. The possibilities include intrauterine fetal demise and stillbirth, preterm delivery, low birth weight, preeclampsia, and developmental anomalies including reduced intelligence quotient (IQ).1,2,4,6 Blazer and colleagues correlated intrauterine growth with maternal TSH and fetal FT4 and concluded that impaired intrauterine growth is related to abnormal thyroid function and might reflect an insufficient level of hormone production by hypothyroid mothers during pregnancy.9 Maternal and congenital hypothyroidism resulting from severe iodine deficiency are associated with profound neurologic impairment and mental retardation.1,3,10 If the condition is left untreated, cretinism can occur. Congenital cretinism is associated with growth failure, mental retardation, and other neuropsychologic deficits including deaf-mutism.3,4 However, if cretinism is identified and treated in the first 3 months of life, near-normal growth and intelligence can be expected.6 For this reason, all 50 states and the District of Columbia require newborn screening for congenital hypothyroidism.6
- Asymptomatic overt hypothyroidism. Several studies have evaluated neonatal outcomes in pregnancy complicated by asymptomatic overt hypothyroidism—that is, women who had previously been diagnosed with hypothyroidism, who have abnormal TSH and FT4 levels, but who do not have symptoms. Pop and colleagues have shown impaired psychomotor development at 10 months in infants born to mothers who had low T4 during the first 12 weeks of gestation.7 Haddow and colleagues correlated elevated maternal TSH levels at less than 17 weeks’ gestation with low IQ scores in the offspring at 7 to 9 years of age.8 Klein and colleagues demonstrated an inverse correlation between a woman’s TSH level during pregnancy and the IQ of her offspring.11 Kooistra and colleagues confirmed that maternal hypothyroxinemia is a risk for neurodevelopmental abnormalities that can be identified as early as 3 weeks of age.12 Studies of this relationship are summarized in TABLE 4.
- Subclinical hypothyroidism. During the past decade, researchers have focused attention on neonatal neurologic function in infants born to mothers who had subclinical disease. Mitchell and Klein evaluated the prevalence of subclinical hypothyroidism at less than 17 weeks’ gestation and subsequently compared the IQs in these children with those of controls.4 They found the mean and standard-deviation IQs of the children in the control and treated groups to be significantly higher than those of the children whose mothers were not treated. Casey and colleagues evaluated pregnancy outcomes in women who had undiagnosed subclinical hypothyroidism.10 They found that such pregnancies were more likely to be complicated by placental abruption and preterm birth, and speculated that the reduced IQ demonstrated in the Mitchell and Klein study might have been related to the effects of prematurity.
TABLE 4
Fetal and neonatal effects of asymptomatic overt hypothyroidism
| STUDY | LABORATORY FINDINGS | OUTCOMES AND RECOMMENDATIONS |
|---|---|---|
| Kooistra et al12 | ↓ FT4 | Maternal hypothyroxinemia is a risk for neurodevelopmental abnormalities as early as 3 weeks of age |
| Casey et al10 | ↑ TSH | Pregnancies with undiagnosed subclinical hypothyroidism were more likely to be complicated by placental abruption and preterm birth. The reduced IQ seen in a prior study (Mitchell and Klein4) may be related to effects of prematurity |
| Mitchell and Klein4 | ↑ TSH | The mean and standard deviation of IQs of the children of treated mothers with hypothyroidism and the control group were significantly higher than those for children of untreated hypothyroid women |
| Blazer et al9 | ↑ maternal TSH, ↑ fetal FT4 | Impaired intrauterine growth may reflect insufficient levels of hormone replacement therapy in hypothyroid mothers during pregnancy |
| Pop et al7 | ↓ FT4 | Impaired psychomotor development at 10 months of age in offspring of mothers with low T4 at ≤12 weeks |
| Haddow et al8 | ↑ TSH, ↓ FT4 | Elevated TSH levels at <17 weeks’ gestation are associated with low IQ scores at 7 to 9 years of age. Routine screening for thyroid deficiency may be warranted |
| Klein et al11 | ↑ TSH, ↓ FT4, ↓ TT4 | Inverse correlation between TSH during pregnancy and IQ of offspring |
| FT4=free thyroxine, TSH=thyroid-stimulating hormone, TT4=total thyroxine | ||
Managing hypothyroidism in pregnancy
The treatment of choice for correction of hypothyroidism is synthetic T4, or levothyroxine (Levothyroid, Levoxyl, Synthroid, and Unithroid). Initial treatment in the nonpregnant patient is 1.7 μg/kg/day or 12.5 to 25 μg/day adjusted by 25 μg/day every 2 to 4 weeks until a euthyroid state is achieved.13
Patients who were on thyroxine therapy before pregnancy should increase the dose by 30% once pregnancy is confirmed.1,5 Serum thyrotropin levels should be monitored every 4 weeks to maintain a TSH level between 1 and 2 mU/L and FT4 in upper third of normal.1 Once a euthyroid state has been achieved, thyrotropin levels should be monitored every trimester until delivery. FIGURE 2 provides an algorithm for management of hypothyroidism in pregnancy.
FIGURE 2 During pregnancy, thyroid function merits regular monitoring, fine-tuning of treatment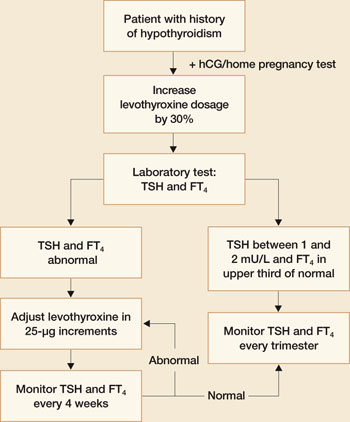
Postpartum thyroiditis
About 5% of all obstetrical patients develop postpartum thyroiditis. Approximately 45% of these women present with hypothyroidism, with the rest evenly divided between thyrotoxicosis (hyperthyroidism) and thyrotoxicosis followed by hypothyroidism. Unfortunately, the signs and symptoms of hypo- and hyperthyroidism are similar to the postpartum state. Many of these patients are not diagnosed. A high index of suspicion warrants thyroid function testing. Women who have a history of type 1 diabetes mellitus have a 25% chance of developing postpartum thyroid dysfunction.
The diagnosis is made by documenting abnormal levels of TSH and FT4. Postpartum hyperthyroidism may be diagnosed by the presence of antimicrosomal or thyroperoxidase antithyroid peroxidase antibodies. Goiter may be present in up to 50% of patients.
Postpartum thyroiditis has two phases
The first phase, also known as the thyrotoxic phase, occurs 1 to 4 months after delivery when transient thyrotoxicosis develops from excessive release of thyroid hormones. The most common symptoms with early postpartum thyroiditis are fatigue and palpitations. Approximately 67% of these women will return to a euthyroid state, and thioamide therapy is generally considered ineffective. Hypothyroidism can develop within 1 month of the onset of thyroiditis.
The second phase occurs between 4 and 8 months postpartum, and these women present with hypothyroidism. Thyromegaly and associated symptoms are common. Unlike the first (thyrotoxic) phase, medical treatment is recommended. Thyroxine treatment should be initiated and maintained for 6 to 12 months. Postpartum thyroiditis carries a 30% risk of recurrence.14
Postpartum thyroiditis may be associated with depression or aggravate symptoms of depression, although the data on this association are conflicting. The largest study addressing this issue concluded that there was no difference in the clinical and psychiatric signs and symptoms between postpartum thyroiditis and controls.15 Nevertheless, it would seem prudent to evaluate thyroid function in postpartum depression if other signs of thyroid dysfunction are present.
1. Idris I, Srinivasan R, Simm A, Page RC. Effects of maternal hyperthyroidism during early gestation on neonatal and obstetric outcome. Clin Endocrinol. 2006;65:133-135.
2. Girling JC. Thyroid disorders in pregnancy. Curr Obstet Gynecol. 2006;16:47-53.
3. Creasy RK, Resnik R, Iams J. Maternal–Fetal Medicine. 5th ed. Philadelphia, Pa: Saunders Elsevier; 2004:1063-1082.
4. Mitchell ML, Klein RZ. The sequelae of untreated maternal hypothyroidism. Eur J Endocrinol. 2004;151 Suppl 3:U45-U48.
5. Alexander EK, Marqusee E, Lawrence J, Jarolim P, Fischer GA, Larsen PR. Timing and magnitude of increases in levothyroxine requirements during pregnancy in women with hypothyroidism. N Engl J Med. 2004;351:241-249.
6. American College of Obstetrics and Gynecology. ACOG Practice Bulletin. Clinical management guidelines for obstetrician-gynecologists. Number 37, August 2002. (Replaces Practice Bulletin Number 32, November 2001). Thyroid disease in pregnancy. Obstet Gynecol. 2002;100:387-396.
7. Pop VJ, Kuijpens JL, van Baar AL, et al. Low maternal free thyroxine concentrations during early pregnancy are associated with impaired psychomotor development in infancy. Clin Endocrinol. 1999;50:149-155.
8. Haddow JE, Palomaki GE, Allan WC, et al. Maternal thyroid deficiency during pregnancy and subsequent neuropsychological development of the child. N Engl J Med. 1999;341:549-555.
9. Blazer S, Moreh-Waterman Y, Miller-Lotan R, Tamir A, Hochberg Z. Maternal hypothyroidism may affect fetal growth and neonatal thyroid function. Obstet Gynecol. 2003;102:232-241.
10. Casey BM, Dashe JS, Wells CE, et al. Subclinical hypothyroidism and pregnancy outcomes. Obstet Gynecol. 2005;105:239-245.
11. Klein RZ, Haddow JE, Faix JD, et al. Prevalence of thyroid deficiency in pregnant women. Clin Endocrinol. 1991;35:41-46.
12. Kooistra L, Crawford S, van Baar AL, Brouwers EP, Pop VJ. Neonatal effects of maternal hypothyroxinemia during early pregnancy. Pediatrics. 2006;117:161-167.
13. Levothyroxine: Drug information. Lexicomp. http://www.utdol.com/utd/content/topic.do?topicKey=drug_l_z/143814&type=A&selectedTitle=2~39. Accessed December 14, 2007.
14. Casey BM, Leveno KJ. Thyroid disease in pregnancy. Obstet Gynecol. 2006;108:1283-1292.
15. Kent GN, Stuckey BG, Allen JR, Lambert T, Gee V. Postpartum thyroid dysfunction: clinical assessment and relationship to psychiatric affective morbidity. Clin Endocrinol. 1999;51:429-438.
The authors report no financial relationships relevant to this article.
A pregnant woman whose thyroid gland isn’t doing its job presents a serious management problem for her obstetrician. If she has overt hypothyroidism, seen in between 0.3% and 2.5% of pregnancies, active intervention is required to prevent serious damage to the fetus.1,2 Even if she has subclinical disease, seen in 2% to 3% of pregnancies, current research indicates that intervention may be indicated.
Fetal thyroxine requirements increase as early as 5 weeks of gestation, when the fetus is still dependent on maternal thyroxine. A deficiency of maternal thyroxine can have severe adverse outcomes, affecting the course of the pregnancy and the neurologic development of the fetus. To prevent such sequelae, patients who were on thyroid medication before pregnancy should increase the dosage by 30% once pregnancy is confirmed, and hypothyroidism that develops in pregnancy should be managed aggressively and meticulously.
Here, we’ll examine the published research to advise you on evidence-based approaches for diagnosis and management of this complex condition.
Maternal thyroid function
An elaborate negative-feedback loop prevails before pregnancy
In a nonpregnant woman, thyroid function is controlled by a negative-feedback loop that works like this:
- The hypothalamus releases thyroid-releasing hormone (TRH)
- TRH acts on the pituitary gland to release thyroid-stimulating hormone (TSH)
- TSH, in turn, acts on the thyroid gland to release the thyroid hormones iodothyronine (T3) and thyroxine (T4) that regulate metabolism
- TRH and TSH concentrations are inversely related to T3 and T4 concentrations. That is, the more TRH and TSH circulating in the blood stream, the less T3 and T4 will be produced by the thyroid gland3
- Almost all (approximately 99%) circulating T3 and T4 is bound to a protein called thyroxine-binding globulin (TBG). Only 1% of these hormones circulate in the free form, and only the free forms are biologically active.3
This relationship is illustrated in FIGURE 1.
FIGURE 1 Thyroid physiology and the impact of pregnancy
Pregnancy reduces free forms of T3 and T4, and increases TSH slightly
Pregnancy alters thyroid function in significant ways:
- Increases in circulating estrogen lead to the production of more TBG
- When TBG increases, more T3 and T4 are bound and fewer free forms of these hormones are available
- Because the total T3 (TT3) and total free T4 (TT4) are decreased in pregnancy, they are not good measures of thyroid function. Maternal thyroid function in pregnancy should be monitored using free T4 (FT4) and TSH levels
- Increased TBG also leads to a slight increase in TSH between the first trimester and term
- Human chorionic gonadotropin (hCG) concentrations also increase in pregnancy. Because hCG has thyrotropin-like activity, these higher levels cause a transient decrease in TSH by suppression of TSH production between approximately 8 and 14 weeks of gestation.
Fetal thyroid function
During early gestation, the fetus receives thyroid hormone from the mother.1 Maternal T4 crosses the placenta actively—the only hormone that does so.4 The fetus’s need for thyroxine starts to increase as early as 5 weeks of gestation.5
Fetal thyroid development does not begin until 10 to 12 weeks of gestation, and then continues until term. The fetus relies on maternal T4 exclusively before 12 weeks and partially thereafter for normal fetal neurologic development. It follows that maternal hypothyroidism could be detrimental to fetal development if not detected and corrected very early in gestation.
How (and whom) to screen for maternal hypothyroidism
Routine screening has been recommended for women who have infertility, menstrual disorders, or type 1 diabetes mellitus, and for pregnant women who have signs and symptoms of deficient thyroid function.6 In recent years, some authors have recommended screening all pregnant women for thyroid dysfunction, but such recommendations remain controversial.3,7,8 Routine screening is not endorsed by the American College of Obstetricians and Gynecologists.6
Symptoms overlap typical conditions of pregnancy
The difficulty here is that the characteristic signs and symptoms of hypothyroidism are very similar to physiologic conditions seen in most pregnancies. They include fatigue, constipation, cold intolerance, muscle cramps, hair loss, dry skin, brittle nails, weight gain, intellectual slowness, bradycardia, depression, insomnia, periorbital edema, myxedema, and myxedema coma.6 A side-by-side comparison of pregnancy conditions and hypothyroidism symptoms is provided in TABLE 1.
TABLE 1
Distinguishing hypothyroidism from a normal gestation can be challenging
| SYMPTOM | HYPOTHYROIDISM | PREGNANCY |
|---|---|---|
| Fatigue | • | • |
| Constipation | • | • |
| Hair loss | • | |
| Dry skin | • | |
| Brittle nails | • | |
| Weight gain | • | • |
| Fluid retention | • | • |
| Bradycardia | • | • |
| Goiter | • | |
| Carpal tunnel syndrome | • | • |
Which laboratory tests are informative?
Because screening is controversial and symptomatology does not reliably distinguish hypothyroidism from normal pregnancy, laboratory tests are the standard for diagnosis. Overt hypothyroidism is diagnosed in a symptomatic patient by elevated TSH level and low levels of FT4 and free T3 (FT3). Subclinical hypothyroidism is defined as elevated TSH with normal FT4 and FT3 in an asymptomatic patient. Level changes characteristic of normal pregnancy, overt hypothyroidism, and subclinical hypothyroidism are given in TABLE 2.6
TABLE 2
Laboratory diagnosis of hypothyroidism
| MATERNAL CONDITION | TSH | FREE T3 | FREE T4 | TOTAL T3 | TOTAL T4 |
|---|---|---|---|---|---|
| Normal pregnancy | No change | No change | ↑ | ↑ | ↑ |
| Hypothyroidism | ↑ | ↓ | ↓ | ↓ | ↓ |
| Subclinical hypothyroidism | ↑ | No change | No change | ↓ | ↓ |
| Adapted from American College of Obstetricians and Gynecologists6 | |||||
What causes hypothyroidism?
The most common cause of hypothyroidism in most of the world is iodine deficiency. In developed countries, however, where lack of iodine in the diet is not a problem, Hashimoto’s thyroiditis, also known as chronic autoimmune thyroiditis, is the most common cause. Hashimoto’s thyroiditis is characterized by the presence of antithyroid antibodies, including both thyroid antimicrosomial and antithyroglobulin antibodies. Both iodine deficiency and Hashimoto’s thyroiditis are associated with goiter.5 Other causes of hypothyroidism include radioactive iodine therapy for Graves’ disease, a condition we will discuss in Part 2 of this series in February; thyroidectomy; viral thyroiditis; pituitary tumors; Sheehan’s syndrome; and a number of medications.
Causes of hypothyroidism are summarized in TABLE 3.3
TABLE 3
Causes of hypothyroidism
| Iodine deficiency |
| Hashimoto’s thyroiditis |
| Radioactive iodine therapy |
| Thyroidectomy |
| Viral thyroiditis |
| Sheehan’s syndrome |
Medications
|
Effects vary by medication
Medications alter thyroid function in different ways. Iodine and lithium inhibit thyroid function and, along with dopamine antagonists, increase TSH levels. Conversely, thioamides, glucocorticoids, dopamine agonists, and somatostatins decrease TSH levels. Finally, ferrous sulfate, sucrafate, cholestyramine, and aluminum hydroxide antacids all inhibit gastrointestinal absorption of thyroid hormone and therefore should not be taken within 4 hours of thyroid medication.6
Maternal hypothyroidism: Effects on fetus, newborn
The impact of maternal hypothyroidism on the fetus depends on the severity of the condition.
- Uncontrolled hypothyroidism. The consequences of this condition can be dire. The possibilities include intrauterine fetal demise and stillbirth, preterm delivery, low birth weight, preeclampsia, and developmental anomalies including reduced intelligence quotient (IQ).1,2,4,6 Blazer and colleagues correlated intrauterine growth with maternal TSH and fetal FT4 and concluded that impaired intrauterine growth is related to abnormal thyroid function and might reflect an insufficient level of hormone production by hypothyroid mothers during pregnancy.9 Maternal and congenital hypothyroidism resulting from severe iodine deficiency are associated with profound neurologic impairment and mental retardation.1,3,10 If the condition is left untreated, cretinism can occur. Congenital cretinism is associated with growth failure, mental retardation, and other neuropsychologic deficits including deaf-mutism.3,4 However, if cretinism is identified and treated in the first 3 months of life, near-normal growth and intelligence can be expected.6 For this reason, all 50 states and the District of Columbia require newborn screening for congenital hypothyroidism.6
- Asymptomatic overt hypothyroidism. Several studies have evaluated neonatal outcomes in pregnancy complicated by asymptomatic overt hypothyroidism—that is, women who had previously been diagnosed with hypothyroidism, who have abnormal TSH and FT4 levels, but who do not have symptoms. Pop and colleagues have shown impaired psychomotor development at 10 months in infants born to mothers who had low T4 during the first 12 weeks of gestation.7 Haddow and colleagues correlated elevated maternal TSH levels at less than 17 weeks’ gestation with low IQ scores in the offspring at 7 to 9 years of age.8 Klein and colleagues demonstrated an inverse correlation between a woman’s TSH level during pregnancy and the IQ of her offspring.11 Kooistra and colleagues confirmed that maternal hypothyroxinemia is a risk for neurodevelopmental abnormalities that can be identified as early as 3 weeks of age.12 Studies of this relationship are summarized in TABLE 4.
- Subclinical hypothyroidism. During the past decade, researchers have focused attention on neonatal neurologic function in infants born to mothers who had subclinical disease. Mitchell and Klein evaluated the prevalence of subclinical hypothyroidism at less than 17 weeks’ gestation and subsequently compared the IQs in these children with those of controls.4 They found the mean and standard-deviation IQs of the children in the control and treated groups to be significantly higher than those of the children whose mothers were not treated. Casey and colleagues evaluated pregnancy outcomes in women who had undiagnosed subclinical hypothyroidism.10 They found that such pregnancies were more likely to be complicated by placental abruption and preterm birth, and speculated that the reduced IQ demonstrated in the Mitchell and Klein study might have been related to the effects of prematurity.
TABLE 4
Fetal and neonatal effects of asymptomatic overt hypothyroidism
| STUDY | LABORATORY FINDINGS | OUTCOMES AND RECOMMENDATIONS |
|---|---|---|
| Kooistra et al12 | ↓ FT4 | Maternal hypothyroxinemia is a risk for neurodevelopmental abnormalities as early as 3 weeks of age |
| Casey et al10 | ↑ TSH | Pregnancies with undiagnosed subclinical hypothyroidism were more likely to be complicated by placental abruption and preterm birth. The reduced IQ seen in a prior study (Mitchell and Klein4) may be related to effects of prematurity |
| Mitchell and Klein4 | ↑ TSH | The mean and standard deviation of IQs of the children of treated mothers with hypothyroidism and the control group were significantly higher than those for children of untreated hypothyroid women |
| Blazer et al9 | ↑ maternal TSH, ↑ fetal FT4 | Impaired intrauterine growth may reflect insufficient levels of hormone replacement therapy in hypothyroid mothers during pregnancy |
| Pop et al7 | ↓ FT4 | Impaired psychomotor development at 10 months of age in offspring of mothers with low T4 at ≤12 weeks |
| Haddow et al8 | ↑ TSH, ↓ FT4 | Elevated TSH levels at <17 weeks’ gestation are associated with low IQ scores at 7 to 9 years of age. Routine screening for thyroid deficiency may be warranted |
| Klein et al11 | ↑ TSH, ↓ FT4, ↓ TT4 | Inverse correlation between TSH during pregnancy and IQ of offspring |
| FT4=free thyroxine, TSH=thyroid-stimulating hormone, TT4=total thyroxine | ||
Managing hypothyroidism in pregnancy
The treatment of choice for correction of hypothyroidism is synthetic T4, or levothyroxine (Levothyroid, Levoxyl, Synthroid, and Unithroid). Initial treatment in the nonpregnant patient is 1.7 μg/kg/day or 12.5 to 25 μg/day adjusted by 25 μg/day every 2 to 4 weeks until a euthyroid state is achieved.13
Patients who were on thyroxine therapy before pregnancy should increase the dose by 30% once pregnancy is confirmed.1,5 Serum thyrotropin levels should be monitored every 4 weeks to maintain a TSH level between 1 and 2 mU/L and FT4 in upper third of normal.1 Once a euthyroid state has been achieved, thyrotropin levels should be monitored every trimester until delivery. FIGURE 2 provides an algorithm for management of hypothyroidism in pregnancy.
FIGURE 2 During pregnancy, thyroid function merits regular monitoring, fine-tuning of treatment
Postpartum thyroiditis
About 5% of all obstetrical patients develop postpartum thyroiditis. Approximately 45% of these women present with hypothyroidism, with the rest evenly divided between thyrotoxicosis (hyperthyroidism) and thyrotoxicosis followed by hypothyroidism. Unfortunately, the signs and symptoms of hypo- and hyperthyroidism are similar to the postpartum state. Many of these patients are not diagnosed. A high index of suspicion warrants thyroid function testing. Women who have a history of type 1 diabetes mellitus have a 25% chance of developing postpartum thyroid dysfunction.
The diagnosis is made by documenting abnormal levels of TSH and FT4. Postpartum hyperthyroidism may be diagnosed by the presence of antimicrosomal or thyroperoxidase antithyroid peroxidase antibodies. Goiter may be present in up to 50% of patients.
Postpartum thyroiditis has two phases
The first phase, also known as the thyrotoxic phase, occurs 1 to 4 months after delivery when transient thyrotoxicosis develops from excessive release of thyroid hormones. The most common symptoms with early postpartum thyroiditis are fatigue and palpitations. Approximately 67% of these women will return to a euthyroid state, and thioamide therapy is generally considered ineffective. Hypothyroidism can develop within 1 month of the onset of thyroiditis.
The second phase occurs between 4 and 8 months postpartum, and these women present with hypothyroidism. Thyromegaly and associated symptoms are common. Unlike the first (thyrotoxic) phase, medical treatment is recommended. Thyroxine treatment should be initiated and maintained for 6 to 12 months. Postpartum thyroiditis carries a 30% risk of recurrence.14
Postpartum thyroiditis may be associated with depression or aggravate symptoms of depression, although the data on this association are conflicting. The largest study addressing this issue concluded that there was no difference in the clinical and psychiatric signs and symptoms between postpartum thyroiditis and controls.15 Nevertheless, it would seem prudent to evaluate thyroid function in postpartum depression if other signs of thyroid dysfunction are present.
1. Idris I, Srinivasan R, Simm A, Page RC. Effects of maternal hyperthyroidism during early gestation on neonatal and obstetric outcome. Clin Endocrinol. 2006;65:133-135.
2. Girling JC. Thyroid disorders in pregnancy. Curr Obstet Gynecol. 2006;16:47-53.
3. Creasy RK, Resnik R, Iams J. Maternal–Fetal Medicine. 5th ed. Philadelphia, Pa: Saunders Elsevier; 2004:1063-1082.
4. Mitchell ML, Klein RZ. The sequelae of untreated maternal hypothyroidism. Eur J Endocrinol. 2004;151 Suppl 3:U45-U48.
5. Alexander EK, Marqusee E, Lawrence J, Jarolim P, Fischer GA, Larsen PR. Timing and magnitude of increases in levothyroxine requirements during pregnancy in women with hypothyroidism. N Engl J Med. 2004;351:241-249.
6. American College of Obstetrics and Gynecology. ACOG Practice Bulletin. Clinical management guidelines for obstetrician-gynecologists. Number 37, August 2002. (Replaces Practice Bulletin Number 32, November 2001). Thyroid disease in pregnancy. Obstet Gynecol. 2002;100:387-396.
7. Pop VJ, Kuijpens JL, van Baar AL, et al. Low maternal free thyroxine concentrations during early pregnancy are associated with impaired psychomotor development in infancy. Clin Endocrinol. 1999;50:149-155.
8. Haddow JE, Palomaki GE, Allan WC, et al. Maternal thyroid deficiency during pregnancy and subsequent neuropsychological development of the child. N Engl J Med. 1999;341:549-555.
9. Blazer S, Moreh-Waterman Y, Miller-Lotan R, Tamir A, Hochberg Z. Maternal hypothyroidism may affect fetal growth and neonatal thyroid function. Obstet Gynecol. 2003;102:232-241.
10. Casey BM, Dashe JS, Wells CE, et al. Subclinical hypothyroidism and pregnancy outcomes. Obstet Gynecol. 2005;105:239-245.
11. Klein RZ, Haddow JE, Faix JD, et al. Prevalence of thyroid deficiency in pregnant women. Clin Endocrinol. 1991;35:41-46.
12. Kooistra L, Crawford S, van Baar AL, Brouwers EP, Pop VJ. Neonatal effects of maternal hypothyroxinemia during early pregnancy. Pediatrics. 2006;117:161-167.
13. Levothyroxine: Drug information. Lexicomp. http://www.utdol.com/utd/content/topic.do?topicKey=drug_l_z/143814&type=A&selectedTitle=2~39. Accessed December 14, 2007.
14. Casey BM, Leveno KJ. Thyroid disease in pregnancy. Obstet Gynecol. 2006;108:1283-1292.
15. Kent GN, Stuckey BG, Allen JR, Lambert T, Gee V. Postpartum thyroid dysfunction: clinical assessment and relationship to psychiatric affective morbidity. Clin Endocrinol. 1999;51:429-438.
PRENATAL COUNSELING
Investigations of maternal alcohol consumption have consistently produced the same finding: Even a low level of alcohol—especially in the first trimester—has a harmful effect on fetal development. The American College of Obstetricians and Gynecologists (ACOG), American Academy of Pediatricians, and the US Surgeon General now support the tenet that no lower limit of alcohol consumption is safe during pregnancy.
Although a specific fetal alcohol syndrome (FAS) was not identified until 1968, the adverse effects of alcohol during pregnancy have been observed for centuries. FAS is the most severe manifestation of maternal alcohol consumption and is estimated to affect 0.2 to 1.5 of every 1,000 births. The term refers to a “constellation of physical abnormalities” and “problems of behavior and cognition in children born to mothers who drank heavily during pregnancy.”1 The syndrome is also “completely preventable.”1
The US Surgeon General recommends that health professionals:
- routinely inquire about alcohol consumption in women of childbearing age
- inform them of the risks of alcohol consumption during pregnancy
- advise them not to drink during pregnancy.2
New drinking pattern emerges
Of special concern is binge drinking, initially defined as the consumption of five or more drinks during one session, even among women who do not chronically consume alcohol. Like lower levels of alcohol consumption during pregnancy, binge drinking increases the risk of developmental and growth delays in the child. The higher peak levels of alcohol associated with binge drinking appear particularly deleterious to fetal neurodevelopment. And because a woman may engage in binge drinking before she is aware that she is pregnant, the issue merits particular attention.
Hallmarks of FAS
FAS causes facial dysmorphia, including short palpebral fissures, flattened midfacies, epicanthal folds, and micrognathia. Defects of the central nervous system and cardiac, renal, and skeletal systems also can occur, along with prenatal and postnatal growth delay. In addition, developmental delay is present.
FAS can be present even if history of alcohol exposure is uncertain
In 1996, the Institute of Medicine broadened the classification of FAS to include:
- Category 1 – FAS with a confirmed history of maternal alcohol exposure
- Category 2 – FAS with no confirmed history of maternal alcohol exposure
- Category 3 – partial FAS with a history of maternal alcohol exposure
- Category 4 – alcohol-related birth defects (physical anomalies only)
- Category 5 – alcohol-related neurodevelopmental disorders.1
Alcohol exposure linked to a spectrum of effects
In 2005, the term “fetal alcohol spectrum disorder” (FASD) entered the lexicon. FASD is not intended to be used as a clinical diagnosis but to describe a spectrum of conditions that may result from prenatal alcohol exposure.
The prevalence of FASD is uncertain, although alcohol-related neurobehavioral abnormalities that affect learning and behavior may occur in three additional children for every one child who is given a diagnosis of classic FAS.
In this Update, I highlight recent studies or publications that:
- describe drinking patterns among women of reproductive age
- offer screening strategies or
- suggest a framework for counseling the patient to reduce or eliminate alcohol consumption.
Which women are most likely to drink during pregnancy?
Tsai J, Floyd RL, Green PP, Bouyle CA. Patterns and average volume of alcohol use among women of childbearing age. Matern Child Health J. 2007;11:437–445.
Tsai J, Floyd RL, Bertrand J. Tracking binge drinking among childbearing-age women. Prev Med. 2007; 44:298–302.
Caetano R, Ramisetty-Mikler S, Floyd L, McGrath C. The epidemiology of drinking among women of childbearing age. Alcohol Clin Exp Res. 2006;30:1023–1030.
Studies that led to the phenotypic description of FASD focused on women who had recognized alcohol dependency and who drank heavily. Additional research has identified another subset of women who are likely to continue alcohol consumption during pregnancy: binge drinkers. Many women who report binge drinking do not consider their alcohol consumption to be chronic or excessive.
Binge drinking is on the rise among women of childbearing age…
Binge drinking has increased steadily over the past 10 years despite public health initiatives and other programs developed to educate consumers. Tsai and colleagues used data from the Centers for Disease Control and Prevention (CDC) Behavior Risk Factor Surveillance System from 2001 to 2003 to calculate the magnitude of alcohol consumption among women of childbearing age. The rate of binge drinking increased from 10.3% to 13% between 1991 and 2003. In 2003, the highest prevalence of binge drinking was observed in the 18- to 24-year-old age group (20.5%), and among non-Hispanic white (15.5%), employed (14%), college-educated (13.3%), and unmarried women (18.7%). The highest number of binge sessions in the preceding month followed the same pattern.
In 2004, as it became clear that the adverse effects of binge alcohol consumption were more significant in women than men, at-risk binge drinking was redefined as more than three drinks in a single session.
…and also on the rise among pregnant women
In a separate study by Tsai and colleagues using the same data, one in 50 gravidas reported alcohol consumption in a binge fashion during the current pregnancy, with a background rate of 9% to 12% of pregnant women who reported any use of alcohol. More than 50% of the pregnant women who reported binge drinking said they had engaged in binge drinking at least twice during the preceding month.
Binge drinking and unplanned pregnancy—a risky combination
Binge drinking among women of reproductive age is especially risky because roughly half of all pregnancies in the United States are unplanned, so a woman may unwittingly engage in binge drinking during pregnancy. The rate of unintended pregnancy is highest among adolescents (82%) and 20- to 24-year-olds (61%), the groups with the highest rate of binge drinking (20%) and the most episodes in the preceding month (3.5). These figures suggest that efforts to prevent FAS should encompass the concept of binge drinking as an at-risk behavior and focus on all women of reproductive age, not just those known to be pregnant.
The typical binge drinker? She’s young, white, single, and employed
Utilizing the 2002 National Epidemiologic Survey on Alcohol and Related Conditions, Caetano and colleagues explored alcohol consumption among women of reproductive age before they recognized they were pregnant. Women of childbearing age who are social drinkers but develop a pattern of binge drinking represent a larger percentage of the female population than do women who consume alcohol daily, but both groups face an increased risk of bearing a child with alcohol-related neurodevelopmental difficulties.
Unplanned pregnancies were associated with a higher rate of preconception binge drinking than were planned gestations, and unmarried Caucasian women who smoked were most likely to engage in preconception binge drinking.
When the year preceding the study was assessed for both alcohol use and pregnancy, Caetano and associates found that 20% of women met the criteria for binge drinking or alcohol dependence. The high prevalence probably reflects the longer time span for acknowledgment of alcohol consumption (an entire year) and the lower drink limit for the redefined term “binge drinking” (in this study, it was defined as four drinks or more rather than five or more drinks on one occasion). The highest-risk women were young, single, and Caucasian, and had a higher income (>$40,000). White women had higher rates of binge drinking than black or Hispanic women at comparable ages, marital status, and income levels.
What’s the best way to screen for “at-risk” alcohol consumption?
Drinking and Reproductive Health: A Fetal Alcohol Spectrum Disorders Prevention Tool Kit. Washington, DC: American College of Obstetricians and Gynecologists; 2006. Available at: cdc.gov/ncbddd/fas/acog_toolkit.htm
In 2006, in collaboration with the CDC, ACOG developed a comprehensive educational tool kit for physicians. The kit, which can be downloaded from the CDC Web site, outlines office-based screening for at-risk drinking patterns in pregnant and nonpregnant women. It includes a screening tool—T-ACE—that has proved to be effective and can be incorporated into practice fairly efficiently. T-ACE and a similar tool—TWEAK—are presented in the TABLE.
ACOG recommends, and research supports, routine screening of all women of childbearing age. Studies assessing the prevalence of at-risk drinking and the efficacy of various interventions suggest that screening for alcohol use should be a routine part of prenatal care—as well as annual gynecologic care among women of childbearing age. One applicable approach is incorporation of a screening tool into the health-and-habits questionnaire administered to the patient.
Available as companion pieces to the tool kit are patient education sheets covering the risks of alcohol exposure and emphasizing basic concepts such as:
- alcohol equivalency (12 oz of beer=5 oz of wine=1 oz of liquor)
- risks of alcohol exposure before pregnancy is recognized
- goals for reducing or eliminating alcohol consumption.
Use these tools to screen for excessive alcohol consumption
| FOCUS | QUESTION | POINTS |
|---|---|---|
| T-ACE (a positive screen is ≥2 points) | ||
| (T) Tolerance | How many drinks does it take to make you feel high? | 1 point per drink |
| (A) Annoyed | Have people annoyed you by criticizing your drinking? | Yes = 1 point |
| (C) Cut down | Have you ever felt you ought to cut down on your drinking? | Yes = 1 point |
| (E) Eye-opener | Have you ever had a drink first thing in the morning to steady your nerves or get rid of a hangover? | Yes = 1 point |
| TWEAK (a positive screen is ≥2 points) | ||
| (T) Tolerance | Are more than two drinks necessary to make you feel high? | Yes = 2 points |
| (W) Worry | Are your friends or family worried about your level of alcohol consumption? | Yes = 1 point |
| (E) Eye-opener | Do you ever need to drink in the morning? | Yes = 1 point |
| (A) Amnesia | Do you ever black out when drinking? | Yes = 1 point |
| (K) Cut down | Do you believe you need to cut down on your drinking? | Yes = 1 point |
Are efforts to reduce alcohol use among gravidas successful?
Floyd RL, Sobell M, Velasquez M, et al; Project CHOICES Efficacy Study Group. Preventing alcohol-exposed pregnancies. A randomized controlled trial. Am J Prev Med. 2007;32:1–10.
Brief intervention has been a successful tool for changing the behavior of nonpregnant adults. It also appears to be effective and efficient in the pregnant population. A brief intervention typically consists of a time-limited motivational counseling session that aims to educate, recommend a change in habits, and help the patient set goals. Brief intervention has had special success among nondependent women and has been used effectively in obstetric clinics and among women of various racial, ethnic, and socioeconomic backgrounds.
This randomized, controlled trial by Floyd and colleagues focused on the pregnant population. Like three other brief intervention trials conducted between 2000 and 2006, it found that brief intervention reduced alcohol consumption, increased positive newborn outcomes, and decreased alcohol consumption in subsequent pregnancies.3-5
FRAMES model: 6 manageable steps
One successful brief intervention is the FRAMES model, which is included in the ACOG tool kit for physicians. It is based on concepts of:
- feedback (F) – compare the patient’s level of drinking with drinking patterns that are not risky
- responsibility (R) – emphasize that it is up to her to change her habits
- advice (A) – counsel her to change her behavior
- menu (M) – identify risky drinking situations and offer tactics for coping
- empathy (E) – be understanding
- self-efficacy (S) – encourage the patient to set goals and commit to change.
Use an individualized approach to change behavior
Despite widespread, population-based educational efforts throughout the 1990s, the prevalence of alcohol consumption among nonpregnant and pregnant women remains largely unchanged or even increased, particularly binge drinking. Other approaches are needed to avert the largest preventable contributor to birth defects and childhood neurodevelopmental disability.
With improved and validated office-based methods for identifying alcohol consumption, along with referrals when appropriate, it is possible to reduce maternal alcohol consumption during pregnancy. These simple methods are also easy to incorporate into an office routine. Equally important is incorporation of these methods into the office visit for the nonpregnant woman of reproductive age, with the aim of reducing alcohol consumption and increasing use of effective contraception.
1. Stratton K, Howe C, Battaglia F. eds. Fetal Alcohol Syndrome: Diagnosis, Epidemiology, Prevention, and Treatment. Washington, DC: National Academy Press; 1996. Available at: www.nap.edu/openbook.php?record_id=4991&page=R1. Accessed December 5, 2007.
2. US Department of Health and Human Services, Office of the Surgeon General. Surgeon General’s Advisory on Alcohol Use in Pregnancy. Available at: www.surgeongeneral.gov/pressreleases/sg02222005.html. Accessed December 5, 2007.
3. Manwell LB, Fleming MF, Mundt MP, Stauffacher EA, Barry KL. Treatment of problem alcohol use in women of childbearing age: results of a brief intervention trial. Alcohol Clin Exp Res. 2000;24:1517-1524.
4. Ingersoll KS, Ceperich SD, Nettleman MD, Karanda K, Brocksen S, Johnson BA. Reducing alcohol-exposed pregnancy risk in college women: initial outcomes of a clinical trial of a motivational intervention. J Subst Abuse Treat. 2005;29:173-189.
5. Chang G, Wilkins-Haug BS, Goetz MA. Brief interventions for alcohol use in pregnancy: a randomized trial. Addiction. 1999;94:1499-1508.
Investigations of maternal alcohol consumption have consistently produced the same finding: Even a low level of alcohol—especially in the first trimester—has a harmful effect on fetal development. The American College of Obstetricians and Gynecologists (ACOG), American Academy of Pediatricians, and the US Surgeon General now support the tenet that no lower limit of alcohol consumption is safe during pregnancy.
Although a specific fetal alcohol syndrome (FAS) was not identified until 1968, the adverse effects of alcohol during pregnancy have been observed for centuries. FAS is the most severe manifestation of maternal alcohol consumption and is estimated to affect 0.2 to 1.5 of every 1,000 births. The term refers to a “constellation of physical abnormalities” and “problems of behavior and cognition in children born to mothers who drank heavily during pregnancy.”1 The syndrome is also “completely preventable.”1
The US Surgeon General recommends that health professionals:
- routinely inquire about alcohol consumption in women of childbearing age
- inform them of the risks of alcohol consumption during pregnancy
- advise them not to drink during pregnancy.2
New drinking pattern emerges
Of special concern is binge drinking, initially defined as the consumption of five or more drinks during one session, even among women who do not chronically consume alcohol. Like lower levels of alcohol consumption during pregnancy, binge drinking increases the risk of developmental and growth delays in the child. The higher peak levels of alcohol associated with binge drinking appear particularly deleterious to fetal neurodevelopment. And because a woman may engage in binge drinking before she is aware that she is pregnant, the issue merits particular attention.
Hallmarks of FAS
FAS causes facial dysmorphia, including short palpebral fissures, flattened midfacies, epicanthal folds, and micrognathia. Defects of the central nervous system and cardiac, renal, and skeletal systems also can occur, along with prenatal and postnatal growth delay. In addition, developmental delay is present.
FAS can be present even if history of alcohol exposure is uncertain
In 1996, the Institute of Medicine broadened the classification of FAS to include:
- Category 1 – FAS with a confirmed history of maternal alcohol exposure
- Category 2 – FAS with no confirmed history of maternal alcohol exposure
- Category 3 – partial FAS with a history of maternal alcohol exposure
- Category 4 – alcohol-related birth defects (physical anomalies only)
- Category 5 – alcohol-related neurodevelopmental disorders.1
Alcohol exposure linked to a spectrum of effects
In 2005, the term “fetal alcohol spectrum disorder” (FASD) entered the lexicon. FASD is not intended to be used as a clinical diagnosis but to describe a spectrum of conditions that may result from prenatal alcohol exposure.
The prevalence of FASD is uncertain, although alcohol-related neurobehavioral abnormalities that affect learning and behavior may occur in three additional children for every one child who is given a diagnosis of classic FAS.
In this Update, I highlight recent studies or publications that:
- describe drinking patterns among women of reproductive age
- offer screening strategies or
- suggest a framework for counseling the patient to reduce or eliminate alcohol consumption.
Which women are most likely to drink during pregnancy?
Tsai J, Floyd RL, Green PP, Bouyle CA. Patterns and average volume of alcohol use among women of childbearing age. Matern Child Health J. 2007;11:437–445.
Tsai J, Floyd RL, Bertrand J. Tracking binge drinking among childbearing-age women. Prev Med. 2007; 44:298–302.
Caetano R, Ramisetty-Mikler S, Floyd L, McGrath C. The epidemiology of drinking among women of childbearing age. Alcohol Clin Exp Res. 2006;30:1023–1030.
Studies that led to the phenotypic description of FASD focused on women who had recognized alcohol dependency and who drank heavily. Additional research has identified another subset of women who are likely to continue alcohol consumption during pregnancy: binge drinkers. Many women who report binge drinking do not consider their alcohol consumption to be chronic or excessive.
Binge drinking is on the rise among women of childbearing age…
Binge drinking has increased steadily over the past 10 years despite public health initiatives and other programs developed to educate consumers. Tsai and colleagues used data from the Centers for Disease Control and Prevention (CDC) Behavior Risk Factor Surveillance System from 2001 to 2003 to calculate the magnitude of alcohol consumption among women of childbearing age. The rate of binge drinking increased from 10.3% to 13% between 1991 and 2003. In 2003, the highest prevalence of binge drinking was observed in the 18- to 24-year-old age group (20.5%), and among non-Hispanic white (15.5%), employed (14%), college-educated (13.3%), and unmarried women (18.7%). The highest number of binge sessions in the preceding month followed the same pattern.
In 2004, as it became clear that the adverse effects of binge alcohol consumption were more significant in women than men, at-risk binge drinking was redefined as more than three drinks in a single session.
…and also on the rise among pregnant women
In a separate study by Tsai and colleagues using the same data, one in 50 gravidas reported alcohol consumption in a binge fashion during the current pregnancy, with a background rate of 9% to 12% of pregnant women who reported any use of alcohol. More than 50% of the pregnant women who reported binge drinking said they had engaged in binge drinking at least twice during the preceding month.
Binge drinking and unplanned pregnancy—a risky combination
Binge drinking among women of reproductive age is especially risky because roughly half of all pregnancies in the United States are unplanned, so a woman may unwittingly engage in binge drinking during pregnancy. The rate of unintended pregnancy is highest among adolescents (82%) and 20- to 24-year-olds (61%), the groups with the highest rate of binge drinking (20%) and the most episodes in the preceding month (3.5). These figures suggest that efforts to prevent FAS should encompass the concept of binge drinking as an at-risk behavior and focus on all women of reproductive age, not just those known to be pregnant.
The typical binge drinker? She’s young, white, single, and employed
Utilizing the 2002 National Epidemiologic Survey on Alcohol and Related Conditions, Caetano and colleagues explored alcohol consumption among women of reproductive age before they recognized they were pregnant. Women of childbearing age who are social drinkers but develop a pattern of binge drinking represent a larger percentage of the female population than do women who consume alcohol daily, but both groups face an increased risk of bearing a child with alcohol-related neurodevelopmental difficulties.
Unplanned pregnancies were associated with a higher rate of preconception binge drinking than were planned gestations, and unmarried Caucasian women who smoked were most likely to engage in preconception binge drinking.
When the year preceding the study was assessed for both alcohol use and pregnancy, Caetano and associates found that 20% of women met the criteria for binge drinking or alcohol dependence. The high prevalence probably reflects the longer time span for acknowledgment of alcohol consumption (an entire year) and the lower drink limit for the redefined term “binge drinking” (in this study, it was defined as four drinks or more rather than five or more drinks on one occasion). The highest-risk women were young, single, and Caucasian, and had a higher income (>$40,000). White women had higher rates of binge drinking than black or Hispanic women at comparable ages, marital status, and income levels.
What’s the best way to screen for “at-risk” alcohol consumption?
Drinking and Reproductive Health: A Fetal Alcohol Spectrum Disorders Prevention Tool Kit. Washington, DC: American College of Obstetricians and Gynecologists; 2006. Available at: cdc.gov/ncbddd/fas/acog_toolkit.htm
In 2006, in collaboration with the CDC, ACOG developed a comprehensive educational tool kit for physicians. The kit, which can be downloaded from the CDC Web site, outlines office-based screening for at-risk drinking patterns in pregnant and nonpregnant women. It includes a screening tool—T-ACE—that has proved to be effective and can be incorporated into practice fairly efficiently. T-ACE and a similar tool—TWEAK—are presented in the TABLE.
ACOG recommends, and research supports, routine screening of all women of childbearing age. Studies assessing the prevalence of at-risk drinking and the efficacy of various interventions suggest that screening for alcohol use should be a routine part of prenatal care—as well as annual gynecologic care among women of childbearing age. One applicable approach is incorporation of a screening tool into the health-and-habits questionnaire administered to the patient.
Available as companion pieces to the tool kit are patient education sheets covering the risks of alcohol exposure and emphasizing basic concepts such as:
- alcohol equivalency (12 oz of beer=5 oz of wine=1 oz of liquor)
- risks of alcohol exposure before pregnancy is recognized
- goals for reducing or eliminating alcohol consumption.
Use these tools to screen for excessive alcohol consumption
| FOCUS | QUESTION | POINTS |
|---|---|---|
| T-ACE (a positive screen is ≥2 points) | ||
| (T) Tolerance | How many drinks does it take to make you feel high? | 1 point per drink |
| (A) Annoyed | Have people annoyed you by criticizing your drinking? | Yes = 1 point |
| (C) Cut down | Have you ever felt you ought to cut down on your drinking? | Yes = 1 point |
| (E) Eye-opener | Have you ever had a drink first thing in the morning to steady your nerves or get rid of a hangover? | Yes = 1 point |
| TWEAK (a positive screen is ≥2 points) | ||
| (T) Tolerance | Are more than two drinks necessary to make you feel high? | Yes = 2 points |
| (W) Worry | Are your friends or family worried about your level of alcohol consumption? | Yes = 1 point |
| (E) Eye-opener | Do you ever need to drink in the morning? | Yes = 1 point |
| (A) Amnesia | Do you ever black out when drinking? | Yes = 1 point |
| (K) Cut down | Do you believe you need to cut down on your drinking? | Yes = 1 point |
Are efforts to reduce alcohol use among gravidas successful?
Floyd RL, Sobell M, Velasquez M, et al; Project CHOICES Efficacy Study Group. Preventing alcohol-exposed pregnancies. A randomized controlled trial. Am J Prev Med. 2007;32:1–10.
Brief intervention has been a successful tool for changing the behavior of nonpregnant adults. It also appears to be effective and efficient in the pregnant population. A brief intervention typically consists of a time-limited motivational counseling session that aims to educate, recommend a change in habits, and help the patient set goals. Brief intervention has had special success among nondependent women and has been used effectively in obstetric clinics and among women of various racial, ethnic, and socioeconomic backgrounds.
This randomized, controlled trial by Floyd and colleagues focused on the pregnant population. Like three other brief intervention trials conducted between 2000 and 2006, it found that brief intervention reduced alcohol consumption, increased positive newborn outcomes, and decreased alcohol consumption in subsequent pregnancies.3-5
FRAMES model: 6 manageable steps
One successful brief intervention is the FRAMES model, which is included in the ACOG tool kit for physicians. It is based on concepts of:
- feedback (F) – compare the patient’s level of drinking with drinking patterns that are not risky
- responsibility (R) – emphasize that it is up to her to change her habits
- advice (A) – counsel her to change her behavior
- menu (M) – identify risky drinking situations and offer tactics for coping
- empathy (E) – be understanding
- self-efficacy (S) – encourage the patient to set goals and commit to change.
Use an individualized approach to change behavior
Despite widespread, population-based educational efforts throughout the 1990s, the prevalence of alcohol consumption among nonpregnant and pregnant women remains largely unchanged or even increased, particularly binge drinking. Other approaches are needed to avert the largest preventable contributor to birth defects and childhood neurodevelopmental disability.
With improved and validated office-based methods for identifying alcohol consumption, along with referrals when appropriate, it is possible to reduce maternal alcohol consumption during pregnancy. These simple methods are also easy to incorporate into an office routine. Equally important is incorporation of these methods into the office visit for the nonpregnant woman of reproductive age, with the aim of reducing alcohol consumption and increasing use of effective contraception.
1. Stratton K, Howe C, Battaglia F. eds. Fetal Alcohol Syndrome: Diagnosis, Epidemiology, Prevention, and Treatment. Washington, DC: National Academy Press; 1996. Available at: www.nap.edu/openbook.php?record_id=4991&page=R1. Accessed December 5, 2007.
2. US Department of Health and Human Services, Office of the Surgeon General. Surgeon General’s Advisory on Alcohol Use in Pregnancy. Available at: www.surgeongeneral.gov/pressreleases/sg02222005.html. Accessed December 5, 2007.
3. Manwell LB, Fleming MF, Mundt MP, Stauffacher EA, Barry KL. Treatment of problem alcohol use in women of childbearing age: results of a brief intervention trial. Alcohol Clin Exp Res. 2000;24:1517-1524.
4. Ingersoll KS, Ceperich SD, Nettleman MD, Karanda K, Brocksen S, Johnson BA. Reducing alcohol-exposed pregnancy risk in college women: initial outcomes of a clinical trial of a motivational intervention. J Subst Abuse Treat. 2005;29:173-189.
5. Chang G, Wilkins-Haug BS, Goetz MA. Brief interventions for alcohol use in pregnancy: a randomized trial. Addiction. 1999;94:1499-1508.
Retaining Experienced VA Nurses: Their Own Perspectives
Shared Group Medical Appointments for Diabetic Foot Care
Superior Labral Anterior to Posterior (SLAP) Tears
Posterior Shoulder Instability: Comprehensive Analysis of Open and Arthroscopic Approaches
Osteochondral Lesions of the Talar Dome
URINARY INCONTINENCE
The author reports no financial relationships relevant to this article.
The past year has seen the publication of much useful evidence regarding urinary incontinence, from both epidemiologic studies and clinical trials. Research into the pathophysiology of incontinence continues to move forward, slowly but surely, measured not in breakthroughs but in gradually increasing knowledge of how the urethra and bladder function in the continent person and how that function can break down, leading to incontinence and other urinary symptoms.
Highlighted here are four notable studies from 2007, as well as progress notes on a trial mentioned early this year in Examining the Evidence (January issue).
New data clarify incidence and uncloak the effect of weight gain
Townsend MK, Danforth KN, Liffort KL, et al. Incidence and remission of urinary incontinence in middle-aged women. Am J Obstet Gynecol. 2007;197:167.e1–167.e5.
Townsend MK, Danforth KN, Liffort KL, et al. Body mass index, weight gain, and incident urinary incontinence in middle-aged women. Obstet Gynecol. 2007;110:346–353.
Studies of urinary incontinence in numerous populations have reported its prevalence—i.e., the percentage of people who have the condition at any point in time—but few have attempted to define its incidence—i.e., the rate at which it develops during a defined period.
Incidence is a true rate, described with a unit of time in the denominator. Prevalence is not a rate (although it is commonly referred to as such) and is described as a percentage only, without time in the denominator. With that distinction in mind, it is easy to see why prevalence data greatly outnumber incidence data: Prevalence can be obtained by means of cross-sectional study, with one-time collection of data. In contrast, incidence data require a population that is free of the condition of interest at baseline; that population is then followed to determine how many people who were initially free of the condition go on to develop it.
Lack of a standard definition makes it hard to measure incontinence
Reported prevalence can range from less than 10% to more than 90%, depending on how incontinence is defined:
- Very low prevalence is found when the definition is limited to persons with the greatest severity or frequency of symptoms
- at the other end of the spectrum, very high prevalence—even approaching 100%—can be found using a definition that includes people who have “ever” leaked urine.
The same issues complicate estimates of incidence. Because there is no consensus over what constitutes a clinically significant threshold for incontinence, investigators are forced to develop their own definitions.
In a pair of studies, Townsend and colleagues neatly circumvent this problem. Using data from the Nurses’ Health Study II, they used a series of definitions of incontinence, ranging from less severe to more severe, to describe their findings in ways that are easily transferred to clinical practice. They focused their attention on women aged 36 to 55 years to estimate the incidence of incontinence over a 2-year period. At baseline, women were considered at risk of incident incontinence if they reported never leaking or leaking only a few drops less than once a month. Three categories of incontinence were then defined, based on symptoms 2 years later:
- incident incontinence: any urine loss, defined as leaking 1–3 times a month
- frequent incontinence: urine loss at least once a week
- severe incontinence: urine loss at least once a week of sufficient volume to at least wet underwear.
Incidence rose with BMI, weight gain
In almost 34,000 continent women from 2001 to follow-up in 2003, the overall (average) incidence of urinary incontinence was 6.9 women for every 100 woman-years. Frequent incontinence developed in, on average, 1.8 women for every 100 woman-years; severe incontinence, in 0.6 women for every 100 woman-years.
Using multivariable logistic regression models, the authors analyzed the likelihood of incident incontinence by body mass index (BMI) and estimated weight gain from the age of 18 until 2001. For either variable, odds ratios (OR) showed a highly significant trend (P<.001) for an increased risk of incident incontinence.
For example, at a BMI greater than 35 kg/m2, the likelihood of:
- any incontinence increased by a factor of about 2 (OR, 2.11; 95% confidence interval [CI], 1.84–2.42)
- frequent incontinence increased by a factor of almost 4 (OR, 3.85; 95% CI, 3.05–4.85)
- severe incontinence increased by a factor of more than 5 (OR, 5.52; 95% CI, 3.72–8.18).
The trend for weight gain was similar, with a gain of more than 30 kg showing odds ratios and 95% confidence intervals of similar magnitude to those seen with a BMI greater than 35.
But one third of incontinent women improved after 2 years
Although urinary incontinence is usually understood as a chronic condition, albeit under the influence of other factors, such as weight gain, data on remission are even scarcer than data on incidence. Using the same dataset, the authors determined that almost 31,000 women were incontinent at baseline in 2001, with incontinence occurring at least monthly. Complete remission, defined as no leaking in 2003, occurred in almost 14% of women. One third reported improvement, defined as either complete remission or a decrease in leaking frequency from 2001 to 2003.
It’s interesting that complete remission was more common in younger women. It also was more common in women who experienced frequent incontinence than in those who reported occasional incontinence. The remaining percentage of women—almost 60%—reported a similar or increased frequency of incontinence over the 2 years of follow-up.
The authors did not collect data on treatment. Estimates of persistence, improvement, and remission could be affected, therefore, if women received effective treatment between 2001 and 2003. However, only about one third of women reported mentioning their symptoms to a physician, and only 13% reported receiving treatment for incontinence. The magnitude of the effect of treatment on remission or improvement of urinary incontinence symptoms therefore seems limited.
Women remain reticent about incontinence
Several points underline the clinical importance of these data, including the relatively high incidence of incontinence symptoms and the strong influence of BMI and weight gain on that incidence. Also notable, and described in previous studies, is the vast underreporting and undertreatment of incontinence in women—an observation that should motivate all clinicians to include screening for urinary incontinence as part of regular well-woman care. Clinicians should also be prepared to refer women with incontinence or to initiate evaluation and management.
Some reports have suggested that the stigma of urinary incontinence has diminished slightly in light of widespread direct-to-consumer advertising for products related to the care (e.g., pads) or treatment (e.g., pharmaceuticals) of incontinence. The data from Townsend and colleagues are relatively recent, yet the majority of women failed to report their symptoms, and an even higher percentage received no treatment. The authors recommend that health-care providers initiate a discussion of urinary symptoms even in middle-aged women, who may be targeted for screening less frequently than older women.
In fascial sling vs Burch, sling prevails but is linked to more adverse effects
Albo ME, Richter HE, Brubaker L, et al, for the Urinary Incontinence Treatment Network. Burch colposuspension versus fascial sling to reduce urinary stress incontinence. N Engl J Med. 2007;356:2143–2155; comment: 2198–2200.
Eagerly anticipated results of the Urinary Incontinence Treatment Network’s first surgical trial, which compared the fascial sling procedure with Burch colposuspension for stress incontinence, were published in May in the New England Journal of Medicine. The Urinary Incontinence Treatment Network is a multicenter clinical trials group that was established in 2000 and is sponsored by the National Institutes of Health (specifically, by the National Institute of Diabetes and Digestive and Kidney Diseases and the National Institute of Child Health and Human Development).
Women were eligible for the trial if they experienced symptoms of stress incontinence; symptoms of mixed incontinence were allowed as long as stress symptoms predominated. Of 655 women in the trial, 326 were randomly assigned to undergo placement of an autologous rectus fascia pubovaginal sling, and 329 were randomized to Burch colposuspension.
Overall success was defined as:
- negative pad test
- no urinary incontinence reported in a 3-day diary
- negative stress test to cough and Valsalva maneuver
- no self-reported symptoms of stress incontinence
- no retreatment for stress incontinence.
“Stress success,” or stress continence, was defined using the last three criteria.
At 2 years after the index surgery, 520 women (79%) were available for follow-up. Overall success and stress success were slightly higher in women who underwent sling placement than in those treated by Burch: overall success, 47% versus 38%, and stress success, 66% versus 49%, respectively. However, women who had slings experienced more adverse outcomes, including urinary tract infection, difficulty voiding, and postoperative urge incontinence.
Success rates were much lower than previously reported
These findings are particularly striking because the success rates are lower than in previous reports—and lower than the figures commonly used by surgeons to counsel women about likely results. “Success” for either procedure has been commonly quoted in the 80% to 90% range, not the 30% to 40% range found here. The authors are to be commended for the stringent definition of “success,” which included elements that invariably result in a lower success rate. It is these numbers that women are most interested in when they are considering this type of surgery.
The difference between sling and Burch procedures was particularly remarkable in regard to stress success (17 percentage points). The smaller difference seen for overall success (9 percentage points) can be attributed to the increase in postoperative urge incontinence among women undergoing the sling procedure.
If the other adverse events associated with the sling procedure (i.e., urinary tract infection and voiding difficulty) had been included in the composite measure of success, it seems possible, if not likely, that a smaller difference—or no difference at all—would have been seen between the sling and Burch groups.
Additional data still to come
Follow-up of women in this trial has been extended for up to 5 years and should provide much-needed information on longer-term results after these surgeries.
Transobturator mid-urethral sling linked to fewer complications
Sung VW, Schleinitz MD, Rardin CR, Ward RM, Myers DL. Comparison of retropubic versus transobturator approach to mid-urethral slings: a systematic review and meta-analysis. Am J Obstet Gynecol. 2007;197:3–11.
In this Update 1 year ago, I remarked on the need for more comparative information about the various mid-urethral slings currently on the market, particularly in regard to complications—information necessary to make recommendations and guide clinical decision-making.
Originally, the procedure for mid-urethral sling placement was modified from the retropubic approach to the obturator approach with the aim of reducing the risk of major bladder and urethral injury and vascular complications (FIGURE 1). Recent data suggest that that goal has been achieved. In a systematic review and meta-analysis of 17 studies that compared retropubic and transobturator approaches, Sung and colleagues found the transobturator route to be associated with fewer complications.
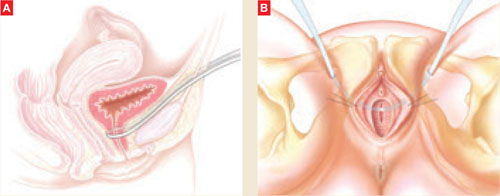
FIGURE 1 Transobturator approach lives up to promise
The retropubic approach (A) was modified to create the transobturator approach (B), with the aim of protecting the bladder, urethra, and vascular structures. A recent meta-analysis indicates that this goal was achieved.
Subjective and objective outcomes were similar for the two approaches
Overall, 492 women in six trials were randomly assigned to receive either a retropubic or transobturator mid-urethral sling for treatment of stress incontinence. Although some trials specified exactly which device was used, others did not. Follow-up ranged from 1 to 15 months.
Because the studies used different definitions of objective success as outcomes, it was not possible to obtain a pooled estimate for objective outcomes. However, the authors were able to calculate a pooled estimate for subjective outcomes by defining subjective success as a woman reporting either continence or improved status after surgery, and by defining failure as a woman reporting unchanged or deteriorating incontinence status.
The pooled odds ratio for subjective failure after transobturator placement of a mid-urethral sling was 0.85, compared with the retropubic approach (95% CI, 0.38–1.92). Results were relatively stable despite changes in definitions of success and failure and restriction to studies with more than 1 year of follow-up. Sung and colleagues concluded that evidence was insufficient to support one or the other approach in regard to subjective or objective outcomes.
Bladder perforation was most common complication
Findings regarding complications were more conclusive. Again drawing on data from six randomized trials, the authors estimated a pooled odds ratio for complications from transobturator placement of 0.40, compared with the retropubic approach (95% CI, 0.19–0.83). Using data from both randomized trials and cohort studies, the most common complications were:
- bladder perforation: 3.5% for retropubic placement, 0.2% for the transobturator route
- hematoma: 1.5% for retropubic placement, 0.08% for the transobturator route.
More definitive data are in the works
As noted here last year, the Urinary Incontinence Treatment Network is enrolling women with stress or stress-predominant mixed incontinence in a randomized trial to compare the retropubic and transobturator approaches for mid-urethral slings. With a sample size of 655 women and 2-year follow-up planned, this trial should be adequately powered to detect clinically important differences, if they exist, in both continence outcomes and complications. Enrollment is projected to close in 2008, with results to follow 2 years later.
Botox injection for detrusor overactivity is no quick fix after all
Interest continues to rise in treating detrusor overactivity—with or without incontinence—with botulinum toxin A. Only one commercial product is available in the United States, sold by Allergan under the trade name Botox. Last year, the Pelvic Floor Disorders Network, sponsored by the National Institute of Child Health and Human Development and the Office of Research in Women’s Health, began a placebo-controlled trial of cystoscopic detrusor injection of 200 U of Botox versus placebo, randomized in a 2:1 ratio, for women with incontinence caused by refractory idiopathic detrusor overactivity (FIGURE 2).
Although a sample size of 210 subjects was planned, enrollment was halted after 43 women received injections (28 with Botox, 15 with placebo). The reason: A higher-than-expected rate of urinary retention.
The trial had defined urinary retention as:
- use of catheterization for more than 4 weeks after the date of injection, or
- postvoid residual (PVR) urine of 200 mL or more at the 4-week visit. (The protocol mandated that a patient with this degree of retention be catheterized or that catheterization be considered by the clinician.)
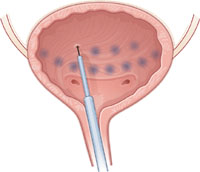
FIGURE 2 Botox relieves detrusor overactivity—but only temporarily
A trial intended to encompass 210 women was halted early because the rate of urinary retention was significantly higher than expected. Twenty-eight women underwent injection of 200 U of Botox, and almost half were classified as having urinary retention 4 weeks after the procedure.
Rate of urinary retention proved to be much higher than anticipated
At the time the study protocol was finalized, most existing studies had focused on patients with neurogenic detrusor overactivity incontinence, many of whom already had impaired bladder emptying treated with self-catheterization. Communication with clinicians using Botox off-label for idiopathic detrusor overactivity incontinence suggested that the occurrence of urinary retention requiring intervention was less than 5%. However, of the 28 women who received Botox, 12 experienced urinary retention; most of these women (9 of 12) had elevated PVR at 4 weeks after injection. Although this elevation was temporary, some women required catheterization for months.
Of the 43 women included in the trial, 12 (28%) experienced urinary retention. However, counting only subjects who received Botox, the proportion with retention was 12 of 28 (43%). None of the women who received placebo experienced urinary retention.
There was also a higher incidence of urinary tract infection in women who developed retention after Botox injection and performed self-catheterization.
Follow-up continues for all 43 subjects, as the protocol provided for monitoring up to 1 year after injection. A full report on the safety and effectiveness of Botox for idiopathic detrusor overactivity in this trial is pending (manuscript submitted for publication).
Catheterization may raise risk of infection without providing a benefit
Ideal management of women who experience elevated PVR after Botox injection is unclear. Many clinicians wonder whether treatment—i.e., catheterization—is necessary for the type of impaired bladder emptying that occurs after Botox injection. It is even possible that catheterization increases the risk of urinary tract infection (or colonization) without providing a benefit to balance that risk.
Botox may still be an option, provided the patient is counseled about risks
Our understanding, albeit incomplete, of the mechanism of action when Botox is used to treat detrusor overactivity does not suggest an increased risk of elevated intravesical pressure leading to ureteral reflux and kidney damage; in fact, normal bladder pressure has been observed in the few studies in which it was measured after Botox injection. However, until we have further information about the short- and long-term risks, if any, of elevated PVR after Botox injection, clinicians should counsel patients about this possibility before proceeding with off-label use of Botox for detrusor overactivity.
Patients unlikely to tolerate repeated Botox injection over several years
Whether or not Botox in its current form will prove to be a useful treatment for women who have detrusor overactivity incontinence remains to be proven conclusively. Even if Botox relieves symptoms, especially in women who have not obtained relief from other treatments, current evidence suggests that the effect is time-limited, probably on the order of several months—although occasional patients obtain relief of greater duration, suggesting an effect that lasts beyond direct Botox action.
Given that most women experience these symptoms on a chronic basis—perhaps especially those who are refractory to usual treatment—it seems unlikely that repeated injections at intervals of only several months can be sustained for years. Ideally, development of second-generation products and further research will produce longer-lasting effects without the need for repeated injections at regular intervals.
The author reports no financial relationships relevant to this article.
The past year has seen the publication of much useful evidence regarding urinary incontinence, from both epidemiologic studies and clinical trials. Research into the pathophysiology of incontinence continues to move forward, slowly but surely, measured not in breakthroughs but in gradually increasing knowledge of how the urethra and bladder function in the continent person and how that function can break down, leading to incontinence and other urinary symptoms.
Highlighted here are four notable studies from 2007, as well as progress notes on a trial mentioned early this year in Examining the Evidence (January issue).
New data clarify incidence and uncloak the effect of weight gain
Townsend MK, Danforth KN, Liffort KL, et al. Incidence and remission of urinary incontinence in middle-aged women. Am J Obstet Gynecol. 2007;197:167.e1–167.e5.
Townsend MK, Danforth KN, Liffort KL, et al. Body mass index, weight gain, and incident urinary incontinence in middle-aged women. Obstet Gynecol. 2007;110:346–353.
Studies of urinary incontinence in numerous populations have reported its prevalence—i.e., the percentage of people who have the condition at any point in time—but few have attempted to define its incidence—i.e., the rate at which it develops during a defined period.
Incidence is a true rate, described with a unit of time in the denominator. Prevalence is not a rate (although it is commonly referred to as such) and is described as a percentage only, without time in the denominator. With that distinction in mind, it is easy to see why prevalence data greatly outnumber incidence data: Prevalence can be obtained by means of cross-sectional study, with one-time collection of data. In contrast, incidence data require a population that is free of the condition of interest at baseline; that population is then followed to determine how many people who were initially free of the condition go on to develop it.
Lack of a standard definition makes it hard to measure incontinence
Reported prevalence can range from less than 10% to more than 90%, depending on how incontinence is defined:
- Very low prevalence is found when the definition is limited to persons with the greatest severity or frequency of symptoms
- at the other end of the spectrum, very high prevalence—even approaching 100%—can be found using a definition that includes people who have “ever” leaked urine.
The same issues complicate estimates of incidence. Because there is no consensus over what constitutes a clinically significant threshold for incontinence, investigators are forced to develop their own definitions.
In a pair of studies, Townsend and colleagues neatly circumvent this problem. Using data from the Nurses’ Health Study II, they used a series of definitions of incontinence, ranging from less severe to more severe, to describe their findings in ways that are easily transferred to clinical practice. They focused their attention on women aged 36 to 55 years to estimate the incidence of incontinence over a 2-year period. At baseline, women were considered at risk of incident incontinence if they reported never leaking or leaking only a few drops less than once a month. Three categories of incontinence were then defined, based on symptoms 2 years later:
- incident incontinence: any urine loss, defined as leaking 1–3 times a month
- frequent incontinence: urine loss at least once a week
- severe incontinence: urine loss at least once a week of sufficient volume to at least wet underwear.
Incidence rose with BMI, weight gain
In almost 34,000 continent women from 2001 to follow-up in 2003, the overall (average) incidence of urinary incontinence was 6.9 women for every 100 woman-years. Frequent incontinence developed in, on average, 1.8 women for every 100 woman-years; severe incontinence, in 0.6 women for every 100 woman-years.
Using multivariable logistic regression models, the authors analyzed the likelihood of incident incontinence by body mass index (BMI) and estimated weight gain from the age of 18 until 2001. For either variable, odds ratios (OR) showed a highly significant trend (P<.001) for an increased risk of incident incontinence.
For example, at a BMI greater than 35 kg/m2, the likelihood of:
- any incontinence increased by a factor of about 2 (OR, 2.11; 95% confidence interval [CI], 1.84–2.42)
- frequent incontinence increased by a factor of almost 4 (OR, 3.85; 95% CI, 3.05–4.85)
- severe incontinence increased by a factor of more than 5 (OR, 5.52; 95% CI, 3.72–8.18).
The trend for weight gain was similar, with a gain of more than 30 kg showing odds ratios and 95% confidence intervals of similar magnitude to those seen with a BMI greater than 35.
But one third of incontinent women improved after 2 years
Although urinary incontinence is usually understood as a chronic condition, albeit under the influence of other factors, such as weight gain, data on remission are even scarcer than data on incidence. Using the same dataset, the authors determined that almost 31,000 women were incontinent at baseline in 2001, with incontinence occurring at least monthly. Complete remission, defined as no leaking in 2003, occurred in almost 14% of women. One third reported improvement, defined as either complete remission or a decrease in leaking frequency from 2001 to 2003.
It’s interesting that complete remission was more common in younger women. It also was more common in women who experienced frequent incontinence than in those who reported occasional incontinence. The remaining percentage of women—almost 60%—reported a similar or increased frequency of incontinence over the 2 years of follow-up.
The authors did not collect data on treatment. Estimates of persistence, improvement, and remission could be affected, therefore, if women received effective treatment between 2001 and 2003. However, only about one third of women reported mentioning their symptoms to a physician, and only 13% reported receiving treatment for incontinence. The magnitude of the effect of treatment on remission or improvement of urinary incontinence symptoms therefore seems limited.
Women remain reticent about incontinence
Several points underline the clinical importance of these data, including the relatively high incidence of incontinence symptoms and the strong influence of BMI and weight gain on that incidence. Also notable, and described in previous studies, is the vast underreporting and undertreatment of incontinence in women—an observation that should motivate all clinicians to include screening for urinary incontinence as part of regular well-woman care. Clinicians should also be prepared to refer women with incontinence or to initiate evaluation and management.
Some reports have suggested that the stigma of urinary incontinence has diminished slightly in light of widespread direct-to-consumer advertising for products related to the care (e.g., pads) or treatment (e.g., pharmaceuticals) of incontinence. The data from Townsend and colleagues are relatively recent, yet the majority of women failed to report their symptoms, and an even higher percentage received no treatment. The authors recommend that health-care providers initiate a discussion of urinary symptoms even in middle-aged women, who may be targeted for screening less frequently than older women.
In fascial sling vs Burch, sling prevails but is linked to more adverse effects
Albo ME, Richter HE, Brubaker L, et al, for the Urinary Incontinence Treatment Network. Burch colposuspension versus fascial sling to reduce urinary stress incontinence. N Engl J Med. 2007;356:2143–2155; comment: 2198–2200.
Eagerly anticipated results of the Urinary Incontinence Treatment Network’s first surgical trial, which compared the fascial sling procedure with Burch colposuspension for stress incontinence, were published in May in the New England Journal of Medicine. The Urinary Incontinence Treatment Network is a multicenter clinical trials group that was established in 2000 and is sponsored by the National Institutes of Health (specifically, by the National Institute of Diabetes and Digestive and Kidney Diseases and the National Institute of Child Health and Human Development).
Women were eligible for the trial if they experienced symptoms of stress incontinence; symptoms of mixed incontinence were allowed as long as stress symptoms predominated. Of 655 women in the trial, 326 were randomly assigned to undergo placement of an autologous rectus fascia pubovaginal sling, and 329 were randomized to Burch colposuspension.
Overall success was defined as:
- negative pad test
- no urinary incontinence reported in a 3-day diary
- negative stress test to cough and Valsalva maneuver
- no self-reported symptoms of stress incontinence
- no retreatment for stress incontinence.
“Stress success,” or stress continence, was defined using the last three criteria.
At 2 years after the index surgery, 520 women (79%) were available for follow-up. Overall success and stress success were slightly higher in women who underwent sling placement than in those treated by Burch: overall success, 47% versus 38%, and stress success, 66% versus 49%, respectively. However, women who had slings experienced more adverse outcomes, including urinary tract infection, difficulty voiding, and postoperative urge incontinence.
Success rates were much lower than previously reported
These findings are particularly striking because the success rates are lower than in previous reports—and lower than the figures commonly used by surgeons to counsel women about likely results. “Success” for either procedure has been commonly quoted in the 80% to 90% range, not the 30% to 40% range found here. The authors are to be commended for the stringent definition of “success,” which included elements that invariably result in a lower success rate. It is these numbers that women are most interested in when they are considering this type of surgery.
The difference between sling and Burch procedures was particularly remarkable in regard to stress success (17 percentage points). The smaller difference seen for overall success (9 percentage points) can be attributed to the increase in postoperative urge incontinence among women undergoing the sling procedure.
If the other adverse events associated with the sling procedure (i.e., urinary tract infection and voiding difficulty) had been included in the composite measure of success, it seems possible, if not likely, that a smaller difference—or no difference at all—would have been seen between the sling and Burch groups.
Additional data still to come
Follow-up of women in this trial has been extended for up to 5 years and should provide much-needed information on longer-term results after these surgeries.
Transobturator mid-urethral sling linked to fewer complications
Sung VW, Schleinitz MD, Rardin CR, Ward RM, Myers DL. Comparison of retropubic versus transobturator approach to mid-urethral slings: a systematic review and meta-analysis. Am J Obstet Gynecol. 2007;197:3–11.
In this Update 1 year ago, I remarked on the need for more comparative information about the various mid-urethral slings currently on the market, particularly in regard to complications—information necessary to make recommendations and guide clinical decision-making.
Originally, the procedure for mid-urethral sling placement was modified from the retropubic approach to the obturator approach with the aim of reducing the risk of major bladder and urethral injury and vascular complications (FIGURE 1). Recent data suggest that that goal has been achieved. In a systematic review and meta-analysis of 17 studies that compared retropubic and transobturator approaches, Sung and colleagues found the transobturator route to be associated with fewer complications.
FIGURE 1 Transobturator approach lives up to promise
The retropubic approach (A) was modified to create the transobturator approach (B), with the aim of protecting the bladder, urethra, and vascular structures. A recent meta-analysis indicates that this goal was achieved.
Subjective and objective outcomes were similar for the two approaches
Overall, 492 women in six trials were randomly assigned to receive either a retropubic or transobturator mid-urethral sling for treatment of stress incontinence. Although some trials specified exactly which device was used, others did not. Follow-up ranged from 1 to 15 months.
Because the studies used different definitions of objective success as outcomes, it was not possible to obtain a pooled estimate for objective outcomes. However, the authors were able to calculate a pooled estimate for subjective outcomes by defining subjective success as a woman reporting either continence or improved status after surgery, and by defining failure as a woman reporting unchanged or deteriorating incontinence status.
The pooled odds ratio for subjective failure after transobturator placement of a mid-urethral sling was 0.85, compared with the retropubic approach (95% CI, 0.38–1.92). Results were relatively stable despite changes in definitions of success and failure and restriction to studies with more than 1 year of follow-up. Sung and colleagues concluded that evidence was insufficient to support one or the other approach in regard to subjective or objective outcomes.
Bladder perforation was most common complication
Findings regarding complications were more conclusive. Again drawing on data from six randomized trials, the authors estimated a pooled odds ratio for complications from transobturator placement of 0.40, compared with the retropubic approach (95% CI, 0.19–0.83). Using data from both randomized trials and cohort studies, the most common complications were:
- bladder perforation: 3.5% for retropubic placement, 0.2% for the transobturator route
- hematoma: 1.5% for retropubic placement, 0.08% for the transobturator route.
More definitive data are in the works
As noted here last year, the Urinary Incontinence Treatment Network is enrolling women with stress or stress-predominant mixed incontinence in a randomized trial to compare the retropubic and transobturator approaches for mid-urethral slings. With a sample size of 655 women and 2-year follow-up planned, this trial should be adequately powered to detect clinically important differences, if they exist, in both continence outcomes and complications. Enrollment is projected to close in 2008, with results to follow 2 years later.
Botox injection for detrusor overactivity is no quick fix after all
Interest continues to rise in treating detrusor overactivity—with or without incontinence—with botulinum toxin A. Only one commercial product is available in the United States, sold by Allergan under the trade name Botox. Last year, the Pelvic Floor Disorders Network, sponsored by the National Institute of Child Health and Human Development and the Office of Research in Women’s Health, began a placebo-controlled trial of cystoscopic detrusor injection of 200 U of Botox versus placebo, randomized in a 2:1 ratio, for women with incontinence caused by refractory idiopathic detrusor overactivity (FIGURE 2).
Although a sample size of 210 subjects was planned, enrollment was halted after 43 women received injections (28 with Botox, 15 with placebo). The reason: A higher-than-expected rate of urinary retention.
The trial had defined urinary retention as:
- use of catheterization for more than 4 weeks after the date of injection, or
- postvoid residual (PVR) urine of 200 mL or more at the 4-week visit. (The protocol mandated that a patient with this degree of retention be catheterized or that catheterization be considered by the clinician.)
FIGURE 2 Botox relieves detrusor overactivity—but only temporarily
A trial intended to encompass 210 women was halted early because the rate of urinary retention was significantly higher than expected. Twenty-eight women underwent injection of 200 U of Botox, and almost half were classified as having urinary retention 4 weeks after the procedure.
Rate of urinary retention proved to be much higher than anticipated
At the time the study protocol was finalized, most existing studies had focused on patients with neurogenic detrusor overactivity incontinence, many of whom already had impaired bladder emptying treated with self-catheterization. Communication with clinicians using Botox off-label for idiopathic detrusor overactivity incontinence suggested that the occurrence of urinary retention requiring intervention was less than 5%. However, of the 28 women who received Botox, 12 experienced urinary retention; most of these women (9 of 12) had elevated PVR at 4 weeks after injection. Although this elevation was temporary, some women required catheterization for months.
Of the 43 women included in the trial, 12 (28%) experienced urinary retention. However, counting only subjects who received Botox, the proportion with retention was 12 of 28 (43%). None of the women who received placebo experienced urinary retention.
There was also a higher incidence of urinary tract infection in women who developed retention after Botox injection and performed self-catheterization.
Follow-up continues for all 43 subjects, as the protocol provided for monitoring up to 1 year after injection. A full report on the safety and effectiveness of Botox for idiopathic detrusor overactivity in this trial is pending (manuscript submitted for publication).
Catheterization may raise risk of infection without providing a benefit
Ideal management of women who experience elevated PVR after Botox injection is unclear. Many clinicians wonder whether treatment—i.e., catheterization—is necessary for the type of impaired bladder emptying that occurs after Botox injection. It is even possible that catheterization increases the risk of urinary tract infection (or colonization) without providing a benefit to balance that risk.
Botox may still be an option, provided the patient is counseled about risks
Our understanding, albeit incomplete, of the mechanism of action when Botox is used to treat detrusor overactivity does not suggest an increased risk of elevated intravesical pressure leading to ureteral reflux and kidney damage; in fact, normal bladder pressure has been observed in the few studies in which it was measured after Botox injection. However, until we have further information about the short- and long-term risks, if any, of elevated PVR after Botox injection, clinicians should counsel patients about this possibility before proceeding with off-label use of Botox for detrusor overactivity.
Patients unlikely to tolerate repeated Botox injection over several years
Whether or not Botox in its current form will prove to be a useful treatment for women who have detrusor overactivity incontinence remains to be proven conclusively. Even if Botox relieves symptoms, especially in women who have not obtained relief from other treatments, current evidence suggests that the effect is time-limited, probably on the order of several months—although occasional patients obtain relief of greater duration, suggesting an effect that lasts beyond direct Botox action.
Given that most women experience these symptoms on a chronic basis—perhaps especially those who are refractory to usual treatment—it seems unlikely that repeated injections at intervals of only several months can be sustained for years. Ideally, development of second-generation products and further research will produce longer-lasting effects without the need for repeated injections at regular intervals.
How to manage an adnexal mass
The authors report no financial relationships relevant to this article.
CASE 1 Ovarian mass in a perimenopausal patient
A.R. is a 50-year-old gravida 3 para 3 who complains to her primary gynecologist of perimenopausal bleeding. A pelvic examination suggests an ovarian mass, and ultrasonography (US) reveals a myomatous uterus, thickened endometrium (34 mm), and a left ovarian cyst, with debris, that is 3.5×3.4×3.9 cm in size. The mass is thought to be a hemorrhagic cyst. Endometrial biopsy is benign.
Five weeks later, repeat US reveals that the mass has increased in size to 5.6×5.3×4.3 cm. It now appears complex in nature, with smooth walls and a single solid projection. The patient’s CA-125 level is 15 U/mL, which is in the normal range.
How should the mass be managed?
This scenario isn’t uncommon: Approximately one in every 10 women undergoes surgery for an adnexal mass, and an even higher percentage develop a mass that ultimately resolves or requires no surgery.1 Most of these lesions occur in women of reproductive age and are benign, often functional. The two groups at highest risk of malignancy are prepubescent and postmenopausal females.2,3 The rate of malignancy among prepubescent girls who have an adnexal mass is 35%; in postmenopausal women who have an adnexal mass, 30%.2,3
In this article, we describe how to evaluate and manage an adnexal mass in perimenopausal and postmenopausal women, as well as in the pregnant population, and outline the fundamentals of excision and surgical staging. Whenever possible, we base our observations on comprehensive guidelines and reliable data.
In the case just described, the increasing size of the mass and the complex appearance on follow-up imaging justify a surgical approach. Conservative management and definitive surgical treatment are the two treatment options for any adnexal mass.
Multipronged assessment is vital
Pelvic examination alone is insufficient to accurately assess ovarian size and internal characteristics of the mass, especially in postmenopausal and obese women.4 Nevertheless, the pelvic exam is a critical component of evaluation and often detects pathology. Pelvic examination also can assist in determining the best route of removal, depending on the mobility and size of the mass.
US yields the most information
US is the most effective tool for evaluating pelvic structures. It helps characterize masses and differentiates uterine, ovarian, and extraovarian tissues (FIGURE). If there is a high suspicion of malignancy, the next step is computed tomography (CT) to rule out metastatic disease.
US findings that suggest a malignant process are:
- solid component, not hyperechoic; usually nodular or papillary
- thick septations (2–3 mm)
- bilaterality
- positive flow to the solid component of the mass
- ascites.5
If a pregnant patient requires further evaluation for an adnexal mass, she should undergo magnetic resonance imaging (MRI) without contrast, not CT, to avoid radiation exposure. Although we lack studies of the safety of contrast agents in pregnant women, animal studies have demonstrated an increased rate of miscarriage, skeletal dysplasia, and visceral abnormalities with the use of contrast.6
FIGURE The complex nature of a mass comes to light via ultrasonography
This complex mass of the right ovary, seen from different vantage points in A and B, contains multiple cysts and septations. Minimal blood flow is apparent in C.
An incidental mass may not require immediate surgery
A small (<5 cm in diameter), simple, asymptomatic mass may be followed conservatively (TABLE).7 Follow-up consists of repeat US, beginning within 4 to 6 weeks after detection.
Any postmenopausal woman who has a complex mass identified by US should undergo CA-125 testing and surgical excision. A mass in a premenopausal woman should also be removed if it has these characteristics—provided the mass is not functional and the complexity does not arise from hemorrhage associated with ovulation.
A program at the University of Kentucky enrolled 15,106 women older than 50 years to undergo annual transvaginal US for ovarian cancer screening.8 Of these, 18% were given a diagnosis of unilocular ovarian cysts, with an initial mean diameter of 2.7 cm; 69.4% of the cysts resolved spontaneously. No woman with an isolated unilocular cystic ovarian tumor developed ovarian cancer during the 6.3-year follow-up; the risk of malignancy was less than 0.1% with a 95% confidence interval. It therefore appears safe to follow small simple cysts in women of any age.
TABLE
When an adnexal mass is detected, possibilities are many
| EXTRAOVARIAN |
| Ectopic |
| Pedunculated fibroid |
| Hydrosalpinx |
| Tubo-ovarian abscess or diverticular abscess |
| Inclusion cyst |
| Fallopian tube cancer |
| Appendicial tumor |
| Pelvic kidney |
| OVARIAN |
Simple
|
Complex
|
Metastatic
|
Malignant, borderline, or benign
|
| * Three percent of germ-cell ovarian neoplasms are malignant; the majority are mature teratomas.7 |
Medical therapy might facilitate regression of the mass
Conservative management might also include medical therapy. Follicular cysts are very common in menarchal and perimenopausal women, and a trial of hormones, in the form of an oral contraceptive (OC) for 4 to 6 weeks, is a common strategy to prevent new cysts by suppressing ovulation. Such a trial is appropriate only for a premenopausal woman who has a simple cyst, however. A complex mass should generally not be observed unless the complexity is thought to be the result of a physiologic process. Six weeks of OC use is long enough to cause physiologic cysts to regress and to reveal which patients should proceed to surgery.9
Surgical treatment, staging
A mass that is suspicious for malignancy should be removed as soon as possible. If frozen section histology confirms the diagnosis, total abdominal hysterectomy with bilateral salpingo-oophorectomy is appropriate. If the patient desires childbearing and the cancer is of low grade and confined to the ovary, unilateral oophorectomy with ipsilateral nodes and staging is appropriate.
Surgical staging of ovarian malignancy should be carried out by a gynecologic oncologist. It involves removal of all mullerian structures, bilateral pelvic and periaortic lymph node sampling, peritoneal biopsies, and cytology or biopsy of the diaphragm. If there is no evidence of gross tumor, comprehensive staging with peritoneal biopsies, lymph node dissection, and cytology of the diaphragm is crucial.
Pathologic findings may necessitate upstaging of the patient and indicate the need for chemotherapy. Approximately 20% of patients who appear to have stage I or II localized disease have occult dissemination within the abdomen.10
If there is gross disease within the abdomen, the goal of surgery is to remove it.
When should you refer?
According to guidelines from the American College of Obstetricians and Gynecologists and the Society of Gynecologic Oncologists, a postmenopausal woman with an adnexal mass should be referred to a gynecologic oncologist when she has one or more of the following:
- nodular or fixed mass
- elevated CA-125 level (>35 U/mL)
- ascites
- evidence of metastasis on imaging
- strong family history of breast or ovarian cancer.11
A premenopausal woman should be referred if she has an adnexal mass and one or more of the following:
- elevated CA-125 (>200 U/mL)
- evidence of metastatic disease
- ascites.
Referral may also be appropriate if there is a first-degree relative with breast or ovarian cancer.11
CASE 1 Resolved
After the patient is counseled about the likelihood of malignancy, she undergoes exploratory laparotomy with frozen section. The ovary ruptures, and analysis of a frozen section is consistent with mullerian adenocarcinoma.
She then undergoes total abdominal hysterectomy and bilateral salpingooophorectomy. Gynecologic oncology is consulted, and complete staging follows, including omentectomy, peritoneal biopsies, and pelvic and periaortic lymph node dissection. Pathology reveals stage IC poorly differentiated adenocarcinoma, endometrioid type. Combination chemotherapy with carboplatin and a taxane is recommended.
CASE 2 Elderly patient with a complex mass
P.W., an 86-year-old gravida 9 para 4043, has an incidental adnexal mass detected during CT imaging. The left ovarian mass is complex and 7 cm in diameter at its largest point. The CA-125 level is 23 U/mL, and the carcinoembryonic antigen level is 4.5 ng/mL—both within normal range. A colonoscopy—performed as routine screening, not as part of the workup for the mass—is normal.
Because the mass is complex, surgery is indicated, and the physician prefers the laparoscopic approach—but is it reasonable?
Tumor markers should not be drawn reflexively with every adnexal mass. Clinical findings and diagnostic imaging must be considered to minimize false-positive test results. Do not order tumor markers without performing a thorough clinical evaluation.
A tumor isn’t the only pathology that produces elevated CA-125
Malignant epithelial tumors produce an elevated CA-125 level in 80% of cases.14 However, any disease state that causes inflammation of peritoneal surfaces will also produce an elevated CA-125 level. A few examples of disease states that cause inflammation of mesothelium-derived tissue are endometriosis, pancreatitis, colitis, pericarditis, diverticulitis, and ascites.15
Women who have an adnexal mass identified by pelvic exam should undergo US imaging. If imaging suggests that the mass is anything other than a simple cyst or functional, CA-125 measurement should follow. If imaging does not suggest malignancy, repeat US is indicated within 4 to 6 weeks to assure that the mass is resolving or is not increasing in size. Some masses in a postmenopausal woman may be followed if they are simple, less than 4 cm, and associated with a normal CA-125 level.
What level is cause for concern?
The normal CA-125 level for a postmenopausal woman is less than 30 to 35 U/mL, depending on the laboratory used. For a premenopausal woman, a normal level falls below 200 U/mL.
Young females who have a low likelihood of epithelial cancer do not need to undergo CA-125 measurement. CA-125 assessment has low sensitivity (0.5) and specificity (0.5) for epithelial cancer in premenarchal girls.16 Pubescent and prepubescent females should undergo measurement of the appropriate tumor markers for germ-cell or sex-cord tumors. Germ-cell tumor markers include α-fetoprotein, lactate dehydrogenase, and human chorionic gonadotropin. The sex-cord tumor marker is inhibin.
In cases such as this, the decision is best left to the discretion of the surgeon. If the mass is mobile and small enough to fit into a bag (to prevent spillage if it ruptures), laparoscopic removal is appropriate. As in other settings, laparoscopy speeds recovery and shortens hospitalization.
Laparoscopic removal of an adnexal mass is technically similar to an open procedure. After washings are obtained and the ureter is identified, the infundibulopelvic ligament is ligated or cauterized. The broad ligament anterior to the ureter is separated from the peritoneum. The utero-ovarian ligament is then cauterized, as is the fallopian tube, and the specimen is placed in a sealed bag. The bag is then generally removed through a 10-mm port, and the specimen is sent for pathologic evaluation.
If frozen section analysis indicates that a mass is malignant, a gynecologic oncologist can stage the patient during the same procedure. This staging can be performed laparoscopically if it is technically feasible and if the surgeon feels comfortable using this approach. If it is not possible to stage the patient at the initial surgery, staging should occur within 6 weeks after the original diagnosis.
For a discussion of the advisability of laparoscopy in a pregnant patient, see below.
CASE 2 Resolved
The patient undergoes bilateral salpingo-oophorectomy via a laparoscopic approach. During the procedure, the left ovary is placed into an endoscopic specimen bag and drained to allow adequate removal through the abdominal port site; no rupture occurs. Frozen section is benign, and the final pathology report shows the mass to be a serous cystadenoma.
The pregnant patient
CASE 3 Suspicious mass with abnormal vascularity
B.E. is a 25-year-old gravida 2 para 1001 who has a pelvic mass identified during a 20-week anomaly scan. The mass involves the left ovary and is 7.1 cm in size, well circumscribed, and solid, with multiple cystic spaces and increased flow apparent on color Doppler imaging. The mass is characterized by a large degree of abnormal vascularity, and an experienced ultrasonographer describes it as “worrisome for malignancy.” MRI is performed, and the findings are consistent with those of ultrasonography but without evidence of malignant spread. Tumor markers are within normal limits, except for ß-human chorionic gonadotropin, which is elevated for the obvious reason.
Is surgery appropriate?
Gravidas develop pelvic masses at a significant rate, with a prevalence of approximately 2.3%, according to a study of 18,391 pregnant women who underwent US imaging at Washington University between 1988 and 1993.12 The majority of patients who had an adnexal mass—76%, or 320 women—had a simple cyst that was less than 5 cm in diameter and associated with no adverse events. The other 24%, or 102 women, had a mass larger than 5 cm, either simple or complex in nature. Most masses resolved spontaneously, and only 25 required surgical removal.12 No invasive carcinomas were found.
Despite the long odds of malignancy, an adnexal mass in pregnancy warrants close evaluation and follow-up and, occasionally, surgical management.
Fine-needle aspiration of an adnexal mass is rarely appropriate. In one study, 105 ovarian specimens were removed intact and the results of cyst cytology (from fine-needle aspiration) and final ovarian histology were compared.17 (Cytologic fluid was obtained by the pathologist after intact ovary removal—not preoperatively.) Histology revealed 89 benign ovarian tumors and 13 ovarian carcinomas. The sensitivity of fine-needle aspiration was 25%, with a specificity of 90%. The false-positive rate for fine-needle aspiration was 73%, and the false-negative rate was 12%.
Biopsy is risky
Malignant cystic lesions should be biopsied only in a patient who has advanced disease confirmed, or when it is necessary to check for recurrence, to avoid spreading malignant cells in localized tumors.18
General ObGyns and primary care physicians should not make the decision to biopsy an adnexal mass. The need for such a decision is grounds for referral. Nor does a patient require a diagnosis of cancer to be referred to a gynecologic oncologist. An oncologist may elect to biopsy a woman who is a poor surgical candidate, in whom chemotherapy may be first-line therapy in the neoadjuvant setting.
When is surgery justified?
Cholecystitis, appendicitis, and ovarian torsion are common diagnoses that require operative intervention regardless of gestational age.
Otherwise, when a complex adnexal mass is identified during pregnancy and is symptomatic or large enough to require removal, the gynecologist should proceed with surgery, whenever possible, in the second trimester—the most opportune time for removal. In some women, the ideal time for surgical removal of a mass detected during pregnancy is around 18 weeks’ gestation, but certainly before 24 weeks. Given the position of the gravid uterus, exploratory laparotomy is preferred over laparoscopy at this stage of gestation.
Intraoperative evaluation of the mass by pathology with frozen section is recommended. Even though immediate staging may not be feasible, owing to the pregnancy, pathology results can reassure the patient and her family and also facilitate planning of the optimal time and route of delivery.
If the mass is determined to be malignant, the patient should undergo surgical staging after completion of the pregnancy. At 37 weeks, labor should be induced, with staging performed within the next 2 to 4 weeks, or a cesarean section should be performed, with staging carried out at that time.
Laparoscopy may be feasible in the first trimester
Because laparoscopy can be difficult to perform during pregnancy, it should be used judiciously; uterine size can limit visibility and hinder safe placement of trocars. The first trimester is the least problematic period for laparoscopy.
A large study in Sweden compared laparoscopy with laparotomy between 4 and 20 weeks’ gestation and assessed fetal outcomes.13 In the study, 2,181 women underwent laparoscopy and 1,522 underwent laparotomy. Low birth weight (<2,500 g), intrauterine growth restriction, and delivery before 37 weeks’ gestation increased among all surgical patients, with no differences attributed to the route of the procedure. Nor were there significant differences between surgical and nonsurgical patients in either infant survival at 1 year or the incidence of fetal malformation.
As long as the anesthesiologist is aware of the pregnancy, a general surgeon can safely perform either laparoscopy or laparotomy during the first or second trimester. Care should be taken not to remove a corpus luteum before the 14th week of gestation. Pregnancy should not alter the surgeon’s preferred treatment approach at this time, unless uterine size is the limiting factor.
CASE 3 Resolved
B.E. safely undergoes exploratory laparotomy and left oophorectomy at 23-4/7 weeks’ gestation. Frozen section indicates that the mass is a malignant neoplasm. The final pathology report describes a highly unusual constellation of histologic findings, including juvenile granulosa cell tumor, dysgerminoma, and gonadoblastoma. A cesarean delivery with completion of cancer staging is planned when the fetus achieves lung maturity, with preservation of the contralateral ovary and uterus nodal sampling, peritoneal biopsies, and omentectomy.
Reference
1. Hilger WS, Margina JF, Magtibay PM. Laparoscopic management of the adnexal mass. Clin Obstet Gynecol. 2006;49:535-548.
2. Hoffman M. Differential diagnosis of the adnexal mass. UpToDate Online. Available at http://utdol.com. Accessed March 10, 2007.
3. Breen JL, Maxson WS. Ovarian tumors in children and adolescents. Clin Obstet Gynecol. 1977;20:607-623.
4. Van Nagell JR, Depriest PD. Management of adnexal masses in postmenopausal women. Am J Obstet Gynecol. 2005;193:30-35.
5. Brown D. Sonographic differentiation of benign versus malignant adnexal masses. UpToDate Online. Available at http://www.utdol.com. Accessed March 10, 2007.
6. ACOG Committee on Obstetric Practice. ACOG Committee Opinion. Number 299, September 2004 (replaces Number 158, September 1995). Guidelines for diagnostic imaging during pregnancy. Obstet Gynecol. 2004;104:647-651.
7. Berek J. Novak’s Gynecology. 13th ed. Philadelphia: Lippincott, Williams & Wilkins; 2002.
8. Modesitt SC, Pavlik EJ, Ueland FR, DePriest PD, Kryscio RJ, van Nagell JR. Risk of malignancy in unilocular ovarian cystic tumors less than 10 centimeters in diameter. Obstet Gynecol. 2003;102:594-599.
9. Spanos WJ. Preoperative hormonal therapy of cystic adnexal masses. Am J Obstet Gynecol. 1973;116:551-556.
10. Young RC, Fisher RI. The staging and treatment of epithelial ovarian cancer. Can Med Assoc J. 1978;119:249-256.
11. Gostout BS, Brewer MA. Guideline for referral of the patient with an adnexal mass. Clin Obstet Gynecol. 2006;49:448-458.
12. Bernhard LM, Klebba PK, Gray DL, Mutch DG. Predictors of persistence of adnexal masses in pregnancy. Obstet Gynecol. 1999;93:585-589.
13. Reddy MB, Kallen B, Kuehl TJ. Laparoscopy during pregnancy: a study of five fetal outcome parameters with use of the Swedish Health Registry. Am J Obstet Gynecol. 1997;177:673-679.
14. Silberstein LB, Rosenthal AN, Coppack SW, Noonan K, Jacobs IJ. Ascites and a raised serum CA-125—confusing combination. J R Soc Med. 2001;94:581-582.
15. Rosenthal AN, Menon U, Jacobs IJ. Screening for ovarian cancer. Clin Obstet Gynecol. 2006;49:443-447.
16. Stankovic Z, Djuricic S, Djukic M, Jovanovic D, Vasiljevic M. Epithelial ovarian tumors and CA125 in premenarchal girls. Eur J Gynaecol Oncol. 2006;27:597-599.
17. Higgins RV, Matkins JF, Marroum MC. Comparison of fine-needle aspiration cytologic findings of ovarian cysts with ovarian histologic findings. Am J Obstet Gynecol. 1999;180(3 Pt 1):550-553.
18. Zanetta G, Trio D, Lissoni A, et al. Early and short-term complications after US-guided puncture of gynecologic lesions: evaluation after 1,000 consecutive cases. Radiology. 1993;189:161-164.
The authors report no financial relationships relevant to this article.
CASE 1 Ovarian mass in a perimenopausal patient
A.R. is a 50-year-old gravida 3 para 3 who complains to her primary gynecologist of perimenopausal bleeding. A pelvic examination suggests an ovarian mass, and ultrasonography (US) reveals a myomatous uterus, thickened endometrium (34 mm), and a left ovarian cyst, with debris, that is 3.5×3.4×3.9 cm in size. The mass is thought to be a hemorrhagic cyst. Endometrial biopsy is benign.
Five weeks later, repeat US reveals that the mass has increased in size to 5.6×5.3×4.3 cm. It now appears complex in nature, with smooth walls and a single solid projection. The patient’s CA-125 level is 15 U/mL, which is in the normal range.
How should the mass be managed?
This scenario isn’t uncommon: Approximately one in every 10 women undergoes surgery for an adnexal mass, and an even higher percentage develop a mass that ultimately resolves or requires no surgery.1 Most of these lesions occur in women of reproductive age and are benign, often functional. The two groups at highest risk of malignancy are prepubescent and postmenopausal females.2,3 The rate of malignancy among prepubescent girls who have an adnexal mass is 35%; in postmenopausal women who have an adnexal mass, 30%.2,3
In this article, we describe how to evaluate and manage an adnexal mass in perimenopausal and postmenopausal women, as well as in the pregnant population, and outline the fundamentals of excision and surgical staging. Whenever possible, we base our observations on comprehensive guidelines and reliable data.
In the case just described, the increasing size of the mass and the complex appearance on follow-up imaging justify a surgical approach. Conservative management and definitive surgical treatment are the two treatment options for any adnexal mass.
Multipronged assessment is vital
Pelvic examination alone is insufficient to accurately assess ovarian size and internal characteristics of the mass, especially in postmenopausal and obese women.4 Nevertheless, the pelvic exam is a critical component of evaluation and often detects pathology. Pelvic examination also can assist in determining the best route of removal, depending on the mobility and size of the mass.
US yields the most information
US is the most effective tool for evaluating pelvic structures. It helps characterize masses and differentiates uterine, ovarian, and extraovarian tissues (FIGURE). If there is a high suspicion of malignancy, the next step is computed tomography (CT) to rule out metastatic disease.
US findings that suggest a malignant process are:
- solid component, not hyperechoic; usually nodular or papillary
- thick septations (2–3 mm)
- bilaterality
- positive flow to the solid component of the mass
- ascites.5
If a pregnant patient requires further evaluation for an adnexal mass, she should undergo magnetic resonance imaging (MRI) without contrast, not CT, to avoid radiation exposure. Although we lack studies of the safety of contrast agents in pregnant women, animal studies have demonstrated an increased rate of miscarriage, skeletal dysplasia, and visceral abnormalities with the use of contrast.6
FIGURE The complex nature of a mass comes to light via ultrasonography
This complex mass of the right ovary, seen from different vantage points in A and B, contains multiple cysts and septations. Minimal blood flow is apparent in C.
An incidental mass may not require immediate surgery
A small (<5 cm in diameter), simple, asymptomatic mass may be followed conservatively (TABLE).7 Follow-up consists of repeat US, beginning within 4 to 6 weeks after detection.
Any postmenopausal woman who has a complex mass identified by US should undergo CA-125 testing and surgical excision. A mass in a premenopausal woman should also be removed if it has these characteristics—provided the mass is not functional and the complexity does not arise from hemorrhage associated with ovulation.
A program at the University of Kentucky enrolled 15,106 women older than 50 years to undergo annual transvaginal US for ovarian cancer screening.8 Of these, 18% were given a diagnosis of unilocular ovarian cysts, with an initial mean diameter of 2.7 cm; 69.4% of the cysts resolved spontaneously. No woman with an isolated unilocular cystic ovarian tumor developed ovarian cancer during the 6.3-year follow-up; the risk of malignancy was less than 0.1% with a 95% confidence interval. It therefore appears safe to follow small simple cysts in women of any age.
TABLE
When an adnexal mass is detected, possibilities are many
| EXTRAOVARIAN |
| Ectopic |
| Pedunculated fibroid |
| Hydrosalpinx |
| Tubo-ovarian abscess or diverticular abscess |
| Inclusion cyst |
| Fallopian tube cancer |
| Appendicial tumor |
| Pelvic kidney |
| OVARIAN |
Simple
|
Complex
|
Metastatic
|
Malignant, borderline, or benign
|
| * Three percent of germ-cell ovarian neoplasms are malignant; the majority are mature teratomas.7 |
Medical therapy might facilitate regression of the mass
Conservative management might also include medical therapy. Follicular cysts are very common in menarchal and perimenopausal women, and a trial of hormones, in the form of an oral contraceptive (OC) for 4 to 6 weeks, is a common strategy to prevent new cysts by suppressing ovulation. Such a trial is appropriate only for a premenopausal woman who has a simple cyst, however. A complex mass should generally not be observed unless the complexity is thought to be the result of a physiologic process. Six weeks of OC use is long enough to cause physiologic cysts to regress and to reveal which patients should proceed to surgery.9
Surgical treatment, staging
A mass that is suspicious for malignancy should be removed as soon as possible. If frozen section histology confirms the diagnosis, total abdominal hysterectomy with bilateral salpingo-oophorectomy is appropriate. If the patient desires childbearing and the cancer is of low grade and confined to the ovary, unilateral oophorectomy with ipsilateral nodes and staging is appropriate.
Surgical staging of ovarian malignancy should be carried out by a gynecologic oncologist. It involves removal of all mullerian structures, bilateral pelvic and periaortic lymph node sampling, peritoneal biopsies, and cytology or biopsy of the diaphragm. If there is no evidence of gross tumor, comprehensive staging with peritoneal biopsies, lymph node dissection, and cytology of the diaphragm is crucial.
Pathologic findings may necessitate upstaging of the patient and indicate the need for chemotherapy. Approximately 20% of patients who appear to have stage I or II localized disease have occult dissemination within the abdomen.10
If there is gross disease within the abdomen, the goal of surgery is to remove it.
When should you refer?
According to guidelines from the American College of Obstetricians and Gynecologists and the Society of Gynecologic Oncologists, a postmenopausal woman with an adnexal mass should be referred to a gynecologic oncologist when she has one or more of the following:
- nodular or fixed mass
- elevated CA-125 level (>35 U/mL)
- ascites
- evidence of metastasis on imaging
- strong family history of breast or ovarian cancer.11
A premenopausal woman should be referred if she has an adnexal mass and one or more of the following:
- elevated CA-125 (>200 U/mL)
- evidence of metastatic disease
- ascites.
Referral may also be appropriate if there is a first-degree relative with breast or ovarian cancer.11
CASE 1 Resolved
After the patient is counseled about the likelihood of malignancy, she undergoes exploratory laparotomy with frozen section. The ovary ruptures, and analysis of a frozen section is consistent with mullerian adenocarcinoma.
She then undergoes total abdominal hysterectomy and bilateral salpingooophorectomy. Gynecologic oncology is consulted, and complete staging follows, including omentectomy, peritoneal biopsies, and pelvic and periaortic lymph node dissection. Pathology reveals stage IC poorly differentiated adenocarcinoma, endometrioid type. Combination chemotherapy with carboplatin and a taxane is recommended.
CASE 2 Elderly patient with a complex mass
P.W., an 86-year-old gravida 9 para 4043, has an incidental adnexal mass detected during CT imaging. The left ovarian mass is complex and 7 cm in diameter at its largest point. The CA-125 level is 23 U/mL, and the carcinoembryonic antigen level is 4.5 ng/mL—both within normal range. A colonoscopy—performed as routine screening, not as part of the workup for the mass—is normal.
Because the mass is complex, surgery is indicated, and the physician prefers the laparoscopic approach—but is it reasonable?
Tumor markers should not be drawn reflexively with every adnexal mass. Clinical findings and diagnostic imaging must be considered to minimize false-positive test results. Do not order tumor markers without performing a thorough clinical evaluation.
A tumor isn’t the only pathology that produces elevated CA-125
Malignant epithelial tumors produce an elevated CA-125 level in 80% of cases.14 However, any disease state that causes inflammation of peritoneal surfaces will also produce an elevated CA-125 level. A few examples of disease states that cause inflammation of mesothelium-derived tissue are endometriosis, pancreatitis, colitis, pericarditis, diverticulitis, and ascites.15
Women who have an adnexal mass identified by pelvic exam should undergo US imaging. If imaging suggests that the mass is anything other than a simple cyst or functional, CA-125 measurement should follow. If imaging does not suggest malignancy, repeat US is indicated within 4 to 6 weeks to assure that the mass is resolving or is not increasing in size. Some masses in a postmenopausal woman may be followed if they are simple, less than 4 cm, and associated with a normal CA-125 level.
What level is cause for concern?
The normal CA-125 level for a postmenopausal woman is less than 30 to 35 U/mL, depending on the laboratory used. For a premenopausal woman, a normal level falls below 200 U/mL.
Young females who have a low likelihood of epithelial cancer do not need to undergo CA-125 measurement. CA-125 assessment has low sensitivity (0.5) and specificity (0.5) for epithelial cancer in premenarchal girls.16 Pubescent and prepubescent females should undergo measurement of the appropriate tumor markers for germ-cell or sex-cord tumors. Germ-cell tumor markers include α-fetoprotein, lactate dehydrogenase, and human chorionic gonadotropin. The sex-cord tumor marker is inhibin.
In cases such as this, the decision is best left to the discretion of the surgeon. If the mass is mobile and small enough to fit into a bag (to prevent spillage if it ruptures), laparoscopic removal is appropriate. As in other settings, laparoscopy speeds recovery and shortens hospitalization.
Laparoscopic removal of an adnexal mass is technically similar to an open procedure. After washings are obtained and the ureter is identified, the infundibulopelvic ligament is ligated or cauterized. The broad ligament anterior to the ureter is separated from the peritoneum. The utero-ovarian ligament is then cauterized, as is the fallopian tube, and the specimen is placed in a sealed bag. The bag is then generally removed through a 10-mm port, and the specimen is sent for pathologic evaluation.
If frozen section analysis indicates that a mass is malignant, a gynecologic oncologist can stage the patient during the same procedure. This staging can be performed laparoscopically if it is technically feasible and if the surgeon feels comfortable using this approach. If it is not possible to stage the patient at the initial surgery, staging should occur within 6 weeks after the original diagnosis.
For a discussion of the advisability of laparoscopy in a pregnant patient, see below.
CASE 2 Resolved
The patient undergoes bilateral salpingo-oophorectomy via a laparoscopic approach. During the procedure, the left ovary is placed into an endoscopic specimen bag and drained to allow adequate removal through the abdominal port site; no rupture occurs. Frozen section is benign, and the final pathology report shows the mass to be a serous cystadenoma.
The pregnant patient
CASE 3 Suspicious mass with abnormal vascularity
B.E. is a 25-year-old gravida 2 para 1001 who has a pelvic mass identified during a 20-week anomaly scan. The mass involves the left ovary and is 7.1 cm in size, well circumscribed, and solid, with multiple cystic spaces and increased flow apparent on color Doppler imaging. The mass is characterized by a large degree of abnormal vascularity, and an experienced ultrasonographer describes it as “worrisome for malignancy.” MRI is performed, and the findings are consistent with those of ultrasonography but without evidence of malignant spread. Tumor markers are within normal limits, except for ß-human chorionic gonadotropin, which is elevated for the obvious reason.
Is surgery appropriate?
Gravidas develop pelvic masses at a significant rate, with a prevalence of approximately 2.3%, according to a study of 18,391 pregnant women who underwent US imaging at Washington University between 1988 and 1993.12 The majority of patients who had an adnexal mass—76%, or 320 women—had a simple cyst that was less than 5 cm in diameter and associated with no adverse events. The other 24%, or 102 women, had a mass larger than 5 cm, either simple or complex in nature. Most masses resolved spontaneously, and only 25 required surgical removal.12 No invasive carcinomas were found.
Despite the long odds of malignancy, an adnexal mass in pregnancy warrants close evaluation and follow-up and, occasionally, surgical management.
Fine-needle aspiration of an adnexal mass is rarely appropriate. In one study, 105 ovarian specimens were removed intact and the results of cyst cytology (from fine-needle aspiration) and final ovarian histology were compared.17 (Cytologic fluid was obtained by the pathologist after intact ovary removal—not preoperatively.) Histology revealed 89 benign ovarian tumors and 13 ovarian carcinomas. The sensitivity of fine-needle aspiration was 25%, with a specificity of 90%. The false-positive rate for fine-needle aspiration was 73%, and the false-negative rate was 12%.
Biopsy is risky
Malignant cystic lesions should be biopsied only in a patient who has advanced disease confirmed, or when it is necessary to check for recurrence, to avoid spreading malignant cells in localized tumors.18
General ObGyns and primary care physicians should not make the decision to biopsy an adnexal mass. The need for such a decision is grounds for referral. Nor does a patient require a diagnosis of cancer to be referred to a gynecologic oncologist. An oncologist may elect to biopsy a woman who is a poor surgical candidate, in whom chemotherapy may be first-line therapy in the neoadjuvant setting.
When is surgery justified?
Cholecystitis, appendicitis, and ovarian torsion are common diagnoses that require operative intervention regardless of gestational age.
Otherwise, when a complex adnexal mass is identified during pregnancy and is symptomatic or large enough to require removal, the gynecologist should proceed with surgery, whenever possible, in the second trimester—the most opportune time for removal. In some women, the ideal time for surgical removal of a mass detected during pregnancy is around 18 weeks’ gestation, but certainly before 24 weeks. Given the position of the gravid uterus, exploratory laparotomy is preferred over laparoscopy at this stage of gestation.
Intraoperative evaluation of the mass by pathology with frozen section is recommended. Even though immediate staging may not be feasible, owing to the pregnancy, pathology results can reassure the patient and her family and also facilitate planning of the optimal time and route of delivery.
If the mass is determined to be malignant, the patient should undergo surgical staging after completion of the pregnancy. At 37 weeks, labor should be induced, with staging performed within the next 2 to 4 weeks, or a cesarean section should be performed, with staging carried out at that time.
Laparoscopy may be feasible in the first trimester
Because laparoscopy can be difficult to perform during pregnancy, it should be used judiciously; uterine size can limit visibility and hinder safe placement of trocars. The first trimester is the least problematic period for laparoscopy.
A large study in Sweden compared laparoscopy with laparotomy between 4 and 20 weeks’ gestation and assessed fetal outcomes.13 In the study, 2,181 women underwent laparoscopy and 1,522 underwent laparotomy. Low birth weight (<2,500 g), intrauterine growth restriction, and delivery before 37 weeks’ gestation increased among all surgical patients, with no differences attributed to the route of the procedure. Nor were there significant differences between surgical and nonsurgical patients in either infant survival at 1 year or the incidence of fetal malformation.
As long as the anesthesiologist is aware of the pregnancy, a general surgeon can safely perform either laparoscopy or laparotomy during the first or second trimester. Care should be taken not to remove a corpus luteum before the 14th week of gestation. Pregnancy should not alter the surgeon’s preferred treatment approach at this time, unless uterine size is the limiting factor.
CASE 3 Resolved
B.E. safely undergoes exploratory laparotomy and left oophorectomy at 23-4/7 weeks’ gestation. Frozen section indicates that the mass is a malignant neoplasm. The final pathology report describes a highly unusual constellation of histologic findings, including juvenile granulosa cell tumor, dysgerminoma, and gonadoblastoma. A cesarean delivery with completion of cancer staging is planned when the fetus achieves lung maturity, with preservation of the contralateral ovary and uterus nodal sampling, peritoneal biopsies, and omentectomy.
Reference
1. Hilger WS, Margina JF, Magtibay PM. Laparoscopic management of the adnexal mass. Clin Obstet Gynecol. 2006;49:535-548.
2. Hoffman M. Differential diagnosis of the adnexal mass. UpToDate Online. Available at http://utdol.com. Accessed March 10, 2007.
3. Breen JL, Maxson WS. Ovarian tumors in children and adolescents. Clin Obstet Gynecol. 1977;20:607-623.
4. Van Nagell JR, Depriest PD. Management of adnexal masses in postmenopausal women. Am J Obstet Gynecol. 2005;193:30-35.
5. Brown D. Sonographic differentiation of benign versus malignant adnexal masses. UpToDate Online. Available at http://www.utdol.com. Accessed March 10, 2007.
6. ACOG Committee on Obstetric Practice. ACOG Committee Opinion. Number 299, September 2004 (replaces Number 158, September 1995). Guidelines for diagnostic imaging during pregnancy. Obstet Gynecol. 2004;104:647-651.
7. Berek J. Novak’s Gynecology. 13th ed. Philadelphia: Lippincott, Williams & Wilkins; 2002.
8. Modesitt SC, Pavlik EJ, Ueland FR, DePriest PD, Kryscio RJ, van Nagell JR. Risk of malignancy in unilocular ovarian cystic tumors less than 10 centimeters in diameter. Obstet Gynecol. 2003;102:594-599.
9. Spanos WJ. Preoperative hormonal therapy of cystic adnexal masses. Am J Obstet Gynecol. 1973;116:551-556.
10. Young RC, Fisher RI. The staging and treatment of epithelial ovarian cancer. Can Med Assoc J. 1978;119:249-256.
11. Gostout BS, Brewer MA. Guideline for referral of the patient with an adnexal mass. Clin Obstet Gynecol. 2006;49:448-458.
12. Bernhard LM, Klebba PK, Gray DL, Mutch DG. Predictors of persistence of adnexal masses in pregnancy. Obstet Gynecol. 1999;93:585-589.
13. Reddy MB, Kallen B, Kuehl TJ. Laparoscopy during pregnancy: a study of five fetal outcome parameters with use of the Swedish Health Registry. Am J Obstet Gynecol. 1997;177:673-679.
14. Silberstein LB, Rosenthal AN, Coppack SW, Noonan K, Jacobs IJ. Ascites and a raised serum CA-125—confusing combination. J R Soc Med. 2001;94:581-582.
15. Rosenthal AN, Menon U, Jacobs IJ. Screening for ovarian cancer. Clin Obstet Gynecol. 2006;49:443-447.
16. Stankovic Z, Djuricic S, Djukic M, Jovanovic D, Vasiljevic M. Epithelial ovarian tumors and CA125 in premenarchal girls. Eur J Gynaecol Oncol. 2006;27:597-599.
17. Higgins RV, Matkins JF, Marroum MC. Comparison of fine-needle aspiration cytologic findings of ovarian cysts with ovarian histologic findings. Am J Obstet Gynecol. 1999;180(3 Pt 1):550-553.
18. Zanetta G, Trio D, Lissoni A, et al. Early and short-term complications after US-guided puncture of gynecologic lesions: evaluation after 1,000 consecutive cases. Radiology. 1993;189:161-164.