User login
Comprehensive Genomic Profiles of Melanoma in Veterans Compared to Reference Databases
Comprehensive Genomic Profiles of Melanoma in Veterans Compared to Reference Databases
The veteran population, with its unique and diverse types of exposure and military service experiences, faces distinct health factors compared with the general population. These factors can be categorized into exposures during military service and those occurring postservice. While the latter phase incorporates psychological issues that may arise while transitioning to civilian life, the service period is associated with major physical, chemical, and psychological exposures that can impact veterans’ health. Carcinogenesis related to military exposures is concerning, and different types of malignancies have been associated with military exposures.1 The 2022 introduction of the Cancer Moonshot initiative served as a breeding ground for multiple projects aimed at investigation of exposure-related carcinogenesis, prompting increased attention and efforts to linking specific exposures to specific malignancies.2
Melanoma is the deadliest skin cancer, accounting for 1.3% of all cancer deaths.3 Although it may only account for 1% to 5% of skin cancer diagnoses, its incidence in the United States’ population has been increasing.4,5 There were 97,610 estimated new cases of melanoma in 2023, according to the National Cancer Institute.6
The incidence of melanoma may be higher in the military population compared with the general population.7 Melanoma is the fourth-most common cancer diagnosed in veterans.8
Several demographic characteristics of the US military population are associated with higher melanoma incidence and poorer prognosis, including male sex, older age, and White race. Apart from sun exposure—a known risk factor for melanoma development—other factors, such as service branch, seem to contribute to risk, with the highest melanoma rates noted in the Air Force.9 According to a study by Chang et al, veterans have a higher risk of stage III (18%) or stage IV (13%) melanoma at initial diagnosis.8
Molecular testing of metastatic melanoma is currently the standard of care for guiding the use of US Food and Drug Administration-approved targeted therapies such as BRAF, MEK, and KIT inhibitors. This comparative analysis details the melanoma comprehensive genomic profiles observed at a large US Department of Veterans Affairs (VA) medical center (VAMC) and those reported in reference databases.
Methods
A query to select all metastatic melanomas sent for comprehensive genomic profiling from the Kansas City VAMC (KCVAMC), identified 35 cases from 2019 through 2023 as the study population. The health records of these patients were reviewed to collect demographic information, military service history, melanoma history, other medical, social, and family histories. The comprehensive genomic profiling reports were reviewed to collect the reported pathogenic variants, microsatellite instability (MSI) status, and tumor mutational burden (TMB) for each case.
The Catalogue of Somatic Mutations in Cancer (COSMIC) was used to identify the most commonly mutated genes in melanomas from The Cancer Genome Atlas for the general population.4,5 The literature was consulted to determine the MSI status and TMB in melanomas from The Cancer Genome Atlas for separate reference populations.6,7 The frequency of MSI-high (MSI-H) status, TMB ≥ 10 mutations/megabase (mut/Mb), and mutations in each of the 20 most commonly mutated genes was determined and compared between melanomas from The Cancer Genome Atlas and KCVAMC cases. Corresponding P values were calculated to identify significant differences. Values were calculated for the entire sample as well as a subgroup with Agent Orange (AO) exposure. The study was approved by the KCVAMC Institutional Review Board.
Results
The mean (SD) age of study participants was 72.9 (9.4) years (range, 39-90 years). The mean (SD) duration of military service was 1654 (1421) days (about 4 years, 6 months, and 10 days). Of the 35 patients included, 22 (63%) served during the Vietnam era (November 1, 1965, to April 30, 1975) and 2 (6%) served during the Persian Gulf War era (August 2, 1990, to February 28, 1991). Seventeen veterans (49%) served in the Army, 9 in the Navy (26%), 5 in the Air Force (14%), and 4 in the Marine Corps (11%). Definitive AO exposure was noted in 13 patients (37%) (Table 1).
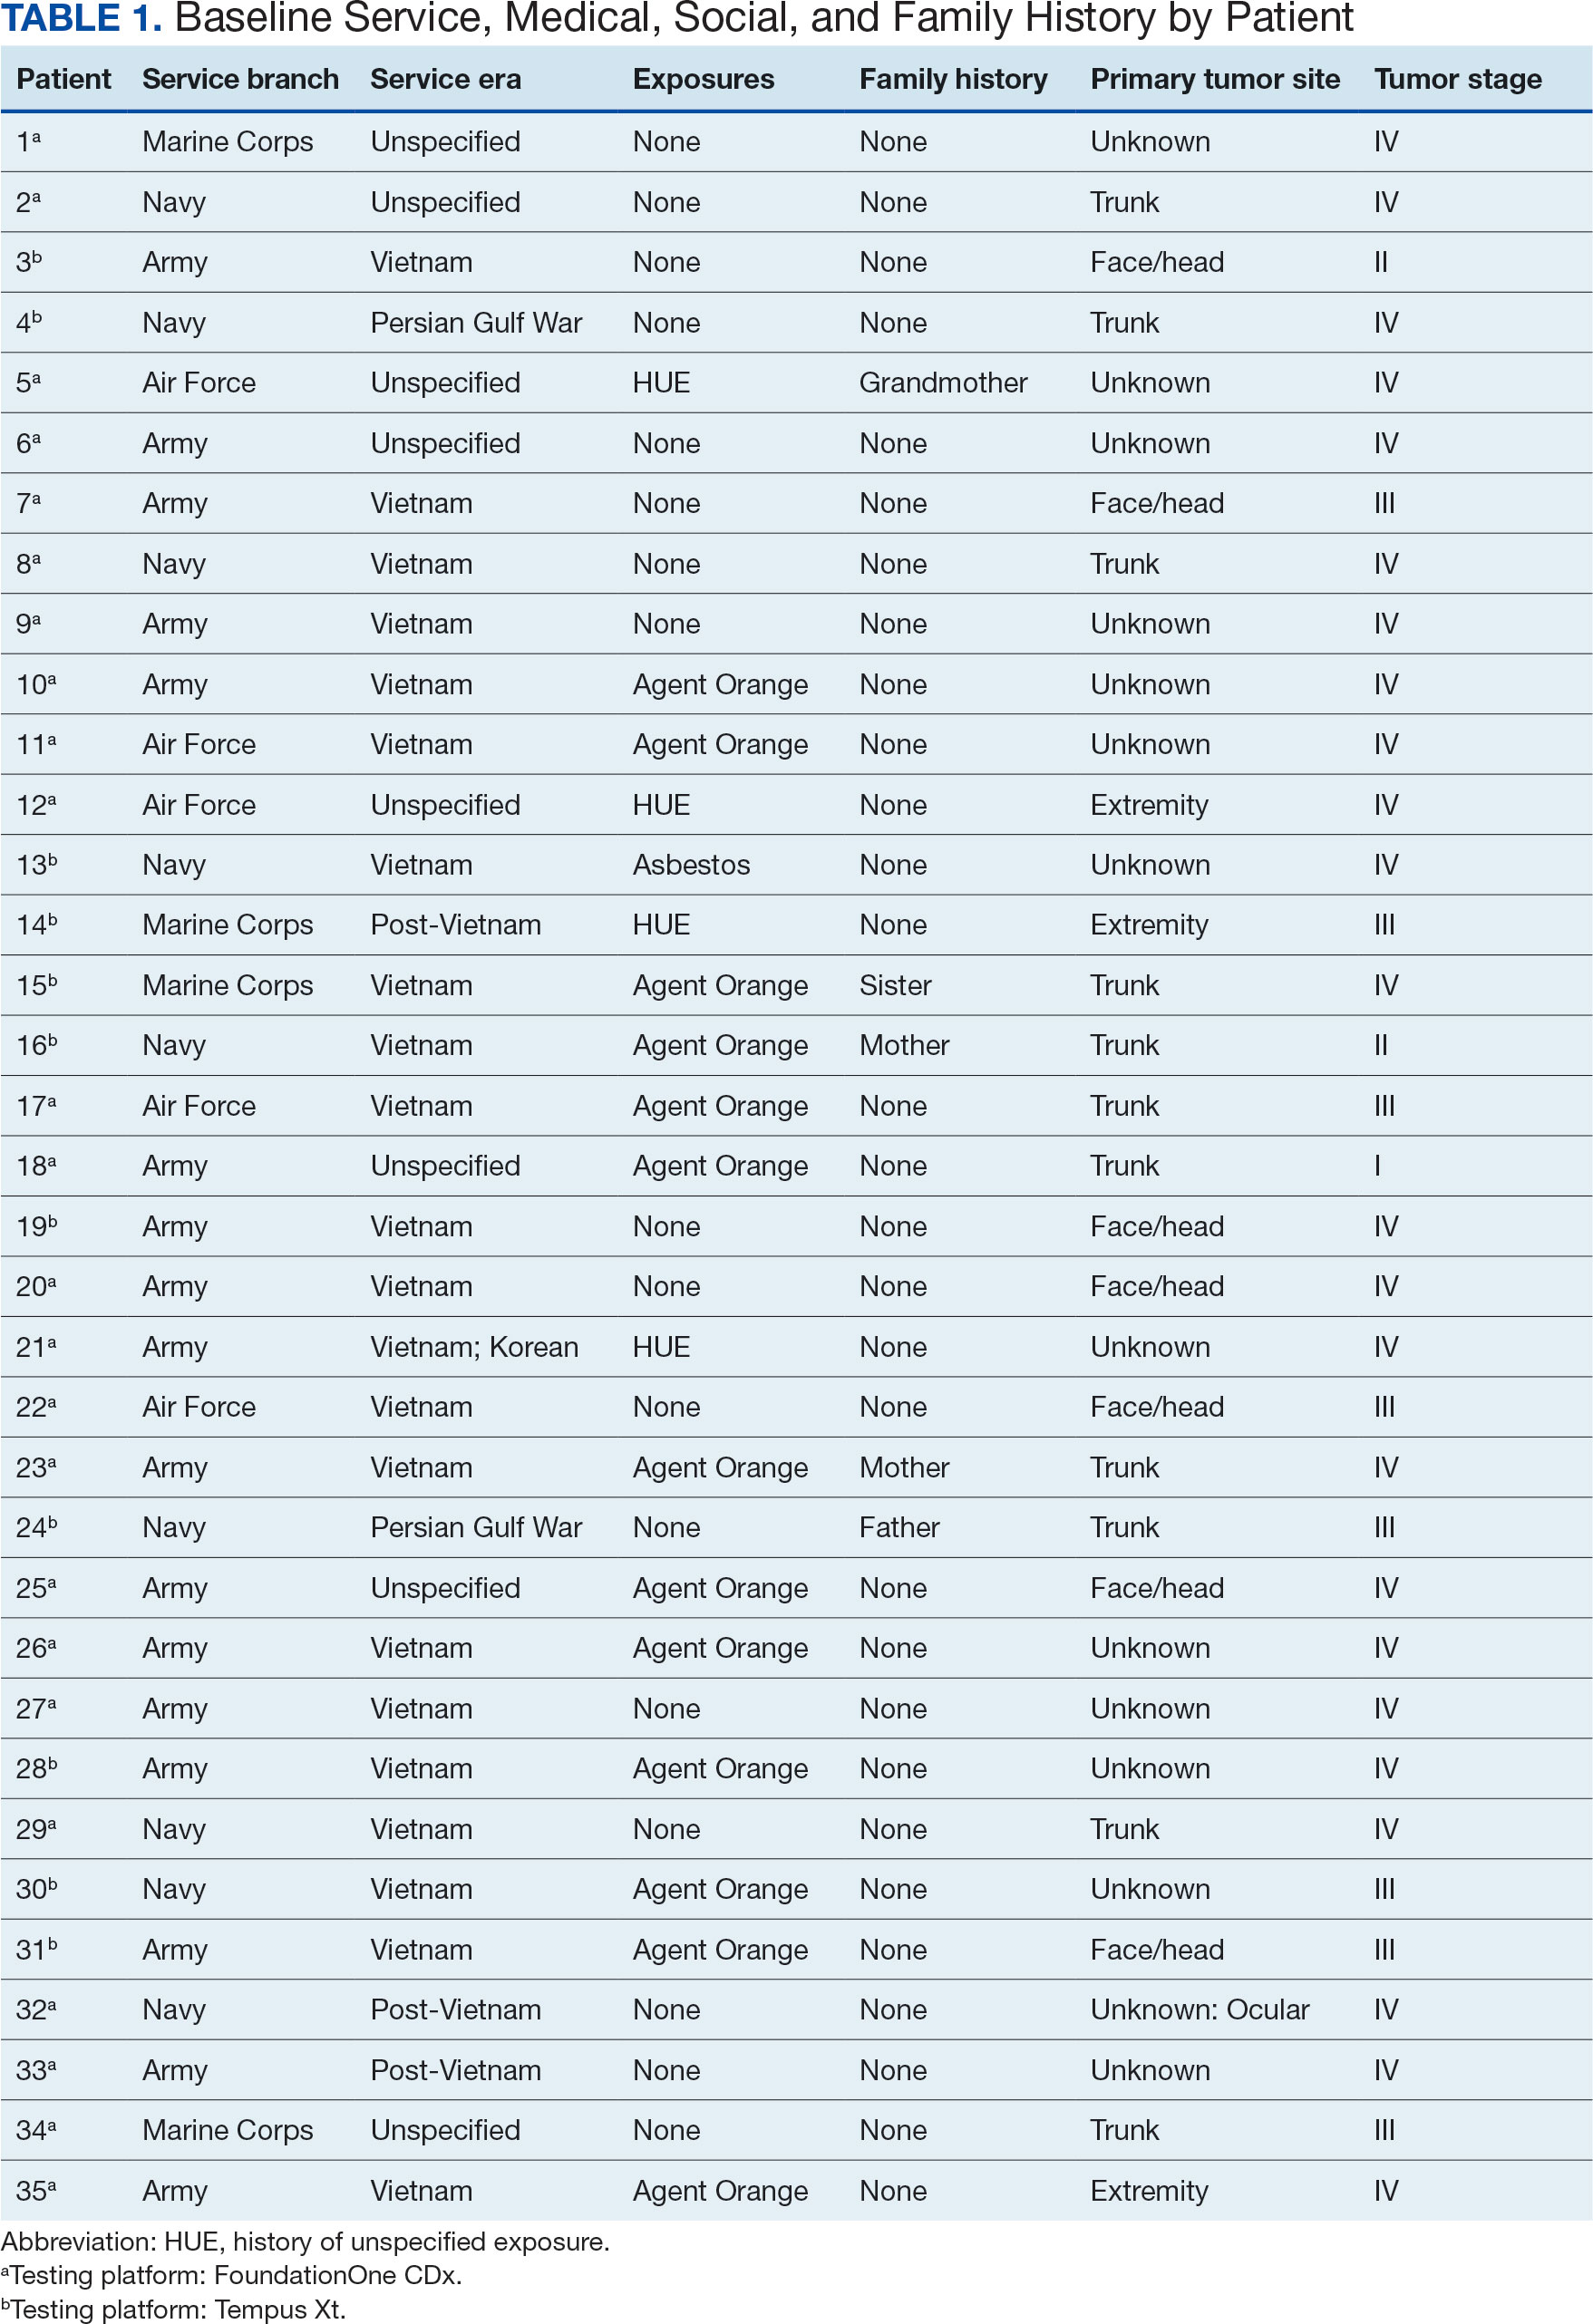
Of the 35 patients, 24 (69%) had metastatic disease and the primary site of melanoma was unknown in 14 patients (40%). One patient (Patient 32) had an intraocular melanoma. The primary site was the trunk for 11 patients (31%), the face/head for 7 patients (20%) and extremities for 3 patients (9%). Eight patients (23%) were pT3 stage (thickness > 2 mm but < 4 mm), 7 patients (20%) were pT4 stage (thickness > 4 mm), and 5 patients (14%) were pT1 (thickness ≥ 1 mm). One patient had a primary lesion at pT2 stage, and 1 had a Tis stage lesion. Three patients (9%) had a family history of melanoma in a first-degree relative.
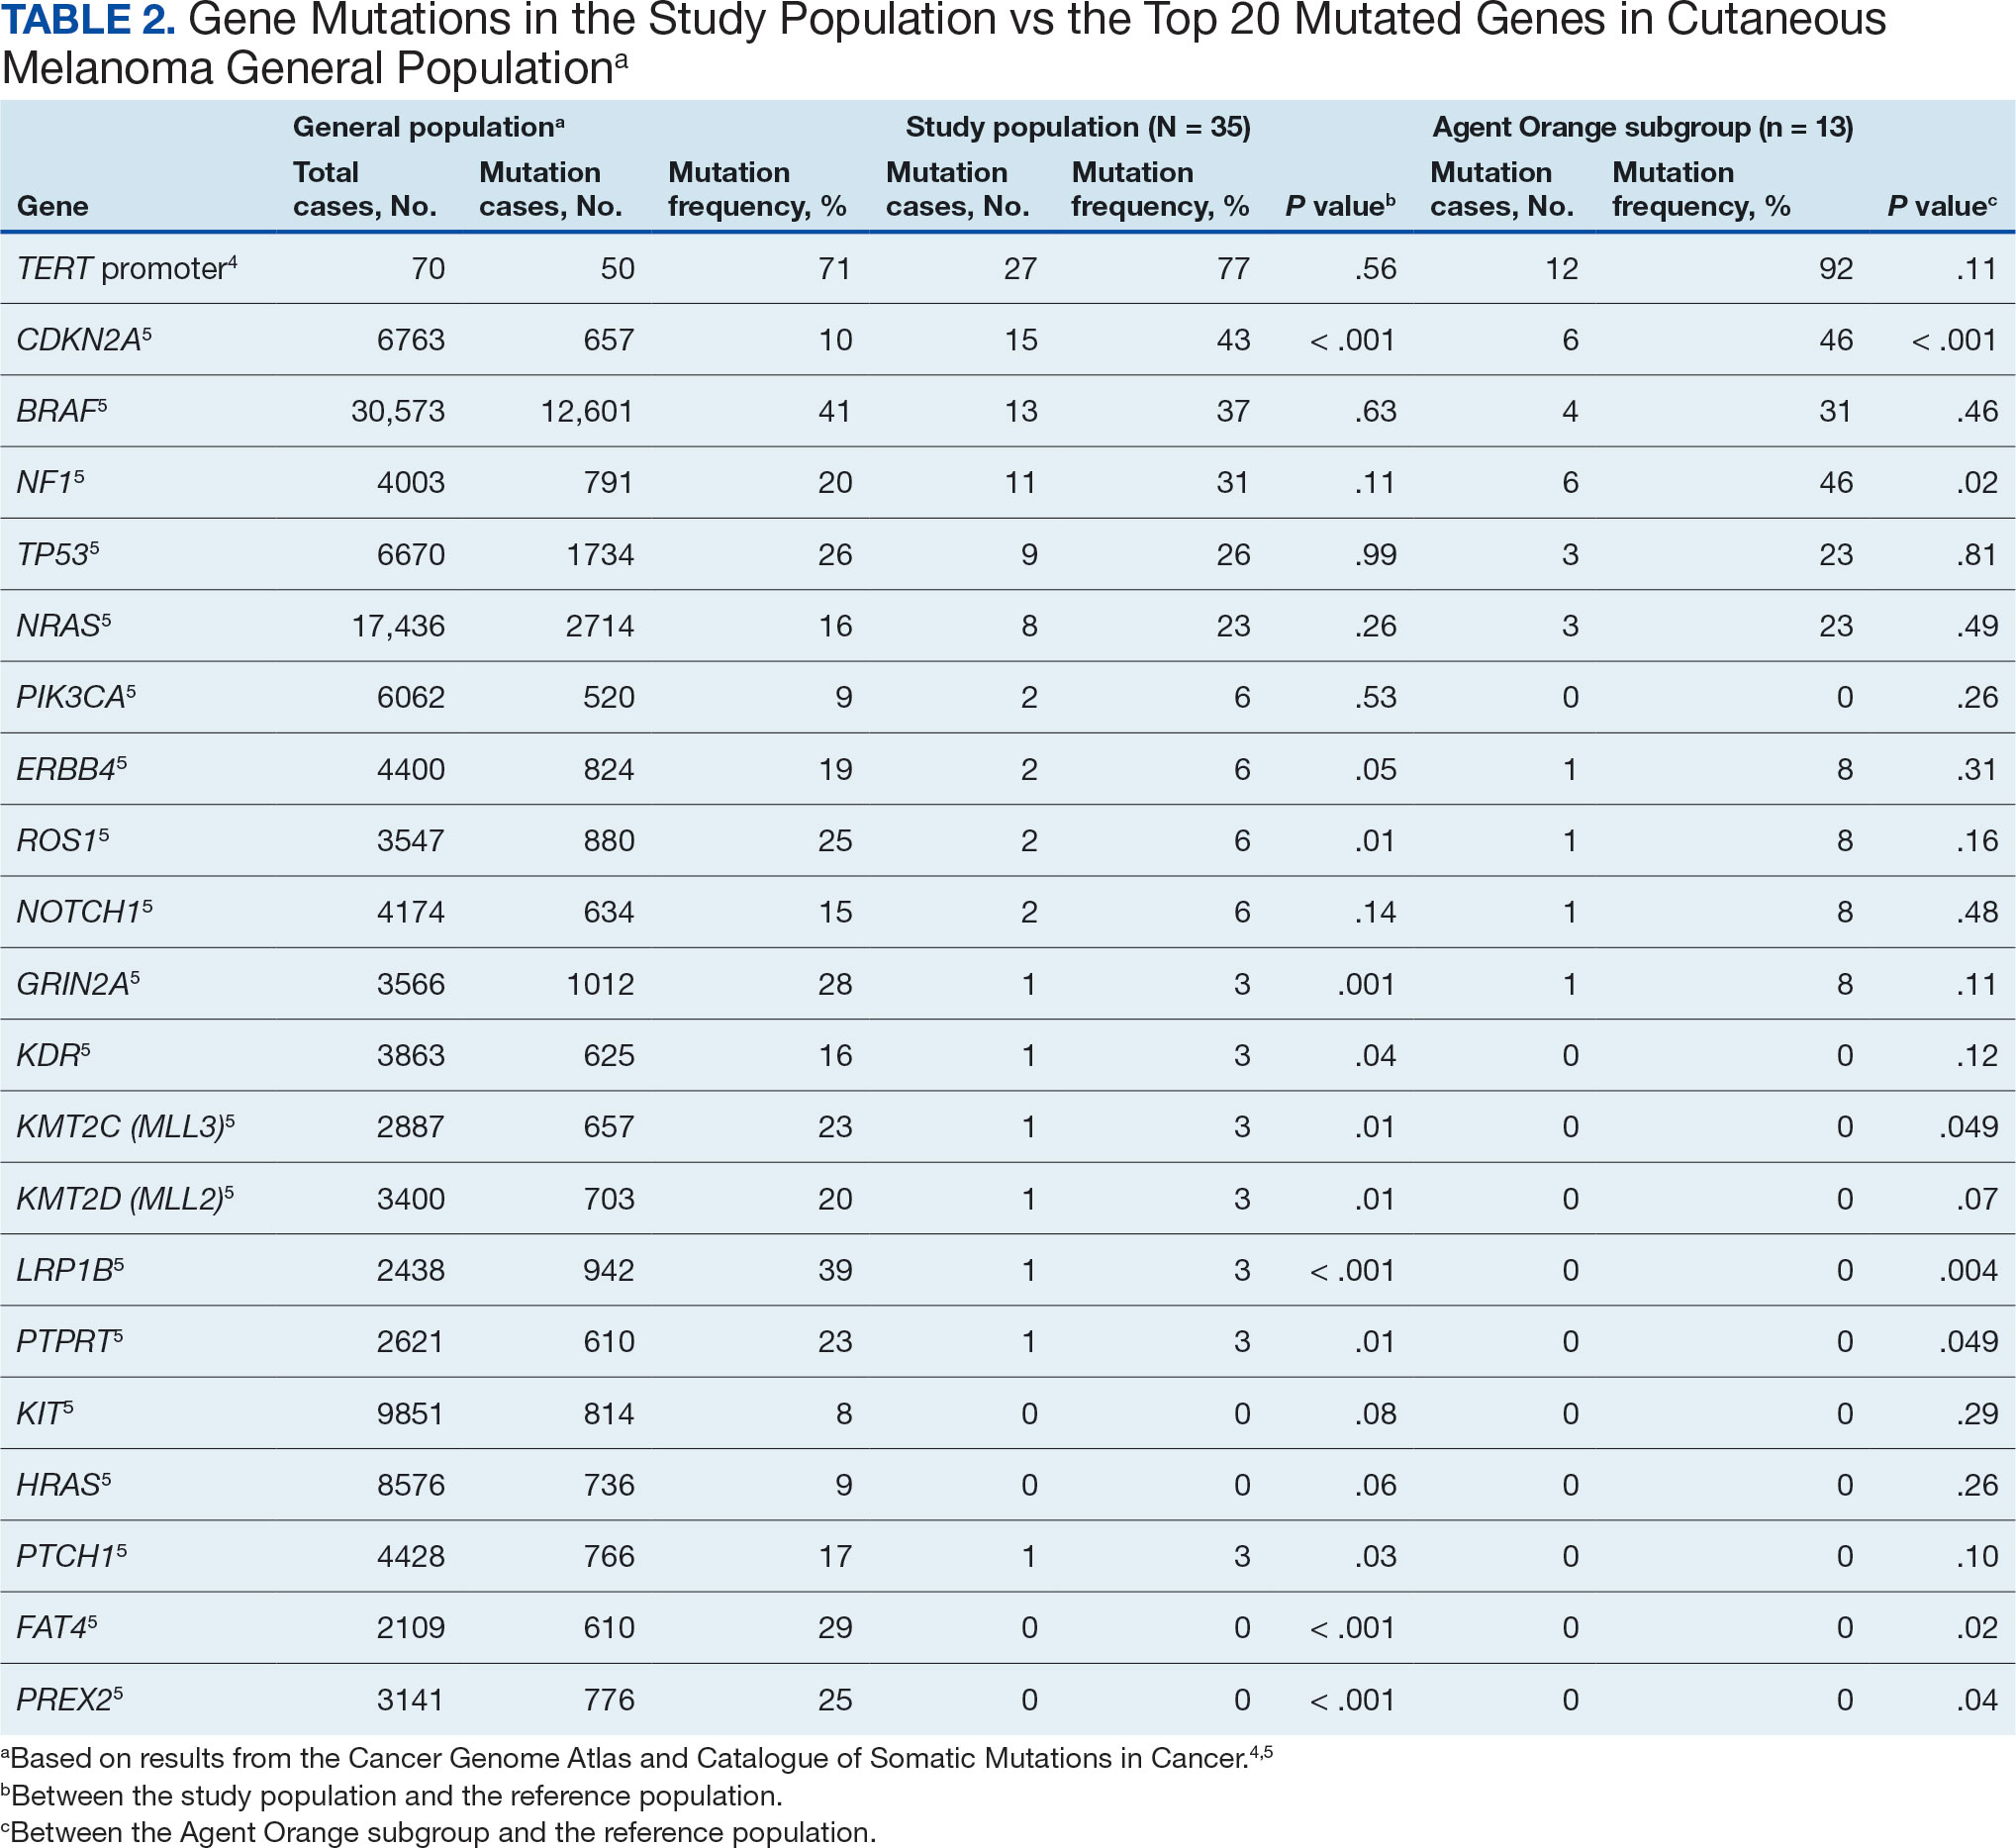
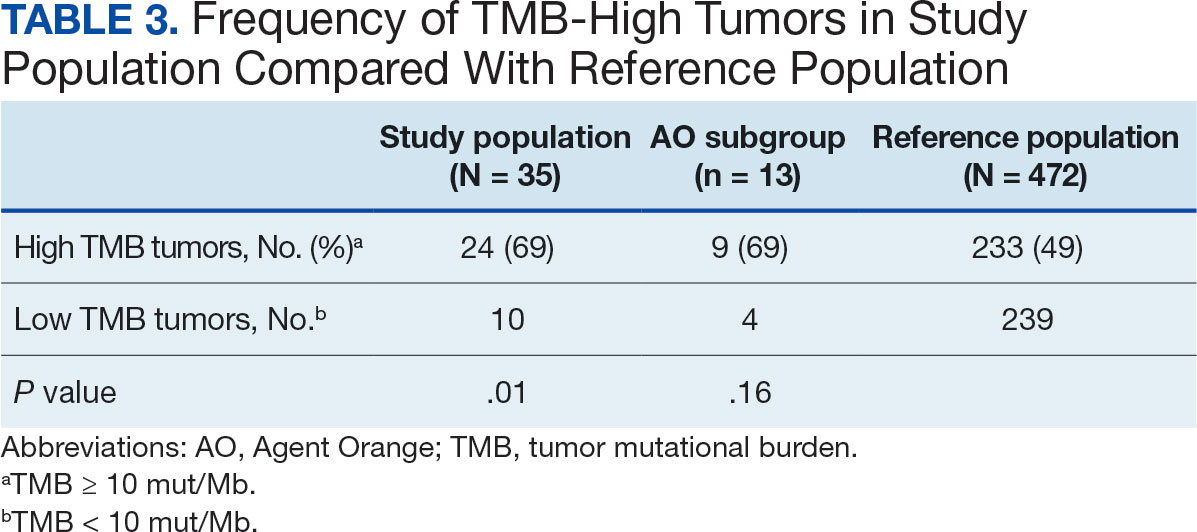
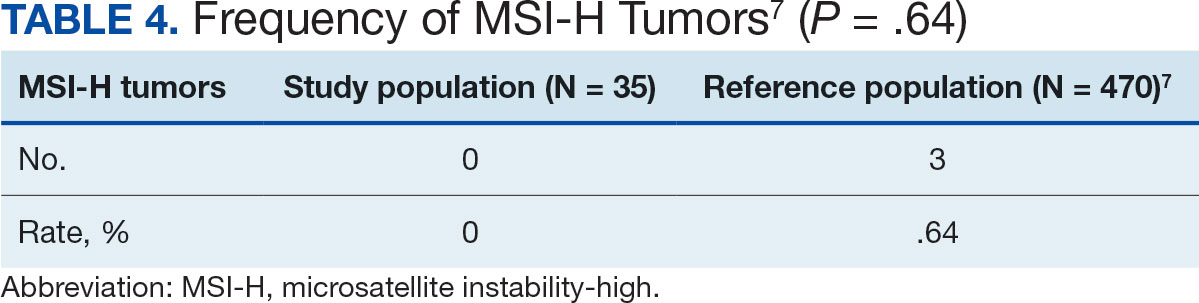
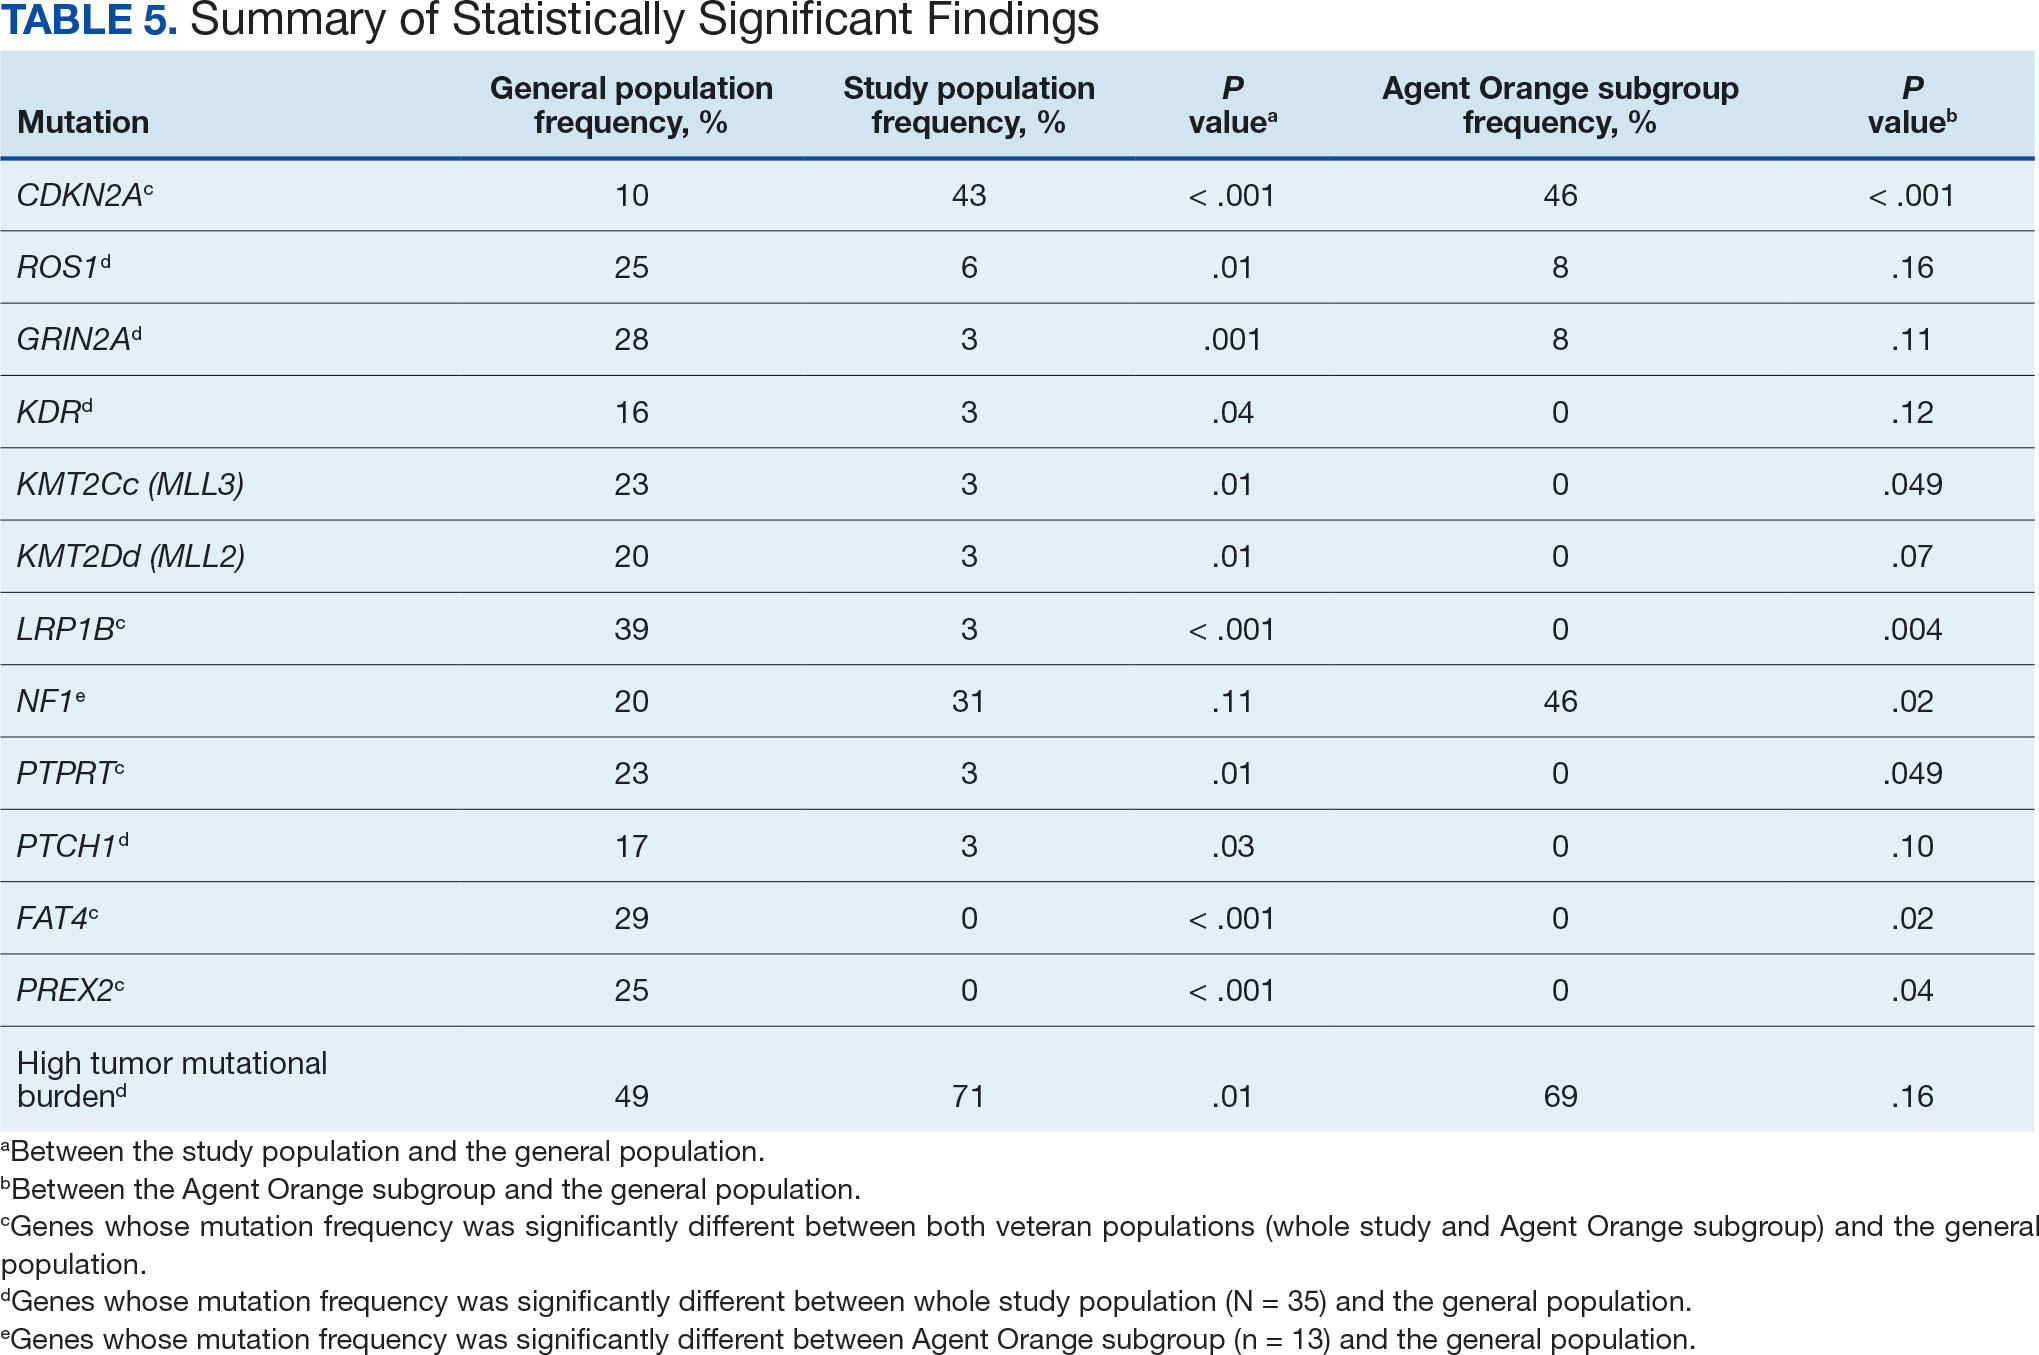
The list of genes mutated in melanoma cells in the study population is provided in the eAppendix.10,11 Twenty-seven patients (77%) had mutations in TERT promoter, 15 (43%) in CDKN2A/B, 13 (37%) in BRAF, 11 (31%) in NF1, 9 (26%) in TP53, and 8 (23%) in NRAS (Table 2). The majority of mutations in TERT promoter were c.- 146C>T (18 of 27 patients [67%]), whereas c.-124C>T was the second-most common (8 of 27 patients [30%]). The 2 observed mutations in the 13 patients with BRAF mutations were V600E and V600K, with almost equal distribution (54% and 46%, respectively). The mean (SD) TMB was 33.2 (39) mut/Mb (range, 1-203 mut/Mb). Ten patients (29%) had a TMB < 10 mut/Mb, whereas 24 (69%) had a TMB > 10 mut/Mb. The TMB could not be determined in 1 case. The frequency of TMB-high tumors in the study population compared with frequency in the reference population is shown in Table 3.12 Only 3 patients (0.64%) in the reference population had MSI-H tumors, and the microsatellite status could not be determined in those tumors (Table 4).13 Table 5 outlines statistically significant findings.
Agent Orange Subgroup
AO was a tactical herbicide used by the US military, named for the orange band around the storage barrels. Possible mutagenic properties of AO have been attributed to its byproduct, dioxin. Among the most common cancers known to be associated with AO exposure are bladder and prostate carcinoma and hematopoietic neoplasms. The association between genetic alterations and AO exposure was studied in veterans with prostate cancer.14 However, to our knowledge, insufficient information is available to determine whether an association exists between exposure to herbicides used in Vietnam or the contaminant dioxin and melanoma. Because a significant proportion of this study population had a well-documented history of AO exposure (37.1%), we were able to analyze them as a subgroup and to separately compare their mutation frequency with the general population.
Results were notable for different distributions of the most frequently mutated genes in the AO subgroup compared with the whole study population. As such, TERT promoter remained the most frequently mutated gene (92%), followed by CDKN2A/B (46%); however, frequency of mutations in NF1 (46%) outnumbered those of BRAF (31%), the fourth-most common mutation. Moreover, when compared with the general melanoma population, a significantly higher frequency of mutations in the NF1 gene was observed in the AO subgroup—not the entire study population.
Discussion
Given that veterans constitute a distinct population, there is reasonable interest in investigating characteristic health issues related to military service. Skin cancer—melanoma in particular—has been researched recently in a veteran population. The differences in demographics, tumor characteristics, and melanoma- specific survival in veterans compared with the general population have already been assessed. According to Chang et al, compared with the general population, veterans are more likely to present with metastatic disease and have lower 5-year survival rates.8
Melanoma is one of the most highly mutated malignancies.15 Fortunately, the most common mutation in melanoma, BRAF V600E, is now considered therapeutically targetable. However, there are still many mutations that are less often discussed and not well understood. Regardless of therapeutic implications, all mutations observed in melanoma are worth investigating because a tumor’s genomic profile also can provide prognostic and etiologic information. Developing comprehensive descriptions of melanoma mutational profiles in specific populations is critical to advancing etiologic understanding and informing prevention strategies.
Our results demonstrate the high prevalence of TERT promoter mutations with characteristic ultraviolet signature (C>T) in the study population. This aligns with general evidence that TERT promoter mutations are common in cutaneous melanomas: 77% of this study sample and up to 86% of all mutations are TERT promoter mutations, according to Davis et al.15TERT promoter mutations are positively associated with the initiation, invasion, and metastasis of melanoma. In certain subtypes, there is evidence that the presence of TERT promoter mutations is significantly associated with risk for extranodal metastasis and death.16 The second-most common mutated gene in the veteran study population was CDKN2A/B (43%), and the third-most mutated gene was BRAF (37%).
In chronically sun-exposed skin NF1, NRAS, and occasionally BRAF V600K mutations tend to predominate. BRAF V600E mutations, on the other hand, are rare in these melanomas.15 In our study population, the most prevalent melanoma site was the trunk (31%), which is considered a location with an intermittent pattern of sun exposure.17
This study population also had a higher frequency of CDKN2A/B mutations. High frequencies of CDKN2A/B mutations have been reported in familial melanomas, but only 1 patient with CDKN2A/B mutations had a known family history of melanoma.15 Tumors in the study population showed significantly lower frequency of mutations in ROS1, GRIN2A, KDR, KMT2C (MLL3), KMT2D (MLL2), LRP1B, PTPRT, PTCH1, FAT4, and PREX2 (P < .05).
In this study the subgroup of veterans with AO exposure differed from the whole study population. As such, CDKN2A/B mutations were observed with the same frequency as NF1 mutations (46% each); however, BRAF mutations constituted only 31% of the mutations. In addition, the frequency of NF1 mutations was significantly higher in the AO subgroup compared with the general population, but not in the whole study population.
Our sample also differed from the reference population by showing a significantly higher frequency of TMB-high (ie, ≥ 10 mut/Mb) tumors (71% vs 49%; P = .01).12 Interestingly, no significant difference in the frequency of TMB-high tumors was observed between the AO subgroup and the reference population (69% vs 49%; P = .16). There also was no statistically significant difference between the frequency of MSI-H tumors in our study population and the reference population (P = .64).13
One patient in the study population had uveal melanoma. Mutations encountered in this patient’s tumor differed from the general mutational profile of tumors. None of the 21 mutations depicted in Table 2 were present in this sample.10,11 On the other hand, those mutations frequently observed in intraocular melanomas, BAP1 and GNA11, were present in this patient.18 Additionally, this particular melanoma possessed mutations in genes RICTOR, RAD21, and PIK3R1.
Limitations
This study population consisted exclusively of male patients, introducing sex as a potential confounder in analyzing differences between the study population and the general population. As noted in a 2020 systematic review, there were no sex-based differences in the frequency of mutations in BRAF, NRAS, and KIT genes.19
Regarding NF1 mutations, only NF1-mutated acral and mucosal melanomas were more frequently observed in female patients, whereas nonacral NF1-mutated melanomas were more frequently observed in male patients.20 However, there is currently no clear evidence of whether the mutational landscapes of cutaneous melanoma differ by sex.21 Among the 11 cases with NF1-mutatation, site of origin was known in 6, 5 of which originated at nonacral sites. Although the AO subgroup also consisted entirely of male patients, this does not explain the observed increased frequency of NF1 mutations relative to the general population. No such difference was observed between the whole study population, which also consisted exclusively of male patients, and the general population. The similar frequencies of nonacral location in the whole study population (3 acral, 18 nonacral, 14 unknown site of origin) and AO subgroup (1 acral, 7 nonacral, 5 unknown site of origin) preclude location as an explanation.
The Cancer Genome Atlas Network proposed a framework for genomic classification of melanoma into 4 subtypes based on the pattern of the most prevalent significantly mutated genes: mutant BRAF, mutant RAS, mutant NF1, and triple–wild-type. According to that study, BRAF mutations were indeed associated with younger age, in contrast to the NF1-mutant genomic subtype, which was more prevalent in older individuals with higher TMB.22 This emphasizes the need to interpret the potential association of AO exposure and NF1 mutation in melanoma with caution, although additional studies are required to observe the difference between the veteran population and age-matched general population.
On the other hand, Yu et al reported no significant differences of TMB values between patients aged < 60 and ≥ 60 years with melanoma.23 In short, the observed differences we report in our limited study warrant additional investigation with larger sample sizes, sex-matched controlling, and age-matched controlling. The study was limited by its small sample size and the single location.
Conclusion
The genomic profile of melanomas in the veteran population appears to be similar to that of the general population with a few possible differences. Melanomas in the veteran study population showed a higher frequency of CDKN2A/B mutations; lower frequency of ROS1, GRIN2A, KDR, KMT2C (MLL3), KMT2D (MLL2), LRP1B, PTPRT, PTCH1, FAT4, and PREX2 mutations; and higher TMB. In addition, melanomas in the AO subgroup showed higher frequencies of NF1 mutations. The significance of such findings remains to be determined by further investigation.
- Bytnar JA, McGlynn KA, et al. Cancer incidence in the US military: An updated analysis. Cancer. 2024;130(1):96-106. doi:10.1002/cncr.34978
- Singer DS. A new phase of the Cancer Moonshot to end cancer as we know it. Nat Med. 2022;28(7):1345-1347. doi:10.1038/s41591-022-01881-5
- Koczkodaj P, Sulkowska U, Didkowska J, et al. Melanoma mortality trends in 28 European countries: a retrospective analysis for the years 1960-2020. Cancers (Basel). 2023;15(5):1514. Published 2023 Feb 28. doi:10.3390/cancers15051514
- Okobi OE, Abreo E, Sams NP, et al. Trends in melanoma incidence, prevalence, stage at diagnosis, and survival: an analysis of the United States Cancer Statistics (USCS) database. Cureus. 2024;16(10):e70697. doi:10.7759/cureus.70697
- Bartling SJ, Rivard SC, Meyerle JH. Melanoma in an active duty marine. Mil Med. 2017;182:e2034-e2039. doi:10.7205/MILMED-D-17-00127
- American Cancer Society. Cancer facts & figures 2023. American Cancer Society; 2023. Accessed June 20, 2025. https://www.cancer.org/content/dam/cancer-org/research/cancer-facts-and-statistics/annual-cancer-facts-and-figures/2023/2023-cancer-facts-and-figures.pdf
- Rezaei SJ, Kim J, Onyeka S, et al. Skin cancer and other dermatologic conditions among US veterans. JAMA Dermatol. 2024;160(10):1107-1111. doi:10.1001/jamadermatol.2024.3043
- Chang MS, La J, Trepanowski N, et al. Increased relative proportions of advanced melanoma among veterans: a comparative analysis with the Surveillance, Epidemiology, and End Results registry. J Am Acad Dermatol. 2022;87:72-79. doi:10.1016/j.jaad.2022.02.063
- Riemenschneider K, Liu J, Powers JG. Skin cancer in the military: a systematic review of melanoma and nonmelanoma skin cancer incidence, prevention, and screening among active duty and veteran personnel. J Am Acad Dermatol. 2018;78:1185-1192. doi:10.1016/j.jaad.2017.11.062
- Huang FW, Hodis E, Xu MJ, et al. Highly recurrent TERT promoter mutations in human melanoma. Science. 2013;339:957-959. doi:10.1126/science.1229259
- Tate JG, Bamford S, Jubb HC, et al. COSMIC: the Catalogue of Somatic Mutations in Cancer. Nucleic Acids Res. 2019;47:D941-D947. doi:10.1093/nar/gky1015
- Li M, Gao X, Wang X. Identification of tumor mutation burden-associated molecular and clinical features in cancer by analyzing multi-omics data. Front Immunol. 2023;14:1090838. doi:10.3389/fimmu.2023.1090838
- Bonneville R, Krook MA, Kautto EA, et al. Landscape of microsatellite instability across 39 cancer types. JCO Precis Oncol. 2017;2017:PO.17.00073. doi:10.1200/PO.17.00073
- Lui AJ, Pagadala MS, Zhong AY, et al. Agent Orange exposure and prostate cancer risk in the Million Veteran Program. medRxiv [Preprint]. 2023:2023.06.14.23291413. doi:10.1101/2023.06.14.23291413
- Davis EJ, Johnson DB, Sosman JA, et al. Melanoma: what do all the mutations mean? Cancer. 2018;124:3490-3499. doi:10.1002/cncr.31345
- Guo Y, Chen Y, Zhang L, et al. TERT promoter mutations and telomerase in melanoma. J Oncol. 2022;2022:6300329. doi:10.1155/2022/6300329
- Whiteman DC, Stickley M, Watt P, et al. Anatomic site, sun exposure, and risk of cutaneous melanoma. J Clin Oncol. 2006;24:3172-3177. doi:10.1200/JCO.2006.06.1325
- Decatur CL, Ong E, Garg N, et al. Driver mutations in uveal melanoma: associations with gene expression profile and patient outcomes. JAMA Ophthalmol. 2016;134:728-733. doi:10.1001/jamaophthalmol.2016.0903
- Gutiérrez-Castañeda LD, Nova JA, Tovar-Parra JD. Frequency of mutations in BRAF, NRAS, and KIT in different populations and histological subtypes of melanoma: a systemic review. Melanoma Res. 2020;30:62- 70. doi:10.1097/CMR.0000000000000628
- Thielmann CM, Chorti E, Matull J, et al. NF1-mutated melanomas reveal distinct clinical characteristics depending on tumour origin and respond favourably to immune checkpoint inhibitors. Eur J Cancer. 2021;159:113-124. doi:10.1016/j.ejca.2021.09.035
- D’Ecclesiis O, Caini S, Martinoli C, et al. Gender-dependent specificities in cutaneous melanoma predisposition, risk factors, somatic mutations, prognostic and predictive factors: a systematic review. Int J Environ Res Public Health. 2021;18:7945. doi:10.3390/ijerph18157945
- Cancer Genome Atlas Network. Genomic classification of cutaneous melanoma. Cell. 2015;161:1681-1696. doi:10.1016/j.cell.2015.05.044
- Yu Z, Wang J, Feng L, et al. Association of tumor mutational burden with age in solid tumors. J Clin Oncol. 2020;38:e13590-e13590. doi:10.1200/JCO.2020.38.15_suppl.e13590
The veteran population, with its unique and diverse types of exposure and military service experiences, faces distinct health factors compared with the general population. These factors can be categorized into exposures during military service and those occurring postservice. While the latter phase incorporates psychological issues that may arise while transitioning to civilian life, the service period is associated with major physical, chemical, and psychological exposures that can impact veterans’ health. Carcinogenesis related to military exposures is concerning, and different types of malignancies have been associated with military exposures.1 The 2022 introduction of the Cancer Moonshot initiative served as a breeding ground for multiple projects aimed at investigation of exposure-related carcinogenesis, prompting increased attention and efforts to linking specific exposures to specific malignancies.2
Melanoma is the deadliest skin cancer, accounting for 1.3% of all cancer deaths.3 Although it may only account for 1% to 5% of skin cancer diagnoses, its incidence in the United States’ population has been increasing.4,5 There were 97,610 estimated new cases of melanoma in 2023, according to the National Cancer Institute.6
The incidence of melanoma may be higher in the military population compared with the general population.7 Melanoma is the fourth-most common cancer diagnosed in veterans.8
Several demographic characteristics of the US military population are associated with higher melanoma incidence and poorer prognosis, including male sex, older age, and White race. Apart from sun exposure—a known risk factor for melanoma development—other factors, such as service branch, seem to contribute to risk, with the highest melanoma rates noted in the Air Force.9 According to a study by Chang et al, veterans have a higher risk of stage III (18%) or stage IV (13%) melanoma at initial diagnosis.8
Molecular testing of metastatic melanoma is currently the standard of care for guiding the use of US Food and Drug Administration-approved targeted therapies such as BRAF, MEK, and KIT inhibitors. This comparative analysis details the melanoma comprehensive genomic profiles observed at a large US Department of Veterans Affairs (VA) medical center (VAMC) and those reported in reference databases.
Methods
A query to select all metastatic melanomas sent for comprehensive genomic profiling from the Kansas City VAMC (KCVAMC), identified 35 cases from 2019 through 2023 as the study population. The health records of these patients were reviewed to collect demographic information, military service history, melanoma history, other medical, social, and family histories. The comprehensive genomic profiling reports were reviewed to collect the reported pathogenic variants, microsatellite instability (MSI) status, and tumor mutational burden (TMB) for each case.
The Catalogue of Somatic Mutations in Cancer (COSMIC) was used to identify the most commonly mutated genes in melanomas from The Cancer Genome Atlas for the general population.4,5 The literature was consulted to determine the MSI status and TMB in melanomas from The Cancer Genome Atlas for separate reference populations.6,7 The frequency of MSI-high (MSI-H) status, TMB ≥ 10 mutations/megabase (mut/Mb), and mutations in each of the 20 most commonly mutated genes was determined and compared between melanomas from The Cancer Genome Atlas and KCVAMC cases. Corresponding P values were calculated to identify significant differences. Values were calculated for the entire sample as well as a subgroup with Agent Orange (AO) exposure. The study was approved by the KCVAMC Institutional Review Board.
Results
The mean (SD) age of study participants was 72.9 (9.4) years (range, 39-90 years). The mean (SD) duration of military service was 1654 (1421) days (about 4 years, 6 months, and 10 days). Of the 35 patients included, 22 (63%) served during the Vietnam era (November 1, 1965, to April 30, 1975) and 2 (6%) served during the Persian Gulf War era (August 2, 1990, to February 28, 1991). Seventeen veterans (49%) served in the Army, 9 in the Navy (26%), 5 in the Air Force (14%), and 4 in the Marine Corps (11%). Definitive AO exposure was noted in 13 patients (37%) (Table 1).
Of the 35 patients, 24 (69%) had metastatic disease and the primary site of melanoma was unknown in 14 patients (40%). One patient (Patient 32) had an intraocular melanoma. The primary site was the trunk for 11 patients (31%), the face/head for 7 patients (20%) and extremities for 3 patients (9%). Eight patients (23%) were pT3 stage (thickness > 2 mm but < 4 mm), 7 patients (20%) were pT4 stage (thickness > 4 mm), and 5 patients (14%) were pT1 (thickness ≥ 1 mm). One patient had a primary lesion at pT2 stage, and 1 had a Tis stage lesion. Three patients (9%) had a family history of melanoma in a first-degree relative.
The list of genes mutated in melanoma cells in the study population is provided in the eAppendix.10,11 Twenty-seven patients (77%) had mutations in TERT promoter, 15 (43%) in CDKN2A/B, 13 (37%) in BRAF, 11 (31%) in NF1, 9 (26%) in TP53, and 8 (23%) in NRAS (Table 2). The majority of mutations in TERT promoter were c.- 146C>T (18 of 27 patients [67%]), whereas c.-124C>T was the second-most common (8 of 27 patients [30%]). The 2 observed mutations in the 13 patients with BRAF mutations were V600E and V600K, with almost equal distribution (54% and 46%, respectively). The mean (SD) TMB was 33.2 (39) mut/Mb (range, 1-203 mut/Mb). Ten patients (29%) had a TMB < 10 mut/Mb, whereas 24 (69%) had a TMB > 10 mut/Mb. The TMB could not be determined in 1 case. The frequency of TMB-high tumors in the study population compared with frequency in the reference population is shown in Table 3.12 Only 3 patients (0.64%) in the reference population had MSI-H tumors, and the microsatellite status could not be determined in those tumors (Table 4).13 Table 5 outlines statistically significant findings.
Agent Orange Subgroup
AO was a tactical herbicide used by the US military, named for the orange band around the storage barrels. Possible mutagenic properties of AO have been attributed to its byproduct, dioxin. Among the most common cancers known to be associated with AO exposure are bladder and prostate carcinoma and hematopoietic neoplasms. The association between genetic alterations and AO exposure was studied in veterans with prostate cancer.14 However, to our knowledge, insufficient information is available to determine whether an association exists between exposure to herbicides used in Vietnam or the contaminant dioxin and melanoma. Because a significant proportion of this study population had a well-documented history of AO exposure (37.1%), we were able to analyze them as a subgroup and to separately compare their mutation frequency with the general population.
Results were notable for different distributions of the most frequently mutated genes in the AO subgroup compared with the whole study population. As such, TERT promoter remained the most frequently mutated gene (92%), followed by CDKN2A/B (46%); however, frequency of mutations in NF1 (46%) outnumbered those of BRAF (31%), the fourth-most common mutation. Moreover, when compared with the general melanoma population, a significantly higher frequency of mutations in the NF1 gene was observed in the AO subgroup—not the entire study population.
Discussion
Given that veterans constitute a distinct population, there is reasonable interest in investigating characteristic health issues related to military service. Skin cancer—melanoma in particular—has been researched recently in a veteran population. The differences in demographics, tumor characteristics, and melanoma- specific survival in veterans compared with the general population have already been assessed. According to Chang et al, compared with the general population, veterans are more likely to present with metastatic disease and have lower 5-year survival rates.8
Melanoma is one of the most highly mutated malignancies.15 Fortunately, the most common mutation in melanoma, BRAF V600E, is now considered therapeutically targetable. However, there are still many mutations that are less often discussed and not well understood. Regardless of therapeutic implications, all mutations observed in melanoma are worth investigating because a tumor’s genomic profile also can provide prognostic and etiologic information. Developing comprehensive descriptions of melanoma mutational profiles in specific populations is critical to advancing etiologic understanding and informing prevention strategies.
Our results demonstrate the high prevalence of TERT promoter mutations with characteristic ultraviolet signature (C>T) in the study population. This aligns with general evidence that TERT promoter mutations are common in cutaneous melanomas: 77% of this study sample and up to 86% of all mutations are TERT promoter mutations, according to Davis et al.15TERT promoter mutations are positively associated with the initiation, invasion, and metastasis of melanoma. In certain subtypes, there is evidence that the presence of TERT promoter mutations is significantly associated with risk for extranodal metastasis and death.16 The second-most common mutated gene in the veteran study population was CDKN2A/B (43%), and the third-most mutated gene was BRAF (37%).
In chronically sun-exposed skin NF1, NRAS, and occasionally BRAF V600K mutations tend to predominate. BRAF V600E mutations, on the other hand, are rare in these melanomas.15 In our study population, the most prevalent melanoma site was the trunk (31%), which is considered a location with an intermittent pattern of sun exposure.17
This study population also had a higher frequency of CDKN2A/B mutations. High frequencies of CDKN2A/B mutations have been reported in familial melanomas, but only 1 patient with CDKN2A/B mutations had a known family history of melanoma.15 Tumors in the study population showed significantly lower frequency of mutations in ROS1, GRIN2A, KDR, KMT2C (MLL3), KMT2D (MLL2), LRP1B, PTPRT, PTCH1, FAT4, and PREX2 (P < .05).
In this study the subgroup of veterans with AO exposure differed from the whole study population. As such, CDKN2A/B mutations were observed with the same frequency as NF1 mutations (46% each); however, BRAF mutations constituted only 31% of the mutations. In addition, the frequency of NF1 mutations was significantly higher in the AO subgroup compared with the general population, but not in the whole study population.
Our sample also differed from the reference population by showing a significantly higher frequency of TMB-high (ie, ≥ 10 mut/Mb) tumors (71% vs 49%; P = .01).12 Interestingly, no significant difference in the frequency of TMB-high tumors was observed between the AO subgroup and the reference population (69% vs 49%; P = .16). There also was no statistically significant difference between the frequency of MSI-H tumors in our study population and the reference population (P = .64).13
One patient in the study population had uveal melanoma. Mutations encountered in this patient’s tumor differed from the general mutational profile of tumors. None of the 21 mutations depicted in Table 2 were present in this sample.10,11 On the other hand, those mutations frequently observed in intraocular melanomas, BAP1 and GNA11, were present in this patient.18 Additionally, this particular melanoma possessed mutations in genes RICTOR, RAD21, and PIK3R1.
Limitations
This study population consisted exclusively of male patients, introducing sex as a potential confounder in analyzing differences between the study population and the general population. As noted in a 2020 systematic review, there were no sex-based differences in the frequency of mutations in BRAF, NRAS, and KIT genes.19
Regarding NF1 mutations, only NF1-mutated acral and mucosal melanomas were more frequently observed in female patients, whereas nonacral NF1-mutated melanomas were more frequently observed in male patients.20 However, there is currently no clear evidence of whether the mutational landscapes of cutaneous melanoma differ by sex.21 Among the 11 cases with NF1-mutatation, site of origin was known in 6, 5 of which originated at nonacral sites. Although the AO subgroup also consisted entirely of male patients, this does not explain the observed increased frequency of NF1 mutations relative to the general population. No such difference was observed between the whole study population, which also consisted exclusively of male patients, and the general population. The similar frequencies of nonacral location in the whole study population (3 acral, 18 nonacral, 14 unknown site of origin) and AO subgroup (1 acral, 7 nonacral, 5 unknown site of origin) preclude location as an explanation.
The Cancer Genome Atlas Network proposed a framework for genomic classification of melanoma into 4 subtypes based on the pattern of the most prevalent significantly mutated genes: mutant BRAF, mutant RAS, mutant NF1, and triple–wild-type. According to that study, BRAF mutations were indeed associated with younger age, in contrast to the NF1-mutant genomic subtype, which was more prevalent in older individuals with higher TMB.22 This emphasizes the need to interpret the potential association of AO exposure and NF1 mutation in melanoma with caution, although additional studies are required to observe the difference between the veteran population and age-matched general population.
On the other hand, Yu et al reported no significant differences of TMB values between patients aged < 60 and ≥ 60 years with melanoma.23 In short, the observed differences we report in our limited study warrant additional investigation with larger sample sizes, sex-matched controlling, and age-matched controlling. The study was limited by its small sample size and the single location.
Conclusion
The genomic profile of melanomas in the veteran population appears to be similar to that of the general population with a few possible differences. Melanomas in the veteran study population showed a higher frequency of CDKN2A/B mutations; lower frequency of ROS1, GRIN2A, KDR, KMT2C (MLL3), KMT2D (MLL2), LRP1B, PTPRT, PTCH1, FAT4, and PREX2 mutations; and higher TMB. In addition, melanomas in the AO subgroup showed higher frequencies of NF1 mutations. The significance of such findings remains to be determined by further investigation.
- Bytnar JA, McGlynn KA, et al. Cancer incidence in the US military: An updated analysis. Cancer. 2024;130(1):96-106. doi:10.1002/cncr.34978
- Singer DS. A new phase of the Cancer Moonshot to end cancer as we know it. Nat Med. 2022;28(7):1345-1347. doi:10.1038/s41591-022-01881-5
- Koczkodaj P, Sulkowska U, Didkowska J, et al. Melanoma mortality trends in 28 European countries: a retrospective analysis for the years 1960-2020. Cancers (Basel). 2023;15(5):1514. Published 2023 Feb 28. doi:10.3390/cancers15051514
- Okobi OE, Abreo E, Sams NP, et al. Trends in melanoma incidence, prevalence, stage at diagnosis, and survival: an analysis of the United States Cancer Statistics (USCS) database. Cureus. 2024;16(10):e70697. doi:10.7759/cureus.70697
- Bartling SJ, Rivard SC, Meyerle JH. Melanoma in an active duty marine. Mil Med. 2017;182:e2034-e2039. doi:10.7205/MILMED-D-17-00127
- American Cancer Society. Cancer facts & figures 2023. American Cancer Society; 2023. Accessed June 20, 2025. https://www.cancer.org/content/dam/cancer-org/research/cancer-facts-and-statistics/annual-cancer-facts-and-figures/2023/2023-cancer-facts-and-figures.pdf
- Rezaei SJ, Kim J, Onyeka S, et al. Skin cancer and other dermatologic conditions among US veterans. JAMA Dermatol. 2024;160(10):1107-1111. doi:10.1001/jamadermatol.2024.3043
- Chang MS, La J, Trepanowski N, et al. Increased relative proportions of advanced melanoma among veterans: a comparative analysis with the Surveillance, Epidemiology, and End Results registry. J Am Acad Dermatol. 2022;87:72-79. doi:10.1016/j.jaad.2022.02.063
- Riemenschneider K, Liu J, Powers JG. Skin cancer in the military: a systematic review of melanoma and nonmelanoma skin cancer incidence, prevention, and screening among active duty and veteran personnel. J Am Acad Dermatol. 2018;78:1185-1192. doi:10.1016/j.jaad.2017.11.062
- Huang FW, Hodis E, Xu MJ, et al. Highly recurrent TERT promoter mutations in human melanoma. Science. 2013;339:957-959. doi:10.1126/science.1229259
- Tate JG, Bamford S, Jubb HC, et al. COSMIC: the Catalogue of Somatic Mutations in Cancer. Nucleic Acids Res. 2019;47:D941-D947. doi:10.1093/nar/gky1015
- Li M, Gao X, Wang X. Identification of tumor mutation burden-associated molecular and clinical features in cancer by analyzing multi-omics data. Front Immunol. 2023;14:1090838. doi:10.3389/fimmu.2023.1090838
- Bonneville R, Krook MA, Kautto EA, et al. Landscape of microsatellite instability across 39 cancer types. JCO Precis Oncol. 2017;2017:PO.17.00073. doi:10.1200/PO.17.00073
- Lui AJ, Pagadala MS, Zhong AY, et al. Agent Orange exposure and prostate cancer risk in the Million Veteran Program. medRxiv [Preprint]. 2023:2023.06.14.23291413. doi:10.1101/2023.06.14.23291413
- Davis EJ, Johnson DB, Sosman JA, et al. Melanoma: what do all the mutations mean? Cancer. 2018;124:3490-3499. doi:10.1002/cncr.31345
- Guo Y, Chen Y, Zhang L, et al. TERT promoter mutations and telomerase in melanoma. J Oncol. 2022;2022:6300329. doi:10.1155/2022/6300329
- Whiteman DC, Stickley M, Watt P, et al. Anatomic site, sun exposure, and risk of cutaneous melanoma. J Clin Oncol. 2006;24:3172-3177. doi:10.1200/JCO.2006.06.1325
- Decatur CL, Ong E, Garg N, et al. Driver mutations in uveal melanoma: associations with gene expression profile and patient outcomes. JAMA Ophthalmol. 2016;134:728-733. doi:10.1001/jamaophthalmol.2016.0903
- Gutiérrez-Castañeda LD, Nova JA, Tovar-Parra JD. Frequency of mutations in BRAF, NRAS, and KIT in different populations and histological subtypes of melanoma: a systemic review. Melanoma Res. 2020;30:62- 70. doi:10.1097/CMR.0000000000000628
- Thielmann CM, Chorti E, Matull J, et al. NF1-mutated melanomas reveal distinct clinical characteristics depending on tumour origin and respond favourably to immune checkpoint inhibitors. Eur J Cancer. 2021;159:113-124. doi:10.1016/j.ejca.2021.09.035
- D’Ecclesiis O, Caini S, Martinoli C, et al. Gender-dependent specificities in cutaneous melanoma predisposition, risk factors, somatic mutations, prognostic and predictive factors: a systematic review. Int J Environ Res Public Health. 2021;18:7945. doi:10.3390/ijerph18157945
- Cancer Genome Atlas Network. Genomic classification of cutaneous melanoma. Cell. 2015;161:1681-1696. doi:10.1016/j.cell.2015.05.044
- Yu Z, Wang J, Feng L, et al. Association of tumor mutational burden with age in solid tumors. J Clin Oncol. 2020;38:e13590-e13590. doi:10.1200/JCO.2020.38.15_suppl.e13590
Comprehensive Genomic Profiles of Melanoma in Veterans Compared to Reference Databases
Comprehensive Genomic Profiles of Melanoma in Veterans Compared to Reference Databases


Colorectal Cancer Characteristics and Mortality From Propensity Score-Matched Cohorts of Urban and Rural Veterans
Colorectal Cancer Characteristics and Mortality From Propensity Score-Matched Cohorts of Urban and Rural Veterans
Colorectal cancer (CRC) is the second-leading cause of cancer-related deaths in the United States, with an estimated 52,550 deaths in 2023.1 However, the disease burden varies among different segments of the population.2 While both CRC incidence and mortality have been decreasing due to screening and advances in treatment, there are disparities in incidence and mortality across the sociodemographic spectrum including race, ethnicity, education, and income.1-4 While CRC incidence is decreasing for older adults, it is increasing among those aged < 55 years.5 The incidence of CRC in adults aged 40 to 54 years has increased by 0.5% to 1.3% annually since the mid-1990s.6 The US Preventive Services Task Force now recommends starting CRC screening at age 45 years for asymptomatic adults with average risk.7
Disparities also exist across geographical boundaries and living environment. Rural Americans faces additional challenges in health and lifestyle that can affect CRC outcomes. Compared to their urban counterparts, rural residents are more likely to be older, have lower levels of education, higher levels of poverty, lack health insurance, and less access to health care practitioners (HCPs).8-10 Geographic proximity, defined as travel time or physical distance to a health facility, has been recognized as a predictor of inferior outcomes.11 These aspects of rural living may pose challenges for accessing care for CRC screening and treatment.11-13 National and local studies have shown disparities in CRC screening rates, incidence, and mortality between rural and urban populations.14-16
It is unclear whether rural/urban disparities persist under the Veterans Health Administration (VHA) health care delivery model. This study examined differences in baseline characteristics and mortality between rural and urban veterans newly diagnosed with CRC. We also focused on a subpopulation aged ≤ 45 years.
Methods
This study extracted national data from the US Department of Veterans Affairs (VA) Corporate Data Warehouse (CDW) hosted in the VA Informatics and Computing Infrastructure (VINCI) environment. VINCI is an initiative to improve access to VA data and facilitate the analysis of these data while ensuring veterans’ privacy and data security.17 CDW is the VHA business intelligence information repository, which extracts data from clinical and nonclinical sources following prescribed and validated protocols. Data extracted included demographics, diagnosis, and procedure codes for both inpatient and outpatient encounters, vital signs, and vital status. This study used data previously extracted from a national cohort of veterans that encompassed all patients who received a group of commonly prescribed medications, such as statins, proton pump inhibitors, histamine-2 blockers, acetaminophen-containing products, and hydrocortisone-containing skin applications. This cohort encompassed 8,648,754 veterans, from whom 2,460,727 had encounters during fiscal years (FY) 2016 to 2021 (study period). The cohort was used to ensure that subjects were VHA patients, allowing them to adequately capture their clinical profiles.
Patients were identified as rural or urban based on their residence address at the date of their first diagnosis of CRC. The Geospatial Service Support Center (GSSC) aggregates and updates veterans’ residence address records for all enrolled veterans from the National Change of Address database. The data contain 1 record per enrollee. GSSC Geocoded Enrollee File contains enrollee addresses and their rurality indicators, categorized as urban, rural, or highly rural.18 Rurality is defined by the Rural Urban Commuting Area (RUCA) categories developed by the Department of Agriculture and the Health Resources and Services Administration of the US Department of Health and Human Services.19 Urban areas had RUCA codes of 1.0 to 1.1, and highly rural areas had RUCA scores of 10.0. All other areas were classified as rural. Since the proportion of veterans from highly rural areas was small, we included residents from highly rural areas in the rural residents’ group.
Inclusion and Exclusion Criteria
All veterans newly diagnosed with CRC from FY 2016 to 2021 were included. We used the ninth and tenth clinical modification revisions of the International Classification of Diseases (ICD-9-CM and ICD-10-CM) to define CRC diagnosis (Supplemental materials).4,20 To ensure that patients were newly diagnosed with CRC, this study excluded patients with a previous ICD-9-CM code for CRC diagnosis since FY 2003.
Comorbidities were identified using diagnosis and procedure codes from inpatient and outpatient encounters, which were used to calculate the Charlson Comorbidity Index (CCI) at the time of CRC diagnosis using the weighted method described by Schneeweiss et al.21 We defined CRC high-risk conditions and CRC screening tests, including flexible sigmoidoscopy and stool tests, as described in previous studies (Supplemental materials).20
The main outcome was total mortality. The date of death was extracted from the VHA Death Ascertainment File, which contains mortality data from the Master Person Index file in CDW and the Social Security Administration Death Master File. We used the date of death from any cause, as cause of death was not available.
A propensity score (PS) was created to match rural (including highly rural) and urban residents at a ratio of 1:1. Using a standard procedure described in prior publications, multivariable logistic regression used all baseline characteristics to estimate the PS and perform nearest-number matching without replacement.22,23 A caliper of 0.01 maximized the matched cohort size and achieved balance (Supplemental materials). We then examined the balance of baseline characteristics between PS-matched groups.
Analyses
Cox proportional hazards regression analysis estimated the hazard ratio (HR) of death in rural residents compared to urban residents in the PS-matched cohort. The outcome event was the date of death during the study’s follow-up period (defined as period from first CRC diagnosis to death or study end), with censoring at the study’s end date (September 30, 2021). The proportional hazards assumption was assessed by inspecting the Kaplan-Meier curves. Multiple analyses examined the HR of total mortality in the PS-matched cohort, stratified by sex, race, and ethnicity. We also examined the HR of total mortality stratified by duration of follow-up.
Another PS-matching analysis among veterans aged ≤ 45 years was performed using the same techniques described earlier in this article. We performed a Cox proportional hazards regression analysis to compare mortality in PS-matched urban and rural veterans aged ≤ 45 years. The HR of death in all veterans aged ≤ 45 years (before PS-matching) was estimated using Cox proportional hazard regression analysis, adjusting for PS.
Dichotomous variables were compared using X2 tests and continuous variables were compared using t tests. Baseline characteristics with missing values were converted into categorical variables and the proportion of subjects with missing values was equalized between treatment groups after PS-matching. For subgroup analysis, we examined the HR of total mortality in each subgroup using separate Cox proportional hazards regression models similar to the primary analysis but adjusted for PS. Due to multiple comparisons in the subgroup analysis, the findings should be considered exploratory. Statistical tests were 2-tailed, and significance was defined as P < .05. Data management and statistical analyses were conducted from June 2022 to January 2023 using STATA, Version 17. The VA Orlando Healthcare System Institutional Review Board approved the study and waived requirements for informed consent because only deidentified data were used.
Results
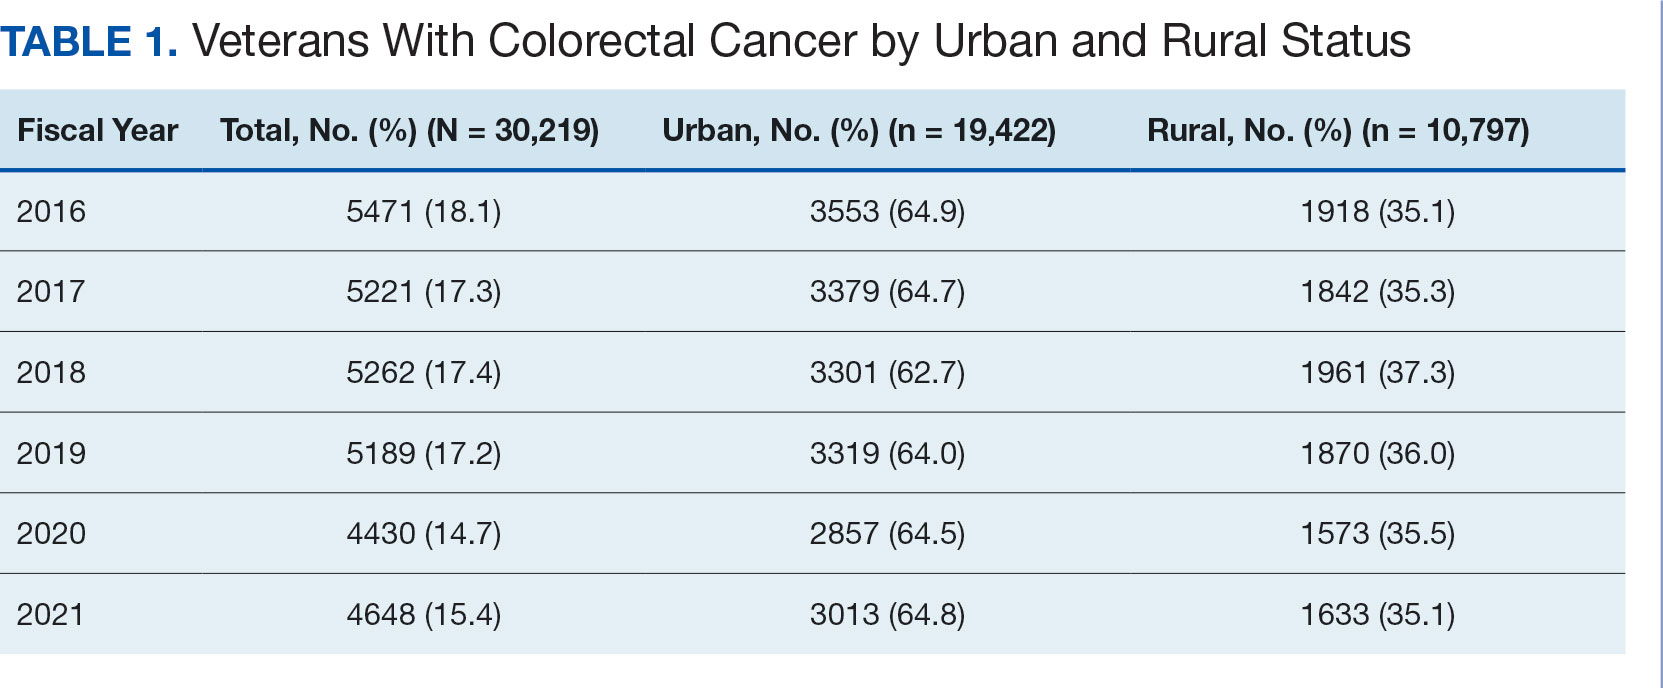
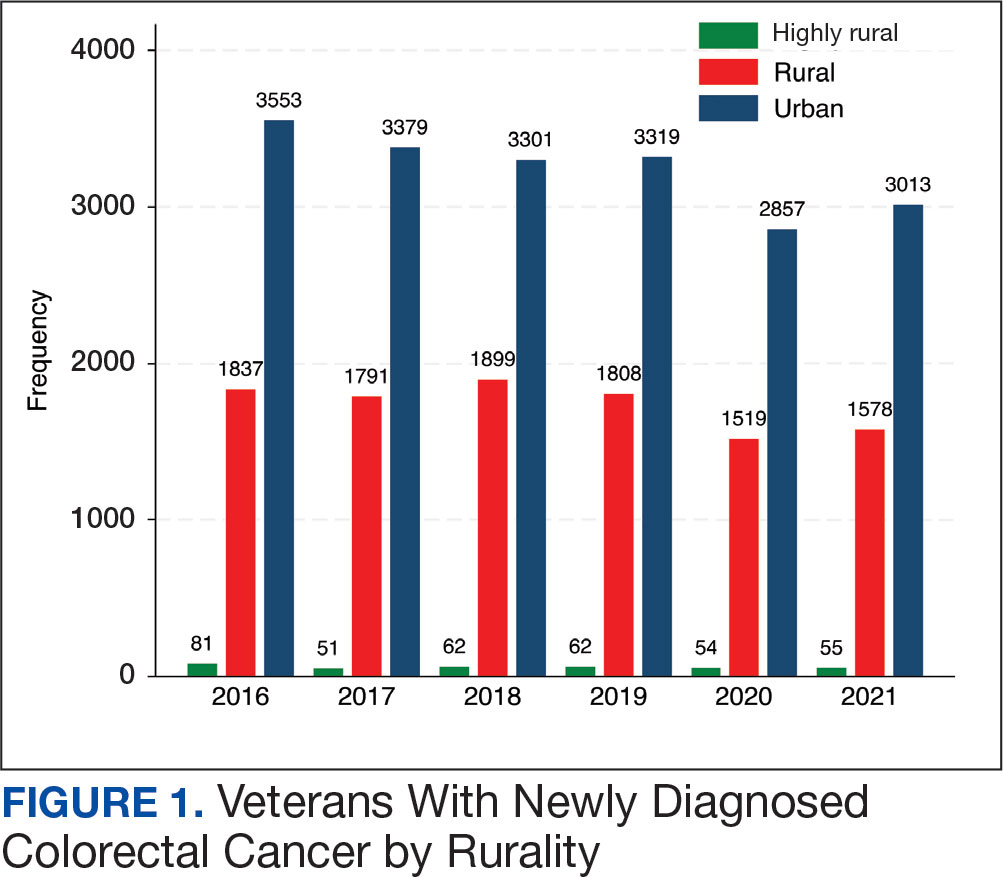
After excluding 49 patients (Supplemental materials, available at doi:10.12788/fp.0560), we identified 30,219 veterans with newly diagnosed CRC between FY 2016 to 2021 (Table 1). Of these, 19,422 (64.3%) resided in urban areas and 10,797 (35.7%) resided in rural areas (Table 2). The mean (SD) duration from the first CRC diagnosis to death or study end was 832 (640) days, and the median (IQR) was 723 (246–1330) days. Overall, incident CRC diagnoses were numerically highest in FY 2016 and lowest in FY 2020 (Figure 1). Patients with CRC in rural areas vs urban areas were significantly older (mean, 71.2 years vs 70.8 years, respectively; P < .001), more likely to be male (96.7% vs 95.7%, respectively; P < .001), more likely to be White (83.6% vs 67.8%, respectively; P < .001) and more likely to be non-Hispanic (92.2% vs 87.5%, respectively; P < .001). In terms of general health, rural veterans with CRC were more likely to be overweight or obese (81.5% rural vs 78.5% urban; P < .001) but had fewer mean comorbidities as measured by CCI (5.66 rural vs 5.90 urban; P < .001). A higher proportion of rural veterans with CRC had received stool-based (fecal occult blood test or fecal immunochemical test) CRC screening tests (61.6% rural vs 57.2% urban; P < .001). Fewer rural patients presented with systemic symptoms or signs within 1 year of CRC diagnosis (54.4% rural vs 57.5% urban, P < .001). Among urban patients with CRC, 6959 (35.8%) deaths were observed, compared with 3766 (34.9%) among rural patients (P = .10).
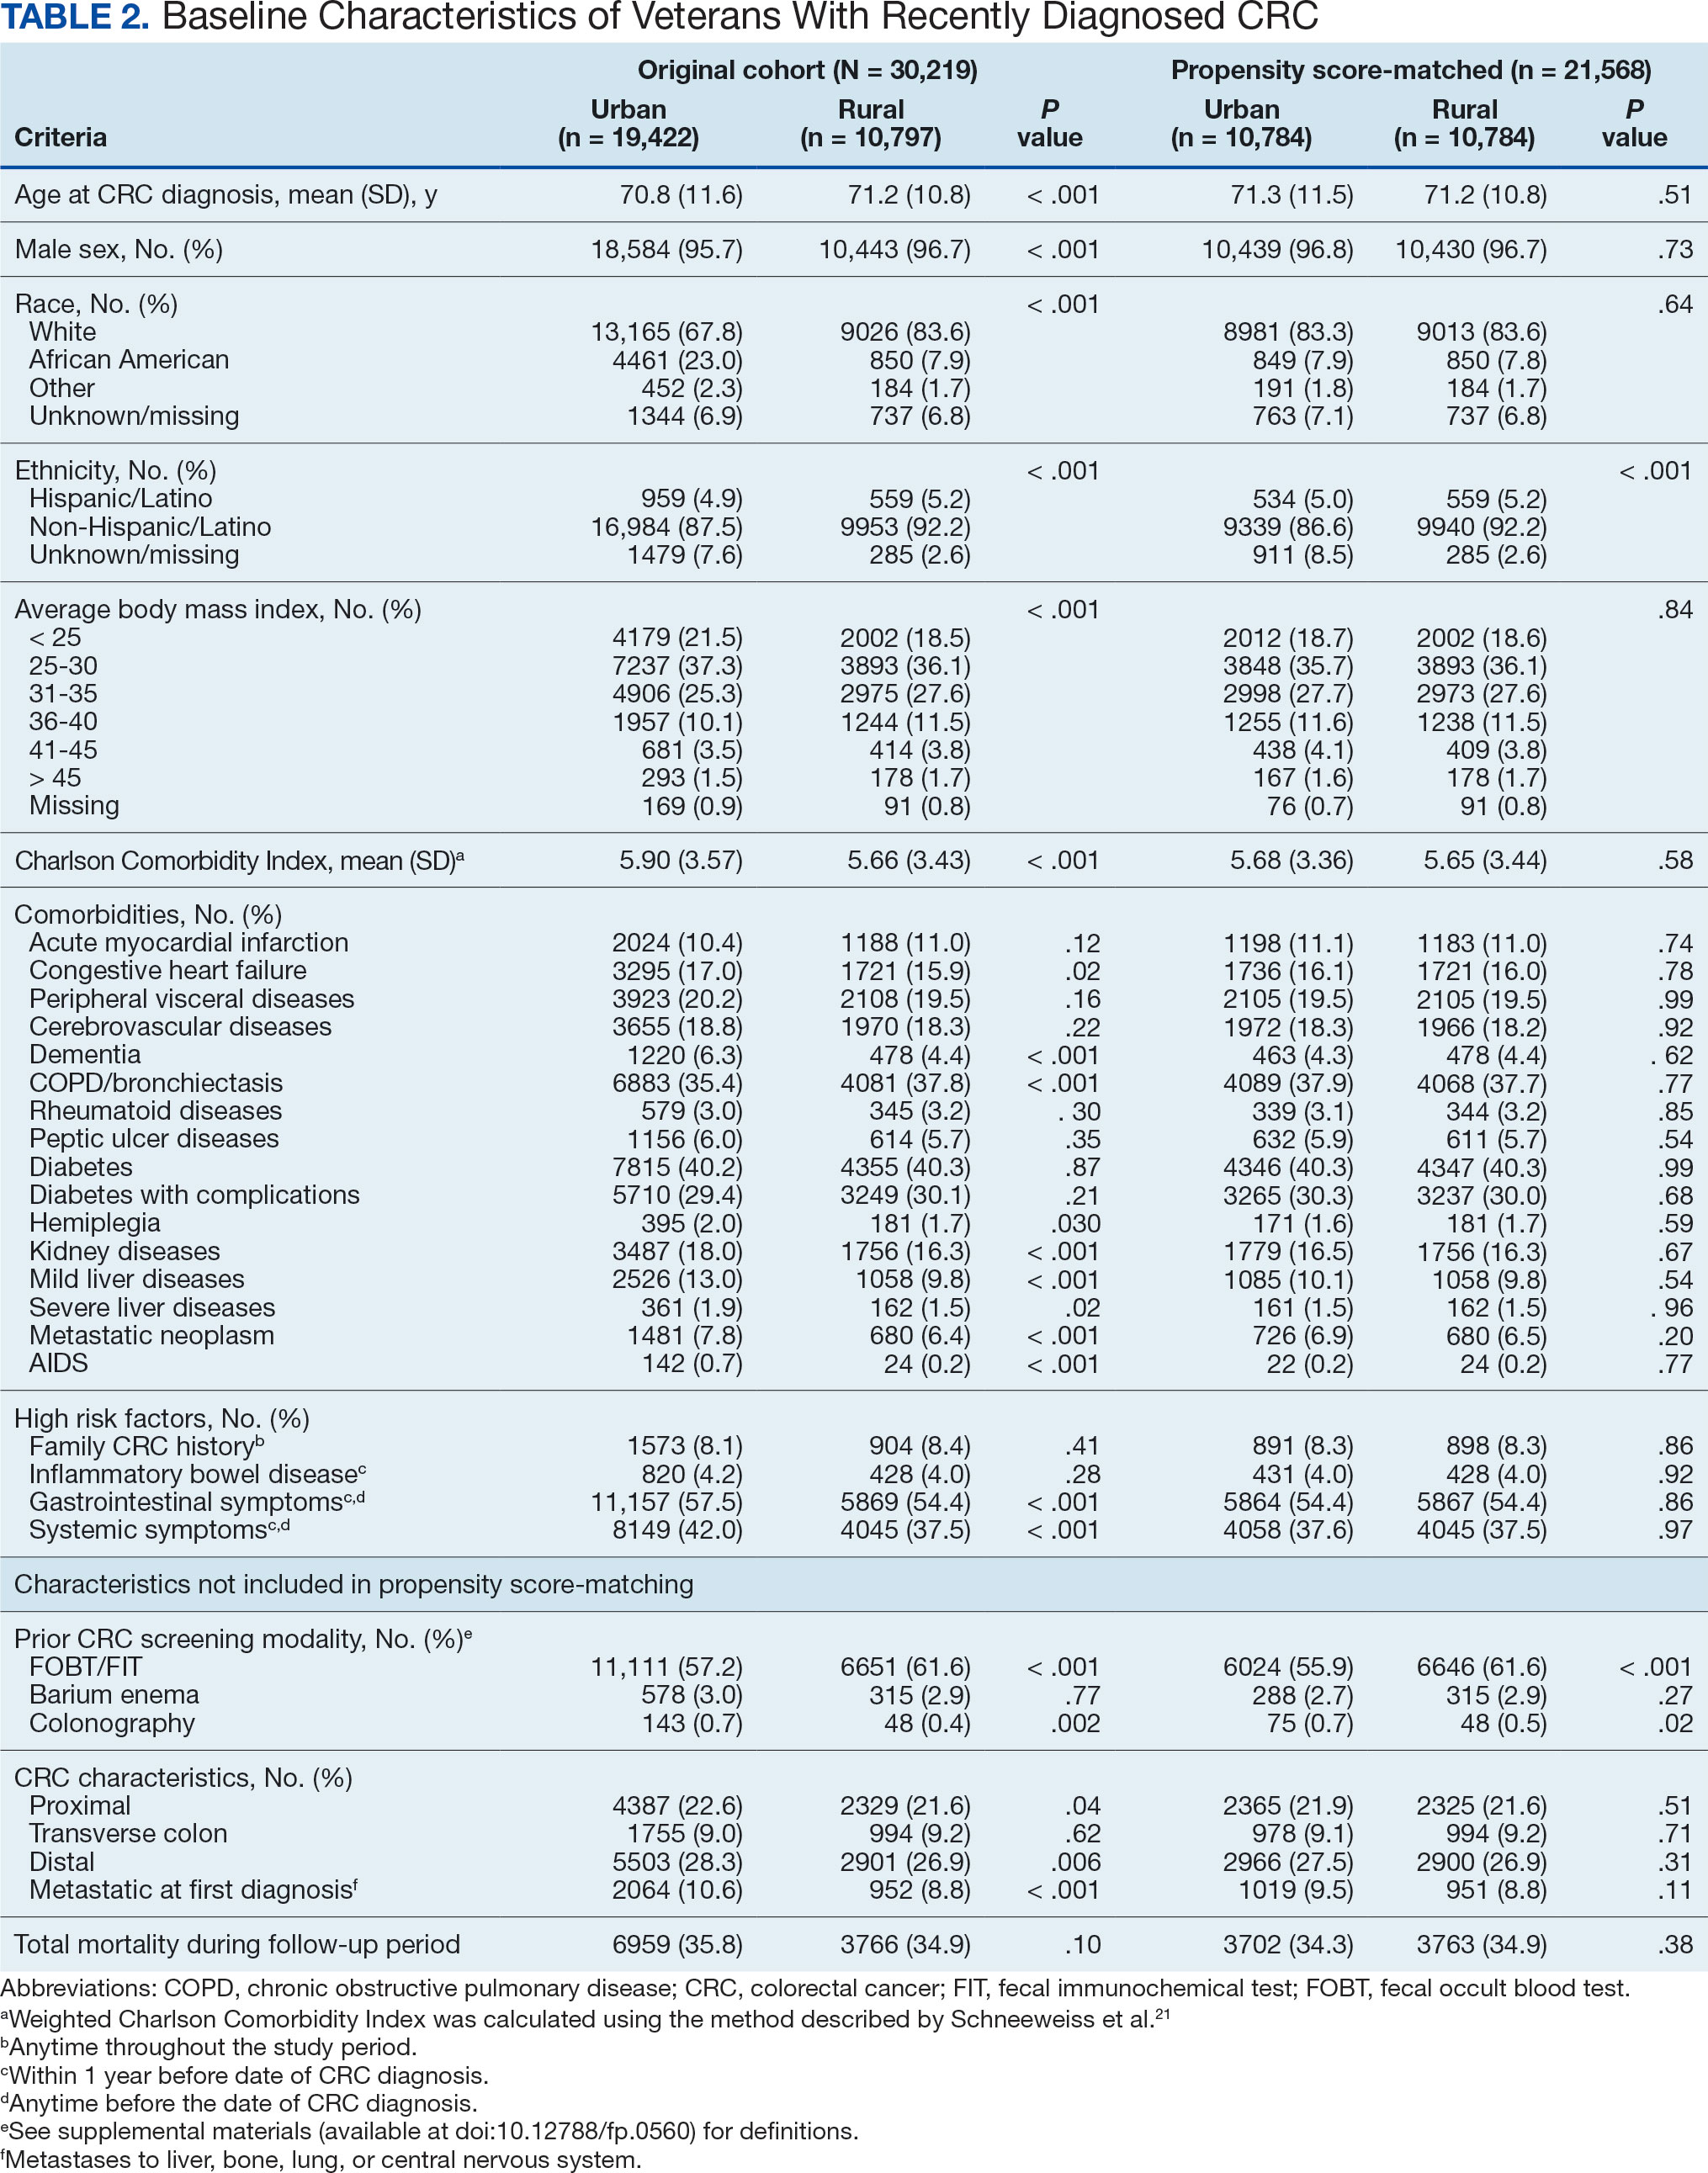
There were 21,568 PS-matched veterans: 10,784 in each group. In the PS-matched cohort, baseline characteristics were similar between veterans in urban and rural communities, including age, sex, race/ethnicity, body mass index, and comorbidities. Among rural patients with CRC, 3763 deaths (34.9%) were observed compared with 3702 (34.3%) among urban veterans. There was no significant difference in the HR of mortality between rural and urban CRC residents (HR, 1.01; 95% CI, 0.97-1.06; P = .53) (Figure 2).
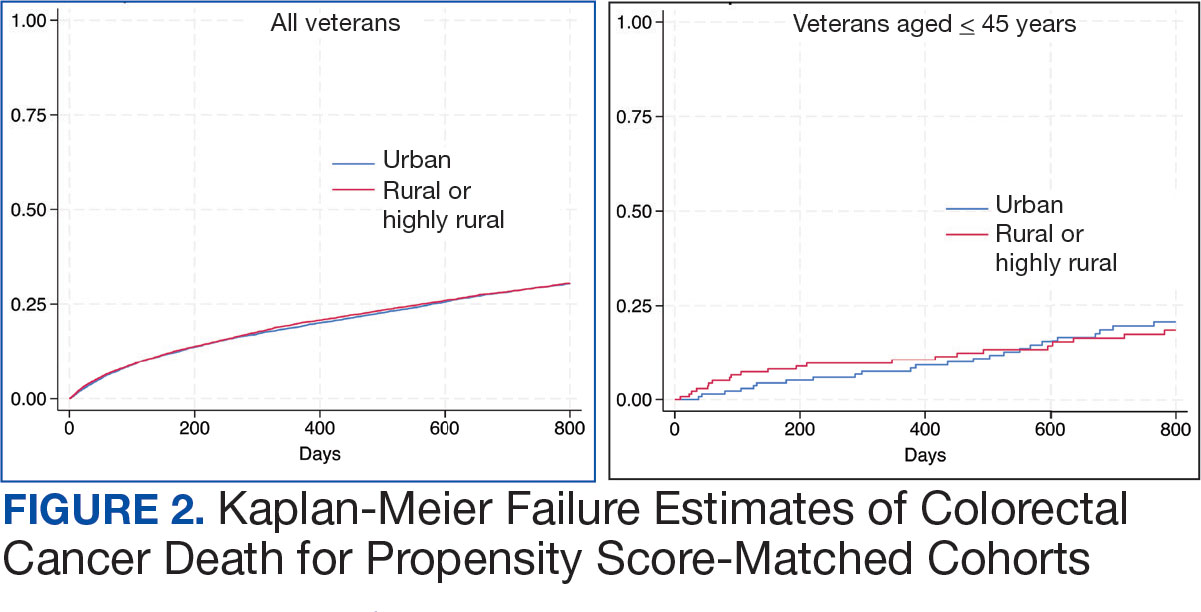
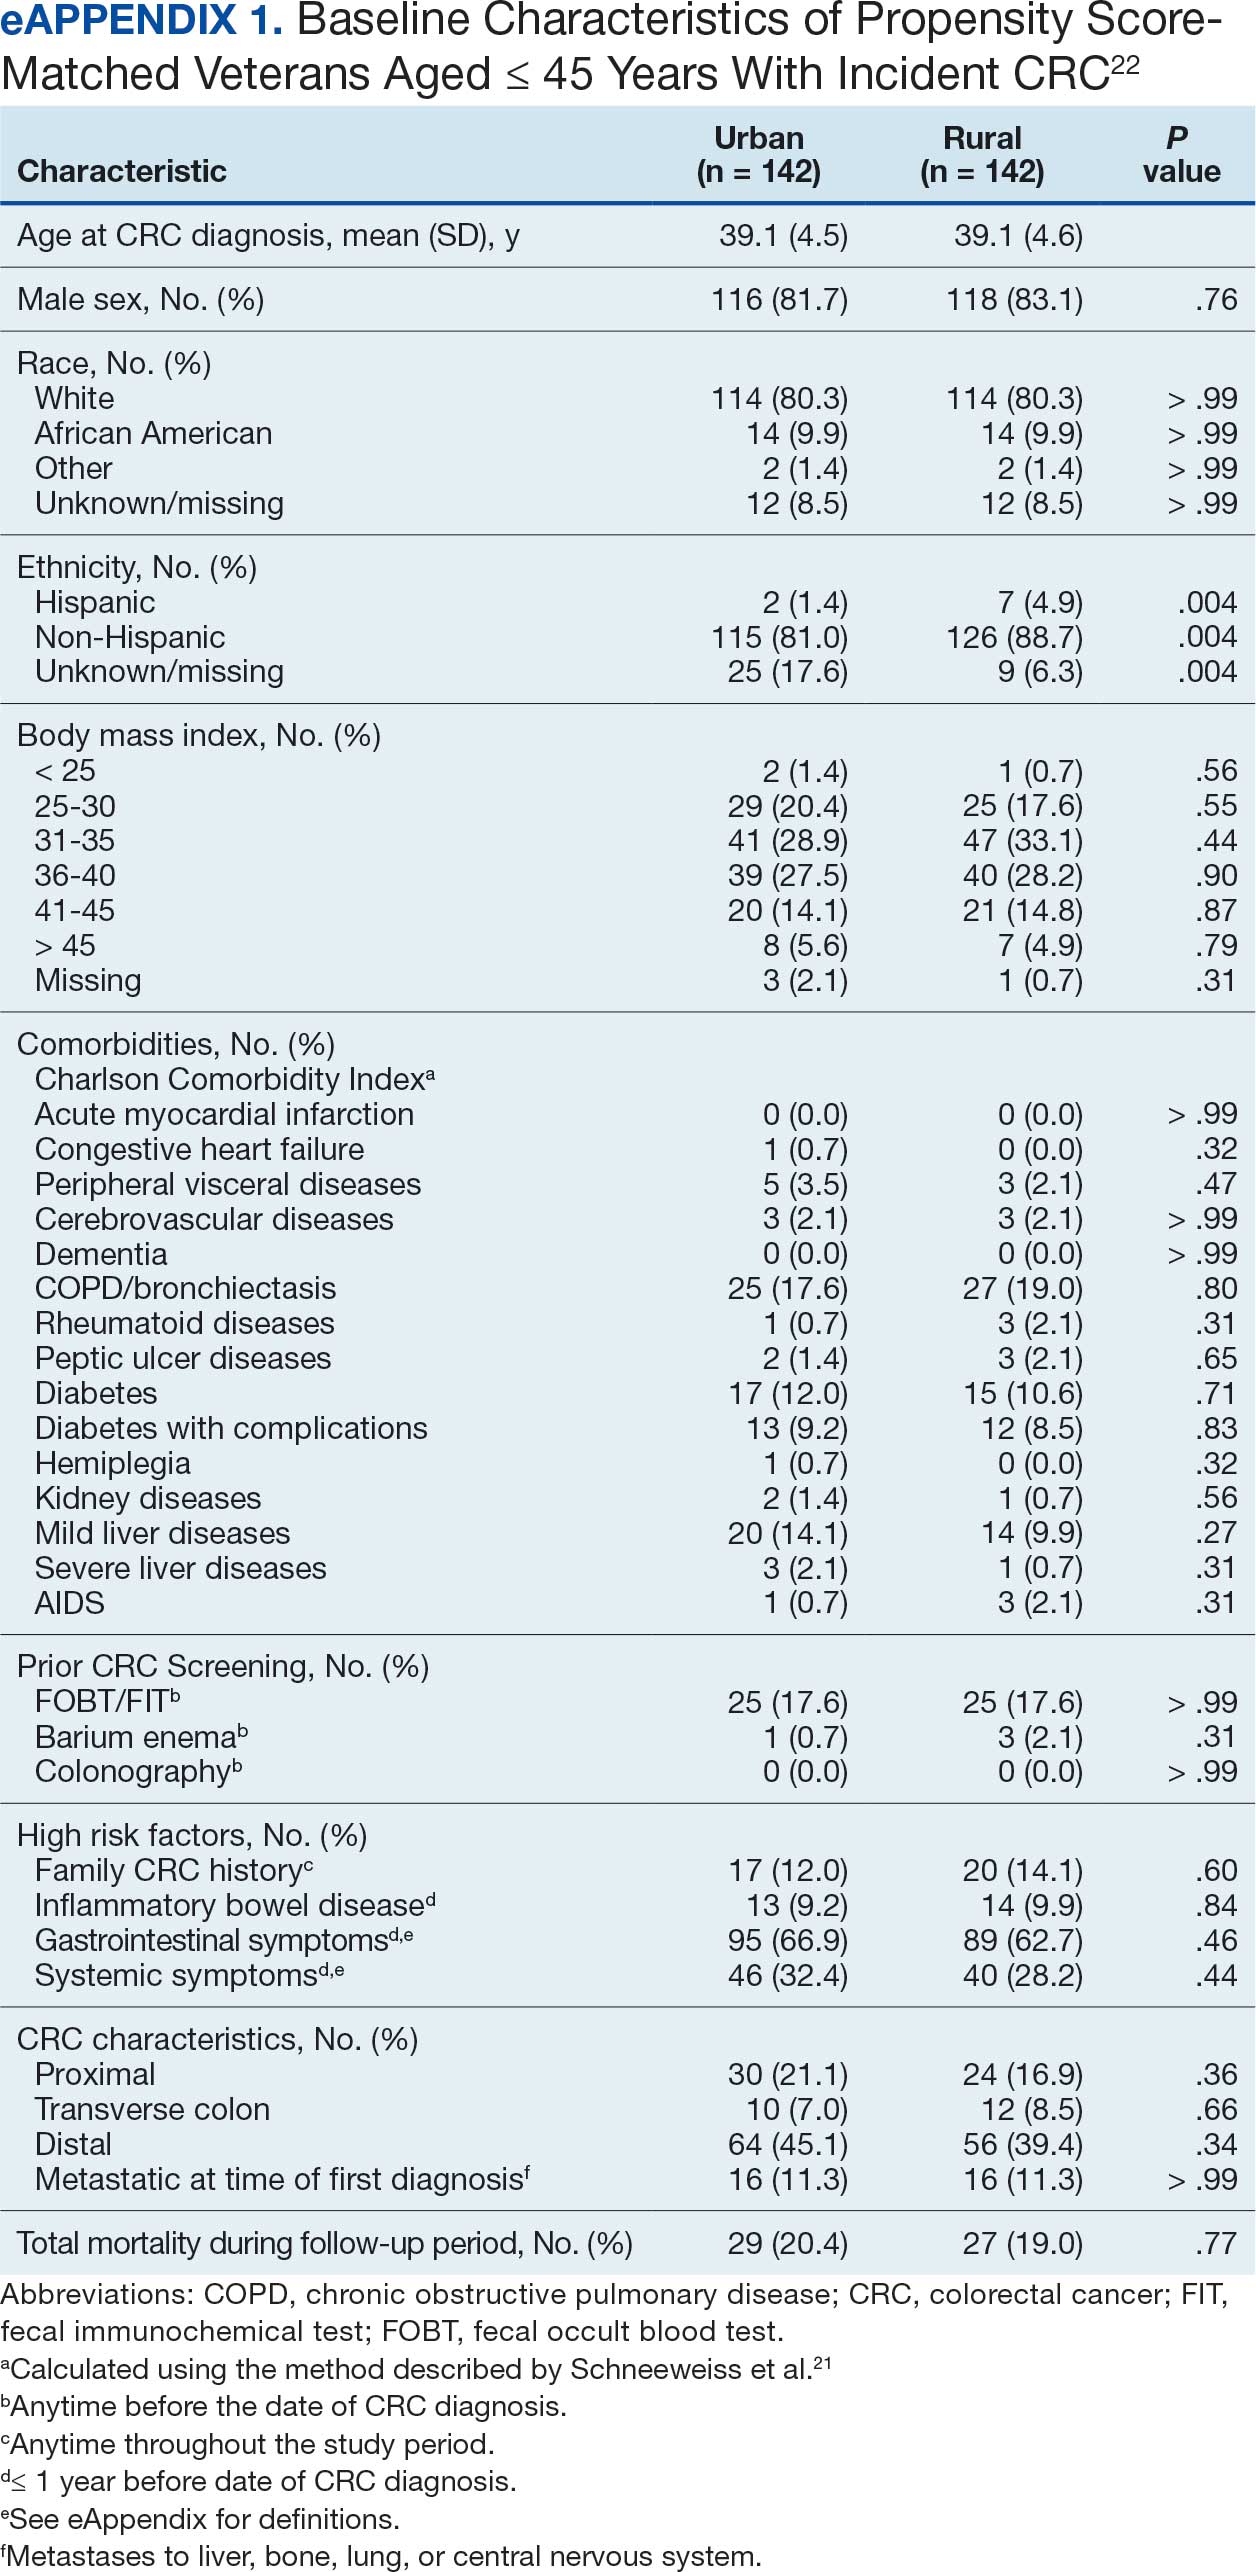
Among veterans aged ≤ 45 years, 551 were diagnosed with CRC (391 urban and 160 rural). We PS-matched 142 pairs of urban and rural veterans without residual differences in baseline characteristics (eAppendix 1). There was no significant difference in the HR of mortality between rural and urban veterans aged ≤ 45 years (HR, 0.97; 95% CI, 0.57-1.63; P = .90) (Figure 2). Similarly, no difference in mortality was observed adjusting for PS between all rural and urban veterans aged ≤ 45 years (HR, 1.03; 95% CI, 0.67-1.59; P = .88).
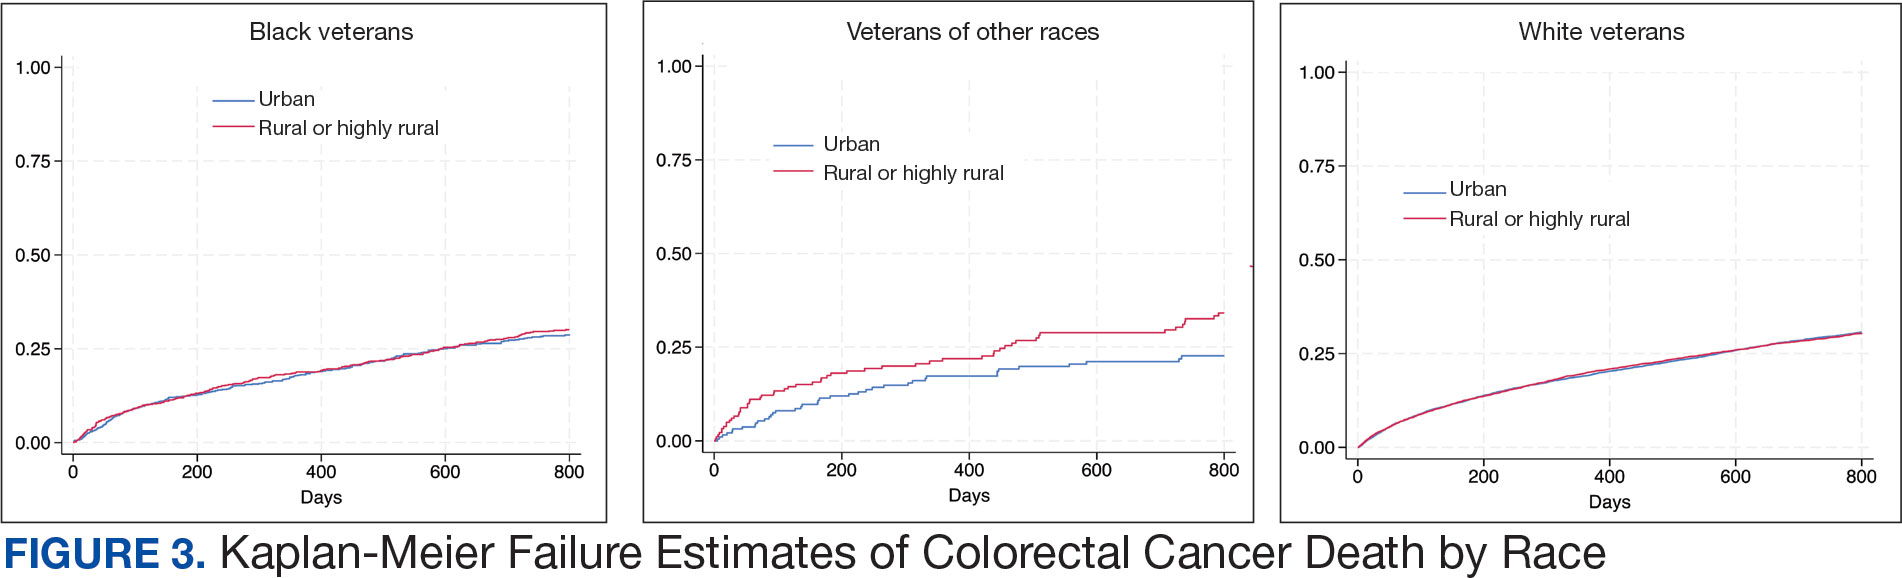
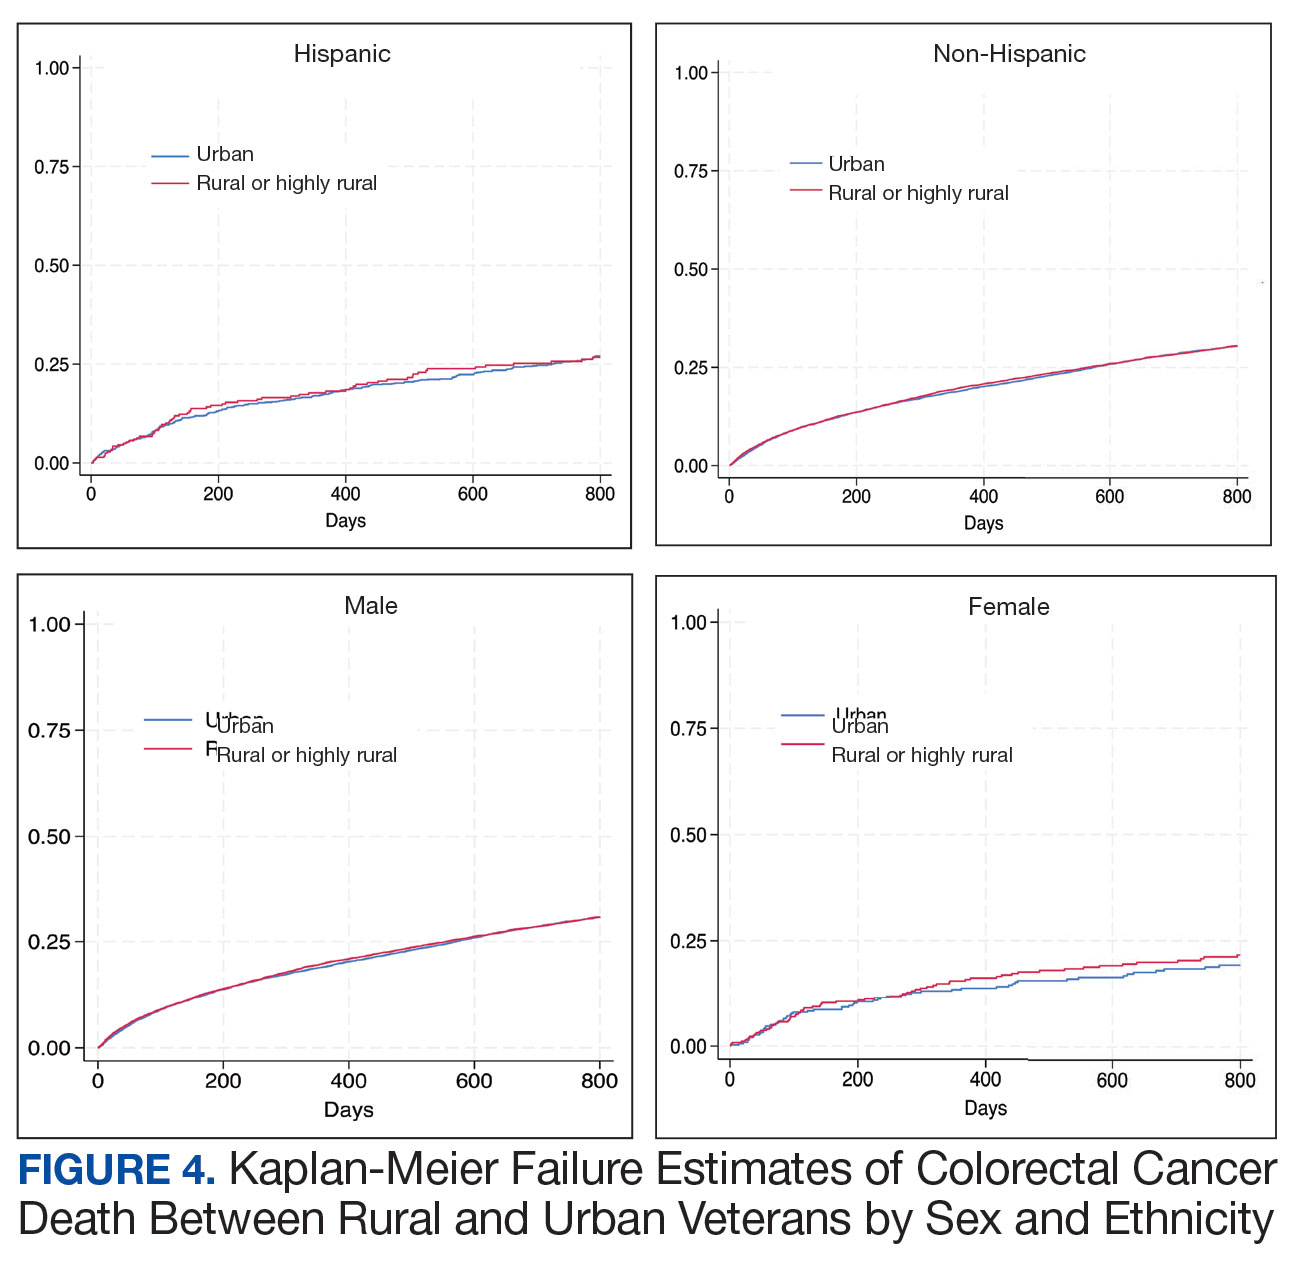
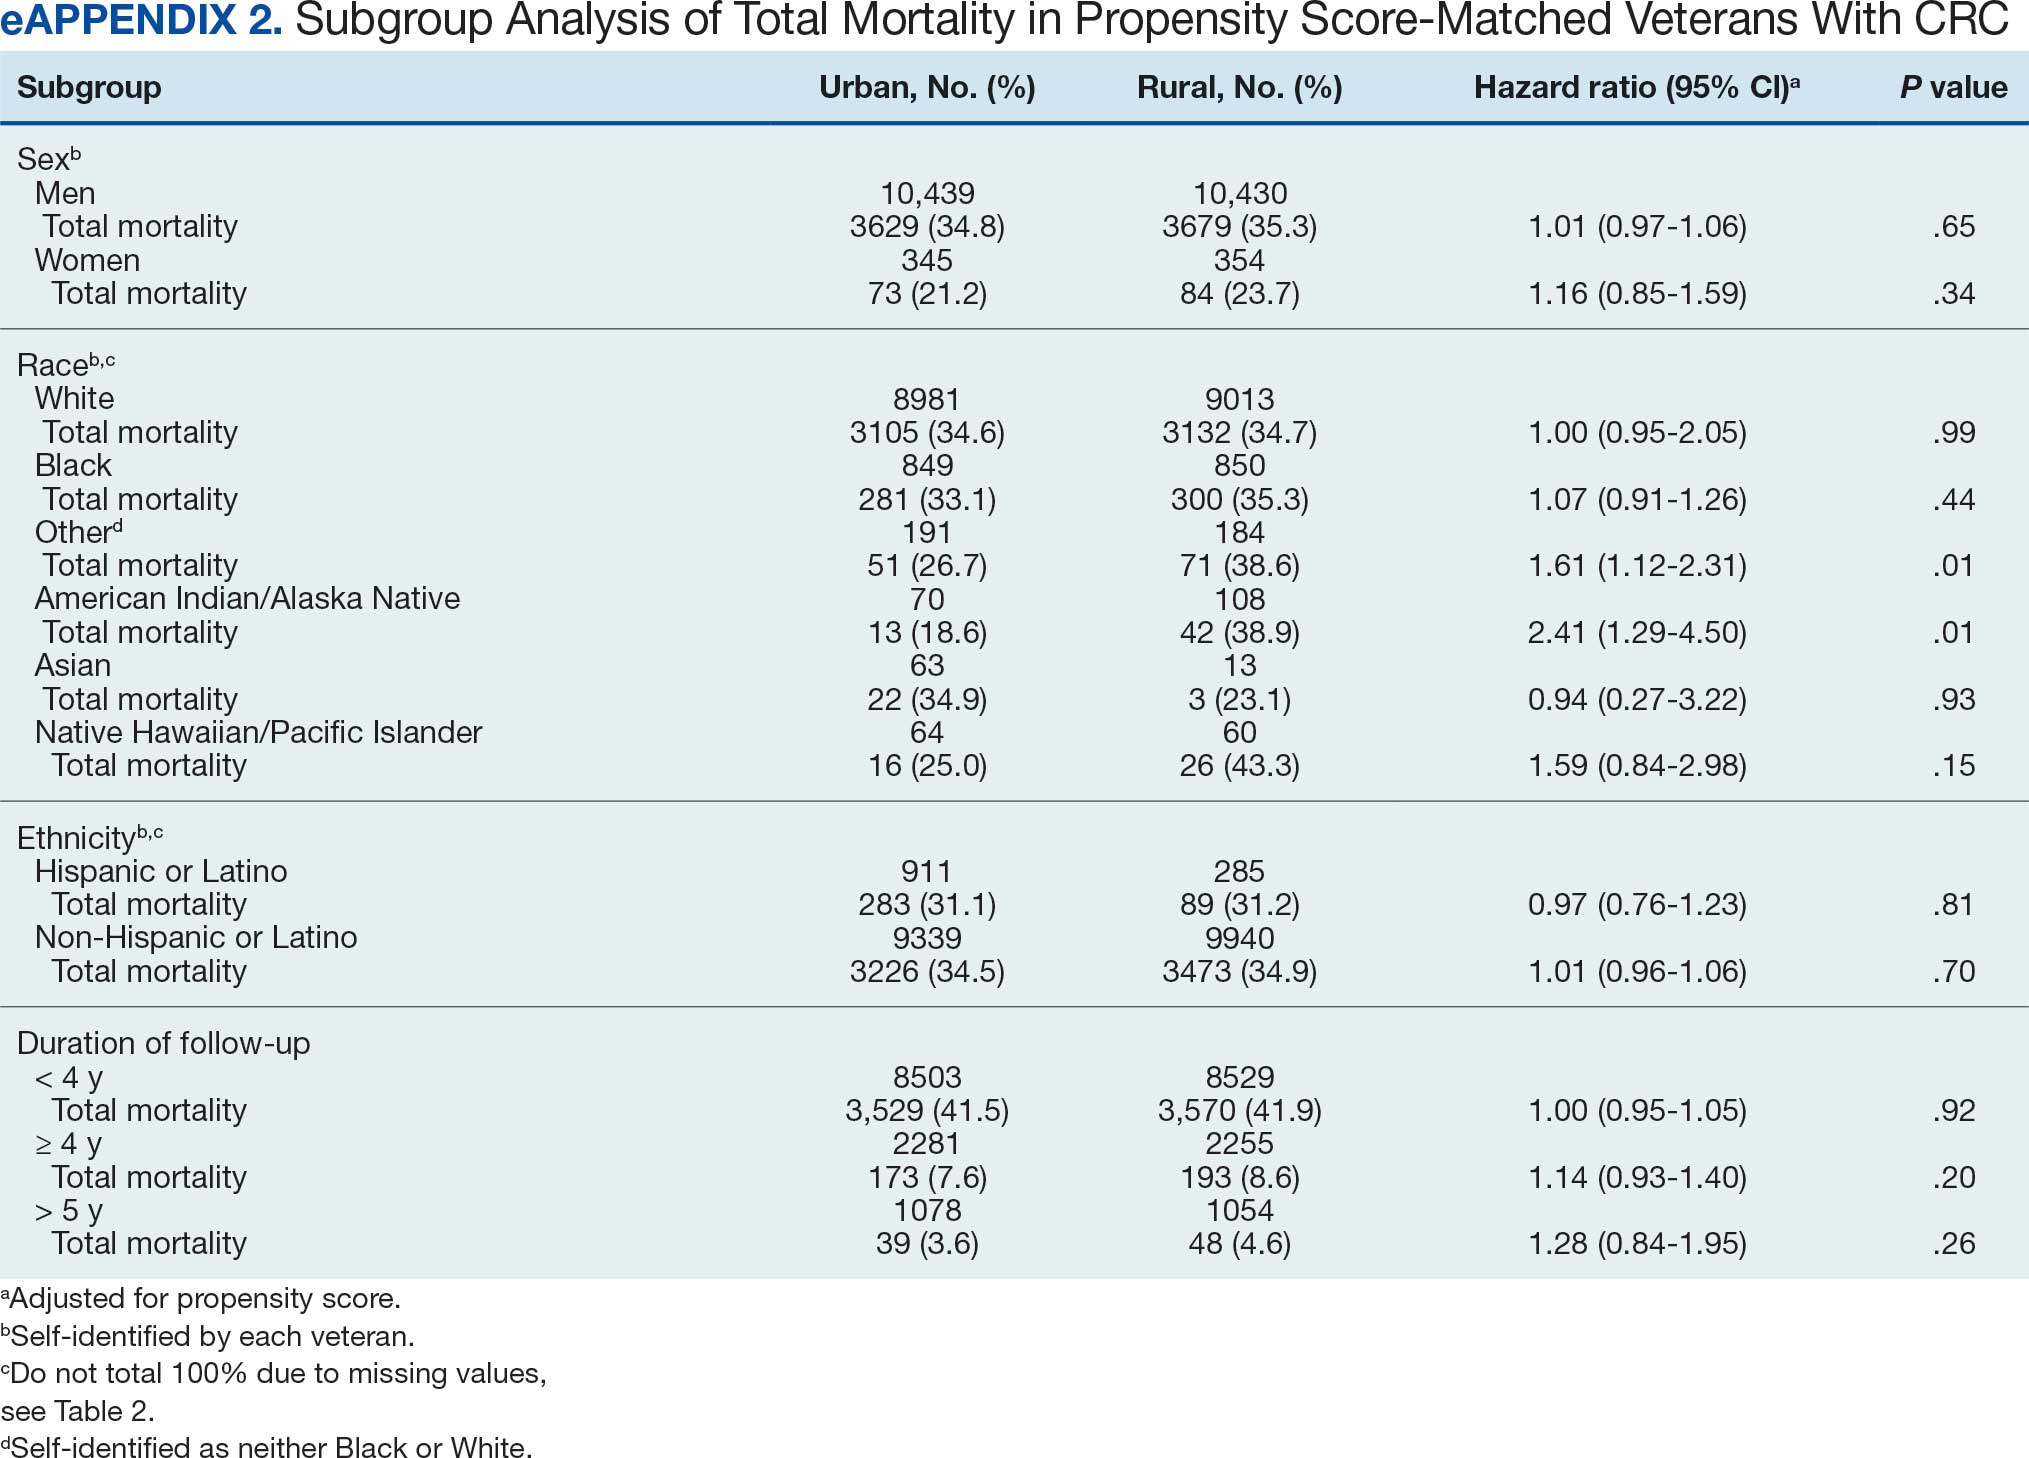
There was no difference in total mortality between rural and urban veterans in any subgroup except for American Indian or Alaska Native veterans (HR, 2.41; 95% CI, 1.29-4.50; P = .006) (eAppendix 2).
Discussion
This study examined characteristics of patients with CRC between urban and rural areas among veterans who were VHA patients. Similar to other studies, rural veterans with CRC were older, more likely to be White, and were obese, but exhibited fewer comorbidities (lower CCI and lower incidence of congestive heart failure, dementia, hemiplegia, kidney diseases, liver diseases and AIDS, but higher incidence of chronic obstructive lung disease).8,16 The incidence of CRC in this study population was lowest in FY 2020, which was reported by the Centers for Disease Control and Prevention and is attributed to COVID-19 pandemic disruption of health services.24 The overall mortality in this study was similar to rates reported in other studies from the VA Central Cancer Registry.4 In the PS-matched cohort, where baseline characteristics were similar between urban and rural patients with CRC, we found no disparities in CRC-specific mortality between veterans in rural and urban areas. Additionally, when analysis was restricted to veterans aged ≤ 45 years, the results remained consistent.
Subgroup analyses showed no significant difference in mortality between rural and urban areas by sex, race or ethnicity, except rural American Indian or Alaska Native veterans who had double the mortality of their urban counterparts (HR, 2.41; 95% CI, 1.29-4.50; P = .006). This finding is difficult to interpret due to the small number of events and the wide CI. While with a Bonferroni correction the adjusted P value was .08, which is not statistically significant, a previous study found that although CRC incidence was lower overall in American Indian or Alaska Native populations compared to non-Hispanic White populations, CRC incidence was higher among American Indian or Alaska Native individuals in some areas such as Alaska and the Northern Plains.25,26 Studies have noted that rural American Indian/Alaska Native populations experience greater poverty, less access to broadband internet, and limited access to care, contributing to poorer cancer outcomes and lower survival.27 Thus, the finding of disparity in mortality between rural and urban American Indian or Alaska Native veterans warrants further study.
Other studies have raised concerns that CRC disproportionately affects adults in rural areas with higher mortality rates.14-16 These disparities arise from sociodemographic factors and modifiable risk factors, including physical activity, dietary patterns, access to cancer screening, and gaps in quality treatment resources.16,28 These factors operate at multiple levels: from individual, local health system, to community and policy.2,27 For example, a South Carolina study (1996–2016) found that residents in rural areas were more likely to be diagnosed with advanced CRC, possibly indicating lower rates of CRC screening in rural areas. They also had higher likelihood of death from CRC.15 However, the study did not include any clinical parameters, such as comorbidities or obesity. A statewide, population-based study in Utah showed that rural men experienced a lower CRC survival in their unadjusted analysis.16 However, the study was small, with only 3948 urban and 712 rural residents. Additionally, there was no difference in total mortality in the whole cohort (HR, 0.96; 95% CI, 0.86-1.07) or in CRC-specific death (HR, 0.93; 95% CI, 0.81-1.08). A nationwide study also showed that CRC mortality rates were 8% higher in nonmetropolitan or rural areas than in the most urbanized areas containing large metropolitan counties.29 However, this study did not include descriptions of clinical confounders, such as comorbidities, making it difficult to ascertain whether the difference in CRC mortality was due to rurality or differences in baseline risk characteristics.
In this study, the lack of CRC-specific mortality disparities may be attributed to the structures and practices of VHA health care. Recent studies have noted that mortality of several chronic medical conditions treated at the VHA was lower than at non-VHA hospitals.30,31 One study that measured the quality of nonmetastatic CRC care based on National Comprehensive Cancer Network guidelines showed that > 72% of VHA patients received guideline-concordant care for each diagnostic and therapeutic measure, except for follow-up colonoscopy timing, which appear to be similar or superior to that of the private sector.30,32,33 Some of the VA initiative for CRC screening may bypass the urban-rurality divide such as the mailed fecal immunochemical test program for CRC. This program was implemented at the onset of the COVID-19 pandemic to avoid disruptions of medical care.34 Rural patients are more likely to undergo fecal immunochemical testing when compared to urban patients in this data. Beyond clinical care, the VHA uses processes to tackle social determinants of health such as housing, food security, and transportation, promoting equal access to health care, and promoting cultural competency among HCPs.35-37
The results suggest that solutions to CRC disparities between rural and urban areas need to consider known barriers to rural health care, including transportation, diminished rural health care workforce, and other social determinants of health.9,10,27,38 VHA makes considerable efforts to provide equitable care to all enrolled veterans, including specific programs for rural veterans, including ongoing outreach.39 This study demonstrated lack of disparity in CRC-specific mortality in veterans receiving VHA care, highlighting the importance of these efforts.
Strengths and Limitations
This study used the VHA cohort to compare patient characteristics and mortality between patients with CRC residing in rural and urban areas. The study provides nationwide perspectives on CRC across the geographical spectrum and used a longitudinal cohort with prolonged follow-up to account for comorbidities.
However, the study compared a cohort of rural and urban veterans enrolled in the VHA; hence, the results may not reflect CRC outcomes in veterans without access to VHA care. Rurality has been independently associated with decreased likelihood of meeting CRC screening guidelines among veterans and military service members.38 This study lacked sufficient information to compare CRC staging or treatment modalities among veterans. Although the data cannot identify CRC stage, the proportions of patients with metastatic CRC at diagnosis and CRC location were similar between groups. The study did not have information on their care outside of VHA setting.
This study could not ascertain whether disparities existed in CRC treatment modality since rural residence may result in referral to community-based CRC care, which did not appear in the data. To address these limitations, we used death from any cause as the primary outcome, since death is a hard outcome and is not subject to ascertainment bias. The relatively short follow-up time is another limitation, though subgroup analysis by follow-up did not show significant differences. Despite PS matching, residual unmeasured confounding may exist between urban and rural groups. The predominantly White, male VHA population with high CCI may limit the generalizability of the results.
Conclusions
Rural VHA enrollees had similar survival rates after CRC diagnosis compared to their urban counterparts in a PS-matched analysis. The VHA models of care—including mailed CRC screening tools, several socioeconomic determinants of health (housing, food security, and transportation), and promoting equal access to health care, as well as cultural competency among HCPs—HCPs—may help alleviate disparities across the rural-urban spectrum. The VHA should continue efforts to enroll veterans and provide comprehensive coordinated care in community partnerships.
- Siegel RL, Wagle NS, Cercek A, Smith RA, Jemal A. Colorectal cancer statistics, 2023. CA Cancer J Clin. 2023;73(3):233-254. doi:10.3322/caac.21772
- Carethers JM, Doubeni CA. Causes of socioeconomic disparities in colorectal cancer and intervention framework and strategies. Gastroenterology. 2020;158(2):354-367. doi:10.1053/j.gastro.2019.10.029
- Murphy G, Devesa SS, Cross AJ, Inskip PD, McGlynn KA, Cook MB. Sex disparities in colorectal cancer incidence by anatomic subsite, race and age. Int J Cancer. 2011;128(7):1668-75. doi:10.1002/ijc.25481
- Zullig LL, Smith VA, Jackson GL, et al. Colorectal cancer statistics from the Veterans Affairs central cancer registry. Clin Colorectal Cancer. 2016;15(4):e199-e204. doi:10.1016/j.clcc.2016.04.005
- Lin JS, Perdue LA, Henrikson NB, Bean SI, Blasi PR. Screening for Colorectal Cancer: An Evidence Update for the US Preventive Services Task Force. 2021. U.S. Preventive Services Task Force Evidence Syntheses, formerly Systematic Evidence Reviews:Chapter 1. Agency for Healthcare Research and Quality (US); 2021. Accessed February 18, 2025. https://www.ncbi.nlm.nih.gov/books/NBK570917/
- Siegel RL, Fedewa SA, Anderson WF, et al. Colorectal cancer incidence patterns in the United States, 1974-2013. J Natl Cancer Inst. 2017;109(8). doi:10.1093/jnci/djw322
- Davidson KW, Barry MJ, Mangione CM, et al. Screening for colorectal cancer: US Preventive Services Task Force recommendation statement. JAMA. 2021;325(19):1965-1977. doi:10.1001/jama.2021.6238
- Hines R, Markossian T, Johnson A, Dong F, Bayakly R. Geographic residency status and census tract socioeconomic status as determinants of colorectal cancer outcomes. Am J Public Health. 2014;104(3):e63-e71. doi:10.2105/AJPH.2013.301572
- Cauwels J. The many barriers to high-quality rural health care. 2022;(9):1-32. NEJM Catal Innov Care Deliv. Accessed April 24, 2025. https://catalyst.nejm.org/doi/pdf/10.1056/CAT.22.0254
- Gong G, Phillips SG, Hudson C, Curti D, Philips BU. Higher US rural mortality rates linked to socioeconomic status, physician shortages, and lack of health insurance. Health Aff (Millwood);38(12):2003-2010. doi:10.1377/hlthaff.2019.00722
- Aboagye JK, Kaiser HE, Hayanga AJ. Rural-urban differences in access to specialist providers of colorectal cancer care in the United States: a physician workforce issue. JAMA Surg. 2014;149(6):537-543. doi:10.1001/jamasurg.2013.5062
- Lyckholm LJ, Hackney MH, Smith TJ. Ethics of rural health care. Crit Rev Oncol Hematol. 2001;40(2):131-138. doi:10.1016/s1040-8428(01)00139-1
- Krieger N, Williams DR, Moss NE. Measuring social class in US public health research: concepts, methodologies, and guidelines. Annu Rev Public Health. 1997;18:341-378. doi:10.1146/annurev.publhealth.18.1.341
- Singh GK, Jemal A. Socioeconomic and racial/ethnic disparities in cancer mortality, incidence, and survival in the United States, 1950-2014: over six decades of changing patterns and widening inequalities. J Environ Public Health. 2017;2017:2819372. doi:10.1155/2017/2819372
- Adams SA, Zahnd WE, Ranganathan R, et al. Rural and racial disparities in colorectal cancer incidence and mortality in South Carolina, 1996 - 2016. J Rural Health. 2022;38(1):34-39. doi:10.1111/jrh.12580
- Rogers CR, Blackburn BE, Huntington M, et al. Rural- urban disparities in colorectal cancer survival and risk among men in Utah: a statewide population-based study. Cancer Causes Control. 2020;31(3):241-253. doi:10.1007/s10552-020-01268-2
- US Department of Veterans Affairs. VA Informatics and Computing Infrastructure (VINCI), VA HSR RES 13-457. https://vincicentral.vinci.med.va.gov [Source not verified]
- US Department of Veterans Affairs Information Resource Center. VIReC Research User Guide: PSSG Geocoded Enrollee Files, 2015 Edition. US Department of Veterans Affairs, Health Services Research & Development Service, Information Resource Center; May. 2016. [source not verified]
- Goldsmith HF, Puskin DS, Stiles DJ. Improving the operational definition of “rural areas” for federal programs. US Department of Health and Human Services; 1993. Accessed February 27, 2025. https://www.ruralhealthinfo.org/pdf/improving-the-operational-definition-of-rural-areas.pdf
- Adams MA, Kerr EA, Dominitz JA, et al. Development and validation of a new ICD-10-based screening colonoscopy overuse measure in a large integrated healthcare system: a retrospective observational study. BMJ Qual Saf. 2023;32(7):414-424. doi:10.1136/bmjqs-2021-014236
- Schneeweiss S, Wang PS, Avorn J, Glynn RJ. Improved comorbidity adjustment for predicting mortality in Medicare populations. Health Serv Res. 2003;38(4):1103-1120. doi:10.1111/1475-6773.00165
- Becker S, Ichino A. Estimation of average treatment effects based on propensity scores. The Stata Journal. 2002;2(4):358-377.
- Leuven E, Sianesi B. PSMATCH2: Stata module to perform full Mahalanobis and propensity score matching, common support graphing, and covariate imbalance testing. Statistical software components. Revised February 1, 2018. Accessed February 27, 2025. https://ideas.repec.org/c/boc/bocode/s432001.html.
- US Cancer Statistics Working Group. US cancer statistics data visualizations tool. Centers for Disease Control and Prevention. June 2024. Accessed February 27, 2025. https://www.cdc.gov/cancer/dataviz
- Cao J, Zhang S. Multiple Comparison Procedures. JAMA. 2014;312(5):543-544. doi:10.1001/jama.2014.9440
- Gopalani SV, Janitz AE, Martinez SA, et al. Trends in cancer incidence among American Indians and Alaska Natives and Non-Hispanic Whites in the United States, 1999-2015. Epidemiology. 2020;31(2):205-213. doi:10.1097/EDE.0000000000001140
- Zahnd WE, Murphy C, Knoll M, et al. The intersection of rural residence and minority race/ethnicity in cancer disparities in the United States. Int J Environ Res Public Health. 2021;18(4). doi:10.3390/ijerph18041384
- Blake KD, Moss JL, Gaysynsky A, Srinivasan S, Croyle RT. Making the case for investment in rural cancer control: an analysis of rural cancer incidence, mortality, and funding trends. Cancer Epidemiol Biomarkers Prev. 2017;26(7):992-997. doi:10.1158/1055-9965.EPI-17-0092
- Singh GK, Williams SD, Siahpush M, Mulhollen A. Socioeconomic, rural-urban, and racial inequalities in US cancer mortality: part i-all cancers and lung cancer and part iicolorectal, prostate, breast, and cervical cancers. J Cancer Epidemiol. 2011;2011:107497. doi:10.1155/2011/107497
- Jackson GL, Melton LD, Abbott DH, et al. Quality of nonmetastatic colorectal cancer care in the Department of Veterans Affairs. J Clin Oncol. 2010;28(19):3176-3181. doi:10.1200/JCO.2009.26.7948
- Yoon J, Phibbs CS, Ong MK, et al. Outcomes of veterans treated in Veterans Affairs hospitals vs non-Veterans Affairs hospitals. JAMA Netw Open. 2023;6(12):e2345898. doi:10.1001/jamanetworkopen.2023.45898
- Malin JL, Schneider EC, Epstein AM, Adams J, Emanuel EJ, Kahn KL. Results of the National Initiative for Cancer Care Quality: how can we improve the quality of cancer care in the United States? J Clin Oncol. 2006;24(4):626-634. doi:10.1200/JCO.2005.03.3365
- Levin B, Lieberman DA, McFarland B, et al. Screening and surveillance for the early detection of colorectal cancer and adenomatous polyps, 2008: a joint guideline from the American Cancer Society, the US Multi-Society Task Force on Colorectal Cancer, and the American College of Radiology. Gastroenterology. 2008;134(5):1570-1595. doi:10.1053/j.gastro.2008.02.002
- Deeds SA, Moore CB, Gunnink EJ, et al. Implementation of a mailed faecal immunochemical test programme for colorectal cancer screening among Veterans. BMJ Open Qual. 2022;11(4). doi:10.1136/bmjoq-2022-001927
- Yehia BR, Greenstone CL, Hosenfeld CB, Matthews KL, Zephyrin LC. The role of VA community care in addressing health and health care disparities. Med Care. 2017;55(Suppl 9 suppl 2):S4-S5. doi:10.1097/MLR.0000000000000768
- Wright BN, MacDermid Wadsworth S, Wellnitz A, Eicher- Miller HA. Reaching rural veterans: a new mechanism to connect rural, low-income US Veterans with resources and improve food security. J Public Health (Oxf). 2019;41(4):714-723. doi:10.1093/pubmed/fdy203
- Nelson RE, Byrne TH, Suo Y, et al. Association of temporary financial assistance with housing stability among US veterans in the supportive services for veteran families program. JAMA Netw Open. 2021;4(2):e2037047. doi:10.1001/jamanetworkopen.2020.37047
- McDaniel JT, Albright D, Lee HY, et al. Rural–urban disparities in colorectal cancer screening among military service members and Veterans. J Mil Veteran Fam Health. 2019;5(1):40-48. doi:10.3138/jmvfh.2018-0013
- US Department of Veterans Affairs, Office of Rural Health. The rural veteran outreach toolkit. Updated February 12, 2025. Accessed February 18, 2025. https://www.ruralhealth.va.gov/partners/toolkit.asp
Colorectal cancer (CRC) is the second-leading cause of cancer-related deaths in the United States, with an estimated 52,550 deaths in 2023.1 However, the disease burden varies among different segments of the population.2 While both CRC incidence and mortality have been decreasing due to screening and advances in treatment, there are disparities in incidence and mortality across the sociodemographic spectrum including race, ethnicity, education, and income.1-4 While CRC incidence is decreasing for older adults, it is increasing among those aged < 55 years.5 The incidence of CRC in adults aged 40 to 54 years has increased by 0.5% to 1.3% annually since the mid-1990s.6 The US Preventive Services Task Force now recommends starting CRC screening at age 45 years for asymptomatic adults with average risk.7
Disparities also exist across geographical boundaries and living environment. Rural Americans faces additional challenges in health and lifestyle that can affect CRC outcomes. Compared to their urban counterparts, rural residents are more likely to be older, have lower levels of education, higher levels of poverty, lack health insurance, and less access to health care practitioners (HCPs).8-10 Geographic proximity, defined as travel time or physical distance to a health facility, has been recognized as a predictor of inferior outcomes.11 These aspects of rural living may pose challenges for accessing care for CRC screening and treatment.11-13 National and local studies have shown disparities in CRC screening rates, incidence, and mortality between rural and urban populations.14-16
It is unclear whether rural/urban disparities persist under the Veterans Health Administration (VHA) health care delivery model. This study examined differences in baseline characteristics and mortality between rural and urban veterans newly diagnosed with CRC. We also focused on a subpopulation aged ≤ 45 years.
Methods
This study extracted national data from the US Department of Veterans Affairs (VA) Corporate Data Warehouse (CDW) hosted in the VA Informatics and Computing Infrastructure (VINCI) environment. VINCI is an initiative to improve access to VA data and facilitate the analysis of these data while ensuring veterans’ privacy and data security.17 CDW is the VHA business intelligence information repository, which extracts data from clinical and nonclinical sources following prescribed and validated protocols. Data extracted included demographics, diagnosis, and procedure codes for both inpatient and outpatient encounters, vital signs, and vital status. This study used data previously extracted from a national cohort of veterans that encompassed all patients who received a group of commonly prescribed medications, such as statins, proton pump inhibitors, histamine-2 blockers, acetaminophen-containing products, and hydrocortisone-containing skin applications. This cohort encompassed 8,648,754 veterans, from whom 2,460,727 had encounters during fiscal years (FY) 2016 to 2021 (study period). The cohort was used to ensure that subjects were VHA patients, allowing them to adequately capture their clinical profiles.
Patients were identified as rural or urban based on their residence address at the date of their first diagnosis of CRC. The Geospatial Service Support Center (GSSC) aggregates and updates veterans’ residence address records for all enrolled veterans from the National Change of Address database. The data contain 1 record per enrollee. GSSC Geocoded Enrollee File contains enrollee addresses and their rurality indicators, categorized as urban, rural, or highly rural.18 Rurality is defined by the Rural Urban Commuting Area (RUCA) categories developed by the Department of Agriculture and the Health Resources and Services Administration of the US Department of Health and Human Services.19 Urban areas had RUCA codes of 1.0 to 1.1, and highly rural areas had RUCA scores of 10.0. All other areas were classified as rural. Since the proportion of veterans from highly rural areas was small, we included residents from highly rural areas in the rural residents’ group.
Inclusion and Exclusion Criteria
All veterans newly diagnosed with CRC from FY 2016 to 2021 were included. We used the ninth and tenth clinical modification revisions of the International Classification of Diseases (ICD-9-CM and ICD-10-CM) to define CRC diagnosis (Supplemental materials).4,20 To ensure that patients were newly diagnosed with CRC, this study excluded patients with a previous ICD-9-CM code for CRC diagnosis since FY 2003.
Comorbidities were identified using diagnosis and procedure codes from inpatient and outpatient encounters, which were used to calculate the Charlson Comorbidity Index (CCI) at the time of CRC diagnosis using the weighted method described by Schneeweiss et al.21 We defined CRC high-risk conditions and CRC screening tests, including flexible sigmoidoscopy and stool tests, as described in previous studies (Supplemental materials).20
The main outcome was total mortality. The date of death was extracted from the VHA Death Ascertainment File, which contains mortality data from the Master Person Index file in CDW and the Social Security Administration Death Master File. We used the date of death from any cause, as cause of death was not available.
A propensity score (PS) was created to match rural (including highly rural) and urban residents at a ratio of 1:1. Using a standard procedure described in prior publications, multivariable logistic regression used all baseline characteristics to estimate the PS and perform nearest-number matching without replacement.22,23 A caliper of 0.01 maximized the matched cohort size and achieved balance (Supplemental materials). We then examined the balance of baseline characteristics between PS-matched groups.
Analyses
Cox proportional hazards regression analysis estimated the hazard ratio (HR) of death in rural residents compared to urban residents in the PS-matched cohort. The outcome event was the date of death during the study’s follow-up period (defined as period from first CRC diagnosis to death or study end), with censoring at the study’s end date (September 30, 2021). The proportional hazards assumption was assessed by inspecting the Kaplan-Meier curves. Multiple analyses examined the HR of total mortality in the PS-matched cohort, stratified by sex, race, and ethnicity. We also examined the HR of total mortality stratified by duration of follow-up.
Another PS-matching analysis among veterans aged ≤ 45 years was performed using the same techniques described earlier in this article. We performed a Cox proportional hazards regression analysis to compare mortality in PS-matched urban and rural veterans aged ≤ 45 years. The HR of death in all veterans aged ≤ 45 years (before PS-matching) was estimated using Cox proportional hazard regression analysis, adjusting for PS.
Dichotomous variables were compared using X2 tests and continuous variables were compared using t tests. Baseline characteristics with missing values were converted into categorical variables and the proportion of subjects with missing values was equalized between treatment groups after PS-matching. For subgroup analysis, we examined the HR of total mortality in each subgroup using separate Cox proportional hazards regression models similar to the primary analysis but adjusted for PS. Due to multiple comparisons in the subgroup analysis, the findings should be considered exploratory. Statistical tests were 2-tailed, and significance was defined as P < .05. Data management and statistical analyses were conducted from June 2022 to January 2023 using STATA, Version 17. The VA Orlando Healthcare System Institutional Review Board approved the study and waived requirements for informed consent because only deidentified data were used.
Results
After excluding 49 patients (Supplemental materials, available at doi:10.12788/fp.0560), we identified 30,219 veterans with newly diagnosed CRC between FY 2016 to 2021 (Table 1). Of these, 19,422 (64.3%) resided in urban areas and 10,797 (35.7%) resided in rural areas (Table 2). The mean (SD) duration from the first CRC diagnosis to death or study end was 832 (640) days, and the median (IQR) was 723 (246–1330) days. Overall, incident CRC diagnoses were numerically highest in FY 2016 and lowest in FY 2020 (Figure 1). Patients with CRC in rural areas vs urban areas were significantly older (mean, 71.2 years vs 70.8 years, respectively; P < .001), more likely to be male (96.7% vs 95.7%, respectively; P < .001), more likely to be White (83.6% vs 67.8%, respectively; P < .001) and more likely to be non-Hispanic (92.2% vs 87.5%, respectively; P < .001). In terms of general health, rural veterans with CRC were more likely to be overweight or obese (81.5% rural vs 78.5% urban; P < .001) but had fewer mean comorbidities as measured by CCI (5.66 rural vs 5.90 urban; P < .001). A higher proportion of rural veterans with CRC had received stool-based (fecal occult blood test or fecal immunochemical test) CRC screening tests (61.6% rural vs 57.2% urban; P < .001). Fewer rural patients presented with systemic symptoms or signs within 1 year of CRC diagnosis (54.4% rural vs 57.5% urban, P < .001). Among urban patients with CRC, 6959 (35.8%) deaths were observed, compared with 3766 (34.9%) among rural patients (P = .10).
There were 21,568 PS-matched veterans: 10,784 in each group. In the PS-matched cohort, baseline characteristics were similar between veterans in urban and rural communities, including age, sex, race/ethnicity, body mass index, and comorbidities. Among rural patients with CRC, 3763 deaths (34.9%) were observed compared with 3702 (34.3%) among urban veterans. There was no significant difference in the HR of mortality between rural and urban CRC residents (HR, 1.01; 95% CI, 0.97-1.06; P = .53) (Figure 2).
Among veterans aged ≤ 45 years, 551 were diagnosed with CRC (391 urban and 160 rural). We PS-matched 142 pairs of urban and rural veterans without residual differences in baseline characteristics (eAppendix 1). There was no significant difference in the HR of mortality between rural and urban veterans aged ≤ 45 years (HR, 0.97; 95% CI, 0.57-1.63; P = .90) (Figure 2). Similarly, no difference in mortality was observed adjusting for PS between all rural and urban veterans aged ≤ 45 years (HR, 1.03; 95% CI, 0.67-1.59; P = .88).
There was no difference in total mortality between rural and urban veterans in any subgroup except for American Indian or Alaska Native veterans (HR, 2.41; 95% CI, 1.29-4.50; P = .006) (eAppendix 2).
Discussion
This study examined characteristics of patients with CRC between urban and rural areas among veterans who were VHA patients. Similar to other studies, rural veterans with CRC were older, more likely to be White, and were obese, but exhibited fewer comorbidities (lower CCI and lower incidence of congestive heart failure, dementia, hemiplegia, kidney diseases, liver diseases and AIDS, but higher incidence of chronic obstructive lung disease).8,16 The incidence of CRC in this study population was lowest in FY 2020, which was reported by the Centers for Disease Control and Prevention and is attributed to COVID-19 pandemic disruption of health services.24 The overall mortality in this study was similar to rates reported in other studies from the VA Central Cancer Registry.4 In the PS-matched cohort, where baseline characteristics were similar between urban and rural patients with CRC, we found no disparities in CRC-specific mortality between veterans in rural and urban areas. Additionally, when analysis was restricted to veterans aged ≤ 45 years, the results remained consistent.
Subgroup analyses showed no significant difference in mortality between rural and urban areas by sex, race or ethnicity, except rural American Indian or Alaska Native veterans who had double the mortality of their urban counterparts (HR, 2.41; 95% CI, 1.29-4.50; P = .006). This finding is difficult to interpret due to the small number of events and the wide CI. While with a Bonferroni correction the adjusted P value was .08, which is not statistically significant, a previous study found that although CRC incidence was lower overall in American Indian or Alaska Native populations compared to non-Hispanic White populations, CRC incidence was higher among American Indian or Alaska Native individuals in some areas such as Alaska and the Northern Plains.25,26 Studies have noted that rural American Indian/Alaska Native populations experience greater poverty, less access to broadband internet, and limited access to care, contributing to poorer cancer outcomes and lower survival.27 Thus, the finding of disparity in mortality between rural and urban American Indian or Alaska Native veterans warrants further study.
Other studies have raised concerns that CRC disproportionately affects adults in rural areas with higher mortality rates.14-16 These disparities arise from sociodemographic factors and modifiable risk factors, including physical activity, dietary patterns, access to cancer screening, and gaps in quality treatment resources.16,28 These factors operate at multiple levels: from individual, local health system, to community and policy.2,27 For example, a South Carolina study (1996–2016) found that residents in rural areas were more likely to be diagnosed with advanced CRC, possibly indicating lower rates of CRC screening in rural areas. They also had higher likelihood of death from CRC.15 However, the study did not include any clinical parameters, such as comorbidities or obesity. A statewide, population-based study in Utah showed that rural men experienced a lower CRC survival in their unadjusted analysis.16 However, the study was small, with only 3948 urban and 712 rural residents. Additionally, there was no difference in total mortality in the whole cohort (HR, 0.96; 95% CI, 0.86-1.07) or in CRC-specific death (HR, 0.93; 95% CI, 0.81-1.08). A nationwide study also showed that CRC mortality rates were 8% higher in nonmetropolitan or rural areas than in the most urbanized areas containing large metropolitan counties.29 However, this study did not include descriptions of clinical confounders, such as comorbidities, making it difficult to ascertain whether the difference in CRC mortality was due to rurality or differences in baseline risk characteristics.
In this study, the lack of CRC-specific mortality disparities may be attributed to the structures and practices of VHA health care. Recent studies have noted that mortality of several chronic medical conditions treated at the VHA was lower than at non-VHA hospitals.30,31 One study that measured the quality of nonmetastatic CRC care based on National Comprehensive Cancer Network guidelines showed that > 72% of VHA patients received guideline-concordant care for each diagnostic and therapeutic measure, except for follow-up colonoscopy timing, which appear to be similar or superior to that of the private sector.30,32,33 Some of the VA initiative for CRC screening may bypass the urban-rurality divide such as the mailed fecal immunochemical test program for CRC. This program was implemented at the onset of the COVID-19 pandemic to avoid disruptions of medical care.34 Rural patients are more likely to undergo fecal immunochemical testing when compared to urban patients in this data. Beyond clinical care, the VHA uses processes to tackle social determinants of health such as housing, food security, and transportation, promoting equal access to health care, and promoting cultural competency among HCPs.35-37
The results suggest that solutions to CRC disparities between rural and urban areas need to consider known barriers to rural health care, including transportation, diminished rural health care workforce, and other social determinants of health.9,10,27,38 VHA makes considerable efforts to provide equitable care to all enrolled veterans, including specific programs for rural veterans, including ongoing outreach.39 This study demonstrated lack of disparity in CRC-specific mortality in veterans receiving VHA care, highlighting the importance of these efforts.
Strengths and Limitations
This study used the VHA cohort to compare patient characteristics and mortality between patients with CRC residing in rural and urban areas. The study provides nationwide perspectives on CRC across the geographical spectrum and used a longitudinal cohort with prolonged follow-up to account for comorbidities.
However, the study compared a cohort of rural and urban veterans enrolled in the VHA; hence, the results may not reflect CRC outcomes in veterans without access to VHA care. Rurality has been independently associated with decreased likelihood of meeting CRC screening guidelines among veterans and military service members.38 This study lacked sufficient information to compare CRC staging or treatment modalities among veterans. Although the data cannot identify CRC stage, the proportions of patients with metastatic CRC at diagnosis and CRC location were similar between groups. The study did not have information on their care outside of VHA setting.
This study could not ascertain whether disparities existed in CRC treatment modality since rural residence may result in referral to community-based CRC care, which did not appear in the data. To address these limitations, we used death from any cause as the primary outcome, since death is a hard outcome and is not subject to ascertainment bias. The relatively short follow-up time is another limitation, though subgroup analysis by follow-up did not show significant differences. Despite PS matching, residual unmeasured confounding may exist between urban and rural groups. The predominantly White, male VHA population with high CCI may limit the generalizability of the results.
Conclusions
Rural VHA enrollees had similar survival rates after CRC diagnosis compared to their urban counterparts in a PS-matched analysis. The VHA models of care—including mailed CRC screening tools, several socioeconomic determinants of health (housing, food security, and transportation), and promoting equal access to health care, as well as cultural competency among HCPs—HCPs—may help alleviate disparities across the rural-urban spectrum. The VHA should continue efforts to enroll veterans and provide comprehensive coordinated care in community partnerships.
- Siegel RL, Wagle NS, Cercek A, Smith RA, Jemal A. Colorectal cancer statistics, 2023. CA Cancer J Clin. 2023;73(3):233-254. doi:10.3322/caac.21772
- Carethers JM, Doubeni CA. Causes of socioeconomic disparities in colorectal cancer and intervention framework and strategies. Gastroenterology. 2020;158(2):354-367. doi:10.1053/j.gastro.2019.10.029
- Murphy G, Devesa SS, Cross AJ, Inskip PD, McGlynn KA, Cook MB. Sex disparities in colorectal cancer incidence by anatomic subsite, race and age. Int J Cancer. 2011;128(7):1668-75. doi:10.1002/ijc.25481
- Zullig LL, Smith VA, Jackson GL, et al. Colorectal cancer statistics from the Veterans Affairs central cancer registry. Clin Colorectal Cancer. 2016;15(4):e199-e204. doi:10.1016/j.clcc.2016.04.005
- Lin JS, Perdue LA, Henrikson NB, Bean SI, Blasi PR. Screening for Colorectal Cancer: An Evidence Update for the US Preventive Services Task Force. 2021. U.S. Preventive Services Task Force Evidence Syntheses, formerly Systematic Evidence Reviews:Chapter 1. Agency for Healthcare Research and Quality (US); 2021. Accessed February 18, 2025. https://www.ncbi.nlm.nih.gov/books/NBK570917/
- Siegel RL, Fedewa SA, Anderson WF, et al. Colorectal cancer incidence patterns in the United States, 1974-2013. J Natl Cancer Inst. 2017;109(8). doi:10.1093/jnci/djw322
- Davidson KW, Barry MJ, Mangione CM, et al. Screening for colorectal cancer: US Preventive Services Task Force recommendation statement. JAMA. 2021;325(19):1965-1977. doi:10.1001/jama.2021.6238
- Hines R, Markossian T, Johnson A, Dong F, Bayakly R. Geographic residency status and census tract socioeconomic status as determinants of colorectal cancer outcomes. Am J Public Health. 2014;104(3):e63-e71. doi:10.2105/AJPH.2013.301572
- Cauwels J. The many barriers to high-quality rural health care. 2022;(9):1-32. NEJM Catal Innov Care Deliv. Accessed April 24, 2025. https://catalyst.nejm.org/doi/pdf/10.1056/CAT.22.0254
- Gong G, Phillips SG, Hudson C, Curti D, Philips BU. Higher US rural mortality rates linked to socioeconomic status, physician shortages, and lack of health insurance. Health Aff (Millwood);38(12):2003-2010. doi:10.1377/hlthaff.2019.00722
- Aboagye JK, Kaiser HE, Hayanga AJ. Rural-urban differences in access to specialist providers of colorectal cancer care in the United States: a physician workforce issue. JAMA Surg. 2014;149(6):537-543. doi:10.1001/jamasurg.2013.5062
- Lyckholm LJ, Hackney MH, Smith TJ. Ethics of rural health care. Crit Rev Oncol Hematol. 2001;40(2):131-138. doi:10.1016/s1040-8428(01)00139-1
- Krieger N, Williams DR, Moss NE. Measuring social class in US public health research: concepts, methodologies, and guidelines. Annu Rev Public Health. 1997;18:341-378. doi:10.1146/annurev.publhealth.18.1.341
- Singh GK, Jemal A. Socioeconomic and racial/ethnic disparities in cancer mortality, incidence, and survival in the United States, 1950-2014: over six decades of changing patterns and widening inequalities. J Environ Public Health. 2017;2017:2819372. doi:10.1155/2017/2819372
- Adams SA, Zahnd WE, Ranganathan R, et al. Rural and racial disparities in colorectal cancer incidence and mortality in South Carolina, 1996 - 2016. J Rural Health. 2022;38(1):34-39. doi:10.1111/jrh.12580
- Rogers CR, Blackburn BE, Huntington M, et al. Rural- urban disparities in colorectal cancer survival and risk among men in Utah: a statewide population-based study. Cancer Causes Control. 2020;31(3):241-253. doi:10.1007/s10552-020-01268-2
- US Department of Veterans Affairs. VA Informatics and Computing Infrastructure (VINCI), VA HSR RES 13-457. https://vincicentral.vinci.med.va.gov [Source not verified]
- US Department of Veterans Affairs Information Resource Center. VIReC Research User Guide: PSSG Geocoded Enrollee Files, 2015 Edition. US Department of Veterans Affairs, Health Services Research & Development Service, Information Resource Center; May. 2016. [source not verified]
- Goldsmith HF, Puskin DS, Stiles DJ. Improving the operational definition of “rural areas” for federal programs. US Department of Health and Human Services; 1993. Accessed February 27, 2025. https://www.ruralhealthinfo.org/pdf/improving-the-operational-definition-of-rural-areas.pdf
- Adams MA, Kerr EA, Dominitz JA, et al. Development and validation of a new ICD-10-based screening colonoscopy overuse measure in a large integrated healthcare system: a retrospective observational study. BMJ Qual Saf. 2023;32(7):414-424. doi:10.1136/bmjqs-2021-014236
- Schneeweiss S, Wang PS, Avorn J, Glynn RJ. Improved comorbidity adjustment for predicting mortality in Medicare populations. Health Serv Res. 2003;38(4):1103-1120. doi:10.1111/1475-6773.00165
- Becker S, Ichino A. Estimation of average treatment effects based on propensity scores. The Stata Journal. 2002;2(4):358-377.
- Leuven E, Sianesi B. PSMATCH2: Stata module to perform full Mahalanobis and propensity score matching, common support graphing, and covariate imbalance testing. Statistical software components. Revised February 1, 2018. Accessed February 27, 2025. https://ideas.repec.org/c/boc/bocode/s432001.html.
- US Cancer Statistics Working Group. US cancer statistics data visualizations tool. Centers for Disease Control and Prevention. June 2024. Accessed February 27, 2025. https://www.cdc.gov/cancer/dataviz
- Cao J, Zhang S. Multiple Comparison Procedures. JAMA. 2014;312(5):543-544. doi:10.1001/jama.2014.9440
- Gopalani SV, Janitz AE, Martinez SA, et al. Trends in cancer incidence among American Indians and Alaska Natives and Non-Hispanic Whites in the United States, 1999-2015. Epidemiology. 2020;31(2):205-213. doi:10.1097/EDE.0000000000001140
- Zahnd WE, Murphy C, Knoll M, et al. The intersection of rural residence and minority race/ethnicity in cancer disparities in the United States. Int J Environ Res Public Health. 2021;18(4). doi:10.3390/ijerph18041384
- Blake KD, Moss JL, Gaysynsky A, Srinivasan S, Croyle RT. Making the case for investment in rural cancer control: an analysis of rural cancer incidence, mortality, and funding trends. Cancer Epidemiol Biomarkers Prev. 2017;26(7):992-997. doi:10.1158/1055-9965.EPI-17-0092
- Singh GK, Williams SD, Siahpush M, Mulhollen A. Socioeconomic, rural-urban, and racial inequalities in US cancer mortality: part i-all cancers and lung cancer and part iicolorectal, prostate, breast, and cervical cancers. J Cancer Epidemiol. 2011;2011:107497. doi:10.1155/2011/107497
- Jackson GL, Melton LD, Abbott DH, et al. Quality of nonmetastatic colorectal cancer care in the Department of Veterans Affairs. J Clin Oncol. 2010;28(19):3176-3181. doi:10.1200/JCO.2009.26.7948
- Yoon J, Phibbs CS, Ong MK, et al. Outcomes of veterans treated in Veterans Affairs hospitals vs non-Veterans Affairs hospitals. JAMA Netw Open. 2023;6(12):e2345898. doi:10.1001/jamanetworkopen.2023.45898
- Malin JL, Schneider EC, Epstein AM, Adams J, Emanuel EJ, Kahn KL. Results of the National Initiative for Cancer Care Quality: how can we improve the quality of cancer care in the United States? J Clin Oncol. 2006;24(4):626-634. doi:10.1200/JCO.2005.03.3365
- Levin B, Lieberman DA, McFarland B, et al. Screening and surveillance for the early detection of colorectal cancer and adenomatous polyps, 2008: a joint guideline from the American Cancer Society, the US Multi-Society Task Force on Colorectal Cancer, and the American College of Radiology. Gastroenterology. 2008;134(5):1570-1595. doi:10.1053/j.gastro.2008.02.002
- Deeds SA, Moore CB, Gunnink EJ, et al. Implementation of a mailed faecal immunochemical test programme for colorectal cancer screening among Veterans. BMJ Open Qual. 2022;11(4). doi:10.1136/bmjoq-2022-001927
- Yehia BR, Greenstone CL, Hosenfeld CB, Matthews KL, Zephyrin LC. The role of VA community care in addressing health and health care disparities. Med Care. 2017;55(Suppl 9 suppl 2):S4-S5. doi:10.1097/MLR.0000000000000768
- Wright BN, MacDermid Wadsworth S, Wellnitz A, Eicher- Miller HA. Reaching rural veterans: a new mechanism to connect rural, low-income US Veterans with resources and improve food security. J Public Health (Oxf). 2019;41(4):714-723. doi:10.1093/pubmed/fdy203
- Nelson RE, Byrne TH, Suo Y, et al. Association of temporary financial assistance with housing stability among US veterans in the supportive services for veteran families program. JAMA Netw Open. 2021;4(2):e2037047. doi:10.1001/jamanetworkopen.2020.37047
- McDaniel JT, Albright D, Lee HY, et al. Rural–urban disparities in colorectal cancer screening among military service members and Veterans. J Mil Veteran Fam Health. 2019;5(1):40-48. doi:10.3138/jmvfh.2018-0013
- US Department of Veterans Affairs, Office of Rural Health. The rural veteran outreach toolkit. Updated February 12, 2025. Accessed February 18, 2025. https://www.ruralhealth.va.gov/partners/toolkit.asp
Colorectal Cancer Characteristics and Mortality From Propensity Score-Matched Cohorts of Urban and Rural Veterans
Colorectal Cancer Characteristics and Mortality From Propensity Score-Matched Cohorts of Urban and Rural Veterans

Continuous Glucose Monitoring vs Fingerstick Monitoring for Hemoglobin A1c Control in Veterans
In the United States, 1 in 4 veterans lives with type 2 diabetes mellitus (T2DM), double the rate of the general population.1 Medications are important for the treatment of T2DM and preventing complications that may develop if not properly managed. Common classes of medications for diabetes include biguanides, sodiumglucose cotransporter-2 (SGLT-2) inhibitors, glucagon-like peptide-1 (GLP-1) receptor agonists, dipeptidyl peptidase-4 inhibitors, thiazolidinediones, sulfonylureas, and insulin. The selection of treatment depends on patient-specific factors including hemoglobin A1c (HbA1c) goal, potential effects on weight, risk of hypoglycemia, and comorbidities such as atherosclerotic cardiovascular disease, heart failure, or chronic kidney disease.2
HbA1c level reflects the mean blood glucose over the previous 3 months and serves as an indication of diabetes control. In patients with diabetes, it is recommended that HbA1c is checked ≥ 2 times annually for those meeting treatment goals, or more often if the patient needs to adjust medications to reach their HbA1c goal. The goal HbA1c level for most adults with diabetes is < 7%.3 This target can be adjusted based on age, comorbidities, or other patient factors. It is generally recommended that frequent glucose monitoring is not needed for patients with T2DM who are only taking oral agents and/or noninsulin injectables. However, for those on insulin regimens, it is advised to monitor glucose closely, with even more frequent testing for those with an intensive insulin regimen.3
Most patients with diabetes use fingerstick testing to self-monitor their blood glucose. However, continuous glucose monitors (CGMs) are becoming widely available and offer a solution to those who do not have the ability to check their glucose multiple times a day and throughout the night. The American Diabetes Association recommends that the frequency and timing of blood glucose monitoring, or the consideration of CGM use, should be based on the specific needs and goals of each patient.3 Guidelines also encourage those on intensive insulin regimens to check glucose levels when fasting, before and after meals, prior to exercise, and when hypoglycemia or hyperglycemia is suspected. Frequent testing can become a burden for patients, whereas once a CGM sensor is placed, it can be worn for 10 to 14 days. CGMs are also capable of transmitting glucose readings every 1 to 15 minutes to a receiver or mobile phone, allowing for further adaptability to a patient’s lifestyle.3
CGMs work by measuring the interstitial glucose with a small filament sensor and have demonstrated accuracy when compared to blood glucose readings. The ability of a CGM to accurately reflect HbA1c levels is a potential benefit, reducing the need for frequent testing to determine whether patients have achieved glycemic control.4 Another benefit of a CGM is the ease of sharing data; patient accounts can be linked with a health care site, allowing clinicians to access glucose data even if the patient is not able to be seen in clinic. This allows health care practitioners (HCPs) to more efficiently tailor medications and optimize regimens based on patient-specific data that was not available by fingerstick testing alone.
Vigersky and colleagues provided one of the few studies on the long-term effects of CGM in patients managing T2DM through diet and exercise alone, oral medications, or basal insulin and found significant improvement in HbA1c after only 3 months of CGM use.5
An important aspect of CGM use is the ability to alert the patient to low blood glucose readings, which can be dangerous for those unaware of hypoglycemia. Many studies have investigated the association between CGM use and acute metabolic events, demonstrating the potential for CGMs to prevent these emergencies. Karter and colleagues found a reduction in emergency department visits and hospitalizations for hypoglycemia associated with the use of CGMs in patients with type 1 DM (T1DM) and T2DM.6
There have been few studies on the use of CGM in veterans. Langford and colleagues found a reduction of HbA1c among veterans with T2DM using CGMs. However, > 50% of the patients in the study were not receiving insulin therapy, which currently is a US Department of Veterans Affairs (VA) CGM criteria for use.7 While current studies provide evidence that supports improvement in HbA1c levels with the use of CGMs, data are lacking for veterans with T2DM taking insulin. There is also minimal research that indicates which patients should be offered a CGM. The objective of this study was to evaluate glycemic control in veterans with T2DM on insulin using a CGM who were previously monitoring blood glucose with fingerstick testing. Secondary endpoints were explored to identify subgroups that may benefit from a CGM and other potential advantages of CGMs.
Methods
This was a retrospective study of veterans who transitioned from fingerstick testing to CGM for glucose monitoring. Each veteran served as their own control to limit confounding variables when comparing HbA1c levels. Veterans with an active or suspended CGM order were identified by reviewing outpatient prescription data. All data collection and analysis were done within the Veterans Affairs Sioux Falls Health Care System.
The primary objective of this study was to assess glycemic control from the use of a CGM by evaluating the change in HbA1c after transitioning to a CGM compared to the change in HbA1c with standard fingerstick monitoring. Three HbA1c values were collected for each veteran: before starting CGM, at initiation, and following CGM initiation (Figure 1). CGM start date was the date the CGM prescription order was placed. The pre-CGM HbA1c level was ≥ 1 year prior to the CGM start date or the HbA1c closest to 1 year. The start CGM HbA1c level was within 3 months before or 1 month after the CGM start date. The post-CGM HbA1c level was the most recent time of data collection and at least 6 months after CGM initiation. The change in HbA1c from fingerstick glucose monitoring was the difference between the pre-CGM and start CGM values. The change in HbA1c from use of a CGM was the difference between start CGM and post-CGM values, which were compared to determine HbA1c reduction from CGM use.
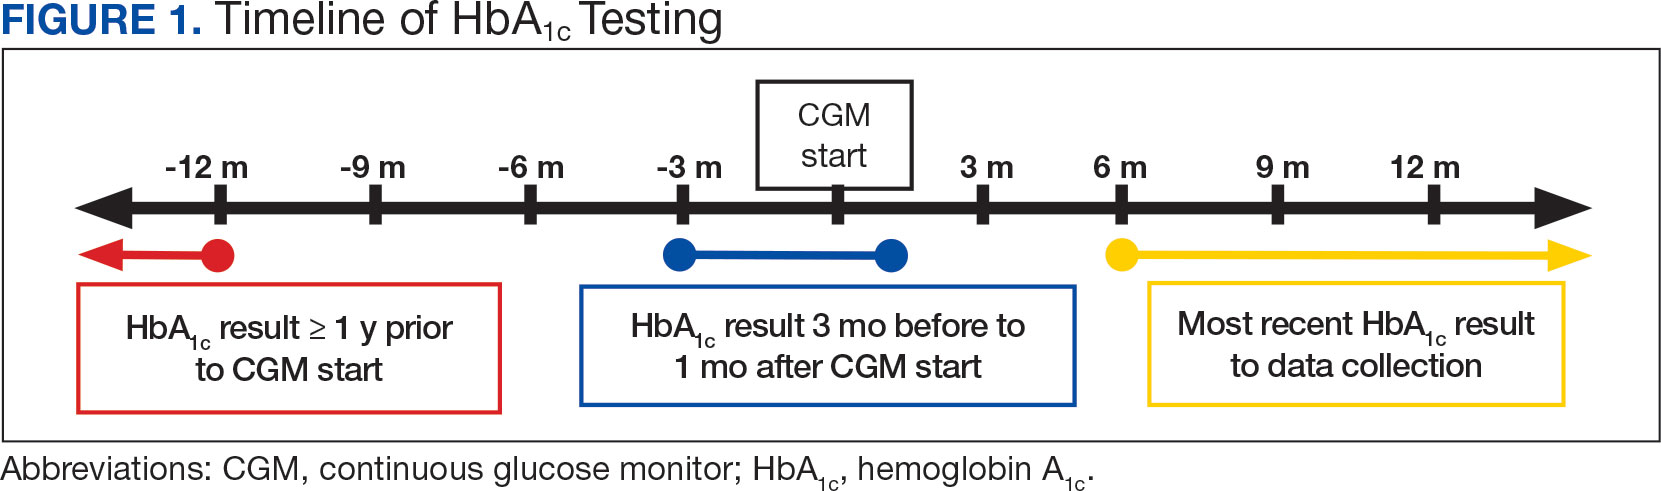
This study also explored secondary outcomes including changes in HbA1c by prescriber type, differences in HbA1c reduction based on age, and changes in diabetes medications, including total daily insulin doses. For secondary outcomes, diabetes medication information and the total daily dose of insulin were gathered at the start of CGM use and at the time of data collection. The most recent CGM order prescribed was also collected.
Veterans were included if they were aged ≥ 18 years, had an active order for a CGM, T2DM diagnosis, an insulin prescription, and previously used test strips for glucose monitoring. Patients with T1DM, those who accessed CGMs or care in the community, and patients without HbA1c values pre-CGM, were excluded.
Statistical Analysis
The primary endpoint of change in HbA1c level before and after CGM use was compared using a paired t test. A 0.5% change in HbA1c was considered clinically significant, as suggested in other studies.8,9P < .05 was considered statistically significant. Analysis for continuous baseline characteristics, including age and total daily insulin, were reported as mean values. Nominal characteristics including sex, race, diabetes medications, and prescriber type are reported as percentages.
Results
A total of 402 veterans were identified with an active CGM at the time of initial data collection in January 2024 and 175 met inclusion criteria. Sixty patients were excluded due to diabetes managed through a community HCP, 38 had T1DM, and 129 lacked HbA1c within all specified time periods. The 175 veterans were randomized, and 150 were selected to perform a chart review for data collection. The mean age was 70 years, most were male and identified as White (Table 1). The majority of patients were managed by endocrinology (53.3%), followed by primary care (24.0%), and pharmacy (22.7%) (Table 2). The mean baseline HbA1c was 8.6%.
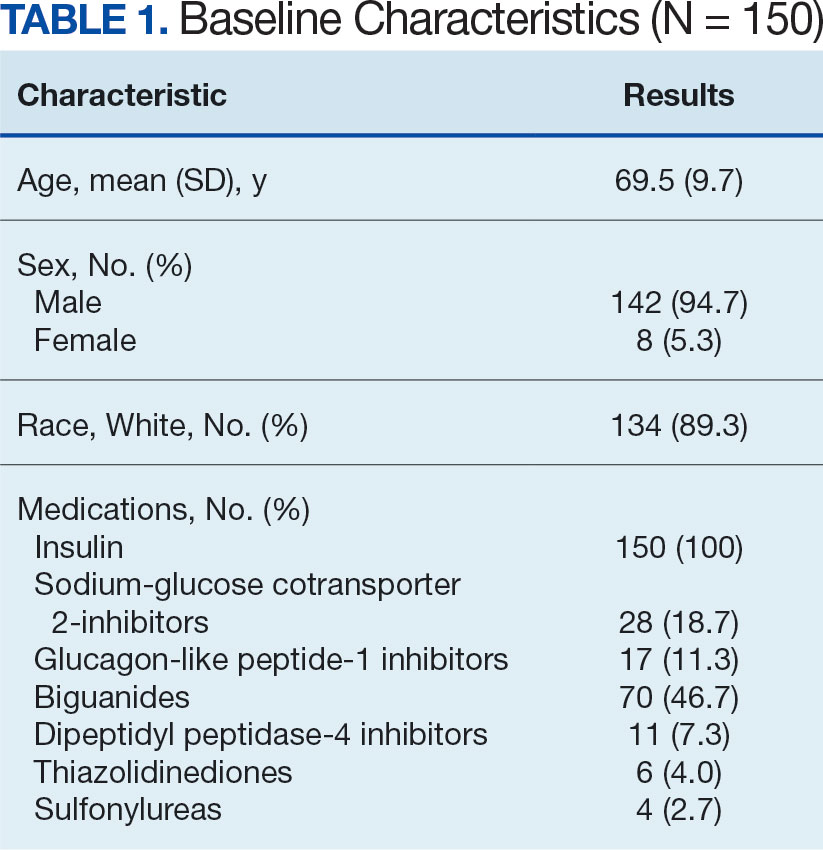
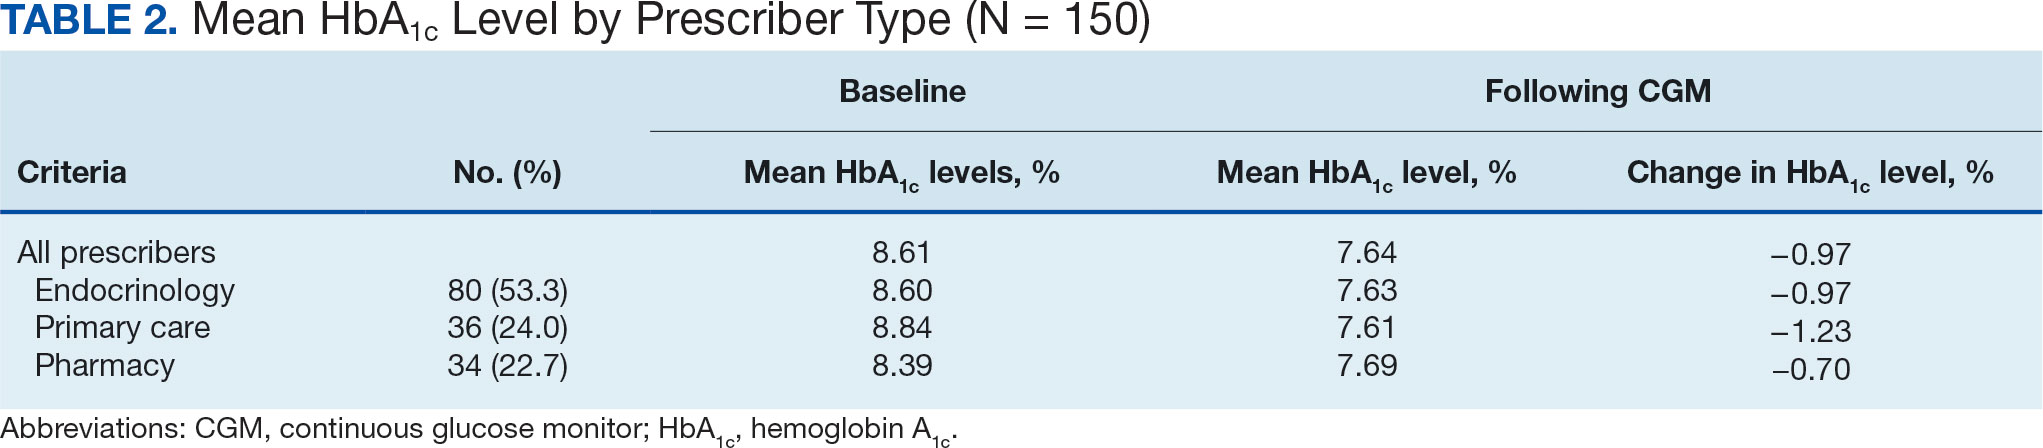
The difference in HbA1c before and after use of CGM was -0.97% (P = .0001). Prior to use of a CGM the change in HbA1c was minimal, with an increase of 0.003% with the use of selfmonitoring glucose. After use of a CGM, HbA1c decreased by 0.971%. This reduction in HbA1c would also be considered clinically significant as the change was > 0.5%. The mean pre-, at start, and post-CGM HbA1c levels were 8.6%, 8.6%, and 7.6%, respectively (Figure 2). Pharmacy prescribers had a 0.7% reduction in HbA1c post-CGM, the least of all prescribers. While most age groups saw a reduction in HbA1c, those aged ≥ 80 years had an increase of 0.18% (Table 3). There was an overall mean reduction in insulin of 22 units, which was similar between all prescribers.
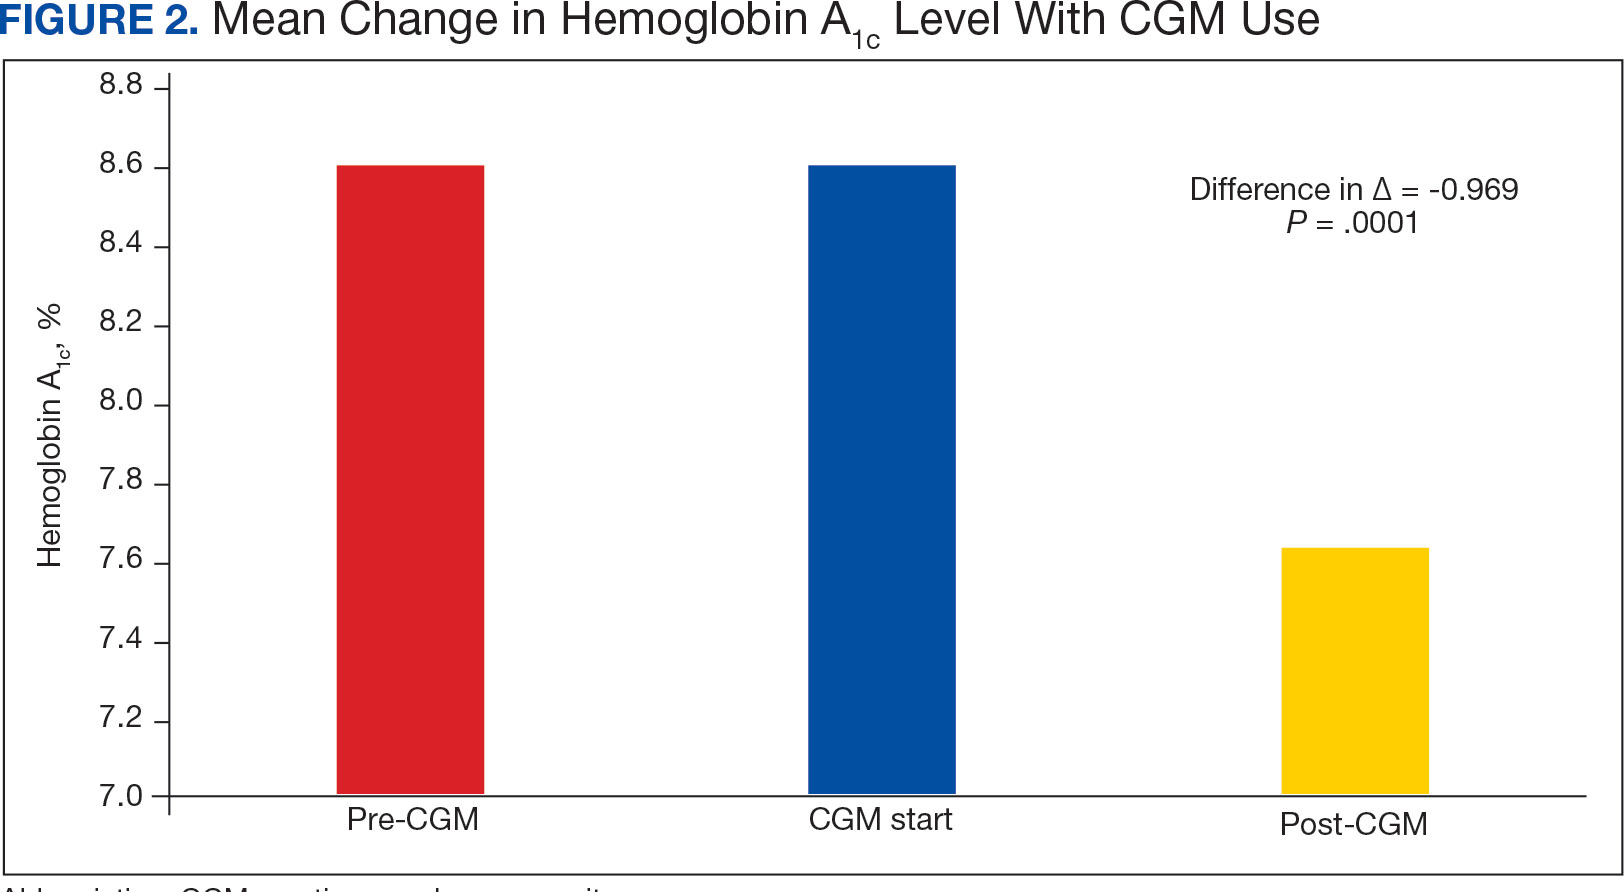
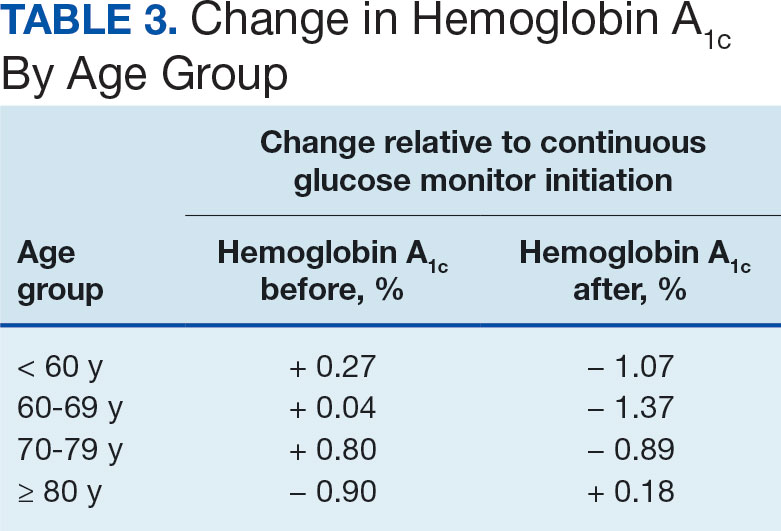
Discussion
The primary endpoint of difference in change of HbA1c before and after CGM use was found to be statistically and clinically significant, with a nearly 1% reduction in HbA1c, which was similar to the reduction found by Vigersky and colleagues. 5 Across all prescribers, post-CGM HbA1c levels were similar; however, patients with CGM prescribed by pharmacists had the smallest change in HbA1c. VA pharmacists primarily assess veterans taking insulin who have HbA1c levels that are below the goal with the aim of decreasing insulin to reduce the risk of hypoglycemia, which could result in increased HbA1c levels. This may also explain the observed increase in post-CGM HbA1c levels in patients aged ≥ 80 years. Patients under the care of pharmacists also had baseline mean HbA1c levels that were lower than primary care and endocrinology prescribers and were closer to their HbA1c goal at baseline, which likely was reflected in the smaller reduction in post-CGM HbA1c level.
While there was a decrease in HbA1c levels with CGM use, there were also changes to medications during this timeframe that also may have impacted HbA1c levels. The most common diabetes medications started during CGM use were GLP-1 agonists and SGLT2-inhibitors. Additionally, there was a reduction in the total daily dose of insulin in the study population. These results demonstrate the potential benefits of CGMs for prescribers who take advantage of the CGM glucose data available to assist with medication adjustments. Another consideration for differences in changes of HbA1c among prescriber types is the opportunity for more frequent follow- up visits with pharmacy or endocrinology compared with primary care. If veterans are followed more closely, it may be associated with improved HbA1c control. Further research investigating changes in HbA1c levels based on followup frequency may be useful.
Strengths and Limitations
The crossover design was a strength of this study. This design reduced confounding variables by having veterans serve as their own controls. In addition, the collection of multiple secondary outcomes adds to the knowledge base for future studies. This study focused on a unique population of veterans with T2DM who were taking insulin, an area that previously had very little data available to determine the benefits of CGM use.
Although the use of a CGM showed statistical significance in lowering HbA1c, many veterans were started on new diabetes medication during the period of CGM use, which also likely contributed to the reduction in HbA1c and may have confounded the results. The study was limited by its small population size due to time constraints of chart reviews and the limited generalizability of results outside of the VA system. The majority of patients were from a single site, male and identified as White, which may not be reflective of other VA and community health care systems. It was also noted that the time from the initiation of CGM use to the most recent HbA1c level varied from 6 months to several years. Additionally, veterans managed by community-based HCPs with complex diabetes cases were excluded.
Conclusions
This study demonstrated a clinically and statistically significant reduction in HbA1c with the use of a CGM compared to fingerstick monitoring in veterans with T2DM who were being treated with insulin. The change in post-CGM HbA1c levels across prescribers was similar. In the subgroup analysis of change in HbA1c among age groups, there was a lower HbA1c reduction in individuals aged ≥ 80 years. The results from this study support the idea that CGM use may be beneficial for patients who require a reduction in HbA1c by allowing more precise adjustments to medications and optimization of therapy, as well as the potential to reduce insulin requirements, which is especially valuable in the older adult veteran population.
- US Department of Veterans Affairs. VA supports veterans who have type 2 diabetes. VA News. Accessed September 30, 2024. https://news.va.gov/107579/va-supports-veterans-who-have-type-2-diabetes/
- ElSayed NA, Aleppo G, Aroda VR, et al. 9. Pharmacologic approaches to glycemic treatment: standards of care in diabetes-2023. Diabetes Care. 2023;46(Suppl 1):S140- S157. doi:10.2337/dc23-S009
- ElSayed NA, Aleppo G, Aroda VR, et al. 6. Glycemic targets: standards of care in diabetes-2023. Diabetes Care. 2023;46(Suppl 1):S97-S110. doi:10.2337/dc23-S006
- Miller E, Gavin JR, Kruger DF, Brunton SA. Continuous glucose monitoring: optimizing diabetes care: executive summary. Clin Diabetes. 2022;40(4):394-398. doi:10.2337/cd22-0043
- Vigersky RA, Fonda SJ, Chellappa M, Walker MS, Ehrhardt NM. Short- and long-term effects of real-time continuous glucose monitoring in patients with type 2 diabetes. Diabetes Care. 2012;35(1):32-38. doi:10.2337/dc11-1438
- Karter AJ, Parker MM, Moffet HH, Gilliam LK, Dlott R. Association of real-time continuous glucose monitoring with glycemic control and acute metabolic events among patients with insulin-treated diabetes. JAMA. 2021;325(22):2273-2284. doi:10.1001/JAMA.2021.6530
- Langford SN, Lane M, Karounos D. Continuous blood glucose monitoring outcomes in veterans with type 2 diabetes. Fed Pract. 2021;38(Suppl 4):S14-S17. doi:10.12788/fp.0189
- Radin MS. Pitfalls in hemoglobin A1c measurement: when results may be misleading. J Gen Intern Med. 2014;29(2):388-394. doi:10.1007/s11606-013-2595-x.
- Little RR, Rohlfing CL, Sacks DB; National Glycohemoglobin Standardization Program (NGSP) steering committee. Status of hemoglobin A1c measurement and goals for improvement: from chaos to order for improving diabetes care. Clin Chem. 2011;57(2):205-214. doi:10.1373/clinchem.2010.148841
In the United States, 1 in 4 veterans lives with type 2 diabetes mellitus (T2DM), double the rate of the general population.1 Medications are important for the treatment of T2DM and preventing complications that may develop if not properly managed. Common classes of medications for diabetes include biguanides, sodiumglucose cotransporter-2 (SGLT-2) inhibitors, glucagon-like peptide-1 (GLP-1) receptor agonists, dipeptidyl peptidase-4 inhibitors, thiazolidinediones, sulfonylureas, and insulin. The selection of treatment depends on patient-specific factors including hemoglobin A1c (HbA1c) goal, potential effects on weight, risk of hypoglycemia, and comorbidities such as atherosclerotic cardiovascular disease, heart failure, or chronic kidney disease.2
HbA1c level reflects the mean blood glucose over the previous 3 months and serves as an indication of diabetes control. In patients with diabetes, it is recommended that HbA1c is checked ≥ 2 times annually for those meeting treatment goals, or more often if the patient needs to adjust medications to reach their HbA1c goal. The goal HbA1c level for most adults with diabetes is < 7%.3 This target can be adjusted based on age, comorbidities, or other patient factors. It is generally recommended that frequent glucose monitoring is not needed for patients with T2DM who are only taking oral agents and/or noninsulin injectables. However, for those on insulin regimens, it is advised to monitor glucose closely, with even more frequent testing for those with an intensive insulin regimen.3
Most patients with diabetes use fingerstick testing to self-monitor their blood glucose. However, continuous glucose monitors (CGMs) are becoming widely available and offer a solution to those who do not have the ability to check their glucose multiple times a day and throughout the night. The American Diabetes Association recommends that the frequency and timing of blood glucose monitoring, or the consideration of CGM use, should be based on the specific needs and goals of each patient.3 Guidelines also encourage those on intensive insulin regimens to check glucose levels when fasting, before and after meals, prior to exercise, and when hypoglycemia or hyperglycemia is suspected. Frequent testing can become a burden for patients, whereas once a CGM sensor is placed, it can be worn for 10 to 14 days. CGMs are also capable of transmitting glucose readings every 1 to 15 minutes to a receiver or mobile phone, allowing for further adaptability to a patient’s lifestyle.3
CGMs work by measuring the interstitial glucose with a small filament sensor and have demonstrated accuracy when compared to blood glucose readings. The ability of a CGM to accurately reflect HbA1c levels is a potential benefit, reducing the need for frequent testing to determine whether patients have achieved glycemic control.4 Another benefit of a CGM is the ease of sharing data; patient accounts can be linked with a health care site, allowing clinicians to access glucose data even if the patient is not able to be seen in clinic. This allows health care practitioners (HCPs) to more efficiently tailor medications and optimize regimens based on patient-specific data that was not available by fingerstick testing alone.
Vigersky and colleagues provided one of the few studies on the long-term effects of CGM in patients managing T2DM through diet and exercise alone, oral medications, or basal insulin and found significant improvement in HbA1c after only 3 months of CGM use.5
An important aspect of CGM use is the ability to alert the patient to low blood glucose readings, which can be dangerous for those unaware of hypoglycemia. Many studies have investigated the association between CGM use and acute metabolic events, demonstrating the potential for CGMs to prevent these emergencies. Karter and colleagues found a reduction in emergency department visits and hospitalizations for hypoglycemia associated with the use of CGMs in patients with type 1 DM (T1DM) and T2DM.6
There have been few studies on the use of CGM in veterans. Langford and colleagues found a reduction of HbA1c among veterans with T2DM using CGMs. However, > 50% of the patients in the study were not receiving insulin therapy, which currently is a US Department of Veterans Affairs (VA) CGM criteria for use.7 While current studies provide evidence that supports improvement in HbA1c levels with the use of CGMs, data are lacking for veterans with T2DM taking insulin. There is also minimal research that indicates which patients should be offered a CGM. The objective of this study was to evaluate glycemic control in veterans with T2DM on insulin using a CGM who were previously monitoring blood glucose with fingerstick testing. Secondary endpoints were explored to identify subgroups that may benefit from a CGM and other potential advantages of CGMs.
Methods
This was a retrospective study of veterans who transitioned from fingerstick testing to CGM for glucose monitoring. Each veteran served as their own control to limit confounding variables when comparing HbA1c levels. Veterans with an active or suspended CGM order were identified by reviewing outpatient prescription data. All data collection and analysis were done within the Veterans Affairs Sioux Falls Health Care System.
The primary objective of this study was to assess glycemic control from the use of a CGM by evaluating the change in HbA1c after transitioning to a CGM compared to the change in HbA1c with standard fingerstick monitoring. Three HbA1c values were collected for each veteran: before starting CGM, at initiation, and following CGM initiation (Figure 1). CGM start date was the date the CGM prescription order was placed. The pre-CGM HbA1c level was ≥ 1 year prior to the CGM start date or the HbA1c closest to 1 year. The start CGM HbA1c level was within 3 months before or 1 month after the CGM start date. The post-CGM HbA1c level was the most recent time of data collection and at least 6 months after CGM initiation. The change in HbA1c from fingerstick glucose monitoring was the difference between the pre-CGM and start CGM values. The change in HbA1c from use of a CGM was the difference between start CGM and post-CGM values, which were compared to determine HbA1c reduction from CGM use.
This study also explored secondary outcomes including changes in HbA1c by prescriber type, differences in HbA1c reduction based on age, and changes in diabetes medications, including total daily insulin doses. For secondary outcomes, diabetes medication information and the total daily dose of insulin were gathered at the start of CGM use and at the time of data collection. The most recent CGM order prescribed was also collected.
Veterans were included if they were aged ≥ 18 years, had an active order for a CGM, T2DM diagnosis, an insulin prescription, and previously used test strips for glucose monitoring. Patients with T1DM, those who accessed CGMs or care in the community, and patients without HbA1c values pre-CGM, were excluded.
Statistical Analysis
The primary endpoint of change in HbA1c level before and after CGM use was compared using a paired t test. A 0.5% change in HbA1c was considered clinically significant, as suggested in other studies.8,9P < .05 was considered statistically significant. Analysis for continuous baseline characteristics, including age and total daily insulin, were reported as mean values. Nominal characteristics including sex, race, diabetes medications, and prescriber type are reported as percentages.
Results
A total of 402 veterans were identified with an active CGM at the time of initial data collection in January 2024 and 175 met inclusion criteria. Sixty patients were excluded due to diabetes managed through a community HCP, 38 had T1DM, and 129 lacked HbA1c within all specified time periods. The 175 veterans were randomized, and 150 were selected to perform a chart review for data collection. The mean age was 70 years, most were male and identified as White (Table 1). The majority of patients were managed by endocrinology (53.3%), followed by primary care (24.0%), and pharmacy (22.7%) (Table 2). The mean baseline HbA1c was 8.6%.
The difference in HbA1c before and after use of CGM was -0.97% (P = .0001). Prior to use of a CGM the change in HbA1c was minimal, with an increase of 0.003% with the use of selfmonitoring glucose. After use of a CGM, HbA1c decreased by 0.971%. This reduction in HbA1c would also be considered clinically significant as the change was > 0.5%. The mean pre-, at start, and post-CGM HbA1c levels were 8.6%, 8.6%, and 7.6%, respectively (Figure 2). Pharmacy prescribers had a 0.7% reduction in HbA1c post-CGM, the least of all prescribers. While most age groups saw a reduction in HbA1c, those aged ≥ 80 years had an increase of 0.18% (Table 3). There was an overall mean reduction in insulin of 22 units, which was similar between all prescribers.
Discussion
The primary endpoint of difference in change of HbA1c before and after CGM use was found to be statistically and clinically significant, with a nearly 1% reduction in HbA1c, which was similar to the reduction found by Vigersky and colleagues. 5 Across all prescribers, post-CGM HbA1c levels were similar; however, patients with CGM prescribed by pharmacists had the smallest change in HbA1c. VA pharmacists primarily assess veterans taking insulin who have HbA1c levels that are below the goal with the aim of decreasing insulin to reduce the risk of hypoglycemia, which could result in increased HbA1c levels. This may also explain the observed increase in post-CGM HbA1c levels in patients aged ≥ 80 years. Patients under the care of pharmacists also had baseline mean HbA1c levels that were lower than primary care and endocrinology prescribers and were closer to their HbA1c goal at baseline, which likely was reflected in the smaller reduction in post-CGM HbA1c level.
While there was a decrease in HbA1c levels with CGM use, there were also changes to medications during this timeframe that also may have impacted HbA1c levels. The most common diabetes medications started during CGM use were GLP-1 agonists and SGLT2-inhibitors. Additionally, there was a reduction in the total daily dose of insulin in the study population. These results demonstrate the potential benefits of CGMs for prescribers who take advantage of the CGM glucose data available to assist with medication adjustments. Another consideration for differences in changes of HbA1c among prescriber types is the opportunity for more frequent follow- up visits with pharmacy or endocrinology compared with primary care. If veterans are followed more closely, it may be associated with improved HbA1c control. Further research investigating changes in HbA1c levels based on followup frequency may be useful.
Strengths and Limitations
The crossover design was a strength of this study. This design reduced confounding variables by having veterans serve as their own controls. In addition, the collection of multiple secondary outcomes adds to the knowledge base for future studies. This study focused on a unique population of veterans with T2DM who were taking insulin, an area that previously had very little data available to determine the benefits of CGM use.
Although the use of a CGM showed statistical significance in lowering HbA1c, many veterans were started on new diabetes medication during the period of CGM use, which also likely contributed to the reduction in HbA1c and may have confounded the results. The study was limited by its small population size due to time constraints of chart reviews and the limited generalizability of results outside of the VA system. The majority of patients were from a single site, male and identified as White, which may not be reflective of other VA and community health care systems. It was also noted that the time from the initiation of CGM use to the most recent HbA1c level varied from 6 months to several years. Additionally, veterans managed by community-based HCPs with complex diabetes cases were excluded.
Conclusions
This study demonstrated a clinically and statistically significant reduction in HbA1c with the use of a CGM compared to fingerstick monitoring in veterans with T2DM who were being treated with insulin. The change in post-CGM HbA1c levels across prescribers was similar. In the subgroup analysis of change in HbA1c among age groups, there was a lower HbA1c reduction in individuals aged ≥ 80 years. The results from this study support the idea that CGM use may be beneficial for patients who require a reduction in HbA1c by allowing more precise adjustments to medications and optimization of therapy, as well as the potential to reduce insulin requirements, which is especially valuable in the older adult veteran population.
- US Department of Veterans Affairs. VA supports veterans who have type 2 diabetes. VA News. Accessed September 30, 2024. https://news.va.gov/107579/va-supports-veterans-who-have-type-2-diabetes/
- ElSayed NA, Aleppo G, Aroda VR, et al. 9. Pharmacologic approaches to glycemic treatment: standards of care in diabetes-2023. Diabetes Care. 2023;46(Suppl 1):S140- S157. doi:10.2337/dc23-S009
- ElSayed NA, Aleppo G, Aroda VR, et al. 6. Glycemic targets: standards of care in diabetes-2023. Diabetes Care. 2023;46(Suppl 1):S97-S110. doi:10.2337/dc23-S006
- Miller E, Gavin JR, Kruger DF, Brunton SA. Continuous glucose monitoring: optimizing diabetes care: executive summary. Clin Diabetes. 2022;40(4):394-398. doi:10.2337/cd22-0043
- Vigersky RA, Fonda SJ, Chellappa M, Walker MS, Ehrhardt NM. Short- and long-term effects of real-time continuous glucose monitoring in patients with type 2 diabetes. Diabetes Care. 2012;35(1):32-38. doi:10.2337/dc11-1438
- Karter AJ, Parker MM, Moffet HH, Gilliam LK, Dlott R. Association of real-time continuous glucose monitoring with glycemic control and acute metabolic events among patients with insulin-treated diabetes. JAMA. 2021;325(22):2273-2284. doi:10.1001/JAMA.2021.6530
- Langford SN, Lane M, Karounos D. Continuous blood glucose monitoring outcomes in veterans with type 2 diabetes. Fed Pract. 2021;38(Suppl 4):S14-S17. doi:10.12788/fp.0189
- Radin MS. Pitfalls in hemoglobin A1c measurement: when results may be misleading. J Gen Intern Med. 2014;29(2):388-394. doi:10.1007/s11606-013-2595-x.
- Little RR, Rohlfing CL, Sacks DB; National Glycohemoglobin Standardization Program (NGSP) steering committee. Status of hemoglobin A1c measurement and goals for improvement: from chaos to order for improving diabetes care. Clin Chem. 2011;57(2):205-214. doi:10.1373/clinchem.2010.148841

VA Cancer Clinical Trials as a Strategy for Increasing Accrual of Racial and Ethnic Underrepresented Groups
Background
Cancer clinical trials (CCTs) are central to improving cancer care. However, generalizability of findings from CCTs is difficult due to the lack of diversity in most United States CCTs. Clinical trial accrual of underrepresented groups, is low throughout the United States and is approximately 4-5% in most CCTs. Reasons for low accrual in this population are multifactorial. Despite numerous factors related to accruing racial and ethnic underrepresented groups, many institutions have sought to address these barriers. We conducted a scoping review to identify evidence-based approaches to increase participation in cancer treatment clinical trials.
Methods
We reviewed the Salisbury VA Medical Center Oncology clinical trial database from October 2019 to June 2024. The participants in these clinical trials required consent. These clinical trials included treatment interventional as well as non-treatment interventional. Fifteen studies were included and over 260 Veterans participated.
Results
Key themes emerged that included a focus on patient education, cultural competency, and building capacity in the clinics to care for the Veteran population at three separate sites in the Salisbury VA system. The Black Veteran accrual rate of 29% was achieved. This accrual rate is representative of our VA catchment population of 33% for Black Veterans, and is five times the national average.
Conclusions
The research team’s success in enrolling Black Veterans in clinical trials is attributed to several factors. The demographic composition of Veterans served by the Salisbury, Charlotte, and Kernersville VA provided a diverse population that included a 33% Black group. The type of clinical trials focused on patients who were most impacted by the disease. The VA did afford less barriers to access to health care.

Process Improvement for Engaging With Trauma-Focused Evidence-Based Psychotherapy for PTSD
Process Improvement for Engaging With Trauma-Focused Evidence-Based Psychotherapy for PTSD
Trauma-focused evidence-based psychotherapies (TF-EBPs), including cognitive processing therapy (CPT) and prolonged exposure therapy (PE), are recommended treatments for posttraumatic stress disorder (PTSD) in clinical practice guidelines.1-3 To increase initiation of these treatments, the US Department of Veterans Affairs (VA) used a large-scale dissemination and implementation effort to improve access to TF-EBP.4,5 These efforts achieved modest success, increasing prevalence of TF-EBP from a handful of veterans in 2004 to an annual prevalence of 14.6% for CPT and 4.3% for PE in 2014.6
Throughout these efforts, qualitative studies have been used to better understand veterans’ perspectives on receiving TF-EBP care.7-18 Barriers to initiation of and engagement in TF-EBP and PTSD care have been identified from these qualitative studies. One identified barrier was lack of knowledge—particularly lack of knowledge about what is meant by a PTSD diagnosis and available treatments.7-10 Stigma (ie, automatic negative associations) toward mental health problems or seeking mental health care also has been identified as a barrier to initiation.7,10-14 Perceptions of poor alignment between treatment and veteran goals, including lack of buy-in for the rationale, served as barriers to initiation and engagement.8,15-18
Using prior qualitative work, numerous initiatives have been developed to reduce stigma, facilitate conversations about how treatment aligns with goals, and fill knowledge gaps, particularly through online resources and shared decision-making.19,20 To better inform the state of veterans’ experiences with TF-EBP, a qualitative investigation was conducted involving veterans who recently initiated TF-EBP. Themes directly related to transitions to TF-EBP were identified; however, all veterans interviewed also described their experiences with TFEBP engagement and mental health care. Consistent with recommendations for qualitative methods, this study extends prior work on transitions to TF-EBP by describing themes with a distinct focus on the experience of engaging with TF-EBP and mental health care.21,22
Methods
The experiences of veterans who were transitioning into TF-EBPs were collected in semistructured interviews and analyzed. The semistructured interview guide was developed and refined in consultation with both qualitative methods experts and PTSD treatment experts to ensure that 6 content domains were appropriately queried: PTSD treatment options, cultural sensitivity of treatment, PTSD treatment selection, transition criteria, beliefs about stabilization treatment, and treatment needs/preferences.
Participants were identified using the VA Corporate Data Warehouse and included post-9/11 veterans who had recently initiated CPT or PE for the first time between September 1, 2021, and September 1, 2022. More details of participant selection are available in Holder et al.21 From a population of 10,814 patients, stratified random sampling generated a recruitment pool of 200 veterans for further outreach. The strata were defined such that this recruitment pool had similar proportions of demographic characteristics (ie, gender, race, ethnicity) to the population of eligible veterans, equivalent distributions of time to CPT or PE initiation (ie, 33.3% < 1 year, 33.3% 1-3 years, and 33.3% > 3 years), and adequate variability in TF-EBP type (ie, 66.7% CPT, 33.3% PE). A manual chart review in the recruitment pool excluded 12 veterans who did not initiate CPT or PE, 1 veteran with evidence of current active psychosis and/or cognitive impairment that would likely preclude comprehension of study materials, and 1 who was deceased.
Eligible veterans from the recruitment pool were contacted in groups of 25. First, a recruitment letter with study information and instructions to opt-out of further contact was mailed or emailed to veterans. After 2 weeks, veterans who had not responded were contacted by phone up to 3 times. Veterans interested in participating were scheduled for a 1-time visit that included verbal consent and the qualitative interview. Metrics were established a priori to ensure an adequately diverse and inclusive sample. Specifically, a minimum number of racial and/or ethnic minority veterans (33%) and women veterans (20%) were sought. Equal distribution across the 3 categories of time from first mental health visit to CPT/PE initiation also was targeted. Throughout enrollment, recruitment efforts were adapted to meet these metrics in the emerging sample. While the goal was to generate a diverse and inclusive sample using these methods, the sample was not intended to be representative of the population.
Of the 186 eligible participants, 21 declined participation and 26 could not be reached. The targeted sample was reached after exhausting contact for 47 veterans and contacting 80 veterans for a final response rate of 40% among fully contacted veterans and 27% among veterans with any contact. The final sample included 30 veterans who received CPT or PE in VA facilities (Table).
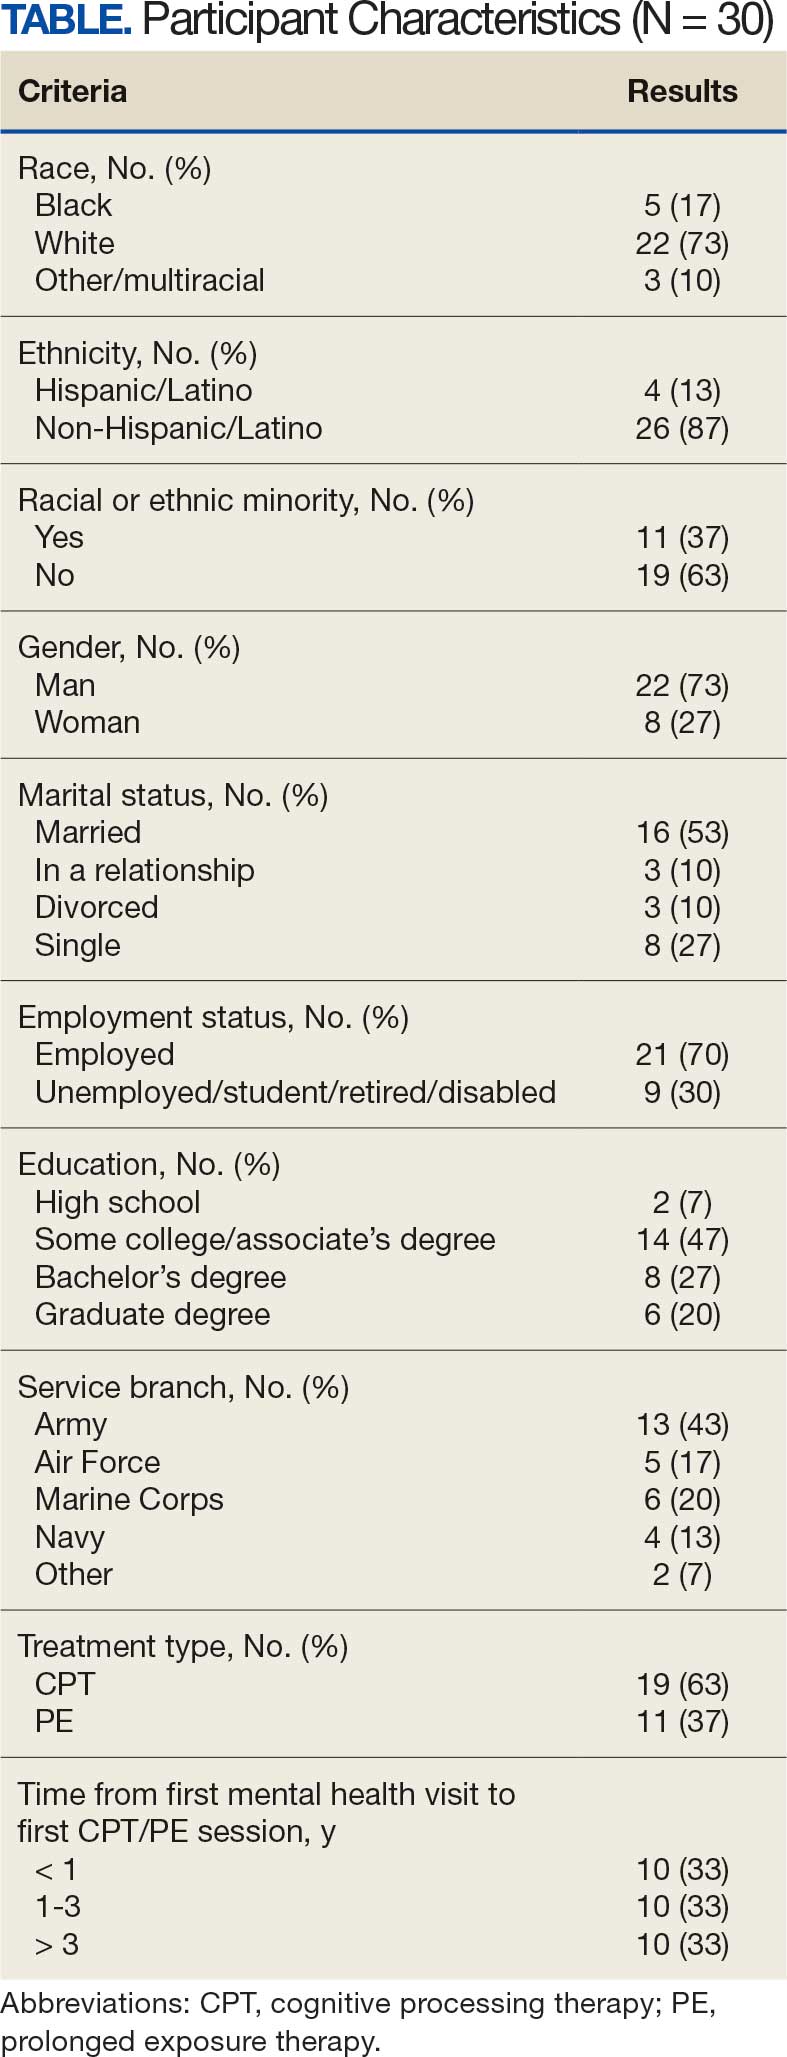
After veterans provided verbal consent for study participation, sociodemographic information was verbally reported, and a 30- to 60-minute semistructured qualitative phone interview was recorded and transcribed. Veterans received $40 for participation. All procedures were approved by the University of California San Francisco Institutional Review Board.
Qualitative Data Analysis
Rapid analysis procedures were used to analyze qualitative data. This approach is suitable for focused, moderately structured qualitative analyses in health services research and facilitates rapid dissemination to stakeholders.23 The qualitative analysts were 2 clinical psychologists with expertise in PTSD treatment (NH primary and RR secondary). Consistent with rapid analysis procedures, analysts prepared a templated summary (including relevant quotations) of each interview, organized by the prespecified content domains. Interviews were summarized independently, compared to ensure consistency, and discrepancies were resolved through review of the interview source materials. Individual summary templates were combined into a master analytic matrix to facilitate the identification of patterns and delineation of themes. Analysts routinely met to identify, discuss, and refine preliminary themes, revisiting source materials to reach consensus as needed.
Results
Fifteen themes were identified and organized into 2 distinct focus areas: themes directly related to the transition to TF-EBP (8 themes) and themes related to veterans’ experiences with TF-EBP and general mental health care with potential process-improvement implications (7 themes).21 Seven themes were identified related to experiences with TF-EBP engagement and VA mental health care. The 7 themes related to TF-EBP engagement and VA mental health care themes are summarized with exemplary quotations.
Veterans want a better understanding of psychotherapy and engaging with VA mental health. Veterans reported that they generally had a poor or “nebulous” understanding about the experience of psychotherapy. For example, veterans exhibited confusion about whether certain experiences were equivalent to participating in psychotherapy. They were sometimes unable to distinguish between interactions such as assessment, disability evaluations, peer support, and psychotherapy. One veteran described a conversation with a TFEBP therapist about prior treatment:
She [asked], have you ever been, or gone through a therapy to begin with? And I, I said, well I just chatted with somebody. And she said that’s not, that’s not therapy. So, I was like, oh, it’s not? That’s not what people do?
Veterans were surprised the VA offered a diverse range of psychotherapy interventions, rather than simply therapy. They did not realize there were different types of psychotherapy. As a result, veterans were not aware that some VA mental practitioners have specialty training and certification to provide treatment matched to specific diagnoses or needs. They thought that all clinicians could provide the same care. One veteran described their understanding:
I just figured all mental health people are mental health people. I didn’t have a better understanding of the system and all the different levels and how it plays out and specialties and things like that. Which, I guess, I should have because you have a primary care doctor, but then you have specialists in all these other different sectors that specialize in one particular area. I guess that should’ve been common sense, but it wasn’t.
Stigma was a barrier to seeking and engaging in mental health care. Veterans discovered they had to overcome stigma associated with seeking and engaging in mental health treatment. Military culture was often discussed as promoting stigma regarding mental health treatment. Specifically, veterans described that seeking treatment meant “either, I’m weak or I’m gonna be seen as weak.” In active-duty settings, the strategy for dealing with mental health symptoms was to “leave those feelings, you push ‘em aside,” an approach highly inconsistent with TF-EBP. In some cases, incorrect information about the VA and PTSD was presented as part of discharge from the military, leading to long-term skepticism of the VA and PTSD treatment. One veteran described his experience as part of a class on the VA compensation and pension assessment process for service-connected disabilities during his military discharge:
[A fellow discharging soldier asked] what about like PTSD, gettin’ rated for PTSD. I hear they take our weapons and stuff like we can’t own firearms and all that stuff. And [the instructor] was like, well, yes that’s a thing. He didn’t explain it like if you get compensated for PTSD you don’t lose your rights to carry a firearm or to have, to be able to go hunting.
Importantly, veterans often described how other identities (eg, race, ethnicity, gender, region of origin) interacted with military culture to enhance stigma. Hearing messaging from multiple sources reinforced beliefs that mental health treatment is inappropriate or is associated with weakness:
As a first-generation Italian, I was always taught keep your feelings to yourself. Never talk outside your family. Never bring up problems to other people and stuff like that. Same with the military. And then the old stigma working in [emergency medical services] and public safety, you’re weak if you get help.
The fundamentals of therapy, including rapport and flexibility, were important. Veterans valued nonspecific therapy factors, genuine empathy, building trust, being honest about treatment, personality, and rapport. These characteristics were almost universally described as particularly important:
I liked the fact that she made it personable and she cared. It wasn’t just like, here, we’re gonna start this. She explained it in the ways I could understand, not in medical terms, so to speak, but that’s what I liked about her. She really cared about what she did and helping me.
Flexibility was viewed as an asset, particularly when clinicians acknowledged veteran autonomy. A consistent example was when veterans were able to titrate trauma disclosure. One veteran described this flexible treatment experience: “She was right there in the room, she said, you know, at any time, you know, we could stop, we could debrief.”
Experiences of clinician flexibility and personalization of therapy were contrasted with experiences of overly rigid therapy. Overemphasis on protocols created barriers, often because treatment did not feel personalized. One veteran described how a clinician’s task-oriented approach interfered with their ability to engage in TF-EBP:
They listened, but it just didn’t seem like they were listening, because they really wanted to stay on task… So, I felt like if the person was more concerned, or more sympathetic to the things that was also going on in my life at that present time, I think I would’ve felt more comfortable talking about what was the PTSD part, too.
Veterans valued shared decision-making prior to TF-EBP initiation. Veterans typically described being involved in a shared decision-making process prior to initiating TF-EBP. During these sessions, clinicians discussed treatment options and provided veterans with a variety of materials describing treatments (eg, pamphlets, websites, videos, statistics). Most veterans appreciated being able to reflect on and discuss treatment options with their clinicians. Being given time in and out of session to review was viewed as valuable and increased confidence in treatment choice. One veteran described their experience:
I was given the information, you know, they gave me handouts, PDFs, whatever was available, and let me read over it. I didn’t have to choose anything right then and there, you know, they let me sleep on it. And I got back to them after some thought.
However, some veterans felt overwhelmed by being presented with too much information and did not believe they knew enough to make a final treatment decision. One veteran described being asked to contribute to the treatment decision:
I definitely asked [the clinician] to weigh in on maybe what he thought was best, because—I mean, I don’t know… I’m not necessarily sure I know what I think is best. I think we’re just lucky I’m here, so if you can give me a solid and help me out here by telling me just based on what I’ve said to you and the things that I’ve gone through, what do you think?
Veterans who perceived that their treatment preferences were respected had a positive outlook on TF-EBP. As part of the shared-decision making process, veterans typically described being given choices among PTSD treatments. One way that preferences were respected was through clinicians tailoring treatment descriptions to a veteran’s unique symptoms, experiences, and values. In these cases, clinicians observed specific concerns and clearly linked treatment principles to those concerns. For example, one veteran described their clinician’s recommendation for PE: “The hardest thing for me is to do the normal things like grocery store or getting on a train or anything like that. And so, he suggested that [PE] would be a good idea.”
In other cases, veterans wanted the highest quality of treatment rather than a match between treatment principles and the veteran’s presentation, goals, or strengths. These veterans wanted the best treatment available for PTSD and valued research support, recommendations from clinical practice guidelines, or clinician confidence in the effectiveness of the treatment. One veteran described this perspective:
I just wanted to be able to really tackle it in the best way possible and in the most like aggressive way possible. And it seemed like PE really was going to, they said that it’s a difficult type of therapy, but I really just wanted to kind of do the best that I could to eradicate some of the issues that I was having.
When veterans perceived a lack of respect for their preferences, they were hesitant about TF-EBP. For some veterans, a generic pitch for a TF-EBP was detrimental in the absence of the personal connection between the treatment and their own symptoms, goals, or strengths. These veterans did not question whether the treatment was effective in general but did question whether the treatment was best for them. One veteran described the contrast between their clinician’s perspective and their own.
I felt like they felt very comfortable, very confident in [CPT] being the program, because it was comfortable for them. Because they did it several times. And maybe they had a lot of success with other individuals... but they were very comfortable with that one, as a provider, more than: Is this the best fit for [me]?
Some veterans perceived little concern for their preferences and a lack of choice in available treatments, which tended to perpetuate negative perceptions of TFEBP. These veterans described their lack of choices with frustration. Alternatives to TFEBP were described by these veterans as so undesirable that they did not believe they had a real choice:
[CPT] was the only decision they had. There was nothing else for PTSD. They didn’t offer anything else. So, I mean it wasn’t a decision. It was either … take treatment or don’t take treatment at all… Actually, I need to correct myself. So, there were 2 options, group therapy or CPT. I forgot about that. I’m not a big group guy so I chose the CPT.
Another veteran was offered a choice between therapeutic approaches, but all were delivered via telehealth (consistent with the transition to virtual services during the COVID-19 pandemic). For this veteran, not only was the distinction between approaches unclear, but the choice between approaches was unimportant compared to the mode of delivery.
This happened during COVID-19 and VA stopped seeing anybody physically, face-to-face. So my only option for therapy was [telehealth]… There was like 3 of them, and I tried to figure out, you know, from the layperson’s perspective, like: I don’t know which one to go with.
Veterans wanted to be asked about their cultural identity. Veterans valued when clinicians asked questions about cultural identity as part of their mental health treatment and listened to their cultural context. Cultural identity factors extended beyond factors such as race, ethnicity, gender, and sexual orientation to religion, military culture, and regionality. Veterans often described situations where they wished clinicians would ask the question or initiate conversations about culture. A veteran highlighted the importance of their faith but noted that it was a taboo topic. Their clinician did not say “we don’t go there,” but they “never dove into it either.” Another veteran expressed a desire for their clinician to ask questions about experiences in the National Guard and as an African American veteran:
If a provider was to say like: Oh, you know, it’s a stressful situation being a part of the military, being in the National Guard. You know, just asking questions about that. I think that would really go a long way… Being African American was difficult as well. And more so because of my region, I think… I felt like it would probably be an uncomfortable subject to speak on… I mean, it wasn’t anything that my providers necessarily did, it was more so just because it wasn’t brought up.
One common area of concern for veterans was a match between veteran and therapist demographics. When asked about how their cultural identity influenced treatment, several veterans described the relevance of therapist match. Much like questions about their own cultural identity, veterans valued being asked about identity preferences in clinicians (eg, gender or race matching), rather than having to bring up the preference themselves. One veteran described relief at this question being asked directly: “I was relieved when she had asked [whether I wanted a male or female clinician] primarily because I was going to ask that or bring that up somehow. But her asking that before me was a weight off my shoulders.”
Discussing cultural identity through treatment strengthened veterans’ engagement in therapy. Many veterans appreciated when analogies used in therapy were relevant to their cultural experiences and when clinicians understood their culture (eg, military culture, race, ethnicity, religious beliefs, sexual orientation). One veteran described how their clinician understood military culture and made connections between military culture and the rationale for TF-EBP, which strengthened the veteran’s buy-in for the treatment and alliance with the clinician:
At the beginning when she was explaining PTSD, and I remember she said that your brain needed to think this way when you were in the military because it was a way of protecting and surviving, so your brain was doing that in order for you to survive in whatever areas you were because there was danger. So, your brain had you thinking that way. But now, you’re not in those situations anymore. You’re not in danger. You’re not in the military, but your brain is still thinking you are, and that’s what PTSD generally does to you.
Specific elements of TF-EBP also provided opportunities to discuss and integrate important aspects of identity. This is accomplished in PE by assigning relevant in vivo exercises. In CPT, “connecting the dots” on how prior experiences influenced trauma-related stuck points achieved this element. One veteran described their experience with a clinician who was comfortable discussing the veteran’s sexual orientation and recognized the impacts of prior trauma on intimacy:
They’re very different, and there’s a lot of things that can be accepted in gay relationships that are not in straight ones. With all that said, I think [the PE therapist] did a fantastic job being not—like never once did she laugh or make an uncomfortable comment or say she didn’t wanna talk about something when like part of the reason I wanted to get into therapy is that my partner and I weren’t having sex unless I used alcohol.
Discussion
As part of a larger national qualitative investigation of the experiences of veterans who recently initiated TF-EBP, veterans discussed their experiences with therapy and mental health care that have important implications for continued process improvement.21 Three key areas for continued process improvement were identified: (1) providing information about the diverse range of mental health care services at the VA and the implications of this continuum of care; (2) consideration of veteran preferences in treatment decision-making, including the importance of perceived choice; and (3) incorporating cultural assessment and cultural responsiveness into case conceptualization and treatment.
One area of process improvement identified was increasing knowledge about different types of psychotherapy and the continuum of care available at the VA. Veterans in this study confused or conflated participating in psychotherapy with talking about mental health symptoms with a clinician (eg, assessment, disability evaluation). They were sometimes surprised that psychotherapy is an umbrella term referring to a variety of different modalities. The downstream impact of these misunderstandings was a perception of VA mental health care as nebulous. Veterans were surprised that all mental health practitioners were unable to provide the same care. Confusion may have been compounded by highly variable referral processes across VA.24 To address this, clinicians have developed local educational resources and handouts for both veterans and referring clinicians from nonmental health and general mental health specialties.25 Given the variability in referral processes both between and within VA medical centers, national dissemination of these educational materials may be more difficult compared to materials for TF-EBPs.24 The VA started to use behavioral health interdisciplinary program (BHIP) teams, which are designed to be clinical homes for veterans connected with a central clinician who can explain and coordinate their mental health care as well as bring more consistency to the referral process.26 The ongoing transition toward the BHIP model of mental health care at VA may provide the opportunity to consolidate and integrate knowledge about the VA approach to mental health care, potentially filling knowledge gaps.
A second area of process improvement focused on the shared decision-making process. Consistent with mental health initiatives, veterans generally believed they had received sufficient information about TF-EBP and engaged in shared decision-making with clinicians.20,27 Veterans were given educational materials to review and had the opportunity to discuss these materials with clinicians. However, veterans described variability in the success of shared decision-making. Although veterans valued receiving accurate, comprehensible information to support treatment decisions, some preferred to defer to clinicians’ expertise regarding which treatment to pursue. While these veterans valued information, they also valued the expertise of clinicians in explaining why specific treatments would be beneficial. A key contributor to veterans satisfaction was assessing how veterans wanted to engage in the decision-making process and respecting those preferences.28 Veterans approached shared decision-making differently, from making decisions independently after receiving information to relying solely on clinician recommendation. The process was most successful when clinicians articulated how their recommended treatment aligned with a veteran’s preferences, including recommendations based on specific values (eg, personalized match vs being the best). Another important consideration is ensuring veterans know they can receive a variety of different types of mental health services available in different modalities (eg, virtual vs in-person; group vs individual). When veterans did not perceive choice in treatment aspects important to them (typically despite having choices), they were less satisfied with their TF-EBP experience.
A final area of process improvement identified involves how therapists address important aspects of culture. Veterans often described mental health stigma coming from intersecting cultural identities and expressed appreciation when therapists helped them recognize the impact of these beliefs on treatment. Some veterans did not discuss important aspects of their identity with clinicians, including race/ethnicity, religion, and military culture. Veterans did not report negative interactions with clinicians or experiences suggesting it was inappropriate to discuss identity; however, they were reluctant to independently raise these identity factors. Strategies such as the ADDRESSING framework, a mnemonic acronym that describes a series of potentially relevant characteristics, can help clinicians comprehensively consider different aspects that may be relevant to veterans, modeling that discussion of relevant these characteristics is welcome in TF-EBP.29 Veterans reported that making culturally relevant connections enhanced the TF-EBP experience, most commonly with military culture. These data support that TF-EBP delivery with attention to culture should be an integrated part of treatment, supporting engagement and therapeutic alliance.30 The VA National Center for PTSD consultation program is a resource to support clinicians in assessing and incorporating relevant aspects of cultural identity.31 For example, the National Center for PTSD provides a guide for using case conceptualization to address patient reactions to race-based violence during PTSD treatment.32 Both manualized design and therapist certification training can reinforce that assessing and attending to case conceptualization (including identity factors) is an integral component of TF-EBP.33,34
Limitations
While the current study has numerous strengths (eg, national veteran sampling, robust qualitative methods), results should be considered within the context of study limitations. First, veteran participants all received TF-EBP, and the perspectives of veterans who never initiate TF-EBP may differ. Despite the strong sampling approach, the study design is not intended to be generalizable to all veterans receiving TF-EBP for PTSD. Qualitative analysis yielded 15 themes, described in this study and prior research, consistent with recommendations.21,22 This approach allows rich description of distinct focus areas that would not be possible in a single manuscript. Nonetheless, all veterans interviewed described their experiences in TF-EBP and general mental health care, the focus of the semistructured interview guide was on the experience of transitioning from other treatment to TF-EBP.
Conclusion
This study describes themes related to general mental health and TF-EBP process improvement as part of a larger study on transitions in PTSD care.21,22 Veterans valued the fundamentals of therapy, including rapport and flexibility. Treatment-specific rapport (eg, pointing out treatment progress and effort in completing treatment components) and flexibility within the context of fidelity (ie, personalizing treatment while maintaining core treatment elements) may be most effective at engaging veterans in recommended PTSD treatments.18,34 In addition to successes, themes suggest multiple opportunities for process improvement. Ongoing VA initiatives and priorities (ie, BHIP, shared decision-making, consultation services) aim to improve processes consistent with veteran recommendations. Future research is needed to evaluate the success of these and other programs to optimize access to and engagement in recommended PTSD treatments.
- US Department of Veterans Affairs; US Department of Defense. VA/DoD clinical practice guideline for the management of posttraumatic stress disorder and acute stress disorder. 2023. Updated August 20, 2025. Accessed October 17, 2025. https://www.healthquality.va.gov/guidelines/MH/ptsd/
- International Society for Traumatic Stress Studies. ISTSS PTSD prevention and treatment guidelines: methodology and recommendations. Accessed August 13, 2025. http://www.istss.org/getattachment/Treating-Trauma/New-ISTSS-Prevention-and-TreatmentGuidelines/ISTSS_PreventionTreatmentGuidelines_FNL-March-19-2019.pdf.aspx
- American Psychological Association. Clinical practice guideline for the treatment of posttraumatic stress disorder in adults. Accessed August 13, 2025. https://www.apa.org/ptsd-guideline/ptsd.pdf
- Karlin BE, Cross G. From the laboratory to the therapy room: National dissemination and implementation of evidence- based psychotherapies in the U.S. Department of Veterans Affairs Health Care System. Am Psychol. 2014;69:19-33. doi:10.1037/a0033888
- Rosen CS, Matthieu MM, Wiltsey Stirman S, et al. A review of studies on the system-wide implementation of evidencebased psychotherapies for posttraumatic stress disorder in the Veterans Health Administration. Adm Policy Ment Health. 2016;43:957-977. doi:10.1007/s10488-016-0755-0
- Maguen S, Holder N, Madden E, et al. Evidence-based psychotherapy trends among posttraumatic stress disorder patients in a national healthcare system, 2001-2014. Depress Anxiety. 2020;37:356-364. doi:10.1002/da.22983
- Cheney AM, Koenig CJ, Miller CJ, et al. Veteran-centered barriers to VA mental healthcare services use. BMC Health Serv Res. 2018;18:591. doi:10.1186/s12913-018-3346-9
- Hundt NE, Mott JM, Miles SR, et al. Veterans’ perspectives on initiating evidence-based psychotherapy for posttraumatic stress disorder. Psychol Trauma. 2015;7:539-546. doi:10.1037/tra0000035
- Hundt NE, Helm A, Smith TL, et al. Failure to engage: a qualitative study of veterans who decline evidence-based psychotherapies for PTSD. Psychol Serv. 2018;15:536- 542. doi:10.1037/ser0000212
- Sayer NA, Friedemann-Sanchez G, Spoont M, et al. A qualitative study of determinants of PTSD treatment initiation in veterans. Psychiatry. 2009;72:238-255. doi:10.1521/psyc.2009.72.3.238
- Mittal D, Drummond KL, Blevins D, et al. Stigma associated with PTSD: perceptions of treatment seeking combat veterans. Psychiatr Rehabil J. 2013;36:86-92. doi:10.1037/h0094976
- Possemato K, Wray LO, Johnson E, et al. Facilitators and barriers to seeking mental health care among primary care veterans with posttraumatic stress disorder. J Trauma Stress. 2018;31:742-752. doi:10.1002/jts.22327
- Silvestrini M, Chen JA. “It’s a sign of weakness”: Masculinity and help-seeking behaviors among male veterans accessing posttraumatic stress disorder care. Psychol Trauma. 2023;15:665-671. doi:10.1037/tra0001382
- Stecker T, Shiner B, Watts BV, et al. Treatment-seeking barriers for veterans of the Iraq and Afghanistan conflicts who screen positive for PTSD. Psychiatr Serv. 2013;64:280-283. doi:10.1176/appi.ps.001372012
- Etingen B, Grubbs KM, Harik JM. Drivers of preference for evidence-based PTSD treatment: a qualitative assessment. Mil Med. 2020;185:303-310. doi:10.1093/milmed/usz220
- Hundt NE, Ecker AH, Thompson K, et al. “It didn’t fit for me:” A qualitative examination of dropout from prolonged exposure and cognitive processing therapy in veterans. Psychol Serv. 2020;17:414-421. doi:10.1037/ser0000316
- Kehle-Forbes SM, Gerould H, Polusny MA, et al. “It leaves me very skeptical” messaging in marketing prolonged exposure and cognitive processing therapy to veterans with PTSD. Psychol Trauma. 2022;14:849-852. doi:10.1037/tra0000550
- Kehle-Forbes SM, Ackland PE, Spoont MR, et al. Divergent experiences of U.S. veterans who did and did not complete trauma-focused therapies for PTSD: a national qualitative study of treatment dropout. Behav Res Ther. 2022;154:104123. doi:10.1016/j.brat.2022.104123
- Hessinger JD, London MJ, Baer SM. Evaluation of a shared decision-making intervention on the utilization of evidence-based psychotherapy in a VA outpatient PTSD clinic. Psychol Serv. 2018;15:437-441. doi:10.1037/ser0000141
- Hamblen JL, Grubbs KM, Cole B, et al. “Will it work for me?” Developing patient-friendly graphical displays of posttraumatic stress disorder treatment effectiveness. J Trauma Stress. 2022;35:999-1010. doi:10.1002/jts.22808
- Holder N, Ranney RM, Delgado AK, et al. Transitioning into trauma-focused evidence-based psychotherapy for posttraumatic stress disorder from other treatments: a qualitative investigation. Cogn Behav Ther. 2025;54:391-407. doi:10.1080/16506073.2024.2408386
- Levitt HM, Bamberg M, Creswell JW, et al. Journal article reporting standards for qualitative primary, qualitative meta-analytic, and mixed methods research in psychology: The APA Publications and Communications Board task force report. Am Psychol. 2018;73:26-46. doi:10.1037/amp0000151
- Palinkas LA, Mendon SJ, Hamilton AB. Innovations in mixed methods evaluations. Annu Rev Public Health. 2019;40:423- 442. doi:10.1146/annurev-publhealth-040218-044215
- Ranney RM, Cordova MJ, Maguen S. A review of the referral process for evidence-based psychotherapies for PTSD among veterans. Prof Psychol Res Pr. 2022;53:276-285. doi:10.1037/pro0000463
- Holder N, Ranney RM, Delgado AK, et al. Transitions to trauma-focused evidence-based psychotherapy for posttraumatic stress disorder from other treatment: a qualitative investigation of clinician’s perspectives. Cogn Behav Ther. 2025;1-19. doi:10.1080/16506073.2025.2481475
- Barry CN, Abraham KM, Weaver KR, et al. Innovating team-based outpatient mental health care in the Veterans Health Administration: staff-perceived benefits and challenges to pilot implementation of the Behavioral Health Interdisciplinary Program (BHIP). Psychol Serv. 2016;13:148-155. doi:10.1037/ser0000072
- Harik JM, Hundt NE, Bernardy NC, et al. Desired involvement in treatment decisions among adults with PTSD symptoms. J Trauma Stress. 2016;29:221-228. doi:10.1002/jts.22102
- Larsen SE, Hooyer K, Kehle-Forbes SM, et al. Patient experiences in making PTSD treatment decisions. Psychol Serv. 2024;21:529-537. doi:10.1037/ser0000817
- Hays PA. Four steps toward intersectionality in psychotherapy using the ADDRESSING framework. Prof Psychol Res Pr. 2024;55:454-462. doi:10.1037/pro0000577
- Galovski TE, Nixon RDV, Kaysen D. Flexible Applications of Cognitive Processing Therapy: Evidence-Based Treatment Methods. Academic Press; 2020.
- Larsen SE, McKee T, Fielstein E, et al. The development of a posttraumatic stress disorder (PTSD) consultation program to support system-wide implementation of high-quality PTSD care for veterans. Psychol Serv. 2025;22:342-348. doi:10.1037/ser0000867
- Galovski T, Kaysen D, McClendon J, et al. Provider guide to addressing patient reactions to race-based violence during PTSD treatment. PTSD.va.gov. Accessed August 3, 2025. www.ptsd.va.gov/professional/treat/specific/patient_reactions_race_violence.asp
- Galovski TE, Nixon RDV, Kehle-Forbes S. Walking the line between fidelity and flexibility: a conceptual review of personalized approaches to manualized treatments for posttraumatic stress disorder. J Trauma Stress. 2024;37:768-774. doi:10.1002/jts.23073
- Galovski TE, McSweeney LB, Nixon RDV, et al. Personalizing cognitive processing therapy with a case formulation approach to intentionally target impairment in psychosocial functioning associated with PTSD. Contemp Clin Trials Commun. 2024;42:101385. doi:10.1016/j.conctc.2024.101385
Trauma-focused evidence-based psychotherapies (TF-EBPs), including cognitive processing therapy (CPT) and prolonged exposure therapy (PE), are recommended treatments for posttraumatic stress disorder (PTSD) in clinical practice guidelines.1-3 To increase initiation of these treatments, the US Department of Veterans Affairs (VA) used a large-scale dissemination and implementation effort to improve access to TF-EBP.4,5 These efforts achieved modest success, increasing prevalence of TF-EBP from a handful of veterans in 2004 to an annual prevalence of 14.6% for CPT and 4.3% for PE in 2014.6
Throughout these efforts, qualitative studies have been used to better understand veterans’ perspectives on receiving TF-EBP care.7-18 Barriers to initiation of and engagement in TF-EBP and PTSD care have been identified from these qualitative studies. One identified barrier was lack of knowledge—particularly lack of knowledge about what is meant by a PTSD diagnosis and available treatments.7-10 Stigma (ie, automatic negative associations) toward mental health problems or seeking mental health care also has been identified as a barrier to initiation.7,10-14 Perceptions of poor alignment between treatment and veteran goals, including lack of buy-in for the rationale, served as barriers to initiation and engagement.8,15-18
Using prior qualitative work, numerous initiatives have been developed to reduce stigma, facilitate conversations about how treatment aligns with goals, and fill knowledge gaps, particularly through online resources and shared decision-making.19,20 To better inform the state of veterans’ experiences with TF-EBP, a qualitative investigation was conducted involving veterans who recently initiated TF-EBP. Themes directly related to transitions to TF-EBP were identified; however, all veterans interviewed also described their experiences with TFEBP engagement and mental health care. Consistent with recommendations for qualitative methods, this study extends prior work on transitions to TF-EBP by describing themes with a distinct focus on the experience of engaging with TF-EBP and mental health care.21,22
Methods
The experiences of veterans who were transitioning into TF-EBPs were collected in semistructured interviews and analyzed. The semistructured interview guide was developed and refined in consultation with both qualitative methods experts and PTSD treatment experts to ensure that 6 content domains were appropriately queried: PTSD treatment options, cultural sensitivity of treatment, PTSD treatment selection, transition criteria, beliefs about stabilization treatment, and treatment needs/preferences.
Participants were identified using the VA Corporate Data Warehouse and included post-9/11 veterans who had recently initiated CPT or PE for the first time between September 1, 2021, and September 1, 2022. More details of participant selection are available in Holder et al.21 From a population of 10,814 patients, stratified random sampling generated a recruitment pool of 200 veterans for further outreach. The strata were defined such that this recruitment pool had similar proportions of demographic characteristics (ie, gender, race, ethnicity) to the population of eligible veterans, equivalent distributions of time to CPT or PE initiation (ie, 33.3% < 1 year, 33.3% 1-3 years, and 33.3% > 3 years), and adequate variability in TF-EBP type (ie, 66.7% CPT, 33.3% PE). A manual chart review in the recruitment pool excluded 12 veterans who did not initiate CPT or PE, 1 veteran with evidence of current active psychosis and/or cognitive impairment that would likely preclude comprehension of study materials, and 1 who was deceased.
Eligible veterans from the recruitment pool were contacted in groups of 25. First, a recruitment letter with study information and instructions to opt-out of further contact was mailed or emailed to veterans. After 2 weeks, veterans who had not responded were contacted by phone up to 3 times. Veterans interested in participating were scheduled for a 1-time visit that included verbal consent and the qualitative interview. Metrics were established a priori to ensure an adequately diverse and inclusive sample. Specifically, a minimum number of racial and/or ethnic minority veterans (33%) and women veterans (20%) were sought. Equal distribution across the 3 categories of time from first mental health visit to CPT/PE initiation also was targeted. Throughout enrollment, recruitment efforts were adapted to meet these metrics in the emerging sample. While the goal was to generate a diverse and inclusive sample using these methods, the sample was not intended to be representative of the population.
Of the 186 eligible participants, 21 declined participation and 26 could not be reached. The targeted sample was reached after exhausting contact for 47 veterans and contacting 80 veterans for a final response rate of 40% among fully contacted veterans and 27% among veterans with any contact. The final sample included 30 veterans who received CPT or PE in VA facilities (Table).
After veterans provided verbal consent for study participation, sociodemographic information was verbally reported, and a 30- to 60-minute semistructured qualitative phone interview was recorded and transcribed. Veterans received $40 for participation. All procedures were approved by the University of California San Francisco Institutional Review Board.
Qualitative Data Analysis
Rapid analysis procedures were used to analyze qualitative data. This approach is suitable for focused, moderately structured qualitative analyses in health services research and facilitates rapid dissemination to stakeholders.23 The qualitative analysts were 2 clinical psychologists with expertise in PTSD treatment (NH primary and RR secondary). Consistent with rapid analysis procedures, analysts prepared a templated summary (including relevant quotations) of each interview, organized by the prespecified content domains. Interviews were summarized independently, compared to ensure consistency, and discrepancies were resolved through review of the interview source materials. Individual summary templates were combined into a master analytic matrix to facilitate the identification of patterns and delineation of themes. Analysts routinely met to identify, discuss, and refine preliminary themes, revisiting source materials to reach consensus as needed.
Results
Fifteen themes were identified and organized into 2 distinct focus areas: themes directly related to the transition to TF-EBP (8 themes) and themes related to veterans’ experiences with TF-EBP and general mental health care with potential process-improvement implications (7 themes).21 Seven themes were identified related to experiences with TF-EBP engagement and VA mental health care. The 7 themes related to TF-EBP engagement and VA mental health care themes are summarized with exemplary quotations.
Veterans want a better understanding of psychotherapy and engaging with VA mental health. Veterans reported that they generally had a poor or “nebulous” understanding about the experience of psychotherapy. For example, veterans exhibited confusion about whether certain experiences were equivalent to participating in psychotherapy. They were sometimes unable to distinguish between interactions such as assessment, disability evaluations, peer support, and psychotherapy. One veteran described a conversation with a TFEBP therapist about prior treatment:
She [asked], have you ever been, or gone through a therapy to begin with? And I, I said, well I just chatted with somebody. And she said that’s not, that’s not therapy. So, I was like, oh, it’s not? That’s not what people do?
Veterans were surprised the VA offered a diverse range of psychotherapy interventions, rather than simply therapy. They did not realize there were different types of psychotherapy. As a result, veterans were not aware that some VA mental practitioners have specialty training and certification to provide treatment matched to specific diagnoses or needs. They thought that all clinicians could provide the same care. One veteran described their understanding:
I just figured all mental health people are mental health people. I didn’t have a better understanding of the system and all the different levels and how it plays out and specialties and things like that. Which, I guess, I should have because you have a primary care doctor, but then you have specialists in all these other different sectors that specialize in one particular area. I guess that should’ve been common sense, but it wasn’t.
Stigma was a barrier to seeking and engaging in mental health care. Veterans discovered they had to overcome stigma associated with seeking and engaging in mental health treatment. Military culture was often discussed as promoting stigma regarding mental health treatment. Specifically, veterans described that seeking treatment meant “either, I’m weak or I’m gonna be seen as weak.” In active-duty settings, the strategy for dealing with mental health symptoms was to “leave those feelings, you push ‘em aside,” an approach highly inconsistent with TF-EBP. In some cases, incorrect information about the VA and PTSD was presented as part of discharge from the military, leading to long-term skepticism of the VA and PTSD treatment. One veteran described his experience as part of a class on the VA compensation and pension assessment process for service-connected disabilities during his military discharge:
[A fellow discharging soldier asked] what about like PTSD, gettin’ rated for PTSD. I hear they take our weapons and stuff like we can’t own firearms and all that stuff. And [the instructor] was like, well, yes that’s a thing. He didn’t explain it like if you get compensated for PTSD you don’t lose your rights to carry a firearm or to have, to be able to go hunting.
Importantly, veterans often described how other identities (eg, race, ethnicity, gender, region of origin) interacted with military culture to enhance stigma. Hearing messaging from multiple sources reinforced beliefs that mental health treatment is inappropriate or is associated with weakness:
As a first-generation Italian, I was always taught keep your feelings to yourself. Never talk outside your family. Never bring up problems to other people and stuff like that. Same with the military. And then the old stigma working in [emergency medical services] and public safety, you’re weak if you get help.
The fundamentals of therapy, including rapport and flexibility, were important. Veterans valued nonspecific therapy factors, genuine empathy, building trust, being honest about treatment, personality, and rapport. These characteristics were almost universally described as particularly important:
I liked the fact that she made it personable and she cared. It wasn’t just like, here, we’re gonna start this. She explained it in the ways I could understand, not in medical terms, so to speak, but that’s what I liked about her. She really cared about what she did and helping me.
Flexibility was viewed as an asset, particularly when clinicians acknowledged veteran autonomy. A consistent example was when veterans were able to titrate trauma disclosure. One veteran described this flexible treatment experience: “She was right there in the room, she said, you know, at any time, you know, we could stop, we could debrief.”
Experiences of clinician flexibility and personalization of therapy were contrasted with experiences of overly rigid therapy. Overemphasis on protocols created barriers, often because treatment did not feel personalized. One veteran described how a clinician’s task-oriented approach interfered with their ability to engage in TF-EBP:
They listened, but it just didn’t seem like they were listening, because they really wanted to stay on task… So, I felt like if the person was more concerned, or more sympathetic to the things that was also going on in my life at that present time, I think I would’ve felt more comfortable talking about what was the PTSD part, too.
Veterans valued shared decision-making prior to TF-EBP initiation. Veterans typically described being involved in a shared decision-making process prior to initiating TF-EBP. During these sessions, clinicians discussed treatment options and provided veterans with a variety of materials describing treatments (eg, pamphlets, websites, videos, statistics). Most veterans appreciated being able to reflect on and discuss treatment options with their clinicians. Being given time in and out of session to review was viewed as valuable and increased confidence in treatment choice. One veteran described their experience:
I was given the information, you know, they gave me handouts, PDFs, whatever was available, and let me read over it. I didn’t have to choose anything right then and there, you know, they let me sleep on it. And I got back to them after some thought.
However, some veterans felt overwhelmed by being presented with too much information and did not believe they knew enough to make a final treatment decision. One veteran described being asked to contribute to the treatment decision:
I definitely asked [the clinician] to weigh in on maybe what he thought was best, because—I mean, I don’t know… I’m not necessarily sure I know what I think is best. I think we’re just lucky I’m here, so if you can give me a solid and help me out here by telling me just based on what I’ve said to you and the things that I’ve gone through, what do you think?
Veterans who perceived that their treatment preferences were respected had a positive outlook on TF-EBP. As part of the shared-decision making process, veterans typically described being given choices among PTSD treatments. One way that preferences were respected was through clinicians tailoring treatment descriptions to a veteran’s unique symptoms, experiences, and values. In these cases, clinicians observed specific concerns and clearly linked treatment principles to those concerns. For example, one veteran described their clinician’s recommendation for PE: “The hardest thing for me is to do the normal things like grocery store or getting on a train or anything like that. And so, he suggested that [PE] would be a good idea.”
In other cases, veterans wanted the highest quality of treatment rather than a match between treatment principles and the veteran’s presentation, goals, or strengths. These veterans wanted the best treatment available for PTSD and valued research support, recommendations from clinical practice guidelines, or clinician confidence in the effectiveness of the treatment. One veteran described this perspective:
I just wanted to be able to really tackle it in the best way possible and in the most like aggressive way possible. And it seemed like PE really was going to, they said that it’s a difficult type of therapy, but I really just wanted to kind of do the best that I could to eradicate some of the issues that I was having.
When veterans perceived a lack of respect for their preferences, they were hesitant about TF-EBP. For some veterans, a generic pitch for a TF-EBP was detrimental in the absence of the personal connection between the treatment and their own symptoms, goals, or strengths. These veterans did not question whether the treatment was effective in general but did question whether the treatment was best for them. One veteran described the contrast between their clinician’s perspective and their own.
I felt like they felt very comfortable, very confident in [CPT] being the program, because it was comfortable for them. Because they did it several times. And maybe they had a lot of success with other individuals... but they were very comfortable with that one, as a provider, more than: Is this the best fit for [me]?
Some veterans perceived little concern for their preferences and a lack of choice in available treatments, which tended to perpetuate negative perceptions of TFEBP. These veterans described their lack of choices with frustration. Alternatives to TFEBP were described by these veterans as so undesirable that they did not believe they had a real choice:
[CPT] was the only decision they had. There was nothing else for PTSD. They didn’t offer anything else. So, I mean it wasn’t a decision. It was either … take treatment or don’t take treatment at all… Actually, I need to correct myself. So, there were 2 options, group therapy or CPT. I forgot about that. I’m not a big group guy so I chose the CPT.
Another veteran was offered a choice between therapeutic approaches, but all were delivered via telehealth (consistent with the transition to virtual services during the COVID-19 pandemic). For this veteran, not only was the distinction between approaches unclear, but the choice between approaches was unimportant compared to the mode of delivery.
This happened during COVID-19 and VA stopped seeing anybody physically, face-to-face. So my only option for therapy was [telehealth]… There was like 3 of them, and I tried to figure out, you know, from the layperson’s perspective, like: I don’t know which one to go with.
Veterans wanted to be asked about their cultural identity. Veterans valued when clinicians asked questions about cultural identity as part of their mental health treatment and listened to their cultural context. Cultural identity factors extended beyond factors such as race, ethnicity, gender, and sexual orientation to religion, military culture, and regionality. Veterans often described situations where they wished clinicians would ask the question or initiate conversations about culture. A veteran highlighted the importance of their faith but noted that it was a taboo topic. Their clinician did not say “we don’t go there,” but they “never dove into it either.” Another veteran expressed a desire for their clinician to ask questions about experiences in the National Guard and as an African American veteran:
If a provider was to say like: Oh, you know, it’s a stressful situation being a part of the military, being in the National Guard. You know, just asking questions about that. I think that would really go a long way… Being African American was difficult as well. And more so because of my region, I think… I felt like it would probably be an uncomfortable subject to speak on… I mean, it wasn’t anything that my providers necessarily did, it was more so just because it wasn’t brought up.
One common area of concern for veterans was a match between veteran and therapist demographics. When asked about how their cultural identity influenced treatment, several veterans described the relevance of therapist match. Much like questions about their own cultural identity, veterans valued being asked about identity preferences in clinicians (eg, gender or race matching), rather than having to bring up the preference themselves. One veteran described relief at this question being asked directly: “I was relieved when she had asked [whether I wanted a male or female clinician] primarily because I was going to ask that or bring that up somehow. But her asking that before me was a weight off my shoulders.”
Discussing cultural identity through treatment strengthened veterans’ engagement in therapy. Many veterans appreciated when analogies used in therapy were relevant to their cultural experiences and when clinicians understood their culture (eg, military culture, race, ethnicity, religious beliefs, sexual orientation). One veteran described how their clinician understood military culture and made connections between military culture and the rationale for TF-EBP, which strengthened the veteran’s buy-in for the treatment and alliance with the clinician:
At the beginning when she was explaining PTSD, and I remember she said that your brain needed to think this way when you were in the military because it was a way of protecting and surviving, so your brain was doing that in order for you to survive in whatever areas you were because there was danger. So, your brain had you thinking that way. But now, you’re not in those situations anymore. You’re not in danger. You’re not in the military, but your brain is still thinking you are, and that’s what PTSD generally does to you.
Specific elements of TF-EBP also provided opportunities to discuss and integrate important aspects of identity. This is accomplished in PE by assigning relevant in vivo exercises. In CPT, “connecting the dots” on how prior experiences influenced trauma-related stuck points achieved this element. One veteran described their experience with a clinician who was comfortable discussing the veteran’s sexual orientation and recognized the impacts of prior trauma on intimacy:
They’re very different, and there’s a lot of things that can be accepted in gay relationships that are not in straight ones. With all that said, I think [the PE therapist] did a fantastic job being not—like never once did she laugh or make an uncomfortable comment or say she didn’t wanna talk about something when like part of the reason I wanted to get into therapy is that my partner and I weren’t having sex unless I used alcohol.
Discussion
As part of a larger national qualitative investigation of the experiences of veterans who recently initiated TF-EBP, veterans discussed their experiences with therapy and mental health care that have important implications for continued process improvement.21 Three key areas for continued process improvement were identified: (1) providing information about the diverse range of mental health care services at the VA and the implications of this continuum of care; (2) consideration of veteran preferences in treatment decision-making, including the importance of perceived choice; and (3) incorporating cultural assessment and cultural responsiveness into case conceptualization and treatment.
One area of process improvement identified was increasing knowledge about different types of psychotherapy and the continuum of care available at the VA. Veterans in this study confused or conflated participating in psychotherapy with talking about mental health symptoms with a clinician (eg, assessment, disability evaluation). They were sometimes surprised that psychotherapy is an umbrella term referring to a variety of different modalities. The downstream impact of these misunderstandings was a perception of VA mental health care as nebulous. Veterans were surprised that all mental health practitioners were unable to provide the same care. Confusion may have been compounded by highly variable referral processes across VA.24 To address this, clinicians have developed local educational resources and handouts for both veterans and referring clinicians from nonmental health and general mental health specialties.25 Given the variability in referral processes both between and within VA medical centers, national dissemination of these educational materials may be more difficult compared to materials for TF-EBPs.24 The VA started to use behavioral health interdisciplinary program (BHIP) teams, which are designed to be clinical homes for veterans connected with a central clinician who can explain and coordinate their mental health care as well as bring more consistency to the referral process.26 The ongoing transition toward the BHIP model of mental health care at VA may provide the opportunity to consolidate and integrate knowledge about the VA approach to mental health care, potentially filling knowledge gaps.
A second area of process improvement focused on the shared decision-making process. Consistent with mental health initiatives, veterans generally believed they had received sufficient information about TF-EBP and engaged in shared decision-making with clinicians.20,27 Veterans were given educational materials to review and had the opportunity to discuss these materials with clinicians. However, veterans described variability in the success of shared decision-making. Although veterans valued receiving accurate, comprehensible information to support treatment decisions, some preferred to defer to clinicians’ expertise regarding which treatment to pursue. While these veterans valued information, they also valued the expertise of clinicians in explaining why specific treatments would be beneficial. A key contributor to veterans satisfaction was assessing how veterans wanted to engage in the decision-making process and respecting those preferences.28 Veterans approached shared decision-making differently, from making decisions independently after receiving information to relying solely on clinician recommendation. The process was most successful when clinicians articulated how their recommended treatment aligned with a veteran’s preferences, including recommendations based on specific values (eg, personalized match vs being the best). Another important consideration is ensuring veterans know they can receive a variety of different types of mental health services available in different modalities (eg, virtual vs in-person; group vs individual). When veterans did not perceive choice in treatment aspects important to them (typically despite having choices), they were less satisfied with their TF-EBP experience.
A final area of process improvement identified involves how therapists address important aspects of culture. Veterans often described mental health stigma coming from intersecting cultural identities and expressed appreciation when therapists helped them recognize the impact of these beliefs on treatment. Some veterans did not discuss important aspects of their identity with clinicians, including race/ethnicity, religion, and military culture. Veterans did not report negative interactions with clinicians or experiences suggesting it was inappropriate to discuss identity; however, they were reluctant to independently raise these identity factors. Strategies such as the ADDRESSING framework, a mnemonic acronym that describes a series of potentially relevant characteristics, can help clinicians comprehensively consider different aspects that may be relevant to veterans, modeling that discussion of relevant these characteristics is welcome in TF-EBP.29 Veterans reported that making culturally relevant connections enhanced the TF-EBP experience, most commonly with military culture. These data support that TF-EBP delivery with attention to culture should be an integrated part of treatment, supporting engagement and therapeutic alliance.30 The VA National Center for PTSD consultation program is a resource to support clinicians in assessing and incorporating relevant aspects of cultural identity.31 For example, the National Center for PTSD provides a guide for using case conceptualization to address patient reactions to race-based violence during PTSD treatment.32 Both manualized design and therapist certification training can reinforce that assessing and attending to case conceptualization (including identity factors) is an integral component of TF-EBP.33,34
Limitations
While the current study has numerous strengths (eg, national veteran sampling, robust qualitative methods), results should be considered within the context of study limitations. First, veteran participants all received TF-EBP, and the perspectives of veterans who never initiate TF-EBP may differ. Despite the strong sampling approach, the study design is not intended to be generalizable to all veterans receiving TF-EBP for PTSD. Qualitative analysis yielded 15 themes, described in this study and prior research, consistent with recommendations.21,22 This approach allows rich description of distinct focus areas that would not be possible in a single manuscript. Nonetheless, all veterans interviewed described their experiences in TF-EBP and general mental health care, the focus of the semistructured interview guide was on the experience of transitioning from other treatment to TF-EBP.
Conclusion
This study describes themes related to general mental health and TF-EBP process improvement as part of a larger study on transitions in PTSD care.21,22 Veterans valued the fundamentals of therapy, including rapport and flexibility. Treatment-specific rapport (eg, pointing out treatment progress and effort in completing treatment components) and flexibility within the context of fidelity (ie, personalizing treatment while maintaining core treatment elements) may be most effective at engaging veterans in recommended PTSD treatments.18,34 In addition to successes, themes suggest multiple opportunities for process improvement. Ongoing VA initiatives and priorities (ie, BHIP, shared decision-making, consultation services) aim to improve processes consistent with veteran recommendations. Future research is needed to evaluate the success of these and other programs to optimize access to and engagement in recommended PTSD treatments.
- US Department of Veterans Affairs; US Department of Defense. VA/DoD clinical practice guideline for the management of posttraumatic stress disorder and acute stress disorder. 2023. Updated August 20, 2025. Accessed October 17, 2025. https://www.healthquality.va.gov/guidelines/MH/ptsd/
- International Society for Traumatic Stress Studies. ISTSS PTSD prevention and treatment guidelines: methodology and recommendations. Accessed August 13, 2025. http://www.istss.org/getattachment/Treating-Trauma/New-ISTSS-Prevention-and-TreatmentGuidelines/ISTSS_PreventionTreatmentGuidelines_FNL-March-19-2019.pdf.aspx
- American Psychological Association. Clinical practice guideline for the treatment of posttraumatic stress disorder in adults. Accessed August 13, 2025. https://www.apa.org/ptsd-guideline/ptsd.pdf
- Karlin BE, Cross G. From the laboratory to the therapy room: National dissemination and implementation of evidence- based psychotherapies in the U.S. Department of Veterans Affairs Health Care System. Am Psychol. 2014;69:19-33. doi:10.1037/a0033888
- Rosen CS, Matthieu MM, Wiltsey Stirman S, et al. A review of studies on the system-wide implementation of evidencebased psychotherapies for posttraumatic stress disorder in the Veterans Health Administration. Adm Policy Ment Health. 2016;43:957-977. doi:10.1007/s10488-016-0755-0
- Maguen S, Holder N, Madden E, et al. Evidence-based psychotherapy trends among posttraumatic stress disorder patients in a national healthcare system, 2001-2014. Depress Anxiety. 2020;37:356-364. doi:10.1002/da.22983
- Cheney AM, Koenig CJ, Miller CJ, et al. Veteran-centered barriers to VA mental healthcare services use. BMC Health Serv Res. 2018;18:591. doi:10.1186/s12913-018-3346-9
- Hundt NE, Mott JM, Miles SR, et al. Veterans’ perspectives on initiating evidence-based psychotherapy for posttraumatic stress disorder. Psychol Trauma. 2015;7:539-546. doi:10.1037/tra0000035
- Hundt NE, Helm A, Smith TL, et al. Failure to engage: a qualitative study of veterans who decline evidence-based psychotherapies for PTSD. Psychol Serv. 2018;15:536- 542. doi:10.1037/ser0000212
- Sayer NA, Friedemann-Sanchez G, Spoont M, et al. A qualitative study of determinants of PTSD treatment initiation in veterans. Psychiatry. 2009;72:238-255. doi:10.1521/psyc.2009.72.3.238
- Mittal D, Drummond KL, Blevins D, et al. Stigma associated with PTSD: perceptions of treatment seeking combat veterans. Psychiatr Rehabil J. 2013;36:86-92. doi:10.1037/h0094976
- Possemato K, Wray LO, Johnson E, et al. Facilitators and barriers to seeking mental health care among primary care veterans with posttraumatic stress disorder. J Trauma Stress. 2018;31:742-752. doi:10.1002/jts.22327
- Silvestrini M, Chen JA. “It’s a sign of weakness”: Masculinity and help-seeking behaviors among male veterans accessing posttraumatic stress disorder care. Psychol Trauma. 2023;15:665-671. doi:10.1037/tra0001382
- Stecker T, Shiner B, Watts BV, et al. Treatment-seeking barriers for veterans of the Iraq and Afghanistan conflicts who screen positive for PTSD. Psychiatr Serv. 2013;64:280-283. doi:10.1176/appi.ps.001372012
- Etingen B, Grubbs KM, Harik JM. Drivers of preference for evidence-based PTSD treatment: a qualitative assessment. Mil Med. 2020;185:303-310. doi:10.1093/milmed/usz220
- Hundt NE, Ecker AH, Thompson K, et al. “It didn’t fit for me:” A qualitative examination of dropout from prolonged exposure and cognitive processing therapy in veterans. Psychol Serv. 2020;17:414-421. doi:10.1037/ser0000316
- Kehle-Forbes SM, Gerould H, Polusny MA, et al. “It leaves me very skeptical” messaging in marketing prolonged exposure and cognitive processing therapy to veterans with PTSD. Psychol Trauma. 2022;14:849-852. doi:10.1037/tra0000550
- Kehle-Forbes SM, Ackland PE, Spoont MR, et al. Divergent experiences of U.S. veterans who did and did not complete trauma-focused therapies for PTSD: a national qualitative study of treatment dropout. Behav Res Ther. 2022;154:104123. doi:10.1016/j.brat.2022.104123
- Hessinger JD, London MJ, Baer SM. Evaluation of a shared decision-making intervention on the utilization of evidence-based psychotherapy in a VA outpatient PTSD clinic. Psychol Serv. 2018;15:437-441. doi:10.1037/ser0000141
- Hamblen JL, Grubbs KM, Cole B, et al. “Will it work for me?” Developing patient-friendly graphical displays of posttraumatic stress disorder treatment effectiveness. J Trauma Stress. 2022;35:999-1010. doi:10.1002/jts.22808
- Holder N, Ranney RM, Delgado AK, et al. Transitioning into trauma-focused evidence-based psychotherapy for posttraumatic stress disorder from other treatments: a qualitative investigation. Cogn Behav Ther. 2025;54:391-407. doi:10.1080/16506073.2024.2408386
- Levitt HM, Bamberg M, Creswell JW, et al. Journal article reporting standards for qualitative primary, qualitative meta-analytic, and mixed methods research in psychology: The APA Publications and Communications Board task force report. Am Psychol. 2018;73:26-46. doi:10.1037/amp0000151
- Palinkas LA, Mendon SJ, Hamilton AB. Innovations in mixed methods evaluations. Annu Rev Public Health. 2019;40:423- 442. doi:10.1146/annurev-publhealth-040218-044215
- Ranney RM, Cordova MJ, Maguen S. A review of the referral process for evidence-based psychotherapies for PTSD among veterans. Prof Psychol Res Pr. 2022;53:276-285. doi:10.1037/pro0000463
- Holder N, Ranney RM, Delgado AK, et al. Transitions to trauma-focused evidence-based psychotherapy for posttraumatic stress disorder from other treatment: a qualitative investigation of clinician’s perspectives. Cogn Behav Ther. 2025;1-19. doi:10.1080/16506073.2025.2481475
- Barry CN, Abraham KM, Weaver KR, et al. Innovating team-based outpatient mental health care in the Veterans Health Administration: staff-perceived benefits and challenges to pilot implementation of the Behavioral Health Interdisciplinary Program (BHIP). Psychol Serv. 2016;13:148-155. doi:10.1037/ser0000072
- Harik JM, Hundt NE, Bernardy NC, et al. Desired involvement in treatment decisions among adults with PTSD symptoms. J Trauma Stress. 2016;29:221-228. doi:10.1002/jts.22102
- Larsen SE, Hooyer K, Kehle-Forbes SM, et al. Patient experiences in making PTSD treatment decisions. Psychol Serv. 2024;21:529-537. doi:10.1037/ser0000817
- Hays PA. Four steps toward intersectionality in psychotherapy using the ADDRESSING framework. Prof Psychol Res Pr. 2024;55:454-462. doi:10.1037/pro0000577
- Galovski TE, Nixon RDV, Kaysen D. Flexible Applications of Cognitive Processing Therapy: Evidence-Based Treatment Methods. Academic Press; 2020.
- Larsen SE, McKee T, Fielstein E, et al. The development of a posttraumatic stress disorder (PTSD) consultation program to support system-wide implementation of high-quality PTSD care for veterans. Psychol Serv. 2025;22:342-348. doi:10.1037/ser0000867
- Galovski T, Kaysen D, McClendon J, et al. Provider guide to addressing patient reactions to race-based violence during PTSD treatment. PTSD.va.gov. Accessed August 3, 2025. www.ptsd.va.gov/professional/treat/specific/patient_reactions_race_violence.asp
- Galovski TE, Nixon RDV, Kehle-Forbes S. Walking the line between fidelity and flexibility: a conceptual review of personalized approaches to manualized treatments for posttraumatic stress disorder. J Trauma Stress. 2024;37:768-774. doi:10.1002/jts.23073
- Galovski TE, McSweeney LB, Nixon RDV, et al. Personalizing cognitive processing therapy with a case formulation approach to intentionally target impairment in psychosocial functioning associated with PTSD. Contemp Clin Trials Commun. 2024;42:101385. doi:10.1016/j.conctc.2024.101385
Process Improvement for Engaging With Trauma-Focused Evidence-Based Psychotherapy for PTSD
Process Improvement for Engaging With Trauma-Focused Evidence-Based Psychotherapy for PTSD
Preoperative Diabetes Management for Patients Undergoing Elective Surgeries at a Veterans Affairs Medical Center
Preoperative Diabetes Management for Patients Undergoing Elective Surgeries at a Veterans Affairs Medical Center
More than 38 million people in the United States (12%) have diabetes mellitus (DM), though 1 in 5 are unaware they have DM.1 The prevalence among veterans is even more substantial, impacting nearly 25% of those who received care from the US Department of Veterans Affairs (VA).2 DM can lead to increased health care costs in addition to various complications (eg, cardiovascular, renal), especially if left uncontrolled.1,3 similar impact is found in the perioperative period (defined as at or around the time of an operation), as multiple studies have found that uncontrolled preoperative DM can result in worsened surgical outcomes, including longer hospital stays, more infectious complications, and higher perioperative mortality.4-6
In contrast, adequate glycemic control assessed with blood glucose levels has been shown to decrease the incidence of postoperative infections.7 Optimizing glycemic control during hospital stays, especially postsurgery, has become the standard of care, with most health systems establishing specific protocols. In current literature, most studies examining DM management in the perioperative period are focused on postoperative care, with little attention to the preoperative period.4,6,7
One study found that patients with poor presurgery glycemic control assessed by hemoglobin A1c (HbA1c) levels were more likely to remain hyperglycemic during and after surgery. 8 Blood glucose levels < 200 mg/dL can lead to an increased risk of infection and impaired wound healing, meaning a well-controlled HbA1c before a procedure serves as a potential factor for success.9 The 2025 American Diabetes Association (ADA) Standards of Care (SOC) recommendation is to target HbA1c < 8% whenever possible, and some health systems require lower levels (eg, < 7% or 7.5%).10 With that goal in mind and knowing that preoperative hyperglycemia has been shown to be a contributing factor in the delay or cancellation of surgical cases, an argument can be made that attention to preoperative DM management also should be a focus for health care systems performing surgeries.8,9,11
Attention to glucose control during preoperative care offers an opportunity to screen for DM in patients who may not have been screened otherwise and to standardize perioperative DM management. Since DM disproportionately impacts veterans, this is a pertinent issue to the VA. Veterans can be more susceptible to complications if DM is left uncontrolled prior to surgery. To determine readiness for surgery and control of comorbid conditions such as DM before a planned surgery, facilities often perform a preoperative clinic assessment, often in a multidisciplinary clinic.
At Veteran Health Indiana (VHI), a presurgery clinic visit involving the primary surgery service (physician, nurse practitioner, and/or a physician assistant) is conducted 1 to 2 months prior to the planned procedure to determine whether a patient is ready for surgery. During this visit, patients receive a packet with instructions for various tasks and medications, such as applying topical antibiotic prophylaxis on the anticipated surgical site. This is documented in the form of a note in the VHI Computerized Patient Record System (CPRS). The medication instructions are provided according to the preferences of the surgical team. These may be templated notes that contain general directions on the timing and dosing of specific medications, in addition to instructions for holding or reducing doses when appropriate. The instructions can be tailored by the team conducting the preoperative visit (eg, “Take 20 units of insulin glargine the day before surgery” vs “Take half of your long-acting insulin the night before surgery”). Specific to DM, VHI has a nurse-driven day of surgery glucose assessment where point-of-care blood glucose is collected during preoperative holding for most patients.
There is limited research assessing the level of preoperative glycemic control and the incidence of complications in a veteran population. The objective of this study was to gain a baseline understanding of what, if any, standardization exists for preoperative instructions for DM medications and to assess the level of preoperative glycemic control and postoperative complications in patients with DM undergoing major elective surgical procedures.
Methods
This retrospective, single-center chart review was conducted at VHI. The Indiana University and VHI institutional review boards determined that this quality improvement project was exempt from review.
The primary outcome was the number of patients with surgical procedures delayed or canceled due to hyperglycemia or hypoglycemia. Hyperglycemia was defined as blood glucose > 180 mg/dL and hypoglycemia was defined as < 70 mg/dL, slight variations from the current ADA SOC preoperative specific recommendation of a blood glucose reading of 100 to 180 mg/dL within 4 hours of surgery.10 The standard outpatient hypoglycemia definition of blood glucose < 70 mg/dL was chosen because the current goal (< 100 mg/dL) was not the standard in previous ADA SOCs that were in place during the study period. Specifically, the 2018 ADA SOC did not provide preoperative recommendations and the 2019-2021 ADA SOC recommended 80 to 180 mg/dL.10,12-18 For patients who had multiple preoperative blood glucose measurements, the first recorded glucose on the day of the procedure was used.
The secondary outcomes of this study were focused on the preoperative process/care at VHI and postoperative glycemic control. The preoperative process included examining whether medication instructions were given and their quality. Additionally, the number of interventions for hyperglycemia and hypoglycemia were required immediately prior to surgery and the average preoperative HbA1c (measured within 3 months prior to surgery) were collected and analyzed. For postoperative glycemic control, average blood glucose measurements and number of hypoglycemic (< 70 mg/dL) and hyperglycemic (> 180 mg/dL) events were measured in addition to the frequency of changes made at discharge to patients’ DM medication regimens.
The safety outcome of this study assessed commonly observed postoperative complications and was examined up to 30 days postsurgery. These included acute kidney injury (defined using Kidney Disease: Improving Global Outcomes 2012, the standard during the study period), nonfatal myocardial infarction, nonfatal stroke, and surgical site infections, which were identified from the discharge summary written by the primary surgery service.19 All-cause mortality also was collected.
Patients were included if they were admitted for major elective surgeries and had a diagnosis of either type 1 or type 2 DM on their problem list, determined by International Classification of Diseases, Tenth Revision codes. Major elective surgery was defined as a procedure that would likely result in a hospital admission of > 24 hours. Of note, patients may have been included in this study more than once if they had > 1 procedure at least 30 days apart and met inclusion criteria within the time frame. Patients were excluded if they were taking no DM medications or chronic steroids (at any dose), residing in a long-term care facility, being managed by a non-VA clinician prior to surgery, or missing a preoperative blood glucose measurement.
All data were collected from the CPRS. A list of surgical cases involving patients with DM who were scheduled to undergo major elective surgeries from January 1, 2018, to December 31, 2021, at VHI was generated. The list was randomized to a smaller number (N = 394) for data collection due to the time and resource constraints for a pharmacy residency project. All data were deidentified and stored in a secured VA server to protect patient confidentiality. Descriptive statistics were used for all results.
Results
Initially, 2362 surgeries were identified. A randomized sample of 394 charts were reviewed and 131 cases met inclusion criteria. Each case involved a unique patient (Figure). The most common reasons for exclusion were 143 patients with diet-controlled DM and 78 nonelective surgeries. The mean (SD) age of patients was 68 (8) years, and the most were male (98.5%) and White (76.3%) (Table 1).
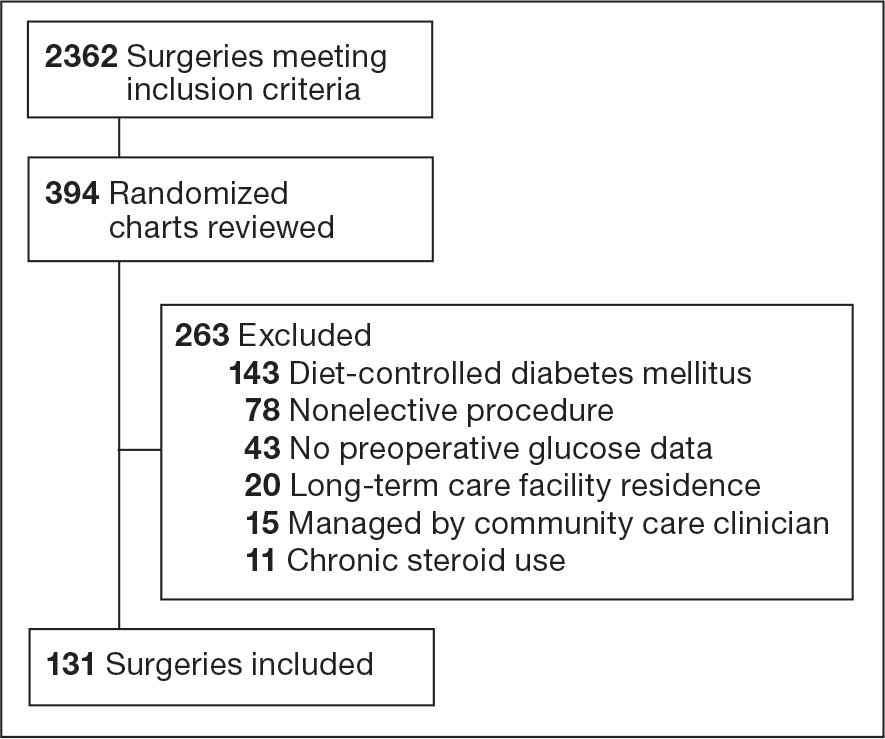
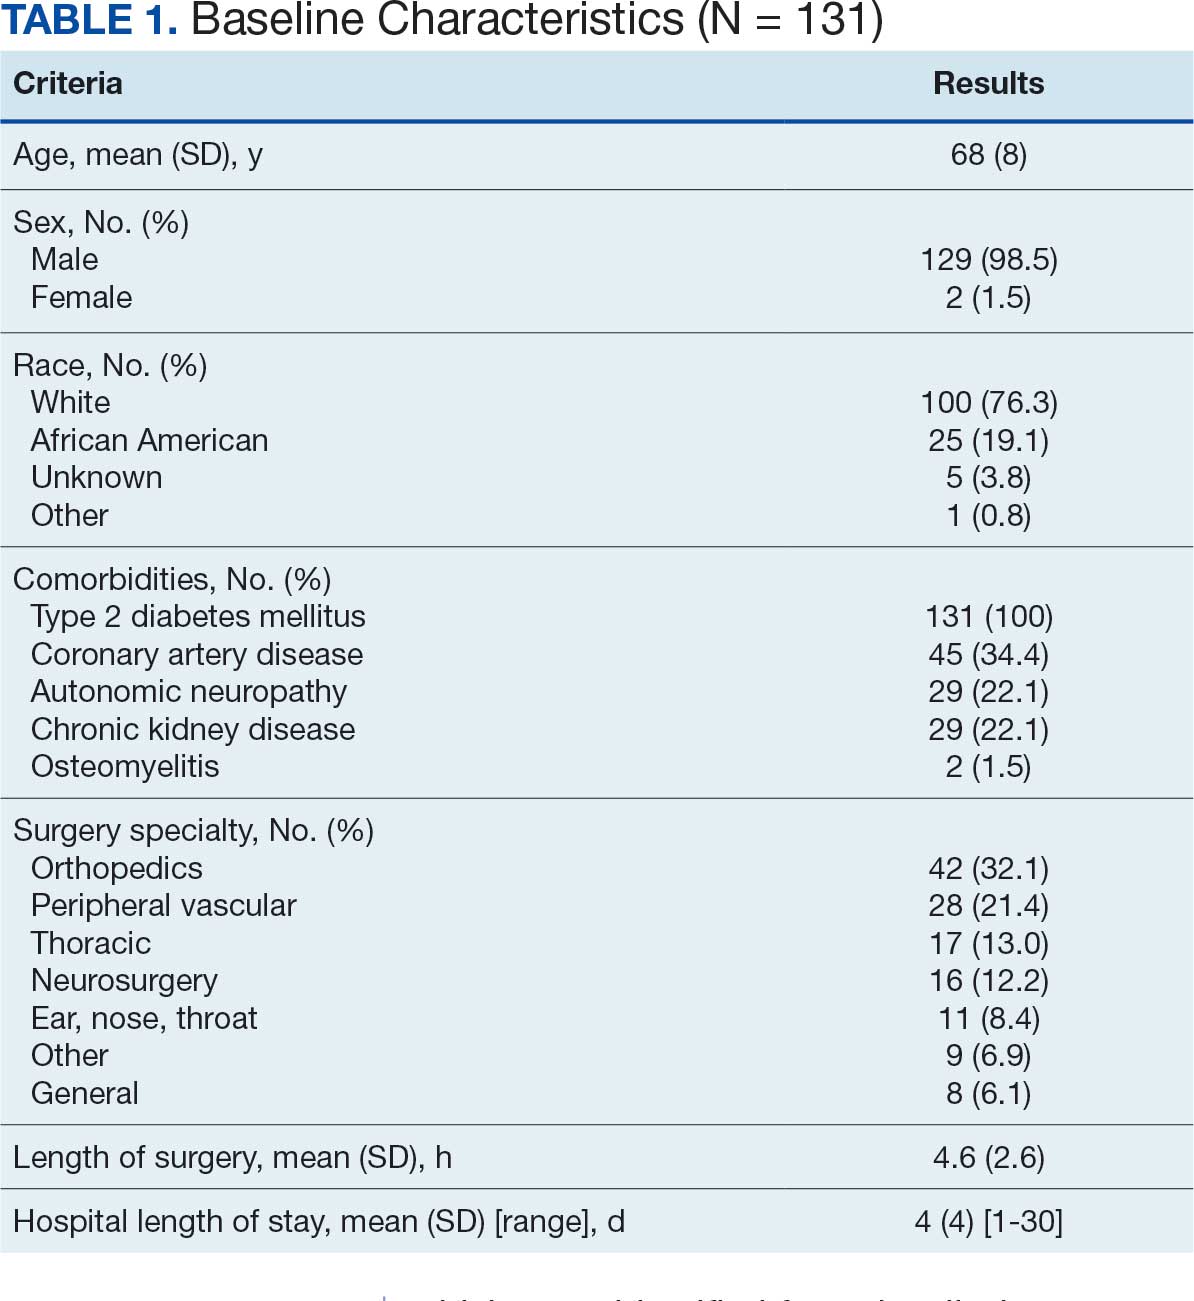
At baseline, 45 of 131 patients (34.4%) had coronary artery disease and 29 (22.1%) each had autonomic neuropathy and chronic kidney disease. Most surgeries were conducted by orthopedic (32.1%) and peripheral vascular (21.4%) specialties. The mean (SD) length of surgery was 4.6 (2.6) hours and of hospital length of stay was 4 (4) days. No patients stayed longer than the 30-day safety outcome follow-up period. All patients had type 2 DM and took a mean 2 DM medications. The 63 patients taking insulin had a mean (SD) total daily dose of 99 (77) U (Table 2). A preoperative HbA1c was collected in 116 patients within 3 months of surgery, with a mean HbA1c of 7.0% (range, 5.3-10.7).
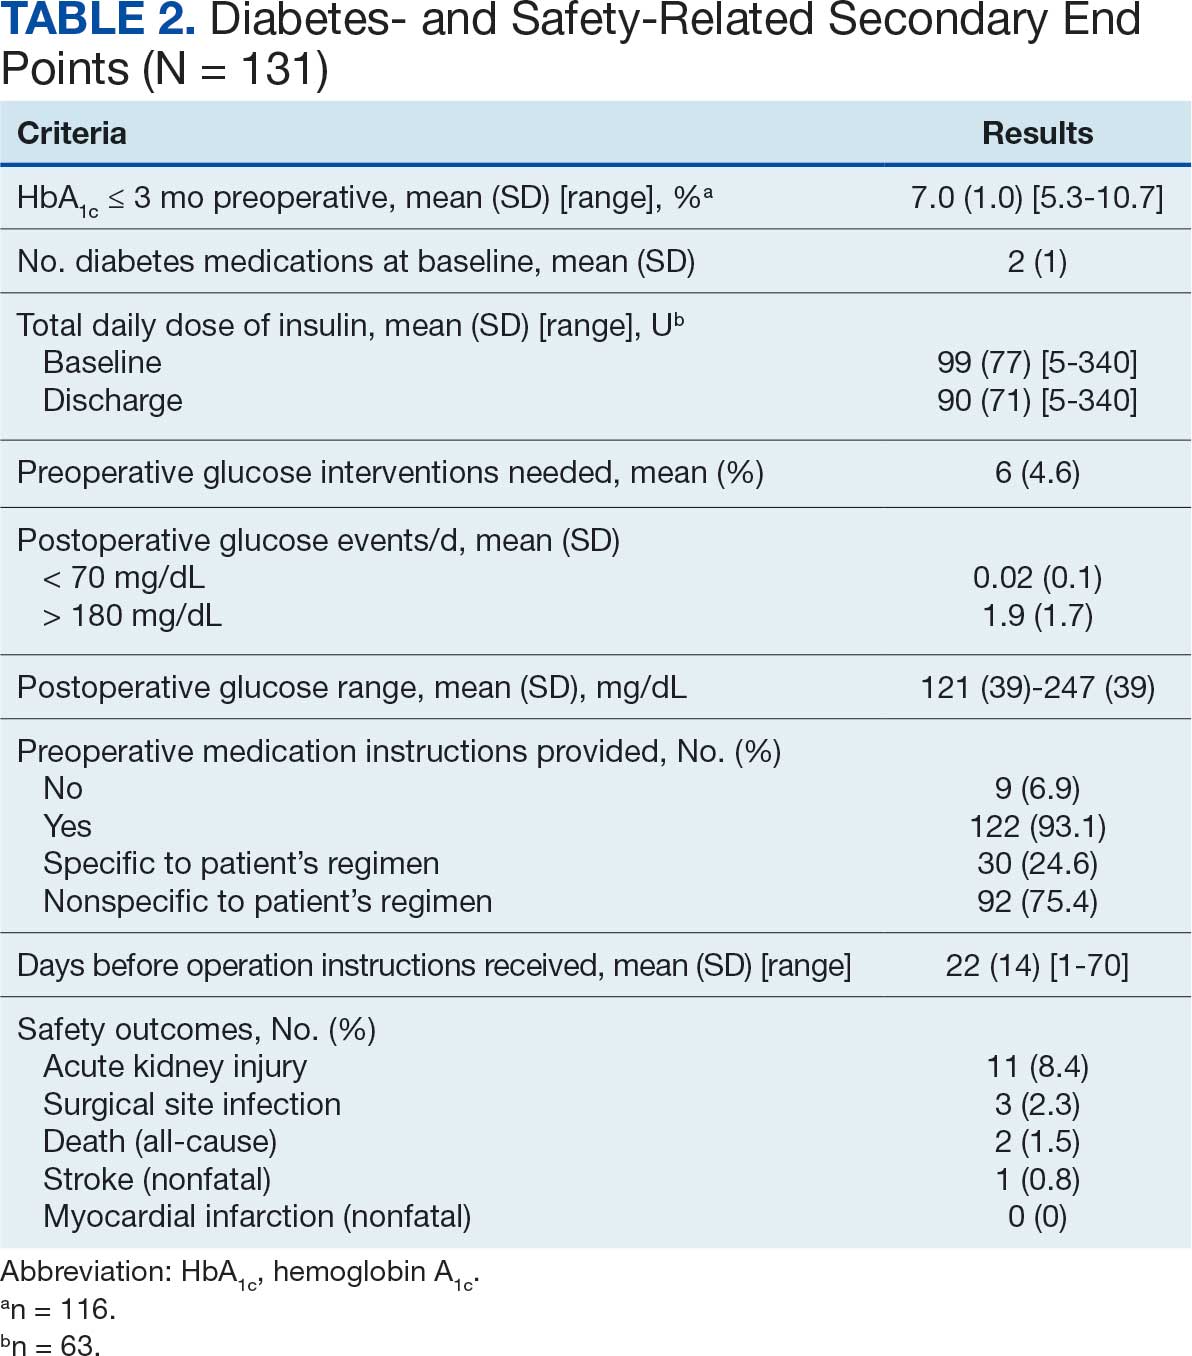
No patients had surgeries delayed or canceled because of uncontrolled DM on the day of surgery. The mean preoperative blood glucose level was 146 mg/dL (range, 73-365) (Table 3). No patients had a preoperative blood glucose level of < 70 mg/dL and 19 (14.5%) had a blood glucose level > 180 mg/dL. Among patients with hyperglycemia immediately prior to surgery, 6 (31.6%) had documentation of insulin being provided.
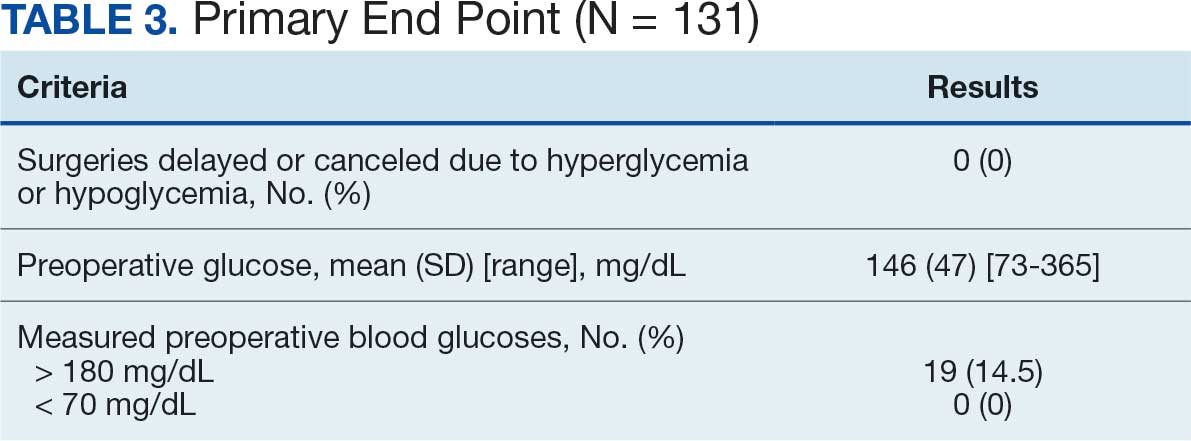
For this sample of patients, the preoperative clinic visit was conducted a mean 22 days prior to the planned surgery date. Among the 131 included patients, 122 (93.1%) had documentation of receiving instructions for DM medications. Among patients who had documented receipt of instructions, only 30 (24.6%) had instructions specifically tailored to their regimen rather than a generic templated form. The mean (SD) preoperative blood glucose was similar for those who received specific perioperative DM instructions at 146 (50) mg/dL when compared with those who did not at 147 (45) mg/dL. The mean (SD) preoperative blood glucose reading for those who had no documentation of receipt of perioperative instructions was 126 (54) mg/dL compared with 147 (46) mg/dL for those who did.
The mean number of postoperative blood glucose events per day was negligible for hypoglycemia and more frequent for hyperglycemia with a mean of 2 events per day. The mean postoperative blood glucose range was 121 to 247 mg/dL with most readings < 180 mg/dL. Upon discharge, most patients continued their home DM regimen with 5 patients (3.8%) having changes made to their regimen upon discharge.
Very few postoperative complications were identified from chart review. The most frequently observed postoperative complications were acute kidney injury, surgical site infections, and nonfatal stroke. There were no documented nonfatal myocardial infarctions. Two patients (1.5%) died within 30 days of the surgery; neither death was deemed to have been related to poor perioperative glycemic control.
Discussion
To our knowledge, this retrospective chart review was the first study to assess preoperative DM management and postoperative complications in a veteran population. VHI is a large, tertiary, level 1a, academic medical center that serves approximately 62,000 veterans annually and performs about 5000 to 6000 surgeries annually, a total that is increasing following the COVID-19 pandemic.20 This study found that the current process of a presurgery clinic visit and day of surgery glucose assessment has prevented surgical delays or cancellations.
Most patients included in this study were well controlled at baseline in accordance with the 2025 ADA SOC HbA1c recommendation of a preoperative HbA1c of < 8%, which may have contributed to no surgical delays or cancellations.10 However, not all patients had HbA1c collected within 3 months of surgery or even had one collected at all. Despite the ADA SOC providing no explicit recommendation for universal HbA1c screening prior to elective procedures, its importance cannot be understated given the body of evidence demonstrating poor outcomes with uncontrolled preoperative DM.8,10 The glycemic control at baseline may have contributed to the very few postsurgical complications observed in this study.
Although the current process at VHI prevented surgical delays and cancellations in this sample, there are still identified areas for improvement. One area is the instructions the patients received. Patients with DM are often prescribed ≥ 1 medication or a combination of insulins, noninsulin injectables, and oral DM medications, and this study population was no different. Because these medications may influence the anesthesia and perioperative periods, the ADA has specific guidance for altering administration schedules in the days leading up to surgery.10
Inappropriate administration of DM medications could lead to perioperative hypoglycemia or hyperglycemia, possibly causing surgical delays, case cancellations, and/or postoperative complications.21 Although these data reveal the specificity and documented receipt that the preoperative DM instructions did not impact the first recorded preoperative blood glucose, future studies should examine patient confidence in how to properly administer their DM medications prior to surgery. It is vital that patients receive clear instructions in accordance with the ADA SOC on whether to continue, hold, or adjust the dose of their medications to prevent fluctuations in blood glucose levels in the perioperative period, ensure safety with anesthesia, and prevent postoperative complications such as acute kidney injury. Of note, compliance with guideline recommendations for medication instructions was not examined because the data collection time frame expanded over multiple years and the recommendations have evolved each year as new data emerge.
Preoperative DM Management
The first key takeaway from this study is to ensure patients are ready for surgery with a formal assessment (typically in the form of a clinic visit) prior to the surgery. One private sector health system published their approach to this by administering an automatic preoperative HbA1c screening for those with a DM diagnosis and all patients with a random plasma glucose ≥ 200 mg/dL.22 Additionally, if the patient's HbA1c level was not at goal prior to surgery (≥ 8% for those with known DM and ≥ 6.5% with no known DM), patients were referred to endocrinology for further management. Increasing attention to the preoperative visit and extending HbA1c testing to all patients regardless of DM status also provides an opportunity to identify individuals living with undiagnosed DM.1
Even though there was no difference in the mean preoperative blood glucose level based on receipt or specificity of preoperative DM instructions, a second takeaway from this study is the importance of ensuring patients receive clear instructions on their DM medication schedule in the perioperative period. A practical first step may be updating the templates used by the primary surgery teams and providing education to the clinicians in the clinic on how to personalize the visits. Because the current preoperative DM process at VHI is managed by the primary surgical team in a clinic visit, there is an opportunity to shift this responsibility to other health care professionals, such as pharmacists—a change shown to reduce unintended omission of home medications following surgery during hospitalization and reduce costs.23,24
Limitations
This study relied on data included in the patient chart. These data include medication interventions made immediately prior to surgery, which can sometimes be inaccurately charted or difficult to find as they are not documented in the typical medication administration record. Also, the safety outcomes were collected from a discharge summary written by different clinicians, which may lead to information bias. Special attention was taken to ensure these data points were collected as accurately as possible, but it is possible some data may be inaccurate from unintentional human error. Additionally, the safety outcome was limited to a 30-day follow-up, but encompassed the entire length of postoperative stay for all included patients. Finally, given this study was retrospective with no comparison group and the intent was to improve processes at VHI, only hypotheses and potential interventions can be generated from this study. Future prospective studies with larger sample sizes and comparator groups are needed to draw further conclusions.
Conclusions
This study found that the current presurgery process at VHI appears to be successful in preventing surgical delays or cancellations due to hyperglycemia or hypoglycemia. Optimizing DM management can improve surgical outcomes by decreasing rates of postoperative complications, and this study added additional evidence in support of that in a unique population: veterans. Insight on the awareness of preoperative blood glucose management should be gleaned from this study, and based on this sample and site, the preadmission screening process and instructions provided to patients can serve as 2 starting points for optimizing elective surgery.
- Centers for Disease Control and Prevention. Diabetes basics. May 15, 2024. Accessed September 24, 2025. https://www.cdc.gov/diabetes/about/index.html
- Liu Y, Sayam S, Shao X, et al. Prevalence of and trends in diabetes among veterans, United States, 2005-2014. Prev Chronic Dis. 2017;14:E135. doi:10.5888/pcd14.170230
- Farmaki P, Damaskos C, Garmpis N, et al . Complications of the Type 2 Diabetes Mellitus. Curr Cardiol Rev. 2020;16(4):249-251. doi:10.2174/1573403X1604201229115531
- Frisch A, Chandra P, Smiley D, et al. Prevalence and clinical outcome of hyperglycemia in the perioperative period in noncardiac surgery. Diabetes Care. 2010;33:1783-1788. doi:10.2337/dc10-0304
- Noordzij PG, Boersma E, Schreiner F, et al. Increased preoperative glucose levels are associated with perioperative mortality in patients undergoing noncardiac, nonvascular surgery. Eur J Endocrinol. 2007;156:137 -142. doi:10.1530/eje.1.02321
- Pomposelli JJ, Baxter JK 3rd, Babineau TJ, et al. Early postoperative glucose control predicts nosocomial infection rate in diabetic patients. JPEN J Parenter Enteral Nutr. 1998;22:77-81. doi:10.1177/01486071980220027
- Umpierrez GE, Smiley D, Jacobs S, et al. Randomized study of basal-bolus insulin therapy in the inpatient management of patients with type 2 diabetes undergoing general surgery (RABBIT 2 surgery). Diabetes Care. 2011;34:256-261. doi:10.2337/dc10-1407
- Pasquel FJ, Gomez-Huelgas R, Anzola I, et al. Predictive value of admission hemoglobin A1c on inpatient glycemic control and response to insulin therapy in medicine and surgery patients with type 2 diabetes. Diabetes Care. 2015;38:e202-e203. doi:10.2337/dc15-1835
- Alexiewicz JM, Kumar D, Smogorzewski M, et al. Polymorphonuclear leukocytes in non-insulin-dependent diabetes mellitus: abnormalities in metabolism and function. Ann Intern Med. 1995;123:919-924. doi:10.7326/0003-4819-123-12-199512150-00004
- American Diabetes Association Professional Practice Committee. 16. Diabetes care in the hospital: Standards of Medical Care in Diabetes—2025. Diabetes Care. 2025;48(1 suppl 1):S321-S334. doi:10.2337/dc25-S016
- Kumar R, Gandhi R. Reasons for cancellation of operation on the day of intended surgery in a multidisciplinary 500 bedded hospital. J Anaesthesiol Clin Pharmacol. 2012;28:66-69. doi:10.4103/0970-9185.92442
- American Diabetes Association. 14. Diabetes care in the hospital: Standards of Medical Care in Diabetes— 2018. Diabetes Care. 2018;41(1 suppl 1):S144- S151. doi:10.2337/dc18-S014
- American Diabetes Association. 15. Diabetes care in the hospital: Standards of Medical Care in Diabetes— 2019. Diabetes Care. 2019;42(suppl 1):S173- S181. doi:10.2337/dc19-S015
- American Diabetes Association. 15. Diabetes care in the hospital: Standards of Medical Care in Diabetes— 2020. Diabetes Care. 2020;43(suppl 1):S193- S202. doi:10.2337/dc20-S015
- American Diabetes Association. 15. Diabetes care in the hospital: Standards of Medical Care in Diabetes— 2021. Diabetes Care. 2021;44(suppl 1):S211- S220. doi:10.2337/dc21-S015
- American Diabetes Association Professional Practice Committee. 16. Diabetes care in the hospital: Standards of Medical Care in Diabetes—2022. Diabetes Care. 2022;45(suppl 1):S244-S253. doi:10.2337/dc22-S016
- ElSayed NA, Aleppo G, Aroda VR, et al. 16. Diabetes care in the hospital: Standards of Care in Diabetes—2023. Diabetes Care. 2023;46(suppl 1):S267-S278. doi:10.2337/dc23-S016
- American Diabetes Association Professional Practice Committee. 16. Diabetes care in the hospital: Standards of Care in Diabetes—2024. Diabetes Care. 2024;47(suppl 1):S295-S306. doi:10.2337/dc24-S016
- Kidney Disease: Improving Global Outcomes (KDIGO) Acute Kidney Injury Work Group. KDIGO Clinical Practice Guideline for Acute Kidney Injury. Kidney Int Suppl. 2012;2:1-138. Accessed September 24, 2025. https:// www.kisupplements.org/issue/S2157-1716(12)X7200-9
- US Department of Veterans Affairs. VA Indiana Healthcare: about us. Accessed September 24, 2025. https:// www.va.gov/indiana-health-care/about-us/
- Koh WX, Phelan R, Hopman WM, et al. Cancellation of elective surgery: rates, reasons and effect on patient satisfaction. Can J Surg. 2021;64:E155-E161. doi:10.1503/cjs.008119
- Pai S-L, Haehn DA, Pitruzzello NE, et al. Reducing infection rates with enhanced preoperative diabetes mellitus diagnosis and optimization processes. South Med J. 2023;116:215-219. doi:10.14423/SMJ.0000000000001507
- Forrester TG, Sullivan S, Snoswell CL, et al. Integrating a pharmacist into the perioperative setting. Aust Health Rev. 2020;44:563-568. doi:10.1071/AH19126
- Hale AR, Coombes ID, Stokes J, et al. Perioperative medication management: expanding the role of the preadmission clinic pharmacist in a single centre, randomised controlled trial of collaborative prescribing. BMJ Open. 2013;3:e003027. doi:10.1136/bmjopen-2013-003027
More than 38 million people in the United States (12%) have diabetes mellitus (DM), though 1 in 5 are unaware they have DM.1 The prevalence among veterans is even more substantial, impacting nearly 25% of those who received care from the US Department of Veterans Affairs (VA).2 DM can lead to increased health care costs in addition to various complications (eg, cardiovascular, renal), especially if left uncontrolled.1,3 similar impact is found in the perioperative period (defined as at or around the time of an operation), as multiple studies have found that uncontrolled preoperative DM can result in worsened surgical outcomes, including longer hospital stays, more infectious complications, and higher perioperative mortality.4-6
In contrast, adequate glycemic control assessed with blood glucose levels has been shown to decrease the incidence of postoperative infections.7 Optimizing glycemic control during hospital stays, especially postsurgery, has become the standard of care, with most health systems establishing specific protocols. In current literature, most studies examining DM management in the perioperative period are focused on postoperative care, with little attention to the preoperative period.4,6,7
One study found that patients with poor presurgery glycemic control assessed by hemoglobin A1c (HbA1c) levels were more likely to remain hyperglycemic during and after surgery. 8 Blood glucose levels < 200 mg/dL can lead to an increased risk of infection and impaired wound healing, meaning a well-controlled HbA1c before a procedure serves as a potential factor for success.9 The 2025 American Diabetes Association (ADA) Standards of Care (SOC) recommendation is to target HbA1c < 8% whenever possible, and some health systems require lower levels (eg, < 7% or 7.5%).10 With that goal in mind and knowing that preoperative hyperglycemia has been shown to be a contributing factor in the delay or cancellation of surgical cases, an argument can be made that attention to preoperative DM management also should be a focus for health care systems performing surgeries.8,9,11
Attention to glucose control during preoperative care offers an opportunity to screen for DM in patients who may not have been screened otherwise and to standardize perioperative DM management. Since DM disproportionately impacts veterans, this is a pertinent issue to the VA. Veterans can be more susceptible to complications if DM is left uncontrolled prior to surgery. To determine readiness for surgery and control of comorbid conditions such as DM before a planned surgery, facilities often perform a preoperative clinic assessment, often in a multidisciplinary clinic.
At Veteran Health Indiana (VHI), a presurgery clinic visit involving the primary surgery service (physician, nurse practitioner, and/or a physician assistant) is conducted 1 to 2 months prior to the planned procedure to determine whether a patient is ready for surgery. During this visit, patients receive a packet with instructions for various tasks and medications, such as applying topical antibiotic prophylaxis on the anticipated surgical site. This is documented in the form of a note in the VHI Computerized Patient Record System (CPRS). The medication instructions are provided according to the preferences of the surgical team. These may be templated notes that contain general directions on the timing and dosing of specific medications, in addition to instructions for holding or reducing doses when appropriate. The instructions can be tailored by the team conducting the preoperative visit (eg, “Take 20 units of insulin glargine the day before surgery” vs “Take half of your long-acting insulin the night before surgery”). Specific to DM, VHI has a nurse-driven day of surgery glucose assessment where point-of-care blood glucose is collected during preoperative holding for most patients.
There is limited research assessing the level of preoperative glycemic control and the incidence of complications in a veteran population. The objective of this study was to gain a baseline understanding of what, if any, standardization exists for preoperative instructions for DM medications and to assess the level of preoperative glycemic control and postoperative complications in patients with DM undergoing major elective surgical procedures.
Methods
This retrospective, single-center chart review was conducted at VHI. The Indiana University and VHI institutional review boards determined that this quality improvement project was exempt from review.
The primary outcome was the number of patients with surgical procedures delayed or canceled due to hyperglycemia or hypoglycemia. Hyperglycemia was defined as blood glucose > 180 mg/dL and hypoglycemia was defined as < 70 mg/dL, slight variations from the current ADA SOC preoperative specific recommendation of a blood glucose reading of 100 to 180 mg/dL within 4 hours of surgery.10 The standard outpatient hypoglycemia definition of blood glucose < 70 mg/dL was chosen because the current goal (< 100 mg/dL) was not the standard in previous ADA SOCs that were in place during the study period. Specifically, the 2018 ADA SOC did not provide preoperative recommendations and the 2019-2021 ADA SOC recommended 80 to 180 mg/dL.10,12-18 For patients who had multiple preoperative blood glucose measurements, the first recorded glucose on the day of the procedure was used.
The secondary outcomes of this study were focused on the preoperative process/care at VHI and postoperative glycemic control. The preoperative process included examining whether medication instructions were given and their quality. Additionally, the number of interventions for hyperglycemia and hypoglycemia were required immediately prior to surgery and the average preoperative HbA1c (measured within 3 months prior to surgery) were collected and analyzed. For postoperative glycemic control, average blood glucose measurements and number of hypoglycemic (< 70 mg/dL) and hyperglycemic (> 180 mg/dL) events were measured in addition to the frequency of changes made at discharge to patients’ DM medication regimens.
The safety outcome of this study assessed commonly observed postoperative complications and was examined up to 30 days postsurgery. These included acute kidney injury (defined using Kidney Disease: Improving Global Outcomes 2012, the standard during the study period), nonfatal myocardial infarction, nonfatal stroke, and surgical site infections, which were identified from the discharge summary written by the primary surgery service.19 All-cause mortality also was collected.
Patients were included if they were admitted for major elective surgeries and had a diagnosis of either type 1 or type 2 DM on their problem list, determined by International Classification of Diseases, Tenth Revision codes. Major elective surgery was defined as a procedure that would likely result in a hospital admission of > 24 hours. Of note, patients may have been included in this study more than once if they had > 1 procedure at least 30 days apart and met inclusion criteria within the time frame. Patients were excluded if they were taking no DM medications or chronic steroids (at any dose), residing in a long-term care facility, being managed by a non-VA clinician prior to surgery, or missing a preoperative blood glucose measurement.
All data were collected from the CPRS. A list of surgical cases involving patients with DM who were scheduled to undergo major elective surgeries from January 1, 2018, to December 31, 2021, at VHI was generated. The list was randomized to a smaller number (N = 394) for data collection due to the time and resource constraints for a pharmacy residency project. All data were deidentified and stored in a secured VA server to protect patient confidentiality. Descriptive statistics were used for all results.
Results
Initially, 2362 surgeries were identified. A randomized sample of 394 charts were reviewed and 131 cases met inclusion criteria. Each case involved a unique patient (Figure). The most common reasons for exclusion were 143 patients with diet-controlled DM and 78 nonelective surgeries. The mean (SD) age of patients was 68 (8) years, and the most were male (98.5%) and White (76.3%) (Table 1).
At baseline, 45 of 131 patients (34.4%) had coronary artery disease and 29 (22.1%) each had autonomic neuropathy and chronic kidney disease. Most surgeries were conducted by orthopedic (32.1%) and peripheral vascular (21.4%) specialties. The mean (SD) length of surgery was 4.6 (2.6) hours and of hospital length of stay was 4 (4) days. No patients stayed longer than the 30-day safety outcome follow-up period. All patients had type 2 DM and took a mean 2 DM medications. The 63 patients taking insulin had a mean (SD) total daily dose of 99 (77) U (Table 2). A preoperative HbA1c was collected in 116 patients within 3 months of surgery, with a mean HbA1c of 7.0% (range, 5.3-10.7).
No patients had surgeries delayed or canceled because of uncontrolled DM on the day of surgery. The mean preoperative blood glucose level was 146 mg/dL (range, 73-365) (Table 3). No patients had a preoperative blood glucose level of < 70 mg/dL and 19 (14.5%) had a blood glucose level > 180 mg/dL. Among patients with hyperglycemia immediately prior to surgery, 6 (31.6%) had documentation of insulin being provided.
For this sample of patients, the preoperative clinic visit was conducted a mean 22 days prior to the planned surgery date. Among the 131 included patients, 122 (93.1%) had documentation of receiving instructions for DM medications. Among patients who had documented receipt of instructions, only 30 (24.6%) had instructions specifically tailored to their regimen rather than a generic templated form. The mean (SD) preoperative blood glucose was similar for those who received specific perioperative DM instructions at 146 (50) mg/dL when compared with those who did not at 147 (45) mg/dL. The mean (SD) preoperative blood glucose reading for those who had no documentation of receipt of perioperative instructions was 126 (54) mg/dL compared with 147 (46) mg/dL for those who did.
The mean number of postoperative blood glucose events per day was negligible for hypoglycemia and more frequent for hyperglycemia with a mean of 2 events per day. The mean postoperative blood glucose range was 121 to 247 mg/dL with most readings < 180 mg/dL. Upon discharge, most patients continued their home DM regimen with 5 patients (3.8%) having changes made to their regimen upon discharge.
Very few postoperative complications were identified from chart review. The most frequently observed postoperative complications were acute kidney injury, surgical site infections, and nonfatal stroke. There were no documented nonfatal myocardial infarctions. Two patients (1.5%) died within 30 days of the surgery; neither death was deemed to have been related to poor perioperative glycemic control.
Discussion
To our knowledge, this retrospective chart review was the first study to assess preoperative DM management and postoperative complications in a veteran population. VHI is a large, tertiary, level 1a, academic medical center that serves approximately 62,000 veterans annually and performs about 5000 to 6000 surgeries annually, a total that is increasing following the COVID-19 pandemic.20 This study found that the current process of a presurgery clinic visit and day of surgery glucose assessment has prevented surgical delays or cancellations.
Most patients included in this study were well controlled at baseline in accordance with the 2025 ADA SOC HbA1c recommendation of a preoperative HbA1c of < 8%, which may have contributed to no surgical delays or cancellations.10 However, not all patients had HbA1c collected within 3 months of surgery or even had one collected at all. Despite the ADA SOC providing no explicit recommendation for universal HbA1c screening prior to elective procedures, its importance cannot be understated given the body of evidence demonstrating poor outcomes with uncontrolled preoperative DM.8,10 The glycemic control at baseline may have contributed to the very few postsurgical complications observed in this study.
Although the current process at VHI prevented surgical delays and cancellations in this sample, there are still identified areas for improvement. One area is the instructions the patients received. Patients with DM are often prescribed ≥ 1 medication or a combination of insulins, noninsulin injectables, and oral DM medications, and this study population was no different. Because these medications may influence the anesthesia and perioperative periods, the ADA has specific guidance for altering administration schedules in the days leading up to surgery.10
Inappropriate administration of DM medications could lead to perioperative hypoglycemia or hyperglycemia, possibly causing surgical delays, case cancellations, and/or postoperative complications.21 Although these data reveal the specificity and documented receipt that the preoperative DM instructions did not impact the first recorded preoperative blood glucose, future studies should examine patient confidence in how to properly administer their DM medications prior to surgery. It is vital that patients receive clear instructions in accordance with the ADA SOC on whether to continue, hold, or adjust the dose of their medications to prevent fluctuations in blood glucose levels in the perioperative period, ensure safety with anesthesia, and prevent postoperative complications such as acute kidney injury. Of note, compliance with guideline recommendations for medication instructions was not examined because the data collection time frame expanded over multiple years and the recommendations have evolved each year as new data emerge.
Preoperative DM Management
The first key takeaway from this study is to ensure patients are ready for surgery with a formal assessment (typically in the form of a clinic visit) prior to the surgery. One private sector health system published their approach to this by administering an automatic preoperative HbA1c screening for those with a DM diagnosis and all patients with a random plasma glucose ≥ 200 mg/dL.22 Additionally, if the patient's HbA1c level was not at goal prior to surgery (≥ 8% for those with known DM and ≥ 6.5% with no known DM), patients were referred to endocrinology for further management. Increasing attention to the preoperative visit and extending HbA1c testing to all patients regardless of DM status also provides an opportunity to identify individuals living with undiagnosed DM.1
Even though there was no difference in the mean preoperative blood glucose level based on receipt or specificity of preoperative DM instructions, a second takeaway from this study is the importance of ensuring patients receive clear instructions on their DM medication schedule in the perioperative period. A practical first step may be updating the templates used by the primary surgery teams and providing education to the clinicians in the clinic on how to personalize the visits. Because the current preoperative DM process at VHI is managed by the primary surgical team in a clinic visit, there is an opportunity to shift this responsibility to other health care professionals, such as pharmacists—a change shown to reduce unintended omission of home medications following surgery during hospitalization and reduce costs.23,24
Limitations
This study relied on data included in the patient chart. These data include medication interventions made immediately prior to surgery, which can sometimes be inaccurately charted or difficult to find as they are not documented in the typical medication administration record. Also, the safety outcomes were collected from a discharge summary written by different clinicians, which may lead to information bias. Special attention was taken to ensure these data points were collected as accurately as possible, but it is possible some data may be inaccurate from unintentional human error. Additionally, the safety outcome was limited to a 30-day follow-up, but encompassed the entire length of postoperative stay for all included patients. Finally, given this study was retrospective with no comparison group and the intent was to improve processes at VHI, only hypotheses and potential interventions can be generated from this study. Future prospective studies with larger sample sizes and comparator groups are needed to draw further conclusions.
Conclusions
This study found that the current presurgery process at VHI appears to be successful in preventing surgical delays or cancellations due to hyperglycemia or hypoglycemia. Optimizing DM management can improve surgical outcomes by decreasing rates of postoperative complications, and this study added additional evidence in support of that in a unique population: veterans. Insight on the awareness of preoperative blood glucose management should be gleaned from this study, and based on this sample and site, the preadmission screening process and instructions provided to patients can serve as 2 starting points for optimizing elective surgery.
- Centers for Disease Control and Prevention. Diabetes basics. May 15, 2024. Accessed September 24, 2025. https://www.cdc.gov/diabetes/about/index.html
- Liu Y, Sayam S, Shao X, et al. Prevalence of and trends in diabetes among veterans, United States, 2005-2014. Prev Chronic Dis. 2017;14:E135. doi:10.5888/pcd14.170230
- Farmaki P, Damaskos C, Garmpis N, et al . Complications of the Type 2 Diabetes Mellitus. Curr Cardiol Rev. 2020;16(4):249-251. doi:10.2174/1573403X1604201229115531
- Frisch A, Chandra P, Smiley D, et al. Prevalence and clinical outcome of hyperglycemia in the perioperative period in noncardiac surgery. Diabetes Care. 2010;33:1783-1788. doi:10.2337/dc10-0304
- Noordzij PG, Boersma E, Schreiner F, et al. Increased preoperative glucose levels are associated with perioperative mortality in patients undergoing noncardiac, nonvascular surgery. Eur J Endocrinol. 2007;156:137 -142. doi:10.1530/eje.1.02321
- Pomposelli JJ, Baxter JK 3rd, Babineau TJ, et al. Early postoperative glucose control predicts nosocomial infection rate in diabetic patients. JPEN J Parenter Enteral Nutr. 1998;22:77-81. doi:10.1177/01486071980220027
- Umpierrez GE, Smiley D, Jacobs S, et al. Randomized study of basal-bolus insulin therapy in the inpatient management of patients with type 2 diabetes undergoing general surgery (RABBIT 2 surgery). Diabetes Care. 2011;34:256-261. doi:10.2337/dc10-1407
- Pasquel FJ, Gomez-Huelgas R, Anzola I, et al. Predictive value of admission hemoglobin A1c on inpatient glycemic control and response to insulin therapy in medicine and surgery patients with type 2 diabetes. Diabetes Care. 2015;38:e202-e203. doi:10.2337/dc15-1835
- Alexiewicz JM, Kumar D, Smogorzewski M, et al. Polymorphonuclear leukocytes in non-insulin-dependent diabetes mellitus: abnormalities in metabolism and function. Ann Intern Med. 1995;123:919-924. doi:10.7326/0003-4819-123-12-199512150-00004
- American Diabetes Association Professional Practice Committee. 16. Diabetes care in the hospital: Standards of Medical Care in Diabetes—2025. Diabetes Care. 2025;48(1 suppl 1):S321-S334. doi:10.2337/dc25-S016
- Kumar R, Gandhi R. Reasons for cancellation of operation on the day of intended surgery in a multidisciplinary 500 bedded hospital. J Anaesthesiol Clin Pharmacol. 2012;28:66-69. doi:10.4103/0970-9185.92442
- American Diabetes Association. 14. Diabetes care in the hospital: Standards of Medical Care in Diabetes— 2018. Diabetes Care. 2018;41(1 suppl 1):S144- S151. doi:10.2337/dc18-S014
- American Diabetes Association. 15. Diabetes care in the hospital: Standards of Medical Care in Diabetes— 2019. Diabetes Care. 2019;42(suppl 1):S173- S181. doi:10.2337/dc19-S015
- American Diabetes Association. 15. Diabetes care in the hospital: Standards of Medical Care in Diabetes— 2020. Diabetes Care. 2020;43(suppl 1):S193- S202. doi:10.2337/dc20-S015
- American Diabetes Association. 15. Diabetes care in the hospital: Standards of Medical Care in Diabetes— 2021. Diabetes Care. 2021;44(suppl 1):S211- S220. doi:10.2337/dc21-S015
- American Diabetes Association Professional Practice Committee. 16. Diabetes care in the hospital: Standards of Medical Care in Diabetes—2022. Diabetes Care. 2022;45(suppl 1):S244-S253. doi:10.2337/dc22-S016
- ElSayed NA, Aleppo G, Aroda VR, et al. 16. Diabetes care in the hospital: Standards of Care in Diabetes—2023. Diabetes Care. 2023;46(suppl 1):S267-S278. doi:10.2337/dc23-S016
- American Diabetes Association Professional Practice Committee. 16. Diabetes care in the hospital: Standards of Care in Diabetes—2024. Diabetes Care. 2024;47(suppl 1):S295-S306. doi:10.2337/dc24-S016
- Kidney Disease: Improving Global Outcomes (KDIGO) Acute Kidney Injury Work Group. KDIGO Clinical Practice Guideline for Acute Kidney Injury. Kidney Int Suppl. 2012;2:1-138. Accessed September 24, 2025. https:// www.kisupplements.org/issue/S2157-1716(12)X7200-9
- US Department of Veterans Affairs. VA Indiana Healthcare: about us. Accessed September 24, 2025. https:// www.va.gov/indiana-health-care/about-us/
- Koh WX, Phelan R, Hopman WM, et al. Cancellation of elective surgery: rates, reasons and effect on patient satisfaction. Can J Surg. 2021;64:E155-E161. doi:10.1503/cjs.008119
- Pai S-L, Haehn DA, Pitruzzello NE, et al. Reducing infection rates with enhanced preoperative diabetes mellitus diagnosis and optimization processes. South Med J. 2023;116:215-219. doi:10.14423/SMJ.0000000000001507
- Forrester TG, Sullivan S, Snoswell CL, et al. Integrating a pharmacist into the perioperative setting. Aust Health Rev. 2020;44:563-568. doi:10.1071/AH19126
- Hale AR, Coombes ID, Stokes J, et al. Perioperative medication management: expanding the role of the preadmission clinic pharmacist in a single centre, randomised controlled trial of collaborative prescribing. BMJ Open. 2013;3:e003027. doi:10.1136/bmjopen-2013-003027
Preoperative Diabetes Management for Patients Undergoing Elective Surgeries at a Veterans Affairs Medical Center
Preoperative Diabetes Management for Patients Undergoing Elective Surgeries at a Veterans Affairs Medical Center
Efficacy of Subcutaneous Semaglutide Dose Escalation in Reducing Insulin in Patients With Type 2 Diabetes
Efficacy of Subcutaneous Semaglutide Dose Escalation in Reducing Insulin in Patients With Type 2 Diabetes
Type 2 diabetes mellitus (T2DM) is a chronic disease becoming more prevalent each year and is the seventh-leading cause of death in the United States.1 The most common reason for hospitalization for patients with T2DM is uncontrolled glycemic levels.2 Nearly 25% of the US Department of Veterans Affairs (VA) patient population has T2DM.3 T2DM is the leading cause of blindness, end-stage renal disease, and amputation for VA patients.4
According to the 2023 American Diabetes Association (ADA) guidelines, treatment goals of T2DM include eliminating symptoms, preventing or delaying complications, and attaining glycemic goals. A typical hemoglobin A1c (HbA1c) goal range is < 7%, but individual goals can vary up to < 9% due to a multitude of factors, including patient comorbidities and clinical status.5
Initial treatment recommendations are nonpharmacologic and include comprehensive lifestyle interventions such as optimizing nutrition, physical activity, and behavioral therapy. When pharmacologic therapy is required, metformin is the preferred first-line treatment for the majority of newly diagnosed patients with T2DM and should be added to continued lifestyle management.5 If HbA1c levels remains above goal, the 2023 ADA guidelines recommend adding a second medication, including but not limited to insulin, a glucagonlike peptide-1 receptor agonist (GLP-1RA), or a sodium-glucose cotransporter 2 inhibitor. Medication choice is largely based on the patient’s concomitant conditions (eg, atherosclerotic cardiovascular disease, heart failure, or chronic kidney disease). The 2023 ADA guidelines suggest initiating insulin therapy when a patient's blood glucose ≥ 300 mg/dL, HbA1c > 10%, or if the patient has symptoms of hyperglycemia, even at initial diagnosis. Initiating medications to minimize or avoid hypoglycemia is a priority, especially in high-risk individuals.5
Clinical evidence shows that GLP-1RAs may provide similar glycemic control to insulin with lower risk of hypoglycemia.6 Other reported benefits of GLP-1RAs include weight loss, blood pressure reduction, and improved lipid levels. The most common adverse events (AEs) with GLP-1RAs are gastrointestinal. Including GLP-1RAs in T2DM pharmacotherapy may lower the risk of hypoglycemia, especially in patients at high risk of hypoglycemia.
The 2023 ADA guidelines indicate that it is appropriate to initiate GLP-]1RAs in patients on insulin.5 However, while GLP-1RAs do not increase the risk of hypoglycemia independently, combination treatment with GLP-1RAs and insulin can still result in hypoglycemia.6 Insulin is the key suspect of this hypoglycemic risk.7 Thus, if insulin dosage can be reduced or discontinued, this might reduce the risk of hypoglycemia.
The literature is limited on how the addition of a GLP-1RA to insulin treatment will affect the patient's daily insulin doses, particularly for the veteran population. The goal of this study is to examine this gap in current research by examining semaglutide, which is the current formulary preferred GLP-1RA at the VA.
Semaglutide is subcutaneously initiated at a dose of 0.25 mg once weekly for 4 weeks to reduce gastrointestinal symptoms, then increased to 0.5 mg weekly. Additional increases to a maintenance dose of 1 mg or 2 mg weekly can occur to achieve glycemic goals. The SUSTAIN-FORTE randomized controlled trial sought to determine whether there was a difference in HbA1c level reduction and significant weight loss with the 2-mg vs 1-mg dose.8 Patients in the trial were taking metformin but needed additional medication to control their HbA1c. They were not using insulin and may or may not have been taking sulfonylureas prior to semaglutide initiation. Semaglutide 2 mg was found to significantly improve HbA1c control and promote weight loss compared with semaglutide 1 mg, while maintaining a similar safety profile.
Because this study involved patients who required additional HbA1c control, although semaglutide reduced HbA1c, not all patients were able to reduce their other diabetes medications, which depended on the baseline HbA1c level and the level upon completion of semaglutide titration. Dose reductions for the patients’ other T2DM medications were not reported at trial end. SUSTAIN-FORTE established titration up to semaglutide 2 mg as effective for HbA1c reduction, although it did not study patients also on insulin.8
Insulin is associated with hypoglycemic risk, weight gain, and other AEs.7,8 This study analyzed whether increasing semaglutide could reduce insulin doses and therefore reduce risk of AEs in patients with T2DM.
Methods
A retrospective, single-center, chart review was conducted at VA Sioux Falls Health Care System (VASFHCS). Data were collected through manual review of VASFHCS electronic medical records. Patients aged ≥ 18 years with active prescriptions for at least once-daily insulin who were initiated on 2-mg weekly dose of semaglutide at the VASFHCS clinical pharmacy practitioner medication management clinic between January 1, 2021, and September 1, 2023, were included. VASFHCS clinical pharmacy practitioners have a scope of practice that allows them to initiate, modify, or discontinue medication therapy within medication management clinics.
The most frequently used prandial insulin at VASFHCS is insulin aspart, and the most frequently used basal insulin is insulin glargine. Patients were retrospectively monitored as they progressed from baseline (the point in time where semaglutide 0.5 mg was initiated) to ≥ 3 months on semaglutide 2-mg therapy. Patients were excluded if they previously used a GLP-1RA or if they were on sliding scale insulin without an exact daily dosage.
The primary endpoint was the percent change in total daily insulin dose from baseline to each dose increase after receiving semaglutide 2 mg for ≥ 3 months. Secondary endpoints included changes in daily prandial insulin dose, daily basal insulin dose, HbA1c, and number of hypoglycemic events reported. Data collected included age, race, weight, body mass index, total daily prandial insulin dose, total daily basal insulin dose, HbA1c, and hypoglycemic events reported at the visit when semaglutide was initiated.
Statistical Analysis
The sample size was calculated prior to data collection, and it was determined that for α = .05, 47 patients were needed to achieve 95% power. The primary endpoint was assessed using a paired t test, as were each secondary endpoint. Results with P < .05 were considered statistically significant.
Results
Sixty-two patients were included. The mean HbA1c level at baseline was 7.7%, the baseline mean prandial and insulin daily doses were 41.5 units and 85.1 units, respectively (Table 1) From baseline to initiation of a semaglutide 1-mg dose, the daily insulin dose changed –5.6% (95% CI, 2.2-14.0; P = .008). From baseline to 2-mg dose initiation daily insulin changed -22.2% (95% CI, 22.0-35.1; P < .001) and for patients receiving semaglutide 2 mg for ≥ 3 months it changed -36.9% (95% CI, 37.4-56.5; P < .001) (Figure).
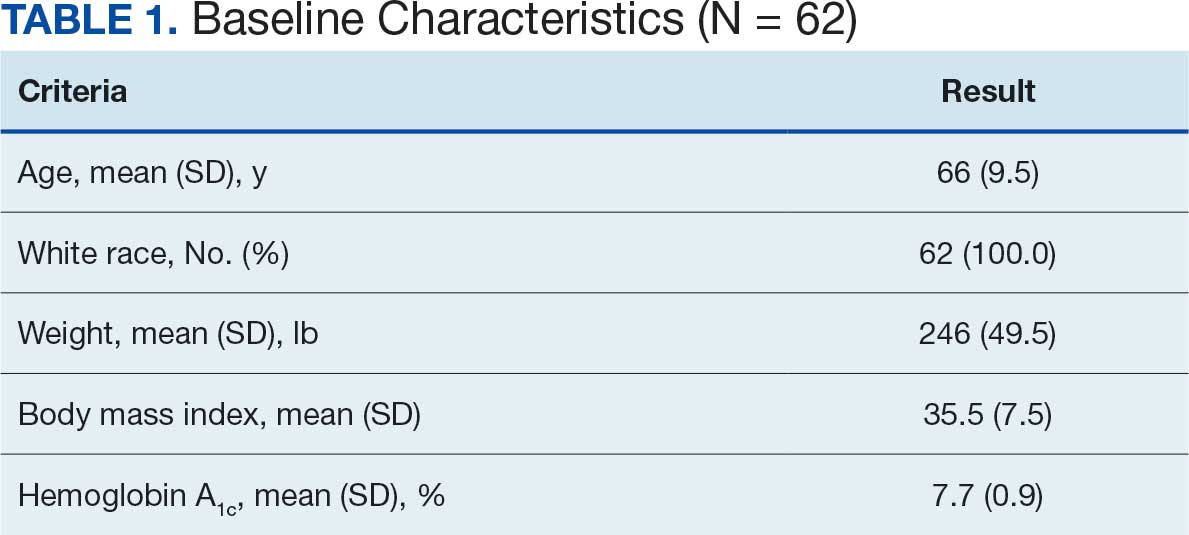
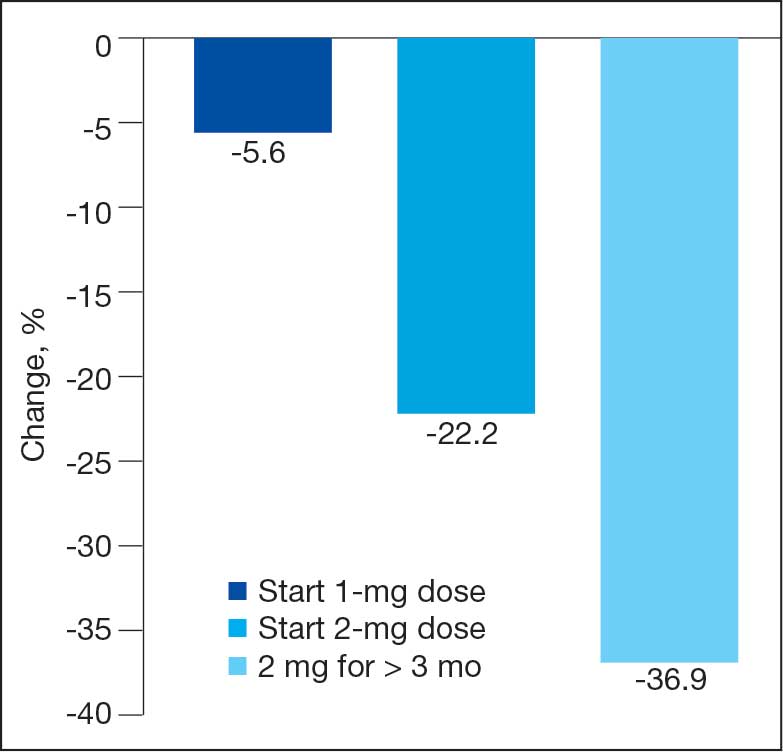
After receiving the 2-mg dose for ≥ 3 months, the mean daily dose of prandial insulin decreased from 41.5 units to 24.6 units (95% CI, 12.6-21.2; P < .001); mean daily dose of basal insulin decreased from 85.1 units to 52.1 units (95% CI, 23.9-42.0; P < .001); and mean HbA1c level decreased from 7.7% to 7.1% (95% CI, 0.3-0.8; P < .001). Mean number of hypoglycemic events reported was not statistically significant, changing from 3.6 to 3.2 (95% CI, –0.6 to 0.1; P = .21) (Table 2).
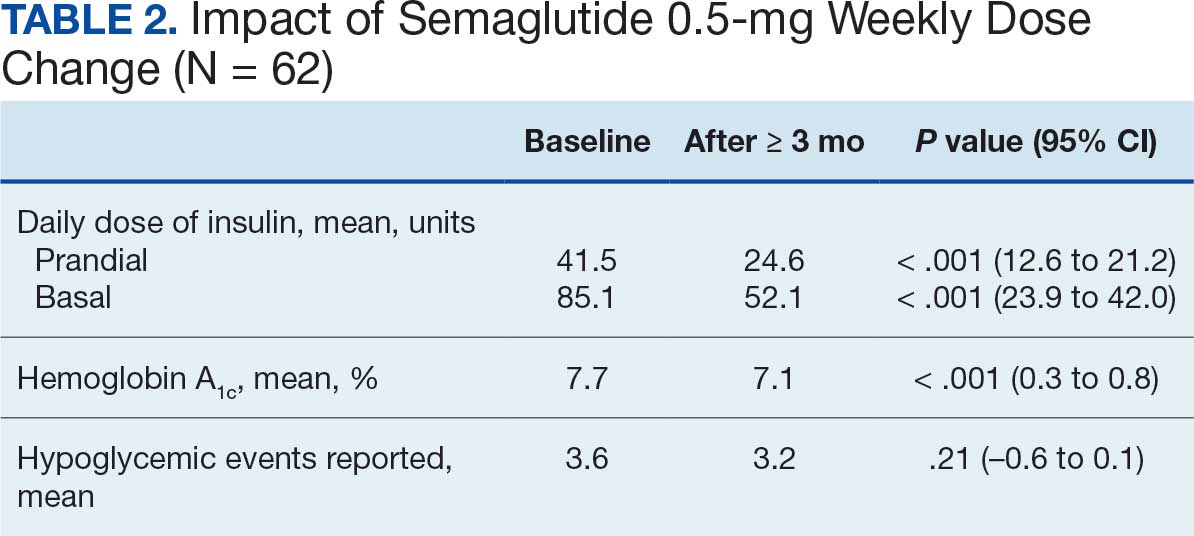
Discussion
This study investigated the effect of subcutaneous semaglutide dose escalation on total daily insulin dose for patients with T2DM. There was a statistically significant decrease in total daily insulin dose from baseline to 1 mg initiation; this decrease continued with further insulin dose reduction seen at the 2-mg dose initiation and additional insulin dose reduction at ≥ 3 months at this dose. It was hypothesized there would be a significant total daily insulin dose reduction at some point, especially when transitioning from the semaglutide 1-mg to the 2-mg dose, based on previous research. 9,10 The additional reduction in daily insulin dose when continuing on semaglutide 2 mg for ≥ 3 months was an unanticipated but added benefit, showing that if tolerated, maintaining the 2-mg dose will help patients reduce their insulin doses.
In terms of secondary endpoints, there was a statistically significant decrease in mean total daily dose individually for prandial and basal insulin from baseline to ≥ 3 months after semaglutide 2 mg initiation. The change in HbA1c level was also statistically significant and decreased from baseline, even as insulin doses were reduced. This change in HbA1c level was expected; previous literature has shown a significant link between improving HbA1c control when semaglutide doses are increased to 2 mg weekly.10 Due to having been shown in previous trials, it was expected that HbA1c levels would decrease even when the insulin doses were being reduced.10 Insulin dose reduction can potentially be added to the growing evidence of semaglutide benefits. The change in the number of hypoglycemic events was not statistically significant, which was unexpected since previous research show a trend in patients taking GLP-1RAs having fewer hypoglycemic events than those taking insulin.6 Further investigation with a larger sample size and prospective trial could determine whether this result is an outlier. In this study, there was no increase in HbA1c or hypoglycemic events reported with increasing semaglutide doses, which provides further evidence of the safety of semaglutide even at higher doses.
These data suggest that for a patient with T2DM who is already taking insulin, the recommended titration of semaglutide is to start with 0.5 mg and titrate up to a 2-mg subcutaneous weekly dose and to then continue at that dose. As long as the 2-mg dose is tolerated, it will provide patients with the most HbA1c control and lead to a reduction of their total daily insulin doses according to these results.
Strengths and Limitations
This study compared patient data at different points. This method did not require a second distinct control group, which would potentially introduce confounding factors, such as different baseline characteristics. Another strength is that documentation was available for all patients throughout the study so no one was lost to follow-up. This allowed comprehensive data collection and provided a stronger conclusion given the completeness of the data from baseline to follow-up.
Limitations include the retrospective design and small sample size. In addition, the study design did not allow for randomization. There is no documentation of adherence to medication regimen, which was difficult to determine due to the retrospective nature. Other changes to the patients’ medication regimen were not collected in aggregate and thus, it is possible the total daily insulin dose was impacted by other medication changes. There is also potential for inconsistent documentation of the patients’ true total daily insulin dose in the medical record, thus leading to inaccuracy of recorded data.
Conclusions
A small sample of veterans with T2DM had statistically significant reductions in total daily insulin dose when subcutaneous semaglutide was initiated, as well as after each dose increase. There was also a statistically significant reduction in HbA1c levels from baseline even as patient insulin doses were reduced. These results support the current practice of using semaglutide to treat T2DM, suggesting it may be safe and effective at reducing HbA1c levels as the dose is titrated up to 2 mg. There was no statistically significant change in the number of hypoglycemic events reported as semaglutide was titrated up. Thus, when semaglutide is increased to the maximum recommended dose of 2 mg for T2DM, patients may experience a reduction of their total daily dose of insulin and HbA1c levels. These benefits may reduce the risk of insulin-related AEs while maintaining appropriate glycemic control.
- Diabetes mellitus: in federal health care data trends 2017. Fed Pract. 2017:S20. Accessed August 6, 2025. https://www.fedprac-digital.com/federalpractitioner/data_trends_2017
- Centers for Disease Control and Prevention. National diabetes statistics report. May 15, 2024. Accessed September 17, 2025. https://www.cdc.gov/diabetes/php/data-research/index.html
- US Department of Veterans Affairs. VA research on diabetes. Updated January 15, 2021. Accessed August 6, 2025. https://www.research.va.gov/topics/diabetes.cfm
- Liu Y, Sayam S, Shao X, et al. Prevalence of and trends in diabetes among veterans, United States, 2005-2014. Prev Chronic Dis. 2017;14:E135. doi:10.5888/pcd14.170230
- American Diabetes Association. Standards of care in diabetes— 2023 abridged for primary care providers. Clin Diabetes. 2022;41:4-31. doi:10.2337/cd23-as01
- Zhao Z, Tang Y, Hu Y, Zhu H, Chen X, Zhao B. Hypoglycemia following the use of glucagon-like peptide-1 receptor agonists: a real-world analysis of post-marketing surveillance data. Ann Transl Med. 2021;9:1482. doi:10.21037/atm-21-4162
- Workgroup on Hypoglycemia, American Diabetes Association. Defining and reporting hypoglycemia in diabetes: a report from the American Diabetes Association Workgroup on Hypoglycemia. Diabetes Care. 2005;28:1245-1249. doi:10.2337/diacare.28.5.1245
- Frías JP, Auerbach P, Bajaj HS, et al. Efficacy and safety of once-weekly semaglutide 2.0 mg versus 1.0 mg in patients with type 2 diabetes (SUSTAIN FORTE): a double-blind, randomised, phase 3B trial. Lancet Diabetes Endocrinol. 2021;9:563-574. doi:10.1016/S2213-8587(21)00174-1
- Garber AJ, Handelsman Y, Grunberger G, et al. Consensus statement by the American Association of Clinical Endocrinologists and American College of Endocrinology on the comprehensive type 2 diabetes management algorithm - 2020 executive summary. Endocr Pract. 2020;26:107-139. doi:10.4158/CS-2019-0472
- Miles KE, Kerr JL. Semaglutide for the treatment of type 2 diabetes mellitus. J Pharm Technol. 2018;34:281-289. doi:10.1177/8755122518790925
Type 2 diabetes mellitus (T2DM) is a chronic disease becoming more prevalent each year and is the seventh-leading cause of death in the United States.1 The most common reason for hospitalization for patients with T2DM is uncontrolled glycemic levels.2 Nearly 25% of the US Department of Veterans Affairs (VA) patient population has T2DM.3 T2DM is the leading cause of blindness, end-stage renal disease, and amputation for VA patients.4
According to the 2023 American Diabetes Association (ADA) guidelines, treatment goals of T2DM include eliminating symptoms, preventing or delaying complications, and attaining glycemic goals. A typical hemoglobin A1c (HbA1c) goal range is < 7%, but individual goals can vary up to < 9% due to a multitude of factors, including patient comorbidities and clinical status.5
Initial treatment recommendations are nonpharmacologic and include comprehensive lifestyle interventions such as optimizing nutrition, physical activity, and behavioral therapy. When pharmacologic therapy is required, metformin is the preferred first-line treatment for the majority of newly diagnosed patients with T2DM and should be added to continued lifestyle management.5 If HbA1c levels remains above goal, the 2023 ADA guidelines recommend adding a second medication, including but not limited to insulin, a glucagonlike peptide-1 receptor agonist (GLP-1RA), or a sodium-glucose cotransporter 2 inhibitor. Medication choice is largely based on the patient’s concomitant conditions (eg, atherosclerotic cardiovascular disease, heart failure, or chronic kidney disease). The 2023 ADA guidelines suggest initiating insulin therapy when a patient's blood glucose ≥ 300 mg/dL, HbA1c > 10%, or if the patient has symptoms of hyperglycemia, even at initial diagnosis. Initiating medications to minimize or avoid hypoglycemia is a priority, especially in high-risk individuals.5
Clinical evidence shows that GLP-1RAs may provide similar glycemic control to insulin with lower risk of hypoglycemia.6 Other reported benefits of GLP-1RAs include weight loss, blood pressure reduction, and improved lipid levels. The most common adverse events (AEs) with GLP-1RAs are gastrointestinal. Including GLP-1RAs in T2DM pharmacotherapy may lower the risk of hypoglycemia, especially in patients at high risk of hypoglycemia.
The 2023 ADA guidelines indicate that it is appropriate to initiate GLP-]1RAs in patients on insulin.5 However, while GLP-1RAs do not increase the risk of hypoglycemia independently, combination treatment with GLP-1RAs and insulin can still result in hypoglycemia.6 Insulin is the key suspect of this hypoglycemic risk.7 Thus, if insulin dosage can be reduced or discontinued, this might reduce the risk of hypoglycemia.
The literature is limited on how the addition of a GLP-1RA to insulin treatment will affect the patient's daily insulin doses, particularly for the veteran population. The goal of this study is to examine this gap in current research by examining semaglutide, which is the current formulary preferred GLP-1RA at the VA.
Semaglutide is subcutaneously initiated at a dose of 0.25 mg once weekly for 4 weeks to reduce gastrointestinal symptoms, then increased to 0.5 mg weekly. Additional increases to a maintenance dose of 1 mg or 2 mg weekly can occur to achieve glycemic goals. The SUSTAIN-FORTE randomized controlled trial sought to determine whether there was a difference in HbA1c level reduction and significant weight loss with the 2-mg vs 1-mg dose.8 Patients in the trial were taking metformin but needed additional medication to control their HbA1c. They were not using insulin and may or may not have been taking sulfonylureas prior to semaglutide initiation. Semaglutide 2 mg was found to significantly improve HbA1c control and promote weight loss compared with semaglutide 1 mg, while maintaining a similar safety profile.
Because this study involved patients who required additional HbA1c control, although semaglutide reduced HbA1c, not all patients were able to reduce their other diabetes medications, which depended on the baseline HbA1c level and the level upon completion of semaglutide titration. Dose reductions for the patients’ other T2DM medications were not reported at trial end. SUSTAIN-FORTE established titration up to semaglutide 2 mg as effective for HbA1c reduction, although it did not study patients also on insulin.8
Insulin is associated with hypoglycemic risk, weight gain, and other AEs.7,8 This study analyzed whether increasing semaglutide could reduce insulin doses and therefore reduce risk of AEs in patients with T2DM.
Methods
A retrospective, single-center, chart review was conducted at VA Sioux Falls Health Care System (VASFHCS). Data were collected through manual review of VASFHCS electronic medical records. Patients aged ≥ 18 years with active prescriptions for at least once-daily insulin who were initiated on 2-mg weekly dose of semaglutide at the VASFHCS clinical pharmacy practitioner medication management clinic between January 1, 2021, and September 1, 2023, were included. VASFHCS clinical pharmacy practitioners have a scope of practice that allows them to initiate, modify, or discontinue medication therapy within medication management clinics.
The most frequently used prandial insulin at VASFHCS is insulin aspart, and the most frequently used basal insulin is insulin glargine. Patients were retrospectively monitored as they progressed from baseline (the point in time where semaglutide 0.5 mg was initiated) to ≥ 3 months on semaglutide 2-mg therapy. Patients were excluded if they previously used a GLP-1RA or if they were on sliding scale insulin without an exact daily dosage.
The primary endpoint was the percent change in total daily insulin dose from baseline to each dose increase after receiving semaglutide 2 mg for ≥ 3 months. Secondary endpoints included changes in daily prandial insulin dose, daily basal insulin dose, HbA1c, and number of hypoglycemic events reported. Data collected included age, race, weight, body mass index, total daily prandial insulin dose, total daily basal insulin dose, HbA1c, and hypoglycemic events reported at the visit when semaglutide was initiated.
Statistical Analysis
The sample size was calculated prior to data collection, and it was determined that for α = .05, 47 patients were needed to achieve 95% power. The primary endpoint was assessed using a paired t test, as were each secondary endpoint. Results with P < .05 were considered statistically significant.
Results
Sixty-two patients were included. The mean HbA1c level at baseline was 7.7%, the baseline mean prandial and insulin daily doses were 41.5 units and 85.1 units, respectively (Table 1) From baseline to initiation of a semaglutide 1-mg dose, the daily insulin dose changed –5.6% (95% CI, 2.2-14.0; P = .008). From baseline to 2-mg dose initiation daily insulin changed -22.2% (95% CI, 22.0-35.1; P < .001) and for patients receiving semaglutide 2 mg for ≥ 3 months it changed -36.9% (95% CI, 37.4-56.5; P < .001) (Figure).
After receiving the 2-mg dose for ≥ 3 months, the mean daily dose of prandial insulin decreased from 41.5 units to 24.6 units (95% CI, 12.6-21.2; P < .001); mean daily dose of basal insulin decreased from 85.1 units to 52.1 units (95% CI, 23.9-42.0; P < .001); and mean HbA1c level decreased from 7.7% to 7.1% (95% CI, 0.3-0.8; P < .001). Mean number of hypoglycemic events reported was not statistically significant, changing from 3.6 to 3.2 (95% CI, –0.6 to 0.1; P = .21) (Table 2).
Discussion
This study investigated the effect of subcutaneous semaglutide dose escalation on total daily insulin dose for patients with T2DM. There was a statistically significant decrease in total daily insulin dose from baseline to 1 mg initiation; this decrease continued with further insulin dose reduction seen at the 2-mg dose initiation and additional insulin dose reduction at ≥ 3 months at this dose. It was hypothesized there would be a significant total daily insulin dose reduction at some point, especially when transitioning from the semaglutide 1-mg to the 2-mg dose, based on previous research. 9,10 The additional reduction in daily insulin dose when continuing on semaglutide 2 mg for ≥ 3 months was an unanticipated but added benefit, showing that if tolerated, maintaining the 2-mg dose will help patients reduce their insulin doses.
In terms of secondary endpoints, there was a statistically significant decrease in mean total daily dose individually for prandial and basal insulin from baseline to ≥ 3 months after semaglutide 2 mg initiation. The change in HbA1c level was also statistically significant and decreased from baseline, even as insulin doses were reduced. This change in HbA1c level was expected; previous literature has shown a significant link between improving HbA1c control when semaglutide doses are increased to 2 mg weekly.10 Due to having been shown in previous trials, it was expected that HbA1c levels would decrease even when the insulin doses were being reduced.10 Insulin dose reduction can potentially be added to the growing evidence of semaglutide benefits. The change in the number of hypoglycemic events was not statistically significant, which was unexpected since previous research show a trend in patients taking GLP-1RAs having fewer hypoglycemic events than those taking insulin.6 Further investigation with a larger sample size and prospective trial could determine whether this result is an outlier. In this study, there was no increase in HbA1c or hypoglycemic events reported with increasing semaglutide doses, which provides further evidence of the safety of semaglutide even at higher doses.
These data suggest that for a patient with T2DM who is already taking insulin, the recommended titration of semaglutide is to start with 0.5 mg and titrate up to a 2-mg subcutaneous weekly dose and to then continue at that dose. As long as the 2-mg dose is tolerated, it will provide patients with the most HbA1c control and lead to a reduction of their total daily insulin doses according to these results.
Strengths and Limitations
This study compared patient data at different points. This method did not require a second distinct control group, which would potentially introduce confounding factors, such as different baseline characteristics. Another strength is that documentation was available for all patients throughout the study so no one was lost to follow-up. This allowed comprehensive data collection and provided a stronger conclusion given the completeness of the data from baseline to follow-up.
Limitations include the retrospective design and small sample size. In addition, the study design did not allow for randomization. There is no documentation of adherence to medication regimen, which was difficult to determine due to the retrospective nature. Other changes to the patients’ medication regimen were not collected in aggregate and thus, it is possible the total daily insulin dose was impacted by other medication changes. There is also potential for inconsistent documentation of the patients’ true total daily insulin dose in the medical record, thus leading to inaccuracy of recorded data.
Conclusions
A small sample of veterans with T2DM had statistically significant reductions in total daily insulin dose when subcutaneous semaglutide was initiated, as well as after each dose increase. There was also a statistically significant reduction in HbA1c levels from baseline even as patient insulin doses were reduced. These results support the current practice of using semaglutide to treat T2DM, suggesting it may be safe and effective at reducing HbA1c levels as the dose is titrated up to 2 mg. There was no statistically significant change in the number of hypoglycemic events reported as semaglutide was titrated up. Thus, when semaglutide is increased to the maximum recommended dose of 2 mg for T2DM, patients may experience a reduction of their total daily dose of insulin and HbA1c levels. These benefits may reduce the risk of insulin-related AEs while maintaining appropriate glycemic control.
- Diabetes mellitus: in federal health care data trends 2017. Fed Pract. 2017:S20. Accessed August 6, 2025. https://www.fedprac-digital.com/federalpractitioner/data_trends_2017
- Centers for Disease Control and Prevention. National diabetes statistics report. May 15, 2024. Accessed September 17, 2025. https://www.cdc.gov/diabetes/php/data-research/index.html
- US Department of Veterans Affairs. VA research on diabetes. Updated January 15, 2021. Accessed August 6, 2025. https://www.research.va.gov/topics/diabetes.cfm
- Liu Y, Sayam S, Shao X, et al. Prevalence of and trends in diabetes among veterans, United States, 2005-2014. Prev Chronic Dis. 2017;14:E135. doi:10.5888/pcd14.170230
- American Diabetes Association. Standards of care in diabetes— 2023 abridged for primary care providers. Clin Diabetes. 2022;41:4-31. doi:10.2337/cd23-as01
- Zhao Z, Tang Y, Hu Y, Zhu H, Chen X, Zhao B. Hypoglycemia following the use of glucagon-like peptide-1 receptor agonists: a real-world analysis of post-marketing surveillance data. Ann Transl Med. 2021;9:1482. doi:10.21037/atm-21-4162
- Workgroup on Hypoglycemia, American Diabetes Association. Defining and reporting hypoglycemia in diabetes: a report from the American Diabetes Association Workgroup on Hypoglycemia. Diabetes Care. 2005;28:1245-1249. doi:10.2337/diacare.28.5.1245
- Frías JP, Auerbach P, Bajaj HS, et al. Efficacy and safety of once-weekly semaglutide 2.0 mg versus 1.0 mg in patients with type 2 diabetes (SUSTAIN FORTE): a double-blind, randomised, phase 3B trial. Lancet Diabetes Endocrinol. 2021;9:563-574. doi:10.1016/S2213-8587(21)00174-1
- Garber AJ, Handelsman Y, Grunberger G, et al. Consensus statement by the American Association of Clinical Endocrinologists and American College of Endocrinology on the comprehensive type 2 diabetes management algorithm - 2020 executive summary. Endocr Pract. 2020;26:107-139. doi:10.4158/CS-2019-0472
- Miles KE, Kerr JL. Semaglutide for the treatment of type 2 diabetes mellitus. J Pharm Technol. 2018;34:281-289. doi:10.1177/8755122518790925
Efficacy of Subcutaneous Semaglutide Dose Escalation in Reducing Insulin in Patients With Type 2 Diabetes
Efficacy of Subcutaneous Semaglutide Dose Escalation in Reducing Insulin in Patients With Type 2 Diabetes
Impact of Continuous Glucose Monitoring for American Indian/Alaska Native Adults With Type 2 Diabetes Mellitus Not Using Insulin
Impact of Continuous Glucose Monitoring for American Indian/Alaska Native Adults With Type 2 Diabetes Mellitus Not Using Insulin
Diabetes mellitus (DM) is a national health crisis affecting > 38 million people (11.6%) in the United States.1 American Indian and Alaska Native (AI/AN) adults are disproportionately affected, with a prevalence of 14.5%—the highest among all racial and ethnic groups.1 Type 2 DM (T2DM) accounts for 90% to 95% of all DM cases and is a leading cause of morbidity and mortality due to its association with cardiovascular disease, kidney failure, and other complications.2
Maintaining glycemic control is important for managing T2DM and preventing microvascular and macrovascular complications.3 The cornerstone of diabetes self-management has been patient self-monitored blood glucose (SMBG) using finger-stick glucometers.4 However, SMBG provides measurements from a single point in time and requires frequent, painful, and inconvenient finger pricks, leading to decreased adherence.5,6 These limitations negatively affect patient engagement and overall glycemic control.7
Continuous glucose monitors (CGMs) offer real-time, continuous glucose readings and trends.8 CGMs improve glycemic control and reduce hypoglycemic episodes in patients who are insulin-dependent.9,10 Flash glucose monitors, a type of CGM that requires scanning to obtain glucose readings, provide similar benefits.11 Despite these demonstrated advantages, research has primarily focused on insulin-dependent populations, leaving a significant gap in understanding the effect of CGMs on patients with T2DM who are not insulin-dependent.12
Given the high prevalence of T2DM among AI/AN populations and the potential benefits of CGMs, this study sought to evaluate the effect of CGM use on glycemic control and other health metrics in patients with non–insulin-dependent T2DM in an AI/AN population. This focus addresses a critical knowledge gap and may inform clinical practices and policies to improve diabetes management in this high-risk group.
Methods
A retrospective observational study was conducted using deidentified electronic health records (EHRs) from 2019 to 2024 at a federally operated outpatient Indian Health Service (IHS) clinic serving an AI/AN population in the IHS Portland Area (Oregon, Washington, Idaho). The study protocol was reviewed and deemed exempt by institutional review boards at Washington State University and the Portland Area IHS.
Study Population
This study included patients diagnosed with non–insulin-dependent T2DM, had used a CGM for ≥ 1 year, and had hemoglobin A1c (HbA1c) measurements within 4 months prior to CGM initiation (baseline) and within ± 4 months after 1 year of CGM use. For other health metrics, including blood pressure (BP), weight, low-density lipoprotein cholesterol (LDL-C), and estimated glomerular filtration rate (eGFR), this study required measurements within 6 months before CGM initiation and within 6 months after 1 year of CGM use. The baseline HbA1c in the dataset ranged from 5.3% to > 14%.
Patients were excluded if they used insulin during the study period, had incomplete laboratory or clinical data for the required time frame, or had < 1 year of CGM use. The dataset did not include detailed information on oral DM medications; thus, we could not report or account for the type or number of oral hypoglycemic agents used by the patients. The IHS clinical applications coordinator compiled the dataset from the EHR, identifying patients who were prescribed and received a CGM at the clinic. All patients used the Abbott Freestyle Libre CGM, the only formulary CGM available at the clinic during the study period.
A 1-year follow-up endpoint was selected for several reasons: (1) to capture potential seasonal variations in diet and activity; (2) to align with the clinic’s standard practice of annual comprehensive diabetes evaluations; and (3) to allow sufficient time for patients to adapt to CGM use and reflect any meaningful changes in glycemic control.
All patients received standard DM care according to clinic protocols, which included DM self-management education and training. Patients met with the diabetes educator at least once, during which the educator emphasized making informed decisions using CGM data, such as adjusting dietary choices and physical activity levels to manage blood glucose concentrations effectively.
A total of 302 patients were initially identified. After applying exclusion criteria, 132 were excluded due to insulin use, and 77 were excluded due to incomplete HbA1c data within the specified time frames (Figure 1). The final sample included 93 patients.
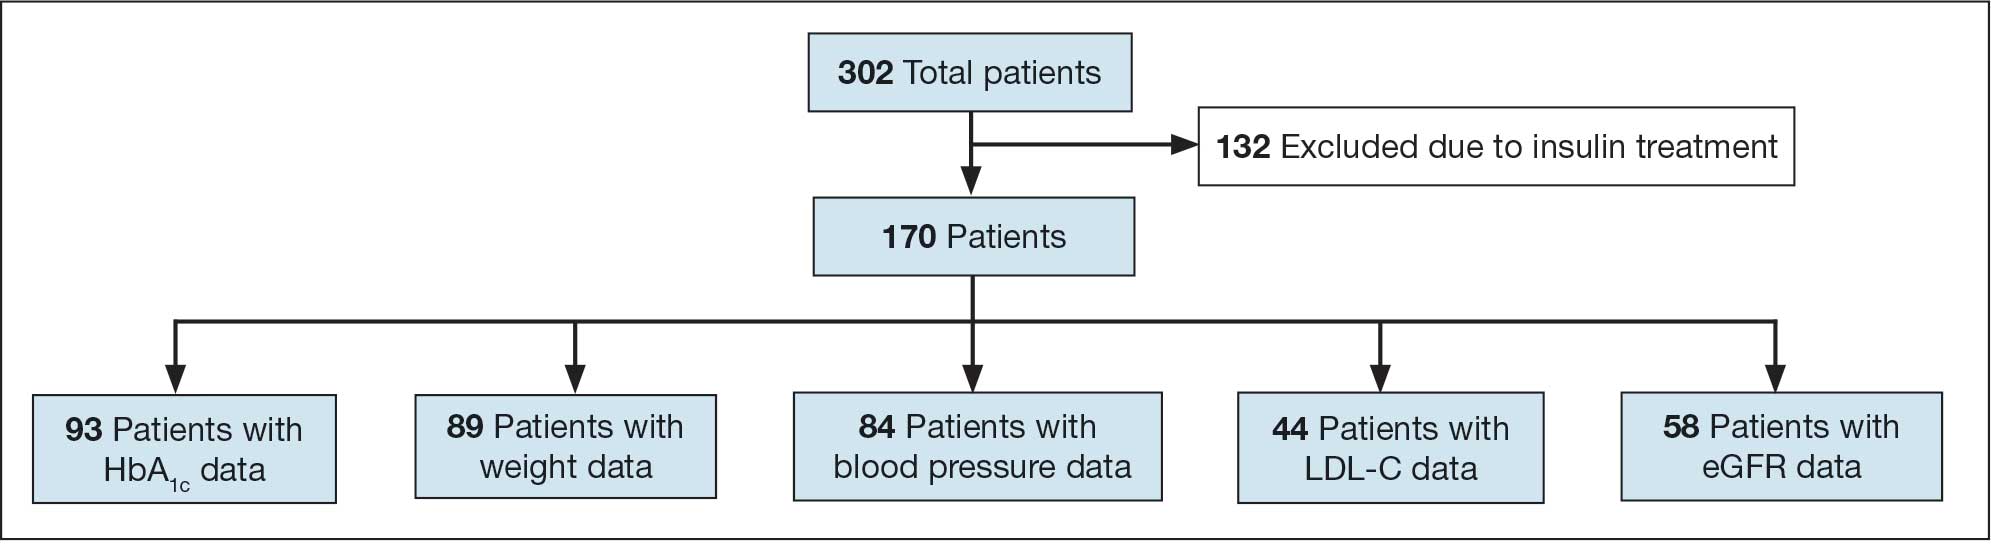
Abbreviations: eGFR, estimated glomerular filtration rate; HbA1c, hemoglobin A1c; LDL-C, low-density lipoprotein cholesterol.
Measures
The primary outcome was the change in HbA1c levels from baseline to 1 year after CGM initiation. Secondary outcomes included changes in weight, systolic and diastolic BP, LDL-C concentrations, and eGFR. For the primary outcome, HbA1c values were collected within a grace period of ± 4 months from the baseline and 1-year time points. The laboratory’s upper reporting limit for HbA1c was 14%; values reported as “> 14%” were recorded as 14.1% for data analysis, although the actual values could have been higher.
For secondary outcomes, data were included if measurements were obtained within ± 6 months of the baseline and 1-year time points. Patients who did not have measurements within these time frames for specific metrics were excluded from secondary outcome analysis but remained in the overall study if they met the criteria for HbA1c and CGM use.
Statistical Analysis
Statistical analysis was performed using R statistical software version 4.4.2. Paired t tests were conducted to compare baseline and 1-year follow- up measurements for variables with parametric distributions. Wilcoxon signed-rank test was used for nonparametric data. A linear regression analysis was conducted to examine the relationship between baseline HbA1c levels and the change in HbA1c after 1 year of CGM use. Differences were considered significant at P < .05 set a priori. To guide future research, a posthoc power analysis was performed using Cohen’s d to estimate the required sample sizes for detecting significant effects, assuming a similar population.
Results
The study included 93 patients, with a mean (SD) age of 55 (13) years (range, 29-83 years). Of the participants, 56 were female (60%) and 37 were male (40%). All participants were identified as AI/AN and had non–insulin-dependent T2DM.
Primary Outcomes
A significant reduction in HbA1c levels was observed after 1 year of CGM use. The mean (SD) baseline HbA1c was 9.5% (2.4%), which decreased to 7.6% (2.2%) at 1-year follow-up (Table 1). This difference represents a mean change of -1.86% (2.4%) (95% CI, -2.35 to -1.37; P < .001 [paired t test, -7.53]).
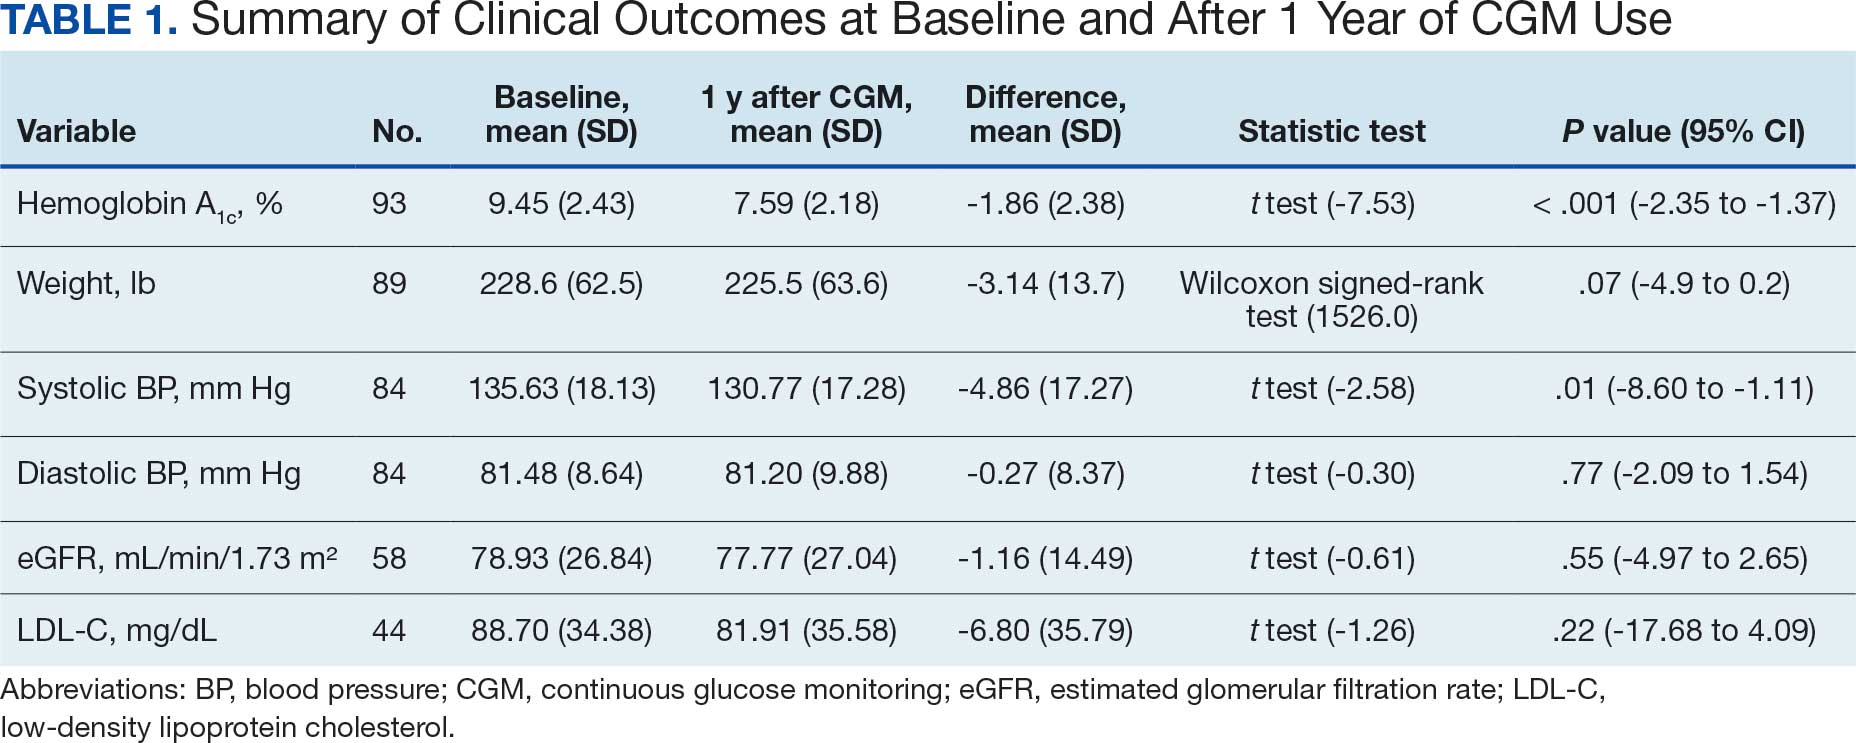
A linear regression model evaluated the relationship between baseline HbA1c (predictor) and the change in HbA1c after 1 year (outcome). The change in HbA1c was calculated as the difference between 1-year follow-up and baseline values. The regression model revealed a significant negative association between baseline HbA1c and the change in HbA1c (Β = -0.576; P < .001), indicating that higher baseline HbA1c values were associated with greater reductions in HbA1c over the year. The regression equation was: Change in HbA1c = 3.587 – 0.576 × Baseline HbA1c
The regression coefficient for baseline HbA1c was -0.576 (standard error, 0.083; t = -6.931; P < .001), indicating that for each 1% increase in baseline HbA1c, the reduction of HbA1c after 1 year increased by approximately 0.576% (Figure 2). The model explained 34.6% of the variance in HbA1c change (R2 = .345; adjusted R2 = .338).
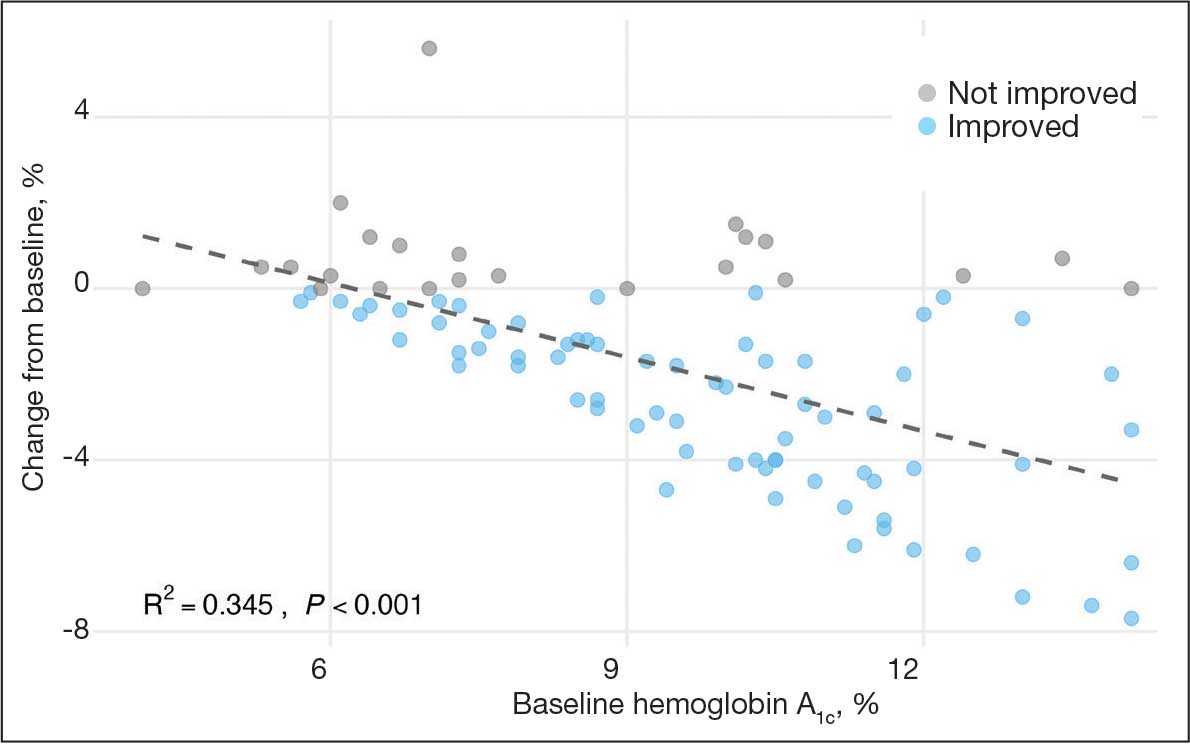
Secondary Outcomes
Systolic BP decreased by a mean (SD) -4.9 (17) mm Hg; 95% CI, -8.6 to -1.11; P = .01, paired t test). However, no significant change was observed for diastolic BP (P = .77, paired t test). Similarly, no significant changes were observed in weight, LDL-C concentrations, or eGFR after 1 year of CGM use. A posthoc power analysis indicated that the study was underpowered to detect smaller effect sizes in secondary outcomes. For example, sample size estimates indicated that detecting significant changes in weight and LDL-C concentrations would require sample sizes of 152 and 220 patients, respectively (Table 2).
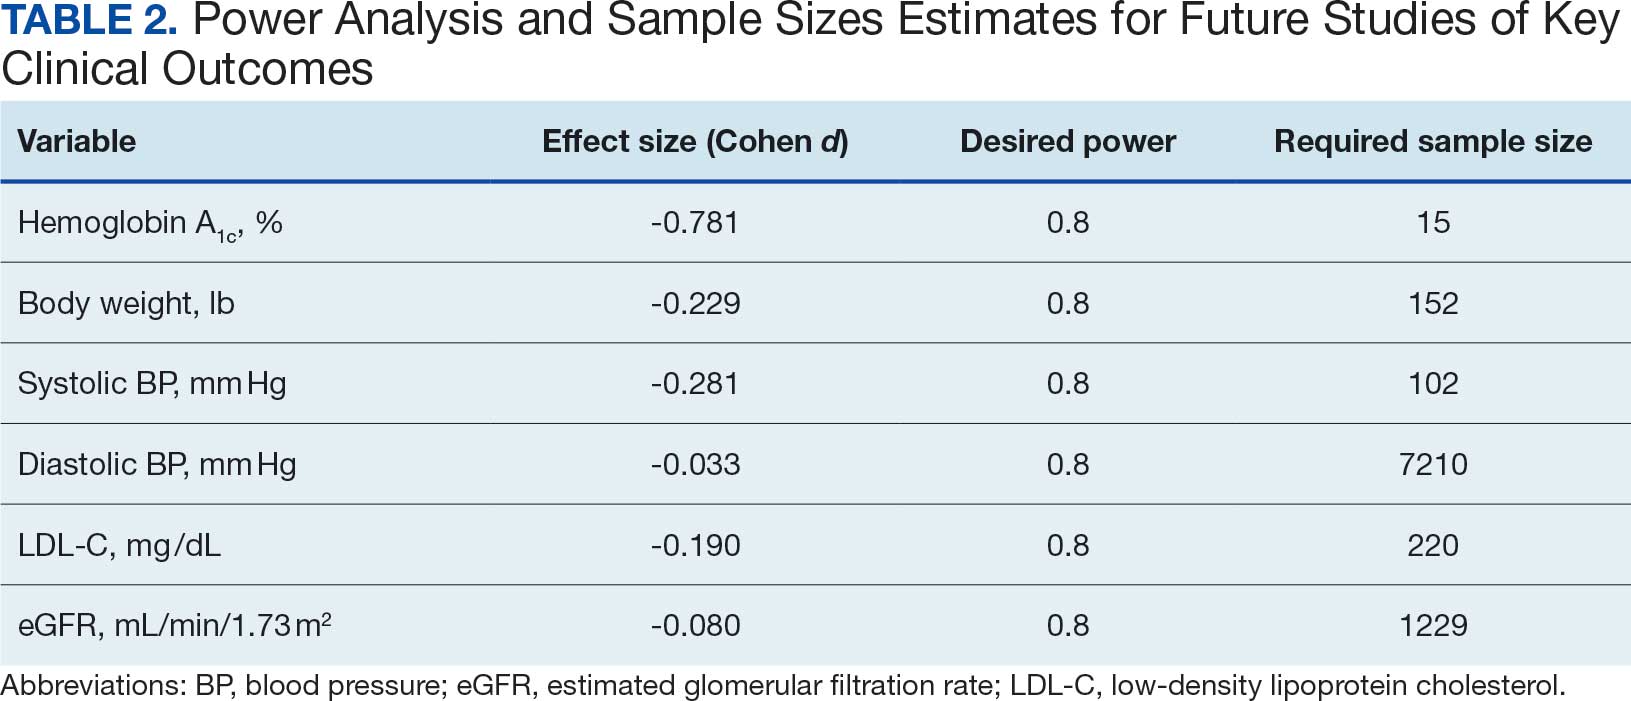
Discussion
This study found a clinically significant reduction in HbA1c levels after 1 year among AI/AN patients with non–insulin-dependent T2DM who used CGMs. The mean HbA1c decreased 1.9%, from 9.5% at baseline to 7.6% after 1 year. This reduction is not only statistically significant (P < .001), it is clinically meaningful—even a 1% decrease in HbA1c is associated with substantial reductions in the risk of microvascular complications.3 The magnitude of the HbA1c reduction observed suggests CGM use may be associated with improved glycemic control in this high-risk population. By achieving lower HbA1c levels, patients may experience improved long-term health outcomes and a reduced burden of DM-related complications.
Changes in oral DM medications during the study period may have contributed to the observed improvements in HbA1c levels. While the dataset lacked detailed information on types or dosages of oral hypoglycemic agents used, adjustments in medication regimens are common in DM management and could significantly affect glycemic control. The inability to account for these changes results in an inability to attribute the improvements in HbA1c solely to CGM use. Future studies should collect comprehensive medication data to better isolate the effects of CGM use from other treatment modifications.
Another factor that may have contributed to the improved glycemic control is the DM self-management education and training patients received as part of standard care. Patients met with diabetes educators at least once and learned how to use the CGM device and interpret the data for self-management decisions. This education may have enhanced patient engagement and empowerment, enabling them to make informed choices about diet, physical activity, and medication adherence. Studies have shown that DM self-management education can significantly improve glycemic control and patient outcomes.13 By combining the CGM technology with targeted education, patients may have been better equipped to manage their condition, contributing to the observed reduction in HbA1c levels. Future studies should consider synergistic effects of CGM use and DM education when evaluating interventions for glycemic control.
The significant reduction in HbA1c indicates CGM use is associated with improved glycemic control in non–insulin-dependent T2DM. The linear regression analysis suggests patients with poorer glycemic control at baseline experienced greater reductions in HbA1c over the course of 1 year. This finding aligns with previous studies that have shown greater HbA1c reductions in patients with higher initial levels when using CGMs. Yaron et al reported similar findings: higher baseline HbA1c levels predicted more substantial improvements with CGM use in patients with T2DM on insulin therapy.14
This study contributes to existing research by examining the association between CGM use and glycemic control in patients with non– insulin-dependent T2DM within an AI/AN population, a group that has been underreported in previous studies. Most prior research has focused on insulin-dependent patients or populations with different ethnic backgrounds.12 By focusing on patients with non–insulin-dependent T2DM, this study highlights the broader applicability of CGMs beyond traditional use, showcasing their potential association with benefits in earlier stages of DM management. Targeting the AI/AN population addresses a critical knowledge gap, given the disproportionately high prevalence of T2DM and associated complications in this group. The findings of this study suggest integrating CGM technology into the standard care of AI/AN patients with non–insulin-dependent T2DM may be associated with improved glycemic control and may help reduce health disparities.
The modest decrease in systolic BP observed in this study may indicate potential cardiovascular benefits associated with CGM use, possibly due to improved glycemic control and increased patient engagement in self-management. However, given the limited sample size and exclusion criteria, the study lacked sufficient power to detect significant associations between CGM use and other secondary outcomes such as BP, weight, LDL-C, and eGFR. Therefore, the significant finding with systolic BP should be interpreted with caution.
The lack of significant changes in secondary outcomes may be attributed to the study’s limited sample size and the relatively short duration for observing changes in these parameters. Larger studies are needed to assess the full impact of CGM on these variables. The required sample sizes for achieving adequate power in future studies were calculated, highlighting the utility of our study as a pilot, providing critical data for the design of larger, adequately powered studies.
Limitations
The retrospective design of this study limits causal inferences. Moreover, potential confounding variables were not controlled, such as changes in medication regimens (other than insulin use), dietary counseling, or physical activity. Additionally, we could not account for the type or number of oral DM medications prescribed to patients. The dataset included only information on insulin use, without detailed records of other antidiabetic medications. This limitation may have influenced the observed change in glycemic control, as variations in medication regimens could affect HbA1c levels.
Because this study lacked a comparator group, the effect of CGM use cannot be definitively isolated from other factors (eg, medication changes, dietary modifications, or physical activity). Moreover, CGM devices can be costly and are not universally covered by all insurance or IHS programs, potentially limiting widespread implementation. Policy-level restrictions and patient-specific barriers may also hinder feasibility in other settings.
The small sample size may limit the generalizability of the findings. Of the initial 302 patients, about 69% were excluded due to insulin use or incomplete laboratory data. A ± 4-month window was selected to balance data quality with real-world practices. Extending this window further (eg, ± 6 months) might have included more participants but risked diluting the 1-year endpoint consistency. The lack of statistical significance in secondary metrics may be due to insufficient power rather than the absence of an effect.
Exclusion of patients due to incomplete data may have introduced selection bias. However, patients were included in the overall analysis if they met the criteria for HbA1c and CGM use, even if they lacked data for secondary outcomes. Additionally, the laboratory’s upper reporting limit for HbA1c was 14%, with values above this reported as “> 14%.” For analysis, these were recorded as 14.1%, which may underestimate the true baseline HbA1c levels and impact of the assessment of change. This occurred for 4 of the 93 patients included.
All patients used the Freestyle Libre CGM, which may limit the generalizability of the findings to other CGM brands or models. Differences in device features, accuracy, scanning frequency, and user experience may influence outcomes, and results might differ with other CGM technologies. The dataset did not include patients’ scanning frequency because this metric was not consistently included in the EHRs.
Conclusions
This study found that CGM use was significantly associated with improved glycemic control in patients with non–insulin-dependent T2DM within an AI/AN population, particularly among patients with higher baseline HbA1c levels. The findings suggest that CGMs may be a valuable tool for managing T2DM beyond insulin-dependent populations.
Additional research with larger sample sizes, control groups, and extended follow-up periods is recommended to explore long-term benefits and impacts on other health metrics. The sample size estimates derived from this study serve as a valuable resource for researchers designing future studies aimed at addressing these gaps. Future research that expands on our findings by including larger, more diverse cohorts, accounting for medication use, and exploring different CGM technologies will enhance understanding and contribute to more effective diabetes management strategies for varied populations.
- National diabetes statistics report. Centers for Disease Control and Prevention. May 15, 2024. Accessed October 7, 2025. https://www.cdc.gov/diabetes/php/data-research/index.html
- Elsayed NA, Aleppo G, Aroda VR, et al. 2. Classification and diagnosis of diabetes: standards of care in diabetes—2023. Diabetes Care. 2023;46:S19-S40. doi:10.2337/dc23-S002
- Fowler MJ. Microvascular and macrovascular complications of diabetes. Clin Diabetes. 2011;29:116-122. doi:10.2337/diaclin.29.3.116
- Pleus S, Freckmann G, Schauer S, et al. Self-monitoring of blood glucose as an integral part in the management of people with type 2 diabetes mellitus. Diabetes Ther. 2022;13:829-846. doi:10.1007/s13300-022-01254-8
- Polonsky WH, Fisher L, Schikman CH, et al. Structured self-monitoring of blood glucose significantly reduces A1C levels in poorly controlled, noninsulin-treated type 2 diabetes: results from the Structured Testing Program study. Diabetes Care. 2011;34:262-267. doi:10.2337/dc10-1732
- Tanaka N, Yabe D, Murotani K, et al. Mental distress and health-related quality of life among type 1 and type 2 diabetes patients using self-monitoring of blood glucose: a cross-sectional questionnaire study in Japan. J Diabetes Investig. 2018;9:1203-1211. doi:10.1111/jdi.12827
- Hortensius J, Kars MC, Wierenga WS, et al. Perspectives of patients with type 1 or insulin-treated type 2 diabetes on self-monitoring of blood glucose: a qualitative study. BMC Public Health. 2012;12:167. doi:10.1186/1471-2458-12-167
- Didyuk O, Econom N, Guardia A, Livingston K, Klueh U. Continuous glucose monitoring devices: past, present, and future focus on the history and evolution of technological innovation. J Diabetes Sci Technol. 2021;15:676-683. doi:10.1177/1932296819899394
- Beck RW, Riddlesworth TD, Ruedy K, et al. Effect of continuous glucose monitoring on glycemic control in adults with type 1 diabetes using insulin injections: the DIAMOND randomized clinical trial. JAMA. 2017;317:371-378. doi:10.1001/jama.2016.19975
- Lind M, Polonsky W, Hirsch IB, et al. Continuous glucose monitoring vs conventional therapy for glycemic control in adults with type 1 diabetes treated with multiple daily insulin injections: the GOLD randomized clinical trial. JAMA. 2017;317:379-387. doi:10.1001/jama.2016.19976
- Bolinder J, Antuna R, Geelhoed-Duijvestijn P, et al. Novel glucose-sensing technology and hypoglycemia in type 1 diabetes: a multicenter, non-masked, randomized controlled trial. Lancet. 2016;388:2254-2263. doi:10.1016/S0140-6736(16)31535-5
- Seidu S, Kunutsor SK, Ajjan RA, et al. Efficacy and safety of continuous glucose monitoring and intermittently scanned continuous glucose monitoring in patients with type 2 diabetes: a systematic review and meta-analysis of interventional evidence. Diabetes Care. 2024;47:169-179. doi:10.2337/dc23-1520
- ElSayed NA, Aleppo G, Aroda VR, et al. 5. Facilitating positive health behaviors and well-being to improve health outcomes: standards of care in diabetes-2023. Diabetes Care. 2023;46:S68-S96. doi:10.2337/dc23-S005
- Yaron M, Roitman E, Aharon-Hananel G, et al. Effect of flash glucose monitoring technology on glycemic control and treatment satisfaction in patients with type 2 diabetes. Diabetes Care. 2019;42:1178-1184. doi:10.2337/dc18-0166
Diabetes mellitus (DM) is a national health crisis affecting > 38 million people (11.6%) in the United States.1 American Indian and Alaska Native (AI/AN) adults are disproportionately affected, with a prevalence of 14.5%—the highest among all racial and ethnic groups.1 Type 2 DM (T2DM) accounts for 90% to 95% of all DM cases and is a leading cause of morbidity and mortality due to its association with cardiovascular disease, kidney failure, and other complications.2
Maintaining glycemic control is important for managing T2DM and preventing microvascular and macrovascular complications.3 The cornerstone of diabetes self-management has been patient self-monitored blood glucose (SMBG) using finger-stick glucometers.4 However, SMBG provides measurements from a single point in time and requires frequent, painful, and inconvenient finger pricks, leading to decreased adherence.5,6 These limitations negatively affect patient engagement and overall glycemic control.7
Continuous glucose monitors (CGMs) offer real-time, continuous glucose readings and trends.8 CGMs improve glycemic control and reduce hypoglycemic episodes in patients who are insulin-dependent.9,10 Flash glucose monitors, a type of CGM that requires scanning to obtain glucose readings, provide similar benefits.11 Despite these demonstrated advantages, research has primarily focused on insulin-dependent populations, leaving a significant gap in understanding the effect of CGMs on patients with T2DM who are not insulin-dependent.12
Given the high prevalence of T2DM among AI/AN populations and the potential benefits of CGMs, this study sought to evaluate the effect of CGM use on glycemic control and other health metrics in patients with non–insulin-dependent T2DM in an AI/AN population. This focus addresses a critical knowledge gap and may inform clinical practices and policies to improve diabetes management in this high-risk group.
Methods
A retrospective observational study was conducted using deidentified electronic health records (EHRs) from 2019 to 2024 at a federally operated outpatient Indian Health Service (IHS) clinic serving an AI/AN population in the IHS Portland Area (Oregon, Washington, Idaho). The study protocol was reviewed and deemed exempt by institutional review boards at Washington State University and the Portland Area IHS.
Study Population
This study included patients diagnosed with non–insulin-dependent T2DM, had used a CGM for ≥ 1 year, and had hemoglobin A1c (HbA1c) measurements within 4 months prior to CGM initiation (baseline) and within ± 4 months after 1 year of CGM use. For other health metrics, including blood pressure (BP), weight, low-density lipoprotein cholesterol (LDL-C), and estimated glomerular filtration rate (eGFR), this study required measurements within 6 months before CGM initiation and within 6 months after 1 year of CGM use. The baseline HbA1c in the dataset ranged from 5.3% to > 14%.
Patients were excluded if they used insulin during the study period, had incomplete laboratory or clinical data for the required time frame, or had < 1 year of CGM use. The dataset did not include detailed information on oral DM medications; thus, we could not report or account for the type or number of oral hypoglycemic agents used by the patients. The IHS clinical applications coordinator compiled the dataset from the EHR, identifying patients who were prescribed and received a CGM at the clinic. All patients used the Abbott Freestyle Libre CGM, the only formulary CGM available at the clinic during the study period.
A 1-year follow-up endpoint was selected for several reasons: (1) to capture potential seasonal variations in diet and activity; (2) to align with the clinic’s standard practice of annual comprehensive diabetes evaluations; and (3) to allow sufficient time for patients to adapt to CGM use and reflect any meaningful changes in glycemic control.
All patients received standard DM care according to clinic protocols, which included DM self-management education and training. Patients met with the diabetes educator at least once, during which the educator emphasized making informed decisions using CGM data, such as adjusting dietary choices and physical activity levels to manage blood glucose concentrations effectively.
A total of 302 patients were initially identified. After applying exclusion criteria, 132 were excluded due to insulin use, and 77 were excluded due to incomplete HbA1c data within the specified time frames (Figure 1). The final sample included 93 patients.
Abbreviations: eGFR, estimated glomerular filtration rate; HbA1c, hemoglobin A1c; LDL-C, low-density lipoprotein cholesterol.
Measures
The primary outcome was the change in HbA1c levels from baseline to 1 year after CGM initiation. Secondary outcomes included changes in weight, systolic and diastolic BP, LDL-C concentrations, and eGFR. For the primary outcome, HbA1c values were collected within a grace period of ± 4 months from the baseline and 1-year time points. The laboratory’s upper reporting limit for HbA1c was 14%; values reported as “> 14%” were recorded as 14.1% for data analysis, although the actual values could have been higher.
For secondary outcomes, data were included if measurements were obtained within ± 6 months of the baseline and 1-year time points. Patients who did not have measurements within these time frames for specific metrics were excluded from secondary outcome analysis but remained in the overall study if they met the criteria for HbA1c and CGM use.
Statistical Analysis
Statistical analysis was performed using R statistical software version 4.4.2. Paired t tests were conducted to compare baseline and 1-year follow- up measurements for variables with parametric distributions. Wilcoxon signed-rank test was used for nonparametric data. A linear regression analysis was conducted to examine the relationship between baseline HbA1c levels and the change in HbA1c after 1 year of CGM use. Differences were considered significant at P < .05 set a priori. To guide future research, a posthoc power analysis was performed using Cohen’s d to estimate the required sample sizes for detecting significant effects, assuming a similar population.
Results
The study included 93 patients, with a mean (SD) age of 55 (13) years (range, 29-83 years). Of the participants, 56 were female (60%) and 37 were male (40%). All participants were identified as AI/AN and had non–insulin-dependent T2DM.
Primary Outcomes
A significant reduction in HbA1c levels was observed after 1 year of CGM use. The mean (SD) baseline HbA1c was 9.5% (2.4%), which decreased to 7.6% (2.2%) at 1-year follow-up (Table 1). This difference represents a mean change of -1.86% (2.4%) (95% CI, -2.35 to -1.37; P < .001 [paired t test, -7.53]).
A linear regression model evaluated the relationship between baseline HbA1c (predictor) and the change in HbA1c after 1 year (outcome). The change in HbA1c was calculated as the difference between 1-year follow-up and baseline values. The regression model revealed a significant negative association between baseline HbA1c and the change in HbA1c (Β = -0.576; P < .001), indicating that higher baseline HbA1c values were associated with greater reductions in HbA1c over the year. The regression equation was: Change in HbA1c = 3.587 – 0.576 × Baseline HbA1c
The regression coefficient for baseline HbA1c was -0.576 (standard error, 0.083; t = -6.931; P < .001), indicating that for each 1% increase in baseline HbA1c, the reduction of HbA1c after 1 year increased by approximately 0.576% (Figure 2). The model explained 34.6% of the variance in HbA1c change (R2 = .345; adjusted R2 = .338).
Secondary Outcomes
Systolic BP decreased by a mean (SD) -4.9 (17) mm Hg; 95% CI, -8.6 to -1.11; P = .01, paired t test). However, no significant change was observed for diastolic BP (P = .77, paired t test). Similarly, no significant changes were observed in weight, LDL-C concentrations, or eGFR after 1 year of CGM use. A posthoc power analysis indicated that the study was underpowered to detect smaller effect sizes in secondary outcomes. For example, sample size estimates indicated that detecting significant changes in weight and LDL-C concentrations would require sample sizes of 152 and 220 patients, respectively (Table 2).
Discussion
This study found a clinically significant reduction in HbA1c levels after 1 year among AI/AN patients with non–insulin-dependent T2DM who used CGMs. The mean HbA1c decreased 1.9%, from 9.5% at baseline to 7.6% after 1 year. This reduction is not only statistically significant (P < .001), it is clinically meaningful—even a 1% decrease in HbA1c is associated with substantial reductions in the risk of microvascular complications.3 The magnitude of the HbA1c reduction observed suggests CGM use may be associated with improved glycemic control in this high-risk population. By achieving lower HbA1c levels, patients may experience improved long-term health outcomes and a reduced burden of DM-related complications.
Changes in oral DM medications during the study period may have contributed to the observed improvements in HbA1c levels. While the dataset lacked detailed information on types or dosages of oral hypoglycemic agents used, adjustments in medication regimens are common in DM management and could significantly affect glycemic control. The inability to account for these changes results in an inability to attribute the improvements in HbA1c solely to CGM use. Future studies should collect comprehensive medication data to better isolate the effects of CGM use from other treatment modifications.
Another factor that may have contributed to the improved glycemic control is the DM self-management education and training patients received as part of standard care. Patients met with diabetes educators at least once and learned how to use the CGM device and interpret the data for self-management decisions. This education may have enhanced patient engagement and empowerment, enabling them to make informed choices about diet, physical activity, and medication adherence. Studies have shown that DM self-management education can significantly improve glycemic control and patient outcomes.13 By combining the CGM technology with targeted education, patients may have been better equipped to manage their condition, contributing to the observed reduction in HbA1c levels. Future studies should consider synergistic effects of CGM use and DM education when evaluating interventions for glycemic control.
The significant reduction in HbA1c indicates CGM use is associated with improved glycemic control in non–insulin-dependent T2DM. The linear regression analysis suggests patients with poorer glycemic control at baseline experienced greater reductions in HbA1c over the course of 1 year. This finding aligns with previous studies that have shown greater HbA1c reductions in patients with higher initial levels when using CGMs. Yaron et al reported similar findings: higher baseline HbA1c levels predicted more substantial improvements with CGM use in patients with T2DM on insulin therapy.14
This study contributes to existing research by examining the association between CGM use and glycemic control in patients with non– insulin-dependent T2DM within an AI/AN population, a group that has been underreported in previous studies. Most prior research has focused on insulin-dependent patients or populations with different ethnic backgrounds.12 By focusing on patients with non–insulin-dependent T2DM, this study highlights the broader applicability of CGMs beyond traditional use, showcasing their potential association with benefits in earlier stages of DM management. Targeting the AI/AN population addresses a critical knowledge gap, given the disproportionately high prevalence of T2DM and associated complications in this group. The findings of this study suggest integrating CGM technology into the standard care of AI/AN patients with non–insulin-dependent T2DM may be associated with improved glycemic control and may help reduce health disparities.
The modest decrease in systolic BP observed in this study may indicate potential cardiovascular benefits associated with CGM use, possibly due to improved glycemic control and increased patient engagement in self-management. However, given the limited sample size and exclusion criteria, the study lacked sufficient power to detect significant associations between CGM use and other secondary outcomes such as BP, weight, LDL-C, and eGFR. Therefore, the significant finding with systolic BP should be interpreted with caution.
The lack of significant changes in secondary outcomes may be attributed to the study’s limited sample size and the relatively short duration for observing changes in these parameters. Larger studies are needed to assess the full impact of CGM on these variables. The required sample sizes for achieving adequate power in future studies were calculated, highlighting the utility of our study as a pilot, providing critical data for the design of larger, adequately powered studies.
Limitations
The retrospective design of this study limits causal inferences. Moreover, potential confounding variables were not controlled, such as changes in medication regimens (other than insulin use), dietary counseling, or physical activity. Additionally, we could not account for the type or number of oral DM medications prescribed to patients. The dataset included only information on insulin use, without detailed records of other antidiabetic medications. This limitation may have influenced the observed change in glycemic control, as variations in medication regimens could affect HbA1c levels.
Because this study lacked a comparator group, the effect of CGM use cannot be definitively isolated from other factors (eg, medication changes, dietary modifications, or physical activity). Moreover, CGM devices can be costly and are not universally covered by all insurance or IHS programs, potentially limiting widespread implementation. Policy-level restrictions and patient-specific barriers may also hinder feasibility in other settings.
The small sample size may limit the generalizability of the findings. Of the initial 302 patients, about 69% were excluded due to insulin use or incomplete laboratory data. A ± 4-month window was selected to balance data quality with real-world practices. Extending this window further (eg, ± 6 months) might have included more participants but risked diluting the 1-year endpoint consistency. The lack of statistical significance in secondary metrics may be due to insufficient power rather than the absence of an effect.
Exclusion of patients due to incomplete data may have introduced selection bias. However, patients were included in the overall analysis if they met the criteria for HbA1c and CGM use, even if they lacked data for secondary outcomes. Additionally, the laboratory’s upper reporting limit for HbA1c was 14%, with values above this reported as “> 14%.” For analysis, these were recorded as 14.1%, which may underestimate the true baseline HbA1c levels and impact of the assessment of change. This occurred for 4 of the 93 patients included.
All patients used the Freestyle Libre CGM, which may limit the generalizability of the findings to other CGM brands or models. Differences in device features, accuracy, scanning frequency, and user experience may influence outcomes, and results might differ with other CGM technologies. The dataset did not include patients’ scanning frequency because this metric was not consistently included in the EHRs.
Conclusions
This study found that CGM use was significantly associated with improved glycemic control in patients with non–insulin-dependent T2DM within an AI/AN population, particularly among patients with higher baseline HbA1c levels. The findings suggest that CGMs may be a valuable tool for managing T2DM beyond insulin-dependent populations.
Additional research with larger sample sizes, control groups, and extended follow-up periods is recommended to explore long-term benefits and impacts on other health metrics. The sample size estimates derived from this study serve as a valuable resource for researchers designing future studies aimed at addressing these gaps. Future research that expands on our findings by including larger, more diverse cohorts, accounting for medication use, and exploring different CGM technologies will enhance understanding and contribute to more effective diabetes management strategies for varied populations.
- National diabetes statistics report. Centers for Disease Control and Prevention. May 15, 2024. Accessed October 7, 2025. https://www.cdc.gov/diabetes/php/data-research/index.html
- Elsayed NA, Aleppo G, Aroda VR, et al. 2. Classification and diagnosis of diabetes: standards of care in diabetes—2023. Diabetes Care. 2023;46:S19-S40. doi:10.2337/dc23-S002
- Fowler MJ. Microvascular and macrovascular complications of diabetes. Clin Diabetes. 2011;29:116-122. doi:10.2337/diaclin.29.3.116
- Pleus S, Freckmann G, Schauer S, et al. Self-monitoring of blood glucose as an integral part in the management of people with type 2 diabetes mellitus. Diabetes Ther. 2022;13:829-846. doi:10.1007/s13300-022-01254-8
- Polonsky WH, Fisher L, Schikman CH, et al. Structured self-monitoring of blood glucose significantly reduces A1C levels in poorly controlled, noninsulin-treated type 2 diabetes: results from the Structured Testing Program study. Diabetes Care. 2011;34:262-267. doi:10.2337/dc10-1732
- Tanaka N, Yabe D, Murotani K, et al. Mental distress and health-related quality of life among type 1 and type 2 diabetes patients using self-monitoring of blood glucose: a cross-sectional questionnaire study in Japan. J Diabetes Investig. 2018;9:1203-1211. doi:10.1111/jdi.12827
- Hortensius J, Kars MC, Wierenga WS, et al. Perspectives of patients with type 1 or insulin-treated type 2 diabetes on self-monitoring of blood glucose: a qualitative study. BMC Public Health. 2012;12:167. doi:10.1186/1471-2458-12-167
- Didyuk O, Econom N, Guardia A, Livingston K, Klueh U. Continuous glucose monitoring devices: past, present, and future focus on the history and evolution of technological innovation. J Diabetes Sci Technol. 2021;15:676-683. doi:10.1177/1932296819899394
- Beck RW, Riddlesworth TD, Ruedy K, et al. Effect of continuous glucose monitoring on glycemic control in adults with type 1 diabetes using insulin injections: the DIAMOND randomized clinical trial. JAMA. 2017;317:371-378. doi:10.1001/jama.2016.19975
- Lind M, Polonsky W, Hirsch IB, et al. Continuous glucose monitoring vs conventional therapy for glycemic control in adults with type 1 diabetes treated with multiple daily insulin injections: the GOLD randomized clinical trial. JAMA. 2017;317:379-387. doi:10.1001/jama.2016.19976
- Bolinder J, Antuna R, Geelhoed-Duijvestijn P, et al. Novel glucose-sensing technology and hypoglycemia in type 1 diabetes: a multicenter, non-masked, randomized controlled trial. Lancet. 2016;388:2254-2263. doi:10.1016/S0140-6736(16)31535-5
- Seidu S, Kunutsor SK, Ajjan RA, et al. Efficacy and safety of continuous glucose monitoring and intermittently scanned continuous glucose monitoring in patients with type 2 diabetes: a systematic review and meta-analysis of interventional evidence. Diabetes Care. 2024;47:169-179. doi:10.2337/dc23-1520
- ElSayed NA, Aleppo G, Aroda VR, et al. 5. Facilitating positive health behaviors and well-being to improve health outcomes: standards of care in diabetes-2023. Diabetes Care. 2023;46:S68-S96. doi:10.2337/dc23-S005
- Yaron M, Roitman E, Aharon-Hananel G, et al. Effect of flash glucose monitoring technology on glycemic control and treatment satisfaction in patients with type 2 diabetes. Diabetes Care. 2019;42:1178-1184. doi:10.2337/dc18-0166
Impact of Continuous Glucose Monitoring for American Indian/Alaska Native Adults With Type 2 Diabetes Mellitus Not Using Insulin
Impact of Continuous Glucose Monitoring for American Indian/Alaska Native Adults With Type 2 Diabetes Mellitus Not Using Insulin
Reducing Sex Disparities in Statin Therapy Among Female Veterans With Type 2 Diabetes and/or Cardiovascular Disease
Reducing Sex Disparities in Statin Therapy Among Female Veterans With Type 2 Diabetes and/or Cardiovascular Disease
Cardiovascular disease (CVD) is the leading cause of death among women in the United States.1 Most CVD is due to the buildup of plaque (ie, cholesterol, proteins, calcium, and inflammatory cells) in artery walls.2 The plaque may lead to atherosclerotic cardiovascular disease (ASCVD), which includes coronary heart disease, cerebrovascular disease, peripheral artery disease, and aortic atherosclerotic disease.2,3 Control and reduction of ASCVD risk factors, including high cholesterol levels, elevated blood pressure, insulin resistance, smoking, and a sedentary lifestyle, can contribute to a reduction in ASCVD morbidity and mortality.2 People with type 2 diabetes mellitus (T2DM) have an increased prevalence of lipid abnormalities, contributing to their high risk of ASCVD.4,5
The prescribing of statins (3-hydroxy-3-methyl-glutaryl-coenzmye A reductase inhibitors) is the cornerstone of lipid-lowering therapy and cardiovascular risk reduction for primary and secondary prevention of ASCVD.6 The American Diabetes Association (ADA) and American College of Cardiology/American Heart Association (ACC/AHA) recommend moderate- to high-intensity statins for primary prevention in patients with T2DM and high-intensity statins for secondary prevention in those with or without diabetes when not contraindicated.4,5,7 Despite eligibility according to guideline recommendations, research predominantly shows that women are less likely to receive statin therapy; however, this trend is improving. [6,8-11] To explain the sex differences in statin use, Nanna et al found that there is a combination of women being offered statin therapy less frequently, declining therapy more frequently, and discontinuing treatment more frequently.11 One possibility for discontinuing treatment could be statin-associated muscle symptoms (SAMS), which occur in about 10% of patients.12 The incidence of adverse effects (AEs) may be related to the way statins are metabolized.
Pharmacogenomic testing is free for veterans through the US Department of Veterans Affairs (VA) PHASER program, which offers information and recommendations for a panel of 11 gene variants. The panel includes genes related to common medication classes such as anticoagulants, antiplatelets, proton pump inhibitors, nonsteroidal anti-inflammatory drugs, opioids, antidepressants, and statins. The VA PHASER panel includes the solute carrier organic anion transporter family member 1B1 (SLCO1B1) gene, which is predominantly expressed in the liver and facilitates the hepatic uptake of most statins.13,14 A reduced function of SLCO1B1 can lead to higher statin levels, resulting in increased concentrations that may potentially cause SAMS.13,14 Some alleles associated with reduced function include SLCO1B1*5, *15, *23, *31, and *46 to *49, whereas others are associated with increased function, such as SLCO1B1 *14 and *20 (Appendix).15 Supporting evidence shows the SLCO1B1*5 nucleotide polymorphism increases plasma levels of simvastatin and atorvastatin, affecting effectiveness or toxicity. 13 Females tend to have a lower body weight and higher percentage of body fat compared with males, which might lead to higher concentrations of lipophilic drugs, including atorvastatin and simvastatin, which may be exacerbated by decreased function of SLCO1B1*5.15 With pharmacogenomic testing, therapeutic recommendations can be made to improve the overall safety and efficacy of statins, thus improving adherence using a patient-specific approach.14,15
Methods
Carl Vinson VA Medical Center (CVVAMC) serves about 42,000 veterans in Central and South Georgia, of which about 15% are female. Of the female veterans enrolled in care, 63% identify as Black, 27% White, and 1.5% as Asian, American Indian/Alaska Native, or Native Hawaiian/Other Pacific Islander. The 2020 Veterans Chartbook report showed that female veterans and minority racial and ethnic groups had worse access to health care and higher mortality rates than their male and non-Hispanic White counterparts.16
The Primary Care Equity Dashboard (PCED) was developed to engage the VA health care workforce in the process of identifying and addressing inequities in local patient populations.17 Using electronic quality measure data, the PCED provides Veterans Integrated Service Network-level and facility-level performance on several metrics.18 The PCED had not been previously used at the CVVAMC, and few publications or quality improvement projects regarding its use have been reported by the VA Office of Health Equity. PCED helped identify disparities when comparing female to male patients in the prescribing of statin therapy for patients with CVD and statin therapy for patients with T2DM.
VA PHASER pharmacogenomic analyses provided an opportunity to expand this quality improvement project. Sanford Health and the VA collaborated on the PHASER program to offer free genetic testing for veterans. The program launched in 2019 and expanded to various VA sites, including CVVAMC in March 2023. This program has been extended to December 31, 2025.
The primary objective of this quality improvement project was to increase statin prescribing among female veterans with T2DM and/or CVD to reduce cardiovascular risk. Secondary outcomes included increased pharmacogenomic testing and the assessment of pharmacogenomic results related to statin therapy. This project was approved by the CVVAMC Pharmacy and Therapeutics Committee. The PCED was used to identify female veterans with T2DM and/or CVD without an active prescription for a statin between July and October 2023. A review of Computerized Patient Record System patient charts was completed to screen for prespecified inclusion and exclusion criteria. Veterans were included if they were assigned female at birth, were enrolled in care at CVVAMC, and had a diagnosis of T2DM or CVD (history of myocardial infarction, coronary bypass graft, percutaneous coronary intervention, or other revascularization in any setting).
Veterans were excluded if they were currently pregnant, trying to conceive, breastfeeding, had a T1DM diagnosis, had previously documented hypersensitivity to a statin, active liver failure or decompensated cirrhosis, previously documented statin-associated rhabdomyolysis or autoimmune myopathy, an active prescription for a proprotein convertase subtilisin/kexin type 9 inhibitor, or previously documented statin intolerance (defined as the inability to tolerate ≥ 3 statins, with ≥ 1 prescribed at low intensity or alternate-day dosing). The female veterans were compared to 2 comparators: the facility's male veterans and the VA national average, identified via the PCED.
Once a veteran was screened, they were telephoned between October 2023 and February 2024 and provided education on statin use and pharmacogenomic testing using a standardized note template. An order was placed for participants who provided verbal consent for pharmacogenomic testing. Those who agreed to statin initiation were referred to a clinical pharmacist practitioner (CPP) who contacted them at a later date to prescribe a statin following the recommendations of the 2019 ACC/AHA and 2023 ADA guidelines and pharmacogenomic testing, if applicable.4,5,7 Appropriate monitoring and follow-up occurred at the discretion of each CPP. Data collection included: age, race, diagnoses (T2DM, CVD, or both), baseline lipid panel (total cholesterol, triglycerides, high-density lipoprotein, low-density lipoprotein), hepatic function, name and dose of statin, reasons for declining statin therapy, and pharmacogenomic testing results related to SLCO1B1.
Results
At baseline in July 2023, 77.8% of female veterans with T2DM were prescribed a statin, which exceeded the national VA average (77.0%), but was below the rate for male veterans (78.7%) in the facility comparator group.17 Additionally, 82.2% of females with CVD were prescribed a statin, which was below the national VA average of 86.0% and the 84.9% of male veterans in the facility comparator group.17 The PCED identified 189 female veterans from July 2023 to October 2023 who may benefit from statin therapy. Thirty-three females met the exclusion criteria. Of the 156 included veterans, 129 (82.7%) were successfully contacted and 27 (17.3%) could not be reached by telephone after 3 attempts (Figure 1). The 129 female veterans contacted had a mean age of 59 years and the majority were Black (82.9%) (Table 1).
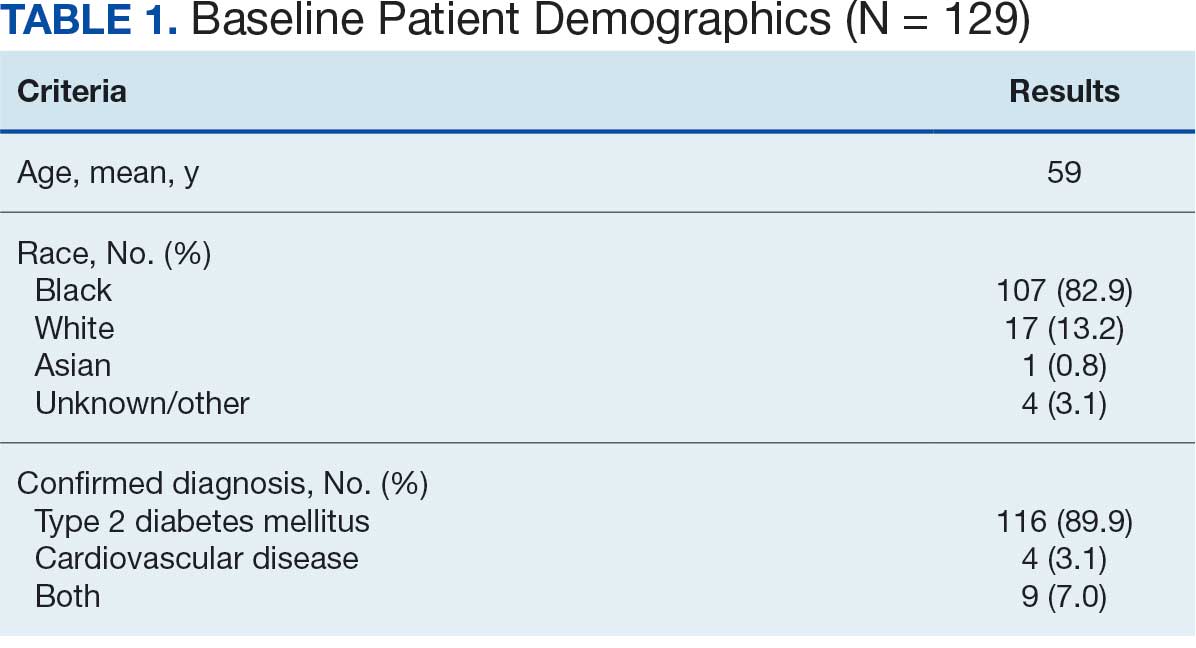
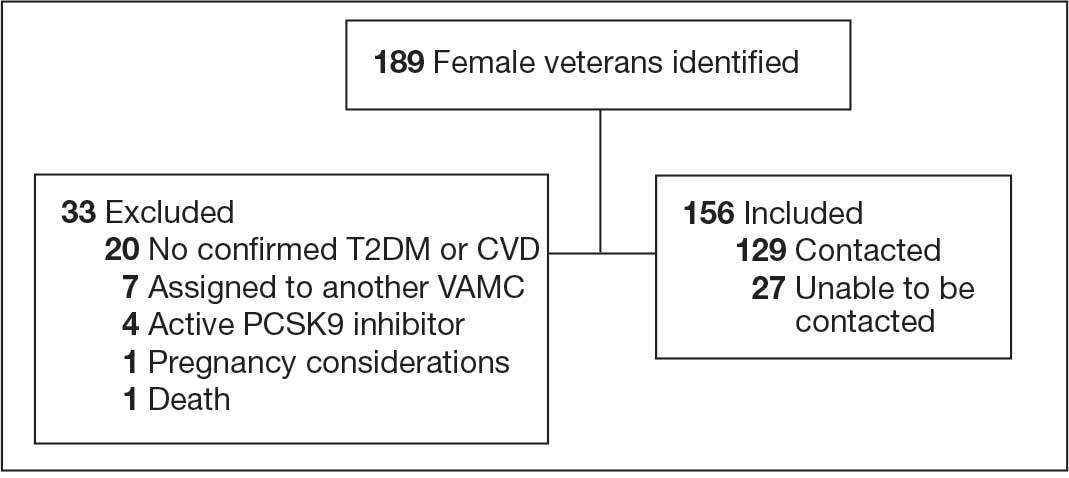
Abbreviations: CVD, cardiovascular disease; PCSK9, proprotein convertase subtilisin/
kexin type 9; T2DM, type 2 diabetes mellitus; VAMC, Veterans Affairs medical center.
Primary Outcomes
Of the 129 contacted veterans, 31 (24.0%) had a non-VA statin prescription, 13 (10.1%) had an active VA statin prescription, and 85 (65.9%) did not have a statin prescription, despite being eligible. Statin adherence was confirmed with participants, and the medication list was updated accordingly.
Of the 85 veterans with no active statin therapy, 37 (43.5%) accepted a new statin prescription and 48 (56.5%) declined. There were various reasons provided for declining statin therapy: 17 participants (35.4%) declined due to concern for AEs (Table 2).
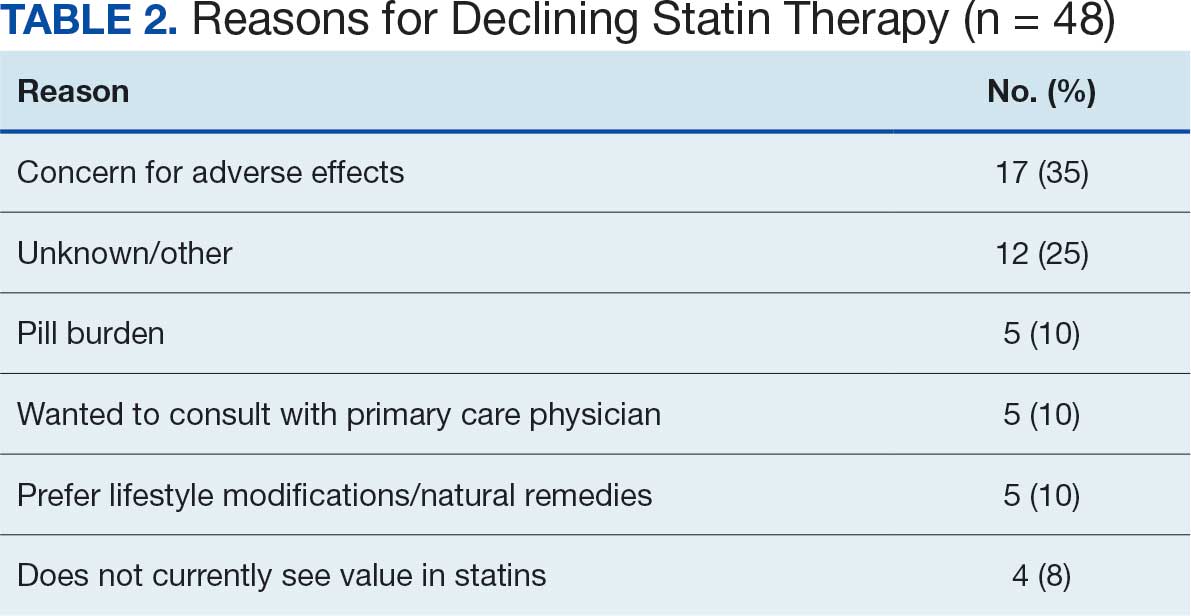
From July 2023 to March 2024, the percentage of female veterans with active statin therapy with T2DM increased from 77.8% to 79.0%. For those with active statin therapy with CVD, usage increased from 82.2% to 90.2%, which exceeded the national VA average and facility male comparator group (Figures 2 and 3).17
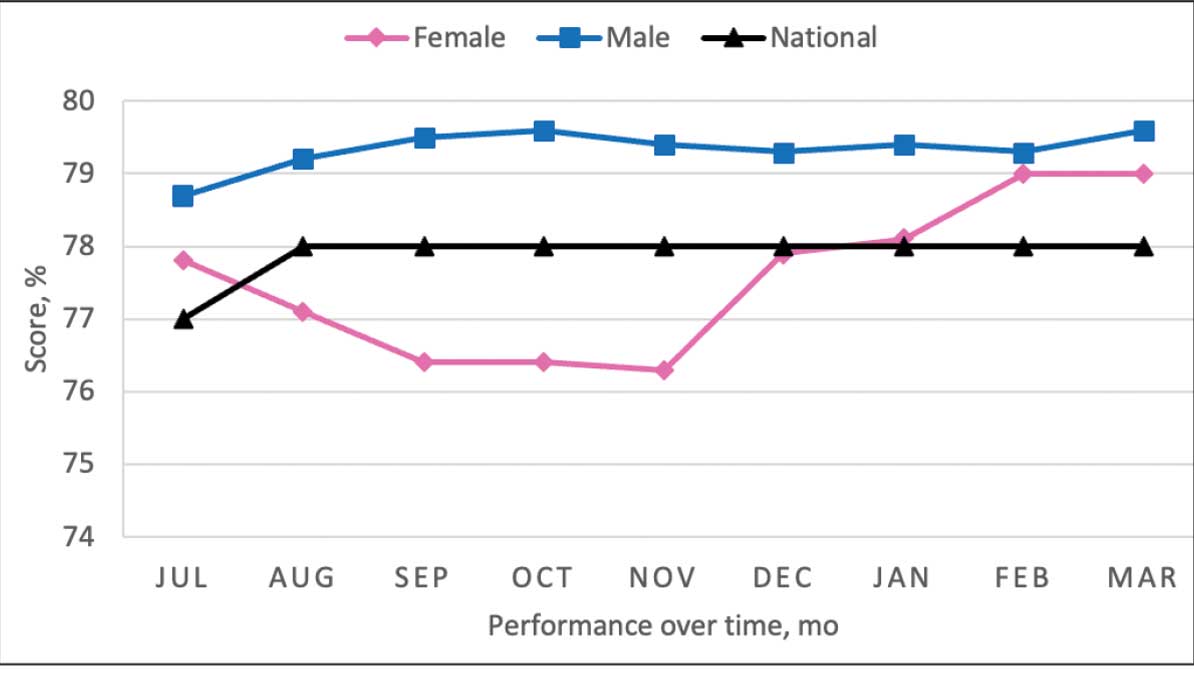
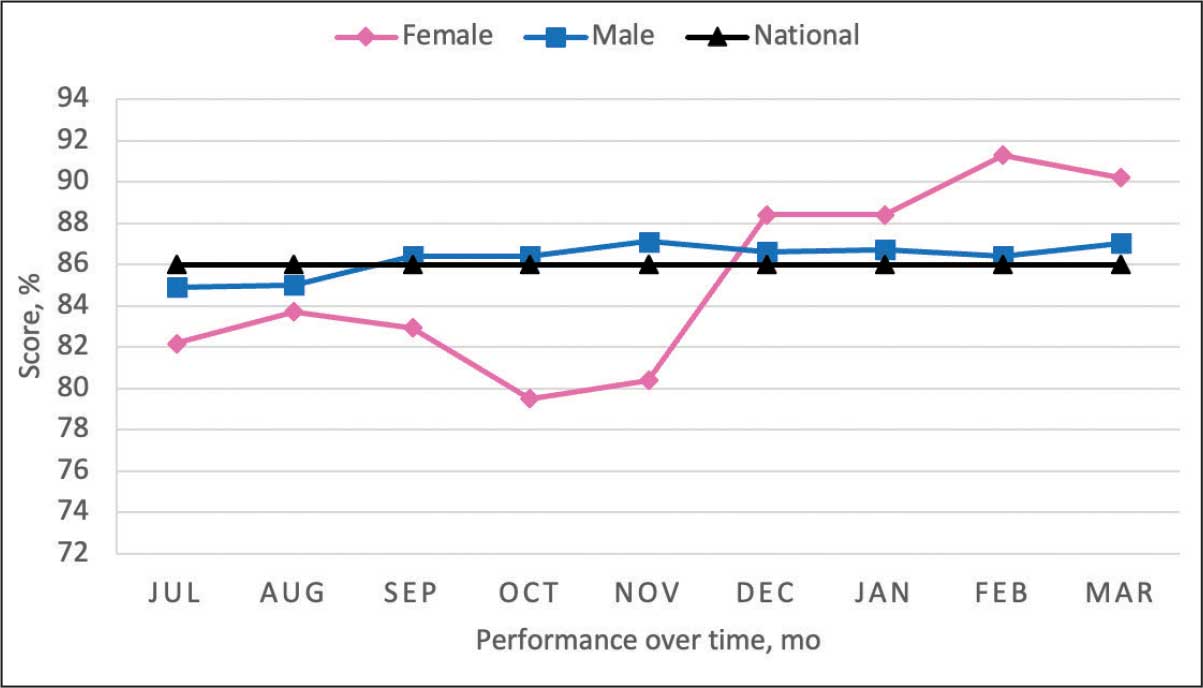
Secondary Outcomes
Seventy-one of 129 veterans (55.0%) gave verbal consent, and 47 (66.2%) completed the pharmacogenomic testing; 58 (45.0%) declined. Five veterans (10.6%) had a known SLCO1B1 allele variant present. One veteran required a change in statin therapy based on the results (eAppendix).
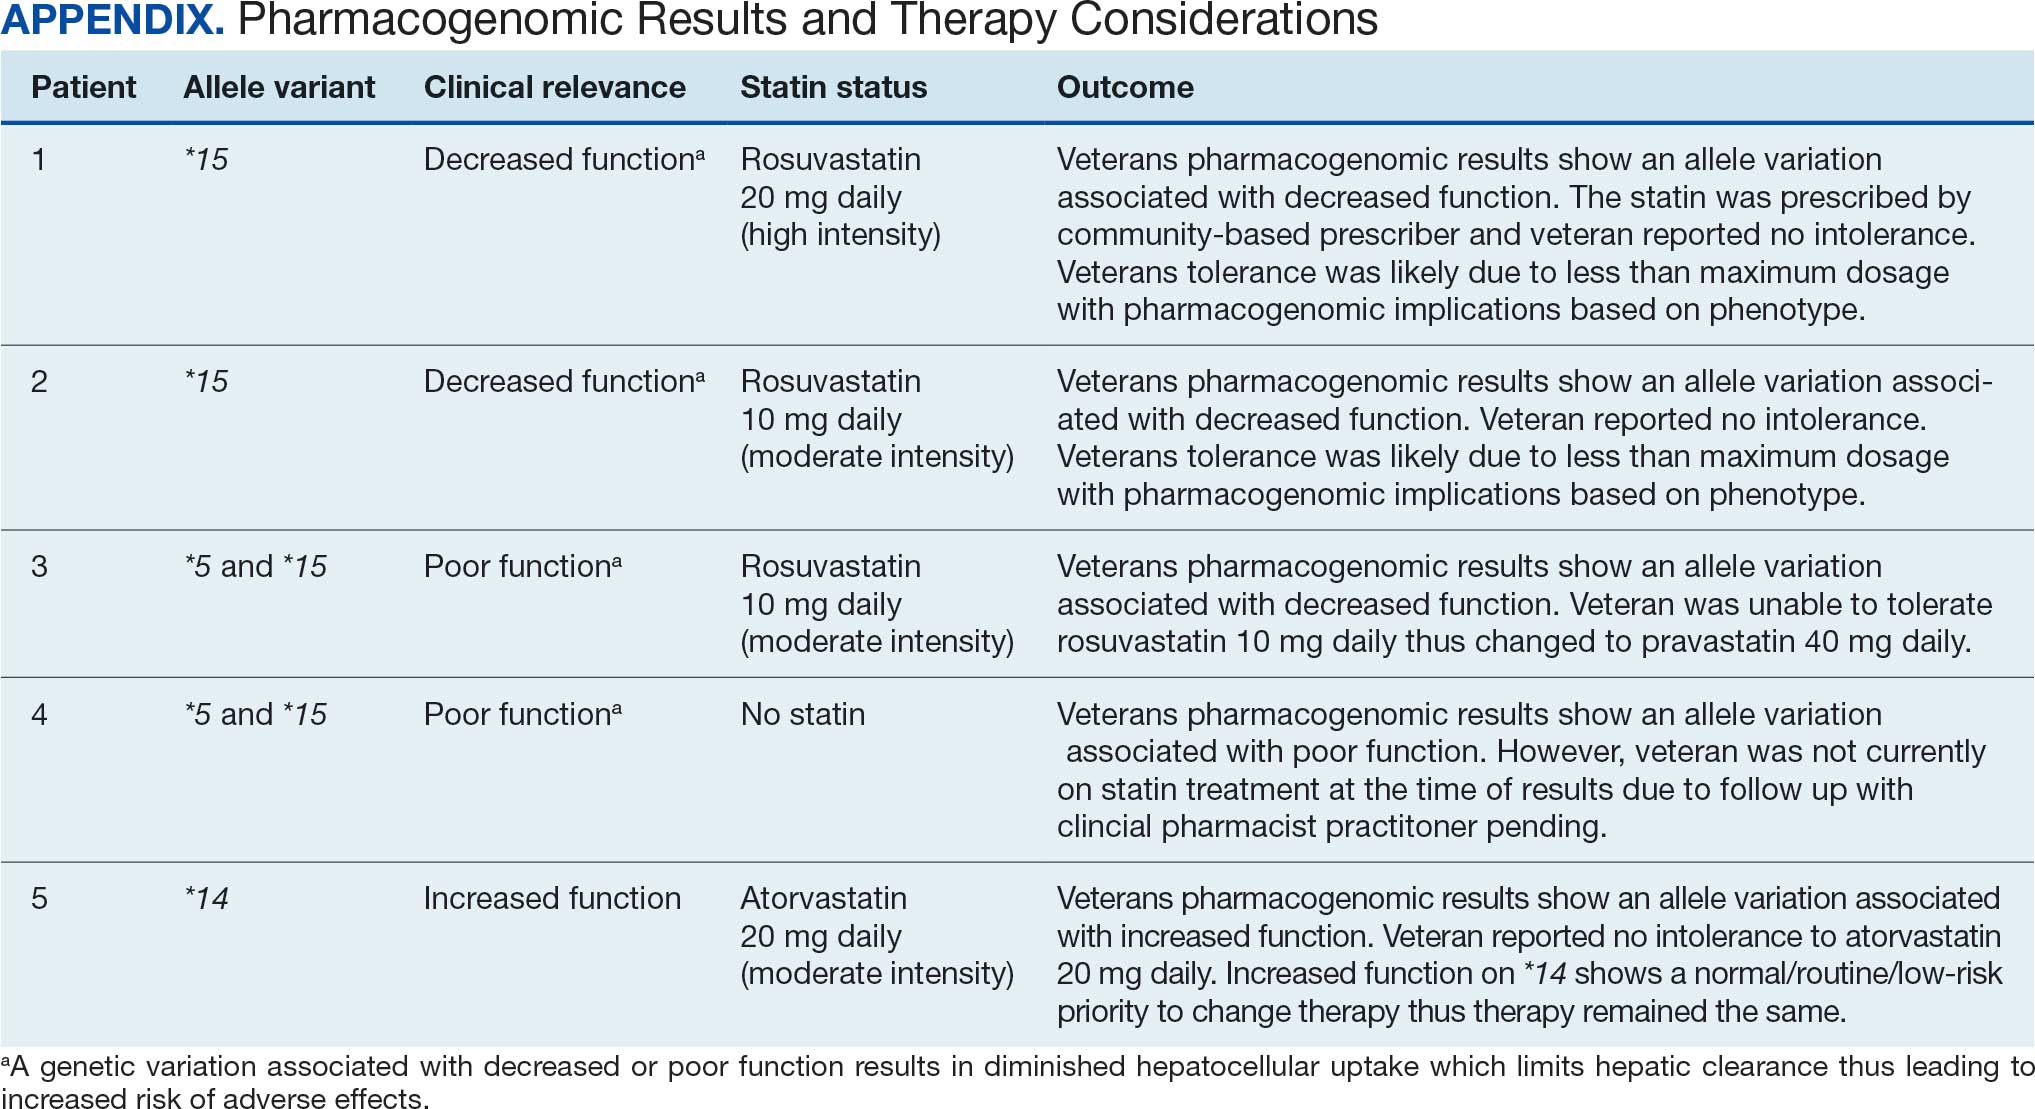
Discussion
This project aimed to increase statin prescribing among female veterans with T2DM and/or CVD to reduce cardiovascular risk and increase pharmacogenomic testing using the PCED and care managed by CPPs. The results of this quality improvement project illustrated that both metrics have improved at CVVAMC as a result of the intervention. The results in both metrics now exceed the PCED national VA average, and the CVD metric also exceeds that of the facility male comparator group. While there was only a 1.2% increase from July 2023 to March 2024 for patients with T2DM, there was an 8.0% increase for patients with CVD. Despite standardized education on statin use, more veterans declined therapy than accepted it, mostly due to concern for AEs. Recording the reasons for declining statin therapy offered valuable insight that can be used in additional discussions with veterans and clinicians.
Pharmacogenomics gives clinicians the unique opportunity to take a proactive approach to better predict drug responses, potentially allowing for less trial and error with medications, fewer AEs, greater trust in the clinician, and improved medication adherence. The CPPs incorporated pharmacogenomic testing into their practice, which led to identifying 5 SLCO1B1 gene abnormalities. The PCED served as a powerful tool for advancing equity-focused quality improvement initiatives on a local level and was crucial in prioritizing the detection of veterans potentially receiving suboptimal care.
Limitations
The nature of “cold calls” made it challenging to establish contact for inclusion in this study. An alternative to increase engagement could have been scheduled phone or face-to-face visits. While the use of the PCED was crucial, data did not account for statins listed in the non-VA medication list. All 31 patients with statins prescribed outside the VA had a start date added to provide the most accurate representation of the data moving forward.
Another limitation in this project was its small sample size and population. CVVAMC serves about 6200 female veterans, with roughly 63% identifying as Black. The preponderance of Black individuals (83%) in this project is typical for the female patient population at CVVAMC but may not reflect the demographics of other populations. Other limitations to this project consisted of scheduling conflicts. Appointments for laboratory draws at community-based outpatient clinics were subject to availability, which resulted in some delay in completion of pharmacogenomic testing.
Conclusions
CPPs can help reduce inequity in health care delivery. Increased incorporation of the PCED into regular practice within the VA is recommended to continue addressing sex disparities in statin use, diabetes control, blood pressure management, cancer screenings, and vaccination needs. CVVAMC plans to expand its use through another quality improvement project focused on reducing sex disparities in blood pressure management. Improving educational resources made available to veterans on the importance of statin therapy and potential to mitigate AEs through use of the VA PHASER program also would be helpful. This project successfully improved CVVAMC metrics for female veterans appropriately prescribed statin therapy and increased access to pharmacogenomic testing. Most importantly, it helped close the sex-based gap in CVD risk reduction care.
- Heron M. Deaths: leading causes for 2018. Nat Vital Stat Rep. 2021;70:1-114.
- US Department of Veterans Affairs, US Department of Defense. VA/DoD Clinical practice guideline for the management of dyslipidemia for cardiovascular risk reduction. Published June 2020. Accessed August 25, 2025. https://www.healthquality.va.gov/guidelines/CD/lipids/VADODDyslipidemiaCPG5087212020.pdf
- Atherosclerotic Cardiovascular Disease (ASCVD). American Heart Association. Accessed August 26, 2025. https:// www.heart.org/en/professional/quality-improvement/ascvd
- American Diabetes Association Professional Practice Committee. 10. Cardiovascular disease and risk management: standards of medical care in diabetes-2022. Diabetes Care. 2022;45(Suppl 1):S144-S174. doi:10.2337/dc22-S010
- American Diabetes Association. Standards of Care in Diabetes— 2023 abridged for primary care providers. Clinical Diabetes. 2022;41(1):4-31. doi:10.2337/cd23-as01
- Virani SS, Woodard LD, Ramsey DJ, et al. Gender disparities in evidence-based statin therapy in patients with cardiovascular disease. Am J Cardiol. 2015;115:21-26. doi:10.1016/j.amjcard.2014.09.041
- Arnett DK, Blumenthal RS, Albert MA, et al. 2019 ACC/ AHA Guideline on the primary prevention of cardiovascular disease: a report of the American College of Cardiology/ American Heart Association Task Force on Clinical Practice Guidelines. Circulation. 2019;140(11):e596-e646. doi:10.1161/CIR.0000000000000678
- Buchanan CH, Brown EA, Bishu KG, et al. The magnitude and potential causes of gender disparities in statin therapy in veterans with type 2 diabetes: a 10-year nationwide longitudinal cohort study. Womens Health Issues. 2022;32:274-283. doi:10.1016/j.whi.2021.10.003
- Ahmed F, Lin J, Ahmed T, et al. Health disparities: statin prescribing patterns among patients with diabetes in a family medicine clinic. Health Equity. 2022;6:291-297. doi:10.1089/heq.2021.0144
- Metser G, Bradley C, Moise N, Liyanage-Don N, Kronish I, Ye S. Gaps and disparities in primary prevention statin prescription during outpatient care. Am J Cardiol. 2021;161:36-41. doi:10.1016/j.amjcard.2021.08.070
- Nanna MG, Wang TY, Xiang Q, et al. Sex differences in the use of statins in community practice. Circ Cardiovasc Qual Outcomes. 2019;12(8):e005562. doi:10.1161/CIRCOUTCOMES.118.005562
- Kitzmiller JP, Mikulik EB, Dauki AM, Murkherjee C, Luzum JA. Pharmacogenomics of statins: understanding susceptibility to adverse effects. Pharmgenomics Pers Med. 2016;9:97-106. doi:10.2147/PGPM.S86013
- Türkmen D, Masoli JAH, Kuo CL, Bowden J, Melzer D, Pilling LC. Statin treatment effectiveness and the SLCO1B1*5 reduced function genotype: long-term outcomes in women and men. Br J Clin Pharmacol. 2022;88:3230-3240. doi:10.1111/bcp.15245
- Cooper-DeHoff RM, Niemi M, Ramsey LB, et al. The Clinical Pharmacogenetics Implementation Consortium guideline for SLCO1B1, ABCG2, and CYP2C9 genotypes and statin-associated musculoskeletal symptoms. Clin Pharmacol Ther. 2022;111:1007-1021. doi:10.1002/cpt.2557
- Ramsey LB, Gong L, Lee SB, et al. PharmVar GeneFocus: SLCO1B1. Clin Pharmacol Ther. 2023;113:782-793. doi:10.1002/cpt.2705
- National Healthcare Quality and Disparities Report: Chartbook on Healthcare for Veterans. Rockville (MD): Agency for Healthcare Research and Quality (US); November 2020.
- Procario G. Primary Care Equity Dashboard [database online]. Power Bi. 2023. Accessed August 26, 2025. https://app.powerbigov.us
- Hausmann LRM, Lamorte C, Estock JL. Understanding the context for incorporating equity into quality improvement throughout a national health care system. Health Equity. 2023;7(1):312-320. doi:10.1089/heq.2023.0009
Cardiovascular disease (CVD) is the leading cause of death among women in the United States.1 Most CVD is due to the buildup of plaque (ie, cholesterol, proteins, calcium, and inflammatory cells) in artery walls.2 The plaque may lead to atherosclerotic cardiovascular disease (ASCVD), which includes coronary heart disease, cerebrovascular disease, peripheral artery disease, and aortic atherosclerotic disease.2,3 Control and reduction of ASCVD risk factors, including high cholesterol levels, elevated blood pressure, insulin resistance, smoking, and a sedentary lifestyle, can contribute to a reduction in ASCVD morbidity and mortality.2 People with type 2 diabetes mellitus (T2DM) have an increased prevalence of lipid abnormalities, contributing to their high risk of ASCVD.4,5
The prescribing of statins (3-hydroxy-3-methyl-glutaryl-coenzmye A reductase inhibitors) is the cornerstone of lipid-lowering therapy and cardiovascular risk reduction for primary and secondary prevention of ASCVD.6 The American Diabetes Association (ADA) and American College of Cardiology/American Heart Association (ACC/AHA) recommend moderate- to high-intensity statins for primary prevention in patients with T2DM and high-intensity statins for secondary prevention in those with or without diabetes when not contraindicated.4,5,7 Despite eligibility according to guideline recommendations, research predominantly shows that women are less likely to receive statin therapy; however, this trend is improving. [6,8-11] To explain the sex differences in statin use, Nanna et al found that there is a combination of women being offered statin therapy less frequently, declining therapy more frequently, and discontinuing treatment more frequently.11 One possibility for discontinuing treatment could be statin-associated muscle symptoms (SAMS), which occur in about 10% of patients.12 The incidence of adverse effects (AEs) may be related to the way statins are metabolized.
Pharmacogenomic testing is free for veterans through the US Department of Veterans Affairs (VA) PHASER program, which offers information and recommendations for a panel of 11 gene variants. The panel includes genes related to common medication classes such as anticoagulants, antiplatelets, proton pump inhibitors, nonsteroidal anti-inflammatory drugs, opioids, antidepressants, and statins. The VA PHASER panel includes the solute carrier organic anion transporter family member 1B1 (SLCO1B1) gene, which is predominantly expressed in the liver and facilitates the hepatic uptake of most statins.13,14 A reduced function of SLCO1B1 can lead to higher statin levels, resulting in increased concentrations that may potentially cause SAMS.13,14 Some alleles associated with reduced function include SLCO1B1*5, *15, *23, *31, and *46 to *49, whereas others are associated with increased function, such as SLCO1B1 *14 and *20 (Appendix).15 Supporting evidence shows the SLCO1B1*5 nucleotide polymorphism increases plasma levels of simvastatin and atorvastatin, affecting effectiveness or toxicity. 13 Females tend to have a lower body weight and higher percentage of body fat compared with males, which might lead to higher concentrations of lipophilic drugs, including atorvastatin and simvastatin, which may be exacerbated by decreased function of SLCO1B1*5.15 With pharmacogenomic testing, therapeutic recommendations can be made to improve the overall safety and efficacy of statins, thus improving adherence using a patient-specific approach.14,15
Methods
Carl Vinson VA Medical Center (CVVAMC) serves about 42,000 veterans in Central and South Georgia, of which about 15% are female. Of the female veterans enrolled in care, 63% identify as Black, 27% White, and 1.5% as Asian, American Indian/Alaska Native, or Native Hawaiian/Other Pacific Islander. The 2020 Veterans Chartbook report showed that female veterans and minority racial and ethnic groups had worse access to health care and higher mortality rates than their male and non-Hispanic White counterparts.16
The Primary Care Equity Dashboard (PCED) was developed to engage the VA health care workforce in the process of identifying and addressing inequities in local patient populations.17 Using electronic quality measure data, the PCED provides Veterans Integrated Service Network-level and facility-level performance on several metrics.18 The PCED had not been previously used at the CVVAMC, and few publications or quality improvement projects regarding its use have been reported by the VA Office of Health Equity. PCED helped identify disparities when comparing female to male patients in the prescribing of statin therapy for patients with CVD and statin therapy for patients with T2DM.
VA PHASER pharmacogenomic analyses provided an opportunity to expand this quality improvement project. Sanford Health and the VA collaborated on the PHASER program to offer free genetic testing for veterans. The program launched in 2019 and expanded to various VA sites, including CVVAMC in March 2023. This program has been extended to December 31, 2025.
The primary objective of this quality improvement project was to increase statin prescribing among female veterans with T2DM and/or CVD to reduce cardiovascular risk. Secondary outcomes included increased pharmacogenomic testing and the assessment of pharmacogenomic results related to statin therapy. This project was approved by the CVVAMC Pharmacy and Therapeutics Committee. The PCED was used to identify female veterans with T2DM and/or CVD without an active prescription for a statin between July and October 2023. A review of Computerized Patient Record System patient charts was completed to screen for prespecified inclusion and exclusion criteria. Veterans were included if they were assigned female at birth, were enrolled in care at CVVAMC, and had a diagnosis of T2DM or CVD (history of myocardial infarction, coronary bypass graft, percutaneous coronary intervention, or other revascularization in any setting).
Veterans were excluded if they were currently pregnant, trying to conceive, breastfeeding, had a T1DM diagnosis, had previously documented hypersensitivity to a statin, active liver failure or decompensated cirrhosis, previously documented statin-associated rhabdomyolysis or autoimmune myopathy, an active prescription for a proprotein convertase subtilisin/kexin type 9 inhibitor, or previously documented statin intolerance (defined as the inability to tolerate ≥ 3 statins, with ≥ 1 prescribed at low intensity or alternate-day dosing). The female veterans were compared to 2 comparators: the facility's male veterans and the VA national average, identified via the PCED.
Once a veteran was screened, they were telephoned between October 2023 and February 2024 and provided education on statin use and pharmacogenomic testing using a standardized note template. An order was placed for participants who provided verbal consent for pharmacogenomic testing. Those who agreed to statin initiation were referred to a clinical pharmacist practitioner (CPP) who contacted them at a later date to prescribe a statin following the recommendations of the 2019 ACC/AHA and 2023 ADA guidelines and pharmacogenomic testing, if applicable.4,5,7 Appropriate monitoring and follow-up occurred at the discretion of each CPP. Data collection included: age, race, diagnoses (T2DM, CVD, or both), baseline lipid panel (total cholesterol, triglycerides, high-density lipoprotein, low-density lipoprotein), hepatic function, name and dose of statin, reasons for declining statin therapy, and pharmacogenomic testing results related to SLCO1B1.
Results
At baseline in July 2023, 77.8% of female veterans with T2DM were prescribed a statin, which exceeded the national VA average (77.0%), but was below the rate for male veterans (78.7%) in the facility comparator group.17 Additionally, 82.2% of females with CVD were prescribed a statin, which was below the national VA average of 86.0% and the 84.9% of male veterans in the facility comparator group.17 The PCED identified 189 female veterans from July 2023 to October 2023 who may benefit from statin therapy. Thirty-three females met the exclusion criteria. Of the 156 included veterans, 129 (82.7%) were successfully contacted and 27 (17.3%) could not be reached by telephone after 3 attempts (Figure 1). The 129 female veterans contacted had a mean age of 59 years and the majority were Black (82.9%) (Table 1).
Abbreviations: CVD, cardiovascular disease; PCSK9, proprotein convertase subtilisin/
kexin type 9; T2DM, type 2 diabetes mellitus; VAMC, Veterans Affairs medical center.
Primary Outcomes
Of the 129 contacted veterans, 31 (24.0%) had a non-VA statin prescription, 13 (10.1%) had an active VA statin prescription, and 85 (65.9%) did not have a statin prescription, despite being eligible. Statin adherence was confirmed with participants, and the medication list was updated accordingly.
Of the 85 veterans with no active statin therapy, 37 (43.5%) accepted a new statin prescription and 48 (56.5%) declined. There were various reasons provided for declining statin therapy: 17 participants (35.4%) declined due to concern for AEs (Table 2).
From July 2023 to March 2024, the percentage of female veterans with active statin therapy with T2DM increased from 77.8% to 79.0%. For those with active statin therapy with CVD, usage increased from 82.2% to 90.2%, which exceeded the national VA average and facility male comparator group (Figures 2 and 3).17
Secondary Outcomes
Seventy-one of 129 veterans (55.0%) gave verbal consent, and 47 (66.2%) completed the pharmacogenomic testing; 58 (45.0%) declined. Five veterans (10.6%) had a known SLCO1B1 allele variant present. One veteran required a change in statin therapy based on the results (eAppendix).
Discussion
This project aimed to increase statin prescribing among female veterans with T2DM and/or CVD to reduce cardiovascular risk and increase pharmacogenomic testing using the PCED and care managed by CPPs. The results of this quality improvement project illustrated that both metrics have improved at CVVAMC as a result of the intervention. The results in both metrics now exceed the PCED national VA average, and the CVD metric also exceeds that of the facility male comparator group. While there was only a 1.2% increase from July 2023 to March 2024 for patients with T2DM, there was an 8.0% increase for patients with CVD. Despite standardized education on statin use, more veterans declined therapy than accepted it, mostly due to concern for AEs. Recording the reasons for declining statin therapy offered valuable insight that can be used in additional discussions with veterans and clinicians.
Pharmacogenomics gives clinicians the unique opportunity to take a proactive approach to better predict drug responses, potentially allowing for less trial and error with medications, fewer AEs, greater trust in the clinician, and improved medication adherence. The CPPs incorporated pharmacogenomic testing into their practice, which led to identifying 5 SLCO1B1 gene abnormalities. The PCED served as a powerful tool for advancing equity-focused quality improvement initiatives on a local level and was crucial in prioritizing the detection of veterans potentially receiving suboptimal care.
Limitations
The nature of “cold calls” made it challenging to establish contact for inclusion in this study. An alternative to increase engagement could have been scheduled phone or face-to-face visits. While the use of the PCED was crucial, data did not account for statins listed in the non-VA medication list. All 31 patients with statins prescribed outside the VA had a start date added to provide the most accurate representation of the data moving forward.
Another limitation in this project was its small sample size and population. CVVAMC serves about 6200 female veterans, with roughly 63% identifying as Black. The preponderance of Black individuals (83%) in this project is typical for the female patient population at CVVAMC but may not reflect the demographics of other populations. Other limitations to this project consisted of scheduling conflicts. Appointments for laboratory draws at community-based outpatient clinics were subject to availability, which resulted in some delay in completion of pharmacogenomic testing.
Conclusions
CPPs can help reduce inequity in health care delivery. Increased incorporation of the PCED into regular practice within the VA is recommended to continue addressing sex disparities in statin use, diabetes control, blood pressure management, cancer screenings, and vaccination needs. CVVAMC plans to expand its use through another quality improvement project focused on reducing sex disparities in blood pressure management. Improving educational resources made available to veterans on the importance of statin therapy and potential to mitigate AEs through use of the VA PHASER program also would be helpful. This project successfully improved CVVAMC metrics for female veterans appropriately prescribed statin therapy and increased access to pharmacogenomic testing. Most importantly, it helped close the sex-based gap in CVD risk reduction care.
- Heron M. Deaths: leading causes for 2018. Nat Vital Stat Rep. 2021;70:1-114.
- US Department of Veterans Affairs, US Department of Defense. VA/DoD Clinical practice guideline for the management of dyslipidemia for cardiovascular risk reduction. Published June 2020. Accessed August 25, 2025. https://www.healthquality.va.gov/guidelines/CD/lipids/VADODDyslipidemiaCPG5087212020.pdf
- Atherosclerotic Cardiovascular Disease (ASCVD). American Heart Association. Accessed August 26, 2025. https:// www.heart.org/en/professional/quality-improvement/ascvd
- American Diabetes Association Professional Practice Committee. 10. Cardiovascular disease and risk management: standards of medical care in diabetes-2022. Diabetes Care. 2022;45(Suppl 1):S144-S174. doi:10.2337/dc22-S010
- American Diabetes Association. Standards of Care in Diabetes— 2023 abridged for primary care providers. Clinical Diabetes. 2022;41(1):4-31. doi:10.2337/cd23-as01
- Virani SS, Woodard LD, Ramsey DJ, et al. Gender disparities in evidence-based statin therapy in patients with cardiovascular disease. Am J Cardiol. 2015;115:21-26. doi:10.1016/j.amjcard.2014.09.041
- Arnett DK, Blumenthal RS, Albert MA, et al. 2019 ACC/ AHA Guideline on the primary prevention of cardiovascular disease: a report of the American College of Cardiology/ American Heart Association Task Force on Clinical Practice Guidelines. Circulation. 2019;140(11):e596-e646. doi:10.1161/CIR.0000000000000678
- Buchanan CH, Brown EA, Bishu KG, et al. The magnitude and potential causes of gender disparities in statin therapy in veterans with type 2 diabetes: a 10-year nationwide longitudinal cohort study. Womens Health Issues. 2022;32:274-283. doi:10.1016/j.whi.2021.10.003
- Ahmed F, Lin J, Ahmed T, et al. Health disparities: statin prescribing patterns among patients with diabetes in a family medicine clinic. Health Equity. 2022;6:291-297. doi:10.1089/heq.2021.0144
- Metser G, Bradley C, Moise N, Liyanage-Don N, Kronish I, Ye S. Gaps and disparities in primary prevention statin prescription during outpatient care. Am J Cardiol. 2021;161:36-41. doi:10.1016/j.amjcard.2021.08.070
- Nanna MG, Wang TY, Xiang Q, et al. Sex differences in the use of statins in community practice. Circ Cardiovasc Qual Outcomes. 2019;12(8):e005562. doi:10.1161/CIRCOUTCOMES.118.005562
- Kitzmiller JP, Mikulik EB, Dauki AM, Murkherjee C, Luzum JA. Pharmacogenomics of statins: understanding susceptibility to adverse effects. Pharmgenomics Pers Med. 2016;9:97-106. doi:10.2147/PGPM.S86013
- Türkmen D, Masoli JAH, Kuo CL, Bowden J, Melzer D, Pilling LC. Statin treatment effectiveness and the SLCO1B1*5 reduced function genotype: long-term outcomes in women and men. Br J Clin Pharmacol. 2022;88:3230-3240. doi:10.1111/bcp.15245
- Cooper-DeHoff RM, Niemi M, Ramsey LB, et al. The Clinical Pharmacogenetics Implementation Consortium guideline for SLCO1B1, ABCG2, and CYP2C9 genotypes and statin-associated musculoskeletal symptoms. Clin Pharmacol Ther. 2022;111:1007-1021. doi:10.1002/cpt.2557
- Ramsey LB, Gong L, Lee SB, et al. PharmVar GeneFocus: SLCO1B1. Clin Pharmacol Ther. 2023;113:782-793. doi:10.1002/cpt.2705
- National Healthcare Quality and Disparities Report: Chartbook on Healthcare for Veterans. Rockville (MD): Agency for Healthcare Research and Quality (US); November 2020.
- Procario G. Primary Care Equity Dashboard [database online]. Power Bi. 2023. Accessed August 26, 2025. https://app.powerbigov.us
- Hausmann LRM, Lamorte C, Estock JL. Understanding the context for incorporating equity into quality improvement throughout a national health care system. Health Equity. 2023;7(1):312-320. doi:10.1089/heq.2023.0009
Reducing Sex Disparities in Statin Therapy Among Female Veterans With Type 2 Diabetes and/or Cardiovascular Disease
Reducing Sex Disparities in Statin Therapy Among Female Veterans With Type 2 Diabetes and/or Cardiovascular Disease
Impact of Retroactive Application of Updated Surveillance Guidelines on Endoscopy Center Capacity at a Large VA Health Care System
Impact of Retroactive Application of Updated Surveillance Guidelines on Endoscopy Center Capacity at a Large VA Health Care System
In 2020, the US Multi-Society Task Force (USMSTF) on Colorectal Cancer (CRC) increased the recommended colon polyp surveillance interval for 1 to 2 subcentimeter tubular adenomas from 5 to 10 years to 7 to 10 years.1 This change was prompted by emerging research indicating that rates of CRC and advanced neoplasia among patients with a history of only 1 to 2 subcentimeter tubular adenomas are lower than initially estimated.2,3 This extension provides an opportunity to increase endoscopy capacity and improve access to colonoscopies by retroactively applying the 2020 guidelines to surveillance interval recommendations made before their introduction. For example, based on the updated guidelines, patients previously recommended to undergo colon polyp surveillance colonoscopy 5 years after an index colonoscopy could extend their surveillance interval by 2 to 5 years. Increasing endoscopic capacity could address the growing demand for colonoscopies from new screening guidelines that reduced the age of initial CRC screening from 50 years to 45 years and the backlog of procedures due to COVID-19 restrictions.4
As part of a project to increase endoscopic capacity at the US Department of Veterans Affairs (VA) Pittsburgh Healthcare System (VAPHS), this study assessed the potential impact of retroactively applying the 2020 USMSTF polyp surveillance guidelines on endoscopic capacity. These results may be informative for other VA and private-sector health care systems seeking to identify strategies to improve endoscopy capacity.
Methods
VAPHS is an integrated health care system in the Veterans Health Administration (VHA) serving 85,000 patients across 8 health care institutions in Pennsylvania, Ohio, and West Virginia. VAPHS manages colorectal screening recommendations for patients receiving medical care in the health care system regardless of whether their prior colonoscopy was performed at VAPHS or external facilities. The VA maintains a national CRC screening and surveillance electronic medical record reminder that prompts health care practitioners to order colon polyp surveillance based on interval recommendations from the index colonoscopy. This study reviewed all patients from the VAPHS panel with a reminder to undergo colonoscopy for screening for CRC or surveillance of colon polyps within 12 months from September 1, 2022.
Among patients with a reminder, 3 investigators reviewed index colonoscopy and pathology reports to identify CRC risk category, colonoscopy indication, procedural quality, and recommended repeat colonoscopy interval. Per the USMSTF guidelines, patients with incomplete colonoscopy or pathology records, high-risk indications (ie, personal history of inflammatory bowel disease, personal history of CRC, or family history of CRC), or inadequate bowel preparation (Boston Bowel Preparation Score < 6) were excluded. Additionally, patients who had CRC screening or surveillance discontinued due to age or comorbidities, had completed a subsequent follow-up colonoscopy, or were deceased at the time of review were excluded.
Retroactive Interval Reclassification
Among eligible patients, this study compared the repeat colonoscopy interval recommended by the prior endoscopist with those from the 2020 USMSTF guidelines. In cases where the interval was documented as a range of years, the lower end was considered the recommendation. Similarly, the lower end of the range from the 2020 USMSTF guidelines was used for the reclassified surveillance interval. Years extended per patient were quantified relative to September 1, 2023 (ie, 1 year after the review date). For example, if the index colonoscopy was completed on September 1, 2016, the initial surveillance recommendation was 5 years, and the reclassified recommendation was 7 years, the interval extension beyond September 1, 2023, was 0 years.
Furthermore, because index surveillance recommendations are not always guideline concordant, the years extended per patient were calculated by harmonizing the index endoscopist’s recommendations with the guidelines at the time of the index colonoscopy.5 For example, if the index colonoscopy was completed on September 1, 2018, and the endoscopist recommended a 5-year follow-up for a patient with average risk for CRC, adequate bowel preparation, and no colorectal polyps, that patient is eligible to extend their colonoscopy to September 1, 2028, based on guideline recommendations at the time of index endoscopy recommending that the next colonoscopy occur in 10 years. In this analysis the 2012 USMSTF guidelines were applied to all index colonoscopies completed in 2021 or earlier to allow time for adoption of the 2020 guidelines.
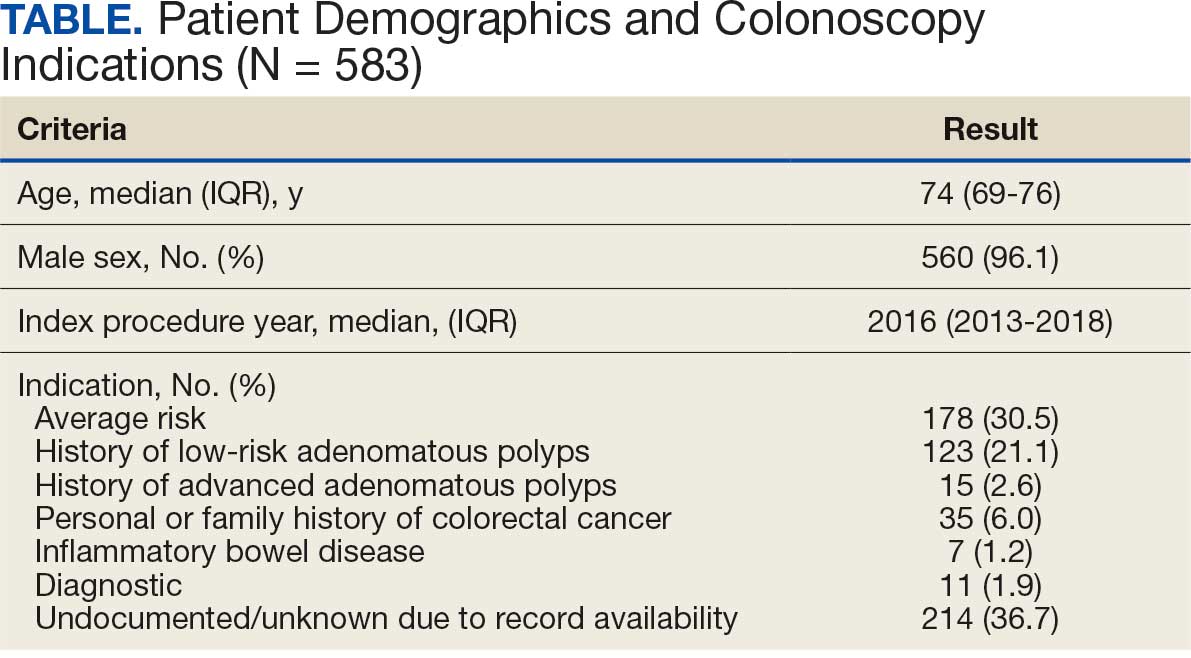
This project fulfilled a facility mandate to increase capacity to conduct endoscopic procedures. Institutional review board approval was not required by VAPHS policy relating to clinical operations projects. Approval for publication of clinical operations activity was obtained from the VAPHS facility director.
Results
Within 1 year of the September 1, 2022, review date, 637 patients receiving care at VAPHS had clinical reminders for an upcoming colonoscopy. Of these, 54 (8.4%) were already up to date or were deceased at the time of review. Of the 583 eligible patients, 96% were male, the median age was 74 years, the median index colonoscopy year was 2016, and 178 (30.5%) had an average-risk CRC screening indication at the index colonoscopy (Table).
Of the 583 patients due for colonoscopy, 331 (56.7%) had both colonoscopy and pathology reports available. The majority of those with incomplete records had the index colonoscopy completed outside VAPHS. Among these patients, 222 (67.0%) had adequate bowel preparation. Of those with adequate bowel preparation, 43 were not eligible for interval extension because of high-risk conditions and 13 were not eligible because there was no index surveillance interval recommendation from the index endoscopist. Of the patients due for colonoscopy, 166 (28.4%) were potentially eligible for surveillance interval extension (Figure).
Sixty-five (39.2%) of the 166 patients had 1 to 2 subcentimeter tubular adenomas on their index colonoscopy. Sixty-two patients were eligible for interval extension to 7 years, but this only resulted in ≥ 1 year of extension beyond the review date for 36 (6% of all 583 patients due for colonoscopy). The 36 patients were extended 63 years. By harmonizing the index endoscopists’ surveillance interval recommendation with the guideline at the time of the index colonoscopy, 29 additional patients could have their colonoscopy extended by ≥ 1 year. Harmonization extended colonoscopy intervals by 93 years. Retroactively applying the 2020 USMSTF polyp surveillance guidelines and harmonizing recommendations to guidelines extended the time of index colonoscopy by 153 years.
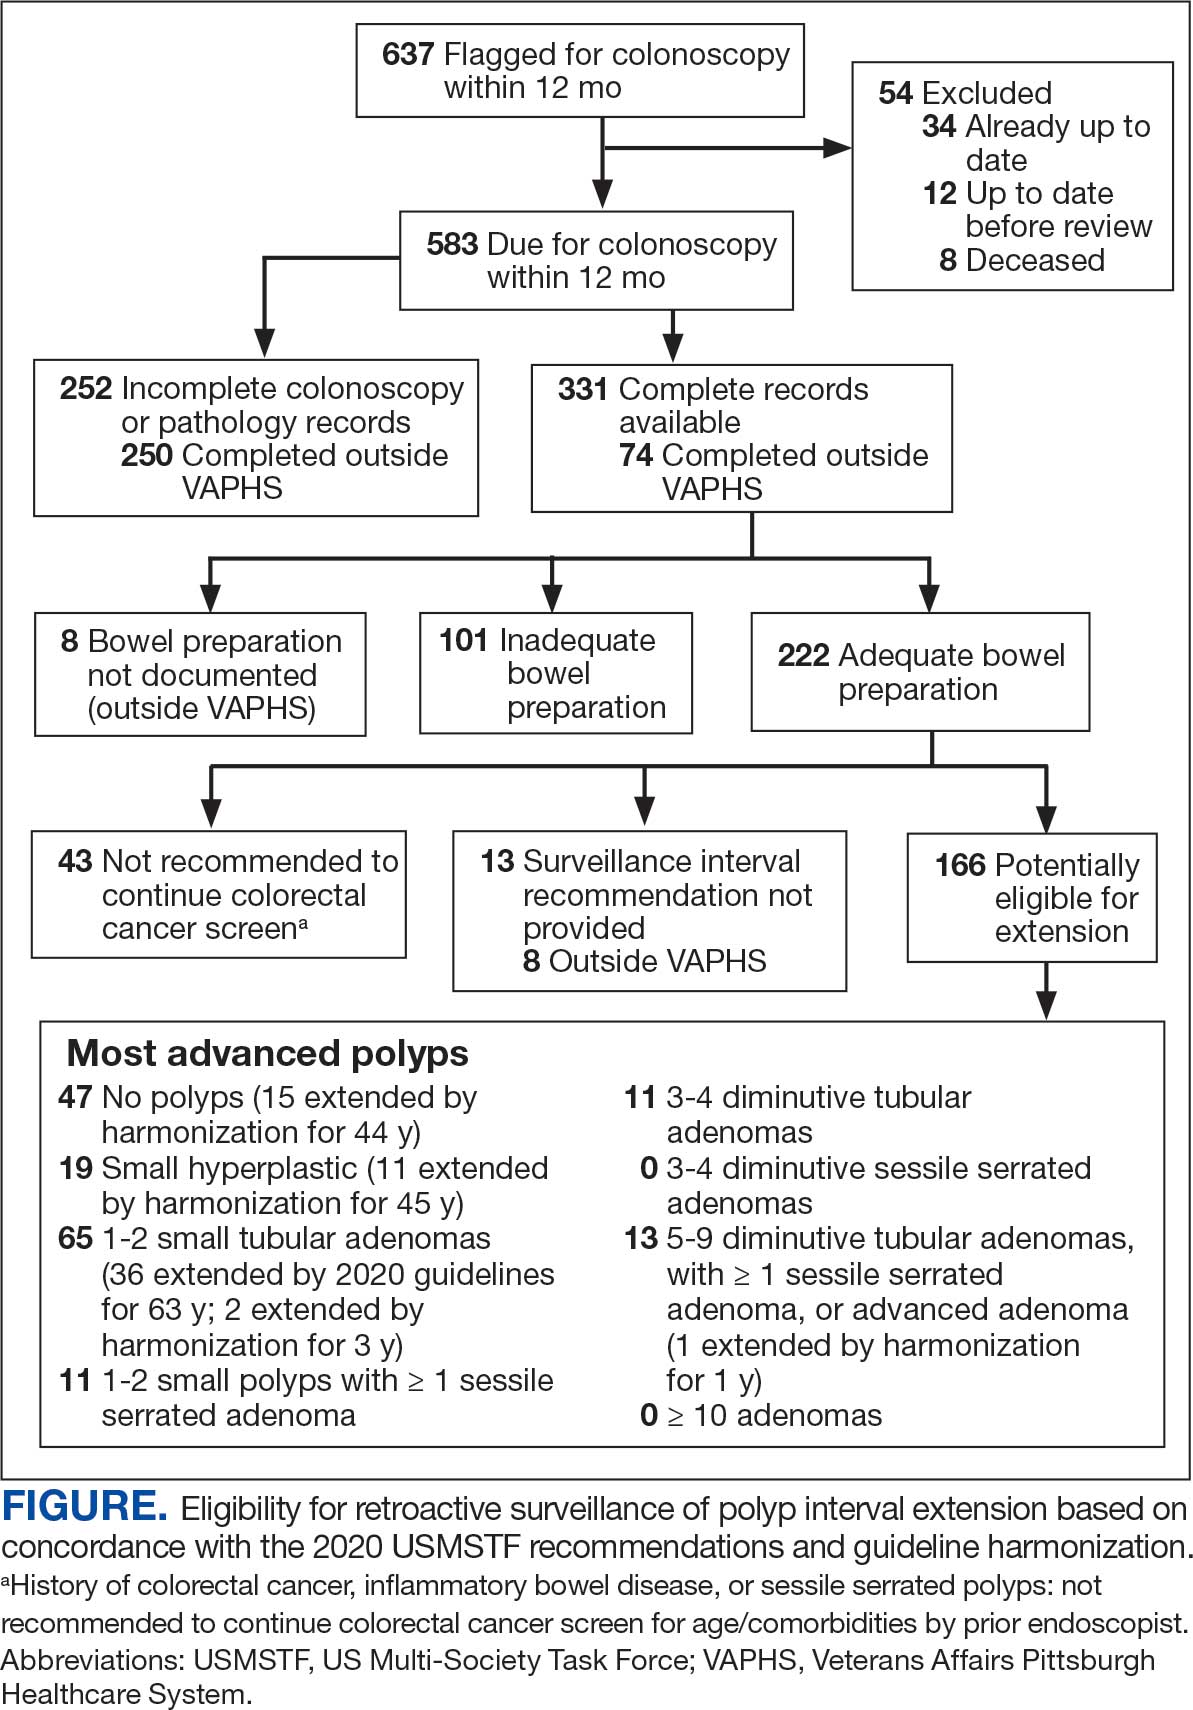
Discussion
With retroactive application of the 2020 USMSTF polyp surveillance guidelines, 6% of patients due for an upcoming colonoscopy could extend their follow-up by ≥ 1 year by extending the surveillance interval for 1 to 2 subcentimeter tubular adenomas to 7 years. An additional 5% of patients could extend their interval by harmonizing the index endoscopist’s interval recommendation with polyp surveillance guidelines at the time of the index colonoscopy. These findings are consistent with the results of 2 studies that demonstrated that about 14% of patients due for colonoscopy could have their interval extended.6,7 The current study enhances those insights by separating the contribution of 2020 USMSTF polyp surveillance guidelines from the contribution of harmonizing surveillance intervals with guidelines for other polyp histologies. This study found that there is an opportunity to improve endoscopic capacity by harmonizing recommendations with guidelines. This complements a 2023 study showing that even when knowledgeable about guidelines, clinicians do not necessarily follow recommendations.8 While this and previous research have identified that 11% to 14% of patients are eligible for extension, these individuals would also have to be willing to have their polyp surveillance intervals extended for there to be a real-world impact on endoscopic capacity. A 2024 study found that only 19% to 37% of patients with 1 to 2 small tubular adenomas were willing to have polyps surveillance interval extension.9 This suggests the actual effect on capacity may be even lower than reported.
Limitations
The overall impact of the 2020 USMSTF polyp surveillance guidelines on endoscopic capacity was blunted by the high prevalence of incomplete index colonoscopy records among the study population. Without data on bowel preparation quality or procedure indications, this study could not assess whether 43% of patients were eligible for surveillance interval extension. Most index colonoscopies with incomplete documentation were completed at community-care gastroenterology facilities. This high rate of incomplete documentation is likely generalizable to other VA health care systems—especially in the era of the Veterans Access, Choice, and Accountability Act of 2014, which increased veteran access to non-VA community care.10 Veterans due for colon polyp surveillance colonoscopies are more likely to have had their prior colonoscopy in community care compared with prior eras.11 Furthermore, because the VHA is among the most established integrated health care systems offering primary and subspecialty care in the US, private sector health care systems may have even greater rates of care fragmentation for longitudinal CRC screening and colon polyp surveillance, as these systems have only begun to regionally integrate recently.12,13
Another limitation is that nearly one-third of the individuals with documentation had inadequate bowel preparation for surveillance recommendations. This results in shorter surveillance follow-up colonoscopies and increases downstream demand for future colonoscopies. The low yield of extending colon polyp surveillance interval in this study emphasizes that improved efforts to obtain colonoscopy and pathology reports from community care, right-sizing the colon polyp surveillance intervals recommended by endoscopists, and improving quality of bowel preparation could have downstream health care system benefits in the future. These efforts could increase colonoscopy capacity at VA health care systems, thereby shortening colonoscopy wait times, decreasing fragmentation of care, and increasing the number of veterans who receive high-quality colonoscopies at VA health care systems.14
Conclusions
Eleven percent of patients in this study due for a colonoscopy could extend their follow-up by ≥ 1 year. About half of these extensions were directly due to the 2020 USMSTF polyp surveillance interval extension for 1 to 2 subcentimeter tubular adenomas. The rest resulted from harmonizing recommendations with guidelines at the time of the procedure. To determine whether retroactively applying polyp surveillance guidelines to follow-up interval recommendations will result in improved endoscopic capacity, health care system administrators should consider the degree of CRC screening care fragmentation in their patient population. Greater long-term gains in endoscopic capacity may be achieved by proactively supporting endoscopists in making guideline-concordant screening recommendations at the time of colonoscopy.
Gupta S, Lieberman D, Anderson JC, et al. Recommendations for follow-up after colonoscopy and polypectomy: a consensus update by the US Multi-Society Task Force on Colorectal Cancer. Gastrointest Endosc. 2020;91:463-485. doi:10.1016/j.gie.2020.01.014
Dubé C, Yakubu M, McCurdy BR, et al. Risk of advanced adenoma, colorectal cancer, and colorectal cancer mortality in people with low-risk adenomas at baseline colonoscopy: a systematic review and meta-analysis. Am J Gastroenterol. 2017;112:1790-1801. doi:10.1038/ajg.2017.360
Click B, Pinsky PF, Hickey T, Doroudi M, Shoen RE. Association of colonoscopy adenoma findings with long-term colorectal cancer incidence. JAMA. 2018;319:2021-2031. doi:10.1001/jama.2018.5809
US Preventive Services Task Force, Davidson KW, Barry MJ, et al. Screening for colorectal cancer: US Preventive Services Task Force recommendation statement. JAMA. 2021;325:1965-1977. doi:10.1001/jama.2021.6238
Djinbachian R, Dubé AJ, Durand M, et al. Adherence to post-polypectomy surveillance guidelines: a systematic review and meta-analysis. Endoscopy. 2019;51:673-683. doi:10.1055/a-0865-2082
Gawron AJ, Kaltenbach T, Dominitz JA. The impact of the coronavirus disease-19 pandemic on access to endoscopy procedures in the VA healthcare system. Gastroenterology. 2020;159:1216-1220.e1. doi:10.1053/j.gastro.2020.07.033
Xiao AH, Chang SY, Stevoff CG, Komanduri S, Pandolfino JE, Keswani RN. Adoption of multi-society guidelines facilitates value-based reduction in screening and surveillance colonoscopy volume during COVID-19 pandemic. Dig Dis Sci. 2021;66:2578-2584. doi:10.1007/s10620-020-06539-1
Dong J, Wang LF, Ardolino E, Feuerstein JD. Real-world compliance with the 2020 U.S. Multi-Society Task Force on Colorectal Cancer polypectomy surveillance guidelines: an observational study. Gastrointest Endosc. 2023;97:350-356.e3. doi:10.1016/j.gie.2022.08.020
Lee JK, Koripella PC, Jensen CD, et al. Randomized trial of patient outreach approaches to de-implement outdated colonoscopy surveillance intervals. Clin Gastroenterol Hepatol. 2024;22:1315-1322.e7. doi:10.1016/j.cgh.2023.12.027
Veterans Access, Choice, and Accountability Act of 2014, HR 3230, 113th Cong (2014). Accessed September 8, 2025. https://www.congress.gov/bill/113th-congress/house-bill/3230
Dueker JM, Khalid A. Performance of the Veterans Choice Program for improving access to colonoscopy at a tertiary VA facility. Fed Pract. 2020;37:224-228.
Oliver A. The Veterans Health Administration: an American success story? Milbank Q. 2007;85:5-35. doi:10.1111/j.1468-0009.2007.00475.x
Furukawa MF, Machta RM, Barrett KA, et al. Landscape of health systems in the United States. Med Care Res Rev. 2020;77:357-366. doi:10.1177/1077558718823130
Petros V, Tsambikos E, Madhoun M, Tierney WM. Impact of community referral on colonoscopy quality metrics in a Veterans Affairs Medical Center. Clin Transl Gastroenterol. 2022;13:e00460. doi:10.14309/ctg.0000000000000460
In 2020, the US Multi-Society Task Force (USMSTF) on Colorectal Cancer (CRC) increased the recommended colon polyp surveillance interval for 1 to 2 subcentimeter tubular adenomas from 5 to 10 years to 7 to 10 years.1 This change was prompted by emerging research indicating that rates of CRC and advanced neoplasia among patients with a history of only 1 to 2 subcentimeter tubular adenomas are lower than initially estimated.2,3 This extension provides an opportunity to increase endoscopy capacity and improve access to colonoscopies by retroactively applying the 2020 guidelines to surveillance interval recommendations made before their introduction. For example, based on the updated guidelines, patients previously recommended to undergo colon polyp surveillance colonoscopy 5 years after an index colonoscopy could extend their surveillance interval by 2 to 5 years. Increasing endoscopic capacity could address the growing demand for colonoscopies from new screening guidelines that reduced the age of initial CRC screening from 50 years to 45 years and the backlog of procedures due to COVID-19 restrictions.4
As part of a project to increase endoscopic capacity at the US Department of Veterans Affairs (VA) Pittsburgh Healthcare System (VAPHS), this study assessed the potential impact of retroactively applying the 2020 USMSTF polyp surveillance guidelines on endoscopic capacity. These results may be informative for other VA and private-sector health care systems seeking to identify strategies to improve endoscopy capacity.
Methods
VAPHS is an integrated health care system in the Veterans Health Administration (VHA) serving 85,000 patients across 8 health care institutions in Pennsylvania, Ohio, and West Virginia. VAPHS manages colorectal screening recommendations for patients receiving medical care in the health care system regardless of whether their prior colonoscopy was performed at VAPHS or external facilities. The VA maintains a national CRC screening and surveillance electronic medical record reminder that prompts health care practitioners to order colon polyp surveillance based on interval recommendations from the index colonoscopy. This study reviewed all patients from the VAPHS panel with a reminder to undergo colonoscopy for screening for CRC or surveillance of colon polyps within 12 months from September 1, 2022.
Among patients with a reminder, 3 investigators reviewed index colonoscopy and pathology reports to identify CRC risk category, colonoscopy indication, procedural quality, and recommended repeat colonoscopy interval. Per the USMSTF guidelines, patients with incomplete colonoscopy or pathology records, high-risk indications (ie, personal history of inflammatory bowel disease, personal history of CRC, or family history of CRC), or inadequate bowel preparation (Boston Bowel Preparation Score < 6) were excluded. Additionally, patients who had CRC screening or surveillance discontinued due to age or comorbidities, had completed a subsequent follow-up colonoscopy, or were deceased at the time of review were excluded.
Retroactive Interval Reclassification
Among eligible patients, this study compared the repeat colonoscopy interval recommended by the prior endoscopist with those from the 2020 USMSTF guidelines. In cases where the interval was documented as a range of years, the lower end was considered the recommendation. Similarly, the lower end of the range from the 2020 USMSTF guidelines was used for the reclassified surveillance interval. Years extended per patient were quantified relative to September 1, 2023 (ie, 1 year after the review date). For example, if the index colonoscopy was completed on September 1, 2016, the initial surveillance recommendation was 5 years, and the reclassified recommendation was 7 years, the interval extension beyond September 1, 2023, was 0 years.
Furthermore, because index surveillance recommendations are not always guideline concordant, the years extended per patient were calculated by harmonizing the index endoscopist’s recommendations with the guidelines at the time of the index colonoscopy.5 For example, if the index colonoscopy was completed on September 1, 2018, and the endoscopist recommended a 5-year follow-up for a patient with average risk for CRC, adequate bowel preparation, and no colorectal polyps, that patient is eligible to extend their colonoscopy to September 1, 2028, based on guideline recommendations at the time of index endoscopy recommending that the next colonoscopy occur in 10 years. In this analysis the 2012 USMSTF guidelines were applied to all index colonoscopies completed in 2021 or earlier to allow time for adoption of the 2020 guidelines.
This project fulfilled a facility mandate to increase capacity to conduct endoscopic procedures. Institutional review board approval was not required by VAPHS policy relating to clinical operations projects. Approval for publication of clinical operations activity was obtained from the VAPHS facility director.
Results
Within 1 year of the September 1, 2022, review date, 637 patients receiving care at VAPHS had clinical reminders for an upcoming colonoscopy. Of these, 54 (8.4%) were already up to date or were deceased at the time of review. Of the 583 eligible patients, 96% were male, the median age was 74 years, the median index colonoscopy year was 2016, and 178 (30.5%) had an average-risk CRC screening indication at the index colonoscopy (Table).
Of the 583 patients due for colonoscopy, 331 (56.7%) had both colonoscopy and pathology reports available. The majority of those with incomplete records had the index colonoscopy completed outside VAPHS. Among these patients, 222 (67.0%) had adequate bowel preparation. Of those with adequate bowel preparation, 43 were not eligible for interval extension because of high-risk conditions and 13 were not eligible because there was no index surveillance interval recommendation from the index endoscopist. Of the patients due for colonoscopy, 166 (28.4%) were potentially eligible for surveillance interval extension (Figure).
Sixty-five (39.2%) of the 166 patients had 1 to 2 subcentimeter tubular adenomas on their index colonoscopy. Sixty-two patients were eligible for interval extension to 7 years, but this only resulted in ≥ 1 year of extension beyond the review date for 36 (6% of all 583 patients due for colonoscopy). The 36 patients were extended 63 years. By harmonizing the index endoscopists’ surveillance interval recommendation with the guideline at the time of the index colonoscopy, 29 additional patients could have their colonoscopy extended by ≥ 1 year. Harmonization extended colonoscopy intervals by 93 years. Retroactively applying the 2020 USMSTF polyp surveillance guidelines and harmonizing recommendations to guidelines extended the time of index colonoscopy by 153 years.
Discussion
With retroactive application of the 2020 USMSTF polyp surveillance guidelines, 6% of patients due for an upcoming colonoscopy could extend their follow-up by ≥ 1 year by extending the surveillance interval for 1 to 2 subcentimeter tubular adenomas to 7 years. An additional 5% of patients could extend their interval by harmonizing the index endoscopist’s interval recommendation with polyp surveillance guidelines at the time of the index colonoscopy. These findings are consistent with the results of 2 studies that demonstrated that about 14% of patients due for colonoscopy could have their interval extended.6,7 The current study enhances those insights by separating the contribution of 2020 USMSTF polyp surveillance guidelines from the contribution of harmonizing surveillance intervals with guidelines for other polyp histologies. This study found that there is an opportunity to improve endoscopic capacity by harmonizing recommendations with guidelines. This complements a 2023 study showing that even when knowledgeable about guidelines, clinicians do not necessarily follow recommendations.8 While this and previous research have identified that 11% to 14% of patients are eligible for extension, these individuals would also have to be willing to have their polyp surveillance intervals extended for there to be a real-world impact on endoscopic capacity. A 2024 study found that only 19% to 37% of patients with 1 to 2 small tubular adenomas were willing to have polyps surveillance interval extension.9 This suggests the actual effect on capacity may be even lower than reported.
Limitations
The overall impact of the 2020 USMSTF polyp surveillance guidelines on endoscopic capacity was blunted by the high prevalence of incomplete index colonoscopy records among the study population. Without data on bowel preparation quality or procedure indications, this study could not assess whether 43% of patients were eligible for surveillance interval extension. Most index colonoscopies with incomplete documentation were completed at community-care gastroenterology facilities. This high rate of incomplete documentation is likely generalizable to other VA health care systems—especially in the era of the Veterans Access, Choice, and Accountability Act of 2014, which increased veteran access to non-VA community care.10 Veterans due for colon polyp surveillance colonoscopies are more likely to have had their prior colonoscopy in community care compared with prior eras.11 Furthermore, because the VHA is among the most established integrated health care systems offering primary and subspecialty care in the US, private sector health care systems may have even greater rates of care fragmentation for longitudinal CRC screening and colon polyp surveillance, as these systems have only begun to regionally integrate recently.12,13
Another limitation is that nearly one-third of the individuals with documentation had inadequate bowel preparation for surveillance recommendations. This results in shorter surveillance follow-up colonoscopies and increases downstream demand for future colonoscopies. The low yield of extending colon polyp surveillance interval in this study emphasizes that improved efforts to obtain colonoscopy and pathology reports from community care, right-sizing the colon polyp surveillance intervals recommended by endoscopists, and improving quality of bowel preparation could have downstream health care system benefits in the future. These efforts could increase colonoscopy capacity at VA health care systems, thereby shortening colonoscopy wait times, decreasing fragmentation of care, and increasing the number of veterans who receive high-quality colonoscopies at VA health care systems.14
Conclusions
Eleven percent of patients in this study due for a colonoscopy could extend their follow-up by ≥ 1 year. About half of these extensions were directly due to the 2020 USMSTF polyp surveillance interval extension for 1 to 2 subcentimeter tubular adenomas. The rest resulted from harmonizing recommendations with guidelines at the time of the procedure. To determine whether retroactively applying polyp surveillance guidelines to follow-up interval recommendations will result in improved endoscopic capacity, health care system administrators should consider the degree of CRC screening care fragmentation in their patient population. Greater long-term gains in endoscopic capacity may be achieved by proactively supporting endoscopists in making guideline-concordant screening recommendations at the time of colonoscopy.
Gupta S, Lieberman D, Anderson JC, et al. Recommendations for follow-up after colonoscopy and polypectomy: a consensus update by the US Multi-Society Task Force on Colorectal Cancer. Gastrointest Endosc. 2020;91:463-485. doi:10.1016/j.gie.2020.01.014
Dubé C, Yakubu M, McCurdy BR, et al. Risk of advanced adenoma, colorectal cancer, and colorectal cancer mortality in people with low-risk adenomas at baseline colonoscopy: a systematic review and meta-analysis. Am J Gastroenterol. 2017;112:1790-1801. doi:10.1038/ajg.2017.360
Click B, Pinsky PF, Hickey T, Doroudi M, Shoen RE. Association of colonoscopy adenoma findings with long-term colorectal cancer incidence. JAMA. 2018;319:2021-2031. doi:10.1001/jama.2018.5809
US Preventive Services Task Force, Davidson KW, Barry MJ, et al. Screening for colorectal cancer: US Preventive Services Task Force recommendation statement. JAMA. 2021;325:1965-1977. doi:10.1001/jama.2021.6238
Djinbachian R, Dubé AJ, Durand M, et al. Adherence to post-polypectomy surveillance guidelines: a systematic review and meta-analysis. Endoscopy. 2019;51:673-683. doi:10.1055/a-0865-2082
Gawron AJ, Kaltenbach T, Dominitz JA. The impact of the coronavirus disease-19 pandemic on access to endoscopy procedures in the VA healthcare system. Gastroenterology. 2020;159:1216-1220.e1. doi:10.1053/j.gastro.2020.07.033
Xiao AH, Chang SY, Stevoff CG, Komanduri S, Pandolfino JE, Keswani RN. Adoption of multi-society guidelines facilitates value-based reduction in screening and surveillance colonoscopy volume during COVID-19 pandemic. Dig Dis Sci. 2021;66:2578-2584. doi:10.1007/s10620-020-06539-1
Dong J, Wang LF, Ardolino E, Feuerstein JD. Real-world compliance with the 2020 U.S. Multi-Society Task Force on Colorectal Cancer polypectomy surveillance guidelines: an observational study. Gastrointest Endosc. 2023;97:350-356.e3. doi:10.1016/j.gie.2022.08.020
Lee JK, Koripella PC, Jensen CD, et al. Randomized trial of patient outreach approaches to de-implement outdated colonoscopy surveillance intervals. Clin Gastroenterol Hepatol. 2024;22:1315-1322.e7. doi:10.1016/j.cgh.2023.12.027
Veterans Access, Choice, and Accountability Act of 2014, HR 3230, 113th Cong (2014). Accessed September 8, 2025. https://www.congress.gov/bill/113th-congress/house-bill/3230
Dueker JM, Khalid A. Performance of the Veterans Choice Program for improving access to colonoscopy at a tertiary VA facility. Fed Pract. 2020;37:224-228.
Oliver A. The Veterans Health Administration: an American success story? Milbank Q. 2007;85:5-35. doi:10.1111/j.1468-0009.2007.00475.x
Furukawa MF, Machta RM, Barrett KA, et al. Landscape of health systems in the United States. Med Care Res Rev. 2020;77:357-366. doi:10.1177/1077558718823130
Petros V, Tsambikos E, Madhoun M, Tierney WM. Impact of community referral on colonoscopy quality metrics in a Veterans Affairs Medical Center. Clin Transl Gastroenterol. 2022;13:e00460. doi:10.14309/ctg.0000000000000460
Impact of Retroactive Application of Updated Surveillance Guidelines on Endoscopy Center Capacity at a Large VA Health Care System
Impact of Retroactive Application of Updated Surveillance Guidelines on Endoscopy Center Capacity at a Large VA Health Care System