User login
Long-Term Surgical Management of Severe Pelvic Injury and Resulting Neurogenic Bladder From an Improvised Explosive Device
More than 52,000 soldiers have been injured and 6,800 have been killed during the wars in Iraq and Afghanistan.1 Blast injuries from improvised explosive devices (IEDs) account for 70% to 79% of combat-related injuries and deaths in these wars.2 Advances in personal body armor, rapid and advanced surgical treatment, and the changing nature of combat in Iraq and Afghanistan have changed injury patterns and survival compared with prior military conflicts such as those in Vietnam and Korea.3
The most common combat-related injuries in the recent wars are extremity, facial, brain, and gastrointestinal injuries. Pelvic and genitourinary injuries are also common, accounting for about 8% of total injuries.2 Pelvic and genitourinary injury can cause long-term disability from nerve injury (neurogenic bladder, neurogenic bowel, sexual dysfunction, urethral injury), as well as general loss of genital structures from blast injuries.
The usual care for bladder dysfunction from pelvic or genitourinary injury ranges from the use of chronic indwelling catheters to reconstructive surgery. However, there is no standard of care for long-term treatment of patients with pelvic or genitourinary injury who experience bladder dysfunction. Reconstructive surgery has the potential to improve quality of life (QOL) and eliminate chronic indwelling catheters, which are prone to cause infection and long-term kidney problems in patients with bladder dysfunction from traumatic injury.
This case report evaluates the efficacy of reconstructive surgery for bladder dysfunction to improve independence and QOL and decrease complications associated with chronic indwelling urinary catheters. The authors hope to raise awareness regarding this option for patients with pelvic, spinal cord, or genitourinary injury who are young and face long-term disability from their injuries.
Case Presentation
A 22-year-old man presented to the George E. Wahlen VAMC Urology Clinic in Salt Lake City, Utah with a complicated history related to combat injuries. During combat operations 3 years earlier, he was injured by an IED blast while on foot patrol. His injuries included bilateral severe extremity injury, perineal and genital blast wounds, a bladder injury, pelvic fracture, colorectal injury, and extensive soft tissue loss. He underwent multiple abdominal explorations, left leg amputation below the knee, multiple skin grafts, soft tissue debridements, left-side orchiectomy, bladder repair, and diverting colostomy. He survived the injuries and was eventually discharged from active military service and returned home.
Upon presentation to the VAMC, the patient had a diverting colostomy, suprapubic bladder catheter, and bladder and bowel function consistent with cauda equina syndrome (pelvic nerve injury). Given the lack of rectal tone, fecal incontinence was likely with colostomy reversal. His bladder had low volume and poor compliance (elasticity). In addition, the patient had no volitional control of urination or defecation.
The patient previously performed intermittent self-catheterization but experienced total urinary incontinence (UI) between catheterizations, due to his bladder dynamics and a lack of urinary sphincter tone. A suprapubic bladder catheter was previously placed to control UI. However, the patient remained incontinent, and urinary leakage, need for diapers, and urinary tract infections (UTIs) negatively impacted QOL. The patient ambulated well and was physically active. His priority was to reduce incontinence and improve QOL.
Catheterizable Ileal Cecocystoplasty
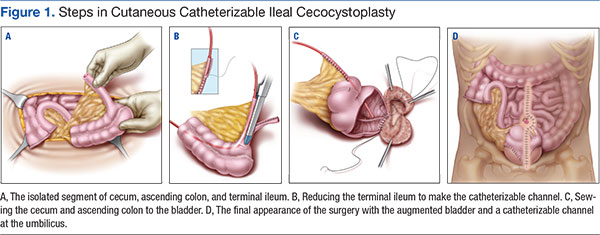
The patient underwent cutaneous catheterizable ileal cecocystoplasty (CCIC) (Figure 1). In this surgery, a segment of the cecum and ascending colon with attached terminal ileum is used to increase the size of the bladder (augmentation cystoplasty) and create a channel for catheterization from the umbilicus. The cecum and colon are detubularized, and a large rectangular plate of large bowel is formed, which is then sewn to the bladder, expanding its volume. About 10 to 15 cm of the terminal ileum is tapered to the diameter of a pencil and brought through the base of the umbilicus, creating a small stoma for intermittent bladder catheterization. The ileocecal valve is tightened and serves as a continence mechanism to prevent urinary leakage through the small stoma in the umbilicus.4
A perineal urethral mesh sling was placed at the time of the patient’s surgery to bolster the deinnervated urinary sphincter and prevent urethral leakage. The goal of reconstructive surgery for this patient was to create a small bowel channel connecting the umbilicus and bladder that could be catheterized every 4 to 6 hours, increase bladder capacity, and increase sphincteric resistance to reduce urethral leakage through the penis. Because there can be damage from passing a catheter through mesh slings and the urethra over time, including stenosis or erosion of the sling, an alternative catheterizable channel was needed in this patient.
The patient recovered after the surgery and was able to self-catheterize without difficulty. However, the urethral mesh sling did not place enough pressure on the urethra to prevent leakage, and he had persistent incontinence from the penis. Three months after the original surgery the patient had exploration of the perineum, which revealed that the mesh sling was loose and exerting inadequate pressure on the urethra. It was likely the sling slipped postoperatively—a known complication of urethral slings. An artificial urinary sphincter (AUS) was placed around the urethra during the second surgery to address the patient’s UI. 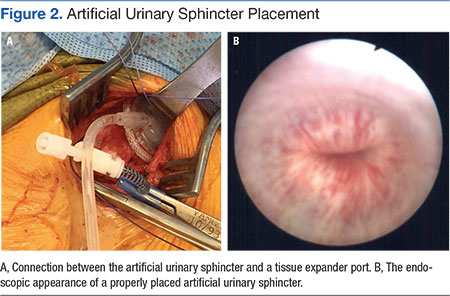
More than 1 year after the original surgery, the patient self-catheterizes about 4 to 5 times daily via the catheterizable channel using a single-use catheter. His bladder holds at least 500 mL. The patient does not have significant leakage from the channel or the penis. He is no longer dependent on a chronic indwelling catheter and is free of the problems associated with severe UI, including foul odor, UTIs, and social isolation.
Discussion
Patients with spinal cord or pelvic nerve injury often develop spastic bladders with low capacities. This is similar to muscle spasticity that may occur with a neurologic injury, below the level of the injury, such as in the lower extremities. The powerful uncontrolled bladder spasms and small bladder capacity most often lead to incontinence. Additionally, neurologic control of the urinary sphincter is affected, leading to either uncontrolled spasms or poor tone. Patients with these injuries have no volitional control of bladder functions and are forced to catheterize intermittently, use a condom-type catheter, or have a chronic indwelling catheter (a Foley catheter or suprapubic catheter).
Intermittent catheterization is the preferred management option for neurogenic bladder. When compared with chronic indwelling catheters, intermittent catheterization is associated with lower rates of UTI and upper tract abnormalities and with the loss of renal function.5 Unfortunately, patients do not often stay on intermittent catheterization. A recent study showed that up to 70% of patients with spinal cord injuries who used clean intermittent catheterization when discharged from acute rehabilitation discontinue use and are subsequently managed by chronic indwelling catheters.6 Although the reasons why intermittent catheterization is discontinued are unclear, patient dissatisfaction with catheterization, anatomic problems, such as urethral scarring, or continued leakage despite medical treatments, such as anticholinergic medicines, may be factors.
Uncontrolled leakage and UI significantly impacts QOL and may cause patients to choose chronic indwelling catheters over intermittent catheterization. Several treatments are available to control incontinence associated with intermittent catheterization. Anticholinergic medications and more recently onabotulinum toxin A may help improve bladder spasticity. In 2011, the FDA approved onabotulinum toxin A for transurethral bladder injections. It has been shown to increase functional bladder capacity and decrease spasticity.7,8 Onabotulinum toxin A treatment will not enlarge a small, contracted bladder.
Onabotulinum toxin A treatment would not be ideal for the patient in this case study. His absolute bladder capacity was 200 mL, and onabotulinum toxin A treatment would not significantly improve capacity or make intermittent catheterization practical. Additionally, the patient had poor urinary sphincter function, and he would continue to leak regardless of improvements in the bladder spasticity or tone.
Augmentation enterocystoplasty is surgical enlargement of the bladder, using a piece of the bowel and is indicated in patients with low bladder volumes. With this procedure the native bladder becomes defunctionalized, and patients experience a dramatic improvement in bladder volumes and a reduction in bladder spasms and leakage. The use of the colon and terminal ileum for bladder augmentation, or CCIC, was first reported by Sarosdy in 2 patients in 1992.9 In 1996, King and colleagues demonstrated successful outcomes with CCIC in a cohort of 8 patients after 34 months of follow-up.10 Seven patients successfully used clean intermittent catheterization, and 1 patient chose an indwelling catheter because of progressive upper extremity weakness. No patients experienced worsened renal function or pyelonephritis suggestive of upper urinary tract deterioration. A single patient had mild stomal stenosis, which was successfully revised under local anesthesia.
In another study, Sutton and colleagues reported at 27 months an improvement of 276 mL in bladder capacity, no metabolic complications, and a 95% continence rate in a cohort of 23 patients with neurogenic bladder who underwent CCIC.4 Sutton and colleagues later reported outcomes for 34 patients with a median of 31 months follow-up.11 The most common complications were recurrent UTIs (12%) and stomal stenosis (12%). Only 3 patients (9%) required surgical revisions for stomal stenosis.
Altered bowel function and metabolic abnormalities are a concern after bowel resection and reconstruction. However, a study has found no subjective change in bowel function following ileal resection of up to 60 cm for urinary diversion for bladder malignancy.12 Rates of hyperchloremic hypokalemic metabolic acidosis are low, and most changes in electrolytes are subclinical.13,14 Long-term vitamin B12 deficiency is seen with larger (> 50 cm) ileal resections but is rare with CCIC, given the small segment used for reconstruction.15 Overall, CCIC is shown to have excellent surgical outcomes in carefully selected patients with neurogenic bladder.
In addition to low bladder capacity, the case study patient also had intrinsic sphincteric deficiency (very low urinary sphincter tone), which is common with pelvic nerve injury but unusual with spinal cord injury. He initially received a suburethral mesh sling that supported and compressed the urethra and buttressed the natural urinary sphincter. However, patients can develop catheterization issues with a suburethral sling due to mechanical compression of the urethra and traversing the compressed area with a urinary catheter. Given the indication for augmentation cystoplasty in this patient, he additionally elected to undergo catheterization channel creation to avoid long-term issues of urethral catheterization through the urethra compressed by the sling.
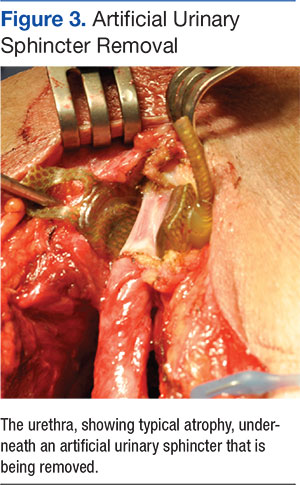
Unfortunately, this patient had postoperative issues with his suburethral sling, and a modified AUS was inserted rather than a second sling. Normally, an AUS is attached to a pump mechanism in the scrotum. The pump allows the patient to cycle fluid from the sphincter cuff to a reservoir in the abdomen, removing compression on the urethra and allowing normal urination. Because this patient could not effectively urinate from the penis, the authors wanted to obstruct the urethra to prevent leakage without closing it permanently. The AUS was connected to a tissue expander port placed subcutaneously in the lower abdomen rather than to a pump mechanism. This modified approach used fewer mechanical parts compared with the pump mechanism, possibly reducing rates of mechanical failure. Additionally, a lower cuff pressure could be used to obstruct the urethra and prevent leakage, reducing the likelihood of urethral atrophy. Fewer mechanical parts and a lower cuff pressure could theoretically improve longevity of the AUS (Figure 3). This modified method of AUS placement has been described in patients with sphincteric deficiency and spinal cord injury.16
These 2 reconstructive surgeries freed the patient from indwelling catheter dependence and significantly improved his incontinence and QOL. Many patients with spinal cord injury or pelvic injury could benefit from similar reconstructive surgeries if conservative measures such as anticholinergic medications or onabotulinum toxin A treatments do not control incontinence.
Conclusion
Blast injuries in soldiers often cause pelvic and genitourinary injuries. These injuries can lead to chronic urinary problems and profound social and physical disability. These young veterans need innovative, individualized approaches to best manage their long-term urinary issues. Reconstructive surgery may improve QOL and decrease disability from bladder dysfunction for carefully selected patients. Clinicians caring for veterans with pelvic and genitourinary injury should strive to create a system where these options are available when they are appropriate.
1. U.S. Department of Defense. U.S. Casualty Status. U.S. Department of Defense Website. http://www.defense.gov/casualty.pdf. Updated November 3, 2015. Accessed November 4, 2015.
2. Schoenfeld AJ, Dunn JC, Bader JO, Belmont PJ Jr. The nature and extent of war injuries sustained by combat specialty personnel killed and wounded in Afghanistan and Iraq, 2003-2011. J Trauma Acute Care Surg. 2013;75(2):287-291.
3. Pannell D, Brisebois R, Talbot M, et al. Causes of death in Canadian Forces members deployed to Afghanistan and implications on tactical combat casualty care provision. J Trauma. 2011;71(5)(suppl 1):S401-S407.
4. Sutton MA, Hinson JL, Nickell KG, Boone TB. Continent ileocecal augmentation cystoplasty. Spinal Cord. 1998;36(4):246-251.
5. Weld KJ, Wall BM, Mangold TA, Steere EL, Dmochowski RR. Influences on renal function in chronic spinal cord injured patients. J Urol. 2000;164(5):1490-1493.
6. Cameron AP, Wallner LP, Tate DG, Sarma AV, Rodriguez GM, Clemens JQ. Bladder management after spinal cord injury in the United States 1972 to 2005. J Urol. 2010;184(1):213-217.
7. Cruz F, Herschorn S, Aliotta P, et al. Efficacy and safety of onabotulinumtoxinA in patients with urinary incontinence due to neurogenic detrusor overactivity: a randomised, double-blind, placebo-controlled trial. Eur Urol. 2011;60(4):742-750.
8. Ginsberg D, Gousse A, Keppenne V, et al. Phase 3 efficacy and tolerability study of onabotulinumtoxinA for urinary incontinence from neurogenic detrusor overactivity. J Urol. 2012;187(6):2131-2139.
9. Sarosdy MF. Continent urinary diversion using cutaneous ileocecocystoplasty. Urology. 1992;40(2):102-106.
10. King DH, Hlavinka TC, Sarosdy MF. Additional experience with continent urinary diversion using cutaneous ileocecocystoplasty. Urology. 1996;47(4):471-475.
11. Khavari R, Fletcher SG, Liu J, Boone TB. A modification to augmentation cystoplasty with catheterizable stoma for neurogenic patients: technique and long-term results. Urology. 2012;80(2):460-464.
12. Fung B, Kessler TM, Haeni K, Burkhard FC, Studer UE. Bowel function remains subjectively unchanged after ileal resection for construction of continent ileal reservoirs. Eur Urol. 2011;60(3):585-590.
13. Adams RC, Vachha B, Samuelson ML, Keefover-Hicks A, Snodgrass WT. Incidence of new onset metabolic acidosis following enteroplasty for myelomeningocele. J Urol. 2010;183(1):302-305.
14. Hensle TW, Gilbert SM. A review of metabolic consequences and long-term complications of enterocystoplasty in children. Curr Urol Rep. 2007;8(2):157-162.
15. Pannek J, Haupt G, Schulze H, Senge T. Influence of continent ileal urinary diversion on vitamin B12 absorption. J Urol. 1996;155(4):1206-1208.
16. Bersch U, Göcking K, Pannek J. The artificial urinary sphincter in patients with spinal cord lesion: description of a modified technique and clinical results. Eur Urol. 2009;55(3):687-693.
More than 52,000 soldiers have been injured and 6,800 have been killed during the wars in Iraq and Afghanistan.1 Blast injuries from improvised explosive devices (IEDs) account for 70% to 79% of combat-related injuries and deaths in these wars.2 Advances in personal body armor, rapid and advanced surgical treatment, and the changing nature of combat in Iraq and Afghanistan have changed injury patterns and survival compared with prior military conflicts such as those in Vietnam and Korea.3
The most common combat-related injuries in the recent wars are extremity, facial, brain, and gastrointestinal injuries. Pelvic and genitourinary injuries are also common, accounting for about 8% of total injuries.2 Pelvic and genitourinary injury can cause long-term disability from nerve injury (neurogenic bladder, neurogenic bowel, sexual dysfunction, urethral injury), as well as general loss of genital structures from blast injuries.
The usual care for bladder dysfunction from pelvic or genitourinary injury ranges from the use of chronic indwelling catheters to reconstructive surgery. However, there is no standard of care for long-term treatment of patients with pelvic or genitourinary injury who experience bladder dysfunction. Reconstructive surgery has the potential to improve quality of life (QOL) and eliminate chronic indwelling catheters, which are prone to cause infection and long-term kidney problems in patients with bladder dysfunction from traumatic injury.
This case report evaluates the efficacy of reconstructive surgery for bladder dysfunction to improve independence and QOL and decrease complications associated with chronic indwelling urinary catheters. The authors hope to raise awareness regarding this option for patients with pelvic, spinal cord, or genitourinary injury who are young and face long-term disability from their injuries.
Case Presentation
A 22-year-old man presented to the George E. Wahlen VAMC Urology Clinic in Salt Lake City, Utah with a complicated history related to combat injuries. During combat operations 3 years earlier, he was injured by an IED blast while on foot patrol. His injuries included bilateral severe extremity injury, perineal and genital blast wounds, a bladder injury, pelvic fracture, colorectal injury, and extensive soft tissue loss. He underwent multiple abdominal explorations, left leg amputation below the knee, multiple skin grafts, soft tissue debridements, left-side orchiectomy, bladder repair, and diverting colostomy. He survived the injuries and was eventually discharged from active military service and returned home.
Upon presentation to the VAMC, the patient had a diverting colostomy, suprapubic bladder catheter, and bladder and bowel function consistent with cauda equina syndrome (pelvic nerve injury). Given the lack of rectal tone, fecal incontinence was likely with colostomy reversal. His bladder had low volume and poor compliance (elasticity). In addition, the patient had no volitional control of urination or defecation.
The patient previously performed intermittent self-catheterization but experienced total urinary incontinence (UI) between catheterizations, due to his bladder dynamics and a lack of urinary sphincter tone. A suprapubic bladder catheter was previously placed to control UI. However, the patient remained incontinent, and urinary leakage, need for diapers, and urinary tract infections (UTIs) negatively impacted QOL. The patient ambulated well and was physically active. His priority was to reduce incontinence and improve QOL.
Catheterizable Ileal Cecocystoplasty
The patient underwent cutaneous catheterizable ileal cecocystoplasty (CCIC) (Figure 1). In this surgery, a segment of the cecum and ascending colon with attached terminal ileum is used to increase the size of the bladder (augmentation cystoplasty) and create a channel for catheterization from the umbilicus. The cecum and colon are detubularized, and a large rectangular plate of large bowel is formed, which is then sewn to the bladder, expanding its volume. About 10 to 15 cm of the terminal ileum is tapered to the diameter of a pencil and brought through the base of the umbilicus, creating a small stoma for intermittent bladder catheterization. The ileocecal valve is tightened and serves as a continence mechanism to prevent urinary leakage through the small stoma in the umbilicus.4
A perineal urethral mesh sling was placed at the time of the patient’s surgery to bolster the deinnervated urinary sphincter and prevent urethral leakage. The goal of reconstructive surgery for this patient was to create a small bowel channel connecting the umbilicus and bladder that could be catheterized every 4 to 6 hours, increase bladder capacity, and increase sphincteric resistance to reduce urethral leakage through the penis. Because there can be damage from passing a catheter through mesh slings and the urethra over time, including stenosis or erosion of the sling, an alternative catheterizable channel was needed in this patient.
The patient recovered after the surgery and was able to self-catheterize without difficulty. However, the urethral mesh sling did not place enough pressure on the urethra to prevent leakage, and he had persistent incontinence from the penis. Three months after the original surgery the patient had exploration of the perineum, which revealed that the mesh sling was loose and exerting inadequate pressure on the urethra. It was likely the sling slipped postoperatively—a known complication of urethral slings. An artificial urinary sphincter (AUS) was placed around the urethra during the second surgery to address the patient’s UI.
More than 1 year after the original surgery, the patient self-catheterizes about 4 to 5 times daily via the catheterizable channel using a single-use catheter. His bladder holds at least 500 mL. The patient does not have significant leakage from the channel or the penis. He is no longer dependent on a chronic indwelling catheter and is free of the problems associated with severe UI, including foul odor, UTIs, and social isolation.
Discussion
Patients with spinal cord or pelvic nerve injury often develop spastic bladders with low capacities. This is similar to muscle spasticity that may occur with a neurologic injury, below the level of the injury, such as in the lower extremities. The powerful uncontrolled bladder spasms and small bladder capacity most often lead to incontinence. Additionally, neurologic control of the urinary sphincter is affected, leading to either uncontrolled spasms or poor tone. Patients with these injuries have no volitional control of bladder functions and are forced to catheterize intermittently, use a condom-type catheter, or have a chronic indwelling catheter (a Foley catheter or suprapubic catheter).
Intermittent catheterization is the preferred management option for neurogenic bladder. When compared with chronic indwelling catheters, intermittent catheterization is associated with lower rates of UTI and upper tract abnormalities and with the loss of renal function.5 Unfortunately, patients do not often stay on intermittent catheterization. A recent study showed that up to 70% of patients with spinal cord injuries who used clean intermittent catheterization when discharged from acute rehabilitation discontinue use and are subsequently managed by chronic indwelling catheters.6 Although the reasons why intermittent catheterization is discontinued are unclear, patient dissatisfaction with catheterization, anatomic problems, such as urethral scarring, or continued leakage despite medical treatments, such as anticholinergic medicines, may be factors.
Uncontrolled leakage and UI significantly impacts QOL and may cause patients to choose chronic indwelling catheters over intermittent catheterization. Several treatments are available to control incontinence associated with intermittent catheterization. Anticholinergic medications and more recently onabotulinum toxin A may help improve bladder spasticity. In 2011, the FDA approved onabotulinum toxin A for transurethral bladder injections. It has been shown to increase functional bladder capacity and decrease spasticity.7,8 Onabotulinum toxin A treatment will not enlarge a small, contracted bladder.
Onabotulinum toxin A treatment would not be ideal for the patient in this case study. His absolute bladder capacity was 200 mL, and onabotulinum toxin A treatment would not significantly improve capacity or make intermittent catheterization practical. Additionally, the patient had poor urinary sphincter function, and he would continue to leak regardless of improvements in the bladder spasticity or tone.
Augmentation enterocystoplasty is surgical enlargement of the bladder, using a piece of the bowel and is indicated in patients with low bladder volumes. With this procedure the native bladder becomes defunctionalized, and patients experience a dramatic improvement in bladder volumes and a reduction in bladder spasms and leakage. The use of the colon and terminal ileum for bladder augmentation, or CCIC, was first reported by Sarosdy in 2 patients in 1992.9 In 1996, King and colleagues demonstrated successful outcomes with CCIC in a cohort of 8 patients after 34 months of follow-up.10 Seven patients successfully used clean intermittent catheterization, and 1 patient chose an indwelling catheter because of progressive upper extremity weakness. No patients experienced worsened renal function or pyelonephritis suggestive of upper urinary tract deterioration. A single patient had mild stomal stenosis, which was successfully revised under local anesthesia.
In another study, Sutton and colleagues reported at 27 months an improvement of 276 mL in bladder capacity, no metabolic complications, and a 95% continence rate in a cohort of 23 patients with neurogenic bladder who underwent CCIC.4 Sutton and colleagues later reported outcomes for 34 patients with a median of 31 months follow-up.11 The most common complications were recurrent UTIs (12%) and stomal stenosis (12%). Only 3 patients (9%) required surgical revisions for stomal stenosis.
Altered bowel function and metabolic abnormalities are a concern after bowel resection and reconstruction. However, a study has found no subjective change in bowel function following ileal resection of up to 60 cm for urinary diversion for bladder malignancy.12 Rates of hyperchloremic hypokalemic metabolic acidosis are low, and most changes in electrolytes are subclinical.13,14 Long-term vitamin B12 deficiency is seen with larger (> 50 cm) ileal resections but is rare with CCIC, given the small segment used for reconstruction.15 Overall, CCIC is shown to have excellent surgical outcomes in carefully selected patients with neurogenic bladder.
In addition to low bladder capacity, the case study patient also had intrinsic sphincteric deficiency (very low urinary sphincter tone), which is common with pelvic nerve injury but unusual with spinal cord injury. He initially received a suburethral mesh sling that supported and compressed the urethra and buttressed the natural urinary sphincter. However, patients can develop catheterization issues with a suburethral sling due to mechanical compression of the urethra and traversing the compressed area with a urinary catheter. Given the indication for augmentation cystoplasty in this patient, he additionally elected to undergo catheterization channel creation to avoid long-term issues of urethral catheterization through the urethra compressed by the sling.
Unfortunately, this patient had postoperative issues with his suburethral sling, and a modified AUS was inserted rather than a second sling. Normally, an AUS is attached to a pump mechanism in the scrotum. The pump allows the patient to cycle fluid from the sphincter cuff to a reservoir in the abdomen, removing compression on the urethra and allowing normal urination. Because this patient could not effectively urinate from the penis, the authors wanted to obstruct the urethra to prevent leakage without closing it permanently. The AUS was connected to a tissue expander port placed subcutaneously in the lower abdomen rather than to a pump mechanism. This modified approach used fewer mechanical parts compared with the pump mechanism, possibly reducing rates of mechanical failure. Additionally, a lower cuff pressure could be used to obstruct the urethra and prevent leakage, reducing the likelihood of urethral atrophy. Fewer mechanical parts and a lower cuff pressure could theoretically improve longevity of the AUS (Figure 3). This modified method of AUS placement has been described in patients with sphincteric deficiency and spinal cord injury.16
These 2 reconstructive surgeries freed the patient from indwelling catheter dependence and significantly improved his incontinence and QOL. Many patients with spinal cord injury or pelvic injury could benefit from similar reconstructive surgeries if conservative measures such as anticholinergic medications or onabotulinum toxin A treatments do not control incontinence.
Conclusion
Blast injuries in soldiers often cause pelvic and genitourinary injuries. These injuries can lead to chronic urinary problems and profound social and physical disability. These young veterans need innovative, individualized approaches to best manage their long-term urinary issues. Reconstructive surgery may improve QOL and decrease disability from bladder dysfunction for carefully selected patients. Clinicians caring for veterans with pelvic and genitourinary injury should strive to create a system where these options are available when they are appropriate.
1. U.S. Department of Defense. U.S. Casualty Status. U.S. Department of Defense Website. http://www.defense.gov/casualty.pdf. Updated November 3, 2015. Accessed November 4, 2015.
2. Schoenfeld AJ, Dunn JC, Bader JO, Belmont PJ Jr. The nature and extent of war injuries sustained by combat specialty personnel killed and wounded in Afghanistan and Iraq, 2003-2011. J Trauma Acute Care Surg. 2013;75(2):287-291.
3. Pannell D, Brisebois R, Talbot M, et al. Causes of death in Canadian Forces members deployed to Afghanistan and implications on tactical combat casualty care provision. J Trauma. 2011;71(5)(suppl 1):S401-S407.
4. Sutton MA, Hinson JL, Nickell KG, Boone TB. Continent ileocecal augmentation cystoplasty. Spinal Cord. 1998;36(4):246-251.
5. Weld KJ, Wall BM, Mangold TA, Steere EL, Dmochowski RR. Influences on renal function in chronic spinal cord injured patients. J Urol. 2000;164(5):1490-1493.
6. Cameron AP, Wallner LP, Tate DG, Sarma AV, Rodriguez GM, Clemens JQ. Bladder management after spinal cord injury in the United States 1972 to 2005. J Urol. 2010;184(1):213-217.
7. Cruz F, Herschorn S, Aliotta P, et al. Efficacy and safety of onabotulinumtoxinA in patients with urinary incontinence due to neurogenic detrusor overactivity: a randomised, double-blind, placebo-controlled trial. Eur Urol. 2011;60(4):742-750.
8. Ginsberg D, Gousse A, Keppenne V, et al. Phase 3 efficacy and tolerability study of onabotulinumtoxinA for urinary incontinence from neurogenic detrusor overactivity. J Urol. 2012;187(6):2131-2139.
9. Sarosdy MF. Continent urinary diversion using cutaneous ileocecocystoplasty. Urology. 1992;40(2):102-106.
10. King DH, Hlavinka TC, Sarosdy MF. Additional experience with continent urinary diversion using cutaneous ileocecocystoplasty. Urology. 1996;47(4):471-475.
11. Khavari R, Fletcher SG, Liu J, Boone TB. A modification to augmentation cystoplasty with catheterizable stoma for neurogenic patients: technique and long-term results. Urology. 2012;80(2):460-464.
12. Fung B, Kessler TM, Haeni K, Burkhard FC, Studer UE. Bowel function remains subjectively unchanged after ileal resection for construction of continent ileal reservoirs. Eur Urol. 2011;60(3):585-590.
13. Adams RC, Vachha B, Samuelson ML, Keefover-Hicks A, Snodgrass WT. Incidence of new onset metabolic acidosis following enteroplasty for myelomeningocele. J Urol. 2010;183(1):302-305.
14. Hensle TW, Gilbert SM. A review of metabolic consequences and long-term complications of enterocystoplasty in children. Curr Urol Rep. 2007;8(2):157-162.
15. Pannek J, Haupt G, Schulze H, Senge T. Influence of continent ileal urinary diversion on vitamin B12 absorption. J Urol. 1996;155(4):1206-1208.
16. Bersch U, Göcking K, Pannek J. The artificial urinary sphincter in patients with spinal cord lesion: description of a modified technique and clinical results. Eur Urol. 2009;55(3):687-693.
Personalized Health Planning in Primary Care Settings
Health care has become increasingly unaffordable in the U.S., yet it remains ineffective in preventing or effectively treating chronic diseases.1,2 Given the increasing burden of chronic disease on the American health care system, there is an effort to shift the practice of medicine away from its reactive, disease-oriented approach to a more sustainable proactive model.3-5
Personalized health care (PHC) is an approach to the practice of medicine where prediction, prevention, intense patient engagement, shared health care decision making, and coordination of care are essential to cost effectively facilitate better outcomes.3,5-7 Greater collaboration between patient and clinician replaces the traditional clinician-dominated dialogue with more effective patient-clinician partnerships.8,9 Patients’ knowledge, skills, and confidence to manage their health care have been linked to improved health outcomes, lower costs, and greater satisfaction with health care experiences.10,11
Personalized health care has been proposed as a means to achieve better patient engagement as part of an aligned, proactive clinical approach. At the heart of PHC is personalized health planning, wherein the patient and clinician develop shared health-related goals and a plan to achieve them.3
The VHA, the largest integrated health care system in the country, is on the vanguard of incorporating tenets of PHC into its delivery model. In 2011, the Office of Patient Centered Care and Cultural Transformation (OPCC&CT) was founded to “oversee the VHA’s cultural transformation to patient-centered care.”12 This undertaking represents “one of the most massive changes in the philosophy and process for health care delivery ever undertaken by an organized health care system.”13
The primary goal of the VHA’s strategic plan for 2013 to 2018 is to provide veterans personalized, proactive, patient-driven health care.14 The intention of this approach is to engage and inspire veterans to their highest possible level of health and well-being. A personalized approach requires a dynamic customization of care that is specifically relevant to the individual, based on factors such as medical conditions, genome, needs, values, and circumstances. In addition to being personalized, this approach must be proactive, and therefore, preventive and include strategies to strengthen the person’s innate capacity for enhancing health.
The third distinction of this new model health care is that it is patient-driven, rooted in and driven by that which matters most to people in their lives and aligns their health care with their day-to-day and long-term life goals.15 The latter may be the most critical of the 3 tenets, because a personalized, proactive approach that is not driven by an engaged and inspired individual will be unlikely to achieve adherence, let alone the highest level of health and well-being.
The VHA is uniquely positioned to optimize health and well-being for veterans due in part to a systemwide emphasis on training providers to promote and support behavior change through approaches including health coaching and motivational interviewing. These synergistic approaches used widely by clinicians throughout the VHA are influenced by the transtheoretical model (ie, the stages of change theory), which considers patients holistically and helps them identify intrinsic motivation to improve their health behaviors.16,17 The transformation occurring in the VHA is intended to shift the current disease-centric medical model to an approach that optimizes the health of veterans through patient-clinician engagement, health risk assessment (HRA), shared health goal creation, and a coordinated plan to attain them.12,13
Personalized Health Planning
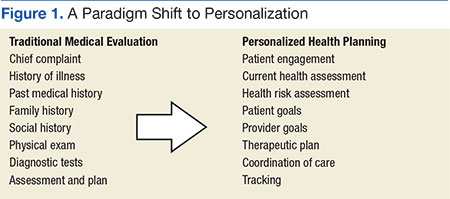
In recognition of the need to deliver care that emphasizes prevention and coordination, the patient-centered medical home, patient-aligned care teams (PACTs), and the chronic care model were developed. All of these embrace concepts of patient engagement, shared decision making, and team-based care. However, none of these approaches have outlined a clinical workflow that systematically and proactively operationalizes these concepts with the creation of a risk-based personalized care approach. Personalized health planning provides a clinical workflow that operationalizes all these features (Figure 1).
Of central importance is the creation of a personalized health plan (PHP), which the patient and clinician develop collaboratively. The plan serves to organize and coordinate care while engaging the patient in the process of care delivery and appropriate self-management of health.3,5 This approach promotes personalized and proactive care that values the individual and fosters meaningful patient self-awareness and engagement through shared decision making.7
The personalized health planning process is composed of several key components (Figure 2). 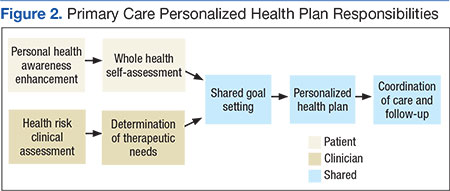
With this information, the clinician develops a preliminary therapeutic plan to meet these goals and discusses this plan with the patient. The next component is the synthesis of the clinician’s goals and/or treatment plan with the priorities of the patient to establish shared clinician-patient goals. This is followed by the establishment of the PHP, which consists of the agreed upon shared clinician and patient goals, a therapeutic and wellness plan to meet them, metrics for tracking progress, consults and referrals, and a time frame for the patient to achieve the health goals.
Related: The Right Care at the Right Time and in the Right Place: The Role of Technology in the VHA
The final component is coordination of care and a formalized follow-up system in which the health care team monitors the patient’s progress and provides support by revisiting or updating the PHP at intervals determined by the provider, based on the level of monitoring required by the patient’s health status. This approach invites the patient to become an empowered member of the care team by creating a patient-clinician partnership and providing a model for delivering personalized, proactive, patient-driven care to individuals with a diverse range of needs.4,5,18
Design and Implementation
This project qualified as exempt through the Duke University Institutional Review Board. The primary aim of this pilot was to examine the feasibility of implementing personalized health planning into primary care settings and to develop a workable process that is scalable and customizable to inpatient and outpatient clinics of varying sizes for different patient populations within the VHA. The pilot included 5 clinics in 2 geographic areas that were selected for their facility’s leadership support and desire to participate.
The VA Boston Healthcare System implemented personalized health planning at 3 primary care clinics: Jamaica Plain Primary Care, Jamaica Plain Women’s Health, and Quincy Primary Care. Three distinct PACTs participated in Boston, each composed of a medical doctor or doctor of osteopathy, a registered nurse (RN) or health technician, and a medical support assistant. The Sam Rayburn Memorial Veterans Center in Bonham, Texas, implemented personalized health planning at 2 clinics: the Hypertension Shared Medical Appointment and the Domiciliary Inpatient Primary Care. At Bonham, a medical doctor, pharmacist, RN, and an integrated mental health provider led the shared medical appointment (SMA) with guest presenters for individual appointments, depending on the topic covered. A RN and social worker implemented personalized health planning in the domiciliary.
After receiving training in the personalized health planning process, each of the clinics’ multidisciplinary PACTs incorporated their custom personalized health planning workflow into patient encounters. During the intake process of the clinic visit, the patient received a Personal Health Inventory (PHI) to determine health care priorities. The OPCC&CT developed the PHI as a whole-health self-assessment tool to help patients reflect on their health and lives, including core values, disparities between current and desired states, and preparedness to make behavioral changes to promote health.
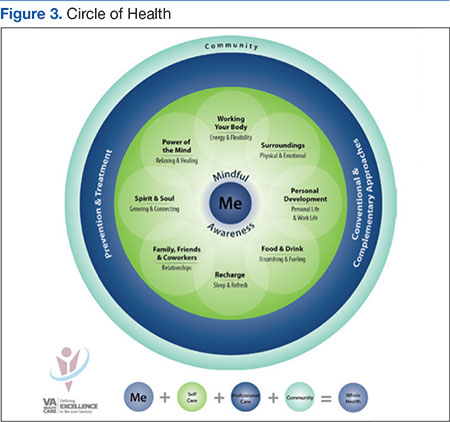
The PHI assisted with framing this whole health approach to clinical care by expanding the definition of health to include more holistic elements of well-being, such as spirituality, personal relationships, emotional health, and personal development. A visual representation of the whole health domains termed The Circle of Health introduced this concept to the patient and assisted with goal setting (Figure 3).12
The PHI organized the patient’s input and was provided to the clinician to contribute to the development of the shared therapeutic goals and a final treatment plan. The PHP provided the tool to organize the goals, plans, and care following the visit and to connect the patient to additional resources within the VHA to support goal attainment through skill building and support. Each clinical site developed a mechanism to follow up with these patients either telephonically or with additional clinic appointments. The participating clinics implemented their customized version of personalized health planning for an average of 3 months.
Personalized health planning and accompanying tools were used primarily in routine ambulatory care visits. They were also used in the Bonham domiciliary clinic, which provides care for veterans with mental illnesses or addictive disorders who require additional structure and support. The purpose of the pilot was to determine whether personalized health planning could be used within this population. Given the small sample size and incompleteness of data collected, the Bonham domiciliary group was not included in the participating patient total. Across the other 4 clinics a total of 153 patients participated in the 3-month pilot study by establishing shared health goals and plans to meet them.
Results and Evaluation
Using a structured interview guide, a total of 6 small group interviews with participating clinicians were held (3 in Boston and 3 in Bonham, N = 18). Qualitative methods for research and evaluation were used to capture the depth of responses and to provide complex descriptions of the clinicians’ perspectives on the implementation of the personalized health planning process. Two researchers reviewed the transcripts to identify and code themes, and a third researcher reviewed the transcripts to confirm themes and resolve any discrepancies.
Analysis of the interview data revealed 9 core themes related to the feasibility, effectiveness, and future dissemination of personalized health planning. These themes, described below with exemplar data, include (a) patient engagement; (b) clinical assessment; (c) goal setting; (d) clinical workflow; (e) resources and support for veterans and clinicians; (f) Computerized Patient Record System (CPRS) integration; (g) patient-clinician relationship; (h) clinical outcomes; and (i) patient satisfaction.
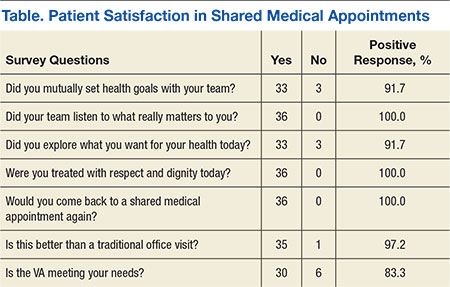
The purpose of this study was to evaluate the feasibility of introducing personalized health planning within the workflows of the clinics that were participating. As a consequence of this, interviews were held with clinic staff rather than patients. However, the authors did obtain patient satisfaction data from 10 patients who received care from the hypertension SMA and responded to TruthPoint questions after their visit (Table).
Patient Engagement
A central tenant of personalized health planning is to engage patients in their health and health care. Findings revealed that clinicians at both sites perceived the PHP as an effective tool for integrating patients as robust members of the care team. Clinicians noted that by asking patients what was important to them, the patients felt more empowered to actively engage in the clinical encounter and to take responsibility for their health decisions. One pharmacist noted, “Patients are more empowered…when you change how you’re having your conversation with them that helps people start to recognize that they are an active participant [sic] and they can have an impact and can help with minimizing medicines or trying other things.”
Clinicians reported that including patients as active members in their care created a level of buy-in that motivated behavioral changes, because the patients identified behaviors they wanted to change vs the clinician telling them what they should or should not do. A nurse manager reported, “The key is that (the health goal) is coming from the patient…. Once it comes out of their mouth, they’re thinking about it and it’s not the clinician telling them what they should or shouldn’t do, but it’s helping them…identify something that’s important that will keep them into staying the way they want to, for the reasons that they want to.”
Clinical Assessment
The HRA tools are a vital part of the personalized health planning process, as they focus on preventive strategies that are most important for the patient.4 Clinicians reported using the PHI and additional HRA tools as part of the pilot program. The PHI is a self-assessment tool designed to identify psychosocial, behavioral, and environmental issues that can impact the patient’s care and health status. Most clinicians found that the PHI helped to solicit patients’ input on what was important to them and their health status while introducing the new approach to care. One nurse commented, “I found [PHI] very effective if I could actually sit down and review it with them to see what it was that was truly important to them and explain that this new approach is for a better understanding.”
Clinicians also found that the PHI helped focus the patient’s attention toward self-care areas that facilitated the shared goal setting process with the clinician. It moved the clinical encounter away from the chief health problems and toward identifying what is important to the patient and leveraging his or her intrinsic motivation to support health promotion via lifestyle modification.
Goal Setting
Shared goal setting is a critical component of personalized health planning. The clinician and patient must agree about realistic goals to improve the patient’s health. Clinicians reported that the goal setting stage was most successful when patients were invited to guide the process and offered the goals themselves; ie, when it was not just patient-centered but patient-driven.
“Setting a goal with a patient is pretty easy because people have an idea of what they should be doing and what they want to be doing,” one clinician reported. “They know their goal. So it’s a matter of just listening, really listening, and seeing what they want…. It’s not incongruous to get the medical goal and the patient goal to match.”
Patients were amenable to this collaborative approach to goal setting, and there was often commonality between the clinician’s goals and what was important to the patient. Occasionally, the patient set goals in seemingly unrelated areas that facilitated chronic disease management.
“One of our hypertensive patients wanted to work on things that are external that they felt are stressors that actually caused their blood pressure to be high,” a pharmacist recalled. “At the end of the day they wanted to control their environment better so that they could see if they could then be off of antihypertensives altogether. It appears that may be the case right now. That this individual has been able to accomplish that, which I thought was amazing, and since it’s still new, I’m still a little bit skeptical.... Is that possible? But if at the end of the day that is an outcome that we see from doing this, I think that’s wonderful.”
Clinicians reported that follow-up with the patient was a critical aspect of goal setting, because it improved accountability and helped track progress and health outcomes. However, due to the 3-month time limit of the pilot, there was insufficient time to get uniform data on the formalized follow-up systems developed by each clinic.
Clinical Workflow
Examining the feasibility of creating a process to incorporate personalized health planning into a busy primary care clinic was one of the major aims of this pilot. As such, issues of time, staff responsibilities, and use of the CPRS and other systems to facilitate the process were challenges that each clinic addressed in slightly different ways and with varying success. One method was to leverage the SMA for a group of patients with a common diagnosis to discuss their goals, provide accountability, and improve access to a medical team.
Another innovative approach was utilizing medical support administrators and health technicians to front-load some of the introductory information and patient education in the waiting room or during the intake process. Despite these efforts, some clinicians thought that the personalized health planning process might take longer than the traditional clinical encounter. One nurse manager commented, “I think it did affect the length of visits…it has made them a little bit longer.”
Resources and Support
The VHA has been undergoing a shift from an emphasis on tertiary care to include a greater focus on primary care. Part of this shift has been an investment in complementary and alternative medicine (CAM). The PHP helped clinicians explore what resources existed at their facility to support veterans in accomplishing their goals, including CAM. One nurse reported, “It made us look into other avenues that were actually available at the VHA that we didn’t even know we had…the acupuncture, the qigong, the voluntary services getting the veterans involved.”
Clinicians also identified the need for patient education in the concepts of whole health, personalized care, and patient involvement as necessary for moving the piloted approach forward. A nurse noted that “for [personalized health planning] to work well, [the patients] need more orientation and education upfront systemwide so that when they get into an appointment with us, we’re not starting at explaining the whole world view of partnership and doing things differently.”
Resources for clinicians were just as critical as resources for patients in facilitating the personalized health planning process. Specifically, most clinicians identified their own education and training in techniques to engage the patient in a meaningful way via motivational interviewing and health coaching complemented the personalized approach to care, particularly for shared goal setting,
CPRS Integration
The CPRS is an integrated, electronic patient record system that provides a single interface for clinicians to manage patient care as well as an efficient means for others to access and use patient information.19 The most commonly cited challenge in the pilot was the lack of available staff and time in the patient visit to complete the PHP while completing documentation requirements in CPRS.
One clinician stated, “For clinicians, the barriers…it’s time to get through the reminders and preventatives.” Clinicians reported that the process and the CPRS documentation were misaligned and lacked integration to coordinate care or support health planning. Moreover, clinicians reported that the data being collected did not support patient-centered care.
Patient-Clinician Relationship
A significant strength of personalized health planning was that it fostered a beneficial patient-clinician relationship that promoted greater depth of care. One clinician noted, “I think that it adds a more personalized dimension to the whole patient visit.” In addition to experiencing a deeper relationship with their patients, clinicians also expressed having higher levels of job satisfaction and relished the opportunity to connect with their patients in a more personal way.
Clinicians also reported that patients seemed more satisfied with the experience. One nurse commented, “They really respond to it very well when they figure out that you care about them as a whole… it’s not just about the disease process anymore.”
Clinical Outcomes
Clinicians reported a number of positive health outcomes during the pilot. One physician reported, “I have a patient, he had a follow-up today, a 29-year-old veteran, who was 260 pounds 5 months ago, and he’s 230 pounds today. He comes in monthly to see the nurse to let us know he’s doing it.”
The same physician also shared a similar transformation in a patient as a result of personalized health planning. “We had another one yesterday, 4 months ago his [hemoglobin] A1c was 10.3%. It was 7.2% yesterday, and [his weight was] down 20 pounds.” In addition to positive clinical outcomes, patients made changes in areas of their health that they identified as important through the PHI, although these areas are not typically discussed in a clinical visit.
Patient Satisfaction
Although the overall goal of this pilot was to determine the feasibility of a clinical workflow embracing personalized health planning, data on patient satisfaction were collected from patients receiving care in the Hypertension Shared Medical Appointments Program at Bohnam. Ten patients were seen over the course of 5 visits. At each visit, they were asked to rate their satisfaction (Table).
Overall, patients were highly satisfied with their experience and the care they received: 91.7% reported exploring what they wanted for their health and setting shared goals; 100% reported that their providers truly listened to their needs and treated them with respect and dignity; and 97.2% reported that their experience was better than a traditional office visit. One participating physician noted that higher levels of patient and provider satisfaction are a product of this type of patient engagement. “I also think that looking at patient and provider satisfaction, the visits feel more meaningful, and there’s a better relationship built through this discussion,” he noted. These findings demonstrating increased satisfaction further suggest the benefits of personalized health planning approach.
Discussion
In 2012, the VHA National Leadership Council convened a Strategic Planning Summit to set goals and objectives to help the VHA be at the vanguard of a movement toward a more proactive health care delivery model. The first of 3 goals developed was to provide veterans personalized, proactive, patient-driven health care.13 It is becoming increasingly clear that truly affecting health and health outcomes requires motivated, engaged, and informed patients with a care delivery approach that provides ample opportunities for patient involvement and input in health care decision making.10,11
The OPCC&CT has ongoing initiatives driving innovation, research, education, and deployment across the system to set the stage for personalized, proactive, patient-driven care.20 Some of these innovations include clinician education in the concept of whole health; health coaching; group-based, peer-led approaches; and the expansion of CAM such as mind-body approaches, qi-gong, massage therapy, yoga, and acupuncture.21
The primary aim of the Whole Health in Primary Care Project was to determine the feasibility of using personalized health planning as the operational model to deliver personalized, proactive, patient-driven care. The decision was made to integrate personalized health planning into ongoing clinical operations rather than design clinical pilots de novo. This had the advantage of speed in starting the project but limited the ability to create an optimal workflow from scratch. Given the time and resources available for this study, it was not possible to obtain quantitative data particularly as it related to quantifying clinical outcomes.
Despite these limitations, early indications suggest that the personalized health planning process can serve as the operational clinical working model to enable personalized, proactive, patient-driven care in a variety of primary care settings. As noted by one nurse manager, preparing the personalized health plan made the initial visit “a bit longer.” However, after the first visit, monitoring health risk abatement and goal achievement is akin to what is currently done by reviewing problem lists. Thus, although the personalized health planning experience is just beginning, clinicians noted that it fostered a beneficial patient-clinician relationship. This deeper relationship between the patient and the clinician may be the most powerful signal that the process is worthwhile.
This pilot provided valuable information related to the implementation of a clinical workflow redesign, an initial step toward developing an optimized operational model of the PHP process. Additionally, although it is not yet possible to quantify the clinical impact of the personalized health planning, anecdotal evidence suggests its positive potential. Clinicians reported that patients were successful in managing a multitude of common chronic diseases, including weight loss, high blood pressure management, reduction of A1c, and improved sleep habits.
These findings compare with studies using similar approaches that demonstrated their value in the treatment of congestive heart failure, cardiovascular disease risk, type 2 diabetes, and postpartum weight retention.22-25 A growing body of evidence continues to affirm that a primary care model designed to deliver individualized care focused on improving health and an augmented patient-clinician relationship results in significant savings, primarily from reduced medical expenditures.26
This pilot provided an important opportunity to learn how to improve the effectiveness of personalized health planning and how to scale it. The experiences in Boston and Bonham demonstrated that personalized health planning can be integrated into diverse primary care settings with PACTs. The authors suggest that the knowledge gained from this project should be incorporated into new pilots at various clinical settings to determine the usefulness of the PHP for clinical indications beyond primary care. Specialty care clinics, home-based primary care services, and telehealth programs would be potential clinical applications for such pilots.
New pilots should be designed de novo and be of sufficient length to gain quantitative data on patient activation and clinical outcomes. Furthermore, future studies of personalized health planning should obtain input from the patient using Likert scales, surveys, and focus groups to gauge and quantify patient satisfaction and outcomes with the approach. Since patient engagement and better understanding of patients’ holistic needs are central to development of the PHP, patients need to be educated about this new approach to care and their active role in it.
The choice of the tools, including the HRA instrument, materials for orienting patients to their more active role in their care, the PHI, the PHP template to document shared goals, and other avenues used to engage patients, require refinement to improve their clarity, effectiveness of conveying the intended information, and ease of use. These studies demonstrated the vital need to address the best means to engage patients in understanding the value of their health to them since the clinician visit is likely to be an opportune teaching moment. Initial observations suggested that patients respond with different degrees of enthusiasm when given the opportunity to be more engaged in their care. Future pilots should clarify whether these differences stem from (a) how the invitation is presented; (b) individual differences in personality and preferences; (c) perceived clinical needs; or (d) unfamiliarity with the collaborative personalized health planning process.
The alignment of personalized health planning with outcomes data in the CPRS is essential for widespread adoption. Importantly, incentives and performance metrics will need to be redesigned to support the intended outcomes of using personalized health planning in clinical care. To that end, further investigation into the potential for cost savings associated with personalized health planning use is warranted, especially given studies that suggest high levels of patient engagement result in lower health care utilization expenditures.27
Additionally, wherever personalized health planning is initiated, employees across all levels of the system would benefit from training in patient engagement techniques and other means of attaining behavioral change. This would facilitate more effective use of time during the clinical visit and improve both the patient’s and the clinician’s satisfaction. Indeed, preliminary data indicate that this approach in a SMA setting is greatly valued by the patients.
Conclusions
The Whole Health in Primary Care Project was conducted to determine the feasibility of personalized health planning as the basis for primary care designed to facilitate personalized, proactive, patient-driven care. The pilot demonstrated that personalized health planning could be operational in VHA clinical settings and used to enhance patient-clinician engagement, establish shared health goals, and increase patient satisfaction. The personalized health planning process also provides a framework for the rational introduction of new capabilities to enhance prediction, clinical tracking, coordination of ancillary services, and clinical data collection. Future research should validate the efficacy of personalized health planning within both the VHA and health systems nationwide. Such research has the potential to refine this process so it becomes a key part of a personalized, proactive, patient-driven delivery approach.
Acknowledgements
We gratefully acknowledge the assistance of Cindy Mitchell at Duke University Medical Center with the editing and preparation of this manuscript. We also gratefully acknowledge the participation of the providers and patients at VA Boston Healthcare System and Sam Rayburn Memorial Veterans Center. Funding for this project was provided by VA777-12-C-002 to the Pacific Institute for Research and Evaluation through subcontracts to Ralph Snyderman, MD, and to the Duke University School of Nursing (Simmons PI.)
1. Anderson G. Chronic care: making the case for ongoing care. Princeton, NJ: Robert Wood Johnson Foundation; 2010.
2. Anderson G, Horvath J. The growing burden of chronic disease in America. Public Health Rep. 2004;119(3):263-270.
3. Dinan MA, Simmons LA, Snyderman R. Commentary: Personalized health planning and the Patient Protection and Affordable Care Act: an opportunity for academic medicine to lead health care reform. Acad Med. 2010;85(11):1665-1668.
4. Snyderman R, Yoediono Z. Prospective care: a personalized, preventative approach to medicine. Pharmacogenomics. 2006;7(1):5-9.
5. Snyderman R. Personalized health care: from theory to practice. Biotechnol. 2012;7(8):973-979.
6. Burnette R, Simmons LA, Snyderman R. Personalized health care as a pathway for the adoption of genomic medicine. J Pers Med. 2012;2(4):232-240.
7. Simmons LA, Dinan MA, Robinson TJ, Snyderman R. Personalized medicine is more than genomic medicine: confusion over terminology impedes progress towards personalized healthcare. J Pers Med. 2012;9(1):85-91.
8. Pelletier LR, Stichler JF. Patient-centered care and engagement: nurse leaders' imperative for health reform. J Nurs Adm. 2014;44(9):473-480.
9. Epstein RM, Street RL Jr. The values and value of patient-centered care. Ann Fam Med. 2011;9(2):100-103.
10. Simmons LA, Wolever RQ, Bechard EM, Snyderman R. Patient engagement as a risk factor in personalized health care: a systematic review of the literature on chronic disease. Genome Med. 2014;6(2):16.
11. Greene J, Hibbard JH. Why does patient activation matter? An examination of the relationships between patient activation and health-related outcomes. J Gen Intern Med. 2012;27(5):520-526.
12. U.S. Department of Veterans Affairs. VA Patient Centered Care. U.S. Department of Veterans Affairs Website. http://www.va.gov/patientcenteredcare. Updated October 30, 2015. Accessed December 3, 2015.
13. Gaudet T. The Transformation of Healthcare. Paper presented at: 27th Annual Voluntary Health Leadership Conference; 2014; Tucson, Arizona.
14. U.S. Department of Veterans Affairs. VHA Strategic Plan FY 2013-2018. U.S. Department of Veterans Affairs Website. http://www.va.gov/health/docs/VHA_STRATEGIC_PLAN_FY2013-2018.pdf. Accessed December 3, 2015.
15. U.S. Department of Veterans Affairs. Blueprint for excellence. U.S. Department of Veterans Affairs Website. http://www.va.gov/health/docs/VHA_Blueprint_for_Excellence.pdf. Published September 21, 2014. Accessed December 3, 2015.
16. Prochaska JO, Velicer WF. The transtheoretical model of health behavior change. Am J Health Promot. 1997;12(1):38-48.
17. Simmons LA, Wolever RQ. Integrative health coaching and motivational interviewing: synergistic approaches to behavior change in healthcare. Glob Adv Health Med. 2013;2(4):28-35.
18. Snyderman R, Dinan MA. Improving health by taking it personally. JAMA. 2010;303(4):363-364.
19. U.S. Department of Veterans Affairs. Computerized Patient Record System (CPRS) User Guide: GUI version. U.S Department of Veterans Affairs Website. http://www.va.gov/vdl/documents/Clinical/Comp_Patient_Recrd_Sys_(CPRS)/cprsguium.pdf. Published November 2015. Accessed December 3, 2015.
20. Perlin JB, Kolodner RM, Roswell RH. The Veterans Health Administration: quality, value, accountability, and information as transforming strategies for patient-centered care. Healthc Pap. 2005;5(4):10-24.
21. Denneson LM, Corson K, Dobscha SK. Complementary and alternative medicine use among veterans with chronic noncancer pain. JRRD. 2011;48(9):1119-1128.
22. Whellan DJ, Gaulden L, Gattis WA, et al. The benefit of implementing a heart failure disease management program. Arch Intern Med. 2001;161(18):2223-2228.
23. Edelman D, Oddone EZ, Liebowitz RS, et al. A multidimensional integrative medicine intervention to improve cardiovascular risk. J Gen Intern Med. 2006;21(7):728-734.
24. Wolever RQ, Dreusicke M, Fikkan J, et al. Integrative health coaching for patients with type 2 diabetes: a randomized clinical trial. Diabetes Educ. 2010;36(4):629-639.
25. Yang NY, Wroth S, Parham C, Strait M, Simmons LA. Personalized health planning with integrative health coaching to reduce obesity risk among women gaining excess weight during pregnancy. Glob Adv Health Med. 2013;2(4):72-77.
26. Musich S, Klemes A, Kubica MA, Wang S, Hawkins K. Personalized preventive care reduces healthcare expenditures among Medicare advantage beneficiaries. Am J Manag Care. 2014;20(8):613-620.
27. Hibbard JH, Greene J, Overton V. Patients with lower activation associated with higher costs; delivery systems should know their patients' 'scores.' Health Aff. 2013;32(2):216-222.
Health care has become increasingly unaffordable in the U.S., yet it remains ineffective in preventing or effectively treating chronic diseases.1,2 Given the increasing burden of chronic disease on the American health care system, there is an effort to shift the practice of medicine away from its reactive, disease-oriented approach to a more sustainable proactive model.3-5
Personalized health care (PHC) is an approach to the practice of medicine where prediction, prevention, intense patient engagement, shared health care decision making, and coordination of care are essential to cost effectively facilitate better outcomes.3,5-7 Greater collaboration between patient and clinician replaces the traditional clinician-dominated dialogue with more effective patient-clinician partnerships.8,9 Patients’ knowledge, skills, and confidence to manage their health care have been linked to improved health outcomes, lower costs, and greater satisfaction with health care experiences.10,11
Personalized health care has been proposed as a means to achieve better patient engagement as part of an aligned, proactive clinical approach. At the heart of PHC is personalized health planning, wherein the patient and clinician develop shared health-related goals and a plan to achieve them.3
The VHA, the largest integrated health care system in the country, is on the vanguard of incorporating tenets of PHC into its delivery model. In 2011, the Office of Patient Centered Care and Cultural Transformation (OPCC&CT) was founded to “oversee the VHA’s cultural transformation to patient-centered care.”12 This undertaking represents “one of the most massive changes in the philosophy and process for health care delivery ever undertaken by an organized health care system.”13
The primary goal of the VHA’s strategic plan for 2013 to 2018 is to provide veterans personalized, proactive, patient-driven health care.14 The intention of this approach is to engage and inspire veterans to their highest possible level of health and well-being. A personalized approach requires a dynamic customization of care that is specifically relevant to the individual, based on factors such as medical conditions, genome, needs, values, and circumstances. In addition to being personalized, this approach must be proactive, and therefore, preventive and include strategies to strengthen the person’s innate capacity for enhancing health.
The third distinction of this new model health care is that it is patient-driven, rooted in and driven by that which matters most to people in their lives and aligns their health care with their day-to-day and long-term life goals.15 The latter may be the most critical of the 3 tenets, because a personalized, proactive approach that is not driven by an engaged and inspired individual will be unlikely to achieve adherence, let alone the highest level of health and well-being.
The VHA is uniquely positioned to optimize health and well-being for veterans due in part to a systemwide emphasis on training providers to promote and support behavior change through approaches including health coaching and motivational interviewing. These synergistic approaches used widely by clinicians throughout the VHA are influenced by the transtheoretical model (ie, the stages of change theory), which considers patients holistically and helps them identify intrinsic motivation to improve their health behaviors.16,17 The transformation occurring in the VHA is intended to shift the current disease-centric medical model to an approach that optimizes the health of veterans through patient-clinician engagement, health risk assessment (HRA), shared health goal creation, and a coordinated plan to attain them.12,13
Personalized Health Planning
In recognition of the need to deliver care that emphasizes prevention and coordination, the patient-centered medical home, patient-aligned care teams (PACTs), and the chronic care model were developed. All of these embrace concepts of patient engagement, shared decision making, and team-based care. However, none of these approaches have outlined a clinical workflow that systematically and proactively operationalizes these concepts with the creation of a risk-based personalized care approach. Personalized health planning provides a clinical workflow that operationalizes all these features (Figure 1).
Of central importance is the creation of a personalized health plan (PHP), which the patient and clinician develop collaboratively. The plan serves to organize and coordinate care while engaging the patient in the process of care delivery and appropriate self-management of health.3,5 This approach promotes personalized and proactive care that values the individual and fosters meaningful patient self-awareness and engagement through shared decision making.7
The personalized health planning process is composed of several key components (Figure 2).
With this information, the clinician develops a preliminary therapeutic plan to meet these goals and discusses this plan with the patient. The next component is the synthesis of the clinician’s goals and/or treatment plan with the priorities of the patient to establish shared clinician-patient goals. This is followed by the establishment of the PHP, which consists of the agreed upon shared clinician and patient goals, a therapeutic and wellness plan to meet them, metrics for tracking progress, consults and referrals, and a time frame for the patient to achieve the health goals.
Related: The Right Care at the Right Time and in the Right Place: The Role of Technology in the VHA
The final component is coordination of care and a formalized follow-up system in which the health care team monitors the patient’s progress and provides support by revisiting or updating the PHP at intervals determined by the provider, based on the level of monitoring required by the patient’s health status. This approach invites the patient to become an empowered member of the care team by creating a patient-clinician partnership and providing a model for delivering personalized, proactive, patient-driven care to individuals with a diverse range of needs.4,5,18
Design and Implementation
This project qualified as exempt through the Duke University Institutional Review Board. The primary aim of this pilot was to examine the feasibility of implementing personalized health planning into primary care settings and to develop a workable process that is scalable and customizable to inpatient and outpatient clinics of varying sizes for different patient populations within the VHA. The pilot included 5 clinics in 2 geographic areas that were selected for their facility’s leadership support and desire to participate.
The VA Boston Healthcare System implemented personalized health planning at 3 primary care clinics: Jamaica Plain Primary Care, Jamaica Plain Women’s Health, and Quincy Primary Care. Three distinct PACTs participated in Boston, each composed of a medical doctor or doctor of osteopathy, a registered nurse (RN) or health technician, and a medical support assistant. The Sam Rayburn Memorial Veterans Center in Bonham, Texas, implemented personalized health planning at 2 clinics: the Hypertension Shared Medical Appointment and the Domiciliary Inpatient Primary Care. At Bonham, a medical doctor, pharmacist, RN, and an integrated mental health provider led the shared medical appointment (SMA) with guest presenters for individual appointments, depending on the topic covered. A RN and social worker implemented personalized health planning in the domiciliary.
After receiving training in the personalized health planning process, each of the clinics’ multidisciplinary PACTs incorporated their custom personalized health planning workflow into patient encounters. During the intake process of the clinic visit, the patient received a Personal Health Inventory (PHI) to determine health care priorities. The OPCC&CT developed the PHI as a whole-health self-assessment tool to help patients reflect on their health and lives, including core values, disparities between current and desired states, and preparedness to make behavioral changes to promote health.
The PHI assisted with framing this whole health approach to clinical care by expanding the definition of health to include more holistic elements of well-being, such as spirituality, personal relationships, emotional health, and personal development. A visual representation of the whole health domains termed The Circle of Health introduced this concept to the patient and assisted with goal setting (Figure 3).12
The PHI organized the patient’s input and was provided to the clinician to contribute to the development of the shared therapeutic goals and a final treatment plan. The PHP provided the tool to organize the goals, plans, and care following the visit and to connect the patient to additional resources within the VHA to support goal attainment through skill building and support. Each clinical site developed a mechanism to follow up with these patients either telephonically or with additional clinic appointments. The participating clinics implemented their customized version of personalized health planning for an average of 3 months.
Personalized health planning and accompanying tools were used primarily in routine ambulatory care visits. They were also used in the Bonham domiciliary clinic, which provides care for veterans with mental illnesses or addictive disorders who require additional structure and support. The purpose of the pilot was to determine whether personalized health planning could be used within this population. Given the small sample size and incompleteness of data collected, the Bonham domiciliary group was not included in the participating patient total. Across the other 4 clinics a total of 153 patients participated in the 3-month pilot study by establishing shared health goals and plans to meet them.
Results and Evaluation
Using a structured interview guide, a total of 6 small group interviews with participating clinicians were held (3 in Boston and 3 in Bonham, N = 18). Qualitative methods for research and evaluation were used to capture the depth of responses and to provide complex descriptions of the clinicians’ perspectives on the implementation of the personalized health planning process. Two researchers reviewed the transcripts to identify and code themes, and a third researcher reviewed the transcripts to confirm themes and resolve any discrepancies.
Analysis of the interview data revealed 9 core themes related to the feasibility, effectiveness, and future dissemination of personalized health planning. These themes, described below with exemplar data, include (a) patient engagement; (b) clinical assessment; (c) goal setting; (d) clinical workflow; (e) resources and support for veterans and clinicians; (f) Computerized Patient Record System (CPRS) integration; (g) patient-clinician relationship; (h) clinical outcomes; and (i) patient satisfaction.
The purpose of this study was to evaluate the feasibility of introducing personalized health planning within the workflows of the clinics that were participating. As a consequence of this, interviews were held with clinic staff rather than patients. However, the authors did obtain patient satisfaction data from 10 patients who received care from the hypertension SMA and responded to TruthPoint questions after their visit (Table).
Patient Engagement
A central tenant of personalized health planning is to engage patients in their health and health care. Findings revealed that clinicians at both sites perceived the PHP as an effective tool for integrating patients as robust members of the care team. Clinicians noted that by asking patients what was important to them, the patients felt more empowered to actively engage in the clinical encounter and to take responsibility for their health decisions. One pharmacist noted, “Patients are more empowered…when you change how you’re having your conversation with them that helps people start to recognize that they are an active participant [sic] and they can have an impact and can help with minimizing medicines or trying other things.”
Clinicians reported that including patients as active members in their care created a level of buy-in that motivated behavioral changes, because the patients identified behaviors they wanted to change vs the clinician telling them what they should or should not do. A nurse manager reported, “The key is that (the health goal) is coming from the patient…. Once it comes out of their mouth, they’re thinking about it and it’s not the clinician telling them what they should or shouldn’t do, but it’s helping them…identify something that’s important that will keep them into staying the way they want to, for the reasons that they want to.”
Clinical Assessment
The HRA tools are a vital part of the personalized health planning process, as they focus on preventive strategies that are most important for the patient.4 Clinicians reported using the PHI and additional HRA tools as part of the pilot program. The PHI is a self-assessment tool designed to identify psychosocial, behavioral, and environmental issues that can impact the patient’s care and health status. Most clinicians found that the PHI helped to solicit patients’ input on what was important to them and their health status while introducing the new approach to care. One nurse commented, “I found [PHI] very effective if I could actually sit down and review it with them to see what it was that was truly important to them and explain that this new approach is for a better understanding.”
Clinicians also found that the PHI helped focus the patient’s attention toward self-care areas that facilitated the shared goal setting process with the clinician. It moved the clinical encounter away from the chief health problems and toward identifying what is important to the patient and leveraging his or her intrinsic motivation to support health promotion via lifestyle modification.
Goal Setting
Shared goal setting is a critical component of personalized health planning. The clinician and patient must agree about realistic goals to improve the patient’s health. Clinicians reported that the goal setting stage was most successful when patients were invited to guide the process and offered the goals themselves; ie, when it was not just patient-centered but patient-driven.
“Setting a goal with a patient is pretty easy because people have an idea of what they should be doing and what they want to be doing,” one clinician reported. “They know their goal. So it’s a matter of just listening, really listening, and seeing what they want…. It’s not incongruous to get the medical goal and the patient goal to match.”
Patients were amenable to this collaborative approach to goal setting, and there was often commonality between the clinician’s goals and what was important to the patient. Occasionally, the patient set goals in seemingly unrelated areas that facilitated chronic disease management.
“One of our hypertensive patients wanted to work on things that are external that they felt are stressors that actually caused their blood pressure to be high,” a pharmacist recalled. “At the end of the day they wanted to control their environment better so that they could see if they could then be off of antihypertensives altogether. It appears that may be the case right now. That this individual has been able to accomplish that, which I thought was amazing, and since it’s still new, I’m still a little bit skeptical.... Is that possible? But if at the end of the day that is an outcome that we see from doing this, I think that’s wonderful.”
Clinicians reported that follow-up with the patient was a critical aspect of goal setting, because it improved accountability and helped track progress and health outcomes. However, due to the 3-month time limit of the pilot, there was insufficient time to get uniform data on the formalized follow-up systems developed by each clinic.
Clinical Workflow
Examining the feasibility of creating a process to incorporate personalized health planning into a busy primary care clinic was one of the major aims of this pilot. As such, issues of time, staff responsibilities, and use of the CPRS and other systems to facilitate the process were challenges that each clinic addressed in slightly different ways and with varying success. One method was to leverage the SMA for a group of patients with a common diagnosis to discuss their goals, provide accountability, and improve access to a medical team.
Another innovative approach was utilizing medical support administrators and health technicians to front-load some of the introductory information and patient education in the waiting room or during the intake process. Despite these efforts, some clinicians thought that the personalized health planning process might take longer than the traditional clinical encounter. One nurse manager commented, “I think it did affect the length of visits…it has made them a little bit longer.”
Resources and Support
The VHA has been undergoing a shift from an emphasis on tertiary care to include a greater focus on primary care. Part of this shift has been an investment in complementary and alternative medicine (CAM). The PHP helped clinicians explore what resources existed at their facility to support veterans in accomplishing their goals, including CAM. One nurse reported, “It made us look into other avenues that were actually available at the VHA that we didn’t even know we had…the acupuncture, the qigong, the voluntary services getting the veterans involved.”
Clinicians also identified the need for patient education in the concepts of whole health, personalized care, and patient involvement as necessary for moving the piloted approach forward. A nurse noted that “for [personalized health planning] to work well, [the patients] need more orientation and education upfront systemwide so that when they get into an appointment with us, we’re not starting at explaining the whole world view of partnership and doing things differently.”
Resources for clinicians were just as critical as resources for patients in facilitating the personalized health planning process. Specifically, most clinicians identified their own education and training in techniques to engage the patient in a meaningful way via motivational interviewing and health coaching complemented the personalized approach to care, particularly for shared goal setting,
CPRS Integration
The CPRS is an integrated, electronic patient record system that provides a single interface for clinicians to manage patient care as well as an efficient means for others to access and use patient information.19 The most commonly cited challenge in the pilot was the lack of available staff and time in the patient visit to complete the PHP while completing documentation requirements in CPRS.
One clinician stated, “For clinicians, the barriers…it’s time to get through the reminders and preventatives.” Clinicians reported that the process and the CPRS documentation were misaligned and lacked integration to coordinate care or support health planning. Moreover, clinicians reported that the data being collected did not support patient-centered care.
Patient-Clinician Relationship
A significant strength of personalized health planning was that it fostered a beneficial patient-clinician relationship that promoted greater depth of care. One clinician noted, “I think that it adds a more personalized dimension to the whole patient visit.” In addition to experiencing a deeper relationship with their patients, clinicians also expressed having higher levels of job satisfaction and relished the opportunity to connect with their patients in a more personal way.
Clinicians also reported that patients seemed more satisfied with the experience. One nurse commented, “They really respond to it very well when they figure out that you care about them as a whole… it’s not just about the disease process anymore.”
Clinical Outcomes
Clinicians reported a number of positive health outcomes during the pilot. One physician reported, “I have a patient, he had a follow-up today, a 29-year-old veteran, who was 260 pounds 5 months ago, and he’s 230 pounds today. He comes in monthly to see the nurse to let us know he’s doing it.”
The same physician also shared a similar transformation in a patient as a result of personalized health planning. “We had another one yesterday, 4 months ago his [hemoglobin] A1c was 10.3%. It was 7.2% yesterday, and [his weight was] down 20 pounds.” In addition to positive clinical outcomes, patients made changes in areas of their health that they identified as important through the PHI, although these areas are not typically discussed in a clinical visit.
Patient Satisfaction
Although the overall goal of this pilot was to determine the feasibility of a clinical workflow embracing personalized health planning, data on patient satisfaction were collected from patients receiving care in the Hypertension Shared Medical Appointments Program at Bohnam. Ten patients were seen over the course of 5 visits. At each visit, they were asked to rate their satisfaction (Table).
Overall, patients were highly satisfied with their experience and the care they received: 91.7% reported exploring what they wanted for their health and setting shared goals; 100% reported that their providers truly listened to their needs and treated them with respect and dignity; and 97.2% reported that their experience was better than a traditional office visit. One participating physician noted that higher levels of patient and provider satisfaction are a product of this type of patient engagement. “I also think that looking at patient and provider satisfaction, the visits feel more meaningful, and there’s a better relationship built through this discussion,” he noted. These findings demonstrating increased satisfaction further suggest the benefits of personalized health planning approach.
Discussion
In 2012, the VHA National Leadership Council convened a Strategic Planning Summit to set goals and objectives to help the VHA be at the vanguard of a movement toward a more proactive health care delivery model. The first of 3 goals developed was to provide veterans personalized, proactive, patient-driven health care.13 It is becoming increasingly clear that truly affecting health and health outcomes requires motivated, engaged, and informed patients with a care delivery approach that provides ample opportunities for patient involvement and input in health care decision making.10,11
The OPCC&CT has ongoing initiatives driving innovation, research, education, and deployment across the system to set the stage for personalized, proactive, patient-driven care.20 Some of these innovations include clinician education in the concept of whole health; health coaching; group-based, peer-led approaches; and the expansion of CAM such as mind-body approaches, qi-gong, massage therapy, yoga, and acupuncture.21
The primary aim of the Whole Health in Primary Care Project was to determine the feasibility of using personalized health planning as the operational model to deliver personalized, proactive, patient-driven care. The decision was made to integrate personalized health planning into ongoing clinical operations rather than design clinical pilots de novo. This had the advantage of speed in starting the project but limited the ability to create an optimal workflow from scratch. Given the time and resources available for this study, it was not possible to obtain quantitative data particularly as it related to quantifying clinical outcomes.
Despite these limitations, early indications suggest that the personalized health planning process can serve as the operational clinical working model to enable personalized, proactive, patient-driven care in a variety of primary care settings. As noted by one nurse manager, preparing the personalized health plan made the initial visit “a bit longer.” However, after the first visit, monitoring health risk abatement and goal achievement is akin to what is currently done by reviewing problem lists. Thus, although the personalized health planning experience is just beginning, clinicians noted that it fostered a beneficial patient-clinician relationship. This deeper relationship between the patient and the clinician may be the most powerful signal that the process is worthwhile.
This pilot provided valuable information related to the implementation of a clinical workflow redesign, an initial step toward developing an optimized operational model of the PHP process. Additionally, although it is not yet possible to quantify the clinical impact of the personalized health planning, anecdotal evidence suggests its positive potential. Clinicians reported that patients were successful in managing a multitude of common chronic diseases, including weight loss, high blood pressure management, reduction of A1c, and improved sleep habits.
These findings compare with studies using similar approaches that demonstrated their value in the treatment of congestive heart failure, cardiovascular disease risk, type 2 diabetes, and postpartum weight retention.22-25 A growing body of evidence continues to affirm that a primary care model designed to deliver individualized care focused on improving health and an augmented patient-clinician relationship results in significant savings, primarily from reduced medical expenditures.26
This pilot provided an important opportunity to learn how to improve the effectiveness of personalized health planning and how to scale it. The experiences in Boston and Bonham demonstrated that personalized health planning can be integrated into diverse primary care settings with PACTs. The authors suggest that the knowledge gained from this project should be incorporated into new pilots at various clinical settings to determine the usefulness of the PHP for clinical indications beyond primary care. Specialty care clinics, home-based primary care services, and telehealth programs would be potential clinical applications for such pilots.
New pilots should be designed de novo and be of sufficient length to gain quantitative data on patient activation and clinical outcomes. Furthermore, future studies of personalized health planning should obtain input from the patient using Likert scales, surveys, and focus groups to gauge and quantify patient satisfaction and outcomes with the approach. Since patient engagement and better understanding of patients’ holistic needs are central to development of the PHP, patients need to be educated about this new approach to care and their active role in it.
The choice of the tools, including the HRA instrument, materials for orienting patients to their more active role in their care, the PHI, the PHP template to document shared goals, and other avenues used to engage patients, require refinement to improve their clarity, effectiveness of conveying the intended information, and ease of use. These studies demonstrated the vital need to address the best means to engage patients in understanding the value of their health to them since the clinician visit is likely to be an opportune teaching moment. Initial observations suggested that patients respond with different degrees of enthusiasm when given the opportunity to be more engaged in their care. Future pilots should clarify whether these differences stem from (a) how the invitation is presented; (b) individual differences in personality and preferences; (c) perceived clinical needs; or (d) unfamiliarity with the collaborative personalized health planning process.
The alignment of personalized health planning with outcomes data in the CPRS is essential for widespread adoption. Importantly, incentives and performance metrics will need to be redesigned to support the intended outcomes of using personalized health planning in clinical care. To that end, further investigation into the potential for cost savings associated with personalized health planning use is warranted, especially given studies that suggest high levels of patient engagement result in lower health care utilization expenditures.27
Additionally, wherever personalized health planning is initiated, employees across all levels of the system would benefit from training in patient engagement techniques and other means of attaining behavioral change. This would facilitate more effective use of time during the clinical visit and improve both the patient’s and the clinician’s satisfaction. Indeed, preliminary data indicate that this approach in a SMA setting is greatly valued by the patients.
Conclusions
The Whole Health in Primary Care Project was conducted to determine the feasibility of personalized health planning as the basis for primary care designed to facilitate personalized, proactive, patient-driven care. The pilot demonstrated that personalized health planning could be operational in VHA clinical settings and used to enhance patient-clinician engagement, establish shared health goals, and increase patient satisfaction. The personalized health planning process also provides a framework for the rational introduction of new capabilities to enhance prediction, clinical tracking, coordination of ancillary services, and clinical data collection. Future research should validate the efficacy of personalized health planning within both the VHA and health systems nationwide. Such research has the potential to refine this process so it becomes a key part of a personalized, proactive, patient-driven delivery approach.
Acknowledgements
We gratefully acknowledge the assistance of Cindy Mitchell at Duke University Medical Center with the editing and preparation of this manuscript. We also gratefully acknowledge the participation of the providers and patients at VA Boston Healthcare System and Sam Rayburn Memorial Veterans Center. Funding for this project was provided by VA777-12-C-002 to the Pacific Institute for Research and Evaluation through subcontracts to Ralph Snyderman, MD, and to the Duke University School of Nursing (Simmons PI.)
1. Anderson G. Chronic care: making the case for ongoing care. Princeton, NJ: Robert Wood Johnson Foundation; 2010.
2. Anderson G, Horvath J. The growing burden of chronic disease in America. Public Health Rep. 2004;119(3):263-270.
3. Dinan MA, Simmons LA, Snyderman R. Commentary: Personalized health planning and the Patient Protection and Affordable Care Act: an opportunity for academic medicine to lead health care reform. Acad Med. 2010;85(11):1665-1668.
4. Snyderman R, Yoediono Z. Prospective care: a personalized, preventative approach to medicine. Pharmacogenomics. 2006;7(1):5-9.
5. Snyderman R. Personalized health care: from theory to practice. Biotechnol. 2012;7(8):973-979.
6. Burnette R, Simmons LA, Snyderman R. Personalized health care as a pathway for the adoption of genomic medicine. J Pers Med. 2012;2(4):232-240.
7. Simmons LA, Dinan MA, Robinson TJ, Snyderman R. Personalized medicine is more than genomic medicine: confusion over terminology impedes progress towards personalized healthcare. J Pers Med. 2012;9(1):85-91.
8. Pelletier LR, Stichler JF. Patient-centered care and engagement: nurse leaders' imperative for health reform. J Nurs Adm. 2014;44(9):473-480.
9. Epstein RM, Street RL Jr. The values and value of patient-centered care. Ann Fam Med. 2011;9(2):100-103.
10. Simmons LA, Wolever RQ, Bechard EM, Snyderman R. Patient engagement as a risk factor in personalized health care: a systematic review of the literature on chronic disease. Genome Med. 2014;6(2):16.
11. Greene J, Hibbard JH. Why does patient activation matter? An examination of the relationships between patient activation and health-related outcomes. J Gen Intern Med. 2012;27(5):520-526.
12. U.S. Department of Veterans Affairs. VA Patient Centered Care. U.S. Department of Veterans Affairs Website. http://www.va.gov/patientcenteredcare. Updated October 30, 2015. Accessed December 3, 2015.
13. Gaudet T. The Transformation of Healthcare. Paper presented at: 27th Annual Voluntary Health Leadership Conference; 2014; Tucson, Arizona.
14. U.S. Department of Veterans Affairs. VHA Strategic Plan FY 2013-2018. U.S. Department of Veterans Affairs Website. http://www.va.gov/health/docs/VHA_STRATEGIC_PLAN_FY2013-2018.pdf. Accessed December 3, 2015.
15. U.S. Department of Veterans Affairs. Blueprint for excellence. U.S. Department of Veterans Affairs Website. http://www.va.gov/health/docs/VHA_Blueprint_for_Excellence.pdf. Published September 21, 2014. Accessed December 3, 2015.
16. Prochaska JO, Velicer WF. The transtheoretical model of health behavior change. Am J Health Promot. 1997;12(1):38-48.
17. Simmons LA, Wolever RQ. Integrative health coaching and motivational interviewing: synergistic approaches to behavior change in healthcare. Glob Adv Health Med. 2013;2(4):28-35.
18. Snyderman R, Dinan MA. Improving health by taking it personally. JAMA. 2010;303(4):363-364.
19. U.S. Department of Veterans Affairs. Computerized Patient Record System (CPRS) User Guide: GUI version. U.S Department of Veterans Affairs Website. http://www.va.gov/vdl/documents/Clinical/Comp_Patient_Recrd_Sys_(CPRS)/cprsguium.pdf. Published November 2015. Accessed December 3, 2015.
20. Perlin JB, Kolodner RM, Roswell RH. The Veterans Health Administration: quality, value, accountability, and information as transforming strategies for patient-centered care. Healthc Pap. 2005;5(4):10-24.
21. Denneson LM, Corson K, Dobscha SK. Complementary and alternative medicine use among veterans with chronic noncancer pain. JRRD. 2011;48(9):1119-1128.
22. Whellan DJ, Gaulden L, Gattis WA, et al. The benefit of implementing a heart failure disease management program. Arch Intern Med. 2001;161(18):2223-2228.
23. Edelman D, Oddone EZ, Liebowitz RS, et al. A multidimensional integrative medicine intervention to improve cardiovascular risk. J Gen Intern Med. 2006;21(7):728-734.
24. Wolever RQ, Dreusicke M, Fikkan J, et al. Integrative health coaching for patients with type 2 diabetes: a randomized clinical trial. Diabetes Educ. 2010;36(4):629-639.
25. Yang NY, Wroth S, Parham C, Strait M, Simmons LA. Personalized health planning with integrative health coaching to reduce obesity risk among women gaining excess weight during pregnancy. Glob Adv Health Med. 2013;2(4):72-77.
26. Musich S, Klemes A, Kubica MA, Wang S, Hawkins K. Personalized preventive care reduces healthcare expenditures among Medicare advantage beneficiaries. Am J Manag Care. 2014;20(8):613-620.
27. Hibbard JH, Greene J, Overton V. Patients with lower activation associated with higher costs; delivery systems should know their patients' 'scores.' Health Aff. 2013;32(2):216-222.
Treatment Options for Acute Gout
Gout is an extremely painful arthritis initiated by innate immune responses to monosodium urate crystals that accumulate in affected joints and surrounding tissues. As a result, gout is characterized by painful arthritis flares followed by intervening periods of disease quiescence. Over time, gout can lead to chronic pain, disability, and tophi. Nearly 10% of those aged > 65 years report having gout. The overall prevalence in the U.S. population approaches 4%.1
Gout treatment has 2 overarching goals: alleviating the pain and inflammation caused by acute gout attacks and long-term management that is focused on lowering serum urate (sUA) levels to reduce the risk of future attacks. Alleviating the pain and inflammation of an acute attack is often complicated by patient characteristics, namely, other chronic health conditions that frequently accompany gout, such as diabetes mellitus (DM), chronic kidney disease (CKD), hypertension, and cardiovascular disease (CVD).
Patients with gout tend to be older and have multiple comorbidities that require the use of many medications.2 Because the VA patient population tends to be older, acute gout and attendant complications of treatment are an important consideration for VA health care providers (HCPs).
Recently, the American College of Rheumatology (ACR) released management recommendations for gout, including those for the treatment of acute gout.3 The ACR recommends 3 first-line therapies, but limited guidance is provided for deciding among therapies. This article briefly reviews the relevant ACR recommendations and details important comorbidity and concomitant medication considerations in the treatment of acute gout.
Acute Gout Characteristics
Acute gout attacks are characterized by a rapid onset and escalation with joint pain typically peaking within 24 hours of attack onset. An acute attack often begins to remit after 5 to 12 days without intervention, but complete resolution may take longer in some patients.4 In one study, at 24 hours after attack onset, 16% of patients on placebo had > 50% reduction in pain compared with 70% that had no recovery at all.5 By 48 hours, one-third of patients on placebo achieved a 50% reduction in pain.6 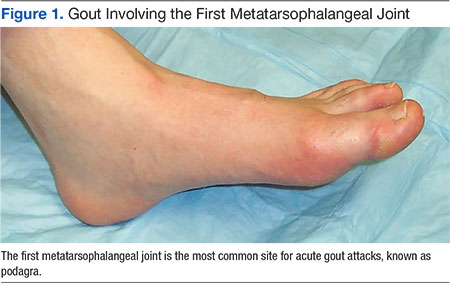
Treatment Recommendations
Therapy for acute gout attacks aims to reduce pain and promote a full, early resolution. The ACR recommends pharmacologic therapy as first-line treatment with adjunctive topical ice and rest as needed.3 Typically, monotherapy is appropriate if the individual is experiencing mild-to-moderate pain affecting ≤ 2 joints of any size. Severe pain or attacks affecting multiple joints may benefit from initial combination therapy. Three first-line therapies are available: nonsteroidal anti-inflammatory drugs (NSAIDs) or cyclooxygenase-2 (COX-2) inhibitors, colchicine, or systemic glucocorticoids (Figure 2).
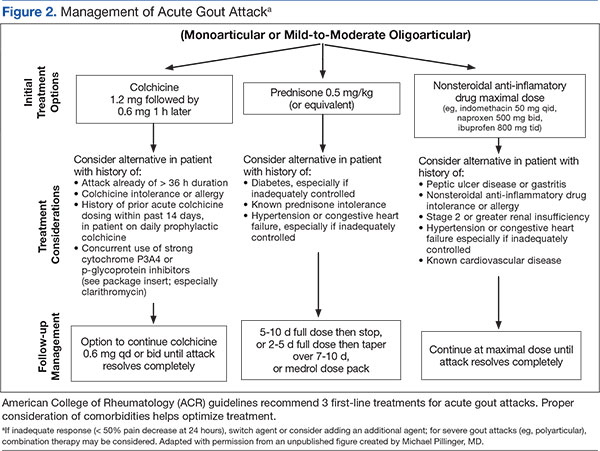
Few studies compare the efficacy of first-line therapeutic categories. There are no clinical trials directly comparing colchicine with NSAIDs or colchicine with glucocorticoids. No difference in mean reduction of pain and no differences in adverse events (AEs) were shown in a trial that compared glucocorticoids with NSAIDs.8 Thus, without further study, treatment choices made by HCPs are often guided by factors other than the existence of robust evidence.
Treatment with NSAIDs or COX-2 inhibitors should be initiated at the approved dose and continued until the gout attack has completely resolved. In one study, 73% of patients had pain reduction of ≥ 50% when taking NSAIDs relative to only 27% of patients on placebo.8 All available NSAIDs are considered effective, but only 3 NSAIDs are specifically approved for treatment of acute gout (naproxen, indomethacin, and sulindac). There is no evidence supporting one NSAID as being more effective than another; evidence fails to show a meaningful difference.8 Limited evidence indicates that selective COX-2 inhibitors, including celexocib, have similar efficacy as nonselective NSAIDs but may have fewer AEs, driven in part by fewer gastrointestinal (GI) events (6% vs 16% for GI events).8
Colchicine has long been used as prophylaxis for acute gout attacks and has been endorsed for the treatment of acute attacks. Recent evidence suggests that colchicine initially dosed at 1.2 mg followed by a single 0.6-mg dose 1 hour later is as effective with fewer AEs compared with a traditional regimen of 1.2 mg followed by 0.6 mg every hour for up to 6 hours.5 About 40% of patients have 50% pain reduction within 24 hours and a 40% absolute risk reduction in AEs on this low-dose regimen. The efficacy of colchicine relative to other therapies is poorly defined, especially for patients presenting longer after attack onset. The ACR guidelines recommend colchicine only if treatment is initiated within 36 hours of attack onset, but this is based solely on expert consensus. Likewise, the above trial for low-dose colchicine did not provide information about dosing beyond the first 6 hours, leaving little guidance for follow-up treatment of residual pain beyond the 32 hours reported.5 Traditionally, one 0.6-mg dose is provided every 12 to 24 hours.3
Systemic glucocorticoids are also commonly used in treating acute gout.9 There was a small pain reduction benefit for prednisolone, but the difference was not clinically significant in one clinical trial comparing oral prednisolone 30 mg daily for 5 days vs a combination of indomethacin for 5 days and an initial intramuscular injection of diclofenac 75 mg.10 The prednisolone group also had fewer patients with AEs, including abdominal pain (0% vs 30%) and GI bleeding (0% vs 11%). The lower incidence of short-term AEs may be a primary benefit of systemic glucocorticoids.11
Intra-articular glucocorticoids are not suggested first-line therapies but are commonly used by rheumatologists.9 In an uncontrolled study conducted by Fernández and colleagues, intra-articular glucocorticoid injections helped to quickly resolve 20 out of 20 crystal-proven gout attacks.12 However, no randomized controlled trials have examined this approach. Although seemingly efficacious, other considerations are important for this modality. Intra-articular glucocorticoids may not be preferred for polyarticular attacks or attacks in difficult-to-aspirate joints. Additionally, intra-articular glucocorticoids have been anecdotally associated with rebound attacks (ie, attacks that occur shortly after resolution without other interventions). However, the Fernández study had no such attacks occur among participants.12 Finally, septic arthritis must be ruled out as in any case of acute onset monoarticular arthritis.
Biologic agents targeting interleukin-1(IL-1) are not currently approved for gout, although there is burgeoning data suggesting that this strategy may have substantial merit.13 Additionally, there is limited evidence that adrenocorticotropic hormone (ACTH) may provide rapid pain relief when other available therapies are ineffective or contraindicated. However, ACTH studies have not provided robust trial designs, and drug costs remain substantial, thus limiting the widespread use of ACTH in acute gout.14,15 Anti-IL-1 agents and ACTH may both be considered as second-line options if first-line therapies are contraindicated or fail. Careful consideration should be given to AE profiles, patient preferences, and cost.
Comorbidities
Acute gout care, especially in the context of comorbidities, has been identified as a critical treatment concern by an international panel of rheumatologists as part of the 3e (Evidence, Expertise, Exchange) Initiative.16 However, regular clinical trial exclusion criteria have limited data necessary to guide treatment when comorbidities are present. Therefore, studies of acute gout treatment in the context of disease comorbidity represents a major unmet need in understanding and optimizing gout care.
Chronic Kidney Disease
Chronic kidney disease is common in gout; 20% of patients with gout have an estimated glomerular filtration rate (eGFR) of < 30 mL/min.2 Thus, CKD is an important consideration when deciding the best treatment for acute gout. The ACR recommendations do not provide specific guidance on NSAID use in CKD but suggest the potential option of tapering the dose as pain begins to resolve. There is mixed evidence that NSAIDs accelerate CKD progression with the best evidence for high-dose NSAID use.17 When prescribing the concomitant use of NSAIDs with other medications affecting kidney function, HCPs should consider CKD.
For colchicine, current labeling and evidence indicate that no dose adjustments are needed for stage 3 or better CKD (eGFR ≥ 60 mL/min) even among the elderly.18,19 Although labeling indicates that a single unadjusted dose (0.6 mg) can be given once every 2 weeks for those with severe CKD (eGFR < 30 mL/min) or for those who are on dialysis, alternative therapies should be considered, as AEs increase with decreasing renal function.19 Colchicine should not be used in those with eGFR < 10 mL/min.20 All patients who have CKD and are treated with colchicine should be informed of the AEs and closely observed for signs of toxicity, including blood dyscrasias, neuromyopathy, emesis, or diarrhea.
Considering the potential complications for NSAIDs and colchicine, patients with CKD may be good candidates for glucocorticoid therapy, administered either systemically or as an intra-articular injection. Alternatively, second-line agents such as ACTH or IL-1 inhibition may be considered in such patients.
Hypertension
Hypertension is one of the most common comorbidities among patients with gout. It is important for HCP consideration when deciding treatment. Poorly controlled hypertension is a contraindication for both NSAIDs and systemic glucocorticoids. Patients with hypertension in the absence of significant renal impairment may be good candidates for colchicine.
Diabetes and Hyperlipidemia
Glucocorticoids should be avoided if possible in the setting of inadequately controlled type 2 DM (T2DM) or hyperlipidemia. Glucocorticoids exacerbate insulin resistance and stimulate glucose secretion from the liver. This can create substantial and sometimes dangerous fluctuations in circulating glucose concentrations. Additionally, glucocorticoids may increase serum triglycerides and low-density lipoprotein levels. Thus, patients with T2DM or hyperlipidemia may be good candidates for alternative treatments, such as colchicine or NSAIDs.
Cardiovascular Disease
Cardiovascular disease risk has been shown to increase with the use of COX-2 inhibitors. This risk may be present for all NSAIDs. Current FDA labeling suggests limiting NSAID and COX-2 inhibitor use in patients with a history of myocardial infarction (MI), congestive heart failure, or stroke. Given the potential impact on cardiovascular risk factors, including hypertension, T2DM, and hyperlipidemia, glucocorticoids may not be ideal for patients with known CVD or those at high risk.
Recent evidence has shown that colchicine use is associated with a lower risk of MI among patients with gout.21 These results, in addition to a proposed dual role of IL-1 in both gout and CVD, suggest that either colchicine or IL-1 inhibitors may be rational agents in the treatment of acute gout in the context of CVD.22
Hepatic Impairment and GI Bleeding
Patients with cirrhosis should avoid NSAID use due to the potential increased bleeding risk from underlying coagulopathy. Additionally, colchicine clearance may be reduced in patients with severe liver impairment, mandating close surveillance when this agent is used. If hepatic impairment is mild to moderate, judicious use of any of the first-line therapies may be appropriate.
Patients with GI bleeding or a history of peptic ulcer disease should avoid NSAID use because of increased bleeding risk. If an NSAID is used, proton pump inhibitors decrease the risk of NSAID-associated mucosal damage.
Drug Interactions
Colchicine is metabolized by the cytochrome P450 3A4 enzyme (CYP3A4) and is a substrate for P-glycoprotein (P-gp). Therefore, concomitant use of colchicine with potent inhibitors of CYP3A4 or P-gp should be avoided when possible. These agents include macrolide antibiotics (clarithromyocin), calcium channel blockers (verapamil and diltiazem), and cyclosporine (commonly used in transplant patients who are at high risk for gout). New evidence-based dosing recommendations indicate that no dose reduction is required with azithromyocin.23
Nonsteroidal anti-inflammatory drugs are contraindicated with the concomitant use of angiotensin-converting enzyme (ACE) inhibitors and/or diuretics. Prostaglandin production is decreased while using NSAIDs, resulting in increased constriction of afferent renal arterioles and decreased glomerular filtration pressure. This physiologic effect of NSAIDs can be exacerbated when used in combination with ACE inhibitors or diuretics, both of which can also reduce glomerular filtration pressures. Combination therapy with either ACE inhibitors or diuretics increases the risk for NSAID-mediated acute kidney injury. Additionally, NSAID use should be avoided in patients taking anticoagulants such as warfarin or heparin due to increased bleeding risk.
Diagnosis
Diagnosis is a key component of proper treatment of acute gout. A gout diagnosis is usually made based on clinical signs and symptoms, including sudden onset of pain that peaks within 24 hours, past history of acute self-limited attacks of arthritis, first MTP involvement, and an elevated sUA. However, not all these factors must be present. In a study conducted by Janssens and colleagues, these factors plus additional demographics had a sensitivity of 90% and specificity of 65% when compared with crystal diagnosis.24 However, a normal sUA level does not exclude gout as a diagnosis due to the uricosuric effect of the inflammatory process.25 In fact, one observational cohort recorded an average sUA decrease from baseline of 2 mg/dL during an acute gout attack.26
Alternative diagnoses, including septic arthritis, should be considered, particularly in the context of treatment failure (< 50% reduction in pain) within the first 24 to 48 hours. A definitive diagnosis is made by identifying negatively birefringent crystals in the synovial fluid of the affected joint (using polarized microscopy) with negative cultures. In the absence of crystal confirmation, there is an emerging role for imaging in gout diagnosis, including the use of ultrasound and dual-energy computed tomography.27
Long-term Treatment Considerations
During treatment for acute gout attacks, urate-lowering therapy that was initiated before the attack should not be discontinued.28 There is no evidence to suggest that current urate lowering has any AEs during attacks. However, removing treatment may increase sUA levels, precipitating attacks in other joints by “destabilizing” crystals still present. Current recommendations also state that urate-lowering therapy may be started during an attack despite traditionally being deferred until the attack has resolved.28 In a randomized trial comparing a group starting allopurinol 300 mg during an attack vs a placebo group (with all patients receiving anti-inflammatory treatment for the acute attack), there was no difference in pain outcomes.29 Regardless of the chosen timing, lowering and maintaining sUA ≤ 6.0 mg/dL is the primary method for minimizing long-term risk of gout attacks.28
Health care providers should discuss with patients the likely need for indefinite urate-lowering therapy while noting that attacks related to therapy initiation are relatively common.30 Current guidelines recommend starting urate-lowering therapy in low doses (≤ 100 mg/d for allopurinol) and titrating to achieve and maintain the target sUA level. Along with the judicious use of anti-inflammatory prophylaxis, this may minimize attacks related to therapy initiation.3,28 By lowering and maintaining sUA below the target level, monosodium urate crystals will dissolve, thereby eliminating the major inciting factor of acute attacks.
Other day-to-day triggers such as alcohol, meat or seafood consumption, and dehydration exist for some patients with gout. Patients should be informed of these inciting factors, as they could potentially be avoided, reducing the risk of future gout attacks. It is important to recognize, however, that dietary or behavioral interventions have generally yielded only modest sUA reductions. For the majority of patients, therefore, reduction and maintenance of sUA ≤ 6.0 mg/dL requires pharmacologic intervention.
Conclusions
Gout attacks should be treated immediately with pharmacologic treatment when contraindications are absent. First-line treatment options include NSAIDs, colchicine, and systemic glucocorticoids. Use of these modalities can be complicated because of comorbidity and concomitant medication use that is prevalent among patients with gout. Comorbidities commonly limiting treatment choice include hypertension (NSAIDs, glucocorticoids), CKD (NSAIDS, colchicine), CVD (NSAIDs, COX-2 inhibitors, glucocorticoids), T2DM (glucocorticoids), and liver disease (NSAIDs, colchicine). Careful consideration must be given to these comorbidities and contraindications as well as patient preferences.
1. Zhu Y, Pandya BJ, Choi HK. Prevalence of gout and hyperuricemia in the US general population: the National Health and Nutrition Examination Survey 2007-2008. Arthritis Rheum. 2011;63(10):3136-3141.
2. Zhu Y, Pandya BJ, Choi HK. Comorbidities of gout and hyperuricemia in the US general population: NHANES 2007-2008. Am J Med. 2012;125(7):679-687.e1.
3. Khanna D, Khanna PP, Fitzgerald JD, et al; American College of Rheumatology. 2012 American College of Rheumatology guidelines for management of gout. Part 2: therapy and antiinflammatory prophylaxis of acute gouty arthritis. Arthritis Care Res (Hoboken). 2012;64(10):1447-1461.
4. Bellamy N, Downie WW, Buchanan WW. Observations on spontaneous improvement in patients with podagra: implications for therapeutic trials of non-steroidal anti-inflammatory drugs. Br J Clin Pharmacol. 1987;24(1):33-36.
5. Terkeltaub RA, Furst DE, Bennett K, Kook KA, Crockett RS, Davis MW. High versus low dosing of oral colchicine for early acute gout flare: twenty-four-hour outcome of the first multicenter, randomized, double-blind, placebo-controlled, parallel-group, dose-comparison colchicine study. Arthritis Rheum. 2010;62(4):1060-1068.
6. Ahern MJ, Reid C, Gordon TP, McCredie M, Brooks PM, Jones M. Does colchicine work? The results of the first controlled study in acute gout. Aust N Z J Med. 1987;17(3):301-304.
7. Puig JG, Michán AD, Jiménez ML, et al. Female gout. Clinical spectrum and uric acid metabolism. Arch Intern Med. 1991;151(4):726-732.
8. van Durme CM, Wechalekar MD, Buchbinder R, Schlesinger N, van der Heijde D, Landewé RB. Non-steroidal anti-inflammatory drugs for acute gout. Cochrane Database Syst Rev. 2014;9:CD010120.
9. Schlesinger N, Moore DF, Sun JD, Schumacher HR Jr. A survey of current evaluation and treatment of gout. J Rheumatol. 2006;33(10):2050-2052.
10. Man CY, Cheung IT, Cameron PA, Rainer TH. Comparison of oral prednisolone/paracetamol and oral indomethacin/paracetamol combination therapy in the treatment of acute goutlike arthritis: a double-blind, randomized, controlled trial. Ann Emerg Med. 2007;49(5):670-677.
11. Janssens HJ, Lucassen PL, Van de Laar FA, Janssen M, Van de Lisdonk EH. Systemic corticosteroids for acute gout. Cochrane Database Syst Rev. 2008;(2):CD005521.
12. Fernández C, Noguera R, González JA, Pascual E. Treatment of acute attacks of gout with a small dose of intraarticular triamcinolone acetonide. J Rheumatol. 1999;26(10):2285-2286.
13. Burns CM, Wortmann RL. Gout therapeutics: new drugs for an old disease. Lancet. 2011;377(9760):165-177.
14. Axelrod D, Preston S. Comparison of parenteral adrenocorticotropic hormone with oral indomethacin in the treatment of acute gout. Arthritis Rheum. 1988;31(6):803-805.
15. Ritter J, Kerr LD, Valeriano-Marcet J, Spiera H. ACTH revisited: effective treatment for acute crystal induced synovitis in patients with multiple medical problems. J Rheumatol. 1994;21(4):696-699.
16. Sivera F, Andrés M, Carmona L, et al. Multinational evidence-based recommendations for the diagnosis and management of gout: integrating systematic literature review and expert opinion of a broad panel of rheumatologists in the 3e initiative. Ann Rheum Dis. 2014;73(2):328-335.
17. Nderitu P, Doos L, Jones PW, Davies SJ, Kadam UT. Non-steroidal anti-inflammatory drugs and chronic kidney disease progression: a systematic review. Fam Pract. 2013;30(3):247-255.
18. Wason S, Faulkner RD, Davis MW. Are dosing adjustments required for colchicine in the elderly compared with younger patients? Adv Ther. 2012;29(6):551-561.
19. Wason S, Mount D, Faulkner R. Single-dose, open-label study of the differences in pharmacokinetics of colchicine in subjects with renal impairment, including end-stage renal disease. Clin Drug Investig. 2014;34(12):845-855.
20. Hanlon JT, Aspinall SL, Semla TP, et al. Consensus guidelines for oral dosing of primarily renally cleared medications in older adults. J Am Geriatr Soc. 2009;57(2):335-340.
21. Crittenden DB, Lehmann RA, Schneck L, et al. Colchicine use is associated with decreased prevalence of myocardial infarction in patients with gout. J Rheumatol. 2012;39(7):1458-1464.
22. Esser N, Paquot N, Scheen AJ. Anti-inflammatory agents to treat or prevent type 2 diabetes, metabolic syndrome and cardiovascular disease. Expert Opin Investig Drugs. 2015;24(3):283-307.
23. Terkeltaub RA, Furst DE, Digiacinto JL, Kook KA, Davis MW. Novel evidence-based colchicine dose-reduction algorithm to predict and prevent colchicine toxicity in the presence of cytochrome P450 3A4/P-glycoprotein inhibitors. Arthritis Rheum. 2011;63(8):2226-2237.
24. Janssens HJ, Fransen J, van de Lisdonk EH, van Riel PL, van Weel C, Janssen M. A diagnostic rule for acute gouty arthritis in primary care without joint fluid analysis. Arch Intern Med. 2010;170(13):1120-1126.
25. Urano W, Yamanaka H, Tsutani H, et al. The inflammatory process in the mechanism of decreased serum uric acid concentrations during acute gouty arthritis. J Rheumatol. 2002;29(9):1950-1953.
26. Logan JA, Morrison E, McGill PE. Serum uric acid in acute gout. Ann Rheum Dis. 1997;56(11):696-697.
27. Ogdie A, Taylor WJ, Weatherall M, et al. Imaging modalities for the classification of gout: systematic literature review and meta-analysis. Ann Rheum Dis. 2015; 74(10):1868-1874.
28. Khanna D, Fitzgerald JD, Khanna PP, et al; American College of Rheumatology. 2012 American College of Rheumatology guidelines for management of gout. Part 1: systematic nonpharmacologic and pharmacologic therapeutic approaches to hyperuricemia. Arthritis Care Res (Hoboken). 2012;64(10):1431-1446.
29. Taylor TH, Mecchella JN, Larson RJ, Kerin KD, Mackenzie TA. Initiation of allopurinol at first medical contact for acute attacks of gout: a randomized clinical trial. Am J Med. 2012;125(11):1126-11134.e7.
30. Becker MA, MacDonald PA, Hunt BJ, Lademacher C, Joseph-Ridge N. Determinants of the clinical outcomes of gout during the first year of urate-lowering therapy. Nucleosides Nucleotides Nucleic Acids. 2008;27(6):585-591.
Gout is an extremely painful arthritis initiated by innate immune responses to monosodium urate crystals that accumulate in affected joints and surrounding tissues. As a result, gout is characterized by painful arthritis flares followed by intervening periods of disease quiescence. Over time, gout can lead to chronic pain, disability, and tophi. Nearly 10% of those aged > 65 years report having gout. The overall prevalence in the U.S. population approaches 4%.1
Gout treatment has 2 overarching goals: alleviating the pain and inflammation caused by acute gout attacks and long-term management that is focused on lowering serum urate (sUA) levels to reduce the risk of future attacks. Alleviating the pain and inflammation of an acute attack is often complicated by patient characteristics, namely, other chronic health conditions that frequently accompany gout, such as diabetes mellitus (DM), chronic kidney disease (CKD), hypertension, and cardiovascular disease (CVD).
Patients with gout tend to be older and have multiple comorbidities that require the use of many medications.2 Because the VA patient population tends to be older, acute gout and attendant complications of treatment are an important consideration for VA health care providers (HCPs).
Recently, the American College of Rheumatology (ACR) released management recommendations for gout, including those for the treatment of acute gout.3 The ACR recommends 3 first-line therapies, but limited guidance is provided for deciding among therapies. This article briefly reviews the relevant ACR recommendations and details important comorbidity and concomitant medication considerations in the treatment of acute gout.
Acute Gout Characteristics
Acute gout attacks are characterized by a rapid onset and escalation with joint pain typically peaking within 24 hours of attack onset. An acute attack often begins to remit after 5 to 12 days without intervention, but complete resolution may take longer in some patients.4 In one study, at 24 hours after attack onset, 16% of patients on placebo had > 50% reduction in pain compared with 70% that had no recovery at all.5 By 48 hours, one-third of patients on placebo achieved a 50% reduction in pain.6
Treatment Recommendations
Therapy for acute gout attacks aims to reduce pain and promote a full, early resolution. The ACR recommends pharmacologic therapy as first-line treatment with adjunctive topical ice and rest as needed.3 Typically, monotherapy is appropriate if the individual is experiencing mild-to-moderate pain affecting ≤ 2 joints of any size. Severe pain or attacks affecting multiple joints may benefit from initial combination therapy. Three first-line therapies are available: nonsteroidal anti-inflammatory drugs (NSAIDs) or cyclooxygenase-2 (COX-2) inhibitors, colchicine, or systemic glucocorticoids (Figure 2).
Few studies compare the efficacy of first-line therapeutic categories. There are no clinical trials directly comparing colchicine with NSAIDs or colchicine with glucocorticoids. No difference in mean reduction of pain and no differences in adverse events (AEs) were shown in a trial that compared glucocorticoids with NSAIDs.8 Thus, without further study, treatment choices made by HCPs are often guided by factors other than the existence of robust evidence.
Treatment with NSAIDs or COX-2 inhibitors should be initiated at the approved dose and continued until the gout attack has completely resolved. In one study, 73% of patients had pain reduction of ≥ 50% when taking NSAIDs relative to only 27% of patients on placebo.8 All available NSAIDs are considered effective, but only 3 NSAIDs are specifically approved for treatment of acute gout (naproxen, indomethacin, and sulindac). There is no evidence supporting one NSAID as being more effective than another; evidence fails to show a meaningful difference.8 Limited evidence indicates that selective COX-2 inhibitors, including celexocib, have similar efficacy as nonselective NSAIDs but may have fewer AEs, driven in part by fewer gastrointestinal (GI) events (6% vs 16% for GI events).8
Colchicine has long been used as prophylaxis for acute gout attacks and has been endorsed for the treatment of acute attacks. Recent evidence suggests that colchicine initially dosed at 1.2 mg followed by a single 0.6-mg dose 1 hour later is as effective with fewer AEs compared with a traditional regimen of 1.2 mg followed by 0.6 mg every hour for up to 6 hours.5 About 40% of patients have 50% pain reduction within 24 hours and a 40% absolute risk reduction in AEs on this low-dose regimen. The efficacy of colchicine relative to other therapies is poorly defined, especially for patients presenting longer after attack onset. The ACR guidelines recommend colchicine only if treatment is initiated within 36 hours of attack onset, but this is based solely on expert consensus. Likewise, the above trial for low-dose colchicine did not provide information about dosing beyond the first 6 hours, leaving little guidance for follow-up treatment of residual pain beyond the 32 hours reported.5 Traditionally, one 0.6-mg dose is provided every 12 to 24 hours.3
Systemic glucocorticoids are also commonly used in treating acute gout.9 There was a small pain reduction benefit for prednisolone, but the difference was not clinically significant in one clinical trial comparing oral prednisolone 30 mg daily for 5 days vs a combination of indomethacin for 5 days and an initial intramuscular injection of diclofenac 75 mg.10 The prednisolone group also had fewer patients with AEs, including abdominal pain (0% vs 30%) and GI bleeding (0% vs 11%). The lower incidence of short-term AEs may be a primary benefit of systemic glucocorticoids.11
Intra-articular glucocorticoids are not suggested first-line therapies but are commonly used by rheumatologists.9 In an uncontrolled study conducted by Fernández and colleagues, intra-articular glucocorticoid injections helped to quickly resolve 20 out of 20 crystal-proven gout attacks.12 However, no randomized controlled trials have examined this approach. Although seemingly efficacious, other considerations are important for this modality. Intra-articular glucocorticoids may not be preferred for polyarticular attacks or attacks in difficult-to-aspirate joints. Additionally, intra-articular glucocorticoids have been anecdotally associated with rebound attacks (ie, attacks that occur shortly after resolution without other interventions). However, the Fernández study had no such attacks occur among participants.12 Finally, septic arthritis must be ruled out as in any case of acute onset monoarticular arthritis.
Biologic agents targeting interleukin-1(IL-1) are not currently approved for gout, although there is burgeoning data suggesting that this strategy may have substantial merit.13 Additionally, there is limited evidence that adrenocorticotropic hormone (ACTH) may provide rapid pain relief when other available therapies are ineffective or contraindicated. However, ACTH studies have not provided robust trial designs, and drug costs remain substantial, thus limiting the widespread use of ACTH in acute gout.14,15 Anti-IL-1 agents and ACTH may both be considered as second-line options if first-line therapies are contraindicated or fail. Careful consideration should be given to AE profiles, patient preferences, and cost.
Comorbidities
Acute gout care, especially in the context of comorbidities, has been identified as a critical treatment concern by an international panel of rheumatologists as part of the 3e (Evidence, Expertise, Exchange) Initiative.16 However, regular clinical trial exclusion criteria have limited data necessary to guide treatment when comorbidities are present. Therefore, studies of acute gout treatment in the context of disease comorbidity represents a major unmet need in understanding and optimizing gout care.
Chronic Kidney Disease
Chronic kidney disease is common in gout; 20% of patients with gout have an estimated glomerular filtration rate (eGFR) of < 30 mL/min.2 Thus, CKD is an important consideration when deciding the best treatment for acute gout. The ACR recommendations do not provide specific guidance on NSAID use in CKD but suggest the potential option of tapering the dose as pain begins to resolve. There is mixed evidence that NSAIDs accelerate CKD progression with the best evidence for high-dose NSAID use.17 When prescribing the concomitant use of NSAIDs with other medications affecting kidney function, HCPs should consider CKD.
For colchicine, current labeling and evidence indicate that no dose adjustments are needed for stage 3 or better CKD (eGFR ≥ 60 mL/min) even among the elderly.18,19 Although labeling indicates that a single unadjusted dose (0.6 mg) can be given once every 2 weeks for those with severe CKD (eGFR < 30 mL/min) or for those who are on dialysis, alternative therapies should be considered, as AEs increase with decreasing renal function.19 Colchicine should not be used in those with eGFR < 10 mL/min.20 All patients who have CKD and are treated with colchicine should be informed of the AEs and closely observed for signs of toxicity, including blood dyscrasias, neuromyopathy, emesis, or diarrhea.
Considering the potential complications for NSAIDs and colchicine, patients with CKD may be good candidates for glucocorticoid therapy, administered either systemically or as an intra-articular injection. Alternatively, second-line agents such as ACTH or IL-1 inhibition may be considered in such patients.
Hypertension
Hypertension is one of the most common comorbidities among patients with gout. It is important for HCP consideration when deciding treatment. Poorly controlled hypertension is a contraindication for both NSAIDs and systemic glucocorticoids. Patients with hypertension in the absence of significant renal impairment may be good candidates for colchicine.
Diabetes and Hyperlipidemia
Glucocorticoids should be avoided if possible in the setting of inadequately controlled type 2 DM (T2DM) or hyperlipidemia. Glucocorticoids exacerbate insulin resistance and stimulate glucose secretion from the liver. This can create substantial and sometimes dangerous fluctuations in circulating glucose concentrations. Additionally, glucocorticoids may increase serum triglycerides and low-density lipoprotein levels. Thus, patients with T2DM or hyperlipidemia may be good candidates for alternative treatments, such as colchicine or NSAIDs.
Cardiovascular Disease
Cardiovascular disease risk has been shown to increase with the use of COX-2 inhibitors. This risk may be present for all NSAIDs. Current FDA labeling suggests limiting NSAID and COX-2 inhibitor use in patients with a history of myocardial infarction (MI), congestive heart failure, or stroke. Given the potential impact on cardiovascular risk factors, including hypertension, T2DM, and hyperlipidemia, glucocorticoids may not be ideal for patients with known CVD or those at high risk.
Recent evidence has shown that colchicine use is associated with a lower risk of MI among patients with gout.21 These results, in addition to a proposed dual role of IL-1 in both gout and CVD, suggest that either colchicine or IL-1 inhibitors may be rational agents in the treatment of acute gout in the context of CVD.22
Hepatic Impairment and GI Bleeding
Patients with cirrhosis should avoid NSAID use due to the potential increased bleeding risk from underlying coagulopathy. Additionally, colchicine clearance may be reduced in patients with severe liver impairment, mandating close surveillance when this agent is used. If hepatic impairment is mild to moderate, judicious use of any of the first-line therapies may be appropriate.
Patients with GI bleeding or a history of peptic ulcer disease should avoid NSAID use because of increased bleeding risk. If an NSAID is used, proton pump inhibitors decrease the risk of NSAID-associated mucosal damage.
Drug Interactions
Colchicine is metabolized by the cytochrome P450 3A4 enzyme (CYP3A4) and is a substrate for P-glycoprotein (P-gp). Therefore, concomitant use of colchicine with potent inhibitors of CYP3A4 or P-gp should be avoided when possible. These agents include macrolide antibiotics (clarithromyocin), calcium channel blockers (verapamil and diltiazem), and cyclosporine (commonly used in transplant patients who are at high risk for gout). New evidence-based dosing recommendations indicate that no dose reduction is required with azithromyocin.23
Nonsteroidal anti-inflammatory drugs are contraindicated with the concomitant use of angiotensin-converting enzyme (ACE) inhibitors and/or diuretics. Prostaglandin production is decreased while using NSAIDs, resulting in increased constriction of afferent renal arterioles and decreased glomerular filtration pressure. This physiologic effect of NSAIDs can be exacerbated when used in combination with ACE inhibitors or diuretics, both of which can also reduce glomerular filtration pressures. Combination therapy with either ACE inhibitors or diuretics increases the risk for NSAID-mediated acute kidney injury. Additionally, NSAID use should be avoided in patients taking anticoagulants such as warfarin or heparin due to increased bleeding risk.
Diagnosis
Diagnosis is a key component of proper treatment of acute gout. A gout diagnosis is usually made based on clinical signs and symptoms, including sudden onset of pain that peaks within 24 hours, past history of acute self-limited attacks of arthritis, first MTP involvement, and an elevated sUA. However, not all these factors must be present. In a study conducted by Janssens and colleagues, these factors plus additional demographics had a sensitivity of 90% and specificity of 65% when compared with crystal diagnosis.24 However, a normal sUA level does not exclude gout as a diagnosis due to the uricosuric effect of the inflammatory process.25 In fact, one observational cohort recorded an average sUA decrease from baseline of 2 mg/dL during an acute gout attack.26
Alternative diagnoses, including septic arthritis, should be considered, particularly in the context of treatment failure (< 50% reduction in pain) within the first 24 to 48 hours. A definitive diagnosis is made by identifying negatively birefringent crystals in the synovial fluid of the affected joint (using polarized microscopy) with negative cultures. In the absence of crystal confirmation, there is an emerging role for imaging in gout diagnosis, including the use of ultrasound and dual-energy computed tomography.27
Long-term Treatment Considerations
During treatment for acute gout attacks, urate-lowering therapy that was initiated before the attack should not be discontinued.28 There is no evidence to suggest that current urate lowering has any AEs during attacks. However, removing treatment may increase sUA levels, precipitating attacks in other joints by “destabilizing” crystals still present. Current recommendations also state that urate-lowering therapy may be started during an attack despite traditionally being deferred until the attack has resolved.28 In a randomized trial comparing a group starting allopurinol 300 mg during an attack vs a placebo group (with all patients receiving anti-inflammatory treatment for the acute attack), there was no difference in pain outcomes.29 Regardless of the chosen timing, lowering and maintaining sUA ≤ 6.0 mg/dL is the primary method for minimizing long-term risk of gout attacks.28
Health care providers should discuss with patients the likely need for indefinite urate-lowering therapy while noting that attacks related to therapy initiation are relatively common.30 Current guidelines recommend starting urate-lowering therapy in low doses (≤ 100 mg/d for allopurinol) and titrating to achieve and maintain the target sUA level. Along with the judicious use of anti-inflammatory prophylaxis, this may minimize attacks related to therapy initiation.3,28 By lowering and maintaining sUA below the target level, monosodium urate crystals will dissolve, thereby eliminating the major inciting factor of acute attacks.
Other day-to-day triggers such as alcohol, meat or seafood consumption, and dehydration exist for some patients with gout. Patients should be informed of these inciting factors, as they could potentially be avoided, reducing the risk of future gout attacks. It is important to recognize, however, that dietary or behavioral interventions have generally yielded only modest sUA reductions. For the majority of patients, therefore, reduction and maintenance of sUA ≤ 6.0 mg/dL requires pharmacologic intervention.
Conclusions
Gout attacks should be treated immediately with pharmacologic treatment when contraindications are absent. First-line treatment options include NSAIDs, colchicine, and systemic glucocorticoids. Use of these modalities can be complicated because of comorbidity and concomitant medication use that is prevalent among patients with gout. Comorbidities commonly limiting treatment choice include hypertension (NSAIDs, glucocorticoids), CKD (NSAIDS, colchicine), CVD (NSAIDs, COX-2 inhibitors, glucocorticoids), T2DM (glucocorticoids), and liver disease (NSAIDs, colchicine). Careful consideration must be given to these comorbidities and contraindications as well as patient preferences.
1. Zhu Y, Pandya BJ, Choi HK. Prevalence of gout and hyperuricemia in the US general population: the National Health and Nutrition Examination Survey 2007-2008. Arthritis Rheum. 2011;63(10):3136-3141.
2. Zhu Y, Pandya BJ, Choi HK. Comorbidities of gout and hyperuricemia in the US general population: NHANES 2007-2008. Am J Med. 2012;125(7):679-687.e1.
3. Khanna D, Khanna PP, Fitzgerald JD, et al; American College of Rheumatology. 2012 American College of Rheumatology guidelines for management of gout. Part 2: therapy and antiinflammatory prophylaxis of acute gouty arthritis. Arthritis Care Res (Hoboken). 2012;64(10):1447-1461.
4. Bellamy N, Downie WW, Buchanan WW. Observations on spontaneous improvement in patients with podagra: implications for therapeutic trials of non-steroidal anti-inflammatory drugs. Br J Clin Pharmacol. 1987;24(1):33-36.
5. Terkeltaub RA, Furst DE, Bennett K, Kook KA, Crockett RS, Davis MW. High versus low dosing of oral colchicine for early acute gout flare: twenty-four-hour outcome of the first multicenter, randomized, double-blind, placebo-controlled, parallel-group, dose-comparison colchicine study. Arthritis Rheum. 2010;62(4):1060-1068.
6. Ahern MJ, Reid C, Gordon TP, McCredie M, Brooks PM, Jones M. Does colchicine work? The results of the first controlled study in acute gout. Aust N Z J Med. 1987;17(3):301-304.
7. Puig JG, Michán AD, Jiménez ML, et al. Female gout. Clinical spectrum and uric acid metabolism. Arch Intern Med. 1991;151(4):726-732.
8. van Durme CM, Wechalekar MD, Buchbinder R, Schlesinger N, van der Heijde D, Landewé RB. Non-steroidal anti-inflammatory drugs for acute gout. Cochrane Database Syst Rev. 2014;9:CD010120.
9. Schlesinger N, Moore DF, Sun JD, Schumacher HR Jr. A survey of current evaluation and treatment of gout. J Rheumatol. 2006;33(10):2050-2052.
10. Man CY, Cheung IT, Cameron PA, Rainer TH. Comparison of oral prednisolone/paracetamol and oral indomethacin/paracetamol combination therapy in the treatment of acute goutlike arthritis: a double-blind, randomized, controlled trial. Ann Emerg Med. 2007;49(5):670-677.
11. Janssens HJ, Lucassen PL, Van de Laar FA, Janssen M, Van de Lisdonk EH. Systemic corticosteroids for acute gout. Cochrane Database Syst Rev. 2008;(2):CD005521.
12. Fernández C, Noguera R, González JA, Pascual E. Treatment of acute attacks of gout with a small dose of intraarticular triamcinolone acetonide. J Rheumatol. 1999;26(10):2285-2286.
13. Burns CM, Wortmann RL. Gout therapeutics: new drugs for an old disease. Lancet. 2011;377(9760):165-177.
14. Axelrod D, Preston S. Comparison of parenteral adrenocorticotropic hormone with oral indomethacin in the treatment of acute gout. Arthritis Rheum. 1988;31(6):803-805.
15. Ritter J, Kerr LD, Valeriano-Marcet J, Spiera H. ACTH revisited: effective treatment for acute crystal induced synovitis in patients with multiple medical problems. J Rheumatol. 1994;21(4):696-699.
16. Sivera F, Andrés M, Carmona L, et al. Multinational evidence-based recommendations for the diagnosis and management of gout: integrating systematic literature review and expert opinion of a broad panel of rheumatologists in the 3e initiative. Ann Rheum Dis. 2014;73(2):328-335.
17. Nderitu P, Doos L, Jones PW, Davies SJ, Kadam UT. Non-steroidal anti-inflammatory drugs and chronic kidney disease progression: a systematic review. Fam Pract. 2013;30(3):247-255.
18. Wason S, Faulkner RD, Davis MW. Are dosing adjustments required for colchicine in the elderly compared with younger patients? Adv Ther. 2012;29(6):551-561.
19. Wason S, Mount D, Faulkner R. Single-dose, open-label study of the differences in pharmacokinetics of colchicine in subjects with renal impairment, including end-stage renal disease. Clin Drug Investig. 2014;34(12):845-855.
20. Hanlon JT, Aspinall SL, Semla TP, et al. Consensus guidelines for oral dosing of primarily renally cleared medications in older adults. J Am Geriatr Soc. 2009;57(2):335-340.
21. Crittenden DB, Lehmann RA, Schneck L, et al. Colchicine use is associated with decreased prevalence of myocardial infarction in patients with gout. J Rheumatol. 2012;39(7):1458-1464.
22. Esser N, Paquot N, Scheen AJ. Anti-inflammatory agents to treat or prevent type 2 diabetes, metabolic syndrome and cardiovascular disease. Expert Opin Investig Drugs. 2015;24(3):283-307.
23. Terkeltaub RA, Furst DE, Digiacinto JL, Kook KA, Davis MW. Novel evidence-based colchicine dose-reduction algorithm to predict and prevent colchicine toxicity in the presence of cytochrome P450 3A4/P-glycoprotein inhibitors. Arthritis Rheum. 2011;63(8):2226-2237.
24. Janssens HJ, Fransen J, van de Lisdonk EH, van Riel PL, van Weel C, Janssen M. A diagnostic rule for acute gouty arthritis in primary care without joint fluid analysis. Arch Intern Med. 2010;170(13):1120-1126.
25. Urano W, Yamanaka H, Tsutani H, et al. The inflammatory process in the mechanism of decreased serum uric acid concentrations during acute gouty arthritis. J Rheumatol. 2002;29(9):1950-1953.
26. Logan JA, Morrison E, McGill PE. Serum uric acid in acute gout. Ann Rheum Dis. 1997;56(11):696-697.
27. Ogdie A, Taylor WJ, Weatherall M, et al. Imaging modalities for the classification of gout: systematic literature review and meta-analysis. Ann Rheum Dis. 2015; 74(10):1868-1874.
28. Khanna D, Fitzgerald JD, Khanna PP, et al; American College of Rheumatology. 2012 American College of Rheumatology guidelines for management of gout. Part 1: systematic nonpharmacologic and pharmacologic therapeutic approaches to hyperuricemia. Arthritis Care Res (Hoboken). 2012;64(10):1431-1446.
29. Taylor TH, Mecchella JN, Larson RJ, Kerin KD, Mackenzie TA. Initiation of allopurinol at first medical contact for acute attacks of gout: a randomized clinical trial. Am J Med. 2012;125(11):1126-11134.e7.
30. Becker MA, MacDonald PA, Hunt BJ, Lademacher C, Joseph-Ridge N. Determinants of the clinical outcomes of gout during the first year of urate-lowering therapy. Nucleosides Nucleotides Nucleic Acids. 2008;27(6):585-591.
Minimum 5-Year Results With Duracon Press-Fit Metal-Backed Patellae
The metal-backed patella was originally designed to address the shortcomings of cemented, all-polyethylene patellae: deformation, aseptic loosening, stress fractures of polyethylene, and possible thermal damage from bone cement.1-3 Several long-term studies have found very good outcomes with use of all-polyethylene patellae.4-6 However, complications of using an all-polyethylene patella reportedly accounted for up to half of all knee revisions, and during revision surgery patellar bone stock was often found to have been compromised.7
The intention behind the design of press-fit metal-backed patellae was to address the shortcomings of all-polyethylene patellae by eliminating the need for bone cement and providing stiffness that would help resist polyethylene deformation while decreasing implant–bone interface stresses.8 However, early design iterations of metal-backed patellae demonstrated short-term failures—most commonly, local polyethylene wear damaging the locking mechanism and subsequent dissociation or fracture from the metal baseplate; polyethylene delamination from the metal baseplate; and failure of interface fixation.9,10 On the other hand, good fixation with bony ingrowth was observed in both titanium and cobalt-chromium porous-coated patellae.1,3,9,11-13 Overall, however, negative outcomes reported for metal-backed patellae led many surgeons to abandon these components and return to using cemented all-polyethylene patellae.
Negative outcomes of earlier metal-backed patellae designs have overshadowed reports of positive outcomes achieved with careful attention paid to component design, patellar tracking, and surgical technique.2,3,14 Subsequent design improvements (eg, a third stabilizing peg, thicker polyethylene, improved conformity) produced excellent outcomes.8,12,15 The advantages of using a metal-backed patella (eg, uniform load sharing, decreased polyethylene deformation, potential for biological fixation) may be unjustly outweighed by the fear of patellar component failure.3
Our 30-plus years of experience with metal-backed patellar components reflect the evolving effect of component design on outcome. Much as reported elsewhere, we found earlier component failures were caused by poor locking mechanisms, thin polyethylene, poor tracking, and minimal femur contact. Over the past decade, however, our outcomes with Duracon metal-backed patellae (Stryker) have been encouraging. We think these positive outcomes, seen over minimum 5-year follow-up, are largely attributable to the thicker polyethylene and improved articular conformity of this component relative to earlier designs. We have also found it helpful to adhere to certain criteria when implanting metal-backed patellae, and we think adhering to these criteria, along with improved component design, indicates use of press-fit metal-backed patellae. In this article, we report our failure incidence with use of this device at minimum 5-year follow-up.
Materials and Methods
In this single-center study, we performed clinical and independent radiographic reviews of 88 primary press-fit metal-backed patellae with minimum 5-year follow-up. All components were the same design (Duracon metal-backed patella) from the same manufacturer (Stryker).
This study, which began in September 2003, was reviewed and approved by the Western Institutional Review Board (WIRB). Either the investigator (Dr. Hedley) or the clinical study coordinator gave study candidates a full explanation of the study and answered any questions. Patients who still wanted to participate in the study signed WIRB consent forms after their index surgery but before minimum 5-year follow-up.
Device Description
This Duracon patella has a porous-coated cobalt-chromium metal back intended for press-fit fixation, 3 cobalt-chromium porous-coated pegs, and a preassembled polyethylene anterior surface (Figure 1). Four sizes are available to fit the peripheral shape of the resected patella.
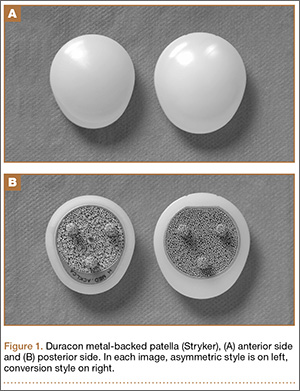
This patella has 3 styles: symmetric, asymmetric, and conversion. In this study, we used only the asymmetric and conversion styles. The design of each style incorporates medial/lateral facets intended to conform to the convex intercondylar radii of the femoral component, thereby allowing the patella to ride deeply in the recessed patellofemoral groove. The asymmetric patella is a resurfacing component with a generous polyethylene thickness (4.6 mm at its thinnest) and a larger lateral facet for more bone coverage. The asymmetric patella naturally medializes component placement. The articulating surface of the conversion patella is identical to that of the asymmetric patella. However, the conversion patella allows for exchange of the polyethylene portion of the implant without revising a stable, well-fixed metal baseplate.
Patient Selection
Candidates were recruited from a group of metal-backed patella patients within Dr. Hedley’s medical practice. All candidates had undergone primary total knee arthroplasty and received a Duracon press-fit metal-backed patella. All recruited patients had undergone primary knee arthroplasty at least 5 years before clinical and radiographic evaluation. Patients were included in the study if they had a diagnosis of noninflammatory degenerative joint disease (eg, osteoarthritis, traumatic arthritis, avascular necrosis). Patients with body mass index higher than 40 were excluded from the study.
Surgical Technique
The patella is everted completely or as much as feasible. Debridement is done circumferentially around the patella. Adherent fat and pseudomeniscus are stripped back until the surgeon sees the entry point of the quadriceps tendon fibers above and the patella tendon fibers below. The cut is then made at this level to remove as much bone as needed to restore the normal height of the patella with the implant in place. The cut is usually made by hand—without guides but with the patella stabilized with a towel clip above and below to prevent any movement during the action.
The desired cut must be absolutely planar, and this should be checked by placing the edge of the blade across the interface. Repeated passes with the saw blade are needed if the cut is not 100% planar. Once the cut is made, the patella is sized with the patella sizers and drill guide. After the appropriate size is selected, the patella is drilled with a bit that is slightly undersized from the size of the pegs (1/32 inch smaller than the bit supplied by the manufacturer).
Once the patella is prepared, the rest of the knee arthroplasty is performed. The patella is press-fit as the last component to be inserted.
Radiologic Review
Radiographic analysis was performed by an independent reviewer according to the current Knee Society total knee arthroplasty roentgenographic evaluation and scoring system (Figure 2).16 The reviewer was an orthopedist specializing in hip and knee surgery. Radiographs the reviewer deemed questionable were shown to another independent hip and knee surgeon for validation. In all cases, the second reviewer confirmed the first reviewer’s initial recorded observations.

KSS (Knee Society Scale), WOMAC (Western Ontario and McMaster Universities Arthritis Index), and SF-36 (36-Item Short Form Health Survey) were also used to evaluate effectiveness in this protocol.
Survivorship Calculations
Kaplan-Meier survivorship was determined for all metal-backed patellae. For survival analysis, only knees with radiographic data were included (74 knees). Mean follow-up was 75.8 months (range, 60-105 months).
Seventy-four patients (88 knees) met the study criteria (Table). At minimum 5-year follow-up, complete data were acquired for 59 patients (72 knees). Of the total group, 14 knees did not have radiographic data. Those knees were categorized as lost to follow-up and were excluded from the survivorship analysis. The status of patients enrolled in the study at minimum 5-year follow-up is shown in the Table.
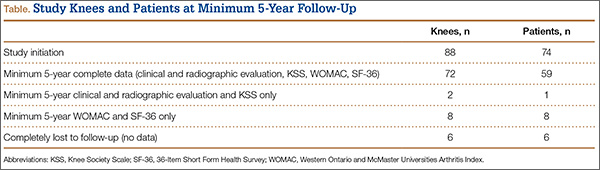
Mann-Whitney U test (nonparametric t test) was used to compare WOMAC and SF-36 scores between the “complete” and the “WOMAC and SF-36 only” data groups.
Statistical Analysis
Kaplan-Meier survivorship probabilities (asymmetric method) were calculated using SAS Version 9.2 (SAS Institute); 95% pointwise confidence limits were used.
The Mann-Whitney U test is a nonparametric analogue to the independent-samples t test. It was used here to compare WOMAC and SF-36 scores of patients with “complete” data with scores of patients with “WOMAC and SF-36 only” data. In either group, for patients who had primary bilateral knee arthroplasty, mean WOMAC and SF-36 scores were used.
Comparisons were made between the unilateral and bilateral knee arthroplasty groups. There were no differences in age, height, or weight (Mann-Whitney U test) or in sex, primary diagnosis, or number of patients lost to follow-up (Fisher exact test). Fisher exact test (vs χ2 test) was used for the contingency table analysis because of small cell sizes (eg, ≤10 females in ‘‘both knees” group), suggesting the unilateral and bilateral patients did not differ in demographics.
For all patient-reported questionnaires, bilateral patients were given the opportunity to note any differences between their knee arthroplasties, but none of these patients made any special notations. We interpreted this to mean that all survey responses from bilateral patients were applicable to both knee arthroplasties.
Results
Seventy-four patients (88 knees) were enrolled in the study: 31 women (41.2%) and 43 men (58.1%). At time of surgery, mean age was 59.7 years (range, 40-86 years), and mean body mass index was 30.6 (range, 19.1-39.6). Eighty-three knees were diagnosed with osteoarthritis, and 5 knees were diagnosed with posttraumatic arthritis. Mean time to follow-up was 74.8 months (range, 60-105 months). Fourteen knees (14 patients) were considered lost to follow-up. However, 8 patients (8 knees) were contacted by telephone about the status of their knee(s), and all 8 completed and returned the minimum 5-year follow-up WOMAC and SF-36 forms; they did not return for their minimum 5-year clinical or radiographic evaluations.
Asymmetric patellae were used in 24 knees, conversion patellae in 64 knees (88 knees total). Forty-nine months after surgery, 1 patella was revised for loosening at its interface with the bone. The 51-year-old active female patient’s asymmetric patella was revised to a conversion patella. The decision to implant another metal-backed device was based on its high density; proper intrusion of acrylic cement would have been questionable. Some early wear was observed on the tibial insert, which was replaced. Sixty-eight months after the revision, the patient was asymptomatic, with a KSS Pain score of 96 and a KSS Function score of 100 (Figure 3). Another revision, for tibial insert exchange only, was performed 48 months after surgery. During this revision, the patella was evaluated and found to be well fixed and functioning normally.
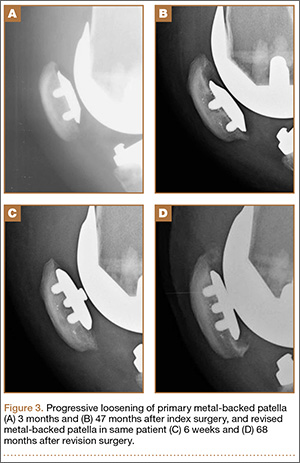
Survivorship of the Duracon metal-backed patella at minimum 5-year follow-up was estimated to be 93.95%, with bounds of 73.61% and 98.74%.
Radiographic analysis revealed no radiolucencies larger than 1 mm (Figure 4). Seventeen 1-mm radiolucencies were recorded: 6 (35.3%) in zone 1, 2 (11.8%) in zone 2, and 9 (52.9%) in zone 4. Twelve (70.6%) of the 17 radiolucencies were in the left knee. Nine radiolucencies were in women and 8 in men. Most (55.6%) of the women’s radiolucencies were in zone 1, and most (75.0%) of the men’s were in zone 4. There were no loose beads other than in the case that was later revised.
KSS, WOMAC, and SF-36 scores and radiographic reviews were used to evaluate effectiveness in accordance with the protocol. At minimum 5-year follow-up, mean KSS Pain score was 94.10 (range, 55-100), and mean KSS Function score was 92.67 (range, 60-100). Mean WOMAC score was 2.21 (range, 0-19.70), mean SF-36 Physical score was 83.65 (range, 30.70-100), and mean SF-36 Mental score was 89.41 (range, 1.4-100).
The preceding calculations do not include WOMAC and SF-36 data for the 8 patients (8 knees) who were counted as lost to follow-up but who submitted minimum 5-year follow-up data. We compared these 8 patients with the 60 patients (74 knees) who had complete WOMAC and SF-36 data at the end of the study in order to determine whether there were any statistically significant differences between the 2 groups’ mean scores. No statistically significant differences were detected in any WOMAC or SF-36 category (α = 0.05).
Discussion
Metal-backed patellar components were originally designed to address the shortcomings (eg, fracture, deformation, aseptic loosening) of cemented all-polyethylene patellae.1-3 It was thought that the stiffness of the metal could help resist polyethylene deformation and that the press-fit interface with bone might eliminate issues related to bone cement.8 However, short-term failures were reported with early metal-backed designs.9,10 At the same time, good fixation with bone ingrowth was observed in both titanium and cobalt-chromium porous-coated patellae.1,3,9-12,17 Further, reports of poor outcomes with some metal-backed patella designs overshadowed reports of positive outcomes.2,3 In all reports (of both poor and positive outcomes), component design, patellar tracking, and surgical technique were cited as contributing to implant success.2,3,14,17,18 Subsequent design improvements (eg, use of a third stabilizing peg, thicker polyethylene, improved conformity) produced excellent outcomes.8,12,15
Our early results are similar to those reported in the literature, and we observed markedly better outcomes that we think resulted from component design improvements. Over the past decade, this has been particularly true with our use of the Duracon metal-backed patella, which has thicker polyethylene, better articular conformity, and a third stabilizing peg, all of which were previously noted as contributing to a successful metal-backed patellar component.2,12,14,15,19 In our study, all 72 knees radiographically evaluated and independently reviewed at minimum 5-year follow-up had well-fixed press-fit metal-backed patellae. Seventeen patellae had 1-mm radiolucencies; the other 59 had no radiolucencies in any zone around the patella–bone interface.
One of the most important aspects of removing a metal-backed patellar component from a patella is that the remaining bone stock is often far superior to the stock available after revision of a cemented patella. Careful removal should leave an excellent bony bed for reimplantation.
We think that surgeons should adhere to certain indications and contraindications when implanting metal-backed patellae and that doing so can contribute to successful outcomes. Type of bone stock available should be considered, as successful biological fixation relies on a good blood supply. A dense (or thin) patella in which intrusion of acrylic cement is improbable or impossible may favor use of a metal-backed patella. Cement is not an adhesive but a grout, so successful cementation requires intrusion of cement into the interstices of the cancellous bone. As adequate intrusion of cement into dense bone is not possible, cementation may not be the best option. Some patellae have failed because of peg “shear-off,”9 likely caused not by failure of peg strength but by failure of cement fixation at the nonpeg interface.20,21 Polyethylene pegs fail when used as the sole method of fixation (they were never designed for that). In addition, we think younger patients are often indicated for a metal-backed patella because, over the long term, loosening of a cemented patella (and the accompanying stress shielding and osteolysis) may cause severe patellar bone destruction. Last, we have found that abnormally high or small patellae are not good candidates for cement fixation because they tend to work themselves loose riding on and off the superior flange. These types of patellae appear to have a much sturdier and longer lasting interface than cement, once biological fixation has occurred.
In summary, we think the indications for a metal-backed implant are a patella that is dense or sclerotic; a patella that is thin, abnormally high, or small; and a younger patient. In addition, a metal-backed implant is not indicated for soft, osteoporotic bone.
This study had a few limitations. Fourteen knees (14 patients), or 15.9% of all knees in the study, were categorized as lost to follow-up. Comparing the WOMAC and SF-36 scores of 8 patients (8 knees) who completed minimum 5-year follow-up but were not clinically evaluated with the scores of patients who had complete data, we found no statistically significant differences in any category. However, 5-year follow-up clinical data were available for those 8 patients. Nevertheless, 74 knees were available for radiologic evaluation, and during telephone interviews all 8 patients indicated they had their original implant(s) and were asymptomatic.
Our experience with the Duracon metal-backed patella has been encouraging. In the study reported here, there were no failures caused by dissociation of plastic. We think that, because the porous coating is under almost constant compression, biological fixation is likely in most instances, as observed in our minimum 5-year radiologic results. Given our minimum 5-year follow-up results with uncemented metal-backed patellae, we think their use may be a viable alternative to use of all-polyethylene patellae.
1. Firestone TP, Teeny SM, Krackow KA, Hungerford DS. The clinical and roentgenographic results of cementless porous-coated patellar fixation. Clin Orthop Relat Res. 1991;273:184-189.
2. Laskin RS, Bucknell A. The use of metal-backed patellar prostheses in total knee arthroplasty. Clin Orthop Relat Res. 1990;260:52-55.
3. Evanich CJ, Tkach TK, von Glinski S, Camargo MP, Hofmann AA. 6- to 10-year experience using countersunk metal-backed patellas. J Arthroplasty. 1997;12(2):149-154.
4. Schwartz AJ, Della Vale CJ, Rosenberg AG, Jacobs JJ, Berger RA, Galante JO. Cruciate-retaining TKA using a third-generation system with a four-pegged tibial component: a minimum 10-year followup note. Clin Orthop Relat Res. 2010;468(8):2160-2167.
5. Bisschop R, Brouwer RW, Van Raay JJ. Total knee arthroplasty in younger patients: a 13-year follow-up study. Orthopedics. 2010;33(12):876-880.
6. Dixon MC, Brown RR, Parsch D, Scott RD. Modular fixed-bearing total knee arthroplasty with retention of the posterior cruciate ligament. A study of patients followed for a minimum of fifteen years. J Bone Joint Surg Am. 2005;87(3):598-603.
7. Brick GW, Scott RD. The patellofemoral component of total knee arthroplasty. Clin Orthop Relat Res. 1988;231)163-178.
8. Garcia RM, Kraay MJ, Goldberg VM. Isolated all-polyethylene patellar revisions for metal-backed patellar failure. Clin Orthop Relat Res. 2008;466(11):2784-2789.
9. Rosenberg AG, Andriacchi TP, Barden R, Galante JO. Patellar component failure in cementless total knee arthroplasty. Clin Orthop Relat Res. 1988;(236):106-114.
10. Stulberg SD, Stulberg BN, Hamati Y, Tsao A. Failure mechanisms of metal-backed patellar components. Clin Orthop Relat Res. 1988;236:88-105.
11. Sundfeldt M, Johansson CB, Regner L, Albrektsson T, Carlsson LV. Long-term results of a cementless knee prosthesis with a metal-backed patellar component: clinical and radiological follow-up with histology from retrieved components. J Long Term Eff Med Implants. 2003;13(4):341-354.
12. Kraay MJ, Darr OJ, Salata MJ, Goldberg VM. Outcome of metal-backed cementless patellar components: the effect of implant design. Clin Orthop Relat Res. 2001;392:239-244.
13. Jensen LN, Lund B, Gotfredsen K. Bone growth into a revised porous-coated patellar implant. Acta Orthop Scand. 1990;61(3):213-216.
14. Hsu HP, Walker PS. Wear and deformation of patellar components in total knee arthroplasty. Clin Orthop Relat Res. 1989;246:260-265.
15. Jordan LR, Sorrells RB, Jordan LC, Olivo JL. The long-term results of a metal-backed mobile bearing patella. Clin Orthop Relat Res. 2005;436:111-118.
16. Ewald FC. The Knee Society total knee arthroplasty roentgenographic evaluation and scoring system. Clin Orthop Relat Res. 1989;248:9-12.
17. Bayley JC, Scott RD, Ewald FC, Holmes GB Jr. Failure of the metal-backed patellar component after total knee replacement. J Bone Joint Surg Am. 1988;70(5):668-674.
18. Lombardi AV Jr, Engh GA, Volz RG, Albrigo JL, Brainard BJ. Fracture/dissociation of the polyethylene in metal-backed patellar components in total knee arthroplasty. J Bone Joint Surg Am. 1988;70(5):675-679.
19. Moreland JR. Mechanisms of failure in total knee arthroplasty. Clin Orthop Relat Res. 1988;226:49-64.
20. Francke EI, Lachiewicz PF. Failure of a cemented all-polyethylene patellar component of a press-fit condylar total knee arthroplasty. J Arthroplasty. 2000;15(2):234-237.
21. Stulberg BN, Wright TM, Stoller AP, Mimnaugh KL, Mason JJ. Bilateral patellar component shear failure of highly cross-linked polyethylene components: report of a case and laboratory analysis of failure mechanisms. J Arthroplasty. 2012;27(5):789-796.
The metal-backed patella was originally designed to address the shortcomings of cemented, all-polyethylene patellae: deformation, aseptic loosening, stress fractures of polyethylene, and possible thermal damage from bone cement.1-3 Several long-term studies have found very good outcomes with use of all-polyethylene patellae.4-6 However, complications of using an all-polyethylene patella reportedly accounted for up to half of all knee revisions, and during revision surgery patellar bone stock was often found to have been compromised.7
The intention behind the design of press-fit metal-backed patellae was to address the shortcomings of all-polyethylene patellae by eliminating the need for bone cement and providing stiffness that would help resist polyethylene deformation while decreasing implant–bone interface stresses.8 However, early design iterations of metal-backed patellae demonstrated short-term failures—most commonly, local polyethylene wear damaging the locking mechanism and subsequent dissociation or fracture from the metal baseplate; polyethylene delamination from the metal baseplate; and failure of interface fixation.9,10 On the other hand, good fixation with bony ingrowth was observed in both titanium and cobalt-chromium porous-coated patellae.1,3,9,11-13 Overall, however, negative outcomes reported for metal-backed patellae led many surgeons to abandon these components and return to using cemented all-polyethylene patellae.
Negative outcomes of earlier metal-backed patellae designs have overshadowed reports of positive outcomes achieved with careful attention paid to component design, patellar tracking, and surgical technique.2,3,14 Subsequent design improvements (eg, a third stabilizing peg, thicker polyethylene, improved conformity) produced excellent outcomes.8,12,15 The advantages of using a metal-backed patella (eg, uniform load sharing, decreased polyethylene deformation, potential for biological fixation) may be unjustly outweighed by the fear of patellar component failure.3
Our 30-plus years of experience with metal-backed patellar components reflect the evolving effect of component design on outcome. Much as reported elsewhere, we found earlier component failures were caused by poor locking mechanisms, thin polyethylene, poor tracking, and minimal femur contact. Over the past decade, however, our outcomes with Duracon metal-backed patellae (Stryker) have been encouraging. We think these positive outcomes, seen over minimum 5-year follow-up, are largely attributable to the thicker polyethylene and improved articular conformity of this component relative to earlier designs. We have also found it helpful to adhere to certain criteria when implanting metal-backed patellae, and we think adhering to these criteria, along with improved component design, indicates use of press-fit metal-backed patellae. In this article, we report our failure incidence with use of this device at minimum 5-year follow-up.
Materials and Methods
In this single-center study, we performed clinical and independent radiographic reviews of 88 primary press-fit metal-backed patellae with minimum 5-year follow-up. All components were the same design (Duracon metal-backed patella) from the same manufacturer (Stryker).
This study, which began in September 2003, was reviewed and approved by the Western Institutional Review Board (WIRB). Either the investigator (Dr. Hedley) or the clinical study coordinator gave study candidates a full explanation of the study and answered any questions. Patients who still wanted to participate in the study signed WIRB consent forms after their index surgery but before minimum 5-year follow-up.
Device Description
This Duracon patella has a porous-coated cobalt-chromium metal back intended for press-fit fixation, 3 cobalt-chromium porous-coated pegs, and a preassembled polyethylene anterior surface (Figure 1). Four sizes are available to fit the peripheral shape of the resected patella.
This patella has 3 styles: symmetric, asymmetric, and conversion. In this study, we used only the asymmetric and conversion styles. The design of each style incorporates medial/lateral facets intended to conform to the convex intercondylar radii of the femoral component, thereby allowing the patella to ride deeply in the recessed patellofemoral groove. The asymmetric patella is a resurfacing component with a generous polyethylene thickness (4.6 mm at its thinnest) and a larger lateral facet for more bone coverage. The asymmetric patella naturally medializes component placement. The articulating surface of the conversion patella is identical to that of the asymmetric patella. However, the conversion patella allows for exchange of the polyethylene portion of the implant without revising a stable, well-fixed metal baseplate.
Patient Selection
Candidates were recruited from a group of metal-backed patella patients within Dr. Hedley’s medical practice. All candidates had undergone primary total knee arthroplasty and received a Duracon press-fit metal-backed patella. All recruited patients had undergone primary knee arthroplasty at least 5 years before clinical and radiographic evaluation. Patients were included in the study if they had a diagnosis of noninflammatory degenerative joint disease (eg, osteoarthritis, traumatic arthritis, avascular necrosis). Patients with body mass index higher than 40 were excluded from the study.
Surgical Technique
The patella is everted completely or as much as feasible. Debridement is done circumferentially around the patella. Adherent fat and pseudomeniscus are stripped back until the surgeon sees the entry point of the quadriceps tendon fibers above and the patella tendon fibers below. The cut is then made at this level to remove as much bone as needed to restore the normal height of the patella with the implant in place. The cut is usually made by hand—without guides but with the patella stabilized with a towel clip above and below to prevent any movement during the action.
The desired cut must be absolutely planar, and this should be checked by placing the edge of the blade across the interface. Repeated passes with the saw blade are needed if the cut is not 100% planar. Once the cut is made, the patella is sized with the patella sizers and drill guide. After the appropriate size is selected, the patella is drilled with a bit that is slightly undersized from the size of the pegs (1/32 inch smaller than the bit supplied by the manufacturer).
Once the patella is prepared, the rest of the knee arthroplasty is performed. The patella is press-fit as the last component to be inserted.
Radiologic Review
Radiographic analysis was performed by an independent reviewer according to the current Knee Society total knee arthroplasty roentgenographic evaluation and scoring system (Figure 2).16 The reviewer was an orthopedist specializing in hip and knee surgery. Radiographs the reviewer deemed questionable were shown to another independent hip and knee surgeon for validation. In all cases, the second reviewer confirmed the first reviewer’s initial recorded observations.
KSS (Knee Society Scale), WOMAC (Western Ontario and McMaster Universities Arthritis Index), and SF-36 (36-Item Short Form Health Survey) were also used to evaluate effectiveness in this protocol.
Survivorship Calculations
Kaplan-Meier survivorship was determined for all metal-backed patellae. For survival analysis, only knees with radiographic data were included (74 knees). Mean follow-up was 75.8 months (range, 60-105 months).
Seventy-four patients (88 knees) met the study criteria (Table). At minimum 5-year follow-up, complete data were acquired for 59 patients (72 knees). Of the total group, 14 knees did not have radiographic data. Those knees were categorized as lost to follow-up and were excluded from the survivorship analysis. The status of patients enrolled in the study at minimum 5-year follow-up is shown in the Table.
Mann-Whitney U test (nonparametric t test) was used to compare WOMAC and SF-36 scores between the “complete” and the “WOMAC and SF-36 only” data groups.
Statistical Analysis
Kaplan-Meier survivorship probabilities (asymmetric method) were calculated using SAS Version 9.2 (SAS Institute); 95% pointwise confidence limits were used.
The Mann-Whitney U test is a nonparametric analogue to the independent-samples t test. It was used here to compare WOMAC and SF-36 scores of patients with “complete” data with scores of patients with “WOMAC and SF-36 only” data. In either group, for patients who had primary bilateral knee arthroplasty, mean WOMAC and SF-36 scores were used.
Comparisons were made between the unilateral and bilateral knee arthroplasty groups. There were no differences in age, height, or weight (Mann-Whitney U test) or in sex, primary diagnosis, or number of patients lost to follow-up (Fisher exact test). Fisher exact test (vs χ2 test) was used for the contingency table analysis because of small cell sizes (eg, ≤10 females in ‘‘both knees” group), suggesting the unilateral and bilateral patients did not differ in demographics.
For all patient-reported questionnaires, bilateral patients were given the opportunity to note any differences between their knee arthroplasties, but none of these patients made any special notations. We interpreted this to mean that all survey responses from bilateral patients were applicable to both knee arthroplasties.
Results
Seventy-four patients (88 knees) were enrolled in the study: 31 women (41.2%) and 43 men (58.1%). At time of surgery, mean age was 59.7 years (range, 40-86 years), and mean body mass index was 30.6 (range, 19.1-39.6). Eighty-three knees were diagnosed with osteoarthritis, and 5 knees were diagnosed with posttraumatic arthritis. Mean time to follow-up was 74.8 months (range, 60-105 months). Fourteen knees (14 patients) were considered lost to follow-up. However, 8 patients (8 knees) were contacted by telephone about the status of their knee(s), and all 8 completed and returned the minimum 5-year follow-up WOMAC and SF-36 forms; they did not return for their minimum 5-year clinical or radiographic evaluations.
Asymmetric patellae were used in 24 knees, conversion patellae in 64 knees (88 knees total). Forty-nine months after surgery, 1 patella was revised for loosening at its interface with the bone. The 51-year-old active female patient’s asymmetric patella was revised to a conversion patella. The decision to implant another metal-backed device was based on its high density; proper intrusion of acrylic cement would have been questionable. Some early wear was observed on the tibial insert, which was replaced. Sixty-eight months after the revision, the patient was asymptomatic, with a KSS Pain score of 96 and a KSS Function score of 100 (Figure 3). Another revision, for tibial insert exchange only, was performed 48 months after surgery. During this revision, the patella was evaluated and found to be well fixed and functioning normally.
Survivorship of the Duracon metal-backed patella at minimum 5-year follow-up was estimated to be 93.95%, with bounds of 73.61% and 98.74%.
Radiographic analysis revealed no radiolucencies larger than 1 mm (Figure 4). Seventeen 1-mm radiolucencies were recorded: 6 (35.3%) in zone 1, 2 (11.8%) in zone 2, and 9 (52.9%) in zone 4. Twelve (70.6%) of the 17 radiolucencies were in the left knee. Nine radiolucencies were in women and 8 in men. Most (55.6%) of the women’s radiolucencies were in zone 1, and most (75.0%) of the men’s were in zone 4. There were no loose beads other than in the case that was later revised.
KSS, WOMAC, and SF-36 scores and radiographic reviews were used to evaluate effectiveness in accordance with the protocol. At minimum 5-year follow-up, mean KSS Pain score was 94.10 (range, 55-100), and mean KSS Function score was 92.67 (range, 60-100). Mean WOMAC score was 2.21 (range, 0-19.70), mean SF-36 Physical score was 83.65 (range, 30.70-100), and mean SF-36 Mental score was 89.41 (range, 1.4-100).
The preceding calculations do not include WOMAC and SF-36 data for the 8 patients (8 knees) who were counted as lost to follow-up but who submitted minimum 5-year follow-up data. We compared these 8 patients with the 60 patients (74 knees) who had complete WOMAC and SF-36 data at the end of the study in order to determine whether there were any statistically significant differences between the 2 groups’ mean scores. No statistically significant differences were detected in any WOMAC or SF-36 category (α = 0.05).
Discussion
Metal-backed patellar components were originally designed to address the shortcomings (eg, fracture, deformation, aseptic loosening) of cemented all-polyethylene patellae.1-3 It was thought that the stiffness of the metal could help resist polyethylene deformation and that the press-fit interface with bone might eliminate issues related to bone cement.8 However, short-term failures were reported with early metal-backed designs.9,10 At the same time, good fixation with bone ingrowth was observed in both titanium and cobalt-chromium porous-coated patellae.1,3,9-12,17 Further, reports of poor outcomes with some metal-backed patella designs overshadowed reports of positive outcomes.2,3 In all reports (of both poor and positive outcomes), component design, patellar tracking, and surgical technique were cited as contributing to implant success.2,3,14,17,18 Subsequent design improvements (eg, use of a third stabilizing peg, thicker polyethylene, improved conformity) produced excellent outcomes.8,12,15
Our early results are similar to those reported in the literature, and we observed markedly better outcomes that we think resulted from component design improvements. Over the past decade, this has been particularly true with our use of the Duracon metal-backed patella, which has thicker polyethylene, better articular conformity, and a third stabilizing peg, all of which were previously noted as contributing to a successful metal-backed patellar component.2,12,14,15,19 In our study, all 72 knees radiographically evaluated and independently reviewed at minimum 5-year follow-up had well-fixed press-fit metal-backed patellae. Seventeen patellae had 1-mm radiolucencies; the other 59 had no radiolucencies in any zone around the patella–bone interface.
One of the most important aspects of removing a metal-backed patellar component from a patella is that the remaining bone stock is often far superior to the stock available after revision of a cemented patella. Careful removal should leave an excellent bony bed for reimplantation.
We think that surgeons should adhere to certain indications and contraindications when implanting metal-backed patellae and that doing so can contribute to successful outcomes. Type of bone stock available should be considered, as successful biological fixation relies on a good blood supply. A dense (or thin) patella in which intrusion of acrylic cement is improbable or impossible may favor use of a metal-backed patella. Cement is not an adhesive but a grout, so successful cementation requires intrusion of cement into the interstices of the cancellous bone. As adequate intrusion of cement into dense bone is not possible, cementation may not be the best option. Some patellae have failed because of peg “shear-off,”9 likely caused not by failure of peg strength but by failure of cement fixation at the nonpeg interface.20,21 Polyethylene pegs fail when used as the sole method of fixation (they were never designed for that). In addition, we think younger patients are often indicated for a metal-backed patella because, over the long term, loosening of a cemented patella (and the accompanying stress shielding and osteolysis) may cause severe patellar bone destruction. Last, we have found that abnormally high or small patellae are not good candidates for cement fixation because they tend to work themselves loose riding on and off the superior flange. These types of patellae appear to have a much sturdier and longer lasting interface than cement, once biological fixation has occurred.
In summary, we think the indications for a metal-backed implant are a patella that is dense or sclerotic; a patella that is thin, abnormally high, or small; and a younger patient. In addition, a metal-backed implant is not indicated for soft, osteoporotic bone.
This study had a few limitations. Fourteen knees (14 patients), or 15.9% of all knees in the study, were categorized as lost to follow-up. Comparing the WOMAC and SF-36 scores of 8 patients (8 knees) who completed minimum 5-year follow-up but were not clinically evaluated with the scores of patients who had complete data, we found no statistically significant differences in any category. However, 5-year follow-up clinical data were available for those 8 patients. Nevertheless, 74 knees were available for radiologic evaluation, and during telephone interviews all 8 patients indicated they had their original implant(s) and were asymptomatic.
Our experience with the Duracon metal-backed patella has been encouraging. In the study reported here, there were no failures caused by dissociation of plastic. We think that, because the porous coating is under almost constant compression, biological fixation is likely in most instances, as observed in our minimum 5-year radiologic results. Given our minimum 5-year follow-up results with uncemented metal-backed patellae, we think their use may be a viable alternative to use of all-polyethylene patellae.
1. Firestone TP, Teeny SM, Krackow KA, Hungerford DS. The clinical and roentgenographic results of cementless porous-coated patellar fixation. Clin Orthop Relat Res. 1991;273:184-189.
2. Laskin RS, Bucknell A. The use of metal-backed patellar prostheses in total knee arthroplasty. Clin Orthop Relat Res. 1990;260:52-55.
3. Evanich CJ, Tkach TK, von Glinski S, Camargo MP, Hofmann AA. 6- to 10-year experience using countersunk metal-backed patellas. J Arthroplasty. 1997;12(2):149-154.
4. Schwartz AJ, Della Vale CJ, Rosenberg AG, Jacobs JJ, Berger RA, Galante JO. Cruciate-retaining TKA using a third-generation system with a four-pegged tibial component: a minimum 10-year followup note. Clin Orthop Relat Res. 2010;468(8):2160-2167.
5. Bisschop R, Brouwer RW, Van Raay JJ. Total knee arthroplasty in younger patients: a 13-year follow-up study. Orthopedics. 2010;33(12):876-880.
6. Dixon MC, Brown RR, Parsch D, Scott RD. Modular fixed-bearing total knee arthroplasty with retention of the posterior cruciate ligament. A study of patients followed for a minimum of fifteen years. J Bone Joint Surg Am. 2005;87(3):598-603.
7. Brick GW, Scott RD. The patellofemoral component of total knee arthroplasty. Clin Orthop Relat Res. 1988;231)163-178.
8. Garcia RM, Kraay MJ, Goldberg VM. Isolated all-polyethylene patellar revisions for metal-backed patellar failure. Clin Orthop Relat Res. 2008;466(11):2784-2789.
9. Rosenberg AG, Andriacchi TP, Barden R, Galante JO. Patellar component failure in cementless total knee arthroplasty. Clin Orthop Relat Res. 1988;(236):106-114.
10. Stulberg SD, Stulberg BN, Hamati Y, Tsao A. Failure mechanisms of metal-backed patellar components. Clin Orthop Relat Res. 1988;236:88-105.
11. Sundfeldt M, Johansson CB, Regner L, Albrektsson T, Carlsson LV. Long-term results of a cementless knee prosthesis with a metal-backed patellar component: clinical and radiological follow-up with histology from retrieved components. J Long Term Eff Med Implants. 2003;13(4):341-354.
12. Kraay MJ, Darr OJ, Salata MJ, Goldberg VM. Outcome of metal-backed cementless patellar components: the effect of implant design. Clin Orthop Relat Res. 2001;392:239-244.
13. Jensen LN, Lund B, Gotfredsen K. Bone growth into a revised porous-coated patellar implant. Acta Orthop Scand. 1990;61(3):213-216.
14. Hsu HP, Walker PS. Wear and deformation of patellar components in total knee arthroplasty. Clin Orthop Relat Res. 1989;246:260-265.
15. Jordan LR, Sorrells RB, Jordan LC, Olivo JL. The long-term results of a metal-backed mobile bearing patella. Clin Orthop Relat Res. 2005;436:111-118.
16. Ewald FC. The Knee Society total knee arthroplasty roentgenographic evaluation and scoring system. Clin Orthop Relat Res. 1989;248:9-12.
17. Bayley JC, Scott RD, Ewald FC, Holmes GB Jr. Failure of the metal-backed patellar component after total knee replacement. J Bone Joint Surg Am. 1988;70(5):668-674.
18. Lombardi AV Jr, Engh GA, Volz RG, Albrigo JL, Brainard BJ. Fracture/dissociation of the polyethylene in metal-backed patellar components in total knee arthroplasty. J Bone Joint Surg Am. 1988;70(5):675-679.
19. Moreland JR. Mechanisms of failure in total knee arthroplasty. Clin Orthop Relat Res. 1988;226:49-64.
20. Francke EI, Lachiewicz PF. Failure of a cemented all-polyethylene patellar component of a press-fit condylar total knee arthroplasty. J Arthroplasty. 2000;15(2):234-237.
21. Stulberg BN, Wright TM, Stoller AP, Mimnaugh KL, Mason JJ. Bilateral patellar component shear failure of highly cross-linked polyethylene components: report of a case and laboratory analysis of failure mechanisms. J Arthroplasty. 2012;27(5):789-796.

Navigating the Alphabet Soup of Labroligamentous Pathology of the Shoulder
The widespread use of eponyms and acronyms to describe labroligamentous findings in the shoulder has made interpretation of shoulder magnetic resonance imaging (MRI) reports challenging. We review and discuss the appearance of these lesions on shoulder MRI to help the orthopedic surgeon understand these entities as imaging findings.
Glenolabral articular disruption (GLAD) occurs secondary to impaction of the humeral head on the glenoid articular cartilage. There is a resultant defect in the glenoid articular cartilage, which extends to the glenoid labrum. A GLAD lesion is diagnosed only if the glenohumeral ligament and scapular periosteum remain intact1 (Figure 1).
Complete detachment of the anteroinferior labrum with tearing of the anterior glenoid periosteum represents a Bankart lesion. Cartilaginous Bankart lesions are caused by an anterior glenohumeral dislocation with resultant avulsion of the anteroinferior labrum and disruption of the scapular periosteum because of acute traction on the anterior band of the inferior glenohumeral ligament (Figure 2). Anterior instability, caused by disruption of the anterior labroligamentous complex, results. Osseous Bankart lesions occur when the anterior displaced humeral head impacts the anterior inferior glenoid rim, causing a fracture (Figure 3). This loss of the glenoid articular surface area can result in glenohumeral instability. Posterior shoulder dislocations can result in corresponding findings in the posterior inferior glenoid labrum (reverse Bankart lesion) and anterior medial humeral head (reverse Hill-Sachs lesion) (Figure 2).
A variant of the Bankart lesion is the anterior labroligamentous periosteal sleeve avulsion (ALPSA). This refers to a medially displaced tear of the anterior labrum with intact periosteal stripping along the medial glenoid2with medial rotation and inferior displacement of the anterior inferior labrum along the scapular neck. An ALPSA lesion can heal via the intact periosteal blood supply. If not repaired, anterior instability will result because of malposition of the labrum, causing a patulous anterior capsule.3 When a corresponding lesion occurs in the posterior labrum because of a posterior dislocation, it is called a posterior labrocapsular periosteal sleeve avulsion (POLPSA) (Figure 4).
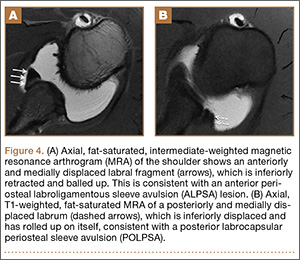
Another variant of the Bankart lesion is the Perthes lesion, which is a nondisplaced tear of the anteroinferior labrum with periosteal stripping. This differs from the ALPSA because the detached labrum and periosteum are held in anatomic position, possibly making the lesion difficult to detect on magnetic resonance arthrography (MRA).3 Obtaining images in the abduction external rotation (ABER) position exerts traction on the anterior inferior joint capsule and may make the Perthes lesion more conspicuous.4 When this occurs in the posterior labrum, it is called a reverse Perthes lesion (Figure 5).
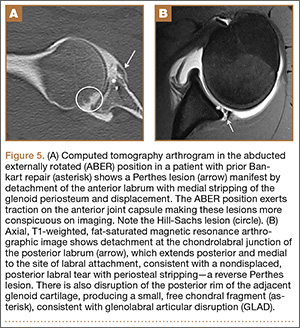
In a patient with anterior glenohumeral instability without a Bankart lesion, pathology of the anterior band of the inferior glenohumeral ligament (IGHL) at its humeral attachment must be suspected. Humeral avulsion of the IGHL (HAGL) or its variants can be overlooked on arthroscopy. HAGL is diagnosed on MRA when the normally U-shaped IGHL takes on a J-shape, and joint fluid extravasates across the torn humeral attachment (Figure 6). If there is an avulsed bony fragment from the medial humeral neck, the lesion is termed a bony HAGL (BHAGL). In addition to the findings of a HAGL, a BHAGL shows the osseous fragment and donor site on MRI. Since a BHAGL is a bony avulsion, it can even be suggested on radiography if a bony fragment is seen adjacent to the medial humeral neck.5 These lesions are highly associated with other shoulder injuries, particularly Hill-Sachs deformities and subscapularis tendon tears, and it is imperative, therefore, to search for additional injuries if a HAGL-type injury is seen.6
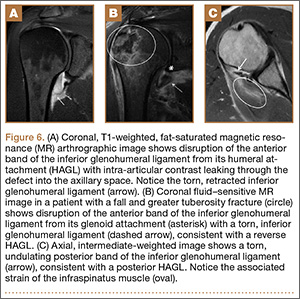
A more uncommon type of HAGL can occur in the setting of posterior capsulolabral injury. A posterior-band IGHL avulsion from the humerus (PHAGL) has similar imaging findings to a HAGL, except that it involves the posterior band of the IGHL. PHAGLs are usually not associated with an acute injury and are thought to be related to repetitive microtrauma, perhaps since the posterior band of the IGHL is the thinnest portion of the IGHL complex.7
A Kim lesion is an arthroscopic finding described in patients with posterior instability as a superficial defect at the undersurface of the posterior labrum and adjacent glenoid cartilage without detachment or extension to the chondrolabral junction.8 It is, by its nature, a concealed finding on routine MRI but can be more conspicuous in FADIR (flexed, adducted, internally rotated) positioning on MRA, which exerts traction on the posterior joint capsule, allowing intra-articular contrast to fill the tear (Figure 7).
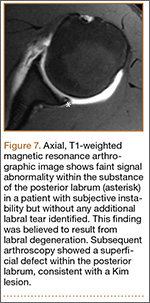
This list describes several of the most commonly encountered acronyms in shoulder MRI. A review of SLAP (superior labrum anterior to posterior) lesions was described in a previous article in the journal’s Imaging Series.9 A thorough understanding of these lesions is helpful in interpreting reports and determining the appropriate treatment for patients with shoulder injuries.
1. Sanders TG, Tirman PF, Linares R, Feller JF, Richardson R. The glenolabral articular disruption lesion: MR arthrography with arthroscopic correlation. AJR Am J Roentgenol. 1999;172(1):171-175.
2. Beltran J, Jbara M, Maimon R. Shoulder: labrum and bicipital tendon. Top Magn Reson Imaging. 2003;14(1):35-50.
3. Waldt S, Burkart A, Imhoff AB, Bruegel M, Rummeny EJ, Woertler K. Anterior shoulder instability: accuracy of MR arthrography in the classification of anteroinferior labroligamentous injuries. Radiology. 2005;237(2):578-583.
4. Schreinemachers SA, van der Hulst VP, Willems J, Bipat S, van der Woude H. Is a single direct MR arthrography series in ABER position as accurate in detecting anteroinferior labroligamentous lesions as conventional MR arthrography? Skeletal Radiol. 2009;38(7):675-683.
5. Bui-Mansfield LT, Taylor DC, Uhorchak JM, Tenuta JT. Humeral avulsions of the glenohumeral ligament: imaging features and a review of the literature. AJR Am J Roentgenol. 2002;179(3):649-655.
6. Magee T. Prevalence of HAGL lesions and associated abnormalities on shoulder MR examination. Skeletal Radiol. 2014;43(3):307-313.
7. Chung CB, Sorenson S, Dwek JR, Resnick D. Humeral avulsion of the posterior band of the inferior glenohumeral ligament: MR arthrography and clinical correlation in 17 patients. AJR Am J Roentgenol. 2004;183(2):355-359.
8. Kim SH, Ha KI, Yoo JC, Noh KC. Kim’s lesion: an incomplete and concealed avulsion of the posteroinferior labrum in posterior or multidirectional posteroinferior instability of the shoulder. Arthroscopy. 2004;20(7):712-720.
9. Grubin J, Maderazo A, Fitzpatrick D. Imaging evaluation of superior labral anteroposterior (SLAP) tears. Am J Orthop. 2015;44(10):476-477.
The widespread use of eponyms and acronyms to describe labroligamentous findings in the shoulder has made interpretation of shoulder magnetic resonance imaging (MRI) reports challenging. We review and discuss the appearance of these lesions on shoulder MRI to help the orthopedic surgeon understand these entities as imaging findings.
Glenolabral articular disruption (GLAD) occurs secondary to impaction of the humeral head on the glenoid articular cartilage. There is a resultant defect in the glenoid articular cartilage, which extends to the glenoid labrum. A GLAD lesion is diagnosed only if the glenohumeral ligament and scapular periosteum remain intact1 (Figure 1).
Complete detachment of the anteroinferior labrum with tearing of the anterior glenoid periosteum represents a Bankart lesion. Cartilaginous Bankart lesions are caused by an anterior glenohumeral dislocation with resultant avulsion of the anteroinferior labrum and disruption of the scapular periosteum because of acute traction on the anterior band of the inferior glenohumeral ligament (Figure 2). Anterior instability, caused by disruption of the anterior labroligamentous complex, results. Osseous Bankart lesions occur when the anterior displaced humeral head impacts the anterior inferior glenoid rim, causing a fracture (Figure 3). This loss of the glenoid articular surface area can result in glenohumeral instability. Posterior shoulder dislocations can result in corresponding findings in the posterior inferior glenoid labrum (reverse Bankart lesion) and anterior medial humeral head (reverse Hill-Sachs lesion) (Figure 2).
A variant of the Bankart lesion is the anterior labroligamentous periosteal sleeve avulsion (ALPSA). This refers to a medially displaced tear of the anterior labrum with intact periosteal stripping along the medial glenoid2with medial rotation and inferior displacement of the anterior inferior labrum along the scapular neck. An ALPSA lesion can heal via the intact periosteal blood supply. If not repaired, anterior instability will result because of malposition of the labrum, causing a patulous anterior capsule.3 When a corresponding lesion occurs in the posterior labrum because of a posterior dislocation, it is called a posterior labrocapsular periosteal sleeve avulsion (POLPSA) (Figure 4).
Another variant of the Bankart lesion is the Perthes lesion, which is a nondisplaced tear of the anteroinferior labrum with periosteal stripping. This differs from the ALPSA because the detached labrum and periosteum are held in anatomic position, possibly making the lesion difficult to detect on magnetic resonance arthrography (MRA).3 Obtaining images in the abduction external rotation (ABER) position exerts traction on the anterior inferior joint capsule and may make the Perthes lesion more conspicuous.4 When this occurs in the posterior labrum, it is called a reverse Perthes lesion (Figure 5).
In a patient with anterior glenohumeral instability without a Bankart lesion, pathology of the anterior band of the inferior glenohumeral ligament (IGHL) at its humeral attachment must be suspected. Humeral avulsion of the IGHL (HAGL) or its variants can be overlooked on arthroscopy. HAGL is diagnosed on MRA when the normally U-shaped IGHL takes on a J-shape, and joint fluid extravasates across the torn humeral attachment (Figure 6). If there is an avulsed bony fragment from the medial humeral neck, the lesion is termed a bony HAGL (BHAGL). In addition to the findings of a HAGL, a BHAGL shows the osseous fragment and donor site on MRI. Since a BHAGL is a bony avulsion, it can even be suggested on radiography if a bony fragment is seen adjacent to the medial humeral neck.5 These lesions are highly associated with other shoulder injuries, particularly Hill-Sachs deformities and subscapularis tendon tears, and it is imperative, therefore, to search for additional injuries if a HAGL-type injury is seen.6
A more uncommon type of HAGL can occur in the setting of posterior capsulolabral injury. A posterior-band IGHL avulsion from the humerus (PHAGL) has similar imaging findings to a HAGL, except that it involves the posterior band of the IGHL. PHAGLs are usually not associated with an acute injury and are thought to be related to repetitive microtrauma, perhaps since the posterior band of the IGHL is the thinnest portion of the IGHL complex.7
A Kim lesion is an arthroscopic finding described in patients with posterior instability as a superficial defect at the undersurface of the posterior labrum and adjacent glenoid cartilage without detachment or extension to the chondrolabral junction.8 It is, by its nature, a concealed finding on routine MRI but can be more conspicuous in FADIR (flexed, adducted, internally rotated) positioning on MRA, which exerts traction on the posterior joint capsule, allowing intra-articular contrast to fill the tear (Figure 7).
This list describes several of the most commonly encountered acronyms in shoulder MRI. A review of SLAP (superior labrum anterior to posterior) lesions was described in a previous article in the journal’s Imaging Series.9 A thorough understanding of these lesions is helpful in interpreting reports and determining the appropriate treatment for patients with shoulder injuries.
1. Sanders TG, Tirman PF, Linares R, Feller JF, Richardson R. The glenolabral articular disruption lesion: MR arthrography with arthroscopic correlation. AJR Am J Roentgenol. 1999;172(1):171-175.
2. Beltran J, Jbara M, Maimon R. Shoulder: labrum and bicipital tendon. Top Magn Reson Imaging. 2003;14(1):35-50.
3. Waldt S, Burkart A, Imhoff AB, Bruegel M, Rummeny EJ, Woertler K. Anterior shoulder instability: accuracy of MR arthrography in the classification of anteroinferior labroligamentous injuries. Radiology. 2005;237(2):578-583.
4. Schreinemachers SA, van der Hulst VP, Willems J, Bipat S, van der Woude H. Is a single direct MR arthrography series in ABER position as accurate in detecting anteroinferior labroligamentous lesions as conventional MR arthrography? Skeletal Radiol. 2009;38(7):675-683.
5. Bui-Mansfield LT, Taylor DC, Uhorchak JM, Tenuta JT. Humeral avulsions of the glenohumeral ligament: imaging features and a review of the literature. AJR Am J Roentgenol. 2002;179(3):649-655.
6. Magee T. Prevalence of HAGL lesions and associated abnormalities on shoulder MR examination. Skeletal Radiol. 2014;43(3):307-313.
7. Chung CB, Sorenson S, Dwek JR, Resnick D. Humeral avulsion of the posterior band of the inferior glenohumeral ligament: MR arthrography and clinical correlation in 17 patients. AJR Am J Roentgenol. 2004;183(2):355-359.
8. Kim SH, Ha KI, Yoo JC, Noh KC. Kim’s lesion: an incomplete and concealed avulsion of the posteroinferior labrum in posterior or multidirectional posteroinferior instability of the shoulder. Arthroscopy. 2004;20(7):712-720.
9. Grubin J, Maderazo A, Fitzpatrick D. Imaging evaluation of superior labral anteroposterior (SLAP) tears. Am J Orthop. 2015;44(10):476-477.
Lateral Ulnar Collateral Ligament Reconstruction: An Analysis of Ulnar Tunnel Locations
Posterolateral rotatory instability (PLRI) of the elbow is well recognized1 and is the most common type of chronic elbow instability. PLRI is often an end result of traumatic elbow dislocation.2 The “essential lesion” in patients with PLRI of the elbow is injury to the lateral ulnar collateral ligament (LUCL).1 However, more recent research has emphasized the importance of other ligaments in the lateral ligament complex (radial collateral and annular ligaments) in preventing PLRI.3-5 Nevertheless, when conservative treatment fails, the most commonly used surgical treatment involves LUCL reconstruction.1,6-11
Numerous techniques for LUCL reconstruction have been described.1,7-9,11-13 The chosen technique ideally restores normal anatomy. Therefore, the isometric point of origin at the lateral epicondyle and insertion at the supinator tubercle are important landmarks for creating tunnels that reproduce isometry, function, and normal anatomy. Most often, 2 tunnels are created in the ulna to secure the graft. It has been our experience that ulnar tunnel creation can affect the length of the bony bridge and the orientation of the graft.
We conducted a study to identify the precise proximal ulna tunnel location—anterior to posterior, with the distal tunnel at the supinator tubercle on the crest—that allows for the largest bony bridge and most geometrically favorable construct. We hypothesized that a most posteriorly placed proximal tunnel would increase bony bridge size and allow for a more isosceles graft configuration. An isosceles configuration with the humerus tunnel at the isometric location would allow for anterior and posterior bands of the same length with theoretically equal force distribution.
Methods
After obtaining institutional review board approval, we retrospectively reviewed the cases of 17 adults with elbow computed tomography (CT) scans for inclusion in this study. The scans were previously performed for diagnostic workup of several pathologies, including valgus instability, olecranon stress fracture, and valgus extension overload. The scan protocol involved 0.5-mm axial cuts with inclusion of the distal humerus through the proximal radius and ulna in the DICOM (Digital Imaging and Communications in Medicine) format. Exclusion criteria included poor CT quality, inadequate visualization of the entire supinator crest, and age under 18 years. Fifteen patients with adequate CT scans met the inclusion criteria. MIMICS (Materialise’s Interactive Medical Image Control System) software was used to convert scans into patient-specific 3-dimensional (3-D) computer models. (Use of this software to produce anatomically accurate models has been verified in shoulder14 and elbow15 models.) These models were uploaded into Magics rapid prototyping software (Materialise) and manipulated for simulated tunnel drilling by precise bone subtraction methods. This software was used to define an ulnar Cartesian coordinate system with anatomical landmarks as reference points in order to standardize the position of each model (Figure 1).16 The y-axis was defined by the longitudinal axis of the ulna, and the x-axis was the transepicondylar axis, defined as the perpendicular line connecting the y-axis with the supinator crest. The z-axis was then established as the line perpendicular to the x- and y-axes—yielding a 3-D coordinate system that allowed us to manipulate the models in standardized fashion, maintaining the exact positions of the ulna while making measurements.
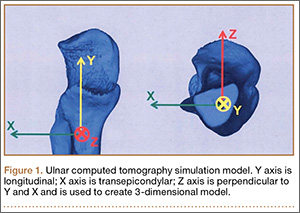
Surgical simulations were performed in the rapid prototyping software by creating a cylinder and placing it at the desired location of each tunnel. Cylinder diameter was 4 mm, matching the diameter of the drill we use to create each tunnel in our practice. The cylinder was inserted into the bone, perpendicular to the surface of the ulna at the point of insertion, so the cylinder’s deepest point entered the medullary canal of the ulna. Using a Boolean operation in the rapid prototyping software, we subtracted cylinder from bone to create a tunnel (Figure 2).15
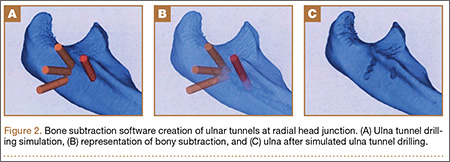
In a previous study,17 we determined that the radial head junction is reproducibly about 15 mm proximal to the distinct supinator tubercle, which may be absent or not readily appreciated in up to 50% of cases. Therefore, proximal ulnar tunnels were placed 0, 5, and 10 mm posterior to the supinator crest at the radial head junction. Distal tunnels were placed 15 mm anterior to the radial head junction on the supinator crest (Figure 2). The bony bridges created by these tunnels were measured, as was the distance between the distal tunnel and the supinator tubercle.
Ideal graft configuration was described as an isosceles triangle with ulna tunnels perpendicular to the humeral tunnel (Figure 3).11 Location of the humeral origin in the sagittal plane was determined by finding the isometric point of the lateral humerus using only bony landmarks. Similar techniques have been used to find the isometric point on the medial epicondyle for medial ulnar collateral ligament reconstruction.15,18 With a circle fit into the trochlear notch of the ulna, the isometric point can be determined by the center of the circle. This point was then superimposed on the humerus to identify the starting point (Figure 4). In our simulation, we measured the isosceles configuration by drawing a line between the proximal and distal tunnels, and then another line connecting the bisecting point of the first line with the isometric point on the humerus from which the graft would originate. The angle between the 2 lines was measured; if isosceles, the angle was 90° (Figure 5). Length of the more proximal limb of the graft and the more distal limb of the graft was determined by measuring the distance from the isometric point to the proximal and distal tunnels, respectively (Figure 6).

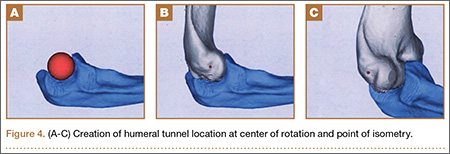
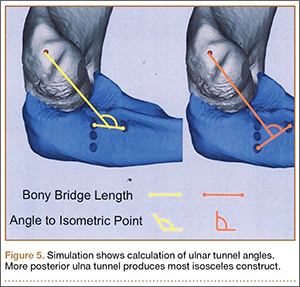
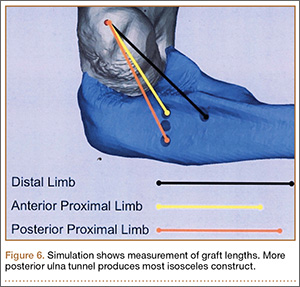
One-way analysis of variance was used to compare all the tunnels’ bony bridge sizes, graft lengths, and angles to the isometric point. For all comparisons, statistical significance was set at P < .05. As no other studies have compared bony bridges by varying tunnel creation parameters, and as the present study is observational and not comparative, no power analysis was performed.
Results
Bony bridges were significantly longer, and angles more perpendicular, with increasing distance from the proximal tunnel to the supinator crest (Table 1, Figure 5, Figure 7). The bony bridge 0 mm posterior to the supinator crest yielded a mean (SE) bony bridge length of 11.0 (0.2) mm. This proximal tunnel also yielded the smallest mean (SE) perpendicular angle to the isometric point, 131.2° (1.9°). The tunnel most posterior to the supinator crest yielded the longest mean (SE) bony bridge, 13.7 (0.2) mm, and the largest mean (SE) degree of perpendicularity, 95.8° (1.4°). The differences between all tunnels’ bony bridges and isometric angles were statistically significant (P < .00001). The difference between the more distal limb and the more proximal limb of the graft was smallest in the more posteriorly placed proximal tunnel (Table 2, Figure 8). In fact, there was no statistical difference between the proximal and distal limbs of the graft when the proximal tunnel was placed 10 mm posterior to the supinator crest: Mean (SE) was 9.4 (0.5) mm at 0 mm (P < .00001) and 1.1 (0.6) mm at 10 mm (P = .24).
![]()
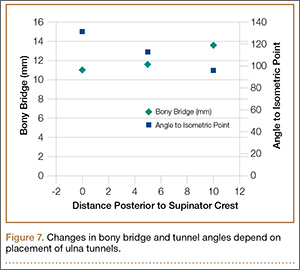
![]()
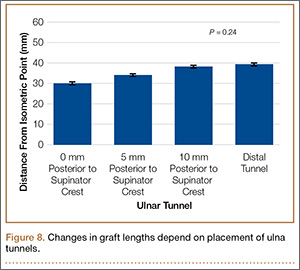
Discussion
PLRI of the elbow is best initially managed nonoperatively. However, when nonoperative management fails, the LUCL is often surgically reconstructed. Reconstruction methods vary by fixation method, graft choice, and bone tunnels.1,7-9,11-13 In 1991, O’Driscoll and colleagues1 described a “yoke” technique for LUCL reconstruction. Since then, the docking technique7 and other techniques have been developed. All these techniques emphasize maximizing anatomical precision and isometry with careful placement of tunnels or fixation devices. The humeral fixation site, at the anterior inferior aspect of the lateral epicondyle at the point of isometry, can be accessed relatively reproducibly. By contrast, the ulnar points of fixation are more variable, because of increased bone stock and overlying soft-tissue and bony anatomy.
Among the challenges in determining the points of ulnar fixation is the bony anatomy that is often used for landmarks. In the literature, the supinator crest or the supintor tubercle is the landmark for placing the distal tunnel.1,7-9,11-13 This is a problem for 2 reasons. First, the supintor crest, a longitudinal structure on the lateral aspect of the ulna, originates from the radial head junction and extends tens of millimeters distally; further specification is needed to guide these ulnar tunnels. The second reason is that use of the supinator tubercle, a prominence on the supinator crest, adds specificity to the location of the ulnar tunnels. During surgery, however, the supinator tubercle may not be a reliable, independently prominent structure; instead, it may be indistinguishable from the supinator crest, on which it rests. One study determined that only about 50% of computer models of patient ulnas had a distinct prominence that could be classified as the supinator tubercle.17 The percentage presumably is lower during surgery, with limited exposure and overlying soft tissues.
In a study of patients with a prominent tubercle, mean (SE) distance from radial head junction to tubercle was 15 (2) mm.17 This finding led us to use the radial head junction as the primary bony landmark in determining the location of the proximal tunnel and placing the distal tunnel 15 mm distally—achieving the same fixation described in the literature but using more distinct landmarks. Our study thus provided a reliable, verified approach to locating the ulnar tunnels in the proximal-distal axis.
We also explored the anterior-posterior orientation of the proximal ulnar tunnel. The 2 primary considerations surrounding the varied proximal tunnel placements were the bony bridge formed between the proximal and distal tunnels and the perpendicularity of the triangle formed by the fixation points. Maximizing the bony bridge is obviously ideal in securing and preventing fixation blowout. Achieving an isoceles reconstruction has been reported in the literature on the various fixation techniques for LUCL reconstruction.11 Although the biomechanical advantage of this fixation type is not fully clear, we assume the construct produces graft stands of equal length, tension, and stability. In addition, the larger footprint created by an isoceles reconstructed ligament increases the stability of the radial head.
Results of the present study showed that the more posterior the proximal ulnar tunnel, the longer the bony bridge and the more isoceles the reconstruction. The difference in bony bridge distance from the most anterior to the most posterior tunnel was about 2 mm, or 18%. For every 1 mm of posteriorization, the bony bridge was 0.2 mm longer. The line from the isometric point of humeral fixation bisecting the proximal and distal tunnels was also more perpendicular with the most posterior tunnel, by about 40°. The resulting proximal and distal limbs of the reconstruction were equal in length, as demonstrated by the smaller difference between the limbs. We assume this isoceles reconstruction more likely applies uniform restraint on the radial head. Thus, an effort should be made to posteriorize the proximal ulnar tunnel during reconstruction.
The study was limited by the number of patient-specific elbow models used. However, given the statistical consistency of measurements, sample size was sufficient. Another limitation, inherent to the model, was that only bony anatomy was incorporated. However, the overlying muscles, tendons, and ligaments can significantly alter tunnel placement, and this study provided other means and cues using more reliable landmarks to adequately place the tunnels. As this was a simulation study, we cannot confirm whether these results would make a difference clinically. The strengths of this study include development and verification of reliable landmarks that can be used to guide ulnar tunnel locations during LUCL reconstruction; these landmarks have been used for medial ulnar collateral ligament reconstruction.15 Other strengths include precise and accurate placement of tunnels and measurement of resulting bony bridges—accomplished independently and without compromising specimen quality.
Conclusion
We recommend drilling the proximal ulnar tunnel posterior to the supinator crest at the level of the radial head junction. A reasonable goal is 10 mm posterior to the crest, though the overlying soft tissue must be considered, and care should be taken to aim the drill anteriorly, toward the ulna’s intramedullary canal, to avoid posterior cortical breach. The distal ulnar tunnel should be drilled just posterior to the supinator crest, 15 mm distal to the radial head junction.
1. O’Driscoll SW, Bell DF, Morrey BF. Posterolateral rotatory instability of the elbow. J Bone Joint Surg Am. 1991;73(3):440-446.
2. O’Driscoll SW. Classification and evaluation of recurrent instability of the elbow. Clin Orthop Relat Res. 2000;370:34-43.
3. Takigawa N, Ryu J, Kish VL, Kinoshita M, Abe M. Functional anatomy of the lateral collateral ligament complex of the elbow: morphology and strain. J Hand Surg Br. 2005;30(2):143-147.
4. McAdams TR, Masters GW, Srivastava S. The effect of arthroscopic sectioning of the lateral ligament complex of the elbow on posterolateral rotatory stability. J Shoulder Elbow Surg. 2005;14(3):298-301.
5. Dunning CE, Zarzour ZD, Patterson SD, Johnson JA, King GJ. Ligamentous stabilizers against posterolateral rotatory instability of the elbow. J Bone Joint Surg Am. 2001;83(12):1823-1828.
6. Eygendaal D. Ligamentous reconstruction around the elbow using triceps tendon. Acta Orthop Scand. 2004;75(5):516-523.
7. Jones KJ, Dodson CC, Osbahr DC, et al. The docking technique for lateral ulnar collateral ligament reconstruction: surgical technique and clinical outcomes. J Shoulder Elbow Surg. 2012;21(3):389-395.
8. Lee BP, Teo LH. Surgical reconstruction for posterolateral rotatory instability of the elbow. J Shoulder Elbow Surg. 2003;12(5):476-479.
9. Lin KY, Shen PH, Lee CH, Pan RY, Lin LC, Shen HC. Functional outcomes of surgical reconstruction for posterolateral rotatory instability of the elbow. Injury. 2012;43(10):1657-1661.
10. Olsen BS, Søjbjerg JO. The treatment of recurrent posterolateral instability of the elbow. J Bone Joint Surg Br. 2003;85(3):342-346.
11. Sanchez-Sotelo J, Morrey BF, O’Driscoll SW. Ligamentous repair and reconstruction for posterolateral rotatory instability of the elbow. J Bone Joint Surg Br. 2005;87(1):54-61.
12. Savoie FH 3rd, Field LD, Gurley DJ. Arthroscopic and open radial ulnohumeral ligament reconstruction for posterolateral rotatory instability of the elbow. Hand Clin. 2009;25(3):323-329.
13. Savoie FH 3rd, O’Brien MJ, Field LD, Gurley DJ. Arthroscopic and open radial ulnohumeral ligament reconstruction for posterolateral rotatory instability of the elbow. Clin Sports Med. 2010;29(4):611-618.
14. Bryce CD, Pennypacker JL, Kulkarni N, et al. Validation of three-dimensional models of in situ scapulae. J Shoulder Elbow Surg. 2008;17(5):825-832.
15. Byram IR, Khanna K, Gardner TR, Ahmad CS. Characterizing bone tunnel placement in medial ulnar collateral ligament reconstruction using patient-specific 3-dimensional computed tomography modeling. Am J Sports Med. 2013;41(4):894-902.
16. Shiba R, Sorbie C, Siu DW, Bryant JT, Cooke TD, Wevers HW. Geometry of the humeroulnar joint. J Orthop Res. 1988;6(6):897-906.
17. Anakwenze OA, Khanna K, Levine WN, Ahmad CS. Characterization of the supinator tubercle for lateral ulnar collateral ligament reconstruction. Orthop J Sports Med. 2014;2(4):2325967114530969. doi:10.1177/2325967114530969.
18. Sasashige Y, Ochi M, Ikuta Y. Optimal attachment site for reconstruction of the ulnar collateral ligament. A cadaver study. Arch Orthop Trauma Surg. 1994;113(5):265-270.
Posterolateral rotatory instability (PLRI) of the elbow is well recognized1 and is the most common type of chronic elbow instability. PLRI is often an end result of traumatic elbow dislocation.2 The “essential lesion” in patients with PLRI of the elbow is injury to the lateral ulnar collateral ligament (LUCL).1 However, more recent research has emphasized the importance of other ligaments in the lateral ligament complex (radial collateral and annular ligaments) in preventing PLRI.3-5 Nevertheless, when conservative treatment fails, the most commonly used surgical treatment involves LUCL reconstruction.1,6-11
Numerous techniques for LUCL reconstruction have been described.1,7-9,11-13 The chosen technique ideally restores normal anatomy. Therefore, the isometric point of origin at the lateral epicondyle and insertion at the supinator tubercle are important landmarks for creating tunnels that reproduce isometry, function, and normal anatomy. Most often, 2 tunnels are created in the ulna to secure the graft. It has been our experience that ulnar tunnel creation can affect the length of the bony bridge and the orientation of the graft.
We conducted a study to identify the precise proximal ulna tunnel location—anterior to posterior, with the distal tunnel at the supinator tubercle on the crest—that allows for the largest bony bridge and most geometrically favorable construct. We hypothesized that a most posteriorly placed proximal tunnel would increase bony bridge size and allow for a more isosceles graft configuration. An isosceles configuration with the humerus tunnel at the isometric location would allow for anterior and posterior bands of the same length with theoretically equal force distribution.
Methods
After obtaining institutional review board approval, we retrospectively reviewed the cases of 17 adults with elbow computed tomography (CT) scans for inclusion in this study. The scans were previously performed for diagnostic workup of several pathologies, including valgus instability, olecranon stress fracture, and valgus extension overload. The scan protocol involved 0.5-mm axial cuts with inclusion of the distal humerus through the proximal radius and ulna in the DICOM (Digital Imaging and Communications in Medicine) format. Exclusion criteria included poor CT quality, inadequate visualization of the entire supinator crest, and age under 18 years. Fifteen patients with adequate CT scans met the inclusion criteria. MIMICS (Materialise’s Interactive Medical Image Control System) software was used to convert scans into patient-specific 3-dimensional (3-D) computer models. (Use of this software to produce anatomically accurate models has been verified in shoulder14 and elbow15 models.) These models were uploaded into Magics rapid prototyping software (Materialise) and manipulated for simulated tunnel drilling by precise bone subtraction methods. This software was used to define an ulnar Cartesian coordinate system with anatomical landmarks as reference points in order to standardize the position of each model (Figure 1).16 The y-axis was defined by the longitudinal axis of the ulna, and the x-axis was the transepicondylar axis, defined as the perpendicular line connecting the y-axis with the supinator crest. The z-axis was then established as the line perpendicular to the x- and y-axes—yielding a 3-D coordinate system that allowed us to manipulate the models in standardized fashion, maintaining the exact positions of the ulna while making measurements.
Surgical simulations were performed in the rapid prototyping software by creating a cylinder and placing it at the desired location of each tunnel. Cylinder diameter was 4 mm, matching the diameter of the drill we use to create each tunnel in our practice. The cylinder was inserted into the bone, perpendicular to the surface of the ulna at the point of insertion, so the cylinder’s deepest point entered the medullary canal of the ulna. Using a Boolean operation in the rapid prototyping software, we subtracted cylinder from bone to create a tunnel (Figure 2).15
In a previous study,17 we determined that the radial head junction is reproducibly about 15 mm proximal to the distinct supinator tubercle, which may be absent or not readily appreciated in up to 50% of cases. Therefore, proximal ulnar tunnels were placed 0, 5, and 10 mm posterior to the supinator crest at the radial head junction. Distal tunnels were placed 15 mm anterior to the radial head junction on the supinator crest (Figure 2). The bony bridges created by these tunnels were measured, as was the distance between the distal tunnel and the supinator tubercle.
Ideal graft configuration was described as an isosceles triangle with ulna tunnels perpendicular to the humeral tunnel (Figure 3).11 Location of the humeral origin in the sagittal plane was determined by finding the isometric point of the lateral humerus using only bony landmarks. Similar techniques have been used to find the isometric point on the medial epicondyle for medial ulnar collateral ligament reconstruction.15,18 With a circle fit into the trochlear notch of the ulna, the isometric point can be determined by the center of the circle. This point was then superimposed on the humerus to identify the starting point (Figure 4). In our simulation, we measured the isosceles configuration by drawing a line between the proximal and distal tunnels, and then another line connecting the bisecting point of the first line with the isometric point on the humerus from which the graft would originate. The angle between the 2 lines was measured; if isosceles, the angle was 90° (Figure 5). Length of the more proximal limb of the graft and the more distal limb of the graft was determined by measuring the distance from the isometric point to the proximal and distal tunnels, respectively (Figure 6).
One-way analysis of variance was used to compare all the tunnels’ bony bridge sizes, graft lengths, and angles to the isometric point. For all comparisons, statistical significance was set at P < .05. As no other studies have compared bony bridges by varying tunnel creation parameters, and as the present study is observational and not comparative, no power analysis was performed.
Results
Bony bridges were significantly longer, and angles more perpendicular, with increasing distance from the proximal tunnel to the supinator crest (Table 1, Figure 5, Figure 7). The bony bridge 0 mm posterior to the supinator crest yielded a mean (SE) bony bridge length of 11.0 (0.2) mm. This proximal tunnel also yielded the smallest mean (SE) perpendicular angle to the isometric point, 131.2° (1.9°). The tunnel most posterior to the supinator crest yielded the longest mean (SE) bony bridge, 13.7 (0.2) mm, and the largest mean (SE) degree of perpendicularity, 95.8° (1.4°). The differences between all tunnels’ bony bridges and isometric angles were statistically significant (P < .00001). The difference between the more distal limb and the more proximal limb of the graft was smallest in the more posteriorly placed proximal tunnel (Table 2, Figure 8). In fact, there was no statistical difference between the proximal and distal limbs of the graft when the proximal tunnel was placed 10 mm posterior to the supinator crest: Mean (SE) was 9.4 (0.5) mm at 0 mm (P < .00001) and 1.1 (0.6) mm at 10 mm (P = .24).
![]()
![]()
Discussion
PLRI of the elbow is best initially managed nonoperatively. However, when nonoperative management fails, the LUCL is often surgically reconstructed. Reconstruction methods vary by fixation method, graft choice, and bone tunnels.1,7-9,11-13 In 1991, O’Driscoll and colleagues1 described a “yoke” technique for LUCL reconstruction. Since then, the docking technique7 and other techniques have been developed. All these techniques emphasize maximizing anatomical precision and isometry with careful placement of tunnels or fixation devices. The humeral fixation site, at the anterior inferior aspect of the lateral epicondyle at the point of isometry, can be accessed relatively reproducibly. By contrast, the ulnar points of fixation are more variable, because of increased bone stock and overlying soft-tissue and bony anatomy.
Among the challenges in determining the points of ulnar fixation is the bony anatomy that is often used for landmarks. In the literature, the supinator crest or the supintor tubercle is the landmark for placing the distal tunnel.1,7-9,11-13 This is a problem for 2 reasons. First, the supintor crest, a longitudinal structure on the lateral aspect of the ulna, originates from the radial head junction and extends tens of millimeters distally; further specification is needed to guide these ulnar tunnels. The second reason is that use of the supinator tubercle, a prominence on the supinator crest, adds specificity to the location of the ulnar tunnels. During surgery, however, the supinator tubercle may not be a reliable, independently prominent structure; instead, it may be indistinguishable from the supinator crest, on which it rests. One study determined that only about 50% of computer models of patient ulnas had a distinct prominence that could be classified as the supinator tubercle.17 The percentage presumably is lower during surgery, with limited exposure and overlying soft tissues.
In a study of patients with a prominent tubercle, mean (SE) distance from radial head junction to tubercle was 15 (2) mm.17 This finding led us to use the radial head junction as the primary bony landmark in determining the location of the proximal tunnel and placing the distal tunnel 15 mm distally—achieving the same fixation described in the literature but using more distinct landmarks. Our study thus provided a reliable, verified approach to locating the ulnar tunnels in the proximal-distal axis.
We also explored the anterior-posterior orientation of the proximal ulnar tunnel. The 2 primary considerations surrounding the varied proximal tunnel placements were the bony bridge formed between the proximal and distal tunnels and the perpendicularity of the triangle formed by the fixation points. Maximizing the bony bridge is obviously ideal in securing and preventing fixation blowout. Achieving an isoceles reconstruction has been reported in the literature on the various fixation techniques for LUCL reconstruction.11 Although the biomechanical advantage of this fixation type is not fully clear, we assume the construct produces graft stands of equal length, tension, and stability. In addition, the larger footprint created by an isoceles reconstructed ligament increases the stability of the radial head.
Results of the present study showed that the more posterior the proximal ulnar tunnel, the longer the bony bridge and the more isoceles the reconstruction. The difference in bony bridge distance from the most anterior to the most posterior tunnel was about 2 mm, or 18%. For every 1 mm of posteriorization, the bony bridge was 0.2 mm longer. The line from the isometric point of humeral fixation bisecting the proximal and distal tunnels was also more perpendicular with the most posterior tunnel, by about 40°. The resulting proximal and distal limbs of the reconstruction were equal in length, as demonstrated by the smaller difference between the limbs. We assume this isoceles reconstruction more likely applies uniform restraint on the radial head. Thus, an effort should be made to posteriorize the proximal ulnar tunnel during reconstruction.
The study was limited by the number of patient-specific elbow models used. However, given the statistical consistency of measurements, sample size was sufficient. Another limitation, inherent to the model, was that only bony anatomy was incorporated. However, the overlying muscles, tendons, and ligaments can significantly alter tunnel placement, and this study provided other means and cues using more reliable landmarks to adequately place the tunnels. As this was a simulation study, we cannot confirm whether these results would make a difference clinically. The strengths of this study include development and verification of reliable landmarks that can be used to guide ulnar tunnel locations during LUCL reconstruction; these landmarks have been used for medial ulnar collateral ligament reconstruction.15 Other strengths include precise and accurate placement of tunnels and measurement of resulting bony bridges—accomplished independently and without compromising specimen quality.
Conclusion
We recommend drilling the proximal ulnar tunnel posterior to the supinator crest at the level of the radial head junction. A reasonable goal is 10 mm posterior to the crest, though the overlying soft tissue must be considered, and care should be taken to aim the drill anteriorly, toward the ulna’s intramedullary canal, to avoid posterior cortical breach. The distal ulnar tunnel should be drilled just posterior to the supinator crest, 15 mm distal to the radial head junction.
1. O’Driscoll SW, Bell DF, Morrey BF. Posterolateral rotatory instability of the elbow. J Bone Joint Surg Am. 1991;73(3):440-446.
2. O’Driscoll SW. Classification and evaluation of recurrent instability of the elbow. Clin Orthop Relat Res. 2000;370:34-43.
3. Takigawa N, Ryu J, Kish VL, Kinoshita M, Abe M. Functional anatomy of the lateral collateral ligament complex of the elbow: morphology and strain. J Hand Surg Br. 2005;30(2):143-147.
4. McAdams TR, Masters GW, Srivastava S. The effect of arthroscopic sectioning of the lateral ligament complex of the elbow on posterolateral rotatory stability. J Shoulder Elbow Surg. 2005;14(3):298-301.
5. Dunning CE, Zarzour ZD, Patterson SD, Johnson JA, King GJ. Ligamentous stabilizers against posterolateral rotatory instability of the elbow. J Bone Joint Surg Am. 2001;83(12):1823-1828.
6. Eygendaal D. Ligamentous reconstruction around the elbow using triceps tendon. Acta Orthop Scand. 2004;75(5):516-523.
7. Jones KJ, Dodson CC, Osbahr DC, et al. The docking technique for lateral ulnar collateral ligament reconstruction: surgical technique and clinical outcomes. J Shoulder Elbow Surg. 2012;21(3):389-395.
8. Lee BP, Teo LH. Surgical reconstruction for posterolateral rotatory instability of the elbow. J Shoulder Elbow Surg. 2003;12(5):476-479.
9. Lin KY, Shen PH, Lee CH, Pan RY, Lin LC, Shen HC. Functional outcomes of surgical reconstruction for posterolateral rotatory instability of the elbow. Injury. 2012;43(10):1657-1661.
10. Olsen BS, Søjbjerg JO. The treatment of recurrent posterolateral instability of the elbow. J Bone Joint Surg Br. 2003;85(3):342-346.
11. Sanchez-Sotelo J, Morrey BF, O’Driscoll SW. Ligamentous repair and reconstruction for posterolateral rotatory instability of the elbow. J Bone Joint Surg Br. 2005;87(1):54-61.
12. Savoie FH 3rd, Field LD, Gurley DJ. Arthroscopic and open radial ulnohumeral ligament reconstruction for posterolateral rotatory instability of the elbow. Hand Clin. 2009;25(3):323-329.
13. Savoie FH 3rd, O’Brien MJ, Field LD, Gurley DJ. Arthroscopic and open radial ulnohumeral ligament reconstruction for posterolateral rotatory instability of the elbow. Clin Sports Med. 2010;29(4):611-618.
14. Bryce CD, Pennypacker JL, Kulkarni N, et al. Validation of three-dimensional models of in situ scapulae. J Shoulder Elbow Surg. 2008;17(5):825-832.
15. Byram IR, Khanna K, Gardner TR, Ahmad CS. Characterizing bone tunnel placement in medial ulnar collateral ligament reconstruction using patient-specific 3-dimensional computed tomography modeling. Am J Sports Med. 2013;41(4):894-902.
16. Shiba R, Sorbie C, Siu DW, Bryant JT, Cooke TD, Wevers HW. Geometry of the humeroulnar joint. J Orthop Res. 1988;6(6):897-906.
17. Anakwenze OA, Khanna K, Levine WN, Ahmad CS. Characterization of the supinator tubercle for lateral ulnar collateral ligament reconstruction. Orthop J Sports Med. 2014;2(4):2325967114530969. doi:10.1177/2325967114530969.
18. Sasashige Y, Ochi M, Ikuta Y. Optimal attachment site for reconstruction of the ulnar collateral ligament. A cadaver study. Arch Orthop Trauma Surg. 1994;113(5):265-270.
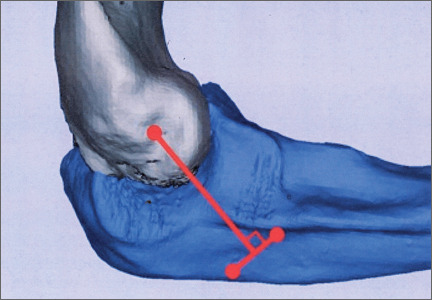
Real‐Time Patient Experience Surveys
In 2010, the Centers for Medicare and Medicaid Services implemented value‐based purchasing, a payment model that incentivizes hospitals for reaching certain quality and patient experience thresholds and penalizes those that do not, in part on the basis of patient satisfaction scores.[1] Although low patient satisfaction scores will adversely affect institutions financially, they also reflect patients' perceptions of their care. Some studies suggest that hospitals with higher patient satisfaction scores score higher overall on clinical care processes such as core measures compliance, readmission rates, lower mortality rates, and other quality‐of‐care metrics.[2, 3, 4, 5, 6, 7, 8, 9, 10, 11]
The Hospital Consumer Assessment of Healthcare Providers and Systems (HCAHPS) survey assesses patients' experience following their hospital stay.[1] The percent of top box scores (ie, response of always on a four point scale, or scores of 9 or 10 on a 10‐point scale) are utilized to compare hospitals and determine the reimbursement or penalty a hospital will receive. Although these scores are available to the public on the Hospital Compare website,[12] physicians may not know how their hospital is ranked or how they are individually perceived by their patients. Additionally, these surveys are typically conducted 48 hours to 6 weeks after patients are discharged, and the results are distributed back to the hospitals well after the time that care was provided, thereby offering providers no chance of improving patient satisfaction during a given hospital stay.
Institutions across the country are trying to improve their HCAHPS scores, but there is limited research identifying specific measures providers can implement. Some studies have suggested that utilizing etiquette‐based communication and sitting at the bedside[13, 14] may help improve patient experience with their providers, and more recently, it has been suggested that providing real‐time deidentified patient experience survey results with education and a rewards/emncentive system to residents may help as well.[15]
Surveys conducted during a patient's hospitalization can offer real‐time actionable feedback to providers. We performed a quality‐improvement project that was designed to determine if real‐time feedback to hospitalist physicians, followed by coaching, and revisits to the patients' bedside could improve the results recorded on provider‐specific patient surveys and/or patients' HCAHPS scores or percentile rankings.
METHODS
Design
This was a prospective, randomized quality‐improvement initiative that was approved by the Colorado Multiple Institutional Review Board and conducted at Denver Health, a 525‐bed university‐affiliated public safety net hospital. The initiative was conducted on both teaching and nonteaching general internal medicine services, which typically have a daily census of between 10 and 15 patients. No protocol changes occurred during the study.
Participants
Participants included all English‐ or Spanish‐speaking patients who were hospitalized on a general internal medicine service, had been admitted within the 2 days prior to enrollment, and had a hospitalist as their attending physician. Patients were excluded if they were enrolled in the study during a previous hospitalization, refused to participate, lacked capacity to participate, had hearing or speech impediments precluding regular conversation, were prisoners, if their clinical condition precluded participation, or their attending was an investigator in the project.
Intervention
Participants were prescreened by investigators by reviewing team sign‐outs to determine if patients had any exclusion criteria. Investigators attempted to survey each patient who met inclusion criteria on a daily basis between 9:00 am and 11:00 am. An investigator administered the survey to each patient verbally using scripted language. Patients were asked to rate how well their doctors were listening to them, explaining what they wanted to know, and whether the doctors were being friendly and helpful, all questions taken from a survey that was available on the US Department of Health and Human Services website (to be referred to as here forward daily survey).[16] We converted the original 5‐point Likert scale used in this survey to a 4‐point scale by removing the option of ok, leaving participants the options of poor, fair, good, or great. Patients were also asked to provide any personalized feedback they had, and these comments were recorded in writing by the investigator.
After being surveyed on day 1, patients were randomized to an intervention or control group using an automated randomization module in Research Electronic Data Capture (REDCap).[17] Patients in both groups who did not provide answers to all 3 questions that qualified as being top box (ie, great) were resurveyed on a daily basis until their responses were all top box or they were discharged, met exclusion criteria, or had been surveyed for a total of 4 consecutive days. In the pilot phase of this study, we found that if patients reported all top box scores on the initial survey their responses typically did not change over time, and the patients became frustrated if asked the same questions again when the patient felt there was not room for improvement. Accordingly, we elected to stop surveying patients when all top box responses were reported.
The attending hospitalist caring for each patient in the intervention group was given feedback about their patients' survey results (both their scores and any specific comments) on a daily basis. Feedback was provided in person by 1 of the investigators. The hospitalist also received an automatically generated electronic mail message with the survey results at 11:00 am on each study day. After informing the hospitalists of the patients' scores, the investigator provided a brief education session that included discussing Denver Health's most recent HCAHPS scores, value‐based purchasing, and the financial consequences of poor patient satisfaction scores. The investigator then coached the hospitalist on etiquette‐based communication,[18, 19] suggested that they sit down when communicating with their patients,[19, 20] and then asked the hospitalist to revisit each patient to discuss how the team could improve in any of the 3 areas where the patient did not give a top box score. These educational sessions were conducted in person and lasted a maximum of 5 minutes. An investigator followed up with each hospitalist the following day to determine whether the revisit occurred. Hospitalists caring for patients who were randomized to the control group were not given real‐time feedback or coaching and were not asked to revisit patients.
A random sample of patients surveyed for this initiative also received HCAHPS surveys 48 hours to 6 weeks following their hospital discharge, according to the standard methodology used to acquire HCAHPS data,[21] by an outside vendor contracted by Denver Health. Our vendor conducted these surveys via telephone in English or Spanish.
Outcomes
The primary outcome was the proportion of patients in each group who reported top box scores on the daily surveys. Secondary outcomes included the percent change for the scores recorded for 3 provider‐specific questions from the daily survey, the median top box HCAHPS scores for the 3 provider related questions and overall hospital rating, and the HCAHPS percentiles of top box scores for these questions.
Sample Size
The sample size for this intervention assumed that the proportion of patients whose treating physicians did not receive real‐time feedback who rated their providers as top box would be 75%, and that the effect of providing real‐time feedback would increase this proportion to 85% on the daily surveys. To have 80% power with a type 1 error of 0.05, we estimated a need to enroll 430 patients, 215 in each group.
Statistics
Data were collected and managed using a secure, Web‐based electronic data capture tool hosted at Denver Health (REDCap), which is designed to support data collection for research studies providing: (1) an intuitive interface for validated data entry, (2) audit trails for tracking data manipulation and export procedures, (3) automated export procedures for seamless data downloads to common statistical packages, and (4) procedures for importing data from external sources.[17]
A 2 test was used to compare the proportion of patients in the 2 groups who reported great scores for each question on the study survey on the first and last day. With the intent of providing a framework for understanding the effect real‐time feedback could have on patient experience, a secondary analysis of HCAHPS results was conducted using several different methods.
First, the proportion of patients in the 2 groups who reported scores of 9 or 10 for the overall hospital rating question or reported always for each doctor communication question on the HCHAPS survey was compared using a 2. Second, to allow for detection of differences in a sample with a smaller N, the median overall hospital rating scores from the HCAHPS survey reported by patients in the 2 groups who completed a survey following discharge were compared using a Wilcoxon rank sum test. Lastly, to place changes in proportion into a larger context (ie, how these changes would relate to value‐based purchasing), HCAHPS scores were converted to percentiles of national performance using the 2014 percentile rankings obtained from the external vendor that conducts the HCAHPS surveys for our hospital and compared between the intervention and control groups using a Wilcoxon rank sum test.
All comments collected from patients during their daily surveys were reviewed, and key words were abstracted from each comment. These key words were sorted and reviewed to categorize recurring key words into themes. Exemplars were then selected for each theme derived from patient comments.
RESULTS
From April 14, 2014 to September 19, 2014, we enrolled 227 patients in the control group and 228 in the intervention group (Figure 1). Patient demographics are summarized in Table 1. Of the 132 patients in the intervention group who reported anything less than top box scores for any of the 3 questions (thus prompting a revisit by their provider), 106 (80%) were revisited by their provider at least once during their hospitalization.
| All Patients | HCAHPS Patients | |||
|---|---|---|---|---|
| Control, N = 227 | Intervention, N = 228 | Control, N = 35 | Intervention, N = 30 | |
| ||||
| Age, mean SD | 55 14 | 55 15 | 55 15 | 57 16 |
| Gender | ||||
| Male | 126 (60) | 121 (55) | 20 (57) | 12 (40) |
| Female | 85 (40) | 98 (45) | 15(43) | 18 (60) |
| Race/ethnicity | ||||
| Hispanic | 84 (40) | 90 (41) | 17 (49) | 12 (40) |
| Black | 38 (18) | 28 (13) | 6 (17) | 7 (23) |
| White | 87 (41) | 97 (44) | 12 (34) | 10 (33) |
| Other | 2 (1) | 4 (2) | 0 (0) | 1 (3) |
| Payer | ||||
| Medicare | 65 (29) | 82 (36) | 15 (43) | 12 (40) |
| Medicaid | 122 (54) | 108 (47) | 17 (49) | 14 (47) |
| Commercial | 12 (5) | 15 (7) | 1 (3) | 1 (3) |
| Medically indigent | 4 (2) | 7 (3) | 0 (0) | 3 (10) |
| Self‐pay | 5 (2) | 4 (2) | 1 (3) | 0 (0) |
| Other/unknown | 19 (8) | 12 (5) | 0 (0) | 0 (0) |
| Team | ||||
| Teaching | 187 (82) | 196 (86) | 27 (77) | 24 (80) |
| Nonteaching | 40 (18) | 32 (14) | 8 (23) | 6 (20) |
| Top 5 primary discharge diagnoses* | ||||
| Septicemia | 26 (11) | 34 (15) | 3 (9) | 5 (17) |
| Heart failure | 14 (6) | 13 (6) | 2 (6) | |
| Acute pancreatitis | 12 (5) | 9 (4) | 3 (9) | 2 (7) |
| Diabetes mellitus | 11 (5) | 8 (4) | 2 (6) | |
| Alcohol withdrawal | 9 (4) | |||
| Cellulitis | 7 (3) | 2 (7) | ||
| Pulmonary embolism | 2 (7) | |||
| Chest pain | 2 (7) | |||
| Atrial fibrillation | 2 (6) | |||
| Length of stay, median (IQR) | 3 (2, 5) | 3 (2, 5) | 3 (2, 5) | 3 (2, 4) |
| Charlson Comorbidity Index, median (IQR) | 1 (0, 3) | 2 (0, 3) | 1 (0, 3) | 1.5 (1, 3) |
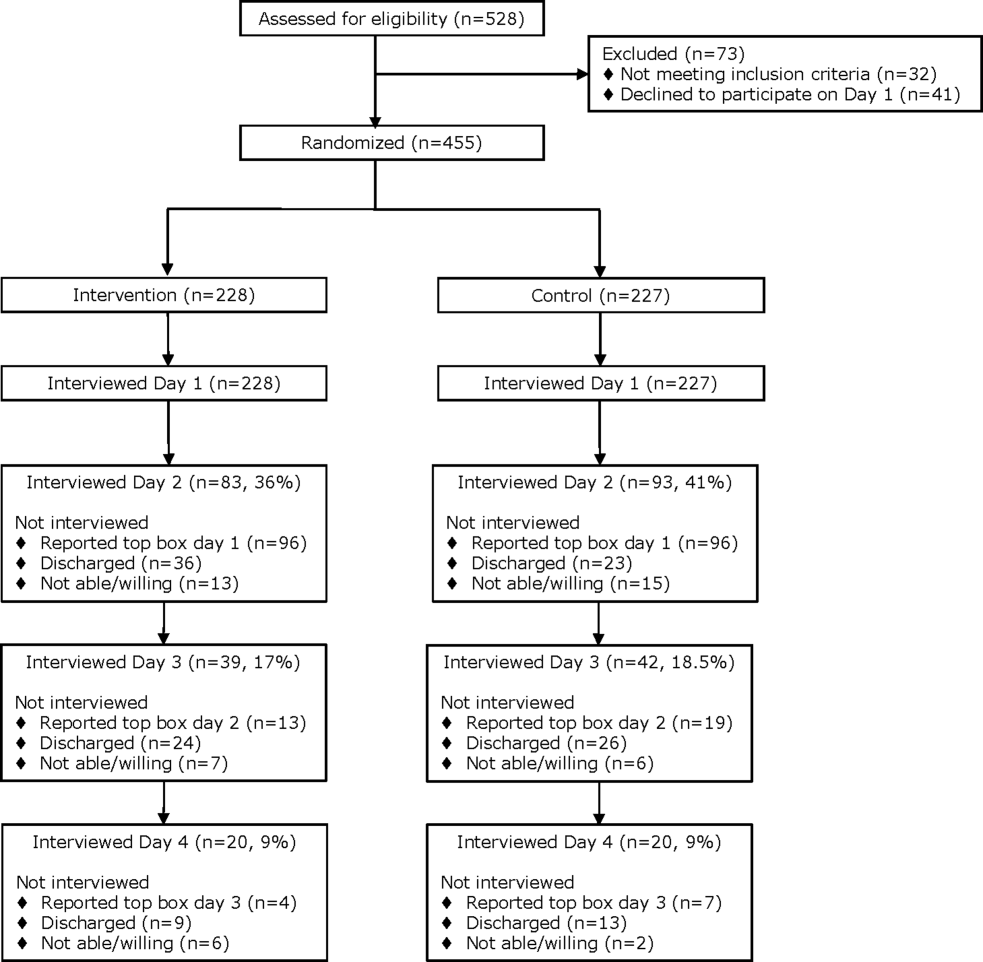
Daily Surveys
The proportion of patients in both study groups reporting top box scores tended to increase from the first day to the last day of the survey (Figure 2); however, we found no statistically significant differences between the proportion of patients who reported top box scores on first day or last day in the intervention group compared to the control group. The comments made by the patients are summarized in Supporting Table 1 in the online version of this article.
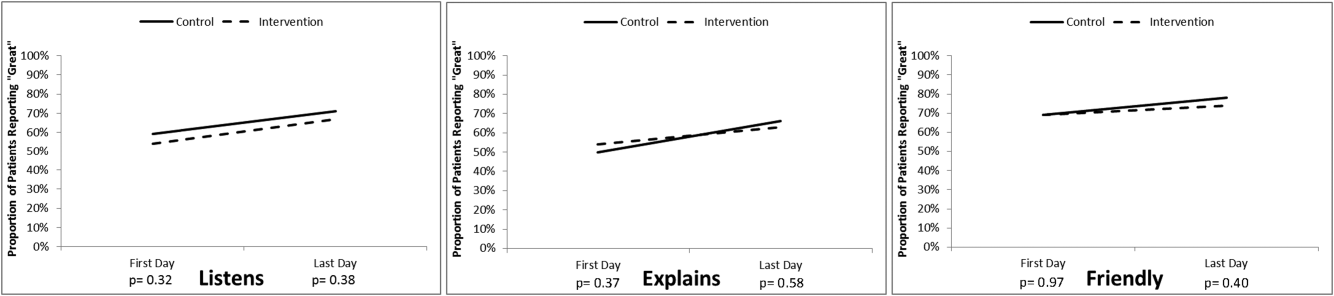
HCAHPS Scores
The proportion of top box scores from the HCAHPS surveys were higher, though not statistically significant, for all 3 provider‐specific questions and for the overall hospital rating for patients whose hospitalists received real‐time feedback (Table 2). The median [interquartile range] score for the overall hospital rating was higher for patients in the intervention group compared with those in the control group, (10 [9, 10] vs 9 [8, 10], P = 0.04]. After converting the HCAHPS scores to percentiles, we found considerably higher rankings for all 3 provider‐related questions and for the overall hospital rating in the intervention group compared to the control group (P = 0.02 for overall differences in percentiles [Table 2]).
| HCAHPS Questions | Proportion Top Box* | Percentile Rank | ||
|---|---|---|---|---|
| Control, N = 35 | Intervention, N = 30 | Control, N = 35 | Intervention, N = 30 | |
| ||||
| Overall hospital rating | 61% | 80% | 6 | 87 |
| Courtesy/respect | 86% | 93% | 23 | 88 |
| Clear communication | 77% | 80% | 39 | 60 |
| Listening | 83% | 90% | 57 | 95 |
No adverse events occurred during the course of the study in either group.
DISCUSSION
The important findings of this study were that (1) daily patient satisfaction scores improved from first day to last day regardless of study group, (2) patients whose providers received real‐time feedback had a trend toward higher HCAHPS proportions for the 3 provider‐related questions as well as the overall rating of the hospital but were not statistically significant, (3) the percentile differences in these 3 questions as well as the overall rating of the hospital were significantly higher in the intervention group as was the median score for the overall hospital rating.
Our original sample size calculation was based upon our own preliminary data, indicating that our baseline top box scores for the daily survey was around 75%. The daily survey top box score on the first day was, however, much lower (Figure 2). Accordingly, although we did not find a significant difference in these daily scores, we were underpowered to find such a difference. Additionally, because only a small percentage of patients are selected for the HCAHPS survey, our ability to detect a difference in this secondary outcome was also limited. We felt that it was important to analyze the percentile comparisons in addition to the proportion of top box scores on the HCAHPS, because the metrics for value‐based purchasing are based upon, in part, how a hospital system compares to other systems. Finally, to improve our power to detect a difference given a small sample size, we converted the scoring system for overall hospital ranking to a continuous variable, which again was noted to be significant.
To our knowledge, this is the first randomized investigation designed to assess the effect of real‐time, patient‐specific feedback to physicians. Real‐time feedback is increasingly being incorporated into medical practice, but there is only limited information available describing how this type of feedback affects outcomes.[22, 23, 24] Banka et al.[15] found that HCAHPS scores improved as a result of real‐time feedback given to residents, but the study was not randomized, utilized a pre‐post design that resulted in there being differences between the patients studied before and after the intervention, and did not provide patient‐specific data to the residents. Tabib et al.[25] found that operating costs decreased 17% after instituting real‐time feedback to providers about these costs. Reeves et al.[26] conducted a cluster randomized trial of a patient feedback survey that was designed to improve nursing care, but the results were reviewed by the nurses several months after patients had been discharged.
The differences in median top box scores and percentile rank that we observed could have resulted from the real‐time feedback, the educational coaching, the fact that the providers revisited the majority of the patients, or a combination of all of the above. Gross et al.[27] found that longer visits lead to higher satisfaction, though others have not found this to necessarily be the case.[28, 29] Lin et al.[30] found that patient satisfaction was affected by the perceived duration of the visit as well as whether expectations on visit length were met and/or exceeded. Brown et al.[31] found that training providers in communication skills improved the providers perception of their communication skills, although patient experience scores did not improve. We feel that the results seen are more likely a combination thereof as opposed to any 1 component of the intervention.
The most commonly reported complaints or concerns in patients' undirected comments often related to communication issues. Comments on subsequent surveys suggested that patient satisfaction improved over time in the intervention group, indicating that perhaps physicians did try to improve in areas that were highlighted by the real‐time feedback, and that patients perceived the physician efforts to do so (eg, They're doing better than the last time you asked. They sat down and talked to me and listened better. They came back and explained to me about my care. They listened better. They should do this survey at the clinic. See Supporting Table 1 in the online version of this article).
Our study has several limitations. First, we did not randomize providers, and many of our providers (approximately 65%) participated in both the control group and also in the intervention group, and thus received real‐time feedback at some point during the study, which could have affected their overall practice and limited our ability to find a difference between the 2 groups. In an attempt to control for this possibility, the study was conducted on an intermittent basis during the study time frame. Furthermore, the proportion of patients who reported top box scores at the beginning of the study did not have a clear trend of change by the end of the study, suggesting that overall clinician practices with respect to patient satisfaction did not change during this short time period.
Second, only a small number of our patients were randomly selected for the HCAHPS survey, which limited our ability to detect significant differences in HCAHPS proportions. Third, the HCAHPS percentiles at our institution at that time were low. Accordingly, the improvements that we observed in patient satisfaction scores might not be reproducible at institutions with higher satisfactions scores. Fourth, time and resources were needed to obtain patient feedback to provide to providers during this study. There are, however, other ways to obtain feedback that are less resource intensive (eg, electronic feedback, the utilization of volunteers, or partnering this with manager rounding). Finally, the study was conducted at a single, university‐affiliated public teaching hospital and was a quality‐improvement initiative, and thus our results are not generalizable to other institutions.
In conclusion, real‐time feedback of patient experience to their providers, coupled with provider education, coaching, and revisits, seems to improve satisfaction of patients hospitalized on general internal medicine units who were cared for by hospitalists.
Acknowledgements
The authors thank Kate Fagan, MPH, for her excellent technical assistance.
Disclosure: Nothing to report.
- HCAHPS Fact Sheet. 2015. Available at: http://www.hcahpsonline.org/Files/HCAHPS_Fact_Sheet_June_2015.pdf. Accessed August 25, 2015.
- , , , . The relationship between commercial website ratings and traditional hospital performance measures in the USA. BMJ Qual Saf. 2013;22:194–202.
- , , , . Patients' perception of hospital care in the United States. N Engl J Med. 2008;359:1921–1931.
- , , , . The relationship between patients' perception of care and measures of hospital quality and safety. Health Serv Res. 2010;45:1024–1040.
- , , , et al. Relationship between quality of diabetes care and patient satisfaction. J Natl Med Assoc. 2003;95:64–70.
- , , , , . Relationship between patient satisfaction with inpatient care and hospital readmission within 30 days. Am J Manag Care. 2011;17:41–48.
- , , . A systematic review of evidence on the links between patient experience and clinical safety and effectiveness. BMJ Open. 2013;3(1).
- , . The association between satisfaction with services provided in primary care and outcomes in type 2 diabetes mellitus. Diabet Med. 2003;20:486–490.
- , , , et al. Associations between Web‐based patient ratings and objective measures of hospital quality. Arch Intern Med. 2012;172:435–436.
- , , , et al. Patient satisfaction and its relationship with clinical quality and inpatient mortality in acute myocardial infarction. Circ Cardiovasc Qual Outcomes. 2010;3:188–195.
- , , , , . Patients' perceptions of care are associated with quality of hospital care: a survey of 4605 hospitals. Am J Med Qual. 2015;30(4):382–388.
- Centers for Medicare 28:908–913.
- , , , , , . Effect of sitting vs. standing on perception of provider time at bedside: a pilot study. Patient Educ Couns. 2012;86:166–171.
- , , , et al. Improving patient satisfaction through physician education, feedback, and incentives. J Hosp Med. 2015;10:497–502.
- US Department of Health and Human Services. Patient satisfaction survey. Available at: http://bphc.hrsa.gov/policiesregulations/performancemeasures/patientsurvey/surveyform.html. Accessed November 15, 2013.
- , , , , , . Research electronic data capture (REDCap)—a metadata‐driven methodology and workflow process for providing translational research informatics support. J Biomed Inform. 2009;42:377–381.
- . The HCAHPS Handbook. Gulf Breeze, FL: Fire Starter; 2010.
- . Etiquette‐based medicine. N Engl J Med. 2008;358:1988–1989.
- . 5 years after the Kahn's etiquette‐based medicine: a brief checklist proposal for a functional second meeting with the patient. Front Psychol. 2013;4:723.
- Frequently Asked Questions. Hospital Value‐Based Purchasing Program. Available at: http://www.cms.gov/Medicare/Quality‐Initiatives‐Patient‐Assessment‐Instruments/hospital‐value‐based‐purchasing/Downloads/FY‐2013‐Program‐Frequently‐Asked‐Questions‐about‐Hospital‐VBP‐3‐9‐12.pdf. Accessed February 8, 2014.
- , , , . Real‐time patient survey data during routine clinical activities for rapid‐cycle quality improvement. JMIR Med Inform. 2015;3:e13.
- . Mount Sinai launches real‐time patient‐feedback survey tool. Healthcare Informatics website. Available at: http://www.healthcare‐informatics.com/news‐item/mount‐sinai‐launches‐real‐time‐patient‐feedback‐survey‐tool. Accessed August 25, 2015.
- , . Hospitals are finally starting to put real‐time data to use. Harvard Business Review website. Available at: https://hbr.org/2014/11/hospitals‐are‐finally‐starting‐to‐put‐real‐time‐data‐to‐use. Published November 12, 2014. Accessed August 25, 2015.
- , , , , . Reducing operating room costs through real‐time cost information feedback: a pilot study. J Endourol. 2015;29:963–968.
- , , . Facilitated patient experience feedback can improve nursing care: a pilot study for a phase III cluster randomised controlled trial. BMC Health Serv Res. 2013;13:259.
- , , , , . Patient satisfaction with time spent with their physician. J Fam Pract. 1998;47:133–137.
- , , , , , . The relationship between time spent communicating and communication outcomes on a hospital medicine service. J Gen Intern Med. 2012;27:185–189.
- , . Cognitive interview techniques reveal specific behaviors and issues that could affect patient satisfaction relative to hospitalists. J Hosp Med. 2009;4:E1–E6.
- , , , et al. Is patients' perception of time spent with the physician a determinant of ambulatory patient satisfaction? Arch Intern Med. 2001;161:1437–1442.
- , , , . Effect of clinician communication skills training on patient satisfaction. A randomized, controlled trial. Ann Intern Med. 1999;131:822–829.
In 2010, the Centers for Medicare and Medicaid Services implemented value‐based purchasing, a payment model that incentivizes hospitals for reaching certain quality and patient experience thresholds and penalizes those that do not, in part on the basis of patient satisfaction scores.[1] Although low patient satisfaction scores will adversely affect institutions financially, they also reflect patients' perceptions of their care. Some studies suggest that hospitals with higher patient satisfaction scores score higher overall on clinical care processes such as core measures compliance, readmission rates, lower mortality rates, and other quality‐of‐care metrics.[2, 3, 4, 5, 6, 7, 8, 9, 10, 11]
The Hospital Consumer Assessment of Healthcare Providers and Systems (HCAHPS) survey assesses patients' experience following their hospital stay.[1] The percent of top box scores (ie, response of always on a four point scale, or scores of 9 or 10 on a 10‐point scale) are utilized to compare hospitals and determine the reimbursement or penalty a hospital will receive. Although these scores are available to the public on the Hospital Compare website,[12] physicians may not know how their hospital is ranked or how they are individually perceived by their patients. Additionally, these surveys are typically conducted 48 hours to 6 weeks after patients are discharged, and the results are distributed back to the hospitals well after the time that care was provided, thereby offering providers no chance of improving patient satisfaction during a given hospital stay.
Institutions across the country are trying to improve their HCAHPS scores, but there is limited research identifying specific measures providers can implement. Some studies have suggested that utilizing etiquette‐based communication and sitting at the bedside[13, 14] may help improve patient experience with their providers, and more recently, it has been suggested that providing real‐time deidentified patient experience survey results with education and a rewards/emncentive system to residents may help as well.[15]
Surveys conducted during a patient's hospitalization can offer real‐time actionable feedback to providers. We performed a quality‐improvement project that was designed to determine if real‐time feedback to hospitalist physicians, followed by coaching, and revisits to the patients' bedside could improve the results recorded on provider‐specific patient surveys and/or patients' HCAHPS scores or percentile rankings.
METHODS
Design
This was a prospective, randomized quality‐improvement initiative that was approved by the Colorado Multiple Institutional Review Board and conducted at Denver Health, a 525‐bed university‐affiliated public safety net hospital. The initiative was conducted on both teaching and nonteaching general internal medicine services, which typically have a daily census of between 10 and 15 patients. No protocol changes occurred during the study.
Participants
Participants included all English‐ or Spanish‐speaking patients who were hospitalized on a general internal medicine service, had been admitted within the 2 days prior to enrollment, and had a hospitalist as their attending physician. Patients were excluded if they were enrolled in the study during a previous hospitalization, refused to participate, lacked capacity to participate, had hearing or speech impediments precluding regular conversation, were prisoners, if their clinical condition precluded participation, or their attending was an investigator in the project.
Intervention
Participants were prescreened by investigators by reviewing team sign‐outs to determine if patients had any exclusion criteria. Investigators attempted to survey each patient who met inclusion criteria on a daily basis between 9:00 am and 11:00 am. An investigator administered the survey to each patient verbally using scripted language. Patients were asked to rate how well their doctors were listening to them, explaining what they wanted to know, and whether the doctors were being friendly and helpful, all questions taken from a survey that was available on the US Department of Health and Human Services website (to be referred to as here forward daily survey).[16] We converted the original 5‐point Likert scale used in this survey to a 4‐point scale by removing the option of ok, leaving participants the options of poor, fair, good, or great. Patients were also asked to provide any personalized feedback they had, and these comments were recorded in writing by the investigator.
After being surveyed on day 1, patients were randomized to an intervention or control group using an automated randomization module in Research Electronic Data Capture (REDCap).[17] Patients in both groups who did not provide answers to all 3 questions that qualified as being top box (ie, great) were resurveyed on a daily basis until their responses were all top box or they were discharged, met exclusion criteria, or had been surveyed for a total of 4 consecutive days. In the pilot phase of this study, we found that if patients reported all top box scores on the initial survey their responses typically did not change over time, and the patients became frustrated if asked the same questions again when the patient felt there was not room for improvement. Accordingly, we elected to stop surveying patients when all top box responses were reported.
The attending hospitalist caring for each patient in the intervention group was given feedback about their patients' survey results (both their scores and any specific comments) on a daily basis. Feedback was provided in person by 1 of the investigators. The hospitalist also received an automatically generated electronic mail message with the survey results at 11:00 am on each study day. After informing the hospitalists of the patients' scores, the investigator provided a brief education session that included discussing Denver Health's most recent HCAHPS scores, value‐based purchasing, and the financial consequences of poor patient satisfaction scores. The investigator then coached the hospitalist on etiquette‐based communication,[18, 19] suggested that they sit down when communicating with their patients,[19, 20] and then asked the hospitalist to revisit each patient to discuss how the team could improve in any of the 3 areas where the patient did not give a top box score. These educational sessions were conducted in person and lasted a maximum of 5 minutes. An investigator followed up with each hospitalist the following day to determine whether the revisit occurred. Hospitalists caring for patients who were randomized to the control group were not given real‐time feedback or coaching and were not asked to revisit patients.
A random sample of patients surveyed for this initiative also received HCAHPS surveys 48 hours to 6 weeks following their hospital discharge, according to the standard methodology used to acquire HCAHPS data,[21] by an outside vendor contracted by Denver Health. Our vendor conducted these surveys via telephone in English or Spanish.
Outcomes
The primary outcome was the proportion of patients in each group who reported top box scores on the daily surveys. Secondary outcomes included the percent change for the scores recorded for 3 provider‐specific questions from the daily survey, the median top box HCAHPS scores for the 3 provider related questions and overall hospital rating, and the HCAHPS percentiles of top box scores for these questions.
Sample Size
The sample size for this intervention assumed that the proportion of patients whose treating physicians did not receive real‐time feedback who rated their providers as top box would be 75%, and that the effect of providing real‐time feedback would increase this proportion to 85% on the daily surveys. To have 80% power with a type 1 error of 0.05, we estimated a need to enroll 430 patients, 215 in each group.
Statistics
Data were collected and managed using a secure, Web‐based electronic data capture tool hosted at Denver Health (REDCap), which is designed to support data collection for research studies providing: (1) an intuitive interface for validated data entry, (2) audit trails for tracking data manipulation and export procedures, (3) automated export procedures for seamless data downloads to common statistical packages, and (4) procedures for importing data from external sources.[17]
A 2 test was used to compare the proportion of patients in the 2 groups who reported great scores for each question on the study survey on the first and last day. With the intent of providing a framework for understanding the effect real‐time feedback could have on patient experience, a secondary analysis of HCAHPS results was conducted using several different methods.
First, the proportion of patients in the 2 groups who reported scores of 9 or 10 for the overall hospital rating question or reported always for each doctor communication question on the HCHAPS survey was compared using a 2. Second, to allow for detection of differences in a sample with a smaller N, the median overall hospital rating scores from the HCAHPS survey reported by patients in the 2 groups who completed a survey following discharge were compared using a Wilcoxon rank sum test. Lastly, to place changes in proportion into a larger context (ie, how these changes would relate to value‐based purchasing), HCAHPS scores were converted to percentiles of national performance using the 2014 percentile rankings obtained from the external vendor that conducts the HCAHPS surveys for our hospital and compared between the intervention and control groups using a Wilcoxon rank sum test.
All comments collected from patients during their daily surveys were reviewed, and key words were abstracted from each comment. These key words were sorted and reviewed to categorize recurring key words into themes. Exemplars were then selected for each theme derived from patient comments.
RESULTS
From April 14, 2014 to September 19, 2014, we enrolled 227 patients in the control group and 228 in the intervention group (Figure 1). Patient demographics are summarized in Table 1. Of the 132 patients in the intervention group who reported anything less than top box scores for any of the 3 questions (thus prompting a revisit by their provider), 106 (80%) were revisited by their provider at least once during their hospitalization.
| All Patients | HCAHPS Patients | |||
|---|---|---|---|---|
| Control, N = 227 | Intervention, N = 228 | Control, N = 35 | Intervention, N = 30 | |
| ||||
| Age, mean SD | 55 14 | 55 15 | 55 15 | 57 16 |
| Gender | ||||
| Male | 126 (60) | 121 (55) | 20 (57) | 12 (40) |
| Female | 85 (40) | 98 (45) | 15(43) | 18 (60) |
| Race/ethnicity | ||||
| Hispanic | 84 (40) | 90 (41) | 17 (49) | 12 (40) |
| Black | 38 (18) | 28 (13) | 6 (17) | 7 (23) |
| White | 87 (41) | 97 (44) | 12 (34) | 10 (33) |
| Other | 2 (1) | 4 (2) | 0 (0) | 1 (3) |
| Payer | ||||
| Medicare | 65 (29) | 82 (36) | 15 (43) | 12 (40) |
| Medicaid | 122 (54) | 108 (47) | 17 (49) | 14 (47) |
| Commercial | 12 (5) | 15 (7) | 1 (3) | 1 (3) |
| Medically indigent | 4 (2) | 7 (3) | 0 (0) | 3 (10) |
| Self‐pay | 5 (2) | 4 (2) | 1 (3) | 0 (0) |
| Other/unknown | 19 (8) | 12 (5) | 0 (0) | 0 (0) |
| Team | ||||
| Teaching | 187 (82) | 196 (86) | 27 (77) | 24 (80) |
| Nonteaching | 40 (18) | 32 (14) | 8 (23) | 6 (20) |
| Top 5 primary discharge diagnoses* | ||||
| Septicemia | 26 (11) | 34 (15) | 3 (9) | 5 (17) |
| Heart failure | 14 (6) | 13 (6) | 2 (6) | |
| Acute pancreatitis | 12 (5) | 9 (4) | 3 (9) | 2 (7) |
| Diabetes mellitus | 11 (5) | 8 (4) | 2 (6) | |
| Alcohol withdrawal | 9 (4) | |||
| Cellulitis | 7 (3) | 2 (7) | ||
| Pulmonary embolism | 2 (7) | |||
| Chest pain | 2 (7) | |||
| Atrial fibrillation | 2 (6) | |||
| Length of stay, median (IQR) | 3 (2, 5) | 3 (2, 5) | 3 (2, 5) | 3 (2, 4) |
| Charlson Comorbidity Index, median (IQR) | 1 (0, 3) | 2 (0, 3) | 1 (0, 3) | 1.5 (1, 3) |
Daily Surveys
The proportion of patients in both study groups reporting top box scores tended to increase from the first day to the last day of the survey (Figure 2); however, we found no statistically significant differences between the proportion of patients who reported top box scores on first day or last day in the intervention group compared to the control group. The comments made by the patients are summarized in Supporting Table 1 in the online version of this article.
HCAHPS Scores
The proportion of top box scores from the HCAHPS surveys were higher, though not statistically significant, for all 3 provider‐specific questions and for the overall hospital rating for patients whose hospitalists received real‐time feedback (Table 2). The median [interquartile range] score for the overall hospital rating was higher for patients in the intervention group compared with those in the control group, (10 [9, 10] vs 9 [8, 10], P = 0.04]. After converting the HCAHPS scores to percentiles, we found considerably higher rankings for all 3 provider‐related questions and for the overall hospital rating in the intervention group compared to the control group (P = 0.02 for overall differences in percentiles [Table 2]).
| HCAHPS Questions | Proportion Top Box* | Percentile Rank | ||
|---|---|---|---|---|
| Control, N = 35 | Intervention, N = 30 | Control, N = 35 | Intervention, N = 30 | |
| ||||
| Overall hospital rating | 61% | 80% | 6 | 87 |
| Courtesy/respect | 86% | 93% | 23 | 88 |
| Clear communication | 77% | 80% | 39 | 60 |
| Listening | 83% | 90% | 57 | 95 |
No adverse events occurred during the course of the study in either group.
DISCUSSION
The important findings of this study were that (1) daily patient satisfaction scores improved from first day to last day regardless of study group, (2) patients whose providers received real‐time feedback had a trend toward higher HCAHPS proportions for the 3 provider‐related questions as well as the overall rating of the hospital but were not statistically significant, (3) the percentile differences in these 3 questions as well as the overall rating of the hospital were significantly higher in the intervention group as was the median score for the overall hospital rating.
Our original sample size calculation was based upon our own preliminary data, indicating that our baseline top box scores for the daily survey was around 75%. The daily survey top box score on the first day was, however, much lower (Figure 2). Accordingly, although we did not find a significant difference in these daily scores, we were underpowered to find such a difference. Additionally, because only a small percentage of patients are selected for the HCAHPS survey, our ability to detect a difference in this secondary outcome was also limited. We felt that it was important to analyze the percentile comparisons in addition to the proportion of top box scores on the HCAHPS, because the metrics for value‐based purchasing are based upon, in part, how a hospital system compares to other systems. Finally, to improve our power to detect a difference given a small sample size, we converted the scoring system for overall hospital ranking to a continuous variable, which again was noted to be significant.
To our knowledge, this is the first randomized investigation designed to assess the effect of real‐time, patient‐specific feedback to physicians. Real‐time feedback is increasingly being incorporated into medical practice, but there is only limited information available describing how this type of feedback affects outcomes.[22, 23, 24] Banka et al.[15] found that HCAHPS scores improved as a result of real‐time feedback given to residents, but the study was not randomized, utilized a pre‐post design that resulted in there being differences between the patients studied before and after the intervention, and did not provide patient‐specific data to the residents. Tabib et al.[25] found that operating costs decreased 17% after instituting real‐time feedback to providers about these costs. Reeves et al.[26] conducted a cluster randomized trial of a patient feedback survey that was designed to improve nursing care, but the results were reviewed by the nurses several months after patients had been discharged.
The differences in median top box scores and percentile rank that we observed could have resulted from the real‐time feedback, the educational coaching, the fact that the providers revisited the majority of the patients, or a combination of all of the above. Gross et al.[27] found that longer visits lead to higher satisfaction, though others have not found this to necessarily be the case.[28, 29] Lin et al.[30] found that patient satisfaction was affected by the perceived duration of the visit as well as whether expectations on visit length were met and/or exceeded. Brown et al.[31] found that training providers in communication skills improved the providers perception of their communication skills, although patient experience scores did not improve. We feel that the results seen are more likely a combination thereof as opposed to any 1 component of the intervention.
The most commonly reported complaints or concerns in patients' undirected comments often related to communication issues. Comments on subsequent surveys suggested that patient satisfaction improved over time in the intervention group, indicating that perhaps physicians did try to improve in areas that were highlighted by the real‐time feedback, and that patients perceived the physician efforts to do so (eg, They're doing better than the last time you asked. They sat down and talked to me and listened better. They came back and explained to me about my care. They listened better. They should do this survey at the clinic. See Supporting Table 1 in the online version of this article).
Our study has several limitations. First, we did not randomize providers, and many of our providers (approximately 65%) participated in both the control group and also in the intervention group, and thus received real‐time feedback at some point during the study, which could have affected their overall practice and limited our ability to find a difference between the 2 groups. In an attempt to control for this possibility, the study was conducted on an intermittent basis during the study time frame. Furthermore, the proportion of patients who reported top box scores at the beginning of the study did not have a clear trend of change by the end of the study, suggesting that overall clinician practices with respect to patient satisfaction did not change during this short time period.
Second, only a small number of our patients were randomly selected for the HCAHPS survey, which limited our ability to detect significant differences in HCAHPS proportions. Third, the HCAHPS percentiles at our institution at that time were low. Accordingly, the improvements that we observed in patient satisfaction scores might not be reproducible at institutions with higher satisfactions scores. Fourth, time and resources were needed to obtain patient feedback to provide to providers during this study. There are, however, other ways to obtain feedback that are less resource intensive (eg, electronic feedback, the utilization of volunteers, or partnering this with manager rounding). Finally, the study was conducted at a single, university‐affiliated public teaching hospital and was a quality‐improvement initiative, and thus our results are not generalizable to other institutions.
In conclusion, real‐time feedback of patient experience to their providers, coupled with provider education, coaching, and revisits, seems to improve satisfaction of patients hospitalized on general internal medicine units who were cared for by hospitalists.
Acknowledgements
The authors thank Kate Fagan, MPH, for her excellent technical assistance.
Disclosure: Nothing to report.
- HCAHPS Fact Sheet. 2015. Available at: http://www.hcahpsonline.org/Files/HCAHPS_Fact_Sheet_June_2015.pdf. Accessed August 25, 2015.
- , , , . The relationship between commercial website ratings and traditional hospital performance measures in the USA. BMJ Qual Saf. 2013;22:194–202.
- , , , . Patients' perception of hospital care in the United States. N Engl J Med. 2008;359:1921–1931.
- , , , . The relationship between patients' perception of care and measures of hospital quality and safety. Health Serv Res. 2010;45:1024–1040.
- , , , et al. Relationship between quality of diabetes care and patient satisfaction. J Natl Med Assoc. 2003;95:64–70.
- , , , , . Relationship between patient satisfaction with inpatient care and hospital readmission within 30 days. Am J Manag Care. 2011;17:41–48.
- , , . A systematic review of evidence on the links between patient experience and clinical safety and effectiveness. BMJ Open. 2013;3(1).
- , . The association between satisfaction with services provided in primary care and outcomes in type 2 diabetes mellitus. Diabet Med. 2003;20:486–490.
- , , , et al. Associations between Web‐based patient ratings and objective measures of hospital quality. Arch Intern Med. 2012;172:435–436.
- , , , et al. Patient satisfaction and its relationship with clinical quality and inpatient mortality in acute myocardial infarction. Circ Cardiovasc Qual Outcomes. 2010;3:188–195.
- , , , , . Patients' perceptions of care are associated with quality of hospital care: a survey of 4605 hospitals. Am J Med Qual. 2015;30(4):382–388.
- Centers for Medicare 28:908–913.
- , , , , , . Effect of sitting vs. standing on perception of provider time at bedside: a pilot study. Patient Educ Couns. 2012;86:166–171.
- , , , et al. Improving patient satisfaction through physician education, feedback, and incentives. J Hosp Med. 2015;10:497–502.
- US Department of Health and Human Services. Patient satisfaction survey. Available at: http://bphc.hrsa.gov/policiesregulations/performancemeasures/patientsurvey/surveyform.html. Accessed November 15, 2013.
- , , , , , . Research electronic data capture (REDCap)—a metadata‐driven methodology and workflow process for providing translational research informatics support. J Biomed Inform. 2009;42:377–381.
- . The HCAHPS Handbook. Gulf Breeze, FL: Fire Starter; 2010.
- . Etiquette‐based medicine. N Engl J Med. 2008;358:1988–1989.
- . 5 years after the Kahn's etiquette‐based medicine: a brief checklist proposal for a functional second meeting with the patient. Front Psychol. 2013;4:723.
- Frequently Asked Questions. Hospital Value‐Based Purchasing Program. Available at: http://www.cms.gov/Medicare/Quality‐Initiatives‐Patient‐Assessment‐Instruments/hospital‐value‐based‐purchasing/Downloads/FY‐2013‐Program‐Frequently‐Asked‐Questions‐about‐Hospital‐VBP‐3‐9‐12.pdf. Accessed February 8, 2014.
- , , , . Real‐time patient survey data during routine clinical activities for rapid‐cycle quality improvement. JMIR Med Inform. 2015;3:e13.
- . Mount Sinai launches real‐time patient‐feedback survey tool. Healthcare Informatics website. Available at: http://www.healthcare‐informatics.com/news‐item/mount‐sinai‐launches‐real‐time‐patient‐feedback‐survey‐tool. Accessed August 25, 2015.
- , . Hospitals are finally starting to put real‐time data to use. Harvard Business Review website. Available at: https://hbr.org/2014/11/hospitals‐are‐finally‐starting‐to‐put‐real‐time‐data‐to‐use. Published November 12, 2014. Accessed August 25, 2015.
- , , , , . Reducing operating room costs through real‐time cost information feedback: a pilot study. J Endourol. 2015;29:963–968.
- , , . Facilitated patient experience feedback can improve nursing care: a pilot study for a phase III cluster randomised controlled trial. BMC Health Serv Res. 2013;13:259.
- , , , , . Patient satisfaction with time spent with their physician. J Fam Pract. 1998;47:133–137.
- , , , , , . The relationship between time spent communicating and communication outcomes on a hospital medicine service. J Gen Intern Med. 2012;27:185–189.
- , . Cognitive interview techniques reveal specific behaviors and issues that could affect patient satisfaction relative to hospitalists. J Hosp Med. 2009;4:E1–E6.
- , , , et al. Is patients' perception of time spent with the physician a determinant of ambulatory patient satisfaction? Arch Intern Med. 2001;161:1437–1442.
- , , , . Effect of clinician communication skills training on patient satisfaction. A randomized, controlled trial. Ann Intern Med. 1999;131:822–829.
© 2016 Society of Hospital Medicine

Impact of Pneumonia Guidelines
Overutilization of resources is a significant, yet underappreciated, problem in medicine. Many interventions target underutilization (eg, immunizations) or misuse (eg, antibiotic prescribing for viral pharyngitis), yet overutilization remains as a significant contributor to healthcare waste.[1] In an effort to reduce waste, the Choosing Wisely campaign created a work group to highlight areas of overutilization, specifically noting both diagnostic tests and therapies for common pediatric conditions with no proven benefit and possible harm to the patient.[2] Respiratory illnesses have been a target of many quality‐improvement efforts, and pneumonia represents a common diagnosis in pediatrics.[3] The use of diagnostic testing for pneumonia is an area where care can be optimized and aligned with evidence.
Laboratory testing and diagnostic imaging are routinely used for the management of children with community‐acquired pneumonia (CAP). Several studies have documented substantial variability in the use of these resources for pneumonia management, with higher resource use associated with a higher chance of hospitalization after emergency department (ED) evaluation and a longer length of stay among those requiring hospitalization.[4, 5] This variation in diagnostic resource utilization has been attributed, at least in part, to a lack of consensus on the management of pneumonia. There is wide variability in diagnostic testing, and due to potential consequences for patients presenting with pneumonia, efforts to standardize care offer an opportunity to improve healthcare value.
In August 2011, the first national, evidence‐based consensus guidelines for the management of childhood CAP were published jointly by the Pediatric Infectious Diseases Society (PIDS) and the Infectious Diseases Society of America (IDSA).[6] A primary focus of these guidelines was the recommendation for the use of narrow spectrum antibiotics for the management of uncomplicated pneumonia. Previous studies have assessed the impact of the publication of the PIDS/IDSA guidelines on empiric antibiotic selection for the management of pneumonia.[7, 8] In addition, the guidelines provided recommendations regarding diagnostic test utilization, in particular discouraging blood tests (eg, complete blood counts) and radiologic studies for nontoxic, fully immunized children treated as outpatients, as well as repeat testing for children hospitalized with CAP who are improving.
Although single centers have demonstrated changes in utilization patterns based on clinical practice guidelines,[9, 10, 11, 12] whether these guidelines have impacted diagnostic test utilization among US children with CAP in a larger scale remains unknown. Therefore, we sought to determine the impact of the PIDS/IDSA guidelines on the use of diagnostic testing among children with CAP using a national sample of US children's hospitals. Because the guidelines discourage repeat diagnostic testing in patients who are improving, we also evaluated the association between repeat diagnostic studies and severity of illness.
METHODS
This retrospective cohort study used data from the Pediatric Health Information System (PHIS) (Children's Hospital Association, Overland Park, KS). The PHIS database contains deidentified administrative data, detailing demographic, diagnostic, procedure, and billing data from 47 freestanding, tertiary care children's hospitals. This database accounts for approximately 20% of all annual pediatric hospitalizations in the United States. Data quality is ensured through a joint effort between the Children's Hospital Association and participating hospitals.
Patient Population
Data from 32 (of the 47) hospitals included in PHIS with complete inpatient and ED data were used to evaluate hospital‐level resource utilization for children 1 to 18 years of age discharged January 1, 2008 to June 30, 2014 with a diagnosis of pneumonia (International Classification of Diseases, 9th Revision [ICD‐9] codes 480.x‐486.x, 487.0).[13] Our goal was to identify previously healthy children with uncomplicated pneumonia, so we excluded patients with complex chronic conditions,[14] billing charges for intensive care management and/or pleural drainage procedure (IDC‐9 codes 510.0, 510.9, 511.0, 511.1, 511.8, 511.9, 513.x) on day of admission or the next day, or prior pneumonia admission in the last 30 days. We studied 2 mutually exclusive populations: children with pneumonia treated in the ED (ie, patients who were evaluated in the ED and discharged to home), and children hospitalized with pneumonia, including those admitted through the ED.
Guideline Publication and Study Periods
For an exploratory before and after comparison, patients were grouped into 2 cohorts based on a guideline online publication date of August 1, 2011: preguideline (January 1, 2008 to July 31, 2011) and postguideline (August 1, 2011 to June 30, 2014).
Study Outcomes
The measured outcomes were the monthly proportion of pneumonia patients for whom specific diagnostic tests were performed, as determined from billing data. The diagnostic tests evaluated were complete blood count (CBC), blood culture, C‐reactive protein (CRP), and chest radiograph (CXR). Standardized costs were also calculated from PHIS charges as previously described to standardize the cost of the individual tests and remove interhospital cost variation.[3]
Relationship of Repeat Testing and Severity of Illness
Because higher illness severity and clinical deterioration may warrant repeat testing, we also explored the association of repeat diagnostic testing for inpatients with severity of illness by using the following variables as measures of severity: length of stay (LOS), transfer to intensive care unit (ICU), or pleural drainage procedure after admission (>2 calendar days after admission). Repeat diagnostic testing was stratified by number of tests.
Statistical Analysis
The categorical demographic characteristics of the pre‐ and postguideline populations were summarized using frequencies and percentages, and compared using 2 tests. Continuous demographics were summarized with medians and interquartile ranges (IQRs) and compared with the Wilcoxon rank sum test. Segmented regression, clustered by hospital, was used to assess trends in monthly resource utilization as well as associated standardized costs before and after guidelines publication. To estimate the impact of the guidelines overall, we compared the observed diagnostic resource use at the end of the study period with expected use projected from trends in the preguidelines period (ie, if there were no new guidelines). Individual interrupted time series were also built for each hospital. From these models, we assessed which hospitals had a significant difference between the rate observed at the end of the study and that estimated from their preguideline trajectory. To assess the relationship between the number of positive improvements at a hospital and hospital characteristics, we used Spearman's correlation and Kruskal‐Wallis tests. All analyses were performed with SAS version 9.3 (SAS Institute, Inc., Cary, NC), and P values <0.05 were considered statistically significant. In accordance with the policies of the Cincinnati Children's Hospital Medical Center Institutional Review Board, this research, using a deidentified dataset, was not considered human subjects research.
RESULTS
There were 275,288 hospital admissions meeting study inclusion criteria of 1 to 18 years of age with a diagnosis of pneumonia from 2008 to 2014. Of these, 54,749 met exclusion criteria (1874 had pleural drainage procedure on day 0 or 1, 51,306 had complex chronic conditions, 1569 were hospitalized with pneumonia in the last 30 days). Characteristics of the remaining 220,539 patients in the final sample are shown in Table 1. The median age was 4 years (IQR, 27 years); a majority of the children were male (53%) and had public insurance (58%). There were 128,855 patients in the preguideline period (January 1, 2008 to July 31, 2011) and 91,684 in the post guideline period (August 1, 2011June 30, 2014).
| Overall | Preguideline | Postguideline | P | |
|---|---|---|---|---|
| ||||
| No. of discharges | 220,539 | 128,855 | 91,684 | |
| Type of encounter | ||||
| ED only | 150,215 (68.1) | 88,790 (68.9) | 61,425 (67) | <0.001 |
| Inpatient | 70,324 (31.9) | 40,065 (31.1) | 30,259 (33) | |
| Age | ||||
| 14 years | 129,360 (58.7) | 77,802 (60.4) | 51,558 (56.2) | <0.001 |
| 59 years | 58,609 (26.6) | 32,708 (25.4) | 25,901 (28.3) | |
| 1018 years | 32,570 (14.8) | 18,345 (14.2) | 14,225 (15.5) | |
| Median [IQR] | 4 [27] | 3 [27] | 4 [27] | <0.001 |
| Gender | ||||
| Male | 116,718 (52.9) | 68,319 (53) | 48,399 (52.8) | 00.285 |
| Female | 103,813 (47.1) | 60,532 (47) | 43,281 (47.2) | |
| Race | ||||
| Non‐Hispanic white | 84,423 (38.3) | 47,327 (36.7) | 37,096 (40.5) | <0.001 |
| Non‐Hispanic black | 60,062 (27.2) | 35,870 (27.8) | 24,192 (26.4) | |
| Hispanic | 51,184 (23.2) | 31,167 (24.2) | 20,017 (21.8) | |
| Asian | 6,444 (2.9) | 3,691 (2.9) | 2,753 (3) | |
| Other | 18,426 (8.4) | 10,800 (8.4) | 7,626 (8.3) | |
| Payer | ||||
| Government | 128,047 (58.1) | 70,742 (54.9) | 57,305 (62.5) | <0.001 |
| Private | 73,338 (33.3) | 44,410 (34.5) | 28,928 (31.6) | |
| Other | 19,154 (8.7) | 13,703 (10.6) | 5,451 (5.9) | |
| Disposition | ||||
| HHS | 684 (0.3) | 411 (0.3) | 273 (0.3) | <0.001 |
| Home | 209,710 (95.1) | 123,236 (95.6) | 86,474 (94.3) | |
| Other | 9,749 (4.4) | 4,962 (3.9) | 4,787 (5.2) | |
| SNF | 396 (0.2) | 246 (0.2) | 150 (0.2) | |
| Season | ||||
| Spring | 60,171 (27.3) | 36,709 (28.5) | 23,462 (25.6) | <0.001 |
| Summer | 29,891 (13.6) | 17,748 (13.8) | 12,143 (13.2) | |
| Fall | 52,161 (23.7) | 28,332 (22) | 23,829 (26) | |
| Winter | 78,316 (35.5) | 46,066 (35.8) | 32,250 (35.2) | |
| LOS | ||||
| 13 days | 204,812 (92.9) | 119,497 (92.7) | 85,315 (93.1) | <0.001 |
| 46 days | 10,454 (4.7) | 6,148 (4.8) | 4,306 (4.7) | |
| 7+ days | 5,273 (2.4) | 3,210 (2.5) | 2,063 (2.3) | |
| Median [IQR] | 1 [11] | 1 [11] | 1 [11] | 0.144 |
| Admitted patients, median [IQR] | 2 [13] | 2 [13] | 2 [13] | <0.001 |
Discharged From the ED
Throughout the study, utilization of CBC, blood cultures, and CRP was <20%, whereas CXR use was >75%. In segmented regression analysis, CRP utilization was relatively stable before the guidelines publication. However, by the end of the study period, the projected estimate of CRP utilization without guidelines (expected) was 2.9% compared with 4.8% with the guidelines (observed) (P < 0.05) (Figure 1). A similar pattern of higher rates of diagnostic utilization after the guidelines compared with projected estimates without the guidelines was also seen in the ED utilization of CBC, blood cultures, and CXR (Figure 1); however, these trends did not achieve statistical significance. Table 2 provides specific values. Using a standard cost of $19.52 for CRP testing, annual costs across all hospitals increased $11,783 for ED evaluation of CAP.
Baseline (%) | Preguideline Trend | Level Change at Guideline | Change in Trend After Guideline | Estimates at End of Study* | |||
|---|---|---|---|---|---|---|---|
Without Guideline (%) | With Guideline (%) | P | |||||
| |||||||
| ED‐only encounters | |||||||
| Blood culture | 14.6 | 0.1 | 0.8 | 0.1 | 5.5 | 8.6 | NS |
| CBC | 19.2 | 0.1 | 0.4 | 0.1 | 10.7 | 14.0 | NS |
| CRP | 5.4 | 0.0 | 0.6 | 0.1 | 2.9 | 4.8 | <0.05 |
| Chest x‐ray | 85.4 | 0.1 | 0.1 | 0.0 | 80.9 | 81.1 | NS |
| Inpatient encounters | |||||||
| Blood culture | 50.6 | 0.0 | 1.7 | 0.2 | 49.2 | 41.4 | <0.05 |
| Repeat blood culture | 6.5 | 0.0 | 1.0 | 0.1 | 8.9 | 5.8 | NS |
| CBC | 65.2 | 0.0 | 3.1 | 0.0 | 65.0 | 62.2 | NS |
| Repeat CBC | 23.4 | 0.0 | 4.2 | 0.0 | 20.8 | 16.0 | NS |
| CRP | 25.7 | 0.0 | 1.1 | 0.0 | 23.8 | 23.5 | NS |
| Repeat CRP | 12.5 | 0.1 | 2.2 | 0.1 | 7.1 | 7.3 | NS |
| Chest x‐ray | 89.4 | 0.1 | 0.7 | 0.0 | 85.4 | 83.9 | NS |
| Repeat chest x‐ray | 25.5 | 0.0 | 2.0 | 0.1 | 24.1 | 17.7 | <0.05 |
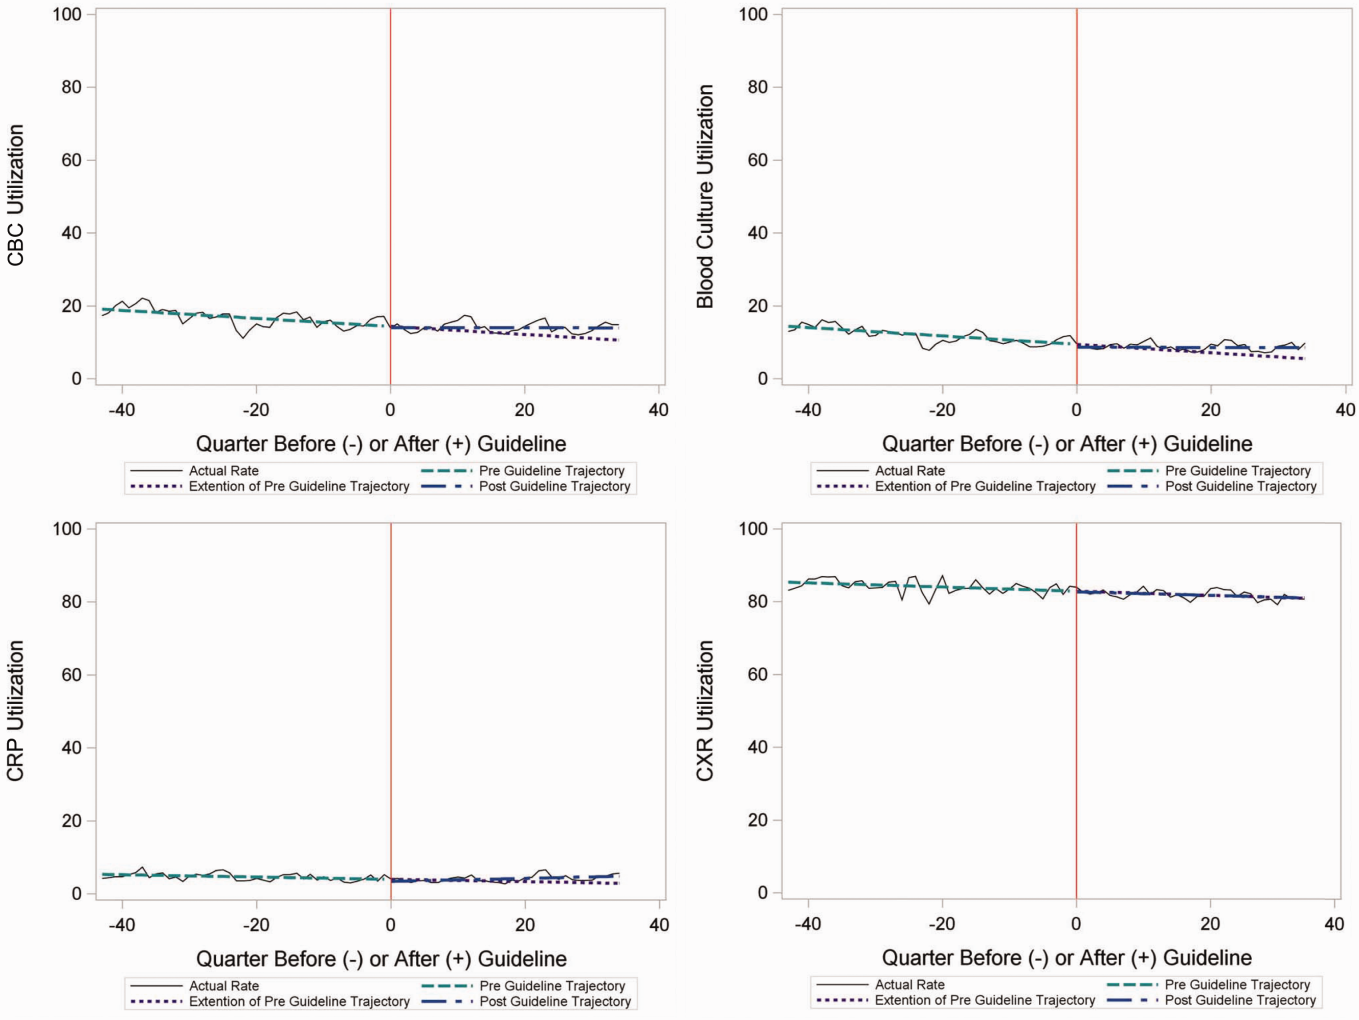
Inpatient Encounters
In the segmented regression analysis of children hospitalized with CAP, guideline publication was associated with changes in the monthly use of some diagnostic tests. For example, by the end of the study period, the use of blood culture was 41.4% (observed), whereas the projected estimated use in the absence of the guidelines was 49.2% (expected) (P < 0.05) (Figure 2). Table 2 includes the data for the other tests, CBC, CRP, and CXR, in which similar patterns are noted with lower utilization rates after the guidelines, compared with expected utilization rates without the guidelines; however, these trends did not achieve statistical significance. Evaluating the utilization of repeat testing for inpatients, only repeat CXR achieved statistical significance (P < 0.05), with utilization rates of 17.7% with the guidelines (actual) compared with 24.1% without the guidelines (predicted).
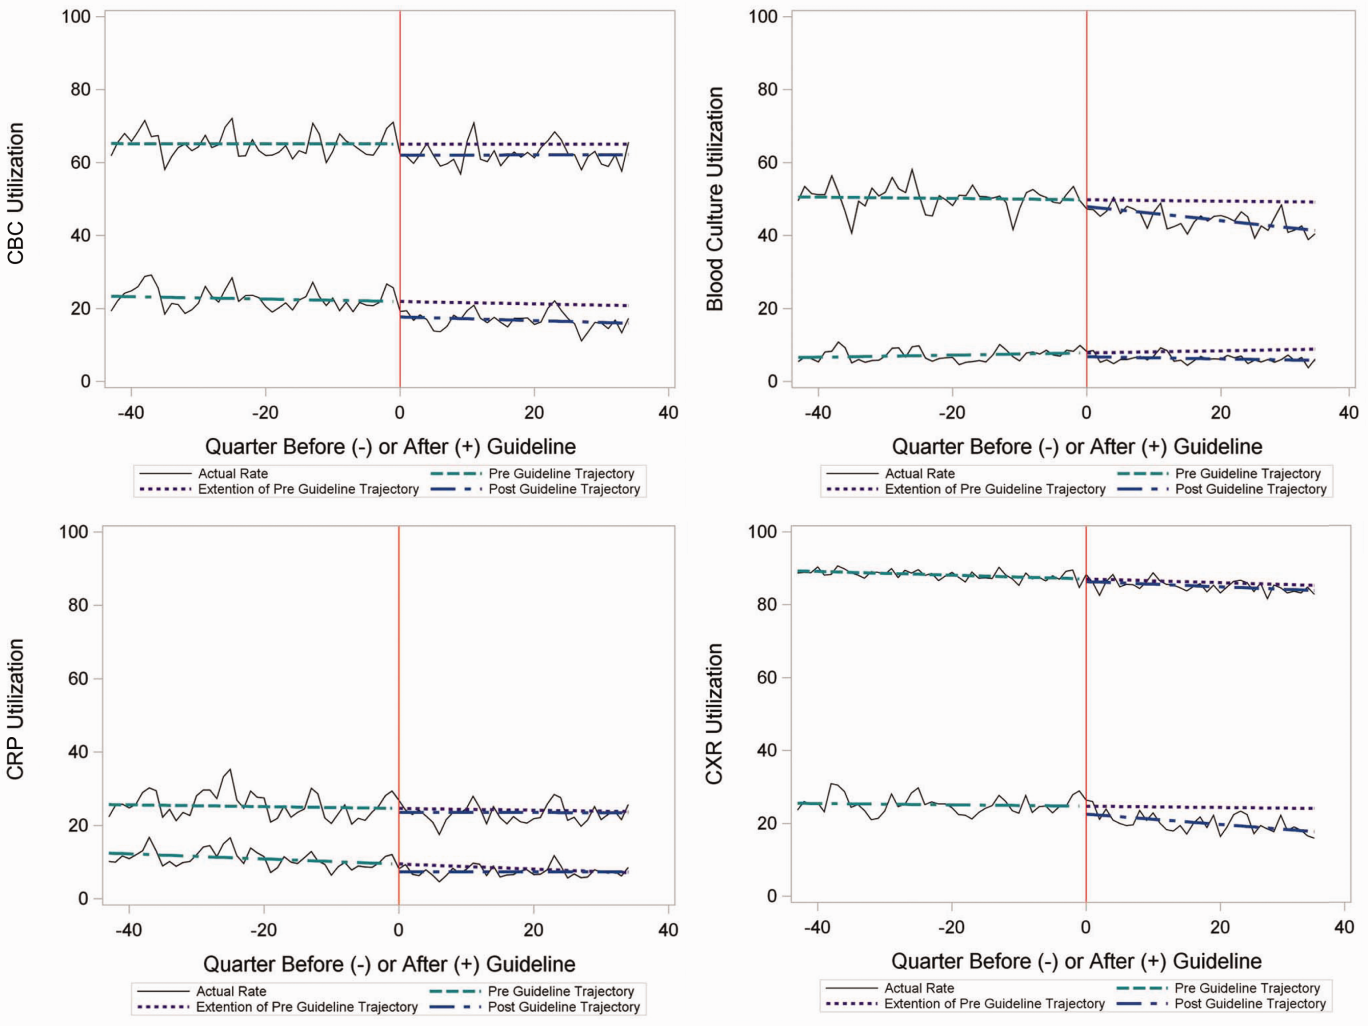
To better understand the use of repeat testing, a comparison of severity outcomesLOS, ICU transfer, and pleural drainage procedureswas performed between patients with no repeat testing (70%) and patients with 1 or more repeat tests (30%). Patients with repeat testing had longer LOS (no repeat testing LOS 1 [IQR, 12]) versus 1 repeat test LOS 3 ([IQR, 24] vs 2+ repeat tests LOS 5 [IQR, 38]), higher rate of ICU transfer (no repeat testing 4.6% vs 1 repeat test 14.6% vs 2+ repeat test 35.6%), and higher rate of pleural drainage (no repeat testing 0% vs 1 repeat test 0.1% vs 2+ repeat test 5.9%] (all P < 0.001).
Using standard costs of $37.57 for blood cultures and $73.28 for CXR, annual costs for children with CAP across all hospitals decreased by $91,512 due to decreased utilization of blood cultures, and by $146,840 due to decreased utilization of CXR.
Hospital‐Level Variation in the Impact of the National Guideline
Figure 3 is a visual representation (heat map) of the impact of the guidelines at the hospital level at the end of the study from the individual interrupted time series. Based on this heat map (Figure 3), there was wide variability between hospitals in the impact of the guideline on each test in different settings (ED or inpatient). By diagnostic testing, 7 hospitals significantly decreased utilization of blood cultures for inpatients, and 5 hospitals significantly decreased utilization for repeat blood cultures and repeat CXR. Correlation between the number of positive improvements at a hospital and region (P = 0.974), number of CAP cases (P = 0.731), or percentage of public insurance (P = 0.241) were all nonsignificant.
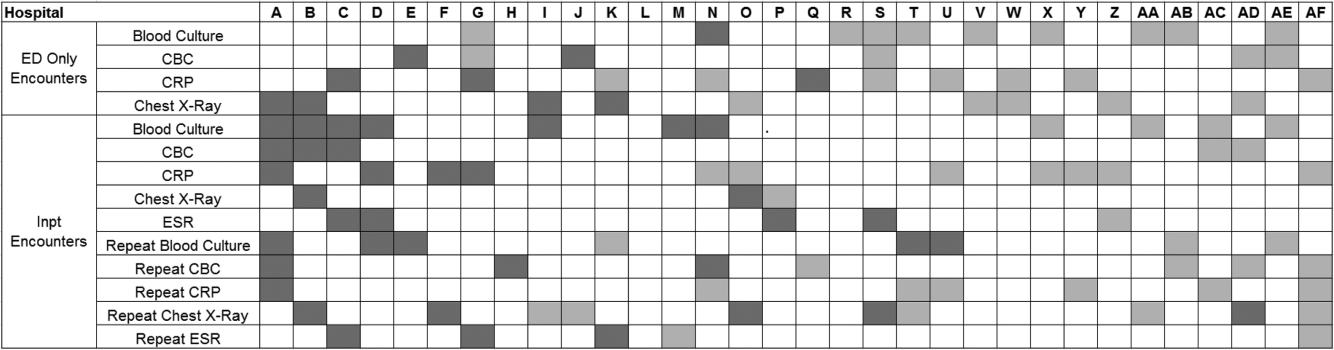
DISCUSSION
This study complements previous assessments by evaluating the impact of the 2011 IDSA/PIDS consensus guidelines on the management of children with CAP cared for at US children's hospitals. Prior studies have shown increased use of narrow‐spectrum antibiotics for children with CAP after the publication of these guidelines.[7] The current study focused on diagnostic testing for CAP before and after the publication of the 2011 guidelines. In the ED setting, use of some diagnostic tests (blood culture, CBC, CXR, CRP) was declining prior to guideline publication, but appeared to plateau and/or increase after 2011. Among children admitted with CAP, use of diagnostic testing was relatively stable prior to 2011, and use of these tests (blood culture, CBC, CXR, CRP) declined after guideline publication. Overall, changes in diagnostic resource utilization 3 years after publication were modest, with few changes achieving statistical significance. There was a large variability in the impact of guidelines on test use between hospitals.
For outpatients, including those managed in the ED, the PIDS/IDSA guidelines recommend limited laboratory testing in nontoxic, fully immunized patients. The guidelines discourage the use of diagnostic testing among outpatients because of their low yield (eg, blood culture), and because test results may not impact management (eg, CBC).[6] In the years prior to guideline publication, there was already a declining trend in testing rates, including blood cultures, CBC, and CRP, for patients in the ED. After guideline publication, the rate of blood cultures, CBC, and CRP increased, but only the increase in CRP utilization achieved statistical significance. We would not expect utilization for common diagnostic tests (eg, CBC for outpatients with CAP) to be at or close to 0% because of the complexity of clinical decision making regarding admission that factors in aspects of patient history, exam findings, and underlying risk.[15] ED utilization of blood cultures was <10%, CBC <15%, and CRP <5% after guideline publication, which may represent the lowest testing limit that could be achieved.
CXRs obtained in the ED did not decrease over the entire study period. The rates of CXR use (close to 80%) seen in our study are similar to prior ED studies.[5, 16] Management of children with CAP in the ED might be different than outpatient primary care management because (1) unlike primary care providers, ED providers do not have an established relationship with their patients and do not have the opportunity for follow‐up and serial exams, making them less likely to tolerate diagnostic uncertainty; and (2) ED providers may see sicker patients. However, use of CXR in the ED does represent an opportunity for further study to understand if decreased utilization is feasible without adversely impacting clinical outcomes.
The CAP guidelines provide a strong recommendation to obtain blood culture in moderate to severe pneumonia. Despite this, blood culture utilization declined after guideline publication. Less than 10% of children hospitalized with uncomplicated CAP have positive blood cultures, which calls into question the utility of blood cultures for all admitted patients.[17, 18, 19] The recent EPIC (Epidemiology of Pneumonia in the Community) study showed that a majority of children hospitalized with pneumonia do not have growth of bacteria in culture, but there may be a role for blood cultures in patients with a strong suspicion of complicated CAP or in the patient with moderate to severe disease.[20] In addition to blood cultures, the guidelines also recommend CBC and CXR in moderate to severely ill children. This observed decline in testing in CBC and CXR may be related to individual physician assessments of which patients are moderately to severely ill, as the guidelines do not recommend testing for children with less severe disease. Our exclusion of patients requiring intensive care management or pleural drainage on admission might have selected children with a milder course of illness, although still requiring admission.
The guidelines discourage repeat diagnostic testing among children hospitalized with CAP who are improving. In this study, repeat CXR and CBC occurred in approximately 20% of patients, but repeat blood culture and CRP was much lower. As with initial diagnostic testing for inpatients with CAP, the rates of some repeat testing decreased with the guidelines. However, those with repeat testing had longer LOS and were more likely to require ICU transfer or a pleural drainage procedure compared to children without repeat testing. This suggests that repeat testing is used more often in children with a severe presentation or a worsening clinical course, and not done routinely on hospitalized patients.
The financial impact of decreased testing is modest, because the tests themselves are relatively inexpensive. However, the lack of substantial cost savings should not preclude efforts to continue to improve adherence to the guidelines. Not only is increased testing associated with higher hospitalization rates,[5] potentially yielding higher costs and family stress, increased testing may also lead to patient discomfort and possibly increased radiation exposure through chest radiography.
Many of the diagnostic testing recommendations in the CAP guidelines are based on weak evidence, which may contribute to the lack of substantial adoption. Nevertheless, adherence to guideline recommendations requires sustained effort on the part of individual physicians that should be encouraged through institutional support.[21] Continuous education and clinical decision support, as well as reminders in the electronic medical record, would make guideline recommendations more visible and may help overcome the inertia of previous practice.[15] The hospital‐level heat map (Figure 3) included in this study demonstrates that the impact of the guidelines was variable across sites. Although a few sites had decreased diagnostic testing in many areas with no increased testing in any category, there were several sites that had no improvement in any diagnostic testing category. In addition, hospital‐level factors like size, geography, and insurance status were not associated with number of improvements. To better understand drivers of change at individual hospitals, future studies should evaluate specific strategies utilized by the rapid guideline adopters.
This study is subject to several limitations. The use of ICD‐9 codes to identify patients with CAP may not capture all patients with this diagnosis; however, these codes have been previously validated.[13] Additionally, because patients were identified using ICD‐9 coding assigned at the time of discharge, testing performed in the ED setting may not reflect care for a child with known pneumonia, but rather may reflect testing for a child with fever or other signs of infection. PHIS collects data from freestanding children's hospitals, which care for a majority of children with CAP in the US, but our findings may not be generalizable to other hospitals. In addition, we did not examine drivers of trends within individual institutions. We did not have detailed information to examine whether the PHIS hospitals in our study had actively worked to adopt the CAP guidelines. We were also unable to assess physician's familiarity with guidelines or the level of disagreement with the recommendations. Furthermore, the PHIS database does not permit detailed correlation of diagnostic testing with clinical parameters. In contrast to the diagnostic testing evaluated in this study, which is primarily discouraged by the IDSA/PIDS guidelines, respiratory viral testing for children with CAP is recommended but could not be evaluated, as data on such testing are not readily available in PHIS.
CONCLUSION
Publication of the IDSA/PIDS evidence‐based guidelines for the management of CAP was associated with modest, variable changes in use of diagnostic testing. Further adoption of the CAP guidelines should reduce variation in care and decrease unnecessary resource utilization in the management of CAP. Our study demonstrates that efforts to promote decreased resource utilization should target specific situations (eg, repeat testing for inpatients who are improving). Adherence to guidelines may be improved by the adoption of local practices that integrate and improve daily workflow, like order sets and clinical decision support tools.
Disclosure: Nothing to report.
- , . Eliminating waste in US health care. JAMA. 2012;307(14):1513–1516.
- , , , et al. Choosing wisely in pediatric hospital medicine: five opportunities for improved healthcare value. J Hosp Med. 2013;8(9):479–485.
- , , , et al.; Pediatric Research in Inpatient Settings (PRIS) Network. Prioritization of comparative effectiveness research topics in hospital pediatrics. Arch Pediatr Adolesc Med. 2012;166(12):1155–1164.
- , , , et al. Variability in processes of care and outcomes among children hospitalized with community‐acquired pneumonia. Pediatr Infect Dis J. 2012;31(10):1036–1041.
- , , , , . Variation in emergency department diagnostic testing and disposition outcomes in pneumonia. Pediatrics. 2013;132(2):237–244.
- , , , et al.; Pediatric Infectious Diseases Society and the Infectious Diseases Society of America. The management of community‐acquired pneumonia in infants and children older than 3 months of age: clinical practice guidelines by the Pediatric Infectious Diseases Society and the Infectious Diseases Society of America. Clin Infect Dis. 2011;53(7):e25–e76.
- , , , et al., Impact of Infectious Diseases Society of America/Pediatric Infectious Diseases Society guidelines on treatment of community‐acquired pneumonia in hospitalized children. Clin Infect Dis. 2014;58(6):834–838.
- , , , et al. Antibiotic choice for children hospitalized with pneumonia and adherence to national guidelines. Pediatrics. 2015;136(1):44–52.
- , , , et al. Quality improvement methods increase appropriate antibiotic prescribing for childhood pneumonia. Pediatrics. 2013;131(5):e1623–e1631.
- , , , et al. Improvement methodology increases guideline recommended blood cultures in children with pneumonia. Pediatrics. 2015;135(4):e1052–e1059.
- , , , , , . Impact of a guideline on management of children hospitalized with community‐acquired pneumonia. Pediatrics. 2012;129(3):e597–e604.
- , , , . Effectiveness of antimicrobial guidelines for community‐acquired pneumonia in children. Pediatrics. 2012;129(5):e1326–e1333.
- , , , et al. Identifying pediatric community‐acquired pneumonia hospitalizations: accuracy of administrative billing codes. JAMA Pediatr. 2013;167(9):851–858.
- , , , , . Pediatric complex chronic conditions classification system version 2: updated for ICD‐10 and complex medical technology dependence and transplantation. BMC Pediatr. 2014;14:199.
- , . Establishing superior benchmarks of care in clinical practice: a proposal to drive achievable health care value. JAMA Pediatr. 2015;169(4):301–302.
- , , , . Emergency department management of childhood pneumonia in the United States prior to publication of national guidelines. Acad Emerg Med. 2013;20(3):240–246.
- , , , et al. Prevalence of bacteremia in hospitalized pediatric patients with community‐acquired pneumonia. Pediatr Infect Dis J. 2013;32(7):736–740.
- , , , , . The prevalence of bacteremia in pediatric patients with community‐acquired pneumonia: guidelines to reduce the frequency of obtaining blood cultures. Hosp Pediatr. 2013;3(2):92–96.
- . Do all children hospitalized with community‐acquired pneumonia require blood cultures? Hosp Pediatr. 2013;3(2):177–179.
- , , , et al.; CDC EPIC Study Team. Community‐acquired pneumonia requiring hospitalization among U.S. children. N Engl J Med. 2015;372(9):835–845.
- , , , et al. Influence of hospital guidelines on management of children hospitalized with pneumonia. Pediatrics. 2012;130(5):e823–e830.
Overutilization of resources is a significant, yet underappreciated, problem in medicine. Many interventions target underutilization (eg, immunizations) or misuse (eg, antibiotic prescribing for viral pharyngitis), yet overutilization remains as a significant contributor to healthcare waste.[1] In an effort to reduce waste, the Choosing Wisely campaign created a work group to highlight areas of overutilization, specifically noting both diagnostic tests and therapies for common pediatric conditions with no proven benefit and possible harm to the patient.[2] Respiratory illnesses have been a target of many quality‐improvement efforts, and pneumonia represents a common diagnosis in pediatrics.[3] The use of diagnostic testing for pneumonia is an area where care can be optimized and aligned with evidence.
Laboratory testing and diagnostic imaging are routinely used for the management of children with community‐acquired pneumonia (CAP). Several studies have documented substantial variability in the use of these resources for pneumonia management, with higher resource use associated with a higher chance of hospitalization after emergency department (ED) evaluation and a longer length of stay among those requiring hospitalization.[4, 5] This variation in diagnostic resource utilization has been attributed, at least in part, to a lack of consensus on the management of pneumonia. There is wide variability in diagnostic testing, and due to potential consequences for patients presenting with pneumonia, efforts to standardize care offer an opportunity to improve healthcare value.
In August 2011, the first national, evidence‐based consensus guidelines for the management of childhood CAP were published jointly by the Pediatric Infectious Diseases Society (PIDS) and the Infectious Diseases Society of America (IDSA).[6] A primary focus of these guidelines was the recommendation for the use of narrow spectrum antibiotics for the management of uncomplicated pneumonia. Previous studies have assessed the impact of the publication of the PIDS/IDSA guidelines on empiric antibiotic selection for the management of pneumonia.[7, 8] In addition, the guidelines provided recommendations regarding diagnostic test utilization, in particular discouraging blood tests (eg, complete blood counts) and radiologic studies for nontoxic, fully immunized children treated as outpatients, as well as repeat testing for children hospitalized with CAP who are improving.
Although single centers have demonstrated changes in utilization patterns based on clinical practice guidelines,[9, 10, 11, 12] whether these guidelines have impacted diagnostic test utilization among US children with CAP in a larger scale remains unknown. Therefore, we sought to determine the impact of the PIDS/IDSA guidelines on the use of diagnostic testing among children with CAP using a national sample of US children's hospitals. Because the guidelines discourage repeat diagnostic testing in patients who are improving, we also evaluated the association between repeat diagnostic studies and severity of illness.
METHODS
This retrospective cohort study used data from the Pediatric Health Information System (PHIS) (Children's Hospital Association, Overland Park, KS). The PHIS database contains deidentified administrative data, detailing demographic, diagnostic, procedure, and billing data from 47 freestanding, tertiary care children's hospitals. This database accounts for approximately 20% of all annual pediatric hospitalizations in the United States. Data quality is ensured through a joint effort between the Children's Hospital Association and participating hospitals.
Patient Population
Data from 32 (of the 47) hospitals included in PHIS with complete inpatient and ED data were used to evaluate hospital‐level resource utilization for children 1 to 18 years of age discharged January 1, 2008 to June 30, 2014 with a diagnosis of pneumonia (International Classification of Diseases, 9th Revision [ICD‐9] codes 480.x‐486.x, 487.0).[13] Our goal was to identify previously healthy children with uncomplicated pneumonia, so we excluded patients with complex chronic conditions,[14] billing charges for intensive care management and/or pleural drainage procedure (IDC‐9 codes 510.0, 510.9, 511.0, 511.1, 511.8, 511.9, 513.x) on day of admission or the next day, or prior pneumonia admission in the last 30 days. We studied 2 mutually exclusive populations: children with pneumonia treated in the ED (ie, patients who were evaluated in the ED and discharged to home), and children hospitalized with pneumonia, including those admitted through the ED.
Guideline Publication and Study Periods
For an exploratory before and after comparison, patients were grouped into 2 cohorts based on a guideline online publication date of August 1, 2011: preguideline (January 1, 2008 to July 31, 2011) and postguideline (August 1, 2011 to June 30, 2014).
Study Outcomes
The measured outcomes were the monthly proportion of pneumonia patients for whom specific diagnostic tests were performed, as determined from billing data. The diagnostic tests evaluated were complete blood count (CBC), blood culture, C‐reactive protein (CRP), and chest radiograph (CXR). Standardized costs were also calculated from PHIS charges as previously described to standardize the cost of the individual tests and remove interhospital cost variation.[3]
Relationship of Repeat Testing and Severity of Illness
Because higher illness severity and clinical deterioration may warrant repeat testing, we also explored the association of repeat diagnostic testing for inpatients with severity of illness by using the following variables as measures of severity: length of stay (LOS), transfer to intensive care unit (ICU), or pleural drainage procedure after admission (>2 calendar days after admission). Repeat diagnostic testing was stratified by number of tests.
Statistical Analysis
The categorical demographic characteristics of the pre‐ and postguideline populations were summarized using frequencies and percentages, and compared using 2 tests. Continuous demographics were summarized with medians and interquartile ranges (IQRs) and compared with the Wilcoxon rank sum test. Segmented regression, clustered by hospital, was used to assess trends in monthly resource utilization as well as associated standardized costs before and after guidelines publication. To estimate the impact of the guidelines overall, we compared the observed diagnostic resource use at the end of the study period with expected use projected from trends in the preguidelines period (ie, if there were no new guidelines). Individual interrupted time series were also built for each hospital. From these models, we assessed which hospitals had a significant difference between the rate observed at the end of the study and that estimated from their preguideline trajectory. To assess the relationship between the number of positive improvements at a hospital and hospital characteristics, we used Spearman's correlation and Kruskal‐Wallis tests. All analyses were performed with SAS version 9.3 (SAS Institute, Inc., Cary, NC), and P values <0.05 were considered statistically significant. In accordance with the policies of the Cincinnati Children's Hospital Medical Center Institutional Review Board, this research, using a deidentified dataset, was not considered human subjects research.
RESULTS
There were 275,288 hospital admissions meeting study inclusion criteria of 1 to 18 years of age with a diagnosis of pneumonia from 2008 to 2014. Of these, 54,749 met exclusion criteria (1874 had pleural drainage procedure on day 0 or 1, 51,306 had complex chronic conditions, 1569 were hospitalized with pneumonia in the last 30 days). Characteristics of the remaining 220,539 patients in the final sample are shown in Table 1. The median age was 4 years (IQR, 27 years); a majority of the children were male (53%) and had public insurance (58%). There were 128,855 patients in the preguideline period (January 1, 2008 to July 31, 2011) and 91,684 in the post guideline period (August 1, 2011June 30, 2014).
| Overall | Preguideline | Postguideline | P | |
|---|---|---|---|---|
| ||||
| No. of discharges | 220,539 | 128,855 | 91,684 | |
| Type of encounter | ||||
| ED only | 150,215 (68.1) | 88,790 (68.9) | 61,425 (67) | <0.001 |
| Inpatient | 70,324 (31.9) | 40,065 (31.1) | 30,259 (33) | |
| Age | ||||
| 14 years | 129,360 (58.7) | 77,802 (60.4) | 51,558 (56.2) | <0.001 |
| 59 years | 58,609 (26.6) | 32,708 (25.4) | 25,901 (28.3) | |
| 1018 years | 32,570 (14.8) | 18,345 (14.2) | 14,225 (15.5) | |
| Median [IQR] | 4 [27] | 3 [27] | 4 [27] | <0.001 |
| Gender | ||||
| Male | 116,718 (52.9) | 68,319 (53) | 48,399 (52.8) | 00.285 |
| Female | 103,813 (47.1) | 60,532 (47) | 43,281 (47.2) | |
| Race | ||||
| Non‐Hispanic white | 84,423 (38.3) | 47,327 (36.7) | 37,096 (40.5) | <0.001 |
| Non‐Hispanic black | 60,062 (27.2) | 35,870 (27.8) | 24,192 (26.4) | |
| Hispanic | 51,184 (23.2) | 31,167 (24.2) | 20,017 (21.8) | |
| Asian | 6,444 (2.9) | 3,691 (2.9) | 2,753 (3) | |
| Other | 18,426 (8.4) | 10,800 (8.4) | 7,626 (8.3) | |
| Payer | ||||
| Government | 128,047 (58.1) | 70,742 (54.9) | 57,305 (62.5) | <0.001 |
| Private | 73,338 (33.3) | 44,410 (34.5) | 28,928 (31.6) | |
| Other | 19,154 (8.7) | 13,703 (10.6) | 5,451 (5.9) | |
| Disposition | ||||
| HHS | 684 (0.3) | 411 (0.3) | 273 (0.3) | <0.001 |
| Home | 209,710 (95.1) | 123,236 (95.6) | 86,474 (94.3) | |
| Other | 9,749 (4.4) | 4,962 (3.9) | 4,787 (5.2) | |
| SNF | 396 (0.2) | 246 (0.2) | 150 (0.2) | |
| Season | ||||
| Spring | 60,171 (27.3) | 36,709 (28.5) | 23,462 (25.6) | <0.001 |
| Summer | 29,891 (13.6) | 17,748 (13.8) | 12,143 (13.2) | |
| Fall | 52,161 (23.7) | 28,332 (22) | 23,829 (26) | |
| Winter | 78,316 (35.5) | 46,066 (35.8) | 32,250 (35.2) | |
| LOS | ||||
| 13 days | 204,812 (92.9) | 119,497 (92.7) | 85,315 (93.1) | <0.001 |
| 46 days | 10,454 (4.7) | 6,148 (4.8) | 4,306 (4.7) | |
| 7+ days | 5,273 (2.4) | 3,210 (2.5) | 2,063 (2.3) | |
| Median [IQR] | 1 [11] | 1 [11] | 1 [11] | 0.144 |
| Admitted patients, median [IQR] | 2 [13] | 2 [13] | 2 [13] | <0.001 |
Discharged From the ED
Throughout the study, utilization of CBC, blood cultures, and CRP was <20%, whereas CXR use was >75%. In segmented regression analysis, CRP utilization was relatively stable before the guidelines publication. However, by the end of the study period, the projected estimate of CRP utilization without guidelines (expected) was 2.9% compared with 4.8% with the guidelines (observed) (P < 0.05) (Figure 1). A similar pattern of higher rates of diagnostic utilization after the guidelines compared with projected estimates without the guidelines was also seen in the ED utilization of CBC, blood cultures, and CXR (Figure 1); however, these trends did not achieve statistical significance. Table 2 provides specific values. Using a standard cost of $19.52 for CRP testing, annual costs across all hospitals increased $11,783 for ED evaluation of CAP.
Baseline (%) | Preguideline Trend | Level Change at Guideline | Change in Trend After Guideline | Estimates at End of Study* | |||
|---|---|---|---|---|---|---|---|
Without Guideline (%) | With Guideline (%) | P | |||||
| |||||||
| ED‐only encounters | |||||||
| Blood culture | 14.6 | 0.1 | 0.8 | 0.1 | 5.5 | 8.6 | NS |
| CBC | 19.2 | 0.1 | 0.4 | 0.1 | 10.7 | 14.0 | NS |
| CRP | 5.4 | 0.0 | 0.6 | 0.1 | 2.9 | 4.8 | <0.05 |
| Chest x‐ray | 85.4 | 0.1 | 0.1 | 0.0 | 80.9 | 81.1 | NS |
| Inpatient encounters | |||||||
| Blood culture | 50.6 | 0.0 | 1.7 | 0.2 | 49.2 | 41.4 | <0.05 |
| Repeat blood culture | 6.5 | 0.0 | 1.0 | 0.1 | 8.9 | 5.8 | NS |
| CBC | 65.2 | 0.0 | 3.1 | 0.0 | 65.0 | 62.2 | NS |
| Repeat CBC | 23.4 | 0.0 | 4.2 | 0.0 | 20.8 | 16.0 | NS |
| CRP | 25.7 | 0.0 | 1.1 | 0.0 | 23.8 | 23.5 | NS |
| Repeat CRP | 12.5 | 0.1 | 2.2 | 0.1 | 7.1 | 7.3 | NS |
| Chest x‐ray | 89.4 | 0.1 | 0.7 | 0.0 | 85.4 | 83.9 | NS |
| Repeat chest x‐ray | 25.5 | 0.0 | 2.0 | 0.1 | 24.1 | 17.7 | <0.05 |
Inpatient Encounters
In the segmented regression analysis of children hospitalized with CAP, guideline publication was associated with changes in the monthly use of some diagnostic tests. For example, by the end of the study period, the use of blood culture was 41.4% (observed), whereas the projected estimated use in the absence of the guidelines was 49.2% (expected) (P < 0.05) (Figure 2). Table 2 includes the data for the other tests, CBC, CRP, and CXR, in which similar patterns are noted with lower utilization rates after the guidelines, compared with expected utilization rates without the guidelines; however, these trends did not achieve statistical significance. Evaluating the utilization of repeat testing for inpatients, only repeat CXR achieved statistical significance (P < 0.05), with utilization rates of 17.7% with the guidelines (actual) compared with 24.1% without the guidelines (predicted).
To better understand the use of repeat testing, a comparison of severity outcomesLOS, ICU transfer, and pleural drainage procedureswas performed between patients with no repeat testing (70%) and patients with 1 or more repeat tests (30%). Patients with repeat testing had longer LOS (no repeat testing LOS 1 [IQR, 12]) versus 1 repeat test LOS 3 ([IQR, 24] vs 2+ repeat tests LOS 5 [IQR, 38]), higher rate of ICU transfer (no repeat testing 4.6% vs 1 repeat test 14.6% vs 2+ repeat test 35.6%), and higher rate of pleural drainage (no repeat testing 0% vs 1 repeat test 0.1% vs 2+ repeat test 5.9%] (all P < 0.001).
Using standard costs of $37.57 for blood cultures and $73.28 for CXR, annual costs for children with CAP across all hospitals decreased by $91,512 due to decreased utilization of blood cultures, and by $146,840 due to decreased utilization of CXR.
Hospital‐Level Variation in the Impact of the National Guideline
Figure 3 is a visual representation (heat map) of the impact of the guidelines at the hospital level at the end of the study from the individual interrupted time series. Based on this heat map (Figure 3), there was wide variability between hospitals in the impact of the guideline on each test in different settings (ED or inpatient). By diagnostic testing, 7 hospitals significantly decreased utilization of blood cultures for inpatients, and 5 hospitals significantly decreased utilization for repeat blood cultures and repeat CXR. Correlation between the number of positive improvements at a hospital and region (P = 0.974), number of CAP cases (P = 0.731), or percentage of public insurance (P = 0.241) were all nonsignificant.
DISCUSSION
This study complements previous assessments by evaluating the impact of the 2011 IDSA/PIDS consensus guidelines on the management of children with CAP cared for at US children's hospitals. Prior studies have shown increased use of narrow‐spectrum antibiotics for children with CAP after the publication of these guidelines.[7] The current study focused on diagnostic testing for CAP before and after the publication of the 2011 guidelines. In the ED setting, use of some diagnostic tests (blood culture, CBC, CXR, CRP) was declining prior to guideline publication, but appeared to plateau and/or increase after 2011. Among children admitted with CAP, use of diagnostic testing was relatively stable prior to 2011, and use of these tests (blood culture, CBC, CXR, CRP) declined after guideline publication. Overall, changes in diagnostic resource utilization 3 years after publication were modest, with few changes achieving statistical significance. There was a large variability in the impact of guidelines on test use between hospitals.
For outpatients, including those managed in the ED, the PIDS/IDSA guidelines recommend limited laboratory testing in nontoxic, fully immunized patients. The guidelines discourage the use of diagnostic testing among outpatients because of their low yield (eg, blood culture), and because test results may not impact management (eg, CBC).[6] In the years prior to guideline publication, there was already a declining trend in testing rates, including blood cultures, CBC, and CRP, for patients in the ED. After guideline publication, the rate of blood cultures, CBC, and CRP increased, but only the increase in CRP utilization achieved statistical significance. We would not expect utilization for common diagnostic tests (eg, CBC for outpatients with CAP) to be at or close to 0% because of the complexity of clinical decision making regarding admission that factors in aspects of patient history, exam findings, and underlying risk.[15] ED utilization of blood cultures was <10%, CBC <15%, and CRP <5% after guideline publication, which may represent the lowest testing limit that could be achieved.
CXRs obtained in the ED did not decrease over the entire study period. The rates of CXR use (close to 80%) seen in our study are similar to prior ED studies.[5, 16] Management of children with CAP in the ED might be different than outpatient primary care management because (1) unlike primary care providers, ED providers do not have an established relationship with their patients and do not have the opportunity for follow‐up and serial exams, making them less likely to tolerate diagnostic uncertainty; and (2) ED providers may see sicker patients. However, use of CXR in the ED does represent an opportunity for further study to understand if decreased utilization is feasible without adversely impacting clinical outcomes.
The CAP guidelines provide a strong recommendation to obtain blood culture in moderate to severe pneumonia. Despite this, blood culture utilization declined after guideline publication. Less than 10% of children hospitalized with uncomplicated CAP have positive blood cultures, which calls into question the utility of blood cultures for all admitted patients.[17, 18, 19] The recent EPIC (Epidemiology of Pneumonia in the Community) study showed that a majority of children hospitalized with pneumonia do not have growth of bacteria in culture, but there may be a role for blood cultures in patients with a strong suspicion of complicated CAP or in the patient with moderate to severe disease.[20] In addition to blood cultures, the guidelines also recommend CBC and CXR in moderate to severely ill children. This observed decline in testing in CBC and CXR may be related to individual physician assessments of which patients are moderately to severely ill, as the guidelines do not recommend testing for children with less severe disease. Our exclusion of patients requiring intensive care management or pleural drainage on admission might have selected children with a milder course of illness, although still requiring admission.
The guidelines discourage repeat diagnostic testing among children hospitalized with CAP who are improving. In this study, repeat CXR and CBC occurred in approximately 20% of patients, but repeat blood culture and CRP was much lower. As with initial diagnostic testing for inpatients with CAP, the rates of some repeat testing decreased with the guidelines. However, those with repeat testing had longer LOS and were more likely to require ICU transfer or a pleural drainage procedure compared to children without repeat testing. This suggests that repeat testing is used more often in children with a severe presentation or a worsening clinical course, and not done routinely on hospitalized patients.
The financial impact of decreased testing is modest, because the tests themselves are relatively inexpensive. However, the lack of substantial cost savings should not preclude efforts to continue to improve adherence to the guidelines. Not only is increased testing associated with higher hospitalization rates,[5] potentially yielding higher costs and family stress, increased testing may also lead to patient discomfort and possibly increased radiation exposure through chest radiography.
Many of the diagnostic testing recommendations in the CAP guidelines are based on weak evidence, which may contribute to the lack of substantial adoption. Nevertheless, adherence to guideline recommendations requires sustained effort on the part of individual physicians that should be encouraged through institutional support.[21] Continuous education and clinical decision support, as well as reminders in the electronic medical record, would make guideline recommendations more visible and may help overcome the inertia of previous practice.[15] The hospital‐level heat map (Figure 3) included in this study demonstrates that the impact of the guidelines was variable across sites. Although a few sites had decreased diagnostic testing in many areas with no increased testing in any category, there were several sites that had no improvement in any diagnostic testing category. In addition, hospital‐level factors like size, geography, and insurance status were not associated with number of improvements. To better understand drivers of change at individual hospitals, future studies should evaluate specific strategies utilized by the rapid guideline adopters.
This study is subject to several limitations. The use of ICD‐9 codes to identify patients with CAP may not capture all patients with this diagnosis; however, these codes have been previously validated.[13] Additionally, because patients were identified using ICD‐9 coding assigned at the time of discharge, testing performed in the ED setting may not reflect care for a child with known pneumonia, but rather may reflect testing for a child with fever or other signs of infection. PHIS collects data from freestanding children's hospitals, which care for a majority of children with CAP in the US, but our findings may not be generalizable to other hospitals. In addition, we did not examine drivers of trends within individual institutions. We did not have detailed information to examine whether the PHIS hospitals in our study had actively worked to adopt the CAP guidelines. We were also unable to assess physician's familiarity with guidelines or the level of disagreement with the recommendations. Furthermore, the PHIS database does not permit detailed correlation of diagnostic testing with clinical parameters. In contrast to the diagnostic testing evaluated in this study, which is primarily discouraged by the IDSA/PIDS guidelines, respiratory viral testing for children with CAP is recommended but could not be evaluated, as data on such testing are not readily available in PHIS.
CONCLUSION
Publication of the IDSA/PIDS evidence‐based guidelines for the management of CAP was associated with modest, variable changes in use of diagnostic testing. Further adoption of the CAP guidelines should reduce variation in care and decrease unnecessary resource utilization in the management of CAP. Our study demonstrates that efforts to promote decreased resource utilization should target specific situations (eg, repeat testing for inpatients who are improving). Adherence to guidelines may be improved by the adoption of local practices that integrate and improve daily workflow, like order sets and clinical decision support tools.
Disclosure: Nothing to report.
- , . Eliminating waste in US health care. JAMA. 2012;307(14):1513–1516.
- , , , et al. Choosing wisely in pediatric hospital medicine: five opportunities for improved healthcare value. J Hosp Med. 2013;8(9):479–485.
- , , , et al.; Pediatric Research in Inpatient Settings (PRIS) Network. Prioritization of comparative effectiveness research topics in hospital pediatrics. Arch Pediatr Adolesc Med. 2012;166(12):1155–1164.
- , , , et al. Variability in processes of care and outcomes among children hospitalized with community‐acquired pneumonia. Pediatr Infect Dis J. 2012;31(10):1036–1041.
- , , , , . Variation in emergency department diagnostic testing and disposition outcomes in pneumonia. Pediatrics. 2013;132(2):237–244.
- , , , et al.; Pediatric Infectious Diseases Society and the Infectious Diseases Society of America. The management of community‐acquired pneumonia in infants and children older than 3 months of age: clinical practice guidelines by the Pediatric Infectious Diseases Society and the Infectious Diseases Society of America. Clin Infect Dis. 2011;53(7):e25–e76.
- , , , et al., Impact of Infectious Diseases Society of America/Pediatric Infectious Diseases Society guidelines on treatment of community‐acquired pneumonia in hospitalized children. Clin Infect Dis. 2014;58(6):834–838.
- , , , et al. Antibiotic choice for children hospitalized with pneumonia and adherence to national guidelines. Pediatrics. 2015;136(1):44–52.
- , , , et al. Quality improvement methods increase appropriate antibiotic prescribing for childhood pneumonia. Pediatrics. 2013;131(5):e1623–e1631.
- , , , et al. Improvement methodology increases guideline recommended blood cultures in children with pneumonia. Pediatrics. 2015;135(4):e1052–e1059.
- , , , , , . Impact of a guideline on management of children hospitalized with community‐acquired pneumonia. Pediatrics. 2012;129(3):e597–e604.
- , , , . Effectiveness of antimicrobial guidelines for community‐acquired pneumonia in children. Pediatrics. 2012;129(5):e1326–e1333.
- , , , et al. Identifying pediatric community‐acquired pneumonia hospitalizations: accuracy of administrative billing codes. JAMA Pediatr. 2013;167(9):851–858.
- , , , , . Pediatric complex chronic conditions classification system version 2: updated for ICD‐10 and complex medical technology dependence and transplantation. BMC Pediatr. 2014;14:199.
- , . Establishing superior benchmarks of care in clinical practice: a proposal to drive achievable health care value. JAMA Pediatr. 2015;169(4):301–302.
- , , , . Emergency department management of childhood pneumonia in the United States prior to publication of national guidelines. Acad Emerg Med. 2013;20(3):240–246.
- , , , et al. Prevalence of bacteremia in hospitalized pediatric patients with community‐acquired pneumonia. Pediatr Infect Dis J. 2013;32(7):736–740.
- , , , , . The prevalence of bacteremia in pediatric patients with community‐acquired pneumonia: guidelines to reduce the frequency of obtaining blood cultures. Hosp Pediatr. 2013;3(2):92–96.
- . Do all children hospitalized with community‐acquired pneumonia require blood cultures? Hosp Pediatr. 2013;3(2):177–179.
- , , , et al.; CDC EPIC Study Team. Community‐acquired pneumonia requiring hospitalization among U.S. children. N Engl J Med. 2015;372(9):835–845.
- , , , et al. Influence of hospital guidelines on management of children hospitalized with pneumonia. Pediatrics. 2012;130(5):e823–e830.
© 2015 Society of Hospital Medicine

Yield of Blood Cultures
Blood cultures are the gold standard test for the diagnosis of bloodstream infections (BSI). Given the high mortality associated with BSI,[1, 2, 3] physicians have a low threshold to obtain blood cultures.[4, 5] Unfortunately, physicians are poor at predicting which hospitalized patients have BSI,[6, 7] and published guidelines do not provide clear indications for the use of blood cultures.[8] As a result, current practice follows a culture if spikes paradigm, whereby inpatient providers often obtain blood cultures in the setting of any fever. This is the most common anticipatory guidance communicated between providers, involving up to 75% of written sign‐out instructions.[9] The result is a low rate of true positive blood cultures (5%10%)[10, 11, 12] with only a slightly lower rate of false positive blood cultures (contaminants).[12, 13, 14] False positive blood cultures often lead to repeat blood cultures, unnecessary antibiotic use, and increased hospital cost and length of stay.[13]
Over the last several years, there has been an increased emphasis on practicing high‐value care by avoiding unnecessary and duplicate testing. In 2012, the American Board of Internal Medicine introduced the Choosing Wisely campaign, with specific initiatives to reduce medical waste and overuse. Given the low yield of blood cultures, guidance on patients in whom blood cultures are most appropriate would be welcome. Studies assessing risk factors for bacteremia have led to the development of multiple stratification systems without overall consensus.[10, 15, 16, 17, 18, 19, 20] Furthermore, much of the current literature on blood culture utilization includes cultures drawn in the emergency department (ED) or intensive care unit setting (ICU).[10, 18, 19, 20] Less is known regarding the rates of positivity and utility for blood cultures drawn on patients hospitalized on an acute care medical ward.
Our study had 3 main objectives: (1) determine the rates of true positive and false positive blood cultures among hospitalized medical patients, (2) determine the ability of physician‐selected indications and patient characteristics to predict BSI, and (3) identify populations in which blood cultures may not be necessary.
PATIENTS AND METHODS
Study Design
We conducted a prospective cohort study of all hospitalized medical patients for whom blood cultures were ordered and received by the microbiology laboratory. This investigation was approved by the Veterans Affairs (VA) Boston Healthcare System internal review board.
Patients and Setting
During a 7‐month period (October 1, 2014April 15, 2015), all blood culture orders were reviewed for indication and result each day (and on Monday for weekend blood cultures) at a large VA teaching hospital (approximately 6200 admissions each year). As part of the electronic medical order, providers selected from among a list of common indications. Options included various clinical signs and diagnoses, and providers could select more than 1 indication. Each blood culture order triggered a phlebotomist to draw 2 separate blood culture sets (each set consisted of 1 aerobic and 1 anaerobic blood culture bottle).
Inclusion criteria included admission to 1 of 5 general medical service teams or 1 of 2 cardiology teams. Given that the study hospital does not have dedicated subspecialty service teams (with the exception of cardiology), all patients with medical diagnoses are cared for on the general medical service.
Predictor and Outcome Variables
Patient characteristics were obtained via chart review. Fever was defined as a single temperature greater than 100.4F within 24 hours prior to a blood culture order. Leukocytosis was defined as a white blood cell count greater than 10,000 within 24 hours of a blood culture order. Patients were considered to have received antibiotics if an order for an antibacterial or antifungal agent was active within 72 hours prior to the blood culture order. Each blood culture order was assigned a working diagnosis that prompted the order. These working diagnoses were identified by chart review as documented under the provider's assessment and plan and were not necessarily the primary diagnosis prompting hospitalization.
Classification of positive blood cultures into true and false positive was determined by consensus among the microbiology and the infectious disease departments after review of clinical and laboratory data, consistent with a previously established practice at the hospital. A true negative culture consisted of any culture that was not a true positive or a false positive. A blood culture order was defined as an electronic entry and included all sets of blood cultures drawn as a result of that order. Consistent with previous literature, a blood culture episode was defined as all blood cultures ordered within a 48‐hour period starting at the time of the first culture.[10] For patients with multiple admissions during the study period, each admission was considered a unique patient.
Statistical Analysis
Rates of true and false positivity of blood cultures were calculated. In addition, positive likelihood ratios (LR+) for true positive blood cultures were calculated using JMP statistical software (SAS Institute, Inc., Cary, NC).
RESULTS
Overall
A total of 576 blood culture orders (467 blood culture episodes) were completed on 363 hospitalized medical patients during the study period. Five hundred forty orders were placed on patients on general medical services and 36 orders on patients on the cardiology services. Four hundred eighty‐seven (85%) orders resulted in 2 sets of cultures being drawn, 87 (15%) resulted in 1 set of cultures, and 2 (0.3%) resulted in 3 sets of cultures. The median time between admission and culture draw was 2 days (range, 072 days), with 57% of cultures drawn during hospital day 0 to 2, 24.5% drawn between hospital day 3 to 7, and 19.4% drawn after hospital day 7. The average age of the patients was 70.4 years, and 94% were men. Additional patient characteristics are shown in Table 1.
| Clinical Characteristic | Total, n = 363 (%) | True Positive Blood Cultures, n = 14 (%) | P Value |
|---|---|---|---|
| |||
| Mean age, y | 70.4 | 73.9 | 0.4 |
| Male sex | 350 (96%) | 14 (100%) | 1 |
| White race | 308 (85%) | 11 (79%) | 0.7 |
| Location prior to admission | |||
| Community | 276 (76%) | 11 (79%) | 1 |
| Hospital | 51 (14%) | 1 (7%) | 0.7 |
| Long‐term care facility | 36 (10%) | 2 (14%) | 0.6 |
| Comorbidities | |||
| Diabetes | 136 (37%) | 5 (36%) | 1 |
| Malignancy | 100 (28%) | 4 (31%) | 1 |
| Alcohol abuse | 89 (25%) | 2 (14%) | 0.5 |
| Cirrhosis | 31 (9%) | 1 (7%) | 1 |
| End‐stage renal disease | 21 (6%) | 1 (7%) | 1 |
| Active drug use* | 16 (4%) | 1 (7%) | 0.5 |
| Catheter | 93 (26%) | 3 (21%) | 0.8 |
| Recent hospitalization | 145 (40%) | 6 (43%) | 1 |
| History of MRSA colonization | 72 (20%) | 5 (36%) | 0.16 |
| Cultures drawn in emergency department | 69 (19%) | 6 (43%) | 0.03 |
The true positive and false positive rates per blood culture order were 3.6% (21/576) and 2.3% (13/576), respectively (Table 2). Similar values were seen per blood cultures episode (3.4% and 2.7%, respectively). The true positive blood culture rates per order and episode were significantly lower than those drawn on emergency room patients during the study period (41/570, 7.2%, P < 0.05).
| Total, n (%) | True Positive, n (%) | False Positive, n (%) | True Negative, n (%) | |
|---|---|---|---|---|
| ||||
| Per patient | 363 | 14 (3.8) | 13 (3.6) | 336 (92.6) |
| Per blood culture episode | 467 | 16 (3.4) | 13 (2.7) | 438 (93.8) |
| Per blood culture order | 576 | 21 (3.6) | 13 (2.3) | 542 (94.1) |
| Rates per blood culture order | ||||
| Physician‐selected indication, n = 530 | ||||
| Fever | 136 (25.6) | 3 (2.2) | 3 (2.2) | 130 (95.6) |
| Fever and additional indication(s) | 118 (22.2) | 5 (4.2) | 3 (2.5) | 110 (93.2) |
| Fever and leukocytosis | 50 (9.4) | 4 (8.0) | 3 (6.0) | 43 (86.0) |
| Leukocytosis | 50 (9.4) | 2 (4.0) | 0 (0) | 48 (96.0) |
| Follow‐up previous positive | 60 (11.3) | 7 (11.7) | 0 (0) | 53 (88.3) |
| Working diagnosis, n = 576 | ||||
| Pneumonia | 101 (17.5) | 0 (0) | 4 (3.9) | 97 (96.0) |
| Bacteremia/endocarditis | 97 (16.8) | 12 (12.3) | 1 (1.0) | 84 (86.6) |
| Urinary tract infection* | 95 (16.4) | 5 (5.3) | 2 (2.1) | 88 (92.6) |
| Other infection | 46 (8.0) | 0 (0) | 0 (0) | 46 (100) |
| Skin and soft‐tissue infection | 39 (6.8) | 1 (2.6) | 0 (0) | 38 (97.4) |
| Neutropenic fever | 28 (4.9) | 0 (0) | 0 (0) | 28 (100) |
| Sepsis | 27 (4.7) | 0 (0) | 0 (0) | 27 (100) |
| Fever | 18 (3.1) | 1 (5.5) | 1 (5.5) | 16 (88.9) |
| Bone and join infection | 15 (2.6) | 1 (6.7) | 0 (0) | 14 (93.3) |
| Postoperative fever | 9 (1.6) | 0 (0) | 0 (0) | 9 (100) |
| Noninfectious diagnosis | 101 (17.5) | 1 (1.0) | 5 (5.0) | 95 (94.1) |
| Antibiotic exposure | ||||
| Yes | 354 (61.5) | 5 (1.4) | 5 (1.4) | 344 (97.1) |
| No | 222 (38.6) | 16 (7.2) | 8 (3.6) | 198 (89.1) |
| Previous documented positive culture via chart review | ||||
| Yes | 155 (26.9) | 9 (5.8) | 2 (1.3) | 144 (92.9) |
| No | 421 (73.1) | 12 (2.9) | 11 (2.6) | 398 (94.5) |
| LR+ (95% CI), True Positive Blood Culture | LR+ (95% CI), False Positive Blood Culture | |
|---|---|---|
| ||
| Physician‐selected indication | ||
| Fever | 0.6 (0.21.7) | 0.9 (0.32.5) |
| Fever and additional indication(s) | 1.1 (0.52.4) | 1.0 (0.42.8) |
| Fever and leukocytosis | 2.2 (0.95.6) | 2.5 (0.97.1) |
| Leukocytosis | 1.1 (0.34.0) | 0.4 (0.05.6) |
| Follow‐up previous positive | 3.4 (1.86.5) | 0.3 (0.04.7) |
| Diagnosis | ||
| Pneumonia | 0.1 (0.01.9) | 1.8 (0.84.1) |
| Bacteremia/endocarditis | 3.7 (2.55.7) | 0.5 (0.13.0) |
| Urinary tract infection | 1.5 (0.73.2) | 0.9 (0.33.4) |
| Noninfectious diagnosis | 0.3 (0.01.8) | 2.3 (1.14.6) |
| Recent antibiotic exposure | ||
| Yes | 0.4 (0.20.8) | 0.6 (0.31.2) |
| No | 2.1 (1.62.7) | 1.6 (1.02.5) |
| No with fever | 2.4 (1.24.9) | 0.8 (0.23.6) |
| No with fever and leukocytosis | 5.6 (1.818.2) | 0.4 (0.12.6) |
| Prior positive cultures | ||
| Yes | 1.6 (1.02.7) | 0.6 (0.22.0) |
For the true positive cultures, gram‐positive organisms were isolated most frequently (14/21, 67%) with Staphylococcus aureus identified in 2/21 (10%) positive cultures and Enterococcus faecalis identified in 7/21 (33%) positive cultures. Gram‐negative organisms were isolated in 6/21 (29%) cultures, and 1/21 (5%) culture grew 2 organisms (Enterococcus faecalis and Nocardia). The majority of false positive cultures isolated 1 or more species of coagulase‐negative Staphylococcus (11/13, 85%).
Predictors of True Bacteremia
The 4 most common working diagnoses prompting a blood culture order were pneumonia, bacteremia/endocarditis, urinary tract infection, and a noninfectious diagnosis (eg, syncope), with each prompting approximately 17% of the total orders (Table 2). Of these, only a primary diagnosis of bacteremia/endocarditis was predictive of a true positive culture, yielding a rate of 12.3% (LR+ 3.7, 95% confidence interval [CI]: 2.5‐5.7). No other diagnosis was predictive of true positivity. A diagnosis of pneumonia yielded no true positive and 4 false positive blood cultures (3.9%), whereas a noninfectious diagnosis yielded only 1 true positive (1.0%) and 5 false positives (5.0%). The positive likelihood ratios for these 2 diagnoses were 0.1 (95% CI: 0.00‐1.9) and 0.3 (95% CI: 0.04‐1.8), respectively.
Indications were selected for 530 of 576 (92%) blood culture orders (Table 2). The most common indication was fever alone (25.6%), followed by fever with an additional indication (22.2%), follow‐up positive blood cultures (11.3%), fever and leukocytosis (9.4%), and leukocytosis alone (9.4%). Only follow‐up positive blood cultures was predictive of a true positive, with a LR+ of 3.4 (95% CI: 1.8‐6.5).
A total of 14 patients (3.9%) had true positive blood cultures. For these patients, 10/14 (71%) had 1 true positive blood culture, 3/14 (21%) had 2 true positive blood cultures, and 1/14 (7%) had 5 true positive blood cultures. The average number of cultures drawn was 4.9. The clinical characteristic most predictive of a true positive blood culture was the absence of recent antibiotic administration. If the blood culture was ordered on a patient not receiving antibiotics (true positivity rate 7.2%, 16/222), the LR+ was 2.1 (95% CI: 1.6‐2.7). In a patient not receiving antibiotics who was also noted to have fever and leukocytosis (true positivity rate 17.6%, 3/17), the LR+ was 5.6 (95% CI: 1.8‐18.2). Conversely, patients receiving antibiotics were rarely found to have true positive blood cultures (true positivity rate 1.4%, 5/354) with a LR+ of 0.4 (95% CI: 0.2‐0.8).
DISCUSSION
In this prospective study, we determined the diagnostic yield of blood cultures ordered on hospitalized medical patients to be low, with just 3.6% of orders identifying a true BSI. This was coupled with a similar false positive rate of 2.3%. Our study found rates of true positive blood cultures much lower in hospitalized medical patients than in rates previously described when ED and ICU patients were included.[11, 16]
Although ordering blood cultures is a routine clinical behavior when there is concern for an infection, a clinician's ability to subjectively predict who has a BSI only improves the likelihood 2‐fold.[6] Despite the availability of multiple scoring systems to aid the clinicians,[10, 21, 22] our study found that over 50% of cultures were ordered in the setting of fever or leukocytosis, potentially demonstrating a triggered response to an event, rather than a decision based on probabilities. This common clinician instinct to culture if spikes is an ineffective practice if not coupled with additional clinical information. In fact, in 1 retrospective study, there was no association between fever spike and blood culture positivity.[23]
Our study suggests that objective and easily obtainable clinical characteristics may be effective in helping determine the probability of blood cultures revealing a BSI. Although more robust prediction models have value, they often require multiple inputs, limiting their utility to the bedside clinician. Stratifying patients by either antibiotic exposure or working diagnosis may provide the most benefit for the hospitalized medical patient. For those on antibiotics, the yield of true positive blood cultures is so low that they are unlikely to provide clinically useful information. In fact, although nearly two‐thirds of cultures were obtained after antibiotic exposure, only 1 (0.2%) of these patients had a culture that provided additional information regarding a BSI. Bacteremia had already been established for the other 4 patients. These results are similar to a prior study, which concluded that physicians should wait 72 hours from time of preantibiotic cultures before considering additional blood cultures given the lack of additional information provided.[24]
The working diagnosis also drives the probability of a positive blood culture. As has been shown with other studies, blood cultures are unlikely to diagnose a BSI for patients being treated for either cellulitis or pneumonia.[25, 26, 27] In our study, the working diagnosis prompting the most blood cultures was pneumonia, with the false positive rate exceeding the true positive rate, a finding consistent with previous literature. This situation may lead to the addition of unnecessary antibiotics while waiting for a positive culture to be confirmed as a false positive (eg, vancomycin for a preliminary culture showing gram‐positive cocci in clusters).
There are a number of limitations to our study. Physician‐chosen indication may not correlate with the actual clinical picture and/or may not represent the full set of variables involved in the clinical decision to order a blood culture. However, the subjective clinical indication and the objective clinical criteria found in the chart provided similar LRs. Our study did not evaluate the potential harm of not ordering a blood culture. We also did not assess the value of a true negative culture particularly in patients with endovascular infections where additional cultures are often required to document clearance of bacteremia. Lastly, our study applies to patients on a hospitalized medical service and was performed at a VA hospital with a specific population of elderly male patients, which may limit the generalizability of our results.
Despite these limitations, this study benefits from its prospective design, along with the fact that >90% of blood culture orders placed included a corresponding indication. This provides insight into physician clinical reasoning at the time the blood culture was ordered. In addition, our ability to calculate likelihood ratios provides bedside physicians with an easy and powerful way of modifying the probability of BSI prior to ordering blood cultures, aiding them in providing high‐value clinical care while potentially reducing testing overuse.
The acceptability of not obtaining blood cultures may vary by clinical experience and by specialty. Physicians must weigh the low true positive rate against the consequences of missing a BSI. Although not a substitute for clinical judgement, the LRs in this study can provide a framework to aid in clinical decision making. For example, assuming a pretest probability of 3.6% (the rate of true positive for our entire cohort), blood cultures may not be equally as compelling in 2 similar patients with fever. The first is not on antibiotics and also has a leukocytosis. The second is being treated for pneumonia and is already on antibiotics. For the first patient, using a LR+ of 5.6 (for the fever and leukocytosis in the absence of antibiotics) modifies the patient's probability of a true positive blood culture to 17.3%. Blood cultures should be ordered. In contrast, for the second patient, using a LR+ of 0.4 (for the presence of antibiotics) decreases the patient's probability of a true positive blood culture to 1.5%. Armed with these data, the bedside clinician can now decide whether this rate of true positivity warrants blood cultures. For some, this rate will be comfortably low. For others, this rate will not assuage them; only the negative culture will. Our data are not meant to make this decision, but may aid in making it a probability‐based decision.
Disclosures
Presented in part at the Infectious Diseases Society of America Annual Meeting in San Diego, California in 2015. This material is the result of work supported in part with resources and the use of facilities at the VA Boston HCS, West Roxbury, MA. Katherine Linsenmeyer, MD, had full access to all of the data in the study and takes responsibility for the integrity of the data and the accuracy of the data analysis. The authors report no conflicts of interest.
- , . Population‐based epidemiology and microbiology of community‐onset bloodstream infections. Clin Microbiol Rev. 2014;27(4):647–664.
- , , , et al. The clinical significance of positive blood cultures in the 1990s: a prospective comprehensive evaluation of the microbiology, epidemiology, and outcome of bacteremia and fungemia in adults. Clin Infect Dis. 1997;24(4):584–602.
- , , , . The clinical significance of positive blood cultures: a comprehensive analysis of 500 episodes of bacteremia and fungemia in adults. II. Clinical observations, with special reference to factors influencing prognosis. Rev Infect Dis. 1983;5(1):54–70.
- , , , et al. Duration of hypotension before initiation of effective antimicrobial therapy is the critical determinant of survival in human septic shock. Crit Care Med. 2006;34(6):1589–1596.
- , , , et al. Epidemiology of sepsis syndrome in 8 academic medical centers. JAMA. 1997;278(3):234–240.
- , , , . Predicting bacteremia in older patients. J Am Geriatr Soc. 1995;43(3):230–235.
- , , , , , . Febrile inpatients: house officers' use of blood cultures. J Gen Intern Med. 1987;2(5):293–297.
- , , , et al. Executive summary: a guide to utilization of the microbiology laboratory for diagnosis of infectious diseases: 2013 recommendations by the Infectious Diseases Society of America (IDSA) and the American Society for Microbiology (ASM)(a). Clin Infect Dis. 2013;57(4):485–488.
- , , , , . What are covering doctors told about their patients? Analysis of sign‐out among internal medicine house staff. Qual Saf Health Care. 2009;18(4):248–255.
- , , , . Predicting bacteremia in hospitalized patients. A prospectively validated model. Ann Intern Med. 1990;113(7):495–500.
- , . Blood cultures. Ann Intern Med. 1987;106(2):246–253.
- , , , et al. Reducing blood culture contamination by a simple informational intervention. J Clin Microbiol. 2010;48(12):4552–4558.
- , , . Contaminant blood cultures and resource utilization. The true consequences of false‐positive results. JAMA. 1991;265(3):365–369.
- . Blood culture contaminants. J Hosp Infect. 2014;87(1):1–10.
- , , , , , . The natural history of the systemic inflammatory response syndrome (SIRS). A prospective study. JAMA. 1995;273(2):117–123.
- , , , et al. Predicting bacteremia in patients with sepsis syndrome. Academic Medical Center Consortium Sepsis Project Working Group. J Infect Dis. 1997;176(6):1538–1551.
- , . The systemic inflammatory response syndrome as a predictor of bacteraemia and outcome from sepsis. QJM. 1996;89(7):515–522.
- , , , , . Who needs a blood culture? A prospectively derived and validated prediction rule. J Emerg Med. 2008;35(3):255–264.
- , , , , , . Factors associated with positive blood cultures in outpatients with suspected bacteremia. Eur J Clin Microbiol Infect Dis. 2011;30(12):1615–1619.
- , , , et al. Two rules for early prediction of bacteremia: testing in a university and a community hospital. J Gen Intern Med. 1996;11(2):98–103.
- , , , . Does this adult patient with suspected bacteremia require blood cultures? JAMA. 2012;308(5):502–511.
- , , , et al. Clinical prediction rules for bacteremia and in‐hospital death based on clinical data at the time of blood withdrawal for culture: an evaluation of their development and use. J Eval Clin Pract. 2006;12(6):692–703.
- , , , et al. Timing of specimen collection for blood cultures from febrile patients with bacteremia. J Clin Microbiol. 2008;46(4):1381–1385.
- , , , . Usefulness of blood culture for hospitalized patients who are receiving antibiotic therapy. Clin Infect Dis. 2001;32(11):1651–1655.
- , , , , . Clinical utility of blood cultures in adult patients with community‐acquired pneumonia without defined underlying risks. Chest. 1995;108(4):932–936.
- . Blood cultures in community‐acquired pneumonia: are we ready to quit? Chest. 2003;123(4):977–978.
- . Blood cultures for community‐acquired pneumonia: piecing together a mosaic for doing less. Am J Respir Crit Care Med. 2004;169(3):327–328.
Blood cultures are the gold standard test for the diagnosis of bloodstream infections (BSI). Given the high mortality associated with BSI,[1, 2, 3] physicians have a low threshold to obtain blood cultures.[4, 5] Unfortunately, physicians are poor at predicting which hospitalized patients have BSI,[6, 7] and published guidelines do not provide clear indications for the use of blood cultures.[8] As a result, current practice follows a culture if spikes paradigm, whereby inpatient providers often obtain blood cultures in the setting of any fever. This is the most common anticipatory guidance communicated between providers, involving up to 75% of written sign‐out instructions.[9] The result is a low rate of true positive blood cultures (5%10%)[10, 11, 12] with only a slightly lower rate of false positive blood cultures (contaminants).[12, 13, 14] False positive blood cultures often lead to repeat blood cultures, unnecessary antibiotic use, and increased hospital cost and length of stay.[13]
Over the last several years, there has been an increased emphasis on practicing high‐value care by avoiding unnecessary and duplicate testing. In 2012, the American Board of Internal Medicine introduced the Choosing Wisely campaign, with specific initiatives to reduce medical waste and overuse. Given the low yield of blood cultures, guidance on patients in whom blood cultures are most appropriate would be welcome. Studies assessing risk factors for bacteremia have led to the development of multiple stratification systems without overall consensus.[10, 15, 16, 17, 18, 19, 20] Furthermore, much of the current literature on blood culture utilization includes cultures drawn in the emergency department (ED) or intensive care unit setting (ICU).[10, 18, 19, 20] Less is known regarding the rates of positivity and utility for blood cultures drawn on patients hospitalized on an acute care medical ward.
Our study had 3 main objectives: (1) determine the rates of true positive and false positive blood cultures among hospitalized medical patients, (2) determine the ability of physician‐selected indications and patient characteristics to predict BSI, and (3) identify populations in which blood cultures may not be necessary.
PATIENTS AND METHODS
Study Design
We conducted a prospective cohort study of all hospitalized medical patients for whom blood cultures were ordered and received by the microbiology laboratory. This investigation was approved by the Veterans Affairs (VA) Boston Healthcare System internal review board.
Patients and Setting
During a 7‐month period (October 1, 2014April 15, 2015), all blood culture orders were reviewed for indication and result each day (and on Monday for weekend blood cultures) at a large VA teaching hospital (approximately 6200 admissions each year). As part of the electronic medical order, providers selected from among a list of common indications. Options included various clinical signs and diagnoses, and providers could select more than 1 indication. Each blood culture order triggered a phlebotomist to draw 2 separate blood culture sets (each set consisted of 1 aerobic and 1 anaerobic blood culture bottle).
Inclusion criteria included admission to 1 of 5 general medical service teams or 1 of 2 cardiology teams. Given that the study hospital does not have dedicated subspecialty service teams (with the exception of cardiology), all patients with medical diagnoses are cared for on the general medical service.
Predictor and Outcome Variables
Patient characteristics were obtained via chart review. Fever was defined as a single temperature greater than 100.4F within 24 hours prior to a blood culture order. Leukocytosis was defined as a white blood cell count greater than 10,000 within 24 hours of a blood culture order. Patients were considered to have received antibiotics if an order for an antibacterial or antifungal agent was active within 72 hours prior to the blood culture order. Each blood culture order was assigned a working diagnosis that prompted the order. These working diagnoses were identified by chart review as documented under the provider's assessment and plan and were not necessarily the primary diagnosis prompting hospitalization.
Classification of positive blood cultures into true and false positive was determined by consensus among the microbiology and the infectious disease departments after review of clinical and laboratory data, consistent with a previously established practice at the hospital. A true negative culture consisted of any culture that was not a true positive or a false positive. A blood culture order was defined as an electronic entry and included all sets of blood cultures drawn as a result of that order. Consistent with previous literature, a blood culture episode was defined as all blood cultures ordered within a 48‐hour period starting at the time of the first culture.[10] For patients with multiple admissions during the study period, each admission was considered a unique patient.
Statistical Analysis
Rates of true and false positivity of blood cultures were calculated. In addition, positive likelihood ratios (LR+) for true positive blood cultures were calculated using JMP statistical software (SAS Institute, Inc., Cary, NC).
RESULTS
Overall
A total of 576 blood culture orders (467 blood culture episodes) were completed on 363 hospitalized medical patients during the study period. Five hundred forty orders were placed on patients on general medical services and 36 orders on patients on the cardiology services. Four hundred eighty‐seven (85%) orders resulted in 2 sets of cultures being drawn, 87 (15%) resulted in 1 set of cultures, and 2 (0.3%) resulted in 3 sets of cultures. The median time between admission and culture draw was 2 days (range, 072 days), with 57% of cultures drawn during hospital day 0 to 2, 24.5% drawn between hospital day 3 to 7, and 19.4% drawn after hospital day 7. The average age of the patients was 70.4 years, and 94% were men. Additional patient characteristics are shown in Table 1.
| Clinical Characteristic | Total, n = 363 (%) | True Positive Blood Cultures, n = 14 (%) | P Value |
|---|---|---|---|
| |||
| Mean age, y | 70.4 | 73.9 | 0.4 |
| Male sex | 350 (96%) | 14 (100%) | 1 |
| White race | 308 (85%) | 11 (79%) | 0.7 |
| Location prior to admission | |||
| Community | 276 (76%) | 11 (79%) | 1 |
| Hospital | 51 (14%) | 1 (7%) | 0.7 |
| Long‐term care facility | 36 (10%) | 2 (14%) | 0.6 |
| Comorbidities | |||
| Diabetes | 136 (37%) | 5 (36%) | 1 |
| Malignancy | 100 (28%) | 4 (31%) | 1 |
| Alcohol abuse | 89 (25%) | 2 (14%) | 0.5 |
| Cirrhosis | 31 (9%) | 1 (7%) | 1 |
| End‐stage renal disease | 21 (6%) | 1 (7%) | 1 |
| Active drug use* | 16 (4%) | 1 (7%) | 0.5 |
| Catheter | 93 (26%) | 3 (21%) | 0.8 |
| Recent hospitalization | 145 (40%) | 6 (43%) | 1 |
| History of MRSA colonization | 72 (20%) | 5 (36%) | 0.16 |
| Cultures drawn in emergency department | 69 (19%) | 6 (43%) | 0.03 |
The true positive and false positive rates per blood culture order were 3.6% (21/576) and 2.3% (13/576), respectively (Table 2). Similar values were seen per blood cultures episode (3.4% and 2.7%, respectively). The true positive blood culture rates per order and episode were significantly lower than those drawn on emergency room patients during the study period (41/570, 7.2%, P < 0.05).
| Total, n (%) | True Positive, n (%) | False Positive, n (%) | True Negative, n (%) | |
|---|---|---|---|---|
| ||||
| Per patient | 363 | 14 (3.8) | 13 (3.6) | 336 (92.6) |
| Per blood culture episode | 467 | 16 (3.4) | 13 (2.7) | 438 (93.8) |
| Per blood culture order | 576 | 21 (3.6) | 13 (2.3) | 542 (94.1) |
| Rates per blood culture order | ||||
| Physician‐selected indication, n = 530 | ||||
| Fever | 136 (25.6) | 3 (2.2) | 3 (2.2) | 130 (95.6) |
| Fever and additional indication(s) | 118 (22.2) | 5 (4.2) | 3 (2.5) | 110 (93.2) |
| Fever and leukocytosis | 50 (9.4) | 4 (8.0) | 3 (6.0) | 43 (86.0) |
| Leukocytosis | 50 (9.4) | 2 (4.0) | 0 (0) | 48 (96.0) |
| Follow‐up previous positive | 60 (11.3) | 7 (11.7) | 0 (0) | 53 (88.3) |
| Working diagnosis, n = 576 | ||||
| Pneumonia | 101 (17.5) | 0 (0) | 4 (3.9) | 97 (96.0) |
| Bacteremia/endocarditis | 97 (16.8) | 12 (12.3) | 1 (1.0) | 84 (86.6) |
| Urinary tract infection* | 95 (16.4) | 5 (5.3) | 2 (2.1) | 88 (92.6) |
| Other infection | 46 (8.0) | 0 (0) | 0 (0) | 46 (100) |
| Skin and soft‐tissue infection | 39 (6.8) | 1 (2.6) | 0 (0) | 38 (97.4) |
| Neutropenic fever | 28 (4.9) | 0 (0) | 0 (0) | 28 (100) |
| Sepsis | 27 (4.7) | 0 (0) | 0 (0) | 27 (100) |
| Fever | 18 (3.1) | 1 (5.5) | 1 (5.5) | 16 (88.9) |
| Bone and join infection | 15 (2.6) | 1 (6.7) | 0 (0) | 14 (93.3) |
| Postoperative fever | 9 (1.6) | 0 (0) | 0 (0) | 9 (100) |
| Noninfectious diagnosis | 101 (17.5) | 1 (1.0) | 5 (5.0) | 95 (94.1) |
| Antibiotic exposure | ||||
| Yes | 354 (61.5) | 5 (1.4) | 5 (1.4) | 344 (97.1) |
| No | 222 (38.6) | 16 (7.2) | 8 (3.6) | 198 (89.1) |
| Previous documented positive culture via chart review | ||||
| Yes | 155 (26.9) | 9 (5.8) | 2 (1.3) | 144 (92.9) |
| No | 421 (73.1) | 12 (2.9) | 11 (2.6) | 398 (94.5) |
| LR+ (95% CI), True Positive Blood Culture | LR+ (95% CI), False Positive Blood Culture | |
|---|---|---|
| ||
| Physician‐selected indication | ||
| Fever | 0.6 (0.21.7) | 0.9 (0.32.5) |
| Fever and additional indication(s) | 1.1 (0.52.4) | 1.0 (0.42.8) |
| Fever and leukocytosis | 2.2 (0.95.6) | 2.5 (0.97.1) |
| Leukocytosis | 1.1 (0.34.0) | 0.4 (0.05.6) |
| Follow‐up previous positive | 3.4 (1.86.5) | 0.3 (0.04.7) |
| Diagnosis | ||
| Pneumonia | 0.1 (0.01.9) | 1.8 (0.84.1) |
| Bacteremia/endocarditis | 3.7 (2.55.7) | 0.5 (0.13.0) |
| Urinary tract infection | 1.5 (0.73.2) | 0.9 (0.33.4) |
| Noninfectious diagnosis | 0.3 (0.01.8) | 2.3 (1.14.6) |
| Recent antibiotic exposure | ||
| Yes | 0.4 (0.20.8) | 0.6 (0.31.2) |
| No | 2.1 (1.62.7) | 1.6 (1.02.5) |
| No with fever | 2.4 (1.24.9) | 0.8 (0.23.6) |
| No with fever and leukocytosis | 5.6 (1.818.2) | 0.4 (0.12.6) |
| Prior positive cultures | ||
| Yes | 1.6 (1.02.7) | 0.6 (0.22.0) |
For the true positive cultures, gram‐positive organisms were isolated most frequently (14/21, 67%) with Staphylococcus aureus identified in 2/21 (10%) positive cultures and Enterococcus faecalis identified in 7/21 (33%) positive cultures. Gram‐negative organisms were isolated in 6/21 (29%) cultures, and 1/21 (5%) culture grew 2 organisms (Enterococcus faecalis and Nocardia). The majority of false positive cultures isolated 1 or more species of coagulase‐negative Staphylococcus (11/13, 85%).
Predictors of True Bacteremia
The 4 most common working diagnoses prompting a blood culture order were pneumonia, bacteremia/endocarditis, urinary tract infection, and a noninfectious diagnosis (eg, syncope), with each prompting approximately 17% of the total orders (Table 2). Of these, only a primary diagnosis of bacteremia/endocarditis was predictive of a true positive culture, yielding a rate of 12.3% (LR+ 3.7, 95% confidence interval [CI]: 2.5‐5.7). No other diagnosis was predictive of true positivity. A diagnosis of pneumonia yielded no true positive and 4 false positive blood cultures (3.9%), whereas a noninfectious diagnosis yielded only 1 true positive (1.0%) and 5 false positives (5.0%). The positive likelihood ratios for these 2 diagnoses were 0.1 (95% CI: 0.00‐1.9) and 0.3 (95% CI: 0.04‐1.8), respectively.
Indications were selected for 530 of 576 (92%) blood culture orders (Table 2). The most common indication was fever alone (25.6%), followed by fever with an additional indication (22.2%), follow‐up positive blood cultures (11.3%), fever and leukocytosis (9.4%), and leukocytosis alone (9.4%). Only follow‐up positive blood cultures was predictive of a true positive, with a LR+ of 3.4 (95% CI: 1.8‐6.5).
A total of 14 patients (3.9%) had true positive blood cultures. For these patients, 10/14 (71%) had 1 true positive blood culture, 3/14 (21%) had 2 true positive blood cultures, and 1/14 (7%) had 5 true positive blood cultures. The average number of cultures drawn was 4.9. The clinical characteristic most predictive of a true positive blood culture was the absence of recent antibiotic administration. If the blood culture was ordered on a patient not receiving antibiotics (true positivity rate 7.2%, 16/222), the LR+ was 2.1 (95% CI: 1.6‐2.7). In a patient not receiving antibiotics who was also noted to have fever and leukocytosis (true positivity rate 17.6%, 3/17), the LR+ was 5.6 (95% CI: 1.8‐18.2). Conversely, patients receiving antibiotics were rarely found to have true positive blood cultures (true positivity rate 1.4%, 5/354) with a LR+ of 0.4 (95% CI: 0.2‐0.8).
DISCUSSION
In this prospective study, we determined the diagnostic yield of blood cultures ordered on hospitalized medical patients to be low, with just 3.6% of orders identifying a true BSI. This was coupled with a similar false positive rate of 2.3%. Our study found rates of true positive blood cultures much lower in hospitalized medical patients than in rates previously described when ED and ICU patients were included.[11, 16]
Although ordering blood cultures is a routine clinical behavior when there is concern for an infection, a clinician's ability to subjectively predict who has a BSI only improves the likelihood 2‐fold.[6] Despite the availability of multiple scoring systems to aid the clinicians,[10, 21, 22] our study found that over 50% of cultures were ordered in the setting of fever or leukocytosis, potentially demonstrating a triggered response to an event, rather than a decision based on probabilities. This common clinician instinct to culture if spikes is an ineffective practice if not coupled with additional clinical information. In fact, in 1 retrospective study, there was no association between fever spike and blood culture positivity.[23]
Our study suggests that objective and easily obtainable clinical characteristics may be effective in helping determine the probability of blood cultures revealing a BSI. Although more robust prediction models have value, they often require multiple inputs, limiting their utility to the bedside clinician. Stratifying patients by either antibiotic exposure or working diagnosis may provide the most benefit for the hospitalized medical patient. For those on antibiotics, the yield of true positive blood cultures is so low that they are unlikely to provide clinically useful information. In fact, although nearly two‐thirds of cultures were obtained after antibiotic exposure, only 1 (0.2%) of these patients had a culture that provided additional information regarding a BSI. Bacteremia had already been established for the other 4 patients. These results are similar to a prior study, which concluded that physicians should wait 72 hours from time of preantibiotic cultures before considering additional blood cultures given the lack of additional information provided.[24]
The working diagnosis also drives the probability of a positive blood culture. As has been shown with other studies, blood cultures are unlikely to diagnose a BSI for patients being treated for either cellulitis or pneumonia.[25, 26, 27] In our study, the working diagnosis prompting the most blood cultures was pneumonia, with the false positive rate exceeding the true positive rate, a finding consistent with previous literature. This situation may lead to the addition of unnecessary antibiotics while waiting for a positive culture to be confirmed as a false positive (eg, vancomycin for a preliminary culture showing gram‐positive cocci in clusters).
There are a number of limitations to our study. Physician‐chosen indication may not correlate with the actual clinical picture and/or may not represent the full set of variables involved in the clinical decision to order a blood culture. However, the subjective clinical indication and the objective clinical criteria found in the chart provided similar LRs. Our study did not evaluate the potential harm of not ordering a blood culture. We also did not assess the value of a true negative culture particularly in patients with endovascular infections where additional cultures are often required to document clearance of bacteremia. Lastly, our study applies to patients on a hospitalized medical service and was performed at a VA hospital with a specific population of elderly male patients, which may limit the generalizability of our results.
Despite these limitations, this study benefits from its prospective design, along with the fact that >90% of blood culture orders placed included a corresponding indication. This provides insight into physician clinical reasoning at the time the blood culture was ordered. In addition, our ability to calculate likelihood ratios provides bedside physicians with an easy and powerful way of modifying the probability of BSI prior to ordering blood cultures, aiding them in providing high‐value clinical care while potentially reducing testing overuse.
The acceptability of not obtaining blood cultures may vary by clinical experience and by specialty. Physicians must weigh the low true positive rate against the consequences of missing a BSI. Although not a substitute for clinical judgement, the LRs in this study can provide a framework to aid in clinical decision making. For example, assuming a pretest probability of 3.6% (the rate of true positive for our entire cohort), blood cultures may not be equally as compelling in 2 similar patients with fever. The first is not on antibiotics and also has a leukocytosis. The second is being treated for pneumonia and is already on antibiotics. For the first patient, using a LR+ of 5.6 (for the fever and leukocytosis in the absence of antibiotics) modifies the patient's probability of a true positive blood culture to 17.3%. Blood cultures should be ordered. In contrast, for the second patient, using a LR+ of 0.4 (for the presence of antibiotics) decreases the patient's probability of a true positive blood culture to 1.5%. Armed with these data, the bedside clinician can now decide whether this rate of true positivity warrants blood cultures. For some, this rate will be comfortably low. For others, this rate will not assuage them; only the negative culture will. Our data are not meant to make this decision, but may aid in making it a probability‐based decision.
Disclosures
Presented in part at the Infectious Diseases Society of America Annual Meeting in San Diego, California in 2015. This material is the result of work supported in part with resources and the use of facilities at the VA Boston HCS, West Roxbury, MA. Katherine Linsenmeyer, MD, had full access to all of the data in the study and takes responsibility for the integrity of the data and the accuracy of the data analysis. The authors report no conflicts of interest.
- , . Population‐based epidemiology and microbiology of community‐onset bloodstream infections. Clin Microbiol Rev. 2014;27(4):647–664.
- , , , et al. The clinical significance of positive blood cultures in the 1990s: a prospective comprehensive evaluation of the microbiology, epidemiology, and outcome of bacteremia and fungemia in adults. Clin Infect Dis. 1997;24(4):584–602.
- , , , . The clinical significance of positive blood cultures: a comprehensive analysis of 500 episodes of bacteremia and fungemia in adults. II. Clinical observations, with special reference to factors influencing prognosis. Rev Infect Dis. 1983;5(1):54–70.
- , , , et al. Duration of hypotension before initiation of effective antimicrobial therapy is the critical determinant of survival in human septic shock. Crit Care Med. 2006;34(6):1589–1596.
- , , , et al. Epidemiology of sepsis syndrome in 8 academic medical centers. JAMA. 1997;278(3):234–240.
- , , , . Predicting bacteremia in older patients. J Am Geriatr Soc. 1995;43(3):230–235.
- , , , , , . Febrile inpatients: house officers' use of blood cultures. J Gen Intern Med. 1987;2(5):293–297.
- , , , et al. Executive summary: a guide to utilization of the microbiology laboratory for diagnosis of infectious diseases: 2013 recommendations by the Infectious Diseases Society of America (IDSA) and the American Society for Microbiology (ASM)(a). Clin Infect Dis. 2013;57(4):485–488.
- , , , , . What are covering doctors told about their patients? Analysis of sign‐out among internal medicine house staff. Qual Saf Health Care. 2009;18(4):248–255.
- , , , . Predicting bacteremia in hospitalized patients. A prospectively validated model. Ann Intern Med. 1990;113(7):495–500.
- , . Blood cultures. Ann Intern Med. 1987;106(2):246–253.
- , , , et al. Reducing blood culture contamination by a simple informational intervention. J Clin Microbiol. 2010;48(12):4552–4558.
- , , . Contaminant blood cultures and resource utilization. The true consequences of false‐positive results. JAMA. 1991;265(3):365–369.
- . Blood culture contaminants. J Hosp Infect. 2014;87(1):1–10.
- , , , , , . The natural history of the systemic inflammatory response syndrome (SIRS). A prospective study. JAMA. 1995;273(2):117–123.
- , , , et al. Predicting bacteremia in patients with sepsis syndrome. Academic Medical Center Consortium Sepsis Project Working Group. J Infect Dis. 1997;176(6):1538–1551.
- , . The systemic inflammatory response syndrome as a predictor of bacteraemia and outcome from sepsis. QJM. 1996;89(7):515–522.
- , , , , . Who needs a blood culture? A prospectively derived and validated prediction rule. J Emerg Med. 2008;35(3):255–264.
- , , , , , . Factors associated with positive blood cultures in outpatients with suspected bacteremia. Eur J Clin Microbiol Infect Dis. 2011;30(12):1615–1619.
- , , , et al. Two rules for early prediction of bacteremia: testing in a university and a community hospital. J Gen Intern Med. 1996;11(2):98–103.
- , , , . Does this adult patient with suspected bacteremia require blood cultures? JAMA. 2012;308(5):502–511.
- , , , et al. Clinical prediction rules for bacteremia and in‐hospital death based on clinical data at the time of blood withdrawal for culture: an evaluation of their development and use. J Eval Clin Pract. 2006;12(6):692–703.
- , , , et al. Timing of specimen collection for blood cultures from febrile patients with bacteremia. J Clin Microbiol. 2008;46(4):1381–1385.
- , , , . Usefulness of blood culture for hospitalized patients who are receiving antibiotic therapy. Clin Infect Dis. 2001;32(11):1651–1655.
- , , , , . Clinical utility of blood cultures in adult patients with community‐acquired pneumonia without defined underlying risks. Chest. 1995;108(4):932–936.
- . Blood cultures in community‐acquired pneumonia: are we ready to quit? Chest. 2003;123(4):977–978.
- . Blood cultures for community‐acquired pneumonia: piecing together a mosaic for doing less. Am J Respir Crit Care Med. 2004;169(3):327–328.
© 2016 Society of Hospital Medicine
Access to Inpatient Dermatology Care in Pennsylvania Hospitals
Access to care is a known issue in dermatology, and many patients may experience long waiting periods to see a physician.1 Previous research has evaluated access to outpatient dermatology services, but access to dermatology in inpatient medicine is also a growing problem.2 Reports depict a decrease in dermatologist involvement in inpatient care and an increase in nondermatologist physicians caring for inpatients with dermatologic needs.2,3 This lack of access could potentially lead to missed and/or incorrect diagnoses. One study showed that most cases in which dermatology was consulted required a change in treatment once correctly diagnosed by a dermatologist.4
Despite the known trend of decreasing involvement of dermatologists in inpatient care, there remains a paucity of data quantifying the current gap in access to care for inpatients with dermatologic needs. The purpose of this study was to evaluate differential access to inpatient dermatology services across licensed hospitals within the state of Pennsylvania.
Methods
In July 2014, an invitation to participate in an anonymous online survey was mailed to all 274 hospitals throughout Pennsylvania that were currently licensed by the US Department of Health. This study was declared exempt from review by the University of Pennsylvania (Philadelphia, Pennsylvania) institutional review board. Study data were collected and managed using electronic data capture tools hosted by the University of Pennsylvania. Hospital administrators were encouraged to report dermatology access and details regardless of current status of inpatient dermatology services in order to inform efforts to improve access to care. Invitation letters to participate in the online survey were addressed to “Administrator” according to the contact method used by the US Department of Health for accreditation of state hospitals. Addresses for accredited state hospitals were obtained from the US Department of Health Web site and were supplemented with additional addresses of Veterans Administration hospitals obtained from public listings. Three weeks after initial survey invitations were sent, reminder letters were sent to nonresponsive hospitals. Only data from hospitals currently offering inpatient services were included in the analysis; exclusion criteria included psychiatric hospitals, substance abuse treatment centers, physical rehabilitation facilities, and outpatient centers.
Results
Of the 204 (74%) hospitals that met the inclusion criteria, 32 responded (16% response rate). Of the 32 hospitals that responded, 31 (97%) were privately owned facilities, 3 of which were specialty surgical centers. One (3%) hospital was a Veterans Administration hospital. Of the responders, 16 (50%) reported having any form of access to inpatient dermatology consultations. Of the 16 with reported access, 9 (56%) received their consultations through a local or private dermatology group, while 4 (25%) had a dermatologist on staff. The remaining 3 hospitals (19%) provided dermatology consultations through nondermatologist physicians on staff (a surgeon, an emergency care physician, and an internist, respectively).
The survey also sought to gain information about the various degrees of access to inpatient dermatology care that hospitals provide. Of the 16 hospitals that reported access to inpatient dermatology services, 11 (69%) provided specific details related to access (eg, coverage, anticipated response times) of dermatology consultations (Figure). The type of access to inpatient dermatology in relation to the type of hospital ownership is shown in the Table.
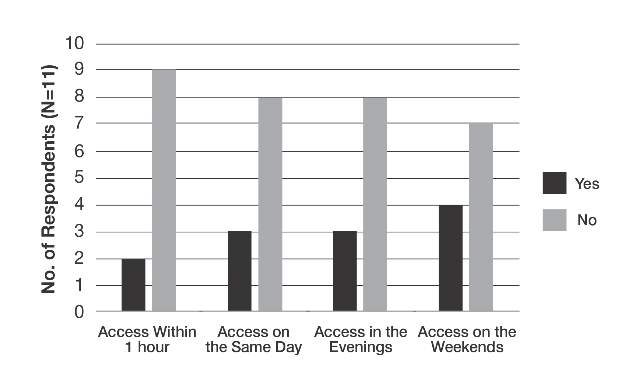
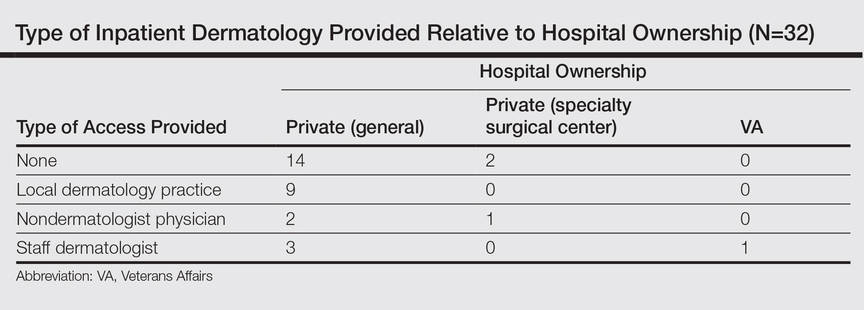
Comment
The survey results indicated suboptimal access to inpatient dermatology services in Pennsylvania hospitals. Only 50% (16/32) of respondents reported providing access to dermatology consultation, the majority of which appeared to have extremely limited same-day, evening, and weekend coverage. Although our study was limited by a low response rate (16%) and represents a narrow geographic distribution, these results suggested that lack of access to inpatient dermatology consultation may be a widespread problem and may be independent of the type of hospital ownership. Furthermore, the results of this study may offer insight into the different types and availability of inpatient dermatology services offered in hospitals across the United States.
The decrease in inpatient dermatology access has been driven by many factors. First, advances in medical research and pharmacotherapy may have decreased the need for dermatologic inpatient care, as patients who formerly would have required inpatient treatments are now able to receive therapies in an outpatient setting (eg, treatment of psoriasis).5 This may create less demand for hospitals to have a dermatologist on staff. Additionally, hospitals may be less able to incentivize dermatologists to provide inpatient dermatology consultations due to low reimbursement rates, time and distance required to visit inpatient facilities (taking away from outpatient clinic time), and the perception that inpatient cases carry greater liability given their greater complexity.6-8 Together, these factors may have contributed to the current lack of inpatient dermatology services in Pennsylvania hospitals and likely in hospitals throughout the United States.
Conclusion
Although a relatively small number of academic hospitals are experiencing an emergence of dermatology hospitalists, poor access to inpatient dermatology care continues to be a problem.8 Innovation (eg, the use of teledermatology to improve access to care9) and further studies are needed to address this gap in access to inpatient dermatology care.
- Kimball AB, Resneck JS. The US dermatology workforce: a specialty remains in shortage. J Am Acad Dermatol. 2008;59:741-745.
- Helms AE, Helms SE, Brodell RT. Hospital consultations: time to address an unmet need? J Am Acad Dermatol. 2009;60:308-311.
- Kirsner RS, Yang DG, Kerdel FA. The changing status of inpatient dermatology at American academic dermatology programs. J Am Acad Dermatol. 1999;40:755-757.
- Nahass GT, Meyer AJ, Campbell SF, et al. Prevalence of cutaneous findings in hospitalized medical patients. J Am Acad Dermatol. 1995;33:207-211.
- Steinke S, Peitsch WK, Ludwig A, et al. Cost-of-illness in psoriasis: comparing inpatient and outpatient therapy. PLoS One. 2013;8:e78152.
- Swerlick RA. Declining interest in medical dermatology. Arch Dermatol. 1998;134:1160-1162.
- Kirsner RS, Yang DG, Kerdel FA. Inpatient dermatology: the difficulties, the reality, and the future. Dermatol Clin. 2000;18:383-390.
- Fox LP, Cotliar J, Hughey L, et al. Hospitalist dermatology. J Am Acad Dermatol. 2009;61:153-154.
- Sharma P, Kovarik CL, Lipoff JB. Teledermatology as a means to improve access to inpatient dermatology care [published online ahead of print September 16, 2015]. J Telemed Telecare. PII: 1357633X15603298.
Access to care is a known issue in dermatology, and many patients may experience long waiting periods to see a physician.1 Previous research has evaluated access to outpatient dermatology services, but access to dermatology in inpatient medicine is also a growing problem.2 Reports depict a decrease in dermatologist involvement in inpatient care and an increase in nondermatologist physicians caring for inpatients with dermatologic needs.2,3 This lack of access could potentially lead to missed and/or incorrect diagnoses. One study showed that most cases in which dermatology was consulted required a change in treatment once correctly diagnosed by a dermatologist.4
Despite the known trend of decreasing involvement of dermatologists in inpatient care, there remains a paucity of data quantifying the current gap in access to care for inpatients with dermatologic needs. The purpose of this study was to evaluate differential access to inpatient dermatology services across licensed hospitals within the state of Pennsylvania.
Methods
In July 2014, an invitation to participate in an anonymous online survey was mailed to all 274 hospitals throughout Pennsylvania that were currently licensed by the US Department of Health. This study was declared exempt from review by the University of Pennsylvania (Philadelphia, Pennsylvania) institutional review board. Study data were collected and managed using electronic data capture tools hosted by the University of Pennsylvania. Hospital administrators were encouraged to report dermatology access and details regardless of current status of inpatient dermatology services in order to inform efforts to improve access to care. Invitation letters to participate in the online survey were addressed to “Administrator” according to the contact method used by the US Department of Health for accreditation of state hospitals. Addresses for accredited state hospitals were obtained from the US Department of Health Web site and were supplemented with additional addresses of Veterans Administration hospitals obtained from public listings. Three weeks after initial survey invitations were sent, reminder letters were sent to nonresponsive hospitals. Only data from hospitals currently offering inpatient services were included in the analysis; exclusion criteria included psychiatric hospitals, substance abuse treatment centers, physical rehabilitation facilities, and outpatient centers.
Results
Of the 204 (74%) hospitals that met the inclusion criteria, 32 responded (16% response rate). Of the 32 hospitals that responded, 31 (97%) were privately owned facilities, 3 of which were specialty surgical centers. One (3%) hospital was a Veterans Administration hospital. Of the responders, 16 (50%) reported having any form of access to inpatient dermatology consultations. Of the 16 with reported access, 9 (56%) received their consultations through a local or private dermatology group, while 4 (25%) had a dermatologist on staff. The remaining 3 hospitals (19%) provided dermatology consultations through nondermatologist physicians on staff (a surgeon, an emergency care physician, and an internist, respectively).
The survey also sought to gain information about the various degrees of access to inpatient dermatology care that hospitals provide. Of the 16 hospitals that reported access to inpatient dermatology services, 11 (69%) provided specific details related to access (eg, coverage, anticipated response times) of dermatology consultations (Figure). The type of access to inpatient dermatology in relation to the type of hospital ownership is shown in the Table.
Comment
The survey results indicated suboptimal access to inpatient dermatology services in Pennsylvania hospitals. Only 50% (16/32) of respondents reported providing access to dermatology consultation, the majority of which appeared to have extremely limited same-day, evening, and weekend coverage. Although our study was limited by a low response rate (16%) and represents a narrow geographic distribution, these results suggested that lack of access to inpatient dermatology consultation may be a widespread problem and may be independent of the type of hospital ownership. Furthermore, the results of this study may offer insight into the different types and availability of inpatient dermatology services offered in hospitals across the United States.
The decrease in inpatient dermatology access has been driven by many factors. First, advances in medical research and pharmacotherapy may have decreased the need for dermatologic inpatient care, as patients who formerly would have required inpatient treatments are now able to receive therapies in an outpatient setting (eg, treatment of psoriasis).5 This may create less demand for hospitals to have a dermatologist on staff. Additionally, hospitals may be less able to incentivize dermatologists to provide inpatient dermatology consultations due to low reimbursement rates, time and distance required to visit inpatient facilities (taking away from outpatient clinic time), and the perception that inpatient cases carry greater liability given their greater complexity.6-8 Together, these factors may have contributed to the current lack of inpatient dermatology services in Pennsylvania hospitals and likely in hospitals throughout the United States.
Conclusion
Although a relatively small number of academic hospitals are experiencing an emergence of dermatology hospitalists, poor access to inpatient dermatology care continues to be a problem.8 Innovation (eg, the use of teledermatology to improve access to care9) and further studies are needed to address this gap in access to inpatient dermatology care.
- Kimball AB, Resneck JS. The US dermatology workforce: a specialty remains in shortage. J Am Acad Dermatol. 2008;59:741-745.
- Helms AE, Helms SE, Brodell RT. Hospital consultations: time to address an unmet need? J Am Acad Dermatol. 2009;60:308-311.
- Kirsner RS, Yang DG, Kerdel FA. The changing status of inpatient dermatology at American academic dermatology programs. J Am Acad Dermatol. 1999;40:755-757.
- Nahass GT, Meyer AJ, Campbell SF, et al. Prevalence of cutaneous findings in hospitalized medical patients. J Am Acad Dermatol. 1995;33:207-211.
- Steinke S, Peitsch WK, Ludwig A, et al. Cost-of-illness in psoriasis: comparing inpatient and outpatient therapy. PLoS One. 2013;8:e78152.
- Swerlick RA. Declining interest in medical dermatology. Arch Dermatol. 1998;134:1160-1162.
- Kirsner RS, Yang DG, Kerdel FA. Inpatient dermatology: the difficulties, the reality, and the future. Dermatol Clin. 2000;18:383-390.
- Fox LP, Cotliar J, Hughey L, et al. Hospitalist dermatology. J Am Acad Dermatol. 2009;61:153-154.
- Sharma P, Kovarik CL, Lipoff JB. Teledermatology as a means to improve access to inpatient dermatology care [published online ahead of print September 16, 2015]. J Telemed Telecare. PII: 1357633X15603298.
Practice Points
- Changes in inpatient dermatology care over the past few decades have led to barriers in patient access to care.
- Many hospitals currently lack access to inpatient dermatology care, and those that do provide access often have no same-day, evening, or weekend coverage or may only provide access to dermatology care via nondermatologist physicians.
- Intervention by a dermatologist may be essential in making correct dermatologic diagnoses and treatment recommendations in inpatient settings.