User login
Discharge Medical Complexity, Change in Medical Complexity and Pediatric 30-day Readmission
Hospitalizations are disruptive, stressful, and costly for patients and families.1-5 Hospital readmissions subject families to the additional morbidity inherent to hospitalization and place patients at additional risk of hospital-acquired conditions or other harm.6-9 In pediatrics, hospital readmissions are common for specific conditions;10 with rates varying across institutions;10,11 and as many as one-third of unplanned pediatric readmissions are potentially preventable.12
Reducing pediatric readmissions requires a deeper understanding of the mechanisms through which readmissions occur. Medical complexity—specifically chronic conditions and use of medical technology—is associated with increased risk of readmission.13,14 Polypharmacy at discharge has also been associated with readmission.15,16 However, prior studies on polypharmacy and readmission risk examined the count of total medications and did not consider the nuances of scheduled versus as-needed medications, or the frequency of doses. These nuances may be critical to caregivers as discharge medical complexity can be overwhelming, even in diagnoses which are not traditionally considered complex.17 Finally, of potentially greater importance than medical complexity at discharge is a change in medical complexity during a hospitalization—for example, new diagnoses or new technologies that require additional education in hospital and management at home.
We sought to further understand the relationship between discharge medical complexity and readmission risk with regards to polypharmacy and home healthcare referrals at discharge. Specifically, we hypothesized that a change in medical complexity during an admission—ie, a new chronic diagnosis or new technology—would be a more prominent risk factor for readmission than discharge complexity alone. We examined these factors in the context of length of stay (LOS) since this is a marker of in-hospital severity of illness and a potentially modifiable function of time allowed for in-hospital teaching and discharge preparation.
METHODS
We conducted a retrospective, case-control study of pediatric hospitalizations at one tertiary care children’s hospital. Children <18 years were eligible for inclusion. Normal birth hospitalizations were excluded. We randomly selected one hospitalization from each child as the index visit. We identified cases, hospitalizations at C.S. Mott Children’s Hospital between 2008 and 2012 with a subsequent unplanned 30-day readmission,18 and matched them one to one with hospitalizations at the same hospital during the same period without subsequent readmission. We matched cases to controls based on the month of admission to account for seasonality of certain illnesses. We also matched on distance and direction from the hospital to the patient’s home to account for the potential to have readmissions to other institutions. We utilized both distance and direction recognizing that a family living 30 miles in one direction would be closer to an urban area with access to more facilities, as opposed to 30 miles in another direction in a rural area without additional access. We subsequently performed medical record review to abstract relevant covariates.
Primary Predictors
Medical Complexity Models (Models 1 and 2):
We evaluated three attributes of discharge medical complexity abstracted by medical record review—discharge medications, technology assistance (ie, tracheostomy, cerebral spinal fluid ventricular shunt, enteral feeding tube, central line), and the need for home healthcare after discharge. We counted discharge medications based on the number of medications listed on the discharge summary separated into scheduled or as needed.19 We also considered the number of scheduled doses to be administered in a 24-hour period (see Appendix methods for more information on counting discharge medications). For assistance by technology, we considered the presence of tracheostomy, cerebral spinal fluid ventricular shunt, enteral feeding tube, and central lines. While we describe these technologies separately, for multivariable analyses we considered the presence of any of the four types of technology.
Change in Medical Complexity Models (Models 3 and 4)
We examined two aspects of change in medical complexity—the presence of a new complex chronic condition (CCC)20 diagnosed during the hospitalization, and a new reliance on medical technology. The presence of new CCC was determined by comparing discharge diagnoses to past medical history abstracted by medical record review. A new CCC was defined as any complex chronic condition that was captured in the discharge diagnoses but was not evident in the past medical history. By definition, all CCCs coded during birth hospitalization (eg, at discharge from the neonatal intensive care unit) were assigned to “new” CCC. We calculated a kappa statistic to determine interrater reliability in determining the designation of new CCC. A sensitivity analysis examining these birth CCCs was also performed comparing no new CCC, new CCC, and new CCC after birth hospitalization. The methods appendix provides additional information on considering new CCCs. New technology, abstracted from chart review, was defined as technology placed during hospitalization that remained in place at discharge. If a child with existing technology had additional technology placed during the hospitalization (eg, a new tracheostomy in a child with a previously placed enteral feeding tube), the encounter was considered as having new technology placed.
Covariates
We created different sets of multivariable models to account for patient/hospitalization characteristics.
Statistical Analysis
A review of 600 cases and 600 controls yields 89% power to detect statistical significance for covariates with an odds ratio of 1.25 (β = 0.22) if the candidate covariate has low to moderate correlation with other covariates (<0.3). If a candidate covariate has a moderate correlation with other covariates (0.6), we have 89% power to detect an odds ratio of 1.35 (β = 0.30).21 We calculated odds of 30-days unplanned readmission using conditional logistic regression to account for matched case-control design. All the analyses were performed using STATA 13 (Stata Corp., College Station, Texas).
RESULTS
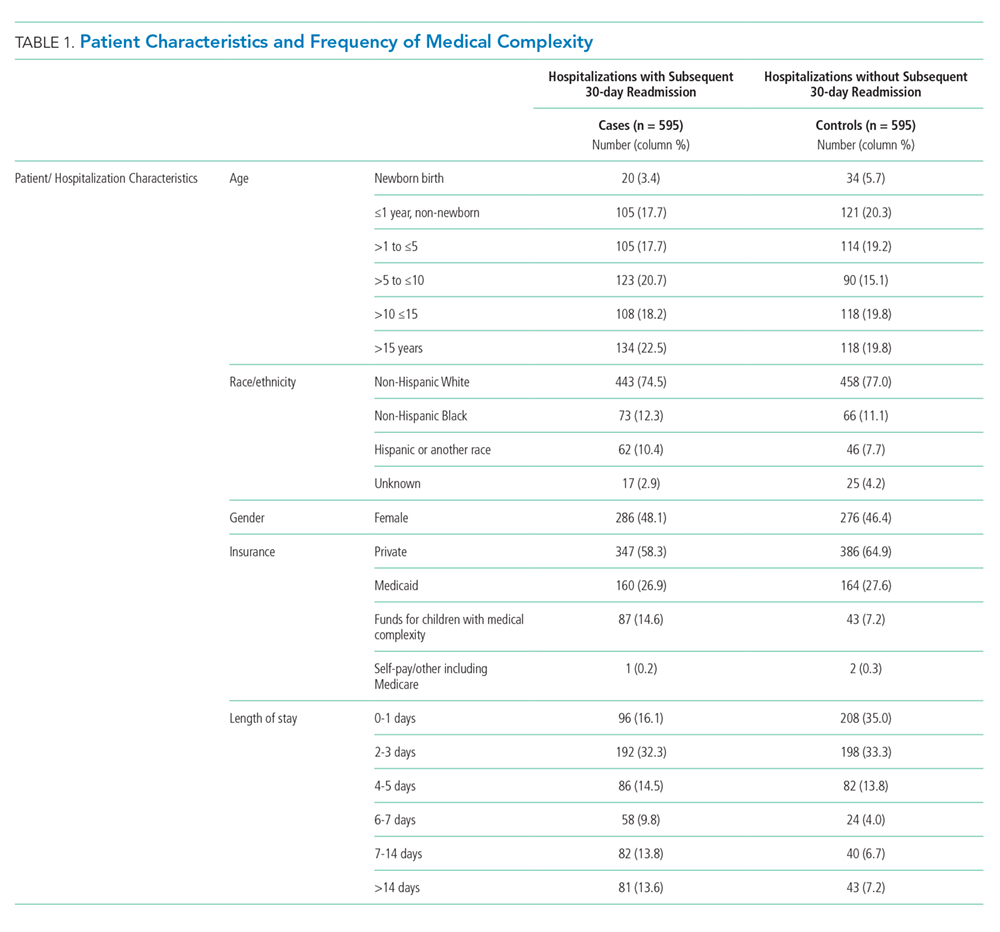
Of the 41,422 eligible index hospitalizations during the study period, 9.4% resulted in a 30-day unplanned readmission. After randomly selecting one hospitalization per child, there were 781 eligible cases. We subsequent matched all but one eligible case to a control. We randomly selected encounters for medical record review, reviewing a total of 1,212 encounters. After excluding pairs with incomplete records, we included 595 cases and 595 controls in this analysis (Figure). Patient/hospitalization characteristics are displayed in Table 1. The most frequent primary discharge diagnoses are displayed in Appendix Table 1.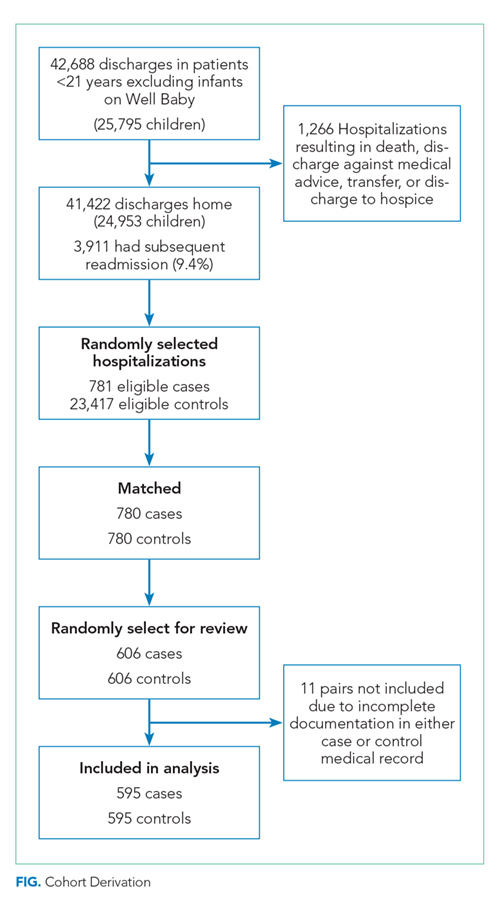
Models of Medical Complexity at Discharge
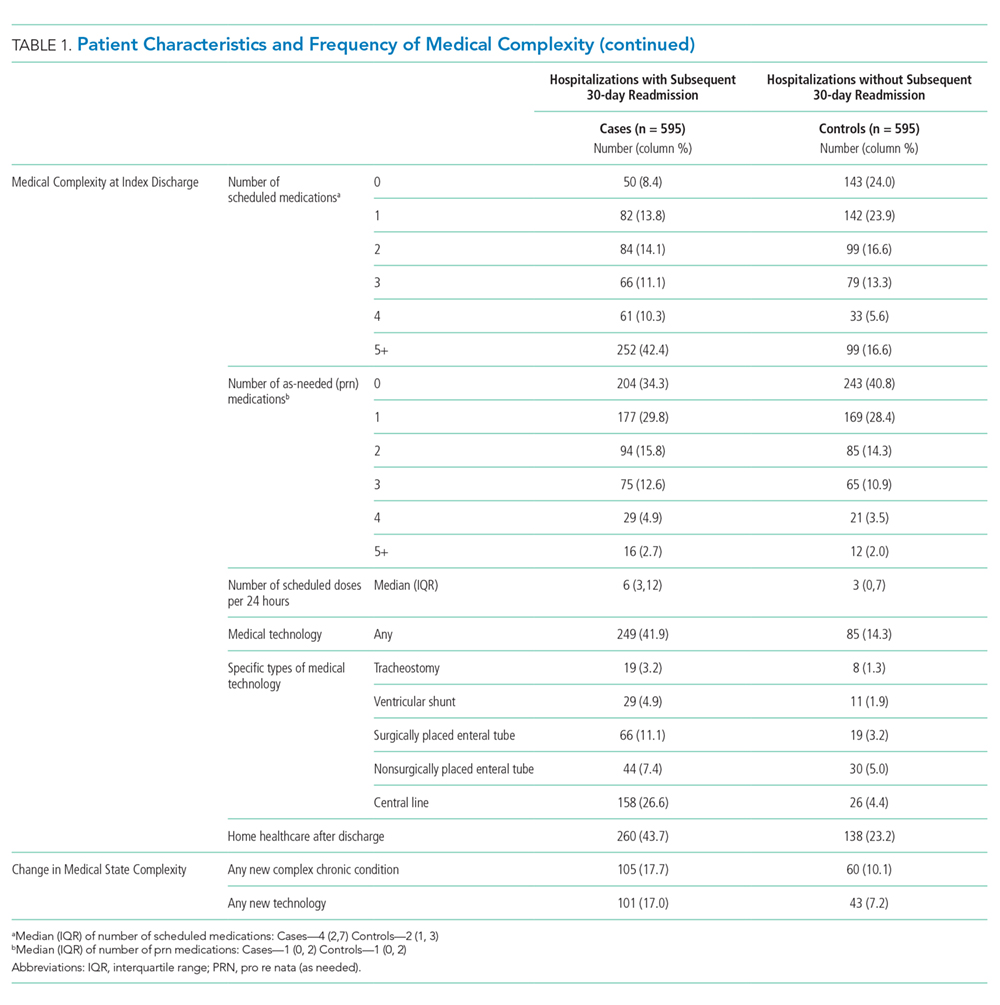
Polypharmacy after discharge was common for both readmitted and nonreadmitted patients. Children who experienced unplanned readmission in 30 days were discharged with a median of four different scheduled medications (interquartile range [IQR] 2,7) which translated into a median of six (IQR 3,12) scheduled doses in a 24-hour period. In comparison, children without an unplanned readmission had a median of two different scheduled medications (IQR 1,3) with a median of three (IQR 0,7) scheduled doses in a 24-hour period. Medical technology was more common in case children (42%) than in control children (14%). Central lines and enteral tubes were the most common forms of medical technology in both cases and controls. Home health referral was common in both cases (44%) and controls (23%; Table 1).
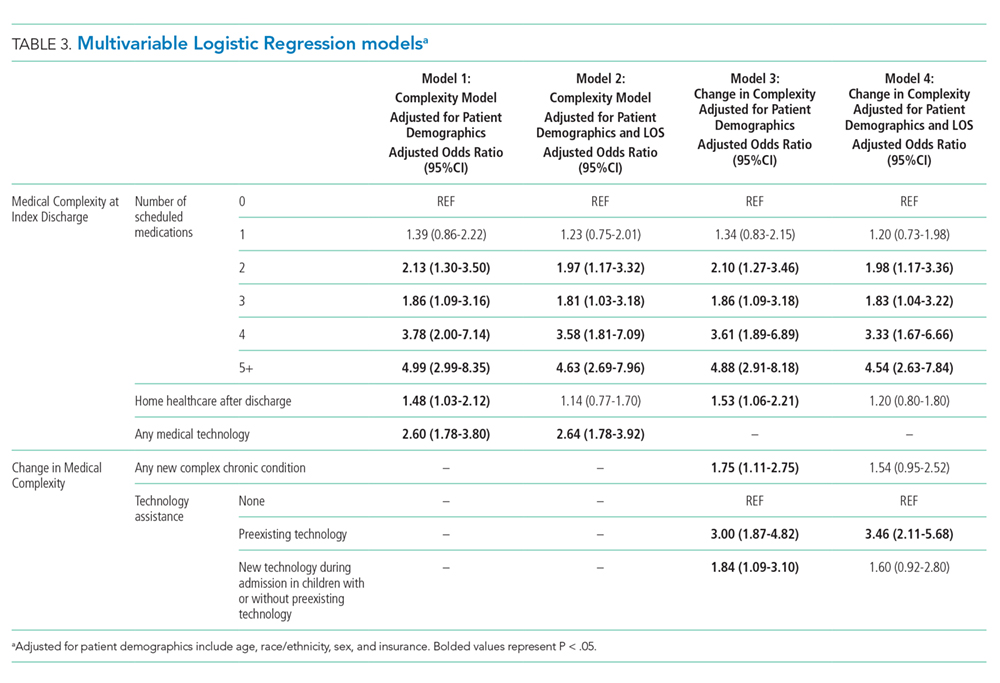
In Model 1 (adjusting only for patient characteristics; Table 3), being discharged on two or more scheduled medications was associated with higher odds of readmission compared to being discharged without medications, with additional medications associated with even higher odds of readmission. Children with any technology had higher odds of readmission than children without medical technology. Likewise, home healthcare visits after discharge were associated with elevated odds of readmission in multivariable analyses without LOS. However, after adding LOS to the model (Model 2), home healthcare visits were no longer significantly associated with readmission.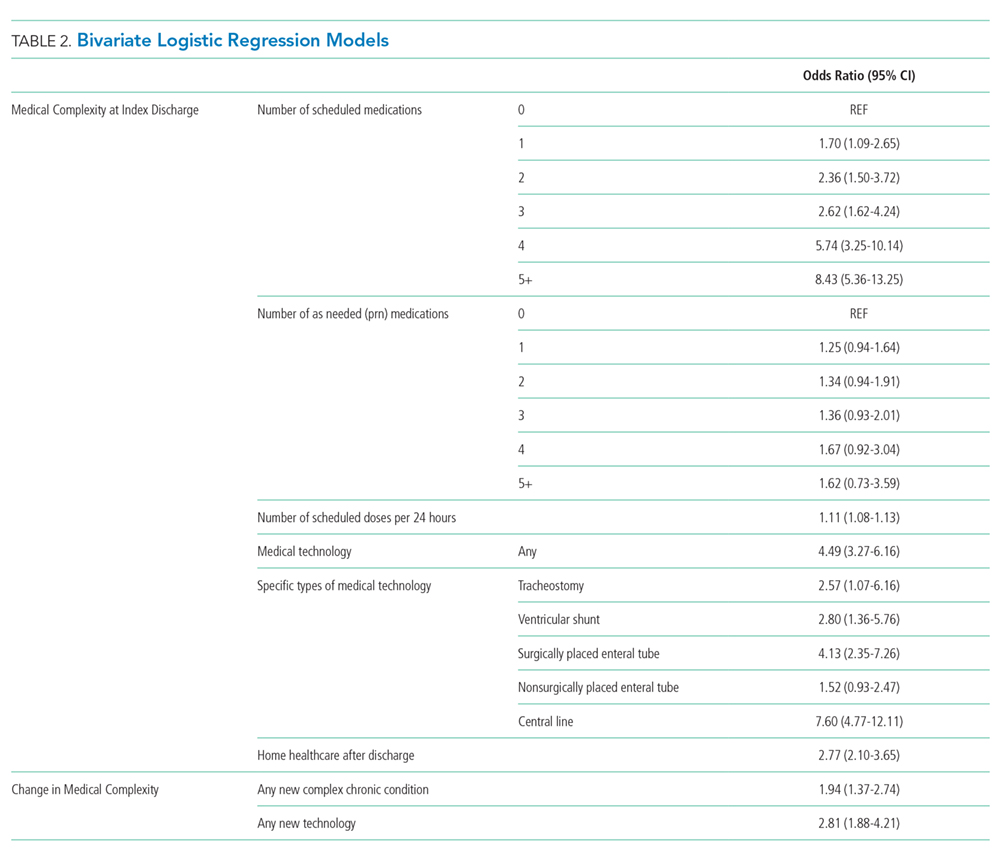
Change in Medical Complexity Models
The adjudication of new CCCs had good reliability (Κ = 0.72). New CCCs occurred in 18% and new technologies occurred in 17% of cases. Comparatively, new CCCs occurred in 10% and new technologies in 7% of hospitalizations in control children (Table 1). In bivariate analyses, both aspects of change in medical complexity were associated with higher odds of readmission (Table 2). In multivariate analysis with patient characteristics (Model 3; Table 3), all aspects of change in complexity were associated with elevated odds of readmission. A new CCC was associated with higher odds of readmission (adjusted OR (AOR) 1.75, 95% CI: 1.11-2.75) as was new technology during admission (AOR 1.84, 95%CI: 1.09-3.10). Furthermore, the odds of readmission for medical complexity variables (polypharmacy and home healthcare need) remained largely unchanged when adding the change in medical complexity variables (ie, comparing Model 1 and Model 3). However, when accounting for LOS (Model 4), neither the acquisition of a new CCC nor the addition of new technology was associated with readmission. The most common form of new technology was central line followed by nonsurgically placed enteral tube (Appendix Table 2). Finally, in sensitivity analyses (results not detailed), separating new CCC acquired at birth and new CCCs in nonbirth hospitalizations, compared to hospitalizations with no new CCC, yielded similar results as the primary analyses.
DISCUSSION
We examined multiple attributes of polypharmacy—the number of scheduled medications, number of as-needed medications, and number of scheduled doses per 24 hours. Interestingly, only the scheduled medications (count of medication and number of doses) were associated with elevated readmission risk. As-needed medications have heterogeneity in the level of importance from critical (eg, seizure rescue) to discretionary (eg, antipyretics, creams). The burden of managing these types of medications may still be high (ie, parents must decide when to administer a critical medication); however, this burden does not translate into increased readmission risk in this population.
Not surprisingly, greater medical complexity—as defined by higher numbers of scheduled discharge medications and technology assistance—is associated with 30-day readmission risk. Our analyses do not allow us to determine how much of the increased risk is due to additional care burden and risks of polypharmacy versus the inherent increase in complexity and severity of illness for which polypharmacy is a marker. Tailoring discharge regimens to the realities of daily life, with the goal of “minimally disruptive medicine”22,23 (eg, integrating manageable discharge medication routines into school and work schedules), is not a common feature of pediatric discharge planning. For adult patients with complex medical conditions, tailoring medication regimens in a minimally disruptive way is known to improve outcomes.24 Similarly, adopting minimally disruptive techniques to integrate the polypharmacy inherent in discharge could potentially mitigate some of the readmission risks for children and adolescents.
Contrary to our hypothesis, new technologies and new diagnoses did not confer additional readmission risk when accounting for LOS and patient characteristics. One potential explanation is varying risks conveyed by different types of new technologies placed during hospitalization. Central lines, the most common form of new technology, is associated with higher odds of reutilization in unadjusted analyses. However, the second most common form of new technology, nonsurgically placed enteral feeding tube, was not. Further analyses of the differential effects of new technology should be further examined in larger datasets. Additionally, the lack of additional readmission risk from new technology may relate to additional teaching and support provided to families of patients undergoing unfamiliar procedures offsets the risks inherent of greater complexity. If so, it may be that the more intensive teaching and postdischarge support provided to families with new technology or a new diagnosis could be replicated through refresher teaching during hospitalizations, when a patient’s state of health is status quo for the family (ie, the child was admitted and discharged with the same technology and diagnoses). This notion is supported by prior work that demonstrated successful readmission reduction interventions for children with chronic conditions often rely on enhanced education or coaching.25,26
We elected to present models both with and without LOS as a confounder because it is a potentially modifiable attribute of hospitalization. Change in medical complexity aspects were significantly associated with readmission in multivariable models without LOS. However, with the addition of LOS, they were no longer significant. Thus, the readmission risk of new complexity is accounted for by the readmission risk inherent in a longer LOS. This finding prompts additional questions that merit further study: is it that LOS is a general marker for heightened complexity, or is it that a longer LOS can modify readmission risk through additional in-hospital care and time for enhanced education?
Our study has several strengths. We were able to discern true complexity at the time of discharge through medical record review. For example, if a child had a peripherally inserted central catheter placed during hospitalization, it cannot be ascertained through administrative data without medical record review if the technology was removed or in place at discharge. Likewise, medical record review allows for identification of medical technology which is not surgically implanted (eg, nasogastric feeding tubes). Given the “fog” families report as part of their in-hospital experience and its threats to education and postdischarge contingency planning,17 we felt it important to evaluate medical technology regardless of whether or not it was surgically placed. Additionally, the more detailed and nuanced understanding gained of polypharmacy burden can better inform both risk prediction models and interventions to improve the transition from hospital to home.
This study
CONCLUSION
Medical complexity at discharge is associated with pediatric readmission risk. Contrary to our hypothesis, the addition of new technologies and new CCC diagnoses are not associated with pediatric readmission, after accounting for patient and hospitalization factors including LOS. The dynamics of LOS as a risk factor for readmission for children with medical complexity are likely multifaceted and merit further investigation in a multi-institutional study.
Disclosures
The authors report no potential conflicts of interest.
Funding
This work was supported by a grant from the Agency for Healthcare Research and Quality (1K08HS204735-01A1) and a grant from the Blue Cross Blue Shield of Michigan Foundation.
1. Diaz-Caneja A, Gledhill J, Weaver T, Nadel S, Garralda E. A child’s admission to hospital: a qualitative study examining the experiences of parents. Intensive Care Med. 2005;31(9):1248-1254. https://doi.org/10.1007/s00134-005-2728-8.
2. Lapillonne A, Regnault A, Gournay V, et al. Impact on parents of bronchiolitis hospitalization of full-term, preterm and congenital heart disease infants. BMC Pediatrics. 2012;12:171. https://doi.org/10.1186/1471-2431-12-171.
3. Leader S, Jacobson P, Marcin J, Vardis R, Sorrentino M, Murray D. A method for identifying the financial burden of hospitalized infants on families. Value Health. 2002;5(1):55-59. https://doi.org/10.1046/j.1524-4733.2002.51076.x.
4. Leidy NK, Margolis MK, Marcin JP, et al. The impact of severe respiratory syncytial virus on the child, caregiver, and family during hospitalization and recovery. Pediatrics. 2005;115(6):1536-1546. https://doi.org/10.1542/peds.2004-1149.
5. Rennick JE, Johnston CC, Dougherty G, Platt R, Ritchie JA. Children’s psychological responses after critical illness and exposure to invasive technology. J Dev Behav Pediatr. 2002;23(3):133-144. PubMed
6. Brennan TA, Leape LL, Laird NM, et al. Incidence of adverse events and negligence in hospitalized patients. Results of the Harvard Medical Practice Study I. N Engl J Med. 1991;324(6):370-376. https://doi.org/10.1056/NEJM199102073240604.
7. Kohn LT, Corrigan J, Donaldson MS. To err is human: building a safer health system. Washington DC: National Academy Press; 2000.
8. Landrigan CP, Parry GJ, Bones CB, Hackbarth AD, Goldmann DA, Sharek PJ. Temporal trends in rates of patient harm resulting from medical care. N Engl J Med. 2010;363(22):2124-2134. https://doi.org/10.1056/NEJMsa1004404.
9. Magill SS, Edwards JR, Bamberg W, et al. Multistate point-prevalence survey of healthcare-associated infections. N Engl J Med. 2014;370(13):1198-1208. https://doi.org/10.1056/NEJMoa1306801.
10. Berry JG, Toomey SL, Zaslavsky AM, et al. Pediatric readmission prevalence and variability across hospitals. JAMA. 2013;309(4):372-380. https://doi.org/10.1001/jama.2012.188351.
11. Bardach NS, Vittinghoff E, Asteria-Penaloza R, et al. Measuring hospital quality using pediatric readmission and revisit rates. Pediatrics. 2013;132(3):429-436. https://doi.org/10.1542/peds.2012-3527.
12. Toomey SL, Peltz A, Loren S, et al. Potentially preventable 30-day hospital readmissions at a children’s hospital. Pediatrics. 2016;138(2):pii: e20154182. https://doi.org/10.1542/peds.2015-4182.
13. Bucholz EM, Gay JC, Hall M, Harris M, Berry JG. Timing and causes of common pediatric readmissions. J Pediatr. 2018;200:240-248. https://doi.org/10.1016/j.jpeds.2018.04.044.
14. Berry JG, Hall DE, Kuo DZ, et al. Hospital utilization and characteristics of patients experiencing recurrent readmissions within children’s hospitals. JAMA. 2011;305(7):682-690. https://doi.org/10.1001/jama.2011.122.
15. Winer JC, Aragona E, Fields AI, Stockwell DC. Comparison of clinical risk factors among pediatric patients with single admission, multiple admissions (without any 7-day readmissions), and 7-day readmission. Hosp Pediatr. 2016;6(3):119-125. https://doi.org/10.1542/hpeds.2015-0110.
16. Brittan MS, Martin S, Anderson L, Moss A, Torok MR. An electronic health record tool designed to improve pediatric hospital discharge has low predictive utility for readmissions. J Hosp Med. 2018;13(11):779-782. https://doi.org/10.12788/jhm.3043.
17. Solan LG, Beck AF, Brunswick SA, et al. The family perspective on hospital to home transitions: a qualitative study. Pediatrics. 2015;136(6):e1539-e1549. https://doi.org/10.1542/peds.2015-2098.
18. Auger KA, Mueller EL, Weinberg SH, et al. A validated method for identifying unplanned pediatric readmission. J Pediatr. 2016;170:105-112. https://doi.org/10.1016/j.jpeds.2015.11.051.
19. Auger KA, Shah SS, Davis MD, Brady PW. Counting the Ways to Count Medications: The Challenges of Defining Pediatric Polypharmacy. J Hosp Med. 2019;14(8):506-507. https://doi.org/10.12788/jhm.3213.
20. Feudtner C, Feinstein JA, Zhong W, Hall M, Dai D. Pediatric complex chronic conditions classification system version 2: updated for ICD-10 and complex medical technology dependence and transplantation. BMC Pediatrics. 2014;14:199. https://doi.org/10.1186/1471-2431-14-199.
21. Hsieh FY. Sample size tables for logistic regression. Stat Med. 1989;8(7):795-802. https://doi.org/10.1002/sim.4780080704.
22. May C, Montori VM, Mair FS. We need minimally disruptive medicine. BMJ. 2009;339:b2803. https://doi.org/10.1136/bmj.b2803.
23. Leppin AL, Montori VM, Gionfriddo MR. Minimally disruptive medicine: a pragmatically comprehensive model for delivering care to patients with multiple chronic conditions. Healthcare (Basel). 2015;3(1):50-63. https://doi.org/10.3390/healthcare3010050.
24. Serrano V, Spencer-Bonilla G, Boehmer KR, Montori VM. Minimally disruptive medicine for patients with diabetes. Curr Diab Rep. 2017;17(11):104. https://doi.org/10.1007/s11892-017-0935-7.
25. Auger KA, Kenyon CC, Feudtner C, Davis MM. Pediatric hospital discharge interventions to reduce subsequent utilization: a systematic review. J Hosp Med. 2013;9(4):251-260. https://doi.org/10.1002/jhm.2134.
26. Coller RJ, Klitzner TS, Lerner CF, et al. Complex care hospital use and postdischarge coaching: a randomized controlled trial. Pediatrics. 2018;142(2):pii: e20174278. https://doi.org/10.1542/peds.2017-4278.
27. Hain PD, Gay JC, Berutti TW, Whitney GM, Wang W, Saville BR. Preventability of early readmissions at a children’s hospital. Pediatrics. 2013;131(1):e171-e181. https://doi.org/10.1542/peds.2012-0820.
28. Auger KA, Teufel RJ, 2nd, Harris JM, 2nd, et al. Children’s hospital characteristics and readmission metrics. Pediatrics. 2017;139(2). https://doi.org/10.1542/peds.2016-1720.
29. Gay JC, Agrawal R, Auger KA, et al. Rates and impact of potentially preventable readmissions at children’s hospitals. J Pediatr. 2015;166(3):613-619 e615. https://doi.org/10.1016/j.jpeds.2014.10.052.
Hospitalizations are disruptive, stressful, and costly for patients and families.1-5 Hospital readmissions subject families to the additional morbidity inherent to hospitalization and place patients at additional risk of hospital-acquired conditions or other harm.6-9 In pediatrics, hospital readmissions are common for specific conditions;10 with rates varying across institutions;10,11 and as many as one-third of unplanned pediatric readmissions are potentially preventable.12
Reducing pediatric readmissions requires a deeper understanding of the mechanisms through which readmissions occur. Medical complexity—specifically chronic conditions and use of medical technology—is associated with increased risk of readmission.13,14 Polypharmacy at discharge has also been associated with readmission.15,16 However, prior studies on polypharmacy and readmission risk examined the count of total medications and did not consider the nuances of scheduled versus as-needed medications, or the frequency of doses. These nuances may be critical to caregivers as discharge medical complexity can be overwhelming, even in diagnoses which are not traditionally considered complex.17 Finally, of potentially greater importance than medical complexity at discharge is a change in medical complexity during a hospitalization—for example, new diagnoses or new technologies that require additional education in hospital and management at home.
We sought to further understand the relationship between discharge medical complexity and readmission risk with regards to polypharmacy and home healthcare referrals at discharge. Specifically, we hypothesized that a change in medical complexity during an admission—ie, a new chronic diagnosis or new technology—would be a more prominent risk factor for readmission than discharge complexity alone. We examined these factors in the context of length of stay (LOS) since this is a marker of in-hospital severity of illness and a potentially modifiable function of time allowed for in-hospital teaching and discharge preparation.
METHODS
We conducted a retrospective, case-control study of pediatric hospitalizations at one tertiary care children’s hospital. Children <18 years were eligible for inclusion. Normal birth hospitalizations were excluded. We randomly selected one hospitalization from each child as the index visit. We identified cases, hospitalizations at C.S. Mott Children’s Hospital between 2008 and 2012 with a subsequent unplanned 30-day readmission,18 and matched them one to one with hospitalizations at the same hospital during the same period without subsequent readmission. We matched cases to controls based on the month of admission to account for seasonality of certain illnesses. We also matched on distance and direction from the hospital to the patient’s home to account for the potential to have readmissions to other institutions. We utilized both distance and direction recognizing that a family living 30 miles in one direction would be closer to an urban area with access to more facilities, as opposed to 30 miles in another direction in a rural area without additional access. We subsequently performed medical record review to abstract relevant covariates.
Primary Predictors
Medical Complexity Models (Models 1 and 2):
We evaluated three attributes of discharge medical complexity abstracted by medical record review—discharge medications, technology assistance (ie, tracheostomy, cerebral spinal fluid ventricular shunt, enteral feeding tube, central line), and the need for home healthcare after discharge. We counted discharge medications based on the number of medications listed on the discharge summary separated into scheduled or as needed.19 We also considered the number of scheduled doses to be administered in a 24-hour period (see Appendix methods for more information on counting discharge medications). For assistance by technology, we considered the presence of tracheostomy, cerebral spinal fluid ventricular shunt, enteral feeding tube, and central lines. While we describe these technologies separately, for multivariable analyses we considered the presence of any of the four types of technology.
Change in Medical Complexity Models (Models 3 and 4)
We examined two aspects of change in medical complexity—the presence of a new complex chronic condition (CCC)20 diagnosed during the hospitalization, and a new reliance on medical technology. The presence of new CCC was determined by comparing discharge diagnoses to past medical history abstracted by medical record review. A new CCC was defined as any complex chronic condition that was captured in the discharge diagnoses but was not evident in the past medical history. By definition, all CCCs coded during birth hospitalization (eg, at discharge from the neonatal intensive care unit) were assigned to “new” CCC. We calculated a kappa statistic to determine interrater reliability in determining the designation of new CCC. A sensitivity analysis examining these birth CCCs was also performed comparing no new CCC, new CCC, and new CCC after birth hospitalization. The methods appendix provides additional information on considering new CCCs. New technology, abstracted from chart review, was defined as technology placed during hospitalization that remained in place at discharge. If a child with existing technology had additional technology placed during the hospitalization (eg, a new tracheostomy in a child with a previously placed enteral feeding tube), the encounter was considered as having new technology placed.
Covariates
We created different sets of multivariable models to account for patient/hospitalization characteristics.
Statistical Analysis
A review of 600 cases and 600 controls yields 89% power to detect statistical significance for covariates with an odds ratio of 1.25 (β = 0.22) if the candidate covariate has low to moderate correlation with other covariates (<0.3). If a candidate covariate has a moderate correlation with other covariates (0.6), we have 89% power to detect an odds ratio of 1.35 (β = 0.30).21 We calculated odds of 30-days unplanned readmission using conditional logistic regression to account for matched case-control design. All the analyses were performed using STATA 13 (Stata Corp., College Station, Texas).
RESULTS
Of the 41,422 eligible index hospitalizations during the study period, 9.4% resulted in a 30-day unplanned readmission. After randomly selecting one hospitalization per child, there were 781 eligible cases. We subsequent matched all but one eligible case to a control. We randomly selected encounters for medical record review, reviewing a total of 1,212 encounters. After excluding pairs with incomplete records, we included 595 cases and 595 controls in this analysis (Figure). Patient/hospitalization characteristics are displayed in Table 1. The most frequent primary discharge diagnoses are displayed in Appendix Table 1.
Models of Medical Complexity at Discharge
Polypharmacy after discharge was common for both readmitted and nonreadmitted patients. Children who experienced unplanned readmission in 30 days were discharged with a median of four different scheduled medications (interquartile range [IQR] 2,7) which translated into a median of six (IQR 3,12) scheduled doses in a 24-hour period. In comparison, children without an unplanned readmission had a median of two different scheduled medications (IQR 1,3) with a median of three (IQR 0,7) scheduled doses in a 24-hour period. Medical technology was more common in case children (42%) than in control children (14%). Central lines and enteral tubes were the most common forms of medical technology in both cases and controls. Home health referral was common in both cases (44%) and controls (23%; Table 1).
In Model 1 (adjusting only for patient characteristics; Table 3), being discharged on two or more scheduled medications was associated with higher odds of readmission compared to being discharged without medications, with additional medications associated with even higher odds of readmission. Children with any technology had higher odds of readmission than children without medical technology. Likewise, home healthcare visits after discharge were associated with elevated odds of readmission in multivariable analyses without LOS. However, after adding LOS to the model (Model 2), home healthcare visits were no longer significantly associated with readmission.
Change in Medical Complexity Models
The adjudication of new CCCs had good reliability (Κ = 0.72). New CCCs occurred in 18% and new technologies occurred in 17% of cases. Comparatively, new CCCs occurred in 10% and new technologies in 7% of hospitalizations in control children (Table 1). In bivariate analyses, both aspects of change in medical complexity were associated with higher odds of readmission (Table 2). In multivariate analysis with patient characteristics (Model 3; Table 3), all aspects of change in complexity were associated with elevated odds of readmission. A new CCC was associated with higher odds of readmission (adjusted OR (AOR) 1.75, 95% CI: 1.11-2.75) as was new technology during admission (AOR 1.84, 95%CI: 1.09-3.10). Furthermore, the odds of readmission for medical complexity variables (polypharmacy and home healthcare need) remained largely unchanged when adding the change in medical complexity variables (ie, comparing Model 1 and Model 3). However, when accounting for LOS (Model 4), neither the acquisition of a new CCC nor the addition of new technology was associated with readmission. The most common form of new technology was central line followed by nonsurgically placed enteral tube (Appendix Table 2). Finally, in sensitivity analyses (results not detailed), separating new CCC acquired at birth and new CCCs in nonbirth hospitalizations, compared to hospitalizations with no new CCC, yielded similar results as the primary analyses.
DISCUSSION
We examined multiple attributes of polypharmacy—the number of scheduled medications, number of as-needed medications, and number of scheduled doses per 24 hours. Interestingly, only the scheduled medications (count of medication and number of doses) were associated with elevated readmission risk. As-needed medications have heterogeneity in the level of importance from critical (eg, seizure rescue) to discretionary (eg, antipyretics, creams). The burden of managing these types of medications may still be high (ie, parents must decide when to administer a critical medication); however, this burden does not translate into increased readmission risk in this population.
Not surprisingly, greater medical complexity—as defined by higher numbers of scheduled discharge medications and technology assistance—is associated with 30-day readmission risk. Our analyses do not allow us to determine how much of the increased risk is due to additional care burden and risks of polypharmacy versus the inherent increase in complexity and severity of illness for which polypharmacy is a marker. Tailoring discharge regimens to the realities of daily life, with the goal of “minimally disruptive medicine”22,23 (eg, integrating manageable discharge medication routines into school and work schedules), is not a common feature of pediatric discharge planning. For adult patients with complex medical conditions, tailoring medication regimens in a minimally disruptive way is known to improve outcomes.24 Similarly, adopting minimally disruptive techniques to integrate the polypharmacy inherent in discharge could potentially mitigate some of the readmission risks for children and adolescents.
Contrary to our hypothesis, new technologies and new diagnoses did not confer additional readmission risk when accounting for LOS and patient characteristics. One potential explanation is varying risks conveyed by different types of new technologies placed during hospitalization. Central lines, the most common form of new technology, is associated with higher odds of reutilization in unadjusted analyses. However, the second most common form of new technology, nonsurgically placed enteral feeding tube, was not. Further analyses of the differential effects of new technology should be further examined in larger datasets. Additionally, the lack of additional readmission risk from new technology may relate to additional teaching and support provided to families of patients undergoing unfamiliar procedures offsets the risks inherent of greater complexity. If so, it may be that the more intensive teaching and postdischarge support provided to families with new technology or a new diagnosis could be replicated through refresher teaching during hospitalizations, when a patient’s state of health is status quo for the family (ie, the child was admitted and discharged with the same technology and diagnoses). This notion is supported by prior work that demonstrated successful readmission reduction interventions for children with chronic conditions often rely on enhanced education or coaching.25,26
We elected to present models both with and without LOS as a confounder because it is a potentially modifiable attribute of hospitalization. Change in medical complexity aspects were significantly associated with readmission in multivariable models without LOS. However, with the addition of LOS, they were no longer significant. Thus, the readmission risk of new complexity is accounted for by the readmission risk inherent in a longer LOS. This finding prompts additional questions that merit further study: is it that LOS is a general marker for heightened complexity, or is it that a longer LOS can modify readmission risk through additional in-hospital care and time for enhanced education?
Our study has several strengths. We were able to discern true complexity at the time of discharge through medical record review. For example, if a child had a peripherally inserted central catheter placed during hospitalization, it cannot be ascertained through administrative data without medical record review if the technology was removed or in place at discharge. Likewise, medical record review allows for identification of medical technology which is not surgically implanted (eg, nasogastric feeding tubes). Given the “fog” families report as part of their in-hospital experience and its threats to education and postdischarge contingency planning,17 we felt it important to evaluate medical technology regardless of whether or not it was surgically placed. Additionally, the more detailed and nuanced understanding gained of polypharmacy burden can better inform both risk prediction models and interventions to improve the transition from hospital to home.
This study
CONCLUSION
Medical complexity at discharge is associated with pediatric readmission risk. Contrary to our hypothesis, the addition of new technologies and new CCC diagnoses are not associated with pediatric readmission, after accounting for patient and hospitalization factors including LOS. The dynamics of LOS as a risk factor for readmission for children with medical complexity are likely multifaceted and merit further investigation in a multi-institutional study.
Disclosures
The authors report no potential conflicts of interest.
Funding
This work was supported by a grant from the Agency for Healthcare Research and Quality (1K08HS204735-01A1) and a grant from the Blue Cross Blue Shield of Michigan Foundation.
1. Diaz-Caneja A, Gledhill J, Weaver T, Nadel S, Garralda E. A child’s admission to hospital: a qualitative study examining the experiences of parents. Intensive Care Med. 2005;31(9):1248-1254. https://doi.org/10.1007/s00134-005-2728-8.
2. Lapillonne A, Regnault A, Gournay V, et al. Impact on parents of bronchiolitis hospitalization of full-term, preterm and congenital heart disease infants. BMC Pediatrics. 2012;12:171. https://doi.org/10.1186/1471-2431-12-171.
3. Leader S, Jacobson P, Marcin J, Vardis R, Sorrentino M, Murray D. A method for identifying the financial burden of hospitalized infants on families. Value Health. 2002;5(1):55-59. https://doi.org/10.1046/j.1524-4733.2002.51076.x.
4. Leidy NK, Margolis MK, Marcin JP, et al. The impact of severe respiratory syncytial virus on the child, caregiver, and family during hospitalization and recovery. Pediatrics. 2005;115(6):1536-1546. https://doi.org/10.1542/peds.2004-1149.
5. Rennick JE, Johnston CC, Dougherty G, Platt R, Ritchie JA. Children’s psychological responses after critical illness and exposure to invasive technology. J Dev Behav Pediatr. 2002;23(3):133-144. PubMed
6. Brennan TA, Leape LL, Laird NM, et al. Incidence of adverse events and negligence in hospitalized patients. Results of the Harvard Medical Practice Study I. N Engl J Med. 1991;324(6):370-376. https://doi.org/10.1056/NEJM199102073240604.
7. Kohn LT, Corrigan J, Donaldson MS. To err is human: building a safer health system. Washington DC: National Academy Press; 2000.
8. Landrigan CP, Parry GJ, Bones CB, Hackbarth AD, Goldmann DA, Sharek PJ. Temporal trends in rates of patient harm resulting from medical care. N Engl J Med. 2010;363(22):2124-2134. https://doi.org/10.1056/NEJMsa1004404.
9. Magill SS, Edwards JR, Bamberg W, et al. Multistate point-prevalence survey of healthcare-associated infections. N Engl J Med. 2014;370(13):1198-1208. https://doi.org/10.1056/NEJMoa1306801.
10. Berry JG, Toomey SL, Zaslavsky AM, et al. Pediatric readmission prevalence and variability across hospitals. JAMA. 2013;309(4):372-380. https://doi.org/10.1001/jama.2012.188351.
11. Bardach NS, Vittinghoff E, Asteria-Penaloza R, et al. Measuring hospital quality using pediatric readmission and revisit rates. Pediatrics. 2013;132(3):429-436. https://doi.org/10.1542/peds.2012-3527.
12. Toomey SL, Peltz A, Loren S, et al. Potentially preventable 30-day hospital readmissions at a children’s hospital. Pediatrics. 2016;138(2):pii: e20154182. https://doi.org/10.1542/peds.2015-4182.
13. Bucholz EM, Gay JC, Hall M, Harris M, Berry JG. Timing and causes of common pediatric readmissions. J Pediatr. 2018;200:240-248. https://doi.org/10.1016/j.jpeds.2018.04.044.
14. Berry JG, Hall DE, Kuo DZ, et al. Hospital utilization and characteristics of patients experiencing recurrent readmissions within children’s hospitals. JAMA. 2011;305(7):682-690. https://doi.org/10.1001/jama.2011.122.
15. Winer JC, Aragona E, Fields AI, Stockwell DC. Comparison of clinical risk factors among pediatric patients with single admission, multiple admissions (without any 7-day readmissions), and 7-day readmission. Hosp Pediatr. 2016;6(3):119-125. https://doi.org/10.1542/hpeds.2015-0110.
16. Brittan MS, Martin S, Anderson L, Moss A, Torok MR. An electronic health record tool designed to improve pediatric hospital discharge has low predictive utility for readmissions. J Hosp Med. 2018;13(11):779-782. https://doi.org/10.12788/jhm.3043.
17. Solan LG, Beck AF, Brunswick SA, et al. The family perspective on hospital to home transitions: a qualitative study. Pediatrics. 2015;136(6):e1539-e1549. https://doi.org/10.1542/peds.2015-2098.
18. Auger KA, Mueller EL, Weinberg SH, et al. A validated method for identifying unplanned pediatric readmission. J Pediatr. 2016;170:105-112. https://doi.org/10.1016/j.jpeds.2015.11.051.
19. Auger KA, Shah SS, Davis MD, Brady PW. Counting the Ways to Count Medications: The Challenges of Defining Pediatric Polypharmacy. J Hosp Med. 2019;14(8):506-507. https://doi.org/10.12788/jhm.3213.
20. Feudtner C, Feinstein JA, Zhong W, Hall M, Dai D. Pediatric complex chronic conditions classification system version 2: updated for ICD-10 and complex medical technology dependence and transplantation. BMC Pediatrics. 2014;14:199. https://doi.org/10.1186/1471-2431-14-199.
21. Hsieh FY. Sample size tables for logistic regression. Stat Med. 1989;8(7):795-802. https://doi.org/10.1002/sim.4780080704.
22. May C, Montori VM, Mair FS. We need minimally disruptive medicine. BMJ. 2009;339:b2803. https://doi.org/10.1136/bmj.b2803.
23. Leppin AL, Montori VM, Gionfriddo MR. Minimally disruptive medicine: a pragmatically comprehensive model for delivering care to patients with multiple chronic conditions. Healthcare (Basel). 2015;3(1):50-63. https://doi.org/10.3390/healthcare3010050.
24. Serrano V, Spencer-Bonilla G, Boehmer KR, Montori VM. Minimally disruptive medicine for patients with diabetes. Curr Diab Rep. 2017;17(11):104. https://doi.org/10.1007/s11892-017-0935-7.
25. Auger KA, Kenyon CC, Feudtner C, Davis MM. Pediatric hospital discharge interventions to reduce subsequent utilization: a systematic review. J Hosp Med. 2013;9(4):251-260. https://doi.org/10.1002/jhm.2134.
26. Coller RJ, Klitzner TS, Lerner CF, et al. Complex care hospital use and postdischarge coaching: a randomized controlled trial. Pediatrics. 2018;142(2):pii: e20174278. https://doi.org/10.1542/peds.2017-4278.
27. Hain PD, Gay JC, Berutti TW, Whitney GM, Wang W, Saville BR. Preventability of early readmissions at a children’s hospital. Pediatrics. 2013;131(1):e171-e181. https://doi.org/10.1542/peds.2012-0820.
28. Auger KA, Teufel RJ, 2nd, Harris JM, 2nd, et al. Children’s hospital characteristics and readmission metrics. Pediatrics. 2017;139(2). https://doi.org/10.1542/peds.2016-1720.
29. Gay JC, Agrawal R, Auger KA, et al. Rates and impact of potentially preventable readmissions at children’s hospitals. J Pediatr. 2015;166(3):613-619 e615. https://doi.org/10.1016/j.jpeds.2014.10.052.
© 2019 Society of Hospital Medicine
Opioid Utilization and Perception of Pain Control in Hospitalized Patients: A Cross-Sectional Study of 11 Sites in 8 Countries
Since 2000, the United States has seen a marked increase in opioid prescribing1-3 and opioid-related complications, including overdoses, hospitalizations, and deaths.2,4,5 A study from 2015 showed that more than one-third of the US civilian noninstitutionalized population reported receiving an opioid prescription in the prior year, with 12.5% reporting misuse, and, of those, 16.7% reported a prescription use disorder.6 While there has been a slight decrease in opioid prescriptions in the US since 2012, rates of opioid prescribing in 2015 were three times higher than in 1999 and approximately four times higher than in Europe in 2015.3,7
Pain is commonly reported by hospitalized patients,8,9 and opioids are often a mainstay of treatment;9,10 however, treatment with opioids can have a number of adverse outcomes.2,10,11 Short-term exposure to opioids can lead to long-term use,12-16 and patients on opioids are at an increased risk for subsequent hospitalization and longer inpatient lengths of stay.5
Physician prescribing practices for opioids and patient expectations for pain control vary as a function of geographic region and culture,10,12,17,18 and pain is influenced by the cultural context in which it occurs.17,19-22 Treatment of pain may also be affected by limited access to or restrictions on selected medications, as well as by cultural biases.23 Whether these variations in the treatment of pain are reflected in patients’ satisfaction with pain control is uncertain.
We sought to compare the inpatient analgesic prescribing practices and patients’ perceptions of pain control for medical patients in four teaching hospitals in the US and in seven teaching hospitals in seven other countries.
METHODS
Study Design
We utilized a cross-sectional, observational design. The study was approved by the Institutional Review Boards at all participating sites.
Setting
The study was conducted at 11 academic hospitals in eight countries from October 8, 2013 to August 31, 2015. Sites in the US included Denver Health in Denver, Colorado; the University of Colorado Hospital in Aurora, Colorado; Hennepin Healthcare in Minneapolis, Minnesota; and Legacy Health in Portland, Oregon. Sites outside the US included McMaster University in Hamilton, Ontario, Canada; Hospital de la Santa Creu i Sant Pau, Universitat Autonòma de Barcelona in Barcelona, Spain; the University of Study of Milan and the University Ospedale “Luigi Sacco” in Milan, Italy, the National Taiwan University Hospital, in Taipei, Taiwan, the University of Ulsan College of Medicine, Asan Medical Center, in Seoul, Korea, the Imperial College, Chelsea and Westminster Hospital, in London, United Kingdom and Dunedin Hospital, Dunedin, New Zealand.
Inclusion and Exclusion Criteria
We included patients 18-89 years of age (20-89 in Taiwan because patients under 20 years of age in this country are a restricted group with respect to participating in research), admitted to an internal medicine service from the Emergency Department or Urgent Care clinic with an acute illness for a minimum of 24 hours (with time zero defined as the time care was initiated in the Emergency Department or Urgent Care Clinic), who reported pain at some time during the first 24-36 hours of their hospitalization and who provided informed consent. In the US, “admission” included both observation and inpatient status. We limited the patient population to those admitted via emergency departments and urgent care clinics in order to enroll similar patient populations across sites.
Scheduled admissions, patients transferred from an outside facility, patients admitted directly from a clinic, and those receiving care in intensive care units were excluded. We also excluded patients who were incarcerated, pregnant, those who received major surgery within the previous 14 days, those with a known diagnosis of active cancer, and those who were receiving palliative or hospice care. Patients receiving care from an investigator in the study at the time of enrollment were not eligible due to the potential conflict of interest.
Patient Screening
Primary teams were contacted to determine if any patients on their service might meet the criteria for inclusion in the study on preselected study days chosen on the basis of the research team’s availability. Identified patients were then screened to establish if they met the eligibility criteria. Patients were asked directly if they had experienced pain during their preadmission evaluation or during their hospitalization.
Data Collection
All patients were hospitalized at the time they gave consent and when data were collected. Data were collected via interviews with patients, as well as through chart review. We recorded patients’ age, gender, race, admitting diagnosis(es), length of stay, psychiatric illness, illicit drug use, whether they reported receiving opioid analgesics at the time of hospitalization, whether they were prescribed opioids and/or nonopioid analgesics during their hospitalization, the median and maximum doses of opioids prescribed and dispensed, and whether they were discharged on opioids. The question of illicit drug use was asked of all patients with the exception of those hospitalized in South Korea due to potential legal implications.
Opioid prescribing and receipt of opioids was recorded based upon current provider orders and medication administration records, respectively. Perception of and satisfaction with pain control was assessed with the American Pain Society Patient Outcome Questionnaire–Modified (APS-POQ-Modified).24,25 Versions of this survey have been validated in English as well as in other languages and cultures.26-28 Because hospitalization practices could differ across hospitals and in different countries, we compared patients’ severity of illness by using Charlson comorbidity scores. Consent forms and the APS-POQ were translated into each country’s primary language according to established processes.29 The survey was filled out by having site investigators read questions aloud and by use of a large-font visual analog scale to aid patients’ verbal responses.
Data were collected and managed using a secure, web-based application electronic data capture tool (Research Electronic Data Capture [REDCap], Nashville, Tennessee), hosted at Denver Health.30
Study Size
Preliminary data from the internal medicine units at our institution suggested that 40% of patients without cancer received opioid analgesics during their hospitalization. Assuming 90% power to detect an absolute difference in the proportion of inpatient medical patients who are receiving opioid analgesics during their hospital stay of 17%, a two-sided type 1 error rate of 0.05, six hospitals in the US, and nine hospitals from all other countries, we calculated an initial sample size of 150 patients per site. This sample size was considered feasible for enrollment in a busy inpatient clinical setting. Study end points were to either reach the goal number of patients (150 per site) or the predetermined study end date, whichever came first.
Data Analysis
We generated means with standard deviations (SDs) and medians with interquartile ranges (IQRs) for normally and nonnormally distributed continuous variables, respectively, and frequencies for categorical variables. We used linear mixed modeling for the analysis of continuous variables. For binary outcomes, our data were fitted to a generalized linear mixed model with logit as the link function and a binary distribution. For ordinal variables, specifically patient-reported satisfaction with pain control and the opinion statements, the data were fitted to a generalized linear mixed model with a cumulative logit link and a multinomial distribution. Hospital was included as a random effect in all models to account for patients cared for in the same hospital.
Country of origin, dichotomized as US or non-US, was the independent variable of interest for all models. An interaction term for exposure to opioids prior to admission and country was entered into all models to explore whether differences in the effect of country existed for patients who reported taking opioids prior to admission and those who did not.
The models for the frequency with which analgesics were given, doses of opioids given during hospitalization and at discharge, patient-reported pain score, and patient-reported satisfaction with pain control were adjusted for (1) age, (2) gender, (3) Charlson Comorbidity Index, (4) length of stay, (5) history of illicit drug use, (6) history of psychiatric illness, (7) daily dose in morphine milligram equivalents (MME) for opioids prior to admission, (8) average pain score, and (9) hospital. The patient-reported satisfaction with pain control model was also adjusted for whether or not opioids were given to the patient during their hospitalization. P < .05 was considered to indicate significance. All analyses were performed using SAS Enterprise Guide 7.1 (SAS Institute, Inc., Cary, North Carolina). We reported data on medications that were prescribed and dispensed (as opposed to just prescribed and not necessarily given). Opioids prescribed at discharge represented the total possible opioids that could be given based upon the order/prescription (eg, oxycodone 5 mg every 6 hours as needed for pain would be counted as 20 mg/24 hours maximum possible dose followed by conversion to MME).
Missing Data
When there were missing data, a query was sent to sites to verify if the data were retrievable. If retrievable, the data were then entered. Data were missing in 5% and 2% of patients who did or did not report taking an opioid prior to admission, respectively. If a variable was included in a specific statistical test, then subjects with missing data were excluded from that analysis (ie, complete case analysis).
RESULTS
We approached 1,309 eligible patients, of which 981 provided informed consent, for a response rate of 75%; 503 from the US and 478 patients from other countries (Figure). In unadjusted analyses, we found no significant differences between US and non-US patients in age (mean age 51, SD 15 vs 59, SD 19; P = .30), race, ethnicity, or Charlson comorbidity index scores (median 2, IQR 1-3 vs 3, IQR 1-4; P = .45). US patients had shorter lengths of stay (median 3 days, IQR 2-4 vs 6 days, IQR 3-11; P = .04), a more frequent history of illicit drug use (33% vs 6%; P = .003), a higher frequency of psychiatric illness (27% vs 8%; P < .0001), and more were receiving opioid analgesics prior to admission (38% vs 17%; P = .007) than those hospitalized in other countries (Table 1, Appendix 1). The primary admitting diagnoses for all patients in the study are listed in Appendix 2. Opioid prescribing practices across the individual sites are shown in Appendix 3.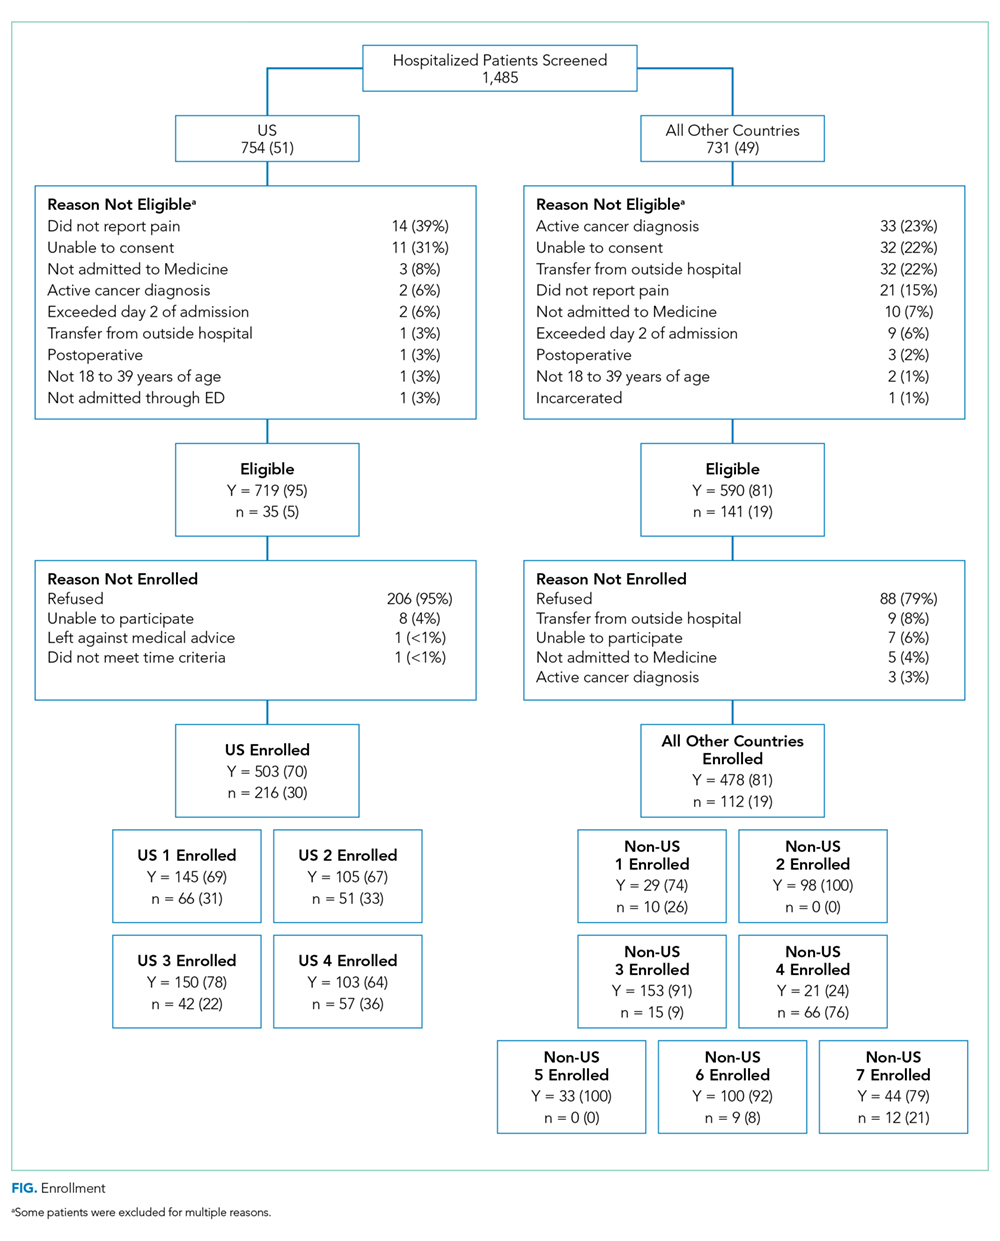
Patients Taking Opioids Prior to Admission
After adjusting for relevant covariates, we found that more patients in the US were given opioids during their hospitalization and in higher doses than patients from other countries and more were prescribed opioids at discharge. Fewer patients in the US were dispensed nonopioid analgesics during their hospitalization than patients from other countries, but this difference was not significant (Table 2). Appendix 4 shows the types of nonopioid pain medications prescribed in the US and other countries.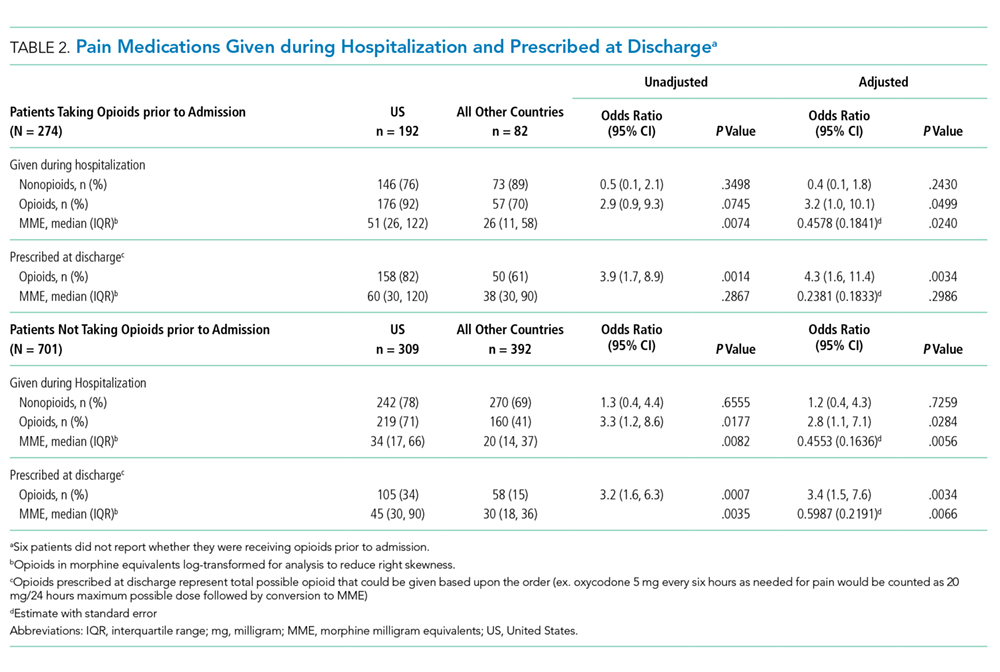
After adjustment for relevant covariates, US patients reported greater pain severity at the time they completed their pain surveys. We found no significant difference in satisfaction with pain control between patients from the US and other countries in the models, regardless of whether we included average pain score or opioid receipt during hospitalization in the model (Table 3).
In unadjusted analyses, compared with patients hospitalized in other countries, more patients in the US stated that they would like a stronger dose of analgesic if they were still in pain, though the difference was nonsignificant, and US patients were more likely to agree with the statement that people become addicted to pain medication easily and less likely to agree with the statement that it is easier to endure pain than deal with the side effects of pain medications (Table 3).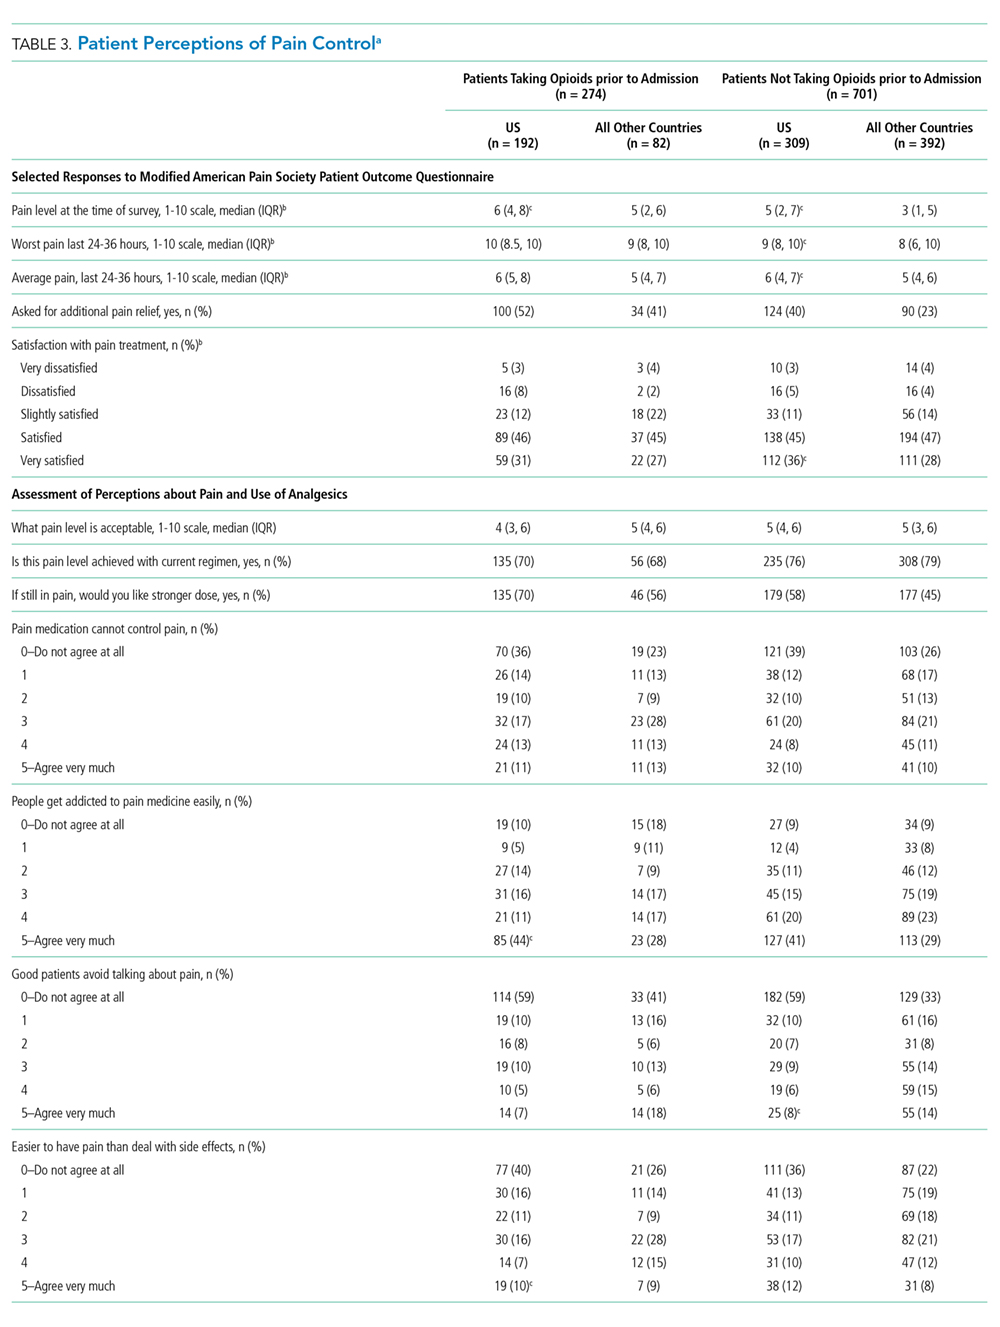
Patients Not Taking Opioids Prior to Admission
After adjusting for relevant covariates, we found no significant difference in the proportion of US patients provided with nonopioid pain medications during their hospitalization compared with patients in other countries, but a greater percentage of US patients were given opioids during their hospitalization and at discharge and in higher doses (Table 2).
After adjusting for relevant covariates, US patients reported greater pain severity at the time they completed their pain surveys and greater pain severity in the 24-36 hours prior to completing the survey than patients from other countries, but we found no difference in patient satisfaction with pain control (Table 3). After we included the average pain score and whether or not opioids were given to the patient during their hospitalization in this model, patients in the US were more likely to report a higher level of satisfaction with pain control than patients in all other countries (P = .001).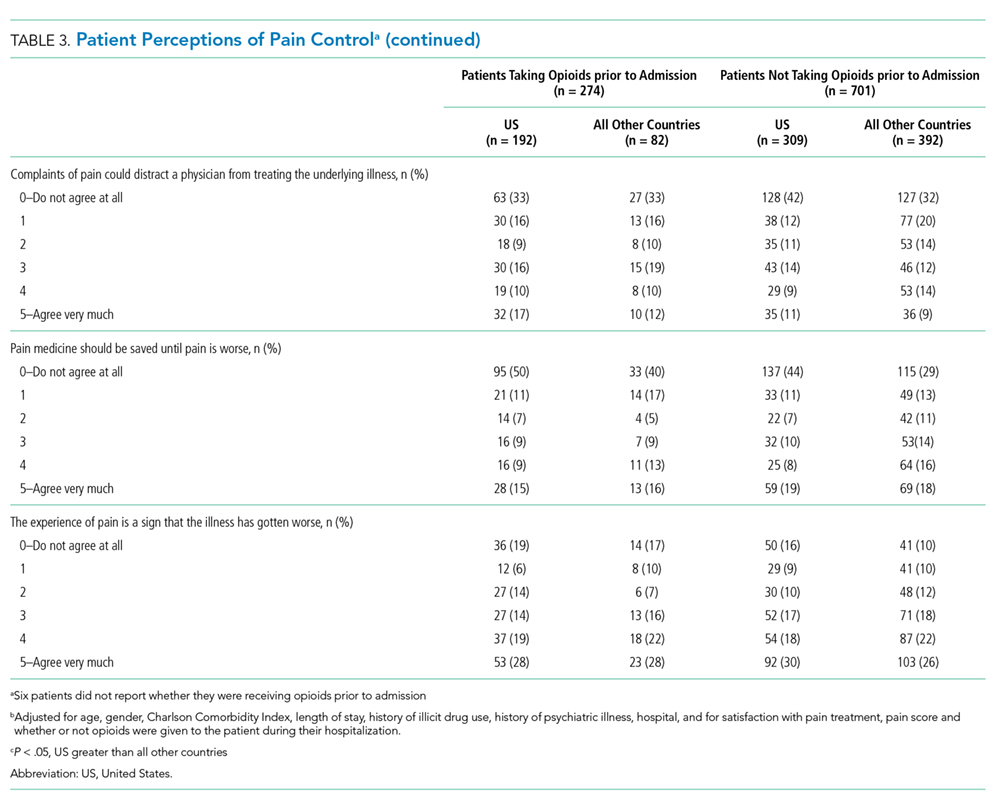
In unadjusted analyses, compared with patients hospitalized in other countries, those in the US were less likely to agree with the statement that good patients avoid talking about pain (Table 3).
Patient Satisfaction and Opioid Receipt
Among patients cared for in the US, after controlling for the average pain score, we did not find a significant association between receiving opioids while in the hospital and satisfaction with pain control for patients who either did or did not endorse taking opioids prior to admission (P = .38 and P = .24, respectively). Among patients cared for in all other countries, after controlling for the average pain score, we found a significant association between receiving opioids while in the hospital and a lower level of satisfaction with pain control for patients who reported taking opioids prior to admission (P = .02) but not for patients who did not report taking opioids prior to admission (P = .08).
DISCUSSION
Compared with patients hospitalized in other countries, a greater percentage of those hospitalized in the US were prescribed opioid analgesics both during hospitalization and at the time of discharge, even after adjustment for pain severity. In addition, patients hospitalized in the US reported greater pain severity at the time they completed their pain surveys and in the 24 to 36 hours prior to completing the survey than patients from other countries. In this sample, satisfaction, beliefs, and expectations about pain control differed between patients in the US and other sites. Our study also suggests that opioid receipt did not lead to improved patient satisfaction with pain control.
The frequency with which we observed opioid analgesics being prescribed during hospitalization in US hospitals (79%) was higher than the 51% of patients who received opioids reported by Herzig and colleagues.10 Patients in our study had a higher prevalence of illicit drug abuse and psychiatric illness, and our study only included patients who reported pain at some point during their hospitalization. We also studied prescribing practices through analysis of provider orders and medication administration records at the time the patient was hospitalized.
While we observed that physicians in the US more frequently prescribed opioid analgesics during hospitalizations than physicians working in other countries, we also observed that patients in the US reported higher levels of pain during their hospitalization. After adjusting for a number of variables, including pain severity, however, we still found that opioids were more commonly prescribed during hospitalizations by physicians working in the US sites studied than by physicians in the non-US sites.
Opioid prescribing practices varied across the sites sampled in our study. While the US sites, Taiwan, and Korea tended to be heavier utilizers of opioids during hospitalization, there were notable differences in discharge prescribing of opioids, with the US sites more commonly prescribing opioids and higher MME for patients who did not report taking opioids prior to their hospitalization (Appendix 3). A sensitivity analysis was conducted excluding South Korea from modeling, given that patients there were not asked about illicit opioid use. There were no important changes in the magnitude or direction of the results.
Our study supports previous studies indicating that there are cultural and societal differences when it comes to the experience of pain and the expectations around pain control.17,20-22,31 Much of the focus on reducing opioid utilization has been on provider practices32 and on prescription drug monitoring programs.33 Our findings suggest that another area of focus that may be important in mitigating the opioid epidemic is patient expectations of pain control.
Our study has a number of strengths. First, we included 11 hospitals from eight different countries. Second, we believe this is the first study to assess opioid prescribing and dispensing practices during hospitalization as well as at the time of discharge. Third, patient perceptions of pain control were assessed in conjunction with analgesic prescribing and were assessed during hospitalization. Fourth, we had high response rates for patient participation in our study. Fifth, we found much larger differences in opioid prescribing than anticipated, and thus, while we did not achieve the sample size originally planned for either the number of hospitals or patients enrolled per hospital, we were sufficiently powered. This is likely secondary to the fact that the population we studied was one that specifically reported pain, resulting in the larger differences seen.
Our study also had a number of limitations. First, the prescribing practices in countries other than the US are represented by only one hospital per country and, in some countries, by limited numbers of patients. While we studied four sites in the US, we did not have a site in the Northeast, a region previously shown to have lower prescribing rates.10 Additionally, patient samples for the US sites compared with the sites in other countries varied considerably with respect to ethnicity. While some studies in US patients have shown that opioid prescribing may vary based on race/ethnicity,34 we are uncertain as to how this might impact a study that crosses multiple countries. We also had a low number of patients receiving opioids prior to hospitalization for several of the non-US countries, which reduced the power to detect differences in this subgroup. Previous research has shown that there are wide variations in prescribing practices even within countries;10,12,18 therefore, caution should be taken when generalizing our findings. Second, we assessed analgesic prescribing patterns and pain control during the first 24 to 36 hours of hospitalization and did not consider hospital days beyond this timeframe with the exception of noting what medications were prescribed at discharge. We chose this methodology in an attempt to eliminate as many differences that might exist in the duration of hospitalization across many countries. Third, investigators in the study administered the survey, and respondents may have been affected by social desirability bias in how the survey questions were answered. Because investigators were not a part of the care team of any study patients, we believe this to be unlikely. Fourth, our study was conducted from October 8, 2013 to August 31, 2015 and the opioid epidemic is dynamic. Accordingly, our data may not reflect current opioid prescribing practices or patients’ current beliefs regarding pain control. Fifth, we did not collect demographic data on the patients who did not participate and could not look for systematic differences between participants and nonparticipants. Sixth, we relied on patients to self-report whether they were taking opioids prior to hospitalization or using illicit drugs. Seventh, we found comorbid mental health conditions to be more frequent in the US population studied. Previous work has shown regional variation in mental health conditions,35,36 which could have affected our findings. To account for this, our models included psychiatric illness.
CONCLUSIONS
Our data suggest that physicians in the US may prescribe opioids more frequently during patients’ hospitalizations and at discharge than their colleagues in other countries. We also found that patient satisfaction, beliefs, and expectations about pain control differed between patients in the US and other sites. Although the small number of hospitals included in our sample coupled with the small sample size in some of the non-US countries limits the generalizability of our findings, the data suggest that reducing the opioid epidemic in the US may require addressing patients’ expectations regarding pain control in addition to providers’ inpatient analgesic prescribing patterns.
Disclosures
The authors report no conflicts of interest.
Funding
The authors report no funding source for this work.
1. Pletcher MJ, Kertesz SG, Kohn MA, Gonzales R. Trends in opioid prescribing by race/ethnicity for patients seeking care in US emergency departments. JAMA. 2008;299(1):70-78. https://doi.org/10.1001/jama.2007.64.
2. Herzig SJ. Growing concerns regarding long-term opioid use: the hospitalization hazard. J Hosp Med. 2015;10(7):469-470. https://doi.org/10.1002/jhm.2369.
3. Guy GP Jr, Zhang K, Bohm MK, et al. Vital Signs: changes in opioid prescribing in the United States, 2006–2015. MMWR Morb Mortal Wkly Rep. 2017;66(26):697-704. https://doi.org/10.15585/mmwr.mm6626a4.
4. Okie S. A flood of opioids, a rising tide of deaths. N Engl J Med. 2010;363(21):1981-1985. https://doi.org/10.1056/NEJMp1011512.
5. Liang Y, Turner BJ. National cohort study of opioid analgesic dose and risk of future hospitalization. J Hosp Med. 2015;10(7):425-431. https://doi.org/10.1002/jhm.2350.
6. Han B, Compton WM, Blanco C, et al. Prescription opioid use, misuse, and use disorders in U.S. Adults: 2015 national survey on drug use and health. Ann Intern Med. 2017;167(5):293-301. https://doi.org/10.7326/M17-0865.
7. Schuchat A, Houry D, Guy GP, Jr. New data on opioid use and prescribing in the United States. JAMA. 2017;318(5):425-426. https://doi.org/10.1001/jama.2017.8913.
8. Sawyer J, Haslam L, Robinson S, Daines P, Stilos K. Pain prevalence study in a large Canadian teaching hospital. Pain Manag Nurs. 2008;9(3):104-112. https://doi.org/10.1016/j.pmn.2008.02.001.
9. Gupta A, Daigle S, Mojica J, Hurley RW. Patient perception of pain care in hospitals in the United States. J Pain Res. 2009;2:157-164. https://doi.org/10.2147/JPR.S7903.
10. Herzig SJ, Rothberg MB, Cheung M, Ngo LH, Marcantonio ER. Opioid utilization and opioid-related adverse events in nonsurgical patients in US hospitals. J Hosp Med. 2014;9(2):73-81. https://doi.org/10.1002/jhm.2102.
11. Kanjanarat P, Winterstein AG, Johns TE, et al. Nature of preventable adverse drug events in hospitals: a literature review. Am J Health Syst Pharm. 2003;60(17):1750-1759. https://doi.org/10.1093/ajhp/60.17.1750.
12. Jena AB, Goldman D, Karaca-Mandic P. Hospital prescribing of opioids to medicare beneficiaries. JAMA Intern Med. 2016;176(7):990-997. https://doi.org/10.1001/jamainternmed.2016.2737.
13. Hooten WM, St Sauver JL, McGree ME, Jacobson DJ, Warner DO. Incidence and risk factors for progression From short-term to episodic or long-term opioid prescribing: A population-based study. Mayo Clin Proc. 2015;90(7):850-856. https://doi.org/10.1016/j.mayocp.2015.04.012.
14. Alam A, Gomes T, Zheng H, et al. Long-term analgesic use after low-risk surgery: a retrospective cohort study. Arch Intern Med. 2012;172(5):425-430. https://doi.org/10.1001/archinternmed.2011.1827.
15. Barnett ML, Olenski AR, Jena AB. Opioid-prescribing patterns of emergency physicians and risk of long-term use. N Engl J Med. 2017;376(7):663-673. https://doi.org/10.1056/NEJMsa1610524.
16. Calcaterra SL, Scarbro S, Hull ML, et al. Prediction of future chronic opioid use Among hospitalized patients. J Gen Intern Med. 2018;33(6):898-905. https://doi.org/10.1007/s11606-018-4335-8.
17. Callister LC. Cultural influences on pain perceptions and behaviors. Home Health Care Manag Pract. 2003;15(3):207-211. https://doi.org/10.1177/1084822302250687.
18. Paulozzi LJ, Mack KA, Hockenberry JM. Vital signs: Variation among states in prescribing of opioid pain relievers and benzodiazepines--United States, 2012. J Saf Res. 2014;63(26):563-568. https://doi.org/10.1016/j.jsr.2014.09.001.
19. Callister LC, Khalaf I, Semenic S, Kartchner R, Vehvilainen-Julkunen K. The pain of childbirth: perceptions of culturally diverse women. Pain Manag Nurs. 2003;4(4):145-154. https://doi.org/10.1016/S1524-9042(03)00028-6.
20. Moore R, Brødsgaard I, Mao TK, Miller ML, Dworkin SF. Perceived need for local anesthesia in tooth drilling among Anglo-Americans, Chinese, and Scandinavians. Anesth Prog. 1998;45(1):22-28.
21. Kankkunen PM, Vehviläinen-Julkunen KM, Pietilä AM, et al. A tale of two countries: comparison of the perceptions of analgesics among Finnish and American parents. Pain Manag Nurs. 2008;9(3):113-119. https://doi.org/10.1016/j.pmn.2007.12.003.
22. Hanoch Y, Katsikopoulos KV, Gummerum M, Brass EP. American and German students’ knowledge, perceptions, and behaviors with respect to over-the-counter pain relievers. Health Psychol. 2007;26(6):802-806. https://doi.org/10.1037/0278-6133.26.6.802.
23. Manjiani D, Paul DB, Kunnumpurath S, Kaye AD, Vadivelu N. Availability and utilization of opioids for pain management: global issues. Ochsner J. 2014;14(2):208-215.
24. Quality improvement guidelines for the treatment of acute pain and cancer pain. JAMA. 1995;274(23):1874-1880.
25. McNeill JA, Sherwood GD, Starck PL, Thompson CJ. Assessing clinical outcomes: patient satisfaction with pain management. J Pain Symptom Manag. 1998;16(1):29-40. https://doi.org/10.1016/S0885-3924(98)00034-7.
26. Ferrari R, Novello C, Catania G, Visentin M. Patients’ satisfaction with pain management: the Italian version of the Patient Outcome Questionnaire of the American Pain Society. Recenti Prog Med. 2010;101(7–8):283-288.
27. Malouf J, Andión O, Torrubia R, Cañellas M, Baños JE. A survey of perceptions with pain management in Spanish inpatients. J Pain Symptom Manag. 2006;32(4):361-371. https://doi.org/10.1016/j.jpainsymman.2006.05.006.
28. Gordon DB, Polomano RC, Pellino TA, et al. Revised American Pain Society Patient Outcome Questionnaire (APS-POQ-R) for quality improvement of pain management in hospitalized adults: preliminary psychometric evaluation. J Pain. 2010;11(11):1172-1186. https://doi.org/10.1016/j.jpain.2010.02.012.
29. Beaton DE, Bombardier C, Guillemin F, Ferraz MB. Guidelines for the process of cross-cultural adaptation of self-report measures. Spine (Phila Pa 1976). 2000;25(24):3186-3191. https://doi.org/10.1097/00007632-200012150-00014.
30. Harris PA, Taylor R, Thielke R, et al. Research Electronic Data Capture (REDCap)--a metadata-driven methodology and workflow process for providing translational research informatics support. J Biomed Inform. 2009;42(2):377-381. https://doi.org/10.1016/j.jbi.2008.08.010.
31. Duman F. After surgery in Germany, I wanted Vicodin, not herbal tea. New York Times. January 27, 2018. https://www.nytimes.com/2018/01/27/opinion/sunday/surgery-germany-vicodin.html. Accessed November 6, 2018.
32. Beaudoin FL, Banerjee GN, Mello MJ. State-level and system-level opioid prescribing policies: the impact on provider practices and overdose deaths, a systematic review. J Opioid Manag. 2016;12(2):109-118. https://doi.org/10.5055/jom.2016.0322. 33. Bao Y, Wen K, Johnson P, et al. Assessing the impact of state policies for prescription drug monitoring programs on high-risk opioid prescriptions. Health Aff (Millwood). 2018;37(10):1596-1604. https://doi.org/10.1377/hlthaff.2018.0512.
34. Friedman J, Kim D, Schneberk T, et al. Assessment of racial/ethnic and income disparities in the prescription of opioids and other controlled medications in California. JAMA Intern Med. 2019. https://doi.org/10.1001/jamainternmed.2018.6721.
35. Steel Z, Marnane C, Iranpour C, et al. The global prevalence of common mental disorders: a systematic review and meta-analysis 1980-2013. Int J Epidemiol. 2014;43(2):476-493. https://doi.org/10.1093/ije/dyu038.
36. Simon GE, Goldberg DP, Von Korff M, Ustün TB. Understanding cross-national differences in depression prevalence. Psychol Med. 2002;32(4):585-594. https://doi.org/10.1017/S0033291702005457.
Since 2000, the United States has seen a marked increase in opioid prescribing1-3 and opioid-related complications, including overdoses, hospitalizations, and deaths.2,4,5 A study from 2015 showed that more than one-third of the US civilian noninstitutionalized population reported receiving an opioid prescription in the prior year, with 12.5% reporting misuse, and, of those, 16.7% reported a prescription use disorder.6 While there has been a slight decrease in opioid prescriptions in the US since 2012, rates of opioid prescribing in 2015 were three times higher than in 1999 and approximately four times higher than in Europe in 2015.3,7
Pain is commonly reported by hospitalized patients,8,9 and opioids are often a mainstay of treatment;9,10 however, treatment with opioids can have a number of adverse outcomes.2,10,11 Short-term exposure to opioids can lead to long-term use,12-16 and patients on opioids are at an increased risk for subsequent hospitalization and longer inpatient lengths of stay.5
Physician prescribing practices for opioids and patient expectations for pain control vary as a function of geographic region and culture,10,12,17,18 and pain is influenced by the cultural context in which it occurs.17,19-22 Treatment of pain may also be affected by limited access to or restrictions on selected medications, as well as by cultural biases.23 Whether these variations in the treatment of pain are reflected in patients’ satisfaction with pain control is uncertain.
We sought to compare the inpatient analgesic prescribing practices and patients’ perceptions of pain control for medical patients in four teaching hospitals in the US and in seven teaching hospitals in seven other countries.
METHODS
Study Design
We utilized a cross-sectional, observational design. The study was approved by the Institutional Review Boards at all participating sites.
Setting
The study was conducted at 11 academic hospitals in eight countries from October 8, 2013 to August 31, 2015. Sites in the US included Denver Health in Denver, Colorado; the University of Colorado Hospital in Aurora, Colorado; Hennepin Healthcare in Minneapolis, Minnesota; and Legacy Health in Portland, Oregon. Sites outside the US included McMaster University in Hamilton, Ontario, Canada; Hospital de la Santa Creu i Sant Pau, Universitat Autonòma de Barcelona in Barcelona, Spain; the University of Study of Milan and the University Ospedale “Luigi Sacco” in Milan, Italy, the National Taiwan University Hospital, in Taipei, Taiwan, the University of Ulsan College of Medicine, Asan Medical Center, in Seoul, Korea, the Imperial College, Chelsea and Westminster Hospital, in London, United Kingdom and Dunedin Hospital, Dunedin, New Zealand.
Inclusion and Exclusion Criteria
We included patients 18-89 years of age (20-89 in Taiwan because patients under 20 years of age in this country are a restricted group with respect to participating in research), admitted to an internal medicine service from the Emergency Department or Urgent Care clinic with an acute illness for a minimum of 24 hours (with time zero defined as the time care was initiated in the Emergency Department or Urgent Care Clinic), who reported pain at some time during the first 24-36 hours of their hospitalization and who provided informed consent. In the US, “admission” included both observation and inpatient status. We limited the patient population to those admitted via emergency departments and urgent care clinics in order to enroll similar patient populations across sites.
Scheduled admissions, patients transferred from an outside facility, patients admitted directly from a clinic, and those receiving care in intensive care units were excluded. We also excluded patients who were incarcerated, pregnant, those who received major surgery within the previous 14 days, those with a known diagnosis of active cancer, and those who were receiving palliative or hospice care. Patients receiving care from an investigator in the study at the time of enrollment were not eligible due to the potential conflict of interest.
Patient Screening
Primary teams were contacted to determine if any patients on their service might meet the criteria for inclusion in the study on preselected study days chosen on the basis of the research team’s availability. Identified patients were then screened to establish if they met the eligibility criteria. Patients were asked directly if they had experienced pain during their preadmission evaluation or during their hospitalization.
Data Collection
All patients were hospitalized at the time they gave consent and when data were collected. Data were collected via interviews with patients, as well as through chart review. We recorded patients’ age, gender, race, admitting diagnosis(es), length of stay, psychiatric illness, illicit drug use, whether they reported receiving opioid analgesics at the time of hospitalization, whether they were prescribed opioids and/or nonopioid analgesics during their hospitalization, the median and maximum doses of opioids prescribed and dispensed, and whether they were discharged on opioids. The question of illicit drug use was asked of all patients with the exception of those hospitalized in South Korea due to potential legal implications.
Opioid prescribing and receipt of opioids was recorded based upon current provider orders and medication administration records, respectively. Perception of and satisfaction with pain control was assessed with the American Pain Society Patient Outcome Questionnaire–Modified (APS-POQ-Modified).24,25 Versions of this survey have been validated in English as well as in other languages and cultures.26-28 Because hospitalization practices could differ across hospitals and in different countries, we compared patients’ severity of illness by using Charlson comorbidity scores. Consent forms and the APS-POQ were translated into each country’s primary language according to established processes.29 The survey was filled out by having site investigators read questions aloud and by use of a large-font visual analog scale to aid patients’ verbal responses.
Data were collected and managed using a secure, web-based application electronic data capture tool (Research Electronic Data Capture [REDCap], Nashville, Tennessee), hosted at Denver Health.30
Study Size
Preliminary data from the internal medicine units at our institution suggested that 40% of patients without cancer received opioid analgesics during their hospitalization. Assuming 90% power to detect an absolute difference in the proportion of inpatient medical patients who are receiving opioid analgesics during their hospital stay of 17%, a two-sided type 1 error rate of 0.05, six hospitals in the US, and nine hospitals from all other countries, we calculated an initial sample size of 150 patients per site. This sample size was considered feasible for enrollment in a busy inpatient clinical setting. Study end points were to either reach the goal number of patients (150 per site) or the predetermined study end date, whichever came first.
Data Analysis
We generated means with standard deviations (SDs) and medians with interquartile ranges (IQRs) for normally and nonnormally distributed continuous variables, respectively, and frequencies for categorical variables. We used linear mixed modeling for the analysis of continuous variables. For binary outcomes, our data were fitted to a generalized linear mixed model with logit as the link function and a binary distribution. For ordinal variables, specifically patient-reported satisfaction with pain control and the opinion statements, the data were fitted to a generalized linear mixed model with a cumulative logit link and a multinomial distribution. Hospital was included as a random effect in all models to account for patients cared for in the same hospital.
Country of origin, dichotomized as US or non-US, was the independent variable of interest for all models. An interaction term for exposure to opioids prior to admission and country was entered into all models to explore whether differences in the effect of country existed for patients who reported taking opioids prior to admission and those who did not.
The models for the frequency with which analgesics were given, doses of opioids given during hospitalization and at discharge, patient-reported pain score, and patient-reported satisfaction with pain control were adjusted for (1) age, (2) gender, (3) Charlson Comorbidity Index, (4) length of stay, (5) history of illicit drug use, (6) history of psychiatric illness, (7) daily dose in morphine milligram equivalents (MME) for opioids prior to admission, (8) average pain score, and (9) hospital. The patient-reported satisfaction with pain control model was also adjusted for whether or not opioids were given to the patient during their hospitalization. P < .05 was considered to indicate significance. All analyses were performed using SAS Enterprise Guide 7.1 (SAS Institute, Inc., Cary, North Carolina). We reported data on medications that were prescribed and dispensed (as opposed to just prescribed and not necessarily given). Opioids prescribed at discharge represented the total possible opioids that could be given based upon the order/prescription (eg, oxycodone 5 mg every 6 hours as needed for pain would be counted as 20 mg/24 hours maximum possible dose followed by conversion to MME).
Missing Data
When there were missing data, a query was sent to sites to verify if the data were retrievable. If retrievable, the data were then entered. Data were missing in 5% and 2% of patients who did or did not report taking an opioid prior to admission, respectively. If a variable was included in a specific statistical test, then subjects with missing data were excluded from that analysis (ie, complete case analysis).
RESULTS
We approached 1,309 eligible patients, of which 981 provided informed consent, for a response rate of 75%; 503 from the US and 478 patients from other countries (Figure). In unadjusted analyses, we found no significant differences between US and non-US patients in age (mean age 51, SD 15 vs 59, SD 19; P = .30), race, ethnicity, or Charlson comorbidity index scores (median 2, IQR 1-3 vs 3, IQR 1-4; P = .45). US patients had shorter lengths of stay (median 3 days, IQR 2-4 vs 6 days, IQR 3-11; P = .04), a more frequent history of illicit drug use (33% vs 6%; P = .003), a higher frequency of psychiatric illness (27% vs 8%; P < .0001), and more were receiving opioid analgesics prior to admission (38% vs 17%; P = .007) than those hospitalized in other countries (Table 1, Appendix 1). The primary admitting diagnoses for all patients in the study are listed in Appendix 2. Opioid prescribing practices across the individual sites are shown in Appendix 3.
Patients Taking Opioids Prior to Admission
After adjusting for relevant covariates, we found that more patients in the US were given opioids during their hospitalization and in higher doses than patients from other countries and more were prescribed opioids at discharge. Fewer patients in the US were dispensed nonopioid analgesics during their hospitalization than patients from other countries, but this difference was not significant (Table 2). Appendix 4 shows the types of nonopioid pain medications prescribed in the US and other countries.
After adjustment for relevant covariates, US patients reported greater pain severity at the time they completed their pain surveys. We found no significant difference in satisfaction with pain control between patients from the US and other countries in the models, regardless of whether we included average pain score or opioid receipt during hospitalization in the model (Table 3).
In unadjusted analyses, compared with patients hospitalized in other countries, more patients in the US stated that they would like a stronger dose of analgesic if they were still in pain, though the difference was nonsignificant, and US patients were more likely to agree with the statement that people become addicted to pain medication easily and less likely to agree with the statement that it is easier to endure pain than deal with the side effects of pain medications (Table 3).
Patients Not Taking Opioids Prior to Admission
After adjusting for relevant covariates, we found no significant difference in the proportion of US patients provided with nonopioid pain medications during their hospitalization compared with patients in other countries, but a greater percentage of US patients were given opioids during their hospitalization and at discharge and in higher doses (Table 2).
After adjusting for relevant covariates, US patients reported greater pain severity at the time they completed their pain surveys and greater pain severity in the 24-36 hours prior to completing the survey than patients from other countries, but we found no difference in patient satisfaction with pain control (Table 3). After we included the average pain score and whether or not opioids were given to the patient during their hospitalization in this model, patients in the US were more likely to report a higher level of satisfaction with pain control than patients in all other countries (P = .001).
In unadjusted analyses, compared with patients hospitalized in other countries, those in the US were less likely to agree with the statement that good patients avoid talking about pain (Table 3).
Patient Satisfaction and Opioid Receipt
Among patients cared for in the US, after controlling for the average pain score, we did not find a significant association between receiving opioids while in the hospital and satisfaction with pain control for patients who either did or did not endorse taking opioids prior to admission (P = .38 and P = .24, respectively). Among patients cared for in all other countries, after controlling for the average pain score, we found a significant association between receiving opioids while in the hospital and a lower level of satisfaction with pain control for patients who reported taking opioids prior to admission (P = .02) but not for patients who did not report taking opioids prior to admission (P = .08).
DISCUSSION
Compared with patients hospitalized in other countries, a greater percentage of those hospitalized in the US were prescribed opioid analgesics both during hospitalization and at the time of discharge, even after adjustment for pain severity. In addition, patients hospitalized in the US reported greater pain severity at the time they completed their pain surveys and in the 24 to 36 hours prior to completing the survey than patients from other countries. In this sample, satisfaction, beliefs, and expectations about pain control differed between patients in the US and other sites. Our study also suggests that opioid receipt did not lead to improved patient satisfaction with pain control.
The frequency with which we observed opioid analgesics being prescribed during hospitalization in US hospitals (79%) was higher than the 51% of patients who received opioids reported by Herzig and colleagues.10 Patients in our study had a higher prevalence of illicit drug abuse and psychiatric illness, and our study only included patients who reported pain at some point during their hospitalization. We also studied prescribing practices through analysis of provider orders and medication administration records at the time the patient was hospitalized.
While we observed that physicians in the US more frequently prescribed opioid analgesics during hospitalizations than physicians working in other countries, we also observed that patients in the US reported higher levels of pain during their hospitalization. After adjusting for a number of variables, including pain severity, however, we still found that opioids were more commonly prescribed during hospitalizations by physicians working in the US sites studied than by physicians in the non-US sites.
Opioid prescribing practices varied across the sites sampled in our study. While the US sites, Taiwan, and Korea tended to be heavier utilizers of opioids during hospitalization, there were notable differences in discharge prescribing of opioids, with the US sites more commonly prescribing opioids and higher MME for patients who did not report taking opioids prior to their hospitalization (Appendix 3). A sensitivity analysis was conducted excluding South Korea from modeling, given that patients there were not asked about illicit opioid use. There were no important changes in the magnitude or direction of the results.
Our study supports previous studies indicating that there are cultural and societal differences when it comes to the experience of pain and the expectations around pain control.17,20-22,31 Much of the focus on reducing opioid utilization has been on provider practices32 and on prescription drug monitoring programs.33 Our findings suggest that another area of focus that may be important in mitigating the opioid epidemic is patient expectations of pain control.
Our study has a number of strengths. First, we included 11 hospitals from eight different countries. Second, we believe this is the first study to assess opioid prescribing and dispensing practices during hospitalization as well as at the time of discharge. Third, patient perceptions of pain control were assessed in conjunction with analgesic prescribing and were assessed during hospitalization. Fourth, we had high response rates for patient participation in our study. Fifth, we found much larger differences in opioid prescribing than anticipated, and thus, while we did not achieve the sample size originally planned for either the number of hospitals or patients enrolled per hospital, we were sufficiently powered. This is likely secondary to the fact that the population we studied was one that specifically reported pain, resulting in the larger differences seen.
Our study also had a number of limitations. First, the prescribing practices in countries other than the US are represented by only one hospital per country and, in some countries, by limited numbers of patients. While we studied four sites in the US, we did not have a site in the Northeast, a region previously shown to have lower prescribing rates.10 Additionally, patient samples for the US sites compared with the sites in other countries varied considerably with respect to ethnicity. While some studies in US patients have shown that opioid prescribing may vary based on race/ethnicity,34 we are uncertain as to how this might impact a study that crosses multiple countries. We also had a low number of patients receiving opioids prior to hospitalization for several of the non-US countries, which reduced the power to detect differences in this subgroup. Previous research has shown that there are wide variations in prescribing practices even within countries;10,12,18 therefore, caution should be taken when generalizing our findings. Second, we assessed analgesic prescribing patterns and pain control during the first 24 to 36 hours of hospitalization and did not consider hospital days beyond this timeframe with the exception of noting what medications were prescribed at discharge. We chose this methodology in an attempt to eliminate as many differences that might exist in the duration of hospitalization across many countries. Third, investigators in the study administered the survey, and respondents may have been affected by social desirability bias in how the survey questions were answered. Because investigators were not a part of the care team of any study patients, we believe this to be unlikely. Fourth, our study was conducted from October 8, 2013 to August 31, 2015 and the opioid epidemic is dynamic. Accordingly, our data may not reflect current opioid prescribing practices or patients’ current beliefs regarding pain control. Fifth, we did not collect demographic data on the patients who did not participate and could not look for systematic differences between participants and nonparticipants. Sixth, we relied on patients to self-report whether they were taking opioids prior to hospitalization or using illicit drugs. Seventh, we found comorbid mental health conditions to be more frequent in the US population studied. Previous work has shown regional variation in mental health conditions,35,36 which could have affected our findings. To account for this, our models included psychiatric illness.
CONCLUSIONS
Our data suggest that physicians in the US may prescribe opioids more frequently during patients’ hospitalizations and at discharge than their colleagues in other countries. We also found that patient satisfaction, beliefs, and expectations about pain control differed between patients in the US and other sites. Although the small number of hospitals included in our sample coupled with the small sample size in some of the non-US countries limits the generalizability of our findings, the data suggest that reducing the opioid epidemic in the US may require addressing patients’ expectations regarding pain control in addition to providers’ inpatient analgesic prescribing patterns.
Disclosures
The authors report no conflicts of interest.
Funding
The authors report no funding source for this work.
1. Pletcher MJ, Kertesz SG, Kohn MA, Gonzales R. Trends in opioid prescribing by race/ethnicity for patients seeking care in US emergency departments. JAMA. 2008;299(1):70-78. https://doi.org/10.1001/jama.2007.64.
2. Herzig SJ. Growing concerns regarding long-term opioid use: the hospitalization hazard. J Hosp Med. 2015;10(7):469-470. https://doi.org/10.1002/jhm.2369.
3. Guy GP Jr, Zhang K, Bohm MK, et al. Vital Signs: changes in opioid prescribing in the United States, 2006–2015. MMWR Morb Mortal Wkly Rep. 2017;66(26):697-704. https://doi.org/10.15585/mmwr.mm6626a4.
4. Okie S. A flood of opioids, a rising tide of deaths. N Engl J Med. 2010;363(21):1981-1985. https://doi.org/10.1056/NEJMp1011512.
5. Liang Y, Turner BJ. National cohort study of opioid analgesic dose and risk of future hospitalization. J Hosp Med. 2015;10(7):425-431. https://doi.org/10.1002/jhm.2350.
6. Han B, Compton WM, Blanco C, et al. Prescription opioid use, misuse, and use disorders in U.S. Adults: 2015 national survey on drug use and health. Ann Intern Med. 2017;167(5):293-301. https://doi.org/10.7326/M17-0865.
7. Schuchat A, Houry D, Guy GP, Jr. New data on opioid use and prescribing in the United States. JAMA. 2017;318(5):425-426. https://doi.org/10.1001/jama.2017.8913.
8. Sawyer J, Haslam L, Robinson S, Daines P, Stilos K. Pain prevalence study in a large Canadian teaching hospital. Pain Manag Nurs. 2008;9(3):104-112. https://doi.org/10.1016/j.pmn.2008.02.001.
9. Gupta A, Daigle S, Mojica J, Hurley RW. Patient perception of pain care in hospitals in the United States. J Pain Res. 2009;2:157-164. https://doi.org/10.2147/JPR.S7903.
10. Herzig SJ, Rothberg MB, Cheung M, Ngo LH, Marcantonio ER. Opioid utilization and opioid-related adverse events in nonsurgical patients in US hospitals. J Hosp Med. 2014;9(2):73-81. https://doi.org/10.1002/jhm.2102.
11. Kanjanarat P, Winterstein AG, Johns TE, et al. Nature of preventable adverse drug events in hospitals: a literature review. Am J Health Syst Pharm. 2003;60(17):1750-1759. https://doi.org/10.1093/ajhp/60.17.1750.
12. Jena AB, Goldman D, Karaca-Mandic P. Hospital prescribing of opioids to medicare beneficiaries. JAMA Intern Med. 2016;176(7):990-997. https://doi.org/10.1001/jamainternmed.2016.2737.
13. Hooten WM, St Sauver JL, McGree ME, Jacobson DJ, Warner DO. Incidence and risk factors for progression From short-term to episodic or long-term opioid prescribing: A population-based study. Mayo Clin Proc. 2015;90(7):850-856. https://doi.org/10.1016/j.mayocp.2015.04.012.
14. Alam A, Gomes T, Zheng H, et al. Long-term analgesic use after low-risk surgery: a retrospective cohort study. Arch Intern Med. 2012;172(5):425-430. https://doi.org/10.1001/archinternmed.2011.1827.
15. Barnett ML, Olenski AR, Jena AB. Opioid-prescribing patterns of emergency physicians and risk of long-term use. N Engl J Med. 2017;376(7):663-673. https://doi.org/10.1056/NEJMsa1610524.
16. Calcaterra SL, Scarbro S, Hull ML, et al. Prediction of future chronic opioid use Among hospitalized patients. J Gen Intern Med. 2018;33(6):898-905. https://doi.org/10.1007/s11606-018-4335-8.
17. Callister LC. Cultural influences on pain perceptions and behaviors. Home Health Care Manag Pract. 2003;15(3):207-211. https://doi.org/10.1177/1084822302250687.
18. Paulozzi LJ, Mack KA, Hockenberry JM. Vital signs: Variation among states in prescribing of opioid pain relievers and benzodiazepines--United States, 2012. J Saf Res. 2014;63(26):563-568. https://doi.org/10.1016/j.jsr.2014.09.001.
19. Callister LC, Khalaf I, Semenic S, Kartchner R, Vehvilainen-Julkunen K. The pain of childbirth: perceptions of culturally diverse women. Pain Manag Nurs. 2003;4(4):145-154. https://doi.org/10.1016/S1524-9042(03)00028-6.
20. Moore R, Brødsgaard I, Mao TK, Miller ML, Dworkin SF. Perceived need for local anesthesia in tooth drilling among Anglo-Americans, Chinese, and Scandinavians. Anesth Prog. 1998;45(1):22-28.
21. Kankkunen PM, Vehviläinen-Julkunen KM, Pietilä AM, et al. A tale of two countries: comparison of the perceptions of analgesics among Finnish and American parents. Pain Manag Nurs. 2008;9(3):113-119. https://doi.org/10.1016/j.pmn.2007.12.003.
22. Hanoch Y, Katsikopoulos KV, Gummerum M, Brass EP. American and German students’ knowledge, perceptions, and behaviors with respect to over-the-counter pain relievers. Health Psychol. 2007;26(6):802-806. https://doi.org/10.1037/0278-6133.26.6.802.
23. Manjiani D, Paul DB, Kunnumpurath S, Kaye AD, Vadivelu N. Availability and utilization of opioids for pain management: global issues. Ochsner J. 2014;14(2):208-215.
24. Quality improvement guidelines for the treatment of acute pain and cancer pain. JAMA. 1995;274(23):1874-1880.
25. McNeill JA, Sherwood GD, Starck PL, Thompson CJ. Assessing clinical outcomes: patient satisfaction with pain management. J Pain Symptom Manag. 1998;16(1):29-40. https://doi.org/10.1016/S0885-3924(98)00034-7.
26. Ferrari R, Novello C, Catania G, Visentin M. Patients’ satisfaction with pain management: the Italian version of the Patient Outcome Questionnaire of the American Pain Society. Recenti Prog Med. 2010;101(7–8):283-288.
27. Malouf J, Andión O, Torrubia R, Cañellas M, Baños JE. A survey of perceptions with pain management in Spanish inpatients. J Pain Symptom Manag. 2006;32(4):361-371. https://doi.org/10.1016/j.jpainsymman.2006.05.006.
28. Gordon DB, Polomano RC, Pellino TA, et al. Revised American Pain Society Patient Outcome Questionnaire (APS-POQ-R) for quality improvement of pain management in hospitalized adults: preliminary psychometric evaluation. J Pain. 2010;11(11):1172-1186. https://doi.org/10.1016/j.jpain.2010.02.012.
29. Beaton DE, Bombardier C, Guillemin F, Ferraz MB. Guidelines for the process of cross-cultural adaptation of self-report measures. Spine (Phila Pa 1976). 2000;25(24):3186-3191. https://doi.org/10.1097/00007632-200012150-00014.
30. Harris PA, Taylor R, Thielke R, et al. Research Electronic Data Capture (REDCap)--a metadata-driven methodology and workflow process for providing translational research informatics support. J Biomed Inform. 2009;42(2):377-381. https://doi.org/10.1016/j.jbi.2008.08.010.
31. Duman F. After surgery in Germany, I wanted Vicodin, not herbal tea. New York Times. January 27, 2018. https://www.nytimes.com/2018/01/27/opinion/sunday/surgery-germany-vicodin.html. Accessed November 6, 2018.
32. Beaudoin FL, Banerjee GN, Mello MJ. State-level and system-level opioid prescribing policies: the impact on provider practices and overdose deaths, a systematic review. J Opioid Manag. 2016;12(2):109-118. https://doi.org/10.5055/jom.2016.0322.33. Bao Y, Wen K, Johnson P, et al. Assessing the impact of state policies for prescription drug monitoring programs on high-risk opioid prescriptions. Health Aff (Millwood). 2018;37(10):1596-1604. https://doi.org/10.1377/hlthaff.2018.0512.
34. Friedman J, Kim D, Schneberk T, et al. Assessment of racial/ethnic and income disparities in the prescription of opioids and other controlled medications in California. JAMA Intern Med. 2019. https://doi.org/10.1001/jamainternmed.2018.6721.
35. Steel Z, Marnane C, Iranpour C, et al. The global prevalence of common mental disorders: a systematic review and meta-analysis 1980-2013. Int J Epidemiol. 2014;43(2):476-493. https://doi.org/10.1093/ije/dyu038.
36. Simon GE, Goldberg DP, Von Korff M, Ustün TB. Understanding cross-national differences in depression prevalence. Psychol Med. 2002;32(4):585-594. https://doi.org/10.1017/S0033291702005457.
© 2019 Society of Hospital Medicine
Improving the Transition of Intravenous to Enteral Antibiotics in Pediatric Patients with Pneumonia or Skin and Soft Tissue Infections
Intravenous (IV) antibiotics are commonly used in hospitalized pediatric patients to treat bacterial infections. Antimicrobial stewardship guidelines published by the Infectious Diseases Society of America (IDSA) recommend institutions develop a systematic plan to convert from IV to enteral antibiotics, as early transition may reduce healthcare costs, decrease length of stay (LOS), and avoid prolonged IV access complications1 such as extravasation, thrombosis, and catheter-associated infections.2-5
Pediatric patients with community-acquired pneumonia (CAP) and mild skin and soft tissue infections (SSTI) may not require IV antibiotics, even if the patient is hospitalized.6 Although national guidelines for pediatric CAP and SSTI recommend IV antibiotics for hospitalized patients, these guidelines state that mild infections may be treated with enteral antibiotics and emphasize discontinuation of IV antibiotics when the patient meets discharge criteria.7,8 Furthermore, several enteral antibiotics used for the treatment of CAP and SSTI, such as cephalexin and clindamycin,9 have excellent bioavailability (>90%) or can achieve sufficient concentrations to attain the pharmacodynamic target (ie, amoxicillin and trimethoprim–sulfamethoxazole).10,11 Nonetheless, the guidelines do not explicitly outline criteria regarding the transition from IV to enteral antibiotics.7,8
At our institution, patients admitted to Hospital Medicine (HM) often remained on IV antibiotics until discharge. Data review revealed that antibiotic treatment of CAP and SSTI posed the greatest opportunity for early conversion to enteral therapy based on the high frequency of admissions and the ability of commonly used enteral antibiotics to attain pharmacodynamic targets. We sought to change practice culture by decoupling transition to enteral antibiotics from discharge and use administration of other enteral medications as an objective indicator for transition. Our aim was to increase the proportion of enterally administered antibiotic doses for HM patients aged >60 days admitted with uncomplicated CAP or SSTI from 44% to 75% in eight months.
METHODS
Context
Cincinnati Children’s Hospital Medical Center (CCHMC) is a large, urban, academic hospital. The HM division has 45 attendings and admits >8,000 general pediatric patients annually. The five HM teams at the main campus consist of attendings, fellows, residents, and medical students. One HM team serves as the resident quality improvement (QI) team where residents collaborate in a longitudinal study under the guidance of QI-trained coaches. The focus of this QI initiative was determined by resident consensus and aligned with a high-value care curriculum.12
To identify the target patient population, we investigated IV antimicrobials frequently used in HM patients. Ampicillin and clindamycin are commonly used IV antibiotics, most frequently corresponding with the diagnoses of CAP and SSTI, respectively, accounting for half of all antibiotic use on the HM service. Amoxicillin, the enteral equivalent of ampicillin, can achieve sufficient concentrations to attain the pharmacodynamic target at infection sites, and clindamycin has high bioavailability, making them ideal options for early transition. Our institution’s robust antimicrobial stewardship program has published local guidelines on using amoxicillin as the enteral antibiotic of choice for uncomplicated CAP, but it does not provide guidance on the timing of transition for either CAP or SSTI; the clinical team makes this decision.
HM attendings were surveyed to determine the criteria used to transition from IV to enteral antibiotics for patients with CAP or SSTI. The survey illustrated practice variability with providers using differing clinical criteria to signal the timing of transition. Additionally, only 49% of respondents (n = 37) rated themselves as “very comfortable” with residents making autonomous decisions to transition to enteral antibiotics. We chose to use the administration of other enteral medications, instead of discharge readiness, as an objective indicator of a patient’s readiness to transition to enteral antibiotics, given the low-risk patient population and the ability of the enteral antibiotics commonly used for CAP and SSTI to achieve pharmacodynamic targets.
The study population included patients aged >60 days admitted to HM with CAP or SSTI treated with any antibiotic. We excluded patients with potential complications or significant progression of their disease process, including patients with parapneumonic effusions or chest tubes, patients who underwent bronchoscopy, and patients with osteomyelitis, septic arthritis, or preseptal or orbital cellulitis. Past medical history and clinical status on admission were not used to exclude patients.
Interventions
Our multidisciplinary team, formed in January 2017, included HM attendings, HM fellows, pediatric residents, a critical care attending, a pharmacy resident, and an antimicrobial stewardship pharmacist. Under the guidance of QI coaches, the residents on the HM QI team developed and tested all interventions on their team and then determined which interventions would spread to the other four teams. The nursing director of our primary HM unit disseminated project updates to bedside nurses. A simplified failure mode and effects analysis identified areas for improvement and potential interventions. Interventions focused on the following key drivers (Figure 1): increased prescriber awareness of medication charge, standardization of conversion from IV to enteral antibiotics, clear definition of the patients ready for transition, ongoing evaluation of the antimicrobial plan, timely recognition by prescribers of patients ready for transition, culture shift regarding the appropriate administration route in the inpatient setting, and transparency of data. The team implemented sequential Plan-Do-Study-Act (PDSA) cycles13 to test the interventions.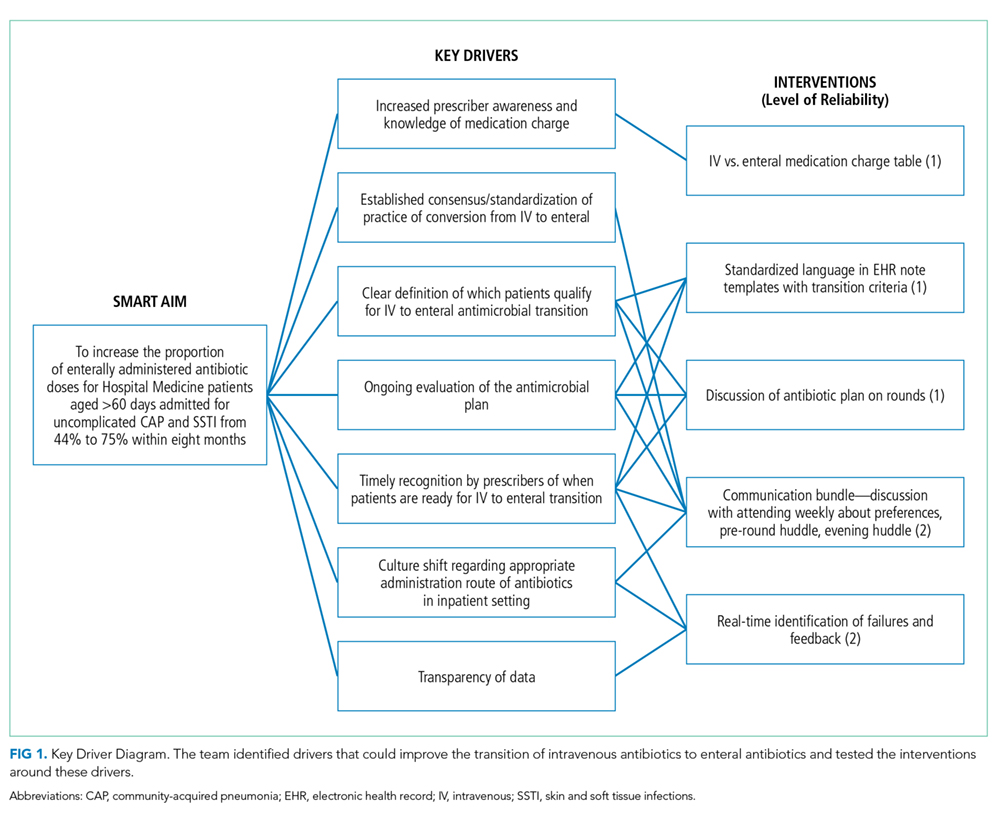
Charge Table
To improve knowledge about the increased charge for commonly used IV medications compared with enteral formulations, a table comparing relative charges was shared during monthly resident morning conferences and at an HM faculty meeting. The table included charge comparisons between ampicillin and amoxicillin and IV and enteral clindamycin.
Standardized Language in Electronic Health Record (EHR) Antibiotic Plan on Rounds
Standardized language to document antibiotic transition plans was added to admission and progress note templates in the EHR. The standard template prompted residents to (1) define clinical transition criteria, (2) discuss attending comfort with transition overnight (based on survey results), and (3) document patient preference of solid or liquid dosage forms. Plans were reviewed and updated daily. We hypothesized that since residents use the information in the daily progress notes, including assessments and plans, to present on rounds, inclusion of the transition criteria in the note would prompt transition plan discussions.
Communication Bundle
To promote early transition to enteral antibiotics, we standardized the discussion about antibiotic transition between residents and attendings. During a weekly preexisting meeting, the resident QI team reviewed preferences for transitions with the new service attending. By identifying attending preferences early, residents were able to proactively transition patients who met the criteria (eg, antibiotic transition in the evening instead of waiting until morning rounds). This discussion also provided an opportunity to engage service attendings in the QI efforts, which were also shared at HM faculty meetings quarterly.
Recognizing that in times of high census, discussion of patient plans may be abbreviated during rounds, residents were asked to identify all patients on IV antibiotics while reviewing patient medication orders prior to rounds. As part of an existing daily prerounds huddle to discuss rounding logistics, residents listed all patients on IV antibiotics and discussed which patients were ready for transition. If patients could not be transitioned immediately, the team identified the transition criteria.
At preexisting evening huddles between overnight shift HM residents and the evening HM attending, residents identified patients who were prescribed IV antibiotics and discussed readiness for enteral transition. If a patient could be transitioned overnight, enteral antibiotic orders were placed. Overnight residents were also encouraged to review the transition criteria with families upon admission.
Real-time Identification of Failures and Feedback
For two weeks, the EHR was queried daily to identify patients admitted for uncomplicated CAP and SSTI who were on antibiotics as well as other enteral medications. A failure was defined as an IV antibiotic dose given to a patient who was administered any enteral medication. Residents on the QI team approached residents on other HM teams whenever patients were identified as a failed transition to learn about failure reasons.
Study of the Interventions
Data for HM patients who met the inclusion criteria were collected weekly from January 2016 through June 2018 via EHR query. We initially searched for diagnoses that fit under the disease categories of pneumonia and SSTI in the EHR, which generated a list of International Classification of Disease-9 and -10 Diagnosis codes (Appendix Figure 1). The query identified patients based on these codes and reported whether the identified patients took a dose of any enteral medication, excluding nystatin, sildenafil, tacrolimus, and mouthwashes, which are commonly continued during NPO status due to no need for absorption or limited parenteral options. It also reported the ordered route of administration for the queried antibiotics (Appendix Figure 1).
The 2016 calendar year established our baseline to account for seasonal variability. Data were reported weekly and reviewed to evaluate the impact of PDSA cycles and inform new interventions.
Measures
Our process measure was the total number of enteral antibiotic doses divided by all antibiotic doses in patients receiving any enteral medication. We reasoned that if patients were well enough to take medications enterally, they could be given an enteral antibiotic that is highly bioavailable or readily achieves concentrations that attain pharmacodynamic targets. This practice change was a culture shift, decoupling the switch to enteral antibiotics from discharge readiness. Our EHR query reported only the antibiotic doses given to patients who took an enteral medication on the day of antibiotic administration and excluded patients who received only IV medications.
Outcome measures included antimicrobial costs per patient encounter using average wholesale prices, which were reported in our EHR query, and LOS. To ensure that transitions of IV to enteral antibiotics were not negatively impacting patient outcomes, patient readmissions within seven days served as a balancing measure.
Analysis
An annotated statistical process control p-chart tracked the impact of interventions on the proportion of antibiotic doses that were enterally administered during hospitalization. An x-bar and an s-chart tracked the impact of interventions on antimicrobial costs per patient encounter and on LOS. A p-chart and an encounters-between g-chart were used to evaluate the impact of our interventions on readmissions. Control chart rules for identifying special cause were used for center line shifts.14
Ethical Considerations
This study was part of a larger study of the residency high-value care curriculum,12 which was deemed exempt by the CCHMC IRB.
RESULTS
The baseline data collected included 372 patients and the postintervention period in 2017 included 326 patients (Table). Approximately two-thirds of patients had a diagnosis of CAP.
The percentage of antibiotic doses given enterally increased from 44% to 80% within eight months (Figure 2). When studying the impact of interventions, residents on the HM QI team found that the standard EHR template added to daily notes did not consistently prompt residents to discuss antibiotic plans and thus was abandoned. Initial improvement coincided with standardizing discussions between residents and attendings regarding transitions. Furthermore, discussion of all patients on IV antibiotics during the prerounds huddle allowed for reliable, daily communication about antibiotic plans and was subsequently spread to and adopted by all HM teams. The percentage of enterally administered antibiotic doses increased to >75% after the evening huddle, which involved all HM teams, and real-time identification of failures on all HM teams with provider feedback. Despite variability when the total number of antibiotic doses prescribed per week was low (<10), we demonstrated sustainability for 11 months (Figure 2), during which the prerounds and evening huddle discussions were continued and an updated control chart was shown monthly to residents during their educational conferences.
Residents on the QI team spoke directly with other HM residents when there were missed opportunities for transition. Based on these discussions and intermittent chart reviews, common reasons for failure to transition in patients with CAP included admission for failed outpatient enteral treatment, recent evaluation by critical care physicians for possible transfer to the intensive care unit, and difficulty weaning oxygen. For patients with SSTI, hand abscesses requiring drainage by surgery and treatment failure with other antibiotics constituted many of the IV antibiotic doses given to patients on enteral medications.
Antimicrobial costs per patient encounter decreased by 70% over one year; the shift in costs coincided with the second shift in our process measure (Appendix Figure 2A). Based on an estimate of 350 patients admitted per year for uncomplicated CAP or SSTI, this translates to an annual cost savings of approximately $29,000. The standard deviation of costs per patient encounter decreased by 84% (Appendix Figure 2B), suggesting a decrease in the variability of prescribing practices.
The average LOS in our patient population prior to intervention was 2.1 days and did not change (Appendix Figure 2C), but the standard deviation decreased by >50% (Appendix Figure 2D). There was no shift in the mean seven-day readmission rate or the number of encounters between readmissions (2.6% and 26, respectively; Appendix Figure 3). In addition, the hospital billing department did not identify an increase in insurance denials related to the route of antibiotic administration.
DISCUSSION
Summary
Using improvement science, we promoted earlier transition to enteral antibiotics for children hospitalized with uncomplicated CAP and SSTI by linking the decision for transition to the ability to take other enteral medications, rather than to discharge readiness. We increased the percentage of enterally administered antibiotic doses in this patient population from 44% to 80% in eight months. Although we did not observe a decrease in LOS as previously noted in a cost analysis study comparing pediatric patients with CAP treated with oral antibiotics versus those treated with IV antibiotics,15 we did find a decrease in LOS variability and in antimicrobial costs to our patients. These cost savings did not include potential savings from nursing or pharmacy labor. In addition, we noted a decrease in the variability in antibiotic prescribing practice, which demonstrates provider ability and willingness to couple antibiotic route transition to an objective characteristic (administration of other enteral medications).
A strength of our study was that residents, the most frequent prescribers of antibiotics on our HM service, were highly involved in the QI initiative, including defining the SMART aim, identifying key drivers, developing interventions, and completing sequential PDSA cycles. Under the guidance of QI-trained coaches, residents developed feasible interventions and assessed their success in real time. Consistent with other studies,16,17 resident buy-in and involvement led to the success of our improvement study.
Interpretation
Despite emerging evidence regarding the timing of transition to enteral antibiotics, several factors impeded early transition at our institution, including physician culture, variable practice habits, and hospital workflow. Evidence supports the use of enteral antibiotics in immunocompetent children hospitalized for uncomplicated CAP who do not have chronic lung disease, are not in shock, and have oxygen saturations >85%.6 Although existing literature suggests that in pediatric patients admitted for SSTIs not involving the eye or bone, IV antibiotics may be transitioned when clinical improvement, evidenced by a reduction in fever or erythema, is noted,6 enteral antibiotics that achieve appropriate concentrations to attain pharmacodynamic targets should have the same efficacy as that of IV antibiotics.9 Using the criterion of administration of any medication enterally to identify a patient’s readiness to transition, we were able to overcome practice variation among providers who may have differing opinions of what constitutes clinical improvement. Of note, new evidence is emerging on predictors of enteral antibiotic treatment failure in patients with CAP and SSTI to guide transition timing, but these studies have largely focused on the adult population or were performed in the outpatient and emergency department (ED) settings.18,19 Regardless, the stable number of encounters between readmissions in our patient population likely indicates that treatment failure in these patients was rare.
Rising healthcare costs have led to concerns around sustainability of the healthcare system;20,21 tackling overuse in clinical practice, as in our study, is one mitigation strategy. Several studies have used QI methods to facilitate the provision of high-value care through the decrease of continuous monitor overuse and extraneous ordering of electrolytes.22,23 Our QI study adds to the high-value care literature by safely decreasing the use of IV antibiotics. One retrospective study demonstrated that a one-day decrease in the use of IV antibiotics in pneumonia resulted in decreased costs without an increase in readmissions, similar to our findings.24 In adults, QI initiatives aimed at improving early transition of antibiotics utilized electronic trigger tools.25,26 Fischer et al. used active orders for scheduled enteral medications or an enteral diet as indication that a patient’s IV medications could be converted to enteral form.26
Our work is not without limitations. The list of ICD-9 and -10 codes used to query the EHR did not capture all diagnoses that would be considered as uncomplicated CAP or SSTI. However, we included an extensive list of diagnoses to ensure that the majority of patients meeting our inclusion criteria were captured. Our process measure did not account for patients on IV antibiotics who were not administered other enteral medications but tolerating an enteral diet. These patients were not identified in our EHR query and were not included in our process measure as a failure. However, in latter interventions, residents identified all patients on IV antibiotics, so that patients not identified by our EHR query benefited from our work. Furthermore, this QI study was conducted at a single institution and several interventions took advantage of preexisting structured huddles and a resident QI curriculum, which may not exist at other institutions. Our study does highlight that engaging frontline providers, such as residents, to review antibiotic orders consistently and question the appropriateness of the administration route is key to making incremental changes in prescribing practices.
CONCLUSIONS
Through a partnership between HM and Pharmacy and with substantial resident involvement, we improved the transition of IV antibiotics in patients with CAP or SSTI by increasing the percentage of enterally administered antibiotic doses and reducing antimicrobial costs and variability in antibiotic prescribing practices. This work illustrates how reducing overuse of IV antibiotics promotes high-value care and aligns with initiatives to prevent avoidable harm.27 Our work highlights that standardized discussions about medication orders to create consensus around enteral antibiotic transitions, real-time feedback, and challenging the status quo can influence practice habits and effect change.
Next steps include testing automated methods to notify providers of opportunities for transition from IV to enteral antibiotics through embedded clinical decision support, a method similar to the electronic trigger tools used in adult QI studies.25,26 Since our prerounds huddle includes identifying all patients on IV antibiotics, studying the transition to enteral antibiotics and its effect on prescribing practices in other diagnoses (ie, urinary tract infection and osteomyelitis) may contribute to spreading these efforts. Partnering with our ED colleagues may be an important next step, as several patients admitted to HM on IV antibiotics are given their first dose in the ED.
Acknowledgments
The authors would like to thank the faculty of the James M. Anderson Center for Health Systems Excellence Intermediate Improvement Science Series for their guidance in the planning of this project. The authors would also like to thank Ms. Ursula Bradshaw and Mr. Michael Ponti-Zins for obtaining the hospital data on length of stay and readmissions. The authors acknowledge Dr. Philip Hagedorn for his assistance with the software that queries the electronic health record and Dr. Laura Brower and Dr. Joanna Thomson for their assistance with statistical analysis. The authors are grateful to all the residents and coaches on the QI Hospital Medicine team who contributed ideas on study design and interventions.
1. Dellit TH, Owens RC, McGowan JE, Jr, et al. Infectious diseases society of America and the society for healthcare epidemiology of America guidelines for developing an institutional program to enhance antimicrobial stewardship. Clin Infect Dis. 2007;44(2):159-177. https://doi.org/10.1086/510393.
2. Shah SS, Srivastava R, Wu S, et al. Intravenous Versus oral antibiotics for postdischarge treatment of complicated pneumonia. Pediatrics. 2016;138(6). https://doi.org/10.1542/peds.2016-1692.
3. Keren R, Shah SS, Srivastava R, et al. Comparative effectiveness of intravenous vs oral antibiotics for postdischarge treatment of acute osteomyelitis in children. JAMA Pediatr. 2015;169(2):120-128. https://doi.org/10.1001/jamapediatrics.2014.2822.
4. Jumani K, Advani S, Reich NG, Gosey L, Milstone AM. Risk factors for peripherally inserted central venous catheter complications in children. JAMA Pediatr. 2013;167(5):429-435.https://doi.org/10.1001/jamapediatrics.2013.775.
5. Zaoutis T, Localio AR, Leckerman K, et al. Prolonged intravenous therapy versus early transition to oral antimicrobial therapy for acute osteomyelitis in children. Pediatrics. 2009;123(2):636-642. https://doi.org/10.1542/peds.2008-0596.
6. McMullan BJ, Andresen D, Blyth CC, et al. Antibiotic duration and timing of the switch from intravenous to oral route for bacterial infections in children: systematic review and guidelines. Lancet Infect Dis. 2016;16(8):e139-e152. https://doi.org/10.1016/S1473-3099(16)30024-X.
7. Bradley JS, Byington CL, Shah SS, et al. The management of community-acquired pneumonia in infants and children older than 3 months of age: clinical practice guidelines by the Pediatric Infectious Diseases Society and the Infectious Diseases Society of America. Clin Infect Dis. 2011;53(7):e25-e76. https://doi.org/10.1093/cid/cir531.
8. Stevens DL, Bisno AL, Chambers HF, et al. Executive summary: practice guidelines for the diagnosis and management of skin and soft tissue infections: 2014 update by the infectious diseases society of America. Clin Infect Dis. 2014;59(2):147-159. https://doi.org/10.1093/cid/ciu444.
9. MacGregor RR, Graziani AL. Oral administration of antibiotics: a rational alternative to the parenteral route. Clin Infect Dis. 1997;24(3):457-467. https://doi.org/10.1093/clinids/24.3.457.
10. Downes KJ, Hahn A, Wiles J, Courter JD, Vinks AA. Dose optimisation of antibiotics in children: application of pharmacokinetics/pharmacodynamics in paediatrics. Int J Antimicrob Agents. 2014;43(3):223-230. https://doi.org/10.1016/j.ijantimicag.2013.11.006.
11. Autmizguine J, Melloni C, Hornik CP, et al. Population pharmacokinetics of trimethoprim-sulfamethoxazole in infants and children. Antimicrob Agents Chemother. 2018;62(1):e01813-e01817. https://doi.org/10.1128/AAC.01813-17.
12. Dewan M, Herrmann LE, Tchou MJ, et al. Development and evaluation of high-value pediatrics: a high-value care pediatric resident curriculum. Hosp Pediatr. 2018;8(12):785-792. https://doi.org/10.1542/hpeds.2018-0115
13. Langley GJ, Moen RD, Nolan KM, Nolan TW, Norman CL, Provost LP. The Improvement Guide: A Practical Approach to Enhancing Organizational Performance. New Jersey, US: John Wiley & Sons; 2009.
14. Benneyan JC. Use and interpretation of statistical quality control charts. Int J Qual Health Care. 1998;10(1):69-73. https://doi.org/10.1093/intqhc/10.1.69.
15. Lorgelly PK, Atkinson M, Lakhanpaul M, et al. Oral versus i.v. antibiotics for community-acquired pneumonia in children: a cost-minimisation analysis. Eur Respir J. 2010;35(4):858-864. https://doi.org/10.1183/09031936.00087209.
16. Vidyarthi AR, Green AL, Rosenbluth G, Baron RB. Engaging residents and fellows to improve institution-wide quality: the first six years of a novel financial incentive program. Acad Med. 2014;89(3):460-468. https://doi.org/10.1097/ACM.0000000000000159.
17. Stinnett-Donnelly JM, Stevens PG, Hood VL. Developing a high value care programme from the bottom up: a programme of faculty-resident improvement projects targeting harmful or unnecessary care. BMJ Qual Saf. 2016;25(11):901-908. https://doi.org/10.1136/bmjqs-2015-004546.
18. Peterson D, McLeod S, Woolfrey K, McRae A. Predictors of failure of empiric outpatient antibiotic therapy in emergency department patients with uncomplicated cellulitis. Acad Emerg Med. 2014;21(5):526-531. https://doi.org/10.1111/acem.12371.
19. Yadav K, Suh KN, Eagles D, et al. Predictors of oral antibiotic treatment failure for non-purulent skin and soft tissue infections in the emergency department. Acad Emerg Med. 2018;20(S1):S24-S25. https://doi.org/10.1017/cem.2018.114.
20. Organisation for Economic Co-operation and Development. Healthcare costs unsustainable in advanced economies without reform. http://www.oecd.org/health/healthcarecostsunsustainableinadvancedeconomieswithoutreform.htm. Accessed June 28, 2018; 2015.
21. Berwick DM, Hackbarth AD. Eliminating waste in US health care. JAMA. 2012;307(14):1513-1516. https://doi.org/10.1001/jama.2012.362.
22. Schondelmeyer AC, Simmons JM, Statile AM, et al. Using quality improvement to reduce continuous pulse oximetry use in children with wheezing. Pediatrics. 2015;135(4):e1044-e1051. https://doi.org/10.1542/peds.2014-2295.
23. Tchou MJ, Tang Girdwood S, Wormser B, et al. Reducing electrolyte testing in hospitalized children by using quality improvement methods. Pediatrics. 2018;141(5). https://doi.org/10.1542/peds.2017-3187.
24. Christensen EW, Spaulding AB, Pomputius WF, Grapentine SP. Effects of hospital practice patterns for antibiotic administration for pneumonia on hospital lengths of stay and costs. J Pediatr Infect Dis Soc. 2019;8(2):115-121. https://doi.org/10.1093/jpids/piy003.
25. Berrevoets MAH, Pot JHLW, Houterman AE, et al. An electronic trigger tool to optimise intravenous to oral antibiotic switch: a controlled, interrupted time series study. Antimicrob Resist Infect Control. 2017;6:81. https://doi.org/10.1186/s13756-017-0239-3.
26. Fischer MA, Solomon DH, Teich JM, Avorn J. Conversion from intravenous to oral medications: assessment of a computerized intervention for hospitalized patients. Arch Intern Med. 2003;163(21):2585-2589. https://doi.org/10.1001/archinte.163.21.2585.
27. Schroeder AR, Harris SJ, Newman TB. Safely doing less: a missing component of the patient safety dialogue. Pediatrics. 2011;128(6):e1596-e1597. https://doi.org/10.1542/peds.2011-2726.
Intravenous (IV) antibiotics are commonly used in hospitalized pediatric patients to treat bacterial infections. Antimicrobial stewardship guidelines published by the Infectious Diseases Society of America (IDSA) recommend institutions develop a systematic plan to convert from IV to enteral antibiotics, as early transition may reduce healthcare costs, decrease length of stay (LOS), and avoid prolonged IV access complications1 such as extravasation, thrombosis, and catheter-associated infections.2-5
Pediatric patients with community-acquired pneumonia (CAP) and mild skin and soft tissue infections (SSTI) may not require IV antibiotics, even if the patient is hospitalized.6 Although national guidelines for pediatric CAP and SSTI recommend IV antibiotics for hospitalized patients, these guidelines state that mild infections may be treated with enteral antibiotics and emphasize discontinuation of IV antibiotics when the patient meets discharge criteria.7,8 Furthermore, several enteral antibiotics used for the treatment of CAP and SSTI, such as cephalexin and clindamycin,9 have excellent bioavailability (>90%) or can achieve sufficient concentrations to attain the pharmacodynamic target (ie, amoxicillin and trimethoprim–sulfamethoxazole).10,11 Nonetheless, the guidelines do not explicitly outline criteria regarding the transition from IV to enteral antibiotics.7,8
At our institution, patients admitted to Hospital Medicine (HM) often remained on IV antibiotics until discharge. Data review revealed that antibiotic treatment of CAP and SSTI posed the greatest opportunity for early conversion to enteral therapy based on the high frequency of admissions and the ability of commonly used enteral antibiotics to attain pharmacodynamic targets. We sought to change practice culture by decoupling transition to enteral antibiotics from discharge and use administration of other enteral medications as an objective indicator for transition. Our aim was to increase the proportion of enterally administered antibiotic doses for HM patients aged >60 days admitted with uncomplicated CAP or SSTI from 44% to 75% in eight months.
METHODS
Context
Cincinnati Children’s Hospital Medical Center (CCHMC) is a large, urban, academic hospital. The HM division has 45 attendings and admits >8,000 general pediatric patients annually. The five HM teams at the main campus consist of attendings, fellows, residents, and medical students. One HM team serves as the resident quality improvement (QI) team where residents collaborate in a longitudinal study under the guidance of QI-trained coaches. The focus of this QI initiative was determined by resident consensus and aligned with a high-value care curriculum.12
To identify the target patient population, we investigated IV antimicrobials frequently used in HM patients. Ampicillin and clindamycin are commonly used IV antibiotics, most frequently corresponding with the diagnoses of CAP and SSTI, respectively, accounting for half of all antibiotic use on the HM service. Amoxicillin, the enteral equivalent of ampicillin, can achieve sufficient concentrations to attain the pharmacodynamic target at infection sites, and clindamycin has high bioavailability, making them ideal options for early transition. Our institution’s robust antimicrobial stewardship program has published local guidelines on using amoxicillin as the enteral antibiotic of choice for uncomplicated CAP, but it does not provide guidance on the timing of transition for either CAP or SSTI; the clinical team makes this decision.
HM attendings were surveyed to determine the criteria used to transition from IV to enteral antibiotics for patients with CAP or SSTI. The survey illustrated practice variability with providers using differing clinical criteria to signal the timing of transition. Additionally, only 49% of respondents (n = 37) rated themselves as “very comfortable” with residents making autonomous decisions to transition to enteral antibiotics. We chose to use the administration of other enteral medications, instead of discharge readiness, as an objective indicator of a patient’s readiness to transition to enteral antibiotics, given the low-risk patient population and the ability of the enteral antibiotics commonly used for CAP and SSTI to achieve pharmacodynamic targets.
The study population included patients aged >60 days admitted to HM with CAP or SSTI treated with any antibiotic. We excluded patients with potential complications or significant progression of their disease process, including patients with parapneumonic effusions or chest tubes, patients who underwent bronchoscopy, and patients with osteomyelitis, septic arthritis, or preseptal or orbital cellulitis. Past medical history and clinical status on admission were not used to exclude patients.
Interventions
Our multidisciplinary team, formed in January 2017, included HM attendings, HM fellows, pediatric residents, a critical care attending, a pharmacy resident, and an antimicrobial stewardship pharmacist. Under the guidance of QI coaches, the residents on the HM QI team developed and tested all interventions on their team and then determined which interventions would spread to the other four teams. The nursing director of our primary HM unit disseminated project updates to bedside nurses. A simplified failure mode and effects analysis identified areas for improvement and potential interventions. Interventions focused on the following key drivers (Figure 1): increased prescriber awareness of medication charge, standardization of conversion from IV to enteral antibiotics, clear definition of the patients ready for transition, ongoing evaluation of the antimicrobial plan, timely recognition by prescribers of patients ready for transition, culture shift regarding the appropriate administration route in the inpatient setting, and transparency of data. The team implemented sequential Plan-Do-Study-Act (PDSA) cycles13 to test the interventions.
Charge Table
To improve knowledge about the increased charge for commonly used IV medications compared with enteral formulations, a table comparing relative charges was shared during monthly resident morning conferences and at an HM faculty meeting. The table included charge comparisons between ampicillin and amoxicillin and IV and enteral clindamycin.
Standardized Language in Electronic Health Record (EHR) Antibiotic Plan on Rounds
Standardized language to document antibiotic transition plans was added to admission and progress note templates in the EHR. The standard template prompted residents to (1) define clinical transition criteria, (2) discuss attending comfort with transition overnight (based on survey results), and (3) document patient preference of solid or liquid dosage forms. Plans were reviewed and updated daily. We hypothesized that since residents use the information in the daily progress notes, including assessments and plans, to present on rounds, inclusion of the transition criteria in the note would prompt transition plan discussions.
Communication Bundle
To promote early transition to enteral antibiotics, we standardized the discussion about antibiotic transition between residents and attendings. During a weekly preexisting meeting, the resident QI team reviewed preferences for transitions with the new service attending. By identifying attending preferences early, residents were able to proactively transition patients who met the criteria (eg, antibiotic transition in the evening instead of waiting until morning rounds). This discussion also provided an opportunity to engage service attendings in the QI efforts, which were also shared at HM faculty meetings quarterly.
Recognizing that in times of high census, discussion of patient plans may be abbreviated during rounds, residents were asked to identify all patients on IV antibiotics while reviewing patient medication orders prior to rounds. As part of an existing daily prerounds huddle to discuss rounding logistics, residents listed all patients on IV antibiotics and discussed which patients were ready for transition. If patients could not be transitioned immediately, the team identified the transition criteria.
At preexisting evening huddles between overnight shift HM residents and the evening HM attending, residents identified patients who were prescribed IV antibiotics and discussed readiness for enteral transition. If a patient could be transitioned overnight, enteral antibiotic orders were placed. Overnight residents were also encouraged to review the transition criteria with families upon admission.
Real-time Identification of Failures and Feedback
For two weeks, the EHR was queried daily to identify patients admitted for uncomplicated CAP and SSTI who were on antibiotics as well as other enteral medications. A failure was defined as an IV antibiotic dose given to a patient who was administered any enteral medication. Residents on the QI team approached residents on other HM teams whenever patients were identified as a failed transition to learn about failure reasons.
Study of the Interventions
Data for HM patients who met the inclusion criteria were collected weekly from January 2016 through June 2018 via EHR query. We initially searched for diagnoses that fit under the disease categories of pneumonia and SSTI in the EHR, which generated a list of International Classification of Disease-9 and -10 Diagnosis codes (Appendix Figure 1). The query identified patients based on these codes and reported whether the identified patients took a dose of any enteral medication, excluding nystatin, sildenafil, tacrolimus, and mouthwashes, which are commonly continued during NPO status due to no need for absorption or limited parenteral options. It also reported the ordered route of administration for the queried antibiotics (Appendix Figure 1).
The 2016 calendar year established our baseline to account for seasonal variability. Data were reported weekly and reviewed to evaluate the impact of PDSA cycles and inform new interventions.
Measures
Our process measure was the total number of enteral antibiotic doses divided by all antibiotic doses in patients receiving any enteral medication. We reasoned that if patients were well enough to take medications enterally, they could be given an enteral antibiotic that is highly bioavailable or readily achieves concentrations that attain pharmacodynamic targets. This practice change was a culture shift, decoupling the switch to enteral antibiotics from discharge readiness. Our EHR query reported only the antibiotic doses given to patients who took an enteral medication on the day of antibiotic administration and excluded patients who received only IV medications.
Outcome measures included antimicrobial costs per patient encounter using average wholesale prices, which were reported in our EHR query, and LOS. To ensure that transitions of IV to enteral antibiotics were not negatively impacting patient outcomes, patient readmissions within seven days served as a balancing measure.
Analysis
An annotated statistical process control p-chart tracked the impact of interventions on the proportion of antibiotic doses that were enterally administered during hospitalization. An x-bar and an s-chart tracked the impact of interventions on antimicrobial costs per patient encounter and on LOS. A p-chart and an encounters-between g-chart were used to evaluate the impact of our interventions on readmissions. Control chart rules for identifying special cause were used for center line shifts.14
Ethical Considerations
This study was part of a larger study of the residency high-value care curriculum,12 which was deemed exempt by the CCHMC IRB.
RESULTS
The baseline data collected included 372 patients and the postintervention period in 2017 included 326 patients (Table). Approximately two-thirds of patients had a diagnosis of CAP.
The percentage of antibiotic doses given enterally increased from 44% to 80% within eight months (Figure 2). When studying the impact of interventions, residents on the HM QI team found that the standard EHR template added to daily notes did not consistently prompt residents to discuss antibiotic plans and thus was abandoned. Initial improvement coincided with standardizing discussions between residents and attendings regarding transitions. Furthermore, discussion of all patients on IV antibiotics during the prerounds huddle allowed for reliable, daily communication about antibiotic plans and was subsequently spread to and adopted by all HM teams. The percentage of enterally administered antibiotic doses increased to >75% after the evening huddle, which involved all HM teams, and real-time identification of failures on all HM teams with provider feedback. Despite variability when the total number of antibiotic doses prescribed per week was low (<10), we demonstrated sustainability for 11 months (Figure 2), during which the prerounds and evening huddle discussions were continued and an updated control chart was shown monthly to residents during their educational conferences.
Residents on the QI team spoke directly with other HM residents when there were missed opportunities for transition. Based on these discussions and intermittent chart reviews, common reasons for failure to transition in patients with CAP included admission for failed outpatient enteral treatment, recent evaluation by critical care physicians for possible transfer to the intensive care unit, and difficulty weaning oxygen. For patients with SSTI, hand abscesses requiring drainage by surgery and treatment failure with other antibiotics constituted many of the IV antibiotic doses given to patients on enteral medications.
Antimicrobial costs per patient encounter decreased by 70% over one year; the shift in costs coincided with the second shift in our process measure (Appendix Figure 2A). Based on an estimate of 350 patients admitted per year for uncomplicated CAP or SSTI, this translates to an annual cost savings of approximately $29,000. The standard deviation of costs per patient encounter decreased by 84% (Appendix Figure 2B), suggesting a decrease in the variability of prescribing practices.
The average LOS in our patient population prior to intervention was 2.1 days and did not change (Appendix Figure 2C), but the standard deviation decreased by >50% (Appendix Figure 2D). There was no shift in the mean seven-day readmission rate or the number of encounters between readmissions (2.6% and 26, respectively; Appendix Figure 3). In addition, the hospital billing department did not identify an increase in insurance denials related to the route of antibiotic administration.
DISCUSSION
Summary
Using improvement science, we promoted earlier transition to enteral antibiotics for children hospitalized with uncomplicated CAP and SSTI by linking the decision for transition to the ability to take other enteral medications, rather than to discharge readiness. We increased the percentage of enterally administered antibiotic doses in this patient population from 44% to 80% in eight months. Although we did not observe a decrease in LOS as previously noted in a cost analysis study comparing pediatric patients with CAP treated with oral antibiotics versus those treated with IV antibiotics,15 we did find a decrease in LOS variability and in antimicrobial costs to our patients. These cost savings did not include potential savings from nursing or pharmacy labor. In addition, we noted a decrease in the variability in antibiotic prescribing practice, which demonstrates provider ability and willingness to couple antibiotic route transition to an objective characteristic (administration of other enteral medications).
A strength of our study was that residents, the most frequent prescribers of antibiotics on our HM service, were highly involved in the QI initiative, including defining the SMART aim, identifying key drivers, developing interventions, and completing sequential PDSA cycles. Under the guidance of QI-trained coaches, residents developed feasible interventions and assessed their success in real time. Consistent with other studies,16,17 resident buy-in and involvement led to the success of our improvement study.
Interpretation
Despite emerging evidence regarding the timing of transition to enteral antibiotics, several factors impeded early transition at our institution, including physician culture, variable practice habits, and hospital workflow. Evidence supports the use of enteral antibiotics in immunocompetent children hospitalized for uncomplicated CAP who do not have chronic lung disease, are not in shock, and have oxygen saturations >85%.6 Although existing literature suggests that in pediatric patients admitted for SSTIs not involving the eye or bone, IV antibiotics may be transitioned when clinical improvement, evidenced by a reduction in fever or erythema, is noted,6 enteral antibiotics that achieve appropriate concentrations to attain pharmacodynamic targets should have the same efficacy as that of IV antibiotics.9 Using the criterion of administration of any medication enterally to identify a patient’s readiness to transition, we were able to overcome practice variation among providers who may have differing opinions of what constitutes clinical improvement. Of note, new evidence is emerging on predictors of enteral antibiotic treatment failure in patients with CAP and SSTI to guide transition timing, but these studies have largely focused on the adult population or were performed in the outpatient and emergency department (ED) settings.18,19 Regardless, the stable number of encounters between readmissions in our patient population likely indicates that treatment failure in these patients was rare.
Rising healthcare costs have led to concerns around sustainability of the healthcare system;20,21 tackling overuse in clinical practice, as in our study, is one mitigation strategy. Several studies have used QI methods to facilitate the provision of high-value care through the decrease of continuous monitor overuse and extraneous ordering of electrolytes.22,23 Our QI study adds to the high-value care literature by safely decreasing the use of IV antibiotics. One retrospective study demonstrated that a one-day decrease in the use of IV antibiotics in pneumonia resulted in decreased costs without an increase in readmissions, similar to our findings.24 In adults, QI initiatives aimed at improving early transition of antibiotics utilized electronic trigger tools.25,26 Fischer et al. used active orders for scheduled enteral medications or an enteral diet as indication that a patient’s IV medications could be converted to enteral form.26
Our work is not without limitations. The list of ICD-9 and -10 codes used to query the EHR did not capture all diagnoses that would be considered as uncomplicated CAP or SSTI. However, we included an extensive list of diagnoses to ensure that the majority of patients meeting our inclusion criteria were captured. Our process measure did not account for patients on IV antibiotics who were not administered other enteral medications but tolerating an enteral diet. These patients were not identified in our EHR query and were not included in our process measure as a failure. However, in latter interventions, residents identified all patients on IV antibiotics, so that patients not identified by our EHR query benefited from our work. Furthermore, this QI study was conducted at a single institution and several interventions took advantage of preexisting structured huddles and a resident QI curriculum, which may not exist at other institutions. Our study does highlight that engaging frontline providers, such as residents, to review antibiotic orders consistently and question the appropriateness of the administration route is key to making incremental changes in prescribing practices.
CONCLUSIONS
Through a partnership between HM and Pharmacy and with substantial resident involvement, we improved the transition of IV antibiotics in patients with CAP or SSTI by increasing the percentage of enterally administered antibiotic doses and reducing antimicrobial costs and variability in antibiotic prescribing practices. This work illustrates how reducing overuse of IV antibiotics promotes high-value care and aligns with initiatives to prevent avoidable harm.27 Our work highlights that standardized discussions about medication orders to create consensus around enteral antibiotic transitions, real-time feedback, and challenging the status quo can influence practice habits and effect change.
Next steps include testing automated methods to notify providers of opportunities for transition from IV to enteral antibiotics through embedded clinical decision support, a method similar to the electronic trigger tools used in adult QI studies.25,26 Since our prerounds huddle includes identifying all patients on IV antibiotics, studying the transition to enteral antibiotics and its effect on prescribing practices in other diagnoses (ie, urinary tract infection and osteomyelitis) may contribute to spreading these efforts. Partnering with our ED colleagues may be an important next step, as several patients admitted to HM on IV antibiotics are given their first dose in the ED.
Acknowledgments
The authors would like to thank the faculty of the James M. Anderson Center for Health Systems Excellence Intermediate Improvement Science Series for their guidance in the planning of this project. The authors would also like to thank Ms. Ursula Bradshaw and Mr. Michael Ponti-Zins for obtaining the hospital data on length of stay and readmissions. The authors acknowledge Dr. Philip Hagedorn for his assistance with the software that queries the electronic health record and Dr. Laura Brower and Dr. Joanna Thomson for their assistance with statistical analysis. The authors are grateful to all the residents and coaches on the QI Hospital Medicine team who contributed ideas on study design and interventions.
1. Dellit TH, Owens RC, McGowan JE, Jr, et al. Infectious diseases society of America and the society for healthcare epidemiology of America guidelines for developing an institutional program to enhance antimicrobial stewardship. Clin Infect Dis. 2007;44(2):159-177. https://doi.org/10.1086/510393.
2. Shah SS, Srivastava R, Wu S, et al. Intravenous Versus oral antibiotics for postdischarge treatment of complicated pneumonia. Pediatrics. 2016;138(6). https://doi.org/10.1542/peds.2016-1692.
3. Keren R, Shah SS, Srivastava R, et al. Comparative effectiveness of intravenous vs oral antibiotics for postdischarge treatment of acute osteomyelitis in children. JAMA Pediatr. 2015;169(2):120-128. https://doi.org/10.1001/jamapediatrics.2014.2822.
4. Jumani K, Advani S, Reich NG, Gosey L, Milstone AM. Risk factors for peripherally inserted central venous catheter complications in children. JAMA Pediatr. 2013;167(5):429-435.https://doi.org/10.1001/jamapediatrics.2013.775.
5. Zaoutis T, Localio AR, Leckerman K, et al. Prolonged intravenous therapy versus early transition to oral antimicrobial therapy for acute osteomyelitis in children. Pediatrics. 2009;123(2):636-642. https://doi.org/10.1542/peds.2008-0596.
6. McMullan BJ, Andresen D, Blyth CC, et al. Antibiotic duration and timing of the switch from intravenous to oral route for bacterial infections in children: systematic review and guidelines. Lancet Infect Dis. 2016;16(8):e139-e152. https://doi.org/10.1016/S1473-3099(16)30024-X.
7. Bradley JS, Byington CL, Shah SS, et al. The management of community-acquired pneumonia in infants and children older than 3 months of age: clinical practice guidelines by the Pediatric Infectious Diseases Society and the Infectious Diseases Society of America. Clin Infect Dis. 2011;53(7):e25-e76. https://doi.org/10.1093/cid/cir531.
8. Stevens DL, Bisno AL, Chambers HF, et al. Executive summary: practice guidelines for the diagnosis and management of skin and soft tissue infections: 2014 update by the infectious diseases society of America. Clin Infect Dis. 2014;59(2):147-159. https://doi.org/10.1093/cid/ciu444.
9. MacGregor RR, Graziani AL. Oral administration of antibiotics: a rational alternative to the parenteral route. Clin Infect Dis. 1997;24(3):457-467. https://doi.org/10.1093/clinids/24.3.457.
10. Downes KJ, Hahn A, Wiles J, Courter JD, Vinks AA. Dose optimisation of antibiotics in children: application of pharmacokinetics/pharmacodynamics in paediatrics. Int J Antimicrob Agents. 2014;43(3):223-230. https://doi.org/10.1016/j.ijantimicag.2013.11.006.
11. Autmizguine J, Melloni C, Hornik CP, et al. Population pharmacokinetics of trimethoprim-sulfamethoxazole in infants and children. Antimicrob Agents Chemother. 2018;62(1):e01813-e01817. https://doi.org/10.1128/AAC.01813-17.
12. Dewan M, Herrmann LE, Tchou MJ, et al. Development and evaluation of high-value pediatrics: a high-value care pediatric resident curriculum. Hosp Pediatr. 2018;8(12):785-792. https://doi.org/10.1542/hpeds.2018-0115
13. Langley GJ, Moen RD, Nolan KM, Nolan TW, Norman CL, Provost LP. The Improvement Guide: A Practical Approach to Enhancing Organizational Performance. New Jersey, US: John Wiley & Sons; 2009.
14. Benneyan JC. Use and interpretation of statistical quality control charts. Int J Qual Health Care. 1998;10(1):69-73. https://doi.org/10.1093/intqhc/10.1.69.
15. Lorgelly PK, Atkinson M, Lakhanpaul M, et al. Oral versus i.v. antibiotics for community-acquired pneumonia in children: a cost-minimisation analysis. Eur Respir J. 2010;35(4):858-864. https://doi.org/10.1183/09031936.00087209.
16. Vidyarthi AR, Green AL, Rosenbluth G, Baron RB. Engaging residents and fellows to improve institution-wide quality: the first six years of a novel financial incentive program. Acad Med. 2014;89(3):460-468. https://doi.org/10.1097/ACM.0000000000000159.
17. Stinnett-Donnelly JM, Stevens PG, Hood VL. Developing a high value care programme from the bottom up: a programme of faculty-resident improvement projects targeting harmful or unnecessary care. BMJ Qual Saf. 2016;25(11):901-908. https://doi.org/10.1136/bmjqs-2015-004546.
18. Peterson D, McLeod S, Woolfrey K, McRae A. Predictors of failure of empiric outpatient antibiotic therapy in emergency department patients with uncomplicated cellulitis. Acad Emerg Med. 2014;21(5):526-531. https://doi.org/10.1111/acem.12371.
19. Yadav K, Suh KN, Eagles D, et al. Predictors of oral antibiotic treatment failure for non-purulent skin and soft tissue infections in the emergency department. Acad Emerg Med. 2018;20(S1):S24-S25. https://doi.org/10.1017/cem.2018.114.
20. Organisation for Economic Co-operation and Development. Healthcare costs unsustainable in advanced economies without reform. http://www.oecd.org/health/healthcarecostsunsustainableinadvancedeconomieswithoutreform.htm. Accessed June 28, 2018; 2015.
21. Berwick DM, Hackbarth AD. Eliminating waste in US health care. JAMA. 2012;307(14):1513-1516. https://doi.org/10.1001/jama.2012.362.
22. Schondelmeyer AC, Simmons JM, Statile AM, et al. Using quality improvement to reduce continuous pulse oximetry use in children with wheezing. Pediatrics. 2015;135(4):e1044-e1051. https://doi.org/10.1542/peds.2014-2295.
23. Tchou MJ, Tang Girdwood S, Wormser B, et al. Reducing electrolyte testing in hospitalized children by using quality improvement methods. Pediatrics. 2018;141(5). https://doi.org/10.1542/peds.2017-3187.
24. Christensen EW, Spaulding AB, Pomputius WF, Grapentine SP. Effects of hospital practice patterns for antibiotic administration for pneumonia on hospital lengths of stay and costs. J Pediatr Infect Dis Soc. 2019;8(2):115-121. https://doi.org/10.1093/jpids/piy003.
25. Berrevoets MAH, Pot JHLW, Houterman AE, et al. An electronic trigger tool to optimise intravenous to oral antibiotic switch: a controlled, interrupted time series study. Antimicrob Resist Infect Control. 2017;6:81. https://doi.org/10.1186/s13756-017-0239-3.
26. Fischer MA, Solomon DH, Teich JM, Avorn J. Conversion from intravenous to oral medications: assessment of a computerized intervention for hospitalized patients. Arch Intern Med. 2003;163(21):2585-2589. https://doi.org/10.1001/archinte.163.21.2585.
27. Schroeder AR, Harris SJ, Newman TB. Safely doing less: a missing component of the patient safety dialogue. Pediatrics. 2011;128(6):e1596-e1597. https://doi.org/10.1542/peds.2011-2726.
© 2019 Society of Hospital Medicine
Examining the “Repletion Reflex”: The Association between Serum Potassium and Outcomes in Hospitalized Patients with Heart Failure
Heart failure (HF) is a leading cause of hospital admission and mortality, accounting for approximately 900,000 discharges in 2014.1 One-year all-cause mortality risk has been estimated at 17% after hospitalization,2 and roughly 50% of deaths are related to sudden cardiac death, mostly due to ventricular arrhythmia.
The principles underlying potassium management in acute HF are complex. Both low and high values have been linked to fatal arrhythmias, notably ventricular fibrillation, and small serum changes often reflect large total body potassium fluctuations.11 Recent literature links hypokalemia to general membrane hypoexcitability, skeletal muscle hyporeflexia, and arrhythmias initiated by reduced sodium-potassium adenosine triphosphatase activity, leading to increased intracellular calcium and regional variations in action potential duration.12 Potassium abnormalities are common at admission and may be exacerbated by both acute illness and treatments given during hospitalization, including baseline potassium, acute kidney injury, aggressive diuretic therapy, or other potassium-related treatments and conditions.13 The success of potassium repletion may also be affected by the choice of HF therapies.14
The belief that patients with HF must maintain a potassium >4.0 mEq/L remains pervasive, with at least one family medicine guideline recommending that patients with HF maintain a serum potassium level >4.0 mEq/L.
METHODS
Data Sources and Cohort Definition
The Institutional Review Board at Baystate Medical Center approved this study. We identified patients with HF who were admitted for more than 72 hours between January 2010 and December 2012 to hospitals contributing to the HealthFacts database, a multihospital dataset derived from the comprehensive electronic health records of 116 geographically and structurally diverse hospitals throughout the United States (Cerner Corp.). HealthFacts—which includes date-stamped pharmacy, laboratory, and billing information—contains records of more than 84 million acute admissions, emergency room visits, and ambulatory visits. We limited the sample to hospitals that contributed to the pharmacy, laboratory, and diagnosis segments.
We included patients who had a principal International Classification of Disease (ICD-9-CM) diagnosis of HF or a principal diagnosis of respiratory failure with secondary diagnosis of HF (ICD-9-CM codes for HF: 402.01, 402.11, 402.91, 404.01, 404.03, 404.11, 404.13, 404.91, 404.93, 428.xx16 and for respiratory failure: 518.81, 518.82, 518.84) and were 18 years or older. We ensured that patients were treated for acute decompensated HF during the hospitalization by restricting the cohort to patients in whom at least one HF therapy (eg, loop diuretics, metolazone, inotropes, and intra-aortic balloon pump) was initiated within the first two days of hospitalization. We excluded patients with a pediatric or psychiatric attending physician, those with elective admissions, and those who were transferred from or to another acute care facility because we could not accurately determine the onset or subsequent course of their illness.
Definition of Variables Describing Serum Potassium Levels
We limited the sample to patients hospitalized for longer than 72 hours in order to observe how initial potassium values influenced outcomes over the course of hospitalization. We chose an exposure window of 72 hours because this allowed, on average, three potential observations of serum potassium per patient. We further restricted the sample to those who had a normal potassium value (3.5-5.0 mEq/L) at admission (defined as 24 hours prior to admission through midnight of the day of admission) to ensure that the included patients did not have abnormal potassium values upon presentation. We identified the period of time from 24 hours prior to admission through 72 hours following admission as “the exposure window” (the time during which patients were eligible to be classified into average serum potassium levels of <4.0, 4.0-4.5, or >4.5 mEq/L). We excluded patients who, during this window, had fewer than three serum potassium levels drawn (“exposure” levels could be disproportionately influenced by a single value) or received sodium polystyrene (as this would indicate that the physicians felt the potassium was dangerously high). For patients with repeated hospitalizations, we randomly selected one visit for inclusion to reduce the risk of survivor bias. We calculated the mean of all serum potassium levels during the exposure window, including the admission value, and then evaluated two different categorizations of mean serum potassium, based on categories of risk previously reported in the literature:8,17,18: (1) <4.0, 4.0-4.5, or >4.5 mEq/L and (2) <4.0 versus ≥4.0 mEq/L.
Outcomes
We assessed three outcomes: in-hospital mortality, transfer to an intensive care unit (ICU), and length of stay (LOS). Admission to the ICU was defined as any evidence, after the exposure window, that the patient received care in the ICU. We excluded patients with ICU admissions during the exposure window from the analysis of this outcome. We calculated LOS as the difference between discharge date/time and the admission date/time.
Covariates and Comorbidity Adjustment
We obtained information on patient demographics (age and race) and identified the presence of comorbid conditions using previously derived and validated models.19,20 We then further quantified these conditions into a single combined score to adjust for differences in presenting illness severity (including kidney disease) and help reduce confounding.21 To account for presenting severity of illness, we calculated the Laboratory-based Acute Physiology Score (LAPS-2).22,23 LAPS-2 was developed for predicting mortality risk in general medical patients, but we previously externally validated it against other published clinical HF models in a cohort of patients hospitalized with acute decompensated HF.5
Potassium Repletion
Analysis
We evaluated the differences in patient characteristics across serum potassium categories. Categorical variables are presented as frequencies and percentages, whereas continuous variables are presented as means and standard deviations. For binary outcomes, we used generalized estimating equations (with a binomial family and logit link and clustering by hospital) to estimate incidence and calculate unadjusted and adjusted odds ratios (ORs) and 95% confidence intervals (CIs). For LOS, we estimated the median and 95% CIs using quantile regression with clustered standard errors.24 We calculated all models using both a binary exposure (<4.0 versus ≥4.0 mEq/L) and a three-level categorization (<4.0, 4.0-4.5, and >4.5 mEq/L) to explore the effects at the highest potassium level. We adjusted all models for age, race, LAPS-2 score, and combined comorbidity score. We conducted two sensitivity analyses. First, we restricted our sample to those who never received potassium during the exposure window, as these patients may be different than patients who required potassium repletion. Second, we stratified our findings by the presence or absence of acute or chronic renal insufficiency (defined as an admission creatinine >1 or the presence of a diagnostic code for renal insufficiency, as defined by Elixhauser et al.).19,21 Statistical significance was set at an alpha of 0.05. Analysis was completed using Stata v15.1, StataCorp LP, College Station, Texas.
RESULTS
Cohort Description
We identified patients from 56 geographically diverse US hospitals, although most were located in either the northeast (n = 21; 38%) or south (n = 18; 32%). A total of 59% of the hospitals were teaching hospitals, and nearly 95% were in an urban setting. We identified 13,163 patients with HF, of which 4,995 (38.0%) met the inclusion criteria. We excluded 3,744 (28.4%) patients with LOS < 72 hours, 2,210 (16.8%) with admission potassium values outside of the defined range, and 896 (6.8%) with fewer than three potassium values during the exposure window. Of the patients who met the inclusion criteria, 2,080 (41.6%), 2,326 (46.6%), and 589 (11.8%) were categorized in the <4.0, 4.0-4.5, and >4.5 mEq/L groups, respectively (Table 1). The groups were clinically similar in terms of age, sex, illness severity (LAPS-2), and comorbidity score. Compared with other racial groups, black patients had higher potassium values. While the <4.0 and 4.0-4.5 mEq/L groups were relatively similar, the group with mean potassium >4.5 mEq/L had higher admission creatinine and a greater prevalence of chronic kidney disease, deficiency anemias, and chronic obstructive pulmonary disease (Table 1).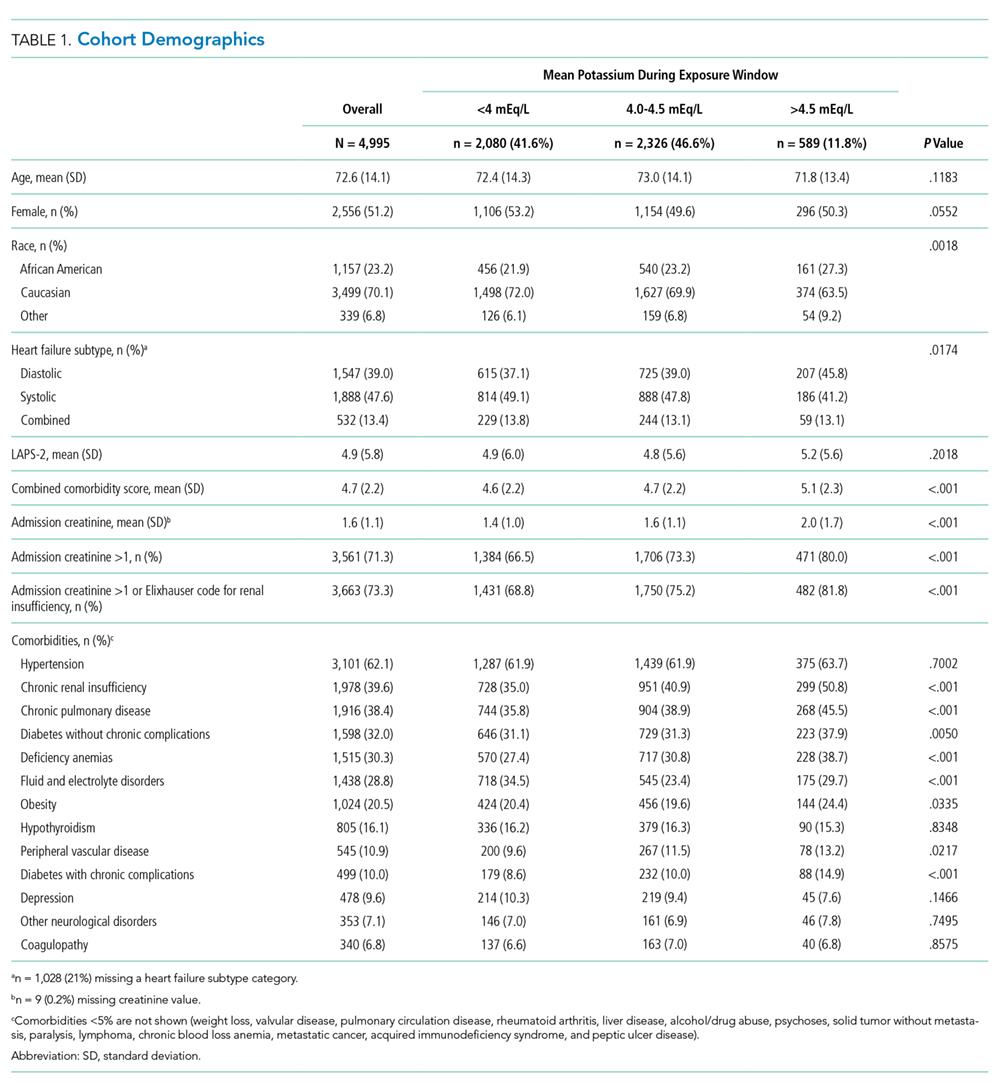
Serum Potassium Values
Individuals’ mean serum potassium within the 72-hour exposure window ranged from 2.9 to 5.8 mEq/L (Table 2). In the <4.0, 4-4.5, and >4.5 mEq/L cohorts respectively, patients had a median serum potassium of 3.8 mEq/L (2.9-3.9), 4.2 mEq/L (4.0-4.5), and 4.7 mEq/L (4.5-5.8) during the exposure window. Approximately half of the patients in the <4.0 mEq/L group had a serum potassium <3.5 mEq/L at some point during the exposure window. In contrast, <10% of the other groups had this low value during the exposure window.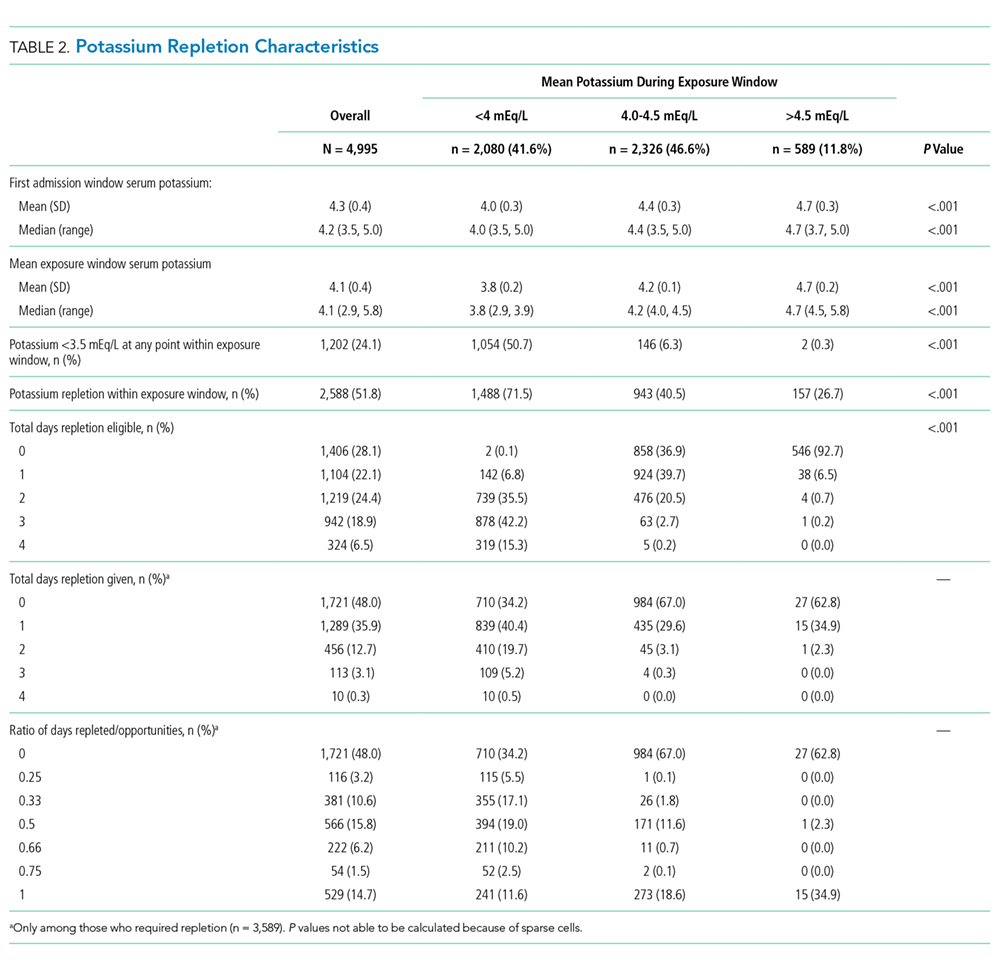
Potassium Repletion
Patients in the <4.0 mEq/L group were much more likely to receive potassium repletion during the exposure window when compared with the 4.0-4.5 mEq/L (71.5% vs 40.5%) and >4.5 mEq/L (71.5% vs 26.7%) groups. On days that they were eligible for repletion (defined as a daily potassium value <4.0 mEq/L), patients with mean serum potassium >4.0 mEq/L were less likely to receive potassium repletion compared with those with values <4.0 mEq/L. There were 592 (28.5%), 1,383 (59.5%), and 432 (73.3%) patients in the <4.0, 4-4.5, and >4,5 mEq/L groups, respectively, who did not receive potassium repletion therapy during the exposure window.
Relationship of Serum Potassium Levels and Outcomes
Overall, 3.7% (n = 187) of patients died during the hospitalization, 2.4% (n = 98) were admitted to the ICU after the exposure window, and the median LOS was 5.6 days. We did not observe a significant association between mean serum potassium of <4.0 or 4.0-4.5 mEq/L and increased risk of mortality, ICU transfer, or LOS (Table 3). Our unadjusted analysis showed that patients with values >4.5 mEq/L had worse outcomes, including more deaths (5.3%; OR = 1.55; 95% CI: 1.01 to 2.39) and ICU admission (3.8%; OR = 2.10; 95% CI: 1.16 to 3.80) compared with those with values <4.0 mEq/L (Table 3). We also found that, compared with the <4.0 mEq/L group, the >4.5 mEq/L group showed just over a half-day longer LOS (0.6 days; 95% CI: 0.0 to 1.0; Table 3). However, we found that mortality and ICU admission results were attenuated after adjustment for age, race, comorbidity score, and LAPS-2 and were no longer statistically significant, whereas the association with LOS was consistent after adjustment. When using a binary exposure (<4.0 versus ≥4.0 mEq/L), we observed no association between mean potassium value and increased risk of mortality, ICU transfer, or LOS both before and after adjustment for age, race, LAPS-2, and comorbidity score (data not shown).
Sensitivity Analyses
In the sensitivity analysis restricted to those who did not receive potassium repletion during the exposure window, we continued to observe no association between the <4.0 and 4.0-4.5 mEq/L groups and outcomes (Table 3). In adjusted models for the >4.5 versus <4.0 mEq/L groups, risk estimates for mortality were similar to the full sample, but statistical significance was lost (OR = 1.56; 95% CI: 0.81 to 3.01). Adjusted risk estimates for ICU transfer were attenuated and not statistically significant (OR = 1.40; 95% CI: 0.60 to 3.26). However, LOS estimates were very similar to that observed in the full dataset (0.6 days; 95% CI: 0.1 to 1.2).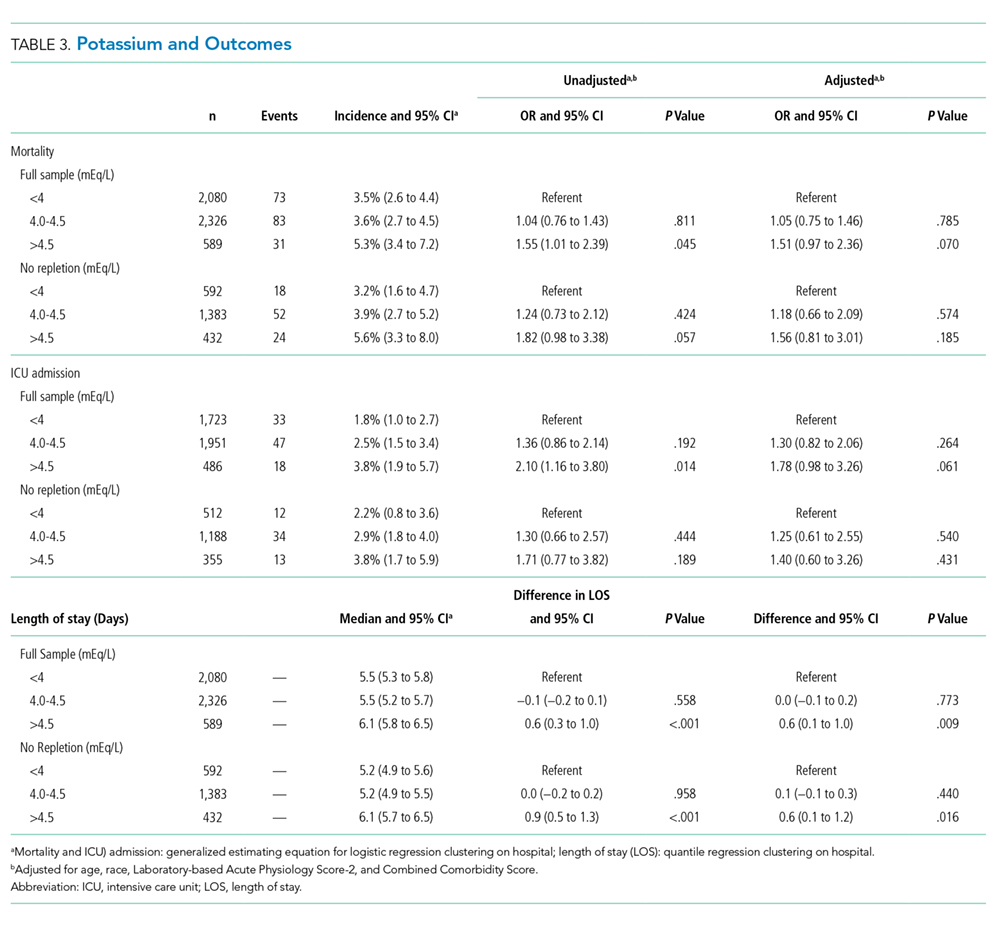
When stratifying our results by the presence or absence of acute or chronic renal insufficiency, we continued to observe no increased risk of any outcome in the 4.0-4.5 mEq/L compared with the <4.0 mEq/L groups across all strata (Table 4). Interestingly, even after adjustment, we did find that most of the increased risk of mortality and ICU admission in the >4.5 versus <4.0 mEq/L groups was among those without renal insufficiency (mortality OR = 3.03; ICU admission OR = 3.00) and was not statistically significant in those with renal insufficiency (mortality OR = 1.27; ICU admission OR = 1.63). Adjusted LOS estimates remained relatively similar in this stratified analysis.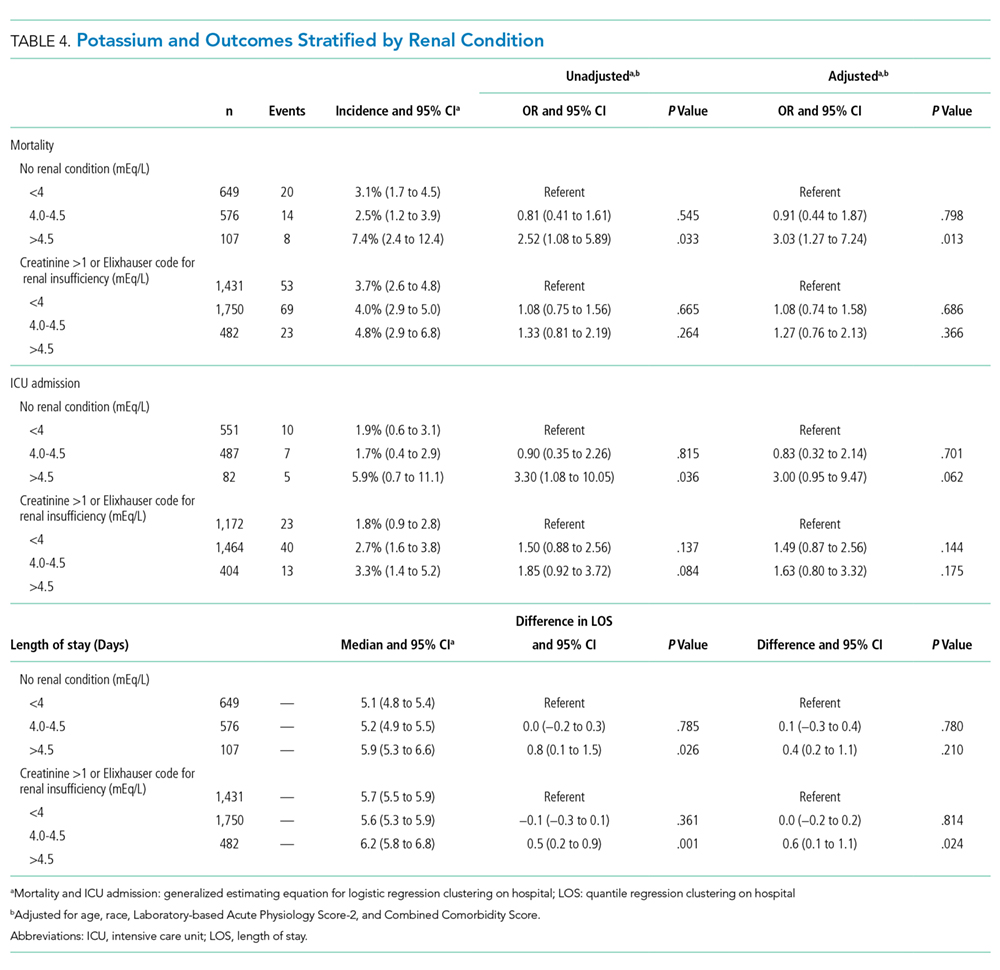
DISCUSSION
The best approach to mild serum potassium value abnormalities in patients hospitalized with HF remains unclear. Many physicians reflexively replete potassium to ensure all patients maintain a serum value of >4.0 mEq/L.15 Yet, in this large observational study of patients hospitalized with an acute HF exacerbation, we found little evidence of association between serum potassium <4.0 mEq/L and negative outcomes.
Compared with those with mean potassium values <4.0 mEq/L (in unadjusted models), there was an association between potassium values of >4.5 mEq/L and increased risk of mortality and ICU transfer. This association was attenuated after adjustment, suggesting that factors beyond potassium values influenced the observed relationship. These findings seem to suggest that unobserved differences in the >4.5 mEq/L group (there were observed differences in this group, eg, greater presenting severity and higher comorbidity scores, suggesting that there were also unobserved differences), and not average potassium value, were the reasons for the observed differences in outcomes. However, we cannot rule out the possibility that potassium >4.5 mEq/L has some associated increased risk compared with mean potassium values of <4.0 mEq/L for patients hospitalized with acute decompensated HF.
Patients in our study routinely received exogenous potassium: more than 70% of patients received repletion at least once, although it is notable that the majority of patients in the 4.0-4.5 and >4.5 mEq/L groups did not receive repletion. Despite this practice, the data supporting this approach to potassium management for patients hospitalized with HF remain mixed. A serum potassium decline of >15% during an acute HF hospital stay has been reported as a predictor of all-cause mortality after controlling for disease severity and associated comorbidities, including renal function.25 However, this study was focused on decline in admission potassium rather than an absolute cut-off (eg, >4.0 mEq/L). Additionally, potassium levels <3.9 mEq/L were associated with increased mortality in patients with acute HF following a myocardial infarction, but this study was not focused on patients with HF.26 Most of the prior literature in patients with HF was conducted in patients in outpatient settings and examined patients who were not experiencing acute exacerbations. MacDonald and Struthers advocate that patients with HF have their potassium maintained above 4.0 mEq/L but did not specify whether this included patients with acute HF exacerbations.10 Additionally, many studies evaluating potassium repletion were conducted before widespread availability of angiotensin-converting enzyme (ACE) inhibitors or potassium-sparing diuretics, including spironolactone. Prior work has consistently reported that hyperkalemia, defined as serum potassium >4.5 mEq/L, is associated with mortality in patients with acute HF over the course of hospitalization (which aligned with the results from our sensitivity analysis), but concurrent medication regimens and underlying impaired renal function likely accounted for most of this association.17 The picture is further complicated as patients with acute HF presenting with hypokalemia may be at risk for subsequent hyperkalemia, and potassium repletion can stimulate aldosterone secretion, potentially exacerbating underlying HF.27,28
These data are observational and are unlikely to change practice. However, daily potassium repletion represents a huge cost in time, money, and effort to the health system. Furthermore, the greatest burden occurs for the patients, who have labs drawn and values checked routinely and potassium administered orally or parenterally. While future randomized clinical trials (RCTs) would best examine the benefits of repletion, future pragmatic trials could attempt to disentangle the associated risks and benefits of potassium repletion in the absence of RCTs. Additionally, such studies could better take into account the role of concurrent medication use (like ACEs or angiotensin II receptor blockers), as well as assess the role of chronic renal insufficiency, acute kidney injury, and magnesium levels.29
This study has limitations. Its retrospective design leads to unmeasured confounding; however, we adjusted for multiple variables (including LAPS-2), which reflect the severity of disease at admission and underlying kidney function at presentation, as well as other comorbid conditions. In addition, data from the cohort only extend to 2012, so more recent changes in practice may not be completely reflected. The nature of the data did not allow us to directly investigate the relationship between serum potassium and arrhythmias, although ICU transfer and mortality were used as surrogates.
In conclusion, the benefit of a serum potassium level >4.0 mEq/L in patients admitted with HF remains unclear. We did not observe that mean potassium values <4.0 mEq/L were associated with worse outcomes, and, more concerning, there may be some risk for patients with mean values >4.5 mEq/L.
Acknowledgments
Dr. Lagu had full access to all the data in the study and takes responsibility for the integrity of the data and the accuracy of the data analysis.
Disclosures
The authors report no potential conflicts of interest. Dr. Lagu has served as a consultant for the Yale Center for Outcomes Research and Evaluation, under contract to the Centers for Medicare and Medicaid Services, for which she has provided clinical and methodological expertise and input on the development, reevaluation, and implementation of hospital outcome and efficiency measures.
Funding
Dr. Lagu is supported by the National Heart, Lung, and Blood Institute of the National Institutes of Health under Award Number K01HL114745 and R01 HL139985-01A1. Dr. Stefan is supported by the National Heart, Lung, and Blood Institute of the National Institutes of Health under Award Number K01HL114631-01A1. Dr. Pack is supported by NHLBI 1K23HL135440. Dr. Lindenauer is supported by the National Heart, Lung, and Blood Institute of the National Institutes of Health under Award Number 1K24HL132008.
Disclaimer
The views expressed in this manuscript do not necessarily reflect those of the Yale Center for Outcomes Research and Evaluation or the Centers for Medicare and Medicaid Services.
1. Benjamin EJ, Virani SS, Callaway CW, et al. Heart disease and stroke statistics–2018 update: a report from the American Heart Association. Circulation. 2018;137(12):e67-e492. https://doi.org/10.1161/CIR.0000000000000558.
2. Maggioni AP, Dahlström U, Filippatos G, et al. EURObservational Research Programme: regional differences and 1-year follow-up results of the Heart Failure Pilot Survey (ESC-HF Pilot). Eur J Heart Fail. 2013;15(7):808-817. https://doi.org/10.1093/eurjhf/hft050.
3. Tomaselli GF, Zipes DP. What causes sudden death in heart failure? Circ Res. 2004;95(8):754-763. https://doi.org/10.1161/01.RES.0000145047.
4. Bowen GS, Diop MS, Jiang L, Wu W-C, Rudolph JL. A multivariable prediction model for mortality in individuals admitted for heart failure. J Am Geriatr Soc. 2018;66(5):902-908. https://doi.org/10.1111/jgs.15319.
5. Lagu T, Pekow PS, Shieh M-S, et al. Validation and comparison of seven mortality prediction models for hospitalized patients with acute decompensated heart failure. Circ Heart Fail. 2016;9(8). https://doi.org/10.1161/CIRCHEARTFAILURE.115.002912.
6. Núñez J, Bayés-Genís A, Zannad F, et al. Long-term potassium monitoring and dynamics in heart failure and risk of mortality. Circulation. 2018;137(13):1320-1330. https://doi.org/10.1161/CIRCULATIONAHA.117.030576.
7. Vardeny O, Claggett B, Anand I, et al. Incidence, predictors, and outcomes related to hypo- and hyperkalemia in patients with severe heart failure treated with a mineralocorticoid receptor antagonist. Circ Heart Fail. 2014;7(4):573-579. https://doi.org/10.1161/CIRCHEARTFAILURE.114.00110.
8. Aldahl M, Jensen A-SC, Davidsen L, et al. Associations of serum potassium levels with mortality in chronic heart failure patients. Eur Heart J. 2017;38(38):2890-2896. https://doi.org/10.1093/eurheartj/ehx460.
9. Hoppe LK, Muhlack DC, Koenig W, Carr PR, Brenner H, Schöttker B. Association of abnormal serum potassium levels with arrhythmias and cardiovascular mortality: a systematic review and meta-analysis of observational studies. Cardiovasc Drugs Ther. 2018;32(2):197-212. https://doi.org/10.1007/s10557-018-6783-0.
10. Macdonald JE, Struthers AD. What is the optimal serum potassium level in cardiovascular patients? J Am Coll Cardiol. 2004;43(2):155-161. https://doi.org/10.1016/j.jacc.2003.06.021.
11. Hulting J. In-hospital ventricular fibrillation and its relation to serum potassium. Acta Med Scand Suppl. 1981;647(647):109-116. https://doi.org/10.1111/j.0954-6820.1981.tb02646.x.
12. Skogestad J, Aronsen JM. Hypokalemia-induced arrhythmias and heart failure: new insights and implications for therapy. Front Physiol. 2018;9:1500. https://doi.org/10.3389/fphys.2018.01500.
13. Tromp J, Ter Maaten JM, Damman K, et al. Serum potassium levels and outcome in acute heart failure (data from the PROTECT and COACH trials). Am J Cardiol. 2017;119(2):290-296. https://doi.org/10.1016/j.amjcard.2016.09.038.
14. Khan SS, Campia U, Chioncel O, et al. Changes in serum potassium levels during hospitalization in patients with worsening heart failure and reduced ejection fraction (from the EVEREST trial). Am J Cardiol. 2015;115(6):790-796. https://doi.org/10.1016/j.amjcard.2014.12.045
15. Viera AJ, Wouk N. Potassium disorders: hypokalemia and hyperkalemia. Am Fam Physician. 2015;92(6):487-495.
16. Krumholz HM, Wang Y, Mattera JA, et al. An administrative claims model suitable for profiling hospital performance based on 30-day mortality rates among patients with heart failure. Circulation. 2006;113(13):1693-1701. https://doi.org/10.1161/CIRCULATIONAHA.105.611194.
17. Legrand M, Ludes P-O, Massy Z, et al. Association between hypo- and hyperkalemia and outcome in acute heart failure patients: the role of medications. Clin Res Cardiol. 2018;107(3):214-221. https://doi.org/10.1007/s00392-017-1173-3.
18. Kok W, Salah K, Stienen S. Are changes in serum potassium levels during admissions for acute decompensated heart failure irrelevant for prognosis: the end of the story? Am J Cardiol. 2015;116(5):825. https://doi.org/10.1016/j.amjcard.2015.05.059.
19. Elixhauser A, Steiner C, Harris DR, Coffey RM. Comorbidity measures for use with administrative data. Med Care. 1998;36(1):8-27. https://doi.org/10.1097/00005650-199801000-00004.
20. Quan H, Parsons GA, Ghali WA. Validity of information on comorbidity derived from ICD-9-CCM administrative data. Med Care. 2002;40(8):675-685. https://doi.org/10.1097/01.MLR.0000020927.46398.5D.
21. Gagne JJ, Glynn RJ, Avorn J, Levin R, Schneeweiss S. A combined comorbidity score predicted mortality in elderly patients better than existing scores. J Clin Epidemiol. 2011;64(7):749-759. https://doi.org/10.1016/j.jclinepi.2010.10.004.
22. Escobar GJ, Gardner MN, Greene JD, Draper D, Kipnis P. Risk-adjusting hospital mortality using a comprehensive electronic record in an integrated health care delivery system. Med Care. 2013;51(5):446-453. https://doi.org/10.1097/MLR.0b013e3182881c8e.
23. Escobar GJ, Greene JD, Scheirer P, Gardner MN, Draper D, Kipnis P. Risk-adjusting hospital inpatient mortality using automated inpatient, outpatient, and laboratory databases. Med Care. 2008;46(3):232-239. https://doi.org/10.1097/MLR.0b013e3181589bb6.
24. Parente PMDC, Santos Silva JMC. Quantile regression with clustered data. J Econom Method. 2016;5(1):1-15. https://doi.org/10.1515/jem-2014-0011.
25. Salah K, Pinto YM, Eurlings LW, et al. Serum potassium decline during hospitalization for acute decompensated heart failure is a predictor of 6-month mortality, independent of N-terminal pro-B-type natriuretic peptide levels: An individual patient data analysis. Am Heart J. 2015;170(3):531-542.e1. https://doi.org/10.1016/j.ahj.2015.06.003.
26. Krogager ML, Eggers-Kaas L, Aasbjerg K, et al. Short-term mortality risk of serum potassium levels in acute heart failure following myocardial infarction. Eur Heart J Cardiovasc Pharmacother. 2015;1(4):245-251. https://doi.org/10.1093/ehjcvp/pvv026.
27. Crop MJ, Hoorn EJ, Lindemans J, Zietse R. Hypokalaemia and subsequent hyperkalaemia in hospitalized patients. Nephrol Dial Transplant. 2007;22(12):3471-3477.https://doi.org/10.1093/ndt/gfm471.
28. Kok W, Salah K, Stienen S. Serum potassium levels during admissions for acute decompensated heart failure: identifying possible threats to outcome. Am J Cardiol. 2018;121(1):141. https://doi.org/10.1016/j.amjcard.2017.09.032.
29. Freda BJ, Knee AB, Braden GL, Visintainer PF, Thakar CV. Effect of transient and sustained acute kidney injury on readmissions in acute decompensated heart failure. Am J Cardiol. 2017;119(11):1809-1814. https://doi.org/10.1016/j.amjcard.2017.02.044.
Heart failure (HF) is a leading cause of hospital admission and mortality, accounting for approximately 900,000 discharges in 2014.1 One-year all-cause mortality risk has been estimated at 17% after hospitalization,2 and roughly 50% of deaths are related to sudden cardiac death, mostly due to ventricular arrhythmia.
The principles underlying potassium management in acute HF are complex. Both low and high values have been linked to fatal arrhythmias, notably ventricular fibrillation, and small serum changes often reflect large total body potassium fluctuations.11 Recent literature links hypokalemia to general membrane hypoexcitability, skeletal muscle hyporeflexia, and arrhythmias initiated by reduced sodium-potassium adenosine triphosphatase activity, leading to increased intracellular calcium and regional variations in action potential duration.12 Potassium abnormalities are common at admission and may be exacerbated by both acute illness and treatments given during hospitalization, including baseline potassium, acute kidney injury, aggressive diuretic therapy, or other potassium-related treatments and conditions.13 The success of potassium repletion may also be affected by the choice of HF therapies.14
The belief that patients with HF must maintain a potassium >4.0 mEq/L remains pervasive, with at least one family medicine guideline recommending that patients with HF maintain a serum potassium level >4.0 mEq/L.
METHODS
Data Sources and Cohort Definition
The Institutional Review Board at Baystate Medical Center approved this study. We identified patients with HF who were admitted for more than 72 hours between January 2010 and December 2012 to hospitals contributing to the HealthFacts database, a multihospital dataset derived from the comprehensive electronic health records of 116 geographically and structurally diverse hospitals throughout the United States (Cerner Corp.). HealthFacts—which includes date-stamped pharmacy, laboratory, and billing information—contains records of more than 84 million acute admissions, emergency room visits, and ambulatory visits. We limited the sample to hospitals that contributed to the pharmacy, laboratory, and diagnosis segments.
We included patients who had a principal International Classification of Disease (ICD-9-CM) diagnosis of HF or a principal diagnosis of respiratory failure with secondary diagnosis of HF (ICD-9-CM codes for HF: 402.01, 402.11, 402.91, 404.01, 404.03, 404.11, 404.13, 404.91, 404.93, 428.xx16 and for respiratory failure: 518.81, 518.82, 518.84) and were 18 years or older. We ensured that patients were treated for acute decompensated HF during the hospitalization by restricting the cohort to patients in whom at least one HF therapy (eg, loop diuretics, metolazone, inotropes, and intra-aortic balloon pump) was initiated within the first two days of hospitalization. We excluded patients with a pediatric or psychiatric attending physician, those with elective admissions, and those who were transferred from or to another acute care facility because we could not accurately determine the onset or subsequent course of their illness.
Definition of Variables Describing Serum Potassium Levels
We limited the sample to patients hospitalized for longer than 72 hours in order to observe how initial potassium values influenced outcomes over the course of hospitalization. We chose an exposure window of 72 hours because this allowed, on average, three potential observations of serum potassium per patient. We further restricted the sample to those who had a normal potassium value (3.5-5.0 mEq/L) at admission (defined as 24 hours prior to admission through midnight of the day of admission) to ensure that the included patients did not have abnormal potassium values upon presentation. We identified the period of time from 24 hours prior to admission through 72 hours following admission as “the exposure window” (the time during which patients were eligible to be classified into average serum potassium levels of <4.0, 4.0-4.5, or >4.5 mEq/L). We excluded patients who, during this window, had fewer than three serum potassium levels drawn (“exposure” levels could be disproportionately influenced by a single value) or received sodium polystyrene (as this would indicate that the physicians felt the potassium was dangerously high). For patients with repeated hospitalizations, we randomly selected one visit for inclusion to reduce the risk of survivor bias. We calculated the mean of all serum potassium levels during the exposure window, including the admission value, and then evaluated two different categorizations of mean serum potassium, based on categories of risk previously reported in the literature:8,17,18: (1) <4.0, 4.0-4.5, or >4.5 mEq/L and (2) <4.0 versus ≥4.0 mEq/L.
Outcomes
We assessed three outcomes: in-hospital mortality, transfer to an intensive care unit (ICU), and length of stay (LOS). Admission to the ICU was defined as any evidence, after the exposure window, that the patient received care in the ICU. We excluded patients with ICU admissions during the exposure window from the analysis of this outcome. We calculated LOS as the difference between discharge date/time and the admission date/time.
Covariates and Comorbidity Adjustment
We obtained information on patient demographics (age and race) and identified the presence of comorbid conditions using previously derived and validated models.19,20 We then further quantified these conditions into a single combined score to adjust for differences in presenting illness severity (including kidney disease) and help reduce confounding.21 To account for presenting severity of illness, we calculated the Laboratory-based Acute Physiology Score (LAPS-2).22,23 LAPS-2 was developed for predicting mortality risk in general medical patients, but we previously externally validated it against other published clinical HF models in a cohort of patients hospitalized with acute decompensated HF.5
Potassium Repletion
Analysis
We evaluated the differences in patient characteristics across serum potassium categories. Categorical variables are presented as frequencies and percentages, whereas continuous variables are presented as means and standard deviations. For binary outcomes, we used generalized estimating equations (with a binomial family and logit link and clustering by hospital) to estimate incidence and calculate unadjusted and adjusted odds ratios (ORs) and 95% confidence intervals (CIs). For LOS, we estimated the median and 95% CIs using quantile regression with clustered standard errors.24 We calculated all models using both a binary exposure (<4.0 versus ≥4.0 mEq/L) and a three-level categorization (<4.0, 4.0-4.5, and >4.5 mEq/L) to explore the effects at the highest potassium level. We adjusted all models for age, race, LAPS-2 score, and combined comorbidity score. We conducted two sensitivity analyses. First, we restricted our sample to those who never received potassium during the exposure window, as these patients may be different than patients who required potassium repletion. Second, we stratified our findings by the presence or absence of acute or chronic renal insufficiency (defined as an admission creatinine >1 or the presence of a diagnostic code for renal insufficiency, as defined by Elixhauser et al.).19,21 Statistical significance was set at an alpha of 0.05. Analysis was completed using Stata v15.1, StataCorp LP, College Station, Texas.
RESULTS
Cohort Description
We identified patients from 56 geographically diverse US hospitals, although most were located in either the northeast (n = 21; 38%) or south (n = 18; 32%). A total of 59% of the hospitals were teaching hospitals, and nearly 95% were in an urban setting. We identified 13,163 patients with HF, of which 4,995 (38.0%) met the inclusion criteria. We excluded 3,744 (28.4%) patients with LOS < 72 hours, 2,210 (16.8%) with admission potassium values outside of the defined range, and 896 (6.8%) with fewer than three potassium values during the exposure window. Of the patients who met the inclusion criteria, 2,080 (41.6%), 2,326 (46.6%), and 589 (11.8%) were categorized in the <4.0, 4.0-4.5, and >4.5 mEq/L groups, respectively (Table 1). The groups were clinically similar in terms of age, sex, illness severity (LAPS-2), and comorbidity score. Compared with other racial groups, black patients had higher potassium values. While the <4.0 and 4.0-4.5 mEq/L groups were relatively similar, the group with mean potassium >4.5 mEq/L had higher admission creatinine and a greater prevalence of chronic kidney disease, deficiency anemias, and chronic obstructive pulmonary disease (Table 1).
Serum Potassium Values
Individuals’ mean serum potassium within the 72-hour exposure window ranged from 2.9 to 5.8 mEq/L (Table 2). In the <4.0, 4-4.5, and >4.5 mEq/L cohorts respectively, patients had a median serum potassium of 3.8 mEq/L (2.9-3.9), 4.2 mEq/L (4.0-4.5), and 4.7 mEq/L (4.5-5.8) during the exposure window. Approximately half of the patients in the <4.0 mEq/L group had a serum potassium <3.5 mEq/L at some point during the exposure window. In contrast, <10% of the other groups had this low value during the exposure window.
Potassium Repletion
Patients in the <4.0 mEq/L group were much more likely to receive potassium repletion during the exposure window when compared with the 4.0-4.5 mEq/L (71.5% vs 40.5%) and >4.5 mEq/L (71.5% vs 26.7%) groups. On days that they were eligible for repletion (defined as a daily potassium value <4.0 mEq/L), patients with mean serum potassium >4.0 mEq/L were less likely to receive potassium repletion compared with those with values <4.0 mEq/L. There were 592 (28.5%), 1,383 (59.5%), and 432 (73.3%) patients in the <4.0, 4-4.5, and >4,5 mEq/L groups, respectively, who did not receive potassium repletion therapy during the exposure window.
Relationship of Serum Potassium Levels and Outcomes
Overall, 3.7% (n = 187) of patients died during the hospitalization, 2.4% (n = 98) were admitted to the ICU after the exposure window, and the median LOS was 5.6 days. We did not observe a significant association between mean serum potassium of <4.0 or 4.0-4.5 mEq/L and increased risk of mortality, ICU transfer, or LOS (Table 3). Our unadjusted analysis showed that patients with values >4.5 mEq/L had worse outcomes, including more deaths (5.3%; OR = 1.55; 95% CI: 1.01 to 2.39) and ICU admission (3.8%; OR = 2.10; 95% CI: 1.16 to 3.80) compared with those with values <4.0 mEq/L (Table 3). We also found that, compared with the <4.0 mEq/L group, the >4.5 mEq/L group showed just over a half-day longer LOS (0.6 days; 95% CI: 0.0 to 1.0; Table 3). However, we found that mortality and ICU admission results were attenuated after adjustment for age, race, comorbidity score, and LAPS-2 and were no longer statistically significant, whereas the association with LOS was consistent after adjustment. When using a binary exposure (<4.0 versus ≥4.0 mEq/L), we observed no association between mean potassium value and increased risk of mortality, ICU transfer, or LOS both before and after adjustment for age, race, LAPS-2, and comorbidity score (data not shown).
Sensitivity Analyses
In the sensitivity analysis restricted to those who did not receive potassium repletion during the exposure window, we continued to observe no association between the <4.0 and 4.0-4.5 mEq/L groups and outcomes (Table 3). In adjusted models for the >4.5 versus <4.0 mEq/L groups, risk estimates for mortality were similar to the full sample, but statistical significance was lost (OR = 1.56; 95% CI: 0.81 to 3.01). Adjusted risk estimates for ICU transfer were attenuated and not statistically significant (OR = 1.40; 95% CI: 0.60 to 3.26). However, LOS estimates were very similar to that observed in the full dataset (0.6 days; 95% CI: 0.1 to 1.2).
When stratifying our results by the presence or absence of acute or chronic renal insufficiency, we continued to observe no increased risk of any outcome in the 4.0-4.5 mEq/L compared with the <4.0 mEq/L groups across all strata (Table 4). Interestingly, even after adjustment, we did find that most of the increased risk of mortality and ICU admission in the >4.5 versus <4.0 mEq/L groups was among those without renal insufficiency (mortality OR = 3.03; ICU admission OR = 3.00) and was not statistically significant in those with renal insufficiency (mortality OR = 1.27; ICU admission OR = 1.63). Adjusted LOS estimates remained relatively similar in this stratified analysis.
DISCUSSION
The best approach to mild serum potassium value abnormalities in patients hospitalized with HF remains unclear. Many physicians reflexively replete potassium to ensure all patients maintain a serum value of >4.0 mEq/L.15 Yet, in this large observational study of patients hospitalized with an acute HF exacerbation, we found little evidence of association between serum potassium <4.0 mEq/L and negative outcomes.
Compared with those with mean potassium values <4.0 mEq/L (in unadjusted models), there was an association between potassium values of >4.5 mEq/L and increased risk of mortality and ICU transfer. This association was attenuated after adjustment, suggesting that factors beyond potassium values influenced the observed relationship. These findings seem to suggest that unobserved differences in the >4.5 mEq/L group (there were observed differences in this group, eg, greater presenting severity and higher comorbidity scores, suggesting that there were also unobserved differences), and not average potassium value, were the reasons for the observed differences in outcomes. However, we cannot rule out the possibility that potassium >4.5 mEq/L has some associated increased risk compared with mean potassium values of <4.0 mEq/L for patients hospitalized with acute decompensated HF.
Patients in our study routinely received exogenous potassium: more than 70% of patients received repletion at least once, although it is notable that the majority of patients in the 4.0-4.5 and >4.5 mEq/L groups did not receive repletion. Despite this practice, the data supporting this approach to potassium management for patients hospitalized with HF remain mixed. A serum potassium decline of >15% during an acute HF hospital stay has been reported as a predictor of all-cause mortality after controlling for disease severity and associated comorbidities, including renal function.25 However, this study was focused on decline in admission potassium rather than an absolute cut-off (eg, >4.0 mEq/L). Additionally, potassium levels <3.9 mEq/L were associated with increased mortality in patients with acute HF following a myocardial infarction, but this study was not focused on patients with HF.26 Most of the prior literature in patients with HF was conducted in patients in outpatient settings and examined patients who were not experiencing acute exacerbations. MacDonald and Struthers advocate that patients with HF have their potassium maintained above 4.0 mEq/L but did not specify whether this included patients with acute HF exacerbations.10 Additionally, many studies evaluating potassium repletion were conducted before widespread availability of angiotensin-converting enzyme (ACE) inhibitors or potassium-sparing diuretics, including spironolactone. Prior work has consistently reported that hyperkalemia, defined as serum potassium >4.5 mEq/L, is associated with mortality in patients with acute HF over the course of hospitalization (which aligned with the results from our sensitivity analysis), but concurrent medication regimens and underlying impaired renal function likely accounted for most of this association.17 The picture is further complicated as patients with acute HF presenting with hypokalemia may be at risk for subsequent hyperkalemia, and potassium repletion can stimulate aldosterone secretion, potentially exacerbating underlying HF.27,28
These data are observational and are unlikely to change practice. However, daily potassium repletion represents a huge cost in time, money, and effort to the health system. Furthermore, the greatest burden occurs for the patients, who have labs drawn and values checked routinely and potassium administered orally or parenterally. While future randomized clinical trials (RCTs) would best examine the benefits of repletion, future pragmatic trials could attempt to disentangle the associated risks and benefits of potassium repletion in the absence of RCTs. Additionally, such studies could better take into account the role of concurrent medication use (like ACEs or angiotensin II receptor blockers), as well as assess the role of chronic renal insufficiency, acute kidney injury, and magnesium levels.29
This study has limitations. Its retrospective design leads to unmeasured confounding; however, we adjusted for multiple variables (including LAPS-2), which reflect the severity of disease at admission and underlying kidney function at presentation, as well as other comorbid conditions. In addition, data from the cohort only extend to 2012, so more recent changes in practice may not be completely reflected. The nature of the data did not allow us to directly investigate the relationship between serum potassium and arrhythmias, although ICU transfer and mortality were used as surrogates.
In conclusion, the benefit of a serum potassium level >4.0 mEq/L in patients admitted with HF remains unclear. We did not observe that mean potassium values <4.0 mEq/L were associated with worse outcomes, and, more concerning, there may be some risk for patients with mean values >4.5 mEq/L.
Acknowledgments
Dr. Lagu had full access to all the data in the study and takes responsibility for the integrity of the data and the accuracy of the data analysis.
Disclosures
The authors report no potential conflicts of interest. Dr. Lagu has served as a consultant for the Yale Center for Outcomes Research and Evaluation, under contract to the Centers for Medicare and Medicaid Services, for which she has provided clinical and methodological expertise and input on the development, reevaluation, and implementation of hospital outcome and efficiency measures.
Funding
Dr. Lagu is supported by the National Heart, Lung, and Blood Institute of the National Institutes of Health under Award Number K01HL114745 and R01 HL139985-01A1. Dr. Stefan is supported by the National Heart, Lung, and Blood Institute of the National Institutes of Health under Award Number K01HL114631-01A1. Dr. Pack is supported by NHLBI 1K23HL135440. Dr. Lindenauer is supported by the National Heart, Lung, and Blood Institute of the National Institutes of Health under Award Number 1K24HL132008.
Disclaimer
The views expressed in this manuscript do not necessarily reflect those of the Yale Center for Outcomes Research and Evaluation or the Centers for Medicare and Medicaid Services.
1. Benjamin EJ, Virani SS, Callaway CW, et al. Heart disease and stroke statistics–2018 update: a report from the American Heart Association. Circulation. 2018;137(12):e67-e492. https://doi.org/10.1161/CIR.0000000000000558.
2. Maggioni AP, Dahlström U, Filippatos G, et al. EURObservational Research Programme: regional differences and 1-year follow-up results of the Heart Failure Pilot Survey (ESC-HF Pilot). Eur J Heart Fail. 2013;15(7):808-817. https://doi.org/10.1093/eurjhf/hft050.
3. Tomaselli GF, Zipes DP. What causes sudden death in heart failure? Circ Res. 2004;95(8):754-763. https://doi.org/10.1161/01.RES.0000145047.
4. Bowen GS, Diop MS, Jiang L, Wu W-C, Rudolph JL. A multivariable prediction model for mortality in individuals admitted for heart failure. J Am Geriatr Soc. 2018;66(5):902-908. https://doi.org/10.1111/jgs.15319.
5. Lagu T, Pekow PS, Shieh M-S, et al. Validation and comparison of seven mortality prediction models for hospitalized patients with acute decompensated heart failure. Circ Heart Fail. 2016;9(8). https://doi.org/10.1161/CIRCHEARTFAILURE.115.002912.
6. Núñez J, Bayés-Genís A, Zannad F, et al. Long-term potassium monitoring and dynamics in heart failure and risk of mortality. Circulation. 2018;137(13):1320-1330. https://doi.org/10.1161/CIRCULATIONAHA.117.030576.
7. Vardeny O, Claggett B, Anand I, et al. Incidence, predictors, and outcomes related to hypo- and hyperkalemia in patients with severe heart failure treated with a mineralocorticoid receptor antagonist. Circ Heart Fail. 2014;7(4):573-579. https://doi.org/10.1161/CIRCHEARTFAILURE.114.00110.
8. Aldahl M, Jensen A-SC, Davidsen L, et al. Associations of serum potassium levels with mortality in chronic heart failure patients. Eur Heart J. 2017;38(38):2890-2896. https://doi.org/10.1093/eurheartj/ehx460.
9. Hoppe LK, Muhlack DC, Koenig W, Carr PR, Brenner H, Schöttker B. Association of abnormal serum potassium levels with arrhythmias and cardiovascular mortality: a systematic review and meta-analysis of observational studies. Cardiovasc Drugs Ther. 2018;32(2):197-212. https://doi.org/10.1007/s10557-018-6783-0.
10. Macdonald JE, Struthers AD. What is the optimal serum potassium level in cardiovascular patients? J Am Coll Cardiol. 2004;43(2):155-161. https://doi.org/10.1016/j.jacc.2003.06.021.
11. Hulting J. In-hospital ventricular fibrillation and its relation to serum potassium. Acta Med Scand Suppl. 1981;647(647):109-116. https://doi.org/10.1111/j.0954-6820.1981.tb02646.x.
12. Skogestad J, Aronsen JM. Hypokalemia-induced arrhythmias and heart failure: new insights and implications for therapy. Front Physiol. 2018;9:1500. https://doi.org/10.3389/fphys.2018.01500.
13. Tromp J, Ter Maaten JM, Damman K, et al. Serum potassium levels and outcome in acute heart failure (data from the PROTECT and COACH trials). Am J Cardiol. 2017;119(2):290-296. https://doi.org/10.1016/j.amjcard.2016.09.038.
14. Khan SS, Campia U, Chioncel O, et al. Changes in serum potassium levels during hospitalization in patients with worsening heart failure and reduced ejection fraction (from the EVEREST trial). Am J Cardiol. 2015;115(6):790-796. https://doi.org/10.1016/j.amjcard.2014.12.045
15. Viera AJ, Wouk N. Potassium disorders: hypokalemia and hyperkalemia. Am Fam Physician. 2015;92(6):487-495.
16. Krumholz HM, Wang Y, Mattera JA, et al. An administrative claims model suitable for profiling hospital performance based on 30-day mortality rates among patients with heart failure. Circulation. 2006;113(13):1693-1701. https://doi.org/10.1161/CIRCULATIONAHA.105.611194.
17. Legrand M, Ludes P-O, Massy Z, et al. Association between hypo- and hyperkalemia and outcome in acute heart failure patients: the role of medications. Clin Res Cardiol. 2018;107(3):214-221. https://doi.org/10.1007/s00392-017-1173-3.
18. Kok W, Salah K, Stienen S. Are changes in serum potassium levels during admissions for acute decompensated heart failure irrelevant for prognosis: the end of the story? Am J Cardiol. 2015;116(5):825. https://doi.org/10.1016/j.amjcard.2015.05.059.
19. Elixhauser A, Steiner C, Harris DR, Coffey RM. Comorbidity measures for use with administrative data. Med Care. 1998;36(1):8-27. https://doi.org/10.1097/00005650-199801000-00004.
20. Quan H, Parsons GA, Ghali WA. Validity of information on comorbidity derived from ICD-9-CCM administrative data. Med Care. 2002;40(8):675-685. https://doi.org/10.1097/01.MLR.0000020927.46398.5D.
21. Gagne JJ, Glynn RJ, Avorn J, Levin R, Schneeweiss S. A combined comorbidity score predicted mortality in elderly patients better than existing scores. J Clin Epidemiol. 2011;64(7):749-759. https://doi.org/10.1016/j.jclinepi.2010.10.004.
22. Escobar GJ, Gardner MN, Greene JD, Draper D, Kipnis P. Risk-adjusting hospital mortality using a comprehensive electronic record in an integrated health care delivery system. Med Care. 2013;51(5):446-453. https://doi.org/10.1097/MLR.0b013e3182881c8e.
23. Escobar GJ, Greene JD, Scheirer P, Gardner MN, Draper D, Kipnis P. Risk-adjusting hospital inpatient mortality using automated inpatient, outpatient, and laboratory databases. Med Care. 2008;46(3):232-239. https://doi.org/10.1097/MLR.0b013e3181589bb6.
24. Parente PMDC, Santos Silva JMC. Quantile regression with clustered data. J Econom Method. 2016;5(1):1-15. https://doi.org/10.1515/jem-2014-0011.
25. Salah K, Pinto YM, Eurlings LW, et al. Serum potassium decline during hospitalization for acute decompensated heart failure is a predictor of 6-month mortality, independent of N-terminal pro-B-type natriuretic peptide levels: An individual patient data analysis. Am Heart J. 2015;170(3):531-542.e1. https://doi.org/10.1016/j.ahj.2015.06.003.
26. Krogager ML, Eggers-Kaas L, Aasbjerg K, et al. Short-term mortality risk of serum potassium levels in acute heart failure following myocardial infarction. Eur Heart J Cardiovasc Pharmacother. 2015;1(4):245-251. https://doi.org/10.1093/ehjcvp/pvv026.
27. Crop MJ, Hoorn EJ, Lindemans J, Zietse R. Hypokalaemia and subsequent hyperkalaemia in hospitalized patients. Nephrol Dial Transplant. 2007;22(12):3471-3477.https://doi.org/10.1093/ndt/gfm471.
28. Kok W, Salah K, Stienen S. Serum potassium levels during admissions for acute decompensated heart failure: identifying possible threats to outcome. Am J Cardiol. 2018;121(1):141. https://doi.org/10.1016/j.amjcard.2017.09.032.
29. Freda BJ, Knee AB, Braden GL, Visintainer PF, Thakar CV. Effect of transient and sustained acute kidney injury on readmissions in acute decompensated heart failure. Am J Cardiol. 2017;119(11):1809-1814. https://doi.org/10.1016/j.amjcard.2017.02.044.
© 2019 Society of Hospital Medicine
Collaboration, Not Calculation: A Qualitative Study of How Hospital Executives Value Hospital Medicine Groups
The field of hospital medicine has expanded rapidly since its inception in the late 1990s, and currently, most hospitals in the United States employ or contract with hospital medicine groups (HMGs).1-4 This dramatic growth began in response to several factors: primary care physicians (PCPs) opting out of inpatient care, the increasing acuity and complexity of inpatient care, and cost pressures on hospitals.5,6 Recent studies associate greater use of hospitalists with increased hospital revenues and modest improvements in hospital financial performance.7 However, funding the hospitalist delivery model required hospitals to share the savings hospitalists generate through facility billing and quality incentives.
Hospitalists’ professional fee revenues alone generally do not fund their salaries. An average HMG serving adult patients requires $176,658 from the hospital to support a full-time physician.8 Determining the appropriate level of HMG support typically occurs through negotiation with hospital executives. During the last 10 years, HMG size and hospitalist compensation have risen steadily, combining to increase the hospitalist labor costs borne by hospitals.4,8 Accordingly, hospital executives in challenging economic environments may pressure HMG leaders to accept diminished support or to demonstrate a better return on the hospital’s investment.
These negotiations are influenced by the beliefs of hospital executives about the value of the hospitalist labor model. Little is known about how hospital and health system executive leadership assess the value of hospitalists. A deeper understanding of executive attitudes and beliefs could inform HMG leaders seeking integrative (“win-win”) outcomes in contract and compensation negotiations. Members of the Society of Hospital Medicine (SHM) Practice Management Committee surveyed hospital executives to guide SHM program development. We sought to analyze transcripts from these interviews to describe how executives assess HMGs and to test the hypothesis that hospital executives apply specific financial models when determining the return on investment (ROI) from subsidizing an HMG.
METHODS
Study Design, Setting, and Participants
Members of the SHM Practice Management Committee conducted interviews with a convenience sample of 24 key informants representing the following stakeholders at hospitals employing hospitalists: Chief Executive Officers (CEOs), Presidents, Vice Presidents, Chief Medical Officers (CMOs), and Chief Financial Officers (CFOs). Participants were recruited from 17 fee-for-service healthcare organizations, including rural, suburban, urban, community, and academic medical centers. The semi-structured interviews occurred in person between January and March 2018; each one lasted an average of 45 minutes and were designed to guide SHM program and product development. Twenty-eight executives were recruited by e-mail, and four did not complete the interview due to scheduling difficulty. All the participants provided informed consent. The University of Washington Institutional Review Board approved the secondary analysis of deidentified transcripts.
Interview Guide and Data Collection
All interviews followed a guide with eight demographic questions and 10 open-ended questions (Appendix). Cognitive interviews were performed with two hospital executives outside the study cohort, resulting in the addition of one question and rewording one question for clarity. One-on-one interviews were performed by 10 committee members (range, 1-3 interviews). All interview audios were recorded, and no field notes were kept. The goal of the interviews was to obtain an understanding of how hospital executives value the contributions and costs of hospitalist groups.
The interviews began with questions about the informant’s current interactions with hospitalists and the origin of the hospitalist group at their facility. Informants then described the value they feel hospitalists bring to their hospital and occasions they were surprised or dissatisfied with the clinical or financial value delivered by the hospitalists. Participants described how they calculate a return on investment (ROI) for their hospitalist group, nonfinancial benefits and disadvantages to hospitalists, and how they believe hospitalists should participate in risk-sharing contracts.
Data Analysis
The interview audiotapes were transcribed and deidentified. A sample of eight transcripts was verified by participants to ensure accuracy. Three investigators (AAW, RC, CC) reviewed a random sample of five transcripts to identify and codify preliminary themes. We applied a general inductive framework with a content analysis approach. Two investigators (TM and MC) read all transcripts independently, coding the presence of each theme and quotations exemplifying these themes using qualitative analysis software (Dedoose Version 7.0.23, SocioCultural Research Consultants). A third investigator (AAW) read all the transcripts and resolved differences of opinion. Themes and code application were discussed among the study team after the second and fifth transcripts to add or clarify codes. No new codes were identified after the first review of the preliminary codebook, although investigators intermittently used an “unknown” code through the 20th transcript. After discussion to reach consensus, excerpts initially coded “unknown” were assigned existing codes; the 20th transcript represents the approximate point of reaching thematic saturation.
RESULTS
Of the 24 participants, 18 (75%) were male, representing a variety of roles: 7 (29.2%) CMOs, 5 (20.8%) Presidents, 5 (20.8%) CFOs, 4 (16.7%) CEOs, and 3 (12.5%) Vice Presidents. The participants represented all regions (Midwest 12 [50%], South 6 [25%], West 4 [16.7%], and East 2 [8.3%], community size (Urban 11 [45.8%], Suburban 8 [33.3%], and Rural 5 [20.8%]), and Hospital Types (Community 11 [45.8%], Multihospital System 5 [20.8%], Academic 5 [20.8%], Safety Net 2 [8.3%], and Critical Access 1 [4.2%]). We present specific themes below and supporting quotations in Tables 1 and 2.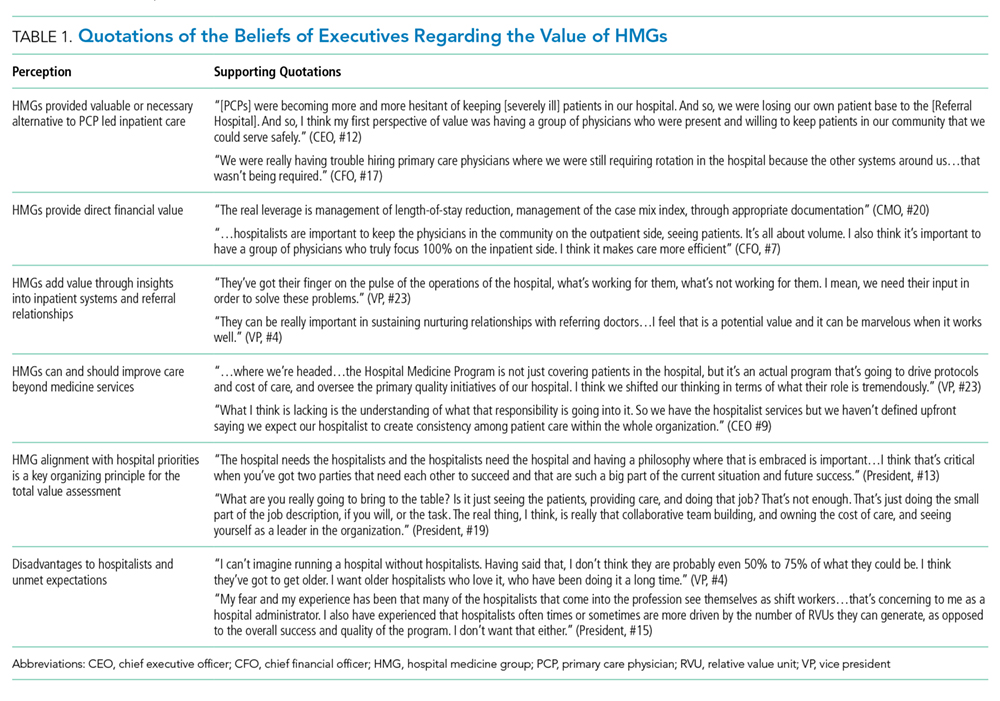
Current Value of the HMG at the Respondent’s Hospital
Most executives reported their hospital’s HMG had operated for over a decade and had developed an earlier, outdated value framework. Interviewees described an initial mix of financial pressures, shifts in physician work preferences, increasing patient acuity, resident labor shortages, and unsolved hospital throughput needs that triggered a reactive conversion from community PCP staffing to hospitalist care teams, followed by refinements to realize value.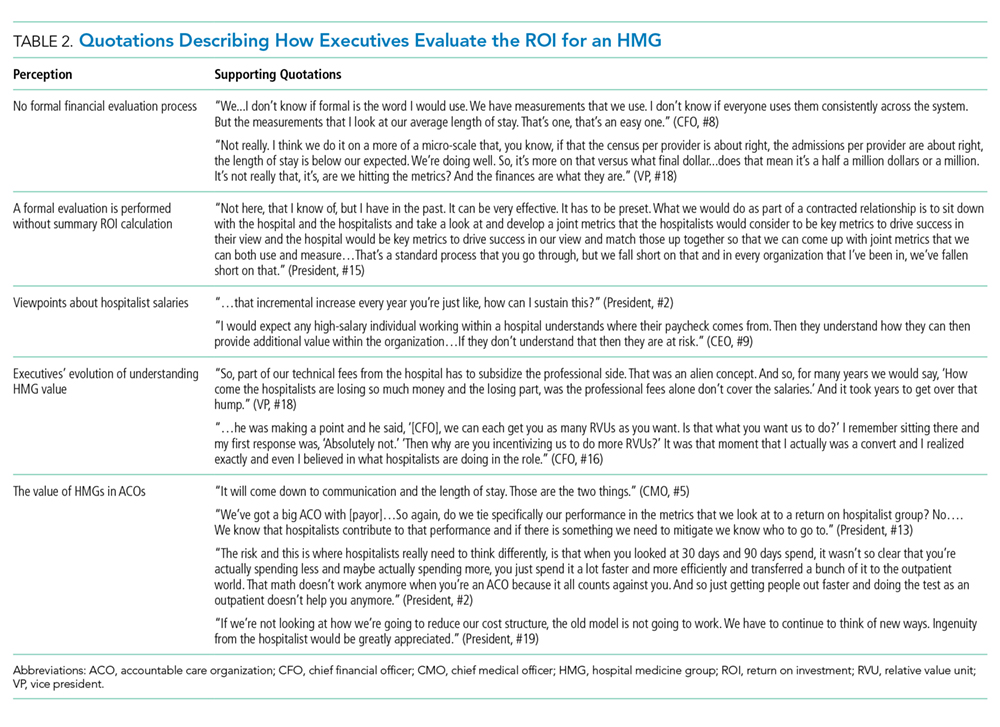
“I think initially here it was to deal with the resident caps, right? So, at that moment, the solution that was put in place probably made a lot of sense. If that’s all someone came in with, now I’d be scratching my head and said, what are you thinking?” (President, #2)
Respondents perceived that HMGs provide value in many domains, including financial contributions, high-quality care, organizational efficiency, academics, leadership of interprofessional teams, effective communication, system improvement, and beneficial influence on the care environment and other employees. Regarding the measurable generation of financial benefit, documentation for improved billing accuracy, increased hospital efficiency (eg, lower length of stay, early discharges), and comanagement arrangements were commonly identified.
“I don’t want a urologist with a stethoscope, so I’m happy to have the hospitalists say, ‘Look, I’ll take care of the patient. You do the procedure.’ Well, that’s inherently valuable, whether we measure it or whether we don’t.” (CMO, #21)
Executives generally expressed satisfaction with their HMG’s quality of care and the related pay-for-performance financial benefits from payers, attributing success to hospitalists’ familiarity with inpatient systems and willingness to standardize.
“I just think it’s having one structure, one group to go to, a standard rather than trying to push it through the medical staff.” (VP, #18)
Executives reported that HMGs generate substantial value that is difficult to measure financially. For example, a large bundle of excerpts organized around communication with patients, nurses, and other providers.
“If we have the right hospitalist staff, to engage them with the nursing staff would help to reduce my turnover rate…and create a very positive morale within the nursing units. That’s huge. That’s nonfinancial” (President, #15)
Executives particularly appreciated hospitalists’ work to aggregate input from multiple specialists and present a cohesive explanation to patients. Executives also felt that HMGs create significant unmeasured value by improving processes and outcomes on service lines beyond hospital medicine, achieving this through culture change, involvement in leadership, hospital-wide process redesign, and running rapid response teams. Some executives expressed a desire for hospitalists to assume this global quality responsibility more explicitly as a job expectation.
Executives described how they would evaluate a de novo proposal for hospitalist services, usually enumerating key general domains without explaining specifically how they would measure each element. The following priorities emerged: clinical excellence, capacity to collaborate with hospital leadership, the scope of services provided, cultural fit/alignment, financial performance, contract cost, pay-for-performance measures, and turnover. Regarding financial performance, respondents expected to know the cost of the proposal but lacked a specific price threshold. Instead, they sought to understand the total value of the proposal through its effect on metrics such as facility fees or resource use. Nonetheless, cultural fit was a critical, overriding driver of the hypothetical decision, despite difficulty defining beyond estimates of teamwork, alignment with hospital priorities, and qualities of the group leader.
“For us, it usually ends being how do we mix personally, do we like them?” (CMO, #5)
Alignment and Collaboration
The related concepts of “collaboration” and “alignment” emerged as prominent themes during all interviews. Executives highly valued hospitalist groups that could demonstrate alignment with hospital priorities and often used this concept to summarize the HMG’s success or failure across a group of value domains.
“If you’re just coming in to fill a shift and see 10 patients, you have much less value than somebody who’s going to play that active partnership role… hospitalist services need to partner with hospitals and be intimately involved with the success of the hospital.” (CMO, #20)
Alignment sometimes manifested in a quantified, explicit way, through incentive plans or shared savings plans. However, it most often manifested as a broader sense that the hospitalists’ work targeted the same priorities as the executive leaders and that hospitalists genuinely cared about those priorities. A “shift-work mentality” was expressed by some as the antithesis of alignment. Incorporating hospitalist leaders in hospital leadership and frequent communication arose as mechanisms to increase alignment.
Ways HMGs Fail to Meet Expectations
Respondents described unresolved disadvantages to the hospitalist care model.
“I mean, OPPE, how do you do that for a hospitalist? How can you do it? It’s hard to attribute a patient to someone….it is a weakness and I think we all know it.” (CMO, #21)
Executives also worried about inconsistent handoffs with primary care providers and the field’s demographics, finding it disproportionately comprised of junior or transient physicians. They also hoped that hospitalist innovators would solve clinician burnout and the high cost of inpatient care. Disappointments specific to the local HMG revolved around difficulty developing shared models of value and mechanisms to achieve them.
“I would like to have more dialog between the hospital leadership team and the hospitalist group…I would like to see a little bit more collaboration.” (President, #13)
These challenges emerged not as a deficiency with hospital medicine as a specialty, but a failure at their specific facility to achieve the goal of alignment through joint strategic planning.
Calculating Value
When asked if their hospital had a formal process to evaluate ROI for their HMG, two dominant answers emerged: (1) the executive lacked a formal process for determining ROI and was unaware of one used at their facility or (2) the executive evaluated HMG performance based on multiple measures, including cost, but did not attempt to calculate ROI or a summary value. Several described the financial evaluation process as too difficult or unnecessary.
“No. It’s too difficult to extract that data. I would say the best proxy that we could do it is our case mix index on our medicine service line.” (CMO, #20)
“No, not a formal process, no… I question the value of some of the other things we do with the medical group…but not the value of the hospitalists… I don’t think we’ve done a formal assessment. I appreciate the flexibility, especially in a small hospital.” (President, #10)
Rarely, executives described specific financial calculations that served as a proxy for ROI. These included calculating a contribution margin to compare against the cost of salary support or the application of external survey benchmarking comparisons for productivity and salary to evaluate the appropriateness of a limited set of financial indicators. Twice respondents alluded to more sophisticated measurements conducted by the finance department but lacked familiarity with the process. Several executives described ROI calculations for specific projects and discrete business decisions involving hospitalists, particularly considering hiring an additional hospitalist.
Executives generally struggled to recall specific ways that the nonfinancial contributions of hospitalists were incorporated into executive decisions regarding the hospitalist group. Two related themes emerged: first, the belief that hospitals could not function effectively without hospitalists, making their presence an expected cost of doing business. Second, absent measures of HMG ROI, executives appeared to determine an approximate overall value of hospitalists, rather than parsing the various contributions. A few respondents expressed alarm at the rise in hospitalist salaries, whereas others acknowledged market forces beyond their control.
“… there is going to be more of a demand for hospitalists, which is definitely going to drive up the compensation. So, I don’t worry that the compensation will be driven up so high that there won’t be a return [on investment].” (CFO, #16)
Some urged individual hospitalists to develop a deeper understanding of what supports their salary to avoid strained relationships with executives.
Evolution and Risk-Sharing Contracts
Respondents described an evolving conceptualization of the hospitalist’s value, occurring at both a broad, long-term scale and at an incremental, annual scale through minor modifications to incentive pay schemes. For most executives, hiring hospitalists as replacements for PCPs had become necessary and not a source of novel value; many executives described it as “the cost of doing business.” Some described gradually deemphasizing relative value unit (RVU) production to recognize other contributions. Several reported their general appreciation of hospitalists evolved as specific hospitalists matured and demonstrated new contributions to hospital function. Some leaders tried to speculate about future phases of this evolution, although details were sparse.
Among respondents with greater implementation of risk-sharing contracts or ACOs, executives did not describe significantly different goals for hospitalists; executives emphasized that hospitalists should accelerate existing efforts to reduce inpatient costs, length of stay, healthcare-acquired conditions, unnecessary testing, and readmissions. A theme emerged around hospitalists supporting the continuum of care, through improved communication and increased alignment with health systems.
“Where I see the real benefit…is to figure out a way to use hospitalists and match them up with the primary care physicians on the outpatient side to truly develop an integrated population-based medicine practice for all our patients.” (President, #15)
Executives believed that communication and collaboration with PCPs and postacute care providers would attract more measurement.
DISCUSSION
Our findings provide hospitalists with insight into the approach hospital executives may follow when determining the rationale for and extent of financial support for HMGs. The results did not support our hypothesis that executives commonly determine the appropriate support by summing detailed quantitative models for various HMG contributions. Instead, most hospital executives appear to make decisions about the appropriateness of financial support based on a small number of basic financial or care quality metrics combined with a subjective assessment of the HMG’s broader alignment with hospital priorities. However, we did find substantial evidence that hospital executives’ expectations of hospitalists have evolved in the last decade, creating the potential for dissociation from how hospitalists prioritize and value their own efforts. Together, our findings suggest that enhanced communication, relationship building, and collaboration with hospital leaders may help HMGs to maintain a shared model of value with hospital executives.
The general absence of summary value calculations suggests specific opportunities, benefits, and risks for HMG group leaders (Table 3). An important opportunity relates to the communication agenda about unmeasured or nonfinancial contributions. Although executives recognized many of these, our data suggest a need for HMG leaders to educate hospital leaders about their unmeasured contributions proactively. Although some might recommend doing so by quantifying and financially rewarding key intangible contributions (eg, measuring leadership in culture change9), this entails important risks.10 Some experts propose that the proliferation of physician pay-for-performance schemes threatens medical professionalism, fails patients, and misunderstands what motivates physicians.11 HMG groups that feel undervalued should hesitate before monetizing all aspects of their work, and consider emphasizing relationship-building as a platform for communication about their performance. Achieving better alignment with executives is not just an opportunity for HMG leaders, but for each hospitalist within the group. Although executives wanted to have deeper relationships with group members, this may not be feasible in large organizations. Instead, it is incumbent for HMG leaders to translate executives’ expectations and forge better alignment.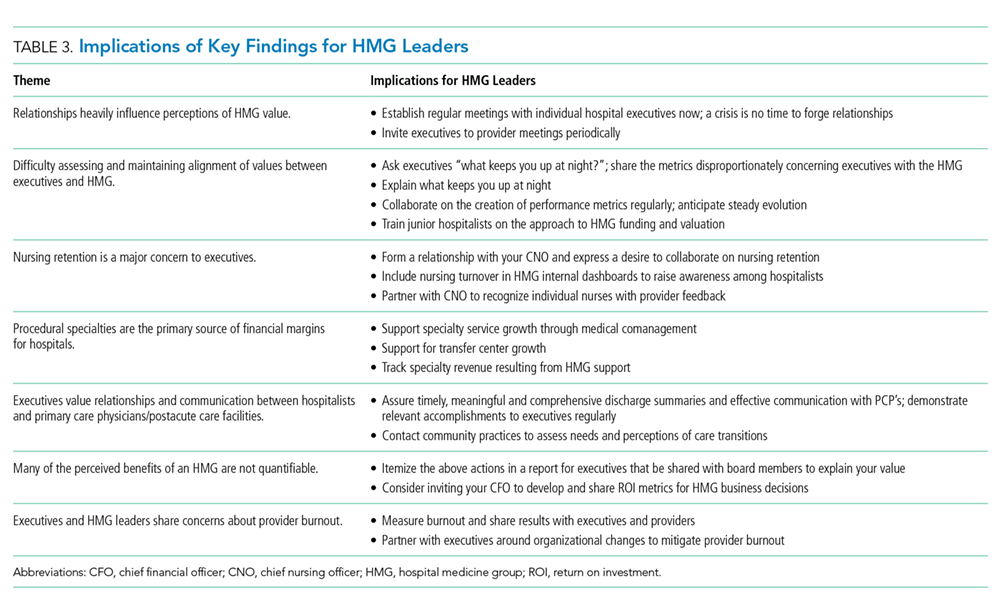
Residency may not adequately prepare hospitalists to meet key expectations hospital executives hold related to system leadership and interprofessional team leadership. For example, hospital leaders particularly valued HMGs’ perceived ability to improve nurse retention and morale. Unfortunately, residency curricula generally lack concerted instruction on the skills required to produce such interprofessional inpatient teams reliably. Similarly, executives strongly wanted HMGs to acknowledge a role as partners in running the quality, stewardship, and safety missions of the entire hospital. While residency training builds clinical competence through the care of individual patients, many residents do not receive experiential education in system design and leadership. This suggests a need for HMGs to provide early career training or mentorship in quality improvement and interprofessional teamwork. Executives and HMG leaders seeking a stable, mature workforce, should allocate resources to retaining mid and late career hospitalists through leadership roles or financial incentives for longevity.
As with many qualitative studies, the generalizability of our findings may be limited, particularly outside the US healthcare system. We invited executives from diverse practice settings but may not have captured all the relevant viewpoints. This study did not include Veterans Affairs hospitals, safety net hospitals were underrepresented, Midwestern hospitals were overrepresented and the participants were predominantly male. We were unable to determine the influence of employment model on participant beliefs about HMGs, nor did we elicit comparisons to other physician specialties that would highlight a distinct approach to negotiating with HMGs. Because we used hospitalists as interviewers, including some from the same institution as the interviewee, respondents may have dampened critiques or descriptions of unmet expectations. Our data do not provide quantitative support for any approach to determining or negotiating appropriate financial support for an HMG.
CONCLUSIONS
This work contributes new understanding of the expectations executives have for HMGs and individual hospitalists. This highlights opportunities for group leaders, hospitalists, medical educators, and quality improvement experts to produce a hospitalist labor force that can engage in productive and mutually satisfying relationships with hospital leaders. Hospitalists should strive to improve alignment and communication with executive groups.
Disclosures
The authors report no potential conflict of interest.
1. Lapps J, Flansbaum B, Leykum L, et al. Updating threshold-based identification of hospitalists in 2012 Medicare pay data. J Hosp Med. 2016;11(1):45-47. https://doi.org/10.1002/jhm.2480.
2. Wachter RM, Goldman L. Zero to 50,000–the 20th Anniversary of the hospitalist. NEJM. 2016;375(11):1009-1011. https://doi.org/10.1056/nejmp1607958.
3. Stevens JP, Nyweide DJ, Maresh S, et al. Comparison of hospital resource use and outcomes among hospitalists, primary care physicians, and other generalists. JAMA Intern Med. 2017;177(12):1781-1787. https://doi.org/10.1001/jamainternmed.2017.5824.
4. American Hospital Association (AHA) (2017), Hospital Statistics, AHA, Chicago, IL.
5. Wachter RM, Goldman L. The emerging role of “hospitalists” in the American health care system. NEJM. 1996;335(7):514-517. https://doi.org/10.1093/ajhp/53.20.2389a.
6. Pham HH, Devers KJ, Kuo S, et al. Health care market trends and the evolution of hospitalist use and roles. J Gen Intern Med. 2005;20(2):101-107. https://doi.org/10.1111/j.1525-1497.2005.40184.x.
7. Epané JP, Weech-Maldonado R, Hearld L, et al. Hospitals’ use of hospitalistas: implications for financial performance. Health Care Manage Rev. 2019;44(1):10-18. https://doi.org/10.1097/hmr.0000000000000170.
8. State of Hospital Medicine: 2018 Report Based on 2017 Data. Society of Hospital Medicine. https://sohm.hospitalmedicine.org/ Accessed December 9, 2018.
9. Carmeli A, Tishler A. The relationships between intangible organizational elements and organizational performance. Strategic Manag J. 2004;25(13):1257-1278. https://doi.org/10.1002/smj.428.
10. Bernard M. Strategic performance management: leveraging and measuring your intangible value drivers. Amsterdam: Butterworth-Heinemann, 2006.
11. Khullar D, Wolfson D, Casalino LP. Professionalism, performance, and the future of physician incentives. JAMA. 2018;320(23):2419-2420. https://doi.org/10.1001/jama.2018.17719.
The field of hospital medicine has expanded rapidly since its inception in the late 1990s, and currently, most hospitals in the United States employ or contract with hospital medicine groups (HMGs).1-4 This dramatic growth began in response to several factors: primary care physicians (PCPs) opting out of inpatient care, the increasing acuity and complexity of inpatient care, and cost pressures on hospitals.5,6 Recent studies associate greater use of hospitalists with increased hospital revenues and modest improvements in hospital financial performance.7 However, funding the hospitalist delivery model required hospitals to share the savings hospitalists generate through facility billing and quality incentives.
Hospitalists’ professional fee revenues alone generally do not fund their salaries. An average HMG serving adult patients requires $176,658 from the hospital to support a full-time physician.8 Determining the appropriate level of HMG support typically occurs through negotiation with hospital executives. During the last 10 years, HMG size and hospitalist compensation have risen steadily, combining to increase the hospitalist labor costs borne by hospitals.4,8 Accordingly, hospital executives in challenging economic environments may pressure HMG leaders to accept diminished support or to demonstrate a better return on the hospital’s investment.
These negotiations are influenced by the beliefs of hospital executives about the value of the hospitalist labor model. Little is known about how hospital and health system executive leadership assess the value of hospitalists. A deeper understanding of executive attitudes and beliefs could inform HMG leaders seeking integrative (“win-win”) outcomes in contract and compensation negotiations. Members of the Society of Hospital Medicine (SHM) Practice Management Committee surveyed hospital executives to guide SHM program development. We sought to analyze transcripts from these interviews to describe how executives assess HMGs and to test the hypothesis that hospital executives apply specific financial models when determining the return on investment (ROI) from subsidizing an HMG.
METHODS
Study Design, Setting, and Participants
Members of the SHM Practice Management Committee conducted interviews with a convenience sample of 24 key informants representing the following stakeholders at hospitals employing hospitalists: Chief Executive Officers (CEOs), Presidents, Vice Presidents, Chief Medical Officers (CMOs), and Chief Financial Officers (CFOs). Participants were recruited from 17 fee-for-service healthcare organizations, including rural, suburban, urban, community, and academic medical centers. The semi-structured interviews occurred in person between January and March 2018; each one lasted an average of 45 minutes and were designed to guide SHM program and product development. Twenty-eight executives were recruited by e-mail, and four did not complete the interview due to scheduling difficulty. All the participants provided informed consent. The University of Washington Institutional Review Board approved the secondary analysis of deidentified transcripts.
Interview Guide and Data Collection
All interviews followed a guide with eight demographic questions and 10 open-ended questions (Appendix). Cognitive interviews were performed with two hospital executives outside the study cohort, resulting in the addition of one question and rewording one question for clarity. One-on-one interviews were performed by 10 committee members (range, 1-3 interviews). All interview audios were recorded, and no field notes were kept. The goal of the interviews was to obtain an understanding of how hospital executives value the contributions and costs of hospitalist groups.
The interviews began with questions about the informant’s current interactions with hospitalists and the origin of the hospitalist group at their facility. Informants then described the value they feel hospitalists bring to their hospital and occasions they were surprised or dissatisfied with the clinical or financial value delivered by the hospitalists. Participants described how they calculate a return on investment (ROI) for their hospitalist group, nonfinancial benefits and disadvantages to hospitalists, and how they believe hospitalists should participate in risk-sharing contracts.
Data Analysis
The interview audiotapes were transcribed and deidentified. A sample of eight transcripts was verified by participants to ensure accuracy. Three investigators (AAW, RC, CC) reviewed a random sample of five transcripts to identify and codify preliminary themes. We applied a general inductive framework with a content analysis approach. Two investigators (TM and MC) read all transcripts independently, coding the presence of each theme and quotations exemplifying these themes using qualitative analysis software (Dedoose Version 7.0.23, SocioCultural Research Consultants). A third investigator (AAW) read all the transcripts and resolved differences of opinion. Themes and code application were discussed among the study team after the second and fifth transcripts to add or clarify codes. No new codes were identified after the first review of the preliminary codebook, although investigators intermittently used an “unknown” code through the 20th transcript. After discussion to reach consensus, excerpts initially coded “unknown” were assigned existing codes; the 20th transcript represents the approximate point of reaching thematic saturation.
RESULTS
Of the 24 participants, 18 (75%) were male, representing a variety of roles: 7 (29.2%) CMOs, 5 (20.8%) Presidents, 5 (20.8%) CFOs, 4 (16.7%) CEOs, and 3 (12.5%) Vice Presidents. The participants represented all regions (Midwest 12 [50%], South 6 [25%], West 4 [16.7%], and East 2 [8.3%], community size (Urban 11 [45.8%], Suburban 8 [33.3%], and Rural 5 [20.8%]), and Hospital Types (Community 11 [45.8%], Multihospital System 5 [20.8%], Academic 5 [20.8%], Safety Net 2 [8.3%], and Critical Access 1 [4.2%]). We present specific themes below and supporting quotations in Tables 1 and 2.
Current Value of the HMG at the Respondent’s Hospital
Most executives reported their hospital’s HMG had operated for over a decade and had developed an earlier, outdated value framework. Interviewees described an initial mix of financial pressures, shifts in physician work preferences, increasing patient acuity, resident labor shortages, and unsolved hospital throughput needs that triggered a reactive conversion from community PCP staffing to hospitalist care teams, followed by refinements to realize value.
“I think initially here it was to deal with the resident caps, right? So, at that moment, the solution that was put in place probably made a lot of sense. If that’s all someone came in with, now I’d be scratching my head and said, what are you thinking?” (President, #2)
Respondents perceived that HMGs provide value in many domains, including financial contributions, high-quality care, organizational efficiency, academics, leadership of interprofessional teams, effective communication, system improvement, and beneficial influence on the care environment and other employees. Regarding the measurable generation of financial benefit, documentation for improved billing accuracy, increased hospital efficiency (eg, lower length of stay, early discharges), and comanagement arrangements were commonly identified.
“I don’t want a urologist with a stethoscope, so I’m happy to have the hospitalists say, ‘Look, I’ll take care of the patient. You do the procedure.’ Well, that’s inherently valuable, whether we measure it or whether we don’t.” (CMO, #21)
Executives generally expressed satisfaction with their HMG’s quality of care and the related pay-for-performance financial benefits from payers, attributing success to hospitalists’ familiarity with inpatient systems and willingness to standardize.
“I just think it’s having one structure, one group to go to, a standard rather than trying to push it through the medical staff.” (VP, #18)
Executives reported that HMGs generate substantial value that is difficult to measure financially. For example, a large bundle of excerpts organized around communication with patients, nurses, and other providers.
“If we have the right hospitalist staff, to engage them with the nursing staff would help to reduce my turnover rate…and create a very positive morale within the nursing units. That’s huge. That’s nonfinancial” (President, #15)
Executives particularly appreciated hospitalists’ work to aggregate input from multiple specialists and present a cohesive explanation to patients. Executives also felt that HMGs create significant unmeasured value by improving processes and outcomes on service lines beyond hospital medicine, achieving this through culture change, involvement in leadership, hospital-wide process redesign, and running rapid response teams. Some executives expressed a desire for hospitalists to assume this global quality responsibility more explicitly as a job expectation.
Executives described how they would evaluate a de novo proposal for hospitalist services, usually enumerating key general domains without explaining specifically how they would measure each element. The following priorities emerged: clinical excellence, capacity to collaborate with hospital leadership, the scope of services provided, cultural fit/alignment, financial performance, contract cost, pay-for-performance measures, and turnover. Regarding financial performance, respondents expected to know the cost of the proposal but lacked a specific price threshold. Instead, they sought to understand the total value of the proposal through its effect on metrics such as facility fees or resource use. Nonetheless, cultural fit was a critical, overriding driver of the hypothetical decision, despite difficulty defining beyond estimates of teamwork, alignment with hospital priorities, and qualities of the group leader.
“For us, it usually ends being how do we mix personally, do we like them?” (CMO, #5)
Alignment and Collaboration
The related concepts of “collaboration” and “alignment” emerged as prominent themes during all interviews. Executives highly valued hospitalist groups that could demonstrate alignment with hospital priorities and often used this concept to summarize the HMG’s success or failure across a group of value domains.
“If you’re just coming in to fill a shift and see 10 patients, you have much less value than somebody who’s going to play that active partnership role… hospitalist services need to partner with hospitals and be intimately involved with the success of the hospital.” (CMO, #20)
Alignment sometimes manifested in a quantified, explicit way, through incentive plans or shared savings plans. However, it most often manifested as a broader sense that the hospitalists’ work targeted the same priorities as the executive leaders and that hospitalists genuinely cared about those priorities. A “shift-work mentality” was expressed by some as the antithesis of alignment. Incorporating hospitalist leaders in hospital leadership and frequent communication arose as mechanisms to increase alignment.
Ways HMGs Fail to Meet Expectations
Respondents described unresolved disadvantages to the hospitalist care model.
“I mean, OPPE, how do you do that for a hospitalist? How can you do it? It’s hard to attribute a patient to someone….it is a weakness and I think we all know it.” (CMO, #21)
Executives also worried about inconsistent handoffs with primary care providers and the field’s demographics, finding it disproportionately comprised of junior or transient physicians. They also hoped that hospitalist innovators would solve clinician burnout and the high cost of inpatient care. Disappointments specific to the local HMG revolved around difficulty developing shared models of value and mechanisms to achieve them.
“I would like to have more dialog between the hospital leadership team and the hospitalist group…I would like to see a little bit more collaboration.” (President, #13)
These challenges emerged not as a deficiency with hospital medicine as a specialty, but a failure at their specific facility to achieve the goal of alignment through joint strategic planning.
Calculating Value
When asked if their hospital had a formal process to evaluate ROI for their HMG, two dominant answers emerged: (1) the executive lacked a formal process for determining ROI and was unaware of one used at their facility or (2) the executive evaluated HMG performance based on multiple measures, including cost, but did not attempt to calculate ROI or a summary value. Several described the financial evaluation process as too difficult or unnecessary.
“No. It’s too difficult to extract that data. I would say the best proxy that we could do it is our case mix index on our medicine service line.” (CMO, #20)
“No, not a formal process, no… I question the value of some of the other things we do with the medical group…but not the value of the hospitalists… I don’t think we’ve done a formal assessment. I appreciate the flexibility, especially in a small hospital.” (President, #10)
Rarely, executives described specific financial calculations that served as a proxy for ROI. These included calculating a contribution margin to compare against the cost of salary support or the application of external survey benchmarking comparisons for productivity and salary to evaluate the appropriateness of a limited set of financial indicators. Twice respondents alluded to more sophisticated measurements conducted by the finance department but lacked familiarity with the process. Several executives described ROI calculations for specific projects and discrete business decisions involving hospitalists, particularly considering hiring an additional hospitalist.
Executives generally struggled to recall specific ways that the nonfinancial contributions of hospitalists were incorporated into executive decisions regarding the hospitalist group. Two related themes emerged: first, the belief that hospitals could not function effectively without hospitalists, making their presence an expected cost of doing business. Second, absent measures of HMG ROI, executives appeared to determine an approximate overall value of hospitalists, rather than parsing the various contributions. A few respondents expressed alarm at the rise in hospitalist salaries, whereas others acknowledged market forces beyond their control.
“… there is going to be more of a demand for hospitalists, which is definitely going to drive up the compensation. So, I don’t worry that the compensation will be driven up so high that there won’t be a return [on investment].” (CFO, #16)
Some urged individual hospitalists to develop a deeper understanding of what supports their salary to avoid strained relationships with executives.
Evolution and Risk-Sharing Contracts
Respondents described an evolving conceptualization of the hospitalist’s value, occurring at both a broad, long-term scale and at an incremental, annual scale through minor modifications to incentive pay schemes. For most executives, hiring hospitalists as replacements for PCPs had become necessary and not a source of novel value; many executives described it as “the cost of doing business.” Some described gradually deemphasizing relative value unit (RVU) production to recognize other contributions. Several reported their general appreciation of hospitalists evolved as specific hospitalists matured and demonstrated new contributions to hospital function. Some leaders tried to speculate about future phases of this evolution, although details were sparse.
Among respondents with greater implementation of risk-sharing contracts or ACOs, executives did not describe significantly different goals for hospitalists; executives emphasized that hospitalists should accelerate existing efforts to reduce inpatient costs, length of stay, healthcare-acquired conditions, unnecessary testing, and readmissions. A theme emerged around hospitalists supporting the continuum of care, through improved communication and increased alignment with health systems.
“Where I see the real benefit…is to figure out a way to use hospitalists and match them up with the primary care physicians on the outpatient side to truly develop an integrated population-based medicine practice for all our patients.” (President, #15)
Executives believed that communication and collaboration with PCPs and postacute care providers would attract more measurement.
DISCUSSION
Our findings provide hospitalists with insight into the approach hospital executives may follow when determining the rationale for and extent of financial support for HMGs. The results did not support our hypothesis that executives commonly determine the appropriate support by summing detailed quantitative models for various HMG contributions. Instead, most hospital executives appear to make decisions about the appropriateness of financial support based on a small number of basic financial or care quality metrics combined with a subjective assessment of the HMG’s broader alignment with hospital priorities. However, we did find substantial evidence that hospital executives’ expectations of hospitalists have evolved in the last decade, creating the potential for dissociation from how hospitalists prioritize and value their own efforts. Together, our findings suggest that enhanced communication, relationship building, and collaboration with hospital leaders may help HMGs to maintain a shared model of value with hospital executives.
The general absence of summary value calculations suggests specific opportunities, benefits, and risks for HMG group leaders (Table 3). An important opportunity relates to the communication agenda about unmeasured or nonfinancial contributions. Although executives recognized many of these, our data suggest a need for HMG leaders to educate hospital leaders about their unmeasured contributions proactively. Although some might recommend doing so by quantifying and financially rewarding key intangible contributions (eg, measuring leadership in culture change9), this entails important risks.10 Some experts propose that the proliferation of physician pay-for-performance schemes threatens medical professionalism, fails patients, and misunderstands what motivates physicians.11 HMG groups that feel undervalued should hesitate before monetizing all aspects of their work, and consider emphasizing relationship-building as a platform for communication about their performance. Achieving better alignment with executives is not just an opportunity for HMG leaders, but for each hospitalist within the group. Although executives wanted to have deeper relationships with group members, this may not be feasible in large organizations. Instead, it is incumbent for HMG leaders to translate executives’ expectations and forge better alignment.
Residency may not adequately prepare hospitalists to meet key expectations hospital executives hold related to system leadership and interprofessional team leadership. For example, hospital leaders particularly valued HMGs’ perceived ability to improve nurse retention and morale. Unfortunately, residency curricula generally lack concerted instruction on the skills required to produce such interprofessional inpatient teams reliably. Similarly, executives strongly wanted HMGs to acknowledge a role as partners in running the quality, stewardship, and safety missions of the entire hospital. While residency training builds clinical competence through the care of individual patients, many residents do not receive experiential education in system design and leadership. This suggests a need for HMGs to provide early career training or mentorship in quality improvement and interprofessional teamwork. Executives and HMG leaders seeking a stable, mature workforce, should allocate resources to retaining mid and late career hospitalists through leadership roles or financial incentives for longevity.
As with many qualitative studies, the generalizability of our findings may be limited, particularly outside the US healthcare system. We invited executives from diverse practice settings but may not have captured all the relevant viewpoints. This study did not include Veterans Affairs hospitals, safety net hospitals were underrepresented, Midwestern hospitals were overrepresented and the participants were predominantly male. We were unable to determine the influence of employment model on participant beliefs about HMGs, nor did we elicit comparisons to other physician specialties that would highlight a distinct approach to negotiating with HMGs. Because we used hospitalists as interviewers, including some from the same institution as the interviewee, respondents may have dampened critiques or descriptions of unmet expectations. Our data do not provide quantitative support for any approach to determining or negotiating appropriate financial support for an HMG.
CONCLUSIONS
This work contributes new understanding of the expectations executives have for HMGs and individual hospitalists. This highlights opportunities for group leaders, hospitalists, medical educators, and quality improvement experts to produce a hospitalist labor force that can engage in productive and mutually satisfying relationships with hospital leaders. Hospitalists should strive to improve alignment and communication with executive groups.
Disclosures
The authors report no potential conflict of interest.
1. Lapps J, Flansbaum B, Leykum L, et al. Updating threshold-based identification of hospitalists in 2012 Medicare pay data. J Hosp Med. 2016;11(1):45-47. https://doi.org/10.1002/jhm.2480.
2. Wachter RM, Goldman L. Zero to 50,000–the 20th Anniversary of the hospitalist. NEJM. 2016;375(11):1009-1011. https://doi.org/10.1056/nejmp1607958.
3. Stevens JP, Nyweide DJ, Maresh S, et al. Comparison of hospital resource use and outcomes among hospitalists, primary care physicians, and other generalists. JAMA Intern Med. 2017;177(12):1781-1787. https://doi.org/10.1001/jamainternmed.2017.5824.
4. American Hospital Association (AHA) (2017), Hospital Statistics, AHA, Chicago, IL.
5. Wachter RM, Goldman L. The emerging role of “hospitalists” in the American health care system. NEJM. 1996;335(7):514-517. https://doi.org/10.1093/ajhp/53.20.2389a.
6. Pham HH, Devers KJ, Kuo S, et al. Health care market trends and the evolution of hospitalist use and roles. J Gen Intern Med. 2005;20(2):101-107. https://doi.org/10.1111/j.1525-1497.2005.40184.x.
7. Epané JP, Weech-Maldonado R, Hearld L, et al. Hospitals’ use of hospitalistas: implications for financial performance. Health Care Manage Rev. 2019;44(1):10-18. https://doi.org/10.1097/hmr.0000000000000170.
8. State of Hospital Medicine: 2018 Report Based on 2017 Data. Society of Hospital Medicine. https://sohm.hospitalmedicine.org/ Accessed December 9, 2018.
9. Carmeli A, Tishler A. The relationships between intangible organizational elements and organizational performance. Strategic Manag J. 2004;25(13):1257-1278. https://doi.org/10.1002/smj.428.
10. Bernard M. Strategic performance management: leveraging and measuring your intangible value drivers. Amsterdam: Butterworth-Heinemann, 2006.
11. Khullar D, Wolfson D, Casalino LP. Professionalism, performance, and the future of physician incentives. JAMA. 2018;320(23):2419-2420. https://doi.org/10.1001/jama.2018.17719.
© 2019 Society of Hospital Medicine
Inpatient Communication Barriers and Drivers When Caring for Limited English Proficiency Children
Immigrant children make up the fastest growing segment of the population in the United States.1 While most immigrant children are fluent in English, approximately 40% live with a parent who has limited English proficiency (LEP; ie, speaks English less than “very well”).2,3 In pediatrics, LEP status has been associated with longer hospitalizations,4 higher hospitalization costs,5 increased risk for serious adverse medical events,4,6 and more frequent emergency department reutilization.7 In the inpatient setting, multiple aspects of care present a variety of communication challenges,8 which are amplified by shift work and workflow complexity that result in patients and families interacting with numerous providers over the course of an inpatient stay.
Increasing access to trained professional interpreters when caring for LEP patients improves communication, patient satisfaction, adherence, and mortality.9-12 However, even when access to interpreter services is established, effective use is not guaranteed.13 Up to 57% of pediatricians report relying on family members to communicate with LEP patients and their caregivers;9 23% of pediatric residents categorized LEP encounters as frustrating while 78% perceived care of LEP patients to be “misdirected” (eg, delay in diagnosis or discharge) because of associated language barriers.14
Understanding experiences of frontline inpatient medical providers and interpreters is crucial in identifying challenges and ways to optimize communication for hospitalized LEP patients and families. However, there is a paucity of literature exploring the perspectives of medical providers and interpreters as it relates to communication with hospitalized LEP children and families. In this study, we sought to identify barriers and drivers of effective communication with pediatric patients and families with LEP in the inpatient setting from the perspective of frontline medical providers and interpreters.
METHODS
Study Design
This qualitative study used Group Level Assessment (GLA), a structured participatory methodology that allows diverse groups of stakeholders to generate and evaluate data in interactive sessions.15-18 GLA structure promotes active participation, group problem-solving, and development of actionable plans, distinguishing it from focus groups and in-depth semistructured interviews.15,19 This study received a human subject research exemption by the institutional review board.
Study Setting
Cincinnati Children’s Hospital Medical Center (CCHMC) is a large quaternary care center with ~200 patient encounters each day who require the use of interpreter services. Interpreters (in-person, video, and phone) are utilized during admission, formal family-centered rounds, hospital discharge, and other encounters with physicians, nurses, and other healthcare professionals. In-person interpreters are available in-house for Spanish and Arabic, with 18 additional languages available through regional vendors. Despite available resources, there is no standard way in which medical providers and interpreters work with one another.
Study Participants and Recruitment
Medical providers who care for hospitalized general pediatric patients were eligible to participate, including attending physicians, resident physicians, bedside nurses, and inpatient ancillary staff (eg, respiratory therapists, physical therapists). Interpreters employed by CCHMC with experience in the inpatient setting were also eligible. Individuals were recruited based on published recommendations to optimize discussion and group-thinking.15 Each participant was asked to take part in one GLA session. Participants were assigned to specific sessions based on roles (ie, physicians, nurses, and interpreters) to maximize engagement and minimize the impact of hierarchy.
Study Procedure
GLA involves a seven-step structured process (Appendix 1): climate setting, generating, appreciating, reflecting, understanding, selecting, and action.15,18 Qualitative data were generated individually and anonymously by participants on flip charts in response to prompts such as: “I worry that LEP families___,” “The biggest challenge when using interpreter services is___,” and “I find___ works well in providing care for LEP families.” Prompts were developed by study investigators, modified based on input from nursing and interpreter services leadership, and finalized by GLA facilitators. Fifty-one unique prompts were utilized (Appendix 2); the number of prompts used (ranging from 15 to 32 prompts) per session was based on published recommendations.15 During sessions, study investigators took detailed notes, including verbatim transcription of participant quotes. Upon conclusion of the session, each participant completed a demographic survey, including years of experience, languages spoken and perceived fluency,20 and ethnicity.
Data Analysis
Within each session, under the guidance of trained and experienced GLA facilitators (WB, HV), participants distilled and summarized qualitative data into themes, discussed and prioritized themes, and generated action items. Following completion of all sessions, analyzed data was compiled by the research team to determine similarities and differences across groups based on participant roles, consolidate themes into barriers and drivers of communication with LEP families, and determine any overlap of priorities for action. Findings were shared back with each group to ensure accuracy and relevance.
RESULTS
Participants
A total of 64 individuals participated (Table 1): hospital medicine physicians and residents (56%), inpatient nurses and ancillary staff (16%), and interpreters (28%). While 81% of physicians spoke multiple languages, only 25% reported speaking them well; two physicians were certified to communicate medical information without an interpreter present.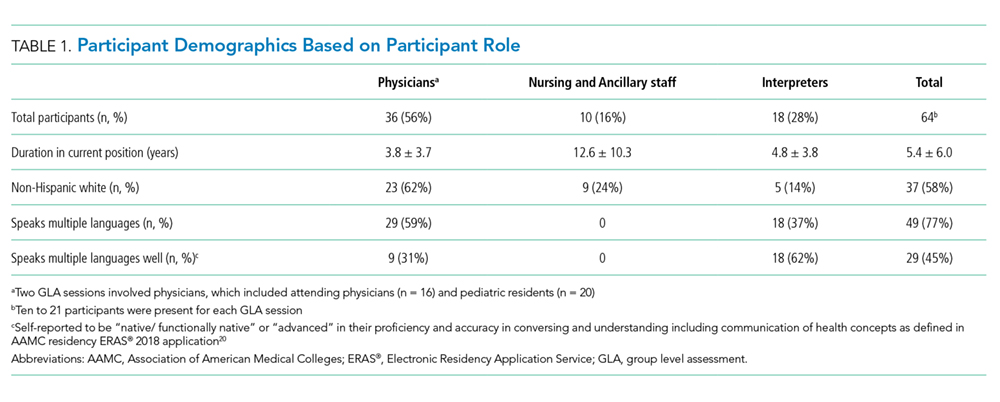
Themes Resulting from GLA Sessions
A total of four barriers (Table 2) and four drivers (Table 3) of effective communication with pediatric LEP patients and their families in the inpatient setting were identified by participants. Participants across all groups, despite enthusiasm around improving communication, were concerned about quality of care LEP families received, noting that the system is “designed to deliver less-good care” and that “we really haven’t figured out how to care for [LEP patients and families] in a [high-]quality and reliable way.” Variation in theme discussion was noted between groups based on participant role: physicians voiced concern about rapport with LEP families, nurses emphasized actionable tasks, and interpreters focused on heightened challenges in times of stress.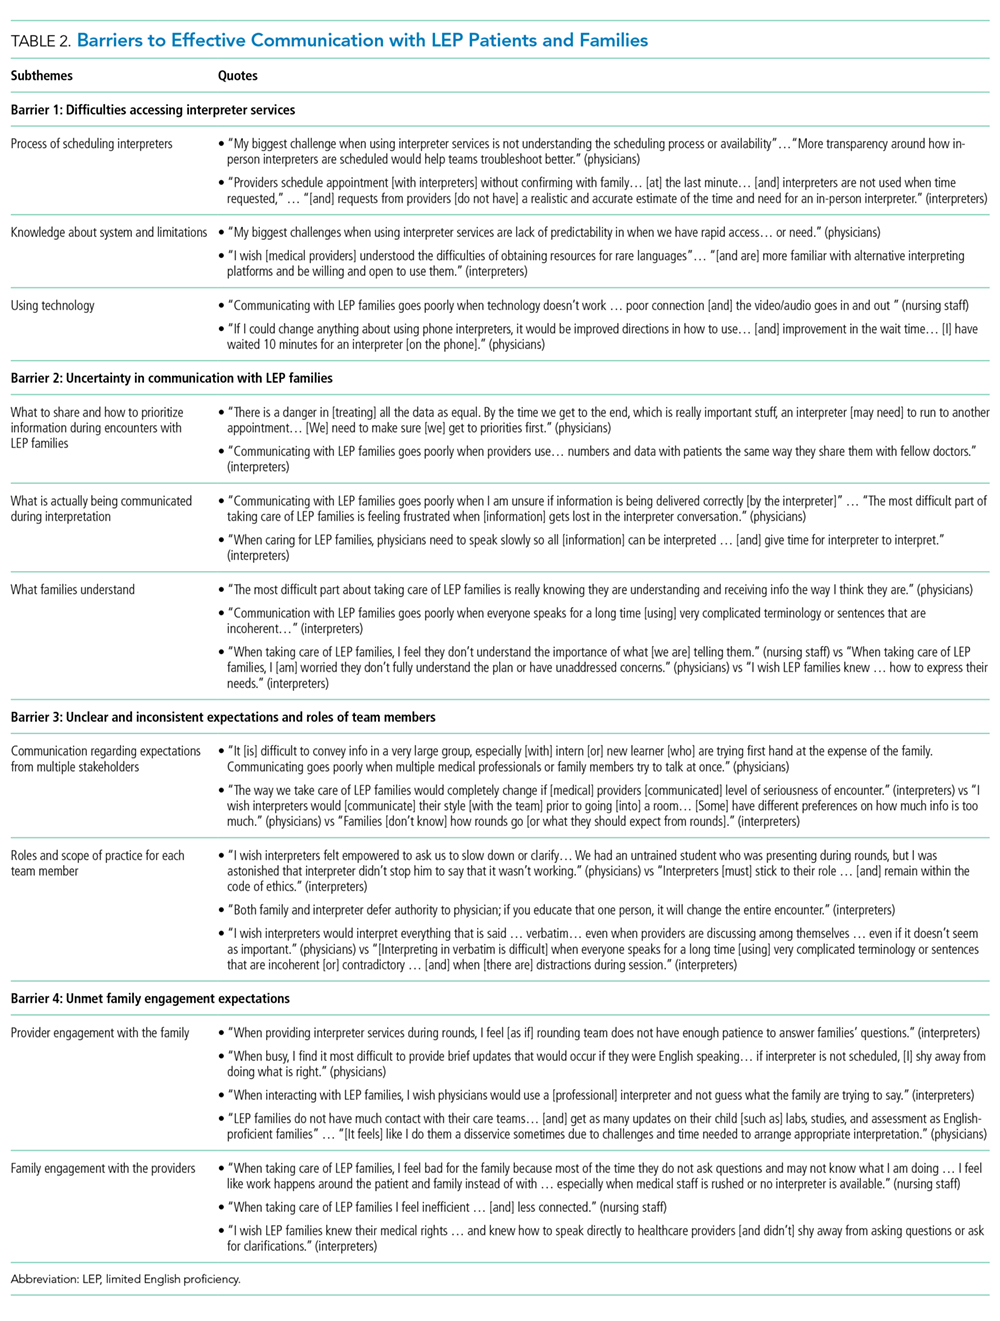
Barrier 1: Difficulties Accessing Interpreter Services
Medical providers (physicians and nurses) identified the “opaque process to access [interpreter] services” as one of their biggest challenges when communicating with LEP families. In particular, the process of scheduling interpreters was described as a “black box,” with physicians and nurses expressing difficulty determining if and when in-person interpreters were scheduled and uncertainty about when to use modalities other than in-person interpretation. Participants across groups highlighted the lack of systems knowledge from medical providers and limitations within the system that make predictable, timely, and reliable access to interpreters challenging, especially for uncommon languages. Medical providers desired more in-person interpreters who can “stay as long as clinically indicated,” citing frustration associated with using phone- and video-interpretation (eg, challenges locating technology, unfamiliarity with use, unreliable functionality of equipment). Interpreters voiced wanting to take time to finish each encounter fully without “being in a hurry because the next appointment is coming soon” or “rushing… in [to the next] session sweating.”
Barrier 2: Uncertainty in Communication with LEP Families
Participants across all groups described three areas of uncertainty as detailed in Table 2: (1) what to share and how to prioritize information during encounters with LEP patients and families, (2) what is communicated during interpretation, and (3) what LEP patients and families understand.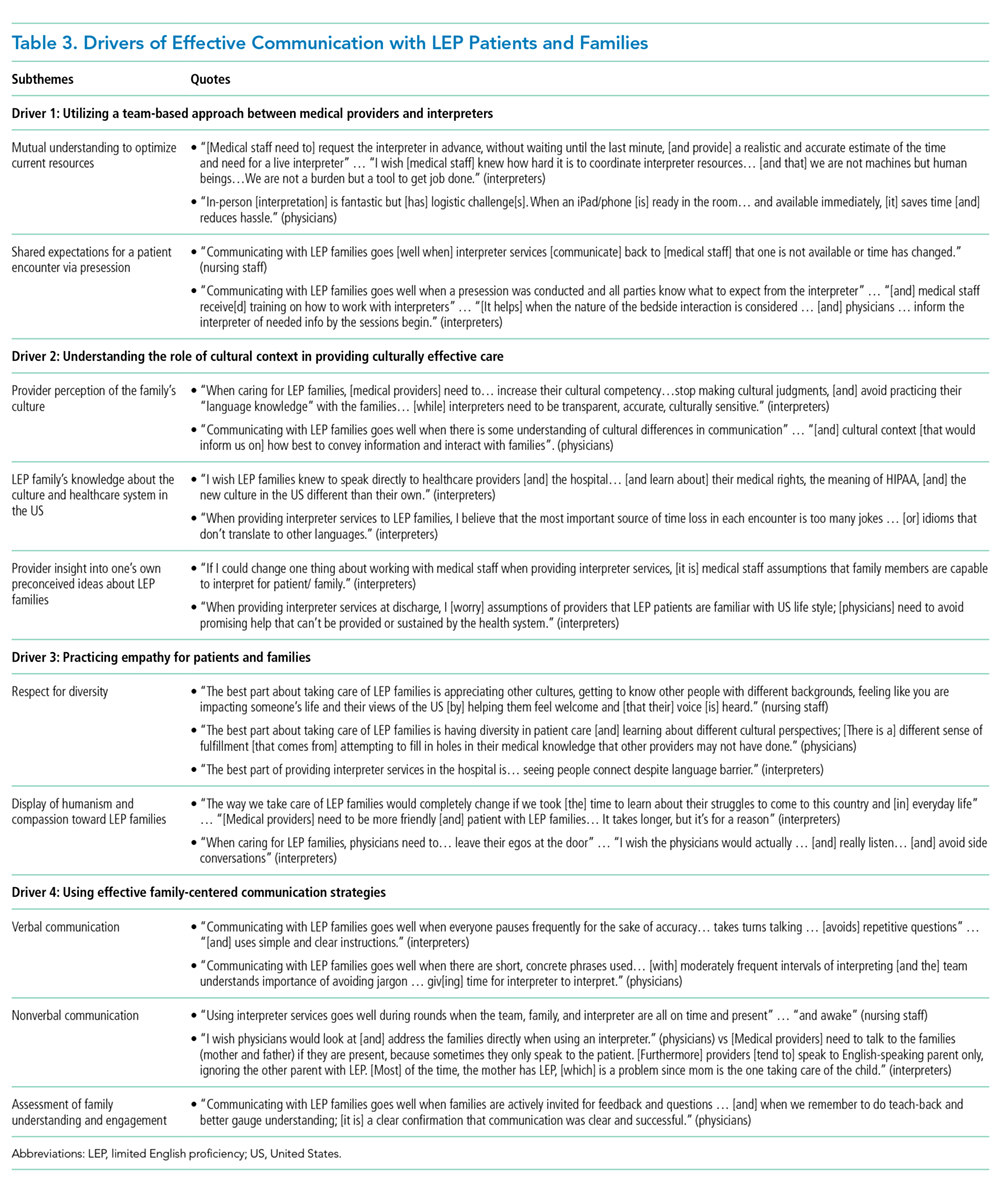
Barrier 3: Unclear and Inconsistent Expectations and Roles of Team Members
Given the complexity involved in communication between medical providers, interpreters, and families, participants across all groups reported feeling ill-prepared when navigating hospital encounters with LEP patients and families. Interpreters reported having little to no clinical context, medical providers reported having no knowledge of the assigned interpreter’s style, and both interpreters and medical providers reported that families have little idea of what to expect or how to engage. All groups voiced frustration about the lack of clarity regarding specific roles and scope of practice for each team member during an encounter, where multiple people end up “talking [or] using the interpreter at once.” Interpreters shared their expectations of medical providers to set the pace and lead conversations with LEP families. On the other hand, medical providers expressed a desire for interpreters to provide cultural context to the team without prompting and to interrupt during encounters when necessary to voice concerns or redirect conversations.
Barrier 4: Unmet Family Engagement Expectations
Participants across all groups articulated challenges with establishing rapport with LEP patients and families, sharing concerns that “inadequate communication” due to “cultural or language barriers” ultimately impacts quality of care. Participants reported decreased bidirectional engagement with and from LEP families. Medical providers not only noted difficulty in connecting with LEP families “on a more personal level” and providing frequent medical updates, but also felt that LEP families do not ask questions even when uncertain. Interpreters expressed concerns about medical providers “not [having] enough patience to answer families’ questions” while LEP families “shy away from asking questions.”
Driver 1: Utilizing a Team-Based Approach between Medical Providers and Interpreters
Participants from all groups emphasized that a mutual understanding of roles and shared expectations regarding communication and interpretation style, clinical context, and time constraints would establish a foundation for respect between medical providers and interpreters. They reported that a team-based approach to LEP patient and family encounters were crucial to achieving effective communication.
Driver 2: Understanding the Role of Cultural Context in Providing Culturally Effective Care.
Participants across all groups highlighted three different aspects of cultural context that drive effective communication: (1) medical providers’ perception of the family’s culture; (2) LEP families’ knowledge about the culture and healthcare system in the US, and (3) medical providers insight into their own preconceived ideas about LEP families.
Driver 3: Practicing Empathy for Patients and Families
All participants reported that respect for diversity and consideration of the backgrounds and perspectives of LEP patients and families are necessary. Furthermore, both medical providers and interpreters articulated a need to remain patient and mindful when interacting with LEP families despite challenges, especially since, as noted by interpreters, encounters may “take longer, but it’s for a reason.”
Driver 4: Using Effective Family-Centered Communication Strategies
Participants identified the use of effective family-centered communication principles as a driver to optimal communication. Many of the principles identified by medical providers and interpreters are generally applicable to all hospitalized patients and families regardless of English proficiency: optimizing verbal communication (eg, using shorter sentences, pausing to allow for interpretation), optimizing nonverbal communication (eg, setting, position, and body language), and assessment of family understanding and engagement (eg, use of teach back).
DISCUSSION
Frontline medical providers and interpreters identified barriers and drivers that impact communication with LEP patients and families during hospitalization. To our knowledge, this is the first study that uses a participatory method to explore the perspectives of medical providers and interpreters who care for LEP children and families in the inpatient setting. Despite existing difficulties and concerns regarding language barriers and its impact on quality of care for hospitalized LEP patients and families, participants were enthusiastic about how identified barriers and drivers may inform future improvement efforts. Notable action steps for future improvement discussed by our participants included: increased use and functionality of technology for timely and predictable access to interpreters, deliberate training for providers focused on delivery of culturally-effective care, consistent use of family-centered communication strategies including teach-back, and implementing interdisciplinary expectation setting through “presessions” before encounters with LEP families.
Participants elaborated on several barriers previously described in the literature including time constraints and technical problems.14,21,22 Such barriers may serve as deterrents to consistent and appropriate use of interpreters in healthcare settings.9 A heavy reliance on off-site interpreters (including phone- or video-interpreters) and lack of knowledge regarding resource availability likely amplified frustration for medical providers. Communication with LEP families can be daunting, especially when medical providers do not care for LEP families or work with interpreters on a regular basis.14 Standardizing the education of medical providers regarding available resources, as well as the logistics, process, and parameters for scheduling interpreters and using technology, was an action step identified by our GLA participants. Targeted education about the logistics of accessing interpreter services and having standardized ways to make technology use easier (ie, one-touch dialing in hospital rooms) has been associated with increased interpreter use and decreased interpreter-related delays in care.23
Our frontline medical providers expressed added concern about not spending as much time with LEP families. In fact, LEP families in the literature have perceived medical providers to spend less time with their children compared to their English-proficient counterparts.24 Language and cultural barriers, both perceived and real, may limit medical provider rapport with LEP patients and families14 and likely contribute to medical providers relying on their preconceived assumptions instead.25 Cultural competency education for medical providers, as highlighted by our GLA participants as an action item, can be used to provide more comprehensive and effective care.26,27
In addition to enhancing cultural humility through education, our participants emphasized the use of family-centered communication strategies as a driver of optimal family engagement and understanding. Actively inviting questions from families and utilizing teach-back, an established evidence-based strategy28-30 discussed by our participants, can be particularly powerful in assessing family understanding and engagement. While information should be presented in plain language for families in all encounters,31 these evidence-based practices are of particular importance when communicating with LEP families. They promote effective communication, empower families to share concerns in a structured manner, and allow medical providers to address matters in real-time with interpreters present.
Finally, our participants highlighted the need for partnerships between providers and interpreter services, noting unclear roles and expectations among interpreters and medical providers as a major barrier. Specifically, physicians noted confusion regarding the scope of an interpreter’s practice. Participants from GLA sessions discussed the importance of a team-based approach and suggested implementing a “presession” prior to encounters with LEP patients and families. Presessions—a concept well accepted among interpreters and recommended by consensus-based practice guidelines—enable medical providers and interpreters to establish shared expectations about scope of practice, communication, interpretation style, time constraints, and medical context prior to patient encounters.32,33
There are several limitations to our study. First, individuals who chose to participate were likely highly motivated by their clinical experiences with LEP patients and invested in improving communication with LEP families. Second, the study is limited in generalizability, as it was conducted at a single academic institution in a Midwestern city. Despite regional variations in available resources as well as patient and workforce demographics, our findings regarding major themes are in agreement with previously published literature and further add to our understanding of ways to improve communication with this vulnerable population across the care spectrum. Lastly, we were logistically limited in our ability to elicit the perspectives of LEP families due to the participatory nature of GLA; the need for multiple interpreters to simultaneously interact with LEP individuals would have not only hindered active LEP family participation but may have also biased the data generated by patients and families, as the services interpreters provide during their inpatient stay was the focus of our study. Engaging LEP families in their preferred language using participatory methods should be considered for future studies.
In conclusion, frontline providers of medical and language services identified barriers and drivers impacting the effective use of interpreter services when communicating with LEP families during hospitalization. Our enhanced understanding of barriers and drivers, as well as identified actionable interventions, will inform future improvement of communication and interactions with LEP families that contributes to effective and efficient family centered care. A framework for the development and implementation of organizational strategies aimed at improving communication with LEP families must include a thorough assessment of impact, feasibility, stakeholder involvement, and sustainability of specific interventions. While there is no simple formula to improve language services, health systems should establish and adopt language access policies, standardize communication practices, and develop processes to optimize the use of language services in the hospital. Furthermore, engagement with LEP families to better understand their perceptions and experiences with the healthcare system is crucial to improve communication between medical providers and LEP families in the inpatient setting and should be the subject of future studies.
Disclosures
The authors have no conflicts of interest to disclose.
Funding
No external funding was secured for this study. Dr. Joanna Thomson is supported by the Agency for Healthcare Research and Quality (Grant #K08 HS025138). Dr. Raglin Bignall was supported through a Ruth L. Kirschstein National Research Service Award (T32HP10027) when the study was conducted. The content is solely the responsibility of the authors and does not necessarily represent the official views of the funding organizations. The funding organizations had no role in the design, preparation, review, or approval of this paper.
1. The American Academy of Pediatrics Council on Community Pediatrics. Providing care for immigrant, migrant, and border children. Pediatrics. 2013;131(6):e2028-e2034. PubMed
2. Meneses C, Chilton L, Duffee J, et al. Council on Community Pediatrics Immigrant Health Tool Kit. The American Academy of Pediatrics. https://www.aap.org/en-us/Documents/cocp_toolkit_full.pdf. Accessed May 13, 2019.
3. Office for Civil Rights. Guidance to Federal Financial Assistance Recipients Regarding Title VI and the Prohibition Against National Origin Discrimination Affecting Limited English Proficient Persons. https://www.hhs.gov/civil-rights/for-individuals/special-topics/limited-english-proficiency/guidance-federal-financial-assistance-recipients-title-vi/index.html. Accessed May 13, 2019.
4. Lion KC, Rafton SA, Shafii J, et al. Association between language, serious adverse events, and length of stay Among hospitalized children. Hosp Pediatr. 2013;3(3):219-225. https://doi.org/10.1542/hpeds.2012-0091.
5. Lion KC, Wright DR, Desai AD, Mangione-Smith R. Costs of care for hospitalized children associated With preferred language and insurance type. Hosp Pediatr. 2017;7(2):70-78. https://doi.org/10.1542/hpeds.2016-0051.
6. Cohen AL, Rivara F, Marcuse EK, McPhillips H, Davis R. Are language barriers associated with serious medical events in hospitalized pediatric patients? Pediatrics. 2005;116(3):575-579. https://doi.org/10.1542/peds.2005-0521.
7. Samuels-Kalow ME, Stack AM, Amico K, Porter SC. Parental language and return visits to the Emergency Department After discharge. Pediatr Emerg Care. 2017;33(6):402-404. https://doi.org/10.1097/PEC.0000000000000592.
8. Unaka NI, Statile AM, Choe A, Shonna Yin H. Addressing health literacy in the inpatient setting. Curr Treat Options Pediatr. 2018;4(2):283-299. https://doi.org/10.1007/s40746-018-0122-3.
9. DeCamp LR, Kuo DZ, Flores G, O’Connor K, Minkovitz CS. Changes in language services use by US pediatricians. Pediatrics. 2013;132(2):e396-e406. https://doi.org/10.1542/peds.2012-2909.
10. Flores G. The impact of medical interpreter services on the quality of health care: A systematic review. Med Care Res Rev. 2005;62(3):255-299. https://doi.org/10.1177/1077558705275416.
11. Flores G, Abreu M, Barone CP, Bachur R, Lin H. Errors of medical interpretation and their potential clinical consequences: A comparison of professional versus hoc versus no interpreters. Ann Emerg Med. 2012;60(5):545-553. https://doi.org/10.1016/j.annemergmed.2012.01.025.
12. Anand KJ, Sepanski RJ, Giles K, Shah SH, Juarez PD. Pediatric intensive care unit mortality among Latino children before and after a multilevel health care delivery intervention. JAMA Pediatr. 2015;169(4):383-390. https://doi.org/10.1001/jamapediatrics.2014.3789.
13. The Joint Commission. Advancing Effective Communication, Cultural Competence, and Patient- and Family-Centered Care: A Roadmap for Hospitals. Oakbrook Terrace, IL: The Joint Commission; 2010.
14. Hernandez RG, Cowden JD, Moon M et al. Predictors of resident satisfaction in caring for limited English proficient families: a multisite study. Acad Pediatr. 2014;14(2):173-180. https://doi.org/10.1016/j.acap.2013.12.002.
15. Vaughn LM, Lohmueller M. Calling all stakeholders: group-level assessment (GLA)-a qualitative and participatory method for large groups. Eval Rev. 2014;38(4):336-355. https://doi.org/10.1177/0193841X14544903.
16. Vaughn LM, Jacquez F, Zhao J, Lang M. Partnering with students to explore the health needs of an ethnically diverse, low-resource school: an innovative large group assessment approach. Fam Commun Health. 2011;34(1):72-84. https://doi.org/10.1097/FCH.0b013e3181fded12.
17. Gosdin CH, Vaughn L. Perceptions of physician bedside handoff with nurse and family involvement. Hosp Pediatr. 2012;2(1):34-38. https://doi.org/10.1542/hpeds.2011-0008-2.
18. Graham KE, Schellinger AR, Vaughn LM. Developing strategies for positive change: transitioning foster youth to adulthood. Child Youth Serv Rev. 2015;54:71-79. https://doi.org/10.1016/j.childyouth.2015.04.014.
19. Vaughn LM. Group level assessment: A Large Group Method for Identifying Primary Issues and Needs within a community. London2014. http://methods.sagepub.com/case/group-level-assessment-large-group-primary-issues-needs-community. Accessed 2017/07/26.
20. Association of American Medical Colleges Electronic Residency Application Service. ERAS 2018 MyERAS Application Worksheet: Language Fluency. Washington, DC:: Association of American Medical Colleges; 2018:5.
21. Brisset C, Leanza Y, Laforest K. Working with interpreters in health care: A systematic review and meta-ethnography of qualitative studies. Patient Educ Couns. 2013;91(2):131-140. https://doi.org/10.1016/j.pec.2012.11.008.
22. Wiking E, Saleh-Stattin N, Johansson SE, Sundquist J. A description of some aspects of the triangular meeting between immigrant patients, their interpreters and GPs in primary health care in Stockholm, Sweden. Fam Pract. 2009;26(5):377-383. https://doi.org/10.1093/fampra/cmp052.
23. Lion KC, Ebel BE, Rafton S et al. Evaluation of a quality improvement intervention to increase use of telephonic interpretation. Pediatrics. 2015;135(3):e709-e716. https://doi.org/10.1542/peds.2014-2024.
24. Zurca AD, Fisher KR, Flor RJ, et al. Communication with limited English-proficient families in the PICU. Hosp Pediatr. 2017;7(1):9-15. https://doi.org/10.1542/hpeds.2016-0071.
25. Kodjo C. Cultural competence in clinician communication. Pediatr Rev. 2009;30(2):57-64. https://doi.org/10.1542/pir.30-2-57.
26. Britton CV, American Academy of Pediatrics Committee on Pediatric Workforce. Ensuring culturally effective pediatric care: implications for education and health policy. Pediatrics. 2004;114(6):1677-1685. https://doi.org/10.1542/peds.2004-2091.
27. The American Academy of Pediatrics. Culturally Effective Care Toolkit: Providing Cuturally Effective Pediatric Care; 2018. https://www.aap.org/en-us/professional-resources/practice-transformation/managing-patients/Pages/effective-care.aspx. Accessed May 13, 2019.
28. Starmer AJ, Spector ND, Srivastava R, et al. Changes in medical errors after implementation of a handoff program. N Engl J Med. 2014;371(19):1803-1812. https://doi.org/10.1056/NEJMsa1405556.
29. Jager AJ, Wynia MK. Who gets a teach-back? Patient-reported incidence of experiencing a teach-back. J Health Commun. 2012;17 Supplement 3:294-302. https://doi.org/10.1080/10810730.2012.712624.
30. Kornburger C, Gibson C, Sadowski S, Maletta K, Klingbeil C. Using “teach-back” to promote a safe transition from hospital to home: an evidence-based approach to improving the discharge process. J Pediatr Nurs. 2013;28(3):282-291. https://doi.org/10.1016/j.pedn.2012.10.007.
31. Abrams MA, Klass P, Dreyer BP. Health literacy and children: recommendations for action. Pediatrics. 2009;124 Supplement 3:S327-S331. https://doi.org/10.1542/peds.2009-1162I.
32. Betancourt JR, Renfrew MR, Green AR, Lopez L, Wasserman M. Improving Patient Safety Systems for Patients with Limited English Proficiency: a Guide for Hospitals. Agency for Healthcare Research and Quality; 2012.33. The National Council on Interpreting in Health Care. Best Practices for Communicating Through an Interpreter . https://refugeehealthta.org/access-to-care/language-access/best-practices-communicating-through-an-interpreter/. Accessed May 19, 2019.
Immigrant children make up the fastest growing segment of the population in the United States.1 While most immigrant children are fluent in English, approximately 40% live with a parent who has limited English proficiency (LEP; ie, speaks English less than “very well”).2,3 In pediatrics, LEP status has been associated with longer hospitalizations,4 higher hospitalization costs,5 increased risk for serious adverse medical events,4,6 and more frequent emergency department reutilization.7 In the inpatient setting, multiple aspects of care present a variety of communication challenges,8 which are amplified by shift work and workflow complexity that result in patients and families interacting with numerous providers over the course of an inpatient stay.
Increasing access to trained professional interpreters when caring for LEP patients improves communication, patient satisfaction, adherence, and mortality.9-12 However, even when access to interpreter services is established, effective use is not guaranteed.13 Up to 57% of pediatricians report relying on family members to communicate with LEP patients and their caregivers;9 23% of pediatric residents categorized LEP encounters as frustrating while 78% perceived care of LEP patients to be “misdirected” (eg, delay in diagnosis or discharge) because of associated language barriers.14
Understanding experiences of frontline inpatient medical providers and interpreters is crucial in identifying challenges and ways to optimize communication for hospitalized LEP patients and families. However, there is a paucity of literature exploring the perspectives of medical providers and interpreters as it relates to communication with hospitalized LEP children and families. In this study, we sought to identify barriers and drivers of effective communication with pediatric patients and families with LEP in the inpatient setting from the perspective of frontline medical providers and interpreters.
METHODS
Study Design
This qualitative study used Group Level Assessment (GLA), a structured participatory methodology that allows diverse groups of stakeholders to generate and evaluate data in interactive sessions.15-18 GLA structure promotes active participation, group problem-solving, and development of actionable plans, distinguishing it from focus groups and in-depth semistructured interviews.15,19 This study received a human subject research exemption by the institutional review board.
Study Setting
Cincinnati Children’s Hospital Medical Center (CCHMC) is a large quaternary care center with ~200 patient encounters each day who require the use of interpreter services. Interpreters (in-person, video, and phone) are utilized during admission, formal family-centered rounds, hospital discharge, and other encounters with physicians, nurses, and other healthcare professionals. In-person interpreters are available in-house for Spanish and Arabic, with 18 additional languages available through regional vendors. Despite available resources, there is no standard way in which medical providers and interpreters work with one another.
Study Participants and Recruitment
Medical providers who care for hospitalized general pediatric patients were eligible to participate, including attending physicians, resident physicians, bedside nurses, and inpatient ancillary staff (eg, respiratory therapists, physical therapists). Interpreters employed by CCHMC with experience in the inpatient setting were also eligible. Individuals were recruited based on published recommendations to optimize discussion and group-thinking.15 Each participant was asked to take part in one GLA session. Participants were assigned to specific sessions based on roles (ie, physicians, nurses, and interpreters) to maximize engagement and minimize the impact of hierarchy.
Study Procedure
GLA involves a seven-step structured process (Appendix 1): climate setting, generating, appreciating, reflecting, understanding, selecting, and action.15,18 Qualitative data were generated individually and anonymously by participants on flip charts in response to prompts such as: “I worry that LEP families___,” “The biggest challenge when using interpreter services is___,” and “I find___ works well in providing care for LEP families.” Prompts were developed by study investigators, modified based on input from nursing and interpreter services leadership, and finalized by GLA facilitators. Fifty-one unique prompts were utilized (Appendix 2); the number of prompts used (ranging from 15 to 32 prompts) per session was based on published recommendations.15 During sessions, study investigators took detailed notes, including verbatim transcription of participant quotes. Upon conclusion of the session, each participant completed a demographic survey, including years of experience, languages spoken and perceived fluency,20 and ethnicity.
Data Analysis
Within each session, under the guidance of trained and experienced GLA facilitators (WB, HV), participants distilled and summarized qualitative data into themes, discussed and prioritized themes, and generated action items. Following completion of all sessions, analyzed data was compiled by the research team to determine similarities and differences across groups based on participant roles, consolidate themes into barriers and drivers of communication with LEP families, and determine any overlap of priorities for action. Findings were shared back with each group to ensure accuracy and relevance.
RESULTS
Participants
A total of 64 individuals participated (Table 1): hospital medicine physicians and residents (56%), inpatient nurses and ancillary staff (16%), and interpreters (28%). While 81% of physicians spoke multiple languages, only 25% reported speaking them well; two physicians were certified to communicate medical information without an interpreter present.
Themes Resulting from GLA Sessions
A total of four barriers (Table 2) and four drivers (Table 3) of effective communication with pediatric LEP patients and their families in the inpatient setting were identified by participants. Participants across all groups, despite enthusiasm around improving communication, were concerned about quality of care LEP families received, noting that the system is “designed to deliver less-good care” and that “we really haven’t figured out how to care for [LEP patients and families] in a [high-]quality and reliable way.” Variation in theme discussion was noted between groups based on participant role: physicians voiced concern about rapport with LEP families, nurses emphasized actionable tasks, and interpreters focused on heightened challenges in times of stress.
Barrier 1: Difficulties Accessing Interpreter Services
Medical providers (physicians and nurses) identified the “opaque process to access [interpreter] services” as one of their biggest challenges when communicating with LEP families. In particular, the process of scheduling interpreters was described as a “black box,” with physicians and nurses expressing difficulty determining if and when in-person interpreters were scheduled and uncertainty about when to use modalities other than in-person interpretation. Participants across groups highlighted the lack of systems knowledge from medical providers and limitations within the system that make predictable, timely, and reliable access to interpreters challenging, especially for uncommon languages. Medical providers desired more in-person interpreters who can “stay as long as clinically indicated,” citing frustration associated with using phone- and video-interpretation (eg, challenges locating technology, unfamiliarity with use, unreliable functionality of equipment). Interpreters voiced wanting to take time to finish each encounter fully without “being in a hurry because the next appointment is coming soon” or “rushing… in [to the next] session sweating.”
Barrier 2: Uncertainty in Communication with LEP Families
Participants across all groups described three areas of uncertainty as detailed in Table 2: (1) what to share and how to prioritize information during encounters with LEP patients and families, (2) what is communicated during interpretation, and (3) what LEP patients and families understand.
Barrier 3: Unclear and Inconsistent Expectations and Roles of Team Members
Given the complexity involved in communication between medical providers, interpreters, and families, participants across all groups reported feeling ill-prepared when navigating hospital encounters with LEP patients and families. Interpreters reported having little to no clinical context, medical providers reported having no knowledge of the assigned interpreter’s style, and both interpreters and medical providers reported that families have little idea of what to expect or how to engage. All groups voiced frustration about the lack of clarity regarding specific roles and scope of practice for each team member during an encounter, where multiple people end up “talking [or] using the interpreter at once.” Interpreters shared their expectations of medical providers to set the pace and lead conversations with LEP families. On the other hand, medical providers expressed a desire for interpreters to provide cultural context to the team without prompting and to interrupt during encounters when necessary to voice concerns or redirect conversations.
Barrier 4: Unmet Family Engagement Expectations
Participants across all groups articulated challenges with establishing rapport with LEP patients and families, sharing concerns that “inadequate communication” due to “cultural or language barriers” ultimately impacts quality of care. Participants reported decreased bidirectional engagement with and from LEP families. Medical providers not only noted difficulty in connecting with LEP families “on a more personal level” and providing frequent medical updates, but also felt that LEP families do not ask questions even when uncertain. Interpreters expressed concerns about medical providers “not [having] enough patience to answer families’ questions” while LEP families “shy away from asking questions.”
Driver 1: Utilizing a Team-Based Approach between Medical Providers and Interpreters
Participants from all groups emphasized that a mutual understanding of roles and shared expectations regarding communication and interpretation style, clinical context, and time constraints would establish a foundation for respect between medical providers and interpreters. They reported that a team-based approach to LEP patient and family encounters were crucial to achieving effective communication.
Driver 2: Understanding the Role of Cultural Context in Providing Culturally Effective Care.
Participants across all groups highlighted three different aspects of cultural context that drive effective communication: (1) medical providers’ perception of the family’s culture; (2) LEP families’ knowledge about the culture and healthcare system in the US, and (3) medical providers insight into their own preconceived ideas about LEP families.
Driver 3: Practicing Empathy for Patients and Families
All participants reported that respect for diversity and consideration of the backgrounds and perspectives of LEP patients and families are necessary. Furthermore, both medical providers and interpreters articulated a need to remain patient and mindful when interacting with LEP families despite challenges, especially since, as noted by interpreters, encounters may “take longer, but it’s for a reason.”
Driver 4: Using Effective Family-Centered Communication Strategies
Participants identified the use of effective family-centered communication principles as a driver to optimal communication. Many of the principles identified by medical providers and interpreters are generally applicable to all hospitalized patients and families regardless of English proficiency: optimizing verbal communication (eg, using shorter sentences, pausing to allow for interpretation), optimizing nonverbal communication (eg, setting, position, and body language), and assessment of family understanding and engagement (eg, use of teach back).
DISCUSSION
Frontline medical providers and interpreters identified barriers and drivers that impact communication with LEP patients and families during hospitalization. To our knowledge, this is the first study that uses a participatory method to explore the perspectives of medical providers and interpreters who care for LEP children and families in the inpatient setting. Despite existing difficulties and concerns regarding language barriers and its impact on quality of care for hospitalized LEP patients and families, participants were enthusiastic about how identified barriers and drivers may inform future improvement efforts. Notable action steps for future improvement discussed by our participants included: increased use and functionality of technology for timely and predictable access to interpreters, deliberate training for providers focused on delivery of culturally-effective care, consistent use of family-centered communication strategies including teach-back, and implementing interdisciplinary expectation setting through “presessions” before encounters with LEP families.
Participants elaborated on several barriers previously described in the literature including time constraints and technical problems.14,21,22 Such barriers may serve as deterrents to consistent and appropriate use of interpreters in healthcare settings.9 A heavy reliance on off-site interpreters (including phone- or video-interpreters) and lack of knowledge regarding resource availability likely amplified frustration for medical providers. Communication with LEP families can be daunting, especially when medical providers do not care for LEP families or work with interpreters on a regular basis.14 Standardizing the education of medical providers regarding available resources, as well as the logistics, process, and parameters for scheduling interpreters and using technology, was an action step identified by our GLA participants. Targeted education about the logistics of accessing interpreter services and having standardized ways to make technology use easier (ie, one-touch dialing in hospital rooms) has been associated with increased interpreter use and decreased interpreter-related delays in care.23
Our frontline medical providers expressed added concern about not spending as much time with LEP families. In fact, LEP families in the literature have perceived medical providers to spend less time with their children compared to their English-proficient counterparts.24 Language and cultural barriers, both perceived and real, may limit medical provider rapport with LEP patients and families14 and likely contribute to medical providers relying on their preconceived assumptions instead.25 Cultural competency education for medical providers, as highlighted by our GLA participants as an action item, can be used to provide more comprehensive and effective care.26,27
In addition to enhancing cultural humility through education, our participants emphasized the use of family-centered communication strategies as a driver of optimal family engagement and understanding. Actively inviting questions from families and utilizing teach-back, an established evidence-based strategy28-30 discussed by our participants, can be particularly powerful in assessing family understanding and engagement. While information should be presented in plain language for families in all encounters,31 these evidence-based practices are of particular importance when communicating with LEP families. They promote effective communication, empower families to share concerns in a structured manner, and allow medical providers to address matters in real-time with interpreters present.
Finally, our participants highlighted the need for partnerships between providers and interpreter services, noting unclear roles and expectations among interpreters and medical providers as a major barrier. Specifically, physicians noted confusion regarding the scope of an interpreter’s practice. Participants from GLA sessions discussed the importance of a team-based approach and suggested implementing a “presession” prior to encounters with LEP patients and families. Presessions—a concept well accepted among interpreters and recommended by consensus-based practice guidelines—enable medical providers and interpreters to establish shared expectations about scope of practice, communication, interpretation style, time constraints, and medical context prior to patient encounters.32,33
There are several limitations to our study. First, individuals who chose to participate were likely highly motivated by their clinical experiences with LEP patients and invested in improving communication with LEP families. Second, the study is limited in generalizability, as it was conducted at a single academic institution in a Midwestern city. Despite regional variations in available resources as well as patient and workforce demographics, our findings regarding major themes are in agreement with previously published literature and further add to our understanding of ways to improve communication with this vulnerable population across the care spectrum. Lastly, we were logistically limited in our ability to elicit the perspectives of LEP families due to the participatory nature of GLA; the need for multiple interpreters to simultaneously interact with LEP individuals would have not only hindered active LEP family participation but may have also biased the data generated by patients and families, as the services interpreters provide during their inpatient stay was the focus of our study. Engaging LEP families in their preferred language using participatory methods should be considered for future studies.
In conclusion, frontline providers of medical and language services identified barriers and drivers impacting the effective use of interpreter services when communicating with LEP families during hospitalization. Our enhanced understanding of barriers and drivers, as well as identified actionable interventions, will inform future improvement of communication and interactions with LEP families that contributes to effective and efficient family centered care. A framework for the development and implementation of organizational strategies aimed at improving communication with LEP families must include a thorough assessment of impact, feasibility, stakeholder involvement, and sustainability of specific interventions. While there is no simple formula to improve language services, health systems should establish and adopt language access policies, standardize communication practices, and develop processes to optimize the use of language services in the hospital. Furthermore, engagement with LEP families to better understand their perceptions and experiences with the healthcare system is crucial to improve communication between medical providers and LEP families in the inpatient setting and should be the subject of future studies.
Disclosures
The authors have no conflicts of interest to disclose.
Funding
No external funding was secured for this study. Dr. Joanna Thomson is supported by the Agency for Healthcare Research and Quality (Grant #K08 HS025138). Dr. Raglin Bignall was supported through a Ruth L. Kirschstein National Research Service Award (T32HP10027) when the study was conducted. The content is solely the responsibility of the authors and does not necessarily represent the official views of the funding organizations. The funding organizations had no role in the design, preparation, review, or approval of this paper.
1. The American Academy of Pediatrics Council on Community Pediatrics. Providing care for immigrant, migrant, and border children. Pediatrics. 2013;131(6):e2028-e2034. PubMed
2. Meneses C, Chilton L, Duffee J, et al. Council on Community Pediatrics Immigrant Health Tool Kit. The American Academy of Pediatrics. https://www.aap.org/en-us/Documents/cocp_toolkit_full.pdf. Accessed May 13, 2019.
3. Office for Civil Rights. Guidance to Federal Financial Assistance Recipients Regarding Title VI and the Prohibition Against National Origin Discrimination Affecting Limited English Proficient Persons. https://www.hhs.gov/civil-rights/for-individuals/special-topics/limited-english-proficiency/guidance-federal-financial-assistance-recipients-title-vi/index.html. Accessed May 13, 2019.
4. Lion KC, Rafton SA, Shafii J, et al. Association between language, serious adverse events, and length of stay Among hospitalized children. Hosp Pediatr. 2013;3(3):219-225. https://doi.org/10.1542/hpeds.2012-0091.
5. Lion KC, Wright DR, Desai AD, Mangione-Smith R. Costs of care for hospitalized children associated With preferred language and insurance type. Hosp Pediatr. 2017;7(2):70-78. https://doi.org/10.1542/hpeds.2016-0051.
6. Cohen AL, Rivara F, Marcuse EK, McPhillips H, Davis R. Are language barriers associated with serious medical events in hospitalized pediatric patients? Pediatrics. 2005;116(3):575-579. https://doi.org/10.1542/peds.2005-0521.
7. Samuels-Kalow ME, Stack AM, Amico K, Porter SC. Parental language and return visits to the Emergency Department After discharge. Pediatr Emerg Care. 2017;33(6):402-404. https://doi.org/10.1097/PEC.0000000000000592.
8. Unaka NI, Statile AM, Choe A, Shonna Yin H. Addressing health literacy in the inpatient setting. Curr Treat Options Pediatr. 2018;4(2):283-299. https://doi.org/10.1007/s40746-018-0122-3.
9. DeCamp LR, Kuo DZ, Flores G, O’Connor K, Minkovitz CS. Changes in language services use by US pediatricians. Pediatrics. 2013;132(2):e396-e406. https://doi.org/10.1542/peds.2012-2909.
10. Flores G. The impact of medical interpreter services on the quality of health care: A systematic review. Med Care Res Rev. 2005;62(3):255-299. https://doi.org/10.1177/1077558705275416.
11. Flores G, Abreu M, Barone CP, Bachur R, Lin H. Errors of medical interpretation and their potential clinical consequences: A comparison of professional versus hoc versus no interpreters. Ann Emerg Med. 2012;60(5):545-553. https://doi.org/10.1016/j.annemergmed.2012.01.025.
12. Anand KJ, Sepanski RJ, Giles K, Shah SH, Juarez PD. Pediatric intensive care unit mortality among Latino children before and after a multilevel health care delivery intervention. JAMA Pediatr. 2015;169(4):383-390. https://doi.org/10.1001/jamapediatrics.2014.3789.
13. The Joint Commission. Advancing Effective Communication, Cultural Competence, and Patient- and Family-Centered Care: A Roadmap for Hospitals. Oakbrook Terrace, IL: The Joint Commission; 2010.
14. Hernandez RG, Cowden JD, Moon M et al. Predictors of resident satisfaction in caring for limited English proficient families: a multisite study. Acad Pediatr. 2014;14(2):173-180. https://doi.org/10.1016/j.acap.2013.12.002.
15. Vaughn LM, Lohmueller M. Calling all stakeholders: group-level assessment (GLA)-a qualitative and participatory method for large groups. Eval Rev. 2014;38(4):336-355. https://doi.org/10.1177/0193841X14544903.
16. Vaughn LM, Jacquez F, Zhao J, Lang M. Partnering with students to explore the health needs of an ethnically diverse, low-resource school: an innovative large group assessment approach. Fam Commun Health. 2011;34(1):72-84. https://doi.org/10.1097/FCH.0b013e3181fded12.
17. Gosdin CH, Vaughn L. Perceptions of physician bedside handoff with nurse and family involvement. Hosp Pediatr. 2012;2(1):34-38. https://doi.org/10.1542/hpeds.2011-0008-2.
18. Graham KE, Schellinger AR, Vaughn LM. Developing strategies for positive change: transitioning foster youth to adulthood. Child Youth Serv Rev. 2015;54:71-79. https://doi.org/10.1016/j.childyouth.2015.04.014.
19. Vaughn LM. Group level assessment: A Large Group Method for Identifying Primary Issues and Needs within a community. London2014. http://methods.sagepub.com/case/group-level-assessment-large-group-primary-issues-needs-community. Accessed 2017/07/26.
20. Association of American Medical Colleges Electronic Residency Application Service. ERAS 2018 MyERAS Application Worksheet: Language Fluency. Washington, DC:: Association of American Medical Colleges; 2018:5.
21. Brisset C, Leanza Y, Laforest K. Working with interpreters in health care: A systematic review and meta-ethnography of qualitative studies. Patient Educ Couns. 2013;91(2):131-140. https://doi.org/10.1016/j.pec.2012.11.008.
22. Wiking E, Saleh-Stattin N, Johansson SE, Sundquist J. A description of some aspects of the triangular meeting between immigrant patients, their interpreters and GPs in primary health care in Stockholm, Sweden. Fam Pract. 2009;26(5):377-383. https://doi.org/10.1093/fampra/cmp052.
23. Lion KC, Ebel BE, Rafton S et al. Evaluation of a quality improvement intervention to increase use of telephonic interpretation. Pediatrics. 2015;135(3):e709-e716. https://doi.org/10.1542/peds.2014-2024.
24. Zurca AD, Fisher KR, Flor RJ, et al. Communication with limited English-proficient families in the PICU. Hosp Pediatr. 2017;7(1):9-15. https://doi.org/10.1542/hpeds.2016-0071.
25. Kodjo C. Cultural competence in clinician communication. Pediatr Rev. 2009;30(2):57-64. https://doi.org/10.1542/pir.30-2-57.
26. Britton CV, American Academy of Pediatrics Committee on Pediatric Workforce. Ensuring culturally effective pediatric care: implications for education and health policy. Pediatrics. 2004;114(6):1677-1685. https://doi.org/10.1542/peds.2004-2091.
27. The American Academy of Pediatrics. Culturally Effective Care Toolkit: Providing Cuturally Effective Pediatric Care; 2018. https://www.aap.org/en-us/professional-resources/practice-transformation/managing-patients/Pages/effective-care.aspx. Accessed May 13, 2019.
28. Starmer AJ, Spector ND, Srivastava R, et al. Changes in medical errors after implementation of a handoff program. N Engl J Med. 2014;371(19):1803-1812. https://doi.org/10.1056/NEJMsa1405556.
29. Jager AJ, Wynia MK. Who gets a teach-back? Patient-reported incidence of experiencing a teach-back. J Health Commun. 2012;17 Supplement 3:294-302. https://doi.org/10.1080/10810730.2012.712624.
30. Kornburger C, Gibson C, Sadowski S, Maletta K, Klingbeil C. Using “teach-back” to promote a safe transition from hospital to home: an evidence-based approach to improving the discharge process. J Pediatr Nurs. 2013;28(3):282-291. https://doi.org/10.1016/j.pedn.2012.10.007.
31. Abrams MA, Klass P, Dreyer BP. Health literacy and children: recommendations for action. Pediatrics. 2009;124 Supplement 3:S327-S331. https://doi.org/10.1542/peds.2009-1162I.
32. Betancourt JR, Renfrew MR, Green AR, Lopez L, Wasserman M. Improving Patient Safety Systems for Patients with Limited English Proficiency: a Guide for Hospitals. Agency for Healthcare Research and Quality; 2012.33. The National Council on Interpreting in Health Care. Best Practices for Communicating Through an Interpreter . https://refugeehealthta.org/access-to-care/language-access/best-practices-communicating-through-an-interpreter/. Accessed May 19, 2019.
© 2019 Society of Hospital Medicine
The Role of Adolescent Acne Treatment in Formation of Scars Among Patients With Persistent Adult Acne: Evidence From an Observational Study
In the last 20 years, the incidence of acne lesions in adults has markedly increased. 1 Acne affects adults (individuals older than 25 years) and is no longer a condition limited to adolescents and young adults (individuals younger than 25 years). According to Dreno et al, 2 the accepted age threshold for the onset of adult acne is 25 years. 1-3 In 2013, the term adult acne was defined. 2 Among patients with adult acne, there are 2 subtypes: (1) persistent adult acne, which is a continuation or recurrence of adolescent acne, affecting approximately 80% of patients, and (2) late-onset acne, affecting approximately 20% of patients. 4
Clinical symptoms of adult acne and available treatment modalities have been explored in the literature. Daily clinical experience shows that additional difficulties involved in the management of adult acne patients are related mainly to a high therapeutic failure rate in acne patients older than 25 years. 5 Persistent adult acne seems to be noteworthy because it causes long-term symptoms, and patients experience uncontrollable recurrences.
It is believed that adult acne often is resistant to treatment. 2 Adult skin is more sensitive to topical agents, leading to more irritation by medications intended for external use and cosmetics. 6 Scars in these patients are a frequent and undesirable consequence. 3
Effective treatment of acne encompasses oral antibiotics, topical and systemic retinoids, and oral contraceptive pills (OCPs). For years, oral subantimicrobial doses of cyclines have been recommended for acne treatment. Topical and oral retinoids have been successfully used for more than 30 years as important therapeutic options. 7 More recent evidence-based guidelines for acne issued by the American Academy of Dermatology 8 and the European Dermatology Forum 9 also show that retinoids play an important role in acne therapy. Their anti-inflammatory activity acts against comedones and their precursors (microcomedones). Successful antiacne therapy not only achieves a smooth face without comedones but also minimizes scar formation, postinflammatory discoloration, and long-lasting postinflammatory erythema. 10 Oral contraceptives have a mainly antiseborrheic effect. 11
Our study sought to analyze the potential influence of therapy during adolescent acne on patients who later developed adult acne. Particular attention was given to the use of oral antibiotics, isotretinoin, and topical retinoids for adolescent acne and their potential role in diminishing scar formation in adult acne.
Materials and Methods
Patient Demographics and Selection
A population-based study of Polish patients with adult acne was conducted. Patients were included in the study group on a consecutive basis from among those who visited our outpatient dermatology center from May 2015 to January 2016. A total of 111 patients (101 women [90.99%] and 10 men [9.01%]) were examined. The study group comprised patients aged 25 years and older who were treated for adult acne (20 patients [18.02%] were aged 25–29 years, 61 [54.95%] were aged 30–39 years, and 30 [27.02%] were 40 years or older).
The following inclusion criteria were used: observation period of at least 6 months in our dermatologic center for patients diagnosed with adult acne, at least 2 dermatologic visits for adult acne prior to the study, written informed consent for study participation and data processing (the aim of the study was explained to each participant by a dermatologist), and age 25 years or older. Exclusion criteria included those who were younger than 25 years, those who had only 1 dermatologic visit at our dermatology center, and those who were unwilling to participate or did not provide written informed consent. Our study was conducted according to Good Clinical Practice.
Data Collection
To obtain data with the highest degree of reliability, 3 sources of information were used: (1) a detailed medical interview conducted by one experienced dermatologist (E.C.) at our dermatology center at the first visit in all study participants, (2) a clinical examination that yielded results necessary for the assessment of scars using a method outlined by Jacob et al, 12 and (3) information included in available medical records. These data were then statistically analyzed.
Statistical Analysis
The results were presented as frequency plots, and a Fisher exact test was conducted to obtain a statistical comparison of the distributions of analyzed data. Unless otherwise indicated, 5% was adopted as the significance level. The statistical analysis was performed using Stata 14 software (StataCorp LLC, College Station, Texas).
Results
Incidence of Different Forms of Adult Acne
To analyze the onset of acne, patients were categorized into 1 of 2 groups: those with persistent adult acne (81.98%) and those with late-onset adult acne (ie, developed after 25 years of age)(18.02%).
Age at Initiation of Dermatologic Treatment
Of the patients with persistent adult acne, 31.87% first visited a dermatologist the same year that the first acne lesions appeared, 36.26% postponed the first visit by at least 5 years (Figure 1), and 23.08% started treatment at least 10 years after acne first appeared. Among patients with persistent adult acne, 76.92% began dermatologic treatment before 25 years of age, and 23.08% began treatment after 25 years of age. Of the latter, 28.57% did not start therapy until they were older than 35 years.

Severity of Adolescent Acne
In the persistent adult acne group, the severity of adolescent acne was assessed during the medical interview as well as detailed histories in medical records. The activity of acne was evaluated at 2-year intervals with the use of a 10-point scale: 1 to 3 points indicated mild acne (7.69% of patients), 4 to 6 points indicated moderate acne (24.18%), and 7 to 10 points indicated severe acne (68.13%).
Treatment of Persistent Acne in Adolescence
Treatment was comprised of oral therapy with antibiotics, isotretinoin, and/or application of topical retinoids (sometimes supported with OCPs). Monotherapy was the standard of treatment more than 25 years ago when patients with persistent adult acne were treated as adolescents or young adults. As many as 43.96% of patients with persistent adult acne did not receive any of these therapies before 25 years of age; rather, they used antiacne cosmetics or beauty procedures. Furthermore, 50.55% of patients were treated with oral antibiotics (Figure 2). Topical retinoids were used in 19.78% of patients and isotretinoin was used in 16.48%. Incidentally, OCPs were given to 26.5%. In the course of adolescent acne, 31.87% of patients received 2 to 4 courses of treatment with either antibiotics or retinoids (oral or topical), and 5.49% were treated with 5 or more courses of treatment (Figure 3). The analysis of each treatment revealed that only 1 patient received 4 courses of isotretinoin. Five courses of oral antibiotics were given in 1 patient, and 3 courses of topical retinoids were given in the same patient.


Topical Retinoids
In an analysis of the number of treatments with topical retinoids completed by patients with persistent adult acne, it was established that 80.22% of patients never used topical retinoids for acne during adolescence. Additionally, 12.08% of these patients completed 1 course of treatment, and 7.69% completed 2 to 4 treatments. However, after 25 years of age, only 25.27% of the patients with persistent adult acne were not treated with topical retinoids, and 35.16% completed more than 2 courses of treatment.
Duration of Treatment
Because adult acne is a chronic disease, the mean number of years that patients received treatment over the disease course was analyzed. In the case of persistent adult acne, the mean duration of treatment, including therapy received during adolescence, was more than 13 years. At the time of the study, more than 30% of patients had been undergoing treatment of adult acne for more than 20 years. Scars— The proportion of patients with persistent adult acne who experienced scarring was evaluated. In the persistent adult acne group, scars were identified in 53.85% of patients. Scars appeared only during adolescence in 26.37% of patients with persistent adult acne, scars appeared only after 25 years of age in 21.97% of patients, and scars appeared in adolescence as well as adulthood in 30.77% of patients.
In an analysis of patients with persistent adult acne who experienced scarring after 25 years of age, the proportion of patients with untreated adolescent acne and those who were treated with antibiotics only was not significantly different (60% vs 64%; P = .478)(Table). The inclusion of topical retinoids into treatment decreased the proportion of scars (isotretinoin: 20%, P = .009; topical retinoids: 38.89%, P = .114).

Comment
Persistent Adult Acne
Patients with symptoms of persistent adult acne represented 81.98% of the study population, which was similar to a 1999 study by Goulden et al, 1 a 2001 study by Shaw and White, 13 and a 2009 report by Schmidt et al. 14 Of these patients with persistent adult acne, 23.08% initiated therapy after 25 years of age, and 23.08% started treatment at least 10 years after acne lesions first appeared. However, it is noteworthy that 68.13% of all patients with persistent adult acne assessed their disease as severe.
Treatment Modalities for Adult Acne
Over the last 5 years, some researchers have attempted to make recommendations for the treatment of adult acne based on standards adopted for the treatment of adolescent acne. 2,9,15 First-line treatment of patients with adult comedonal acne is topical retinoids. 9 The recommended treatment of mild to moderate adult inflammatory acne involves topical drugs, including retinoids, azelaic acid, or benzoyl peroxide, or oral medications, including antibiotics, OCPs, or antiandrogens. In severe inflammatory acne, the recommended treatment involves oral isotretinoin or combined therapies; the latter seems to be the most effective. 16 Furthermore, this therapy has been adjusted to the patient’s current clinical condition; general individual sensitivity of the skin to irritation and the risk for irritant activity of topical medications; and life situation, such as planned pregnancies and intended use of OCPs due to the risk for teratogenic effects of drugs. 17
To assess available treatment modalities, oral therapy with antibiotics or isotretinoin as well as topical retinoids were selected for our analysis. It is difficult to determine an exclusive impact of OCPs as acne treatment; according to our study, many female patients use hormone therapy for other medical conditions or contraception, and only a small proportion of these patients are prescribed hormone treatment for acne. We found that 43.96% of patients with persistent adult acne underwent no treatment with antibiotics, isotretinoin, or topical retinoids in adolescence. Patients who did not receive any of these treatments came only for single visits to a dermatologist, did not comply to a recommended therapy, or used only cosmetics or beauty procedures. We found that 80.22% of patients with persistent adult acne never used topical retinoids during adolescence and did not receive maintenance therapy, which may be attributed to the fact that there were no strict recommendations regarding retinoid treatment when these patients were adolescents or young adults. Published data indicate that retinoid use for acne treatment is not common. 18 Conversely, among patients older than 25 years with late-onset adult acne, there was only 1 patient (ie, < 1%) who had never received any oral antibiotic or isotretinoin treatment or therapy with topical retinoids. The reason for the lack of medical treatment is unknown. Only 25.27% of patients were not treated with topical retinoids, and 35.16% completed at least 2 courses of treatment.
Acne Scarring
The worst complication of acne is scarring. Scars develop for the duration of the disease, during both adolescent and adult acne. In the group with persistent adult acne, scarring was found in 53.85% of patients. Scar formation has been previously reported as a common complication of acne. 19 The effects of skin lesions that remain after acne are not only limited to impaired cosmetic appearance; they also negatively affect mental health and impair quality of life. 20 The aim of our study was to analyze types of treatment for adolescent acne in patients who later had persistent adult acne. Postacne scars observed later are objective evidence of the severity of disease. We found that using oral antibiotics did not diminish the number of scars among persistent adult acne patients in adulthood. In contrast, isotretinoin or topical retinoid treatment during adolescence decreased the risk for scars occurring during adulthood. In our opinion, these findings emphasize the role of this type of treatment among adolescents or young adults. The decrease of scar formation in adult acne due to retinoid treatment in adolescence indirectly justifies the role of maintenance therapy with topical retinoids. 21,22
- Goulden V, Stables GI, Cunliffe WJ. Prevalence of facial acne in adults. J Am Acad Dermatol. 1999;41:577-580.
- Dreno B, Layton A, Zouboulis CC, et al. Adult female acne: a new paradigm. J Eur Acad Dermatol Venereol. 2013;27:1063-1070.
- Preneau S, Dreno B. Female acne--a different subtype of teenager acne? J Eur Acad Dermatol Venereol. 2012;26:277-282.
- Goulden V, Clark SM, Cunliffe WJ. Post-adolescent acne: a review of clinical features. Br J Dermatol. 1997;136:66-70.
- Kamangar F, Shinkai K. Acne in the adult female patient: a practical approach. Int J Dermatol. 2012;51:1162-1174.
- Choi CW, Lee DH, Kim HS, et al. The clinical features of late onset acne compared with early onset acne in women. J Eur Acad Dermatol Venereol. 2011;25:454-461.
- Kligman AM, Fulton JE Jr, Plewig G. Topical vitamin A acid in acne vulgaris. Arch Dermatol. 1969;99:469-476.
- Zaenglein AL, Pathy AL, Schlosser BJ, et al. Guidelines of care for the management of acne vulgaris. J Am Acad Dermatol. 2016;74:945.e33-973.e33.
- Nast A, Dreno B, Bettoli V, et al. European evidence-based guidelines for the treatment of acne. J Eur Acad Dermatol Venereol. 2012;26(suppl 1):1-29.
- Levin J. The relationship of proper skin cleansing to pathophysiology, clinical benefits, and the concomitant use of prescription topical therapies in patients with acne vulgaris. Dermatol Clin. 2016;34:133-145.
- Savage LJ, Layton AM. Treating acne vulgaris: systemic, local and combination therapy. Expert Rev Clin Pharmacol. 2010;3:563-580.
- Jacob CL, Dover JS, Kaminer MS. Acne scarring: a classification system and review of treatment options. J Am Acad Dermatol. 2001;45:109-117.
- Shaw JC, White LE. Persistent acne in adult women. Arch Dermatol. 2001;137:1252-1253.
- Schmidt JV, Masuda PY, Miot HA. Acne in women: clinical patterns in different age groups. An Bras Dermatol. 2009;84:349-354.
- Thiboutot D, Gollnick H, Bettoli V, et al. New insights into the management of acne: an update from the Global Alliance to Improve Outcomes in Acne group. J Am Acad Dermatol. 2009;60(5 suppl):1-50.
- Williams C, Layton AM. Persistent acne in women: implications for the patient and for therapy. Am J Clin Dermatol. 2006;7:281-290.
- Holzmann R, Shakery K. Postadolescent acne in females. Skin Pharmacol Physiol. 2014;27(suppl 1):3-8.
- Pena S, Hill D, Feldman SR. Use of topical retinoids by dermatologist and non-dermatologist in the management of acne vulgaris. J Am Acad Dermatol. 2016;74:1252-1254.
- Layton AM, Henderson CA, Cunliffe WJ. A clinical evaluation of acne scarring and its incidence. Clin Exp Dermatol. 1994;19;303-308.
- Halvorsen JA, Stern RS, Dalgard F, et al. Suicidal ideation, mental health problems, and social impairment are increased in adolescents with acne: a population-based study. J Invest Dermatol. 2011;131:363-370.
- Thielitz A, Sidou F, Gollnick H. Control of microcomedone formation throughout a maintenance treatment with adapalene gel, 0.1%. J Eur Acad Dermatol Venereol. 2007;21:747-753.
- Leyden J, Thiboutot DM, Shalita R, et al. Comparison of tazarotene and minocycline maintenance therapies in acne vulgaris: a multicenter, double-blind, randomized, parallel-group study. Arch Dermatol. 2006;142:605-612.
In the last 20 years, the incidence of acne lesions in adults has markedly increased. 1 Acne affects adults (individuals older than 25 years) and is no longer a condition limited to adolescents and young adults (individuals younger than 25 years). According to Dreno et al, 2 the accepted age threshold for the onset of adult acne is 25 years. 1-3 In 2013, the term adult acne was defined. 2 Among patients with adult acne, there are 2 subtypes: (1) persistent adult acne, which is a continuation or recurrence of adolescent acne, affecting approximately 80% of patients, and (2) late-onset acne, affecting approximately 20% of patients. 4
Clinical symptoms of adult acne and available treatment modalities have been explored in the literature. Daily clinical experience shows that additional difficulties involved in the management of adult acne patients are related mainly to a high therapeutic failure rate in acne patients older than 25 years. 5 Persistent adult acne seems to be noteworthy because it causes long-term symptoms, and patients experience uncontrollable recurrences.
It is believed that adult acne often is resistant to treatment. 2 Adult skin is more sensitive to topical agents, leading to more irritation by medications intended for external use and cosmetics. 6 Scars in these patients are a frequent and undesirable consequence. 3
Effective treatment of acne encompasses oral antibiotics, topical and systemic retinoids, and oral contraceptive pills (OCPs). For years, oral subantimicrobial doses of cyclines have been recommended for acne treatment. Topical and oral retinoids have been successfully used for more than 30 years as important therapeutic options. 7 More recent evidence-based guidelines for acne issued by the American Academy of Dermatology 8 and the European Dermatology Forum 9 also show that retinoids play an important role in acne therapy. Their anti-inflammatory activity acts against comedones and their precursors (microcomedones). Successful antiacne therapy not only achieves a smooth face without comedones but also minimizes scar formation, postinflammatory discoloration, and long-lasting postinflammatory erythema. 10 Oral contraceptives have a mainly antiseborrheic effect. 11
Our study sought to analyze the potential influence of therapy during adolescent acne on patients who later developed adult acne. Particular attention was given to the use of oral antibiotics, isotretinoin, and topical retinoids for adolescent acne and their potential role in diminishing scar formation in adult acne.
Materials and Methods
Patient Demographics and Selection
A population-based study of Polish patients with adult acne was conducted. Patients were included in the study group on a consecutive basis from among those who visited our outpatient dermatology center from May 2015 to January 2016. A total of 111 patients (101 women [90.99%] and 10 men [9.01%]) were examined. The study group comprised patients aged 25 years and older who were treated for adult acne (20 patients [18.02%] were aged 25–29 years, 61 [54.95%] were aged 30–39 years, and 30 [27.02%] were 40 years or older).
The following inclusion criteria were used: observation period of at least 6 months in our dermatologic center for patients diagnosed with adult acne, at least 2 dermatologic visits for adult acne prior to the study, written informed consent for study participation and data processing (the aim of the study was explained to each participant by a dermatologist), and age 25 years or older. Exclusion criteria included those who were younger than 25 years, those who had only 1 dermatologic visit at our dermatology center, and those who were unwilling to participate or did not provide written informed consent. Our study was conducted according to Good Clinical Practice.
Data Collection
To obtain data with the highest degree of reliability, 3 sources of information were used: (1) a detailed medical interview conducted by one experienced dermatologist (E.C.) at our dermatology center at the first visit in all study participants, (2) a clinical examination that yielded results necessary for the assessment of scars using a method outlined by Jacob et al, 12 and (3) information included in available medical records. These data were then statistically analyzed.
Statistical Analysis
The results were presented as frequency plots, and a Fisher exact test was conducted to obtain a statistical comparison of the distributions of analyzed data. Unless otherwise indicated, 5% was adopted as the significance level. The statistical analysis was performed using Stata 14 software (StataCorp LLC, College Station, Texas).
Results
Incidence of Different Forms of Adult Acne
To analyze the onset of acne, patients were categorized into 1 of 2 groups: those with persistent adult acne (81.98%) and those with late-onset adult acne (ie, developed after 25 years of age)(18.02%).
Age at Initiation of Dermatologic Treatment
Of the patients with persistent adult acne, 31.87% first visited a dermatologist the same year that the first acne lesions appeared, 36.26% postponed the first visit by at least 5 years (Figure 1), and 23.08% started treatment at least 10 years after acne first appeared. Among patients with persistent adult acne, 76.92% began dermatologic treatment before 25 years of age, and 23.08% began treatment after 25 years of age. Of the latter, 28.57% did not start therapy until they were older than 35 years.
Severity of Adolescent Acne
In the persistent adult acne group, the severity of adolescent acne was assessed during the medical interview as well as detailed histories in medical records. The activity of acne was evaluated at 2-year intervals with the use of a 10-point scale: 1 to 3 points indicated mild acne (7.69% of patients), 4 to 6 points indicated moderate acne (24.18%), and 7 to 10 points indicated severe acne (68.13%).
Treatment of Persistent Acne in Adolescence
Treatment was comprised of oral therapy with antibiotics, isotretinoin, and/or application of topical retinoids (sometimes supported with OCPs). Monotherapy was the standard of treatment more than 25 years ago when patients with persistent adult acne were treated as adolescents or young adults. As many as 43.96% of patients with persistent adult acne did not receive any of these therapies before 25 years of age; rather, they used antiacne cosmetics or beauty procedures. Furthermore, 50.55% of patients were treated with oral antibiotics (Figure 2). Topical retinoids were used in 19.78% of patients and isotretinoin was used in 16.48%. Incidentally, OCPs were given to 26.5%. In the course of adolescent acne, 31.87% of patients received 2 to 4 courses of treatment with either antibiotics or retinoids (oral or topical), and 5.49% were treated with 5 or more courses of treatment (Figure 3). The analysis of each treatment revealed that only 1 patient received 4 courses of isotretinoin. Five courses of oral antibiotics were given in 1 patient, and 3 courses of topical retinoids were given in the same patient.
Topical Retinoids
In an analysis of the number of treatments with topical retinoids completed by patients with persistent adult acne, it was established that 80.22% of patients never used topical retinoids for acne during adolescence. Additionally, 12.08% of these patients completed 1 course of treatment, and 7.69% completed 2 to 4 treatments. However, after 25 years of age, only 25.27% of the patients with persistent adult acne were not treated with topical retinoids, and 35.16% completed more than 2 courses of treatment.
Duration of Treatment
Because adult acne is a chronic disease, the mean number of years that patients received treatment over the disease course was analyzed. In the case of persistent adult acne, the mean duration of treatment, including therapy received during adolescence, was more than 13 years. At the time of the study, more than 30% of patients had been undergoing treatment of adult acne for more than 20 years. Scars— The proportion of patients with persistent adult acne who experienced scarring was evaluated. In the persistent adult acne group, scars were identified in 53.85% of patients. Scars appeared only during adolescence in 26.37% of patients with persistent adult acne, scars appeared only after 25 years of age in 21.97% of patients, and scars appeared in adolescence as well as adulthood in 30.77% of patients.
In an analysis of patients with persistent adult acne who experienced scarring after 25 years of age, the proportion of patients with untreated adolescent acne and those who were treated with antibiotics only was not significantly different (60% vs 64%; P = .478)(Table). The inclusion of topical retinoids into treatment decreased the proportion of scars (isotretinoin: 20%, P = .009; topical retinoids: 38.89%, P = .114).
Comment
Persistent Adult Acne
Patients with symptoms of persistent adult acne represented 81.98% of the study population, which was similar to a 1999 study by Goulden et al, 1 a 2001 study by Shaw and White, 13 and a 2009 report by Schmidt et al. 14 Of these patients with persistent adult acne, 23.08% initiated therapy after 25 years of age, and 23.08% started treatment at least 10 years after acne lesions first appeared. However, it is noteworthy that 68.13% of all patients with persistent adult acne assessed their disease as severe.
Treatment Modalities for Adult Acne
Over the last 5 years, some researchers have attempted to make recommendations for the treatment of adult acne based on standards adopted for the treatment of adolescent acne. 2,9,15 First-line treatment of patients with adult comedonal acne is topical retinoids. 9 The recommended treatment of mild to moderate adult inflammatory acne involves topical drugs, including retinoids, azelaic acid, or benzoyl peroxide, or oral medications, including antibiotics, OCPs, or antiandrogens. In severe inflammatory acne, the recommended treatment involves oral isotretinoin or combined therapies; the latter seems to be the most effective. 16 Furthermore, this therapy has been adjusted to the patient’s current clinical condition; general individual sensitivity of the skin to irritation and the risk for irritant activity of topical medications; and life situation, such as planned pregnancies and intended use of OCPs due to the risk for teratogenic effects of drugs. 17
To assess available treatment modalities, oral therapy with antibiotics or isotretinoin as well as topical retinoids were selected for our analysis. It is difficult to determine an exclusive impact of OCPs as acne treatment; according to our study, many female patients use hormone therapy for other medical conditions or contraception, and only a small proportion of these patients are prescribed hormone treatment for acne. We found that 43.96% of patients with persistent adult acne underwent no treatment with antibiotics, isotretinoin, or topical retinoids in adolescence. Patients who did not receive any of these treatments came only for single visits to a dermatologist, did not comply to a recommended therapy, or used only cosmetics or beauty procedures. We found that 80.22% of patients with persistent adult acne never used topical retinoids during adolescence and did not receive maintenance therapy, which may be attributed to the fact that there were no strict recommendations regarding retinoid treatment when these patients were adolescents or young adults. Published data indicate that retinoid use for acne treatment is not common. 18 Conversely, among patients older than 25 years with late-onset adult acne, there was only 1 patient (ie, < 1%) who had never received any oral antibiotic or isotretinoin treatment or therapy with topical retinoids. The reason for the lack of medical treatment is unknown. Only 25.27% of patients were not treated with topical retinoids, and 35.16% completed at least 2 courses of treatment.
Acne Scarring
The worst complication of acne is scarring. Scars develop for the duration of the disease, during both adolescent and adult acne. In the group with persistent adult acne, scarring was found in 53.85% of patients. Scar formation has been previously reported as a common complication of acne. 19 The effects of skin lesions that remain after acne are not only limited to impaired cosmetic appearance; they also negatively affect mental health and impair quality of life. 20 The aim of our study was to analyze types of treatment for adolescent acne in patients who later had persistent adult acne. Postacne scars observed later are objective evidence of the severity of disease. We found that using oral antibiotics did not diminish the number of scars among persistent adult acne patients in adulthood. In contrast, isotretinoin or topical retinoid treatment during adolescence decreased the risk for scars occurring during adulthood. In our opinion, these findings emphasize the role of this type of treatment among adolescents or young adults. The decrease of scar formation in adult acne due to retinoid treatment in adolescence indirectly justifies the role of maintenance therapy with topical retinoids. 21,22
- Goulden V, Stables GI, Cunliffe WJ. Prevalence of facial acne in adults. J Am Acad Dermatol. 1999;41:577-580.
- Dreno B, Layton A, Zouboulis CC, et al. Adult female acne: a new paradigm. J Eur Acad Dermatol Venereol. 2013;27:1063-1070.
- Preneau S, Dreno B. Female acne--a different subtype of teenager acne? J Eur Acad Dermatol Venereol. 2012;26:277-282.
- Goulden V, Clark SM, Cunliffe WJ. Post-adolescent acne: a review of clinical features. Br J Dermatol. 1997;136:66-70.
- Kamangar F, Shinkai K. Acne in the adult female patient: a practical approach. Int J Dermatol. 2012;51:1162-1174.
- Choi CW, Lee DH, Kim HS, et al. The clinical features of late onset acne compared with early onset acne in women. J Eur Acad Dermatol Venereol. 2011;25:454-461.
- Kligman AM, Fulton JE Jr, Plewig G. Topical vitamin A acid in acne vulgaris. Arch Dermatol. 1969;99:469-476.
- Zaenglein AL, Pathy AL, Schlosser BJ, et al. Guidelines of care for the management of acne vulgaris. J Am Acad Dermatol. 2016;74:945.e33-973.e33.
- Nast A, Dreno B, Bettoli V, et al. European evidence-based guidelines for the treatment of acne. J Eur Acad Dermatol Venereol. 2012;26(suppl 1):1-29.
- Levin J. The relationship of proper skin cleansing to pathophysiology, clinical benefits, and the concomitant use of prescription topical therapies in patients with acne vulgaris. Dermatol Clin. 2016;34:133-145.
- Savage LJ, Layton AM. Treating acne vulgaris: systemic, local and combination therapy. Expert Rev Clin Pharmacol. 2010;3:563-580.
- Jacob CL, Dover JS, Kaminer MS. Acne scarring: a classification system and review of treatment options. J Am Acad Dermatol. 2001;45:109-117.
- Shaw JC, White LE. Persistent acne in adult women. Arch Dermatol. 2001;137:1252-1253.
- Schmidt JV, Masuda PY, Miot HA. Acne in women: clinical patterns in different age groups. An Bras Dermatol. 2009;84:349-354.
- Thiboutot D, Gollnick H, Bettoli V, et al. New insights into the management of acne: an update from the Global Alliance to Improve Outcomes in Acne group. J Am Acad Dermatol. 2009;60(5 suppl):1-50.
- Williams C, Layton AM. Persistent acne in women: implications for the patient and for therapy. Am J Clin Dermatol. 2006;7:281-290.
- Holzmann R, Shakery K. Postadolescent acne in females. Skin Pharmacol Physiol. 2014;27(suppl 1):3-8.
- Pena S, Hill D, Feldman SR. Use of topical retinoids by dermatologist and non-dermatologist in the management of acne vulgaris. J Am Acad Dermatol. 2016;74:1252-1254.
- Layton AM, Henderson CA, Cunliffe WJ. A clinical evaluation of acne scarring and its incidence. Clin Exp Dermatol. 1994;19;303-308.
- Halvorsen JA, Stern RS, Dalgard F, et al. Suicidal ideation, mental health problems, and social impairment are increased in adolescents with acne: a population-based study. J Invest Dermatol. 2011;131:363-370.
- Thielitz A, Sidou F, Gollnick H. Control of microcomedone formation throughout a maintenance treatment with adapalene gel, 0.1%. J Eur Acad Dermatol Venereol. 2007;21:747-753.
- Leyden J, Thiboutot DM, Shalita R, et al. Comparison of tazarotene and minocycline maintenance therapies in acne vulgaris: a multicenter, double-blind, randomized, parallel-group study. Arch Dermatol. 2006;142:605-612.
Practice Points
- Postacne scarring is the most severe complication of acne.
- Isotretinoin or topical retinoid treatment in adolescence decreases the risk for scars during adult acne, justifying the role of maintenance therapy with topical retinoids.

Usage of and Attitudes Toward Health Information Exchange Before and After System Implementation in a VA Medical Center
More than 9 million veterans are enrolled in the Veterans Health Administration (VHA). A high percentage of veterans who use VHA services have multiple chronic conditions and complex medical needs.1 In addition to receiving health care from the VHA, many of these patients receive additional services from non-VHA providers in the community. Furthermore, recent laws enacted, such as the 2018 VA MISSION Act and the 2014 VA Choice Program, have increased veterans’ use of community health care services.
VHA staff face considerable barriers when seeking documentation about non-VHA services delivered in the community, which can be fragmented across multiple health care systems. In many VHA medical centers, staff must telephone non-VHA sites of care and/or use time-consuming fax services to request community-based patient records. VA health care providers (HCPs) often complain that community records are not available to make timely clinical decisions or that they must do so without knowing past or co-occurring assessments or treatment plans. Without access to comprehensive health records, patients are at risk for duplicated treatment, medication errors, and death.2,3
Background
To improve the continuity and safety of health care, US governmental and health information experts stimulated formal communication among HCPs via the 2009 Health Information Technology for Economic and Clinical Health (HITECH) Act.4,5 One of the primary aims of the HITECH Act was to promote reliable and interoperable electronic sharing of clinical information through health information exchange (HIE) for both patients and HCPs. Monetary incentives encouraged regional, state, or state-funded organizations to create and promote HIE capabilities.
Presently, empirical data are not available that describe the effect of external HIE systems in VHA settings. However, data examining non-VHA settings suggest that HIE may improve quality of care, although findings are mixed. For example, some research has found that HIE reduces hospital admissions, duplicated test ordering, and health care costs and improves decision making, whereas other research has found no change.3,6-13 Barriers to HIE use noted in community settings include poorly designed interfaces, inefficient workflow, and incomplete record availability.3,6-10,14
A few US Department of Veterans Affairs (VA) medical centers have recently initiated contracts with HIE organizations. Because much of the present research evaluates internally developed HIE systems, scholars in the field have identified a pressing need for useful statistics before and after implementation of externally developed HIE systems.13,15 Additionally, scholars call for data examining nonacademic settings (eg, VHA medical centers) and for diverse patient populations (eg, individuals with chronic disorders, veterans).13This quality improvement project had 2 goals. The first goal was to assess baseline descriptive statistics related to requesting/obtaining community health records in a VHA setting. The second goal was to evaluate VHA staff access to needed community health records (eg, records stemming from community consults) before and after implementation of an externally developed HIE system.
Methods
This project was a single-center, quality improvement evaluation examining the effect of implementing an HIE system, developed by an external nonprofit organization. The project protocol was approved by the VA Pacific Islands Healthcare System (VAPIHCS) Evidence-Based Practices Council. Clinicians’ responses were anonymous, and data were reported only in aggregate. Assessment was conducted by an evaluator who was not associated with the HIE system developers and its implementation, reducing the chance of bias.15
Coinciding with the HIE system implementation and prior to having access to it, VAPIHCS medical and managed care staff were invited to complete an online needs assessment tool. Voluntary trainings on the system were offered at various times on multiple days and lasted approximately 1 hour. Six months after the HIE system was implemented, a postassessment tool reevaluated HIE-related access.
VHA Setting and HIE System
VAPIHCS serves about 55,000 unique patients across a 2.6 million square-mile catchment area (Hawaii and Pacific Island territories). Facilities include a medium-sized, urban VA medical center and 7 suburban or rural/remote primary care outpatient clinics.
VAPIHCS contracted with Hawaii Health Information Exchange (HHIE), a nonprofit organization that was designated by the state of Hawaii to develop a seamless, secure HIE system. According to HHIE, 83% of the 23 hospitals in the state and 55% of Hawaii’s 2,927 active practicing physicians have adopted the HIE system (F. Chan, personal communication, December 12, 2018). HHIE’s data sources provide real-time access to a database of 20 million health records. Records include, among other records, data such as patients’ reasons for referral, encounter diagnoses, medications, immunizations, and discharge instructions from many (but not all) HCPs in Hawaii.
HHIE reports that it has the capacity to interface with all electronic health records systems currently in use in the community (F. Chan, personal communication, December 12, 2018). Although the HIE system can provide directed exchange (ie, sending and receiving secure information electronically between HCPs), the HIE system implemented in the VAPIHCS was limited to query-retrieve (ie, practitioner-initiated requests for information from other community HCPs). Specifically, to access patient records, practitioners log in to the HIE portal and enter a patient’s name in a search window. The system then generates a consolidated virtual chart with data collected from all HIE data-sharing participants. To share records, community HCPs either build or enable a profile in an integrated health care enterprise electronic communication interface into their data. However, VHA records were not made available to community HCPs at this initial stage.
Measures and Statistical Analysis
A template of quality improvement-related questions was adapted for this project with input from subject matter experts. Questions were then modified further based on interviews with 5 clinical and managed care staff members. The final online tool consisted of up to 20 multiple choice items and 2 open-ended questions delivered online. A 22-item evaluation tool was administered 6 months after system implementation. Frequencies were obtained for descriptive items, and group responses were compared across time.
Results
Thirty-nine staff (32 medical and 7 managed care staff) completed the needs assessment, and 20 staff (16 medical and 4 managed care staff) completed the postimplementation evaluation.
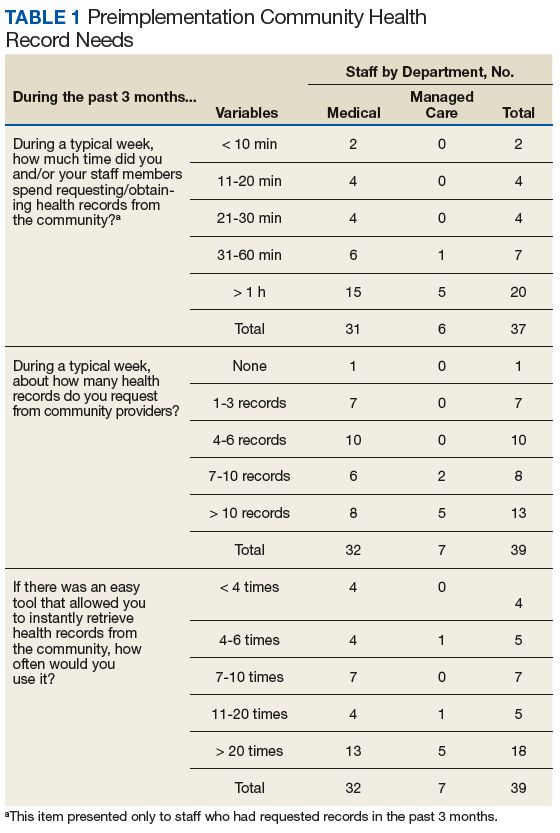
Before implementation of the HIE system, most staff (54%) indicated that they spent > 1 hour a week conducting tasks related to seeking and/or obtaining health records from the community. The largest percentage of staff (27%) requested > 10 community records during a typical week. Most respondents indicated that they would use an easy tool to instantly retrieve community health records at least 20 times per week (Table 1).
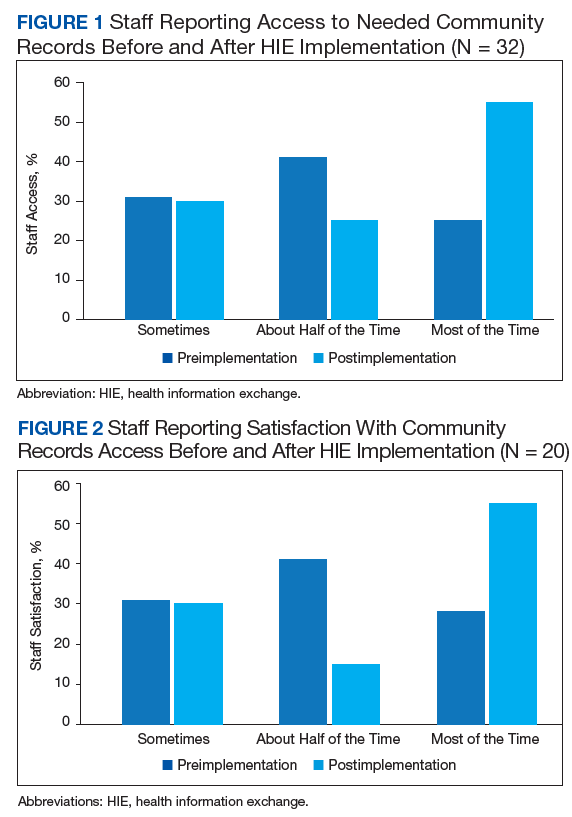
Preimplementation, 32.4% of respondents indicated that they could access community-based health records sometimes. Postimplementation, most respondents indicated they could access the records most of the time (Figure 1).
Preimplementation, staff most frequently indicated they were very dissatisfied with the current level of access to community records. Postimplementation, more staff were somewhat satisfied or very satisfied (Figure 2). Postimplementation, 48% of staff most often reported using the HIE system either several times a month or 2 to 4 times a week, 19% used the system daily, 19% used 1 to 2 times, and 14% never used the system. Most staff (67%) reported that the system improved access to records somewhat and supported continuing the contract with the HIE system. Conversely, 18% of respondents said that their access did not improve enough for the system to be of use to them.
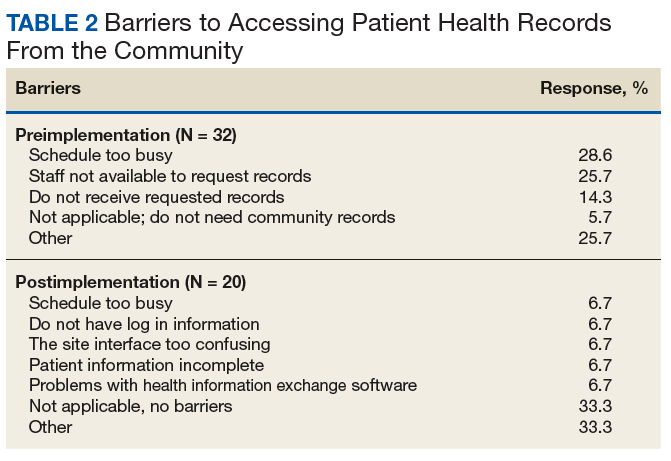
Preimplementation, staff most frequently indicated that they did not have time (28.6%) or sufficient staff (25.7%) to request records (Table 2). Postimplementation, staff most frequently (33.3%) indicated that they had no problems accessing the HIE system, but 6.7% reported having time or interface/software difficulties.
Discussion
This report assessed a quality improvement project designed to increase VHA access to community health records via an external HIE system. Prior to this work, no data were available on use, barriers, and staff satisfaction related to implementing an externally developed HIE system within a VA medical center.13,15
Before the medical center implemented the HIE system, logistical barriers prevented most HCPs and managed care staff from obtaining needed community records. Staff faced challenges such as lacking time as well as rudimentary barriers, such as community clinics not responding to requests or the fax machine not working. Time remained a challenge after implementation, but this work demonstrated that the HIE system helped staff overcome many logistical barriers.
After implementation of the HIE system, staff reported an improvement in access and satisfaction related to retrieving community health records. These findings are consistent with most but not all evaluations of HIE systems.3,6,7,12,13 In the present work, staff used the system several times a month or several times a week, and most staff believed that access to the HIE system should be continued. Still, improvement was incomplete. The HIE system increased access to specific types of records (eg, reports) and health care systems (eg, large hospitals), but not others. As a result, the system was more useful for some staff than for others.
Research examining HIE systems in community and academic settings have identified factors that deter their use, such as poorly designed interfaces, inefficient workflow, and incomplete record availability.3,6,7,14,16 In the present project, incomplete record availability was a noted barrier. Additionally, a few staff reported system interface issues. However, most staff found the system easy to use as part of their daily workflow.
Because the HIE system had a meaningful, positive impact on VHA providers and staff, it will be sustained at VAPIHCS. Specifically, the contract with the HHIE has been renewed, and the number of user licenses has increased. Staff users now self-refer for the service or can be referred by their service chiefs.
Limitations
This work was designed to evaluate the effect of an HIE system on staff in 1 VHA setting; thus, findings may not be generalizable to other settings or HIE systems. Limitations of the present work include small sample size of respondents; limited time frame for responses; and limited response rate. The logical next step would be research efforts to compare access to the HIE system with no access on factors such as workload productivity, cost savings, and patient safety.
Conclusion
The vision of the HITECH Act was to improve the continuity and safety of health care via reliable and interoperable electronic sharing of clinical information across health care entities.6 This VHA quality improvement project demonstrated a meaningful improvement in staff’s level of satisfaction with access to community health records when staff used an externally developed HIE system. Not all types of records (eg, progress notes) were accessible, which resulted in the system being useful for most but not all staff.
In the future, the federal government’s internally developed Veterans Health Information Exchange (formerly known as the Virtual Lifetime Electronic Record [VLER]) is expected to enable VHA, the Department of Defense, and participating community care providers to access shared electronic health records nationally. However, until we can achieve that envisioned interoperability, VHA staff can use HIE and other clinical support applications to access health records.
1. Yu W, Ravelo A, Wagner TH, et al. Prevalence and costs of chronic conditions in the VA health care system. Med Care Res Rev. 2003;60(3)(suppl):146S-167S.
2. Bourgeois FC, Olson KL, Mandl KD. Patients treated at multiple acute health care facilities: quantifying information fragmentation. Arch Intern Med. 2010;170(22):1989-1995.
3. Rudin RS, Motala A, Goldzweig CL, Shekelle PG. Usage and effect of health information exchange: a systematic review. Ann Intern Med. 2014;161(11):803-811.
4. Blumenthal D. Implementation of the federal health information technology initiative. N Engl J Med. 2011;365(25):2426-2431.
5. The Office of the National Coordinator for Health Information Technology. Connecting health and care for the nation: a shared nationwide interoperability roadmap. Final version 1.0. https://www.healthit.gov/sites/default/files/hie-interoperability/nationwide-interoperability-roadmap-final-version-1.0.pdf. Accessed May 22, 2019.
6. Detmer D, Bloomrosen M, Raymond B, Tang P. Integrated personal health records: transformative tools for consumer-centric care. BMC Med Inform Decis Mak. 2008;8:45.
7. Hersh WR, Totten AM, Eden KB, et al. Outcomes from health information exchange: systematic review and future research needs. JMIR Med Inform. 2015;3(4):e39.
8. Vest JR, Kern LM, Campion TR Jr, Silver MD, Kaushal R. Association between use of a health information exchange system and hospital admissions. Appl Clin Inform. 2014;5(1):219-231.
9. Vest JR, Jung HY, Ostrovsky A, Das LT, McGinty GB. Image sharing technologies and reduction of imaging utilization: a systematic review and meta-analysis. J Am Coll Radiol. 2015;12(12 pt B):1371-1379.e3.
10. Walker DM. Does participation in health information exchange improve hospital efficiency? Health Care Manag Sci. 2018;21(3):426-438.
11. Gordon BD, Bernard K, Salzman J, Whitebird RR. Impact of health information exchange on emergency medicine clinical decision making. West J Emerg Med. 2015;16(7):1047-1051.
12. Hincapie A, Warholak T. The impact of health information exchange on health outcomes. Appl Clin Inform. 2011;2(4):499-507.
13. Rahurkar S, Vest JR, Menachemi N. Despite the spread of health information exchange, there is little evidence of its impact on cost, use, and quality of care. Health Aff (Millwood). 2015;34(3):477-483.
14. Eden KB, Totten AM, Kassakian SZ, et al. Barriers and facilitators to exchanging health information: a systematic review. Int J Med Inform. 2016;88:44-51.
15. Hersh WR, Totten AM, Eden K, et al. The evidence base for health information exchange. In: Dixon BE, ed. Health Information Exchange: Navigating and Managing a Network of Health Information Systems. Cambridge, MA: Academic Press; 2016:213-229.
16. Blavin F, Ramos C, Cafarella Lallemand N, Fass J, Ozanich G, Adler-Milstein J. Analyzing the public benefit attributable to interoperable health information exchange. https://aspe.hhs.gov/system/files/pdf/258851/AnalyzingthePublicBenefitAttributabletoInteroperableHealth.pdf. Published July 2017. Accessed May 22, 2019.
More than 9 million veterans are enrolled in the Veterans Health Administration (VHA). A high percentage of veterans who use VHA services have multiple chronic conditions and complex medical needs.1 In addition to receiving health care from the VHA, many of these patients receive additional services from non-VHA providers in the community. Furthermore, recent laws enacted, such as the 2018 VA MISSION Act and the 2014 VA Choice Program, have increased veterans’ use of community health care services.
VHA staff face considerable barriers when seeking documentation about non-VHA services delivered in the community, which can be fragmented across multiple health care systems. In many VHA medical centers, staff must telephone non-VHA sites of care and/or use time-consuming fax services to request community-based patient records. VA health care providers (HCPs) often complain that community records are not available to make timely clinical decisions or that they must do so without knowing past or co-occurring assessments or treatment plans. Without access to comprehensive health records, patients are at risk for duplicated treatment, medication errors, and death.2,3
Background
To improve the continuity and safety of health care, US governmental and health information experts stimulated formal communication among HCPs via the 2009 Health Information Technology for Economic and Clinical Health (HITECH) Act.4,5 One of the primary aims of the HITECH Act was to promote reliable and interoperable electronic sharing of clinical information through health information exchange (HIE) for both patients and HCPs. Monetary incentives encouraged regional, state, or state-funded organizations to create and promote HIE capabilities.
Presently, empirical data are not available that describe the effect of external HIE systems in VHA settings. However, data examining non-VHA settings suggest that HIE may improve quality of care, although findings are mixed. For example, some research has found that HIE reduces hospital admissions, duplicated test ordering, and health care costs and improves decision making, whereas other research has found no change.3,6-13 Barriers to HIE use noted in community settings include poorly designed interfaces, inefficient workflow, and incomplete record availability.3,6-10,14
A few US Department of Veterans Affairs (VA) medical centers have recently initiated contracts with HIE organizations. Because much of the present research evaluates internally developed HIE systems, scholars in the field have identified a pressing need for useful statistics before and after implementation of externally developed HIE systems.13,15 Additionally, scholars call for data examining nonacademic settings (eg, VHA medical centers) and for diverse patient populations (eg, individuals with chronic disorders, veterans).13This quality improvement project had 2 goals. The first goal was to assess baseline descriptive statistics related to requesting/obtaining community health records in a VHA setting. The second goal was to evaluate VHA staff access to needed community health records (eg, records stemming from community consults) before and after implementation of an externally developed HIE system.
Methods
This project was a single-center, quality improvement evaluation examining the effect of implementing an HIE system, developed by an external nonprofit organization. The project protocol was approved by the VA Pacific Islands Healthcare System (VAPIHCS) Evidence-Based Practices Council. Clinicians’ responses were anonymous, and data were reported only in aggregate. Assessment was conducted by an evaluator who was not associated with the HIE system developers and its implementation, reducing the chance of bias.15
Coinciding with the HIE system implementation and prior to having access to it, VAPIHCS medical and managed care staff were invited to complete an online needs assessment tool. Voluntary trainings on the system were offered at various times on multiple days and lasted approximately 1 hour. Six months after the HIE system was implemented, a postassessment tool reevaluated HIE-related access.
VHA Setting and HIE System
VAPIHCS serves about 55,000 unique patients across a 2.6 million square-mile catchment area (Hawaii and Pacific Island territories). Facilities include a medium-sized, urban VA medical center and 7 suburban or rural/remote primary care outpatient clinics.
VAPIHCS contracted with Hawaii Health Information Exchange (HHIE), a nonprofit organization that was designated by the state of Hawaii to develop a seamless, secure HIE system. According to HHIE, 83% of the 23 hospitals in the state and 55% of Hawaii’s 2,927 active practicing physicians have adopted the HIE system (F. Chan, personal communication, December 12, 2018). HHIE’s data sources provide real-time access to a database of 20 million health records. Records include, among other records, data such as patients’ reasons for referral, encounter diagnoses, medications, immunizations, and discharge instructions from many (but not all) HCPs in Hawaii.
HHIE reports that it has the capacity to interface with all electronic health records systems currently in use in the community (F. Chan, personal communication, December 12, 2018). Although the HIE system can provide directed exchange (ie, sending and receiving secure information electronically between HCPs), the HIE system implemented in the VAPIHCS was limited to query-retrieve (ie, practitioner-initiated requests for information from other community HCPs). Specifically, to access patient records, practitioners log in to the HIE portal and enter a patient’s name in a search window. The system then generates a consolidated virtual chart with data collected from all HIE data-sharing participants. To share records, community HCPs either build or enable a profile in an integrated health care enterprise electronic communication interface into their data. However, VHA records were not made available to community HCPs at this initial stage.
Measures and Statistical Analysis
A template of quality improvement-related questions was adapted for this project with input from subject matter experts. Questions were then modified further based on interviews with 5 clinical and managed care staff members. The final online tool consisted of up to 20 multiple choice items and 2 open-ended questions delivered online. A 22-item evaluation tool was administered 6 months after system implementation. Frequencies were obtained for descriptive items, and group responses were compared across time.
Results
Thirty-nine staff (32 medical and 7 managed care staff) completed the needs assessment, and 20 staff (16 medical and 4 managed care staff) completed the postimplementation evaluation.
Before implementation of the HIE system, most staff (54%) indicated that they spent > 1 hour a week conducting tasks related to seeking and/or obtaining health records from the community. The largest percentage of staff (27%) requested > 10 community records during a typical week. Most respondents indicated that they would use an easy tool to instantly retrieve community health records at least 20 times per week (Table 1).
Preimplementation, 32.4% of respondents indicated that they could access community-based health records sometimes. Postimplementation, most respondents indicated they could access the records most of the time (Figure 1).
Preimplementation, staff most frequently indicated they were very dissatisfied with the current level of access to community records. Postimplementation, more staff were somewhat satisfied or very satisfied (Figure 2). Postimplementation, 48% of staff most often reported using the HIE system either several times a month or 2 to 4 times a week, 19% used the system daily, 19% used 1 to 2 times, and 14% never used the system. Most staff (67%) reported that the system improved access to records somewhat and supported continuing the contract with the HIE system. Conversely, 18% of respondents said that their access did not improve enough for the system to be of use to them.
Preimplementation, staff most frequently indicated that they did not have time (28.6%) or sufficient staff (25.7%) to request records (Table 2). Postimplementation, staff most frequently (33.3%) indicated that they had no problems accessing the HIE system, but 6.7% reported having time or interface/software difficulties.
Discussion
This report assessed a quality improvement project designed to increase VHA access to community health records via an external HIE system. Prior to this work, no data were available on use, barriers, and staff satisfaction related to implementing an externally developed HIE system within a VA medical center.13,15
Before the medical center implemented the HIE system, logistical barriers prevented most HCPs and managed care staff from obtaining needed community records. Staff faced challenges such as lacking time as well as rudimentary barriers, such as community clinics not responding to requests or the fax machine not working. Time remained a challenge after implementation, but this work demonstrated that the HIE system helped staff overcome many logistical barriers.
After implementation of the HIE system, staff reported an improvement in access and satisfaction related to retrieving community health records. These findings are consistent with most but not all evaluations of HIE systems.3,6,7,12,13 In the present work, staff used the system several times a month or several times a week, and most staff believed that access to the HIE system should be continued. Still, improvement was incomplete. The HIE system increased access to specific types of records (eg, reports) and health care systems (eg, large hospitals), but not others. As a result, the system was more useful for some staff than for others.
Research examining HIE systems in community and academic settings have identified factors that deter their use, such as poorly designed interfaces, inefficient workflow, and incomplete record availability.3,6,7,14,16 In the present project, incomplete record availability was a noted barrier. Additionally, a few staff reported system interface issues. However, most staff found the system easy to use as part of their daily workflow.
Because the HIE system had a meaningful, positive impact on VHA providers and staff, it will be sustained at VAPIHCS. Specifically, the contract with the HHIE has been renewed, and the number of user licenses has increased. Staff users now self-refer for the service or can be referred by their service chiefs.
Limitations
This work was designed to evaluate the effect of an HIE system on staff in 1 VHA setting; thus, findings may not be generalizable to other settings or HIE systems. Limitations of the present work include small sample size of respondents; limited time frame for responses; and limited response rate. The logical next step would be research efforts to compare access to the HIE system with no access on factors such as workload productivity, cost savings, and patient safety.
Conclusion
The vision of the HITECH Act was to improve the continuity and safety of health care via reliable and interoperable electronic sharing of clinical information across health care entities.6 This VHA quality improvement project demonstrated a meaningful improvement in staff’s level of satisfaction with access to community health records when staff used an externally developed HIE system. Not all types of records (eg, progress notes) were accessible, which resulted in the system being useful for most but not all staff.
In the future, the federal government’s internally developed Veterans Health Information Exchange (formerly known as the Virtual Lifetime Electronic Record [VLER]) is expected to enable VHA, the Department of Defense, and participating community care providers to access shared electronic health records nationally. However, until we can achieve that envisioned interoperability, VHA staff can use HIE and other clinical support applications to access health records.
1. Yu W, Ravelo A, Wagner TH, et al. Prevalence and costs of chronic conditions in the VA health care system. Med Care Res Rev. 2003;60(3)(suppl):146S-167S.
2. Bourgeois FC, Olson KL, Mandl KD. Patients treated at multiple acute health care facilities: quantifying information fragmentation. Arch Intern Med. 2010;170(22):1989-1995.
3. Rudin RS, Motala A, Goldzweig CL, Shekelle PG. Usage and effect of health information exchange: a systematic review. Ann Intern Med. 2014;161(11):803-811.
4. Blumenthal D. Implementation of the federal health information technology initiative. N Engl J Med. 2011;365(25):2426-2431.
5. The Office of the National Coordinator for Health Information Technology. Connecting health and care for the nation: a shared nationwide interoperability roadmap. Final version 1.0. https://www.healthit.gov/sites/default/files/hie-interoperability/nationwide-interoperability-roadmap-final-version-1.0.pdf. Accessed May 22, 2019.
6. Detmer D, Bloomrosen M, Raymond B, Tang P. Integrated personal health records: transformative tools for consumer-centric care. BMC Med Inform Decis Mak. 2008;8:45.
7. Hersh WR, Totten AM, Eden KB, et al. Outcomes from health information exchange: systematic review and future research needs. JMIR Med Inform. 2015;3(4):e39.
8. Vest JR, Kern LM, Campion TR Jr, Silver MD, Kaushal R. Association between use of a health information exchange system and hospital admissions. Appl Clin Inform. 2014;5(1):219-231.
9. Vest JR, Jung HY, Ostrovsky A, Das LT, McGinty GB. Image sharing technologies and reduction of imaging utilization: a systematic review and meta-analysis. J Am Coll Radiol. 2015;12(12 pt B):1371-1379.e3.
10. Walker DM. Does participation in health information exchange improve hospital efficiency? Health Care Manag Sci. 2018;21(3):426-438.
11. Gordon BD, Bernard K, Salzman J, Whitebird RR. Impact of health information exchange on emergency medicine clinical decision making. West J Emerg Med. 2015;16(7):1047-1051.
12. Hincapie A, Warholak T. The impact of health information exchange on health outcomes. Appl Clin Inform. 2011;2(4):499-507.
13. Rahurkar S, Vest JR, Menachemi N. Despite the spread of health information exchange, there is little evidence of its impact on cost, use, and quality of care. Health Aff (Millwood). 2015;34(3):477-483.
14. Eden KB, Totten AM, Kassakian SZ, et al. Barriers and facilitators to exchanging health information: a systematic review. Int J Med Inform. 2016;88:44-51.
15. Hersh WR, Totten AM, Eden K, et al. The evidence base for health information exchange. In: Dixon BE, ed. Health Information Exchange: Navigating and Managing a Network of Health Information Systems. Cambridge, MA: Academic Press; 2016:213-229.
16. Blavin F, Ramos C, Cafarella Lallemand N, Fass J, Ozanich G, Adler-Milstein J. Analyzing the public benefit attributable to interoperable health information exchange. https://aspe.hhs.gov/system/files/pdf/258851/AnalyzingthePublicBenefitAttributabletoInteroperableHealth.pdf. Published July 2017. Accessed May 22, 2019.