User login
CV deaths jumped in 2020, reflecting pandemic toll
Cardiovascular-related deaths increased dramatically in 2020, marking the largest single-year increase since 2015 and surpassing the previous record from 2003, according to the American Heart Association’s 2023 Statistical Update.
During the first year of the COVID-19 pandemic, the largest increases in cardiovascular disease (CVD) deaths were seen among Asian, Black, and Hispanic people.
“We thought we had been improving as a country with respect to CVD deaths over the past few decades,” Connie Tsao, MD, chair of the AHA Statistical Update writing committee, told this news organization.
Since 2020, however, those trends have changed. Dr. Tsao, a staff cardiologist at Beth Israel Deaconess Medical Center and assistant professor of medicine at Harvard Medical School, both in Boston, noted the firsthand experience that many clinicians had in seeing the shift.
“We observed this sharp rise in age-adjusted CVD deaths, which corresponds to the COVID-19 pandemic,” she said. “Those of us health care providers knew from the overfull hospitals and ICUs that clearly COVID took a toll, particularly in those with cardiovascular risk factors.”
The AHA Statistical Update was published online in the journal Circulation.
Data on deaths
Each year, the American Heart Association and National Institutes of Health report the latest statistics related to heart disease, stroke, and cardiovascular risk factors. The 2023 update includes additional information about pandemic-related data.
Overall, the number of people who died from cardiovascular disease increased during the first year of the pandemic, rising from 876,613 in 2019 to 928,741 in 2020. This topped the previous high of 910,000 in 2003.
In addition, the age-adjusted mortality rate increased for the first time in several years, Dr. Tsao said, by a “fairly substantial” 4.6%. The age-adjusted mortality rate incorporates the variability in the aging population from year to year, accounting for higher death rates among older people.
“Even though our total number of deaths has been slowly increasing over the past decade, we have seen a decline each year in our age-adjusted rates – until 2020,” she said. “I think that is very indicative of what has been going on within our country – and the world – in light of people of all ages being impacted by the COVID-19 pandemic, especially before vaccines were available to slow the spread.”
The largest increases in CVD-related deaths occurred among Asian, Black, and Hispanic people, who were most heavily affected during the first year of the pandemic.
“People from communities of color were among those most highly impacted, especially early on, often due to a disproportionate burden of cardiovascular risk factors, such as hypertension and obesity,” Michelle Albert, MD, MPH, president of AHA and a professor of medicine at the University of California, San Francisco, said in a statement.
Dr. Albert, who is also the director of UCSF’s Center for the Study of Adversity and Cardiovascular Disease, does research on health equity and noted the disparities seen in the 2020 numbers. “Additionally, there are socioeconomic considerations, as well as the ongoing impact of structural racism on multiple factors, including limiting the ability to access quality health care,” she said.
Additional considerations
In a special commentary, the Statistical Update writing committee pointed to the need to track data for other underrepresented communities, including LGBTQ people and those living in rural or urban areas. The authors outlined several ways to better understand the effects of identity and social determinants of health, as well as strategies to reduce cardiovascular-related disparities.
“This year’s writing group made a concerted effort to gather information on specific social factors related to health risk and outcomes, including sexual orientation, gender identity, urbanization, and socioeconomic position,” Dr. Tsao said. “However, the data are lacking because these communities are grossly underrepresented in clinical and epidemiological research.”
For the next several years, the AHA Statistical Update will likely include more insights about the effects of the COVID-19 pandemic, as well as ongoing disparities.
“For sure, we will be continuing to see the effects of the pandemic for years to come,” Dr. Tsao said. “Recognition of the disparities in outcomes among vulnerable groups should be a call to action among health care providers and researchers, administration, and policy leaders to investigate the reasons and make changes to reverse these trends.”
The statistical update was prepared by a volunteer writing group on behalf of the American Heart Association Council on Epidemiology and Prevention Statistics Committee and Stroke Statistics Subcommittee.
A version of this article first appeared on Medscape.com.
FROM CIRCULATION
The long-range thrombolysis forecast calls for tiny ultrasonic tornadoes
Sticks and stones may break my bones, but clots will never hurt me
You’ve probably seen “Ghostbusters” or at least heard the theme song. Maybe you even know about the Discovery Channel’s “Mythbusters.” But now there’s a new buster in town, and it eats platitudes for breakfast: Meet Cliche-busters, LOTME’s new recurring feature.
This week, Cliche-busters takes on “Two wrongs don’t make a right.” Yum.
We start with blood clots, which are bad. Doctors go to a lot of trouble to get rid of the things because they are dangerous. A blood clot, then, is a bodily function gone wrong.
Tornadoes are also bad. Out there in the world, these violently rotating columns of air can destroy buildings, toss large objects long distances, and inspire mediocre action movies. They are examples of nature gone wrong.
Seemingly, these two wrongs – blood clots and tornadoes – are not about to make a right. Has Cliche-busters bitten off more than it can chew?
Not according to Xiaoning Jiang of North Carolina State University, Raleigh, and his team of researchers. They’ve figured out a way to use a tiny ultrasonic tornado to break down clots in the brain. “Our new work uses vortex ultrasound, where the ultrasound waves have a helical wavefront. In other words, the ultrasound is swirling as it moves forward,” he said in a statement from the university.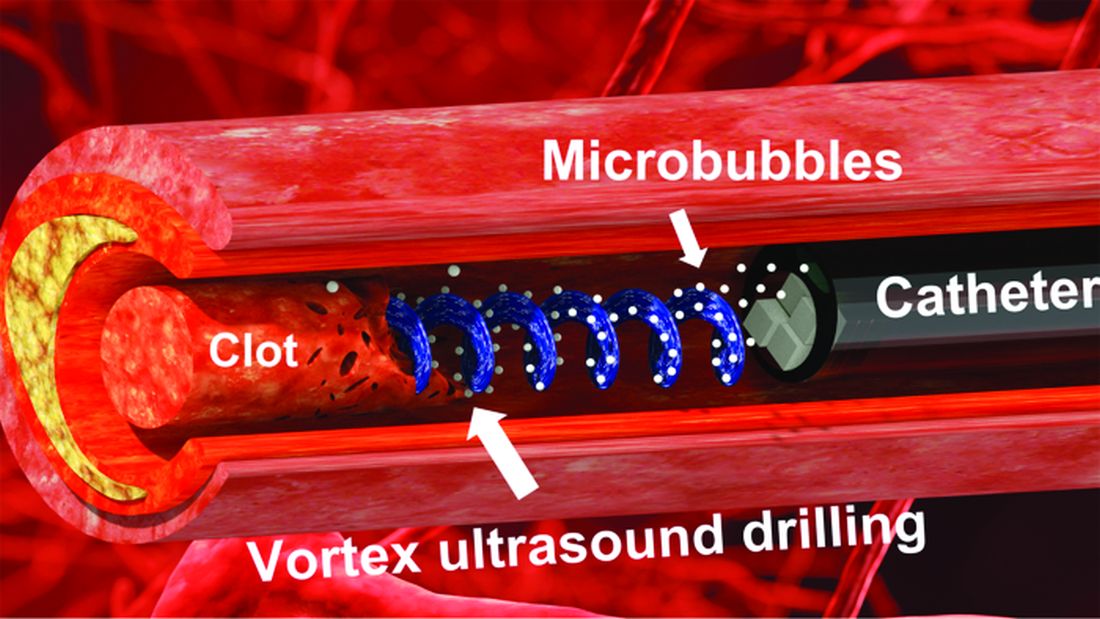
Their new tool’s single transducer is small enough to fit in a catheter, and its “vortex ultrasound-induced shear force has the potential to break down clots safely and improve the efficacy of thrombolysis,” they explained in the open-access journal Research.
The investigators used cow blood in a 3D-printed model of the cerebral venous sinus for the proof-of-concept study and were able to dissolve an acute blood clot in less than 30 minutes, compared with the 15-30 hours needed with a pharmaceutical intervention, according to the written statement.
Can you hear the sound of two wrongs making a right? We can, and that closes the curtain on this cliche.
With age does not come wisdom
We’ve all met this person before. The sort of person who takes a 10-minute IQ test on a shifty-looking website and then proceeds to brag about a 180 IQ until the heat death of the universe. The one who worships at the altar of Mensa. Yeah, that guy. They’re never as smart as they think they are, but they’ll never, ever admit it.
It’s not exactly a secret that IQ as a measurement of intelligence is highly overrated. A lot of scientists doubt we should bother measuring it at all. That said, a higher IQ is associated with greater success in academic and financial endeavors, so it’s not absolutely worthless. And if we’re stuck with it, we may as well study it.
That brings us neatly to new research published in Brain and Behavior. Most studies into IQ and self-estimated intelligence have focused on younger adults, and the author of this study was curious if the stereotype of young men inflating their IQ, a stereotype backed up by research, persisted into older adulthood. So she conducted a survey of 159 younger adults and 152 older adults to find out.
The results in younger adults were not surprising: Younger men overestimated their actual IQ by 5-15 points, which tracks with previous research. We’re in for a bit of a surprise with the older adults, though, because the older men were more humble about their intelligence, with their estimation falling in line with their actual IQ. Older women, however, not so much. In fact, they overestimated their intelligence just as much as the younger men.
In addition, older women who perceived themselves as more attractive reported the highest self-estimated intelligence of all. That isn’t how intelligence works, but honestly, if Grandma’s out and about thinking she looks good and has the brains to go and win “Jeopardy!” do you really have the heart to tell her otherwise?
Fight temptation with empathy … and shoes
Relationships are tough. They all go through their respective ups and downs, but what happens when one person is feeling so down in the partnership that cheating comes to mind? Is there any way to stop it from happening?

Well, a recent study suggests that there is, and it’s as simple as putting yourself in the other person’s shoes. By observing 408 heterosexual, monogamous participants in a series of experiments, psychologists in Israel and New York found that practicing empathy and “perspective taking” doesn’t necessarily stop people from cheating but it does reduces the desire.
People cheat on their significant others for many different reasons – men for a lack of sexual needs being met and women for shortfalls regarding emotional needs – but prioritizing the other person’s perspective gives the idea of being unfaithful a different view and could make one act differently, the investigators said.
Perspective taking also promotes other positive attributes to the relationship, such as the promotion of compassion and the feeling of being understood, lead author Gurit Birnbaum of Reichman University in Herzliya, Israel, said in a written statement. These things ultimately help couples navigate the rough patches and strengthen bonds, making them even less likely to cheat.
The researchers noted that even people in satisfying relationships do cheat, but this approach does encourage people to stop and think before they act. It could ultimately prevent what might be a huge mistake.
Think before they act. Hmm, that’s kind of like look before they leap, right? Sounds like a job for the Cliche-busters.
Sticks and stones may break my bones, but clots will never hurt me
You’ve probably seen “Ghostbusters” or at least heard the theme song. Maybe you even know about the Discovery Channel’s “Mythbusters.” But now there’s a new buster in town, and it eats platitudes for breakfast: Meet Cliche-busters, LOTME’s new recurring feature.
This week, Cliche-busters takes on “Two wrongs don’t make a right.” Yum.
We start with blood clots, which are bad. Doctors go to a lot of trouble to get rid of the things because they are dangerous. A blood clot, then, is a bodily function gone wrong.
Tornadoes are also bad. Out there in the world, these violently rotating columns of air can destroy buildings, toss large objects long distances, and inspire mediocre action movies. They are examples of nature gone wrong.
Seemingly, these two wrongs – blood clots and tornadoes – are not about to make a right. Has Cliche-busters bitten off more than it can chew?
Not according to Xiaoning Jiang of North Carolina State University, Raleigh, and his team of researchers. They’ve figured out a way to use a tiny ultrasonic tornado to break down clots in the brain. “Our new work uses vortex ultrasound, where the ultrasound waves have a helical wavefront. In other words, the ultrasound is swirling as it moves forward,” he said in a statement from the university.
Their new tool’s single transducer is small enough to fit in a catheter, and its “vortex ultrasound-induced shear force has the potential to break down clots safely and improve the efficacy of thrombolysis,” they explained in the open-access journal Research.
The investigators used cow blood in a 3D-printed model of the cerebral venous sinus for the proof-of-concept study and were able to dissolve an acute blood clot in less than 30 minutes, compared with the 15-30 hours needed with a pharmaceutical intervention, according to the written statement.
Can you hear the sound of two wrongs making a right? We can, and that closes the curtain on this cliche.
With age does not come wisdom
We’ve all met this person before. The sort of person who takes a 10-minute IQ test on a shifty-looking website and then proceeds to brag about a 180 IQ until the heat death of the universe. The one who worships at the altar of Mensa. Yeah, that guy. They’re never as smart as they think they are, but they’ll never, ever admit it.
It’s not exactly a secret that IQ as a measurement of intelligence is highly overrated. A lot of scientists doubt we should bother measuring it at all. That said, a higher IQ is associated with greater success in academic and financial endeavors, so it’s not absolutely worthless. And if we’re stuck with it, we may as well study it.
That brings us neatly to new research published in Brain and Behavior. Most studies into IQ and self-estimated intelligence have focused on younger adults, and the author of this study was curious if the stereotype of young men inflating their IQ, a stereotype backed up by research, persisted into older adulthood. So she conducted a survey of 159 younger adults and 152 older adults to find out.
The results in younger adults were not surprising: Younger men overestimated their actual IQ by 5-15 points, which tracks with previous research. We’re in for a bit of a surprise with the older adults, though, because the older men were more humble about their intelligence, with their estimation falling in line with their actual IQ. Older women, however, not so much. In fact, they overestimated their intelligence just as much as the younger men.
In addition, older women who perceived themselves as more attractive reported the highest self-estimated intelligence of all. That isn’t how intelligence works, but honestly, if Grandma’s out and about thinking she looks good and has the brains to go and win “Jeopardy!” do you really have the heart to tell her otherwise?
Fight temptation with empathy … and shoes
Relationships are tough. They all go through their respective ups and downs, but what happens when one person is feeling so down in the partnership that cheating comes to mind? Is there any way to stop it from happening?
Well, a recent study suggests that there is, and it’s as simple as putting yourself in the other person’s shoes. By observing 408 heterosexual, monogamous participants in a series of experiments, psychologists in Israel and New York found that practicing empathy and “perspective taking” doesn’t necessarily stop people from cheating but it does reduces the desire.
People cheat on their significant others for many different reasons – men for a lack of sexual needs being met and women for shortfalls regarding emotional needs – but prioritizing the other person’s perspective gives the idea of being unfaithful a different view and could make one act differently, the investigators said.
Perspective taking also promotes other positive attributes to the relationship, such as the promotion of compassion and the feeling of being understood, lead author Gurit Birnbaum of Reichman University in Herzliya, Israel, said in a written statement. These things ultimately help couples navigate the rough patches and strengthen bonds, making them even less likely to cheat.
The researchers noted that even people in satisfying relationships do cheat, but this approach does encourage people to stop and think before they act. It could ultimately prevent what might be a huge mistake.
Think before they act. Hmm, that’s kind of like look before they leap, right? Sounds like a job for the Cliche-busters.

Autism linked to problems with cardiovascular health
People with autism are more likely to face diabetes, high cholesterol, and heart disease than those without the neurologic condition, according to a study published in JAMA Pediatrics. Researchers also found that children with autism are especially likely to develop diabetes compared with their peers, and are at greater risk of hypertension, too.
While the link between autism and risk for obesity and gastrointestinal ailments is well-established, the new findings suggest that clinicians who care for these patients – particularly children – should focus on cardiometabolic health more broadly.
“Clinicians who are treating kids with autism need to pay more attention to this,” said Chanaka N. Kahathuduwa, MD, PhD, MPhil, of the department of neurology at Texas Tech University Health Sciences Center, in Lubbock, and a coauthor of the new study.
A pediatrician may prescribe an atypical antipsychotic medication such as risperidone to regulate the behavior of an autistic child, Dr. Kahathuduwa said, which may increase their cholesterol levels. Although this or similar drugs may be necessary in some cases, Dr. Kahathuduwa advised that clinicians explore other treatment options first.
Mining data from previously published studies
For the new analysis, Dr. Kahathuduwa and his colleagues pooled the results of 34 previously published studies, which included medical records of more than 276,000 people with autism and close to 8 million people without the condition.
Study participants were an average age of 31 years, and 47% were female. Some studies reported age ranges that enabled the researchers to differentiate between children and adults.
People with autism were 64% more likely to develop type 1 diabetes, 146% more likely to experience type 2 diabetes, and 46% more likely to have heart disease, overall, the study found. Children with autism were almost twice as likely as their peers to develop diabetes (184%) and high blood pressure (154%).
The study found associations, not causation, and does not include detailed data about medication prescribing patterns. While it would be ideal to understand why autism is linked to cardiometabolic risk, to address the link most effectively, Dr. Kahathuduwa said the causes likely are multifactorial. Medication history and genetics each play a role in a way that is hard to untangle. Even so, Dr. Kahathuduwa said he hoped the findings prompt clinicians to reevaluate how they treat their patients with autism.
“This may be an eye opener,” he said.
An editorial accompanying the study noted that people with autism may die up to 30 years earlier than people without autism, in part because of the physical health problems surfaced in the new research. They also are more likely than others to attempt suicide.
Elizabeth M. Weir, PhD, of the Autism Research Centre at the University of Cambridge (England) and author of the editorial, argued that current health delivery models often fail autistic people by not taking their needs into account.
Dr. Weir told this news organization that making adjustments such as dimming the lights for a light-sensitive patient or allowing people with autism to bring an advocate to appointments could build rapport.
“I diagnose autism pretty much every day and I know families get so overwhelmed with all the recommendations that we give,” said Sonia Monteiro, MD, a developmental and behavioral pediatrician at Texas Children’s Hospital in Houston. Still, Dr. Monteiro said clinicians should help parents of children with autism address the potential long-term cardiovascular risks – but to do so by layering in the information rather than merely adding more bullet points to an already long presentation.
“We know this information now, but finding a way to share that with families without overwhelming them even more, I think is challenging,” Dr. Monteiro said. “But it’s not something we can ignore.”
Dr. Kahathuduwa, Dr. Weir, and Dr. Monteiro report no relevant financial relationships.
A version of this article first appeared on Medscape.com.
Long QT syndrome overdiagnosis persists
Five factors underlie the ongoing overdiagnosis and misdiagnosis of long QT syndrome (LQTS), including temporary QT prolongation following vasovagal syncope, a “pseudo”-positive genetic test result, family history of sudden cardiac death, transient QT prolongation, and misinterpretation of the QTc interval, a new study suggests.
Awareness of these characteristics, which led to a diagnostic reversal in 290 of 1,841 (16%) patients, could reduce the burden of overdiagnosis on the health care system and on patients and families, senior author Michael J. Ackerman, MD, PhD, of Mayo Clinic, Rochester, Minn., and colleagues conclude.
“The findings are a disturbing and disappointing sequel to the paper we published about LQTS overdiagnosis back in 2007, which showed that 2 out of every 5 patients who came to Mayo Clinic for a second opinion left without the diagnosis,” Dr. Ackerman told this news organization.
To date, Dr. Ackerman has reversed the diagnosis for 350 patients, he said.
The consequences of an LQTS diagnosis are “profound,” he noted, including years of unnecessary drug therapy, implantation of a cardioverter defibrillator, disqualification from competitive sports, and emotional stress to the individual and family.
By pointing out the five biggest mistakes his team has seen, he said, “we hope to equip the diagnostician with the means to challenge and assess the veracity of a LQTS diagnosis.”
The study was published online in the Journal of the American College of Cardiology.
Time to do better
Dr. Ackerman and colleagues analyzed electronic medical records on 290 of 1,841 (16%) patients who presented with an outside diagnosis of LQTS but subsequently were dismissed as having normal findings. The mean age of these patients at their first Mayo Clinic evaluation was 22, 60% were female, and the mean QTc interval was 427 ±25 milliseconds.
Overall, 38% of misdiagnoses were the result of misinterpretation of clinical factors; 29%, to diagnostic test misinterpretations; 17%, to an apparently positive genetic test in the context of a weak or absent phenotype; and 16%, to a family history of false LQTS or of sudden cardiac or sudden unexplained death.
More specifically, the most common cause of an LQTS misdiagnosis was QT prolongation following vasovagal syncope, which was misinterpreted as LQTS-attributed syncope.
The second most common cause was an apparently positive genetic test for an LQTS gene that turned out to be a benign or likely benign variant.
The third most common cause was an LQTS diagnosis based solely on a family history of sudden unexplained death (26 patients), QT prolongation (11 patients), or sudden cardiac arrest (9 patients).
The fourth most common cause was an isolated event of QT prolongation (44 patients). The transient QT prolongation was observed under myriad conditions unrelated to LQTS. Yet, 31 patients received a diagnosis based solely on the event.
The fifth most common cause was inclusion of the U-wave in the calculation of the QTc interval (40 patients), leading to an inaccurate interpretation of the electrocardiogram.
Dr. Ackerman noted that these LQTS diagnoses were given by heart-rhythm specialists, and most patients self-referred for a second opinion because a family member questioned the diagnosis after doing their own research.
“It’s time that we step up to the plate and do better,” Dr. Ackerman said. The team’s evaluation of the impact of the misdiagnosis on the patients’ lifestyle and quality of life showed that 45% had been restricted from competitive sports (and subsequently resumed sports activity with no adverse events); 80% had been started on beta-blockers (the drugs were discontinued in 84% as a result of the Mayo Clinic evaluation, whereas 16% opted to continue); and 10 of 22 patients (45%) who received an implanted cardioverter device underwent an extraction of the device without complications.
The authors conclude: “Although missing a patient who truly has LQTS can lead to a tragic outcome, the implications of overdiagnosed LQTS are not trivial and are potentially tragic as well.”
‘Tricky diagnosis’
LQTS specialist Peter Aziz, MD, director of pediatric electrophysiology at the Cleveland Clinic, agreed with these findings.
“Most of us ‘channelopathists’ who see LQTS for a living have a good grasp of the disease, but it can be elusive for others,” he said in an interview. “This is a tricky diagnosis. There are ends of the spectrum where people for sure don’t have it and people for sure do. Most clinicians are able to identify that.”
However, he added, “A lot of patients fall into that gray area where it may not be clear at first, even to an expert. But the expert knows how to do a comprehensive evaluation, examining episodes and symptoms and understanding whether they are relevant to LQTS or completely red herrings, and feeling confident about how they calculate the acute interval on an electrocardiogram.”
“All of these may seem mundane, but without the experience, clinicians are vulnerable to miscalculations,” he said. “That’s why our bias, as channelopathists, is that every patient who has a suspected diagnosis or is being treated for LQTS really should see an expert.”
Similarly, Arthur A.M. Wilde, MD, PhD, of the University of Amsterdam, and Peter J. Schwartz, MD, of IRCCS Istituto Auxologico Italiano, Milan, write in a related editorial that it “has to be kept in mind that both diagnostic scores and risk scores are dynamic and can be modified by time and by appropriate therapy.
“Therefore, to make hasty diagnosis of a disease that requires life-long treatment is inappropriate, especially when this is done without the support of adequate, specific experience.”
No commercial funding or relevant financial relationships were reported.
A version of this article first appeared on Medscape.com.
FROM THE JOURNAL OF THE AMERICAN COLLEGE OF CARDIOLOGY
Elevated PCSK9 levels associated with psoriasis suggest new treatment target
A Mendelian randomization study employing data from nearly 300,000 individuals has linked elevated levels of the PCSK9 enzyme with an increased risk of psoriasis, suggesting it might be targetable as an intervention.
. Conversely, psoriasis risk did not appear to be affected when LDL-C was reduced by other pathways of lipid control.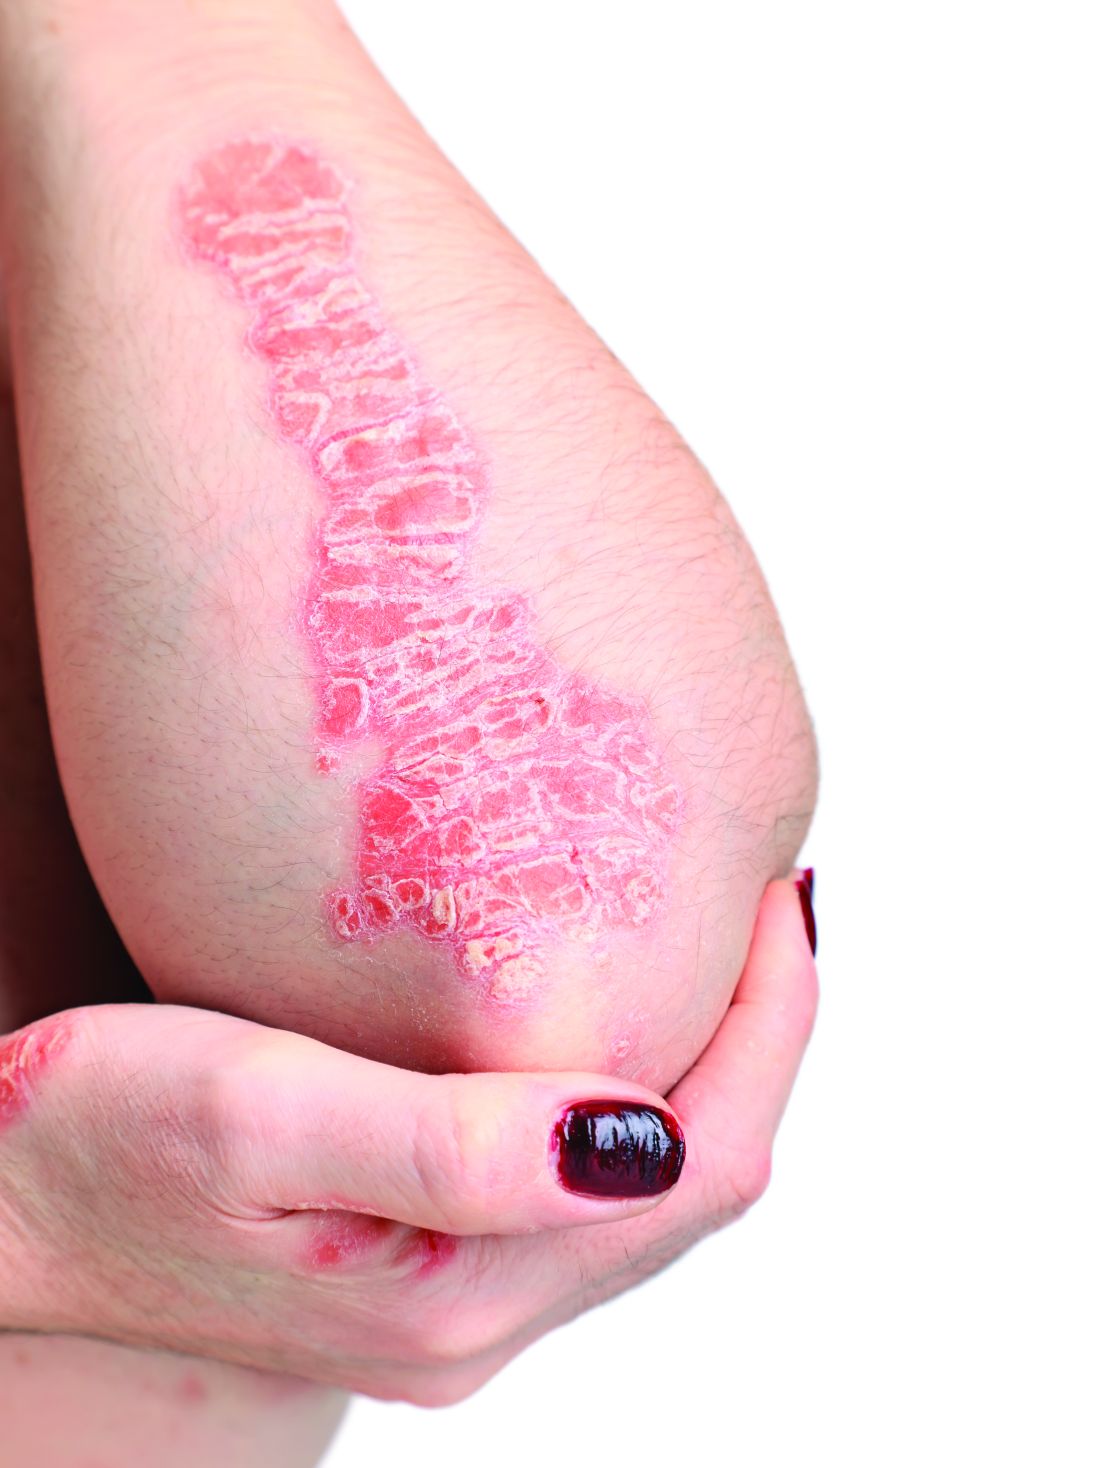
This study “suggests that PCSK9 inhibition is causally associated with reduced risk of psoriasis,” reported a team of investigators led by Sizheng Steven Zhao, MD, PhD, of the division of musculoskeletal and dermatological sciences, University of Manchester (England). “Existing PCSK9 inhibitors hold potential as therapeutic targets for prevention, and possibly treatment, of psoriasis, although further clinical studies are needed,” they concluded.
In an interview, Dr. Zhao also noted that it will be interesting to look at psoriasis susceptibility in post hoc analyses of large randomized controlled trials of PCSK9 inhibitors for cardiovascular disease.
“Genetically proxied” inhibition of HMG-CoA reductase, which is targeted by statins, and NPC1L1 which is targeted by ezetimibe, “were not associated with psoriasis risk,” the investigators reported in the study, published in JAMA Dermatology.
Abnormal lipid metabolism is sufficiently common among people with psoriasis that screening in patients with moderate to severe disease is recommended in 2019 psoriasis guidelines from the American Academy of Dermatology and the National Psoriasis Foundation. However, the link between these diseases is unclear. This study was launched to explore genetically proxied relationships between psoriasis and LDL-C reductions as well as specific treatments for elevated LDL-C.
Mendelian randomizations were applied to deidentified data from two sources, a UK biobank and FinnGen, a Finnish-based project for identifying genotype-to-phenotype correlations. Genetic proxies for these variables were established on the basis of genomewide association studies on large population samples.
Ultimately, 34 genetic variants were selected to proxy for lipid lowering by PCSK9, 19 were selected to proxy for HMG-CoA reductase, and 9 for NPC1L1. In the Mendelian analyses performed on the two sources, genetically proxied PCSK9 inhibition was associated with about a 30% reduction in the odds ratio of psoriasis (OR, 0.69; P = .003). There were no robust associations with proxies for reductions in either HMG-CoA reductase or NPC1L1.
In sensitivity analyses, there was no evidence of bias from pleiotropy or genetic confounding, according to Dr. Zhao and his coauthors, who noted that the relationship between reductions in PCSK9 and reduced risk of psoriasis appeared to be independent of change in circulating LDL-C.

Given the prior evidence implicating the PCSK9 enzyme in psoriasis risk, “this is an exciting study that really highlights the importance of studying and targeting lipid metabolism in psoriasis for a few reasons,” according to Michael S. Garshick, MD, a researcher, cardiologist, and director of the cardio-rheumatology program, New York University Langone Health.
An investigator who has participated in several studies evaluating the relationship between cardiovascular risk and psoriasis, Dr. Garshick said there is increasing interest in PCSK9 as a biomarker or even a mediator of inflammation independent of blood lipid levels.
“In psoriasis regarding PCSK9, we and others have shown PCSK9 is elevated in psoriatic lesion skin, and studies are starting to investigate the unique lipidomic profile in psoriasis,” Dr. Garshick said in an interview. The study he led that showed elevated PCSK9 levels in psoriatic skin was published in 2021 in the Journal of Investigative Dermatology.
While the Mendelian randomization provides only “an inference” that PCSK9 plays a role in mediating risk of psoriasis, Dr. Zhao and coauthors cited numerous studies linking elevated PCSK9 to psoriasis pathophysiology. This not only includes the elevated PCSK9 expression in psoriatic plaques as shown by Dr. Garshick and others but several sets of experimental evidence linking PCSK9 to inflammatory pathways, including upregulation of interleukin-17 and stimulation of macrophage activation.
While Dr. Zhao and coauthors suggested that clinical trials are now needed to test the potential of PCSK9 inhibitors to modify the risk of psoriasis, Dr. Garshick indicated that there are numerous variables to unravel in the relationship between elevated lipids, PCSK9, and psoriasis.
“In our own studies, we did see a statistical correlation between circulating PCSK9 and psoriasis severity,” Dr. Garshick said. But he added, “I think we are just beginning to understand the functions of circulating (extrahepatic) PCSK9 independent of lipid metabolism.”
While he is intrigued by the evidence that PCSK9 is linked to systemic inflammation, he pointed out that several medications used to treat dyslipidemias, such as statins, are associated with an anti-inflammatory effect.
This study “further emphasizes the need to conduct clinical trials treating dyslipidemia in psoriasis, including the targeting of PCSK9, whether it is with statins with lipid lowering and potential pleiotropic anti-inflammatory properties or PCSK9 inhibition,” he said. If positive, “both would be exciting.“
From a cardiologist’s point of view, there is an upside for including patients with psoriasis in lipid-lowering trials even if the effect on psoriasis is modest. Either way, “you still get the lipid-lowering benefit, which is important for reducing atherosclerotic cardiovascular disease,” Dr. Garshick said.
Dr. Zhao reported financial relationships with UCB, although UCB did not provide funding for this study. One author reported grants from Versus Arthritis and the National Institute for Health Research Manchester Biomedical Research Centre during the study, grants from Bristol Myers Squibb, Galapagos, and Pfizer, and personal fees from Chugai Roche outside the submitted work. No other disclosures were reported. The study was supported by grants from Versus Arthritis and the NIHR Manchester Biomedical Research Centre. Dr. Garshick reported financial relationships with AbbVie and Horizon Therapeutics.
A Mendelian randomization study employing data from nearly 300,000 individuals has linked elevated levels of the PCSK9 enzyme with an increased risk of psoriasis, suggesting it might be targetable as an intervention.
. Conversely, psoriasis risk did not appear to be affected when LDL-C was reduced by other pathways of lipid control.
This study “suggests that PCSK9 inhibition is causally associated with reduced risk of psoriasis,” reported a team of investigators led by Sizheng Steven Zhao, MD, PhD, of the division of musculoskeletal and dermatological sciences, University of Manchester (England). “Existing PCSK9 inhibitors hold potential as therapeutic targets for prevention, and possibly treatment, of psoriasis, although further clinical studies are needed,” they concluded.
In an interview, Dr. Zhao also noted that it will be interesting to look at psoriasis susceptibility in post hoc analyses of large randomized controlled trials of PCSK9 inhibitors for cardiovascular disease.
“Genetically proxied” inhibition of HMG-CoA reductase, which is targeted by statins, and NPC1L1 which is targeted by ezetimibe, “were not associated with psoriasis risk,” the investigators reported in the study, published in JAMA Dermatology.
Abnormal lipid metabolism is sufficiently common among people with psoriasis that screening in patients with moderate to severe disease is recommended in 2019 psoriasis guidelines from the American Academy of Dermatology and the National Psoriasis Foundation. However, the link between these diseases is unclear. This study was launched to explore genetically proxied relationships between psoriasis and LDL-C reductions as well as specific treatments for elevated LDL-C.
Mendelian randomizations were applied to deidentified data from two sources, a UK biobank and FinnGen, a Finnish-based project for identifying genotype-to-phenotype correlations. Genetic proxies for these variables were established on the basis of genomewide association studies on large population samples.
Ultimately, 34 genetic variants were selected to proxy for lipid lowering by PCSK9, 19 were selected to proxy for HMG-CoA reductase, and 9 for NPC1L1. In the Mendelian analyses performed on the two sources, genetically proxied PCSK9 inhibition was associated with about a 30% reduction in the odds ratio of psoriasis (OR, 0.69; P = .003). There were no robust associations with proxies for reductions in either HMG-CoA reductase or NPC1L1.
In sensitivity analyses, there was no evidence of bias from pleiotropy or genetic confounding, according to Dr. Zhao and his coauthors, who noted that the relationship between reductions in PCSK9 and reduced risk of psoriasis appeared to be independent of change in circulating LDL-C.
Given the prior evidence implicating the PCSK9 enzyme in psoriasis risk, “this is an exciting study that really highlights the importance of studying and targeting lipid metabolism in psoriasis for a few reasons,” according to Michael S. Garshick, MD, a researcher, cardiologist, and director of the cardio-rheumatology program, New York University Langone Health.
An investigator who has participated in several studies evaluating the relationship between cardiovascular risk and psoriasis, Dr. Garshick said there is increasing interest in PCSK9 as a biomarker or even a mediator of inflammation independent of blood lipid levels.
“In psoriasis regarding PCSK9, we and others have shown PCSK9 is elevated in psoriatic lesion skin, and studies are starting to investigate the unique lipidomic profile in psoriasis,” Dr. Garshick said in an interview. The study he led that showed elevated PCSK9 levels in psoriatic skin was published in 2021 in the Journal of Investigative Dermatology.
While the Mendelian randomization provides only “an inference” that PCSK9 plays a role in mediating risk of psoriasis, Dr. Zhao and coauthors cited numerous studies linking elevated PCSK9 to psoriasis pathophysiology. This not only includes the elevated PCSK9 expression in psoriatic plaques as shown by Dr. Garshick and others but several sets of experimental evidence linking PCSK9 to inflammatory pathways, including upregulation of interleukin-17 and stimulation of macrophage activation.
While Dr. Zhao and coauthors suggested that clinical trials are now needed to test the potential of PCSK9 inhibitors to modify the risk of psoriasis, Dr. Garshick indicated that there are numerous variables to unravel in the relationship between elevated lipids, PCSK9, and psoriasis.
“In our own studies, we did see a statistical correlation between circulating PCSK9 and psoriasis severity,” Dr. Garshick said. But he added, “I think we are just beginning to understand the functions of circulating (extrahepatic) PCSK9 independent of lipid metabolism.”
While he is intrigued by the evidence that PCSK9 is linked to systemic inflammation, he pointed out that several medications used to treat dyslipidemias, such as statins, are associated with an anti-inflammatory effect.
This study “further emphasizes the need to conduct clinical trials treating dyslipidemia in psoriasis, including the targeting of PCSK9, whether it is with statins with lipid lowering and potential pleiotropic anti-inflammatory properties or PCSK9 inhibition,” he said. If positive, “both would be exciting.“
From a cardiologist’s point of view, there is an upside for including patients with psoriasis in lipid-lowering trials even if the effect on psoriasis is modest. Either way, “you still get the lipid-lowering benefit, which is important for reducing atherosclerotic cardiovascular disease,” Dr. Garshick said.
Dr. Zhao reported financial relationships with UCB, although UCB did not provide funding for this study. One author reported grants from Versus Arthritis and the National Institute for Health Research Manchester Biomedical Research Centre during the study, grants from Bristol Myers Squibb, Galapagos, and Pfizer, and personal fees from Chugai Roche outside the submitted work. No other disclosures were reported. The study was supported by grants from Versus Arthritis and the NIHR Manchester Biomedical Research Centre. Dr. Garshick reported financial relationships with AbbVie and Horizon Therapeutics.
FROM JAMA DERMATOLOGY
Angioedema risk jumps when switching HF meds
New renin-angiotensin-system (RAS) inhibitor therapy using sacubitril-valsartan (Entresto) is no more likely to cause angioedema than starting out with an ACE inhibitor or angiotensin receptor blocker (ARB).
But the risk climbs when such patients start on an ACE inhibitor or ARB and then switch to sacubitril-valsartan, compared with those prescribed the newer drug, the only available angiotensin receptor-neprilysin inhibitor (ARNI), in the first place.
Those findings and others from a large database analysis, by researchers at the Food and Drug Administration and Harvard Medical School, may clarify and help alleviate a residual safety concern about the ARNI – that it might promote angioedema – that persists after the drug’s major HF trials.
The angioedema risk increased the most right after the switch to the ARNI from one of the older RAS inhibitors. For example, the overall risk doubled for patients who started with an ARB then switched to sacubitril-valsartan, compared with those who started on the newer drug. But it went up about 2.5 times during the first 14 days after the switch.
A similar pattern emerged for ACE inhibitors, but the increased angioedema risk reached significance only within 2 weeks of the switch from an ACE inhibitor to sacubitril-valsartan compared to starting on the latter.
The analysis, based on data from the FDA’s Sentinel adverse event reporting system, was published in the Journal of the American College of Cardiology.
A rare complication, but ...
Angioedema was rare overall in the study, with an unadjusted rate of about 6.75 per 1,000 person-years for users of ACE inhibitors, less than half that rate for ARB users, and only one-fifth that rate for sacubitril-valsartan recipients.
But even a rare complication can be a worry for drugs as widely used as RAS inhibitors. And it’s not unusual for patients cautiously started on an ACE inhibitor or ARB to be switched to sacubitril-valsartan, which is only recently a core guideline–recommended therapy for HF with reduced ejection fraction.
Such patients transitioning to the ARNI, the current study suggests, should probably be watched closely for signs of angioedema for 2 weeks but especially during the first few days. Indeed, the study’s event curves show most of the extra risk “popping up” right after the switch to sacubitril-valsartan, lead author Efe Eworuke, PhD, told this news organization.
The ARNI’s labeling, which states the drug should follow ACE inhibitors only after 36-hour washout period, “has done justice to this issue,” she said. But “whether clinicians are adhering to that, we can’t tell.”
Potentially, patients who miss the 36-hour washout between ACE inhibitors or ARBs and sacubitril-valsartan may account for the excess angioedema risk seen in the analysis, said Dr. Eworuke, with the FDA’s Center for Drug Evaluation and Research, Silver Spring, Md.
But the analysis doesn’t nail down the window of excess risk to only 36 hours. It suggests that patients switching to the ARNI – even those pausing for 36 hours in between drugs – should probably be monitored “2 weeks or longer,” she said. “They could still have angioedema after the washout period.”
Indeed, the “timing of the switch may be critical,” according to an editorial accompanying the report. “Perhaps a longer initial exposure period of ACE inhibitor or ARB,” beyond 2 weeks, “should be considered before switching to an ARNI,” contended Robert L. Page II, PharmD, MSPH, University of Colorado Skaggs School of Pharmacy and Pharmaceutical Sciences, Aurora.

Moreover, he wrote, the study suggests that “initiation of an ARNI de novo may be safer compared with trialing an ACE inhibitor or ARB then switching to an ARNI,” and “should be a consideration when beginning guideline-directed medical therapy for patients with HF.”
New RAS inhibition with ARNI ‘protective’
Compared with ARNI “new users” who had not received any RAS inhibitor in the prior 6 months, patients in the study who switched from an ACE inhibitor to ARNI (41,548 matched pairs) showed a hazard ratio (HR) for angioedema of 1.62 (95% confidence interval [CI], 0.91-2.89), that is, only a “trend,” the report states.
But that trend became significant when the analysis considered only angioedema cases in the first 14 days after the drug switch: HR, 1.98 (95% CI, 1.11-3.53).
Those switching from an ARB to ARNI, compared with ARNI new users (37,893 matched pairs), showed a significant HR for angioedema of 2.03 (95% CI, 1.16-3.54). The effect was more pronounced when considering only angioedema arising in the first 2 weeks: HR, 2.45 (95% CI, 1.36-4.43).
Compared with new use of ACE inhibitors, new ARNI use (41,998 matched pairs) was “protective,” the report states, with an HR for angioedema of 0.18 (95% CI, 0.11-0.29). So was a switch from ACE inhibitors to the ARNI (69,639 matched pairs), with an HR of 0.31 (95% CI, 0.23-0.43).
But compared with starting with an ARB, ARNI new use (43,755 matched pairs) had a null effect on angioedema risk, HR, 0.59 (95% CI, 0.35-1.01); as did switching from an ARB to ARNI (49,137 matched pairs), HR, 0.85 (95% CI, 0.58-1.26).
The analysis has limitations, Dr. Eworuke acknowledged. The comparator groups probably differed in unknown ways given the limits of propensity matching, for example, and because the FDA’s Sentinel system data can reflect only cases that are reported, the study probably underestimates the true prevalence of angioedema.
For example, a patient may see a clinician for a milder case that resolves without a significant intervention, she noted. But “those types of angioedema would not have been captured by our study.”
Dr. Eworuke disclosed that her comments reflect her views and are not those of the Food and Drug Administration; she and the other authors, as well as editorialist Dr. Page, report no relevant financial relationships.
A version of this article first appeared on Medscape.com.
New renin-angiotensin-system (RAS) inhibitor therapy using sacubitril-valsartan (Entresto) is no more likely to cause angioedema than starting out with an ACE inhibitor or angiotensin receptor blocker (ARB).
But the risk climbs when such patients start on an ACE inhibitor or ARB and then switch to sacubitril-valsartan, compared with those prescribed the newer drug, the only available angiotensin receptor-neprilysin inhibitor (ARNI), in the first place.
Those findings and others from a large database analysis, by researchers at the Food and Drug Administration and Harvard Medical School, may clarify and help alleviate a residual safety concern about the ARNI – that it might promote angioedema – that persists after the drug’s major HF trials.
The angioedema risk increased the most right after the switch to the ARNI from one of the older RAS inhibitors. For example, the overall risk doubled for patients who started with an ARB then switched to sacubitril-valsartan, compared with those who started on the newer drug. But it went up about 2.5 times during the first 14 days after the switch.
A similar pattern emerged for ACE inhibitors, but the increased angioedema risk reached significance only within 2 weeks of the switch from an ACE inhibitor to sacubitril-valsartan compared to starting on the latter.
The analysis, based on data from the FDA’s Sentinel adverse event reporting system, was published in the Journal of the American College of Cardiology.
A rare complication, but ...
Angioedema was rare overall in the study, with an unadjusted rate of about 6.75 per 1,000 person-years for users of ACE inhibitors, less than half that rate for ARB users, and only one-fifth that rate for sacubitril-valsartan recipients.
But even a rare complication can be a worry for drugs as widely used as RAS inhibitors. And it’s not unusual for patients cautiously started on an ACE inhibitor or ARB to be switched to sacubitril-valsartan, which is only recently a core guideline–recommended therapy for HF with reduced ejection fraction.
Such patients transitioning to the ARNI, the current study suggests, should probably be watched closely for signs of angioedema for 2 weeks but especially during the first few days. Indeed, the study’s event curves show most of the extra risk “popping up” right after the switch to sacubitril-valsartan, lead author Efe Eworuke, PhD, told this news organization.
The ARNI’s labeling, which states the drug should follow ACE inhibitors only after 36-hour washout period, “has done justice to this issue,” she said. But “whether clinicians are adhering to that, we can’t tell.”
Potentially, patients who miss the 36-hour washout between ACE inhibitors or ARBs and sacubitril-valsartan may account for the excess angioedema risk seen in the analysis, said Dr. Eworuke, with the FDA’s Center for Drug Evaluation and Research, Silver Spring, Md.
But the analysis doesn’t nail down the window of excess risk to only 36 hours. It suggests that patients switching to the ARNI – even those pausing for 36 hours in between drugs – should probably be monitored “2 weeks or longer,” she said. “They could still have angioedema after the washout period.”
Indeed, the “timing of the switch may be critical,” according to an editorial accompanying the report. “Perhaps a longer initial exposure period of ACE inhibitor or ARB,” beyond 2 weeks, “should be considered before switching to an ARNI,” contended Robert L. Page II, PharmD, MSPH, University of Colorado Skaggs School of Pharmacy and Pharmaceutical Sciences, Aurora.
Moreover, he wrote, the study suggests that “initiation of an ARNI de novo may be safer compared with trialing an ACE inhibitor or ARB then switching to an ARNI,” and “should be a consideration when beginning guideline-directed medical therapy for patients with HF.”
New RAS inhibition with ARNI ‘protective’
Compared with ARNI “new users” who had not received any RAS inhibitor in the prior 6 months, patients in the study who switched from an ACE inhibitor to ARNI (41,548 matched pairs) showed a hazard ratio (HR) for angioedema of 1.62 (95% confidence interval [CI], 0.91-2.89), that is, only a “trend,” the report states.
But that trend became significant when the analysis considered only angioedema cases in the first 14 days after the drug switch: HR, 1.98 (95% CI, 1.11-3.53).
Those switching from an ARB to ARNI, compared with ARNI new users (37,893 matched pairs), showed a significant HR for angioedema of 2.03 (95% CI, 1.16-3.54). The effect was more pronounced when considering only angioedema arising in the first 2 weeks: HR, 2.45 (95% CI, 1.36-4.43).
Compared with new use of ACE inhibitors, new ARNI use (41,998 matched pairs) was “protective,” the report states, with an HR for angioedema of 0.18 (95% CI, 0.11-0.29). So was a switch from ACE inhibitors to the ARNI (69,639 matched pairs), with an HR of 0.31 (95% CI, 0.23-0.43).
But compared with starting with an ARB, ARNI new use (43,755 matched pairs) had a null effect on angioedema risk, HR, 0.59 (95% CI, 0.35-1.01); as did switching from an ARB to ARNI (49,137 matched pairs), HR, 0.85 (95% CI, 0.58-1.26).
The analysis has limitations, Dr. Eworuke acknowledged. The comparator groups probably differed in unknown ways given the limits of propensity matching, for example, and because the FDA’s Sentinel system data can reflect only cases that are reported, the study probably underestimates the true prevalence of angioedema.
For example, a patient may see a clinician for a milder case that resolves without a significant intervention, she noted. But “those types of angioedema would not have been captured by our study.”
Dr. Eworuke disclosed that her comments reflect her views and are not those of the Food and Drug Administration; she and the other authors, as well as editorialist Dr. Page, report no relevant financial relationships.
A version of this article first appeared on Medscape.com.
FROM THE JOURNAL OF THE AMERICAN COLLEGE OF CARDIOLOGY
Noninvasive liver test may help select asymptomatic candidates for heart failure tests
A noninvasive test for liver disease may be a useful, low-cost screening tool to select asymptomatic candidates for a detailed examination of heart failure with preserved ejection fraction (HFpEF), say authors of a report published in Gastro Hep Advances.
The fibrosis-4 (FIB-4) index was a significant predictor of high HFpEF risk, wrote Chisato Okamoto, MD, of the department of medical biochemistry at Osaka University Graduate School of Medicine and the National Cerebral and Cardiovascular Center in Japan, and colleagues.
“Recognition of heart failure with preserved ejection fraction at an early stage in mass screening is desirable, but difficult to achieve,” the authors wrote. “The FIB-4 index is calculated using only four parameters that are routinely evaluated in general health check-up programs.”
HFpEF is an emerging disease in recent years with a poor prognosis, they wrote. Early diagnosis can be challenging for several reasons, particularly because HFpEF patients are often asymptomatic until late in the disease process and have normal left ventricular filling pressures at rest. By using a tool to select probable cases from subclinical participants in a health check-up program, clinicians can refer patients for a diastolic stress test, which is considered the gold standard for diagnosing HFpEF.
Previous studies have found that the FIB-4 index, a noninvasive tool to estimate liver stiffness and fibrosis, is associated with a higher risk of major adverse cardiovascular events (MACE) in patients with HFpEF. In addition, patients with nonalcoholic fatty liver disease (NAFLD) have a twofold higher prevalence of HFpEF than the general population.
Dr. Okamoto and colleagues examined the association between the FIB-4 index and HFpEF risk based on the Heart Failure Association’s diagnostic algorithm for HFpEF in patients with breathlessness (HFA-PEFF). The researchers looked at the prognostic impact of the FIB-4 index in 710 patients who participated in a health check-up program in the rural community of Arita-cho, Japan, between 2006 and 2007. They excluded participants with a history of cardiovascular disease or reduced left ventricular systolic function (LVEF < 50%). Researchers calculated the FIB-4 index and HFA-PEFF score for all participants.
First, using the HFA-PEFF scores, the researchers sorted participants into five groups by HFpEF risk: 215 (30%) with zero points, 100 (14%) with 1 point, 171 (24%) with 2 points, 163 (23%) with 3 points, and 61 (9%) with 4-6 points. Participants in the high-risk group (scores 4-6) were older, mostly men, and had higher blood pressure, alcohol intake, hypertension, dyslipidemia, and liver disease. The higher the HFpEF risk group, the higher the rates of all-cause mortality, hospitalization for heart failure, and MACE.
Overall, the FIB-4 index was correlated with the HFpEF risk groups and showed a stepwise increase across the groups, with .94 for the low-risk group, 1.45 for the intermediate-risk group, and 1.99 for the high-risk group, the authors wrote. The FIB-4 index also correlated with markers associated with components of the HFA-PEFF scoring system.
Using multivariate logistic regression analysis, the FIB-4 index was associated with a high HFpEF risk, and an increase in FIB-4 was associated with increased odds of high HFpEF risk. The association remained significant across four separate models that accounted for risk factors associated with lifestyle-related diseases, blood parameters associated with liver disease, and chronic conditions such as hypertension, dyslipidemia, diabetes mellitus, and liver disease.
In additional area under the curve (AUC) analyses, the FIB-4 index was a significant predictor of high HFpEF risk. At cutoff values typically used for advanced liver fibrosis in NAFLD, a FIB-4 cutoff of 1.3 or less had a sensitivity of 85.2%, while a FIB-4 cutoff of 2.67 or higher had a specificity of 94.8%. At alternate cutoff values typically used for patients with HIV/hepatitis C virus infection, a FIB-4 cutoff of less than 1.45 had a sensitivity of 75.4%, while a FIB-4 cutoff of greater than 3.25 had a specificity of 98%.
Using cutoffs of 1.3 and 2.67, a higher FIB-4 was associated with higher rates of clinical events and MACE, as well as a higher HFpEF risk. Using the alternate cutoffs of 1.45 and 3.25, prognostic stratification of clinical events and MACE was also possible.
When all variables were included in the multivariate model, the FIB-4 index remained a significant prognostic predictor. The FIB-4 index stratified clinical prognosis was also an independent predictor of all-cause mortality and hospitalization for heart failure.
Although additional studies are needed to reveal the interaction between liver and heart function, the study authors wrote, the findings provide valuable insights that can help discover the cardiohepatic interaction to reduce the development of HFpEF.
“Since it can be easily, quickly, and inexpensively measured, routine or repeated measurements of the FIB-4 index could help in selecting preferred candidates for detailed examination of HFpEF risk, which may improve clinical outcomes by diagnosing HFpEF at an early stage,” they wrote.
The study was supported by grants from the Osaka Medical Research Foundation for Intractable Disease, the Japan Arteriosclerosis Prevention Fund, the Japan Society for the Promotion of Science, and the Japan Heart Foundation. The authors disclosed no conflicts.
The 2021 NAFLD clinical care pathway is a shining example of how a simple score like the fibrosis-4 (FIB-4) index – paired sequentially with a second noninvasive test like vibration-controlled elastography – can provide an accurate, cost-effective screening tool and risk stratification and further limit invasive testing such as liver biopsy.

Broader use of FIB-4 by cardiovascular and hepatology providers may increase earlier identification of NAFLD or HFpEF or both.
Anand S. Shah, MD, is director of hepatology at Atlanta VA Healthcare and assistant professor of medicine, division of digestive disease, department of medicine, Emory University, Atlanta. He has no financial conflicts.
The 2021 NAFLD clinical care pathway is a shining example of how a simple score like the fibrosis-4 (FIB-4) index – paired sequentially with a second noninvasive test like vibration-controlled elastography – can provide an accurate, cost-effective screening tool and risk stratification and further limit invasive testing such as liver biopsy.
Broader use of FIB-4 by cardiovascular and hepatology providers may increase earlier identification of NAFLD or HFpEF or both.
Anand S. Shah, MD, is director of hepatology at Atlanta VA Healthcare and assistant professor of medicine, division of digestive disease, department of medicine, Emory University, Atlanta. He has no financial conflicts.
A noninvasive test for liver disease may be a useful, low-cost screening tool to select asymptomatic candidates for a detailed examination of heart failure with preserved ejection fraction (HFpEF), say authors of a report published in Gastro Hep Advances.
The fibrosis-4 (FIB-4) index was a significant predictor of high HFpEF risk, wrote Chisato Okamoto, MD, of the department of medical biochemistry at Osaka University Graduate School of Medicine and the National Cerebral and Cardiovascular Center in Japan, and colleagues.
“Recognition of heart failure with preserved ejection fraction at an early stage in mass screening is desirable, but difficult to achieve,” the authors wrote. “The FIB-4 index is calculated using only four parameters that are routinely evaluated in general health check-up programs.”
HFpEF is an emerging disease in recent years with a poor prognosis, they wrote. Early diagnosis can be challenging for several reasons, particularly because HFpEF patients are often asymptomatic until late in the disease process and have normal left ventricular filling pressures at rest. By using a tool to select probable cases from subclinical participants in a health check-up program, clinicians can refer patients for a diastolic stress test, which is considered the gold standard for diagnosing HFpEF.
Previous studies have found that the FIB-4 index, a noninvasive tool to estimate liver stiffness and fibrosis, is associated with a higher risk of major adverse cardiovascular events (MACE) in patients with HFpEF. In addition, patients with nonalcoholic fatty liver disease (NAFLD) have a twofold higher prevalence of HFpEF than the general population.
Dr. Okamoto and colleagues examined the association between the FIB-4 index and HFpEF risk based on the Heart Failure Association’s diagnostic algorithm for HFpEF in patients with breathlessness (HFA-PEFF). The researchers looked at the prognostic impact of the FIB-4 index in 710 patients who participated in a health check-up program in the rural community of Arita-cho, Japan, between 2006 and 2007. They excluded participants with a history of cardiovascular disease or reduced left ventricular systolic function (LVEF < 50%). Researchers calculated the FIB-4 index and HFA-PEFF score for all participants.
First, using the HFA-PEFF scores, the researchers sorted participants into five groups by HFpEF risk: 215 (30%) with zero points, 100 (14%) with 1 point, 171 (24%) with 2 points, 163 (23%) with 3 points, and 61 (9%) with 4-6 points. Participants in the high-risk group (scores 4-6) were older, mostly men, and had higher blood pressure, alcohol intake, hypertension, dyslipidemia, and liver disease. The higher the HFpEF risk group, the higher the rates of all-cause mortality, hospitalization for heart failure, and MACE.
Overall, the FIB-4 index was correlated with the HFpEF risk groups and showed a stepwise increase across the groups, with .94 for the low-risk group, 1.45 for the intermediate-risk group, and 1.99 for the high-risk group, the authors wrote. The FIB-4 index also correlated with markers associated with components of the HFA-PEFF scoring system.
Using multivariate logistic regression analysis, the FIB-4 index was associated with a high HFpEF risk, and an increase in FIB-4 was associated with increased odds of high HFpEF risk. The association remained significant across four separate models that accounted for risk factors associated with lifestyle-related diseases, blood parameters associated with liver disease, and chronic conditions such as hypertension, dyslipidemia, diabetes mellitus, and liver disease.
In additional area under the curve (AUC) analyses, the FIB-4 index was a significant predictor of high HFpEF risk. At cutoff values typically used for advanced liver fibrosis in NAFLD, a FIB-4 cutoff of 1.3 or less had a sensitivity of 85.2%, while a FIB-4 cutoff of 2.67 or higher had a specificity of 94.8%. At alternate cutoff values typically used for patients with HIV/hepatitis C virus infection, a FIB-4 cutoff of less than 1.45 had a sensitivity of 75.4%, while a FIB-4 cutoff of greater than 3.25 had a specificity of 98%.
Using cutoffs of 1.3 and 2.67, a higher FIB-4 was associated with higher rates of clinical events and MACE, as well as a higher HFpEF risk. Using the alternate cutoffs of 1.45 and 3.25, prognostic stratification of clinical events and MACE was also possible.
When all variables were included in the multivariate model, the FIB-4 index remained a significant prognostic predictor. The FIB-4 index stratified clinical prognosis was also an independent predictor of all-cause mortality and hospitalization for heart failure.
Although additional studies are needed to reveal the interaction between liver and heart function, the study authors wrote, the findings provide valuable insights that can help discover the cardiohepatic interaction to reduce the development of HFpEF.
“Since it can be easily, quickly, and inexpensively measured, routine or repeated measurements of the FIB-4 index could help in selecting preferred candidates for detailed examination of HFpEF risk, which may improve clinical outcomes by diagnosing HFpEF at an early stage,” they wrote.
The study was supported by grants from the Osaka Medical Research Foundation for Intractable Disease, the Japan Arteriosclerosis Prevention Fund, the Japan Society for the Promotion of Science, and the Japan Heart Foundation. The authors disclosed no conflicts.
FROM GASTRO HEP ADVANCES
Does regular walking improve lipid levels in adults?
Evidence summary
Walking’s impact on cholesterol levels is modest, inconsistent
A 2022 systematic review and meta-analysis of 21 studies (n = 1129) evaluated the effects of walking on lipids and lipoproteins in women older than 18 years who were overweight or obese and were not taking any lipid-lowering medications. Median TC was 206 mg/dL and median LDL was 126 mg/dL.1
The primary outcome found that walking decreased TC and LDL levels independent of diet and weight loss. Twenty studies reported on TC and showed that walking significantly decreased TC levels compared to the control groups (raw mean difference [RMD] = 6.7 mg/dL; 95% CI, 0.4-12.9; P = .04). Fifteen studies examined LDL and showed a significant decrease in LDL levels with walking compared to control groups (RMD = 7.4 mg/dL; 95% CI, 0.3-14.5; P = .04). However, the small magnitude of the changes may have little clinical impact.1
There were no significant changes in the walking groups compared to the control groups for triglycerides (17 studies; RMD = 2.2 mg/dL; 95% CI, –8.4 to 12.8; P = .68) or high-density lipoprotein (HDL) (18 studies; RMD = 1.5 mg/dL; 95% CI, –0.4 to 3.3; P = .12). Included studies were required to be controlled but were otherwise not described. The overall risk for bias was determined to be low.1
A 2020 RCT (n = 22) assessed the effects of a walking intervention on cholesterol and cardiovascular disease (CVD) risk in individuals ages 40 to 65 years with moderate CVD risk but without diabetes or CVD.2 Moderate CVD risk was defined as a 2% to 5% 10-year risk for a CVD event using the European HeartScore, which incorporates age, sex, blood pressure, lipid levels, and smoking status3; however, study participants were not required to have hyperlipidemia. Participants were enrolled in a 12-week, nurse-led intervention of moderate-paced walking for 30 to 45 minutes 5 times weekly.
Individuals in the intervention group had significant decreases in average TC levels from baseline to follow-up (244.6 mg/dL vs 213.7 mg/dL; P = .001). As a result, participants’ average 10-year CVD risk was significantly reduced from moderate risk to low risk (2.6% vs 1.8%; P = 038) and was significantly lower in the intervention group than in the control group at follow-up (1.8% vs 3.1%; P = .019). No blinding was used, and the use of lipid-lowering medications was not reported, which could have impacted the results.2
A 2008 RCT (n = 67) examined the effect of a home-based walking program (12 weeks of brisk walking, at least 30 min/d and at least 5 d/wk, with at least 300 kcal burned per walk) vs a sedentary control group in men ages 45 to 65 years with hyperlipidemia (TC > 240 mg/dL and/or TC/HDL-C ratio ≥ 6) who were not receiving lipid-lowering medication. There were no significant changes from baseline to follow-up in the walking group compared to the control group in TC (adjusted mean difference [AMD] = –9.3 mg/dL; 95% CI, –22.8 to 4.64; P = .19), HDL-C (AMD = 2.7 mg/dL; 95% CI, –0.4 to 5.4; P = .07) or triglycerides (AMD = –26.6 mg/dL; 95% CI, –56.7 to 2.7; P = .07).4
A 2002 RCT (n = 111) of sedentary men and women (BMI, 25-35; ages, 40-65 years) with dyslipidemia (LDL of 130-190 mg/dL, or HDL < 40 mg/dL for men or < 45 mg/dL for women) examined the impact of various physical activity levels for 8 months when compared to a control group observed for 6 months. The group assigned to low-amount, moderate-intensity physical activity walked an equivalent of 12 miles per week.5
Continue to: In this group...
In this group, there was a significant decrease in average triglyceride concentrations from baseline to follow-up (mean ± standard error = 196.8 ± 30.5 mg/dL vs 145.2 ± 16.0 mg/dL; P < .001). Significance of the change compared with changes in the control group was not reported, although triglycerides in the control group increased from baseline to follow-up (132.1 ± 11.0 vs 155.8 ± 14.9 mg/dL). There were no significant changes from baseline to follow-up in TC (194 ± 4.8 vs 197.9 ± 5.4 mg/dL), LDL (122.7 ± 4.0 vs 127.8 ± 4.1 mg/dL), or HDL (42.0 ± 1.9 vs 43.1 ± 2.5 mg/dL); P values of pre-post changes and comparison to control group were not reported.5
Recommendations from others
The Physical Activity Guidelines for Americans, published by the Department of Health and Human Services and updated in 2018, cite adherence to the published guidelines as a protective factor against high LDL and total lipids in both adults and children.6 The guidelines for adults recommend 150 to 300 minutes of moderate-intensity or 75 to 150 minutes of vigorous-intensity aerobic exercise per week, as well as muscle-strengthening activities of moderate or greater intensity 2 or more days per week. Brisk walking is included as an example of a moderate-intensity activity. These same guidelines are cited and endorsed by the American College of Sports Medicine and the American Heart Association.7,8
Editor’s takeaway
The lipid reductions achieved from walking—if any—are minimal. By themselves, these small reductions will not accomplish our lipid-lowering goals. However, cholesterol goals are primarily disease oriented. This evidence does not directly inform us of important patient-oriented outcomes, such as morbidity, mortality, and vitality.
1. Ballard AM, Davis A, Wong B, et al. The effects of exclusive walking on lipids and lipoproteins in women with overweight and obesity: a systematic review and meta-analysis. Am J Health Promot. 2022;36:328-339. doi: 10.1177/08901171211048135
2. Akgöz AD, Gözüm S. Effectiveness of a nurse-led physical activity intervention to decrease cardiovascular disease risk in middle-aged adults: a pilot randomized controlled study. J Vasc Nurs. 2020;38:140-148. doi: 10.1016/j.jvn.2020.05.002
3. European Association of Preventive Cardiology. HeartScore. Accessed December 23, 2022. www.heartscore.org/en_GB
4. Coghill N, Cooper AR. The effect of a home-based walking program on risk factors for coronary heart disease in hypercholesterolaemic men: a randomized controlled trial. Prev Med. 2008; 46:545-551. doi: 10.1016/j.ypmed.2008.01.002
5. Kraus WE, Houmard JA, Duscha BD, et al. Effects of the amount and intensity of exercise on plasma lipoproteins. N Engl J Med. 2002;347:1483-1492. doi: 10.1056/NEJMoa020194
6. US Department of Health and Human Services. Physical Activity Guidelines for Americans, 2nd edition. Washington, DC: US Department of Health and Human Services; 2018. Accessed December 23, 2022. https://health.gov/sites/default/files/2019-09/Physical_Activity_Guidelines_2nd_edition.pdf
7. American Heart Association. Recommendations for physical activity in adults and kids. Accessed December 23, 2022. www.heart.org/en/healthy-living/fitness/fitness-basics/aha-recs-for-physical-activity-in-adults
8. American College of Sports Medicine. Trending topic: physical activity guidelines. Accessed December 23, 2022. www.acsm.org/education-resources/trending-topics-resources/physical-activity-guidelines
Evidence summary
Walking’s impact on cholesterol levels is modest, inconsistent
A 2022 systematic review and meta-analysis of 21 studies (n = 1129) evaluated the effects of walking on lipids and lipoproteins in women older than 18 years who were overweight or obese and were not taking any lipid-lowering medications. Median TC was 206 mg/dL and median LDL was 126 mg/dL.1
The primary outcome found that walking decreased TC and LDL levels independent of diet and weight loss. Twenty studies reported on TC and showed that walking significantly decreased TC levels compared to the control groups (raw mean difference [RMD] = 6.7 mg/dL; 95% CI, 0.4-12.9; P = .04). Fifteen studies examined LDL and showed a significant decrease in LDL levels with walking compared to control groups (RMD = 7.4 mg/dL; 95% CI, 0.3-14.5; P = .04). However, the small magnitude of the changes may have little clinical impact.1
There were no significant changes in the walking groups compared to the control groups for triglycerides (17 studies; RMD = 2.2 mg/dL; 95% CI, –8.4 to 12.8; P = .68) or high-density lipoprotein (HDL) (18 studies; RMD = 1.5 mg/dL; 95% CI, –0.4 to 3.3; P = .12). Included studies were required to be controlled but were otherwise not described. The overall risk for bias was determined to be low.1
A 2020 RCT (n = 22) assessed the effects of a walking intervention on cholesterol and cardiovascular disease (CVD) risk in individuals ages 40 to 65 years with moderate CVD risk but without diabetes or CVD.2 Moderate CVD risk was defined as a 2% to 5% 10-year risk for a CVD event using the European HeartScore, which incorporates age, sex, blood pressure, lipid levels, and smoking status3; however, study participants were not required to have hyperlipidemia. Participants were enrolled in a 12-week, nurse-led intervention of moderate-paced walking for 30 to 45 minutes 5 times weekly.
Individuals in the intervention group had significant decreases in average TC levels from baseline to follow-up (244.6 mg/dL vs 213.7 mg/dL; P = .001). As a result, participants’ average 10-year CVD risk was significantly reduced from moderate risk to low risk (2.6% vs 1.8%; P = 038) and was significantly lower in the intervention group than in the control group at follow-up (1.8% vs 3.1%; P = .019). No blinding was used, and the use of lipid-lowering medications was not reported, which could have impacted the results.2
A 2008 RCT (n = 67) examined the effect of a home-based walking program (12 weeks of brisk walking, at least 30 min/d and at least 5 d/wk, with at least 300 kcal burned per walk) vs a sedentary control group in men ages 45 to 65 years with hyperlipidemia (TC > 240 mg/dL and/or TC/HDL-C ratio ≥ 6) who were not receiving lipid-lowering medication. There were no significant changes from baseline to follow-up in the walking group compared to the control group in TC (adjusted mean difference [AMD] = –9.3 mg/dL; 95% CI, –22.8 to 4.64; P = .19), HDL-C (AMD = 2.7 mg/dL; 95% CI, –0.4 to 5.4; P = .07) or triglycerides (AMD = –26.6 mg/dL; 95% CI, –56.7 to 2.7; P = .07).4
A 2002 RCT (n = 111) of sedentary men and women (BMI, 25-35; ages, 40-65 years) with dyslipidemia (LDL of 130-190 mg/dL, or HDL < 40 mg/dL for men or < 45 mg/dL for women) examined the impact of various physical activity levels for 8 months when compared to a control group observed for 6 months. The group assigned to low-amount, moderate-intensity physical activity walked an equivalent of 12 miles per week.5
Continue to: In this group...
In this group, there was a significant decrease in average triglyceride concentrations from baseline to follow-up (mean ± standard error = 196.8 ± 30.5 mg/dL vs 145.2 ± 16.0 mg/dL; P < .001). Significance of the change compared with changes in the control group was not reported, although triglycerides in the control group increased from baseline to follow-up (132.1 ± 11.0 vs 155.8 ± 14.9 mg/dL). There were no significant changes from baseline to follow-up in TC (194 ± 4.8 vs 197.9 ± 5.4 mg/dL), LDL (122.7 ± 4.0 vs 127.8 ± 4.1 mg/dL), or HDL (42.0 ± 1.9 vs 43.1 ± 2.5 mg/dL); P values of pre-post changes and comparison to control group were not reported.5
Recommendations from others
The Physical Activity Guidelines for Americans, published by the Department of Health and Human Services and updated in 2018, cite adherence to the published guidelines as a protective factor against high LDL and total lipids in both adults and children.6 The guidelines for adults recommend 150 to 300 minutes of moderate-intensity or 75 to 150 minutes of vigorous-intensity aerobic exercise per week, as well as muscle-strengthening activities of moderate or greater intensity 2 or more days per week. Brisk walking is included as an example of a moderate-intensity activity. These same guidelines are cited and endorsed by the American College of Sports Medicine and the American Heart Association.7,8
Editor’s takeaway
The lipid reductions achieved from walking—if any—are minimal. By themselves, these small reductions will not accomplish our lipid-lowering goals. However, cholesterol goals are primarily disease oriented. This evidence does not directly inform us of important patient-oriented outcomes, such as morbidity, mortality, and vitality.
1. Ballard AM, Davis A, Wong B, et al. The effects of exclusive walking on lipids and lipoproteins in women with overweight and obesity: a systematic review and meta-analysis. Am J Health Promot. 2022;36:328-339. doi: 10.1177/08901171211048135
2. Akgöz AD, Gözüm S. Effectiveness of a nurse-led physical activity intervention to decrease cardiovascular disease risk in middle-aged adults: a pilot randomized controlled study. J Vasc Nurs. 2020;38:140-148. doi: 10.1016/j.jvn.2020.05.002
3. European Association of Preventive Cardiology. HeartScore. Accessed December 23, 2022. www.heartscore.org/en_GB
4. Coghill N, Cooper AR. The effect of a home-based walking program on risk factors for coronary heart disease in hypercholesterolaemic men: a randomized controlled trial. Prev Med. 2008; 46:545-551. doi: 10.1016/j.ypmed.2008.01.002
5. Kraus WE, Houmard JA, Duscha BD, et al. Effects of the amount and intensity of exercise on plasma lipoproteins. N Engl J Med. 2002;347:1483-1492. doi: 10.1056/NEJMoa020194
6. US Department of Health and Human Services. Physical Activity Guidelines for Americans, 2nd edition. Washington, DC: US Department of Health and Human Services; 2018. Accessed December 23, 2022. https://health.gov/sites/default/files/2019-09/Physical_Activity_Guidelines_2nd_edition.pdf
7. American Heart Association. Recommendations for physical activity in adults and kids. Accessed December 23, 2022. www.heart.org/en/healthy-living/fitness/fitness-basics/aha-recs-for-physical-activity-in-adults
8. American College of Sports Medicine. Trending topic: physical activity guidelines. Accessed December 23, 2022. www.acsm.org/education-resources/trending-topics-resources/physical-activity-guidelines
EVIDENCE-BASED ANSWER:
Minimally. Regular moderate- intensity walking for a period of 4 or more weeks minimally decreased total cholesterol (TC) and low-density lipoprotein (LDL) levels by about 7 mg/dL in women with overweight or obesity (strength of recommendation [SOR]: C, systematic review and meta-analysis on disease-oriented evidence). For adults ages 40 to 65 years, regular walking for 3 or more months inconsistently affected cholesterol and triglyceride levels (SOR: C, based on 3 randomized controlled trials [RCTs] with disease-oriented evidence).

Novel resuscitation for patients with nonshockable rhythms in cardiac arrest
This transcript has been edited for clarity.
Robert D. Glatter, MD: Welcome. I’m Dr Robert Glatter, medical adviser for Medscape Emergency Medicine. with a remarkable increase in neurologically intact survival. Welcome, gentlemen.
Dr. Pepe, I’d like to start off by thanking you for taking time to join us to discuss this novel concept of head-up or what you now refer to as a neuroprotective cardiopulmonary resuscitation (CPR) bundle. Can you define what this entails and why it is referred to as a neuroprotective CPR bundle?
Paul E. Pepe, MD, MPH: CPR has been life saving for 60 years the way we’ve performed it, but probably only in a very small percentage of cases. That’s one of the problems. We have almost a thousand people a day who have sudden cardiac arrest out in the community alone and more in the hospital.
We know that early defibrillation and early CPR can contribute, but it’s still a small percentage of those. About 75%-85% of the cases that we go out to see will have nonshockable rhythms and flatlines. Some cases are what we call “pulseless electrical activity,” meaning that it looks like there is some kind of organized complex, but there is no pulse associated with it.
That’s why it’s a problem, because they don’t come back. Part of the reason why we see poor outcomes is not only that these cases tend to be people who, say, were in ventricular fibrillation and then just went on over time and were not witnessed or resuscitated or had a long response time. They basically either go into flatline or autoconvert into these bizarre rhythms.
The other issue is the way we perform CPR. CPR has been lifesaving, but it only generates about 20% and maybe 15% in some cases of normal blood flow, and particularly, cerebral perfusion pressure. We’ve looked at this nicely in the laboratory.
For example, during chest compressions, we’re hoping during the recoil phase to pull blood down and back into the right heart. The problem is that you’re not only setting a pressure rate up here to the arterial side but also, you’re setting back pressure wave on the venous side. Obviously, the arterial side always wins out, but it’s just not as efficient as it could be, at 20% or 30%.
What does this entail? It entails several independent mechanisms in terms of how they work, but they all do the same thing, which is they help to pull blood out of the brain and back into the right heart by basically manipulating intrathoracic pressure and creating more of a vacuum to get blood back there.
It’s so important that people do quality CPR. You have to have a good release and that helps us suck a little bit of blood and sucks the air in. As soon as the air rushes in, it neutralizes the pressure and there’s no more vacuum and nothing else is happening until the next squeeze.
What we have found is that we can cap the airway just for a second with a little pop-up valve. It acts like when you’re sucking a milkshake through a straw and it creates more of a vacuum in the chest. Just a little pop-up valve that pulls a little bit more blood out of the brain and the rest of the body and into the right heart.
We’ve shown in a human study that, for example, the systolic blood pressure almost doubles. It really goes from 40 mm Hg during standard CPR up to 80 mm Hg, and that would be sustained for 14-15 minutes. That was a nice little study that was done in Milwaukee a few years ago.
The other thing that happens is, if you add on something else, it’s like a toilet plunger. I think many people have seen it; it’s called “active compression-decompression.” It not only compresses, but it decompresses. Where it becomes even more effective is that if you had broken bones or stiff bones as you get older or whatever it may be, as you do the CPR, you’re still getting the push down and then you’re getting the pull out. It helps on several levels. More importantly, when you put the two together, they’re very synergistic.
We, have already done the clinical trial that is the proof of concept, and that was published in The Lancet about 10 years ago. In that study, we found that the combination of those two dramatically improved survival rates by 50%, with 1-year survival neurologically intact. That got us on the right track.
The interesting thing is that someone said, “Can we lift the head up a little bit?” We did a large amount of work in the laboratory over 10 years, fine tuning it. When do you first lift the head? How soon is too soon? It’s probably bad if you just go right to it.
We had to get the pump primed a little bit with these other things to get the flow going better, not only pulling blood out of the brain but now, you have a better flow this way. You have to prime at first for a couple of minutes, and we worked out the timing: Is it 3 or 4 minutes? It seems the timing is right at about 2 minutes, then you gradually elevate the head over about 2 minutes. We’re finding that seems to be the optimal way to do it. About 2 minutes of priming with those other two devices, the adjuncts, and then gradually elevate the head over 2 minutes.
When we do that in the laboratory, we’re getting normalized cerebral perfusion pressures. You’re normalizing the flow back again with that. We’re seeing profound differences in outcome as a result, even in these cases of the nonshockables.
Dr. Glatter: What you’re doing basically is resulting in an increase in cardiac output, essentially. That really is important, especially in these nonshockable rhythms, correct?
Dr. Pepe: Absolutely. As you’re doing this compression and you’re getting these intracranial pulse waves that are going up because they’re colliding up there. It could be even damaging in itself, but we’re seeing these intracranial raises. The intracranial pressure starts going up more and more over time. Also, peripherally in most people, you’re not getting good flow out there; then, your vasculature starts to relax. The arterials are starting to not get oxygen, so they don’t go out.
With this technique where we’re returning the pressure, we’re getting to 40% of normal now with the active compression-decompression CPR plus an impedance threshold device (ACD+ITD CPR) approach. Now, you add this, and you’re almost normalizing. In humans, even in these asystole patients, we’re seeing end-title CO2s which are generally in the 15-20 range with standard CPR are now up with ACD+ITD CPR in the 30%-40% range, where we’re getting through 30 or 40 end-tidal CO2s. Now, we’re seeing even the end-tidal CO2s moving up into the 40s and 50s. We know there’s a surrogate marker telling us that we are generating much better flows not only to the rest of the body, but most importantly, to the brain.
Dr. Glatter: Ryan, could you tell us about the approach in terms of on scene, what you’re doing and how you use the device itself? Maybe you could talk about the backpack that you developed with your fire department?
Ryan P. Quinn, BS, EMS: Our approach has always been to get to the patient quickly, like everybody’s approach on a cardiac arrest when you’re responding. We are an advanced life-support paramedic ambulance service through the fire department – we’re all cross-trained firefighter paramedics. Our first vehicle from the fire department is typically the ambulance. It’s smaller and a little quicker than the fire engine. Two paramedics are going to jump out with two backpacks. One has the automated compressive device (we use the Lucas), and the other one is the sequential patient lifting device, the EleGARD.
Our two paramedics are quick to the patient’s side, and once they make contact with the patient to verify pulseless cardiac arrest, they will unpack. One person will go right to compressions if there’s nobody on compressions already. Sometimes we have a first responder police officer with an automated external defibrillator (AED). We go right to the patient’s side, concentrate on compressions, and within 90 seconds to 2 minutes, we have our bags unpacked, we’ve got the devices turned on, patient lifted up, slid under the device, and we have a supraglottic airway that is placed within 15 seconds already premade with the ITD on top. We have a sealed airway that we can continue to compress with Dr. Pepe’s original discussion of building on what’s previously been shown to work.
Dr. Pepe: Let me make a comment about this. This is so important, what Ryan is saying, because it’s something we found during the study. It’s really a true pit-crew approach. You’re not only getting these materials, which you think you need a medical Sherpa for, but you don’t. They set it up and then when they open it up, it’s all laid out just exactly as you need it. It’s not just how fast you get there; it’s how fast you get this done.
When we look at all cases combined against high-performance systems that had some of the highest survival rates around, when we compare it to those, we found that overall, even if you looked at the ones that had over 20-minute responses, the odds ratios were still three to four times higher. It was impressive.
If you looked at it under 15 minutes, which is really reasonable for most systems that get there by the way, the average time that people start CPR in any system in these studies has been about 8 minutes if you actually start this thing, which takes about 2 minutes more for this new bundle of care with this triad, it’s almost 12-14 times higher in terms of the odds ratio. I’ve never seen anything like that where the higher end is over 100 in terms of your confidence intervals.
Ryan’s system did really well and is one of those with even higher levels of outcomes, mostly because they got it on quickly. It’s like the AED for nonshockables but better because you have a wider range of efficacy where it will work.
Dr. Glatter: When the elapsed time was less than 11 minutes, that seemed to be an inflection point in the study, is that correct? You saw that 11-fold higher incidence in terms of neurologically intact survival, is that correct?
Dr. Pepe: We picked that number because that was the median time to get it on board. Half the people were getting it within that time period. The fact that you have a larger window, we’re talking about 13- almost 14-fold improvements in outcome if it was under 15 minutes. It doesn’t matter about the 11 or the 12. It’s the faster you get it on board, the better off you are.
Dr. Glatter: What’s the next step in the process of doing trials and having implementation on a larger scale based on your Annals of Emergency Medicine study? Where do you go from here?
Dr. Pepe: I’ve come to find out there are many confounding variables. What was the quality of CPR? How did people ventilate? Did they give the breath and hold it? Did they give a large enough breath so that blood can go across the transpulmonary system? There are many confounding variables. That’s why I think, in the future, it’s going to be more of looking at things like propensity score matching because we know all the variables that change outcomes. I think that’s going to be a way for me.
The other thing is that we were looking at only 380 cases here. When this doubles up in numbers, as we accrue more cases around the country of people who are implementing this, these numbers I just quoted are going to go up much higher. Unwitnessed asystole is considered futile, and you just don’t get them back. To be able to get these folks back now, even if it’s a small percentage, and the fact that we know that we’re producing this better flow, is pretty striking.
I’m really impressed, and the main thing is to make sure people are educated about it. Number two is that they understand that it has to be done right. It cannot be done wrong or you’re not going to see the differences. Getting it done right is not only following the procedures, the sequence, and how you do it, but it also has to do with getting there quickly, including assigning the right people to put it on and having well-trained people who know what they’re doing.
Dr. Glatter: In general, the lay public obviously should not attempt this in the field lifting someone’s head up in the sense of trying to do chest compressions. I think that message is important that you just said. It’s not ready for prime time yet in any way. It has to be done right.
Dr. Pepe: Bystanders have to learn CPR – they will buy us time and we’ll have better outcomes when they do that. That’s number one. Number two is that as more and more systems adopt this, you’re going to see more people coming back. If you think about what we’re doing now, if we only get back 5% of these nonshockable vs. less than 1%, it’s 5% of 800 people a day because a thousand people a day die. Several dozens of lives can be saved on a daily basis, coming back neurologically intact. That’s the key thing.
Dr. Glatter: Ryan, can you comment about your experience in the field? Is there anything in terms of your current approach that you think would be ideal to change at this point?
Mr. Quinn: We’ve established that this is the approach that we want to take and we’re just fine tuning it to be more efficient. Using the choreography of which person is going to do which role, we have clearly defined roles and clearly defined command of the scene so we’re not missing anything. Training is extremely important.
Dr. Glatter: Paul, I want to ask you about your anecdotal experience of people waking up quickly and talking after elevating their heads and going through this process. Having people talk about it and waking up is really fascinating. Maybe you can comment further on this.
Dr. Pepe: That’s a great point that you bring up because a 40- to 50-year-old guy who got saved with this approach, when he came around, he said he was hearing what people were saying. When he came out of it, he found out he had been getting CPR for about 25 minutes because he had persistent recurring ventricular fibrillation. He said, “How could I have survived that that long?”
When we told him about the new approach, he added, “Well, that’s like neuroprotective.” He’s right, because in the laboratory, we showed it was neuroprotective and we’re also getting better flows back there. It goes along with everything else, and so we’ve adopted the name because it is.
These are really high-powered systems we are comparing against, and we have the same level of return of spontaneous circulation. The major difference was when you started talking about the neurointact survival. We don’t have enough numbers yet, but next go around, we’re going to look at cerebral performance category (CPC) – CPC1 vs. the CPC2 – which were both considered intact, but CPC1 is actually better. We’re seeing many more of those, anecdotally.
I also wanted to mention that people do bring this up and say, “Well, let’s do a trial.” As far as we’re concerned, the trial’s been done in terms of The Lancet study 10 years ago that showed that the active compression-decompression had tremendously better outcomes. We show in the laboratories that you augment that a little bit. These are all [Food and Drug Administration] approved. You can go out and buy it tomorrow and get it done. I have no conflicts of interest, by the way, with any of this.
To have this device that’s going to have the potential of saving so many more lives is really an exciting breakthrough. More importantly, we’re understanding more now about the physiology of CPR and why it works. It could work much better with the approaches that we’ve been developing over the last 20 years or so.
Dr. Glatter: Absolutely. I want to thank both of you gentlemen. It’s been really an incredible experience to learn more about an advance in resuscitation that could truly be lifesaving. Thank you again for taking time to join us.
Dr. Glatter is an attending physician in the department of emergency medicine, Lenox Hill Hospital, New York. Dr. Pepe is professor, department of management, policy, and community health, University of Texas Health Sciences Center, Houston. Mr. Quinn is EMS Chief, Edina (Minn.) Fire Department. No conflicts of interest were reported.
A version of this article first appeared Jan. 26 on Medscape.com.
More type 2 diabetes deaths from cancer than heart disease
Cancer appears to have overtaken cardiovascular disease (CVD) as a leading cause of death in adults with type 2 diabetes, a 20-year population study in England suggests.
The researchers found that, from 1998 to 2018, in more than 130,000 adults aged 35 and older with type 2 diabetes, all-cause mortality declined for all ages, but cancer mortality increased for those aged 75 and older; people with type 2 diabetes who were smokers had higher and steadily increasing cancer mortality rates; and people with type 2 diabetes had more than twice the rate of colorectal, pancreatic, liver, and endometrial cancer mortality than age- and sex-matched individuals in the general population.
The findings suggest that “cancer prevention strategies therefore deserve at least a similar level of attention as cardiovascular disease prevention, particularly in older people and for some cancers such as liver, colorectal, and pancreatic cancer,” the researchers wrote.
Tailored cancer prevention and early-detection strategies are needed to address persistent inequalities in the older population, the most deprived, and smokers, they added.
Breast cancer rates in younger women with type 2 diabetes rising
According to the researchers, “early cancer detection through changes to existing screening [programs], or more in-depth investigations for suspected/nonspecific symptoms, may reduce the number of avoidable cancer deaths in people with type 2 diabetes.”
Moreover, breast cancer rates in younger women with type 2 diabetes are rising by 4.1% per year, they wrote, which suggests such women are high risk and should be screened at a younger age, but screening age would need to be determined in cost-effectiveness analyses.
The study by Suping Ling, PhD, and colleagues was published online in Diabetologia.
Results challenge belief that preventing CVD is priority in type 2 diabetes
“The prevention of cardiovascular disease has been, and is still considered, a priority in people with diabetes,” the researchers wrote.
“Our results challenge this view by showing that cancer may have overtaken cardiovascular disease as a leading cause of death in people with type 2 diabetes.”
“The proportion of cancer deaths out of all-cause deaths remains high (> 30%) in young ages, and it was steadily increasing in older ages,” Dr. Ling, from the department of noncommunicable disease epidemiology, London School of Hygiene & Tropical Medicine, said in a comment.
“Combined with previous studies reporting decreasing CVD mortality rates,” she said, “we concluded that cancer might have overtaken CVD as the leading cause of death in people with type 2 diabetes.”
Many evidence-based cancer-prevention strategies related to lifestyle (such as being physically active, being a healthy weight, eating a better diet, stopping smoking, as summarized by the World Cancer Research Fund), are helpful for preventing both cancer and CVD, Ling observed.
However, in the medical community, many additional efforts were made for monitoring, early detection, and innovating medications for CVD, she noted. “Therefore, we would like to propose a similar level of attention and effort for cancer in people with type 2 diabetes.”
Deaths from cancer vs. all causes in patients with diabetes
The researchers identified 137,804 patients aged 35 and older who were newly diagnosed with type 2 diabetes from 1998 to 2018 in general practices in the UK that were part of the Clinical Practice Research Datalink.
Patients were a median age of 64 years and 45% were women. Most (83%) were White, followed by South Asian (3.5%), Black (2.0%), and other (3%); 8.4% had missing information for race. Patients had a median body mass index (BMI) of 30.6 kg/m2.
Researchers divided patients into socioeconomic quintiles of most to least deprived based on income, employment, education, and other factors. During a median follow-up of 8.4 years, there were 39,212 deaths (28.5%).
Cancer mortality in subgroups of patients with type 2 diabetes
Researchers analyzed annual deaths from cancer and from all causes over 20 years in subgroups of patients with type 2 diabetes.
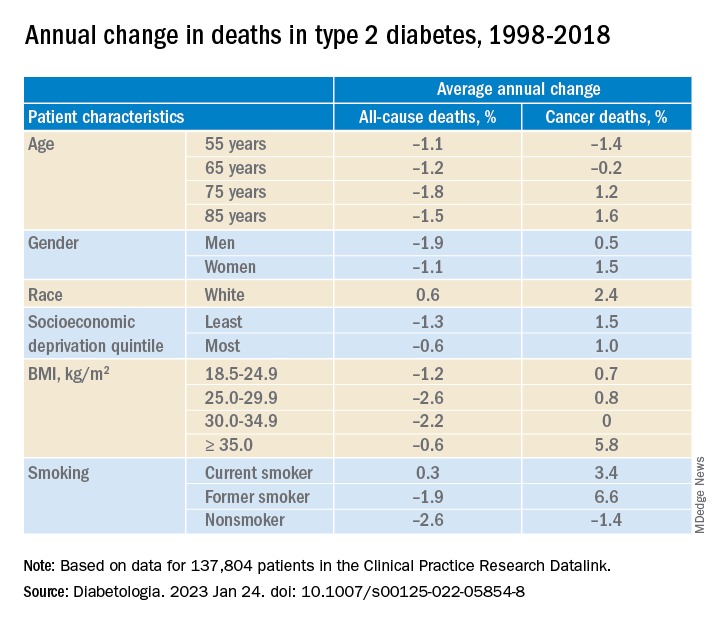
In adults with type 2 diabetes, the average percentage change in cancer mortality per year, from 1998 to 2018 decreased in people aged 55 and 65 (–1.4% and –0.2%, respectively), but increased in people aged 75 and 85 (1.2% and 1.6%, respectively); increased more in women than in men (1.5% vs 1.0%), although women had lower cancer mortality than men; and increased more in the least deprived (wealthiest) individuals than in the most deprived (1.5% vs 1.0%). Cancer mortality rates were consistently higher in the most deprived individuals, Dr. Ling noted.
Cancer mortality also increased more in people with class III obesity (BMI ≥ 35) versus normal weight (5.8% vs 0.7%) and versus other weights. In addition, there was an upward trend in cancer mortality in people who were White or former/current smokers.
Deaths from specific cancers in diabetes vs. general population
Next, researchers determined cancer mortality ratios – the cancer mortality of the patients with diabetes divided by the cancer mortality of the general population.
They determined this for all cancers, the four most common cancers in the United Kingdom (lung, colorectal, breast, and prostate), and cancers caused by type 2 diabetes (pancreatic, liver, gallbladder, and endometrial cancer), standardized by sex and age.
Mortality from all cancer was 18% higher in patients with type 2 diabetes, compared with the general population.
Overall, mortality from colorectal cancer, pancreatic cancer, and liver cancer was 2.4 times, 2.12 times, and 2.13 times higher, respectively, in patients with type 2 diabetes than in the general population.
Mortality from breast cancer was 9% higher and mortality from endometrial cancer was 2.08 times higher in women with type 2 diabetes than in women in the general population.
There was a constant upward trend for mortality rates for pancreatic, liver, and lung cancer at all ages, colorectal cancer at most ages, breast cancer at younger ages, and prostate and endometrial cancer at older ages.
The study was funded by Hope Against Cancer. Dr. Ling reported no relevant financial relationships.
A version of this article first appeared on Medscape.com.
Cancer appears to have overtaken cardiovascular disease (CVD) as a leading cause of death in adults with type 2 diabetes, a 20-year population study in England suggests.
The researchers found that, from 1998 to 2018, in more than 130,000 adults aged 35 and older with type 2 diabetes, all-cause mortality declined for all ages, but cancer mortality increased for those aged 75 and older; people with type 2 diabetes who were smokers had higher and steadily increasing cancer mortality rates; and people with type 2 diabetes had more than twice the rate of colorectal, pancreatic, liver, and endometrial cancer mortality than age- and sex-matched individuals in the general population.
The findings suggest that “cancer prevention strategies therefore deserve at least a similar level of attention as cardiovascular disease prevention, particularly in older people and for some cancers such as liver, colorectal, and pancreatic cancer,” the researchers wrote.
Tailored cancer prevention and early-detection strategies are needed to address persistent inequalities in the older population, the most deprived, and smokers, they added.
Breast cancer rates in younger women with type 2 diabetes rising
According to the researchers, “early cancer detection through changes to existing screening [programs], or more in-depth investigations for suspected/nonspecific symptoms, may reduce the number of avoidable cancer deaths in people with type 2 diabetes.”
Moreover, breast cancer rates in younger women with type 2 diabetes are rising by 4.1% per year, they wrote, which suggests such women are high risk and should be screened at a younger age, but screening age would need to be determined in cost-effectiveness analyses.
The study by Suping Ling, PhD, and colleagues was published online in Diabetologia.
Results challenge belief that preventing CVD is priority in type 2 diabetes
“The prevention of cardiovascular disease has been, and is still considered, a priority in people with diabetes,” the researchers wrote.
“Our results challenge this view by showing that cancer may have overtaken cardiovascular disease as a leading cause of death in people with type 2 diabetes.”
“The proportion of cancer deaths out of all-cause deaths remains high (> 30%) in young ages, and it was steadily increasing in older ages,” Dr. Ling, from the department of noncommunicable disease epidemiology, London School of Hygiene & Tropical Medicine, said in a comment.
“Combined with previous studies reporting decreasing CVD mortality rates,” she said, “we concluded that cancer might have overtaken CVD as the leading cause of death in people with type 2 diabetes.”
Many evidence-based cancer-prevention strategies related to lifestyle (such as being physically active, being a healthy weight, eating a better diet, stopping smoking, as summarized by the World Cancer Research Fund), are helpful for preventing both cancer and CVD, Ling observed.
However, in the medical community, many additional efforts were made for monitoring, early detection, and innovating medications for CVD, she noted. “Therefore, we would like to propose a similar level of attention and effort for cancer in people with type 2 diabetes.”
Deaths from cancer vs. all causes in patients with diabetes
The researchers identified 137,804 patients aged 35 and older who were newly diagnosed with type 2 diabetes from 1998 to 2018 in general practices in the UK that were part of the Clinical Practice Research Datalink.
Patients were a median age of 64 years and 45% were women. Most (83%) were White, followed by South Asian (3.5%), Black (2.0%), and other (3%); 8.4% had missing information for race. Patients had a median body mass index (BMI) of 30.6 kg/m2.
Researchers divided patients into socioeconomic quintiles of most to least deprived based on income, employment, education, and other factors. During a median follow-up of 8.4 years, there were 39,212 deaths (28.5%).
Cancer mortality in subgroups of patients with type 2 diabetes
Researchers analyzed annual deaths from cancer and from all causes over 20 years in subgroups of patients with type 2 diabetes.
In adults with type 2 diabetes, the average percentage change in cancer mortality per year, from 1998 to 2018 decreased in people aged 55 and 65 (–1.4% and –0.2%, respectively), but increased in people aged 75 and 85 (1.2% and 1.6%, respectively); increased more in women than in men (1.5% vs 1.0%), although women had lower cancer mortality than men; and increased more in the least deprived (wealthiest) individuals than in the most deprived (1.5% vs 1.0%). Cancer mortality rates were consistently higher in the most deprived individuals, Dr. Ling noted.
Cancer mortality also increased more in people with class III obesity (BMI ≥ 35) versus normal weight (5.8% vs 0.7%) and versus other weights. In addition, there was an upward trend in cancer mortality in people who were White or former/current smokers.
Deaths from specific cancers in diabetes vs. general population
Next, researchers determined cancer mortality ratios – the cancer mortality of the patients with diabetes divided by the cancer mortality of the general population.
They determined this for all cancers, the four most common cancers in the United Kingdom (lung, colorectal, breast, and prostate), and cancers caused by type 2 diabetes (pancreatic, liver, gallbladder, and endometrial cancer), standardized by sex and age.
Mortality from all cancer was 18% higher in patients with type 2 diabetes, compared with the general population.
Overall, mortality from colorectal cancer, pancreatic cancer, and liver cancer was 2.4 times, 2.12 times, and 2.13 times higher, respectively, in patients with type 2 diabetes than in the general population.
Mortality from breast cancer was 9% higher and mortality from endometrial cancer was 2.08 times higher in women with type 2 diabetes than in women in the general population.
There was a constant upward trend for mortality rates for pancreatic, liver, and lung cancer at all ages, colorectal cancer at most ages, breast cancer at younger ages, and prostate and endometrial cancer at older ages.
The study was funded by Hope Against Cancer. Dr. Ling reported no relevant financial relationships.
A version of this article first appeared on Medscape.com.
FROM DIABETOLOGIA