User login
Children and COVID: Vaccines now available to all ages
The COVID-19 prevention effort in children enters its next phase as June draws to a close, while new pediatric cases continued on a downward trend and hospitalizations continued to rise.
The COVID-19 vaccines from Pfizer-BioNTech and Moderna were approved for use in children as young as 6 months, the Centers for Disease Control and Prevention announced on June 18.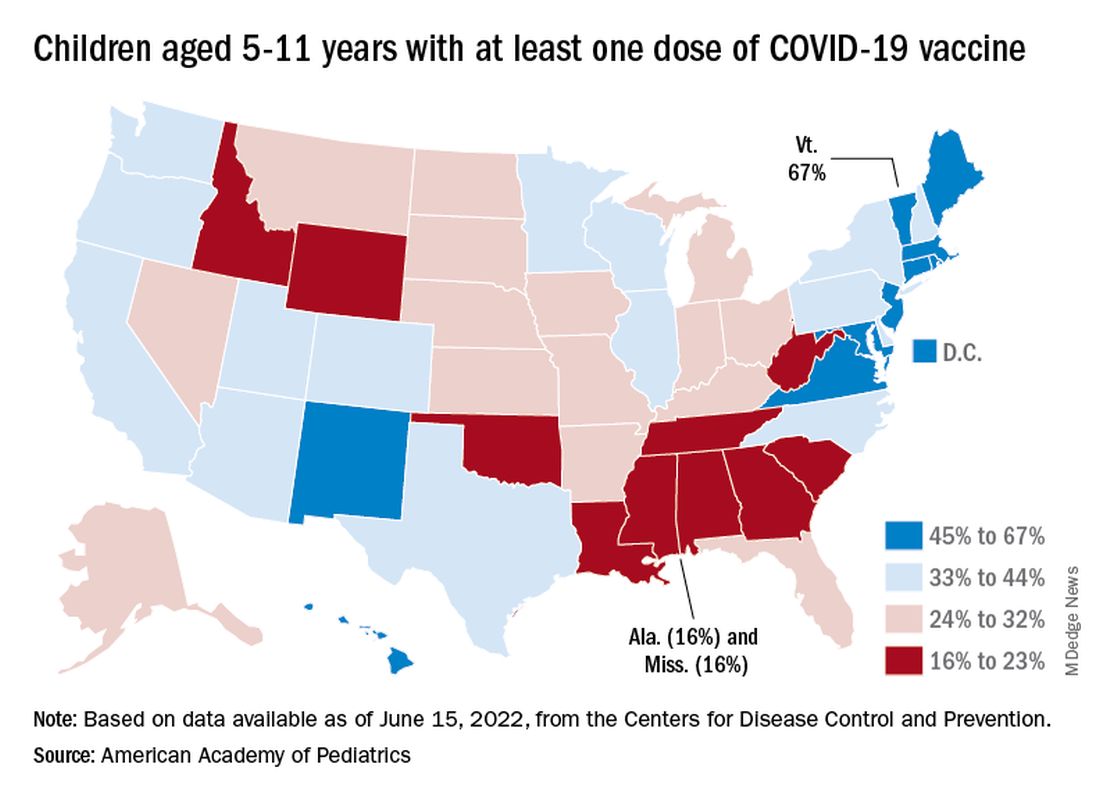
“We know millions of parents and caregivers are eager to get their young children vaccinated. ... I encourage parents and caregivers with questions to talk to their doctor, nurse, or local pharmacist to learn more about the benefits of vaccinations,” CDC Director Rochelle P. Walensky, MD, MPH, said in a written statement.
There are, however, indications that many parents are not that eager. Another 11% said “they will only do so if they are required,” Kaiser noted.
The vaccination experience with children aged 5-11 years seems to agree with those numbers. As of June 16, more than 7 months after the vaccine became available, just over 36% had received at least one dose and about 30% were fully vaccinated, CDC data show.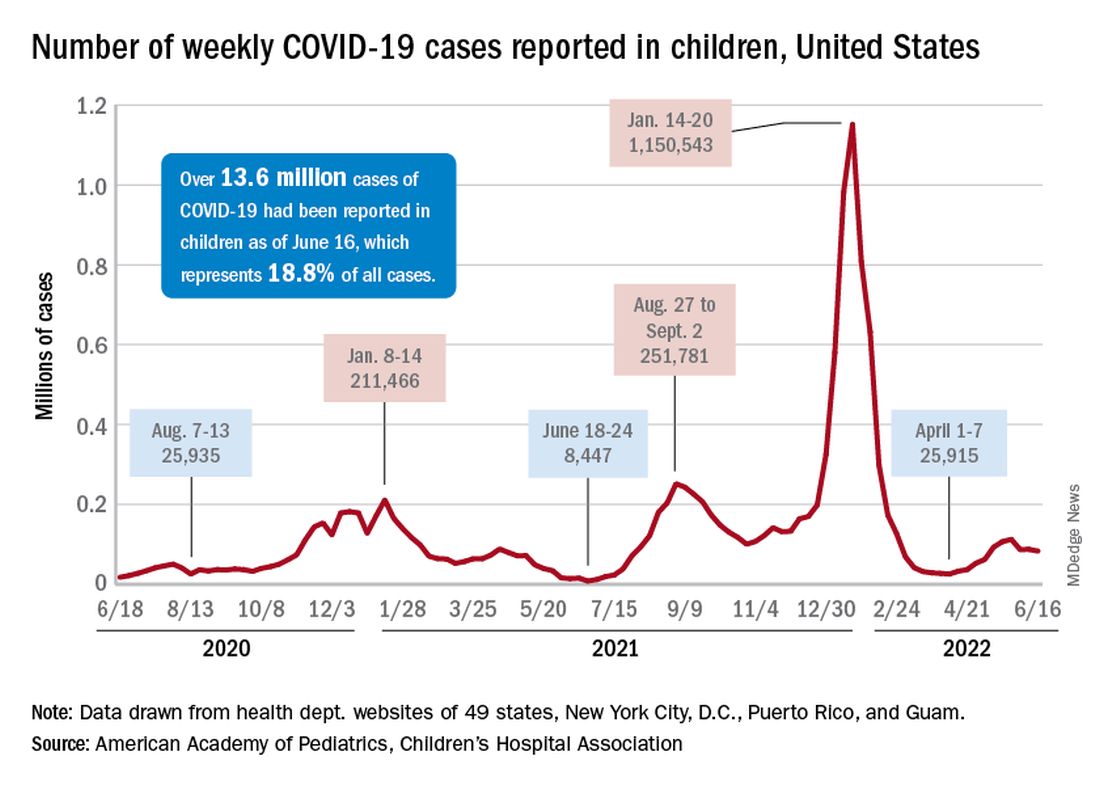
There are, according to the American Academy of Pediatrics, still five states where less than 20% of eligible 5- to 11-year-olds have received an initial vaccination. Among children aged 12-17, uptake has been much higher: 70% have received at least one dose and 60% are fully vaccinated, the CDC said.
Trends for new cases, hospitalizations diverging
COVID incidence in children, meanwhile, dropped for the second time in 3 weeks. There were 83,000 new cases reported during June 10-16, a decline of 4.8% from the previous week, according to the AAP and the Children’s Hospital Association.
New cases had risen by a very slight 0.31% during the week of June 3-9 after dropping 22% the week before (May 27 to June 2). Total cases in children have surpassed 13.6 million, which represents 18.8% of cases in all ages since the start of the pandemic, the AAP and CHA said in their weekly COVID report.
New admissions of children with confirmed COVID-19, however, have continued to climb since early to mid April. On June 16, the rate for children aged 0-17 years was up to 0.31 per 100,000, compared with the 0.13 per 100,000 recorded as late as April 11, the CDC said on its COVID Data Tracker.
COVID vaccination in DMT-treated MS patients: New data
NATIONAL HARBOR, MD. – The latest updates on COVID-19 vaccination response among patients with multiple sclerosis (MS) who are treated with disease-modifying therapy (DMT) show that, if patients do contract the virus, cases are mild and serious infections are rare.
However, vaccine antibody response remains lower with anti-CD20 therapies.
One of several late-breaking studies on these issues that were presented at the annual meeting of the Consortium of Multiple Sclerosis Centers included more than 100 patients with MS who were treated with a variety of DMTs.
Results showed that the rate of antibody response was just 55% among those treated with anti-CD20 therapies versus 83% for those treated with other DMTs, including sphingosine-1-phosphate receptor modulators (S1Ps).
Consistent with what has been observed in other studies, “vaccine antibody responses were slightly lower in B cell–depleted patients than with other therapies,” senior author Rahul Dave, MD, director of the INOVA MS and Neuroimmunology Center, Inova Neurosciences Institute, the University of Virginia, Fairfax, said in an interview.
Vaccine response
The investigators sought to assess detailed vaccine responses in 134 patients with MS. Serum COVID antibody measures were conducted approximately 3 weeks to 4 months after vaccination – and mostly after the initial vaccination.
The antibody response rate was significantly lower with anti-CD20 treatments (55%) than with all other DMTs examined (83%), including S1Ps, immunomodulators, immunosuppressive drugs, interferon B, anti-CD52, and natalizumab (P < .01).
The highest prevalence of antibody response was observed among those taking immunomodulators; responses occurred among 91% of patients taking teriflunomide and among 93% of those taking fumarates.
Among those treated with anti-CD20 therapy, antibody responses correlated with higher baseline immunoglobulin levels (P = .01) and shorter durations of therapy.
“We found that longer total duration of therapy and lower immunoglobulin levels tended to correlate with decreases in immune responses,” said Dr. Dave.
“Interestingly, the timing between vaccination versus administration of [anti-CD20 drug] ocrelizumab did not seem to be impactful with regards to antibody responses,” Dr. Dave noted. He added that this is contrary to some past studies that showed benefits if the vaccination could be completed prior to starting ocrelizumab.
Sixteen participants tested polymerase chain reaction positive for COVID during the previous 12 months. Although most infections were described as mild and self-limited, four of the patients received outpatient monoclonal antibody therapy, and one required hospitalization because of COVID.
“I think it is notable and reassuring that, overall, our patients had mild courses. This is consistent with the vaccines ‘working,’ and is true even in patients on high-efficacy immunosuppressants that partially abrogate antibody responses,” Dr. Dave said.
He added that he reassures patients who need high-efficacy therapies that “they should use them.”
That being said, as in the general population, even vaccinated patients can get COVID. “You can be sick and feel terrible, but in general, hospitalization numbers are way down compared to 2 years ago. We are seeing the same trends in MS patients, including the B cell–depleted patients,” he said.
“To get at the question whether B cell–depleted patients behave exactly the same as the general population, or even [with] other DMTs, we will need large, multicenter, prospective datasets,” said Dr. Dave.
Favorable findings
Two other late-breaking posters at the meeting provided updates regarding antibody responses among patients receiving S1Ps. There has been concern that S1Ps may blunt antibody responses to COVID vaccinations.
The concern is in regard to their unique mechanisms of sequestering circulating lymphocytes, particularly the older, nonselective S1P receptor modulator fingolimod, said the author of one of the studies, Daniel Kantor, MD, president emeritus of the Florida Society of Neurology and founding president of the Medical Partnership 4 MS+.
“It appears the issues with fingolimod might relate to the level of white blood cell sequestration, [which is] greater in fingolimod than the newer S1P receptor modulators, and/or the result of S1P4 receptor modulation, which is not seen with the newer, selective medications,” Dr. Kantor said in an interview.
In a prospective observational trial of patients with relapsing MS, among 30 participants who were treated with ozanimod, the mean increase in IgG antibody titer 4 weeks after either of the two available mRNA vaccines was 232.73 AU/mL versus a mean increase of 526.59 AU/mL among 30 non–ozanimod/DMT-treated patients.
To date, only three patients in the study were taking ocrelizumab; for those patients, the mean increase in IgG titers was 0.633.
Despite the lower antibody titers in the ozanimod-treated patients, which Dr. Kantor noted are generally regarded as protective, all but one of the patients had positive results on T-Detect, which was indicative of vaccine protection.
“In this study, [relapsing] MS patients treated with ozanimod had an antibody and T-cell response to the mRNA COVID-19 vaccines,” he reported. “This trial is ongoing, with 48 weeks of follow-up expected in December 2022.”
Ponesimod results
In the other S1P modulator-related late-breaking study, Janssen Research and Development reported on antibody responses of patients who were treated with the S1P drug ponesimod in the phase 2 AC-058B202 study.
The median exposure to ponesimod at time of vaccination was 10.7 years (range, 9.8-11.8 years). There were 134 patients in the study. Of those, both prevaccination and postvaccination blood samples from 49 patients were tested for spike antibody concentrations.
Among those participants, 40 (81.6%) met the definition of response to the COVID-19 vaccination, defined as seroconversion in the case of negative prevaccination antibody testing or a fourfold antibody concentration increase in the case of a positive prevaccination antibody result.
Of the 38 antibody-negative participants, 33 (86.8%) achieved seroconversion post vaccination.
A total of 20 participants reported having had prevaccine COVID, while 17 had postvaccination COVID.
None of the cases were serious, severe, or fatal, and none led to permanent treatment discontinuation.
“In patients with RMS on ponesimod, the majority (> 80%) appear to develop a measurable SARS-CoV-2 humoral response after COVID-19 vaccination,” the authors, led by Janice Wong, of Janssen Research and Development, wrote.
“Further investigations on the efficacy and safety of COVID-19 vaccination in MS patients on ponesimod are warranted,” they added.
In a final study from Genentech, of 4848 patients with MS who were fully vaccinated during the Delta and Omicron waves, 1.3% had a COVID-related hospitalization. In addition, rate of severe SARS-CoV-2 infections was very low (0.6%); there were fewer than 10 infections in each subgroup of DMTs. These patients included 585 (17%) who were treated with ocrelizumab, 238 (7%) who were treated with S1P receptor modulators, 33 (1%) who were treated with interferons, 1,004 (29%) who were treated with other DMTs, and 1,574 (46%) for whom no DMTs were recorded.
“We can conclude from this study that the characteristics of people with MS with more severe COVID-19 outcomes resemble those observed in the general population,” such as in those who are older or have higher rates of comorbidities, Preeti Bajaj, team lead of HEOR, Neuroscience, at Genentech, said in an interview. “We believe [ocrelizumab] treatment decisions should be made between a patient and their treating neurologist or other medical professional based on a benefit-risk assessment specific to the individual patient.”
Concerns remain
In a comment, Bruce A. C. Cree, MD, PhD, professor of clinical neurology and clinical research director at the Weill Institute for Neurosciences, University of California, San Francisco, described the overall data on vaccine efficacy on anti-CD20s as “discouraging” and said he is adjusting his own recommendations for these patients.
“Repeated vaccinations do not seem to stimulate humoral responses in B cell–depleted patients,” said Dr. Cree, who was not involved with the research.
“In my personal practice, I have been suspending dosing in my patients to allow for B-cell reconstitution to occur followed by revaccination,” he added.
Regarding the S1P drugs, he noted that, aside from fingolimod, “the antibody response frequency seems to be better than initial reports. However, the index values are low and may not be protective.”
Overall, the take-home message for patients with MS who are taking DMTs should be, “all patients treated with S1P modulators or anti-C20 antibodies should be vaccinated and boosted,” Dr. Cree said.
“In some cases, temporary interruption of treatment might be useful to help develop robust responses to vaccinations,” he added.
Dr. Dave reported no financial relationships regarding the poster but is a paid speaker/consultant for Novartis, Bristol-Myers Squibb, EMD Serono, Biogen, Alexion, Genentech, Horizon, and Sanofi for their MS & NMO therapies. Dr. Kantor’s research was supported by a grant from BMS; he is a consultant for Biogen, BMS, and Janssen. Dr. Cree reported that he is an unpaid consultant for BMS, the manufacturer of ozanimod.
A version of this article first appeared on Medscape.com.
AT CMSC 2022
New saliva-based COVID-19 test provides rapid results
A rapid, saliva-based test for COVID-19 could enable testing, diagnosis, and prescribing to take place in a single office visit by immediately confirming whether a patient has the infection and needs to be treated, researchers say. The test has sparked commercial interest and earned additional funding from the Canadian government.
The test uses a DNA aptamer – a short, synthetic oligonucleotide that binds to a specific molecular target – that shows high affinity for the SARS-CoV-2 spike protein and its variants. The approach “can be rapidly adapted to different threats,” as well, Leyla Soleymani, PhD, an associate professor of engineering physics at McMaster University, Hamilton, Ontario, Canada, told this news organization. Her team invented the approach.
Adaptable to other pathogens
Current gold-standard COVID-19 tests are based on reverse transcription-polymerase chain reaction (RT-PCR), which are sensitive but costly, complicated, and require waiting at least a couple of days for results, according to Dr. Soleymani and colleagues. Rapid nucleic acid and antigen tests have only “moderate” sensitivity and specificity, particularly when viral loads are low. None have been shown to work well with saliva samples.
By contrast, the new test “uses a reader and test cartridges, similar to the glucose reader,” said Dr. Soleymani, who is also Canada Research chair in Miniaturized Biomedical Devices. A small sample of saliva is added to a chemical reagent and inserted into the reader, which is attached to a smartphone. Once commercialized, the point-of-care test is expected to be performed quickly in a physician’s office or in a clinic.
“The same reader can be applied to a variety of infectious diseases or infection panels by developing new cartridges,” Dr. Soleymani explained. “Noroviruses and bacteria such as C. difficile are on our list” to examine next.What’s more, she added, “this test is ideally positioned for settings where access to centralized labs is not possible, such as less developed countries.”
The team’s recent studies seem to support the promise. A study published last year in the international edition of Angewandte Chemie documents the development of the test, which at that point could detect wild-type SARS-CoV-2 and its Alpha and Delta variants in unprocessed saliva samples in 10 minutes with 80.5% sensitivity and 100% specificity.
This study was followed in January 2022 by a paper in Chemistry showing that the device also detected Alpha, Gamma, Epsilon, Kappa, and Omicron variants, demonstrating its potential for recognizing rapidly evolving targets such as those found in SARS-CoV-2.
In another demonstration of its versatility, the technology was recently adapted and successfully detected animal viruses from saliva samples.
Commercial and government funding
The findings prompted Zentek, an intellectual property development and commercialization company in Guelph, Ont., to license the technology, with plans to invest more than $1 million in the next 5 years to scale up production of the test components and adapt the technology for other forms of infection.
Furthermore, the collaborative efforts required to develop the test and move it forward gained funding from Canada’s Natural Sciences and Engineering Research Council, which is investing nearly $1.5 million in the form of two grants: $1 million to further streamline the technology development in preparation for the next pandemic and $488,440 (including $140,000 from Zentek) to get the current test to market as quickly as possible.
Meanwhile, Dr. Soleymani is urging clinicians “to be open to nontraditional diagnostic approaches even if the traditional tests do the job. Such tests are more rapid and can be used to enable personalized medicine. Our success relies on collaboration and support from clinicians.”
Further validation needed
Daniel Kuritzkes, MD, chief of infectious diseases at Brigham and Women’s Hospital and the Harriet Ryan Albee Professor of Medicine at Harvard Medical School, Boston, commented on the study in response to a request from this news organization.
While “it’s always good to have more testing options available,” he said, “we don’t yet have very much information about performance characteristics of the test – that is, its sensitivity and specificity. I’d like to see the performance characteristics of this test compared to PCR tests and to the current rapid antigen tests using a large number of patient samples with currently circulating variants, and tests over time to see how soon tests become positive after symptom onset and for how long they remain positive.”
“Further validation studies and emergency use authorization or approval by regulatory authorities are needed before we will see this test implemented in the field,” Dr. Kuritzkes concluded.
A version of this article first appeared on Medscape.com.
COVID-19 Pandemic stress affected ovulation, not menstruation
ATLANTA – Disturbances in ovulation that didn’t produce any actual changes in the menstrual cycle of women were extremely common during the first year of the COVID-19 pandemic and were linked to emotional stress, according to the findings of an “experiment of nature” that allowed for comparison with women a decade earlier.
Findings from two studies of reproductive-age women, one conducted in 2006-2008 and the other in 2020-2021, were presented by Jerilynn C. Prior, MD, at the annual meeting of the Endocrine Society.
The comparison of the two time periods yielded several novel findings. “I was taught in medical school that when women don’t eat enough they lose their period. But what we now understand is there’s a graded response to various stressors, acting through the hypothalamus in a common pathway. There is a gradation of disturbances, some of which are subclinical or not obvious,” said Dr. Prior, professor of endocrinology and metabolism at the University of British Columbia, Vancouver.
Moreover, women’s menstrual cycle lengths didn’t differ across the two time periods, despite a dramatic 63% decrement in normal ovulatory function related to increased depression, anxiety, and outside stresses that the women reported in diaries.
“Assuming that regular cycles need normal ovulation is something we should just get out of our minds. It changes our concept about what’s normal if we only know about the cycle length,” she observed.
It will be critical going forward to see whether the ovulatory disturbances have resolved as the pandemic has shifted “because there’s strong evidence that ovulatory disturbances, even with normal cycle length, are related to bone loss and some evidence it’s related to early heart attacks, breast and endometrial cancers,” Dr. Prior said during a press conference.
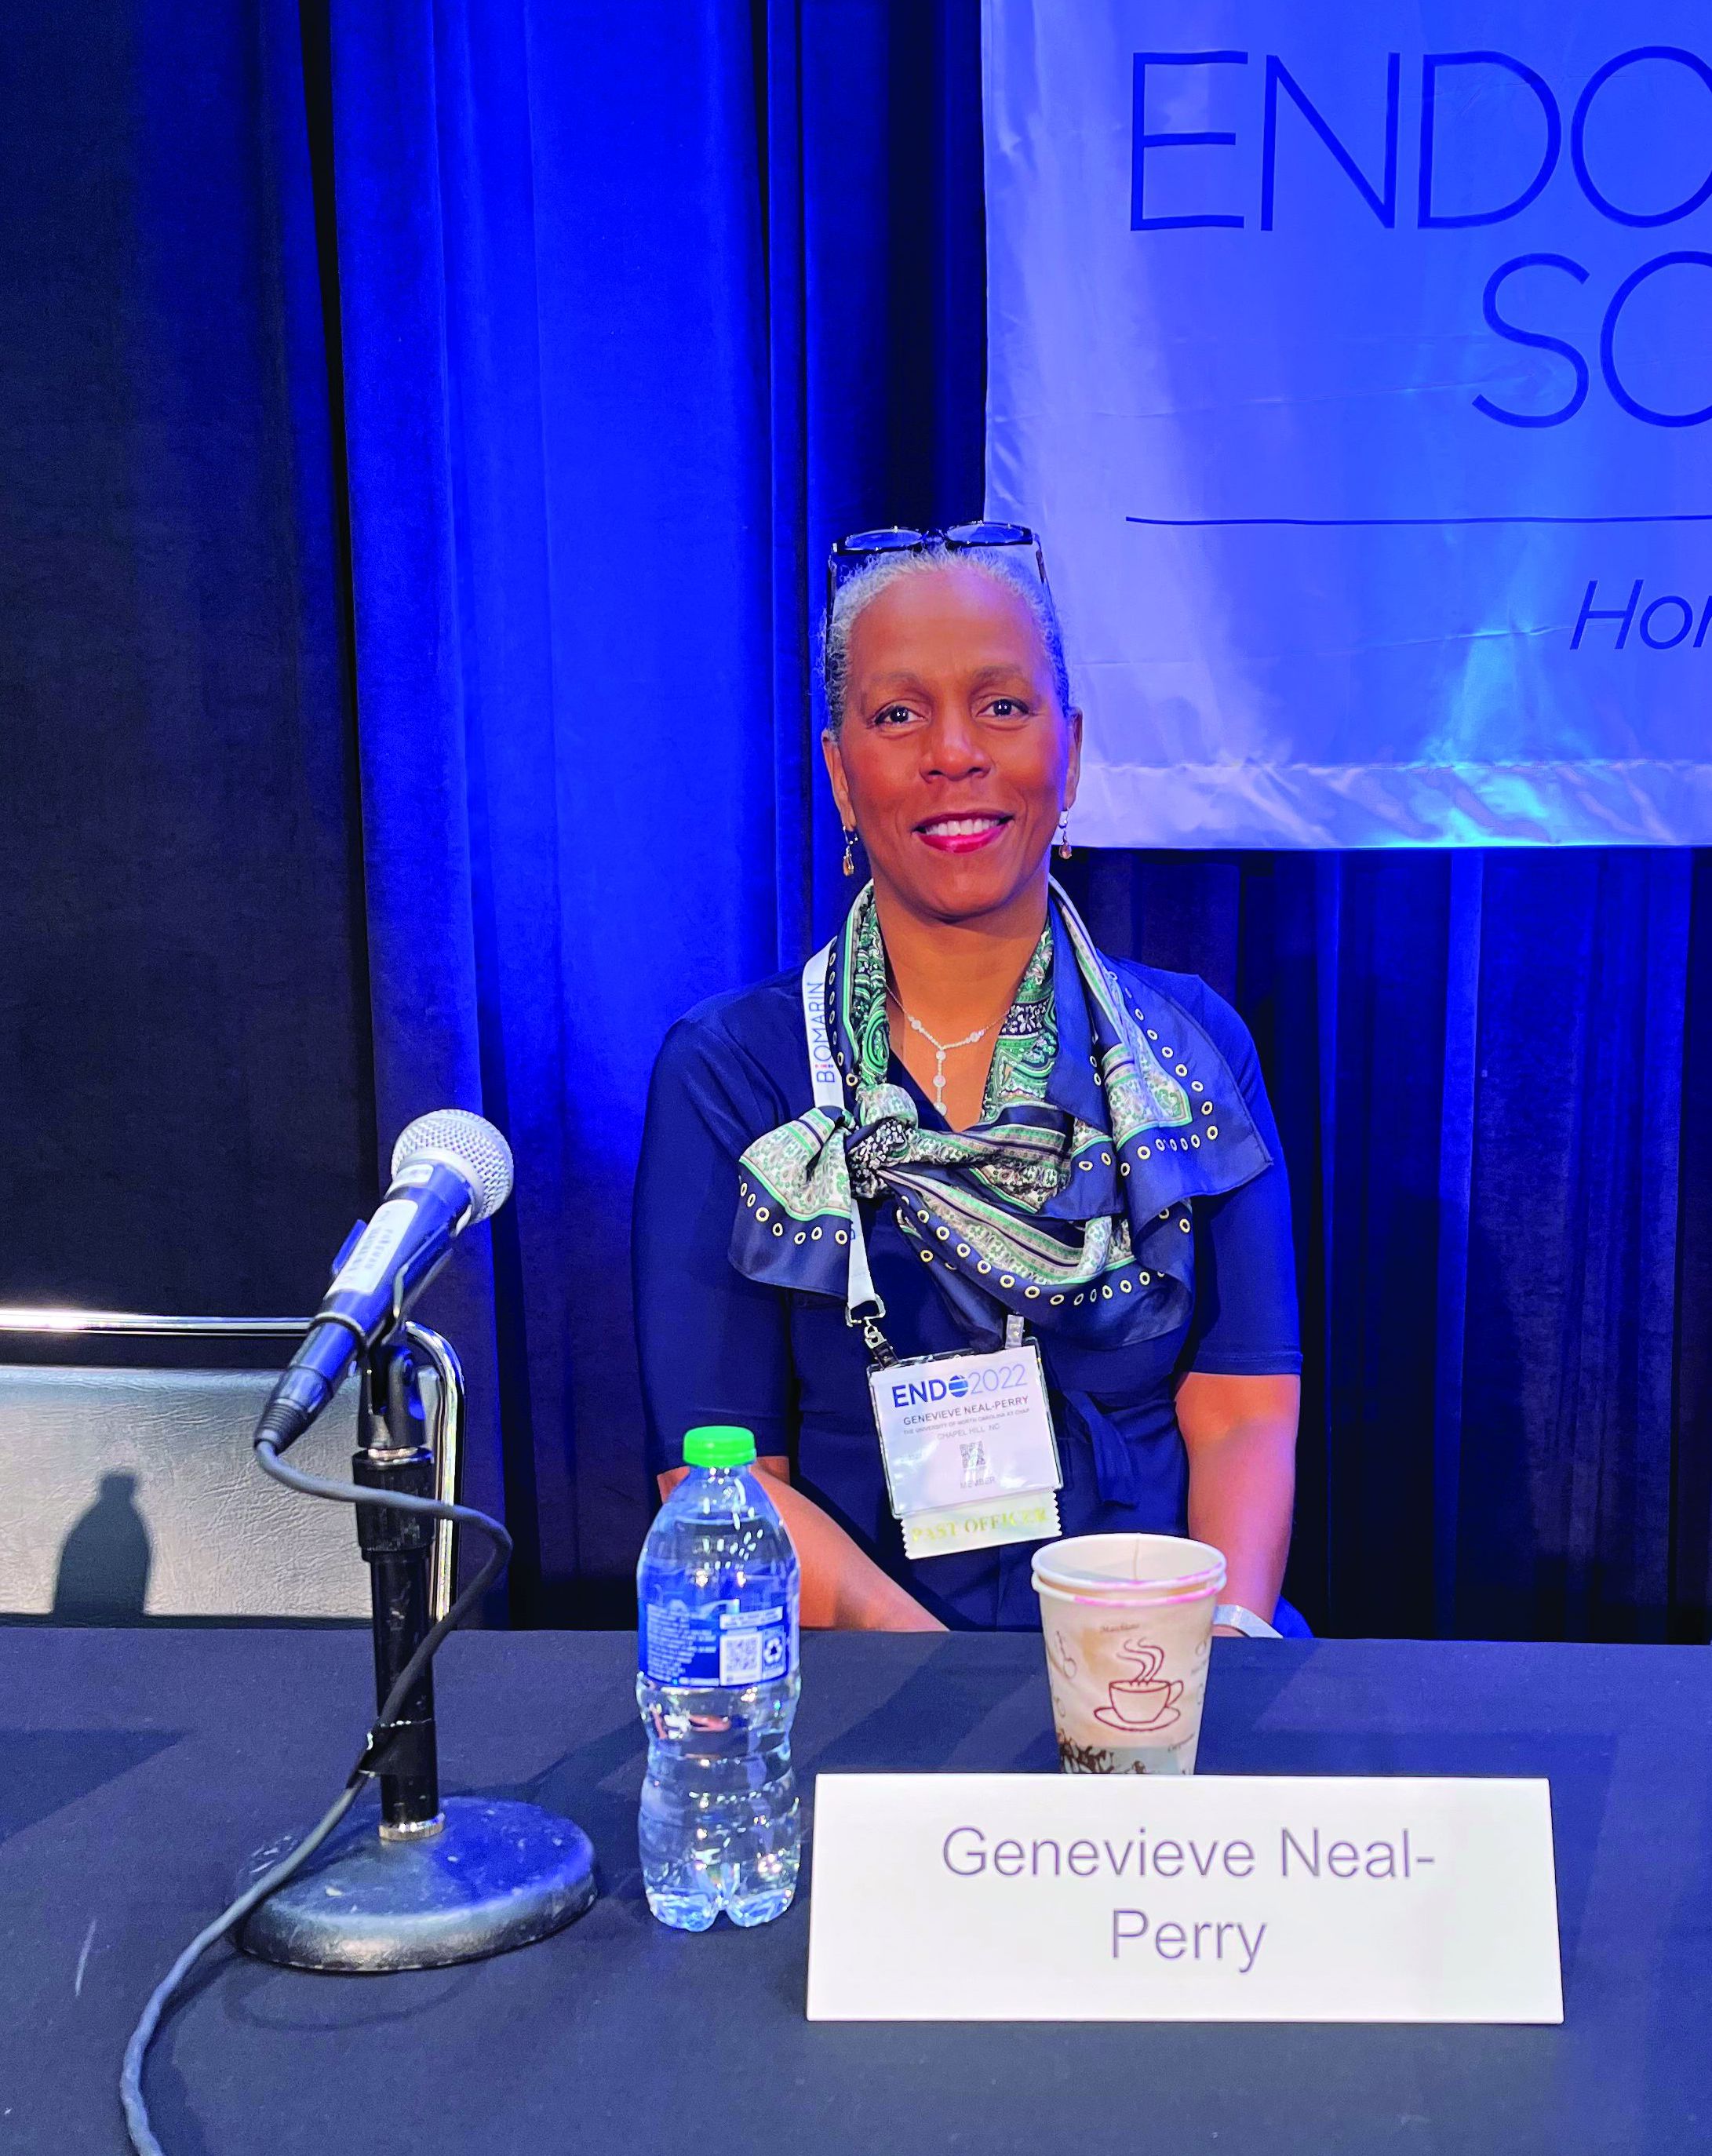
Asked to comment, session moderator Genevieve Neal-Perry, MD, PhD, told this news organization: “I think what we can take away is that stress itself is a modifier of the way the brain and the gonads communicate with each other, and that then has an impact on ovulatory function.”
Dr. Neal-Perry noted that the association of stress and ovulatory disruption has been reported in various ways previously, but “clearly it doesn’t affect everyone. What we don’t know is who is most susceptible. There have been some studies showing a genetic predisposition and a genetic anomaly that actually makes them more susceptible to the impact of stress on the reproductive system.”
But the lack of data on weight change in the study cohorts is a limitation. “To me one of the more important questions was what was going on with weight. Just looking at a static number doesn’t tell you whether there were changes. We know that weight gain or weight loss can stress the reproductive axis,” noted Dr. Neal-Parry of the department of obstetrics and gynecology at the University of North Carolina at Chapel Hill.
‘Experiment of nature’ revealed invisible effect of pandemic stress
The women in both cohorts of the Menstruation Ovulation Study (MOS) were healthy volunteers aged 19-35 years recruited from the metropolitan Vancouver region. All were menstruating monthly and none were taking hormonal birth control. Recruitment for the second cohort had begun just prior to the March 2020 COVID-19 pandemic lockdown.
Interviewer-administered questionnaires (CaMos) covering demographics, socioeconomic status, and reproductive history, and daily diaries kept by the women (menstrual cycle diary) were identical for both cohorts.
Assessments of ovulation differed for the two studies but were cross-validated. For the earlier time period, ovulation was assessed by a threefold increase in follicular-to-luteal urinary progesterone (PdG). For the pandemic-era study, the validated quantitative basal temperature (QBT) method was used.
There were 301 women in the earlier cohort and 125 during the pandemic. Both were an average age of about 29 years and had a body mass index of about 24.3 kg/m2 (within the normal range). The pandemic cohort was more racially/ethnically diverse than the earlier one and more in-line with recent census data.
More of the women were nulliparous during the pandemic than earlier (92.7% vs. 80.4%; P = .002).
The distribution of menstrual cycle lengths didn’t differ, with both cohorts averaging about 30 days (P = .893). However, while 90% of the women in the earlier cohort ovulated normally, only 37% did during the pandemic, a highly significant difference (P < .0001).
Thus, during the pandemic, 63% of women had “silent ovulatory disturbances,” either with short luteal phases after ovulation or no ovulation, compared with just 10% in the earlier cohort, “which is remarkable, unbelievable actually,” Dr. Prior remarked.
The difference wasn’t explained by any of the demographic information collected either, including socioeconomic status, lifestyle, or reproductive history variables.
And it wasn’t because of COVID-19 vaccination, as the vaccine wasn’t available when most of the women were recruited, and of the 79 who were recruited during vaccine availability, only two received a COVID-19 vaccine during the study (and both had normal ovulation).
Employment changes, caring responsibilities, and worry likely causes
The information from the diaries was more revealing. Several diary components were far more common during the pandemic, including negative mood (feeling depressed or anxious, sleep problems, and outside stresses), self-worth, interest in sex, energy level, and appetite. All were significantly different between the two cohorts (P < .001) and between those with and without ovulatory disturbances.
“So menstrual cycle lengths and long cycles didn’t differ, but there was a much higher prevalence of silent or subclinical ovulatory disturbances, and these were related to the increased stresses that women recorded in their diaries. This means that the estrogen levels were pretty close to normal but the progesterone levels were remarkably decreased,” Dr. Prior said.
Interestingly, reported menstrual cramps were also significantly more common during the pandemic and associated with ovulatory disruption.
“That is a new observation because previously we’ve always thought that you needed to ovulate in order to even have cramps,” she commented.
Asked whether COVID-19 itself might have played a role, Dr. Prior said no woman in the study tested positive for the virus or had long COVID.
“As far as I’m aware, it was the changes in employment … and caring for elders and worry about illness in somebody you loved that was related,” she said.
Asked what she thinks the result would be if the study were conducted now, she said: “I don’t know. We’re still in a stressful time with inflation and not complete recovery, so probably the issue is still very present.”
Dr. Prior and Dr. Neal-Perry have reported no relevant financial relationships.
A version of this article first appeared on Medscape.com.
ATLANTA – Disturbances in ovulation that didn’t produce any actual changes in the menstrual cycle of women were extremely common during the first year of the COVID-19 pandemic and were linked to emotional stress, according to the findings of an “experiment of nature” that allowed for comparison with women a decade earlier.
Findings from two studies of reproductive-age women, one conducted in 2006-2008 and the other in 2020-2021, were presented by Jerilynn C. Prior, MD, at the annual meeting of the Endocrine Society.
The comparison of the two time periods yielded several novel findings. “I was taught in medical school that when women don’t eat enough they lose their period. But what we now understand is there’s a graded response to various stressors, acting through the hypothalamus in a common pathway. There is a gradation of disturbances, some of which are subclinical or not obvious,” said Dr. Prior, professor of endocrinology and metabolism at the University of British Columbia, Vancouver.
Moreover, women’s menstrual cycle lengths didn’t differ across the two time periods, despite a dramatic 63% decrement in normal ovulatory function related to increased depression, anxiety, and outside stresses that the women reported in diaries.
“Assuming that regular cycles need normal ovulation is something we should just get out of our minds. It changes our concept about what’s normal if we only know about the cycle length,” she observed.
It will be critical going forward to see whether the ovulatory disturbances have resolved as the pandemic has shifted “because there’s strong evidence that ovulatory disturbances, even with normal cycle length, are related to bone loss and some evidence it’s related to early heart attacks, breast and endometrial cancers,” Dr. Prior said during a press conference.
Asked to comment, session moderator Genevieve Neal-Perry, MD, PhD, told this news organization: “I think what we can take away is that stress itself is a modifier of the way the brain and the gonads communicate with each other, and that then has an impact on ovulatory function.”
Dr. Neal-Perry noted that the association of stress and ovulatory disruption has been reported in various ways previously, but “clearly it doesn’t affect everyone. What we don’t know is who is most susceptible. There have been some studies showing a genetic predisposition and a genetic anomaly that actually makes them more susceptible to the impact of stress on the reproductive system.”
But the lack of data on weight change in the study cohorts is a limitation. “To me one of the more important questions was what was going on with weight. Just looking at a static number doesn’t tell you whether there were changes. We know that weight gain or weight loss can stress the reproductive axis,” noted Dr. Neal-Parry of the department of obstetrics and gynecology at the University of North Carolina at Chapel Hill.
‘Experiment of nature’ revealed invisible effect of pandemic stress
The women in both cohorts of the Menstruation Ovulation Study (MOS) were healthy volunteers aged 19-35 years recruited from the metropolitan Vancouver region. All were menstruating monthly and none were taking hormonal birth control. Recruitment for the second cohort had begun just prior to the March 2020 COVID-19 pandemic lockdown.
Interviewer-administered questionnaires (CaMos) covering demographics, socioeconomic status, and reproductive history, and daily diaries kept by the women (menstrual cycle diary) were identical for both cohorts.
Assessments of ovulation differed for the two studies but were cross-validated. For the earlier time period, ovulation was assessed by a threefold increase in follicular-to-luteal urinary progesterone (PdG). For the pandemic-era study, the validated quantitative basal temperature (QBT) method was used.
There were 301 women in the earlier cohort and 125 during the pandemic. Both were an average age of about 29 years and had a body mass index of about 24.3 kg/m2 (within the normal range). The pandemic cohort was more racially/ethnically diverse than the earlier one and more in-line with recent census data.
More of the women were nulliparous during the pandemic than earlier (92.7% vs. 80.4%; P = .002).
The distribution of menstrual cycle lengths didn’t differ, with both cohorts averaging about 30 days (P = .893). However, while 90% of the women in the earlier cohort ovulated normally, only 37% did during the pandemic, a highly significant difference (P < .0001).
Thus, during the pandemic, 63% of women had “silent ovulatory disturbances,” either with short luteal phases after ovulation or no ovulation, compared with just 10% in the earlier cohort, “which is remarkable, unbelievable actually,” Dr. Prior remarked.
The difference wasn’t explained by any of the demographic information collected either, including socioeconomic status, lifestyle, or reproductive history variables.
And it wasn’t because of COVID-19 vaccination, as the vaccine wasn’t available when most of the women were recruited, and of the 79 who were recruited during vaccine availability, only two received a COVID-19 vaccine during the study (and both had normal ovulation).
Employment changes, caring responsibilities, and worry likely causes
The information from the diaries was more revealing. Several diary components were far more common during the pandemic, including negative mood (feeling depressed or anxious, sleep problems, and outside stresses), self-worth, interest in sex, energy level, and appetite. All were significantly different between the two cohorts (P < .001) and between those with and without ovulatory disturbances.
“So menstrual cycle lengths and long cycles didn’t differ, but there was a much higher prevalence of silent or subclinical ovulatory disturbances, and these were related to the increased stresses that women recorded in their diaries. This means that the estrogen levels were pretty close to normal but the progesterone levels were remarkably decreased,” Dr. Prior said.
Interestingly, reported menstrual cramps were also significantly more common during the pandemic and associated with ovulatory disruption.
“That is a new observation because previously we’ve always thought that you needed to ovulate in order to even have cramps,” she commented.
Asked whether COVID-19 itself might have played a role, Dr. Prior said no woman in the study tested positive for the virus or had long COVID.
“As far as I’m aware, it was the changes in employment … and caring for elders and worry about illness in somebody you loved that was related,” she said.
Asked what she thinks the result would be if the study were conducted now, she said: “I don’t know. We’re still in a stressful time with inflation and not complete recovery, so probably the issue is still very present.”
Dr. Prior and Dr. Neal-Perry have reported no relevant financial relationships.
A version of this article first appeared on Medscape.com.
AT ENDO 2022
COVID-19 Cycle Threshold/Cycle Number Testing at a Community Living Center
COVID-19, caused by SARS-CoV-2, is more severe in individuals with underlying illnesses. Because complete social distancing might be more difficult in nursing homes and community living centers (CLCs), public health leaders and clinicians have been concerned about the epidemiology and disease course in nursing homes even before the COVID-19 pandemic.1-7 A report of a COVID-19 outbreak in a nursing home facility in King County, Washington, documented a 33.7% overall fatality rate for residents and 52.4% among the most critically ill.4,5 The experience at King County, Washington, shows that proactive steps to identify, monitor, and apply preventive control measures is important for future outbreaks.5
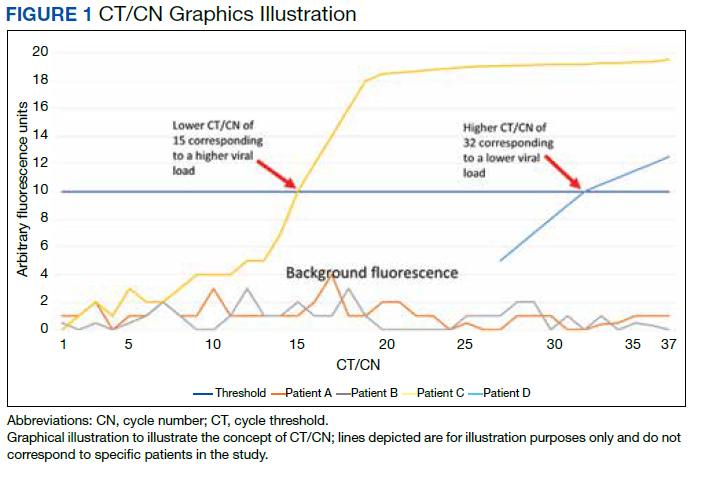
Reverse transcriptase polymerase chain reaction (RT-PCR) testing produces a cycle threshold (CT) or cycle number (CN) that correlates with viral load and infectiousness. 8-14 CT/CN represents the number of RT-PCR cycles required for the fluorescent signal to cross the detection threshold (exceed background level) and is inversely proportional to the viral load. Effectively, the higher the viral load, the lower the CT/ CN value (Figure 1). Tracking CT/CN values was not documented in the Washington nursing home outbreak. Reports of COVID- 19 testing in CLCs during outbreaks are sparse, and CT/CN values and demographic distribution of these veterans has not been reported.15 The CLC veteran population, with known higher vulnerability to infection and chronic diseases, is epidemiologically different from the general nursing home population.15-18 To address these literature gaps, we present the first report of COVID- 19 testing with CT/CN value correlations in the high-risk veteran CLC population.
Methods
A retrospective review of all COVID-19 CT/CN testing at the Corporal Michael J. Crescenz Veterans Affairs Medical Center (VAMC) CLC in Philadelphia, Pennsylvania, from March 28, 2020, to April 24, 2020, was performed with a US Department of Veterans Affairs (VA) Veterans Health Information System Architecture VistA/FileMan search. Only veteran residents were included in this review. Data collected included initial and serial test results, CT/CN on positive test results, test dates, testing platform used, demographic information (age, self-reported ethnicity, and sex), and clinical follow-up information. Health records were reviewed retrospectively to identify death, the first day after diagnosis with no documented symptoms, or hospitalization status.
RT-PCR testing was performed with the Abbott RealTime SARS-CoV-2 assay on the Abbott m2000 platform and the Xpert Xpress SARS-CoV-2 assay on the Cepheid Infinity platform. The Xpert Xpress assay gave 2 CT values for the E and N2 targets on positive samples.19 For this assay to indicate a positive specimen, amplification by RT-PCR of the N2 target or both the N2 and E target is required. The Xpert Xpress assay results as presumptive positive if only the E target amplified. This assay counts a maximum of 45 cycles. The Abbott RealTime SARS-CoV-2 assay gave 1 CN derived from the RNA-dependent RNA polymerase and N targets on positive samples.20 The Abbott assay on the m2000 counts a maximum of 37 cycles. The CT/CN value is the number of cycles required by RT-PCR for the fluorescence signal to cross a threshold value exceeding background level.19,20
Samples that are negative for COVID-19 by RT-PCR do not produce a CT/CN value. Although both instruments were used for RT-PCR, the precise CT/CN values are not interchangeable and CT/CN observations over time between the 2 instruments during the disease course would be based on CT/CN value movement (general upward or downward trend) rather than absolute CT/CN differences. Both assays have been approved by emergency use authorization as qualitative tests for the presence/absence of COVID-19. Although the CT/CN value is available to laboratory staff after test completion, the CT/CN value is not reported routinely in the patient health record. All veteran patients identified on the initial review from March 28, 2020, to April 24, 2020, had all serial COVID-19 testing recorded until November 10, 2020. The CN values at the limit of detection (LOD) for the Abbott m2000 platform from the initial validation study were reviewed for reference.21
Results
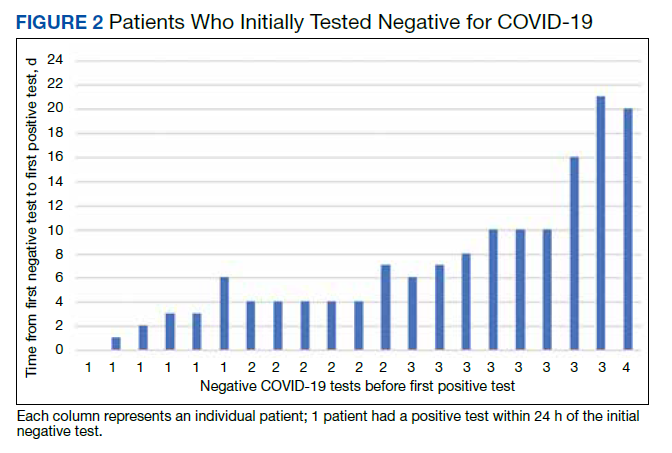
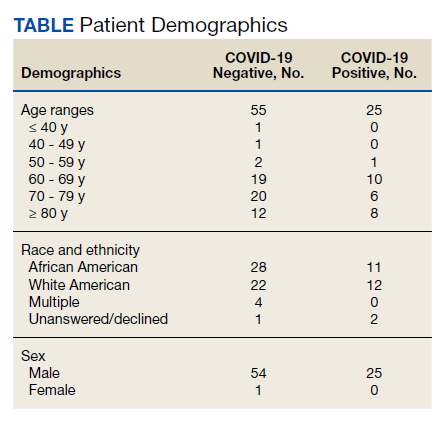
Of 80 patients, 25 (31%) were COVID-19 positive over the course of testing. The study population had a mean age of 73.5 years; 92% were aged > 60 years. The group was predominantly male (79 male vs 1 female). Among the 77 patients with a stated ethnicity, 39 (51%) were African American. In comparison, 43% of residents in Philadelphia County are African American (Table).22,23 Additionally, a previously published total COVID-19 tested population by ethnicity at the same regional VAMC revealed 46.8% of tested veteran patients were African American. 24 Three patients had no stated ethnicity. Among those who tested positive, 11 were African American patients, 12 were White patients, and 2 had no stated ethnicity. Four patients tested positive on their first test. The other 21 patients were positive on repeat testing. Interestingly, 6 patients had 1 initial negative test before a positive test, 6 patients had 2, 8 patients had 3, and 1 patient had 4 initial negative tests before a positive test result. Among the 25 positive patients, 22 were either positive within 10 days of the initial negative test result or initially positive (Figure 2). Three patients who tested positive after 10 days did so at 16, 20, and 21 days after the initial negative test result. Among the 25 positive patients, 23 had initial and serial testing from both the Abbott and Xpert Xpress assays. The remaining 2 positive patients had initial and serial testing from the Abbott assay exclusively.
Only positive COVID-19 results by RTPCR produced a CT/CN value. After disease resolution with a negative test, no CT/CN value was produced with the negative test result on either testing platform. Because repeat testing after the initial positive result took place no sooner than 10 days, we observed that the CT/CN value increased after the initial positive result until the disease resolved, and a negative result was obtained (eAppendix 1, available online at doi:10.12788/fp.0276). A t test comparing the initial CT/CN value to the value more than 10 days after the initial positive showed the CT/CN was statistically significantly higher (P < .05).
Prompt repeat testing after the initial test can show a decrease in the CT/CN value because of increasing viral load before the expected increase until disease resolution if the initial test caught the infection early. Twelve patients had a negative test result between 2 serial positive results. These negative test results occurred later, near the end of the disease course. Among the 12 patients with this positive-negativepositive CT/CN pattern, 7 were symptomatic and no longer had documented symptoms or hospitalization around the time of this positive-negative-positive pattern. Four of these individuals were asymptomatic during the entire infection course. One of the 12 patients with this pattern expired with the negative result occurring on day 27 of the disease in the context of rising CT/CN. One of these 12 patients only had a presumptive positive test result on the Cepheid because it detected only the E target with a CT value of 38.7. In 1 of the 12 patients, the negative test result occurred between 2 positive test results with CT/CN values < 20 (12.05 and 19.05 for the positive tests before and after the negative result, respectively). When the initial CT/CN values was separated based on ethnicity, the average CT/CN value for African Americans (23.3) was higher than for other ethnicities (19.9), although it did not reach statistical significance (P = .35).
Ten of the 25 patients testing positive were admitted to the hospital, including 1 admitted 15 days before diagnosis (patient 20) and 1 admitted 80 days after diagnosis (patient 7). Among these 10 patients, 6 were admitted to the intensive care unit, including patient 7. None of the patients were intubated. Three of the 10 admitted patients died (patients 7, 20, and 24). Patient 7 was a 79-year-old male with a history of dementia, cerebrovascular accident, hypertension, hyperlipidemia, and chronic kidney disease with symptoms of lethargy and refusal of oral intake when he was diagnosed with COVID-19. He was admitted 80 days after diagnosis for hyponatremia and acute renal failure, with death on day 87 recorded as complications from the earlier COVID-19 infection. Patient 20, an 89-year-old male with a history of dementia, chronic kidney disease, and hyperlipidemia, had been admitted with fever, cough, and leukocytosis 17 days before COVID-19 diagnosis. He continued to be symptomatic after diagnosis with development of hypotension, dehydration, and refusal of oral intake while on comfort measures/endof- life care and died 15 days after COVID- 19 infection diagnosis. Patient 24 was a 96-year-old male with history of heart failure, hypertension, coronary artery disease, prostate carcinoma, and dementia who developed a cough at the time of diagnosis; because of his underlying condition, he remained in the CLC on comfort care. His symptoms, including hypoxia, worsened until he died 7 days after diagnosis.
Among the 25 patients, 17 were symptomatic at the time of diagnosis; the 14 initially symptomatic patients who survived improved clinically and returned to baseline. Eight of the 25 patients were asymptomatic initially and 3 developed symptoms 2 to 5 days after diagnosis. Only 1 patient who remained asymptomatic was admitted for inability to adhere to quarantine at the CLC. Review of the health records of all surviving symptomatic patients showed symptom resolution with return to baseline that corresponds to an increasing CT/CN value. A 1-tailed t test comparing the initial CT/ CN at the time of diagnosis to the last CT/CN value for symptomatic patients who recovered revealed a statistically significant increase (P < .05). For the symptomatic, symptom resolution and hospital discharge took (if required) a mean 20 days (range, 7-46). Among those who were not hospitalized, symptoms resolved in 7 to 36 days (18 days). Among those requiring hospitalization at any time (excluding patients who died or were asymptomatic), symptom and hospitalization resolution took a mean 22 days (range, 10-46). Asymptomatic patients (patients 8, 10, 15, 16, and 25) also showed increasing CT/CN value during the infection course, although there was no correlation with the continued lack of symptoms.
During the initial validation of the Abbott m2000 instrument, an LOD study included concentrations of 1000, 500, 250, 100, 70, 60, and 50 virus copies/mL (eAppendix 2, available online at doi:10.12788/fp.0276).21 The average CN at 100 virus copies/mL—the manufacturer provided LOD in the instructions for use—was 25.74.20 At a concentration of one-half that (50 virus copies/mL), the average CN was 28.39.
Discussion
This is the first study in the English literature to track CT/CN values as part of serial testing of a veteran CLC. Widescale testing and repeat screening in the absence of symptoms of nursing home residents would identify those who are infected and allow providers to track viral load clearance.9-14 CT/CN values, when serially tracked during the infection course, appear to increase with illness resolution, consistent with earlier reports that CT/CN correlates with viral load.8-14 Serial CT/CN values that are high (> 25) and continue to increase with each test suggest progression toward disease resolution or viral RNA clearance.8-14 After symptom resolution, patients can have a persistent low level of viral shedding (corresponding to a high CT/CN value).10-14,25 Near the end of disease resolution, a negative serial RT-PCR sample test before a subsequent positive might be a promising clinical sign of near disease recovery. Once the viral load is low with a CT/CN significantly higher than 25, some specimens might result as negative but turn up positive on subsequent sampling with a high CT/CN value. This pattern, with attendant high CT/CN values for the positive results, are consistent with the known effect of viral load (ie, a low viral load correlates to a high CT/CN) and adequacy of specimen collection on CT/CN values.25 If the patient’s viral load is low, the sample collected might have a viral load at or near the testing platform’s LOD.
For Abbott m2000, the manufacturer provided LOD is 100 virus copies/mL, although the instrument was able to detect virus concentrations below that level during the initial validation.20 The actual LOD of the instrument at our institution is < 100 virus copies/mL. For the Cepheid Xpert Xpress SARS-CoV-2 assay, the manufacturer-provided LOD is 250 virus copies/mL.19 An LOD study including samples below the manufacturer-provided LOD was not part of the initial validation study for the Xpert Xpress assay. Nonetheless, the virus concentration of samples with very high CT values at or near the maximum CT value of 45 is expected to be at or near the platform’s actual LOD.
If the samples collected near the end of the patient’s disease course have viral loads near these low concentrations, the encouraging positive-negative-positive pattern with high CT/CN values might be a promising sign for viral clearance. On the other hand, a positive-negative-positive pattern in the setting of low CT/CN values before and after the negative test might indicate poor sampling for the negative specimen. The back-and-forth or positive-negative-positive pattern generally appears to indicate near resolution of the infection course, although clinical correlation is necessary to rule out inadequate sampling earlier in the disease course or prolonged viral RNA shedding.9-14 In all of the surviving symptomatic patients who showed the positive-negative-positive pattern, this sign occurred around or after symptom resolution. It also is important to consider that in some patients, SARS-CoV-2 RNA might remain detectable with increasing CT/CN after symptom resolution, and samples from these patients might not result positive. Therefore, CT/CN values cannot be interpreted without considering the clinical picture.25
Studies on infectiousness and virus culture from COVID-19 samples with CT/ CN correlation have shown that patients with high CT/CN at the end of their disease course might not be as infectious.9-14,25 Because 1 patient had a presumptive positive result after the negative result, this study shows that this positive-negative-positive pattern could include presumptive positive results. Also, in the setting of a recent positive result on the same testing platform, a patient with this pattern is presumed to be positive for COVID-19 RNA because of scant viral material.
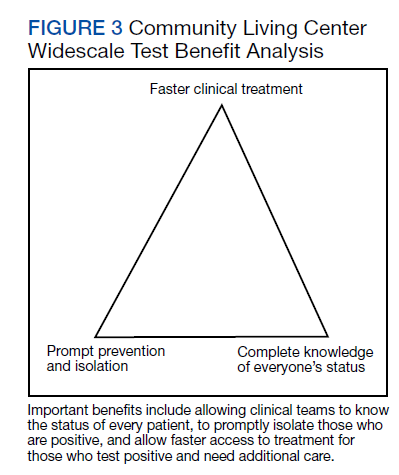
Taiwan’s public health response to the outbreak illustrates the ability to mitigate an outbreak throughout a society.26 These actions could help blunt an outbreak within a civilian nursing home population.5 Mitigation within a veteran CLC population has been documented, but the study, which focused on mitigation, did not consider CT/CN values, demographic distribution, testing access of the studied population, or laboratory findings related to disease pathophysiology.15 A key ingredient in widescale, serial testing is the availability of a rapid turnaround from testing in-house that allowed identification within 24 hours instead of several days at a reference laboratory. 15 Rapid widescale testing would allow clinical teams to optimize the Triangle of Benefit of Widescale Timely Tests for CLC (Figure 3).15 Timely laboratory testing remains pivotal for CLC veteran residents to aid successful clinical triage and management. Reporting serial CT/CN values can provide additional information to clinicians about the disease course because CT/ CN correlates with viral load, which varies based on where the patient is in the disease course.9-14 CT/CN values carry significant prognostic value, particularly with respect to intubation and mortality.8
Limitations
Important limitations to our study include the use of 2 separate RT-PCR platforms. Using different RT-PCR platforms is common in clinical laboratories trying to take advantage of the unique characteristics of different platforms—for example, turnaround time vs high throughput— to manage COVID-19 testing workflow.25 However, the exact CT/CN values obtained from each platform might not translate to the other, and the general trend (CT/CN values are rising or falling across serial tests) rather than a single value could be useful for clinical correlation. Even when the same platform is used for the serial testing, CT/CN values can be affected by adequacy of specimen collection; therefore, clinical correlation and considering the trend in CT/CN values is necessary for interpretation.10-14,25 Because of the known trend in viral dynamics, a positive specimen collected with a high CT/CN followed by a subsequent (within 2 days) positive specimen collected with a low CT/CN might be compatible with early detection of COVID- 19 infection in the appropriate clinical context. 10-14 However, detection late in the infection course or even after the symptomatic disease resolved with prolonged viral shedding might show serial positive samples with increasing CT/CN values.10-14
Patients with prolonged viral shedding might not be infectious.27 Because of the clinical correlation required for interpretation and the other factors that might affect CT/CN values, recommendations advise against using CT/CN values in clinical practice at this time, although these recommendations could change with future research.25 Serial CT/CN values have the potential, if appropriately correlated with the clinical picture, to provide useful information, such as whether the viral load of the sample is relatively high or low and increasing or decreasing.
Veterans, as a population, are more susceptible to poor health outcomes and morbidity compared with similar civilian counterparts.2,14-16 Veteran CLC patients likely would experience worse outcomes with COVID-19, including more infections, expiration, and morbidity compared with similar general population nursing homes. Similar to what had been reported for the civilian population, a trend (high CT/CN values early in the disease course with repeat testing needed to detect all positives followed by lower CT/CN value to correlate with increased viral load and then increased CT/CN value as the infection resolved) also was observed in this veteran population.
It has been extensively documented that minority groups experience decreased health care access and worse health outcomes. 28-30 Considering the critical medical supply shortages, including personal protective equipment, ventilators, and even testing supplies, there is the potential for a resource access disparity by ethnicity.28-31 Because the VA does not depend on measures of wealth and privilege such as health insurance, there was no disparity noted in access to testing by race or ethnicity at the VAMC CLC. When considering the health outcome of viral load from the measured CT/CN value, the viral loads of African American patients and those of other ethnicities was not significantly different in this study.
Conclusions
This is the first study to bring up critical points including serial CT/CN value correlation in RT-PCR tests, demographic distributions demonstrating easy and equal access in a veteran nursing home to COVID-19 testing, and clinical laboratory signs related to disease pathophysiology. Unlike other populations who have undergone serial CT/CN monitoring, nursing homes represent a particularly vulnerable population who require measures to prevent the spread and mitigate outbreaks of COVID-19.2,4,5 Test measurements obtained such as the CT/CN value during routine clinical care can provide useful information for public health, epidemiologic, or clinical purposes with appropriate correlation to clinical and other laboratory parameters. This study demonstrates early intervention of serial testing of an outbreak in a veterans nursing home with CT/CN value correlation.
1. Chen T, Wu D, Chen H, et al. Clinical characteristics of 113 deceased patients with coronavirus disease 2019: retrospective study. BMJ. 2020;368:m1091. doi:10.1136/bmj.m1091
2. Tsan L, Davis C, Langberg R, et al. Prevalence of nursing home-associated infections in the Department of Veterans Affairs nursing home care units. Am J Infect Control. 2008;36(3):173-179. doi:10.1016/j.ajic.2007.06.008
3. Zhou F, Yu T, Du R, et al. Clinical course and risk factors for mortality of adult inpatients with COVID-19 in Wuhan, China: a retrospective cohort study. Lancet. 2020;395(10229):1054-1062. doi:10.1016/S0140-6736(20)30566-3
4. Arentz M, Yim E, Klaff L, et al. Characteristics and outcomes of 21 critically ill patients with COVID-19 in Washington State. JAMA. 2020;323(16):1612-1614. doi:10.1001/jama.2020.4326
5. McMichael TM, Currie DW, Clark S, et al. Public Health–Seattle and King County, EvergreenHealth, and CDC COVID-19 Investigation Team. Epidemiology of Covid-19 in a long-term care facility in King County, Washington. N Engl J Med. 2020;382(21):2005-2011. doi:10.1056/NEJMoa2005412
6. Childs A, Zullo AR, Joyce NR, et al. The burden of respiratory infections among older adults in long-term care: a systematic review. BMC Geriatr. 2019;19(1):210. doi:10.1186/s12877-019-1236-6
7. Eriksen HM, Iversen BG, Aavitsland PJ. Prevalence of nosocomial infections and use of antibiotics in long-term care facilities in Norway, 2002 and 2003. Hosp Infect. 2004;57(4):316-320. doi:10.1016/j.jhin.2004.03.028
8. Magleby R, Westblade LF, Trzebucki A, et al. Impact Severe acute respiratory syndrome coronavirus 2 viral load on risk of intubation and mortality among hospitalized patients with coronavirus disease 2019. Clin Infect Dis. 2021;73(11):e4197-e4205. doi:10.1093/cid/ciaa851
9. Buchan B, Hoff J, Gmehlin C, et al. Distribution of SARSCoV- 2 PCR cycle threshold values provide practical insight into overall and target-specific sensitivity among symptomatic patients. Am Clin Pathol. 2020;154:479-485. doi:10.1093/ajcp/aqaa133
10. He X, Lau EHY, Wu P, et al. Temporal dynamics in viral shedding and transmissibility of COVID-19. Nat Med. 2020;26(5):672-675. doi:10.1038/s41591-020-0869-5
11. Zou L, Ruan F, Huang M, et al. SARS-CoV-2 Viral load in upper respiratory specimens of infected patients. N Engl J Med. 2020;382(12):1177-1179. doi:10.1056/NEJMc2001737
12. Singanayagam A, Patel M, Charlett A, et al. Duration of infectiousness and correlation with RT-PCR cycle threshold values in cases of COVID-19, England, January to May 2020. Euro Surveill. 2020;25(32):2001483. doi:10.2807/1560-7917.ES.2020.25.32.2001483
13. Salvatore P, Dawson P, Wadhwa A, et al. Epidemiological correlates of PCR cycles threshold values in the detection of SARS-CoV-2. Clin Infect Dis. 2021;72(11):e761-e767. doi:10.1093/cid/ciaa1469
14. Kissler S, Fauver J, Mack C, et al. Viral dynamics of SARS-CoV-2 infection and the predictive value of repeat testing. medRxiv. 2020;10.21.20217042. doi:10.1101/2020.10.21.20217042 1
5. Escobar DJ, Lanzi M, Saberi P, et al. Mitigation of a COVID-19 outbreak in a nursing home through serial testing of residents and staff. Clin Infect Dis. 2021;72(9):e394- e396. doi:10.1093/cid/ciaa1021
16. Eibner C, Krull H, Brown KM, et al. Current and projected characteristics and unique health care needs of the patient population served by the Department of Veterans Affairs. Rand Health Q. 2016;5(4):13.
17. Agha Z, Lofgren RP, VanRuiswyk JV, Layde PM. Are patients at Veterans Affairs medical centers sicker? A comparative analysis of health status and medical resource use. Arch Intern Med. 2000;160(21):3252-3257. doi:10.1001/archinte.160.21.3252
18. Morgan RO, Teal CR, Reddy SG, Ford ME, Ashton CM. Measurement in Veterans Affairs Health Services Research: veterans as a special population. Health Serv Res. 2005;40(5 Pt 2):1573-1583. doi:10.1111/j.1475-6773.2005.00448.x 1
9. Xpert Xpress SARS-CoV-2. Instructions for use. Cepheid. 302-2562, Rev. C April 2020. Accessed January 7, 2021. https://www.fda.gov/media/136314/download
20. Abbott RealTime SARS-CoV-2. Instructions for use Abbott. 09N77-95. July 2020. Accessed January 7, 2021. https:// www.fda.gov/media/136258/download
21. Petersen JM, Dalal S, Jhala D. Successful implementation of SARS-CoV-2 testing in midst of pandemic with emphasis on all phases of testing. J Clin Pathol. 2021;74:273- 278. doi:10.1136/jclinpath-2020-207175
22. United States Census Bureau. Quick Facts: Philadelphia County, Pennsylvania. Accessed April 16, 2020. https://www .census.gov/quickfacts/philadelphiacountypennsylvania
23. Centers for Disease Control and Prevention. United States COVID-19 cases, deaths, and laboratory testing (NAATS) by state, territory, and jurisdiction. Accessed April 26, 2020. https://www.cdc.gov/coronavirus/2019-ncov/cases -updates/cases-in-us.html 2
4. Petersen J, Jhala D. Ethnicity, comorbid medical conditions, and SARS-CoV-2 test cycle thresholds in the veteran population [published online ahead of print, 2021 Jul 28]. J Racial Ethn Health Disparities. 2021;1-8. doi:10.1007/s40615-021-01114-4
25. Infectious Diseases Society of America, Association for Molecular Pathology. IDSA and AMP joint statement on the use of SARS-CoV-2 PCR cycle threshold (Ct) values for clinical decision-making. Accessed August 28, 2021. https://www.idsociety.org/globalassets/idsa/public-health /covid-19/idsa-amp-statement.pdf
26. Wang J, Ng CY, Brook RH. Response to COVID-19 in Taiwan: big data analysis, new technology, and proactive testing. JAMA. 2020;323(14):1341-1342. doi:10.1001/jama.2020.3151
27. Centers for Disease Control and Prevention. Overview of testing for SARS-CoV-2, the virus that causes COVID- 19. Accessed July 28, 2021. https://www.cdc.gov /coronavirus/2019-ncov/hcp/testing-overview.html
28. Zuvekas SH, Taliaferro GS. Pathways to access: health insurance, the health care delivery system, and racial/ethnic disparities, 1996-1999. Health Aff. 2003;22(2):139-153. doi:10.1377/hlthaff.22.2.139
29. Egede LE. Race, ethnicity, culture, and disparities in health care. J Gen Intern Med. 2006;21(6):667-669. doi:10.1111/j.1525-1497.2006.0512.x
30. Institute of Medicine (US) Committee on Understanding and Eliminating Racial and Ethnic Disparities in Health Care. Smedley BD, Stith AY, Nelson AR, eds. Unequal treatment: confronting racial and ethnic disparities in health care. National Academies Press; 2003. doi:10.17226/12875
31. Ranney ML, Griffeth V, Jha AK. Critical supply shortages – the need for ventilators and personal protective equipment during the Covid-19 Pandemic. N Engl J Med. 2020;382(18):e41. doi:10.1056/NEJMp2006141
COVID-19, caused by SARS-CoV-2, is more severe in individuals with underlying illnesses. Because complete social distancing might be more difficult in nursing homes and community living centers (CLCs), public health leaders and clinicians have been concerned about the epidemiology and disease course in nursing homes even before the COVID-19 pandemic.1-7 A report of a COVID-19 outbreak in a nursing home facility in King County, Washington, documented a 33.7% overall fatality rate for residents and 52.4% among the most critically ill.4,5 The experience at King County, Washington, shows that proactive steps to identify, monitor, and apply preventive control measures is important for future outbreaks.5
Reverse transcriptase polymerase chain reaction (RT-PCR) testing produces a cycle threshold (CT) or cycle number (CN) that correlates with viral load and infectiousness. 8-14 CT/CN represents the number of RT-PCR cycles required for the fluorescent signal to cross the detection threshold (exceed background level) and is inversely proportional to the viral load. Effectively, the higher the viral load, the lower the CT/ CN value (Figure 1). Tracking CT/CN values was not documented in the Washington nursing home outbreak. Reports of COVID- 19 testing in CLCs during outbreaks are sparse, and CT/CN values and demographic distribution of these veterans has not been reported.15 The CLC veteran population, with known higher vulnerability to infection and chronic diseases, is epidemiologically different from the general nursing home population.15-18 To address these literature gaps, we present the first report of COVID- 19 testing with CT/CN value correlations in the high-risk veteran CLC population.
Methods
A retrospective review of all COVID-19 CT/CN testing at the Corporal Michael J. Crescenz Veterans Affairs Medical Center (VAMC) CLC in Philadelphia, Pennsylvania, from March 28, 2020, to April 24, 2020, was performed with a US Department of Veterans Affairs (VA) Veterans Health Information System Architecture VistA/FileMan search. Only veteran residents were included in this review. Data collected included initial and serial test results, CT/CN on positive test results, test dates, testing platform used, demographic information (age, self-reported ethnicity, and sex), and clinical follow-up information. Health records were reviewed retrospectively to identify death, the first day after diagnosis with no documented symptoms, or hospitalization status.
RT-PCR testing was performed with the Abbott RealTime SARS-CoV-2 assay on the Abbott m2000 platform and the Xpert Xpress SARS-CoV-2 assay on the Cepheid Infinity platform. The Xpert Xpress assay gave 2 CT values for the E and N2 targets on positive samples.19 For this assay to indicate a positive specimen, amplification by RT-PCR of the N2 target or both the N2 and E target is required. The Xpert Xpress assay results as presumptive positive if only the E target amplified. This assay counts a maximum of 45 cycles. The Abbott RealTime SARS-CoV-2 assay gave 1 CN derived from the RNA-dependent RNA polymerase and N targets on positive samples.20 The Abbott assay on the m2000 counts a maximum of 37 cycles. The CT/CN value is the number of cycles required by RT-PCR for the fluorescence signal to cross a threshold value exceeding background level.19,20
Samples that are negative for COVID-19 by RT-PCR do not produce a CT/CN value. Although both instruments were used for RT-PCR, the precise CT/CN values are not interchangeable and CT/CN observations over time between the 2 instruments during the disease course would be based on CT/CN value movement (general upward or downward trend) rather than absolute CT/CN differences. Both assays have been approved by emergency use authorization as qualitative tests for the presence/absence of COVID-19. Although the CT/CN value is available to laboratory staff after test completion, the CT/CN value is not reported routinely in the patient health record. All veteran patients identified on the initial review from March 28, 2020, to April 24, 2020, had all serial COVID-19 testing recorded until November 10, 2020. The CN values at the limit of detection (LOD) for the Abbott m2000 platform from the initial validation study were reviewed for reference.21
Results
Of 80 patients, 25 (31%) were COVID-19 positive over the course of testing. The study population had a mean age of 73.5 years; 92% were aged > 60 years. The group was predominantly male (79 male vs 1 female). Among the 77 patients with a stated ethnicity, 39 (51%) were African American. In comparison, 43% of residents in Philadelphia County are African American (Table).22,23 Additionally, a previously published total COVID-19 tested population by ethnicity at the same regional VAMC revealed 46.8% of tested veteran patients were African American. 24 Three patients had no stated ethnicity. Among those who tested positive, 11 were African American patients, 12 were White patients, and 2 had no stated ethnicity. Four patients tested positive on their first test. The other 21 patients were positive on repeat testing. Interestingly, 6 patients had 1 initial negative test before a positive test, 6 patients had 2, 8 patients had 3, and 1 patient had 4 initial negative tests before a positive test result. Among the 25 positive patients, 22 were either positive within 10 days of the initial negative test result or initially positive (Figure 2). Three patients who tested positive after 10 days did so at 16, 20, and 21 days after the initial negative test result. Among the 25 positive patients, 23 had initial and serial testing from both the Abbott and Xpert Xpress assays. The remaining 2 positive patients had initial and serial testing from the Abbott assay exclusively.
Only positive COVID-19 results by RTPCR produced a CT/CN value. After disease resolution with a negative test, no CT/CN value was produced with the negative test result on either testing platform. Because repeat testing after the initial positive result took place no sooner than 10 days, we observed that the CT/CN value increased after the initial positive result until the disease resolved, and a negative result was obtained (eAppendix 1, available online at doi:10.12788/fp.0276). A t test comparing the initial CT/CN value to the value more than 10 days after the initial positive showed the CT/CN was statistically significantly higher (P < .05).
Prompt repeat testing after the initial test can show a decrease in the CT/CN value because of increasing viral load before the expected increase until disease resolution if the initial test caught the infection early. Twelve patients had a negative test result between 2 serial positive results. These negative test results occurred later, near the end of the disease course. Among the 12 patients with this positive-negativepositive CT/CN pattern, 7 were symptomatic and no longer had documented symptoms or hospitalization around the time of this positive-negative-positive pattern. Four of these individuals were asymptomatic during the entire infection course. One of the 12 patients with this pattern expired with the negative result occurring on day 27 of the disease in the context of rising CT/CN. One of these 12 patients only had a presumptive positive test result on the Cepheid because it detected only the E target with a CT value of 38.7. In 1 of the 12 patients, the negative test result occurred between 2 positive test results with CT/CN values < 20 (12.05 and 19.05 for the positive tests before and after the negative result, respectively). When the initial CT/CN values was separated based on ethnicity, the average CT/CN value for African Americans (23.3) was higher than for other ethnicities (19.9), although it did not reach statistical significance (P = .35).
Ten of the 25 patients testing positive were admitted to the hospital, including 1 admitted 15 days before diagnosis (patient 20) and 1 admitted 80 days after diagnosis (patient 7). Among these 10 patients, 6 were admitted to the intensive care unit, including patient 7. None of the patients were intubated. Three of the 10 admitted patients died (patients 7, 20, and 24). Patient 7 was a 79-year-old male with a history of dementia, cerebrovascular accident, hypertension, hyperlipidemia, and chronic kidney disease with symptoms of lethargy and refusal of oral intake when he was diagnosed with COVID-19. He was admitted 80 days after diagnosis for hyponatremia and acute renal failure, with death on day 87 recorded as complications from the earlier COVID-19 infection. Patient 20, an 89-year-old male with a history of dementia, chronic kidney disease, and hyperlipidemia, had been admitted with fever, cough, and leukocytosis 17 days before COVID-19 diagnosis. He continued to be symptomatic after diagnosis with development of hypotension, dehydration, and refusal of oral intake while on comfort measures/endof- life care and died 15 days after COVID- 19 infection diagnosis. Patient 24 was a 96-year-old male with history of heart failure, hypertension, coronary artery disease, prostate carcinoma, and dementia who developed a cough at the time of diagnosis; because of his underlying condition, he remained in the CLC on comfort care. His symptoms, including hypoxia, worsened until he died 7 days after diagnosis.
Among the 25 patients, 17 were symptomatic at the time of diagnosis; the 14 initially symptomatic patients who survived improved clinically and returned to baseline. Eight of the 25 patients were asymptomatic initially and 3 developed symptoms 2 to 5 days after diagnosis. Only 1 patient who remained asymptomatic was admitted for inability to adhere to quarantine at the CLC. Review of the health records of all surviving symptomatic patients showed symptom resolution with return to baseline that corresponds to an increasing CT/CN value. A 1-tailed t test comparing the initial CT/ CN at the time of diagnosis to the last CT/CN value for symptomatic patients who recovered revealed a statistically significant increase (P < .05). For the symptomatic, symptom resolution and hospital discharge took (if required) a mean 20 days (range, 7-46). Among those who were not hospitalized, symptoms resolved in 7 to 36 days (18 days). Among those requiring hospitalization at any time (excluding patients who died or were asymptomatic), symptom and hospitalization resolution took a mean 22 days (range, 10-46). Asymptomatic patients (patients 8, 10, 15, 16, and 25) also showed increasing CT/CN value during the infection course, although there was no correlation with the continued lack of symptoms.
During the initial validation of the Abbott m2000 instrument, an LOD study included concentrations of 1000, 500, 250, 100, 70, 60, and 50 virus copies/mL (eAppendix 2, available online at doi:10.12788/fp.0276).21 The average CN at 100 virus copies/mL—the manufacturer provided LOD in the instructions for use—was 25.74.20 At a concentration of one-half that (50 virus copies/mL), the average CN was 28.39.
Discussion
This is the first study in the English literature to track CT/CN values as part of serial testing of a veteran CLC. Widescale testing and repeat screening in the absence of symptoms of nursing home residents would identify those who are infected and allow providers to track viral load clearance.9-14 CT/CN values, when serially tracked during the infection course, appear to increase with illness resolution, consistent with earlier reports that CT/CN correlates with viral load.8-14 Serial CT/CN values that are high (> 25) and continue to increase with each test suggest progression toward disease resolution or viral RNA clearance.8-14 After symptom resolution, patients can have a persistent low level of viral shedding (corresponding to a high CT/CN value).10-14,25 Near the end of disease resolution, a negative serial RT-PCR sample test before a subsequent positive might be a promising clinical sign of near disease recovery. Once the viral load is low with a CT/CN significantly higher than 25, some specimens might result as negative but turn up positive on subsequent sampling with a high CT/CN value. This pattern, with attendant high CT/CN values for the positive results, are consistent with the known effect of viral load (ie, a low viral load correlates to a high CT/CN) and adequacy of specimen collection on CT/CN values.25 If the patient’s viral load is low, the sample collected might have a viral load at or near the testing platform’s LOD.
For Abbott m2000, the manufacturer provided LOD is 100 virus copies/mL, although the instrument was able to detect virus concentrations below that level during the initial validation.20 The actual LOD of the instrument at our institution is < 100 virus copies/mL. For the Cepheid Xpert Xpress SARS-CoV-2 assay, the manufacturer-provided LOD is 250 virus copies/mL.19 An LOD study including samples below the manufacturer-provided LOD was not part of the initial validation study for the Xpert Xpress assay. Nonetheless, the virus concentration of samples with very high CT values at or near the maximum CT value of 45 is expected to be at or near the platform’s actual LOD.
If the samples collected near the end of the patient’s disease course have viral loads near these low concentrations, the encouraging positive-negative-positive pattern with high CT/CN values might be a promising sign for viral clearance. On the other hand, a positive-negative-positive pattern in the setting of low CT/CN values before and after the negative test might indicate poor sampling for the negative specimen. The back-and-forth or positive-negative-positive pattern generally appears to indicate near resolution of the infection course, although clinical correlation is necessary to rule out inadequate sampling earlier in the disease course or prolonged viral RNA shedding.9-14 In all of the surviving symptomatic patients who showed the positive-negative-positive pattern, this sign occurred around or after symptom resolution. It also is important to consider that in some patients, SARS-CoV-2 RNA might remain detectable with increasing CT/CN after symptom resolution, and samples from these patients might not result positive. Therefore, CT/CN values cannot be interpreted without considering the clinical picture.25
Studies on infectiousness and virus culture from COVID-19 samples with CT/ CN correlation have shown that patients with high CT/CN at the end of their disease course might not be as infectious.9-14,25 Because 1 patient had a presumptive positive result after the negative result, this study shows that this positive-negative-positive pattern could include presumptive positive results. Also, in the setting of a recent positive result on the same testing platform, a patient with this pattern is presumed to be positive for COVID-19 RNA because of scant viral material.
Taiwan’s public health response to the outbreak illustrates the ability to mitigate an outbreak throughout a society.26 These actions could help blunt an outbreak within a civilian nursing home population.5 Mitigation within a veteran CLC population has been documented, but the study, which focused on mitigation, did not consider CT/CN values, demographic distribution, testing access of the studied population, or laboratory findings related to disease pathophysiology.15 A key ingredient in widescale, serial testing is the availability of a rapid turnaround from testing in-house that allowed identification within 24 hours instead of several days at a reference laboratory. 15 Rapid widescale testing would allow clinical teams to optimize the Triangle of Benefit of Widescale Timely Tests for CLC (Figure 3).15 Timely laboratory testing remains pivotal for CLC veteran residents to aid successful clinical triage and management. Reporting serial CT/CN values can provide additional information to clinicians about the disease course because CT/ CN correlates with viral load, which varies based on where the patient is in the disease course.9-14 CT/CN values carry significant prognostic value, particularly with respect to intubation and mortality.8
Limitations
Important limitations to our study include the use of 2 separate RT-PCR platforms. Using different RT-PCR platforms is common in clinical laboratories trying to take advantage of the unique characteristics of different platforms—for example, turnaround time vs high throughput— to manage COVID-19 testing workflow.25 However, the exact CT/CN values obtained from each platform might not translate to the other, and the general trend (CT/CN values are rising or falling across serial tests) rather than a single value could be useful for clinical correlation. Even when the same platform is used for the serial testing, CT/CN values can be affected by adequacy of specimen collection; therefore, clinical correlation and considering the trend in CT/CN values is necessary for interpretation.10-14,25 Because of the known trend in viral dynamics, a positive specimen collected with a high CT/CN followed by a subsequent (within 2 days) positive specimen collected with a low CT/CN might be compatible with early detection of COVID- 19 infection in the appropriate clinical context. 10-14 However, detection late in the infection course or even after the symptomatic disease resolved with prolonged viral shedding might show serial positive samples with increasing CT/CN values.10-14
Patients with prolonged viral shedding might not be infectious.27 Because of the clinical correlation required for interpretation and the other factors that might affect CT/CN values, recommendations advise against using CT/CN values in clinical practice at this time, although these recommendations could change with future research.25 Serial CT/CN values have the potential, if appropriately correlated with the clinical picture, to provide useful information, such as whether the viral load of the sample is relatively high or low and increasing or decreasing.
Veterans, as a population, are more susceptible to poor health outcomes and morbidity compared with similar civilian counterparts.2,14-16 Veteran CLC patients likely would experience worse outcomes with COVID-19, including more infections, expiration, and morbidity compared with similar general population nursing homes. Similar to what had been reported for the civilian population, a trend (high CT/CN values early in the disease course with repeat testing needed to detect all positives followed by lower CT/CN value to correlate with increased viral load and then increased CT/CN value as the infection resolved) also was observed in this veteran population.
It has been extensively documented that minority groups experience decreased health care access and worse health outcomes. 28-30 Considering the critical medical supply shortages, including personal protective equipment, ventilators, and even testing supplies, there is the potential for a resource access disparity by ethnicity.28-31 Because the VA does not depend on measures of wealth and privilege such as health insurance, there was no disparity noted in access to testing by race or ethnicity at the VAMC CLC. When considering the health outcome of viral load from the measured CT/CN value, the viral loads of African American patients and those of other ethnicities was not significantly different in this study.
Conclusions
This is the first study to bring up critical points including serial CT/CN value correlation in RT-PCR tests, demographic distributions demonstrating easy and equal access in a veteran nursing home to COVID-19 testing, and clinical laboratory signs related to disease pathophysiology. Unlike other populations who have undergone serial CT/CN monitoring, nursing homes represent a particularly vulnerable population who require measures to prevent the spread and mitigate outbreaks of COVID-19.2,4,5 Test measurements obtained such as the CT/CN value during routine clinical care can provide useful information for public health, epidemiologic, or clinical purposes with appropriate correlation to clinical and other laboratory parameters. This study demonstrates early intervention of serial testing of an outbreak in a veterans nursing home with CT/CN value correlation.
1. Chen T, Wu D, Chen H, et al. Clinical characteristics of 113 deceased patients with coronavirus disease 2019: retrospective study. BMJ. 2020;368:m1091. doi:10.1136/bmj.m1091
2. Tsan L, Davis C, Langberg R, et al. Prevalence of nursing home-associated infections in the Department of Veterans Affairs nursing home care units. Am J Infect Control. 2008;36(3):173-179. doi:10.1016/j.ajic.2007.06.008
3. Zhou F, Yu T, Du R, et al. Clinical course and risk factors for mortality of adult inpatients with COVID-19 in Wuhan, China: a retrospective cohort study. Lancet. 2020;395(10229):1054-1062. doi:10.1016/S0140-6736(20)30566-3
4. Arentz M, Yim E, Klaff L, et al. Characteristics and outcomes of 21 critically ill patients with COVID-19 in Washington State. JAMA. 2020;323(16):1612-1614. doi:10.1001/jama.2020.4326
5. McMichael TM, Currie DW, Clark S, et al. Public Health–Seattle and King County, EvergreenHealth, and CDC COVID-19 Investigation Team. Epidemiology of Covid-19 in a long-term care facility in King County, Washington. N Engl J Med. 2020;382(21):2005-2011. doi:10.1056/NEJMoa2005412
6. Childs A, Zullo AR, Joyce NR, et al. The burden of respiratory infections among older adults in long-term care: a systematic review. BMC Geriatr. 2019;19(1):210. doi:10.1186/s12877-019-1236-6
7. Eriksen HM, Iversen BG, Aavitsland PJ. Prevalence of nosocomial infections and use of antibiotics in long-term care facilities in Norway, 2002 and 2003. Hosp Infect. 2004;57(4):316-320. doi:10.1016/j.jhin.2004.03.028
8. Magleby R, Westblade LF, Trzebucki A, et al. Impact Severe acute respiratory syndrome coronavirus 2 viral load on risk of intubation and mortality among hospitalized patients with coronavirus disease 2019. Clin Infect Dis. 2021;73(11):e4197-e4205. doi:10.1093/cid/ciaa851
9. Buchan B, Hoff J, Gmehlin C, et al. Distribution of SARSCoV- 2 PCR cycle threshold values provide practical insight into overall and target-specific sensitivity among symptomatic patients. Am Clin Pathol. 2020;154:479-485. doi:10.1093/ajcp/aqaa133
10. He X, Lau EHY, Wu P, et al. Temporal dynamics in viral shedding and transmissibility of COVID-19. Nat Med. 2020;26(5):672-675. doi:10.1038/s41591-020-0869-5
11. Zou L, Ruan F, Huang M, et al. SARS-CoV-2 Viral load in upper respiratory specimens of infected patients. N Engl J Med. 2020;382(12):1177-1179. doi:10.1056/NEJMc2001737
12. Singanayagam A, Patel M, Charlett A, et al. Duration of infectiousness and correlation with RT-PCR cycle threshold values in cases of COVID-19, England, January to May 2020. Euro Surveill. 2020;25(32):2001483. doi:10.2807/1560-7917.ES.2020.25.32.2001483
13. Salvatore P, Dawson P, Wadhwa A, et al. Epidemiological correlates of PCR cycles threshold values in the detection of SARS-CoV-2. Clin Infect Dis. 2021;72(11):e761-e767. doi:10.1093/cid/ciaa1469
14. Kissler S, Fauver J, Mack C, et al. Viral dynamics of SARS-CoV-2 infection and the predictive value of repeat testing. medRxiv. 2020;10.21.20217042. doi:10.1101/2020.10.21.20217042 1
5. Escobar DJ, Lanzi M, Saberi P, et al. Mitigation of a COVID-19 outbreak in a nursing home through serial testing of residents and staff. Clin Infect Dis. 2021;72(9):e394- e396. doi:10.1093/cid/ciaa1021
16. Eibner C, Krull H, Brown KM, et al. Current and projected characteristics and unique health care needs of the patient population served by the Department of Veterans Affairs. Rand Health Q. 2016;5(4):13.
17. Agha Z, Lofgren RP, VanRuiswyk JV, Layde PM. Are patients at Veterans Affairs medical centers sicker? A comparative analysis of health status and medical resource use. Arch Intern Med. 2000;160(21):3252-3257. doi:10.1001/archinte.160.21.3252
18. Morgan RO, Teal CR, Reddy SG, Ford ME, Ashton CM. Measurement in Veterans Affairs Health Services Research: veterans as a special population. Health Serv Res. 2005;40(5 Pt 2):1573-1583. doi:10.1111/j.1475-6773.2005.00448.x 1
9. Xpert Xpress SARS-CoV-2. Instructions for use. Cepheid. 302-2562, Rev. C April 2020. Accessed January 7, 2021. https://www.fda.gov/media/136314/download
20. Abbott RealTime SARS-CoV-2. Instructions for use Abbott. 09N77-95. July 2020. Accessed January 7, 2021. https:// www.fda.gov/media/136258/download
21. Petersen JM, Dalal S, Jhala D. Successful implementation of SARS-CoV-2 testing in midst of pandemic with emphasis on all phases of testing. J Clin Pathol. 2021;74:273- 278. doi:10.1136/jclinpath-2020-207175
22. United States Census Bureau. Quick Facts: Philadelphia County, Pennsylvania. Accessed April 16, 2020. https://www .census.gov/quickfacts/philadelphiacountypennsylvania
23. Centers for Disease Control and Prevention. United States COVID-19 cases, deaths, and laboratory testing (NAATS) by state, territory, and jurisdiction. Accessed April 26, 2020. https://www.cdc.gov/coronavirus/2019-ncov/cases -updates/cases-in-us.html 2
4. Petersen J, Jhala D. Ethnicity, comorbid medical conditions, and SARS-CoV-2 test cycle thresholds in the veteran population [published online ahead of print, 2021 Jul 28]. J Racial Ethn Health Disparities. 2021;1-8. doi:10.1007/s40615-021-01114-4
25. Infectious Diseases Society of America, Association for Molecular Pathology. IDSA and AMP joint statement on the use of SARS-CoV-2 PCR cycle threshold (Ct) values for clinical decision-making. Accessed August 28, 2021. https://www.idsociety.org/globalassets/idsa/public-health /covid-19/idsa-amp-statement.pdf
26. Wang J, Ng CY, Brook RH. Response to COVID-19 in Taiwan: big data analysis, new technology, and proactive testing. JAMA. 2020;323(14):1341-1342. doi:10.1001/jama.2020.3151
27. Centers for Disease Control and Prevention. Overview of testing for SARS-CoV-2, the virus that causes COVID- 19. Accessed July 28, 2021. https://www.cdc.gov /coronavirus/2019-ncov/hcp/testing-overview.html
28. Zuvekas SH, Taliaferro GS. Pathways to access: health insurance, the health care delivery system, and racial/ethnic disparities, 1996-1999. Health Aff. 2003;22(2):139-153. doi:10.1377/hlthaff.22.2.139
29. Egede LE. Race, ethnicity, culture, and disparities in health care. J Gen Intern Med. 2006;21(6):667-669. doi:10.1111/j.1525-1497.2006.0512.x
30. Institute of Medicine (US) Committee on Understanding and Eliminating Racial and Ethnic Disparities in Health Care. Smedley BD, Stith AY, Nelson AR, eds. Unequal treatment: confronting racial and ethnic disparities in health care. National Academies Press; 2003. doi:10.17226/12875
31. Ranney ML, Griffeth V, Jha AK. Critical supply shortages – the need for ventilators and personal protective equipment during the Covid-19 Pandemic. N Engl J Med. 2020;382(18):e41. doi:10.1056/NEJMp2006141
FDA authorizes COVID vaccines in kids as young as 6 months
, one of the final steps in a long-awaited authorization process to extend protection to the youngest of Americans.
The agency’s move comes after a closely watched FDA advisory group vote earlier this week, which resulted in a unanimous vote in favor of the FDA authorizing both vaccines in this age group.
“The FDA’s evaluation and analysis of the safety, effectiveness, and manufacturing data of these vaccines was rigorous and comprehensive, supporting the EUAs,” the agency said in a news release.
The data show that the “known and potential benefits” of the vaccines outweigh any potential risks, the agency said.
The Moderna vaccine is authorized as a two-dose primary series in children 6 months to 17 years of age. The Pfizer vaccine is now authorized as a three-dose primary series in children 6 months up to 4 years of age. Pfizer’s vaccine was already authorized in children 5 years old and older.
Now all eyes are on the Centers for Disease Control and Prevention, which is expected to decide on the final regulatory hurdle at a meeting June 18. The CDC’s Advisory Committee on Immunization Practices has scheduled a vote on whether to give the vaccines the green light.
If ACIP gives the OK, CDC Director Rochelle Walensky, MD, MPH, is expected to issue recommendations for use shortly thereafter.
Following these final regulatory steps, parents could start bringing their children to pediatricians, family doctors, or local pharmacies for vaccination as early as June 20.
A version of this article first appeared on WebMD.com.
Past COVID-19 infection could play role in childhood hepatitis
There may be a link between the recent unexplained cases of hepatitis in children and prior coronavirus infections, according to new research from Israel.
The study involves five children in Israel who had mild cases of COVID-19 who went on to develop hepatitis; two of these children required liver transplants. But clinicians are cautious about drawing conclusions from such a small study.
“All you can say is that these five cases seem to have proximity to COVID-19, and COVID-19 may be able to cause pediatric liver complications,” said Nancy Reau, MD, section chief of hepatology at Rush University in Chicago. She was not involved with the study.
While COVID-19 could be one explanation for these hepatitis cases, it is also possible that the two are unrelated, said William Balistreri, MD, director emeritus of the Pediatric Liver Care Center at Cincinnati Children’s Hospital Medical Center. He also is unaffiliated with the study.
Hepatitis is rare in children, and between 30% and 50% of these pediatric cases have no known cause, according to the CDC.
Since April 2022, children with hepatitis of an unexplained cause have garnered global attention. The United Kingdom now has 240 confirmed cases, the United States is investigating 290 cases, and Israel has reported 12 cases to the World Health Organization. Many investigators think that these liver problems could be related to adenovirus – a common infection in children that normally causes cold or flu-like symptoms – because more than half of global cases tested for the virus have been positive, according to the WHO. About 12% of children with unexplained hepatitis have tested positive for SARS-CoV-2, the virus that causes COVID-19, but investigators are considering the possibility that some cases may be related to prior infections.
The study documents five patients, 3-months to 13 years old, with prior coronavirus infection who later developed hepatitis. All were treated at Schneider Children’s Medical Hospital in Petah Tikva, Israel, during 2021. The paper was published in the Journal of Pediatric Gastroenterology and Nutrition. Two patients, a 3-month-old and 5-month-old, needed liver transplants. The other three patients (two 8-year-olds and a 13-year-old) were treated with steroids. None of the five children had received any vaccinations against COVID-19. The time between COVID-19 infection and liver problems ranged from 21 to 130 days.
“It took time to be convinced that this could be COVID-related,” said senior study author Orith Waisbourd-Zinman, MD, director of pediatric liver disease service at Schneider Children’s Medical Hospital. “It’s something that wasn’t described.”
Sudden-onset hepatitis after COVID-19 has been recorded in adults, and the virus has been associated with multisystem inflammatory syndrome in children (MIS-C). The condition causes inflammation through the body, including the heart, lungs, and kidneys.
“We know that COVID can be mischievous, and children are no more exempt from that than adults,” Dr. Reau said.
Liver samples taken from these five patients did not test positive for COVID-19, similar to how liver samples have tested negative for adenovirus in more recent hepatitis cases around the world. Dr. Waisbourd-Zinman suggested that in these patients, hepatitis may have been brought on by an inflammatory response that was triggered by the virus.
Still, there are notable differences between these five cases and current cases internationally. These five children became sick during the period of December 2020 to September 2021, whereas all current counted cases in the United Kingdom occurred after January 2022. The first cases in the United States took place in October 2021. It could be that there were similar hepatitis cases before that were not identified, Dr. Reau said.
The ages of the Israeli children with hepatitis also differ from the cases seen globally. More than three-fourths of these reported hepatitis cases occurred in children under 5, the WHO reports, though affected individuals have been as young as 1-month-old up to 16 years old. In the United Kingdom, which accounts for about a third of cases reported to the WHO, most children with unexplained hepatitis have been between 3 and 5 years old.
More research is needed to tease out any relationship between prior COVID-19 infection and liver inflammation, Dr. Balistreri said.
“I’m not sure what to make of any of it yet. We know that SARS-CoV-2 can alter immune responses ... so it wouldn’t surprise me,” if COVID-19 and these hepatitis cases were linked, he said. “It’s just that we need more information.”
A version of this article first appeared on WebMD.com.
Diabetes tied to risk of long COVID, too
Individuals with diabetes who experience COVID-19 are at increased risk for long COVID compared to individuals without diabetes, according to data from a literature review of seven studies.
Diabetes remains a risk factor for severe COVID-19, but whether it is a risk factor for postacute sequelae of COVID-19 (PASC), also known as long COVID, remains unclear, Jessica L. Harding, PhD, of Emory University, said in a late-breaking poster session at the annual scientific sessions of the American Diabetes Association.
Long COVID is generally defined as “sequelae that extend beyond the 4 weeks after initial infection” and may include a range of symptoms that affect multiple organs, Dr. Harding said. A study conducted in January of 2022 suggested that type 2 diabetes was one of several strong risk factors for long COVID, she noted.
Dr. Harding and colleagues reviewed data from seven studies published from Jan. 1, 2020, to Jan. 27, 2022, on the risk of PASC in people with and without diabetes. The studies included patients with a minimum of 4 weeks’ follow-up after COVID-19 diagnosis. All seven studies had a longitudinal cohort design, and included adults from high-income countries, with study populations ranging from 104 to 4,182.
Across the studies, long COVID definitions varied, but included ongoing symptoms of fatigue, cough, and dyspnea, with follow-up periods of 4 weeks to 7 months.
Overall, three of the seven studies indicated that diabetes was a risk factor for long COVID (odds ratio [OR] greater than 4 for all) and four studies indicated that diabetes was not a risk factor for long COVID (OR, 0.5-2.2).
One of the three studies showing increased risk included 2,334 individuals hospitalized with COVID-19; of these about 5% had diabetes. The odds ratio for PASC for individuals with diabetes was 4.18. In another study of 209 persons with COVID-19, of whom 22% had diabetes, diabetes was significantly correlated with respiratory viral disease (meaning at least two respiratory symptoms). The third study showing an increased risk of long COVID in diabetes patients included 104 kidney transplant patients, of whom 20% had diabetes; the odds ratio for PASC was 4.42.
The findings were limited by several factors, including the relatively small number of studies and the heterogeneity of studies regarding definitions of long COVID, specific populations at risk, follow-up times, and risk adjustment, Dr. Harding noted.
More high-quality studies across multiple populations and settings are needed to determine if diabetes is indeed a risk factor for long COVID, she said.
In the meantime, “careful monitoring of people with diabetes for development of PASC may be advised,” Dr. Harding concluded.
Findings support need for screening
“Given the devastating impact of COVID on people with diabetes, it’s important to know what data has been accumulated on long COVID for future research and discoveries in this area,” Robert A. Gabbay, MD, chief science and medical officer for the American Diabetes Association, said in an interview. “The more information we have, the better we can understand the implications.”

Dr. Gabbay said he was surprised by the current study findings. “We know very little on this subject, so yes, I am surprised to see just how significant the risk of long COVID for people with diabetes seems to be, but clearly, more research needs to be done to understand long COVID,” he emphasized.
The take-home message for clinicians is the importance of screening patients for PASC; also “ask your patients if they had COVID, to better understand any symptoms they might have that could be related to PACS,” he noted.
“It is crucial that we confirm these results and then look at risk factors in people with diabetes that might explain who is at highest risk and ultimately understand the causes and potential cure,” Dr. Gabbay added.
The study was supported by the National Heart, Lung, and Blood Institute. Dr. Harding and Dr. Gabbay had no financial conflicts to disclose.
Individuals with diabetes who experience COVID-19 are at increased risk for long COVID compared to individuals without diabetes, according to data from a literature review of seven studies.
Diabetes remains a risk factor for severe COVID-19, but whether it is a risk factor for postacute sequelae of COVID-19 (PASC), also known as long COVID, remains unclear, Jessica L. Harding, PhD, of Emory University, said in a late-breaking poster session at the annual scientific sessions of the American Diabetes Association.
Long COVID is generally defined as “sequelae that extend beyond the 4 weeks after initial infection” and may include a range of symptoms that affect multiple organs, Dr. Harding said. A study conducted in January of 2022 suggested that type 2 diabetes was one of several strong risk factors for long COVID, she noted.
Dr. Harding and colleagues reviewed data from seven studies published from Jan. 1, 2020, to Jan. 27, 2022, on the risk of PASC in people with and without diabetes. The studies included patients with a minimum of 4 weeks’ follow-up after COVID-19 diagnosis. All seven studies had a longitudinal cohort design, and included adults from high-income countries, with study populations ranging from 104 to 4,182.
Across the studies, long COVID definitions varied, but included ongoing symptoms of fatigue, cough, and dyspnea, with follow-up periods of 4 weeks to 7 months.
Overall, three of the seven studies indicated that diabetes was a risk factor for long COVID (odds ratio [OR] greater than 4 for all) and four studies indicated that diabetes was not a risk factor for long COVID (OR, 0.5-2.2).
One of the three studies showing increased risk included 2,334 individuals hospitalized with COVID-19; of these about 5% had diabetes. The odds ratio for PASC for individuals with diabetes was 4.18. In another study of 209 persons with COVID-19, of whom 22% had diabetes, diabetes was significantly correlated with respiratory viral disease (meaning at least two respiratory symptoms). The third study showing an increased risk of long COVID in diabetes patients included 104 kidney transplant patients, of whom 20% had diabetes; the odds ratio for PASC was 4.42.
The findings were limited by several factors, including the relatively small number of studies and the heterogeneity of studies regarding definitions of long COVID, specific populations at risk, follow-up times, and risk adjustment, Dr. Harding noted.
More high-quality studies across multiple populations and settings are needed to determine if diabetes is indeed a risk factor for long COVID, she said.
In the meantime, “careful monitoring of people with diabetes for development of PASC may be advised,” Dr. Harding concluded.
Findings support need for screening
“Given the devastating impact of COVID on people with diabetes, it’s important to know what data has been accumulated on long COVID for future research and discoveries in this area,” Robert A. Gabbay, MD, chief science and medical officer for the American Diabetes Association, said in an interview. “The more information we have, the better we can understand the implications.”
Dr. Gabbay said he was surprised by the current study findings. “We know very little on this subject, so yes, I am surprised to see just how significant the risk of long COVID for people with diabetes seems to be, but clearly, more research needs to be done to understand long COVID,” he emphasized.
The take-home message for clinicians is the importance of screening patients for PASC; also “ask your patients if they had COVID, to better understand any symptoms they might have that could be related to PACS,” he noted.
“It is crucial that we confirm these results and then look at risk factors in people with diabetes that might explain who is at highest risk and ultimately understand the causes and potential cure,” Dr. Gabbay added.
The study was supported by the National Heart, Lung, and Blood Institute. Dr. Harding and Dr. Gabbay had no financial conflicts to disclose.
FROM ADA 2022
Blood test aims to measure COVID immunity
Scientists created a test that indirectly measures T-cell response – an important, long-term component of immunity that can last long after antibody levels fall off – to a challenge by the virus in whole blood.
The test mimics what can be done in a formal laboratory now but avoids some complicated steps and specialized training for lab personnel. This test, researchers said, is faster, can scale up to test many more people, and can be adapted to detect viral mutations as they emerge in the future.
The study explaining how all this works was published online in Nature Biotechnology.
The test, called dqTACT, could help predict the likelihood of “breakthrough” infections in people who are fully vaccinated and could help determine how frequently people who are immunocompromised might need to be revaccinated, the authors noted.
Infection with the coronavirus and other viruses can trigger a one-two punch from the immunity system – a fast antibody response followed by longer-lasting cellular immunity, including T cells, which “remember” the virus. Cellular immunity can trigger a quick response if the same virus ever shows up again.
The new test adds synthetic viral peptides – strings of amino acids that make up proteins – from the coronavirus to a blood sample. If there is no T-cell reaction within 24 hours, the test is negative. If the peptides trigger T cells, the test can measure the strength of the immune response.
The researchers validated the new test against traditional laboratory testing in 91 people, about half of whom never had COVID-19 and another half who were infected and recovered. The results matched well.
They also found the test predicted immune strength up to 8 months following a second dose of COVID-19 vaccine. Furthermore, T-cell response was greater among people who received two doses of a vaccine versus others who received only one immunization.
Studies are ongoing and designed to meet authorization requirements as part of future licensing from the Food and Drug Administration.
A version of this article first appeared on WebMD.com.
FROM NATURE BIOTECHNOLOGY
FDA panel votes unanimously for COVID shots for youngest kids
Federal advisers to the U.S. Food and Drug Administration voted unanimously June 15 to recommend the use of the Moderna and Pfizer-BioNTech COVID-19 vaccines in infants and young children.
The Vaccines and Related Biological Products Advisory Committee (VRBPAC) of the FDA voted 21-0 to say that benefits of a two-dose series of Moderna’s mRNA vaccine outweigh risk for use in infants and children 6 months through 5 years of age.
The panel then voted 21-0 to say that benefits of a three-dose series of the Pfizer-BioNTech mRNA vaccine outweigh risk for use in infants and children 6 months through 4 years of age.
The FDA is not bound to follow the suggestions of its advisory committees, but it often does. Moderna and Pfizer are seeking to expand emergency use authorization (EUA) for their vaccines. EUAs are special clearances used to allow use of products in connection with public health crises such as the pandemic.
The Pfizer vaccine has standard, nonemergency FDA approval for use in people 16 years of age and older. The FDA also has granted EUA clearance for use of the shot in people ages 5 to 15.
The VRBPAC on June 15 recommended granting EUA clearance for Moderna’s COVID-19 vaccine for people ages 6 to 17. The Moderna vaccine already has full approval for use in people 18 years of age and older.
Many parents have been waiting for a clearance of COVID vaccines for their infants and young children, seeking protection for them at a time of continued spread of the virus.
The White House on June 9 outlined plans for making 10 million doses of COVID vaccines available for children under the age of 5 in the coming weeks.
The Centers for Disease Control and Prevention (CDC) has scheduled a June 18 meeting of its Advisory Committee on Immunization Practices, where members of that panel will vote on recommendations about use of the Moderna and Pfizer-BioNTech vaccines in infants and young children. The last step in the approval process to get shots into arms will be endorsement by the CDC director if the committee votes in favor of the vaccines.
For and against
During the public session during the June 15 FDA meeting, speakers offered varied opinions.
Some urged the panel to vote against the EUA expansion, citing concerns about risks of COVID vaccines in general.
But at the close of the meeting, top FDA vaccine official Peter Marks, MD, PhD, urged the public to be cautious about drawing conclusions from reading incident reports of side effects.
He said he has seen a “Twitter storm” during the day about claims of side effects. but stressed that the FDA has reported to the public on the rare side effects linked to the COVID vaccines, such as myocarditis, with advisories based on a review of reports of side effects. But many of these reports, gathered from the Vaccine Adverse Event Reporting System (VAERS) system, will turn out on further inspection not to be related to vaccination.
Many other speakers urged members of the panel to support expanded use of the vaccines for infants and young children. These speakers emphasized how lack of a vaccine to date has isolated young children who remain unprotected, even with about 83% of those age 5 and older in the United States having received at least one COVID shot.
Dr. Marks noted that there have been 442 deaths from COVID among children under 4 years of age during the pandemic, a number that he compared with the 78 deaths reported in the H1N1 flu. He urged the panel “to be careful that we don’t become numb to the number of pediatric deaths because of the overwhelming number of older deaths here.”
Panelist H. Cody Meissner, MD, a pediatric infectious disease specialist from Tufts University, said the vaccine should be made available -- particularly for children considered to be at high risk for complications from COVID --but health officials need to present a clear picture of the relatively low risks to children of harm from the vaccines-- and from COVID.
“That has to be communicated clearly to parents so that they can participate in the decision about vaccinating a child in this age group,” Dr. Meissner said.
The results presented June 15 from studies of the shots in younger children were less impressive than those from the initial COVID vaccine trials done in adults. This was not a surprise to panelists given the rise of the omicron variant and the evolution of the pandemic, but it still led to comments about the need for further continued study of the vaccines in young children even if they are authorized.
Consider that in 2020, Pfizer won the first EUA for a COVID vaccine of any kind with data that pegged the shot’s efficacy rate at 95%. Statisticians estimated a likely possible range, or 95% confidence interval, for the vaccine efficacy rate at 90.3% to 97.6%.
Those estimates were based on finding eight cases of COVID reported among 18,198 study participants who got the Pfizer-BioNTech shot, compared with 162 cases among the 18,325 people in the placebo group, according to the FDA review of Pifzer’s initial application.
Study data
But on June 15, FDA advisers had to consider an EUA application for which the data did not make as strong a case for the vaccine’s benefit among younger patients.
Pfizer presented what the FDA called a “preliminary descriptive analysis” of vaccine efficacy among participants in Study C4591007 who received three study vaccinations, following accrual of 10 total confirmed COVID-19 cases occurring at least 7 days after the third dose.
Looking at results for study participants ages 6 to 23 months of age, there was one case in the group that got the Pfizer-BioNTech shot and two in the placebo group, pegged as a 75.6% vaccine efficacy rate -- but one with caveats to the small numbers of cases. The 95% confidence interval for this vaccine efficacy rate was reported as-369.1% to 99.6% according to the FDA staff review.
For participants 2-4 years of age with and without evidence of prior SARS-CoV-
2 infection, there were two cases in the group that got the shot and five in the placebo group showing a vaccine efficacy rate of 82.4%, with a 95% confidence interval estimated ranging between -7.6% and 98.3%. For the combined analysis of both age groups, the efficacy rate was estimated at 80.4%, with a 95% confidence interval of 14.1% and 96.7%.
Doran Fink, MD, PhD, a top official in the FDA’s vaccines division, noted that the current EUA application for expanded pediatric use involved “some very preliminary” results that involved “a small number of cases and limited follow up time.”
But he stressed that the evidence gathered to date for the Pifzer application for use of its COVID shot in infants and young children met the threshold for conditional clearance during a crisis.
“We do feel very confident that the evidentiary standard for benefit for an EUA has been met here,” but added that more data would be needed to address questions about the efficacy of the vaccine beyond a third dose and whether an additional dose may be needed.
Pfizer also used a comparison known as “immunobridging” in support of the application. This looked at SARS- CoV-2 50% neutralizing antibody titers for the children in the age group covered by the EUA application and compared them to a randomly selected subset of 16-25-year-old participants in another study,
Key data for the pending Moderna EUA for use of its shot in infants and young children came from study P204. In it, Moderna found 51 cases of COVID among 1,511 children ages 6 months to 23 months who got the vaccines, versus 34 cases among 513 children who received a placebo, according to an FDA staff review.
That resulted in a vaccine efficacy rate pegged at 50.6%, with a 95% confidence interval of 21.4% to 68.6%.
Looking at the children ages 2 to 5 years in the P204 study, there were 119 cases out of 2,594 participants who got the shot, versus 61 cases of 858 in the placebo arm, or 7.1%. That translated to a 36.8% vaccine efficacy rate, with a confidence interval 12.5% to 54.0%.
Panelist Jay Portnoy, MD, of Children’s Mercy Hospital in Kansas City said all of the pediatricians he knows are waiting for the FDA to authorize the new uses of these vaccines in infants and young children.
“The death rate from COVID in young children may not be extremely high, but it’s absolutely terrifying to parents to have their child be sick, have to go to the hospital or even go to the emergency room or their primary care doctor because they’re sick and having trouble breathing,” said Dr. Portnoy, who served as the panel’s consumer representative.
A version of this article first appeared on WebMD.com.
This article was updated on 6/16/22.