User login
Study links GLP-1R agonists, lower inflammatory biomarker levels
Patients with both type 2 diabetes and asthma who were on glucagonlike peptide receptor–1 (GLP-1R) agonists for glucose control had lower levels of a key biomarker of airway inflammation than similar patients on other types of glucose-control medications, according to results of a study to have been presented at the annual meeting of the American Academy of Asthma, Allergy, and Immunology. The AAAAI canceled their annual meeting and provided abstracts and access to presenters for press coverage.

The findings from this study potentially replicated findings in humans that have been reported in preclinical trials.
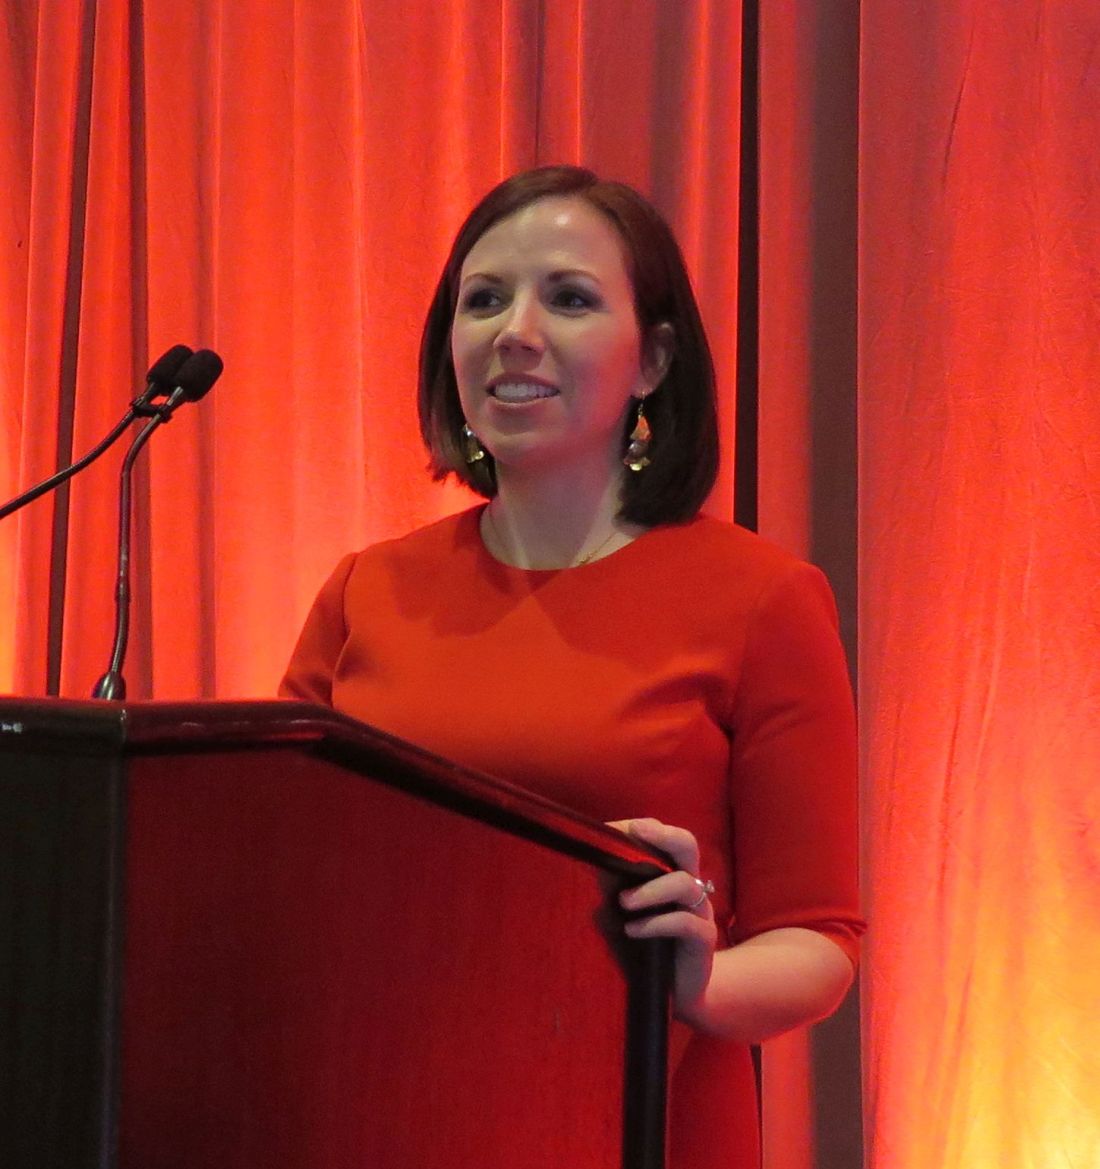
“Our work showed that type 2 diabetics with asthma who were treated with GLP-1 receptor agonists had lower levels of periostin, and this provides really one of the first human data to show that these drugs may impact key inflammation pathways in the airway,” Dinah Foer, MD, of Brigham and Women’s Hospital, Boston, said in an interview. She described periostin as “a known critical inducer of airway mucous production and airway responsiveness.”
The study retrospectively evaluated serum samples from the Partners HealthCare Biobank of 161 adults with both asthma and type 2 diabetes, 42 of whom were on GLP-1R agonists and 119 of whom were taking non-GLP-1R agonist diabetes medications. The study used the Partners Healthcare EHR to identify eligible patients.
The study found that periostin levels were significantly decreased in GLP-1R agonist users: 19.1 ng/mL (standard deviation, +8.7) versus 27.4 ng/mL (SD, +14) in the non-GLP-1R agonist group (P = .001), Dr. Foer said. The other known mediators of asthma inflammatory pathways that were measured – interleukin-6, IL-8, sCD163, total IgE, and sST2 (soluble suppression of tumorigenesis–2) – showed no differences between the two groups, Dr. Foer said.
She said that this was the first human study to show similar results to preclinical models of asthma pathways. “What was interesting to us was that our findings were robust even when we controlled for covariates,” she added.
These findings lay the groundwork for further research into the potential therapeutic role GLP-1R agonists in asthma, Dr. Foer said. “This supports using periostin as a biomarker for novel therapeutic use of GLP-1R [agonists] in asthma,” she said. “At this point further study is needed to understand the clinical impact of GPL-1R [agonists] in asthma both for patients with type 2 diabetes and potentially in the future for patients who don’t have type 2 diabetes or metabolic disease.”
She added: “I don’t think we’re there yet; this is just one foot forward.”
The next step for researchers involves analyzing outcomes in asthmatics with type 2 diabetes on GLP-1R agonist therapy using a larger sample size as well as patients with asthma and metabolic disease, Dr. Foer said. The goal would be to identify corresponding biomarkers.
“There’s a terrific conversation in the field about the relationships between metabolism and asthma,” she said. “What our data contributes to that is, it suggests a role for metabolic pathways, specifically as it’s related GLP-1R [agonist] signaling pathways in regulating airway inflammation.”
Mark Moss, MD, associate professor of allergy & immunology at the University of Wisconsin–Madison, who was to serve as the moderator of the session, was positive about the GLP-1R agonist findings. He said in an interview: “This is promising research that provides a possible new target for the treatment of asthma.”
Dr. Foer disclosed that she has no relevant financial relationships.
SOURCE: Foer D et al. AAAAI Session 462, Abstract 784.
Patients with both type 2 diabetes and asthma who were on glucagonlike peptide receptor–1 (GLP-1R) agonists for glucose control had lower levels of a key biomarker of airway inflammation than similar patients on other types of glucose-control medications, according to results of a study to have been presented at the annual meeting of the American Academy of Asthma, Allergy, and Immunology. The AAAAI canceled their annual meeting and provided abstracts and access to presenters for press coverage.
The findings from this study potentially replicated findings in humans that have been reported in preclinical trials.
“Our work showed that type 2 diabetics with asthma who were treated with GLP-1 receptor agonists had lower levels of periostin, and this provides really one of the first human data to show that these drugs may impact key inflammation pathways in the airway,” Dinah Foer, MD, of Brigham and Women’s Hospital, Boston, said in an interview. She described periostin as “a known critical inducer of airway mucous production and airway responsiveness.”
The study retrospectively evaluated serum samples from the Partners HealthCare Biobank of 161 adults with both asthma and type 2 diabetes, 42 of whom were on GLP-1R agonists and 119 of whom were taking non-GLP-1R agonist diabetes medications. The study used the Partners Healthcare EHR to identify eligible patients.
The study found that periostin levels were significantly decreased in GLP-1R agonist users: 19.1 ng/mL (standard deviation, +8.7) versus 27.4 ng/mL (SD, +14) in the non-GLP-1R agonist group (P = .001), Dr. Foer said. The other known mediators of asthma inflammatory pathways that were measured – interleukin-6, IL-8, sCD163, total IgE, and sST2 (soluble suppression of tumorigenesis–2) – showed no differences between the two groups, Dr. Foer said.
She said that this was the first human study to show similar results to preclinical models of asthma pathways. “What was interesting to us was that our findings were robust even when we controlled for covariates,” she added.
These findings lay the groundwork for further research into the potential therapeutic role GLP-1R agonists in asthma, Dr. Foer said. “This supports using periostin as a biomarker for novel therapeutic use of GLP-1R [agonists] in asthma,” she said. “At this point further study is needed to understand the clinical impact of GPL-1R [agonists] in asthma both for patients with type 2 diabetes and potentially in the future for patients who don’t have type 2 diabetes or metabolic disease.”
She added: “I don’t think we’re there yet; this is just one foot forward.”
The next step for researchers involves analyzing outcomes in asthmatics with type 2 diabetes on GLP-1R agonist therapy using a larger sample size as well as patients with asthma and metabolic disease, Dr. Foer said. The goal would be to identify corresponding biomarkers.
“There’s a terrific conversation in the field about the relationships between metabolism and asthma,” she said. “What our data contributes to that is, it suggests a role for metabolic pathways, specifically as it’s related GLP-1R [agonist] signaling pathways in regulating airway inflammation.”
Mark Moss, MD, associate professor of allergy & immunology at the University of Wisconsin–Madison, who was to serve as the moderator of the session, was positive about the GLP-1R agonist findings. He said in an interview: “This is promising research that provides a possible new target for the treatment of asthma.”
Dr. Foer disclosed that she has no relevant financial relationships.
SOURCE: Foer D et al. AAAAI Session 462, Abstract 784.
Treating COVID-19 in patients with diabetes
Patients with diabetes may be at extra risk for coronavirus disease (COVID-19) mortality, and doctors treating them need to keep up with the latest guidelines and expert advice.
Most health advisories about COVID-19 mention diabetes as one of the high-risk categories for the disease, likely because early data coming out of China, where the disease was first reported, indicated an elevated case-fatality rate for COVID-19 patients who also had diabetes.
In an article published in JAMA, Zunyou Wu, MD, and Jennifer M. McGoogan, PhD, summarized the findings from a February report on 44,672 confirmed cases of the disease from the Chinese Center for Disease Control and Prevention. The overall case-fatality rate (CFR) at that stage was 2.3% (1,023 deaths of the 44,672 confirmed cases). The data indicated that the CFR was elevated among COVID-19 patients with preexisting comorbid conditions, specifically, cardiovascular disease (CFR, 10.5%), diabetes (7.3%), chronic respiratory disease (6.3%), hypertension (6%), and cancer (5.6%).
The data also showed an aged-related trend in the CFR, with patients aged 80 years or older having a CFR of 14.8% and those aged 70-79 years, a rate of 8.0%, while there were no fatal cases reported in patients aged 9 years or younger (JAMA. 2020 Feb 24. doi: 10.1001/jama.2020.2648).
Those findings have been echoed by the U.S. Centers of Disease Control and Prevention. The American Diabetes Association and the American Association of Clinical Endocrinologists have in turn referenced the CDC in their COVID-19 guidance recommendations for patients with diabetes.
Guidelines were already in place for treatment of infections in patients with diabetes, and
In general, patients with diabetes – especially those whose disease is not controlled, or not well controlled – can be more susceptible to more common infections, such as influenza and pneumonia, possibly because hyperglycemia can subdue immunity by disrupting function of the white blood cells.
Glucose control is key
An important factor in any form of infection control in patients with diabetes seems to be whether or not a patient’s glucose levels are well controlled, according to comments from members of the editorial advisory board for Clinical Endocrinology News. Good glucose control, therefore, could be instrumental in reducing both the risk for and severity of infection.

Paul Jellinger, MD, of the Center for Diabetes & Endocrine Care, Hollywood, Fla., said that, over the years, he had not observed higher infection rates in general in patients with hemoglobin A1c levels below 7, or even higher. However, “a bigger question for me, given the broad category of ‘diabetes’ listed as a risk for serious coronavirus complications by the CDC, has been: Just which individuals with diabetes are really at risk? Are patients with well-controlled diabetes at increased risk as much as those with significant hyperglycemia and uncontrolled diabetes? In my view, not likely.”
Alan Jay Cohen, MD, agreed with Dr. Jellinger. “Many patients have called the office in the last 10 days to ask if there are special precautions they should take because they are reading that they are in the high-risk group because they have diabetes. Many of them are in superb, or at least pretty good, control. I have not seen where they have had a higher incidence of infection than the general population, and I have not seen data with COVID-19 that specifically demonstrates that a person with diabetes in good control has an increased risk,” he said.

“My recommendations to these patients have been the same as those given to the general population,” added Dr. Cohen, medical director at Baptist Medical Group: The Endocrine Clinic, Memphis.
Herbert I. Rettinger, MD, also conceded that poorly controlled blood sugars and confounding illnesses, such as renal and cardiac conditions, are common in patients with long-standing diabetes, but “there is a huge population of patients with type 1 diabetes, and very few seem to be more susceptible to infection. Perhaps I am missing those with poor diet and glucose control.”
Philip Levy, MD, picked up on that latter point, emphasizing that “endocrinologists take care of fewer patients with diabetes than do primary care physicians. Most patients with type 2 diabetes are not seen by us unless the PCP has problems [treating them],” so it could be that PCPs may see a higher number of patients who are at a greater risk for infections.
Ultimately, “good glucose control is very helpful in avoiding infections,” said Dr. Levy, of the Banner University Medical Group Endocrinology & Diabetes, Phoenix.
For sick patients
Guidelines for patients at the Joslin Diabetes Center in Boston advise patients who are feeling sick to continue taking their diabetes medications, unless instructed otherwise by their providers, and to monitor their glucose more frequently because it can spike suddenly.
Patients with type 1 diabetes should check for ketones if their glucose passes 250 mg/dL, according to the guidelines, and patients should remain hydrated at all times and get plenty of rest.
“Sick-day guidelines definitely apply, but patients should be advised to get tested if they have any symptoms they are concerned about,” said Dr. Rettinger, of the Endocrinology Medical Group of Orange County, Orange, Calif.
If patients with diabetes develop COVID-19, then home management may still be possible, according to Ritesh Gupta, MD, of Fortis C-DOC Hospital, New Delhi, and colleagues (Diabetes Metab Syndr. 2020 Mar 10;14[3]:211-2. doi: 10.1016/j.dsx.2020.03.002).
Dr. Rettinger agreed, noting that home management would be feasible as long as “everything is going well, that is, the patient is not experiencing respiratory problems or difficulties in controlling glucose levels. Consider patients with type 1 diabetes who have COVID-19 as you would a nursing home patient – ever vigilant.”
Dr. Gupta and coauthors also recommended basic treatment measures such as maintaining hydration and managing symptoms with acetaminophen and steam inhalation, and home isolation for 14 days or until the symptoms resolve. However, the ADA warns in its guidelines that patients should “be aware that some constant glucose monitoring sensors (Dexcom G5, Medtronic Enlite, and Guardian) are impacted by acetaminophen (Tylenol), and that patients should check with finger sticks to ensure accuracy [if they are taking acetaminophen].”
In the event of hyperglycemia with fever in patients with type 1 diabetes, blood glucose and urinary ketones should be monitored often, the authors wrote, cautioning that “frequent changes in dosage and correctional bolus may be required to maintain normoglycemia.” Dr Rettinger emphasized that “hyperglycemia, as always, is best treated with fluids and insulin and frequent checks of sugars to be sure the treatment regimen is successful.”
In regard to diabetic drug regimens, patients with type 1 or 2 disease should continue on their current medications, advised Yehuda Handelsman, MD. “Some, especially those on insulin, may require more of it. And the patient should increase fluid intake to prevent fluid depletion. We do not reduce antihyperglycemic medication to preserve fluids.

“As for hypoglycemia, we always aim for less to no hypoglycemia,” he continued. “Monitoring glucose and appropriate dosage is the way to go. In other words, do not reduce medications in sick patients who typically need more medication.”
Dr. Handelsman, medical director and principal investigator at Metabolic Institute of America, Tarzana, Calif., added that very sick patients who are hospitalized should be managed with insulin and that oral agents – particularly metformin and sodium-glucose transporter 2 inhibitors – should be stopped.
“Once the patient has recovered and stabilized, you can return to the prior regimen, and, even if the patient is still in hospital, noninsulin therapy can be reintroduced,” he said.
“This is standard procedure in very sick patients, especially those in critical care. Metformin may raise lactic acid levels, and the SGLT2 inhibitors cause volume contraction, fat metabolism, and acidosis,” he explained. “We also stop the glucagon-like peptide receptor–1 analogues, which can cause nausea and vomiting, and pioglitazone because it causes fluid overload.
“Only insulin can be used for acutely sick patients – those with sepsis, for example. The same would apply if they have severe breathing disorders, and definitely, if they are on a ventilator. This is also the time we stop aromatase inhibitor orals and we use insulin.”
Preventive measures
In the interest of maintaining good glucose control, patients also should monitor their glucose levels more frequently so that fluctuations can be detected early and quickly addressed with the appropriate medication adjustments, according to guidelines from the ADA and AACE. They should continue to follow a healthy diet that includes adequate protein and they should exercise regularly.
Patients should ensure that they have enough medication and testing supplies – for at least 14 days, and longer, if costs permit – in case they have to go into quarantine.
General preventive measures, such as frequent hand washing with soap and water, practicing good respiratory hygiene by sneezing or coughing into a facial tissue or bent elbow, also apply for reducing the risk of infection. Touching of the face should be avoided, as should nonessential travel and contact with infected individuals.
Patients with diabetes should always be current with their influenza and pneumonia shots.
Dr. Rettinger said that he always recommends the following preventative measures to his patients and he is using the current health crisis to reinforce them:
- Eat lots of multicolored fruits and vegetables.
- Eat yogurt and take probiotics to keep the intestinal biome strong and functional.
- Be extra vigilant regarding sugars and sugar control to avoid peaks and valleys wherever possible.
- Keep the immune system strong with at least 7-8 hours sleep and reduce stress levels whenever possible.
- Avoid crowds and handshaking.
- Wash hands regularly.
Possible therapies
There are currently no drugs that have been approved specifically for the treatment of COVID-19, although a vaccine against the disease is currently under development.
Dr. Gupta and his colleagues noted in their article that there have been reports of the anecdotal use of antiviral drugs such as lopinavir, ritonavir, interferon-beta, the RNA polymerase inhibitor remdesivir, and chloroquine.
However, Dr. Handelsman said that, as far as he knows, none of these drugs has been shown to be beneficial for COVID-19. “Some [providers] have tried Tamiflu, but with no clear outcomes, and for severely sick patients, they tried medications for anti-HIV, hepatitis C, and malaria, but so far, there has been no breakthrough.”
Dr. Cohen, Dr. Handelsman, Dr. Jellinger, Dr. Levy, and Dr. Rettinger are members of the editorial advisory board of Clinical Endocrinology News. Dr. Gupta and Dr. Wu, and their colleagues, reported no conflicts of interest.
Patients with diabetes may be at extra risk for coronavirus disease (COVID-19) mortality, and doctors treating them need to keep up with the latest guidelines and expert advice.
Most health advisories about COVID-19 mention diabetes as one of the high-risk categories for the disease, likely because early data coming out of China, where the disease was first reported, indicated an elevated case-fatality rate for COVID-19 patients who also had diabetes.
In an article published in JAMA, Zunyou Wu, MD, and Jennifer M. McGoogan, PhD, summarized the findings from a February report on 44,672 confirmed cases of the disease from the Chinese Center for Disease Control and Prevention. The overall case-fatality rate (CFR) at that stage was 2.3% (1,023 deaths of the 44,672 confirmed cases). The data indicated that the CFR was elevated among COVID-19 patients with preexisting comorbid conditions, specifically, cardiovascular disease (CFR, 10.5%), diabetes (7.3%), chronic respiratory disease (6.3%), hypertension (6%), and cancer (5.6%).
The data also showed an aged-related trend in the CFR, with patients aged 80 years or older having a CFR of 14.8% and those aged 70-79 years, a rate of 8.0%, while there were no fatal cases reported in patients aged 9 years or younger (JAMA. 2020 Feb 24. doi: 10.1001/jama.2020.2648).
Those findings have been echoed by the U.S. Centers of Disease Control and Prevention. The American Diabetes Association and the American Association of Clinical Endocrinologists have in turn referenced the CDC in their COVID-19 guidance recommendations for patients with diabetes.
Guidelines were already in place for treatment of infections in patients with diabetes, and
In general, patients with diabetes – especially those whose disease is not controlled, or not well controlled – can be more susceptible to more common infections, such as influenza and pneumonia, possibly because hyperglycemia can subdue immunity by disrupting function of the white blood cells.
Glucose control is key
An important factor in any form of infection control in patients with diabetes seems to be whether or not a patient’s glucose levels are well controlled, according to comments from members of the editorial advisory board for Clinical Endocrinology News. Good glucose control, therefore, could be instrumental in reducing both the risk for and severity of infection.
Paul Jellinger, MD, of the Center for Diabetes & Endocrine Care, Hollywood, Fla., said that, over the years, he had not observed higher infection rates in general in patients with hemoglobin A1c levels below 7, or even higher. However, “a bigger question for me, given the broad category of ‘diabetes’ listed as a risk for serious coronavirus complications by the CDC, has been: Just which individuals with diabetes are really at risk? Are patients with well-controlled diabetes at increased risk as much as those with significant hyperglycemia and uncontrolled diabetes? In my view, not likely.”
Alan Jay Cohen, MD, agreed with Dr. Jellinger. “Many patients have called the office in the last 10 days to ask if there are special precautions they should take because they are reading that they are in the high-risk group because they have diabetes. Many of them are in superb, or at least pretty good, control. I have not seen where they have had a higher incidence of infection than the general population, and I have not seen data with COVID-19 that specifically demonstrates that a person with diabetes in good control has an increased risk,” he said.
“My recommendations to these patients have been the same as those given to the general population,” added Dr. Cohen, medical director at Baptist Medical Group: The Endocrine Clinic, Memphis.
Herbert I. Rettinger, MD, also conceded that poorly controlled blood sugars and confounding illnesses, such as renal and cardiac conditions, are common in patients with long-standing diabetes, but “there is a huge population of patients with type 1 diabetes, and very few seem to be more susceptible to infection. Perhaps I am missing those with poor diet and glucose control.”
Philip Levy, MD, picked up on that latter point, emphasizing that “endocrinologists take care of fewer patients with diabetes than do primary care physicians. Most patients with type 2 diabetes are not seen by us unless the PCP has problems [treating them],” so it could be that PCPs may see a higher number of patients who are at a greater risk for infections.
Ultimately, “good glucose control is very helpful in avoiding infections,” said Dr. Levy, of the Banner University Medical Group Endocrinology & Diabetes, Phoenix.
For sick patients
Guidelines for patients at the Joslin Diabetes Center in Boston advise patients who are feeling sick to continue taking their diabetes medications, unless instructed otherwise by their providers, and to monitor their glucose more frequently because it can spike suddenly.
Patients with type 1 diabetes should check for ketones if their glucose passes 250 mg/dL, according to the guidelines, and patients should remain hydrated at all times and get plenty of rest.
“Sick-day guidelines definitely apply, but patients should be advised to get tested if they have any symptoms they are concerned about,” said Dr. Rettinger, of the Endocrinology Medical Group of Orange County, Orange, Calif.
If patients with diabetes develop COVID-19, then home management may still be possible, according to Ritesh Gupta, MD, of Fortis C-DOC Hospital, New Delhi, and colleagues (Diabetes Metab Syndr. 2020 Mar 10;14[3]:211-2. doi: 10.1016/j.dsx.2020.03.002).
Dr. Rettinger agreed, noting that home management would be feasible as long as “everything is going well, that is, the patient is not experiencing respiratory problems or difficulties in controlling glucose levels. Consider patients with type 1 diabetes who have COVID-19 as you would a nursing home patient – ever vigilant.”
Dr. Gupta and coauthors also recommended basic treatment measures such as maintaining hydration and managing symptoms with acetaminophen and steam inhalation, and home isolation for 14 days or until the symptoms resolve. However, the ADA warns in its guidelines that patients should “be aware that some constant glucose monitoring sensors (Dexcom G5, Medtronic Enlite, and Guardian) are impacted by acetaminophen (Tylenol), and that patients should check with finger sticks to ensure accuracy [if they are taking acetaminophen].”
In the event of hyperglycemia with fever in patients with type 1 diabetes, blood glucose and urinary ketones should be monitored often, the authors wrote, cautioning that “frequent changes in dosage and correctional bolus may be required to maintain normoglycemia.” Dr Rettinger emphasized that “hyperglycemia, as always, is best treated with fluids and insulin and frequent checks of sugars to be sure the treatment regimen is successful.”
In regard to diabetic drug regimens, patients with type 1 or 2 disease should continue on their current medications, advised Yehuda Handelsman, MD. “Some, especially those on insulin, may require more of it. And the patient should increase fluid intake to prevent fluid depletion. We do not reduce antihyperglycemic medication to preserve fluids.
“As for hypoglycemia, we always aim for less to no hypoglycemia,” he continued. “Monitoring glucose and appropriate dosage is the way to go. In other words, do not reduce medications in sick patients who typically need more medication.”
Dr. Handelsman, medical director and principal investigator at Metabolic Institute of America, Tarzana, Calif., added that very sick patients who are hospitalized should be managed with insulin and that oral agents – particularly metformin and sodium-glucose transporter 2 inhibitors – should be stopped.
“Once the patient has recovered and stabilized, you can return to the prior regimen, and, even if the patient is still in hospital, noninsulin therapy can be reintroduced,” he said.
“This is standard procedure in very sick patients, especially those in critical care. Metformin may raise lactic acid levels, and the SGLT2 inhibitors cause volume contraction, fat metabolism, and acidosis,” he explained. “We also stop the glucagon-like peptide receptor–1 analogues, which can cause nausea and vomiting, and pioglitazone because it causes fluid overload.
“Only insulin can be used for acutely sick patients – those with sepsis, for example. The same would apply if they have severe breathing disorders, and definitely, if they are on a ventilator. This is also the time we stop aromatase inhibitor orals and we use insulin.”
Preventive measures
In the interest of maintaining good glucose control, patients also should monitor their glucose levels more frequently so that fluctuations can be detected early and quickly addressed with the appropriate medication adjustments, according to guidelines from the ADA and AACE. They should continue to follow a healthy diet that includes adequate protein and they should exercise regularly.
Patients should ensure that they have enough medication and testing supplies – for at least 14 days, and longer, if costs permit – in case they have to go into quarantine.
General preventive measures, such as frequent hand washing with soap and water, practicing good respiratory hygiene by sneezing or coughing into a facial tissue or bent elbow, also apply for reducing the risk of infection. Touching of the face should be avoided, as should nonessential travel and contact with infected individuals.
Patients with diabetes should always be current with their influenza and pneumonia shots.
Dr. Rettinger said that he always recommends the following preventative measures to his patients and he is using the current health crisis to reinforce them:
- Eat lots of multicolored fruits and vegetables.
- Eat yogurt and take probiotics to keep the intestinal biome strong and functional.
- Be extra vigilant regarding sugars and sugar control to avoid peaks and valleys wherever possible.
- Keep the immune system strong with at least 7-8 hours sleep and reduce stress levels whenever possible.
- Avoid crowds and handshaking.
- Wash hands regularly.
Possible therapies
There are currently no drugs that have been approved specifically for the treatment of COVID-19, although a vaccine against the disease is currently under development.
Dr. Gupta and his colleagues noted in their article that there have been reports of the anecdotal use of antiviral drugs such as lopinavir, ritonavir, interferon-beta, the RNA polymerase inhibitor remdesivir, and chloroquine.
However, Dr. Handelsman said that, as far as he knows, none of these drugs has been shown to be beneficial for COVID-19. “Some [providers] have tried Tamiflu, but with no clear outcomes, and for severely sick patients, they tried medications for anti-HIV, hepatitis C, and malaria, but so far, there has been no breakthrough.”
Dr. Cohen, Dr. Handelsman, Dr. Jellinger, Dr. Levy, and Dr. Rettinger are members of the editorial advisory board of Clinical Endocrinology News. Dr. Gupta and Dr. Wu, and their colleagues, reported no conflicts of interest.
COVID-19: Extra caution needed for patients with diabetes
Patients with diabetes may have an increased risk of developing coronavirus infection (COVID-19), along with increased risks of morbidity and mortality, according to researchers writing in Diabetes & Metabolic Syndrome.
Although relevant clinical data remain scarce, patients with diabetes should take extra precautions to avoid infection and, if infected, may require special care, reported Ritesh Gupta, MD, of Fortis C-DOC Hospital, New Delhi, and colleagues.
“The disease severity [with COVID-19] has varied from mild, self-limiting, flu-like illness to fulminant pneumonia, respiratory failure, and death,” the authors wrote.
As of March 16, 2020, the World Health Organization reported 167,515 confirmed cases of COVID-19 and 6,606 deaths from around the world, with a mortality rate of 3.9%. But the actual mortality rate may be lower, the authors suggested, because a study involving more than 1,000 confirmed cases reported a mortality rate of 1.4%.
“Considering that the number of unreported and unconfirmed cases is likely to be much higher than the reported cases, the actual mortality may be less than 1%, which is similar to that of severe seasonal influenza,” the authors said, in reference to an editorial by Anthony S. Fauci, MD, and colleagues in the New England Journal of Medicine. In addition, they noted, mortality rates may vary by region.
The largest study relevant to patients with diabetes, which involved 72,314 cases of COVID-19, showed that patients with diabetes had a threefold higher mortality rate than did those without diabetes (7.3% vs. 2.3%, respectively). These figures were reported by the Chinese Centre for Disease Control and Prevention.
However, data from smaller cohorts with diabetes and COVID-19 have yielded mixed results. For instance, one study, involving 140 patients from Wuhan, suggested that diabetes was not a risk factor for severe disease, and in an analysis of 11 studies reporting on laboratory abnormalities in patients with a diagnosis of COVID-19, raised blood sugar levels or diabetes were not mentioned among the predictors of severe disease.
“Our knowledge about the prevalence of COVID-19 and disease course in people with diabetes will evolve as more detailed analyses are carried out,” the authors wrote. “For now, it is reasonable to assume that people with diabetes are at increased risk of developing infection. Coexisting heart disease, kidney disease, advanced age, and frailty are likely to further increase the severity of disease.”
Prevention first
“It is important that people with diabetes maintain good glycemic control, because it might help in reducing the risk of infection and the severity,” the authors wrote.
In addition to more frequent monitoring of blood glucose levels, they recommended other preventive measures, such as getting adequate nutrition, exercising, and being current with vaccinations for influenza and pneumonia. The latter, they said, may also reduce the risk of secondary bacterial pneumonia after a respiratory viral infection.
In regard to nutrition, adequate protein intake is important and “any deficiencies of minerals and vitamins need to be taken care of,” they advised. Likewise, exercise is known to improve immunity and should continue, but they suggest avoiding gyms and swimming pools.
For patients with coexisting heart and/or kidney disease, they also recommended efforts to stabilize cardiac/renal status.
In addition, the general preventive measures, such as regular and thorough hand washing with soap and water, practicing good respiratory hygiene by sneezing and coughing into a bent elbow or a facial tissue, and avoiding contact with anyone who is infected, should be observed.
As with other patients with chronic diseases that are managed long-term medications, patients with diabetes should always ensure that they have a sufficient supply of their medications and refills, if possible.
After a diagnosis
If patients with diabetes develop COVID-19, then home management may still be possible, wrote the authors, who recommended basic treatment measures such as maintaining hydration and managing symptoms with acetaminophen and steam inhalation, and home isolation for 14 days or until the symptoms resolve.
In the event of hyperglycemia with fever in patients with type 1 diabetes, blood glucose and urinary ketones should be monitored often. “Frequent changes in dosage and correctional bolus may be required to maintain normoglycemia,” they cautioned.
Concerning diabetic drug regimens, they suggest patients avoid antihyperglycemic agents that can cause volume depletion or hypoglycemia and, if necessary, that they reduce oral antidiabetic drugs and follow sick-day guidelines.
For hospitalized patients, the investigators strengthened that statement, advising that oral agents need to be stopped, particularly sodium-glucose cotransporter 2 inhibitors and metformin. “Insulin is the preferred agent for control of hyperglycemia in hospitalized sick patients,” they wrote.
Untested therapies
The authors also discussed a range of untested therapies that may help fight COVID-19, such as antiviral drugs (such as lopinavir and ritonavir), zinc nanoparticles, and vitamin C. Supplementing those recommendations, Dr. Gupta and colleagues provided a concise review of COVID-19 epidemiology and extant data relevant to patients with diabetes.
The investigators reported no conflicts of interest.
SOURCE: Gupta et al. Diabetes Metab Syndr. 2020;14(3):211-12.
FROM DIABETES & METABOLIC SYNDROME
CV health in pregnancy improves outcomes for mother and infant
PHOENIX – according to results from a multinational cohort study.
“Over the past 10 years, cardiovascular health [CVH] has been characterized across most of the life course and is associated with a variety of health outcomes, but CVH as a whole has not been well studied during pregnancy,” Amanda M. Perak, MD, said at the Epidemiology and Prevention/Lifestyle and Cardiometabolic Health meeting.
In an effort to examine the associations of maternal gestational CVH with adverse maternal and newborn outcomes, Dr. Perak of the departments of pediatrics and preventive medicine at Northwestern University and Lurie Children’s Hospital, both in Chicago, and colleagues drew from the Hyperglycemia and Adverse Pregnancy Outcome (HAPO) Study, which examined pregnant women at a target of 28 weeks’ gestation and assessed the associations of glycemia with pregnancy outcomes. The researchers analyzed data from an ancillary study of 2,230 mother-child dyads to characterize clinical gestational CVH with use of five metrics: body mass index, blood pressure, cholesterol, glucose, and smoking. The study excluded women with prepregnancy diabetes, preterm births, and cases of fetal death/major malformations.
Each maternal CVH metric was classified as ideal, intermediate, or poor according to modified definitions based on pregnancy guidelines. “For lipids, it’s known that levels change substantially during pregnancy, but there are no pregnancy guidelines,” Dr. Perak said. “We and others have also shown that higher triglycerides in pregnancy are associated with adverse pregnancy outcomes. We selected thresholds of less than 250 mg/dL for ideal and at least 500 mg/dL for poor, based on triglyceride distribution and clinical relevance.”
Total CVH was scored by assigning 2 points for ideal, 1 for intermediate, and 0 for each poor metric, for a total possible 10 points, with 10 being most favorable. They also created four CVH categories, ranging from all ideal to two or more poor metrics. Maternal adverse pregnancy outcomes included preeclampsia and unplanned primary cesarean section. Newborn adverse pregnancy outcomes included birth weight above the 90th percentile and a cord blood insulin sensitivity index lower than the 10th percentile.
The researchers used logistic and multinomial logistic regression of pregnancy outcomes on maternal gestational CVH in two adjusted models. Secondarily, they examined associations of individual CVH metrics with outcomes, with adjustment for the other metrics.
The cohort comprised mother-child dyads from nine field centers in six countries: the United States (25%), Barbados (23%), United Kingdom (21%), China (18%), Thailand (7%), and Canada (7%). The mothers’ mean age was 30 years, and the mean gestational age was 28 weeks. The mean gestational CVH score was 8.8 out of 10. Nearly half of mothers (42%) had ideal metrics, while 4% had two or more poor metrics. Delivery occurred at a mean of 39.8 weeks, and adverse pregnancy outcomes occurred in 4.7%-17.9% of pregnancies.
In the fully adjusted model, which accounted for maternal age, height, alcohol use, gestational age at pregnancy exam, maternal parity, and newborn sex and race/ethnicity, odds ratios per 1-point higher (better) CVH score were 0.61 (95% confidence interval, 0.53-0.70) for preeclampsia, 0.85 (95% CI, 0.76-0.95) for unplanned primary cesarean section (among primiparous mothers), 0.83 (95% CI, 0.77-0.91) for large for gestational age infant, and 0.79 (95% CI, 0.72-0.87) for infant insulin sensitivity index below the 10th percentile. CVH categories were also associated with outcomes. For example, odds ratios for preeclampsia were 4.61 (95% CI, 2.13-11.14) for mothers with one or more intermediate metrics, 7.62 (95% CI, 3.60-18.13) for mothers with one poor metric, and 12.02 (95% CI, 4.70-32.50) for mothers with two or more poor metrics, compared with mothers with all metrics ideal.
“Except for smoking, each CVH metric was independently associated with adverse outcomes,” Dr. Perak said. “However, total CVH was associated with a wider range of outcomes than any single metric. This suggests that CVH provides health insights beyond single risk factors.”
Strengths of the study, she continued, included geographic and racial diversity of participants and high-quality research measurements of CVH. Limitations were that the cohort excluded prepregnancy diabetes and preterm births. “Diet and exercise data were not available, and CVH was measured once at 28 weeks,” she said. “Further study is needed across pregnancy and in other settings, but this study provides the first data on the relevance of gestational CVH for pregnancy outcomes.”
In an interview, Stephen S. Rich, PhD, who directs the Center for Public Health Genomics at the University of Virginia, said that the data “provide strong epidemiologic support to focus on the full range of cardiovascular health. In my view, the primary limitation of the study is that there may be significant differences in how one achieves ideal CHV across a single country, not to mention across the world, particularly in absence of a highly controlled, research environment. It is not clear that the approach used in this study at nine selected sites in six relatively highly developed countries could be translated into primary care – particularly in the U.S. with different regulatory and reimbursement plans and payers. Nonetheless, the evidence suggests a way to reduce adverse outcomes in pregnancy and the area deserves greater research.”
According to Dr. Perak, gestational diabetes is associated with a twofold higher maternal risk for cardiovascular disease (Diabetologia. 2019;62:905-14), while diabetes is also associated with higher offspring risk for CVD (BMJ. 2019;367:16398). However, a paucity of data exists on gestational CVH. In one report, better gestational CVH was associated with less subclinical CVD for the mother 10 years later (J Am Heart Assoc. 2019 Jul 23. doi:10.1161/JAHA.118.011394). In a separate analysis, Dr. Perak and her colleagues found that better gestational CVH was associated with better offspring CVH in childhood. “Unfortunately, we also reported that, among pregnant women in the United States, fewer than 1 in 10 had high CVH,” she said (J Am Heart Assoc. 2020 Feb 17. doi:10.1161/JAHA.119.015123). “However, the relevance of gestational CVH for pregnancy outcomes is unknown, but a it’s key question when considering CVH monitoring in prenatal care.”
Dr. Perak reported having received grant support from the National Heart, Lung, and Blood Institute, the American Heart Association, and Northwestern University. The HAPO Study was supported by NHLBI and the National Institute of Diabetes and Digestive and Kidney Diseases.
The meeting was sponsored by the American Heart Association.
SOURCE: Perak A et al. Epi/Lifestyle 2020, Abstract 33.
REPORTING FROM EPI/LIFESTYLE 2020
Smoking, hypoglycemia, kidney function tied to vision loss in type 2 diabetes
according to new findings published in the Journal of Diabetes and its Complications.
“Smoking cessation strategies and optimal cardiometabolic risk factor management, including blood glucose lowering regimens that minimize hypoglycemia, appear important in preventing the loss of vision associated with type 2 diabetes,” wrote Jocelyn J. Drinkwater of the University of Western Australia, Perth, and coauthors, noting that all three noted risk factors were “potentially modifiable.”
To investigate the impact of type 2 diabetes and associated risk factors on vision, the researchers recruited 1,732 participants for the Fremantle Diabetes Study Phase II, of whom 1,551 patients had type 2 diabetes and underwent face-to-face and visual acuity assessments at baseline and at 2 and 4 years. Visual acuity was measured via the Bailey Lovie chart at a distance of 3 m in a well-lit room. Normal or near-normal vision was classified as a visual acuity of equal to or less than 6/19; visual impairment, a visual acuity of greater than 6/19 and equal to or less than 6/48; and blindness, a visual acuity of greater than 6/48. A change in vision was classified as a difference in visual acuity of more than 10 letters from baseline measurement.
Of the initial 1,551 participants, 31 were excluded because of missing baseline data for visual acuity. The remaining group comprised 52.2% men, the mean age was 65.6 years, and the median diabetes duration was 8.5 years (interquartile range, 2.9-15.8). At baseline, the prevalence of visual impairment was 1.8% (28 patients), and prevalence of blindness was 0.7% (11 patients), so those 39 patients were also excluded from further analysis.
After 4 years, 599 patients (39%) were excluded because of attrition or missing data; among them, 138 (23%) died before the follow-up.
The remaining 882 participants (58%) had their visual acuity measured. Among these patients, 62.2% were men, with a mean age of 65.1 years and an initial median diabetes duration of 7 years (IQR, 2.0-15.0). Their cumulative incidence of visual impairment was 0.9% (eight patients), and no patients with normal or near-normal vision had developed blindness. Cumulative incidence of vision loss was 2.9% (26), and 1.9% (17) had improved visual acuity.
After multivariable logistic regression to determine predictors for vision loss, the researchers found that participants who smoked at baseline were more than three times more likely to lose their vision (odds ratio, 3.17; 95% confidence interval, 1.15-8.76; P = .026). Although smoking was noted as a “well-recognized risk factor for ocular disease,” the authors added that ex-smokers did not have significantly higher odds of vision loss, compared with nonsmokers, suggesting that the “ocular damage caused by smoking may not be permanent.”
Participants who had suffered a severe hypoglycemic event before the study were five times more likely to lose their vision (OR, 5.59; 95% CI, 1.32-23.61; P = .019). The authors emphasized that severe hypoglycemia can worsen existing ischemic tissue damage or contribute to a long duration of poorly controlled diabetes, each of which could “increase the risk of ocular complications leading to impaired vision.”
The final notable risk factor was compromised kidney function, which is identified as a urinary albumin-creatinine ratio (uACR). The authors noted that the uACR has been associated with other ocular pathologies, such as retinopathy and macular edema, and that uACR may be a “surrogate marker of a variety of ocular diseases with shared risk factors, such as poor metabolic control, which have implications for vision.”
In regard to the possible limitations of the study, they authors noted that they had not used the “gold standard” Early Treatment Diabetic Retinopathy Study chart to assess visual acuity. In addition, although they had details on retinopathy, cataracts, and glaucoma status, they did not also consider less common ophthalmic conditions. Finally, as a survivor cohort, they acknowledged that they may have “underestimated the cumulative incidence” of vision issues in the participants.
The study was supported by the National Health and Medical Research Council of Australia. The authors reported no conflicts of interest.
SOURCE: Drinkwater JJ et al. J Diabetes Complications. 2020 Feb 20. doi: 10.1016/j.jdiacomp.2020.107560.
FROM THE JOURNAL OF DIABETES AND ITS COMPLICATIONS
Internist reports from COVID-19 front lines near Seattle
KENT, WASHINGTON – The first thing I learned in this outbreak is that my sense of alarm has been deadened by years of medical practice. As a primary care doctor working south of Seattle, in the University of Washington’s Kent neighborhood clinic, I have dealt with long hours, the sometimes-insurmountable problems of the patients I care for, and the constant, gnawing fear of missing something and doing harm. To get through my day, I’ve done my best to rationalize that fear, to explain it away.

I can’t explain how, when I heard the news of the coronavirus epidemic in China, I didn’t think it would affect me. I can’t explain how news of the first patient presenting to an urgent care north of Seattle didn’t cause me, or all health care providers, to think about how we would respond. I can’t explain why so many doctors were dismissive of the very real threat that was about to explode. I can’t explain why it took 6 weeks for the COVID-19 outbreak to seem real to me.
If you work in a doctor’s office, emergency department, hospital, or urgent care center and have not seen a coronavirus case yet, you may have time to think through what is likely to happen in your community. We did not activate a chain of command or decide how information was going to be communicated to the front line and back to leadership. Few of us ran worst-case scenarios.
By March 12, we had 376 confirmed cases, and likely more than a thousand are undetected. The moment of realization of the severity of the outbreak didn’t come to me until Saturday, Feb. 29. In the week prior, several patients had come into the clinic with symptoms and potential exposures, but not meeting the narrow Centers for Disease Control and Prevention testing criteria. They were all advised by the Washington Department of Health to go home. At the time, it seemed like decent advice. Frontline providers didn’t know that there had been two cases of community transmission weeks before, or that one was about to become the first death in Washington state. I still advised patients to quarantine themselves. In the absence of testing, we had to assume everyone was positive and should stay home until 72 hours after their symptoms resolved. Studying the state’s FMLA [Family and Medical Leave Act] intently, I wrote insistent letters to inflexible bosses, explaining that their employees needed to stay home.
I worked that Saturday. Half of my patients had coughs. Our team insisted that they wear masks. One woman refused, and I refused to see her until she did. In a customer service–oriented health care system, I had been schooled to accommodate almost any patient request. But I was not about to put my staff and other patients at risk. Reluctantly, she complied.
On my lunch break, my partner called me to tell me he was at the grocery store. “Why?” I asked, since we usually went together. It became clear he was worried about an outbreak. He had been following the news closely and tried to tell me how deadly this could get and how quickly the disease could spread. I brushed his fears aside, as more evidence of his sweet and overly cautious nature. “It’ll be fine,” I said with misplaced confidence.
Later that day, I heard about the first death and the outbreak at Life Care, a nursing home north of Seattle. I learned that firefighters who had responded to distress calls were under quarantine. I learned through an epidemiologist that there were likely hundreds of undetected cases throughout Washington.
On Monday, our clinic decided to convert all cases with symptoms into telemedicine visits. Luckily, we had been building the capacity to see and treat patients virtually for a while. We have ramped up quickly, but there have been bumps along the way. It’s difficult to convince those who are anxious about their symptoms to allow us to use telemedicine for everyone’s safety. It is unclear how much liability we are taking on as individual providers with this approach or who will speak up for us if something goes wrong.
Patients don’t seem to know where to get their information, and they have been turning to increasingly bizarre sources. For the poorest, who have had so much trouble accessing care, I cannot blame them for not knowing whom to trust. I post what I know on Twitter and Facebook, but I know I’m no match for cynical social media algorithms.
Testing was still not available at my clinic the first week of March, and it remains largely unavailable throughout much of the country. We have lost weeks of opportunity to contain this. Luckily, on March 4, the University of Washington was finally allowed to use their homegrown test and bypass the limited supply from the CDC. But our capacity at UW is still limited, and the test remained unavailable to the majority of those potentially showing symptoms until March 9.
I am used to being less worried than my patients. I am used to reassuring them. But over the first week of March, I had an eerie sense that my alarm far outstripped theirs. I got relatively few questions about coronavirus, even as the number of cases continued to rise. It wasn’t until the end of the week that I noticed a few were truly fearful. Patients started stealing the gloves and the hand sanitizer, and we had to zealously guard them. My hands are raw from washing.
Throughout this time, I have been grateful for a centralized drive with clear protocols. I am grateful for clear messages at the beginning and end of the day from our CEO. I hope that other clinics model this and have daily in-person meetings, because too much cannot be conveyed in an email when the situation changes hourly.
But our health system nationally was already stretched thin before, and providers have sacrificed a lot, especially in the most critical settings, to provide decent patient care. Now we are asked to risk our health and safety, and our family’s, and I worry about the erosion of trust and work conditions for those on the front lines. I also worry our patients won’t believe us when we have allowed the costs of care to continue to rise and ruin their lives. I worry about the millions of people without doctors to call because they have no insurance, and because so many primary care physicians have left unsustainable jobs.
I am grateful that few of my colleagues have been sick and that those that were called out. I am grateful for the new nurse practitioners in our clinic who took the lion’s share of possibly affected patients and triaged hundreds of phone calls, creating note and message templates that we all use. I am grateful that my clinic manager insisted on doing a drill with all the staff members.
I am grateful that we were reminded that we are a team and that if the call center and cleaning crews and front desk are excluded, then our protocols are useless. I am grateful that our registered nurses quickly shifted to triage. I am grateful that I have testing available.
This week, for the first time since I started working, multiple patients asked how I am doing and expressed their thanks. I am most grateful for them.
I can’t tell you what to do or what is going to happen, but I can tell you that you need to prepare now. You need to run drills and catch the holes in your plans before the pandemic reaches you. You need to be creative and honest about the flaws in your organization that this pandemic will inevitably expose. You need to meet with your team every day and remember that we are all going to be stretched even thinner than before.
Most of us will get through this, but many of us won’t. And for those who do, we need to be honest about our successes and failures. We need to build a system that can do better next time. Because this is not the last pandemic we will face.
Dr. Elisabeth Poorman is a general internist at a University of Washington neighborhood clinic in Kent. She completed her residency at Cambridge (Mass.) Health Alliance and specializes in addiction medicine. She also serves on the editorial advisory board of Internal Medicine News.
KENT, WASHINGTON – The first thing I learned in this outbreak is that my sense of alarm has been deadened by years of medical practice. As a primary care doctor working south of Seattle, in the University of Washington’s Kent neighborhood clinic, I have dealt with long hours, the sometimes-insurmountable problems of the patients I care for, and the constant, gnawing fear of missing something and doing harm. To get through my day, I’ve done my best to rationalize that fear, to explain it away.
I can’t explain how, when I heard the news of the coronavirus epidemic in China, I didn’t think it would affect me. I can’t explain how news of the first patient presenting to an urgent care north of Seattle didn’t cause me, or all health care providers, to think about how we would respond. I can’t explain why so many doctors were dismissive of the very real threat that was about to explode. I can’t explain why it took 6 weeks for the COVID-19 outbreak to seem real to me.
If you work in a doctor’s office, emergency department, hospital, or urgent care center and have not seen a coronavirus case yet, you may have time to think through what is likely to happen in your community. We did not activate a chain of command or decide how information was going to be communicated to the front line and back to leadership. Few of us ran worst-case scenarios.
By March 12, we had 376 confirmed cases, and likely more than a thousand are undetected. The moment of realization of the severity of the outbreak didn’t come to me until Saturday, Feb. 29. In the week prior, several patients had come into the clinic with symptoms and potential exposures, but not meeting the narrow Centers for Disease Control and Prevention testing criteria. They were all advised by the Washington Department of Health to go home. At the time, it seemed like decent advice. Frontline providers didn’t know that there had been two cases of community transmission weeks before, or that one was about to become the first death in Washington state. I still advised patients to quarantine themselves. In the absence of testing, we had to assume everyone was positive and should stay home until 72 hours after their symptoms resolved. Studying the state’s FMLA [Family and Medical Leave Act] intently, I wrote insistent letters to inflexible bosses, explaining that their employees needed to stay home.
I worked that Saturday. Half of my patients had coughs. Our team insisted that they wear masks. One woman refused, and I refused to see her until she did. In a customer service–oriented health care system, I had been schooled to accommodate almost any patient request. But I was not about to put my staff and other patients at risk. Reluctantly, she complied.
On my lunch break, my partner called me to tell me he was at the grocery store. “Why?” I asked, since we usually went together. It became clear he was worried about an outbreak. He had been following the news closely and tried to tell me how deadly this could get and how quickly the disease could spread. I brushed his fears aside, as more evidence of his sweet and overly cautious nature. “It’ll be fine,” I said with misplaced confidence.
Later that day, I heard about the first death and the outbreak at Life Care, a nursing home north of Seattle. I learned that firefighters who had responded to distress calls were under quarantine. I learned through an epidemiologist that there were likely hundreds of undetected cases throughout Washington.
On Monday, our clinic decided to convert all cases with symptoms into telemedicine visits. Luckily, we had been building the capacity to see and treat patients virtually for a while. We have ramped up quickly, but there have been bumps along the way. It’s difficult to convince those who are anxious about their symptoms to allow us to use telemedicine for everyone’s safety. It is unclear how much liability we are taking on as individual providers with this approach or who will speak up for us if something goes wrong.
Patients don’t seem to know where to get their information, and they have been turning to increasingly bizarre sources. For the poorest, who have had so much trouble accessing care, I cannot blame them for not knowing whom to trust. I post what I know on Twitter and Facebook, but I know I’m no match for cynical social media algorithms.
Testing was still not available at my clinic the first week of March, and it remains largely unavailable throughout much of the country. We have lost weeks of opportunity to contain this. Luckily, on March 4, the University of Washington was finally allowed to use their homegrown test and bypass the limited supply from the CDC. But our capacity at UW is still limited, and the test remained unavailable to the majority of those potentially showing symptoms until March 9.
I am used to being less worried than my patients. I am used to reassuring them. But over the first week of March, I had an eerie sense that my alarm far outstripped theirs. I got relatively few questions about coronavirus, even as the number of cases continued to rise. It wasn’t until the end of the week that I noticed a few were truly fearful. Patients started stealing the gloves and the hand sanitizer, and we had to zealously guard them. My hands are raw from washing.
Throughout this time, I have been grateful for a centralized drive with clear protocols. I am grateful for clear messages at the beginning and end of the day from our CEO. I hope that other clinics model this and have daily in-person meetings, because too much cannot be conveyed in an email when the situation changes hourly.
But our health system nationally was already stretched thin before, and providers have sacrificed a lot, especially in the most critical settings, to provide decent patient care. Now we are asked to risk our health and safety, and our family’s, and I worry about the erosion of trust and work conditions for those on the front lines. I also worry our patients won’t believe us when we have allowed the costs of care to continue to rise and ruin their lives. I worry about the millions of people without doctors to call because they have no insurance, and because so many primary care physicians have left unsustainable jobs.
I am grateful that few of my colleagues have been sick and that those that were called out. I am grateful for the new nurse practitioners in our clinic who took the lion’s share of possibly affected patients and triaged hundreds of phone calls, creating note and message templates that we all use. I am grateful that my clinic manager insisted on doing a drill with all the staff members.
I am grateful that we were reminded that we are a team and that if the call center and cleaning crews and front desk are excluded, then our protocols are useless. I am grateful that our registered nurses quickly shifted to triage. I am grateful that I have testing available.
This week, for the first time since I started working, multiple patients asked how I am doing and expressed their thanks. I am most grateful for them.
I can’t tell you what to do or what is going to happen, but I can tell you that you need to prepare now. You need to run drills and catch the holes in your plans before the pandemic reaches you. You need to be creative and honest about the flaws in your organization that this pandemic will inevitably expose. You need to meet with your team every day and remember that we are all going to be stretched even thinner than before.
Most of us will get through this, but many of us won’t. And for those who do, we need to be honest about our successes and failures. We need to build a system that can do better next time. Because this is not the last pandemic we will face.
Dr. Elisabeth Poorman is a general internist at a University of Washington neighborhood clinic in Kent. She completed her residency at Cambridge (Mass.) Health Alliance and specializes in addiction medicine. She also serves on the editorial advisory board of Internal Medicine News.
Program Helps Native Americans Get Back to the Roots of Good Health
Diabetes used to be rare among Native Americans. Before the 1950s, there were few accounts of lifestyle diseases like type 2 diabetes mellitus (T2DM), says Valarie Blue Bird Jernigan, a member of the Choctaw Nation and University of Oklahoma researcher who studies the impacts of food environments on Native American health: “They couldn’t really be found in Native American communities. The major problem was malnutrition.” In 1940, only 21 cases of T2DM were identified among the Akimel O’odham people living in the Sonoran Desert. By 2006, 38% of adults in that tribe had T2DM.
The rate of diagnosed T2DM among American Indian/Alaska Native (AI/AN) adults is now double that of white adults, and the incidence among children and young adults is > 10 times that of other groups.
“Focusing on biologic factors alone overlooks factors that propel development of chronic diseases,” say researchers from the University of New Mexico and the Centers for Disease Control and Prevention (CDC) Native Diabetes Wellness program. Poverty, historical trauma, and adverse childhood experiences all play a part in AI/AN health issues. But food insecurity—uncertain or limited access to enough food for a healthy life—also correlates with greater risk of T2DM. In 2016, nearly 30% of AI/AN households were food insecure, compared with 16% of non-AI/AN households. Rates of food insecurity among AI/AN children are about double the national rates. Compounding the problem, “food deserts” are still common in Indian Country.
Native Americans used to eat healthier, living off the land, hunting, and fishing. Then federal mandates affected the land and water resources of tribal nations, disrupting indigenous food systems and reducing access to traditional foods, the researchers say. In the 1970s, the federal government began buying up surplus foods to support prices for farmers, then providing them to Native communities. The food was needed—the problem was that it consisted largely of high-salt, high-fat, high-sugar canned foods. One consequence of the calorie-dense commodities-based diet was “commod bod,” a phrase coined in Native communities.
Recently some traditional foods, like hand-harvested wild rice, grass-fed bison, and wild-caught Pacific salmon, have been added to the food assistance programs; the US Department of Agriculture cites high rates of participant satisfaction. About one-third of 103 tribal organizations also now have “grocery-store–like models” where aid recipients can select their own foods, including fresh fruits and vegetables.
However, in February, the Trump administration released a proposal to overhaul the Supplemental Nutrition Assistance Program, replacing half the benefits people receive with boxed, nonperishable foods. According to recent research, Jernigan says, 60% of Native Americans who receive food assistance through the Supplemental Nutrition Assistance Program rely on the program as their primary source of food.
It became clear that one way to help AI/AN communities reclaim their health was to bring back the old ways. The Indian Health Service (IHS) Tribal Leaders Diabetes Committee has supported programs in which AI/AN communities integrate their own cultures and history, to encourage healthier lifestyles. The concept of a “food sovereignty movement” evolved into programs like the Traditional Foods Project (TFP).
The TFP has provided “modest” funding to AI/AN communities to design their own interventions promoting access to traditional foods, physical activity, and social support. The project began in 2008 with 11 tribes and tribal organizations, and expanded to 17 in 2009.
Recently, the CDC researchers reported on how the TFP was doing, evaluating data the tribal partners collected between 2008 and 2014 in 3 domains: traditional foods, physical activity, and social support. Each partner used various strategies aimed at behavior changes, with unique solutions in each group. Some of their initiatives covered > 1 domain: gardening, for instance, involved physical activity, social support, and traditional foods.
From 82% to 94% of the partners (numbers varied as more communities joined the TFP) reported gardening during summer months; 59% to 82% also gardened during the winter. Many started community gardens, but school gardens had the most participants. In 1 year, 6 communities had school gardens involving 3,017 people. Most of the partners also began focusing on sustainability, using heirloom seeds, for instance. One coordinator took a course to become a Master Composter, balancing traditional ecological knowledge and Western science, leading to “large yields of harvested produce.”
Healthy food outlets increased, reported by 11 of 16 communities in T10, up from 2 of 11 in the first test period. Moreover, by T10, nearly two-thirds of the partners reported that healthy food selections were available at 1 or more venues, including worksites, supermarkets, vending machines, and restaurants.
Most partners reported health education activities for each period, involving nearly 11,000 participants. Storytelling was an important teaching activity, the researchers say. Head Start organizations added physical activities, gardening, and a health education curriculum.
The partners measured changes such as weight loss, improved physical activity, and healthy food choices in 69 of 156 data points recorded during the 10 periods. In most periods, almost half of the partners measured participant change in 1 or more domains. As many as 7,500 participants took part in organized physical activities for 1 partner during 1 period. Involvement in activities peaked in the middle years but leveled off at a median of about 65%.
The researchers also gathered observations from the partners. The program’s impact was visible not only community-wide, but among individuals. One young man who had struggled with substance abuse said he “found himself through connection with the earth” in the community garden. Another participant said, “Food is good medicine.”
A thread in every discussion, the researchers say, was: “Traditional foods have become a way to talk about health.” The way to reclaim health, the partners came to believe, was to reconnect with the land, water, traditional foodways, and “all that they mean.”
FDA to revise safety evaluation of type 2 diabetes drugs
The US Food and Drug Administration (FDA) has issued new draft guidance for industry on evaluating the safety of new drugs for type 2 diabetes and removed the “outdated” 12-year-old requirement for standardized cardiovascular outcomes trials (CVOTs).
The new draft guidance, “Type 2 Diabetes Mellitus: Evaluating the Safety of New Drugs for Improving Glycemic Control,” will replace the December 2008 requirement that manufacturers conduct CVOTs to rule out unacceptable cardiovascular safety risk. That move followed concerns raised at the time about the thiazolidinedione class of glucose-lowering drugs.
Since then, “FDA has reviewed the results of several [CVOTs] conducted to meet the December 2008 guidance recommendations. None of the CVOTs to date have identified an increased risk of ischemic cardiovascular events; some of the CVOTs have instead demonstrated a reduced risk for cardiovascular events,” according to the federal register announcement.
In October 2018, the FDA’s Endocrinologic and Metabolic Drugs Advisory Committee narrowly voted (10 to 9) to continue requiring CVOTs, but most panel members also recommended some changes to them, including requirements for safety data beyond cardiovascular events.
Based on the CVOT results over the years and the panel’s recommendations, “FDA is revisiting the recommendations of the December 2008 guidance and is now proposing an updated approach to evaluating the safety of new drugs and biologics to improve glycemic control.”
“The new draft guidance does not contain the recommendation that sponsors of all new therapies for type 2 diabetes uniformly rule out a specific degree of risk for ischemic cardiovascular adverse outcomes,” the FDA said.
Instead, the draft calls for at least 4000 patient-years of exposure to the new drug in phase 3 trials and inclusion of study participants with comorbid conditions and/or diabetes complications, including at least 500 with stage 3-4 chronic kidney disease, 600 with established cardiovascular disease, and at least 600 over the age of 65 years.
The FDA is soliciting stakeholder input on these and other issues, including study duration, subject demographics, specific safety concerns, and event adjudication.
In a statement, Lisa Yanoff, MD, acting director of the Division for Metabolism and Endocrinology Products in the FDA’s Center for Drug Evaluation and Research, said: “By following previous FDA recommendations, sponsors have shown that new type 2 diabetes drugs do not have excess ischemic cardiovascular risk, which has provided reassuring cardiovascular safety information for millions of diabetes patients. Now, with this proposed approach, we will have broader, valuable safety information for these medications.”
The draft is open for comments for 90 days after March 9, 2020. It is available online, along with a link for submitting comments.
This article first appeared on Medscape.com.
Risk factors for death from COVID-19 identified in Wuhan patients
Patients who did not survive hospitalization for COVID-19 in Wuhan were more likely to be older, have comorbidities, and elevated D-dimer, according to the first study to examine risk factors associated with death among adults hospitalized with COVID-19. “Older age, showing signs of sepsis on admission, underlying diseases like high blood pressure and diabetes, and the prolonged use of noninvasive ventilation were important factors in the deaths of these patients,” coauthor Zhibo Liu said in a news release. Abnormal blood clotting was part of the clinical picture too.
Fei Zhou, MD, from the Chinese Academy of Medical Sciences, and colleagues conducted a retrospective, observational, multicenter cohort study of 191 patients, 137 of whom were discharged and 54 of whom died in the hospital.
The study, published online today in The Lancet, included all adult inpatients with laboratory-confirmed COVID-19 from Jinyintan Hospital and Wuhan Pulmonary Hospital who had been discharged or died by January 31 of this year. Severely ill patients in the province were transferred to these hospitals until February 1.
The researchers compared demographic, clinical, treatment, and laboratory data from electronic medical records between survivors and those who succumbed to the disease. The analysis also tested serial samples for viral RNA. Overall, 91 (48%) of the 191 patients had comorbidity. Most common was hypertension (30%), followed by diabetes (19%) and coronary heart disease (8%).
The odds of dying in the hospital increased with age (odds ratio 1.10; 95% confidence interval, 1.03-1.17; per year increase in age), higher Sequential Organ Failure Assessment (SOFA) score (5.65, 2.61-12.23; P < .0001), and D-dimer level exceeding 1 mcg/L on admission. The SOFA was previously called the “sepsis-related organ failure assessment score” and assesses rate of organ failure in intensive care units. Elevated D-dimer indicates increased risk of abnormal blood clotting, such as deep vein thrombosis.
Nonsurvivors compared with survivors had higher frequencies of respiratory failure (98% vs 36%), sepsis (100%, vs 42%), and secondary infections (50% vs 1%).
The average age of survivors was 52 years compared to 69 for those who died. Liu cited weakening of the immune system and increased inflammation, which damages organs and also promotes viral replication, as explanations for the age effect.
From the time of initial symptoms, median time to discharge from the hospital was 22 days. Average time to death was 18.5 days.
Fever persisted for a median of 12 days among all patients, and cough persisted for a median 19 days; 45% of the survivors were still coughing on discharge. In survivors, shortness of breath improved after 13 days, but persisted until death in the others.
Viral shedding persisted for a median duration of 20 days in survivors, ranging from 8 to 37. The virus (SARS-CoV-2) was detectable in nonsurvivors until death. Antiviral treatment did not curtail viral shedding.
But the viral shedding data come with a caveat. “The extended viral shedding noted in our study has important implications for guiding decisions around isolation precautions and antiviral treatment in patients with confirmed COVID-19 infection. However, we need to be clear that viral shedding time should not be confused with other self-isolation guidance for people who may have been exposed to COVID-19 but do not have symptoms, as this guidance is based on the incubation time of the virus,” explained colead author Bin Cao.
“Older age, elevated D-dimer levels, and high SOFA score could help clinicians to identify at an early stage those patients with COVID-19 who have poor prognosis. Prolonged viral shedding provides the rationale for a strategy of isolation of infected patients and optimal antiviral interventions in the future,” the researchers conclude.
A limitation in interpreting the findings of the study is that hospitalized patients do not represent the entire infected population. The researchers caution that “the number of deaths does not reflect the true mortality of COVID-19.” They also note that they did not have enough genetic material to accurately assess duration of viral shedding.
This article first appeared on Medscape.com.
Belapectin misses endpoints in NASH trial
For patients with nonalcoholic steatohepatitis (NASH) with cirrhosis and portal hypertension, belapectin therapy was safe but did not significantly improve fibrosis or hepatic venous pressure gradient, compared with placebo, according to the results of a multicenter phase 2b study.
After 52 weeks of infusions, the change in hepatic venous pressure gradient did not significantly differ between the 2-mg/kg group (–0.28 mm Hg) and the placebo group (0.10 mm Hg) or between the 8-mg/kg group (–0.25 mm Hg) and the placebo group (P = .1 for both comparisons). Belapectin also did not significantly improve fibrosis, nonalcoholic fatty liver disease activity score, or the frequency of various complications of cirrhosis. “However, in a subgroup analysis of patients without esophageal varices, 2 mg/kg belapectin did reduce hepatic venous pressure gradient and development of varices,” wrote Naga Chalasani, MD, of Indiana University in Indianapolis and his associates. The findings were published in Gastroenterology.
NASH leads to portal hypertension, variceal bleeding, ascites with bacterial peritonitis, hepatic encephalopathy, and liver-related death and is a leading reason for liver transplantation among women and men. Galectin-3, which is primarily secreted by macrophages, is elevated in patients with NASH and has been linked to the pathophysiology of liver fibrosis in mice. Belapectin (GR-MD-02), a complex carbohydrate that targets and disrupts galectin-3, has been found to reduce liver fibrosis and portal hypertension in rats and was safe and well tolerated in phase 1 studies.
For this double-blind trial, the researchers randomly assigned 162 patients with NASH, cirrhosis, and portal hypertension (hepatic venous pressure gradient at least 6 mm Hg) to receive biweekly infusions of belapectin 2 mg/kg (54 patients), belapectin 8 mg/kg (54 patients), or placebo (54 patients). Patients were treated for 52 weeks. The primary endpoint was change from baseline in hepatic venous pressure gradient.
In a post-hoc analysis of the 81 patients who had no esophageal varices at baseline, 2 mg/kg belapectin was associated with an average 1.61-mm Hg reduction in hepatic venous pressure gradient from baseline (P = .02) and with a reduction in the development of new varices (P = .03).These effects did not extend to subgroups of patients with varices at baseline, clinically significant portal hypertension, or mild portal hypertension. Moreover, 2 mg/kg belapectin did not improve fibrosis, and the higher dose of belapectin (8 mg/kg) met neither the primary endpoint nor the secondary endpoints in the overall cohort or in subgroup analyses. In the subgroup with no varices at baseline, Galectin Technologies is proceeding to initiating a phase 3 clinical trial.
“Interestingly and somewhat unexpectedly, belapectin was associated with an improvement in hepatocyte ballooning,” which “is considered fundamental to the pathogenesis of disease progression in nonalcoholic steatohepatitis,” the researchers wrote. “The significance of such improvement in hepatocyte ballooning in the absence of improvement of other histological components, especially inflammation, is unknown.”
Galectin Therapeutics provided funding. Dr. Chalasani disclosed grant support from Galectin Therapeutics and relevant consulting relationships with NuSirt, AbbVie, Afimmune (DS Biopharma), and several other pharmaceutical companies. Sixteen coinvestigators also disclosed relationships with pharmaceutical companies, of whom eight disclosed consulting relationships, received research funding, or were employed by Galectin.
SOURCE: Chalasani N et al. Gastroenterology. 2019 Dec 5. doi: 10.1053/j.gastro.2019.11.296.
*This story was updated on 3/18/2020.
FROM GASTROENTEROLOGY