User login
The VA, California, and NYC requiring employee vaccinations
-- or, in the case of California and New York City, undergo regular testing.
The VA becomes the first federal agency to mandate COVID vaccinations for workers. In a news release, VA Secretary Denis McDonough said the mandate is “the best way to keep Veterans safe, especially as the Delta variant spreads across the country.”
VA health care personnel -- including doctors, dentists, podiatrists, optometrists, registered nurses, physician assistants, and chiropractors -- have 8 weeks to become fully vaccinated, the news release said. The New York Times reported that about 115,000 workers will be affected.
The trifecta of federal-state-municipal vaccine requirements arrived as the nation searches for ways to get more people vaccinated to tamp down the Delta variant.
Some organizations, including the military, have already said vaccinations will be required as soon as the Food and Drug Administration formally approves the vaccines, which are now given under emergency use authorizations. The FDA has said the Pfizer vaccine could receive full approval within months.
California Gov. Gavin Newsom said the requirements he announced July 27 were the first in the nation on the state level.
“As the state’s largest employer, we are leading by example and requiring all state and health care workers to show proof of vaccination or be tested regularly, and we are encouraging local governments and businesses to do the same,” he said in a news release.
California employees must provide proof of vaccination or get tested at least once a week. The policy starts Aug. 2 for state employees and Aug. 9 for state health care workers and employees of congregate facilities, such as jails or homeless shelters.
California, especially the southern part of the state, is grappling with a COVID-19 surge. The state’s daily case rate more than quadrupled, from a low of 1.9 cases per 100,000 in May to at least 9.5 cases per 100,000 today, the release said.
In New York City, Mayor Bill de Blasio had previously announced that city health and hospital employees and those working in Department of Health and Mental Hygiene clinical settings would be required to provide proof of vaccination or have regular testing.
On July 27 he expanded the rule to cover all city employees, with a Sept. 13 deadline for most of them, according to a news release.
“This is what it takes to continue our recovery for all of us while fighting back the Delta variant,” Mayor de Blasio said. “It’s going to take all of us to finally end the fight against COVID-19.”
“We have a moral responsibility to take every precaution possible to ensure we keep ourselves, our colleagues and loved ones safe,” NYC Health + Hospitals President and CEO Mitchell Katz, MD, said in the release. “Our city’s new testing requirement for city workers provides more [peace] of mind until more people get their safe and effective COVID-19 vaccine.”
NBC News reported the plan would affect about 340,000 employees.
A version of this article first appeared on WebMD.com.
Moving patients beyond injury and back to work
This month, JFP tackles a topic—work disability—that might, at first, seem a bit outside our usual wheelhouse of clinical review articles. Work disability is, however, a very important topic. The authors point out that “... primary care clinicians are asked to provide guidance about work activities in nearly 10% of their patient encounters; however, 25% of those clinicians thought they had little influence over work disability outcomes.” This statement suggests that we need to learn more about managing work-related disability and how to influence patients’ outcomes in a positive manner.
I suspect that we tend to be pessimistic about our ability to influence patient outcomes because we are uncertain about the best course of action. The authors of this article provide excellent information about how we can—and should—help ill and injured patients return to work.
As I read the article, I reflected on my own experience providing patients with advice about returning to work. Two points, in particular, struck a chord with me.
1. Many factors in the process are beyond our control. The physician’s role in helping patients return to work after an injury or illness is limited. The authors remind us that there are many patient and employer factors that are beyond our control and that influence patients’ successful return to work. Patient factors include motivation, mental health, and job satisfaction. Employer factors include job flexibility and disability benefits and policies. And of course, there are system factors that include laws governing work-related disability.
2. Our role, while limited, is important. By putting forth a positive attitude toward recovery and providing encouragement to patients, we can facilitate an earlier return to work.
I am cognizant of the pivotal role we can play with back injuries, a frequent cause of work disability. A great deal of excellent research over the past 20 years guides us regarding treatment and prognosis. Most back injuries are due to musculoskeletal injury and improve quickly during the first week, no matter what the therapy. By steering these patients clear of narcotics, telling them to remain as physically active as their pain will allow, and letting them know they will recover, we can pave the way for an early return to work.
Let us all take full advantage, then, of these important conversations with our patients. Armed with the strategies in this month’s article, we can increase the likelihood of our patients’ success.
Editor-in-Chief
Editor-in-Chief
Editor-in-Chief
This month, JFP tackles a topic—work disability—that might, at first, seem a bit outside our usual wheelhouse of clinical review articles. Work disability is, however, a very important topic. The authors point out that “... primary care clinicians are asked to provide guidance about work activities in nearly 10% of their patient encounters; however, 25% of those clinicians thought they had little influence over work disability outcomes.” This statement suggests that we need to learn more about managing work-related disability and how to influence patients’ outcomes in a positive manner.
I suspect that we tend to be pessimistic about our ability to influence patient outcomes because we are uncertain about the best course of action. The authors of this article provide excellent information about how we can—and should—help ill and injured patients return to work.
As I read the article, I reflected on my own experience providing patients with advice about returning to work. Two points, in particular, struck a chord with me.
1. Many factors in the process are beyond our control. The physician’s role in helping patients return to work after an injury or illness is limited. The authors remind us that there are many patient and employer factors that are beyond our control and that influence patients’ successful return to work. Patient factors include motivation, mental health, and job satisfaction. Employer factors include job flexibility and disability benefits and policies. And of course, there are system factors that include laws governing work-related disability.
2. Our role, while limited, is important. By putting forth a positive attitude toward recovery and providing encouragement to patients, we can facilitate an earlier return to work.
I am cognizant of the pivotal role we can play with back injuries, a frequent cause of work disability. A great deal of excellent research over the past 20 years guides us regarding treatment and prognosis. Most back injuries are due to musculoskeletal injury and improve quickly during the first week, no matter what the therapy. By steering these patients clear of narcotics, telling them to remain as physically active as their pain will allow, and letting them know they will recover, we can pave the way for an early return to work.
Let us all take full advantage, then, of these important conversations with our patients. Armed with the strategies in this month’s article, we can increase the likelihood of our patients’ success.
Managing work disability to help patients return to the job
All clinicians who have patients who are employed play an essential role in work disability programs—whether or not those clinicians have received formal training in occupational health. A study found that primary care clinicians are asked to provide guidance about work activities in nearly 10% of their patient encounters; however, 25% of those clinicians thought they had little influence over work disability outcomes.1
In this article, we explain why it is important for family physicians to better manage work disability at the point of care, to help patients return to their pre-injury or pre-illness level of activity.
Why managing the duration of work disability matters
Each year, millions of American workers leave their jobs—temporarily or permanently—because of illness, injury, or the effects of a chronic condition.2 It is estimated that 893 million workdays are lost annually due to a new medical problem; an additional 527 million workdays are lost due to the impact of chronic health conditions on the ability to perform at work.3 The great majority of these lost workdays are the result of personal health conditions, not work-related problems; patients must therefore cope with the accompanying disruption of life and work.
Significant injury and illness can create a life crisis, especially when there is uncertainty about future livelihood, such as an income shortfall during a lengthy recovery. Only 40% of the US workforce is covered by a short-term disability insurance program; only 10% of low-wage and low-skill workers have this type of coverage.4 Benefits rarely replace loss of income entirely, and worker compensation insurance programs provide only partial wage replacement.
In short, work disability is destabilizing and can threaten overall well-being.5
Furthermore, the longer a person remains on temporary disability, the more likely that person is to move to a publicly funded disability program or leave the workforce entirely—thus, potentially losing future earnings and self-identity related to being a working member of society.6-8
Most of the annual cost of poor health for US employers derives from medical and wage benefits ($226 billion) and impaired or reduced employee performance ($223 billion).3 In addition, temporarily disabled workers likely account for a disproportionate share of health care costs: A study found that one-half of medical and pharmacy payments were paid out to the one-quarter of employees requiring disability benefits.9
Continue to: Benefits of staying on the job
Benefits of staying on the job. Research shows that there are physical and mental health benefits to remaining at, or returning to, work after an injury or illness.10,11 For example, in a longitudinal cohort of people with low back pain, immediate or early return to work (in 1-7 days) was associated with reduced pain and improved functioning at 3 months.12 Physicians who can guide patients safely back to normal activities, including work, minimize the physical and mental health impact of the injury or illness and avoid chronicity.13
Emphasizing the importance of health, not disease or injury
Health researchers have found that diagnosis, cause, and extent of morbidity do not adequately explain observed variability in the impact of health conditions, utilization of resources, or need for services. A wider view of the functional implications of an injury or illness is therefore required for physicians to effectively recommend disability duration.
The World Health Organization recommends a shift toward a more holistic view of health, impairment, and disability, including an emphasis on functional ability, intrinsic capacity, and environmental context.14 The American Medical Association, American College of Occupational and Environmental Medicine, and Canadian Medical Association emphasize that prolonged absence from one’s normal role can be detrimental to mental, physical, and social well-being.8 These advisory groups recommend that physicians encourage patients who are unable to work to (1) focus on restoring the rhythm of their everyday life in a stepwise fashion and (2) resume their usual responsibilities as soon as possible.
Advising a patient to focus on “what you can do,” not “what you can’t do,” might make all the difference in their return to productivity. Keeping the patient’s—as well as your own—attention focused on the positive process of recovery and documenting evidence of functional progress is an important addition to (or substitute for) detailed inquiries about pain and dysfunction.
Why does duration of disability vary so much from case to case?
Disability duration is influenced by the individual patient, employer, physician, jurisdiction, insurer or benefits structure, and access to care.15 For you to effectively manage a patient who is out of work for a medical reason, it is important to understand how nonmedical variables often influence the pace of recovery and the timing of return to work (FIGURE).

Continue to: Deficient communication
Deficient communication. Often, employers, insurers, third-party administrators, and clinicians—each a key stakeholder in disability care—are disconnected from one another, resulting in poor communication with the injured worker. Such fragmented communication can delay treatment and recovery.16 Data systems are not designed to measure the duration of disability or provide proactive notification for key stakeholders who might intervene to facilitate a patient’s recovery.
Alternatively, a collaborative approach to disability management has been shown to improve outcomes.17,18 Communication among the various professionals involved can be coordinated and expedited by a case manager or disability manager hired by the medical practice, the employer, or the insurance company.
Psychosocial and economic influences can radically affect the time it takes to return to pre-injury or pre-illness functional status. Demographic variables (age, sex, income, education, and support system) influence how a person responds to a debilitating injury or illness.19 Fear of re-injury, anxiety over the intensity of pain upon movement, worry over dependency on others, and resiliency play an important role when a patient is attempting to return to full activity.20,21
Job satisfaction has been identified as the most significant variable associated with prompt return to work.15 Work has many health-enhancing aspects, including socioeconomic status, psychosocial support, and self-identity22; however, not everyone wants, or feels ready, to go back to work even once they are physically able. Workplace variables, such as the patient–employee’s dislike of the position, coworkers, or manager, have been cited by physicians as leading barriers to returning to work at an appropriate time.23,24
Other external variables. Physicians should formulate activity prescriptions and medical restrictions based on the impact the medical condition has on the usual ability to function, as well as the anticipated impact of specific activities on the body’s natural healing process. However, Rainville and colleagues found that external variables—patient requests, employer characteristics, and jurisdiction issues—considerably influence physicians’ recommendations.20 For example, benefit structure might influence how long a patient wants to remain out of work—thus altering the requests they make to their physician. Jurisdictional characteristics, such as health care systems, state workers’ compensation departments, and payer systems, all influence a patient’s recovery timeline and time away from work.25
Continue to: What does your patient need so that they can recover?
What does your patient need so that they can recover? Individual and systemic factors must be appropriately addressed to minimize the impact that recovery from a disability has on a person’s life. Successful functional recovery enables the person to self-manage symptoms, reduce disruption-associated stress, preserve mental health, and maintain healthy relationships at home and work. An example is the patient who has successfully coped with the entire predicament that their medical condition posed and resumed their usual daily routine and responsibilities at home and at work—albeit sometimes with temporary or permanent modification necessitated by their specific condition.
Strategies that help patients stay at, or return to, their job
Physicians who anticipate, monitor, and actively manage the duration of a work disability can improve patient outcomes by minimizing life disruption, avoiding unnecessary medical care, and shortening the period of absence from work.
Key strategy: Set expectations for functional recovery early in the episode, including a forecast of how long it will take to get life and work back to normal.26,27 This is similar to discussing expectations about pain before surgery, which has been shown to decrease subsequent requests for opioids.28 It is crucial to educate the patient about timelines, define functional outcomes, and encourage them to set goals for recovery.29
Devise an evidence-based treatment plan. A fundamental way to reduce disability duration is to (1) devise a treatment plan that is evidence based and (2) take the most effective route to recovery. Given the pace with which medical research changes the understanding of diseases and treatments, it is essential to rely on up-to-date, comprehensive, independent, and authoritative resources to support your care decisions.
Aligning clinical practice with evidence-based medicine (EBM) is a good way to accomplish that goal. By definition, EBM practice guidelines recommend the safest and most effective treatments after unbiased assessment of the best available research. Increasingly, EBM is adopted to improve clinical and functional outcomes, establish national standards of care, and set criteria to evaluate clinical performance.30
Continue to: Utilize established guidelines
Utilize established guidelines. A tactic that can make it easier to discuss return to work with patients is to rely on an independent and authoritative reference set of codified disability duration guidelines, which, typically, can be searched by diagnosis, procedure, or presenting symptoms. Such guidelines provide a condition-specific expected duration of work disability in the form of number of days, with shortest, typical, and maximum durations for different levels of job demands. If necessary, you can then adjust the guideline’s estimated duration to account for the patient’s age, underlying state of health, comorbidities, and so forth.
The use of disability duration guidelines at the point of care can facilitate the process of setting early and appropriate expectations for a patient’s recovery. If a patient is confrontational in response to your recommendation on the duration of work disability, guidelines can be used to address specific objections and facilitate understanding of functional recovery.
Consider the employer’s needs. To support return-to-work efforts, your guidance about work should consider the employer’s business needs. Employers require that the patient’s abilities, restrictions, and limitations be described in concrete terms because they must decide which specific tasks are unsafe and which ones they can reasonably expect the recovering worker to perform. However, employers often fail to send information to the physician about the patient’s job tasks—such that the clinician must rely on patient self-reporting, which might be inaccurate, incomplete, or biased.15 When a patient needs protection against foreseeable harm, highlight specific activities that are currently unsafe on the recovery timeline.
Employers rely on the physician to (1) estimate what the patient can do and (2) describe work ability in clear, objective terms that both patient and employer can interpret (TABLE). For example, “no heavy lifting” might be hard for an employer to interpret; “may lift 10 pounds from the floor to the waist as many as 12 times an hour” might be applied in a more practical manner to help a patient return to work safely.31 Including specific numbers, rates, and metrics in activity restrictions can also help demonstrate improvement over the course of treatment.

Be clear and specific on work restrictions. During recovery, it is important to tell the patient which temporary work restrictions are intended to prevent further injury or recurrence (prophylactic work restrictions) and which are an estimate of what they are able to do safely at work (capacity-based restrictions). Your written work restrictions form should be kept separate from private medical information because those restrictions will be the basis of subsequent conversations between patient and employer, who should be invited to give feedback if the guidance needs revision or clarification.
Continue to: Employer programs
Employer programs, such as modified duty, transitional duty, or early return to work programs, have been found to resolve claims faster and improve recovery outcomes.10,12 Such programs might also reduce occupational stress and improve productivity when an employee realizes that their functional abilities are matched to realistic job expectations during recovery.16 You can play an important role in empowering your patients to seek out these support programs.
What’s ahead for managing disability durations?
Work disability duration is influenced by the complex mix of biological, psychosocial, and economic variables that we have touched on here. All stakeholders involved in the recovery process should support the patient’s ability to live life with as few restrictions as possible; you play a key role in their recovery by focusing on ability, highlighting remaining capabilities, emphasizing activities that are safe to perform, and encouraging acceptance of, and adaptation to, any irrevocable losses.
This is a holistic approach that might help patients overcome the stress and anxiety associated with major life events arising from illness or injury that trigger disability benefits. Open communication and establishing a shared goal, among all involved, of the best possible outcome increases the likelihood that working patients will return to their familiar life or find another positive path forward.
Using EBM and disability duration guidelines can help decrease the length of life–work disruption by ensuring that patients are given a diagnosis, treated, and managed appropriately.32,33 Although these practices have been adopted by some physicians, health care systems, and insurers, they are not being implemented systematically and are unlikely to become ubiquitous unless they are mandated by payers or by law.
Family physicians are front-line providers for America’s workforce. They are distinctly situated to help patients achieve their best life at home and work. Improving the timeliness and quality of work guidance provided by the physician is an important way to minimize the impact of health problems on working people’s lives and livelihoods—and to help them stay employed.
CORRESPONDENCE
Kerri Wizner, MPH, 10355 Westmoor Drive, Westminster, CO 80021; [email protected].
1. Pransky G, Katz JN, Benjamin K, et al. Improving the physician role in evaluating work ability and managing disability: A survey of primary care practitioners. Disabil Rehabil. 2002;24:867-874. doi: 10.1080/09638280210142176
2. Hollenbeck K. Promoting Retention or Reemployment of Workers After a Significant Injury or Illness. Mathematica Policy Research; October 22, 2015. Accessed June 1, 2021. https://mathematica.org/publications/promoting-retention-or-reemployment-of-workers-after-a-significant-injury-or-illness
3. Poor health costs us employers $530 billion and 1.4 billion work days of absence and impaired performance according to Integrated Benefits Institute. Press release. November 15, 2018. Accessed June 1, 2021. www.ibiweb.org/poor-health-costs-us-employers-530-billion-and-1-4-billion-work-days-of-absence-and-impaired-performance
4. US Bureau of Labor Statistics. Life and disability insurance benefits: How extensive is the employer-provided safety net? BLS looks at life and disability benefits. Program Perspectives. 2010;2:7:1-4. Accessed June 8, 2021. www.bls.gov/opub/btn/archive/program-perspectives-on-life-and-disability-insurance-benefits.pdf
5. Kettlewell N, Morris RW, Ho N, et al. The differential impact of major life events on cognitive and affective wellbeing. SSM Popul Health. 2019;10:100533. doi: 10.1016/j.ssmph.2019.100533
6. Contreary K, Ben-Shalom Y, Gifford B. Using predictive analytics for early identification of short-term disability claimants who exhaust their benefits. J Occup Rehabil. 2018;28:584-596. doi: 10.1007/s10926-018-9815-5
7. Hultin H, Lindholm C, Möller J. Is there an association between long-term sick leave and disability pension and unemployment beyond the effect of health status? – A cohort study. PLoS One. 2012;7:e35614. doi: 10.1371/journal.pone.0035614
8. Canadian Medical Association. CMA policy: The treating physician’s role in helping patients return to work after an illness or injury (update 2013); 2013:1-6. Accessed June 1, 2021. https://policybase.cma.ca/documents/policypdf/PD13-05.pdf
9. Gifford B. Temporarily disabled workers account for a disproportionate share of health care payments. Health Aff (Millwood). 2017;36:245-249. doi:10.1377/hlthaff.2016.1013
10. Rueda S, Chambers L, Wilson M, et al. Association of returning to work with better health in working-aged adults: a systematic review. Am J Public Health. 2012;102:541-556. doi: 10.2105/AJPH.2011.300401
11. Modini M, Joyce S, Mykletun A, et al. The mental health benefits of employment: results of a systematic meta-review. Australas Psychiatry. 2016;24:331-336. doi: 10.1177/1039856215618523
12. Shaw WS, Nelson CC, Woiszwillo MJ, et al. Early return to work has benefits for relief of back pain and functional recovery after controlling for multiple confounds. J Occup Environ Med. 2018;60:901-910. doi: 10.1097/JOM.0000000000001380
13. Jurisic M, Bean M, Harbaugh J, et al. The personal physician’s role in helping patients with medical conditions stay at work or return to work. J Occup Environ Med. 2017;59:e125-e131. doi: 10.1097/JOM.0000000000001055
14. World Health Organization. Towards a common language for functioning, disability and health. ICF: The International Classification of Functioning, Disability and Health. 2002. Accessed June 2, 2021. www.who.int/classifications/icf/icfbeginnersguide.pdf
15. Talmage JB, Melhorn JM, Hyman MH. AMA Guides to the Evaluation of Work Ability and Return to Work. 2nd ed. American Medical Association; 2011.
16. Harrell M. Psychological factors and workforce health. In: Lee LP, Martin DW, Kancelbaum B. Occupational Medicine: A Basic Guide. American College of Occupational and Environmental Medicine; 2019. Accessed June 1, 2021. https://ohguides.acoem.org/07-psychological-factors-and-workforce-health-stress-management
17. Wickizer TM, Franklin GM, Fulton-Kehoe D. Innovations in occupational health care delivery can prevent entry into permanent disability: 8-year follow-up of the Washington State Centers for Occupational Health and Education. Med Care. 2018;56:1018-1023. doi: 10.1097/MLR.0000000000000991
18. Christian J, Wickizer T, Burton K. Implementing a community-focused health & work service. SSDI Solution Initiative, Fiscal Institute of the Committee for a Responsible Federal Budget. May 2019. Accessed June 2, 2021. www.crfb.org/sites/default/files/Implementing_a_Community-Focused_HWS.pdf
19. Macpherson RA, Koehoorn M, Fan J, et al. Do differences in work disability duration between men and women vary by province in Canada? J Occup Rehabil. 2018;29:560-568. doi: 10.1007/s10926-018-9819-1
20. Rainville J, Pransky G, Indahl A, et al. The physician as disability advisor for patients with musculoskeletal complaints. Spine (Phila Pa 1976). 2005;30:2579-2584. doi: 10.1097/01.brs.0000186589.69382.1d
21. Jay K, Thorsen SV, Sundstrup E, et al. Fear avoidance beliefs and risk of long-term sickness absence: prospective cohort study among workers with musculoskeletal pain. Pain Res Treat. 2018;2018:8347120. doi: 10.1155/2018/8347120
22. Burgard S, Lin KY. Bad jobs, bad health? How work and working conditions contribute to health disparities. Am Behav Sci. 2013;57:10.1177/0002764213487347. doi: 10.1177/0002764213487347
23. Soklaridis S, Tang G, Cartmill C, et al. “Can you go back to work?” Family physicians’ experiences with assessing patients’ functional ability to return to work. Can Fam Physician. 2011;57:202-209.
24. Peters SE, Truong AP, Johnston V. Stakeholders identify similar barriers but different strategies to facilitate return-to-work: a vignette of a worker with an upper extremity condition. Work. 2018;59:401-412. doi: 10.3233/WOR-182692
25. Shraim M, Cifuentes M, Willetts JL, et al. Regional socioeconomic disparities in outcomes for workers with low back pain in the United States. Am J Ind Med. 2017;60:472-483. doi: 10.1002/ajim.22712
26. Hill JC, Fritz JM. Psychosocial influences on low back pain, disability, and response to treatment. Phys Ther. 2011;91:712-721. doi: 10.2522/ptj.20100280
27. Aasdahl L, Pape K, Jensen C, et al. Associations between the readiness for return to work scale and return to work: a prospective study. J Occup Rehabil. 2018;28:97-106. doi: 10.1007/s10926-017-9705-2
28. Pino C, Covington M. Prescription of opioids for acute pain in opioid naïve patients. UpToDate Web site. February 9, 2021. Accessed June 2, 2021. www.uptodate.com/contents/prescription-of-opioids-for-acute-pain-in-opioid-naive-patients
29. Cancelliere C, Donovan J, Stochkendahl MJ, et al. Factors affecting return to work after injury or illness: best evidence synthesis of systematic reviews. Chiropr Man Therap. 2016;24:32. doi: 10.1186/s12998-016-0113-z
30. Lewis SJ, Orland BI. The importance and impact of evidence-based medicine. J Manag Care Pharm. 2004;10(5 suppl A):S3-S5. doi: 10.18553/jmcp.2004.10.S5-A.S3
31. Rupe KL. Work restrictions: documenting a patient’s return to work. Nurse Pract. 2010;35:49-53. doi: 10.1097/01.NPR.0000388901.49604.a8
32. Owens JD, Hegmann KT, Thiese MS, et al. Impacts of adherence to evidence-based medicine guidelines for the management of acute low back pain on costs of worker's compensation claims. J Occup Environ Med. 2019;61:445-452. doi: 10.1097/JOM.0000000000001593
33. Gaspar FW, Kownacki R, Zaidel CS, et al. Reducing disability durations and medical costs for patients with a carpal tunnel release surgery through the use of opioid prescribing guidelines. J Occup Environ Med. 2017;59:1180-1187. doi: 10.1097/JOM.0000000000001168
All clinicians who have patients who are employed play an essential role in work disability programs—whether or not those clinicians have received formal training in occupational health. A study found that primary care clinicians are asked to provide guidance about work activities in nearly 10% of their patient encounters; however, 25% of those clinicians thought they had little influence over work disability outcomes.1
In this article, we explain why it is important for family physicians to better manage work disability at the point of care, to help patients return to their pre-injury or pre-illness level of activity.
Why managing the duration of work disability matters
Each year, millions of American workers leave their jobs—temporarily or permanently—because of illness, injury, or the effects of a chronic condition.2 It is estimated that 893 million workdays are lost annually due to a new medical problem; an additional 527 million workdays are lost due to the impact of chronic health conditions on the ability to perform at work.3 The great majority of these lost workdays are the result of personal health conditions, not work-related problems; patients must therefore cope with the accompanying disruption of life and work.
Significant injury and illness can create a life crisis, especially when there is uncertainty about future livelihood, such as an income shortfall during a lengthy recovery. Only 40% of the US workforce is covered by a short-term disability insurance program; only 10% of low-wage and low-skill workers have this type of coverage.4 Benefits rarely replace loss of income entirely, and worker compensation insurance programs provide only partial wage replacement.
In short, work disability is destabilizing and can threaten overall well-being.5
Furthermore, the longer a person remains on temporary disability, the more likely that person is to move to a publicly funded disability program or leave the workforce entirely—thus, potentially losing future earnings and self-identity related to being a working member of society.6-8
Most of the annual cost of poor health for US employers derives from medical and wage benefits ($226 billion) and impaired or reduced employee performance ($223 billion).3 In addition, temporarily disabled workers likely account for a disproportionate share of health care costs: A study found that one-half of medical and pharmacy payments were paid out to the one-quarter of employees requiring disability benefits.9
Continue to: Benefits of staying on the job
Benefits of staying on the job. Research shows that there are physical and mental health benefits to remaining at, or returning to, work after an injury or illness.10,11 For example, in a longitudinal cohort of people with low back pain, immediate or early return to work (in 1-7 days) was associated with reduced pain and improved functioning at 3 months.12 Physicians who can guide patients safely back to normal activities, including work, minimize the physical and mental health impact of the injury or illness and avoid chronicity.13
Emphasizing the importance of health, not disease or injury
Health researchers have found that diagnosis, cause, and extent of morbidity do not adequately explain observed variability in the impact of health conditions, utilization of resources, or need for services. A wider view of the functional implications of an injury or illness is therefore required for physicians to effectively recommend disability duration.
The World Health Organization recommends a shift toward a more holistic view of health, impairment, and disability, including an emphasis on functional ability, intrinsic capacity, and environmental context.14 The American Medical Association, American College of Occupational and Environmental Medicine, and Canadian Medical Association emphasize that prolonged absence from one’s normal role can be detrimental to mental, physical, and social well-being.8 These advisory groups recommend that physicians encourage patients who are unable to work to (1) focus on restoring the rhythm of their everyday life in a stepwise fashion and (2) resume their usual responsibilities as soon as possible.
Advising a patient to focus on “what you can do,” not “what you can’t do,” might make all the difference in their return to productivity. Keeping the patient’s—as well as your own—attention focused on the positive process of recovery and documenting evidence of functional progress is an important addition to (or substitute for) detailed inquiries about pain and dysfunction.
Why does duration of disability vary so much from case to case?
Disability duration is influenced by the individual patient, employer, physician, jurisdiction, insurer or benefits structure, and access to care.15 For you to effectively manage a patient who is out of work for a medical reason, it is important to understand how nonmedical variables often influence the pace of recovery and the timing of return to work (FIGURE).
Continue to: Deficient communication
Deficient communication. Often, employers, insurers, third-party administrators, and clinicians—each a key stakeholder in disability care—are disconnected from one another, resulting in poor communication with the injured worker. Such fragmented communication can delay treatment and recovery.16 Data systems are not designed to measure the duration of disability or provide proactive notification for key stakeholders who might intervene to facilitate a patient’s recovery.
Alternatively, a collaborative approach to disability management has been shown to improve outcomes.17,18 Communication among the various professionals involved can be coordinated and expedited by a case manager or disability manager hired by the medical practice, the employer, or the insurance company.
Psychosocial and economic influences can radically affect the time it takes to return to pre-injury or pre-illness functional status. Demographic variables (age, sex, income, education, and support system) influence how a person responds to a debilitating injury or illness.19 Fear of re-injury, anxiety over the intensity of pain upon movement, worry over dependency on others, and resiliency play an important role when a patient is attempting to return to full activity.20,21
Job satisfaction has been identified as the most significant variable associated with prompt return to work.15 Work has many health-enhancing aspects, including socioeconomic status, psychosocial support, and self-identity22; however, not everyone wants, or feels ready, to go back to work even once they are physically able. Workplace variables, such as the patient–employee’s dislike of the position, coworkers, or manager, have been cited by physicians as leading barriers to returning to work at an appropriate time.23,24
Other external variables. Physicians should formulate activity prescriptions and medical restrictions based on the impact the medical condition has on the usual ability to function, as well as the anticipated impact of specific activities on the body’s natural healing process. However, Rainville and colleagues found that external variables—patient requests, employer characteristics, and jurisdiction issues—considerably influence physicians’ recommendations.20 For example, benefit structure might influence how long a patient wants to remain out of work—thus altering the requests they make to their physician. Jurisdictional characteristics, such as health care systems, state workers’ compensation departments, and payer systems, all influence a patient’s recovery timeline and time away from work.25
Continue to: What does your patient need so that they can recover?
What does your patient need so that they can recover? Individual and systemic factors must be appropriately addressed to minimize the impact that recovery from a disability has on a person’s life. Successful functional recovery enables the person to self-manage symptoms, reduce disruption-associated stress, preserve mental health, and maintain healthy relationships at home and work. An example is the patient who has successfully coped with the entire predicament that their medical condition posed and resumed their usual daily routine and responsibilities at home and at work—albeit sometimes with temporary or permanent modification necessitated by their specific condition.
Strategies that help patients stay at, or return to, their job
Physicians who anticipate, monitor, and actively manage the duration of a work disability can improve patient outcomes by minimizing life disruption, avoiding unnecessary medical care, and shortening the period of absence from work.
Key strategy: Set expectations for functional recovery early in the episode, including a forecast of how long it will take to get life and work back to normal.26,27 This is similar to discussing expectations about pain before surgery, which has been shown to decrease subsequent requests for opioids.28 It is crucial to educate the patient about timelines, define functional outcomes, and encourage them to set goals for recovery.29
Devise an evidence-based treatment plan. A fundamental way to reduce disability duration is to (1) devise a treatment plan that is evidence based and (2) take the most effective route to recovery. Given the pace with which medical research changes the understanding of diseases and treatments, it is essential to rely on up-to-date, comprehensive, independent, and authoritative resources to support your care decisions.
Aligning clinical practice with evidence-based medicine (EBM) is a good way to accomplish that goal. By definition, EBM practice guidelines recommend the safest and most effective treatments after unbiased assessment of the best available research. Increasingly, EBM is adopted to improve clinical and functional outcomes, establish national standards of care, and set criteria to evaluate clinical performance.30
Continue to: Utilize established guidelines
Utilize established guidelines. A tactic that can make it easier to discuss return to work with patients is to rely on an independent and authoritative reference set of codified disability duration guidelines, which, typically, can be searched by diagnosis, procedure, or presenting symptoms. Such guidelines provide a condition-specific expected duration of work disability in the form of number of days, with shortest, typical, and maximum durations for different levels of job demands. If necessary, you can then adjust the guideline’s estimated duration to account for the patient’s age, underlying state of health, comorbidities, and so forth.
The use of disability duration guidelines at the point of care can facilitate the process of setting early and appropriate expectations for a patient’s recovery. If a patient is confrontational in response to your recommendation on the duration of work disability, guidelines can be used to address specific objections and facilitate understanding of functional recovery.
Consider the employer’s needs. To support return-to-work efforts, your guidance about work should consider the employer’s business needs. Employers require that the patient’s abilities, restrictions, and limitations be described in concrete terms because they must decide which specific tasks are unsafe and which ones they can reasonably expect the recovering worker to perform. However, employers often fail to send information to the physician about the patient’s job tasks—such that the clinician must rely on patient self-reporting, which might be inaccurate, incomplete, or biased.15 When a patient needs protection against foreseeable harm, highlight specific activities that are currently unsafe on the recovery timeline.
Employers rely on the physician to (1) estimate what the patient can do and (2) describe work ability in clear, objective terms that both patient and employer can interpret (TABLE). For example, “no heavy lifting” might be hard for an employer to interpret; “may lift 10 pounds from the floor to the waist as many as 12 times an hour” might be applied in a more practical manner to help a patient return to work safely.31 Including specific numbers, rates, and metrics in activity restrictions can also help demonstrate improvement over the course of treatment.
Be clear and specific on work restrictions. During recovery, it is important to tell the patient which temporary work restrictions are intended to prevent further injury or recurrence (prophylactic work restrictions) and which are an estimate of what they are able to do safely at work (capacity-based restrictions). Your written work restrictions form should be kept separate from private medical information because those restrictions will be the basis of subsequent conversations between patient and employer, who should be invited to give feedback if the guidance needs revision or clarification.
Continue to: Employer programs
Employer programs, such as modified duty, transitional duty, or early return to work programs, have been found to resolve claims faster and improve recovery outcomes.10,12 Such programs might also reduce occupational stress and improve productivity when an employee realizes that their functional abilities are matched to realistic job expectations during recovery.16 You can play an important role in empowering your patients to seek out these support programs.
What’s ahead for managing disability durations?
Work disability duration is influenced by the complex mix of biological, psychosocial, and economic variables that we have touched on here. All stakeholders involved in the recovery process should support the patient’s ability to live life with as few restrictions as possible; you play a key role in their recovery by focusing on ability, highlighting remaining capabilities, emphasizing activities that are safe to perform, and encouraging acceptance of, and adaptation to, any irrevocable losses.
This is a holistic approach that might help patients overcome the stress and anxiety associated with major life events arising from illness or injury that trigger disability benefits. Open communication and establishing a shared goal, among all involved, of the best possible outcome increases the likelihood that working patients will return to their familiar life or find another positive path forward.
Using EBM and disability duration guidelines can help decrease the length of life–work disruption by ensuring that patients are given a diagnosis, treated, and managed appropriately.32,33 Although these practices have been adopted by some physicians, health care systems, and insurers, they are not being implemented systematically and are unlikely to become ubiquitous unless they are mandated by payers or by law.
Family physicians are front-line providers for America’s workforce. They are distinctly situated to help patients achieve their best life at home and work. Improving the timeliness and quality of work guidance provided by the physician is an important way to minimize the impact of health problems on working people’s lives and livelihoods—and to help them stay employed.
CORRESPONDENCE
Kerri Wizner, MPH, 10355 Westmoor Drive, Westminster, CO 80021; [email protected].
1. Pransky G, Katz JN, Benjamin K, et al. Improving the physician role in evaluating work ability and managing disability: A survey of primary care practitioners. Disabil Rehabil. 2002;24:867-874. doi: 10.1080/09638280210142176
2. Hollenbeck K. Promoting Retention or Reemployment of Workers After a Significant Injury or Illness. Mathematica Policy Research; October 22, 2015. Accessed June 1, 2021. https://mathematica.org/publications/promoting-retention-or-reemployment-of-workers-after-a-significant-injury-or-illness
3. Poor health costs us employers $530 billion and 1.4 billion work days of absence and impaired performance according to Integrated Benefits Institute. Press release. November 15, 2018. Accessed June 1, 2021. www.ibiweb.org/poor-health-costs-us-employers-530-billion-and-1-4-billion-work-days-of-absence-and-impaired-performance
4. US Bureau of Labor Statistics. Life and disability insurance benefits: How extensive is the employer-provided safety net? BLS looks at life and disability benefits. Program Perspectives. 2010;2:7:1-4. Accessed June 8, 2021. www.bls.gov/opub/btn/archive/program-perspectives-on-life-and-disability-insurance-benefits.pdf
5. Kettlewell N, Morris RW, Ho N, et al. The differential impact of major life events on cognitive and affective wellbeing. SSM Popul Health. 2019;10:100533. doi: 10.1016/j.ssmph.2019.100533
6. Contreary K, Ben-Shalom Y, Gifford B. Using predictive analytics for early identification of short-term disability claimants who exhaust their benefits. J Occup Rehabil. 2018;28:584-596. doi: 10.1007/s10926-018-9815-5
7. Hultin H, Lindholm C, Möller J. Is there an association between long-term sick leave and disability pension and unemployment beyond the effect of health status? – A cohort study. PLoS One. 2012;7:e35614. doi: 10.1371/journal.pone.0035614
8. Canadian Medical Association. CMA policy: The treating physician’s role in helping patients return to work after an illness or injury (update 2013); 2013:1-6. Accessed June 1, 2021. https://policybase.cma.ca/documents/policypdf/PD13-05.pdf
9. Gifford B. Temporarily disabled workers account for a disproportionate share of health care payments. Health Aff (Millwood). 2017;36:245-249. doi:10.1377/hlthaff.2016.1013
10. Rueda S, Chambers L, Wilson M, et al. Association of returning to work with better health in working-aged adults: a systematic review. Am J Public Health. 2012;102:541-556. doi: 10.2105/AJPH.2011.300401
11. Modini M, Joyce S, Mykletun A, et al. The mental health benefits of employment: results of a systematic meta-review. Australas Psychiatry. 2016;24:331-336. doi: 10.1177/1039856215618523
12. Shaw WS, Nelson CC, Woiszwillo MJ, et al. Early return to work has benefits for relief of back pain and functional recovery after controlling for multiple confounds. J Occup Environ Med. 2018;60:901-910. doi: 10.1097/JOM.0000000000001380
13. Jurisic M, Bean M, Harbaugh J, et al. The personal physician’s role in helping patients with medical conditions stay at work or return to work. J Occup Environ Med. 2017;59:e125-e131. doi: 10.1097/JOM.0000000000001055
14. World Health Organization. Towards a common language for functioning, disability and health. ICF: The International Classification of Functioning, Disability and Health. 2002. Accessed June 2, 2021. www.who.int/classifications/icf/icfbeginnersguide.pdf
15. Talmage JB, Melhorn JM, Hyman MH. AMA Guides to the Evaluation of Work Ability and Return to Work. 2nd ed. American Medical Association; 2011.
16. Harrell M. Psychological factors and workforce health. In: Lee LP, Martin DW, Kancelbaum B. Occupational Medicine: A Basic Guide. American College of Occupational and Environmental Medicine; 2019. Accessed June 1, 2021. https://ohguides.acoem.org/07-psychological-factors-and-workforce-health-stress-management
17. Wickizer TM, Franklin GM, Fulton-Kehoe D. Innovations in occupational health care delivery can prevent entry into permanent disability: 8-year follow-up of the Washington State Centers for Occupational Health and Education. Med Care. 2018;56:1018-1023. doi: 10.1097/MLR.0000000000000991
18. Christian J, Wickizer T, Burton K. Implementing a community-focused health & work service. SSDI Solution Initiative, Fiscal Institute of the Committee for a Responsible Federal Budget. May 2019. Accessed June 2, 2021. www.crfb.org/sites/default/files/Implementing_a_Community-Focused_HWS.pdf
19. Macpherson RA, Koehoorn M, Fan J, et al. Do differences in work disability duration between men and women vary by province in Canada? J Occup Rehabil. 2018;29:560-568. doi: 10.1007/s10926-018-9819-1
20. Rainville J, Pransky G, Indahl A, et al. The physician as disability advisor for patients with musculoskeletal complaints. Spine (Phila Pa 1976). 2005;30:2579-2584. doi: 10.1097/01.brs.0000186589.69382.1d
21. Jay K, Thorsen SV, Sundstrup E, et al. Fear avoidance beliefs and risk of long-term sickness absence: prospective cohort study among workers with musculoskeletal pain. Pain Res Treat. 2018;2018:8347120. doi: 10.1155/2018/8347120
22. Burgard S, Lin KY. Bad jobs, bad health? How work and working conditions contribute to health disparities. Am Behav Sci. 2013;57:10.1177/0002764213487347. doi: 10.1177/0002764213487347
23. Soklaridis S, Tang G, Cartmill C, et al. “Can you go back to work?” Family physicians’ experiences with assessing patients’ functional ability to return to work. Can Fam Physician. 2011;57:202-209.
24. Peters SE, Truong AP, Johnston V. Stakeholders identify similar barriers but different strategies to facilitate return-to-work: a vignette of a worker with an upper extremity condition. Work. 2018;59:401-412. doi: 10.3233/WOR-182692
25. Shraim M, Cifuentes M, Willetts JL, et al. Regional socioeconomic disparities in outcomes for workers with low back pain in the United States. Am J Ind Med. 2017;60:472-483. doi: 10.1002/ajim.22712
26. Hill JC, Fritz JM. Psychosocial influences on low back pain, disability, and response to treatment. Phys Ther. 2011;91:712-721. doi: 10.2522/ptj.20100280
27. Aasdahl L, Pape K, Jensen C, et al. Associations between the readiness for return to work scale and return to work: a prospective study. J Occup Rehabil. 2018;28:97-106. doi: 10.1007/s10926-017-9705-2
28. Pino C, Covington M. Prescription of opioids for acute pain in opioid naïve patients. UpToDate Web site. February 9, 2021. Accessed June 2, 2021. www.uptodate.com/contents/prescription-of-opioids-for-acute-pain-in-opioid-naive-patients
29. Cancelliere C, Donovan J, Stochkendahl MJ, et al. Factors affecting return to work after injury or illness: best evidence synthesis of systematic reviews. Chiropr Man Therap. 2016;24:32. doi: 10.1186/s12998-016-0113-z
30. Lewis SJ, Orland BI. The importance and impact of evidence-based medicine. J Manag Care Pharm. 2004;10(5 suppl A):S3-S5. doi: 10.18553/jmcp.2004.10.S5-A.S3
31. Rupe KL. Work restrictions: documenting a patient’s return to work. Nurse Pract. 2010;35:49-53. doi: 10.1097/01.NPR.0000388901.49604.a8
32. Owens JD, Hegmann KT, Thiese MS, et al. Impacts of adherence to evidence-based medicine guidelines for the management of acute low back pain on costs of worker's compensation claims. J Occup Environ Med. 2019;61:445-452. doi: 10.1097/JOM.0000000000001593
33. Gaspar FW, Kownacki R, Zaidel CS, et al. Reducing disability durations and medical costs for patients with a carpal tunnel release surgery through the use of opioid prescribing guidelines. J Occup Environ Med. 2017;59:1180-1187. doi: 10.1097/JOM.0000000000001168
PRACTICE RECOMMENDATIONS
› Set appropriate expectations for the patient at the start of any episode of work disability: Estimate the course of functional recovery over time and the total duration of life–work disruption. A
› Include detailed activity prescriptions in the treatment plan, with stepwise progression over time toward full recovery. B
Strength of recommendation (SOR)
A Good-quality patient-oriented evidence
B Inconsistent or limited-quality patient-oriented evidence
C Consensus, usual practice, opinion, disease-oriented evidence, case series

Can family physicians accurately screen for AAA with point-of-care ultrasound?
EVIDENCE SUMMARY
Meta-analysis demonstrates accuracy of nonradiologist providers with POCUS
A systematic review and meta-analysis (11 studies; 946 exams) compared nonradiologist-performed AAA screening with POCUS vs radiologist-performed aortic imaging as a gold standard. Eight trials involved emergency medicine physicians (718 exams); 1 trial, surgical residents (104 exams); 1 trial, primary care internal medicine physicians (79 exams); and 1 trial, rural family physicians (45 exams). The majority of studies were conducted in Ireland, the United Kingdom, Australia, and Canada, with 4 trials performed in the United States.1
Researchers compared all POCUS exam findings with radiologist-performed imaging (using ultrasound, computed tomography, magnetic resonance imaging, or angiography) and with operative findings or pathology where available. There were 193 true positives, 8 false-positives, 740 true negatives, and 5 false-negatives. Primary care physicians identified 6 patients with AAA, with no false-positives or false-negatives. Overall, POCUS demonstrated a sensitivity of 0.975 (95% CI, 0.942 to 0.992) and a specificity of 0.989 (95% CI, 0.979 to 0.995).1
Nonradiologist providers received POCUS training as follows: emergency medicine residents, 5 hours to 3 days; emergency medicine physicians, 4 to 24 hours of didactics, 50 AAA scans, or American College of Emergency Medicine certification; and primary care physicians, 2.3 hours or 50 AAA scans. Information on training for surgical residents was not supplied. The authors rated the studies for quality (10-14 points on the 14-point QUADA quality score) and heterogeneity (I2 = 0 for sensitivity and I2 = .38 for specificity).1
European studies support FPs’ ability to diagnose AAA with POCUS
Two subsequent prospective diagnostic accuracy studies both found that POCUS performed by family physicians had 100% concordance with radiologist overread. The first study (in Spain) included 106 men (ages 50 and older; mean, 69 years) with chronic hypertension or a history of tobacco use. One family physician underwent training (duration not reported) by a radiologist, including experience measuring standard cross-sections of the aorta. Radiologists reviewed all POCUS images, which identified 6 patients with AAA (confirmed by CT scan). The concordance between the family physician and the radiologists was absolute (kappa = 1.0; sensitivity and specificity, 100%; positive and negative predictive values, both 1.0).2
The second study (in Denmark) compared 29 POCUS screenings for AAA performed by 5 family physicians vs a gold standard of a radiologist-performed abdominal ultrasound blinded to previous ultrasound findings. Four of the family physicians were board certified and 1 was a final-year resident in training. They all underwent a 3-day ultrasonography course that included initial e-learning followed by 2 days of hands-on training; all passed a final certification exam. The family physicians identified 1 patient with AAA. Radiologists overread all the scans and found 100% agreement with the 1 positive AAA and the 28 negative scans.3
Recommendations from others
In 2019, the US Preventive Services Task Force (USPSTF) offered a Grade “B” (moderate net benefit) recommendation for screening with ultrasonography for AAA in men ages 65 to 75 years who have ever smoked, and a Grade “C” recommendation (small net benefit) for screening men ages 65 to 75 years who have never smoked.4 In 2017, the Canadian Task Force on Preventive Health Care recommended screening all men ages 65 to 80 years with 1 ultrasound exam for AAA (weak recommendation; moderate-quality evidence). The Canadian Task Force also noted that, with adequate training, AAA screening could be performed in a family practice setting.5
Editor’s takeaway
While these studies evaluating POCUS performed by nonradiologists included a small number of family physicians, their finding that all participants (attending physicians and residents) demonstrate high sensitivity and specificity for AAA detection with relatively limited training bodes well for more widespread use of the technology. Offering POCUS to detect AAAs in family physician offices has the potential to dramatically improve access to USPSTF-recommended screening.
1. Concannon E, McHugh S, Healy DA, et al. Diagnostic accuracy of non-radiologist performed ultrasound for abdominal aortic aneurysm: systematic review and meta-analysis. Int J Clin Pract. 2014;9:1122-1129. doi: 10.1111/ijcp.12453
2. Sisó-Almirall A, Gilabert Solé R, Bru Saumell C, et al. Feasibility of hand-held-ultrasonography in the screening of abdominal aortic aneurysms and abdominal aortic atherosclerosis [article in Spanish]. Med Clin (Barc). 2013;141:417-422. doi: 10.1016/j.medcli.2013.02.038
3. Lindgaard K, Riisgaard L. ‘Validation of ultrasound examinations performed by general practitioners’. Scand J Prim Health Care. 2017;3:256-261. doi: 10.1080/02813432.2017.1358437
4. US Preventive Task Force. Screening for abdominal aortic aneurysm: US Preventive Services Task Force Recommendation Statement. JAMA. 2019;322:2211-2218. doi:10.1001/jama.2019.18928
5. Canadian Task Force on Preventive Health Care. Recommendations on screening for abdominal aortic aneurysm in primary care. CMAJ. 2017;189:E1137-E1145. doi: 10.1503/cmaj.170118
EVIDENCE SUMMARY
Meta-analysis demonstrates accuracy of nonradiologist providers with POCUS
A systematic review and meta-analysis (11 studies; 946 exams) compared nonradiologist-performed AAA screening with POCUS vs radiologist-performed aortic imaging as a gold standard. Eight trials involved emergency medicine physicians (718 exams); 1 trial, surgical residents (104 exams); 1 trial, primary care internal medicine physicians (79 exams); and 1 trial, rural family physicians (45 exams). The majority of studies were conducted in Ireland, the United Kingdom, Australia, and Canada, with 4 trials performed in the United States.1
Researchers compared all POCUS exam findings with radiologist-performed imaging (using ultrasound, computed tomography, magnetic resonance imaging, or angiography) and with operative findings or pathology where available. There were 193 true positives, 8 false-positives, 740 true negatives, and 5 false-negatives. Primary care physicians identified 6 patients with AAA, with no false-positives or false-negatives. Overall, POCUS demonstrated a sensitivity of 0.975 (95% CI, 0.942 to 0.992) and a specificity of 0.989 (95% CI, 0.979 to 0.995).1
Nonradiologist providers received POCUS training as follows: emergency medicine residents, 5 hours to 3 days; emergency medicine physicians, 4 to 24 hours of didactics, 50 AAA scans, or American College of Emergency Medicine certification; and primary care physicians, 2.3 hours or 50 AAA scans. Information on training for surgical residents was not supplied. The authors rated the studies for quality (10-14 points on the 14-point QUADA quality score) and heterogeneity (I2 = 0 for sensitivity and I2 = .38 for specificity).1
European studies support FPs’ ability to diagnose AAA with POCUS
Two subsequent prospective diagnostic accuracy studies both found that POCUS performed by family physicians had 100% concordance with radiologist overread. The first study (in Spain) included 106 men (ages 50 and older; mean, 69 years) with chronic hypertension or a history of tobacco use. One family physician underwent training (duration not reported) by a radiologist, including experience measuring standard cross-sections of the aorta. Radiologists reviewed all POCUS images, which identified 6 patients with AAA (confirmed by CT scan). The concordance between the family physician and the radiologists was absolute (kappa = 1.0; sensitivity and specificity, 100%; positive and negative predictive values, both 1.0).2
The second study (in Denmark) compared 29 POCUS screenings for AAA performed by 5 family physicians vs a gold standard of a radiologist-performed abdominal ultrasound blinded to previous ultrasound findings. Four of the family physicians were board certified and 1 was a final-year resident in training. They all underwent a 3-day ultrasonography course that included initial e-learning followed by 2 days of hands-on training; all passed a final certification exam. The family physicians identified 1 patient with AAA. Radiologists overread all the scans and found 100% agreement with the 1 positive AAA and the 28 negative scans.3
Recommendations from others
In 2019, the US Preventive Services Task Force (USPSTF) offered a Grade “B” (moderate net benefit) recommendation for screening with ultrasonography for AAA in men ages 65 to 75 years who have ever smoked, and a Grade “C” recommendation (small net benefit) for screening men ages 65 to 75 years who have never smoked.4 In 2017, the Canadian Task Force on Preventive Health Care recommended screening all men ages 65 to 80 years with 1 ultrasound exam for AAA (weak recommendation; moderate-quality evidence). The Canadian Task Force also noted that, with adequate training, AAA screening could be performed in a family practice setting.5
Editor’s takeaway
While these studies evaluating POCUS performed by nonradiologists included a small number of family physicians, their finding that all participants (attending physicians and residents) demonstrate high sensitivity and specificity for AAA detection with relatively limited training bodes well for more widespread use of the technology. Offering POCUS to detect AAAs in family physician offices has the potential to dramatically improve access to USPSTF-recommended screening.
1. Concannon E, McHugh S, Healy DA, et al. Diagnostic accuracy of non-radiologist performed ultrasound for abdominal aortic aneurysm: systematic review and meta-analysis. Int J Clin Pract. 2014;9:1122-1129. doi: 10.1111/ijcp.12453
2. Sisó-Almirall A, Gilabert Solé R, Bru Saumell C, et al. Feasibility of hand-held-ultrasonography in the screening of abdominal aortic aneurysms and abdominal aortic atherosclerosis [article in Spanish]. Med Clin (Barc). 2013;141:417-422. doi: 10.1016/j.medcli.2013.02.038
3. Lindgaard K, Riisgaard L. ‘Validation of ultrasound examinations performed by general practitioners’. Scand J Prim Health Care. 2017;3:256-261. doi: 10.1080/02813432.2017.1358437
4. US Preventive Task Force. Screening for abdominal aortic aneurysm: US Preventive Services Task Force Recommendation Statement. JAMA. 2019;322:2211-2218. doi:10.1001/jama.2019.18928
5. Canadian Task Force on Preventive Health Care. Recommendations on screening for abdominal aortic aneurysm in primary care. CMAJ. 2017;189:E1137-E1145. doi: 10.1503/cmaj.170118
EVIDENCE-BASED ANSWER:
Likely yes. Point-of-care ultrasound (POCUS) screening for abdominal aortic aneurysm (AAA) by nonradiologist physicians is 98% sensitive and 99% specific, compared with imaging performed by radiologists (strength of recommendation [SOR]: B, meta-analysis of diagnostic accuracy studies mostly involving emergency medicine physicians). European family physicians demonstrated 100% concordance with radiologist readings (SOR: C, very small subsequent diagnostic accuracy studies).

How to proceed when it comes to vitamin D
In April 2021, the US Preventive Services Task Force (USPSTF) published an updated recommendation on screening for vitamin D deficiency in adults. It reaffirmed an “I” statement first made in 2014: evidence is insufficient to balance the benefits and harms of screening.1 This recommendation applies to asymptomatic, community-dwelling, nonpregnant adults without conditions treatable with vitamin D. It’s important to remember that screening refers to testing asymptomatic individuals to detect a condition early before it causes illness. Testing performed to determine whether symptoms are evidence of an underlying condition is not screening but diagnostic testing.
The Task Force statement explains the problems they found with the current level of knowledge about screening for vitamin D deficiency. First, while 25-hydroxyvitamin D [25(OH)D] is considered the best test for vitamin D levels, it is hard to measure accurately and test results vary by the method used and laboratories doing the testing. There also is uncertainty about how best to measure vitamin D status in different racial and ethnic groups, especially those with dark skin pigmentation. In addition, 25(OH)D in the blood is predominantly the bound form, with only 10% to 15% being unbound and bioavailable. Current tests do not determine the amount of bound vs unbound 25(OH)D.1-3
There is no consensus about the optimal blood level of vitamin D or the level that defines deficiency. The Institute of Medicine (now the National Academy of Medicine—NAM) stated that serum 25(OH)D levels ≥ 20 ng/mL are adequate to meet the metabolic needs of 97.5% of people, and that levels of 12 to 20 ng/mL pose a risk of deficiency, with levels < 12 considered to be very low.4 The Endocrine Society defines deficiency as < 20 ng/mL and insufficiency as 21 to 29 ng/mL.5
The rate of testing for vitamin D deficiency in primary care in unknown, but there is evidence that since 2000, it has increased 80 fold at least among those with Medicare.6 Data from the 2011-2014 National Health and Nutrition Examination Survey showed that 5% of the population had 25(OH)D levels < 12 ng/mL and 18% had levels between 12 and 19 ng/mL.7 Some have estimated that as many as half of all adults would be considered vitamin D deficient or insufficient using current less conservative definitions, with higher rates in racial/ethnic minorities.2,8
There are no firm data on the frequency, or benefits, of screening for vitamin D levels in asymptomatic adults (and treating those found to have vitamin D deficiency). The Task Force looked for indirect evidence by examining the effect of treating vitamin D deficiency in a number of conditions and found that for some, there was adequate evidence of no benefit and for others there was inadequate evidence for possible benefits.9 No benefit was found for incidence of fractures, type 2 diabetes, and overall mortality.9 Inadequate evidence was found for incidence of cancer, cardiovascular disease, scores on measures of depression and physical functioning, and urinary tract infections in those with impaired fasting glucose.9
Known risk factors for low vitamin D levels include low vitamin D intake, older age, obesity, low UVB exposure or absorption due to long winter seasons in northern latitudes, sun avoidance, and dark skin pigmentation.1 In addition, certain medical conditions contribute to, or are caused by, low vitamin D levels—eg, osteoporosis, chronic kidney disease, malabsorption syndromes, and medication use (ie, glucocorticoids).1-3
The Task Force recommendation on screening for vitamin D deficiency differs from those of some other organizations. However, none recommend universal population-based screening. The Endocrine Society and the American Association of Clinical Endocrinologists recommend screening but only in those at risk for vitamin D deficiency.5,10 The American Academy of Family Physicians endorses the USPSTF recommendation.11
Continue to: Specific USPSTF topics related to vitamin D
Specific USPSTF topics related to vitamin D
The Task Force has specifically addressed 3 topics pertaining to vitamin D.

Prevention of falls in the elderly. In 2018 the Task Force recommended against the use of vitamin D to prevent falls in community-dwelling adults ≥ 65 years.12 This reversed its 2012 recommendation advising vitamin D supplementation to prevent falls. The Task Force re-examined the old evidence and looked at newer studies and concluded that their previous conclusion was wrong and that the evidence showed no benefit from vitamin D in preventing falls in the elderly. The reversal of a prior recommendation is rare for the USPSTF because of the rigor of its evidence reviews and its policy of not making a recommendation unless solid evidence for or against exists.
Prevention of cardiovascular disease and cancer. The Task Force concludes that current evidence is insufficient to assess the balance of benefits and harms in the use of single- or paired-nutrient supplements to prevent cardiovascular disease or cancer.13 (The exceptions are beta-carotene and vitamin E, which the Task Force recommends against.) This statement is consistent with the lack of evidence the Task Force found regarding prevention of these conditions by vitamin D supplementation in those who are vitamin D deficient.
Prevention of fractures in men and in premenopausal and postmenopausal women. For men and premenopausal women, the Task Force concludes that evidence is insufficient to assess the benefits and harms of vitamin D and calcium supplementation, alone or in combination, to prevent fractures.14 For prevention of fractures in postmenopausal women, there are 2 recommendations. The first one advises against the use of ≤ 400 IU of vitamin D and ≤ 1000 mg of calcium because the evidence indicates ineffectiveness. The second one is another “I” statement for the use of doses > 400 IU of vitamin D and > 1000 mg of calcium. These 3 recommendations apply to adults who live in the community and not in nursing homes or other institutional care facilities; they do not apply to those who have osteoporosis.

What should the family physician do?
Encourage all patients to take the recommended dietary allowances (RDA) of vitamin D. The RDA is the average daily level of intake sufficient to meet the nutrient requirements of nearly all (97%-98%) healthy individuals. Most professional organizations recommend that adults ≥ 50 years consume 800 to 1000 IU of vitamin D daily. TABLE 2 lists the RDA for vitamin D by age and sex.15 The amount of vitamin D in selected food products is listed in TABLE 3.15 Some increase in levels of vitamin D can occur as a result of sun exposure, but current practices of sun avoidance make it difficult to achieve a significant contribution to vitamin D requirements.15

Continue to: Alternatives to universal screening
Alternatives to universal screening. Screening for vitamin D deficiency might benefit some patients, although there is no evidence to support it. Universal screening will likely lead to overdiagnosis and overtreatment based on what is essentially a poorly understood blood test. This was the concern expressed by the NAM.4,16 An editorial accompanying publication of the recent USPSTF recommendation suggested not measuring vitamin D levels but instead advising patients to consume the age-based RDA of vitamin D.3 For those at increased risk for vitamin D deficiency, advise a higher dose of vitamin D (eg, 2000 IU/d, which is still lower than the upper daily limit).3
Other options are to screen for vitamin D deficiency only in those at high risk for low vitamin D levels, and to test for vitamin D deficiency in those with symptoms associated with deficiency such as bone pain and muscle weakness. These options would be consistent with recommendations from the Endocrine Society.5 Some have recommended that if testing is ordered, it should be performed by a laboratory that uses liquid chromatography-mass spectrometry because it is the criterion standard.2
Treatment options. Vitamin D deficiency can be treated with either ergocalciferol (vitamin D2) or cholecalciferol (vitamin D3). These treatments can also be recommended for those whose diets may not provide the RDA for vitamin D. Both are readily available over the counter and by prescription. The Task Force found that the harms of treating vitamin D deficiency with vitamin D at recommended doses are small to none.1 There is possibly a small increase in kidney stones with the combined use of 1000 mg/d calcium and 10 mcg (400 IU)/d vitamin D.17 Large doses of vitamin D can cause toxicity including marked hypercalcemia, nausea, vomiting, muscle weakness, neuropsychiatric disturbances, pain, loss of appetite, dehydration, polyuria, excessive thirst, and kidney stones.15A cautious evidence-based approach would be to selectively screen for vitamin D deficiency, conduct diagnostic testing when indicated, and advise vitamin D supplementation as needed.
1. USPSTF. Screening for vitamin D deficiency in adults: US Preventive Services Task Force recommendation statement. JAMA. 2021;325:1436-1442.
2. Michos ED, Kalyani RR, Segal JB. Why USPSTF still finds insufficient evidence to support screening for vitamin D deficiency. JAMA Netw Open. 2021;4:e213627.
3. Burnett-Bowie AAM, Cappola AR. The USPSTF 2021 recommendations on screening for asymptomatic vitamin D deficiency in adults: the challenge for clinicians continues. JAMA. 2021;325:1401-1402.
4. Institute of Medicine. Dietary reference intakes for calcium and vitamin D. National Academies Press; 2011. Accessed May 22, 2021. https://pubmed.ncbi.nlm.nih.gov/21796828/
5. Holick MF, Binkley NC, Bischoff-Ferrari HA, et al. Evaluation, treatment, and prevention of vitamin D deficiency: an Endocrine Society clinical practice guideline. J Clin Endocrinolgy Metab. 2011;96:1911-1930.
6. Shahangian S, Alspach TD, Astles JR, et al. Trends in laboratory test volumes for Medicare part B reimbursements, 2000-2010. Arch Pathol Lab Med. 2014;138:189-203.
7. Herrick KA, Storandt RJ, Afful J, et al. Vitamin D status in the United States, 2011-2014. Am J Clin Nutr. 2019;110:150-157.
8. Forrest KYZ, Stuhldreher WL. Prevalence and correlates of vitamin D deficiency in US adults. Nutr Res. 2011;31:48-54.
9. Kahwati LC, LeBlanc E, Weber RP, et al. Screening for vitamin D deficiency in adults: updated evidence report and systematic review for the US Preventive Services Task Force. JAMA. 2021;325:1443-1463.
10. Camacho PM, Petak SM, Binkley N, et al. American Association of Clinical Endocrinologists and American College of Endocrinology clinical practice guidelines for the diagnosis and treatment of postmenopausal osteoporosis-2016. Endocr Pract. 2016;22(supp 4):1-42.
11. AAFP. Clinical preventive services. Accessed May 22, 2021. www.aafp.org/family-physician/patient-care/clinical-recommendations/aafp-cps.html
12. USPSTF. Falls prevention in community-dwelling older adults: interventions. Accessed May 22, 2021. https://uspreventiveservicestaskforce.org/uspstf/recommendation/falls-prevention-in-older-adults-interventions
13. USPSTF. Vitamin supplementation to prevent cancer and CVD: preventive medication. Accessed May 22, 2021. https://uspreventiveservicestaskforce.org/uspstf/recommendation/vitamin-supplementation-to-prevent-cancer-and-cvd-counseling
14. USPSTF. Vitamin D, calcium, or combined supplementation for the primary prevention of fractures in community-dwelling adults: preventive medication. Accessed May 22, 2021. https://uspreventiveservicestaskforce.org/uspstf/recommendation/vitamin-d-calcium-or-combined-supplementation-for-the-primary-prevention-of-fractures-in-adults-preventive-medication
15. NIH. Vitamin D. Accessed May 22, 2021. https://ods.od.nih.gov/factsheets/VitaminD-HealthProfessional/
16. Ross AC, Manson JE, Abrams SA, et al. The 2011 report on dietary reference intakes for calcium and vitamin D from the Institute of Medicine: what clinicians need to know. J Clin Endocrinol Metab. 2011;96:53-58.
17. Jackson RD, LaCroix AZ, Gass M, et al. Calcium plus vitamin D supplementation and the risk of fractures. N Engl J Med. 2006;354:669-683.
In April 2021, the US Preventive Services Task Force (USPSTF) published an updated recommendation on screening for vitamin D deficiency in adults. It reaffirmed an “I” statement first made in 2014: evidence is insufficient to balance the benefits and harms of screening.1 This recommendation applies to asymptomatic, community-dwelling, nonpregnant adults without conditions treatable with vitamin D. It’s important to remember that screening refers to testing asymptomatic individuals to detect a condition early before it causes illness. Testing performed to determine whether symptoms are evidence of an underlying condition is not screening but diagnostic testing.
The Task Force statement explains the problems they found with the current level of knowledge about screening for vitamin D deficiency. First, while 25-hydroxyvitamin D [25(OH)D] is considered the best test for vitamin D levels, it is hard to measure accurately and test results vary by the method used and laboratories doing the testing. There also is uncertainty about how best to measure vitamin D status in different racial and ethnic groups, especially those with dark skin pigmentation. In addition, 25(OH)D in the blood is predominantly the bound form, with only 10% to 15% being unbound and bioavailable. Current tests do not determine the amount of bound vs unbound 25(OH)D.1-3
There is no consensus about the optimal blood level of vitamin D or the level that defines deficiency. The Institute of Medicine (now the National Academy of Medicine—NAM) stated that serum 25(OH)D levels ≥ 20 ng/mL are adequate to meet the metabolic needs of 97.5% of people, and that levels of 12 to 20 ng/mL pose a risk of deficiency, with levels < 12 considered to be very low.4 The Endocrine Society defines deficiency as < 20 ng/mL and insufficiency as 21 to 29 ng/mL.5
The rate of testing for vitamin D deficiency in primary care in unknown, but there is evidence that since 2000, it has increased 80 fold at least among those with Medicare.6 Data from the 2011-2014 National Health and Nutrition Examination Survey showed that 5% of the population had 25(OH)D levels < 12 ng/mL and 18% had levels between 12 and 19 ng/mL.7 Some have estimated that as many as half of all adults would be considered vitamin D deficient or insufficient using current less conservative definitions, with higher rates in racial/ethnic minorities.2,8
There are no firm data on the frequency, or benefits, of screening for vitamin D levels in asymptomatic adults (and treating those found to have vitamin D deficiency). The Task Force looked for indirect evidence by examining the effect of treating vitamin D deficiency in a number of conditions and found that for some, there was adequate evidence of no benefit and for others there was inadequate evidence for possible benefits.9 No benefit was found for incidence of fractures, type 2 diabetes, and overall mortality.9 Inadequate evidence was found for incidence of cancer, cardiovascular disease, scores on measures of depression and physical functioning, and urinary tract infections in those with impaired fasting glucose.9
Known risk factors for low vitamin D levels include low vitamin D intake, older age, obesity, low UVB exposure or absorption due to long winter seasons in northern latitudes, sun avoidance, and dark skin pigmentation.1 In addition, certain medical conditions contribute to, or are caused by, low vitamin D levels—eg, osteoporosis, chronic kidney disease, malabsorption syndromes, and medication use (ie, glucocorticoids).1-3
The Task Force recommendation on screening for vitamin D deficiency differs from those of some other organizations. However, none recommend universal population-based screening. The Endocrine Society and the American Association of Clinical Endocrinologists recommend screening but only in those at risk for vitamin D deficiency.5,10 The American Academy of Family Physicians endorses the USPSTF recommendation.11
Continue to: Specific USPSTF topics related to vitamin D
Specific USPSTF topics related to vitamin D
The Task Force has specifically addressed 3 topics pertaining to vitamin D.
Prevention of falls in the elderly. In 2018 the Task Force recommended against the use of vitamin D to prevent falls in community-dwelling adults ≥ 65 years.12 This reversed its 2012 recommendation advising vitamin D supplementation to prevent falls. The Task Force re-examined the old evidence and looked at newer studies and concluded that their previous conclusion was wrong and that the evidence showed no benefit from vitamin D in preventing falls in the elderly. The reversal of a prior recommendation is rare for the USPSTF because of the rigor of its evidence reviews and its policy of not making a recommendation unless solid evidence for or against exists.
Prevention of cardiovascular disease and cancer. The Task Force concludes that current evidence is insufficient to assess the balance of benefits and harms in the use of single- or paired-nutrient supplements to prevent cardiovascular disease or cancer.13 (The exceptions are beta-carotene and vitamin E, which the Task Force recommends against.) This statement is consistent with the lack of evidence the Task Force found regarding prevention of these conditions by vitamin D supplementation in those who are vitamin D deficient.
Prevention of fractures in men and in premenopausal and postmenopausal women. For men and premenopausal women, the Task Force concludes that evidence is insufficient to assess the benefits and harms of vitamin D and calcium supplementation, alone or in combination, to prevent fractures.14 For prevention of fractures in postmenopausal women, there are 2 recommendations. The first one advises against the use of ≤ 400 IU of vitamin D and ≤ 1000 mg of calcium because the evidence indicates ineffectiveness. The second one is another “I” statement for the use of doses > 400 IU of vitamin D and > 1000 mg of calcium. These 3 recommendations apply to adults who live in the community and not in nursing homes or other institutional care facilities; they do not apply to those who have osteoporosis.
What should the family physician do?
Encourage all patients to take the recommended dietary allowances (RDA) of vitamin D. The RDA is the average daily level of intake sufficient to meet the nutrient requirements of nearly all (97%-98%) healthy individuals. Most professional organizations recommend that adults ≥ 50 years consume 800 to 1000 IU of vitamin D daily. TABLE 2 lists the RDA for vitamin D by age and sex.15 The amount of vitamin D in selected food products is listed in TABLE 3.15 Some increase in levels of vitamin D can occur as a result of sun exposure, but current practices of sun avoidance make it difficult to achieve a significant contribution to vitamin D requirements.15
Continue to: Alternatives to universal screening
Alternatives to universal screening. Screening for vitamin D deficiency might benefit some patients, although there is no evidence to support it. Universal screening will likely lead to overdiagnosis and overtreatment based on what is essentially a poorly understood blood test. This was the concern expressed by the NAM.4,16 An editorial accompanying publication of the recent USPSTF recommendation suggested not measuring vitamin D levels but instead advising patients to consume the age-based RDA of vitamin D.3 For those at increased risk for vitamin D deficiency, advise a higher dose of vitamin D (eg, 2000 IU/d, which is still lower than the upper daily limit).3
Other options are to screen for vitamin D deficiency only in those at high risk for low vitamin D levels, and to test for vitamin D deficiency in those with symptoms associated with deficiency such as bone pain and muscle weakness. These options would be consistent with recommendations from the Endocrine Society.5 Some have recommended that if testing is ordered, it should be performed by a laboratory that uses liquid chromatography-mass spectrometry because it is the criterion standard.2
Treatment options. Vitamin D deficiency can be treated with either ergocalciferol (vitamin D2) or cholecalciferol (vitamin D3). These treatments can also be recommended for those whose diets may not provide the RDA for vitamin D. Both are readily available over the counter and by prescription. The Task Force found that the harms of treating vitamin D deficiency with vitamin D at recommended doses are small to none.1 There is possibly a small increase in kidney stones with the combined use of 1000 mg/d calcium and 10 mcg (400 IU)/d vitamin D.17 Large doses of vitamin D can cause toxicity including marked hypercalcemia, nausea, vomiting, muscle weakness, neuropsychiatric disturbances, pain, loss of appetite, dehydration, polyuria, excessive thirst, and kidney stones.15A cautious evidence-based approach would be to selectively screen for vitamin D deficiency, conduct diagnostic testing when indicated, and advise vitamin D supplementation as needed.
1. USPSTF. Screening for vitamin D deficiency in adults: US Preventive Services Task Force recommendation statement. JAMA. 2021;325:1436-1442.
2. Michos ED, Kalyani RR, Segal JB. Why USPSTF still finds insufficient evidence to support screening for vitamin D deficiency. JAMA Netw Open. 2021;4:e213627.
3. Burnett-Bowie AAM, Cappola AR. The USPSTF 2021 recommendations on screening for asymptomatic vitamin D deficiency in adults: the challenge for clinicians continues. JAMA. 2021;325:1401-1402.
4. Institute of Medicine. Dietary reference intakes for calcium and vitamin D. National Academies Press; 2011. Accessed May 22, 2021. https://pubmed.ncbi.nlm.nih.gov/21796828/
5. Holick MF, Binkley NC, Bischoff-Ferrari HA, et al. Evaluation, treatment, and prevention of vitamin D deficiency: an Endocrine Society clinical practice guideline. J Clin Endocrinolgy Metab. 2011;96:1911-1930.
6. Shahangian S, Alspach TD, Astles JR, et al. Trends in laboratory test volumes for Medicare part B reimbursements, 2000-2010. Arch Pathol Lab Med. 2014;138:189-203.
7. Herrick KA, Storandt RJ, Afful J, et al. Vitamin D status in the United States, 2011-2014. Am J Clin Nutr. 2019;110:150-157.
8. Forrest KYZ, Stuhldreher WL. Prevalence and correlates of vitamin D deficiency in US adults. Nutr Res. 2011;31:48-54.
9. Kahwati LC, LeBlanc E, Weber RP, et al. Screening for vitamin D deficiency in adults: updated evidence report and systematic review for the US Preventive Services Task Force. JAMA. 2021;325:1443-1463.
10. Camacho PM, Petak SM, Binkley N, et al. American Association of Clinical Endocrinologists and American College of Endocrinology clinical practice guidelines for the diagnosis and treatment of postmenopausal osteoporosis-2016. Endocr Pract. 2016;22(supp 4):1-42.
11. AAFP. Clinical preventive services. Accessed May 22, 2021. www.aafp.org/family-physician/patient-care/clinical-recommendations/aafp-cps.html
12. USPSTF. Falls prevention in community-dwelling older adults: interventions. Accessed May 22, 2021. https://uspreventiveservicestaskforce.org/uspstf/recommendation/falls-prevention-in-older-adults-interventions
13. USPSTF. Vitamin supplementation to prevent cancer and CVD: preventive medication. Accessed May 22, 2021. https://uspreventiveservicestaskforce.org/uspstf/recommendation/vitamin-supplementation-to-prevent-cancer-and-cvd-counseling
14. USPSTF. Vitamin D, calcium, or combined supplementation for the primary prevention of fractures in community-dwelling adults: preventive medication. Accessed May 22, 2021. https://uspreventiveservicestaskforce.org/uspstf/recommendation/vitamin-d-calcium-or-combined-supplementation-for-the-primary-prevention-of-fractures-in-adults-preventive-medication
15. NIH. Vitamin D. Accessed May 22, 2021. https://ods.od.nih.gov/factsheets/VitaminD-HealthProfessional/
16. Ross AC, Manson JE, Abrams SA, et al. The 2011 report on dietary reference intakes for calcium and vitamin D from the Institute of Medicine: what clinicians need to know. J Clin Endocrinol Metab. 2011;96:53-58.
17. Jackson RD, LaCroix AZ, Gass M, et al. Calcium plus vitamin D supplementation and the risk of fractures. N Engl J Med. 2006;354:669-683.

Transitioning patients with developmental disabilities to adult care
Some adults who have an intellectual or other developmental disability (IDD) require extensive subspecialty care; many, however, depend primarily on their family physician for the bulk of their health care. With that reliance in mind, this article provides (1) an overview of important services that family physicians can provide for their adult patients with IDD and (2) pragmatic clinical suggestions for tailoring that care. Note: We highlight only some high-impact areas of clinical focus; refer to the 2018 Canadian consensus guidelines for a comprehensive approach to optimizing primary care for this population.1
CASE
Laura S, a 24-year-old woman with Down syndrome, is visiting your clinic with her mother to establish care. Ms. S has several medical comorbidities, including type 2 diabetes, hyperlipidemia, repaired congenital heart disease, schizoaffective disorder, and hypothyroidism. She is under the care of multiple specialists, including a cardiologist and an endocrinologist. Her medications include the atypical antipsychotic risperidone, which was prescribed for her through the services of a community mental health center.

Ms. S is due for multiple preventive health screenings. She indicates that she feels nervous today talking about these screenings with a new physician.
First step in care: Proficiency in the lexicon of IDD
Three core concepts of IDD are impairment, disability, and handicap. According to the World Health Organization2:
- impairment “is any loss or abnormality of psychological, physiological, or anatomical structure or function.”
- disability “is any restriction or lack (resulting from an impairment) of ability to perform an activity in the manner or within the range considered normal for a human being.”
- handicap therefore “represents socialization of an impairment or disability, and as such it reflects the consequences for the individual—cultural, social, economic, and environmental—that stem from the presence of impairment and disability.”
Essential transition: Pediatric to adult health care
Health care transition (HCT) is the planned process of transferring care from a pediatric to an adult-based health care setting,3 comprising 3 phases:
- preparation
- transfer from pediatric to adult care
- integration into adult-based care.
Two critical components of a smooth HCT include initiating the transition early in adolescence and providing transition-support resources, which are often lacking, even in large, integrated health systems.4 Got Transition, created by the National Alliance to Advance Adolescent Health, outlines core elements of an organized HCT process (www.gottransition.org) specific to young adults with IDD, including young adults with autism spectrum disorder.5,6
Even young people who are served by a family physician and who intend to remain in that family practice as they age into adulthood require HCT services that include6:
- assessment of readiness to transition to adult care
- update of the medical history
- assessment and promotion of self-care skills
- consent discussions and optimized participation in decision-making
- transition of specialty care from pediatric to adult specialists.
Continue to: For an ideal HCT...
For an ideal HCT, full engagement of the patient, the medical home (physicians, nursing staff, and care coordinators), and the patient’s family (including the primary caregiver or guardian) is critical. In addition to preventive care visits and management of chronic disease, additional domains that require explicit attention in transitioning young people with IDD include health insurance, transportation, employment, and postsecondary education.
Young people who have special health care needs and receive high-quality HCT demonstrate improvements in adherence to care, disease-specific measures, quality of life, self-care skills, satisfaction with care, and health care utilization.7TABLE 13 lists resources identified by Berens and colleagues that are helpful in facilitating the transition.

Teach and practice disability etiquette
Societal prejudice harms people with IDD—leading to self-deprecation, alienation from the larger community, and isolation from others with IDD.8 To promote acceptance and inclusivity in residential communities, the workplace, recreational venues, and clinical settings, disability etiquette should be utilized—a set of guidelines on how to interact with patients with IDD. These include speaking to the patient directly, using clear language in an adult voice, and avoiding stereotypes about people with disabilities.9 The entire health care team, including all front-facing staff (receptionists and care and financial coordinators) and clinical staff (physicians, nurses, medical assistants), need to be educated in, and practice, disability etiquette.
Preparing for in-person visits. Pre-visit preparation, ideally by means of dialogue between health care staff and the patient or caregiver (or both), typically by telephone and in advance of the scheduled visit, is often critical for a successful first face-to-face encounter. (See “Pre-visit telephone questionnaire and script for a new adult patient with IDD,” page 287, which we developed for use in our office practice.) Outcomes of the pre-visit preparation should include identifying:
- words or actions that can trigger anxiety or panic
- de-escalation techniques, such as specific calming words and actions
- strategies for optimal communication, physical access, and physical examination.
SIDEBAR
Pre-visit telephone questionnaire and script for a new adult patient with IDD
Introduction
Hello! My name is ______________. I’m a nurse [or medical assistant] from [name of practice]. I understand that [name of patient] is coming to our office for an appointment on [date and time]. I am calling to prepare our health care team to make this first appointment successful for [name of patient] and you.
- How would [name of patient] prefer to be called?
- Who will be accompanying [name of patient] to the appointment? What parts of the appointment will that person remain for?
Describe what to expect, what the patient or caregiver should bring to the appointment, and how long the appointment will last.
- What makes [name of patient] anxious or fearful so that we might avoid doing that? Should we avoid bringing up certain topics? Should we avoid performing any procedures that are customary during a first appointment?
- Does [name of patient] have sensitivities—to light, sound, touch, etc—that we should be aware of?
Offer to have a room ready upon the patient’s arrival if remaining in the waiting area would cause too much anxiety.
- What helps calm [name of patient]? Are there some topics that put [name of patient] at ease?
- How does [name of patient] best communicate?
- Is there anything else the health care team might do to prepare for the appointment?
- Does [name of patient] need personal protective equipment, a wheelchair, oxygen, or other medical equipment upon arrival?
- What would make for a successful first appointment?
- What strategies or techniques have [name of patient’s] providers used in the past that have helped make health care visits successful?
- Is there anything else you want me to know that we haven’t talked about?
- Would it be helpful if I talked with [name of patient] now about their upcoming appointment?
Initial appointments should focus on building trust and rapport with the health care team and desensitizing the patient to the clinical environment.10 Examination techniques used with pediatric patients can be applied to this population: for example, demonstrating an examination maneuver first on the parent or caregiver; beginning the examination with the least invasive or anxiety-provoking components; and stating what you plan to do next—before you do it.
Continue to: Systematic health checks provide great value
Systematic health checks provide great value
A health check is a systematic and comprehensive health assessment that is provided annually to adults with IDD, and includes:
- specific review of signs and symptoms of health conditions that often co-occur in adults with IDD (TABLE 2Calibri11)
- screening for changes in adaptive functioning and secondary disability
- lifestyle counseling
- medication review and counseling
- immunization update
- discussion of caregiver concerns.

Regarding the last point: Many caregivers are the aging parents of the adult patient with IDD—people who have their own emerging health and support needs. You should initiate conversations about advanced planning for the needs of patients, which often involves engaging siblings and other family members to assume a greater role in caregiving.12
Benefits of the health check. A systematic review of 38 studies, comprising more than 5000 patients with IDD, found that health checks increased the detection of serious conditions, improved screening for sensory impairments, and increased the immunization rate.13 Although many patients with IDD generally understand the need for a periodic health examination, you can enhance their experience by better explaining the rationale for the health check; scheduling sufficient time for the appointment, based on the individual clinical situation; and discussing the value of laboratory testing and referrals to specialists.14
Tailoring preventive care
Many of the preventive services recommendations typically utilized by family physicians, such as guidelines from the US Preventive Services Task Force, have been developed for the general population at average risk of conditions of interest.15 Adults with IDD, depending on the cause of their developmental disability and their behavioral risk profile, might be at significantly higher (or lower) risk of cancer, heart disease, or other conditions than the general population. To address these differences, preventive care guidelines tailored to patients with certain developmental disabilities have been created, including guidelines specific to adults with Down syndrome, fragile X syndrome, Prader-Willi syndrome, Smith-Magenis syndrome, and 22q11.2 deletion (DiGeorge) syndrome.16
Clarifying the molecular genetic etiology of many developmental disabilities has led to more precise understandings about physical and behavioral health issues associated with specific developmental disabilities. For that reason, patients without a known cause for their IDD might benefit from referral to a geneticist—even in early or middle adulthood. Variables generally associated with a higher likelihood of an abnormal genetic test result include17:
- a family history of developmental disability
- a congenital malformation or dysmorphic features
- a dual diagnosis of developmental disability and co-occurring mental illness
- hypotonia
- severe or profound IDD.
Continue to: Successful implementation of preventive health screening tests...
Successful implementation of preventive health screening tests often requires ingenuity and the collective creativity of the patient, family members, staff, and family physician to allay fears and anxieties. Examples: Women who have been advised to undergo screening mammography might feel less anxious by undergoing tandem screening with their sister or mother, and colorectal cancer screening might be more easily accomplished using a fecal DNA test rather than by colonoscopy. Procedural desensitization strategies and preventive care instructional materials targeting people with IDD are posted on YouTube (for example, the “DD CARES Best Practices” series [see www.youtube.com/watch?v=EPJy4zvg4io]) and other websites.
Management of chronic disease
Evidence of health disparities in patients with IDD includes suboptimal management of chronic diseases, such as diabetes18 and hypertension,19 despite contact with a primary care physician. Nonadherence to a medication regimen might be more common in patients who live with their family or in a residential setting where there is a lower degree of supervision—that is, compared to a residence that maintains 24-hour staffing with daily nursing care and supervision. For a patient who is not so closely supervised, reviewing the medication refill history with the pharmacy, or using the so-called brown-bag technique of counting pill bottles brought to appointments, can ensure medication adherence.
CASE
As you interview Ms. S, you note that she is shy, avoids eye contact, and appears generally anxious. You calm her by noticing and complimenting her jewelry and fingernail polish. Ms. S smiles and talks about her favorite polish colors.
Her mother reports that, when Ms. S is stressed, she talks to herself alone in her bedroom. However, you do not observe evidence of schizoaffective disorder, and begin to wonder whether she needs to be taking risperidone.
Essentials of mental health care
It is estimated that one-third of adults with IDD have significant mental and behavioral health care needs.20 Patients with IDD suffer the same psychiatric disorders as the general population; some also engage in problematic behaviors, such as self-injurious actions, physical or verbal aggression (or both), property destruction, and resistance to caregiving assistance.
Continue to: Mental and behavioral health problems...
Mental and behavioral health problems can have a profound impact on the quality of life of patients with IDD, their peers, and their family and other caregivers. If untreated, these problems can lead to premature institutionalization, loss of employment or desired program participation, fractured social relationships, and caregiver withdrawal and burnout.
Initial evaluation of suspected mental and behavioral health problems begins with careful assessment for medical conditions that might be causing pain and distress, stereotypies, and other problematic behaviors. Common sources of pain and discomfort include dental and other oral disease, dysphagia, gastroesophageal reflux disease, gastritis, constipation, allergic disease, headache, musculoskeletal pathology, lower urinary tract disease, and gynecologic disorders.11 Identification and optimal treatment of medical conditions might not eliminate problematic behaviors but often decrease their frequency and intensity.
Psychoactive medications are prescribed for many patients with IDD. Many have behavioral adverse effects, such as akathisia, aggression, and disinhibition—leading to a prescribing cascade of psychoactive medication polypharmacy and escalating dosages.21 Antipsychotic medications are often initiated without a careful diagnosis, explicit outcome targets, or adequate clinical monitoring for effectiveness; in addition, they often lead to insulin resistance, metabolic syndrome, and massive weight gain.21 Even a family physician who is not the prescriber can perform an important advocacy role by critically reviewing psychoactive medications, documenting adverse effects, insisting on a clear therapeutic target, and calling for discontinuation of medications that appear to be ineffective.
Evaluation of mental and behavioral health problems requires a developmental perspective to interpret specific, observable behaviors with a proper clinical lens. For example, many patients with IDD engage in self-talk (soliloquizing) as a means of processing the world around them. This practice might escalate during a time of physical or psychological stress, and the unwary clinician might misinterpret this behavior as psychotic, leading to inappropriate prescribing of antipsychotic medication. Other psychotoform behaviors that, superficially, mimic but are typically not truly psychotic, include talk with or about imaginary friends and repetitive retelling of sometimes elaborate or grandiose tales or assertions. The failure of clinicians to recognize developmentally determined expressions of distress often leads to a misdiagnosis of schizophrenia or other psychotic illness and, consequently, inappropriate psychopharmacotherapy.
Family physicians, familiar with the use of psychiatric scales for diagnosis and treatment monitoring, should use similar scales that have been developed specifically for patients with IDD (TABLE 311). In addition, a psychiatric diagnosis manual, the Diagnostic Manual—Intellectual Disability 2, specific to people with IDD (and analogous to the Diagnostic and Statistical Manual of Mental Disorders, 5th Edition) provides modification of diagnostic criteria to account for patients who have difficulty articulating their internal emotional state and inner thoughts.22

Continue to: Problematic behaviors
Problematic behaviors that are not features of a bona fide psychiatric disorder are often best understood through functional behavioral analysis, which examines antecedents and consequences of problematic behaviors and identifies their predictable outcomes, such as gaining attention, avoiding a task, or securing a desired item. Rather than being given a prescription for psychoactive medication, many adult patients with IDD and problematic behaviors might be best served by having you order consultation with a certified behavior analyst. The analyst will conduct an evaluation and, along with family or residential staff and the patient, craft a behavioral support plan to address core drivers of the undesired behavior. Behavioral support plans might be enriched by multidisciplinary input from a speech and language pathologist, habilitation professionals, occupational and physical therapists, a neuropsychologist, and others.23
Resources to help you address the physical, mental, and behavioral health problems of these patients are available online through Vanderbilt Kennedy Center’s “Toolkit for primary care providers” (https://iddtoolkit.vkcsites.org).
CASE
During your examination, you review Ms. S’s vital signs, including body mass index (BMI). You calculate that she is morbidly obese—BMI, 37—in the setting of a known comorbidity, diabetes.
Ms. S tells you that she is interested in having a healthy lifestyle, but feels frustrated because she does not know how to make the necessary changes. You discuss with her how some medications, including risperidone, can promote weight gain, and that it is important for her mental health provider to carefully reassess whether she needs to continue the drug.
Weight management in a patient population that tends to be sedentary
Patients with IDD are more likely to live a sedentary lifestyle. Compared to adults who do not have IDD, adults with IDD—especially women and patients with Down syndrome—are reported to have a higher prevalence of obesity.24
Continue to: As in the general population...
As in the general population, the greatest success in weight management involves multidisciplinary treatment, including nutritional support, physical activity, behavioral changes, and close follow-up. The importance of such an approach was borne out by the findings of a randomized controlled trial in which a multicomponent intervention—an energy-reduced diet, physical activity, and behavioral sessions—delivered to participants or their caregivers during monthly visits produced clinically meaningful 6-month weight loss.25 Health-promoting behavioral interventions that rely on a dyadic strategy, such as peer health coaches (ie, people with IDD who have been trained as a health coach) or mentors (IDD staff trained as a health coach), might be more successful at changing health behaviors among patients with IDD than traditional office-based, individual patient education and counseling.26
Similarly, undesired weight loss demands careful evaluation and management because such loss can reflect a medically significant condition, such as gastroesophageal reflux, constipation, dysphagia, neglect, and cancer.27
Boosting the amount and effectiveness of physical activity
Young people with IDD participate in physical activity less often than their neurotypical peers; as a result, they tend to be less fit and have a higher prevalence of obesity.28 Based on a meta-analysis, interventions that focus on sport and movement skills training, such as soccer, basketball, and ball-throwing programs, might be more effective than general physical activity programs.28 In addition to year-round sports training and athletic competitions, Special Olympics conducts vital health screenings of athletes and supports community-based initiatives that address bias against patients with IDD, promote inclusion, and foster social relationships (www.specialolympics.org/our-work/inclusive-health?locale=en).
Emphasize regular activity. In adulthood, fewer than 10% of patients with IDD exercise regularly.21 According to the second edition of Physical Activity Guidelines for Americans,29 “all adults, with or without a disability, should get at least 150 minutes of aerobic physical activity a week. Activities can be broken down into smaller amounts, such as about 25 minutes a day every day.”30 Supplementation with muscle-strengthening activities (eg, yoga, weight training, and resistance-band training) provides further health benefit, such as improvement in posture and prevention of future injury.31 An ideal exercise program proposed by Tyler and Baker is based on a daily, “3-2-1” schedule (ie, of every hour of activity, 30 minutes should be of aerobic exercise; 20 minutes, of strength building; and 10 minutes, of flexibility).11 By participating in any type of physical activity, there is potential for considerable health benefit in reducing psychosocial stressors, improving mental health, counteracting metabolic syndromes, and, ultimately, reducing morbidity and mortality related to physical inactivity.
CASE
With permission from Ms. S, you send your progress notes by fax to her mental health provider at the community mental health center and request a call to discuss her case—in particular, to examine potential alternatives to risperidone. With Ms. S’s input, you also co-create an exercise prescription that includes a daily 20-minute walking program with her mother.
At the follow-up visit that is scheduled in 3 months, you anticipate adding a resistance component and balance activity to the exercise prescription to enrich Ms. S’s physical activity regimen.
CORRESPONDENCE
Carl V. Tyler Jr., MD, 14601 Detroit Avenue, Lakewood, OH, 44107; [email protected]
1. Sullivan WF, Diepstra H, Heng J, et al. Primary care of adults with intellectual and developmental disabilities: 2018 Canadian consensus guidelines. Can Fam Physician. 2018;64:254-279.
2. World Health Organization. International Classification of Impairments, Disabilities, and Handicaps: A Manual of Classification Relating to the Consequences of Disease. May 1980. Accessed May 27, 2021. https://apps.who.int/iris/bitstream/handle/10665/41003/9241541261_eng.pdf?sequence=1&isAllowed=y
3. Berens J, Wozow C, Peacock C. Transition to adult care. Phys Med Rehabil Clin N Am. 2020;31:159-170. doi:10.1016/j.pmr.2019.09.004
4. American Academy of Pediatrics; American Academy of Family Physicians; American College of Physicians; Transitions Clinical Report Authoring Group; Cooley WC, Sagerman PJ. Supporting the health care transition from adolescence to adulthood in the medical home. Pediatrics. 2011;128:182-200. doi:10.1542/peds.2011-0969
5. Dressler PB, Nguyen TK, Moody EJ, et al. Use of transition resources by primary care providers for youth with intellectual and developmental disabilities. Intellect Dev Disabil. 2018;56:56-68. doi:10.1352/1934-9556-56.1.56
6. The National Alliance to Advance Adolescent Health. Six Core Elements of Health Care Transition.™ Got Transition website. Accessed May 27, 2021. www.gottransition.org
7. Schmidt A, Ilango SM, McManus MA, et al. Outcomes of pediatric to adult health care transition interventions: an updated systematic review. J Pediatr Nurs. 2020; 51:92-107. doi: 10.1016/j.pedn.2020.01.002
8. Keith JM, Bennetto L, Rogge RD. The relationship between contact and attitudes: reducing prejudice toward individuals with intellectual and developmental disabilities. Res Dev Disabil. 2015;47:14-26. doi:10.1016/j.ridd.2015.07.032
9. United Spinal Association. Disability Etiquette: Tips on Interacting With People With Disabilities. 2015. Accessed June 9, 2021. www.unitedspinal.org/pdf/DisabilityEtiquette.pdf
10. Nathawad R, Hanks C. Optimizing the office visit for adolescents with special health care needs. Curr Probl Pediatr Adolesc Health Care. 2017;47:182-189. doi:10.1016/j.cppeds.2017.07.002
11. Tyler CV, Baker S. Intellectual Disabilities at Your Fingertips: A Health Care Resource. High Tide Press; 2009.
12. Williamson HJ, Perkins EA. Family caregivers of adults with intellectual and developmental disabilities: outcomes associated with U.S. services and supports. Intellect Dev Disabil. 2014;52:147-159. doi: 10.1352/1934-9556-52.2.147
13. Robertson J, Hatton C, Emerson E, et al. The impact of health checks for people with intellectual disabilities: an updated systematic review of evidence. Res Dev Disabil. 2014;35:2450-2462. doi:10.1016/j.ridd.2014.06.007
14. Perry J, Felce D, Kerr M, et al. Contact with primary care: the experience of people with intellectual disabilities. J Appl Res Intellect Disabil. 2014;27:200-211. doi: 10.1111/jar.12072
15. Recommendation topics. United States Preventive Services Task Force website. 2020. Accessed May 27, 2021. www.uspreventiveservicestaskforce.org
16. Developmental Disabilities Primary Care Initiative. Tools for the Primary Care of People with Developmental Disabilities. 1st ed. MUMS Guideline Clearinghouse; 2011.
17. Jang W, Kim Y, Han E, et al. Chromosomal microarray analysis as a first-tier clinical diagnostic test in patients with developmental delay/intellectual disability, autism spectrum disorders, and multiple congenital anomalies: a prospective multicenter study in Korea. Ann Lab Med. 2019;39:299-310. doi:10.3343/alm.2019.39.3.299
18. Shireman TI, Reichard A, Nazir N, et al. Quality of diabetes care for adults with developmental disabilities. Disabil Health J. 2010;3:179-185. doi:10.1016/j.dhjo.2009.10.004
19. Cyrus AC, Royer J, Carroll DD, et al. Anti-hypertensive medication use and actors related to adherence among adults with intellectual and developmental disabilities. Am J Intellect Dev Disabil. 2019;124:248-262. doi:10.1352/1944-7558-124.3.248
20. IDD/MI diagnosis. National Association for the Dually Diagnosed (NADD) website. 2019. Accessed May 27, 2021. https://thenadd.org/idd-mi-diagnosis
21. Matson JL, Mayville EA, Bielecki J, et al. Reliability of the Matson Evaluation of Drug Side Effects Scale (MEDS). Res Dev Disabil. 1998;19:501-506. doi:10.1016/s0891-4222(98)00021-3
22. Fletcher R, Barnhill J, Cooper SA. (2017). Diagnostic Manual-Intellectual Disability: A Textbook of Diagnosis of Mental Disorders in Persons with Intellectual Disability. 2nd ed. National Association for the Dually Diagnosed (NADD); 2017.
23. Marrus N, Hall L. Intellectual disability and language disorder. Child Adolesc Psychiatr Clin N Am. 2017;26:539-554. doi:10.1016/j.chc.2017.03.001
24. Rimmer JH, Yamaki K. Obesity and intellectual disability. Ment Retard Dev Disabil Res Rev. 2006;12;22-7. doi: 10.1002/mrdd.20091
25. Ptomey LT, Saunders RR, Saunders M, et al. Weight management in adults with intellectual and developmental disabilities: a randomized controlled trial of two dietary approaches. J Appl Res Intellect Disabil. 2018;31(suppl 1):82-96. doi:10.1111/jar.12348
26. Marks B, Sisirak J, Magallanes R, et al. Effectiveness of a HealthMessages peer-to-peer program for people with intellectual and developmental disabilities. Intellect Dev Disabil. 2019;57:242-258. doi:10.1352/1934-9556-57.3.242
27. Escudé C. Clinical Pearls in IDD Health care. HRS, Inc; 2020.
28. Kapsal NJ, Dicke T, Morin AJS, et al. Effects of physical activity on the physical and psychosocial health of youth with intellectual disabilities: a systematic review and meta-analysis. J Phys Act Health. 2019;16:1187-1195. doi:10.1123/jpah.2018-0675
29. Physical Activity Guidelines for Americans. 2nd ed. US Department of Health and Human Services; 2018. Accessed May 29, 2021. https://health.gov/sites/default/files/2019-09/Physical_Activity_Guidelines_2nd_edition.pdf
30. National Center on Birth Defects and Developmental Disabilities, Centers for Disease Control and Prevention. Physical activity for people with disability. September 2020. Accessed May 27, 2021. www.cdc.gov/ncbddd/disabilityandhealth/features/physical-activity-for-all.html
31. Introduction to strengthening exercises. National Center on Health, Physical Activity and Disability (NCHPAD). 2020. Accessed May 27, 2021. www.nchpad.org/374/2096/Strengthening~Exercises
Some adults who have an intellectual or other developmental disability (IDD) require extensive subspecialty care; many, however, depend primarily on their family physician for the bulk of their health care. With that reliance in mind, this article provides (1) an overview of important services that family physicians can provide for their adult patients with IDD and (2) pragmatic clinical suggestions for tailoring that care. Note: We highlight only some high-impact areas of clinical focus; refer to the 2018 Canadian consensus guidelines for a comprehensive approach to optimizing primary care for this population.1
CASE
Laura S, a 24-year-old woman with Down syndrome, is visiting your clinic with her mother to establish care. Ms. S has several medical comorbidities, including type 2 diabetes, hyperlipidemia, repaired congenital heart disease, schizoaffective disorder, and hypothyroidism. She is under the care of multiple specialists, including a cardiologist and an endocrinologist. Her medications include the atypical antipsychotic risperidone, which was prescribed for her through the services of a community mental health center.
Ms. S is due for multiple preventive health screenings. She indicates that she feels nervous today talking about these screenings with a new physician.
First step in care: Proficiency in the lexicon of IDD
Three core concepts of IDD are impairment, disability, and handicap. According to the World Health Organization2:
- impairment “is any loss or abnormality of psychological, physiological, or anatomical structure or function.”
- disability “is any restriction or lack (resulting from an impairment) of ability to perform an activity in the manner or within the range considered normal for a human being.”
- handicap therefore “represents socialization of an impairment or disability, and as such it reflects the consequences for the individual—cultural, social, economic, and environmental—that stem from the presence of impairment and disability.”
Essential transition: Pediatric to adult health care
Health care transition (HCT) is the planned process of transferring care from a pediatric to an adult-based health care setting,3 comprising 3 phases:
- preparation
- transfer from pediatric to adult care
- integration into adult-based care.
Two critical components of a smooth HCT include initiating the transition early in adolescence and providing transition-support resources, which are often lacking, even in large, integrated health systems.4 Got Transition, created by the National Alliance to Advance Adolescent Health, outlines core elements of an organized HCT process (www.gottransition.org) specific to young adults with IDD, including young adults with autism spectrum disorder.5,6
Even young people who are served by a family physician and who intend to remain in that family practice as they age into adulthood require HCT services that include6:
- assessment of readiness to transition to adult care
- update of the medical history
- assessment and promotion of self-care skills
- consent discussions and optimized participation in decision-making
- transition of specialty care from pediatric to adult specialists.
Continue to: For an ideal HCT...
For an ideal HCT, full engagement of the patient, the medical home (physicians, nursing staff, and care coordinators), and the patient’s family (including the primary caregiver or guardian) is critical. In addition to preventive care visits and management of chronic disease, additional domains that require explicit attention in transitioning young people with IDD include health insurance, transportation, employment, and postsecondary education.
Young people who have special health care needs and receive high-quality HCT demonstrate improvements in adherence to care, disease-specific measures, quality of life, self-care skills, satisfaction with care, and health care utilization.7TABLE 13 lists resources identified by Berens and colleagues that are helpful in facilitating the transition.
Teach and practice disability etiquette
Societal prejudice harms people with IDD—leading to self-deprecation, alienation from the larger community, and isolation from others with IDD.8 To promote acceptance and inclusivity in residential communities, the workplace, recreational venues, and clinical settings, disability etiquette should be utilized—a set of guidelines on how to interact with patients with IDD. These include speaking to the patient directly, using clear language in an adult voice, and avoiding stereotypes about people with disabilities.9 The entire health care team, including all front-facing staff (receptionists and care and financial coordinators) and clinical staff (physicians, nurses, medical assistants), need to be educated in, and practice, disability etiquette.
Preparing for in-person visits. Pre-visit preparation, ideally by means of dialogue between health care staff and the patient or caregiver (or both), typically by telephone and in advance of the scheduled visit, is often critical for a successful first face-to-face encounter. (See “Pre-visit telephone questionnaire and script for a new adult patient with IDD,” page 287, which we developed for use in our office practice.) Outcomes of the pre-visit preparation should include identifying:
- words or actions that can trigger anxiety or panic
- de-escalation techniques, such as specific calming words and actions
- strategies for optimal communication, physical access, and physical examination.
SIDEBAR
Pre-visit telephone questionnaire and script for a new adult patient with IDD
Introduction
Hello! My name is ______________. I’m a nurse [or medical assistant] from [name of practice]. I understand that [name of patient] is coming to our office for an appointment on [date and time]. I am calling to prepare our health care team to make this first appointment successful for [name of patient] and you.
- How would [name of patient] prefer to be called?
- Who will be accompanying [name of patient] to the appointment? What parts of the appointment will that person remain for?
Describe what to expect, what the patient or caregiver should bring to the appointment, and how long the appointment will last.
- What makes [name of patient] anxious or fearful so that we might avoid doing that? Should we avoid bringing up certain topics? Should we avoid performing any procedures that are customary during a first appointment?
- Does [name of patient] have sensitivities—to light, sound, touch, etc—that we should be aware of?
Offer to have a room ready upon the patient’s arrival if remaining in the waiting area would cause too much anxiety.
- What helps calm [name of patient]? Are there some topics that put [name of patient] at ease?
- How does [name of patient] best communicate?
- Is there anything else the health care team might do to prepare for the appointment?
- Does [name of patient] need personal protective equipment, a wheelchair, oxygen, or other medical equipment upon arrival?
- What would make for a successful first appointment?
- What strategies or techniques have [name of patient’s] providers used in the past that have helped make health care visits successful?
- Is there anything else you want me to know that we haven’t talked about?
- Would it be helpful if I talked with [name of patient] now about their upcoming appointment?
Initial appointments should focus on building trust and rapport with the health care team and desensitizing the patient to the clinical environment.10 Examination techniques used with pediatric patients can be applied to this population: for example, demonstrating an examination maneuver first on the parent or caregiver; beginning the examination with the least invasive or anxiety-provoking components; and stating what you plan to do next—before you do it.
Continue to: Systematic health checks provide great value
Systematic health checks provide great value
A health check is a systematic and comprehensive health assessment that is provided annually to adults with IDD, and includes:
- specific review of signs and symptoms of health conditions that often co-occur in adults with IDD (TABLE 2Calibri11)
- screening for changes in adaptive functioning and secondary disability
- lifestyle counseling
- medication review and counseling
- immunization update
- discussion of caregiver concerns.
Regarding the last point: Many caregivers are the aging parents of the adult patient with IDD—people who have their own emerging health and support needs. You should initiate conversations about advanced planning for the needs of patients, which often involves engaging siblings and other family members to assume a greater role in caregiving.12
Benefits of the health check. A systematic review of 38 studies, comprising more than 5000 patients with IDD, found that health checks increased the detection of serious conditions, improved screening for sensory impairments, and increased the immunization rate.13 Although many patients with IDD generally understand the need for a periodic health examination, you can enhance their experience by better explaining the rationale for the health check; scheduling sufficient time for the appointment, based on the individual clinical situation; and discussing the value of laboratory testing and referrals to specialists.14
Tailoring preventive care
Many of the preventive services recommendations typically utilized by family physicians, such as guidelines from the US Preventive Services Task Force, have been developed for the general population at average risk of conditions of interest.15 Adults with IDD, depending on the cause of their developmental disability and their behavioral risk profile, might be at significantly higher (or lower) risk of cancer, heart disease, or other conditions than the general population. To address these differences, preventive care guidelines tailored to patients with certain developmental disabilities have been created, including guidelines specific to adults with Down syndrome, fragile X syndrome, Prader-Willi syndrome, Smith-Magenis syndrome, and 22q11.2 deletion (DiGeorge) syndrome.16
Clarifying the molecular genetic etiology of many developmental disabilities has led to more precise understandings about physical and behavioral health issues associated with specific developmental disabilities. For that reason, patients without a known cause for their IDD might benefit from referral to a geneticist—even in early or middle adulthood. Variables generally associated with a higher likelihood of an abnormal genetic test result include17:
- a family history of developmental disability
- a congenital malformation or dysmorphic features
- a dual diagnosis of developmental disability and co-occurring mental illness
- hypotonia
- severe or profound IDD.
Continue to: Successful implementation of preventive health screening tests...
Successful implementation of preventive health screening tests often requires ingenuity and the collective creativity of the patient, family members, staff, and family physician to allay fears and anxieties. Examples: Women who have been advised to undergo screening mammography might feel less anxious by undergoing tandem screening with their sister or mother, and colorectal cancer screening might be more easily accomplished using a fecal DNA test rather than by colonoscopy. Procedural desensitization strategies and preventive care instructional materials targeting people with IDD are posted on YouTube (for example, the “DD CARES Best Practices” series [see www.youtube.com/watch?v=EPJy4zvg4io]) and other websites.
Management of chronic disease
Evidence of health disparities in patients with IDD includes suboptimal management of chronic diseases, such as diabetes18 and hypertension,19 despite contact with a primary care physician. Nonadherence to a medication regimen might be more common in patients who live with their family or in a residential setting where there is a lower degree of supervision—that is, compared to a residence that maintains 24-hour staffing with daily nursing care and supervision. For a patient who is not so closely supervised, reviewing the medication refill history with the pharmacy, or using the so-called brown-bag technique of counting pill bottles brought to appointments, can ensure medication adherence.
CASE
As you interview Ms. S, you note that she is shy, avoids eye contact, and appears generally anxious. You calm her by noticing and complimenting her jewelry and fingernail polish. Ms. S smiles and talks about her favorite polish colors.
Her mother reports that, when Ms. S is stressed, she talks to herself alone in her bedroom. However, you do not observe evidence of schizoaffective disorder, and begin to wonder whether she needs to be taking risperidone.
Essentials of mental health care
It is estimated that one-third of adults with IDD have significant mental and behavioral health care needs.20 Patients with IDD suffer the same psychiatric disorders as the general population; some also engage in problematic behaviors, such as self-injurious actions, physical or verbal aggression (or both), property destruction, and resistance to caregiving assistance.
Continue to: Mental and behavioral health problems...
Mental and behavioral health problems can have a profound impact on the quality of life of patients with IDD, their peers, and their family and other caregivers. If untreated, these problems can lead to premature institutionalization, loss of employment or desired program participation, fractured social relationships, and caregiver withdrawal and burnout.
Initial evaluation of suspected mental and behavioral health problems begins with careful assessment for medical conditions that might be causing pain and distress, stereotypies, and other problematic behaviors. Common sources of pain and discomfort include dental and other oral disease, dysphagia, gastroesophageal reflux disease, gastritis, constipation, allergic disease, headache, musculoskeletal pathology, lower urinary tract disease, and gynecologic disorders.11 Identification and optimal treatment of medical conditions might not eliminate problematic behaviors but often decrease their frequency and intensity.
Psychoactive medications are prescribed for many patients with IDD. Many have behavioral adverse effects, such as akathisia, aggression, and disinhibition—leading to a prescribing cascade of psychoactive medication polypharmacy and escalating dosages.21 Antipsychotic medications are often initiated without a careful diagnosis, explicit outcome targets, or adequate clinical monitoring for effectiveness; in addition, they often lead to insulin resistance, metabolic syndrome, and massive weight gain.21 Even a family physician who is not the prescriber can perform an important advocacy role by critically reviewing psychoactive medications, documenting adverse effects, insisting on a clear therapeutic target, and calling for discontinuation of medications that appear to be ineffective.
Evaluation of mental and behavioral health problems requires a developmental perspective to interpret specific, observable behaviors with a proper clinical lens. For example, many patients with IDD engage in self-talk (soliloquizing) as a means of processing the world around them. This practice might escalate during a time of physical or psychological stress, and the unwary clinician might misinterpret this behavior as psychotic, leading to inappropriate prescribing of antipsychotic medication. Other psychotoform behaviors that, superficially, mimic but are typically not truly psychotic, include talk with or about imaginary friends and repetitive retelling of sometimes elaborate or grandiose tales or assertions. The failure of clinicians to recognize developmentally determined expressions of distress often leads to a misdiagnosis of schizophrenia or other psychotic illness and, consequently, inappropriate psychopharmacotherapy.
Family physicians, familiar with the use of psychiatric scales for diagnosis and treatment monitoring, should use similar scales that have been developed specifically for patients with IDD (TABLE 311). In addition, a psychiatric diagnosis manual, the Diagnostic Manual—Intellectual Disability 2, specific to people with IDD (and analogous to the Diagnostic and Statistical Manual of Mental Disorders, 5th Edition) provides modification of diagnostic criteria to account for patients who have difficulty articulating their internal emotional state and inner thoughts.22
Continue to: Problematic behaviors
Problematic behaviors that are not features of a bona fide psychiatric disorder are often best understood through functional behavioral analysis, which examines antecedents and consequences of problematic behaviors and identifies their predictable outcomes, such as gaining attention, avoiding a task, or securing a desired item. Rather than being given a prescription for psychoactive medication, many adult patients with IDD and problematic behaviors might be best served by having you order consultation with a certified behavior analyst. The analyst will conduct an evaluation and, along with family or residential staff and the patient, craft a behavioral support plan to address core drivers of the undesired behavior. Behavioral support plans might be enriched by multidisciplinary input from a speech and language pathologist, habilitation professionals, occupational and physical therapists, a neuropsychologist, and others.23
Resources to help you address the physical, mental, and behavioral health problems of these patients are available online through Vanderbilt Kennedy Center’s “Toolkit for primary care providers” (https://iddtoolkit.vkcsites.org).
CASE
During your examination, you review Ms. S’s vital signs, including body mass index (BMI). You calculate that she is morbidly obese—BMI, 37—in the setting of a known comorbidity, diabetes.
Ms. S tells you that she is interested in having a healthy lifestyle, but feels frustrated because she does not know how to make the necessary changes. You discuss with her how some medications, including risperidone, can promote weight gain, and that it is important for her mental health provider to carefully reassess whether she needs to continue the drug.
Weight management in a patient population that tends to be sedentary
Patients with IDD are more likely to live a sedentary lifestyle. Compared to adults who do not have IDD, adults with IDD—especially women and patients with Down syndrome—are reported to have a higher prevalence of obesity.24
Continue to: As in the general population...
As in the general population, the greatest success in weight management involves multidisciplinary treatment, including nutritional support, physical activity, behavioral changes, and close follow-up. The importance of such an approach was borne out by the findings of a randomized controlled trial in which a multicomponent intervention—an energy-reduced diet, physical activity, and behavioral sessions—delivered to participants or their caregivers during monthly visits produced clinically meaningful 6-month weight loss.25 Health-promoting behavioral interventions that rely on a dyadic strategy, such as peer health coaches (ie, people with IDD who have been trained as a health coach) or mentors (IDD staff trained as a health coach), might be more successful at changing health behaviors among patients with IDD than traditional office-based, individual patient education and counseling.26
Similarly, undesired weight loss demands careful evaluation and management because such loss can reflect a medically significant condition, such as gastroesophageal reflux, constipation, dysphagia, neglect, and cancer.27
Boosting the amount and effectiveness of physical activity
Young people with IDD participate in physical activity less often than their neurotypical peers; as a result, they tend to be less fit and have a higher prevalence of obesity.28 Based on a meta-analysis, interventions that focus on sport and movement skills training, such as soccer, basketball, and ball-throwing programs, might be more effective than general physical activity programs.28 In addition to year-round sports training and athletic competitions, Special Olympics conducts vital health screenings of athletes and supports community-based initiatives that address bias against patients with IDD, promote inclusion, and foster social relationships (www.specialolympics.org/our-work/inclusive-health?locale=en).
Emphasize regular activity. In adulthood, fewer than 10% of patients with IDD exercise regularly.21 According to the second edition of Physical Activity Guidelines for Americans,29 “all adults, with or without a disability, should get at least 150 minutes of aerobic physical activity a week. Activities can be broken down into smaller amounts, such as about 25 minutes a day every day.”30 Supplementation with muscle-strengthening activities (eg, yoga, weight training, and resistance-band training) provides further health benefit, such as improvement in posture and prevention of future injury.31 An ideal exercise program proposed by Tyler and Baker is based on a daily, “3-2-1” schedule (ie, of every hour of activity, 30 minutes should be of aerobic exercise; 20 minutes, of strength building; and 10 minutes, of flexibility).11 By participating in any type of physical activity, there is potential for considerable health benefit in reducing psychosocial stressors, improving mental health, counteracting metabolic syndromes, and, ultimately, reducing morbidity and mortality related to physical inactivity.
CASE
With permission from Ms. S, you send your progress notes by fax to her mental health provider at the community mental health center and request a call to discuss her case—in particular, to examine potential alternatives to risperidone. With Ms. S’s input, you also co-create an exercise prescription that includes a daily 20-minute walking program with her mother.
At the follow-up visit that is scheduled in 3 months, you anticipate adding a resistance component and balance activity to the exercise prescription to enrich Ms. S’s physical activity regimen.
CORRESPONDENCE
Carl V. Tyler Jr., MD, 14601 Detroit Avenue, Lakewood, OH, 44107; [email protected]
1. Sullivan WF, Diepstra H, Heng J, et al. Primary care of adults with intellectual and developmental disabilities: 2018 Canadian consensus guidelines. Can Fam Physician. 2018;64:254-279.
2. World Health Organization. International Classification of Impairments, Disabilities, and Handicaps: A Manual of Classification Relating to the Consequences of Disease. May 1980. Accessed May 27, 2021. https://apps.who.int/iris/bitstream/handle/10665/41003/9241541261_eng.pdf?sequence=1&isAllowed=y
3. Berens J, Wozow C, Peacock C. Transition to adult care. Phys Med Rehabil Clin N Am. 2020;31:159-170. doi:10.1016/j.pmr.2019.09.004
4. American Academy of Pediatrics; American Academy of Family Physicians; American College of Physicians; Transitions Clinical Report Authoring Group; Cooley WC, Sagerman PJ. Supporting the health care transition from adolescence to adulthood in the medical home. Pediatrics. 2011;128:182-200. doi:10.1542/peds.2011-0969
5. Dressler PB, Nguyen TK, Moody EJ, et al. Use of transition resources by primary care providers for youth with intellectual and developmental disabilities. Intellect Dev Disabil. 2018;56:56-68. doi:10.1352/1934-9556-56.1.56
6. The National Alliance to Advance Adolescent Health. Six Core Elements of Health Care Transition.™ Got Transition website. Accessed May 27, 2021. www.gottransition.org
7. Schmidt A, Ilango SM, McManus MA, et al. Outcomes of pediatric to adult health care transition interventions: an updated systematic review. J Pediatr Nurs. 2020; 51:92-107. doi: 10.1016/j.pedn.2020.01.002
8. Keith JM, Bennetto L, Rogge RD. The relationship between contact and attitudes: reducing prejudice toward individuals with intellectual and developmental disabilities. Res Dev Disabil. 2015;47:14-26. doi:10.1016/j.ridd.2015.07.032
9. United Spinal Association. Disability Etiquette: Tips on Interacting With People With Disabilities. 2015. Accessed June 9, 2021. www.unitedspinal.org/pdf/DisabilityEtiquette.pdf
10. Nathawad R, Hanks C. Optimizing the office visit for adolescents with special health care needs. Curr Probl Pediatr Adolesc Health Care. 2017;47:182-189. doi:10.1016/j.cppeds.2017.07.002
11. Tyler CV, Baker S. Intellectual Disabilities at Your Fingertips: A Health Care Resource. High Tide Press; 2009.
12. Williamson HJ, Perkins EA. Family caregivers of adults with intellectual and developmental disabilities: outcomes associated with U.S. services and supports. Intellect Dev Disabil. 2014;52:147-159. doi: 10.1352/1934-9556-52.2.147
13. Robertson J, Hatton C, Emerson E, et al. The impact of health checks for people with intellectual disabilities: an updated systematic review of evidence. Res Dev Disabil. 2014;35:2450-2462. doi:10.1016/j.ridd.2014.06.007
14. Perry J, Felce D, Kerr M, et al. Contact with primary care: the experience of people with intellectual disabilities. J Appl Res Intellect Disabil. 2014;27:200-211. doi: 10.1111/jar.12072
15. Recommendation topics. United States Preventive Services Task Force website. 2020. Accessed May 27, 2021. www.uspreventiveservicestaskforce.org
16. Developmental Disabilities Primary Care Initiative. Tools for the Primary Care of People with Developmental Disabilities. 1st ed. MUMS Guideline Clearinghouse; 2011.
17. Jang W, Kim Y, Han E, et al. Chromosomal microarray analysis as a first-tier clinical diagnostic test in patients with developmental delay/intellectual disability, autism spectrum disorders, and multiple congenital anomalies: a prospective multicenter study in Korea. Ann Lab Med. 2019;39:299-310. doi:10.3343/alm.2019.39.3.299
18. Shireman TI, Reichard A, Nazir N, et al. Quality of diabetes care for adults with developmental disabilities. Disabil Health J. 2010;3:179-185. doi:10.1016/j.dhjo.2009.10.004
19. Cyrus AC, Royer J, Carroll DD, et al. Anti-hypertensive medication use and actors related to adherence among adults with intellectual and developmental disabilities. Am J Intellect Dev Disabil. 2019;124:248-262. doi:10.1352/1944-7558-124.3.248
20. IDD/MI diagnosis. National Association for the Dually Diagnosed (NADD) website. 2019. Accessed May 27, 2021. https://thenadd.org/idd-mi-diagnosis
21. Matson JL, Mayville EA, Bielecki J, et al. Reliability of the Matson Evaluation of Drug Side Effects Scale (MEDS). Res Dev Disabil. 1998;19:501-506. doi:10.1016/s0891-4222(98)00021-3
22. Fletcher R, Barnhill J, Cooper SA. (2017). Diagnostic Manual-Intellectual Disability: A Textbook of Diagnosis of Mental Disorders in Persons with Intellectual Disability. 2nd ed. National Association for the Dually Diagnosed (NADD); 2017.
23. Marrus N, Hall L. Intellectual disability and language disorder. Child Adolesc Psychiatr Clin N Am. 2017;26:539-554. doi:10.1016/j.chc.2017.03.001
24. Rimmer JH, Yamaki K. Obesity and intellectual disability. Ment Retard Dev Disabil Res Rev. 2006;12;22-7. doi: 10.1002/mrdd.20091
25. Ptomey LT, Saunders RR, Saunders M, et al. Weight management in adults with intellectual and developmental disabilities: a randomized controlled trial of two dietary approaches. J Appl Res Intellect Disabil. 2018;31(suppl 1):82-96. doi:10.1111/jar.12348
26. Marks B, Sisirak J, Magallanes R, et al. Effectiveness of a HealthMessages peer-to-peer program for people with intellectual and developmental disabilities. Intellect Dev Disabil. 2019;57:242-258. doi:10.1352/1934-9556-57.3.242
27. Escudé C. Clinical Pearls in IDD Health care. HRS, Inc; 2020.
28. Kapsal NJ, Dicke T, Morin AJS, et al. Effects of physical activity on the physical and psychosocial health of youth with intellectual disabilities: a systematic review and meta-analysis. J Phys Act Health. 2019;16:1187-1195. doi:10.1123/jpah.2018-0675
29. Physical Activity Guidelines for Americans. 2nd ed. US Department of Health and Human Services; 2018. Accessed May 29, 2021. https://health.gov/sites/default/files/2019-09/Physical_Activity_Guidelines_2nd_edition.pdf
30. National Center on Birth Defects and Developmental Disabilities, Centers for Disease Control and Prevention. Physical activity for people with disability. September 2020. Accessed May 27, 2021. www.cdc.gov/ncbddd/disabilityandhealth/features/physical-activity-for-all.html
31. Introduction to strengthening exercises. National Center on Health, Physical Activity and Disability (NCHPAD). 2020. Accessed May 27, 2021. www.nchpad.org/374/2096/Strengthening~Exercises
PRACTICE RECOMMENDATIONS
› Provide young people who have an intellectual or other developmental disability (IDD) with a defined, explicit process for making the transition into the adult health care system. A
› Conduct an annual comprehensive, systematic health assessment for patients who have IDD to improve detection of serious conditions and sensory impairments. A
› Encourage young people and adults with IDD to participate in regular physical activity to reduce psychosocial stressors and counteract metabolic syndromes. A
Strength of recommendation (SOR)
A Good-quality patient-oriented evidence
B Inconsistent or limited-quality patient-oriented evidence
C Consensus, usual practice, opinion, disease-oriented evidence, case series

Sen. Schumer backs federal decriminalization of marijuana
U.S. Sen. Chuck Schumer, the Senate majority leader, is cosponsoring legislation that would decriminalize marijuana at the federal level.

The Cannabis Administration & Opportunity Act would allow the federal government to regulate and tax marijuana sales for the first time and would stop the federal prosecution of people for possessing and selling the drug, The New York Times reported. States could still make their own marijuana laws, however.
The bill calls for using money raised by taxing marijuana to help poor people and communities of color that have been unduly affected by marijuana laws.
Arrests and convictions for nonviolent marijuana offenses would be automatically expunged, The New York Times reported.
“The War on Drugs has been a war on people – particularly people of color,” a draft of the bill said, adding that the bill “aims to end the decades of harm inflicted on communities of color by removing cannabis from the federal list of controlled substances and empowering states to implement their own cannabis laws.”
But passage of the bill is highly uncertain because of strong Republican opposition in the Senate, where Democrats hold a narrow majority, according to The New York Times.
Sen. Schumer signaled his intentions when he spoke on April 20, the unofficial holiday for marijuana smokers.
“Hopefully, the next time this unofficial holiday of 4/20 rolls around, our country will have made progress in addressing the massive overcriminalization of marijuana in a meaningful and comprehensive way,” he said at the time, the newspaper reported.
Cosponsors were U.S. Sen. Cory Booker of New Jersey and U.S. Sen. Ron Wyden of Oregon, chairman of the Senate Finance Committee.
A version of this article first appeared on WebMD.com.
U.S. Sen. Chuck Schumer, the Senate majority leader, is cosponsoring legislation that would decriminalize marijuana at the federal level.
The Cannabis Administration & Opportunity Act would allow the federal government to regulate and tax marijuana sales for the first time and would stop the federal prosecution of people for possessing and selling the drug, The New York Times reported. States could still make their own marijuana laws, however.
The bill calls for using money raised by taxing marijuana to help poor people and communities of color that have been unduly affected by marijuana laws.
Arrests and convictions for nonviolent marijuana offenses would be automatically expunged, The New York Times reported.
“The War on Drugs has been a war on people – particularly people of color,” a draft of the bill said, adding that the bill “aims to end the decades of harm inflicted on communities of color by removing cannabis from the federal list of controlled substances and empowering states to implement their own cannabis laws.”
But passage of the bill is highly uncertain because of strong Republican opposition in the Senate, where Democrats hold a narrow majority, according to The New York Times.
Sen. Schumer signaled his intentions when he spoke on April 20, the unofficial holiday for marijuana smokers.
“Hopefully, the next time this unofficial holiday of 4/20 rolls around, our country will have made progress in addressing the massive overcriminalization of marijuana in a meaningful and comprehensive way,” he said at the time, the newspaper reported.
Cosponsors were U.S. Sen. Cory Booker of New Jersey and U.S. Sen. Ron Wyden of Oregon, chairman of the Senate Finance Committee.
A version of this article first appeared on WebMD.com.
Closing the racial gap in minimally invasive gyn hysterectomy and myomectomy
The historical mistreatment of Black bodies in gynecologic care has bled into present day inequities—from surgeries performed on enslaved Black women and sterilization of low-income Black women under federally funded programs, to higher rates of adverse health-related outcomes among Black women compared with their non-Black counterparts.1-3 Not only is the foundation of gynecology imperfect, so too is its current-day structure.
It is not enough to identify and describe racial inequities in health care; action plans to provide equitable care are called for. In this report, we aim to 1) contextualize the data on disparities in minimally invasive gynecologic surgery, specifically hysterectomy and myomectomy candidates and postsurgical outcomes, and 2) provide recommendations to close racial gaps in gynecologic treatment for more equitable experiences for minority women.
Black women and uterine fibroids
Uterine leiomyomas, or fibroids, are not only the most common benign pelvic tumor but they also cause a significant medical and financial burden in the United States, with estimated direct costs of $4.1 ̶ 9.4 billion.4 Fibroids can affect fertility and cause pain, bulk symptoms, heavy bleeding, anemia requiring blood transfusion, and poor pregnancy outcomes. The burden of disease for uterine fibroids is greatest for Black women.
The incidence of fibroids is 2 to 3 times higher in Black women compared with White women.5 According to ultrasound-based studies, the prevalence of fibroids among women aged 18 to 30 years was 26% among Black and 7% among White asymptomatic women.6 Earlier onset and more severe symptoms mean that there is a larger potential for impact on fertility for Black women. This coupled with the historical context of mistreatment of Black bodies makes the need for personalized medicine and culturally sensitive care critical.
Inequitable management of uterine fibroids
Although tumor size, location, and patient risk factors are used to determine the best treatment approach, the American College of Obstetricians and Gynecologists (ACOG) guidelines suggest that the use of alternative treatments to surgery should be first-line management instead of hysterectomy for most benign conditions.9 Conservative management will often help alleviate symptoms, slow the growth of fibroid(s), or bridge women to menopause, and treatment options include hormonal contraception, gonadotropin-releasing hormone agonists, hysteroscopic resection, uterine artery embolization, magnetic resonance-guided focused ultrasound, and myomectomy.
The rate of conservative management prior to hysterectomy varies by setting, reflecting potential bias in treatment decisions. Some medical settings have reported a 29% alternative management rate prior to hysterectomy, while others report much higher rates.10 A study using patient data from Kaiser Permanente Northern California (KPNC) showed that, within a large, diverse, and integrated health care system, more than 80% of patients received alternative treatments before undergoing hysterectomy; for those with symptomatic leiomyomas, 74.1% used alternative treatments prior to hysterectomy, and in logistic regression there was not a difference by race.11 Nationally, Black women are more likely to have hysterectomy or myomectomy compared with a nonsurgical uterine-sparing therapy.12,13
With about 600,000 cases per year within the United States, the hysterectomy is the most frequently performed benign gynecologic surgery.14 The most common indication is for “symptomatic fibroid uterus.” The approach to decision making for route of hysterectomy involves multiple patient and surgeon factors, including history of vaginal delivery, body mass index, history of previous surgery, uterine size, informed patient preference, and surgeon volume.15-17 ACOG recommends a minimally invasive hysterectomy (MIH) whenever feasible given its benefits in postoperative pain, recovery time, and blood loss. Myomectomy, particularly among women in their reproductive years desiring management of leiomyomas, is a uterine-sparing procedure versus hysterectomy. Minimally invasive myomectomy (MIM), compared with an open abdominal route, provides for lower drop in hemoglobin levels, shorter hospital stay, less adhesion formation, and decreased postoperative pain.18
Racial variations in hysterectomy rates persist overall and according to hysterectomy type. Black women are 2 to 3 times more likely to undergo hysterectomy for leiomyomas than other racial groups.19 These differences in rates have been shown to persist even when burden of disease is the same. One study found that Black women had increased odds of hysterectomy compared with their White counterparts even when there was no difference in mean fibroid volume by race,20 calling into question provider bias. Even in a universal insurance setting, Black patients have been found to have higher rates of open hysterectomies.21 Previous studies found that, despite growing frequency of laparoscopic and robotic-assisted hysterectomies, patients of a minority race had decreased odds of undergoing a MIH compared with their White counterparts.22
While little data exist on route of myomectomy by race, a recent study found minority women were more likely to undergo abdominal myomectomy compared with White women; Black women were twice as likely to undergo abdominal myomectomy (adjusted odds ratio [aOR], 1.9; 95% confidence interval [CI], 1.7–2.0), Asian American women were more than twice as likely (aOR, 2.3; 95% CI, 1.8–2.8), and Hispanic American women were 50% more likely to undergo abdominal myomectomy (aOR, 1.5; 95% CI, 1.2–1.9) when compared with White women.23 These differences remained after controlling for potential confounders, and there appeared to be an interaction between race and fibroid weight such that racial bias alone may not explain the differences.
Finally, Black women have higher perioperative complication rates compared with non-Black women. Postoperative complications including blood transfusion after myomectomy have been shown to be twice as high among Black women compared with White women. However, once uterine size, comorbidities, and fibroid number were controlled, race was not associated with higher complications. Black women, compared with White women, have been found to have 50% increased odds of morbidity after an abdominal myomectomy.24
Continue to: How to ensure that BIPOC women get the best management...
How to ensure that BIPOC women get the best management
Eliminating disparities and providing equitable and patient-centered care for Black, Indigenous, and people of color (BIPOC) women will require research, education, training, and targeted quality improvement initiatives.
Research into fibroids and comparative treatment outcomes
Uterine fibroids, despite their major public health impact, remain understudied. With Black women carrying the highest fibroid prevalence and severity burden, especially in their childbearing years, it is imperative that research efforts be focused on outcomes by race and ethnicity. Given the significant economic impact of fibroids, more efforts should be directed toward primary prevention of fibroid formation as well as secondary prevention and limitation of fibroid growth by affordable, effective, and safe means. For example, Bratka and colleagues researched the role of vitamin D in inhibiting growth of leiomyoma cells in animal models.25 Other innovative forms of management under investigation include aromatase inhibitors, green tea, cabergoline, elagolix, paricalcitol, and epigallocatechin gallate.26 Considerations such as stress, diet, and environmental risk factors have yet to be investigated in large studies.
Research contributing to evidence-based guidelines that address the needs of different patient populations affected by uterine fibroids is critical.8 Additionally, research conducted by Black women about Black women should be prioritized. In March 2021, the Stephanie Tubbs Jones Uterine Fibroid Research and Education Act of 2021 was introduced to fund $150 million in research supported by the National Institutes of Health (NIH). This is an opportunity to develop a research database to inform evidence-based culturally informed care regarding fertility counseling, medical management, and optimal surgical approach, as well as to award funding to minority researchers. There are disparities in distribution of funds from the NIH to minority researchers. Under-represented minorities are awarded fewer NIH grants compared with their counterparts despite initiatives to increase funding. Furthermore, in 2011, Black applicants for NIH funding were two-thirds as likely as White applicants to receive grants from 2000 ̶ 2006, even when accounting for publication record and training.27 Funding BIPOC researchers fuels diversity-driven investigation and can be useful in the charge to increase fibroid research.
Education and training: Changing the work force
Achieving equity requires change in provider work force. In a study of trends across multiple specialties including obstetrics and gynecology, Blacks and Latinx are more under-represented in 2016 than in 1990 across all specialties except for Black women in obstetrics and gynecology.28 It is well documented that under-represented minorities are more likely to engage in practice, research, service, and mentorship activities aligned with their identity.29 As a higher proportion of under-represented minority obstetricians and gynecologists practice in medically underserved areas,30 this presents a unique opportunity for gynecologists to improve care for and increase research involvement among BIPOC women.
Increasing BIPOC representation in medical and health care institutions and practices is not enough, however, to achieve health equity. Data from the Association of American Medical Colleges demonstrate that between 1978 and 2017 the total number of full-time obstetrics and gynecology faculty rose nearly fourfold from 1,688 to 6,347; however, the greatest rise in proportion of faculty who were nontenured was among women who were under-represented minorities.31 Additionally, there are disparities in wage by race even after controlling for hours worked and state of residence.32 Medical and academic centers and health care institutions and practices should proactively and systematically engage in the recruitment and retention of under-represented minority physicians and people in leadership roles. This will involve creating safe and inclusive work environments, with equal pay and promotion structures.
Quality initiatives to address provider bias
Provider bias should be addressed in clinical decision making and counseling of patients. Studies focused on ultrasonography have shown an estimated cumulative incidence of fibroids by age 50 of greater than 80% for Black women and nearly 70% for White women.5 Due to the prevalence and burden of fibroids among Black women there may be a provider bias in approach to management. Addressing this bias requires quality improvement efforts and investigation into patient and provider factors in management of fibroids. Black women have been a vulnerable population in medicine due to instances of mistreatment, and often times mistrust can play a role in how a patient views his or her care decisions. A patient-centered strategy allows patient factors such as age, uterine size, and cultural background to be considered such that a provider can tailor an approach that is best for the patient. Previous minority women focus groups have demonstrated that women have a strong desire for elective treatment;33 therefore, providers should listen openly to patients about their values and their perspectives on how fibroids affect their lives. Provider bias toward surgical volume, incentive for surgery, and implicit bias need to be addressed at every institution to work toward equitable and cost-effective care.
Integrated health care systems like Southern and Northern California Permanente Medical Group, using quality initiatives, have increased their minimally invasive surgery rates. Southern California Permanente Medical Group reached a 78% rate of MIH in a system of more than 350 surgeons performing benign indication hysterectomies as reported in 2011.34 Similarly, a study within KPNC, an institution with an MIH rate greater than 95%,35 found that racial disparities in route of MIH were eliminated through a quality improvement initiative described in detail in 2018 (FIGURE and TABLE).36
Conclusions
There are recognized successes in the gynecology field’s efforts to address racial disparities. Prior studies provide insight into opportunities to improve care in medical management of leiomyomas, minimally invasive route of hysterectomy and myomectomy, postsurgical outcomes, and institutional leadership. Particularly, when systemwide approaches are taken in the delivery of health care it is possible to significantly diminish racial disparities in gynecology.35 Much work remains to be done for our health care systems to provide equitable care.
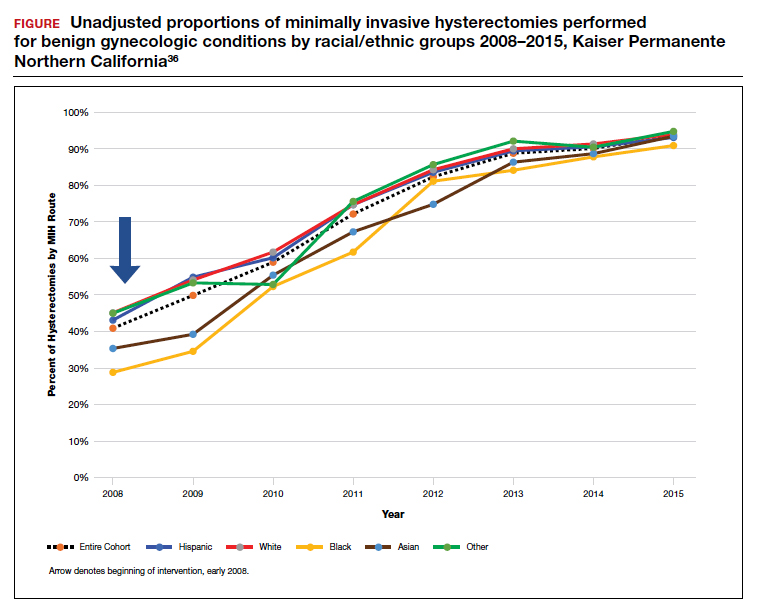
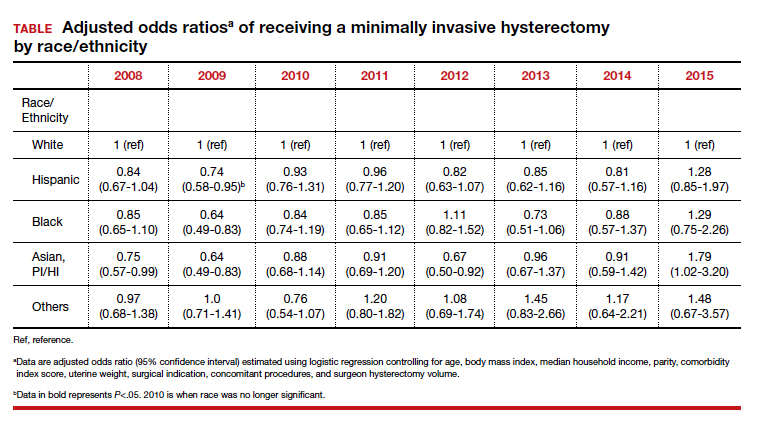
- Ojanuga D. The medical ethics of the ‘father of gynaecology,’ Dr J Marion Sims. J Med Ethics. 1993;19:28-31. doi: 10.1136/jme.19.1.28.
- Borrero S, Zite N, Creinin MD. Federally funded sterilization: time to rethink policy? Am J Public Health. 2012;102:1822-1825.
- Eaglehouse YL, Georg MW, Shriver CD, et al. Racial differences in time to breast cancer surgery and overall survival in the US Military Health System. JAMA Surg. 2019;154:e185113. doi: 10.1001/jamasurg.2018.5113.
- Soliman AM, Yang H, Du EX, et al. The direct and indirect costs of uterine fibroid tumors: a systematic review of the literature between 2000 and 2013. Am J Obstet Gynecol. 2015;213:141-160.
- Baird DD, Dunson DB, Hill MC, et al. High cumulative incidence of uterine leiomyoma in black and white women: ultrasound evidence. Am J Obstet Gynecol. 2003;188:100-107.
- Marshall LM, Spiegelman D, Barbieri RL, et al. Variation in the incidence of uterine leiomyoma among premenopausal women by age and race. Obstet Gynecol. 1997;90:967-973. doi: 10.1016/s0029-7844(97)00534-6.
- Styer AK, Rueda BR. The epidemiology and genetics of uterine leiomyoma. Best Pract Res Clin Obstet Gynaecol. 2016;34:3-12. doi: 10.1016/j.bpobgyn.2015.11.018.
- Al-Hendy A, Myers ER, Stewart E. Uterine fibroids: burden and unmet medical need. Semin Reprod Med. 2017;35:473-480. doi: 10.1055/s-0037-1607264.
- American College of Obstetricians and Gynecologists. ACOG practice bulletin. Alternatives to hysterectomy in the management of leiomyomas. Obstet Gynecol. 2008;112(2 pt 1):387-400.
- Corona LE, Swenson CW, Sheetz KH, et al. Use of other treatments before hysterectomy for benign conditions in a statewide hospital collaborative. Am J Obstet Gynecol. 2015;212:304.e1-e7. doi: 10.1016/j.ajog.2014.11.031.
- Nguyen NT, Merchant M, Ritterman Weintraub ML, et al. Alternative treatment utilization before hysterectomy for benign gynecologic conditions at a large integrated health system. J Minim Invasive Gynecol. 2019;26:847-855. doi: 10.1016/j.jmig.2018.08.013.
- Laughlin-Tommaso SK, Jacoby VL, Myers ER. Disparities in fibroid incidence, prognosis, and management. Obstet Gynecol Clin North Am. 2017;44:81-94. doi: 10.1016/j.ogc.2016.11.007.
- Borah BJ, Laughlin-Tommaso SK, Myers ER, et al. Association between patient characteristics and treatment procedure among patients with uterine leiomyomas. Obstet Gynecol. 2016;127:67-77.
- Whiteman MK, Hillis SD, Jamieson DJ, et al. Inpatient hysterectomy surveillance in the United States, 2000-2004. Am J Obstet Gynecol. 2008;198:34.e1-e7. doi:10.1016/j.ajog.2007.05.039.
- Bardens D, Solomayer E, Baum S, et al. The impact of the body mass index (BMI) on laparoscopic hysterectomy for benign disease. Arch Gynecol Obstet. 2014;289:803-807. doi: 10.1007/s00404-013-3050-2.
- Seracchioli R, Venturoli S, Vianello F, et al. Total laparoscopic hysterectomy compared with abdominal hysterectomy in the presence of a large uterus. J Am Assoc Gynecol Laparosc. 2002;9:333-338. doi: 10.1016/s1074-3804(05)60413.
- Boyd LR, Novetsky AP, Curtin JP. Effect of surgical volume on route of hysterectomy and short-term morbidity. Obstet Gynecol. 2010;116:909-915. doi: 10.1097/AOG.0b013e3181f395d9.
- Jin C, Hu Y, Chen XC, et al. Laparoscopic versus open myomectomy—a meta-analysis of randomized controlled trials. Eur J Obstet Gynecol Reprod Biol. 2009;145:14-21. doi: 10.1016/j.ejogrb.2009.03.009.
- Wechter ME, Stewart EA, Myers ER, et al. Leiomyoma-related hospitalization and surgery: prevalence and predicted growth based on population trends. Am J Obstet Gynecol. 2011;205:492.e1-e5. doi: 10.1016/j.ajog.2011.07.008.
- Bower JK, Schreiner PJ, Sternfeld B, et al. Black-White differences in hysterectomy prevalence: the CARDIA study. Am J Public Health. 2009;99:300-307. doi: 10.2105/AJPH.2008.133702.
- Ranjit A, Sharma M, Romano A, et al. Does universal insurance mitigate racial differences in minimally invasive hysterectomy? J Minim Invasive Gynecol. 2017;24. doi:10.1016/j.jmig.2017.03.016.
- Pollack LM, Olsen MA, Gehlert SJ, et al. Racial/ethnic disparities/differences in hysterectomy route in women likely eligible for minimally invasive surgery. J Minim Invasive Gynecol. 2020;27:1167-1177.e2. doi:10.1016/j.jmig.2019.09.003.
- Stentz NC, Cooney LG, Sammel MD, et al. Association of patient race with surgical practice and perioperative morbidity after myomectomy. Obstet Gynecol. 2018;132:291-297. doi: 10.1097/AOG.0000000000002738.
- Roth TM, Gustilo-Ashby T, Barber MD, et al. Effects of race and clinical factors on short-term outcomes of abdominal myomectomy. Obstet Gynecol. 2003;101(5 pt 1):881-884. doi: 10.1016/s0029-7844(03)00015-2.
- Bratka S, Diamond JS, Al-Hendy A, et al. The role of vitamin D in uterine fibroid biology. Fertil Steril. 2015;104:698-706. doi: 10.1016/j.fertnstert.2015.05.031.
- Ciebiera M, Łukaszuk K, Męczekalski B, et al. Alternative oral agents in prophylaxis and therapy of uterine fibroids—an up-to-date review. Int J Mol Sci. 2017;18:2586. doi:10.3390/ijms18122586.
- Hayden EC. Racial bias haunts NIH funding. Nature. 2015;527:145.
- Lett LA, Orji WU, Sebro R. Declining racial and ethnic representation in clinical academic medicine: a longitudinal study of 16 US medical specialties. PLoS One. 2018;13:e0207274. doi: 10.1371/journal.pone.0207274.
- Sánchez JP, Poll-Hunter N, Stern N, et al. Balancing two cultures: American Indian/Alaska Native medical students’ perceptions of academic medicine careers. J Community Health. 2016;41:871-880.
- Rayburn WF, Xierali IM, Castillo-Page L, et al. Racial and ethnic differences between obstetrician-gynecologists and other adult medical specialists. Obstet Gynecol. 2016;127:148-152. doi: 10.1097/AOG.0000000000001184.
- Esters D, Xierali IM, Nivet MA, et al. The rise of nontenured faculty in obstetrics and gynecology by sex and underrepresented in medicine status. Obstet Gynecol. 2019;134 suppl 1:34S-39S. doi: 10.1097/AOG.0000000000003484.
- Ly DP, Seabury SA, Jena AB. Differences in incomes of physicians in the United States by race and sex: observational study. BMJ. 2016;I2923. doi:10.1136/bmj.i2923.
- Groff JY, Mullen PD, Byrd T, et al. Decision making, beliefs, and attitudes toward hysterectomy: a focus group study with medically underserved women in Texas. J Womens Health Gend Based Med. 2000;9 suppl 2:S39-50. doi: 10.1089/152460900318759.
- Andryjowicz E, Wray T. Regional expansion of minimally invasive surgery for hysterectomy: implementation and methodology in a large multispecialty group. Perm J. 2011;15:42-46.
- Zaritsky E, Ojo A, Tucker LY, et al. Racial disparities in route of hysterectomy for benign indications within an integrated health care system. JAMA Netw Open. 2019;2:e1917004. doi: 10.1001/jamanetworkopen.2019.17004.
- Abel MK, Kho KA, Walter A, et al. Measuring quality in minimally invasive gynecologic surgery: what, how, and why? J Minim Invasive Gynecol. 2019;26:321-326. doi: 10.1016/j.jmig.2018.11.013.
The historical mistreatment of Black bodies in gynecologic care has bled into present day inequities—from surgeries performed on enslaved Black women and sterilization of low-income Black women under federally funded programs, to higher rates of adverse health-related outcomes among Black women compared with their non-Black counterparts.1-3 Not only is the foundation of gynecology imperfect, so too is its current-day structure.
It is not enough to identify and describe racial inequities in health care; action plans to provide equitable care are called for. In this report, we aim to 1) contextualize the data on disparities in minimally invasive gynecologic surgery, specifically hysterectomy and myomectomy candidates and postsurgical outcomes, and 2) provide recommendations to close racial gaps in gynecologic treatment for more equitable experiences for minority women.
Black women and uterine fibroids
Uterine leiomyomas, or fibroids, are not only the most common benign pelvic tumor but they also cause a significant medical and financial burden in the United States, with estimated direct costs of $4.1 ̶ 9.4 billion.4 Fibroids can affect fertility and cause pain, bulk symptoms, heavy bleeding, anemia requiring blood transfusion, and poor pregnancy outcomes. The burden of disease for uterine fibroids is greatest for Black women.
The incidence of fibroids is 2 to 3 times higher in Black women compared with White women.5 According to ultrasound-based studies, the prevalence of fibroids among women aged 18 to 30 years was 26% among Black and 7% among White asymptomatic women.6 Earlier onset and more severe symptoms mean that there is a larger potential for impact on fertility for Black women. This coupled with the historical context of mistreatment of Black bodies makes the need for personalized medicine and culturally sensitive care critical.
Inequitable management of uterine fibroids
Although tumor size, location, and patient risk factors are used to determine the best treatment approach, the American College of Obstetricians and Gynecologists (ACOG) guidelines suggest that the use of alternative treatments to surgery should be first-line management instead of hysterectomy for most benign conditions.9 Conservative management will often help alleviate symptoms, slow the growth of fibroid(s), or bridge women to menopause, and treatment options include hormonal contraception, gonadotropin-releasing hormone agonists, hysteroscopic resection, uterine artery embolization, magnetic resonance-guided focused ultrasound, and myomectomy.
The rate of conservative management prior to hysterectomy varies by setting, reflecting potential bias in treatment decisions. Some medical settings have reported a 29% alternative management rate prior to hysterectomy, while others report much higher rates.10 A study using patient data from Kaiser Permanente Northern California (KPNC) showed that, within a large, diverse, and integrated health care system, more than 80% of patients received alternative treatments before undergoing hysterectomy; for those with symptomatic leiomyomas, 74.1% used alternative treatments prior to hysterectomy, and in logistic regression there was not a difference by race.11 Nationally, Black women are more likely to have hysterectomy or myomectomy compared with a nonsurgical uterine-sparing therapy.12,13
With about 600,000 cases per year within the United States, the hysterectomy is the most frequently performed benign gynecologic surgery.14 The most common indication is for “symptomatic fibroid uterus.” The approach to decision making for route of hysterectomy involves multiple patient and surgeon factors, including history of vaginal delivery, body mass index, history of previous surgery, uterine size, informed patient preference, and surgeon volume.15-17 ACOG recommends a minimally invasive hysterectomy (MIH) whenever feasible given its benefits in postoperative pain, recovery time, and blood loss. Myomectomy, particularly among women in their reproductive years desiring management of leiomyomas, is a uterine-sparing procedure versus hysterectomy. Minimally invasive myomectomy (MIM), compared with an open abdominal route, provides for lower drop in hemoglobin levels, shorter hospital stay, less adhesion formation, and decreased postoperative pain.18
Racial variations in hysterectomy rates persist overall and according to hysterectomy type. Black women are 2 to 3 times more likely to undergo hysterectomy for leiomyomas than other racial groups.19 These differences in rates have been shown to persist even when burden of disease is the same. One study found that Black women had increased odds of hysterectomy compared with their White counterparts even when there was no difference in mean fibroid volume by race,20 calling into question provider bias. Even in a universal insurance setting, Black patients have been found to have higher rates of open hysterectomies.21 Previous studies found that, despite growing frequency of laparoscopic and robotic-assisted hysterectomies, patients of a minority race had decreased odds of undergoing a MIH compared with their White counterparts.22
While little data exist on route of myomectomy by race, a recent study found minority women were more likely to undergo abdominal myomectomy compared with White women; Black women were twice as likely to undergo abdominal myomectomy (adjusted odds ratio [aOR], 1.9; 95% confidence interval [CI], 1.7–2.0), Asian American women were more than twice as likely (aOR, 2.3; 95% CI, 1.8–2.8), and Hispanic American women were 50% more likely to undergo abdominal myomectomy (aOR, 1.5; 95% CI, 1.2–1.9) when compared with White women.23 These differences remained after controlling for potential confounders, and there appeared to be an interaction between race and fibroid weight such that racial bias alone may not explain the differences.
Finally, Black women have higher perioperative complication rates compared with non-Black women. Postoperative complications including blood transfusion after myomectomy have been shown to be twice as high among Black women compared with White women. However, once uterine size, comorbidities, and fibroid number were controlled, race was not associated with higher complications. Black women, compared with White women, have been found to have 50% increased odds of morbidity after an abdominal myomectomy.24
Continue to: How to ensure that BIPOC women get the best management...
How to ensure that BIPOC women get the best management
Eliminating disparities and providing equitable and patient-centered care for Black, Indigenous, and people of color (BIPOC) women will require research, education, training, and targeted quality improvement initiatives.
Research into fibroids and comparative treatment outcomes
Uterine fibroids, despite their major public health impact, remain understudied. With Black women carrying the highest fibroid prevalence and severity burden, especially in their childbearing years, it is imperative that research efforts be focused on outcomes by race and ethnicity. Given the significant economic impact of fibroids, more efforts should be directed toward primary prevention of fibroid formation as well as secondary prevention and limitation of fibroid growth by affordable, effective, and safe means. For example, Bratka and colleagues researched the role of vitamin D in inhibiting growth of leiomyoma cells in animal models.25 Other innovative forms of management under investigation include aromatase inhibitors, green tea, cabergoline, elagolix, paricalcitol, and epigallocatechin gallate.26 Considerations such as stress, diet, and environmental risk factors have yet to be investigated in large studies.
Research contributing to evidence-based guidelines that address the needs of different patient populations affected by uterine fibroids is critical.8 Additionally, research conducted by Black women about Black women should be prioritized. In March 2021, the Stephanie Tubbs Jones Uterine Fibroid Research and Education Act of 2021 was introduced to fund $150 million in research supported by the National Institutes of Health (NIH). This is an opportunity to develop a research database to inform evidence-based culturally informed care regarding fertility counseling, medical management, and optimal surgical approach, as well as to award funding to minority researchers. There are disparities in distribution of funds from the NIH to minority researchers. Under-represented minorities are awarded fewer NIH grants compared with their counterparts despite initiatives to increase funding. Furthermore, in 2011, Black applicants for NIH funding were two-thirds as likely as White applicants to receive grants from 2000 ̶ 2006, even when accounting for publication record and training.27 Funding BIPOC researchers fuels diversity-driven investigation and can be useful in the charge to increase fibroid research.
Education and training: Changing the work force
Achieving equity requires change in provider work force. In a study of trends across multiple specialties including obstetrics and gynecology, Blacks and Latinx are more under-represented in 2016 than in 1990 across all specialties except for Black women in obstetrics and gynecology.28 It is well documented that under-represented minorities are more likely to engage in practice, research, service, and mentorship activities aligned with their identity.29 As a higher proportion of under-represented minority obstetricians and gynecologists practice in medically underserved areas,30 this presents a unique opportunity for gynecologists to improve care for and increase research involvement among BIPOC women.
Increasing BIPOC representation in medical and health care institutions and practices is not enough, however, to achieve health equity. Data from the Association of American Medical Colleges demonstrate that between 1978 and 2017 the total number of full-time obstetrics and gynecology faculty rose nearly fourfold from 1,688 to 6,347; however, the greatest rise in proportion of faculty who were nontenured was among women who were under-represented minorities.31 Additionally, there are disparities in wage by race even after controlling for hours worked and state of residence.32 Medical and academic centers and health care institutions and practices should proactively and systematically engage in the recruitment and retention of under-represented minority physicians and people in leadership roles. This will involve creating safe and inclusive work environments, with equal pay and promotion structures.
Quality initiatives to address provider bias
Provider bias should be addressed in clinical decision making and counseling of patients. Studies focused on ultrasonography have shown an estimated cumulative incidence of fibroids by age 50 of greater than 80% for Black women and nearly 70% for White women.5 Due to the prevalence and burden of fibroids among Black women there may be a provider bias in approach to management. Addressing this bias requires quality improvement efforts and investigation into patient and provider factors in management of fibroids. Black women have been a vulnerable population in medicine due to instances of mistreatment, and often times mistrust can play a role in how a patient views his or her care decisions. A patient-centered strategy allows patient factors such as age, uterine size, and cultural background to be considered such that a provider can tailor an approach that is best for the patient. Previous minority women focus groups have demonstrated that women have a strong desire for elective treatment;33 therefore, providers should listen openly to patients about their values and their perspectives on how fibroids affect their lives. Provider bias toward surgical volume, incentive for surgery, and implicit bias need to be addressed at every institution to work toward equitable and cost-effective care.
Integrated health care systems like Southern and Northern California Permanente Medical Group, using quality initiatives, have increased their minimally invasive surgery rates. Southern California Permanente Medical Group reached a 78% rate of MIH in a system of more than 350 surgeons performing benign indication hysterectomies as reported in 2011.34 Similarly, a study within KPNC, an institution with an MIH rate greater than 95%,35 found that racial disparities in route of MIH were eliminated through a quality improvement initiative described in detail in 2018 (FIGURE and TABLE).36
Conclusions
There are recognized successes in the gynecology field’s efforts to address racial disparities. Prior studies provide insight into opportunities to improve care in medical management of leiomyomas, minimally invasive route of hysterectomy and myomectomy, postsurgical outcomes, and institutional leadership. Particularly, when systemwide approaches are taken in the delivery of health care it is possible to significantly diminish racial disparities in gynecology.35 Much work remains to be done for our health care systems to provide equitable care.
- Ojanuga D. The medical ethics of the ‘father of gynaecology,’ Dr J Marion Sims. J Med Ethics. 1993;19:28-31. doi: 10.1136/jme.19.1.28.
- Borrero S, Zite N, Creinin MD. Federally funded sterilization: time to rethink policy? Am J Public Health. 2012;102:1822-1825.
- Eaglehouse YL, Georg MW, Shriver CD, et al. Racial differences in time to breast cancer surgery and overall survival in the US Military Health System. JAMA Surg. 2019;154:e185113. doi: 10.1001/jamasurg.2018.5113.
- Soliman AM, Yang H, Du EX, et al. The direct and indirect costs of uterine fibroid tumors: a systematic review of the literature between 2000 and 2013. Am J Obstet Gynecol. 2015;213:141-160.
- Baird DD, Dunson DB, Hill MC, et al. High cumulative incidence of uterine leiomyoma in black and white women: ultrasound evidence. Am J Obstet Gynecol. 2003;188:100-107.
- Marshall LM, Spiegelman D, Barbieri RL, et al. Variation in the incidence of uterine leiomyoma among premenopausal women by age and race. Obstet Gynecol. 1997;90:967-973. doi: 10.1016/s0029-7844(97)00534-6.
- Styer AK, Rueda BR. The epidemiology and genetics of uterine leiomyoma. Best Pract Res Clin Obstet Gynaecol. 2016;34:3-12. doi: 10.1016/j.bpobgyn.2015.11.018.
- Al-Hendy A, Myers ER, Stewart E. Uterine fibroids: burden and unmet medical need. Semin Reprod Med. 2017;35:473-480. doi: 10.1055/s-0037-1607264.
- American College of Obstetricians and Gynecologists. ACOG practice bulletin. Alternatives to hysterectomy in the management of leiomyomas. Obstet Gynecol. 2008;112(2 pt 1):387-400.
- Corona LE, Swenson CW, Sheetz KH, et al. Use of other treatments before hysterectomy for benign conditions in a statewide hospital collaborative. Am J Obstet Gynecol. 2015;212:304.e1-e7. doi: 10.1016/j.ajog.2014.11.031.
- Nguyen NT, Merchant M, Ritterman Weintraub ML, et al. Alternative treatment utilization before hysterectomy for benign gynecologic conditions at a large integrated health system. J Minim Invasive Gynecol. 2019;26:847-855. doi: 10.1016/j.jmig.2018.08.013.
- Laughlin-Tommaso SK, Jacoby VL, Myers ER. Disparities in fibroid incidence, prognosis, and management. Obstet Gynecol Clin North Am. 2017;44:81-94. doi: 10.1016/j.ogc.2016.11.007.
- Borah BJ, Laughlin-Tommaso SK, Myers ER, et al. Association between patient characteristics and treatment procedure among patients with uterine leiomyomas. Obstet Gynecol. 2016;127:67-77.
- Whiteman MK, Hillis SD, Jamieson DJ, et al. Inpatient hysterectomy surveillance in the United States, 2000-2004. Am J Obstet Gynecol. 2008;198:34.e1-e7. doi:10.1016/j.ajog.2007.05.039.
- Bardens D, Solomayer E, Baum S, et al. The impact of the body mass index (BMI) on laparoscopic hysterectomy for benign disease. Arch Gynecol Obstet. 2014;289:803-807. doi: 10.1007/s00404-013-3050-2.
- Seracchioli R, Venturoli S, Vianello F, et al. Total laparoscopic hysterectomy compared with abdominal hysterectomy in the presence of a large uterus. J Am Assoc Gynecol Laparosc. 2002;9:333-338. doi: 10.1016/s1074-3804(05)60413.
- Boyd LR, Novetsky AP, Curtin JP. Effect of surgical volume on route of hysterectomy and short-term morbidity. Obstet Gynecol. 2010;116:909-915. doi: 10.1097/AOG.0b013e3181f395d9.
- Jin C, Hu Y, Chen XC, et al. Laparoscopic versus open myomectomy—a meta-analysis of randomized controlled trials. Eur J Obstet Gynecol Reprod Biol. 2009;145:14-21. doi: 10.1016/j.ejogrb.2009.03.009.
- Wechter ME, Stewart EA, Myers ER, et al. Leiomyoma-related hospitalization and surgery: prevalence and predicted growth based on population trends. Am J Obstet Gynecol. 2011;205:492.e1-e5. doi: 10.1016/j.ajog.2011.07.008.
- Bower JK, Schreiner PJ, Sternfeld B, et al. Black-White differences in hysterectomy prevalence: the CARDIA study. Am J Public Health. 2009;99:300-307. doi: 10.2105/AJPH.2008.133702.
- Ranjit A, Sharma M, Romano A, et al. Does universal insurance mitigate racial differences in minimally invasive hysterectomy? J Minim Invasive Gynecol. 2017;24. doi:10.1016/j.jmig.2017.03.016.
- Pollack LM, Olsen MA, Gehlert SJ, et al. Racial/ethnic disparities/differences in hysterectomy route in women likely eligible for minimally invasive surgery. J Minim Invasive Gynecol. 2020;27:1167-1177.e2. doi:10.1016/j.jmig.2019.09.003.
- Stentz NC, Cooney LG, Sammel MD, et al. Association of patient race with surgical practice and perioperative morbidity after myomectomy. Obstet Gynecol. 2018;132:291-297. doi: 10.1097/AOG.0000000000002738.
- Roth TM, Gustilo-Ashby T, Barber MD, et al. Effects of race and clinical factors on short-term outcomes of abdominal myomectomy. Obstet Gynecol. 2003;101(5 pt 1):881-884. doi: 10.1016/s0029-7844(03)00015-2.
- Bratka S, Diamond JS, Al-Hendy A, et al. The role of vitamin D in uterine fibroid biology. Fertil Steril. 2015;104:698-706. doi: 10.1016/j.fertnstert.2015.05.031.
- Ciebiera M, Łukaszuk K, Męczekalski B, et al. Alternative oral agents in prophylaxis and therapy of uterine fibroids—an up-to-date review. Int J Mol Sci. 2017;18:2586. doi:10.3390/ijms18122586.
- Hayden EC. Racial bias haunts NIH funding. Nature. 2015;527:145.
- Lett LA, Orji WU, Sebro R. Declining racial and ethnic representation in clinical academic medicine: a longitudinal study of 16 US medical specialties. PLoS One. 2018;13:e0207274. doi: 10.1371/journal.pone.0207274.
- Sánchez JP, Poll-Hunter N, Stern N, et al. Balancing two cultures: American Indian/Alaska Native medical students’ perceptions of academic medicine careers. J Community Health. 2016;41:871-880.
- Rayburn WF, Xierali IM, Castillo-Page L, et al. Racial and ethnic differences between obstetrician-gynecologists and other adult medical specialists. Obstet Gynecol. 2016;127:148-152. doi: 10.1097/AOG.0000000000001184.
- Esters D, Xierali IM, Nivet MA, et al. The rise of nontenured faculty in obstetrics and gynecology by sex and underrepresented in medicine status. Obstet Gynecol. 2019;134 suppl 1:34S-39S. doi: 10.1097/AOG.0000000000003484.
- Ly DP, Seabury SA, Jena AB. Differences in incomes of physicians in the United States by race and sex: observational study. BMJ. 2016;I2923. doi:10.1136/bmj.i2923.
- Groff JY, Mullen PD, Byrd T, et al. Decision making, beliefs, and attitudes toward hysterectomy: a focus group study with medically underserved women in Texas. J Womens Health Gend Based Med. 2000;9 suppl 2:S39-50. doi: 10.1089/152460900318759.
- Andryjowicz E, Wray T. Regional expansion of minimally invasive surgery for hysterectomy: implementation and methodology in a large multispecialty group. Perm J. 2011;15:42-46.
- Zaritsky E, Ojo A, Tucker LY, et al. Racial disparities in route of hysterectomy for benign indications within an integrated health care system. JAMA Netw Open. 2019;2:e1917004. doi: 10.1001/jamanetworkopen.2019.17004.
- Abel MK, Kho KA, Walter A, et al. Measuring quality in minimally invasive gynecologic surgery: what, how, and why? J Minim Invasive Gynecol. 2019;26:321-326. doi: 10.1016/j.jmig.2018.11.013.
Tennessee fires top vaccine official as COVID cases increase
Tennessee officials have fired the state’s top vaccination manager, who faced recent criticism from Republican lawmakers about her efforts to vaccinate teens against COVID-19.
Michelle Fiscus, MD, the medical director for vaccine-preventable diseases and immunization programs at the Tennessee Department of Health, was terminated on July 12. The termination letter doesn’t explain the reason for her dismissal, according to the newspaper, which received a copy of the letter.
“It was my job to provide evidence-based education and vaccine access so that Tennesseans could protect themselves against COVID-19,” Dr. Fiscus told the Tennessean. “I have now been terminated for doing exactly that.”
In May, Dr. Fiscus sent a memo to medical providers that described the state’s “Mature Minor Doctrine,” a legal mechanism established in 1987 that allows some minors between the ages if 14 and 17 years to receive medical care without parental consent. Tennessee is one of five states that allows health care providers to decide if a minor has the capacity to consent to care, according to CNN.
Dr. Fiscus said she sent the letter in response to providers’ questions and that it contained no new information. She also said the wording was approved by the health department’s attorney and the governor’s office, the newspaper reported.
At a June 16 hearing of the state’s Joint Government Operations Committee, however, Republican officials criticized the memo and Dr. Fiscus, saying that the state misinterpreted its legal authority. During the meeting, some lawmakers discussed dissolving the state health department to stop it from promoting vaccines to teens, the newspaper reported.
Since then, the health department has backed down from promoting vaccines to teens by deleting social media posts that recommended vaccines to anyone over age 12. Internal emails, which were obtained by the Tennessean, showed that department leaders ordered county-level employees to avoid holding vaccine events targeted toward adolescents.
Dr. Fiscus’s firing comes as vaccination efforts lag in the state. About 38% of residents have been fully vaccinated. At the current pace, Tennessee won’t pass the 50% mark until next March, according to an internal report obtained by the newspaper.
COVID-19 cases are beginning to climb again, particularly with the Delta variant circulating among unvaccinated residents. After months of a decline in cases, the average of daily cases has more than doubled since the end of June. The state’s test positivity rate has increased from 2% to 4.5% during that time as well.
In a long written statement, Dr. Fiscus said she was the 25th of 64 state and territorial immunization program directors to leave their positions during the pandemic, whether through resignation or termination. With a loss of institutional knowledge and leadership, COVID-19 vaccine efforts will fall behind.
“Each of us should be waking up every morning with one question on our minds: ‘What can I do protect the people of Tennessee against COVID-19?’ ” she wrote. “Instead, our leaders are putting barriers in place to ensure the people of Tennessee remain at risk, even with the Delta variant bearing down upon us.”
A version of this article first appeared on WebMD.com.
Talking about guns: Website helps physicians follow through on pledge
The group has developed a national resource for clinicians who wish to address the problem of gun violence deaths in the United States, which continue to mount by the day.
Signatures came quickly in 2018 after the Annals of Internal Medicine asked physicians to sign a formal pledge in which they commit to talking with their patients about firearms. To date, the list has grown to more than 3,600, and it remains open for additional signatories.
The effort built on data showing that before people commit violence with firearms, they often have notable risk factors that prompt them to see a physician.
At the time the pledge campaign was launched, frustration and despair had hit new highs after the school shooting of Feb. 14, 2018, in Parkland, Florida, in which 17 people were killed. That occurred just 4 months after the mass shooting in Las Vegas, Nevada, on Oct. 1, 2017, in which 58 people were gunned down.
An editorial by Garen J. Wintemute, MD, MPH, helped kick off the drive.
More deaths than WWII combat fatalities
Dr. Wintemute cited some grim statistics, writing that “nationwide in 2016, there was an average of 97 deaths from firearm violence per day: 35,476 altogether. In the 10 years ending with 2016, deaths of U.S. civilians from firearm violence exceeded American combat fatalities in World War II.”
Amy Barnhorst, MD, vice chair of psychiatry at UC Davis, who was one of the early signers of the pledge, told this news organization that data analyst Rocco Pallin, MPH, with the UC Davis Violence Prevention Research Program (VPRP), quickly started managing commitments to the pledge and developed a “What You Can Do” intervention for physicians looking for help on how to prevent firearm injury and death.
Those efforts snowballed, and a need arose for a centralized public resource. In 2019, the state of California gave $3.8 million to the VPRP, which helped launch the BulletPoints Project, which Dr. Barnhorst now directs.
The website provides clinicians with evidence-based direction on how to have the conversations with patients. It walks them through various scenarios and details what can be done if what they learn during a patient interview requires action.
Dr. Barnhorst said the team is working on formalized online educational courses for mental health professionals and medical clinicians that will be hosted through various national organizations.
Christine Laine, MD, editor-in-chief of the Annals of Internal Medicine, said in an interview that although almost 4,000 persons have made the pledge, that number should be higher. She notes that the American College of Physicians has about 165,000 members, and even that is only a fraction of all physicians and clinicians.
“Signing the pledge helps raise awareness that this is a public health issue and, within the realm of health care providers, that they should be counseling patients about reducing risk, the same way we counsel people to wear bike helmets and use seat belts,” she said.
Dr. Barnhorst says those who don’t want to sign the pledge usually cite time considerations and that they already talk with patients about a list of public health issues. They also say they don’t know how to have the conversations or what they should do if what they hear in the interviews requires action.
“We can’t do anything about the time, but we can do something about the resources,” Dr. Barnhorst said.
Some clinicians, she said, worry that patients will get angry if physicians ask about guns, or they believe it’s illegal to ask.
“But there’s no law preventing physicians from asking these questions,” she said.
Dr. Wintemute told this news organization that he is not discouraged that only about 4,000 have signed the pledge. Rather, he was encouraged that the signatures came so quickly. He also notes that the number of persons who are interested far exceeds the number who have made the pledge.
Boosting the pledge numbers will likely take a new push in the form of published articles, he added, and those are in the works.
Among the next steps is conducting pre- and post-tests to see whether BulletPoints is effectively conveying the information for users, he said.
Another is pushing for advances in petitioning for “extreme risk protection orders,” which would require a gun owner to temporarily relinquish any firearms and ammunition and not purchase additional firearms.
Dr. Wintemute said that currently, Maryland is the only state in which health care professionals can petition for extreme risk protection orders. In any state that has the law, a health care professional can contact law enforcement about “a person who is at very high risk for violence in the very near future” but who has not committed a crime and is not mentally ill and so cannot be legally detained.
For physicians to include gun counseling as a routine part of patient care will likely require hearing from peers who are finding the time to do this effectively and hearing that it matters, he said.
“It’s going to take that on-the-ground diffusion of information, just as it has with vaccine hesitancy,” he said.
He notes that data on how to stop firearm violence are sparse and approaches so far have extrapolated from information on how to stop other health threats, such as smoking and drinking.
But that is changing rapidly, he said: “There’s funding from the CDC for research into the kind of work we’re doing.”
Measuring the success of those efforts is difficult.
One sign of change in the past 3 years, Dr. Wintemute says, is that there’s recognition among health care professionals and the public that this fits into clinicians’ “lane.”
Mass shootings not the largest source of gun violence
Mass shootings continue to dominate news about fatal shootings, but Dr. Barnhorst notes that such shootings represent a very small part – reportedly 1% to 2% – of the firearm deaths in the United States. Almost two-thirds of the deaths are suicides. Domestic violence deaths make up another large sector.
But it’s the mass shootings that stick in the collective U.S. consciousness, and the rising and unrelenting numbers can lead to a sense of futility.
Dr. Barnhorst, Dr. Laine, and Dr. Wintemute acknowledge they don’t know to what degree physicians’ talking to patients about firearms can help. But they do not doubt it’s worthy of the effort.
Dr. Laine said that during the past year, COVID-19 overshadowed the focus on the pledge, but he notes the signup for the pledge remains open. Information on firearm injury is collected on the Annals website.
Dr. Barnhorst says there is no good answer to the question of how many lives need to be saved before talking with patients about firearms becomes worth the effort. “For me,” she said, “that number is very, very low.”
Dr. Laine puts the number at one.
“If a physician talking to their patients about firearms prevents one suicide, then the intervention is a success,” she said.
Dr. Laine, Dr. Barnhorst, and Dr. Wintemute report no relevant financial relationships.
A version of this article first appeared on Medscape.com.