User login
Blood-based signature helps predict status of early AD indicator
A recently developed blood-based signature can help predict the status of an early Alzheimer’s disease risk indicator with high accuracy, investigators are reporting.
By analyzing as few as four proteins, the machine learning-derived test can predict the status of cerebrospinal fluid (CSF) amyloid beta1-42 (Abeta1-42), according to Noel G. Faux, PHD, of IBM Australia and the University of Melbourne, and co-investigators.
While shifts in Abeta1-42 may signal the presence of disease long before significant cognitive decline is clinically apparent, collection of CSF is highly invasive and expensive, Faux and investigators said in their report.
By contrast, blood biomarkers could prove to be a useful alternative not only to invasive lumbar punctures, they said, but also to the positron emission tomography (PET) evaluation of Abeta1-42, which is expensive and limited in some regions.
“In conjunction with biomarkers for neocortical amyloid burden, the CSF Abeta1-42biomarkers presented in this work may help yield a cheap, non-invasive tool for both improving clinical trials targeting amyloid and population screening,” Dr. Faux and co-authors said in Scientific Reports.
Dr. Faux and colleagues used a Random Forest approach to build models for CSF Abeta1-42 using blood biomarkers and other variables.
They found that a model incorporating age, APOEe4 carrier status, and a number of plasma protein levels predicted Abeta1-42 normal/abnormalstatus with an AUC, sensitivity and specificity of 0.84, 0.78 and 0.73 respectively.
In a model they said was more suitable for clinical application, they narrowed down the variables to 4 plasma analytes and APOEe4 carrier status, which had an AUC, sensitivity, and specificity of 0.81, 0.81 and 0.64 respectively.
They validated the models on a cohort of individuals in the Alzheimer’s Disease Neuroimaging Initiative (ADNI), a large, longitudinal, multicenter study.
Patients with mild cognitive impairment with predicted abnormal CSF Abeta1-42 levels indeed did transition to a diagnosis of Alzheimer’s disease more quickly than those with predicted normal levels, according to investigators.
That helps provide “strong evidence” that the blood-based model is generalizable, robust, and could help stratify patients based on risk of progressing to Alzheimer’s disease, they said in their report.
Dr. Faux and colleagues declared no conflicts of interest related to the research.
SOURCE: Goudey B, et al. Sci Rep. 2019 Mar 10. doi: 10.1101/190207v3.
FROM SCIENTIFIC REPORTS
Key clinical point: A blood-based signature can help predict the status of an early Alzheimer’s disease risk indicator.
Major finding:
Study details: Machine learning analysis of blood biomarkers and other variables in a validation cohort of 198 individuals.
Disclosures: The study authors declared no conflicts of interest.
Source: Goudey B, et al. Sci Rep. 2019 Mar 10. doi: 10.1101/190207v3.
Evaluations for possible MS often turn up one of its many mimics
DALLAS – Of 95 patients referred to two multiple sclerosis (MS) centers for a possible diagnosis of MS, 74% did not have MS, according to a study presented at ACTRIMS Forum 2019. A majority had clinical syndromes or imaging findings that are atypical for MS, which “underscores the importance of familiarity with typical MS clinical and imaging findings in avoiding misdiagnosis,” said Marwa Kaisey, MD, and her research colleagues. Dr. Kaisey is a neurologist at Cedars-Sinai Medical Center in Los Angeles.

Physicians often refer patients to academic MS centers to determine whether patients have MS or one of its many mimics. To study the characteristics and final diagnoses of patients referred to MS centers for evaluation of possible MS, the investigators reviewed electronic medical records and MRI from all new patient evaluations at the Cedars-Sinai Medical Center and University of California, Los Angeles MS clinics between July 2016 and June 2017. The researchers excluded patients referred with a previously established diagnosis of MS.
There were 366 new patients evaluated, including 236 patients with previously established MS diagnoses and 35 patients whose evaluations were not related to MS. Of the 95 patients referred for a question of MS diagnosis, 60% had clinical syndromes that were atypical for MS, 22% had normal neurologic exams, and a third had pain or sensory changes that were not localizable to the CNS.
Sixty-seven percent had MRI that was atypical for MS, and nearly half of the patients without MS had nonspecific MRI changes. “Often, these MRI changes alone prompted referral for an MS evaluation,” Dr. Kaisey and colleagues reported. “This suggests that novel, specific imaging tools may increase diagnostic confidence in the clinical setting.”
In all, the referred patients received 28 diagnoses other than MS, most commonly migraine (10 patients), anxiety or conversion disorder (9), postinfectious or idiopathic transverse myelitis (8), compression myelopathy or spondylopathy (8), and peripheral neuropathy or radiculopathy (7).
The researchers did not have any relevant disclosures.
SOURCE: Kaisey M et al. ACTRIMS Forum 2019, Abstract 90.
DALLAS – Of 95 patients referred to two multiple sclerosis (MS) centers for a possible diagnosis of MS, 74% did not have MS, according to a study presented at ACTRIMS Forum 2019. A majority had clinical syndromes or imaging findings that are atypical for MS, which “underscores the importance of familiarity with typical MS clinical and imaging findings in avoiding misdiagnosis,” said Marwa Kaisey, MD, and her research colleagues. Dr. Kaisey is a neurologist at Cedars-Sinai Medical Center in Los Angeles.
Physicians often refer patients to academic MS centers to determine whether patients have MS or one of its many mimics. To study the characteristics and final diagnoses of patients referred to MS centers for evaluation of possible MS, the investigators reviewed electronic medical records and MRI from all new patient evaluations at the Cedars-Sinai Medical Center and University of California, Los Angeles MS clinics between July 2016 and June 2017. The researchers excluded patients referred with a previously established diagnosis of MS.
There were 366 new patients evaluated, including 236 patients with previously established MS diagnoses and 35 patients whose evaluations were not related to MS. Of the 95 patients referred for a question of MS diagnosis, 60% had clinical syndromes that were atypical for MS, 22% had normal neurologic exams, and a third had pain or sensory changes that were not localizable to the CNS.
Sixty-seven percent had MRI that was atypical for MS, and nearly half of the patients without MS had nonspecific MRI changes. “Often, these MRI changes alone prompted referral for an MS evaluation,” Dr. Kaisey and colleagues reported. “This suggests that novel, specific imaging tools may increase diagnostic confidence in the clinical setting.”
In all, the referred patients received 28 diagnoses other than MS, most commonly migraine (10 patients), anxiety or conversion disorder (9), postinfectious or idiopathic transverse myelitis (8), compression myelopathy or spondylopathy (8), and peripheral neuropathy or radiculopathy (7).
The researchers did not have any relevant disclosures.
SOURCE: Kaisey M et al. ACTRIMS Forum 2019, Abstract 90.
REPORTING FROM ACTRIMS FORUM 2019
In utero infections raise risk for autism
Children whose mothers experienced any type of infection during pregnancy were nearly 80 times more likely to be diagnosed with autism than those whose mothers did not have infections, based on data from more than one million children in Sweden.

Although previous studies have shown associations between specific infections in utero and specific conditions, such as schizophrenia, “Whether maternal infection and inflammation can alter fetal neurodevelopment to a degree that imparts risk for a broad spectrum of psychopathologic conditions across the child’s lifetime is unknown,” wrote Benjamin J. S. al-Haddad, MD, formerly of Seattle Children’s Hospital, Washington, currently with Doctors without Borders,Katiola, Côte d’Ivoire, and his colleagues.
In a study published In JAMA Psychiatry, the researchers followed 1,791,520 children (48.6% girls) born between Jan. 1, 1973, and Dec. 31, 2014, for up to 41 years using population-based registry data.
Overall, researchers found a 79% increased risk of an autism diagnosis (hazard ratio 1.79) and a 24% increased risk of a depression diagnosis (HR 1.24) for individuals exposed to any maternal infection in utero compared with those not exposed.
Similar increases in risk appeared when the data were broken down by type of infection. Hazard ratios for an autism diagnosis were 1.81 for exposure to a severe maternal infection and 1.89 for a maternal urinary tract infection; hazard ratios for depression were 1.24 and 1.30, respectively, for severe maternal infection and maternal urinary tract infection.
No increased risk in bipolar disorder, or other psychoses including schizophrenia were observed.
The findings were limited by several factors including the inclusion only of infections diagnosed in a hospital setting, and thus may not be generalizable to infections diagnosed in an outpatient setting, the researchers noted. However, the results “amplify the urgency to better understand the role of maternal infection during pregnancy on fetal brain development and suggest that prevention of infection (such as by influenza vaccination) or anti-inflammatory therapies may be important strategies for the primary prevention of some portion of autism and depression,” they said.
The researchers had no conflicts to disclose. The study was funded by grants from several organizations including the National Institutes of Health.
SOURCE: al-Haddad BJS et al. JAMA Psychiatry. doi:10.1001/jamapsychiatry.2019.0029.
Children whose mothers experienced any type of infection during pregnancy were nearly 80 times more likely to be diagnosed with autism than those whose mothers did not have infections, based on data from more than one million children in Sweden.
Although previous studies have shown associations between specific infections in utero and specific conditions, such as schizophrenia, “Whether maternal infection and inflammation can alter fetal neurodevelopment to a degree that imparts risk for a broad spectrum of psychopathologic conditions across the child’s lifetime is unknown,” wrote Benjamin J. S. al-Haddad, MD, formerly of Seattle Children’s Hospital, Washington, currently with Doctors without Borders,Katiola, Côte d’Ivoire, and his colleagues.
In a study published In JAMA Psychiatry, the researchers followed 1,791,520 children (48.6% girls) born between Jan. 1, 1973, and Dec. 31, 2014, for up to 41 years using population-based registry data.
Overall, researchers found a 79% increased risk of an autism diagnosis (hazard ratio 1.79) and a 24% increased risk of a depression diagnosis (HR 1.24) for individuals exposed to any maternal infection in utero compared with those not exposed.
Similar increases in risk appeared when the data were broken down by type of infection. Hazard ratios for an autism diagnosis were 1.81 for exposure to a severe maternal infection and 1.89 for a maternal urinary tract infection; hazard ratios for depression were 1.24 and 1.30, respectively, for severe maternal infection and maternal urinary tract infection.
No increased risk in bipolar disorder, or other psychoses including schizophrenia were observed.
The findings were limited by several factors including the inclusion only of infections diagnosed in a hospital setting, and thus may not be generalizable to infections diagnosed in an outpatient setting, the researchers noted. However, the results “amplify the urgency to better understand the role of maternal infection during pregnancy on fetal brain development and suggest that prevention of infection (such as by influenza vaccination) or anti-inflammatory therapies may be important strategies for the primary prevention of some portion of autism and depression,” they said.
The researchers had no conflicts to disclose. The study was funded by grants from several organizations including the National Institutes of Health.
SOURCE: al-Haddad BJS et al. JAMA Psychiatry. doi:10.1001/jamapsychiatry.2019.0029.
FROM JAMA PSYCHIATRY
Total plasma tau correlates with dementia onset, Alzheimer’s disease
The total tau level in blood plasma appears to predict both onset and progression of dementia and could be used to help refine research cohorts.
Blood samples from two large dementia research cohorts confirmed the finding: Each standard deviation in plasma tau above the median is associated with a 29% greater risk of incident all-cause dementia and a 35%increase in the risk of incident Alzheimer’s disease, Matthew P. Pase, PhD and colleagues wrote in JAMA Neurology. It also correlated positively with some neuropathological aspects of dementia: smaller hippocampus and a higher burden of neurofibrillary tangles in the medial temporal lobe, said Dr. Pase of The Florey Institute for Neuroscience and Mental Health. Victoria, Australia.
Plasma tau isn’t the highly sought Holy Grail of a simple Alzheimer’s blood test. But the finding could benefit the research world. As a study entry criteria, it could substantially decrease the number of subjects needed to validate an outcome of either all-cause dementia or Alzheimer’s disease. Abnormal tau is also a required finding for an Alzheimer’s diagnosis in revised NIA-AA Research Framework. And, the authors noted, although plasma tau wasn’t quite as accurate a predictor as CSF tau, a needle in the arm would be much more acceptable to many more patients than a lumbar puncture.
“Whereas we do not expect plasma t-tau cutoffs to enhance diagnostic certainty for any single patient, our results suggest that plasma t-tau could be associated with improved risk stratification at a population level, targeting persons for inclusion in prevention trials, thus improving the power and precision of clinical trials and potentially accelerating therapeutic pipelines and drug discovery,” the team wrote.
The study drew on stored plasma samples from subjects enrolled in the Framingham Heart Study (1,453) and the Memento study, a multicenter cohort of persons with mild cognitive impairment or subjective cognitive complaints recruited from memory clinics across France (367).
The Framingham cohort was followed for up to 10 years between baseline examination to incident event (median 6 years).
Over that time, 134 (9.2%) cases of dementia developed; most of these (105) were due possible, probable, or definite Alzheimer’s.
Plasma tau levels rose linearly as the cohort aged. Higher plasma t-tau levels were associated with proven AD risk factors, including female sex, lower education, and higher vascular risk factors. They did not differ by apolipoprotein epsilon 4 status (APOEe4).
After adjusting for age and sex, each stand deviation unit increase in the log of tau was associated with a 29% greater risk of incident all-cause dementia, and a 35% increase in the risk of incident Alzheimer’s dementia. Subjects with tau levels above the median had a 62% increased risk of all-cause dementia and a 76% greater risk of AD. Adding APOEe4 status and vascular risk factors to the analysis didn’t alter the associations.
“Plasma t-tau level improved risk discrimination for all dementia and AD dementia beyond age and sex,” the investigators wrote. “[It] was associated with improved risk discrimination … in both APOEe4 carriers and noncarriers.”
In a hypothetical 5-year clinical trial, enrolling subjects with total plasma tau greater than the median could reduce the estimated necessary sample size by 38% for an outcome of all-cause dementia and by 50% for one of Alzheimer’s. Selecting those with both elevated plasma tau and APOEe4 carriage could reduce the required sample by 69% for all-cause dementia outcomes and by 80% for Alzheimer’s outcomes.
In the neuropathologic study, each standard deviation unit increase was associated with more neurofibrillary tangles in the medial temporal lobe, more microinfarcts, and smaller hippocampal volume. There was no association with amyloid plaque in any brain region.
Subjects in the Memento study had a meant of 4 years of follow-up. Over that time, there were 76 cases of incident dementia, 55 of which were probable Alzheimer’s.
Each standard deviation unit increase was associated with a nonsignificant 14% greater risk of all-cause dementia and a significant 54% increase in the risk of incident Alzheimer’s.
CSF was drawn on the same day as plasma in 140 of these subjects. The addition of CSF boosted the predictive value; each standard deviation increase more than doubled the risk of both Alzheimer’s (HR 2.33). Each standard deviation unit increase in CSF t-tau increased the risk by 2.14.
“Plasma t-tau was weakly correlated with CSF t-tau in our study. This finding is consistent
with previous studies showing that the associations of plasma t-tau with CSF t-tau have been weak or nonexistent,” the authors wrote. But, “Despite a weak correlation between plasma and CSF t-tau, plasma t-tau was at least as strongly associated with the development of incident AD dementia.”
“Use of plasma t-tau in this manner could be likened to the measurement of the APOEe4 allele, which is not a biomarker of AD pathology providing diagnostic certainty for AD dementia but is still routinely used to power clinical trials by selecting at-risk individuals,” they concluded.
Dr. Pase had no financial disclosures.
SOURCE: Pase, M et al JAMA Neurol 2019 doi:10.1001/jamaneurol.2018.4666
FROM JAMA NEUROLOGY
Glyceryl trinitrate does not improve outcomes of ischemic stroke
HONOLULU – , according to data presented at the International Stroke Conference sponsored by the American Heart Association. Results suggest that GTN causes adverse effects in patients with intracerebral hemorrhage (ICH), but this observation is not definitive, according to the researchers. Study results were published online ahead of print Feb. 6 in the Lancet.
Nitric oxide is a regulatory molecule that has vasoactive effects and promotes blood pressure reduction. Vascular levels of nitric oxide are low in stroke, which suggests that the molecule may be a target for stroke treatment. GTN, a nitric oxide donor, lowered blood pressure and improved functional outcome among patients with acute stroke in the phase 2 Rapid Intervention with GTN in Hypertensive Stroke Trial (RIGHT).
Philip Bath, MD, Stroke Association Professor of Stroke Medicine at the University of Nottingham (England), and colleagues conducted the RIGHT-2 study to evaluate the safety and efficacy of GTN when administered early after onset of suspected stroke. Paramedics randomized patients in equal groups to a GTN patch or a sham patch in the ambulance. Three more patches were administered in the hospital on the following days. Active and sham patches looked similar and had no writing on them, thus ensuring effective blinding upon administration. Investigators followed up patients by telephone at 90 days to assess the modified Rankin Scale score and markers of disability, mood, cognition, and quality of life.
Eligible participants were adults who had dialed emergency services, independently or with assistance, because of a possible stroke. They had a Face, Arm, Speech, Time (FAST) score of 2 or 3, were within 4 hours of onset, and had a systolic blood pressure greater than 120 mm Hg. Patients from nursing homes, those with hypoglycemia, those who were unconscious, and those with a witnessed seizure were excluded.
Dr. Bath and colleagues planned to enroll 850 patients from five ambulance services in 30 hospitals across the United Kingdom. Data were to be examined through an intention-to-treat analysis. During the trial, however, the investigators observed that the rate of stroke mimics was 26%, rather than the 12% that they had anticipated. To ensure the proper power for the study, the investigators increased the sample size to 1,149 patients. They also changed the planned data analysis from intention-to-treat to hierarchical analysis. Specifically, the researchers planned to perform the primary analysis in patients with stroke or TIA. If the results were positive, then they would perform a standard intention-to-treat analysis.
More than 99% of patients received the first patch. Approximately 57% of the population received the first two patches. One reason for this decrease in adherence was that many patients were discharged from the hospital with a TIA or a stroke mimic. Participants’ average age was 72. The median time from onset to randomization was 71 minutes, and the median time to treatment was 73 minutes. Participants’ mean systolic blood pressure was 162 mm Hg. Approximately 60% of the patients had a FAST score of 3. About 50% of participants had ischemic stroke, 13% had ICH, 10% had TIA, and 26% had stroke mimics.
At 1 hour after treatment initiation, systolic blood pressure decreased by 6.2 mm Hg and diastolic blood pressure decreased by 2.7 mm Hg among patients who received GTN, compared with controls. At one day, the differences were 5.2 mm Hg and 2.5 mm Hg, respectively, in treated patients, compared with controls. Blood pressure became similar between groups thereafter, “in part because of the tachyphylaxis that we know happens with GTN,” said Dr. Bath.
The researchers found no evidence of an effect of GTN on functional outcome at 90 days in participants with stroke or transient ischemic attack. The adjusted common odds ratio of poor outcome was 1.25 in the GTN group, compared with the control group (95 % confidence interval, 0.97-1.60; P = .083). “We were close to getting a negative trial,” said Dr. Bath.
Subgroup analyses revealed differences in outcome according to the time to randomization. GTN had a negative effect in patients treated within 1 hour of onset. Results were neutral, but tended to be negative, in patients treated between 1 and 2 hours of onset. Results were neutral, but tended to be positive, among patients treated at more than 2 hours after onset. There was no difference between groups in the rate of mortality.
One of the study’s limitations was its single-blind design. In addition, the trial was conducted in a single country, and the investigators changed the protocol after it was initiated. “We had a higher-than-expected [stroke] mimic rate, although I’m reassured by most experts that ... this is probably about right,” said Dr. Bath.
A potential reason for the neutral results is the negative effect that GTN had among patients with ICH, said Dr. Bath. “In that very early first hour, we are of course breaking a law that we learned in medical school, which is that the first part of hemostasis is spasm. We gave an antispasmodic: a vasodilator,” he added. “That is speculation.”
The trial was funded by the British Heart Foundation. Dr. Bath declared a modest ownership interest in Platelet Solutions and consultant or advisory board positions with Moleac, DiaMedica, Phagenesis, Nestle, and ReNeuron. The other investigators declared no conflicts of interest.
The RIGHT-2 trial shows the limitations of a prehospital enrollment model, wrote Karen C. Johnston, MD, professor of neurology at the University of Virginia in Charlottesville, and Valerie L. Durkalski-Mauldin, PhD, professor of medicine at Medical University of South Carolina in Charleston, in an editorial accompanying the RIGHT-2 trial results. The rate of nonstroke diagnoses was so high that it would have reduced the study’s power to assess the efficacy of glyceryl trinitrate (GTN), had the investigators not increased the sample size and changed the statistical analysis plan.
“Future prehospital trials need to consider the implications of enrolling, yet excluding, stroke mimics in the primary analysis,” said Dr. Johnston and Dr. Durkalski-Mauldin. Using telemedicine in the ambulance to facilitate direct contact between the stroke provider and the patient and emergency medical services provider could reduce the enrollment of patients with stroke mimics in clinical trials, they added. “Improved tools to exclude stroke mimics in the field have been difficult to develop and validate. The absence of imaging in most ambulances will continue to limit field personnel from definitively determining ischemic stroke from intracerebral hemorrhage, which will limit hyperacute trials to interventions presumed safe in both populations.”
In addition, the blood pressure reduction that GTN provided might not be clinically relevant, said Dr. Johnston and Dr. Durkalski-Mauldin. “The RIGHT-2 investigators report no difference in blood pressure at day 3 or day 4 of treatment, which might have been related to the very low adherence to study protocol by day 4.
“Regardless of these limitations, RIGHT-2 has provided high-level evidence that GTN given within 4 hours of onset does not significantly improve outcome in hyperacute patients presenting with possible stroke,” the authors concluded (Lancet. 2019 Feb 6. doi: 10.1016/
S0140-6736(19)30276-4). Dr. Johnston and Dr. Durkalski-Mauldin declared no conflicts of interest.
HONOLULU – , according to data presented at the International Stroke Conference sponsored by the American Heart Association. Results suggest that GTN causes adverse effects in patients with intracerebral hemorrhage (ICH), but this observation is not definitive, according to the researchers. Study results were published online ahead of print Feb. 6 in the Lancet.
Nitric oxide is a regulatory molecule that has vasoactive effects and promotes blood pressure reduction. Vascular levels of nitric oxide are low in stroke, which suggests that the molecule may be a target for stroke treatment. GTN, a nitric oxide donor, lowered blood pressure and improved functional outcome among patients with acute stroke in the phase 2 Rapid Intervention with GTN in Hypertensive Stroke Trial (RIGHT).
Philip Bath, MD, Stroke Association Professor of Stroke Medicine at the University of Nottingham (England), and colleagues conducted the RIGHT-2 study to evaluate the safety and efficacy of GTN when administered early after onset of suspected stroke. Paramedics randomized patients in equal groups to a GTN patch or a sham patch in the ambulance. Three more patches were administered in the hospital on the following days. Active and sham patches looked similar and had no writing on them, thus ensuring effective blinding upon administration. Investigators followed up patients by telephone at 90 days to assess the modified Rankin Scale score and markers of disability, mood, cognition, and quality of life.
Eligible participants were adults who had dialed emergency services, independently or with assistance, because of a possible stroke. They had a Face, Arm, Speech, Time (FAST) score of 2 or 3, were within 4 hours of onset, and had a systolic blood pressure greater than 120 mm Hg. Patients from nursing homes, those with hypoglycemia, those who were unconscious, and those with a witnessed seizure were excluded.
Dr. Bath and colleagues planned to enroll 850 patients from five ambulance services in 30 hospitals across the United Kingdom. Data were to be examined through an intention-to-treat analysis. During the trial, however, the investigators observed that the rate of stroke mimics was 26%, rather than the 12% that they had anticipated. To ensure the proper power for the study, the investigators increased the sample size to 1,149 patients. They also changed the planned data analysis from intention-to-treat to hierarchical analysis. Specifically, the researchers planned to perform the primary analysis in patients with stroke or TIA. If the results were positive, then they would perform a standard intention-to-treat analysis.
More than 99% of patients received the first patch. Approximately 57% of the population received the first two patches. One reason for this decrease in adherence was that many patients were discharged from the hospital with a TIA or a stroke mimic. Participants’ average age was 72. The median time from onset to randomization was 71 minutes, and the median time to treatment was 73 minutes. Participants’ mean systolic blood pressure was 162 mm Hg. Approximately 60% of the patients had a FAST score of 3. About 50% of participants had ischemic stroke, 13% had ICH, 10% had TIA, and 26% had stroke mimics.
At 1 hour after treatment initiation, systolic blood pressure decreased by 6.2 mm Hg and diastolic blood pressure decreased by 2.7 mm Hg among patients who received GTN, compared with controls. At one day, the differences were 5.2 mm Hg and 2.5 mm Hg, respectively, in treated patients, compared with controls. Blood pressure became similar between groups thereafter, “in part because of the tachyphylaxis that we know happens with GTN,” said Dr. Bath.
The researchers found no evidence of an effect of GTN on functional outcome at 90 days in participants with stroke or transient ischemic attack. The adjusted common odds ratio of poor outcome was 1.25 in the GTN group, compared with the control group (95 % confidence interval, 0.97-1.60; P = .083). “We were close to getting a negative trial,” said Dr. Bath.
Subgroup analyses revealed differences in outcome according to the time to randomization. GTN had a negative effect in patients treated within 1 hour of onset. Results were neutral, but tended to be negative, in patients treated between 1 and 2 hours of onset. Results were neutral, but tended to be positive, among patients treated at more than 2 hours after onset. There was no difference between groups in the rate of mortality.
One of the study’s limitations was its single-blind design. In addition, the trial was conducted in a single country, and the investigators changed the protocol after it was initiated. “We had a higher-than-expected [stroke] mimic rate, although I’m reassured by most experts that ... this is probably about right,” said Dr. Bath.
A potential reason for the neutral results is the negative effect that GTN had among patients with ICH, said Dr. Bath. “In that very early first hour, we are of course breaking a law that we learned in medical school, which is that the first part of hemostasis is spasm. We gave an antispasmodic: a vasodilator,” he added. “That is speculation.”
The trial was funded by the British Heart Foundation. Dr. Bath declared a modest ownership interest in Platelet Solutions and consultant or advisory board positions with Moleac, DiaMedica, Phagenesis, Nestle, and ReNeuron. The other investigators declared no conflicts of interest.
REPORTING FROM ISC 2019
MS prevalence estimates reach highest point to date
“Our findings suggest that there has been a steady rise in the prevalence of MS over the past 5 decades, that the prevalence of MS remains higher for women than men, and that a north-south geographic gradient still persists,” wrote lead author Mitchell T. Wallin, MD, of Georgetown University, Washington, and his coauthors. The study was published in Neurology.
To determine adult cases of MS, Dr. Wallin and colleagues applied a validated algorithm to private, military, and public AHC datasets. Data from the 2010 U.S. Census were also used to standardize age and sex. In total, 125 million people over 18 years of age were captured in the study, nearly 45% of the U.S. population.
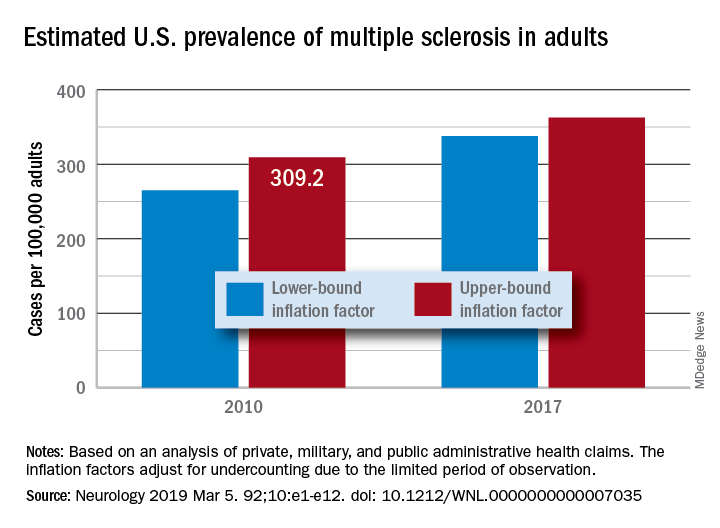
After adjustment, the 2010 prevalence for MS cumulated over 10 years was 309.2 per 100,000 adults (95% confidence interval, 308.1-310.1). This represented a total of 727,344 people with MS. The female to male ratio was 2.8, with a prevalence of 450.1 per 100,000 (95% CI, 448.1-451.6) for women versus a prevalence of 159.7 (95% CI, 158.7-160.6) for men. The age group with the highest estimated prevalence was 55-64 years old, and the prevalence in northern regions of the United States was statistically significantly higher than in southern regions.
The limitations of this study included not including children, the Indian Health Service, the U.S. prison system, or undocumented U.S. residents in the prevalence estimates. However, the authors did note that “these segments of the population are relatively small or, in the case of children, would contribute few cases.” In addition, they were unable to acquire more than 3 years of data for all insurance pools because of high costs.
The study was funded by a grant from the National Multiple Sclerosis Society. The authors reported numerous disclosures, including receiving consulting fees, researching funding, and grant support from various government agencies, foundations, and pharmaceutical companies.
SOURCE: Wallin MT et al. Neurology. 2019 Feb 15. doi: 10.1212/WNL.0000000000007035.
“Our findings suggest that there has been a steady rise in the prevalence of MS over the past 5 decades, that the prevalence of MS remains higher for women than men, and that a north-south geographic gradient still persists,” wrote lead author Mitchell T. Wallin, MD, of Georgetown University, Washington, and his coauthors. The study was published in Neurology.
To determine adult cases of MS, Dr. Wallin and colleagues applied a validated algorithm to private, military, and public AHC datasets. Data from the 2010 U.S. Census were also used to standardize age and sex. In total, 125 million people over 18 years of age were captured in the study, nearly 45% of the U.S. population.
After adjustment, the 2010 prevalence for MS cumulated over 10 years was 309.2 per 100,000 adults (95% confidence interval, 308.1-310.1). This represented a total of 727,344 people with MS. The female to male ratio was 2.8, with a prevalence of 450.1 per 100,000 (95% CI, 448.1-451.6) for women versus a prevalence of 159.7 (95% CI, 158.7-160.6) for men. The age group with the highest estimated prevalence was 55-64 years old, and the prevalence in northern regions of the United States was statistically significantly higher than in southern regions.
The limitations of this study included not including children, the Indian Health Service, the U.S. prison system, or undocumented U.S. residents in the prevalence estimates. However, the authors did note that “these segments of the population are relatively small or, in the case of children, would contribute few cases.” In addition, they were unable to acquire more than 3 years of data for all insurance pools because of high costs.
The study was funded by a grant from the National Multiple Sclerosis Society. The authors reported numerous disclosures, including receiving consulting fees, researching funding, and grant support from various government agencies, foundations, and pharmaceutical companies.
SOURCE: Wallin MT et al. Neurology. 2019 Feb 15. doi: 10.1212/WNL.0000000000007035.
FROM NEUROLOGY
Click for Credit: Endometriosis surgery benefits; diabetes & aging; more
Here are 5 articles from the March issue of Clinician Reviews (individual articles are valid for one year from date of publication—expiration dates below):
1. Endometriosis surgery: Women can expect years-long benefits
To take the posttest, go to: https://bit.ly/2Ez8mdu
Expires January 3, 2019
2. Cerebral small vessel disease progression linked to MCI in hypertensive patients
To take the posttest, go to: https://bit.ly/2ExDV7o
Expires January 4, 2019
3. Adult atopic dermatitis is fraught with dermatologic comorbidities
To take the posttest, go to: https://bit.ly/2Vl7E9a
Expires January 11, 2019
4. Antidepressants tied to greater hip fracture incidence in older adults
To take the posttest, go to: https://bit.ly/2GRfMeH
Expires January 4, 2019
5. Researchers exploring ways to mitigate aging’s impact on diabetes
To take the posttest, go to: https://bit.ly/2tFxF7v
Expires January 8, 2019

MS research: “Our patients can’t wait” for conventional techniques
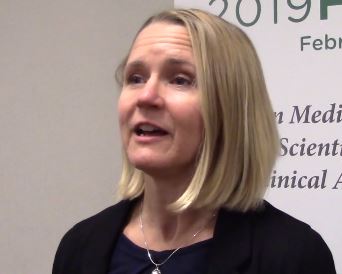
DALLAS – The time is right to bring big data and high-horsepower computation to the thorniest problems in multiple sclerosis (MS) research, said Jennifer Graves, MD, who cochaired the closing session at the meeting held by the Americas Committee for Research and Treatment in Multiple Sclerosis. The session focused on harnessing machine learning, deep learning, and the newest noninvasive observational techniques to move research and clinical care forward.
“We’ve reached a point in MS research where we’re hitting some stumbling blocks. And a lot of those stumbling blocks are related to how well and how precisely we can measure phenotype in MS. The reason that’s important is that our next frontier is treating progressive MS – and what that requires is finding things that let us know what’s happening at the biological level, so that we can screen drugs faster. We can’t afford to have 3- to 5-year clinical trials. ... Because our patients can’t wait,” said Dr. Graves, an associate professor of neuroscience at the University of California, San Diego.
“We can use all sorts of big data sources, whether it’s the rich imaging data we get on patients when they go into the MRI scanner, whether it’s wearable sensors,” or even newer technology, Dr. Graves said. “We can use technology to give us the sensitivity that we’ve been missing.”
Wearable technology, including accelerometers, can track physical activity that tracks with outcomes in MS, she added. As the tech armament increases, so will data available for analysis and correlation.
However, the key to progress will be to focus on technology that measures change over time. “This is the key: sensitivity to change over time. A lot of things can be associated with disability,” said Dr. Graves, but the key is tracking what changes in an individual patient with disease progression, “so that we can detect treatment effects or side effects.”
REPORTING FROM ACTRIMS FORUM 2019
Migraine associated with more severe disability in patients with MS
DALLAS – researchers reported at the meeting held by the Americas Committee for Treatment and Research in Multiple Sclerosis.

“Traditional migraine risk factors such as obesity, anxiety, and depression were also overrepresented in our cohort” of patients with multiple sclerosis (MS) and migraine, said Anne M. Damian, MD, of Johns Hopkins University, Baltimore, and her research colleagues.
Migraine is common in patients with MS, but whether migraine plays a role in MS disease course or MS symptom severity is unknown. Dr. Damian and her colleagues conducted an observational study to examine the associations between migraine history, disability, and neurologic function in patients with MS and whether migraine tends to occur with other comorbid conditions in MS.
They analyzed data from 289 patients (79% female; mean age, 49.2 years) patients with MS who completed the Multiple Sclerosis Performance Test (MSPT), an iPad version of the MS Functional Composite. MS outcome measures included disability (such as the Patient Determined Disease Steps) and objective neurologic outcomes (such as walking speed, manual dexterity, and processing speed). Patients also completed a questionnaire about comorbidities, including history of physician-diagnosed migraine, diabetes, hypertension, hypercholesterolemia, heart disease, sleep apnea, depression, and anxiety.
The researchers used generalized linear models adjusted for age, sex, MS subtype, MS duration, years of education, and body mass index to evaluate the association between history of migraine and MS outcomes.
Compared with patients with MS without migraine, migraineurs (n = 65) tended to be younger (mean age, 44.3 years vs. 50.4 years) and were more likely to be overweight or obese (73.9% vs. 51.6%). In addition, patients with MS and migraine were more likely to have a history of depression (46.2% vs. 24.2%), anxiety (30.8% vs. 18.8%), and severe rather than mild disability (odds ratio, 3.08; 95% confidence, 1.04-9.20). Migraine also was associated with significantly slower walking speeds (9.08% slower; 95% CI, 0.82%-18.77%). Migraine was not associated with processing speed or manual dexterity, however.
If an association between migraine history and worse MS disability is confirmed, migraine history may be a factor that neurologists could consider when making MS treatment decisions, Dr. Damian said. The researchers noted that migraine was reported by patients and not detected using a validated questionnaire. Future studies should investigate whether MS lesions on MRI differ in migraineurs and whether migraine predicts future neurologic disability in patients with MS.
Collection of the MSPT outcomes was sponsored by Biogen.
SOURCE: Damian AM et al. ACTRIMS Forum 2019, Abstract 78.
DALLAS – researchers reported at the meeting held by the Americas Committee for Treatment and Research in Multiple Sclerosis.
“Traditional migraine risk factors such as obesity, anxiety, and depression were also overrepresented in our cohort” of patients with multiple sclerosis (MS) and migraine, said Anne M. Damian, MD, of Johns Hopkins University, Baltimore, and her research colleagues.
Migraine is common in patients with MS, but whether migraine plays a role in MS disease course or MS symptom severity is unknown. Dr. Damian and her colleagues conducted an observational study to examine the associations between migraine history, disability, and neurologic function in patients with MS and whether migraine tends to occur with other comorbid conditions in MS.
They analyzed data from 289 patients (79% female; mean age, 49.2 years) patients with MS who completed the Multiple Sclerosis Performance Test (MSPT), an iPad version of the MS Functional Composite. MS outcome measures included disability (such as the Patient Determined Disease Steps) and objective neurologic outcomes (such as walking speed, manual dexterity, and processing speed). Patients also completed a questionnaire about comorbidities, including history of physician-diagnosed migraine, diabetes, hypertension, hypercholesterolemia, heart disease, sleep apnea, depression, and anxiety.
The researchers used generalized linear models adjusted for age, sex, MS subtype, MS duration, years of education, and body mass index to evaluate the association between history of migraine and MS outcomes.
Compared with patients with MS without migraine, migraineurs (n = 65) tended to be younger (mean age, 44.3 years vs. 50.4 years) and were more likely to be overweight or obese (73.9% vs. 51.6%). In addition, patients with MS and migraine were more likely to have a history of depression (46.2% vs. 24.2%), anxiety (30.8% vs. 18.8%), and severe rather than mild disability (odds ratio, 3.08; 95% confidence, 1.04-9.20). Migraine also was associated with significantly slower walking speeds (9.08% slower; 95% CI, 0.82%-18.77%). Migraine was not associated with processing speed or manual dexterity, however.
If an association between migraine history and worse MS disability is confirmed, migraine history may be a factor that neurologists could consider when making MS treatment decisions, Dr. Damian said. The researchers noted that migraine was reported by patients and not detected using a validated questionnaire. Future studies should investigate whether MS lesions on MRI differ in migraineurs and whether migraine predicts future neurologic disability in patients with MS.
Collection of the MSPT outcomes was sponsored by Biogen.
SOURCE: Damian AM et al. ACTRIMS Forum 2019, Abstract 78.
REPORTING FROM ACTRIMS FORUM 2019
Incidence of treated depression nearly 100% higher in patients with MS
DALLAS – according to an analysis of data from patients in the United Kingdom.
After a diagnosis of MS, the incidence of new treated depression is 229 per 10,000 person-years. In comparison, the incidence of new treated depression among matched patients without MS is 121 per 10,000 person-years, Neil Minton, MD, drug safety head at Celgene, reported at the meeting held by the Americas Committee for Treatment and Research in Multiple Sclerosis.
MS causes changes in the CNS that are associated with depression, but “data on rates of incident depression after MS diagnosis ... are limited,” Dr. Minton and his research colleagues said. To examine rates of treated incident depression in patients with MS after an MS diagnosis, compared with rates in a matched population of patients without MS, the researchers analyzed data from the U.K. Clinical Practice Research Datalink.
Their analysis included patients with MS who received a diagnosis of MS between 2001 and 2016, had at least 1 year of history available before the MS diagnosis, and had no history of treated depression. The researchers matched these patients with as many as 10 patients without MS by age, sex, general practice, record history length, and no history of treated depression. Treated depression was defined as a diagnosis code for depression and a prescription for an antidepressant treatment within 90 days. They used Byar’s method to estimate incidence rates and incidence rate ratios, the Kaplan-Meier method to generate cumulative incidence curves, and a log-rank test to compare the curves.
In all, 5,456 patients with MS and 45,712 matched patients without MS were included in the study. Patients’ median age was 42 years; 65% were female. Compared with patients without MS, patients with MS were more likely to have a history of untreated depression (9.6% vs. 7.5%) and to have received an antidepressant treatment for any indication before cohort entry (28.0% vs. 15.5%). Diagnoses for other psychiatric conditions were similar between the groups.
Incidence rates of treated depression were higher among women with MS, compared with men with MS – 241 versus 202 per 10,000 person-years. Compared with patients without MS, however, men with MS had a higher relative risk of treated depression (2.40 vs. 1.73).
The incidence rate ratios were similar in sensitivity analyses that excluded patients with a history of any psychiatric disorder at cohort entry and that did not require treatment to confirm a depression diagnosis.
The study was funded by a grant from Celgene.
SOURCE: Minton N et al. ACTRIMS Forum 2019, Abstract 82.
REPORTING FROM ACTRIMS FORUM 2019