User login
You and the skeptical patient: Who’s the doctor here?
“I spoke to him on many occasions about the dangers of COVID, but he just didn’t believe me,” said Dr. Hood, an internist in Lexington, Ky. “He just didn’t give me enough time to help him. He waited to let me know he was ill with COVID and took days to pick up the medicine. Unfortunately, he then passed away.”
The rise of the skeptical patient
It can be extremely frustrating for doctors when patients question or disbelieve their physician’s medical advice and explanations. And many physicians resent the amount of time they spend trying to explain or make their case, especially during a busy day. But patients’ skepticism about the validity of some treatments seems to be increasing.
“Patients are now more likely to have their own medical explanation for their complaint than they used to, and that can be bad for their health,” Dr. Hood said.
Dr. Hood sees medical cynicism as part of Americans’ growing distrust of experts, leveraged by easy access to the internet. “When people Google, they tend to look for support of their opinions, rather than arrive at a fully educated decision.”
Only about half of patients believe their physicians “provide fair and accurate treatment information all or most of the time,” according to a 2019 survey by the Pew Research Center.
Patients’ distrust has become more obvious during the COVID-19 pandemic, said John Schumann, MD, an internist with Oak Street Health, a practice with more than 500 physicians and other providers in 20 states, treating almost exclusively Medicare patients.
“The skeptics became more entrenched during the pandemic,” said Dr. Schumann, who is based in Tulsa, Okla. “They may think the COVID vaccines were approved too quickly, or believe the pandemic itself is a hoax.”
“There’s a lot of antiscience rhetoric now,” Dr. Schumann added. “I’d say about half of my patients are comfortable with science-based decisions and the other half are not.”
What are patients mistrustful about?
Patients’ suspicions of certain therapies began long before the pandemic. In dermatology, for example, some patients refuse to take topical steroids, said Steven R. Feldman, MD, a dermatologist in Winston-Salem, N.C.
“Their distrust is usually based on anecdotal stories they read about,” he noted. “Patients in other specialties are dead set against vaccinations.”
In addition to refusing treatments and inoculations, some patients ask for questionable regimens mentioned in the news. “Some patients have demanded hydroxychloroquine or Noromectin, drugs that are unproven in the treatment of COVID,” Dr. Schumann said. “We refuse to prescribe them.”
Dr. Hood said patients’ reluctance to follow medical advice can often be based on cost. “I have a patient who was more willing to save $20 than to save his life. But when the progression of his test results fit my predictions, he became more willing to take treatments. I had to wait for the opportune moment to convince him.”
Many naysayer patients keep their views to themselves, and physicians may be unaware that the patients are stonewalling. A 2006 study estimated that about 10%-16% of primary care patients actively resist medical authority.
Dr. Schumann cited patients who don’t want to hear an upsetting diagnosis. “Some patients might refuse to take a biopsy to see if they have cancer because they don’t want to know,” he said. “In many cases, they simply won’t get the biopsy and won’t tell the doctor that they didn’t.”
Sometimes skeptics’ arguments have merit
Some patients’ concerns can be valid, such as when they refuse to go on statins, said Zain Hakeem, DO, a physician in Austin, Tex.
“In some cases, I feel that statins are not necessary,” he said. “The science on statins for primary prevention is not strong, although they should be used for exceedingly high-risk patients.”
Certain patients, especially those with chronic conditions, do a great deal of research, using legitimate sources on the Web, and their research is well supported.
However, these patients can be overconfident in their conclusions. Several studies have shown that with just a little experience, people can replace beginners’ caution with a false sense of competence.
For example, “Patients may not weigh the risks correctly,” Dr. Hakeem said. “They can be more concerned about the risk of having their colon perforated during a colonoscopy, while the risk of cancer if they don’t have a colonoscopy is much higher.”
Some highly successful people may be more likely to trust their own medical instincts. When Steve Jobs, the founder of Apple, was diagnosed with pancreatic cancer in 2003, he put off surgery for 9 months while he tried to cure his disease with a vegan diet, acupuncture, herbs, bowel cleansings, and other remedies he read about. He died in 2011. Some experts believe that delay hastened his death.
Of course, not all physicians’ diagnoses or treatments are correct. One study indicated doctors’ diagnostic error rate could be as high as 15%. And just as patients can be overconfident in their conclusions, so can doctors. Another study found that physicians’ stated confidence in their diagnosis was only slightly affected by the inaccuracy of that diagnosis or the difficulty of the case.
Best ways to deal with cynical patients
Patients’ skepticism can frustrate doctors, reduce the efficiency of care delivery, and interfere with recovery. What can doctors do to deal with these problems?
1. Build the patient’s trust in you. “Getting patients to adhere to your advice involves making sure they feel they have a caring doctor whom they trust,” Dr. Feldman said.
“I want to show patients that I am entirely focused on them,” he added. “For example, I may rush to the door of the exam room from my last appointment, but I open the door very slowly and deliberately, because I want the patient to see that I won’t hurry with them.”
2. Spend time with the patient. Familiarity builds trust. Dr. Schumann said doctors at Oak Street Health see their patients an average of six to eight times a year, an unusually high number. “The more patients see their physicians, the more likely they are to trust them.”
3. Keep up to date. “I make sure I’m up to date with the literature, and I try to present a truthful message,” Dr. Hood said. “For instance, my research showed that inflammation played a strong role in developing complications from COVID, so I wrote a detailed treatment protocol aimed at the inflammation and the immune response, which has been very effective.”
4. Confront patients tactfully. Patients who do research on the Web don’t want to be scolded, Dr. Feldman said. In fact, he praises them, even if he doesn’t agree with their findings. “I might say: ‘What a relief to finally find patients who’ve taken the time to educate themselves before coming here.’ ”
Dr. Feldman is careful not to dispute patients’ conclusions. “Debating the issues is not an effective approach to get patients to trust you. The last thing you want to tell a patient is: ‘Listen to me! I’m an expert.’ People just dig in.”
However, it does help to give patients feedback. “I’m a big fan of patients arguing with me,” Dr. Hakeem said. “It means you can straighten out misunderstandings and improve decision-making.”
5. Explain your reasoning. “You need to communicate clearly and show them your thinking,” Dr. Hood said. “For instance, I’ll explain why a patient has a strong risk for heart attack.”
6. Acknowledge uncertainties. “The doctor may present the science as far more certain than it is,” Dr. Hakeem said. “If you don’t acknowledge the uncertainties, you could break the patient’s trust in you.”
7. Don’t use a lot of numbers. “Data is not a good tool to convince patients,” Dr. Feldman said. “The human brain isn’t designed to work that way.”
If you want to use numbers to show clinical risk, Dr. Hakeem advisd using natural frequencies, such as 10 out of 10,000, which is less confusing to the patient than the equivalent percentage of 0.1%.
It can be helpful to refer to familiar concepts. One way to understand a risk is to compare it with risks in daily life, such as the dangers of driving or falling in the shower, Dr. Hakeem added.
Dr. Feldman often refers to another person’s experience when presenting his medical advice. “I might say to the patient: ‘You remind me of another patient I had. They were sitting in the same chair you’re sitting in. They did really well on this drug, and I think it’s probably the best choice for you, too.’ ”
8. Adopt shared decision-making. This approach involves empowering the patient to become an equal partner in medical decisions. The patient is given information through portals and is encouraged to do research. Critics, however, say that most patients don’t want this degree of empowerment and would rather depend on the doctor’s advice.
Conclusion
It’s often impossible to get through to a skeptical patient, which can be disheartening for doctors. “Physicians want to do what is best for the patient, so when the patient doesn’t listen, they may take it personally,” Dr. Hood said. “But you always have to remember, the patient is the one with disease, and it’s up to the patient to open the door.”
Still, some skeptical patients ultimately change their minds. Dr. Schumann said patients who initially declined the COVID vaccine eventually decided to get it. “It often took them more than a year. but it’s never too late.”
A version of this article first appeared on Medscape.com.
Loan forgiveness and med school debt: What about me?
This transcript has been edited for clarity.
Hi. I’m Art Caplan. I run the division of medical ethics at New York University Grossman School of Medicine.
Many of you know that President Biden created a loan forgiveness program, forgiving up to $10,000 against federal student loans, including graduate and undergraduate education. The Department of Education is supposed to provide up to $20,000 in debt cancellation to Pell Grant recipients who have loans that are held by the Department of Education. Borrowers can get this relief if their income is less than $125,000 for an individual or $250,000 for married couples.
Many people have looked at this and said, “Hey, wait a minute. I paid off my loans. I didn’t get any reimbursement. That isn’t fair.”
who often still have huge amounts of debt, and either because of the income limits or because they don’t qualify because this debt was accrued long in the past, they’re saying, “What about me? Don’t you want to give any relief to me?”
This is a topic near and dear to my heart because I happen to be at a medical school, NYU, that has decided for the two medical schools it runs – our main campus, NYU in Manhattan and NYU Langone out on Long Island – that we’re going to go tuition free. We’ve done it for a couple of years.
We did it because I think all the administrators and faculty understood the tremendous burden that debt poses on people who both carry forward their undergraduate debt and then have medical school debt. This really leads to very difficult situations – which we have great empathy for – about what specialty you’re going to go into, whether you have to moonlight, and how you’re going to manage a huge burden of debt.
Many people don’t have sympathy out in the public. They say doctors make a large amount of money and they live a nice lifestyle, so we’re not going to relieve their debt. The reality is that, whoever you are, short of Bill Gates or Elon Musk, having hundreds of thousands of dollars of debt is no easy task to live with and to work off.
Still, when we created free tuition at NYU for our medical school, there were many people who paid high tuition fees in the past. Some of them said to us, “What about me?” We decided not to try to do anything retrospectively. The plan was to build up enough money so that we could handle no-cost tuition going forward. We didn’t really have it in our pocketbook to help people who’d already paid their debts or were saddled with NYU debt. Is it fair? No, it’s probably not fair, but it’s an improvement.
That’s what I want people to think about who are saying, “What about my medical school debt? What about my undergraduate plus medical school debt?” I think we should be grateful when efforts are being made to reduce very burdensome student loans that people have. It’s good to give that benefit and move it forward.
Does that mean no one should get anything unless everyone with any kind of debt from school is covered? I don’t think so. I don’t think that’s fair either.
It is possible that we could continue to agitate politically and say, let’s go after some of the health care debt. Let’s go after some of the things that are still driving people to have to work more than they would or to choose specialties that they really don’t want to be in because they have to make up that debt.
It doesn’t mean the last word has been said about the politics of debt relief or, for that matter, the price of going to medical school in the first place and trying to see whether that can be driven down.
I don’t think it’s right to say, “If I can’t benefit, given the huge burden that I’m carrying, then I’m not going to try to give relief to others.” I think we’re relieving debt to the extent that we can do it. The nation can afford it. Going forward is a good thing. It’s wrong to create those gigantic debts in the first place.
What are we going to do about the past? We may decide that we need some sort of forgiveness or reparations for loans that were built up for others going backwards. I wouldn’t hold hostage the future and our children to what was probably a very poor, unethical practice about saddling doctors and others in the past with huge debt.
I’m Art Caplan at the division of medical ethics at New York University Grossman School of Medicine. Thank you for watching.
A version of this article first appeared on Medscape.com.
Which of the following is a nonsurgical treatment for stress urinary incontinence?
[polldaddy:11216821]
[polldaddy:11216821]
[polldaddy:11216821]
Supporting career development for women in gastroenterology
When I was in fellowship in the late 1990s, it was rare to see women at many of the big gastroenterology conferences. And in terms of presentations, there was maybe one session led by or for women at lunchtime. These conferences were the only events I had ever been to where the line for the men’s room was longer than the line for the women’s room.
Over the years, the lines for the women’s room have gotten longer, and the sessions led by female gastroenterologists have grown exponentially. However, women are still underrepresented in our field. Two out of five GI fellows are women, but women constitute less than 18% of practicing gastroenterologists. And the number of women in leadership positions is even lower.
Women in medicine face many challenges
According to a report in JAMA Network Open, women have lower starting salaries more than 90% of the time, which can create income disparities in earning potential throughout our entire careers.
Other studies suggest that female physicians also spend more time with patients and answering messages from patients and colleagues as well. This extra time, although it is done in small increments, adds up quickly and could suggest the pay gap between women and men is wider than we think.
Of course, female physicians still spend more time parenting children and doing household labor. A study found that female physicians spent 8.5 hours more per week on activities that support the family and household.
We’ve been discussing equity for women in medicine, and in the workplace, for decades. But events over the past several years – such as the killing of George Floyd and the formation of the #MeToo movement in response to workplace sexual harassment – have accelerated a paradigm shift in how organizations are focusing on diversity, equity, and inclusion (DEI) and creating cultures that support leadership development for women.
The Gastro Health Women’s Network
In 2020, the leadership of Gastro Health reiterated its commitment to fight discrimination and support equity by sending out a company-wide correspondence that encouraged us to be good stewards within our communities during these turbulent times.
This led to the development of the Gastro Health DEI Council and the Gastro Health Women’s Network, led by Dr. Asma Khapra and based on the framework developed by Dr. Dawn Sears. The programs developed by Dr. Sears are focused on facilitating authentic and supportive relationships, and they helped us create a network for women focused on recruitment, mentorship and retention, networking and social events, and leadership development.
Our network started with a meet & greet, inviting all women in Gastro Health to join a virtual call and get to know each other in an informal setting. This was a great way to introduce people to each other in our natural elements. It was wonderful to see how people are when they are at home and not working.
Recruiting female gastroenterologists
Even though about half of gastroenterology fellows choose independent GI, most fellowship programs don’t educate students about private practice careers or promote that path. In addition, a lot of the national GI conferences are geared toward the academic experience.
It’s incumbent on those of us in private practice to educate students about the benefits and challenges we face as members of independent GI groups, and Gastro Health set out to hold networking and recruitment events at different national conferences with GI fellows and residents.
We’re also working to develop partnerships with fellowship programs. This past year, we’ve held several educational dinners for fellows and residents. Most recently, Dr. Khapra and others took a road trip to New York for dinners with fellows from Mount Sinai, Westchester Medical Center, and the Albert Einstein College of Medicine.
While it was beneficial for Gastro Health to provide information about life as private practice gastroenterologists, it was also helpful for us to hear how the GI leaders of tomorrow are navigating their career choices and what is impacting their decisions about the future.
Mentorship and retention are vital to practice sustainability
Once you’ve recruited physicians to join your practice, how do you ensure their success? Many practices are rightly concerned about their long-term sustainability and are exploring ways to help early-career physicians maintain the clinical skills they need to treat patients and learn the business skills they need to succeed in private practice.
Sometimes it’s as simple as reaching out to new associates on the first day to let them know you’re glad they’ve joined the practice and to let them know you’re available if they need anything. But there’s also growing recognition that implementing a formal mentorship program can help people feel included and supported.
The Women’s Network worked to pair its members with Gastro Health partners as mentors, and we’ve learned some things along the way. Initially, we tried to pair people with similar lifestyles and interests. What we found is that while this sometimes works, we may have overcomplicated the process. We learned that sometimes people would prefer mentors who have backgrounds that are different from their own. We were reminded that mentorship has many faces, and letting those relationships develop naturally can sometimes be more effective.
Networking and social events deter isolation and keep people engaged
Private practice can be different from working within a hospital because oftentimes your colleagues are working in different offices or facilities. In the case of our organization, those offices may be in different states hundreds of miles away. Within a hospital, there might be more potential to interact with your colleagues, whether in clinical conferences or through a chance encounter in the cafeteria.
In private practice, you may need to be more intentional about creating opportunities for people to network and get to know each other outside of work. This year, we developed an email and WhatsApp group so that women throughout the network can connect with each other. We have used it to disseminate information about upcoming events, fellowship opportunities with the national GI societies, interesting articles, and anything important that we think other women within Gastro Health would like to know.
In March, Gastro Health sponsored five women to attend the Scrubs & Heels Summit, which was developed by Dr. Anita Afzali and Dr. Aline Charabaty to create opportunities for women in GI at different stages of their GI careers and help them succeed and achieve their professional goals. There were 2 days of educational talks, but it also included plenty of events for our colleagues to get to know each other and network with other amazing female GI leaders from across the nation.
Where’s the boardroom?
A recent study found that the percentage of women on the boards of the 1,000 largest public companies in America is a little more than 28%, even though research shows that S&P 500 companies headquartered in California with 30% or more women on their boards had 29% higher revenue.
We’re working to develop opportunities for women to be in leadership positions, within our practices and on the national stage in terms of representation, within our national GI societies. It’s very exciting that we have women in leadership within AGA and ASGE, and that Dr. Latha Alaparthi has made increasing the focus on leadership and pipeline development one of her main priorities as the president and board chair of the Digestive Health Physicians Association (DHPA).
Another way private practices can support women who are leaders is by making recommendations for committees within our national societies and by recognizing that time spent developing presentations and speaking at national conferences is beneficial to the practice in terms of thought leadership, branding, and recruitment of the next generation of practice leaders.
While we have a long way to go, we’re also making strides in the board room at the practice level. I’m the first woman, and notably a woman of color, to join the Gastro Health board of directors under the guidance of support of CEO Joseph Garcia. Dr. Aja McCutchen, who serves as the chair of the DHPA Diversity, Equity, and Inclusion committee, is similarly the first woman and woman of color on the board of directors for United Digestive in Atlanta.
What to look for in joining a practice
When determining which practice you might join, ask how committed the leadership of the organization is to supporting career development for women. Does the practice have a network, a committee or other internal group that supports female physicians? What steps does the practice leadership take to support women who are interested in executive opportunities?
If the practice does have an internal organization, how does it measure progress? For example, we’ve implemented focus groups to measure what is working and where we face the most challenges. Gastro Health partnered with a consultant to hold three confidential sessions with 10 women at a time. This will allow for us to collect depersonalized data that can be compiled into a report for the Gastro Health Board and leadership.
If you’re a woman who is considering a career in independent GI, seek out women in private practice and ask about their experiences. Ask about their path and what opportunities they sought out when starting their careers. They may know of some great opportunities that are available to build your leadership skills.
By creating a network for women, Gastro Health is hoping to make it easier to develop relationships and create productive partnerships. We are certain that working to address the specific challenges that female physicians face in their careers will strengthen our group, and ultimately independent gastroenterology overall.
Dr. Adams is a practicing gastroenterologist and partner at Gastro Health Fairfax in Virginia and serves on the Digestive Health Physicians Association’s Diversity, Equity, and Inclusion Committee. Dr. Adams has no conflicts to declare.
Physician bias may prevent quality care for patients with disabilities
For Tara Lagu, MD, the realization that the health care system was broken for patients with disabilities came when a woman she had been treating seemed to keep ignoring Dr. Lagu’s request to see a urologist.
When Dr. Lagu asked the patient’s two attentive daughters about the delay, their response surprised her. The women said they couldn’t find a urologist who was willing to see a patient in a wheelchair.
Surprised and a bit doubtful, Dr. Lagu checked around. She found that, indeed, the only way to get her patient in to see the type of physician required was to send her by ambulance.
“It opened my eyes to how hard it is for patients with disabilities to navigate the health care system,” Dr. Lagu said.
Dr. Lagu, director of the Center for Health Services and Outcomes Research at Northwestern University in Chicago, decided to take a closer look at how her colleagues in medicine care for – or not, as the case proved – the roughly one in four American adults, and millions of children, with disabilities.
In a series of three focus groups, Dr. Lagu and colleagues identified a range of obstacles – including some physician attitudes – that prevent people with disabilities from getting adequate care.
For the study, published in Health Affairs, the researchers interviewed 22 physicians in three groups: Nonrural primary care physicians, rural primary care physicians, and specialists in rheumatology, neurology, obstetrics/gynecology, orthopedics, and ophthalmology.
During the interviews, conducted in the fall of 2018, participants were asked about providing care for five specific types of disabilities: mobility, hearing, vision, mental health, and intellectual limitations.
Lack of experience, logistics often cited
Some physicians admitted that limited resources and training left them without the space and necessary knowledge to properly care for patients with disabilities. They felt they lacked the expertise or exposure to care for individuals with disabilities, nor did they have enough time and space to properly accommodate these patients, according to the researchers. Some said they struggled to coordinate care for individuals with disabilities and did not know which types of accessible equipment, such as adjustable tables and chair scales, were needed or how to use them.
Several physicians also noted that they are inadequately reimbursed for the special accommodations – including additional staff, equipment, and time – required to care for these patients. One primary care physician said he hired a sign-language interpreter for a patient but the bill for the services exceeded the amount insurance reimbursed. As a result, he said, he spent $30 of his own money per visit to see the patient.
Because of these limitations, some physicians in the focus groups said they try to turn away patients with disabilities. Both specialists and general practitioners said they had told patients with disabilities that they didn’t feel they could provide the care needed, and suggested they look elsewhere. A few were surprisingly – even upsettingly – honest, Dr. Lagu said, making statements such as: “I am not the doctor for you.”
‘We really need a rewrite’
Previous work has shown that people with disabilities have worse health outcomes, such as undetected cancer, obesity, and cardiovascular disease.
But “the disability itself isn’t what leads to worse outcomes,” said Allison Kessler, MD, section chief of the Renée Crown Center for Spinal Cord Innovation and associate director of the Shirley Ryan AbilityLab in Chicago*. This study does a good job at highlighting “the need for change on multiple levels,” said Dr. Kessler, who was not a member of the study team.
“People with disabilities have all these disparities in access and outcomes. We’ve never understood why. I think the why is complicated,” Dr. Lagu added. “I think this study suggests some of the negative outcomes are due to explicit bias.”
“It’s also clear that the current framework of health care in the United States does not lend to allowing physicians and medical providers the time needed to adequately address patient issues – those with disabilities or just multiple complex problems,” Colin O’Reilly, DO, vice president and chief medical officer at Children’s Specialized Hospital, an acute rehabilitation facility affiliated with RWJBarnabas Health, in New Brunswick, N.J. “We really need a rewrite.”
However, Dr. O’Reilly said, such a small study population with no control group and no mention of physician resources makes it difficult to come to a strong conclusion about physician bias and discriminatory attitudes against individuals with disabilities.
Dr. Lagu agreed, saying this research “is not conclusive in any way.” The excuses doctors use to discharge patients with disabilities, such as “we don’t accept your insurance,” “we aren’t taking new patients,” and “we can’t provide you with the appropriate care,” could be legitimate, the study authors wrote. But the “disparities in care for people with disabilities suggest that there is a pattern of more frequently denying care to them than people without a disability,” they added.
Dr. Kessler said many of her patients have told her they experience barriers to care. Some say finding an office with the necessary equipment is a challenge or that they often don’t feel welcome.
The Americans With Disabilities Act (ADA) is a federal civil rights law that prohibits discrimination against individuals with disabilities in all public and private places that are open to the general public, including medical offices.
“It is difficult to enforce the ADA in medical settings,” the researchers noted. “Explanations physicians gave in this study could, for any single case of denying care, be legitimate.” Knowing whether a particular instance of denial of care represents discrimination related to disability is “nearly impossible,” they wrote.
All the experts agreed that the study adds valuable insight into an ongoing health disparity. And while system and policy changes are required, Dr. Kessler said, individual physicians can take steps to improve the situation.
A physician in an academic setting can look at the curriculum and the medical school and see about increasing exposure to patients with disabilities earlier in training. In a practice, physicians can retrain staff to ask every patient if an accommodation is needed. “Each one of those changes can only help us move our system in the right direction,” Dr. Kessler said.
The study was supported by a grant from the Eunice Kennedy Shriver National Institute of Child Health and Human Development.
*Correction, 10/5/22: This article includes a corrected title for Dr. Allison Kessler.
A version of this article first appeared on Medscape.com.
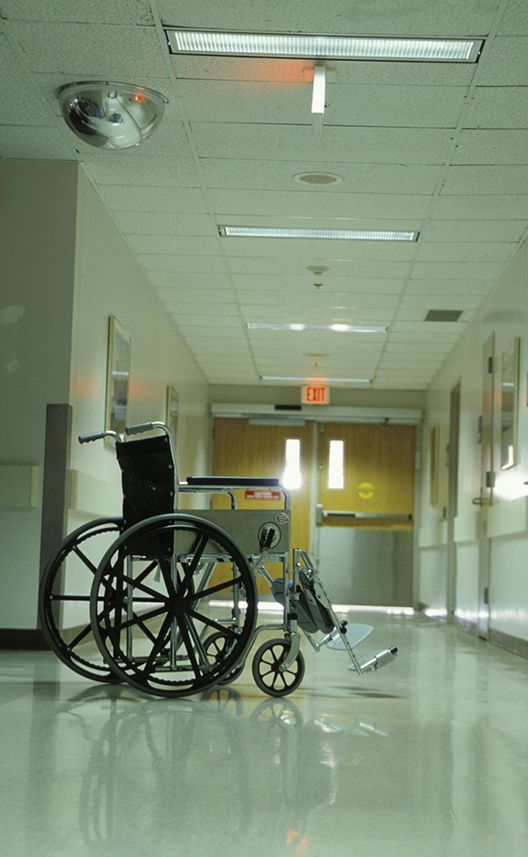
Cancer as a full contact sport
John worked as a handyman and lived on a small sailboat in a marina. When he was diagnosed with metastatic kidney cancer at age 48, he quickly fell through the cracks. He failed to show to appointments and took oral anticancer treatments, but just sporadically. He had Medicaid, so insurance wasn’t the issue. It was everything else.
John was behind on his slip fees; he hadn’t been able to work for some time because of his progressive weakness and pain. He was chronically in danger of getting kicked out of his makeshift home aboard the boat. He had no reliable transportation to the clinic and so he didn’t come to appointments regularly. The specialty pharmacy refused to deliver his expensive oral chemotherapy to his address at the marina. He went days without eating full meals because he was too weak to cook for himself. Plus, he was estranged from his family who were unaware of his illness. His oncologist was overwhelmed trying to take care of him. He had a reasonable chance of achieving disease control on first-line oral therapy, but his problems seemed to hinder these chances at every turn. She was distraught – what could she do?

Enter the team approach. John’s oncologist reached out to our palliative care program for help. We recognized that this was a job too big for us alone so we connected John with the Extensivist Medicine program at UCLA Health, a high-intensity primary care program led by a physician specializing in primary care for high-risk individuals. The program provides wraparound outpatient services for chronically and seriously ill patients, like John, who are at risk for falling through the cracks. John went from receiving very little support to now having an entire team of caring professionals focused on helping him achieve his best possible outcome despite the seriousness of his disease.
He now had the support of a high-functioning team with clearly defined roles. Social work connected him with housing, food, and transportation resources. A nurse called him every day to check in and make sure he was taking medications and reminded him about his upcoming appointments. Case management helped him get needed equipment, such as grab bars and a walker. As his palliative care nurse practitioner, I counseled him on understanding his prognosis and planning ahead for medical emergencies. Our psycho-oncology clinicians helped John reconcile with his family, who were more than willing to take him in once they realized how ill he was. Once these social factors were addressed, John could more easily stay current with his oral chemotherapy, giving him the best chance possible to achieve a robust treatment response that could buy him more time.
And, John did get that time – he got 6 months of improved quality of life, during which he reconnected with his family, including his children, and rebuilt these important relationships. Eventually treatment failed him. His disease, already widely metastatic, became more active and painful. He accepted hospice care at his sister’s house and we transitioned him from our team to the hospice team. He died peacefully surrounded by family.
Interprofessional teamwork is fundamental to treat ‘total pain’
None of this would have been possible without the work of high-functioning teams. It is a commonly held belief that interprofessional teamwork is fundamental to the care of patients and families living with serious illness. But why? How did this idea come about? And what evidence is there to support teamwork?
Dame Cicely Saunders, who founded the modern hospice movement in mid-20th century England, embodied the interdisciplinary team by working first as a nurse, then a social worker, and finally as a physician. She wrote about patients’ “total pain,” the crisis of physical, spiritual, social, and emotional distress that many people have at the end of life. She understood that no single health care discipline was adequate to the task of addressing each of these domains equally well. Thus, hospice became synonymous with care provided by a quartet of specialists – physicians, nurses, social workers, and chaplains. Nowadays, there are other specialists that are added to the mix – home health aides, pharmacists, physical and occupational therapists, music and pet therapists, and so on.
But in medicine, like all areas of science, convention and tradition only go so far. What evidence is there to support the work of an interdisciplinary team in managing the distress of patients and families living with advanced illnesses? It turns out that there is good evidence to support the use of high-functioning interdisciplinary teams in the care of the seriously ill. Palliative care is associated with improved patient outcomes, including improvements in symptom control, quality of life, and end of life care, when it is delivered by an interdisciplinary team rather than by a solo practitioner.
You may think that teamwork is most useful for patients like John who have seemingly intractable social barriers. But it is also true that for even patients with many more social advantages teamwork improves quality of life. I got to see this up close recently in my own life.
Teamwork improves quality of life
My father recently passed away after a 9-month battle with advanced cancer. He had every advantage possible – financial stability, high health literacy, an incredibly devoted spouse who happens to be an RN, good insurance, and access to top-notch medical care. Yet, even he benefited from a team approach. It started small, with the oncologist and oncology NP providing excellent, patient-centered care. Then it grew to include myself as the daughter/palliative care nurse practitioner who made recommendations for treating his nausea and ensured that his advance directive was completed and uploaded to his chart. When my dad needed physical therapy, the home health agency sent a wonderful physical therapist, who brought all sorts of equipment that kept him more functional than he would have been otherwise. Other family members helped out – my sisters helped connect my dad with a priest who came to the home to provide spiritual care, which was crucial to ensuring that he was at peace. And, in his final days, my dad had the hospice team to help manage his symptoms and his family members to provide hands-on care.
The complexity of cancer care has long necessitated a team approach to planning cancer treatment – known as a tumor board – with medical oncology, radiation oncology, surgery, and pathology all weighing in. It makes sense that patients and their families would also need a team of clinicians representing different specialty areas to assist with the wide array of physical, psychosocial, practical, and spiritual concerns that arise throughout the cancer disease trajectory.
Ms. D’Ambruoso is a hospice and palliative care nurse practitioner for UCLA Health Cancer Care, Santa Monica, Calif.
John worked as a handyman and lived on a small sailboat in a marina. When he was diagnosed with metastatic kidney cancer at age 48, he quickly fell through the cracks. He failed to show to appointments and took oral anticancer treatments, but just sporadically. He had Medicaid, so insurance wasn’t the issue. It was everything else.
John was behind on his slip fees; he hadn’t been able to work for some time because of his progressive weakness and pain. He was chronically in danger of getting kicked out of his makeshift home aboard the boat. He had no reliable transportation to the clinic and so he didn’t come to appointments regularly. The specialty pharmacy refused to deliver his expensive oral chemotherapy to his address at the marina. He went days without eating full meals because he was too weak to cook for himself. Plus, he was estranged from his family who were unaware of his illness. His oncologist was overwhelmed trying to take care of him. He had a reasonable chance of achieving disease control on first-line oral therapy, but his problems seemed to hinder these chances at every turn. She was distraught – what could she do?
Enter the team approach. John’s oncologist reached out to our palliative care program for help. We recognized that this was a job too big for us alone so we connected John with the Extensivist Medicine program at UCLA Health, a high-intensity primary care program led by a physician specializing in primary care for high-risk individuals. The program provides wraparound outpatient services for chronically and seriously ill patients, like John, who are at risk for falling through the cracks. John went from receiving very little support to now having an entire team of caring professionals focused on helping him achieve his best possible outcome despite the seriousness of his disease.
He now had the support of a high-functioning team with clearly defined roles. Social work connected him with housing, food, and transportation resources. A nurse called him every day to check in and make sure he was taking medications and reminded him about his upcoming appointments. Case management helped him get needed equipment, such as grab bars and a walker. As his palliative care nurse practitioner, I counseled him on understanding his prognosis and planning ahead for medical emergencies. Our psycho-oncology clinicians helped John reconcile with his family, who were more than willing to take him in once they realized how ill he was. Once these social factors were addressed, John could more easily stay current with his oral chemotherapy, giving him the best chance possible to achieve a robust treatment response that could buy him more time.
And, John did get that time – he got 6 months of improved quality of life, during which he reconnected with his family, including his children, and rebuilt these important relationships. Eventually treatment failed him. His disease, already widely metastatic, became more active and painful. He accepted hospice care at his sister’s house and we transitioned him from our team to the hospice team. He died peacefully surrounded by family.
Interprofessional teamwork is fundamental to treat ‘total pain’
None of this would have been possible without the work of high-functioning teams. It is a commonly held belief that interprofessional teamwork is fundamental to the care of patients and families living with serious illness. But why? How did this idea come about? And what evidence is there to support teamwork?
Dame Cicely Saunders, who founded the modern hospice movement in mid-20th century England, embodied the interdisciplinary team by working first as a nurse, then a social worker, and finally as a physician. She wrote about patients’ “total pain,” the crisis of physical, spiritual, social, and emotional distress that many people have at the end of life. She understood that no single health care discipline was adequate to the task of addressing each of these domains equally well. Thus, hospice became synonymous with care provided by a quartet of specialists – physicians, nurses, social workers, and chaplains. Nowadays, there are other specialists that are added to the mix – home health aides, pharmacists, physical and occupational therapists, music and pet therapists, and so on.
But in medicine, like all areas of science, convention and tradition only go so far. What evidence is there to support the work of an interdisciplinary team in managing the distress of patients and families living with advanced illnesses? It turns out that there is good evidence to support the use of high-functioning interdisciplinary teams in the care of the seriously ill. Palliative care is associated with improved patient outcomes, including improvements in symptom control, quality of life, and end of life care, when it is delivered by an interdisciplinary team rather than by a solo practitioner.
You may think that teamwork is most useful for patients like John who have seemingly intractable social barriers. But it is also true that for even patients with many more social advantages teamwork improves quality of life. I got to see this up close recently in my own life.
Teamwork improves quality of life
My father recently passed away after a 9-month battle with advanced cancer. He had every advantage possible – financial stability, high health literacy, an incredibly devoted spouse who happens to be an RN, good insurance, and access to top-notch medical care. Yet, even he benefited from a team approach. It started small, with the oncologist and oncology NP providing excellent, patient-centered care. Then it grew to include myself as the daughter/palliative care nurse practitioner who made recommendations for treating his nausea and ensured that his advance directive was completed and uploaded to his chart. When my dad needed physical therapy, the home health agency sent a wonderful physical therapist, who brought all sorts of equipment that kept him more functional than he would have been otherwise. Other family members helped out – my sisters helped connect my dad with a priest who came to the home to provide spiritual care, which was crucial to ensuring that he was at peace. And, in his final days, my dad had the hospice team to help manage his symptoms and his family members to provide hands-on care.
The complexity of cancer care has long necessitated a team approach to planning cancer treatment – known as a tumor board – with medical oncology, radiation oncology, surgery, and pathology all weighing in. It makes sense that patients and their families would also need a team of clinicians representing different specialty areas to assist with the wide array of physical, psychosocial, practical, and spiritual concerns that arise throughout the cancer disease trajectory.
Ms. D’Ambruoso is a hospice and palliative care nurse practitioner for UCLA Health Cancer Care, Santa Monica, Calif.
Dual-Physician Marriages: Understanding the Challenges and Rewards
Dual-physician marriages are becoming increasingly common. The estimated median age of first marriage has been increasing; the US Census Bureau reported a median age of 30.4 years for men and 28.6 years for women in early 2021.1 According to the Association of American Medical Colleges 2020 Matriculating Student Questionnaire, the median age at matriculation for medical students was 23 years (N=16,956), and 92.4% (N=15,932) reported their marital status as single and never legally married.2 Thus, it is likely that the majority of physicians get married at some point during medical school or residency training. A survey of over 10,000 physicians in more than 29 specialties showed that 24% of female physicians and 15% of male physicians are married to other physicians.3
Challenges
There are common challenges to all dual-career households, including coordinating demanding career schedules that compete with each other, balancing childrearing with career advancement, and harmonizing economic and personal goals. However, there are challenges that can be amplified in and unique to dual-physician marriages.
The Couples Match—Medical students, trainees, and even physicians in later stages of their careers may have less autonomy over their schedules compared to professionals in other fields. An early obstacle that many dual-physician marriages must overcome is navigating the National Resident Matching Program as a couple. The number of individuals participating as a couple in the 2022 Main Residency Match was 2444, and the postgraduate year 1 (PGY-1) match rate for individuals participating as a couple was 93.7%. The overall PGY-1 match rate for MD seniors in the United States was 92.9%.4 Thus, entering the match as a couple does not necessarily pose a disadvantage to successfully matching, but these statistics may be misleading. When applicants participate in the Match as a couple, their rank order lists form pairs of program choices that are processed by the matching algorithm to match the couple to the most preferred pair of programs on their rank order lists where each partner has been offered a position. Although many couples coordinate their rank order lists geographically, there is no guarantee that the couple will actually match together in the same city, let alone in the same time zone. Also, the statistics do not take into account if an individual in the couple is only partially matched (eg, if one applicant matches to a preliminary year position but not to an advanced dermatology position). The couples’ Match is only available to partners in the same application cycle, and couples that are not in sync may be more restricted when applying for residency positions.
Lack of Synchronization—Dual-physician couples are challenged to achieve synchronization not only in their day-to-day lives but also over the course of their careers. After matching to residency, the dual-physician couple faces additional scheduling stressors during training. Varied demanding patient schedules and competing call schedules may take a toll on the ability to spend time together. Coordination between both training programs to ensure weekend schedules and vacations are aligned can be helpful to try to maximize time together. If the couple’s education is staggered, their training schedules may not align when proceeding to fellowship or starting off with a new job as an attending. It is not uncommon for couples in medicine to be long-distance for a period of time, and partners may find themselves sacrificing ideal positions or self-restricting application to certain programs or jobs to secure a position near a partner who is already in training in a certain geographic location.
Domestic Work-Life Balance—Juxtaposing 2 highly demanding careers in the same household can be associated with certain tensions, as the weight of household and childrearing responsibilities as well as professional productivity and advancement is divided by the couple. In a 2008 survey of the American College of Surgeons on burnout, work-home conflict, and career satisfaction, surgeons in dual-physician relationships experienced a recent career conflict with their domestic partner and a work-home conflict more often than surgeons whose partners were working nonphysicians.5 The hours worked between men and women in dual-physician families differed according to a national sample of 9868 physicians in dual-physician relationships. The study showed that weekly hours worked by women with children were lower than among those without children, whereas similar differences were not observed among men.6 It is not understood if this suggests that women in dual-physician families work fewer hours due to the pressures of historical gender norms and increased household responsibilities. A 1988 survey of female physicians (N=382) in which 247 respondents indicated that they had domestic partners showed that women physicians whose partners also were physicians (n=91) were more than twice as likely to interrupt their own careers for their partners’ careers compared to female physicians whose partners were not physicians (n=156)(25% vs 11%, respectively). In contrast, the male partners who were not physicians were significantly more likely to interrupt their careers than male partners who were physicians (41% vs 15%, respectively, P<.05).7
Divorce—There have been mixed reports on the incidence of divorce in physicians compared to the general population, but studies suggest that physicians’ marriages tend to be more stable than those of other societal groups.8 Of 203 respondents of a survey of female physician members of the Minnesota Medical Association who were or had been married to another physician, 11.3% (22/203) were divorced, and medicine was reported to play a role in 69.6% of those separations.9 A retrospective analysis of nationally representative surveys by the US Census showed that divorce among physicians is less common than among non–health care workers and several other health professions.10
Rewards
The benefits of medical marriages are multifold and include increased job satisfaction, stability, financial security, shared passions, and mutual understanding. Common passions and interests form the foundation for many relationships, which is true for the dual-physician marriage. In a 2009 study, Perlman et al11 performed qualitative interviews with 25 physicians and their partners—10 of which were in dual-physician relationships—about the challenges and strengths of their relationships. A key theme that emerged during the interviews was the acknowledgment of the benefits of being a physician to the relationship. Participants discussed both the financial security in a physician marriage and the security that medical knowledge adds to a relationship when caring for ill or injured family members. Other key themes identified were relying on mutual support in the relationship, recognizing the important role of each family member, and having shared values.11
Financial Security—The financial security attributed to being in a medical marriage was highlighted in a series of interviews with physicians and their spouses.11 A cross-sectional survey of a random sample of physicians showed that both men and women in dual-physician families had lower personal incomes than physicians married to nonphysicians. However, men and women in dual-physician families had spouses with higher incomes compared to spouses of physicians married to nonphysicians. Thus, the total family incomes were substantially higher in dual-physician households than the family incomes of physicians married to nonphysicians.12
Satisfaction—Dual-physician marriages benefit from a shared camaraderie and understanding of the joys and sacrifices that accompany pursuing a career in medicine. Medical spouses can communicate in mutually understood medical jargon. Compared to physicians married to nonphysicians, a statistically significant difference (P<.001) was found in physicians in dual-physicians families who more frequently reported enjoyment in discussing work with their spouses and more frequently reported satisfaction from shared work interests with their spouses.12
Final Thoughts
From the start of medical training, physicians and physicians-in-training experience unique benefits and challenges that are compounded in distinctive ways when 2 physicians get married. In an era where dual-physician marriage is becoming more common, it is important to acknowledge how this can both enrich and challenge the relationship.
Acknowledgment—The author thanks her husband Joshua L. Weinstock, MD (Camden, New Jersey), for his contribution to this article and their marriage.
- Census Bureau releases new estimates on America’s families and living arrangements. News release. US Census Bureau; November 29, 2021. Accessed September 23, 2022. https://www.census.gov/newsroom/press-releases/2021/families-and-living-arrangements.html
- Association of American Medical Colleges. Matriculating Student Questionnaire: 2020 All Schools Summary Report. Published December 2020. Accessed September 12, 2022. https://www.aamc.org/media/50081/download
- Baggett SM, Martin KL. Medscape physician lifestyle & happiness report 2022. Medscape. January 14, 2022. Accessed September 19, 2022. https://www.medscape.com/slideshow/2022-lifestyle-happiness-6014665
- National Resident Matching Program. Results and Data 2022 Main Residency Match. Published May 2022. Accessed September 12, 2022. https://www.nrmp.org/wp-content/uploads/2022/05/2022-Main-Match-Results-and-Data_Final.pdf
- Dyrbye LN, Shanafelt TD, Balch CM, et al. Physicians married or partnered to physicians: a comparative study in the American College of Surgeons. J Am Coll Surg. 2010;211:663-671. doi:10.1016/j.jamcollsurg.2010.03.032
- Ly DP, Seabury SA, Jena AB. Hours worked among US dual physician couples with children, 2000 to 2015. JAMA Intern Med. 2017;177:1524-1525. doi:10.1001/jamainternmed.2017.3437
- Tesch BJ, Osborne J, Simpson DE, et al. Women physicians in dual-physician relationships compared with those in other dual-career relationships. Acad Med. 1992;67:542-544. doi:10.1097/00001888-199208000-00014
- Doherty WJ, Burge SK. Divorce among physicians. comparisons with other occupational groups. JAMA. 1989;261:2374-2377.
- Smith C, Boulger J, Beattie K. Exploring the dual-physician marriage. Minn Med. 2002;85:39-43.
- Ly DP, Seabury SA, Jena AB. Divorce among physicians and other healthcare professionals in the United States: analysis of census survey data. BMJ. 2015;350:h706. doi:10.1136/bmj.h706
- Perlman RL, Ross PT, Lypson ML. Understanding the medical marriage: physicians and their partners share strategies for success. Acad Med. 2015;90:63-68. doi:10.1097/ACM.0000000000000449
- Sobecks NW, Justice AC, Hinze S, et al. When doctors marry doctors: a survey exploring the professional and family lives of young physicians. Ann Intern Med. 1999;130(4 pt 1):312-319. doi:10.7326/0003-4819-130-4-199902160-00017
Dual-physician marriages are becoming increasingly common. The estimated median age of first marriage has been increasing; the US Census Bureau reported a median age of 30.4 years for men and 28.6 years for women in early 2021.1 According to the Association of American Medical Colleges 2020 Matriculating Student Questionnaire, the median age at matriculation for medical students was 23 years (N=16,956), and 92.4% (N=15,932) reported their marital status as single and never legally married.2 Thus, it is likely that the majority of physicians get married at some point during medical school or residency training. A survey of over 10,000 physicians in more than 29 specialties showed that 24% of female physicians and 15% of male physicians are married to other physicians.3
Challenges
There are common challenges to all dual-career households, including coordinating demanding career schedules that compete with each other, balancing childrearing with career advancement, and harmonizing economic and personal goals. However, there are challenges that can be amplified in and unique to dual-physician marriages.
The Couples Match—Medical students, trainees, and even physicians in later stages of their careers may have less autonomy over their schedules compared to professionals in other fields. An early obstacle that many dual-physician marriages must overcome is navigating the National Resident Matching Program as a couple. The number of individuals participating as a couple in the 2022 Main Residency Match was 2444, and the postgraduate year 1 (PGY-1) match rate for individuals participating as a couple was 93.7%. The overall PGY-1 match rate for MD seniors in the United States was 92.9%.4 Thus, entering the match as a couple does not necessarily pose a disadvantage to successfully matching, but these statistics may be misleading. When applicants participate in the Match as a couple, their rank order lists form pairs of program choices that are processed by the matching algorithm to match the couple to the most preferred pair of programs on their rank order lists where each partner has been offered a position. Although many couples coordinate their rank order lists geographically, there is no guarantee that the couple will actually match together in the same city, let alone in the same time zone. Also, the statistics do not take into account if an individual in the couple is only partially matched (eg, if one applicant matches to a preliminary year position but not to an advanced dermatology position). The couples’ Match is only available to partners in the same application cycle, and couples that are not in sync may be more restricted when applying for residency positions.
Lack of Synchronization—Dual-physician couples are challenged to achieve synchronization not only in their day-to-day lives but also over the course of their careers. After matching to residency, the dual-physician couple faces additional scheduling stressors during training. Varied demanding patient schedules and competing call schedules may take a toll on the ability to spend time together. Coordination between both training programs to ensure weekend schedules and vacations are aligned can be helpful to try to maximize time together. If the couple’s education is staggered, their training schedules may not align when proceeding to fellowship or starting off with a new job as an attending. It is not uncommon for couples in medicine to be long-distance for a period of time, and partners may find themselves sacrificing ideal positions or self-restricting application to certain programs or jobs to secure a position near a partner who is already in training in a certain geographic location.
Domestic Work-Life Balance—Juxtaposing 2 highly demanding careers in the same household can be associated with certain tensions, as the weight of household and childrearing responsibilities as well as professional productivity and advancement is divided by the couple. In a 2008 survey of the American College of Surgeons on burnout, work-home conflict, and career satisfaction, surgeons in dual-physician relationships experienced a recent career conflict with their domestic partner and a work-home conflict more often than surgeons whose partners were working nonphysicians.5 The hours worked between men and women in dual-physician families differed according to a national sample of 9868 physicians in dual-physician relationships. The study showed that weekly hours worked by women with children were lower than among those without children, whereas similar differences were not observed among men.6 It is not understood if this suggests that women in dual-physician families work fewer hours due to the pressures of historical gender norms and increased household responsibilities. A 1988 survey of female physicians (N=382) in which 247 respondents indicated that they had domestic partners showed that women physicians whose partners also were physicians (n=91) were more than twice as likely to interrupt their own careers for their partners’ careers compared to female physicians whose partners were not physicians (n=156)(25% vs 11%, respectively). In contrast, the male partners who were not physicians were significantly more likely to interrupt their careers than male partners who were physicians (41% vs 15%, respectively, P<.05).7
Divorce—There have been mixed reports on the incidence of divorce in physicians compared to the general population, but studies suggest that physicians’ marriages tend to be more stable than those of other societal groups.8 Of 203 respondents of a survey of female physician members of the Minnesota Medical Association who were or had been married to another physician, 11.3% (22/203) were divorced, and medicine was reported to play a role in 69.6% of those separations.9 A retrospective analysis of nationally representative surveys by the US Census showed that divorce among physicians is less common than among non–health care workers and several other health professions.10
Rewards
The benefits of medical marriages are multifold and include increased job satisfaction, stability, financial security, shared passions, and mutual understanding. Common passions and interests form the foundation for many relationships, which is true for the dual-physician marriage. In a 2009 study, Perlman et al11 performed qualitative interviews with 25 physicians and their partners—10 of which were in dual-physician relationships—about the challenges and strengths of their relationships. A key theme that emerged during the interviews was the acknowledgment of the benefits of being a physician to the relationship. Participants discussed both the financial security in a physician marriage and the security that medical knowledge adds to a relationship when caring for ill or injured family members. Other key themes identified were relying on mutual support in the relationship, recognizing the important role of each family member, and having shared values.11
Financial Security—The financial security attributed to being in a medical marriage was highlighted in a series of interviews with physicians and their spouses.11 A cross-sectional survey of a random sample of physicians showed that both men and women in dual-physician families had lower personal incomes than physicians married to nonphysicians. However, men and women in dual-physician families had spouses with higher incomes compared to spouses of physicians married to nonphysicians. Thus, the total family incomes were substantially higher in dual-physician households than the family incomes of physicians married to nonphysicians.12
Satisfaction—Dual-physician marriages benefit from a shared camaraderie and understanding of the joys and sacrifices that accompany pursuing a career in medicine. Medical spouses can communicate in mutually understood medical jargon. Compared to physicians married to nonphysicians, a statistically significant difference (P<.001) was found in physicians in dual-physicians families who more frequently reported enjoyment in discussing work with their spouses and more frequently reported satisfaction from shared work interests with their spouses.12
Final Thoughts
From the start of medical training, physicians and physicians-in-training experience unique benefits and challenges that are compounded in distinctive ways when 2 physicians get married. In an era where dual-physician marriage is becoming more common, it is important to acknowledge how this can both enrich and challenge the relationship.
Acknowledgment—The author thanks her husband Joshua L. Weinstock, MD (Camden, New Jersey), for his contribution to this article and their marriage.
- Census Bureau releases new estimates on America’s families and living arrangements. News release. US Census Bureau; November 29, 2021. Accessed September 23, 2022. https://www.census.gov/newsroom/press-releases/2021/families-and-living-arrangements.html
- Association of American Medical Colleges. Matriculating Student Questionnaire: 2020 All Schools Summary Report. Published December 2020. Accessed September 12, 2022. https://www.aamc.org/media/50081/download
- Baggett SM, Martin KL. Medscape physician lifestyle & happiness report 2022. Medscape. January 14, 2022. Accessed September 19, 2022. https://www.medscape.com/slideshow/2022-lifestyle-happiness-6014665
- National Resident Matching Program. Results and Data 2022 Main Residency Match. Published May 2022. Accessed September 12, 2022. https://www.nrmp.org/wp-content/uploads/2022/05/2022-Main-Match-Results-and-Data_Final.pdf
- Dyrbye LN, Shanafelt TD, Balch CM, et al. Physicians married or partnered to physicians: a comparative study in the American College of Surgeons. J Am Coll Surg. 2010;211:663-671. doi:10.1016/j.jamcollsurg.2010.03.032
- Ly DP, Seabury SA, Jena AB. Hours worked among US dual physician couples with children, 2000 to 2015. JAMA Intern Med. 2017;177:1524-1525. doi:10.1001/jamainternmed.2017.3437
- Tesch BJ, Osborne J, Simpson DE, et al. Women physicians in dual-physician relationships compared with those in other dual-career relationships. Acad Med. 1992;67:542-544. doi:10.1097/00001888-199208000-00014
- Doherty WJ, Burge SK. Divorce among physicians. comparisons with other occupational groups. JAMA. 1989;261:2374-2377.
- Smith C, Boulger J, Beattie K. Exploring the dual-physician marriage. Minn Med. 2002;85:39-43.
- Ly DP, Seabury SA, Jena AB. Divorce among physicians and other healthcare professionals in the United States: analysis of census survey data. BMJ. 2015;350:h706. doi:10.1136/bmj.h706
- Perlman RL, Ross PT, Lypson ML. Understanding the medical marriage: physicians and their partners share strategies for success. Acad Med. 2015;90:63-68. doi:10.1097/ACM.0000000000000449
- Sobecks NW, Justice AC, Hinze S, et al. When doctors marry doctors: a survey exploring the professional and family lives of young physicians. Ann Intern Med. 1999;130(4 pt 1):312-319. doi:10.7326/0003-4819-130-4-199902160-00017
Resident Pearl
- As more physicians marry other physicians, there is an increasing need to understand the challenges and rewards of these relationships.
Out-of-state telehealth visits could help more patients if restrictions eased: Study
About 5% of traditional Medicare patients who had telehealth visits were seen virtually by out-of-state clinicians in the first half of 2021, according to a new study in JAMA Health Forum.
Since then, however, many states have restored restrictions that prevent physicians who are licensed in one state from having telehealth visits with patients unless they’re licensed in the state where the patients live.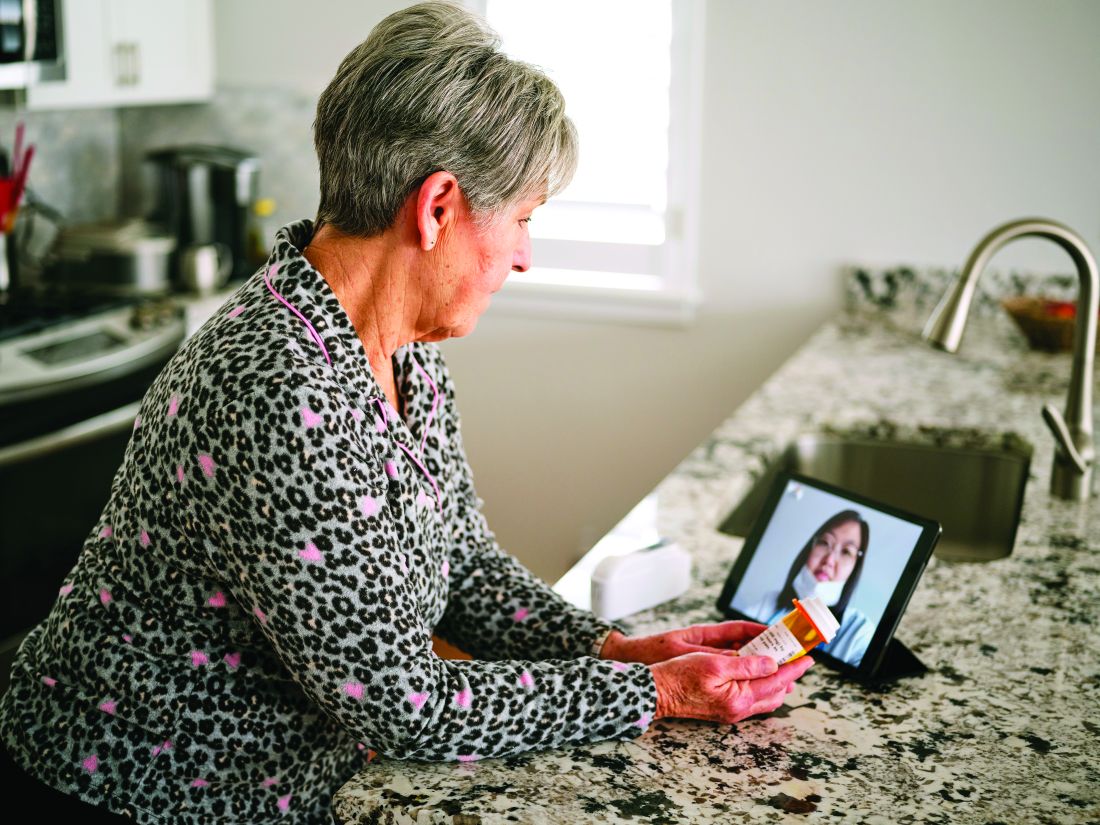
This is not fair to many people who live in areas near state borders, the authors argued. For those patients, it is much more convenient to see their primary care physician in a virtual visit from home than to travel to the doctor’s office in another state. This convenience is enjoyed by most patients who reside elsewhere in their state because they’re seeing physicians who are licensed there.
Moreover, the paper said, patients who live in rural areas and in counties with relatively few physicians per capita would also benefit from relaxed telemedicine restrictions.
Using Medicare claims data, the researchers examined the characteristics of out-of-state (OOS) telemedicine visits for the 6 months from January to June 2021. They chose that period for two reasons: by then, health care had stabilized after the chaotic early phase of the pandemic, and in most states, the relaxation of licensing rules for OOS telehealth had not yet lapsed. Earlier periods of time were also used for certain types of comparisons.
Among fee-for-service Medicare beneficiaries, the number of OOS telemedicine visits peaked at 451,086 in April 2020 and slowly fell to 175,545 in June 2021, according to the study. The fraction of OOS telehealth visits among all virtual visits was 4.5% in April 2020 and increased to 5.6% by June 2021.
Staying close to home
Of all beneficiaries with a telemedicine visit in the study period, 33% lived within 15 miles of a state border. That cohort accounted for 57.2% of all OOS telemedicine visits.
The highest rates of OOS telehealth visits were seen in the District of Columbia (38.5%), Wyoming (25.6%), and North Dakota (21.1%). California (1%), Texas (2%), and Massachusetts (2.1%) had the lowest rates.
Though intuitive in retrospect, the correlation of OOS telemedicine use with proximity to state borders was one of the study’s most important findings, lead author Ateev Mehrotra, MD, a professor at Harvard Medical School, Boston, said in an interview. “It makes sense,” he said. “If you’re in D.C. and you need a cardiologist, you don’t think: ‘I’ll stay in D.C.’ No, Maryland is right there, so you might use a Maryland cardiologist. Now you’re out of state, even though that office might be only half a mile away from you.”
Similar dynamics, he noted, are seen in many metropolitan areas that border on other states, such as Cincinnati; Philadelphia; and Portland, Ore.
This finding lines up with another result of the study: The majority of patients who had OOS telemedicine visits had previously seen in person the doctor who conducted the virtual visit.
Across all OOS telemedicine visits in the first half of 2021, the researchers observed a prior in-person visit between March 2019 and the date of the virtual visit with the same patient and the same clinician in 62.8% of those visits. Across all in-state telehealth visits, 75.8% of them were made by patients who had seen the same clinician in person since March 2019. This preponderance of virtual visits to clinicians whom the patients had already seen in person reflects the fact that, during the pandemic, most physicians began conducting telehealth visits with their own patients, Dr. Mehrotra said.
It also lays to rest the concern that some states have had about allowing OOS telemedicine visits to physicians not licensed in those states, he added. “They think that all these docs from far away are going to start taking care of patients they don’t even know. But our study shows that isn’t the case. Most of the time, doctors are seeing a patient who’s switching over from in-person visits to out-of-state telemedicine.”
More specialty care sought
The dominant conditions that patients presented with were the same in OOS telemedicine and within-state virtual visits. However, the use of OOS telemedicine was higher for some types of specialized care.
For example, the rate of OOS telemedicine use, compared with all telemedicine use, was highest for cancer care (9.8%). Drilling down to more specific conditions, the top three in OOS telemedicine visits were assessment of organ transplant (13%); male reproductive cancers, such as prostate cancer (11.3%); and graft-related issues (10.2%).
The specialty trend was also evident in the types of OOS clinicians from whom Medicare patients sought virtual care. The rates of OOS telemedicine use as a percentage of all telemedicine use in particular specialties were highest for uncommon specialties, such as hematology/oncology, rheumatology, urology, medical oncology, and orthopedic surgery (8.5%). There was less use of OOS telemedicine as a percentage of all telemedicine among more common medical specialties (6.4%), mental health specialties (4.4%), and primary care (4.4%).
Despite its relatively low showing in this category, however, behavioral health was the leading condition treated in both within-state and OOS telemedicine visits, accounting for 30.7% and 25.8%, respectively, of those encounters.
States backslide on OOS telehealth
Since the end of the study period, over half of the states have restored some or all of the restrictions on OOS telemedicine that they had lifted during the pandemic.
According to Dr. Mehrotra, 22 states have some kind of regulation in place to allow an OOS clinician to conduct telehealth visits without being licensed in the state. This varies all the way from complete reciprocity with other states’ licenses to “emergency” telemedicine licenses. The other 28 states and Washington, D.C., require an OOS telemedicine practitioner to get a state license.
Various proposals have been floated to ameliorate this situation, the JAMA paper noted. These proposals include an expansion of the Interstate Medical Licensure Compact that the Federation of State Medical Boards organized in 2014. Since the pact became effective in 2014, at least 35 states and the District of Columbia have joined it. Those states have made it simpler for physicians to gain licensure in states other than their original state of licensure. However, Mehrotra said, it’s still not easy, and not many physicians have taken advantage of it.
One new wrinkle has emerged in this policy debate as a result of the Supreme Court decision overturning Roe v. Wade, he noted. Because people are using OOS telemedicine visits to get prescriptions to abort their fetuses, “that has changed the enthusiasm level for it among many states,” he said.
Dr. Mehrotra reported personal fees from the Pew Charitable Trust, Sanofi Pasteur, and Black Opal Ventures outside the submitted work. One coauthor reported receiving grants from Patient-Centered Outcomes Research, National Institute on Aging, Roundtrip, Independence Blue Cross; personal fees or salary from RAND Corporation from Verily Life Sciences; and that the American Telemedicine Association covered a conference fee. No other disclosures were reported.
A version of this article first appeared on Medscape.com.
FROM JAMA HEALTH FORUM
Britain’s hard lessons from handing elder care over to private equity
Domestic and global private equity investors had supercharged the company’s growth, betting that the rising needs of aging Britons would yield big returns.
Within weeks, the Four Seasons brand may be finished.
Christie & Co., a commercial real estate broker, splashed a summer sale across its website that signaled the demise: The last 111 Four Seasons facilities in England, Scotland, and Jersey were on the market. Already sold were its 29 homes in Northern Ireland.
Four Seasons collapsed after years of private equity investors rolling in one after another to buy its business, sell its real estate, and at times wrest multimillion-dollar profits through complex debt schemes – until the last big equity fund, Terra Firma, which in 2012 paid about $1.3 billion for the company, was caught short.
In a country where government health care is a right, the Four Seasons story exemplifies the high-stakes rise – and, ultimately, fall – of private equity investment in health and social services. Hanging over society’s most vulnerable patients, these heavily leveraged deals failed to account for the cost of their care. Private equity firms are known for making a profit on quick-turnaround investments.
“People often say: ‘Why have American investors, as well as professional investors here and in other countries, poured so much into this sector?’ I think they were dazzled by the potential of the demographics,” said Nick Hood, an analyst at Opus Restructuring & Insolvency in London, which advises care homes – the British equivalent of U.S. nursing homes or assisted living facilities. They “saw the baby boomers aging and thought there would be infinite demands.”
What they missed, Mr. Hood said, “was that about half of all the residents in U.K. homes are funded by the government in one way or another. They aren’t private pay – and they’ve got no money.”
Residents as ‘revenue streams’
As in the United States, long-term care homes in Britain serve a mixed market of public- and private-pay residents, and those whose balance sheets rest heavily on government payments are stressed even in better economic times. Andrew Dobbie, a community officer for Unison, a union that represents care home workers, said private equity investors often see homes like Four Seasons as having “two revenue streams, the properties themselves and the residents,” with efficiencies to exploit.
But investors don’t always understand what caregivers do, he said, or that older residents require more time than spreadsheets have calculated. “That’s a problem when you are looking at operating care homes,” Mr. Dobbie said. “Care workers need to have soft skills to work with a vulnerable group of people. It’s not the same skills as stocking shelves in a supermarket.”
A recent study, funded in part by Unison and conducted by University of Surrey researchers, found big changes in the quality of care after private equity investments. More than a dozen staff members, who weren’t identified by name or facility, said companies were “cutting corners” to curb costs because their priority was profit. Staffers said “these changes meant residents sometimes went without the appropriate care, timely medication or sufficient sanitary supplies.”
In August, the House of Commons received a sobering account: The number of adults 65 and older who will need care is speedily rising, estimated to go from 3.5 million in 2018 to 5.2 million in 2038. Yet workers at care homes are among the lowest paid in health care.
“The covid-19 pandemic shone a light on the adult social care sector,” according to the parliamentary report, which noted that “many frustrated and burnt out care workers left” for better-paying jobs. The report’s advice in a year of soaring inflation and energy costs? The government should add “at least £7 billion a year” – more than $8 billion – or risk deterioration of care.
Britain’s care homes are separate from the much-lauded National Health Service, funded by the government. Care homes rely on support from local authorities, akin to counties in the United States. But they have seen a sharp drop in funding from the British government, which cut a third of its payments in the past decade. When the pandemic hit, the differences were apparent: Care home workers were not afforded masks, gloves, or gowns to shield them from the deadly virus.
Years ago, care homes were largely run by families or local entities. In the 1990s, the government promoted privatization, triggering investments and consolidations. Today, private equity firms own three of the country’s five biggest care home providers.
Chris Thomas, a research fellow at the Institute for Public Policy Research, said investors benefited from scant financial oversight. “The accounting practices are horrendously complicated and meant to be complicated,” he said. Local authorities try “to regulate more, but they don’t have the expertise.”
The financial shuffle
At Four Seasons, the speed of change was dizzying. From 2004 to 2017, big money came and went, with revenue at times threaded through multiple offshore vehicles. Among the groups that owned Four Seasons, in part or in its entirety: British private equity firm Alchemy Partners; Allianz Capital Partners, a German private equity firm; Three Delta, an investment fund backed by Qatar; the American hedge fund Monarch Alternative Capital; and Terra Firma, the British private equity group that wallowed in debt demands. H/2 Capital Partners, a hedge fund in Connecticut, was Four Seasons’ main creditor and took over. By 2019, Four Seasons was managed by insolvency experts.
Pressed on whether Four Seasons would exist in any form after the current sale of its property and businesses, MHP Communications, representing the company, said in an email: “It is too early in the process to speculate about the future of the brand.”
Vivek Kotecha, an accountant who has examined the Four Seasons financial shuffle and coauthored the Unison report, said private equity investment – in homes for older residents and, increasingly, in facilities for troubled children – is now part of the financial mainstream. The consulting firm McKinsey in 2022estimated that private markets manage nearly $10 trillion in assets, making them a dominant force in global markets.
“What you find in America with private equity is much the same here,” said Mr. Kotecha, the founder of Trinava Consulting in London. “They are often the same firms, doing the same things.” What was remarkable about Four Seasons was the enormous liability from high-yield bonds that underpinned the deal – one equaling $514 million at 8.75% interest and another for $277 million at 12.75% interest.
Guy Hands, the high-flying British founder of Terra Firma, bought Four Seasons in 2012, soon after losing an epic court battle with Citigroup over the purchase price of the music company EMI Group. Terra Firma acquired the care homes and then a gardening business with more than 100 stores. Neither proved easy, or good, bets. Hands, a Londoner who moved offshore to Guernsey, declined through a representative to discuss Four Seasons.
Mr. Kotecha, however, helped the BBC try to make sense of Four Seasons’ holdings by tracking financial filings. It was “the most complicated spreadsheet I’ve ever seen,” Mr. Kotecha said. “I think there were more subsidiaries involved in Four Seasons’ care homes than there were with General Motors in Europe.”
As Britain’s small homes were swept up in consolidations, some financial practices were dubious. At times, businesses sold the buildings as lease-back deals – not a problem at first – that, after multiple purchases, left operators paying rent with heavy interest that sapped operating budgets. By 2020, some care homes were estimated to be spending as much as 16% of their bed fees on debt payments, according to parliamentary testimony this year.
How could that happen? In part, for-profit providers – backed by private-equity groups and other corporations – had subsidiaries of their parent companies act as lender, setting the rates.
Britain’s elder care was unrecognizable within a generation. By 2022, private-equity companies alone accounted for 55,000 beds, or about 12.6% of the total for-profit care beds for older people in the United Kingdom, according to LaingBuisson, a health care consultancy. LaingBuisson calculated that the average residential care home fee as of February 2022 was about $44,700 a year; the average nursing home fee was $62,275 a year.
From 1980 to 2018, the number of residential care beds provided by local authorities fell 88% – from 141,719 to 17,100, according to the nonprofit Centre for Health and the Public Interest. Independent operators – nonprofits and for-profits – moved in, it said, controlling 243,000 beds by 2018. Nursing homes saw a similar shift: Private providers accounted for 194,100 beds in 2018, compared with 25,500 decades earlier.
Beyond government control
British lawmakers in the winter of 2021-2022 tried – and failed – to bolster financial reporting rules for care homes, including banning the use of government funds to pay off debt.
“I don’t have a problem with offshore companies that make profits if they offer good services. I don’t have a problem with private equity and hedge funds who deliver good returns to their shareholders,” Ros Altmann, a Conservative Party member in the House of Lords and a pension expert, said in a February debate. “I do have a problem if those companies are taking advantage of some of the most vulnerable people in our society without oversight, without controls.”
She cited Four Seasons as an example of how regulators “have no control over the financial models that are used.” Ms. Altmann warned that economic headwinds could worsen matters: “We now have very heavily debt-laden [homes] in an environment where interest rates are heading upward.”
In August, the Bank of England raised borrowing rates. It now forecasts double-digit inflation – as much as 11% – through 2023.
And that leaves care home owner Robert Kilgour pensive about whether government grasps the risks and possibilities that the sector is facing. “It’s a struggle, and it’s becoming more of a struggle,” he said. A global energy crisis is the latest unexpected emergency. Mr. Kilgour said he recently signed electricity contracts, for April 2023, at rates that will rise by 200%. That means an extra $2,400 a day in utility costs for his homes.
Mr. Kilgour founded Four Seasons, opening its first home, in Fife, Scotland, in 1989. His ambition for its growth was modest: “Ten by 2000.” That changed in 1999 when Alchemy swooped in to expand nationally. Mr. Kilgour had left Four Seasons by 2004, turning to other ventures.
Still, he saw opportunity in elder care and opened Renaissance Care, which now operates 16 homes with 750 beds in Scotland. “I missed it,” he said in an interview in London. “It’s people and it’s property, and I like that.”
“People asked me if I had any regrets about selling to private equity. Well, no, the people I dealt with were very fair, very straight. There were no shenanigans,” Mr. Kilgour said, noting that Alchemy made money but invested as well.
Mr. Kilgour said the pandemic motivated him to improve his business. He is spending millions on new LED lighting and boilers, as well as training staffers on digital record-keeping, all to winnow costs. He increased hourly wages by 5%, but employees have suggested other ways to retain staff: shorter shifts and workdays that fit school schedules or allow them to care for their own older relatives.
Debates over whether the government should move back into elder care make little sense to Mr. Kilgour. Britain has had private care for decades, and he doesn’t see that changing. Instead, operators need help balancing private and publicly funded beds “so you have a blended rate for care and some certainty in the business.”
Consolidations are slowing, he said, which might be part of a long-overdue reckoning. “The idea of 200, 300, 400 care homes – that big is good and big is best – those days are gone,” Mr. Kilgour said.
KHN (Kaiser Health News) is a national newsroom that produces in-depth journalism about health issues. Together with Policy Analysis and Polling, KHN is one of the three major operating programs at KFF (Kaiser Family Foundation). KFF is an endowed nonprofit organization providing information on health issues to the nation.
Increasing primary care doctors’ knowledge of IPF could speed up diagnoses, suggests white paper
The nonspecific nature of the symptoms of idiopathic pulmonary fibrosis (IPF) especially in early stages, and the relative rarity of IPF compared with other conditions that have similar symptoms, may contribute to a delay in diagnosis in the primary care setting, wrote Daniel F. Dilling, MD, of Loyola University Chicago, Maywood, Ill., and colleagues in Chest: Clinical Perspectives (Dilling et al. State of Practice: Factors Driving Diagnostic Delays in Idiopathic Pulmonary Fibrosis. Chest. 2022).
“We have learned over and over again through research, and also through talking with our own patients with IPF, that there is often a long lag between the first signs of the disease and a diagnosis of IPF,” corresponding author Dr. Dilling said in an interview.
“Even some pulmonary specialists can be uncertain about how to approach the diagnosis when a CT scan or other test first suggests the possibility; this can cost a patient precious time, as being on drug therapy earlier can result in preservation of lung function,” he said. “By sounding the alarm bell with this paper, we hope to promote awareness and education/training within the primary care community as well as the pulmonary community, and also to make all of them aware of the possibility of referral to specialty ILD [interstitial lung disease] centers when desired and possible,” he added.
The researchers conducted a pair of online surveys to inform the development of improving education on IPF among primary care providers.
In the white paper, which can be accessed online, the authors reported results of the surveys. One included 100 general pulmonologists and the other included 306 primary care physicians (156 practiced family physicians and 150 practiced general internal medicine). The data were collected between April 11, 2022, and May 16, 2022. Participants were asked to respond to a patient case scenario of a 55-year-old woman with nonspecific symptoms such as shortness of breath on moderate exertion, cough, exhaustion, and trouble sleeping.
The PCPs were most likely to evaluate the patient for a cardiac condition (46%), 25% would evaluate for chronic obstructive pulmonary disease (COPD), and 23% for asthma. More than half (58%) ranked progressive fibrosing ILD as one of their bottom two diagnoses.
A total of 87% of PCPs said they would begin a diagnostic workup to evaluate symptoms if the patient had no preexisting respiratory disease, compared with 61% for patients with a respiratory diagnosis.
Although 93% of PCPs cited a chest x-ray as part of the initial patient workup, fewer than half said they would order an echocardiogram, spirometry, or pulmonary function test (PFT), and 11% said they would include diffusion capacity testing in the initial workup.
In addition, PCPs were less likely to ask patients about issues that might prompt an IPF diagnosis, such as exposures to agents through work, hobbies, the environment, or comorbidities.
In the pulmonology survey, more than 75% of respondents cited patient history, high-resolution tomography scan, serologic testing, and review for autoimmune disease symptoms as first steps in a diagnostic response to patients with suspected IPF.
Differences between PCPs’ and pulmonolgists’ responses
Both PCPs and pulmonologists responded to several questions to assess knowledge and opinion gaps related to IPF. Overall, pulmonologists were more likely than PCPs to cite both imaging and testing issues and waiting 6-8 weeks after symptom onset before imaging as contributing factors to diagnostic delays.
PCPs more often expressed beliefs that delayed diagnosis had little impact on a patient with IPF, and that the treatments may be worse than the disease.
Dr. Dilling said he was not surprised by the survey findings, as similar clues about the underdiagnosis of IPF have surfaced in prior studies.
“We need to get the word out to primary care physicians, to pulmonary physicians, and even to the public, that idiopathic pulmonary fibrosis and other forms of interstitial lung disease are out there and prevalent, and that making the right diagnosis in a timely way can lead to better outcomes for patients,” he said.
The take-home message for primary care is to think outside the COPD box, said Dr. Dilling. “Just because someone has shortness of breath or cough and used to smoke does not automatically mean that they have COPD,” he emphasized. “Listen carefully for crackles (rales) on exam. Get spirometry or PFTs before you secure the diagnosis of COPD, or else you will be missing all of your cases of pulmonary fibrosis; think of pulmonary fibrosis and use imaging to help guide your diagnosis,” he said.
The authors suggested several education goals for PCPs, including establishing the importance of early evaluation, outlining the correct approach to a patient workup, encouraging prompt referral, and empowering PCPs as part of the team approach to IPF patients’ care. For pulmonologists, only 11% of those surveyed said they were aware of the latest developments in antifibrotic research, and education efforts might include information about drug pipelines and clinical trials, as well as technology.
Looking ahead, “We need to better understand how to find the pulmonary fibrosis in the community,” Dr. Dilling said. This understanding may come in part from greater education and awareness, he noted. However, eventually there may be ways to enhance the reading of PFTs and of CT scans through artificial intelligence technologies that would not only prompt clinicians to recognize what they are seeing, but would prompt them to refer and send the patient on the correct diagnostic path as soon as possible, he added.
Key message: Include ILD in differential diagnosis of patients with shortness of breath and/or cough
Advances in diagnostics and therapies for interstitial lung disease can take time to be absorbed and adopted, and patients with ILD and pulmonologists caring for ILD, specifically IPF, continue to report delays in diagnosis and therapy, said Krishna Thavarajah, MD, a pulmonologist at Henry Ford Hospital, Detroit, Mich., in an interview.
The current study findings of the time to diagnosis and the approach to patient workups echo her own clinical experience, Dr. Thavarajah said. “There is a delay in IPF diagnosis as physicians look to more common diagnoses, such as cardiac disease or chronic obstructive pulmonary disease, prior to pursuit of additional workup, and the attitude toward treatment has, in some ways, lagged behind advances in therapy, including timing and feasibility of therapy for IPF,” she said.
The key message for primary care physicians is to include ILD in the differential diagnosis of patients with shortness of breath and/or cough, especially if the initial cardiac and pulmonary test (meaning at least a chest x-ray and pulmonary function tests, including a diffusion capacity) are not pointing to an alternative cause within 3 months of presentation, Dr. Thavarajah said.
Once IPF is diagnosed, primary care clinicians should know that there are FDA-approved therapies that improve survival, said Dr. Thavarajah. “There are identifiable and treatable comorbid conditions,” she added. “The statement of ‘time lost is lung lost’ sums up the care of an IPF patient; partnerships between primary care clinicians, pulmonologists, and referral centers can provide the patient multiple levels of support with quality-of-life interventions, treatments, and also clinical trials, delivered by a team of providers,” she said.
In the wake of the current study, more research is needed with outcome studies regarding educational interventions targeting primary care and pulmonologists on appropriate workup, timing of workup, and current therapy for IPF patients, she added.
The white paper received no outside funding. The authors and Dr. Thavarajah had no financial conflicts to disclose.
FROM CHEST CLINICAL PERSPECTIVES