User login
Twin births down among women 30 and older
according to the National Center for Health Statistics.
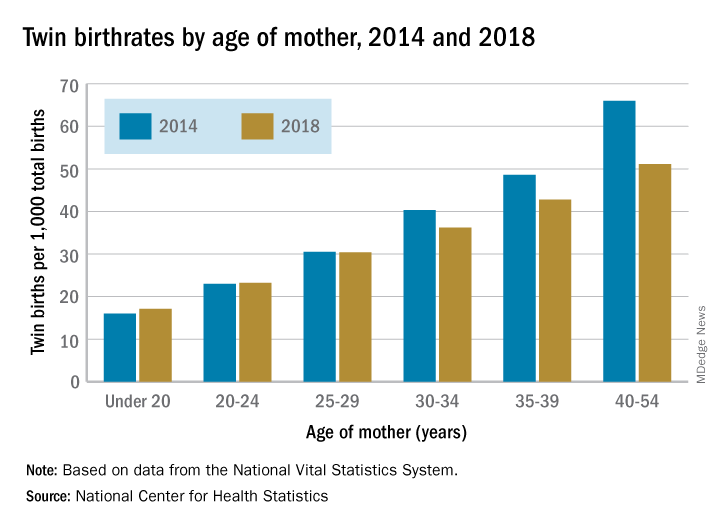
The twin birthrate, which had increased by 79% during 1980-2014, fell by 4% during 2014-2018, but that decline was “not universal across maternal age and race and Hispanic-origin groups,” the NCHS investigators said.
Twin birthrates fell by at least 10% for mothers aged 30 years and older from 2014 to 2018 but held steady for women in their twenties. Over that same period, the twin birthrate fell by a significant 7% among non-Hispanic white women (36.7 to 34.3 per 1,000 total births) but increased just slightly for non-Hispanic black women (40.0 to 40.5 per 1,000) and Hispanic women (24.1 to 24.4), the investigators reported.
For women 30 years and older, the drops in twin births got larger as age increased and were significant for each age group. The rate for women aged 30-34 years fell 10% as it went from 40.3 per 1,000 total births in 2014 to 36.2 per 1,000. The decrease was 12% (from 48.6 per 1,000 to 42.8) for women aged 35-39 and 23% (from 66.0 to 51.1) for those aged 40 years and older, they said based on data from the National Vital Statistics System.
The rates were basically unchanged for women in their 20s, from 23.0 to 23.2 in 20- to 24-year-olds and 30.5 to 30.4 in 25- to 29-year-olds – but there was a significant increase for the youngest group with rates among those younger than 20 years going from 16.0 to 17.1 per 1,000, the report showed.
according to the National Center for Health Statistics.
The twin birthrate, which had increased by 79% during 1980-2014, fell by 4% during 2014-2018, but that decline was “not universal across maternal age and race and Hispanic-origin groups,” the NCHS investigators said.
Twin birthrates fell by at least 10% for mothers aged 30 years and older from 2014 to 2018 but held steady for women in their twenties. Over that same period, the twin birthrate fell by a significant 7% among non-Hispanic white women (36.7 to 34.3 per 1,000 total births) but increased just slightly for non-Hispanic black women (40.0 to 40.5 per 1,000) and Hispanic women (24.1 to 24.4), the investigators reported.
For women 30 years and older, the drops in twin births got larger as age increased and were significant for each age group. The rate for women aged 30-34 years fell 10% as it went from 40.3 per 1,000 total births in 2014 to 36.2 per 1,000. The decrease was 12% (from 48.6 per 1,000 to 42.8) for women aged 35-39 and 23% (from 66.0 to 51.1) for those aged 40 years and older, they said based on data from the National Vital Statistics System.
The rates were basically unchanged for women in their 20s, from 23.0 to 23.2 in 20- to 24-year-olds and 30.5 to 30.4 in 25- to 29-year-olds – but there was a significant increase for the youngest group with rates among those younger than 20 years going from 16.0 to 17.1 per 1,000, the report showed.
Time to conception after miscarriage: How long to wait?
EVIDENCE SUMMARY
To evaluate the longstanding belief that a short IPI after miscarriage is associated with adverse outcomes in subsequent pregnancies, a 2017 systematic review and meta-analysis of 16 studies (3 randomized controlled trials [RCTs] and 13 retrospective cohort studies) with a total of more than 1 million patients compared IPIs shorter and longer than 6 months (miscarriage was defined as any pregnancy loss before 24 weeks).1 The meta-analysis included 10 of the studies (2 RCTs and 8 cohort studies), with a total of 977,972 women and excluded 6 studies because of insufficient data. The outcomes investigated were recurrent miscarriage, preterm birth, stillbirth, pre-eclampsia, and low birthweight in the pregnancy following miscarriage.
Only 1 study reported the specific gestational age of the index miscarriage at 8.6 ± 2.8 weeks.2 All studies adjusted data for age, and some considered other confounders, such as race, smoking status, and body mass index (BMI).
Women included in the meta-analysis were from Asia, Europe, South America, and the United States and had a history of at least 1 miscarriage.1 A study of 257,908 subjects (Conde-Agudelo) also included women with a history of induced abortion from Latin American countries, where abortion is illegal, and made no distinction between spontaneous and induced abortions in those data sets.3 Women with a history of illegal abortion could be at greater risk of subsequent miscarriage than women who underwent a legally performed abortion.
IPI shorter than 6 months carries fewer risks
Excluding the Conde-Agudelo study, women with an IPI < 6 months, compared with > 6 months, had lower risks of subsequent miscarriage (7 studies, 46,313 women; risk ratio [RR] = 0.82; 95% confidence interval [CI], 0.78-0.86) and preterm delivery (7 studies, 60,772 women; RR = 0.79; 95% CI, 0.75-0.83); a higher rate of live births (4 studies, 44,586 women; RR = 1.06; 95% CI, 1.01-1.11); and no increase in stillbirths (4 studies, 44,586 women; RR = 0.88; 95% CI, 0.76-1.02), low birthweight (4 studies, 284,222 women; RR = 1.05; 95% CI, 0.48-2.29) or pre-eclampsia (5 studies, 284,899 women; RR = 0.95; 95% CI, 0.88-1.02) in the subsequent pregnancy.
Including the Conde-Agudelo study, the risk of preterm delivery was the same in women with an IPI < 6 months and > 6 months (8 studies, 318,880 women; RR = 0.93; 95% CI, 0.58-1.48).1 Four of the 10 studies evaluated the risk of miscarriage with an IPI < 3 months compared with > 3 months and found either no difference or a lower risk of subsequent miscarriage.2,4-6
IPI shorter than 3 months has lowest risk of all
A 2017 prospective cohort study examined the association between IPI length and risk of recurrent miscarriage in 514 women who had experienced recent miscarriage (defined as spontaneous pregnancy loss before 20 weeks of gestation).7 Average gestational age at the time of initial miscarriage wasn’t reported. Study participants were 30 years of age on average and predominantly white (76.8%); 12.3% were black.
The authors compared IPIs of < 3 months, 3 to 6 months, and > 18 months with IPIs of 6 to 18 months, which correlates with the IPIs recommended by the World Health Organization (WHO).8 They adjusted for maternal age, race, parity, BMI, and education. An IPI < 3 months was associated with the lowest risk of subsequent miscarriage (7.3% compared with 22.1%; adjusted hazard ratio = 0.33; 95% CI, 0.16-0.71). Women with IPIs of 3 to 6 months and > 18 months didn’t experience statistically significant differences in subsequent miscarriage rates compared with IPIs of 6 to 18 months.7
Continue to: But a short IPI after second-trimester loss increases risk of miscarriage
But a short IPI after second-trimester loss increases risk of miscarriage
By including all miscarriages, the meta-analysis effectively examined IPI after first-trimester loss because first-trimester loss occurs far more frequently than does second-trimester loss.1 A retrospective cohort study of Australian women, not included in the meta-analysis, assessed 4290 patients with a second-trimester pregnancy loss to specifically examine the association between IPI and risk of recurrent pregnancy loss.9
After a pregnancy loss at 14 to 19 weeks, women with an IPI < 3 months, compared with an IPI of 9 to 12 months, had an increased risk of recurrent pregnancy loss (21.9 vs 11.3%; P < .001). Women with an IPI > 9 to 12 months had rates of pregnancy loss similar to an IPI of 3 to 6 months (RR = 1.24; 95% CI, 0.89-1.7) and 6 to 9 months (RR = 1.02; 95% CI, 0.7-1.5). Women who experienced an initial loss at 20 to 23 weeks, for unclear reasons, showed no evidence that the IPI affected the risk of subsequent loss.
Short IPI may be linked to anxiety in first trimester of next pregnancy
A large cohort study of 20,308 pregnant Chinese women, including 1495 with a previous miscarriage, explored the mental health impact of IPI after miscarriage compared with no miscarriage.10 Investigators used the Self-Rating Anxiety Scale to evaluate anxiety and the Center for Epidemiologic Studies Depression Scale to evaluate depression.
Women with an IPI of < 7 months after miscarriage were more likely to experience anxiety symptoms in the subsequent pregnancy than were women with no previous miscarriage (adjusted odds ratio [AOR] = 2.76; 95% CI, 1.4-5.5), whereas women with a history of miscarriage and IPI > 6 months weren’t. Women with IPIs < 7 months and 7 to 12 months, compared with women who had no miscarriage, had an increased risk of depression (AOR = 2.5; 95% CI, 1.4-4.5, and AOR = 2.6; 95% CI, 1.3-5.2, respectively). Women with an IPI > 12 months had no increased risk of depression compared with women with no history of miscarriage.
The odds ratios were adjusted for age, education, BMI, income, and place of residence. The higher rates of depression and anxiety didn’t persist beyond the first trimester of the subsequent pregnancy.
Continue to: RECOMMENDATIONS
RECOMMENDATIONS
The American College of Obstetricians and Gynecologists’ Practice Bulletin on Early Pregnancy Loss states that no quality data exist to support delaying conception after early pregnancy loss (defined as loss of an intrauterine pregnancy in the first trimester) to prevent subsequent pregnancy loss or other pregnancy complications.11
WHO recommends a minimum IPI of at least 6 months after a spontaneous or elective abortion. This recommendation is based on a single multi-center cohort study in Latin America that included women with both spontaneous and induced abortions.8
Editor’s takeaway
High-quality evidence now shows that shorter IPIs after first-trimester miscarriages result in safe subsequent pregnancies. However, some concern remains about second-trimester miscarriages and maternal mental health following a shorter IPI, based on lower-quality evidence.
1. Kangatharan C, Labram S, Bhattacharya S. Interpregnancy interval following miscarriage and adverse pregnancy outcomes: systematic review and meta-analysis. Hum Reprod Update. 2017;23:221-231.
2. Wong LF, Schliep KC, Silver RM, et al. The effect of a very short interpregnancy interval and pregnancy outcomes following a previous pregnancy loss. Am J Obstet Gynecol. 2015;212:375.e1-375.e11.
3. Conde-Agudelo A, Belizan JM, Breman R, et al. Effect of the interpregnancy interval after an abortion on maternal and perinatal health in Latin America. Int J Gynaecol Obstet. 2005;89(suppl 1):S34-S40.
4. Bentolila Y, Ratzon R, Shoham-Vardi I, et al. Effect of interpregnancy interval on outcomes of pregnancy after recurrent pregnancy loss. J Matern Fetal Neonatal Med. 2013;26:1459-1464.
5. DaVanzo J, Hale L, Rahman M. How long after a miscarriage should women wait before becoming pregnant again? Multivariate analysis of cohort data from Matlab, Bangladesh. BMJ Open. 2012;2:e001591.
6. Wyss P, Biedermann K, Huch A. Relevance of the miscarriage-new pregnancy interval. J Perinat Med. 1994;22:235-241.
7. Sundermann AC, Hartmann KE, Jones SH, et al. Interpregnancy interval after pregnancy loss and risk of repeat miscarriage. Obstet Gynecol. 2017;130:1312-1318.
8. World Health Organization. Department of Reproductive Health and Research, Department of Making Pregnancy Safer. Report of a WHO Technical Consultation on Birth Spacing: Geneva, Switzerland 13-15 June 2005. Geneva: World Health Organization, 2007.
9. Roberts CL, Algert CS, Ford JB, et al. Association between interpregnancy interval and the risk of recurrent loss after a midtrimester loss. Hum Reprod. 2016;31:2834-2840.
10. Gong X, Hao J, Tao F, et al. Pregnancy loss and anxiety and depression during subsequent pregnancies: data from the C-ABC study. Eur J Obstet Gynecol Reprod Biol. 2013;166:30-36.
11. American College of Obstetricians and Gynecologists. Committee on Practice Bulletins-Gynecology. The American College of Obstetricians and Gynecologists Practice Bulletin no. 150. Early pregnancy loss. Obstet Gynecol. 2015;125:1258-1267.
EVIDENCE SUMMARY
To evaluate the longstanding belief that a short IPI after miscarriage is associated with adverse outcomes in subsequent pregnancies, a 2017 systematic review and meta-analysis of 16 studies (3 randomized controlled trials [RCTs] and 13 retrospective cohort studies) with a total of more than 1 million patients compared IPIs shorter and longer than 6 months (miscarriage was defined as any pregnancy loss before 24 weeks).1 The meta-analysis included 10 of the studies (2 RCTs and 8 cohort studies), with a total of 977,972 women and excluded 6 studies because of insufficient data. The outcomes investigated were recurrent miscarriage, preterm birth, stillbirth, pre-eclampsia, and low birthweight in the pregnancy following miscarriage.
Only 1 study reported the specific gestational age of the index miscarriage at 8.6 ± 2.8 weeks.2 All studies adjusted data for age, and some considered other confounders, such as race, smoking status, and body mass index (BMI).
Women included in the meta-analysis were from Asia, Europe, South America, and the United States and had a history of at least 1 miscarriage.1 A study of 257,908 subjects (Conde-Agudelo) also included women with a history of induced abortion from Latin American countries, where abortion is illegal, and made no distinction between spontaneous and induced abortions in those data sets.3 Women with a history of illegal abortion could be at greater risk of subsequent miscarriage than women who underwent a legally performed abortion.
IPI shorter than 6 months carries fewer risks
Excluding the Conde-Agudelo study, women with an IPI < 6 months, compared with > 6 months, had lower risks of subsequent miscarriage (7 studies, 46,313 women; risk ratio [RR] = 0.82; 95% confidence interval [CI], 0.78-0.86) and preterm delivery (7 studies, 60,772 women; RR = 0.79; 95% CI, 0.75-0.83); a higher rate of live births (4 studies, 44,586 women; RR = 1.06; 95% CI, 1.01-1.11); and no increase in stillbirths (4 studies, 44,586 women; RR = 0.88; 95% CI, 0.76-1.02), low birthweight (4 studies, 284,222 women; RR = 1.05; 95% CI, 0.48-2.29) or pre-eclampsia (5 studies, 284,899 women; RR = 0.95; 95% CI, 0.88-1.02) in the subsequent pregnancy.
Including the Conde-Agudelo study, the risk of preterm delivery was the same in women with an IPI < 6 months and > 6 months (8 studies, 318,880 women; RR = 0.93; 95% CI, 0.58-1.48).1 Four of the 10 studies evaluated the risk of miscarriage with an IPI < 3 months compared with > 3 months and found either no difference or a lower risk of subsequent miscarriage.2,4-6
IPI shorter than 3 months has lowest risk of all
A 2017 prospective cohort study examined the association between IPI length and risk of recurrent miscarriage in 514 women who had experienced recent miscarriage (defined as spontaneous pregnancy loss before 20 weeks of gestation).7 Average gestational age at the time of initial miscarriage wasn’t reported. Study participants were 30 years of age on average and predominantly white (76.8%); 12.3% were black.
The authors compared IPIs of < 3 months, 3 to 6 months, and > 18 months with IPIs of 6 to 18 months, which correlates with the IPIs recommended by the World Health Organization (WHO).8 They adjusted for maternal age, race, parity, BMI, and education. An IPI < 3 months was associated with the lowest risk of subsequent miscarriage (7.3% compared with 22.1%; adjusted hazard ratio = 0.33; 95% CI, 0.16-0.71). Women with IPIs of 3 to 6 months and > 18 months didn’t experience statistically significant differences in subsequent miscarriage rates compared with IPIs of 6 to 18 months.7
Continue to: But a short IPI after second-trimester loss increases risk of miscarriage
But a short IPI after second-trimester loss increases risk of miscarriage
By including all miscarriages, the meta-analysis effectively examined IPI after first-trimester loss because first-trimester loss occurs far more frequently than does second-trimester loss.1 A retrospective cohort study of Australian women, not included in the meta-analysis, assessed 4290 patients with a second-trimester pregnancy loss to specifically examine the association between IPI and risk of recurrent pregnancy loss.9
After a pregnancy loss at 14 to 19 weeks, women with an IPI < 3 months, compared with an IPI of 9 to 12 months, had an increased risk of recurrent pregnancy loss (21.9 vs 11.3%; P < .001). Women with an IPI > 9 to 12 months had rates of pregnancy loss similar to an IPI of 3 to 6 months (RR = 1.24; 95% CI, 0.89-1.7) and 6 to 9 months (RR = 1.02; 95% CI, 0.7-1.5). Women who experienced an initial loss at 20 to 23 weeks, for unclear reasons, showed no evidence that the IPI affected the risk of subsequent loss.
Short IPI may be linked to anxiety in first trimester of next pregnancy
A large cohort study of 20,308 pregnant Chinese women, including 1495 with a previous miscarriage, explored the mental health impact of IPI after miscarriage compared with no miscarriage.10 Investigators used the Self-Rating Anxiety Scale to evaluate anxiety and the Center for Epidemiologic Studies Depression Scale to evaluate depression.
Women with an IPI of < 7 months after miscarriage were more likely to experience anxiety symptoms in the subsequent pregnancy than were women with no previous miscarriage (adjusted odds ratio [AOR] = 2.76; 95% CI, 1.4-5.5), whereas women with a history of miscarriage and IPI > 6 months weren’t. Women with IPIs < 7 months and 7 to 12 months, compared with women who had no miscarriage, had an increased risk of depression (AOR = 2.5; 95% CI, 1.4-4.5, and AOR = 2.6; 95% CI, 1.3-5.2, respectively). Women with an IPI > 12 months had no increased risk of depression compared with women with no history of miscarriage.
The odds ratios were adjusted for age, education, BMI, income, and place of residence. The higher rates of depression and anxiety didn’t persist beyond the first trimester of the subsequent pregnancy.
Continue to: RECOMMENDATIONS
RECOMMENDATIONS
The American College of Obstetricians and Gynecologists’ Practice Bulletin on Early Pregnancy Loss states that no quality data exist to support delaying conception after early pregnancy loss (defined as loss of an intrauterine pregnancy in the first trimester) to prevent subsequent pregnancy loss or other pregnancy complications.11
WHO recommends a minimum IPI of at least 6 months after a spontaneous or elective abortion. This recommendation is based on a single multi-center cohort study in Latin America that included women with both spontaneous and induced abortions.8
Editor’s takeaway
High-quality evidence now shows that shorter IPIs after first-trimester miscarriages result in safe subsequent pregnancies. However, some concern remains about second-trimester miscarriages and maternal mental health following a shorter IPI, based on lower-quality evidence.
1. Kangatharan C, Labram S, Bhattacharya S. Interpregnancy interval following miscarriage and adverse pregnancy outcomes: systematic review and meta-analysis. Hum Reprod Update. 2017;23:221-231.
2. Wong LF, Schliep KC, Silver RM, et al. The effect of a very short interpregnancy interval and pregnancy outcomes following a previous pregnancy loss. Am J Obstet Gynecol. 2015;212:375.e1-375.e11.
3. Conde-Agudelo A, Belizan JM, Breman R, et al. Effect of the interpregnancy interval after an abortion on maternal and perinatal health in Latin America. Int J Gynaecol Obstet. 2005;89(suppl 1):S34-S40.
4. Bentolila Y, Ratzon R, Shoham-Vardi I, et al. Effect of interpregnancy interval on outcomes of pregnancy after recurrent pregnancy loss. J Matern Fetal Neonatal Med. 2013;26:1459-1464.
5. DaVanzo J, Hale L, Rahman M. How long after a miscarriage should women wait before becoming pregnant again? Multivariate analysis of cohort data from Matlab, Bangladesh. BMJ Open. 2012;2:e001591.
6. Wyss P, Biedermann K, Huch A. Relevance of the miscarriage-new pregnancy interval. J Perinat Med. 1994;22:235-241.
7. Sundermann AC, Hartmann KE, Jones SH, et al. Interpregnancy interval after pregnancy loss and risk of repeat miscarriage. Obstet Gynecol. 2017;130:1312-1318.
8. World Health Organization. Department of Reproductive Health and Research, Department of Making Pregnancy Safer. Report of a WHO Technical Consultation on Birth Spacing: Geneva, Switzerland 13-15 June 2005. Geneva: World Health Organization, 2007.
9. Roberts CL, Algert CS, Ford JB, et al. Association between interpregnancy interval and the risk of recurrent loss after a midtrimester loss. Hum Reprod. 2016;31:2834-2840.
10. Gong X, Hao J, Tao F, et al. Pregnancy loss and anxiety and depression during subsequent pregnancies: data from the C-ABC study. Eur J Obstet Gynecol Reprod Biol. 2013;166:30-36.
11. American College of Obstetricians and Gynecologists. Committee on Practice Bulletins-Gynecology. The American College of Obstetricians and Gynecologists Practice Bulletin no. 150. Early pregnancy loss. Obstet Gynecol. 2015;125:1258-1267.
EVIDENCE-BASED ANSWER:
An interpregnancy interval (IPI) of < 6 months following miscarriage is associated with an increased live birth rate in subsequent pregnancy, lower risks of preterm birth and subsequent miscarriage, and no difference in rates of stillbirth, pre-eclampsia, and low birth weight infants (strength of recommendation [SOR]: A, well-done meta-analysis). (IPI is defined as the time between the end of one pregnancy and the last menstrual period of a subsequent one.)
A very short IPI (< 3 months), when compared with an IPI of 6 to 18 months, is associated with the lowest rate of subsequent miscarriage (SOR: B, cohort study). However, for women who experience a pregnancy loss at 14 to 19 weeks’ gestation, an IPI < 3 months is associated with an increased risk of miscarriage or birth before 24 weeks’ gestation (SOR: B, cohort study).
Women with a short IPI following miscarriage may be at increased risk for anxiety and depression in the first trimester of the subsequent pregnancy (SOR: B, cohort study).

Higher Step Volume Is Associated with Lower Mortality in Older Women
Study Overview
Objective. To evaluate the association of number of steps taken per day and stepping intensity with all-cause mortality in older women.
Design. This was a prospective cohort study of US women participating in the Women’s Health Study (WHS). Participants wore an accelerometer device (ActiGraph GT3X+, ActiGraph Corp, Pensacola, FL) on the hip during waking hours for 7 consecutive days between 2011 and 2015. The accelerator data were collected at 30 Hz and aggregated into 60-second, time-stamped epochs. Data from participants who were adherent with wearing devices (defined as ≥ 10 hours/day of wear on ≥ 4 days) were used in an analysis that was conducted between 2018 and 2019. The exposure variables were defined as steps taken per day and measures of stepping intensity (ie, peak 1-minute cadence; peak 30-minute cadence; maximum 5-minute cadence; and time spent at a stepping rate of ≥ 40 steps/minute, reflecting purposeful steps).
Setting and participants. In total, 18,289 women participated in this study. Of these, 17,708 wore and returned their accelerometer devices, and data were downloaded successfully from 17,466 devices. Compliant wearers of the device (≥ 10 hours/day of wear on ≥4 days) included 16,741 participants (96% compliance rate of all downloaded device data).
Main outcome measure. All-cause mortality as ascertained through the National Death Index or confirmed by medical records and death certificates.
Main results. In this cohort of 16,741 women, average age at baseline was 72.0 ± 5.7 years (range, 62 to 101 years) and the mean step count was 5499 per day (median, 5094 steps/day) during the 7-day data capture period between 2011 and 2015. Not taking steps (0 steps/minute) accounted for 51.4% of the recorded time, incidental steps (1 to 39 steps/minute) accounted for 45.5%, and purposeful steps (≥ 40 steps/minute) accounted for 3.1%. The mean follow-up period was 4.3 years; during this time, 504 participants died. The median steps per day across quartiles were 2718 (lowest), 4363, 5905, and 8442 (highest). The corresponding quartile hazard ratios (HRs) associated with mortality adjusted for confounders were 1.00 (reference; lowest quartile), 0.59 (95% confidence interval [CI], 0.47-0.75), 0.54 (95% CI, 0.41-0.72), and 0.42 (95% CI, 0.30-0.60; highest quartile), respectively (P < 0.01). A higher mean step count per day, up to approximately 7500 steps/day, corresponded with progressive and steady decline in mortality HRs using spline analyses. Similar results were observed using sensitivity analyses that minimized reverse causation bias. While the adjusted analysis of measures of stepping intensity showed an inverse association with mortality rates, these associations were no longer significant after accounting for steps per day. Specifically, adjusted HRs comparing highest to lowest quartile were 0.87 (95% CI, 0.68-1.11) for peak 1-minute cadence; 0.86 (95% CI, 0.65-1.13) for peak 30-minute cadence; 0.80 (95% CI, 0.62-1.05) for maximum 5-minute cadence; and 1.27 (95% CI, 0.96-1.68) for time spent at a stepping rate of ≥ 40 steps/minute.
Conclusion. Older women who took approximately 4400 steps per day had lower all-cause mortality rates during a follow-up period of 4.3 years compared to those who took approximately 2700 steps each day. Progressive reduction in mortality rates was associated with increased steps per day before leveling at about 7500 steps/day. Stepping intensity, when accounting for number of steps taken per day, was not associated with reduction in mortality rates in older women.
Commentary
The health and mortality benefits of exercise are well recognized. The 2018 Department of Health and Human Services Physical Activity Guidelines (DHHS-PAG) recommend that adults should do at least 150 to 300 minutes of moderate-intensity aerobic physical activity per week, or 75 to 150 minutes of vigorous-intensity aerobic physical activity per week, in addition to doing muscle-strengthening activities on 2 or more days a week.1 Importantly, the guidelines emphasize that moving more and sitting less benefit nearly everyone, and note that measures of steps as a metric of ambulation can further promote translation of research into public health recommendations for exercise interventions. Despite this recognition, there is limited information centering on the number of daily steps (step volume) and the intensity of stepping that are needed to achieve optimal health outcomes in older adults. The study reported by Lee and colleagues adds new knowledge regarding the relationship between step volume and intensity and mortality in older women.
To date, only a handful of studies conducted outside of the United States have investigated the association between mortality and objectively measured step volume as determined by pedometer or accelerometer.2-4 While these studies observed that higher step counts are associated with lower mortality rates during follow-up periods of 5 to 10 years, their sample sizes were smaller and the study populations were different from those included in the study reported by Lee and colleagues. For example, the cohort from the United Kingdom included only men,2 and the participants in the Australian study were considerably younger, with a mean age of 59 years.4 In the current study, the largest of its kind thus far, it was observed that older women in the United States who take about 4400 steps a day have a lower mortality rate compared to those who take about 2700 steps a day. Moreover, the benefit of increased step volume on mortality progressively increases until plateauing at about 7500 steps per day. On the other hand, stepping intensity does not appear to lower mortality when step volume is accounted for. These results are important in that they add novel evidence that in older women, a patient population that tends to be sedentary, increased step volume (steps per day) but not stepping intensity (how quickly steps are taken) is associated with a reduction in mortality. Thus, these findings help to better characterize steps as a metric of ambulation in sedentary older adults per DHHS-PAG and add to the evidence necessary to translate this line of research into public health recommendations and programs.
While the health benefit of regular physical activity is well known and has been brought to the foreground with DDHA-PAG, only a small percentage of older adults engage in the recommended amounts and types of exercises. In other words, finding motivation to exercise is hard. Thus, identifying practical methods to facilitate behavioral change that increase and sustain physical activity in sedentary older adults would be essential to promoting health in this population. The use of wearable technologies such as fitness trackers and smartphone apps, devices that are now widely used, has shown promise for measuring and encouraging physical activity. The study by Lee and colleagues adds to this notion and further highlights the potential significance of step volume and mortality benefits in older women. Thus, future research in fitness technology should aim to integrate behavior change techniques (such as goal setting, feedback rewards, and action planning) and physical activity levels in order to improve health outcomes in older adults.5
In this study, the large sample size (> 16,000 participants), high compliance rate of accelerometer use (96% compliance rate), and reliable and continuous data capture (a built-in device feature) provide a large and complete dataset. This dataset, a major strength of the study, allowed the investigators to adequately control for potential confounders of physical activity, such as history of smoking, alcohol use, diet, and self-rated health, and therefore statistically minimize biases that are common in observational studies. However, some limitations inherent to the observational design are noted in this study. For instance, the observed association between step volume and mortality is correlational rather than causal, and a one-time assessment of steps taken over 7 consecutive days (ie, exposure) may not accurately reflect step volume and intensity of study participants over the span of 4.3 years of follow-up. Also, participants of WHS are predominately white, have higher socioeconomic status, and are more physically active than a national sample in the United States; therefore, caution should be exercised when making inferences to the general population.
Applications for Clinical Practice
Increased steps taken each day, up to about 7500 steps per day, is associated with lower mortality in older women. This finding can help inform the discussion when clinicians offer physical activity recommendations to older sedentary patients.
—Fred Ko, MD
1. Piercy KL, Troiano RP, Ballard RM, et al. The physical activity guidelines for Americans. JAMA. 2018;320:2020-2028.
2. Jefferis BJ, Parsons TJ, Sartini C, et al. Objectively measured physical activity, sedentary behaviour and all-cause mortality in older men: does volume of activity matter more than pattern of accumulation? Br J Sports Med. 2019;53:1013-1020.
3. Yamamoto N, Miyazaki H, Shimada M, et al. Daily step count and all-cause mortality in a sample of Japanese elderly people: a cohort study. BMC Public Health. 2018;18:540.
4. Dwyer T, Pezic A, Sun C, et al. Objectively measured daily steps and subsequent long term all-cause mortality: the Tasped prospective cohort study. PLoS One. 2015;10:e0141274.
5. Sullivan AN, Lachman ME. Behavior change with fitness technology in sedentary adults: a review of the evidence for increasing physical activity. Front Public Health. 2016;4:289.
Study Overview
Objective. To evaluate the association of number of steps taken per day and stepping intensity with all-cause mortality in older women.
Design. This was a prospective cohort study of US women participating in the Women’s Health Study (WHS). Participants wore an accelerometer device (ActiGraph GT3X+, ActiGraph Corp, Pensacola, FL) on the hip during waking hours for 7 consecutive days between 2011 and 2015. The accelerator data were collected at 30 Hz and aggregated into 60-second, time-stamped epochs. Data from participants who were adherent with wearing devices (defined as ≥ 10 hours/day of wear on ≥ 4 days) were used in an analysis that was conducted between 2018 and 2019. The exposure variables were defined as steps taken per day and measures of stepping intensity (ie, peak 1-minute cadence; peak 30-minute cadence; maximum 5-minute cadence; and time spent at a stepping rate of ≥ 40 steps/minute, reflecting purposeful steps).
Setting and participants. In total, 18,289 women participated in this study. Of these, 17,708 wore and returned their accelerometer devices, and data were downloaded successfully from 17,466 devices. Compliant wearers of the device (≥ 10 hours/day of wear on ≥4 days) included 16,741 participants (96% compliance rate of all downloaded device data).
Main outcome measure. All-cause mortality as ascertained through the National Death Index or confirmed by medical records and death certificates.
Main results. In this cohort of 16,741 women, average age at baseline was 72.0 ± 5.7 years (range, 62 to 101 years) and the mean step count was 5499 per day (median, 5094 steps/day) during the 7-day data capture period between 2011 and 2015. Not taking steps (0 steps/minute) accounted for 51.4% of the recorded time, incidental steps (1 to 39 steps/minute) accounted for 45.5%, and purposeful steps (≥ 40 steps/minute) accounted for 3.1%. The mean follow-up period was 4.3 years; during this time, 504 participants died. The median steps per day across quartiles were 2718 (lowest), 4363, 5905, and 8442 (highest). The corresponding quartile hazard ratios (HRs) associated with mortality adjusted for confounders were 1.00 (reference; lowest quartile), 0.59 (95% confidence interval [CI], 0.47-0.75), 0.54 (95% CI, 0.41-0.72), and 0.42 (95% CI, 0.30-0.60; highest quartile), respectively (P < 0.01). A higher mean step count per day, up to approximately 7500 steps/day, corresponded with progressive and steady decline in mortality HRs using spline analyses. Similar results were observed using sensitivity analyses that minimized reverse causation bias. While the adjusted analysis of measures of stepping intensity showed an inverse association with mortality rates, these associations were no longer significant after accounting for steps per day. Specifically, adjusted HRs comparing highest to lowest quartile were 0.87 (95% CI, 0.68-1.11) for peak 1-minute cadence; 0.86 (95% CI, 0.65-1.13) for peak 30-minute cadence; 0.80 (95% CI, 0.62-1.05) for maximum 5-minute cadence; and 1.27 (95% CI, 0.96-1.68) for time spent at a stepping rate of ≥ 40 steps/minute.
Conclusion. Older women who took approximately 4400 steps per day had lower all-cause mortality rates during a follow-up period of 4.3 years compared to those who took approximately 2700 steps each day. Progressive reduction in mortality rates was associated with increased steps per day before leveling at about 7500 steps/day. Stepping intensity, when accounting for number of steps taken per day, was not associated with reduction in mortality rates in older women.
Commentary
The health and mortality benefits of exercise are well recognized. The 2018 Department of Health and Human Services Physical Activity Guidelines (DHHS-PAG) recommend that adults should do at least 150 to 300 minutes of moderate-intensity aerobic physical activity per week, or 75 to 150 minutes of vigorous-intensity aerobic physical activity per week, in addition to doing muscle-strengthening activities on 2 or more days a week.1 Importantly, the guidelines emphasize that moving more and sitting less benefit nearly everyone, and note that measures of steps as a metric of ambulation can further promote translation of research into public health recommendations for exercise interventions. Despite this recognition, there is limited information centering on the number of daily steps (step volume) and the intensity of stepping that are needed to achieve optimal health outcomes in older adults. The study reported by Lee and colleagues adds new knowledge regarding the relationship between step volume and intensity and mortality in older women.
To date, only a handful of studies conducted outside of the United States have investigated the association between mortality and objectively measured step volume as determined by pedometer or accelerometer.2-4 While these studies observed that higher step counts are associated with lower mortality rates during follow-up periods of 5 to 10 years, their sample sizes were smaller and the study populations were different from those included in the study reported by Lee and colleagues. For example, the cohort from the United Kingdom included only men,2 and the participants in the Australian study were considerably younger, with a mean age of 59 years.4 In the current study, the largest of its kind thus far, it was observed that older women in the United States who take about 4400 steps a day have a lower mortality rate compared to those who take about 2700 steps a day. Moreover, the benefit of increased step volume on mortality progressively increases until plateauing at about 7500 steps per day. On the other hand, stepping intensity does not appear to lower mortality when step volume is accounted for. These results are important in that they add novel evidence that in older women, a patient population that tends to be sedentary, increased step volume (steps per day) but not stepping intensity (how quickly steps are taken) is associated with a reduction in mortality. Thus, these findings help to better characterize steps as a metric of ambulation in sedentary older adults per DHHS-PAG and add to the evidence necessary to translate this line of research into public health recommendations and programs.
While the health benefit of regular physical activity is well known and has been brought to the foreground with DDHA-PAG, only a small percentage of older adults engage in the recommended amounts and types of exercises. In other words, finding motivation to exercise is hard. Thus, identifying practical methods to facilitate behavioral change that increase and sustain physical activity in sedentary older adults would be essential to promoting health in this population. The use of wearable technologies such as fitness trackers and smartphone apps, devices that are now widely used, has shown promise for measuring and encouraging physical activity. The study by Lee and colleagues adds to this notion and further highlights the potential significance of step volume and mortality benefits in older women. Thus, future research in fitness technology should aim to integrate behavior change techniques (such as goal setting, feedback rewards, and action planning) and physical activity levels in order to improve health outcomes in older adults.5
In this study, the large sample size (> 16,000 participants), high compliance rate of accelerometer use (96% compliance rate), and reliable and continuous data capture (a built-in device feature) provide a large and complete dataset. This dataset, a major strength of the study, allowed the investigators to adequately control for potential confounders of physical activity, such as history of smoking, alcohol use, diet, and self-rated health, and therefore statistically minimize biases that are common in observational studies. However, some limitations inherent to the observational design are noted in this study. For instance, the observed association between step volume and mortality is correlational rather than causal, and a one-time assessment of steps taken over 7 consecutive days (ie, exposure) may not accurately reflect step volume and intensity of study participants over the span of 4.3 years of follow-up. Also, participants of WHS are predominately white, have higher socioeconomic status, and are more physically active than a national sample in the United States; therefore, caution should be exercised when making inferences to the general population.
Applications for Clinical Practice
Increased steps taken each day, up to about 7500 steps per day, is associated with lower mortality in older women. This finding can help inform the discussion when clinicians offer physical activity recommendations to older sedentary patients.
—Fred Ko, MD
1. Piercy KL, Troiano RP, Ballard RM, et al. The physical activity guidelines for Americans. JAMA. 2018;320:2020-2028.
2. Jefferis BJ, Parsons TJ, Sartini C, et al. Objectively measured physical activity, sedentary behaviour and all-cause mortality in older men: does volume of activity matter more than pattern of accumulation? Br J Sports Med. 2019;53:1013-1020.
3. Yamamoto N, Miyazaki H, Shimada M, et al. Daily step count and all-cause mortality in a sample of Japanese elderly people: a cohort study. BMC Public Health. 2018;18:540.
4. Dwyer T, Pezic A, Sun C, et al. Objectively measured daily steps and subsequent long term all-cause mortality: the Tasped prospective cohort study. PLoS One. 2015;10:e0141274.
5. Sullivan AN, Lachman ME. Behavior change with fitness technology in sedentary adults: a review of the evidence for increasing physical activity. Front Public Health. 2016;4:289.
Supine sleep in late pregnancy may promote low birth weight
Data from previous studies suggest that impaired uteroplacental flow can affect fetal growth, wrote Ngaire H. Anderson, PhD, of the University of Auckland, N.Z., and colleagues.
“The initial going-to-sleep position is the sleep position that women maintain for the longest duration throughout the night; therefore, going-to-sleep position is likely to have the greatest impact on blood flow to the developing fetus,” they said.
In a study published in JAMA Network Open, the researchers interviewed women with ongoing pregnancies at 28 weeks’ gestation or later to determine their sleeping positions. The mean age of the participants was 30 years. Of the 1,760 women, 3% reported that they usually slept supine during the past 1-4 weeks.
The adjusted mean birth weight was 3,410 g among supine sleepers and 3,554 g among nonsupine sleepers. The primary outcome was an adjusted mean difference in birth weight between infants of supine sleepers and nonsupine sleepers, which was a statistically significant 144 g (P = .009).
The study findings were limited by several factors including the small number of women who were reported supine sleepers, as well as the reliance on self-reports of sleep position, the researchers said.
However, women who had going-to-sleep data for the previous night and the previous month suggest that most women are consistent in their going-to-sleep position, they noted. “It is also biologically plausible that the association of decreased maternal blood flow on birth size with supine maternal position is cumulative over time,” but the researchers were not able to investigate how the duration of supine sleeping might further affect birth weight.
Although it might make additional studies more difficult, a public health campaign to encourage pregnant women to sleep on their side during the third trimester is a safe and easy opportunity to potentially optimize birth weight, they added.
The study was important because of the limited number of high-quality studies on the effects of maternal sleep on perinatal outcomes, Martina Badell, MD of Emory University in Atlanta said in an interview.
“The overall findings suggested a possible small increased risk of small-for-gestational-age babies with supine maternal sleeping, however, the absolute gram difference of 144 grams at term may not be clinically relevant,” she said. In addition, the relatively small number of women who reported supine sleep in late pregnancy suggests that broad public health campaigns or recommendations may not be indicated at this time.
“Also, the percentage of women who are supine sleepers at term is only approximately 3%, and this study didn’t assess reasons for supine sleeping in this small subset of women,” she said. “Further research is needed to assess whether there are specific maternal factors associated with supine sleeping, such as GI symptoms or respiratory difficulties, which could contribute to smaller fetal size rather than the sleep position itself.”
The study was supported by a Trans-Tasman Research Funding Grant by Cure Kids and Red Nose Australia. Six coauthors reported receiving numerous grants from a variety of organizations. Dr. Anderson and the remaining coauthors had no financial conflicts to disclose. Dr. Badell had no relevant financial disclosures.
SOURCE: Anderson NH et al. JAMA Network Open. 2019 Oct 2. doi: 10.1001/jamanetworkopen.2019.12614.
FROM JAMA NETWORK OPEN
High maternal lead levels linked to children’s obesity
Children born to mothers with high blood levels of lead have an increased risk of being overweight or obese, particularly if their mothers are also overweight, according to new research.

Adequate maternal plasma levels of folate, however, mitigated this risk.
“When considered simultaneously, maternal lead exposure, rather than early childhood lead exposure, contributed to overweight/obesity risk in a dose-response fashion across multiple developmental stages (preschool age, school age and early adolescence) and amplified intergenerational overweight/obesity risk (additively with maternal overweight/obesity),” Guoying Wang, MD, PhD, of Johns Hopkins Bloomberg School of Public Health, Baltimore, and associates, reported in JAMA Network Open.
“These findings support the hypothesis that the obesity epidemic could be related to environmental chemical exposures in utero and raise the possibility that optimal maternal folate supplementation may help counteract the adverse effects of environmental lead exposure,” the authors wrote.
The prospective urban, low-income cohort study, which ran from 2002 to 2013, involved 1,442 mother-child pairs who joined the study when the children were born and attended follow-up visits at Boston Medical Center. The mean age of the mothers was 29 years, and the children were, on average, 8 years old at follow-up. Half the children were male; 67% of mothers were black, and 20% were Latina.
The researchers collected maternal blood samples within 24-72 hours after birth to measure red blood cell lead levels and plasma folate levels. Children’s whole-blood lead levels were measured during the first lead screening of their well child visits, at a median 10 months of age. Researchers tracked children’s body mass index Z-score and defined overweight/obesity as exceeding the 85th national percentile for their age and sex.
Detectable lead was present in all the mothers’ blood samples. The median maternal red blood cell lead level was 2.5 mcg/dL, although black mothers tended to have higher lead exposure than that of other racial groups. Median maternal plasma folate level was 32 nmol/L. Children’s blood lead levels were a median 1.4 mcg/dL, and their median BMI Z-score was 0.78.
Children whose mothers had red blood cell lead levels of 5.0 mcg/dL or greater (16%) had 65% greater odds of being overweight or obese compared with children whose mothers’ lead level was less than 2 mcg/dL, after adjustment for maternal education, race/ethnicity, smoking status, parity, diabetes, hypertensive disorder, preterm birth, fetal growth, and breastfeeding status (odds ratio [OR], 1.65; 95% confidence internal [CI], 1.18-2.32). Only 5.2% of children had whole-blood lead levels of 5 mcg/dL or greater.
“Mothers with the highest red blood cell lead levels were older and multiparous, were more likely to be black and nonsmokers, had lower plasma folate levels and were more likely to have prepregnancy overweight/obesity and diabetes,” the authors reported.
The dose-response association did not lose significance when the researchers adjusted for children’s blood lead levels, maternal age, cesarean delivery, term births only, and black race. Nor did it change in a subset of children when the researchers adjusted for children’s physical activity.
The strength of the association increased when mothers also had a BMI greater than the average/healthy range. Children were more than four times more likely to be overweight or obese if their mothers were overweight or obese and had lead levels greater than 5.0 mcg/dL, compared with nonoverweight mothers with levels below 2 mcg/dL (OR, 4.24; 95% CI, 2.64-6.82).
Among children whose mothers were overweight/obese and had high blood lead levels, however, high folate levels appeared protective against obesity. These children had a 41% lower risk of being overweight or obese, compared with others in their group, if their mothers had plasma folate levels of at least 20 nmol/L (OR, 0.59 CI, 0.36-0.95; P = .03).
According to an invited commentary, “approximately 140,000 new chemicals and pesticides have appeared since 1950,” with “universal human exposure to approximately 5,000 of those,” wrote Marco Sanchez-Guerra, PhD, of the National Institute of Perinatology in Mexico City, and coauthors Andres Cardenas, PhD, of the University of California, Berkeley, and Citlalli Osorio-Yáñez, PhD, of the National Autonomous University of Mexico in Mexico City. Yet fewer than half of those chemicals have been tested for safety or toxic effect, the editorialists wrote, and scientists know little of their potential reproductive harm.
Dr. Sanchez-Guerra, Dr. Cardenas, and Dr. Osorio-Yáñez agreed with the study authors that elevated lead exposures, especially from gasoline before lead was removed in the United States in 1975, may partly explain the current epidemic of obesity.
“Identifying preventable prenatal causes of obesity is a cornerstone in the fight against the obesity epidemic,” the editorialists said. While most recommendations center on changes to diet and physical activity, environmental factors during pregnancy could be involved in childhood obesity as well.
“The study by Wang et al. opens the door to new questions about whether adequate folate intake might modify the adverse effects of other chemical exposures,” they continued, noting other research suggesting a protective effect from folate against health effects of air pollution exposure. “These efforts could yield substantial public health benefits and represent novel tools in fighting the obesity epidemic,” they concluded.
The research was funded by the National Institutes of Health and the U.S. Department of Health and Human Services. Neither the study authors nor the editorialists had industry financial disclosures.
SOURCES: Wang G et al. JAMA Netw Open. 2019;2(10):e1912343. doi: 10.1001/jamanetworkopen.2019.12343; Sanchez-Guerra M et al. JAMA Netw Open. 2019;2(10):e1912334. doi: 10.1001/jamanetworkopen.2019.12334.
Children born to mothers with high blood levels of lead have an increased risk of being overweight or obese, particularly if their mothers are also overweight, according to new research.
Adequate maternal plasma levels of folate, however, mitigated this risk.
“When considered simultaneously, maternal lead exposure, rather than early childhood lead exposure, contributed to overweight/obesity risk in a dose-response fashion across multiple developmental stages (preschool age, school age and early adolescence) and amplified intergenerational overweight/obesity risk (additively with maternal overweight/obesity),” Guoying Wang, MD, PhD, of Johns Hopkins Bloomberg School of Public Health, Baltimore, and associates, reported in JAMA Network Open.
“These findings support the hypothesis that the obesity epidemic could be related to environmental chemical exposures in utero and raise the possibility that optimal maternal folate supplementation may help counteract the adverse effects of environmental lead exposure,” the authors wrote.
The prospective urban, low-income cohort study, which ran from 2002 to 2013, involved 1,442 mother-child pairs who joined the study when the children were born and attended follow-up visits at Boston Medical Center. The mean age of the mothers was 29 years, and the children were, on average, 8 years old at follow-up. Half the children were male; 67% of mothers were black, and 20% were Latina.
The researchers collected maternal blood samples within 24-72 hours after birth to measure red blood cell lead levels and plasma folate levels. Children’s whole-blood lead levels were measured during the first lead screening of their well child visits, at a median 10 months of age. Researchers tracked children’s body mass index Z-score and defined overweight/obesity as exceeding the 85th national percentile for their age and sex.
Detectable lead was present in all the mothers’ blood samples. The median maternal red blood cell lead level was 2.5 mcg/dL, although black mothers tended to have higher lead exposure than that of other racial groups. Median maternal plasma folate level was 32 nmol/L. Children’s blood lead levels were a median 1.4 mcg/dL, and their median BMI Z-score was 0.78.
Children whose mothers had red blood cell lead levels of 5.0 mcg/dL or greater (16%) had 65% greater odds of being overweight or obese compared with children whose mothers’ lead level was less than 2 mcg/dL, after adjustment for maternal education, race/ethnicity, smoking status, parity, diabetes, hypertensive disorder, preterm birth, fetal growth, and breastfeeding status (odds ratio [OR], 1.65; 95% confidence internal [CI], 1.18-2.32). Only 5.2% of children had whole-blood lead levels of 5 mcg/dL or greater.
“Mothers with the highest red blood cell lead levels were older and multiparous, were more likely to be black and nonsmokers, had lower plasma folate levels and were more likely to have prepregnancy overweight/obesity and diabetes,” the authors reported.
The dose-response association did not lose significance when the researchers adjusted for children’s blood lead levels, maternal age, cesarean delivery, term births only, and black race. Nor did it change in a subset of children when the researchers adjusted for children’s physical activity.
The strength of the association increased when mothers also had a BMI greater than the average/healthy range. Children were more than four times more likely to be overweight or obese if their mothers were overweight or obese and had lead levels greater than 5.0 mcg/dL, compared with nonoverweight mothers with levels below 2 mcg/dL (OR, 4.24; 95% CI, 2.64-6.82).
Among children whose mothers were overweight/obese and had high blood lead levels, however, high folate levels appeared protective against obesity. These children had a 41% lower risk of being overweight or obese, compared with others in their group, if their mothers had plasma folate levels of at least 20 nmol/L (OR, 0.59 CI, 0.36-0.95; P = .03).
According to an invited commentary, “approximately 140,000 new chemicals and pesticides have appeared since 1950,” with “universal human exposure to approximately 5,000 of those,” wrote Marco Sanchez-Guerra, PhD, of the National Institute of Perinatology in Mexico City, and coauthors Andres Cardenas, PhD, of the University of California, Berkeley, and Citlalli Osorio-Yáñez, PhD, of the National Autonomous University of Mexico in Mexico City. Yet fewer than half of those chemicals have been tested for safety or toxic effect, the editorialists wrote, and scientists know little of their potential reproductive harm.
Dr. Sanchez-Guerra, Dr. Cardenas, and Dr. Osorio-Yáñez agreed with the study authors that elevated lead exposures, especially from gasoline before lead was removed in the United States in 1975, may partly explain the current epidemic of obesity.
“Identifying preventable prenatal causes of obesity is a cornerstone in the fight against the obesity epidemic,” the editorialists said. While most recommendations center on changes to diet and physical activity, environmental factors during pregnancy could be involved in childhood obesity as well.
“The study by Wang et al. opens the door to new questions about whether adequate folate intake might modify the adverse effects of other chemical exposures,” they continued, noting other research suggesting a protective effect from folate against health effects of air pollution exposure. “These efforts could yield substantial public health benefits and represent novel tools in fighting the obesity epidemic,” they concluded.
The research was funded by the National Institutes of Health and the U.S. Department of Health and Human Services. Neither the study authors nor the editorialists had industry financial disclosures.
SOURCES: Wang G et al. JAMA Netw Open. 2019;2(10):e1912343. doi: 10.1001/jamanetworkopen.2019.12343; Sanchez-Guerra M et al. JAMA Netw Open. 2019;2(10):e1912334. doi: 10.1001/jamanetworkopen.2019.12334.
FROM JAMA NETWORK OPEN
Ovarian tumor markers: What to draw and when
Tumor markers are serum measures that are valuable in the discrimination of an adnexal mass. However, given the long list from which to choose, it can be confusing to know exactly which might best serve your diagnostic needs. I am commonly asked by obstetrician/gynecologists and primary care doctors for guidance on this subject. In this column I will explore some of the decision making that I use when determining which markers might be most helpful for individual patients.
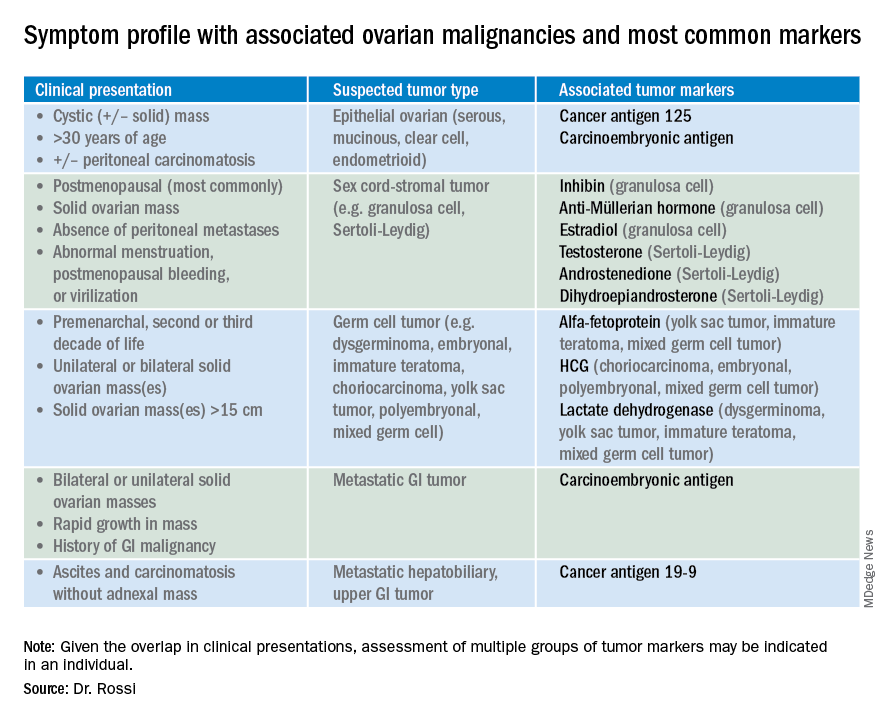
So which tumor markers should you order when you have diagnosed an adnexal mass? Because tumor marker profiles can differ dramatically based on the cell type of the neoplasm, perhaps the first question to ask is what is the most likely category of neoplasm based on other clinical data? Ovarian neoplasms fit into the following subgroups: epithelial (including the most common cell type, serous ovarian cancer, but also the less common mucinous and low malignant potential tumors), sex cord-stromal tumors, germ cell tumors, and metastatic tumors. Table 1 summarizes which tumor markers should be considered based on the clinical setting.
You should suspect an epithelial tumor if there is an adnexal mass with significant cystic components in older, postmenopausal patients, or the presence of peritoneal carcinomatosis on imaging. The tumor markers most commonly elevated in this clinical setting are cancer antigen 125 (CA 125), carcinoembryonic antigen (CEA), and possibly CA 19-9. The CA 125 antigen is a glycoprotein derived from the epithelium of peritoneum, pleura, pericardium, and Müllerian tissues. The multiple sites of origin of this glycoprotein speaks to the poor specificity associated with its elevation, as it is well known to be elevated in both benign conditions such as endometriosis, fibroids, pregnancy, ovulation, cirrhosis, and pericarditis as well as in nongynecologic malignancies, particularly those metastatic to the peritoneal cavity. Multiple different assays are available to measure CA 125, and each is associated with a slightly different reference range. Therefore, if measuring serial values, it is best to have these assessed by the same laboratory. Similarly, as it can be physiologically elevated during the menstrual cycle, premenopausal women should have serial assessments at the same point in their menstrual cycle or ideally within the first 2 weeks of their cycle.
The sensitivity of CA 125 in detecting ovarian cancer is only 78%, which is limited by the fact that not all epithelial ovarian cancer cell types (including some clear cell, carcinosarcoma, and mucinous) express elevations in this tumor marker, and because CA 125 is elevated in less than half of stage I ovarian cancers.1 Therefore, given the lack of sensitivity and specificity for this tumor marker, you should integrate other clinical data, such as imaging findings, age of the patient, and associated benign medical conditions, when evaluating the likelihood of cancer. The American College of Obstetricians and Gynecologists (ACOG) recommends that in the setting of an adnexal mass, referral to gynecologic oncology is recommended when the CA 125 value is greater than 200 U/mL in premenopausal women, or greater than 35U/mL in postmenopausal women.2
CEA is a protein that can be expressed in the colon but not in other normal tissues after birth, and therefore its elevation is commonly associated with metastatic GI tumors to the ovary and peritoneum, or mucinous ovarian tumors, including borderline tumors. Metastatic GI tumors typically are suspected when there are bilateral ovarian solid masses. Right-sided ovarian cysts also can be associated with appendiceal pathology and checking a CEA level can be considered in these cases. I will commonly draw both CA 125 and CEA tumor markers in the setting of cystic +/– solid ovarian masses. This allows the recognition of CA 125-negative/CEA-positive ovarian cancers, such as mucinous tumors, which aids in later surveillance or increases my suspicion for an occult GI tumor (particularly if there is a disproportionately higher elevation in CEA than CA 125).3 If tumor marker profiles are suggestive of an occult GI tumor, I often will consider a preoperative colonoscopy and upper GI endoscopic assessment.
CA 19-9 is a much less specific tumor marker which can be elevated in a variety of solid organ tumors including pancreatic, hepatobiliary, gastric and ovarian tumors. I typically reserve adding this marker for atypical clinical presentations of ovarian cancer, such as carcinomatosis in the absence of pelvic masses.

Ovarian sex cord-stromal neoplasms most commonly present as solid tumors in the ovary. The ovarian stroma includes the bland fibroblasts and the hormone-producing sex-cord granulosa, Sertoli and Leydig cells. Therefore the sex cord-stromal tumors commonly are associated with elevations in serum inhibin, anti-Müllerian hormone, and potentially androstenedione and dehydroepiandrosterone.4 These tumors rarely have advanced disease at diagnosis. Granulosa cell tumors should be suspected in women with a solid ovarian mass and abnormal uterine bleeding (including postmenopausal bleeding), and the appropriate tumor markers (inhibin and anti-Müllerian hormone) can guide this diagnosis preoperatively.4 Androgen-secreting stromal tumors such as Sertoli-Leydig tumors often present with virilization or menstrual irregularities. Interestingly, these patients may have dramatic clinical symptoms with corresponding nonvisible or very small solid adnexal lesions seen on imaging. In the case of fibromas, these solid tumors have normal hormonal tumor markers but may present with ascites and pleural effusions as part of Meigs syndrome, which can confuse the clinician who may suspect advanced-stage epithelial cancer especially as this condition may be associated with elevated CA 125.
Germ cell tumors make up the other main group of primary ovarian tumors, and typically strongly express tumor markers. These tumors typically are solid and highly vascularized on imaging, can be bilateral, and may be very large at the time of diagnosis.5 They most commonly are unilateral and arise among younger women (including usually in the second and third decades of life). Table 1 demonstrates the different tumor markers associated with different germ cell tumors. It is my practice to order a panel of all of these germ cell markers in young women with solid adnexal masses in whom germ cell tumors are suspected, but I will not routinely draw this expansive panel for older women with cystic lesions.
Tumor marker panels (such as OVA 1, Overa, Risk of Malignancy Algorithm or ROMA) have become popular in recent years. These panels include multiple serum markers (such as CA 125, beta-2 microglobulin, human epididymis secretory protein 4, transferrin, etc.) evaluated in concert with the goal being a more nuanced assessment of likelihood for malignancy.6,7 These assays typically are stratified by age or menopausal status given the physiologic differences in normal reference ranges that occur between these groups. While these studies do improve upon the sensitivity and specificity for identifying malignancy, compared with single-assay tests, they are not definitively diagnostic for this purpose. Therefore, I typically recommend these assays if a referring doctor needs additional risk stratification to guide whether or not to refer to an oncologist for surgery.
Not all tumor markers are of equal value in all patients with an adnexal mass. I recommend careful consideration of other clinical factors such as age, menopausal status, ultrasonographic features, and associated findings such as GI symptoms or manifestations of hormonal alterations when considering which markers to assess.
Dr. Rossi is assistant professor in the division of gynecologic oncology at the University of North Carolina at Chapel Hill. She said she had no relevant financial disclosures. Email her at [email protected].
References
1. Hum Reprod. 1989 Jan;4(1):1-12.
2. Obstet Gynecol. 2016 Nov;128(5):e210-e26.
3. Dan Med Bull. 2011 Nov;58(11):A4331.
4. Int J Cancer. 2015 Oct 1;137(7):1661-71.
5. Obstet Gynecol. 2000 Jan;95(1):128-33.
6. Obstet Gynecol. 2011 Jun;117(6):1289-97.
7. Obstet Gynecol. 2011 Aug;118(2 Pt 1):280-8.
Tumor markers are serum measures that are valuable in the discrimination of an adnexal mass. However, given the long list from which to choose, it can be confusing to know exactly which might best serve your diagnostic needs. I am commonly asked by obstetrician/gynecologists and primary care doctors for guidance on this subject. In this column I will explore some of the decision making that I use when determining which markers might be most helpful for individual patients.
So which tumor markers should you order when you have diagnosed an adnexal mass? Because tumor marker profiles can differ dramatically based on the cell type of the neoplasm, perhaps the first question to ask is what is the most likely category of neoplasm based on other clinical data? Ovarian neoplasms fit into the following subgroups: epithelial (including the most common cell type, serous ovarian cancer, but also the less common mucinous and low malignant potential tumors), sex cord-stromal tumors, germ cell tumors, and metastatic tumors. Table 1 summarizes which tumor markers should be considered based on the clinical setting.
You should suspect an epithelial tumor if there is an adnexal mass with significant cystic components in older, postmenopausal patients, or the presence of peritoneal carcinomatosis on imaging. The tumor markers most commonly elevated in this clinical setting are cancer antigen 125 (CA 125), carcinoembryonic antigen (CEA), and possibly CA 19-9. The CA 125 antigen is a glycoprotein derived from the epithelium of peritoneum, pleura, pericardium, and Müllerian tissues. The multiple sites of origin of this glycoprotein speaks to the poor specificity associated with its elevation, as it is well known to be elevated in both benign conditions such as endometriosis, fibroids, pregnancy, ovulation, cirrhosis, and pericarditis as well as in nongynecologic malignancies, particularly those metastatic to the peritoneal cavity. Multiple different assays are available to measure CA 125, and each is associated with a slightly different reference range. Therefore, if measuring serial values, it is best to have these assessed by the same laboratory. Similarly, as it can be physiologically elevated during the menstrual cycle, premenopausal women should have serial assessments at the same point in their menstrual cycle or ideally within the first 2 weeks of their cycle.
The sensitivity of CA 125 in detecting ovarian cancer is only 78%, which is limited by the fact that not all epithelial ovarian cancer cell types (including some clear cell, carcinosarcoma, and mucinous) express elevations in this tumor marker, and because CA 125 is elevated in less than half of stage I ovarian cancers.1 Therefore, given the lack of sensitivity and specificity for this tumor marker, you should integrate other clinical data, such as imaging findings, age of the patient, and associated benign medical conditions, when evaluating the likelihood of cancer. The American College of Obstetricians and Gynecologists (ACOG) recommends that in the setting of an adnexal mass, referral to gynecologic oncology is recommended when the CA 125 value is greater than 200 U/mL in premenopausal women, or greater than 35U/mL in postmenopausal women.2
CEA is a protein that can be expressed in the colon but not in other normal tissues after birth, and therefore its elevation is commonly associated with metastatic GI tumors to the ovary and peritoneum, or mucinous ovarian tumors, including borderline tumors. Metastatic GI tumors typically are suspected when there are bilateral ovarian solid masses. Right-sided ovarian cysts also can be associated with appendiceal pathology and checking a CEA level can be considered in these cases. I will commonly draw both CA 125 and CEA tumor markers in the setting of cystic +/– solid ovarian masses. This allows the recognition of CA 125-negative/CEA-positive ovarian cancers, such as mucinous tumors, which aids in later surveillance or increases my suspicion for an occult GI tumor (particularly if there is a disproportionately higher elevation in CEA than CA 125).3 If tumor marker profiles are suggestive of an occult GI tumor, I often will consider a preoperative colonoscopy and upper GI endoscopic assessment.
CA 19-9 is a much less specific tumor marker which can be elevated in a variety of solid organ tumors including pancreatic, hepatobiliary, gastric and ovarian tumors. I typically reserve adding this marker for atypical clinical presentations of ovarian cancer, such as carcinomatosis in the absence of pelvic masses.
Ovarian sex cord-stromal neoplasms most commonly present as solid tumors in the ovary. The ovarian stroma includes the bland fibroblasts and the hormone-producing sex-cord granulosa, Sertoli and Leydig cells. Therefore the sex cord-stromal tumors commonly are associated with elevations in serum inhibin, anti-Müllerian hormone, and potentially androstenedione and dehydroepiandrosterone.4 These tumors rarely have advanced disease at diagnosis. Granulosa cell tumors should be suspected in women with a solid ovarian mass and abnormal uterine bleeding (including postmenopausal bleeding), and the appropriate tumor markers (inhibin and anti-Müllerian hormone) can guide this diagnosis preoperatively.4 Androgen-secreting stromal tumors such as Sertoli-Leydig tumors often present with virilization or menstrual irregularities. Interestingly, these patients may have dramatic clinical symptoms with corresponding nonvisible or very small solid adnexal lesions seen on imaging. In the case of fibromas, these solid tumors have normal hormonal tumor markers but may present with ascites and pleural effusions as part of Meigs syndrome, which can confuse the clinician who may suspect advanced-stage epithelial cancer especially as this condition may be associated with elevated CA 125.
Germ cell tumors make up the other main group of primary ovarian tumors, and typically strongly express tumor markers. These tumors typically are solid and highly vascularized on imaging, can be bilateral, and may be very large at the time of diagnosis.5 They most commonly are unilateral and arise among younger women (including usually in the second and third decades of life). Table 1 demonstrates the different tumor markers associated with different germ cell tumors. It is my practice to order a panel of all of these germ cell markers in young women with solid adnexal masses in whom germ cell tumors are suspected, but I will not routinely draw this expansive panel for older women with cystic lesions.
Tumor marker panels (such as OVA 1, Overa, Risk of Malignancy Algorithm or ROMA) have become popular in recent years. These panels include multiple serum markers (such as CA 125, beta-2 microglobulin, human epididymis secretory protein 4, transferrin, etc.) evaluated in concert with the goal being a more nuanced assessment of likelihood for malignancy.6,7 These assays typically are stratified by age or menopausal status given the physiologic differences in normal reference ranges that occur between these groups. While these studies do improve upon the sensitivity and specificity for identifying malignancy, compared with single-assay tests, they are not definitively diagnostic for this purpose. Therefore, I typically recommend these assays if a referring doctor needs additional risk stratification to guide whether or not to refer to an oncologist for surgery.
Not all tumor markers are of equal value in all patients with an adnexal mass. I recommend careful consideration of other clinical factors such as age, menopausal status, ultrasonographic features, and associated findings such as GI symptoms or manifestations of hormonal alterations when considering which markers to assess.
Dr. Rossi is assistant professor in the division of gynecologic oncology at the University of North Carolina at Chapel Hill. She said she had no relevant financial disclosures. Email her at [email protected].
References
1. Hum Reprod. 1989 Jan;4(1):1-12.
2. Obstet Gynecol. 2016 Nov;128(5):e210-e26.
3. Dan Med Bull. 2011 Nov;58(11):A4331.
4. Int J Cancer. 2015 Oct 1;137(7):1661-71.
5. Obstet Gynecol. 2000 Jan;95(1):128-33.
6. Obstet Gynecol. 2011 Jun;117(6):1289-97.
7. Obstet Gynecol. 2011 Aug;118(2 Pt 1):280-8.
Vulvar and gluteal manifestations of Crohn disease
A 37-year-old woman presented with recurring painful swelling and erythema of the vulva over the last year. Despite a series of negative vaginal cultures, she was prescribed multiple courses of antifungal and antibacterial treatments, while her symptoms continued to worsen. She had no other relevant medical history except for occasional diarrhea and abdominal cramping, which were attributed to irritable bowel syndrome.

CROHN DISEASE OUTSIDE THE GASTROINTESTINAL TRACT
Crohn disease primarily affects the gastrointestinal tract but is associated with extraintestinal manifestations (in the oral cavity, eyes, skin, and joints) in up to 45% of patients.1
The most common mucocutaneous manifestations are granulomatous lesions that extend directly from the gastrointestinal tract, including perianal and peristomal skin tags, fistulas, and perineal ulcerations. In most cases, the onset of cutaneous manifestations follows intestinal disease, but vulvar Crohn disease may precede gastrointestinal symptoms in approximately 25% of patients, with the average age at onset in the mid-30s.1
The pathogenesis of vulvar Crohn disease remains unclear. One theory involves production of immune complexes from the gastrointestinal tract and a possible T-lymphocyte-mediated type IV hypersensitivity reaction.2

The diagnosis of vulvar Crohn disease should be considered in a patient who has vulvar pain, edema, and ulcerations not otherwise explained, whether or not gastrointestinal Crohn disease is present. The diagnosis is established with clinical history and characteristic histopathology on biopsy. Multiple biopsies may be needed, and early endoscopy is recommended to establish the diagnosis. The histologic features include noncaseating and nonnecrotizing granulomatous dermatitis or vulvitis with occasional reports of eosinophilic infiltrates and necrobiosis.5,6 An imaging study such as ultrasonography is sometimes used to differentiate between a specific cutaneous manifestation of Crohn disease and its complications such as perianal fistula or abscess.
Clinical vulvar lesions are nonspecific, and those of Crohn disease are frequently mistaken for infectious, inflammatory, or traumatic vulvitis. Diagnostic biopsy for histologic analysis is warranted.
- Andreani SM, Ratnasingham K, Dang HH, Gravante G, Giordano P. Crohn’s disease of the vulva. Int J Surg 2010; 8(1):2–5. doi:10.1016/j.ijsu.2009.09.012
- Siroy A, Wasman J. Metastatic Crohn disease: a rare cutaneous entity. Arch Pathol Lab Med 2012; 136(3):329–332. doi:10.5858/arpa.2010-0666-RS
- Foo WC, Papalas JA, Robboy SJ, Selim MA. Vulvar manifestations of Crohn’s disease. Am J Dermatopathol 2011; 33(6):588–593. doi:10.1097/DAD.0b013e31820a2635
- Amankwah Y, Haefner H. Vulvar edema. Dermatol Clin 2010; 28(4):765–777. doi:10.1016/j.det.2010.08.001
- Emanuel PO, Phelps RG. Metastatic Crohn’s disease: a histopathologic study of 12 cases. J Cutan Pathol 2008; 35(5):457–461. doi:10.1111/j.1600-0560.2007.00849.x
- Hackzell-Bradley M, Hedblad MA, Stephansson EA. Metastatic Crohn’s disease: report of 3 cases with special reference to histopathologic findings. Arch Dermatol 1996; 132(8):928–932.
A 37-year-old woman presented with recurring painful swelling and erythema of the vulva over the last year. Despite a series of negative vaginal cultures, she was prescribed multiple courses of antifungal and antibacterial treatments, while her symptoms continued to worsen. She had no other relevant medical history except for occasional diarrhea and abdominal cramping, which were attributed to irritable bowel syndrome.
CROHN DISEASE OUTSIDE THE GASTROINTESTINAL TRACT
Crohn disease primarily affects the gastrointestinal tract but is associated with extraintestinal manifestations (in the oral cavity, eyes, skin, and joints) in up to 45% of patients.1
The most common mucocutaneous manifestations are granulomatous lesions that extend directly from the gastrointestinal tract, including perianal and peristomal skin tags, fistulas, and perineal ulcerations. In most cases, the onset of cutaneous manifestations follows intestinal disease, but vulvar Crohn disease may precede gastrointestinal symptoms in approximately 25% of patients, with the average age at onset in the mid-30s.1
The pathogenesis of vulvar Crohn disease remains unclear. One theory involves production of immune complexes from the gastrointestinal tract and a possible T-lymphocyte-mediated type IV hypersensitivity reaction.2
The diagnosis of vulvar Crohn disease should be considered in a patient who has vulvar pain, edema, and ulcerations not otherwise explained, whether or not gastrointestinal Crohn disease is present. The diagnosis is established with clinical history and characteristic histopathology on biopsy. Multiple biopsies may be needed, and early endoscopy is recommended to establish the diagnosis. The histologic features include noncaseating and nonnecrotizing granulomatous dermatitis or vulvitis with occasional reports of eosinophilic infiltrates and necrobiosis.5,6 An imaging study such as ultrasonography is sometimes used to differentiate between a specific cutaneous manifestation of Crohn disease and its complications such as perianal fistula or abscess.
Clinical vulvar lesions are nonspecific, and those of Crohn disease are frequently mistaken for infectious, inflammatory, or traumatic vulvitis. Diagnostic biopsy for histologic analysis is warranted.
- Andreani SM, Ratnasingham K, Dang HH, Gravante G, Giordano P. Crohn’s disease of the vulva. Int J Surg 2010; 8(1):2–5. doi:10.1016/j.ijsu.2009.09.012
- Siroy A, Wasman J. Metastatic Crohn disease: a rare cutaneous entity. Arch Pathol Lab Med 2012; 136(3):329–332. doi:10.5858/arpa.2010-0666-RS
- Foo WC, Papalas JA, Robboy SJ, Selim MA. Vulvar manifestations of Crohn’s disease. Am J Dermatopathol 2011; 33(6):588–593. doi:10.1097/DAD.0b013e31820a2635
- Amankwah Y, Haefner H. Vulvar edema. Dermatol Clin 2010; 28(4):765–777. doi:10.1016/j.det.2010.08.001
- Emanuel PO, Phelps RG. Metastatic Crohn’s disease: a histopathologic study of 12 cases. J Cutan Pathol 2008; 35(5):457–461. doi:10.1111/j.1600-0560.2007.00849.x
- Hackzell-Bradley M, Hedblad MA, Stephansson EA. Metastatic Crohn’s disease: report of 3 cases with special reference to histopathologic findings. Arch Dermatol 1996; 132(8):928–932.

USPSTF BRCA testing recs: 2 more groups require attention
Reference
1. US Preventive Services Task Force. Risk assessment, genetic counseling, and genetic testing for BRCA-related cancer. JAMA. 2019;322:652-665.
Reference
1. US Preventive Services Task Force. Risk assessment, genetic counseling, and genetic testing for BRCA-related cancer. JAMA. 2019;322:652-665.
Reference
1. US Preventive Services Task Force. Risk assessment, genetic counseling, and genetic testing for BRCA-related cancer. JAMA. 2019;322:652-665.

AF risk is elevated after early-stage breast cancer diagnosis
Women with early-stage breast cancer are at elevated risk for atrial fibrillation (AF) short term and, to a lesser extent, long term, finds a large Canadian cohort study. Risk was higher for those who had received chemotherapy but not tied to specific cardiotoxic drugs or drug classes.
“Cardiovascular disease is a particularly pertinent clinical concern for women diagnosed with early-stage breast cancer,” note the investigators, led by Husam Abdel-Qadir, MD, PhD, FRCPC, Cardiology Clinic, Women’s College Hospital, Toronto. “Many early-stage breast cancer survivors are older than 65 years and have hypertension, diabetes, or left ventricular dysfunction. Accordingly, a diagnosis of AF would translate to a clinically relevant stroke risk for many early-stage breast cancer survivors.”
The investigators undertook a population-based retrospective cohort study of women in the province of Ontario with stage I-III breast cancer diagnosed between April 2007 and December 2016, matching them 1:3 to cancer-free control women on birth year and receipt of breast imaging.
An initial analysis, based on 95,539 breast cancer patients and 217,456 cancer-free controls, showed that the former and latter groups did not differ significantly on the prevalence of preexisting AF (5.3% vs. 5.2%; P = .21), according to results reported in JAMA Network Open.
Main analyses excluded women with preexisting AF, leaving 68,113 breast cancer patients and 204,330 cancer-free controls having a mean follow-up of 5.7 years. Both groups had a mean age of 60 years at baseline, and prevalences of cardiovascular comorbidities were similar. Within the breast cancer group, 50.4% had left-sided disease; overall, 53.2% received chemotherapy and 71.7% received radiation therapy.
At 10 years after diagnosis, breast cancer patients had a small but significant increase in AF incidence relative to control peers (7.4% vs. 6.8%; P less than .001). When the investigators looked at specific time periods, survivors had a significantly elevated AF risk in year 1 postdiagnosis (hazard ratio, 2.16) and after year 5 postdiagnosis (hazard ratio, 1.20), but not during years 2 through 5.
Analyses beginning 1 year after diagnosis showed a slightly smaller but still significant elevation of AF incidence for the breast cancer group at 9 years of follow-up (10 years after diagnosis) (7.0% vs. 6.5%; P less than .001).
Among breast cancer patients, those who received chemotherapy had a higher risk of AF than those who did not (adjusted hazard ratio, 1.23); however, this elevation of risk was not specifically tied to receipt of anthracyclines or trastuzumab (Herceptin) versus other chemotherapy. Risk was not elevated for those who received radiation therapy.
“Our study findings suggest that a diagnosis of early-stage breast cancer may be associated with a small increase in the risk of AF compared with that for cancer-free women,” Dr. Abdel-Qadir and coinvestigators noted. “Since the absolute risk is small, this finding does not warrant routine surveillance but rather should prompt consideration of AF in the differential diagnosis for women with compatible symptoms.
“The early and late periods of increased AF risk in early-stage breast cancer survivors warrant focused research to better understand the underlying causes and subsequent implications,” they concluded.
Dr. Abdel-Qadir reported receiving grants from the Canadian Cardiovascular Society during the conduct of the study, speaker fees from Amgen, and an honorarium for clinical events adjudication committee membership from the Canadian Vigour Centre for a study funded by AstraZeneca. The study was funded by the Canadian Cardiovascular Society Atrial Fibrillation Research Award.
SOURCE: Abdel-Qadir H et al. JAMA Netw Open. 2019 Sep 4;2(9):e1911838.
FROM JAMA NETWORK OPEN
Early maternal anxiety tied to adolescent hyperactivity
COPENHAGEN – Exposure to maternal somatic anxiety during pregnancy and toddlerhood increases a child’s risk of hyperactivity symptoms in adolescence, Blanca Bolea, MD, said at the annual congress of the European College of Neuropsychopharmacology.

In contrast, the children of mothers who were anxious were not at increased risk for subsequent inattention symptoms in an analysis of 8,725 mothers and their children participating in the Avon Longitudinal Study of Parents and Children, a prospective epidemiologic cohort study ongoing in southwest England since 1991, said Dr. Bolea, a psychiatrist at the University of Toronto.
These findings have practical implications for clinical care: “If we know that women who are anxious in the perinatal period put their children at risk for hyperactivity later on, then we can tackle their anxiety in pregnancy or toddlerhood. And that’s easy to do: You can do group [cognitive-behavioral therapy]; you can give medications, so there are things you can do to reduce that risk. That’s relevant, because we don’t know much about how to reduce levels of ADHD. We know it has a genetic component, but we can’t touch that. You cannot change your genes, so far. But environmental things, we can change. So if we can identify the mothers who are more anxious during pregnancy and toddlerhood and give them resources to reduce their anxiety, then we can potentially reduce hyperactivity later on,” she explained in an interview.
In the Avon study, maternal anxiety was serially assessed from early pregnancy up until a child’s 5th birthday.
“We looked for maternal symptoms similar to panic disorder: shortness of breath, dizziness, sweating, things like that. These are symptoms that any clinician can identify by asking the mothers, so it’s not hard to identify the mothers who could be at risk,” according to the psychiatrist.
Children in the Avon study were assessed for symptoms of inattention at age 8.5 years using the Sky Search, Sky Search Dual Test, and Opposite Worlds subtests of the Tests of Everyday Attention for Children. Hyperactivity symptoms were assessed at age 16 years via the Strengths and Difficulties Questionnaire.
In an analysis adjusted for potentially confounding sociodemographic factors, adolescents whose mothers were rated by investigators as having moderate or high somatic anxiety during pregnancy and the toddlerhood years were at 2.1-fold increased risk of hyperactivity symptoms compared to those whose mothers had low or no anxiety, but increased maternal anxiety wasn’t associated with scores on any of the three tests of inattention.
Dr. Bolea cautioned that, while these Avon study findings document an association between early maternal anxiety and subsequent adolescent hyperactivity, that doesn’t prove causality. The findings are consistent, however, with the fetal origins hypothesis put forth by the late British epidemiologist David J. Barker, MD, PhD, which postulates that stressful fetal circumstances have profound effects later in life.
she said.
The hypothesis has been borne out in animal studies: Stress a pregnant rat, and her offspring will display hyperactivity.
Dr. Bolea reported having no financial conflicts regarding her study. The Avon Longitudinal Study of Parents and Children is funded by the Medical Research Council and the Wellcome Trust.
COPENHAGEN – Exposure to maternal somatic anxiety during pregnancy and toddlerhood increases a child’s risk of hyperactivity symptoms in adolescence, Blanca Bolea, MD, said at the annual congress of the European College of Neuropsychopharmacology.
In contrast, the children of mothers who were anxious were not at increased risk for subsequent inattention symptoms in an analysis of 8,725 mothers and their children participating in the Avon Longitudinal Study of Parents and Children, a prospective epidemiologic cohort study ongoing in southwest England since 1991, said Dr. Bolea, a psychiatrist at the University of Toronto.
These findings have practical implications for clinical care: “If we know that women who are anxious in the perinatal period put their children at risk for hyperactivity later on, then we can tackle their anxiety in pregnancy or toddlerhood. And that’s easy to do: You can do group [cognitive-behavioral therapy]; you can give medications, so there are things you can do to reduce that risk. That’s relevant, because we don’t know much about how to reduce levels of ADHD. We know it has a genetic component, but we can’t touch that. You cannot change your genes, so far. But environmental things, we can change. So if we can identify the mothers who are more anxious during pregnancy and toddlerhood and give them resources to reduce their anxiety, then we can potentially reduce hyperactivity later on,” she explained in an interview.
In the Avon study, maternal anxiety was serially assessed from early pregnancy up until a child’s 5th birthday.
“We looked for maternal symptoms similar to panic disorder: shortness of breath, dizziness, sweating, things like that. These are symptoms that any clinician can identify by asking the mothers, so it’s not hard to identify the mothers who could be at risk,” according to the psychiatrist.
Children in the Avon study were assessed for symptoms of inattention at age 8.5 years using the Sky Search, Sky Search Dual Test, and Opposite Worlds subtests of the Tests of Everyday Attention for Children. Hyperactivity symptoms were assessed at age 16 years via the Strengths and Difficulties Questionnaire.
In an analysis adjusted for potentially confounding sociodemographic factors, adolescents whose mothers were rated by investigators as having moderate or high somatic anxiety during pregnancy and the toddlerhood years were at 2.1-fold increased risk of hyperactivity symptoms compared to those whose mothers had low or no anxiety, but increased maternal anxiety wasn’t associated with scores on any of the three tests of inattention.
Dr. Bolea cautioned that, while these Avon study findings document an association between early maternal anxiety and subsequent adolescent hyperactivity, that doesn’t prove causality. The findings are consistent, however, with the fetal origins hypothesis put forth by the late British epidemiologist David J. Barker, MD, PhD, which postulates that stressful fetal circumstances have profound effects later in life.
she said.
The hypothesis has been borne out in animal studies: Stress a pregnant rat, and her offspring will display hyperactivity.
Dr. Bolea reported having no financial conflicts regarding her study. The Avon Longitudinal Study of Parents and Children is funded by the Medical Research Council and the Wellcome Trust.
REPORTING FROM ECNP 2019