User login
Official news magazine of the Society of Hospital Medicine
Copyright by Society of Hospital Medicine or related companies. All rights reserved. ISSN 1553-085X
nav[contains(@class, 'nav-ce-stack nav-ce-stack__large-screen')]
header[@id='header']
div[contains(@class, 'header__large-screen')]
div[contains(@class, 'read-next-article')]
div[contains(@class, 'main-prefix')]
div[contains(@class, 'nav-primary')]
nav[contains(@class, 'nav-primary')]
section[contains(@class, 'footer-nav-section-wrapper')]
footer[@id='footer']
section[contains(@class, 'nav-hidden')]
div[contains(@class, 'ce-card-content')]
nav[contains(@class, 'nav-ce-stack')]
div[contains(@class, 'view-medstat-quiz-listing-panes')]
div[contains(@class, 'pane-article-sidebar-latest-news')]
div[contains(@class, 'pane-pub-article-hospitalist')]

The evolution of social media and visual abstracts in hospital medicine
In recent years, social media platforms like Twitter, Facebook, and Instagram have become popular gathering spots for clinicians to connect, engage, and share medical content. Medical journals, which often act as purveyors of this content, have recognized social media’s growing power and influence and have begun looking for ways to better engage their audiences.

In 2016, the Annals of Surgery was looking to better disseminate the work being published in its pages and looked to Twitter as one way of accomplishing this. At the time, most journals were only posting the title or a brief description of the published manuscript and hoping their Twitter followers would click on the article link. As journal editors were finding, if the audience was not immediately familiar with the topic or able to quickly capture the nuances of the study, there was a good chance the reader would continue to scroll past the post and never view the article.
Recognizing that social media heavily relies on visual material to garner attention, Annals turned to Andrew Ibrahim, MD, an architect turned surgeon, to help them rethink their social media strategy. Using the design training he had previously received in his career as an architect, Dr. Ibrahim created a simple visual tool that could be used to capture the often complicated and nuanced aspects of a research study. He called his creation a “visual abstract.”
But what is a visual abstract? Simply, they are visual representations of the key findings of a published manuscript; or put another way, a “movie trailer” to the full manuscript. While they can take many different forms and designs, they often consist of three key components: (1) a simple, easy to understand title, (2) a primary focus on outcomes, and (3) the use of visual cues or images to help the reader absorb and remember the take home message. This simplified delivery of complex information allows the producer to efficiently share complex findings in a format that allows for rapid visualization and interpretation.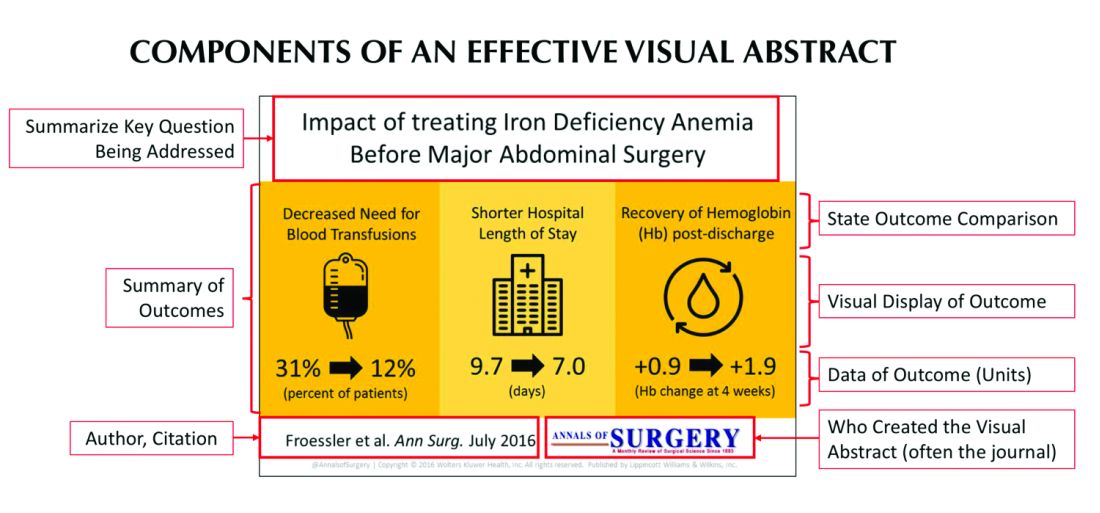
Since its inception, several studies have examined the influence visual abstracts have on disseminating research. One study conducted by Dr. Ibrahim and his colleagues found that articles tweeted with a visual abstract had an almost eightfold increase in the number of Twitter impressions (a measure of social media dissemination) and a threefold increase in article visits, compared with those manuscripts tweeted with the article title only.1 These results reflect what behavioral scientists have long understood: Humans process visual data better than any other type of data.2 For instance, according to research compiled by 3M, the company behind popular sticky notes, visual data is processed 60,000 times faster than text and has been shown to improve learning by 400%.3 Likewise, digital marketers have found that pages with videos and images draw on average 94% more views than their text-only counterparts.4
This knowledge, along with the substantial difference in engagement and dissemination characteristics from Dr. Ibrahim’s study, was far beyond what anyone might have expected and started a trend in medicine that continues to grow today. Medical journals across all practices and disciplines, including several leading journals, such as the New England Journal of Medicine, the Journal of the American Medical Association, and the Journal of Hospital Medicine (JHM), are utilizing this new tool to help disseminate their work in social media.
Visual abstracts have expanded beyond the social media sphere and are now frequently used in Grand Rounds presentations and as teaching tools among medical educators. JHM was one of the first journals to adopt the use of visual abstracts and has since published more than 150 in total. Given the growing popularity and expanded use of visual abstracts, JHM recently began archiving them on the journal’s website to allow clinicians to use the material in their own creative ways.
Visual abstracts are just one piece of the growing enterprise in social media for JHM. Recognizing the growing utilization of social media among physicians, JHM has taken a leading role in the use of online journal clubs. Since 2014, JHM has run a monthly Twitter-based journal club that discusses recently published articles and hospital medicine–based topics, called #JHMChat.5 This forum has allowed hospitalists from across the country, and around the world, to connect, network, and engage around topics important to the field of hospital medicine. The journal frequently reaches beyond hospital medicine borders and partners with other specialties and interest groups to gain perspective and insights into shared topic areas. To date, #JHMChat has one of the most robust online communities and continues to attract new followers each month.
As social media use continues to expand among clinicians, engagement tools like visual abstracts and Twitter chats will certainly continue to grow. Given that more clinicians are scrolling through websites than flipping through journal pages, medical journals like JHM will continually look for novel ways to engage their audiences and create communities among their followers. While a former architect who now practices as a surgeon led the way with visual abstracts, it remains to be seen who will create the next tool used to capture our attention on the ever-evolving sphere of social media.
Dr. Wray is a hospitalist at the University of California, San Francisco, and the San Francisco Veterans Affairs Medical Center. He also serves as a digital media and associate editor for the Journal of Hospital Medicine.
References
1. Ibrahim AM et al. Visual abstracts to disseminate research on social media: A prospective, case-control crossover study. Ann Surg. 2017;266(6):e46.
2. Tufte ER. The Visual Display of Quantitative Information. Second edition. Cheshire, Conn. Graphics Press, 2001. https://search.library.wisc.edu/catalog/999913808702121.
3. Polishing Your Presentation. http://web.archive.org/web/20001014041642/http://www.3m.com:80/meetingnetwork/files/meetingguide_pres.pdf. Accessed May 28, 2017.
4. 7 reasons you need visual content in your marketing strategy. https://medium.com/@nikos_iliopoulos/7-reasons-you-need-visual-content-in-your-marketing-strategy-bc77ca5521ac. Accessed May 28, 2017.
5. Wray CM et al. The adoption of an online journal club to improve research dissemination and social media engagement among hospitalists. J Hosp Med. 2018. doi: 10.12788/jhm.2987.
In recent years, social media platforms like Twitter, Facebook, and Instagram have become popular gathering spots for clinicians to connect, engage, and share medical content. Medical journals, which often act as purveyors of this content, have recognized social media’s growing power and influence and have begun looking for ways to better engage their audiences.
In 2016, the Annals of Surgery was looking to better disseminate the work being published in its pages and looked to Twitter as one way of accomplishing this. At the time, most journals were only posting the title or a brief description of the published manuscript and hoping their Twitter followers would click on the article link. As journal editors were finding, if the audience was not immediately familiar with the topic or able to quickly capture the nuances of the study, there was a good chance the reader would continue to scroll past the post and never view the article.
Recognizing that social media heavily relies on visual material to garner attention, Annals turned to Andrew Ibrahim, MD, an architect turned surgeon, to help them rethink their social media strategy. Using the design training he had previously received in his career as an architect, Dr. Ibrahim created a simple visual tool that could be used to capture the often complicated and nuanced aspects of a research study. He called his creation a “visual abstract.”
But what is a visual abstract? Simply, they are visual representations of the key findings of a published manuscript; or put another way, a “movie trailer” to the full manuscript. While they can take many different forms and designs, they often consist of three key components: (1) a simple, easy to understand title, (2) a primary focus on outcomes, and (3) the use of visual cues or images to help the reader absorb and remember the take home message. This simplified delivery of complex information allows the producer to efficiently share complex findings in a format that allows for rapid visualization and interpretation.
Since its inception, several studies have examined the influence visual abstracts have on disseminating research. One study conducted by Dr. Ibrahim and his colleagues found that articles tweeted with a visual abstract had an almost eightfold increase in the number of Twitter impressions (a measure of social media dissemination) and a threefold increase in article visits, compared with those manuscripts tweeted with the article title only.1 These results reflect what behavioral scientists have long understood: Humans process visual data better than any other type of data.2 For instance, according to research compiled by 3M, the company behind popular sticky notes, visual data is processed 60,000 times faster than text and has been shown to improve learning by 400%.3 Likewise, digital marketers have found that pages with videos and images draw on average 94% more views than their text-only counterparts.4
This knowledge, along with the substantial difference in engagement and dissemination characteristics from Dr. Ibrahim’s study, was far beyond what anyone might have expected and started a trend in medicine that continues to grow today. Medical journals across all practices and disciplines, including several leading journals, such as the New England Journal of Medicine, the Journal of the American Medical Association, and the Journal of Hospital Medicine (JHM), are utilizing this new tool to help disseminate their work in social media.
Visual abstracts have expanded beyond the social media sphere and are now frequently used in Grand Rounds presentations and as teaching tools among medical educators. JHM was one of the first journals to adopt the use of visual abstracts and has since published more than 150 in total. Given the growing popularity and expanded use of visual abstracts, JHM recently began archiving them on the journal’s website to allow clinicians to use the material in their own creative ways.
Visual abstracts are just one piece of the growing enterprise in social media for JHM. Recognizing the growing utilization of social media among physicians, JHM has taken a leading role in the use of online journal clubs. Since 2014, JHM has run a monthly Twitter-based journal club that discusses recently published articles and hospital medicine–based topics, called #JHMChat.5 This forum has allowed hospitalists from across the country, and around the world, to connect, network, and engage around topics important to the field of hospital medicine. The journal frequently reaches beyond hospital medicine borders and partners with other specialties and interest groups to gain perspective and insights into shared topic areas. To date, #JHMChat has one of the most robust online communities and continues to attract new followers each month.
As social media use continues to expand among clinicians, engagement tools like visual abstracts and Twitter chats will certainly continue to grow. Given that more clinicians are scrolling through websites than flipping through journal pages, medical journals like JHM will continually look for novel ways to engage their audiences and create communities among their followers. While a former architect who now practices as a surgeon led the way with visual abstracts, it remains to be seen who will create the next tool used to capture our attention on the ever-evolving sphere of social media.
Dr. Wray is a hospitalist at the University of California, San Francisco, and the San Francisco Veterans Affairs Medical Center. He also serves as a digital media and associate editor for the Journal of Hospital Medicine.
References
1. Ibrahim AM et al. Visual abstracts to disseminate research on social media: A prospective, case-control crossover study. Ann Surg. 2017;266(6):e46.
2. Tufte ER. The Visual Display of Quantitative Information. Second edition. Cheshire, Conn. Graphics Press, 2001. https://search.library.wisc.edu/catalog/999913808702121.
3. Polishing Your Presentation. http://web.archive.org/web/20001014041642/http://www.3m.com:80/meetingnetwork/files/meetingguide_pres.pdf. Accessed May 28, 2017.
4. 7 reasons you need visual content in your marketing strategy. https://medium.com/@nikos_iliopoulos/7-reasons-you-need-visual-content-in-your-marketing-strategy-bc77ca5521ac. Accessed May 28, 2017.
5. Wray CM et al. The adoption of an online journal club to improve research dissemination and social media engagement among hospitalists. J Hosp Med. 2018. doi: 10.12788/jhm.2987.
‘Momentous’ USMLE change: New pass/fail format stuns medicine
News that the United States Medical Licensing Examination (USMLE) program will change its Step 1 scoring from a 3-digit number to pass/fail starting Jan. 1, 2022, has set off a flurry of shocked responses from students and physicians.
J. Bryan Carmody, MD, MPH, an assistant professor at Eastern Virginia Medical School in Norfolk, said in an interview that he was “stunned” when he heard the news on Wednesday and said the switch presents “the single biggest opportunity for medical school education reform since the Flexner Report,” which in 1910 established standards for modern medical education.
Numbers will continue for some tests
The USMLE cosponsors – the Federation of State Medical Boards (FSMB) and the National Board of Medical Examiners (NBME) – said that the Step 2 Clinical Knowledge (CK) exam and Step 3 will continue to be scored numerically. Step 2 Clinical Skills (CS) will continue its pass/fail system.
The change was made after Step 1 had been roundly criticized as playing too big a role in the process of becoming a physician and for causing students to study for the test instead of engaging fully in their medical education.
Ramie Fathy, a third-year medical student at the University of Pennsylvania, Philadelphia, currently studying for Step 1, said in an interview that it would have been nice personally to have the pass/fail choice, but he predicts both good and unintended consequences in the change.
The positive news, Mr. Fathy said, is that less emphasis will be put on the Step 1 test, which includes memorizing basic science details that may or not be relevant depending on later specialty choice.
“It’s not necessarily measuring what the test makers intended, which was whether or not a student can understand and apply basic science concepts to the practice of medicine,” he said.
“The current system encourages students to get as high a score as possible, which – after a certain point – translates to memorizing many little details that become increasingly less practically relevant,” Mr. Fathy said.
Pressure may move elsewhere?
However, Mr. Fathy worries that, without a scoring system to help decide who stands out in Step 1, residency program directors will depend more on the reputation of candidates’ medical school and the clout of the person writing a letter of recommendation – factors that are often influenced by family resources and social standing. That could wedge a further economic divide into the path to becoming a physician.
Mr. Fathy said he and fellow students are watching for information on what the passing bar will be and what happens with Step 2 Clinical Knowledge exam. USMLE has promised more information as soon as it is available.
“The question is whether that test will replace Step 1 as the standardized metric of student competency,” Mr. Fathy said, which would put more pressure on students further down the medical path.
Will Step 2 anxiety increase?
Dr. Carmody agreed that there is the danger that students now will spend their time studying for Step 2 CK at the expense of other parts of their education.
Meaningful reform will depend on the pass/fail move being coupled with other reforms, most importantly application caps, said Dr. Carmody, who teaches preclinical medical students and works with the residency program.
He has been blogging about Step 1 pass/fail for the past year.
Currently students can apply for as many residencies as they can pay for and Carmody said the number of applications per student has been rising over the past decade.
“That puts program directors under an impossible burden,” he said. “With our Step 1-based system, there’s significant inequality in the number of interviews people get. Programs end up overinviting the same group of people who look good on paper.”
People outside that group respond by sending more applications than they need to just to get a few interviews, Dr. Carmody added.
With caps, students would have an incentive to apply to only those programs in which they had a sincere interest, he said. Program directors also would then be better able to evaluate each application.
Switching Step 1 to pass/fail may have some effect on medical school burnout, Dr. Carmody said.
“It’s one thing to work hard when you’re on call and your patients depend on it,” he said. “But I would have a hard time staying up late every night studying something that I know in my heart is not going to help my patients, but I have to do it because I have to do better than the person who’s studying in the apartment next to me.”
Test has strayed from original purpose
Joseph Safdieh, MD, an assistant dean for clinical curriculum and director of the medical student neurology clerkship for the Weill Cornell Medicine, New York, sees the move as positive overall.
“We should not be using any single metric to define or describe our students’ overall profile,” he said in an interview.
“This has been a very significant anxiety point for our medical students for quite a number of years,” Dr. Safdieh said. “They were frustrated that their entire 4 years of medical school seemingly came down to one number.”
The test was created originally as one of three parts of licensure, he pointed out.
“Over the past 10 or 15 years, the exam has morphed to become a litmus test for very specific residency programs,” he said.
However, Dr. Safdieh has concerns that Step 2 will cultivate the same anxiety and may get too big a spotlight without the Step 1 metric, “although one could argue that test does more accurately reflect clinical material,” he said.
He also worries that students who have selected a specialty by the time they take Step 2 may find late in the game that they are less competitive in their field than they thought they were and may have to make a last-minute switch.
Dr. Safdieh said he thinks Step 2 will be next to go the pass/fail route. In reading between the lines of the announcement, he believes the test cosponsors didn’t make both pass/fail at once because it would have been “a nuclear bomb to the system.”
He credited the cosponsors with making what he called a “bold and momentous decision to initiate radical change in the overall transition between undergraduate and graduate medical education.”
Dr. Safdieh added that few in medicine were expecting Wednesday’s announcement.
“I think many of us were expecting them to go to quartile grading, not to go this far,” he said.
Dr. Safdieh suggested that, among those who may see downstream effects from the pass/fail move are offshore schools, such as those in the Caribbean. “Those schools rely on Step 1 to demonstrate that their students are meeting the rigor,” he said. But he hopes that this will lead to more holistic review.
“We’re hoping that this will force change in the system so that residency directors will look at more than just test-taking ability. They’ll look at publications and scholarship, community service and advocacy and performance in medical school,” Dr. Safdieh said.
Alison J. Whelan, MD, chief medical education officer of the Association of American Medical Colleges said in a statement, “The transition from medical school to residency training is a matter of great concern throughout academic medicine.
“The decision by the NBME and FSMB to change USMLE Step 1 score reporting to pass/fail was very carefully considered to balance student learning and student well-being,” she said. “The medical education community must now work together to identify and implement additional changes to improve the overall UME-GME [undergraduate and graduate medical education] transition system for all stakeholders and the AAMC is committed to helping lead this work.”
Dr. Fathy, Dr. Carmody, and Dr. Safdieh have disclosed no relevant financial relationships.
This article first appeared on Medscape.com.
Critical care admissions up for pediatric opioid poisonings
ORLANDO – The proportion of children and adolescents admitted to critical care for serious poisonings has increased in recent years, according to authors of a study of more than 750,000 reported opioid exposures.

Critical care units were involved in 10% of pediatric opioid poisoning cases registered in 2015-2018, up from 7% in 2005-2009, reported Megan E. Land, MD, of Emory University, Atlanta, and coinvestigators.
Attempted suicide has represented an increasingly large proportion of pediatric opioid poisonings from 2005 to 2018, according to the researchers, based on retrospective analysis of cases reported to U.S. poison centers.
Mortality related to these pediatric poisonings increased over time, and among children and adolescents admitted to a pediatric ICU, CPR and naloxone use also increased over time, Dr. Land and associates noted.
These said Dr. Land, who presented the findings at the Critical Care Congress sponsored by the Society of Critical Care Medicine.
“I think that this really requires a two-pronged approach,” she explained. “One is that we need to increase mental health resources for kids to address adolescent suicidality, and secondly, we need to decrease access to opioids in the hands of pediatric patients by decreasing prescribing and then also getting those that are unused out of the homes.”
Jeffrey Zimmerman, MD, past president of SCCM, said these findings on pediatric opioid poisonings represent the “iceberg tip” of a much larger societal issue that has impacts well beyond critical care.
“I think acutely, we’re well equipped to deal with the situation in terms of interventions,” Dr. Zimmerman said in an interview. “The bigger issue is dealing with what happens afterward, when the patient leaves the ICU in the hospital.”
When the issue is chronic opioid use among adolescents or children, critical care specialists can help by initiating opioid tapering in the hospital setting, rather than allowing the complete weaning process to play out at home, he said.
All clinicians can help prevent future injury by asking questions of the child and family to ensure that any opiates and other prescription medications at home are locked up, he added.
“These aren’t very glamorous things, but they’re common sense, and there’s more need for this common sense now than there ever has been,” Dr. Zimmerman concluded.
The study by Dr. Land and colleagues included data on primary opioid ingestions registered at 55 poison control centers in the United States. They assessed trends over three time periods: 2005-2009, 2010-2014, and 2015-2018.
They found that children under 19 years of age accounted for 28% of the 753,592 opioid poisonings reported over that time period.
The overall number of reported opioid poisonings among children declined somewhat since about 2010. However, the proportion admitted to a critical care unit increased from 7% in the 2005-2009 period to 10% in the 2015-2018 period, said Dr. Land, who added that the probability of a moderate or major effect increased by 0.55% and 0.11% per year, respectively, over the 14 years studied.
Mortality – 0.21% overall – increased from 0.18% in the earliest era to 0.28% in the most recent era, according to the investigators.
Suicidal intent increased from 14% in the earliest era to 21% in the most recent era, and was linked to near tenfold odds of undergoing a pediatric ICU procedure, Dr. Land and colleagues reported.
Among those children admitted to a pediatric ICU, use of CPR increased from 1% to 3% in the earliest and latest time periods, respectively; likewise, naloxone administration increased from 42% to 51% over those two time periods. By contrast, there was no change in use of mechanical ventilation (12%) or vasopressors (3%) over time, they added.
The opioids most commonly linked to pediatric ICU procedures were fentanyl (odds ratio, 12), heroin (OR, 11), and methadone (OR, 15).
Some funding for the study came from the Georgia Poison Center. Dr. Land had no disclosures relevant to the research.
SOURCE: Land M et al. Crit Care Med. 2020 doi: 10.1097/01.ccm.0000618708.38414.ea.
ORLANDO – The proportion of children and adolescents admitted to critical care for serious poisonings has increased in recent years, according to authors of a study of more than 750,000 reported opioid exposures.
Critical care units were involved in 10% of pediatric opioid poisoning cases registered in 2015-2018, up from 7% in 2005-2009, reported Megan E. Land, MD, of Emory University, Atlanta, and coinvestigators.
Attempted suicide has represented an increasingly large proportion of pediatric opioid poisonings from 2005 to 2018, according to the researchers, based on retrospective analysis of cases reported to U.S. poison centers.
Mortality related to these pediatric poisonings increased over time, and among children and adolescents admitted to a pediatric ICU, CPR and naloxone use also increased over time, Dr. Land and associates noted.
These said Dr. Land, who presented the findings at the Critical Care Congress sponsored by the Society of Critical Care Medicine.
“I think that this really requires a two-pronged approach,” she explained. “One is that we need to increase mental health resources for kids to address adolescent suicidality, and secondly, we need to decrease access to opioids in the hands of pediatric patients by decreasing prescribing and then also getting those that are unused out of the homes.”
Jeffrey Zimmerman, MD, past president of SCCM, said these findings on pediatric opioid poisonings represent the “iceberg tip” of a much larger societal issue that has impacts well beyond critical care.
“I think acutely, we’re well equipped to deal with the situation in terms of interventions,” Dr. Zimmerman said in an interview. “The bigger issue is dealing with what happens afterward, when the patient leaves the ICU in the hospital.”
When the issue is chronic opioid use among adolescents or children, critical care specialists can help by initiating opioid tapering in the hospital setting, rather than allowing the complete weaning process to play out at home, he said.
All clinicians can help prevent future injury by asking questions of the child and family to ensure that any opiates and other prescription medications at home are locked up, he added.
“These aren’t very glamorous things, but they’re common sense, and there’s more need for this common sense now than there ever has been,” Dr. Zimmerman concluded.
The study by Dr. Land and colleagues included data on primary opioid ingestions registered at 55 poison control centers in the United States. They assessed trends over three time periods: 2005-2009, 2010-2014, and 2015-2018.
They found that children under 19 years of age accounted for 28% of the 753,592 opioid poisonings reported over that time period.
The overall number of reported opioid poisonings among children declined somewhat since about 2010. However, the proportion admitted to a critical care unit increased from 7% in the 2005-2009 period to 10% in the 2015-2018 period, said Dr. Land, who added that the probability of a moderate or major effect increased by 0.55% and 0.11% per year, respectively, over the 14 years studied.
Mortality – 0.21% overall – increased from 0.18% in the earliest era to 0.28% in the most recent era, according to the investigators.
Suicidal intent increased from 14% in the earliest era to 21% in the most recent era, and was linked to near tenfold odds of undergoing a pediatric ICU procedure, Dr. Land and colleagues reported.
Among those children admitted to a pediatric ICU, use of CPR increased from 1% to 3% in the earliest and latest time periods, respectively; likewise, naloxone administration increased from 42% to 51% over those two time periods. By contrast, there was no change in use of mechanical ventilation (12%) or vasopressors (3%) over time, they added.
The opioids most commonly linked to pediatric ICU procedures were fentanyl (odds ratio, 12), heroin (OR, 11), and methadone (OR, 15).
Some funding for the study came from the Georgia Poison Center. Dr. Land had no disclosures relevant to the research.
SOURCE: Land M et al. Crit Care Med. 2020 doi: 10.1097/01.ccm.0000618708.38414.ea.
REPORTING FROM CCC49
When is a troponin elevation an acute myocardial infarction?
Misdiagnosis can have ‘downstream repercussions’
Hospitalists encounter troponin elevations daily, but we have to use clinical judgment to determine if the troponin elevation represents either a myocardial infarction (MI), or a non-MI troponin elevation (i.e. a , nonischemic myocardial injury).
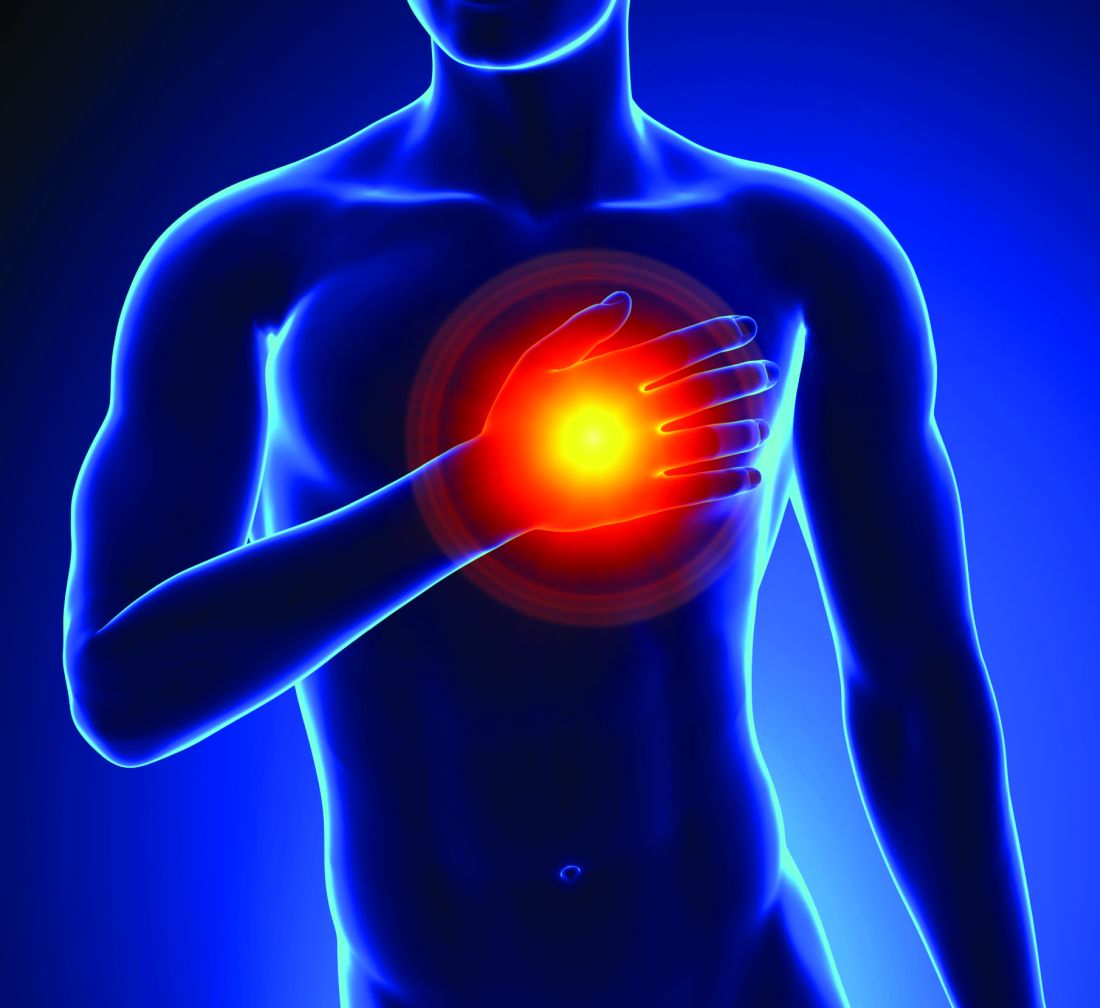
It is important to remember that an MI specifically refers to myocardial injury due to acute myocardial ischemia to the myocardium. This lack of blood supply can be due to an acute absolute or relative deficiency in coronary artery blood flow. However, there are also many mechanisms of myocardial injury unrelated to reduced coronary artery blood flow, and these should be more appropriately termed non-MI troponin elevations.

Historically, when an ischemic mechanism of myocardial injury was suspected, providers would categorize troponin elevations into ST-elevation MI (STEMI) versus non-ST-elevation MI (NSTEMI) based on the electrocardiogram (ECG). We would further classify the NSTEMI into type 1 or type 2, depending on the mechanism of injury. The term “NSTEMI” served as a “catch-all” term to describe both type 1 NSTEMIs and type 2 MIs, but that classification system is no longer valid.

As of Oct. 1, 2017, ICD-10 and the Centers for Medicare & Medicaid Services have a new ICD-10 diagnosis code for type 2 MI (I21.A1), distinct from NSTEMI (I21.4) based on updated definitions from the American College of Cardiology, American Heart Association, European Society of Cardiology, and World Heart Federation. The term “NSTEMI” should be used only when referring to a type 1 MI not when referring to a type 2 MI.1
Classification of MI types
The Fourth Universal Definition of MI published in August 2018 further updated the definitions of MI (summarized in Figure 1).2 This review focuses on type 1 and type 2 MIs, which are the most common types encountered by hospitalists. Types 3-5 MI (grouped under a common ICD-10 diagnosis code for “Other MI Types,” or I21.A9) would rarely be diagnosed by hospitalists.
Figure 1: Classification of MI
MI Type | Classification |
1 | STEMI (acute coronary artery thrombosis) |
2 | Supply/demand mismatch (heterogeneous underlying causes) |
3 | Sudden cardiac death with ECG evidence of acute myocardial ischemia before cardiac troponins could be drawn |
4 | MI due to percutaneous coronary intervention (PCI) |
5 | MI due to coronary artery bypass grafting (CABG) |
The diagnosis of a type 1 MIs (STEMI and NSTEMI) is supported by the presence of an acute coronary thrombus or plaque rupture/erosion on coronary angiography or a strong suspicion for these when angiography is unavailable or contraindicated. Type 1 MI (also referred to as spontaneous MI) is generally a primary reason (or “principal” diagnosis) for a patient’s presentation to a hospital.3 Please note that a very high or rising troponin level alone is not diagnostic for a type 1 or type 2 NSTEMI. The lab has to be taken in the context of the patient’s presentation and other supporting findings.
In contrast to a type 1 MI (STEMI and NSTEMI), at type 2 MI results from an imbalance between myocardial oxygen supply and demand unrelated to acute coronary artery thrombosis or plaque rupture. A type 2 MI is a relative (as opposed to an absolute) deficiency in coronary artery blood flow triggered by an abrupt increase in myocardial oxygen demand, drop in myocardial blood supply, or both. In type 2 MI, myocardial injury occurs secondary to an underlying process, and therefore requires correct documentation of the underlying cause as well.
Common examples of underlying causes of type 2 MI include acute blood loss anemia (e.g. GI bleed), acute hypoxia (e.g. COPD exacerbation), shock states (cardiogenic, hypovolemic, hemorrhagic, or septic), coronary vasospasm (e.g. spontaneous), and bradyarrhythmias. Patients with type 2 MI often have a history of fixed obstructive coronary disease, which when coupled with the acute trigger facilitates the type 2 MI; however, underlying CAD is not always present.
Diagnosing a type 2 MI requires evidence of acute myocardial ischemia (Figure 2) with an elevated troponin but must also have at least one of the following:2
- Symptoms of acute myocardial ischemia such as typical chest pain.
- New ischemic ECG changes.
- Development of pathological Q waves.
- Imaging evidence of new loss of viable myocardium, significant reversible perfusion defect on nuclear imaging, or new regional wall motion abnormality in a pattern consistent with an ischemic etiology.
Distinguishing a type 1 NSTEMI from a type 2 MI depends mainly on the clinical context and clinical judgment. A patient whose presenting symptoms include acute chest discomfort, acute ST-T wave changes, and a rise in troponin would be suspected of having a type 1 NSTEMI. However, in a patient presenting with other or vague complaints where an elevated troponin was found amongst a battery of tests, a type 2 MI may be favored, particularly if there is evidence of an underlying trigger for a supply-demand mismatch. In challenging cases, cardiology consultation can help determine the MI type and/or the next diagnostic and treatment considerations.
When there is only elevated troponin levels (or even a rise and fall in troponin) without new symptoms or ECG/imaging evidence of myocardial ischemia, it is most appropriate to document a non-MI troponin elevation due to a nonischemic mechanism of myocardial injury.
Non-MI troponin elevation (nonischemic myocardial injury)
The number of conditions known to cause myocardial injury through mechanisms other than myocardial ischemia (see Figure 2) is growing, especially in the current era of high-sensitivity troponin assays.4
Common examples of underlying causes of non-MI troponin elevation include:
- Acute (on chronic) systolic or diastolic heart failure: Usually due to acute ventricular wall stretch/strain. Troponin elevations tend to be mild, with more indolent (or even flat) troponin trajectories.
- Pericarditis and myocarditis: Due to direct injury from myocardial inflammation.
- Cardiopulmonary resuscitation (CPR): Due to physical injury to the heart from mechanical chest compressions and from electrical shocks of external defibrillation.
- Stress-induced (takotsubo) cardiomyopathy: Stress-induced release of neurohormonal factors and catecholamines that cause direct myocyte injury and transient dilatation of the ventricle.
- Acute pulmonary embolism: Result of acute right ventricular wall stretch/strain, not from myocardial ischemia.
- Sepsis without shock: Direct toxicity of circulating cytokines to cardiac myocytes. In the absence of evidence of shock and symptoms/signs of myocardial ischemia, do not document type 2 MI.
- Renal failure (acute kidney injury or chronic kidney disease): Multiple etiologies, but at least partially related to reduced renal clearance of troponin. In general, renal failure in the absence of symptoms/signs of ischemia is best classified as a non-MI troponin elevation. ESRD patients who present with volume overload due to missed dialysis also typically have a non-MI troponin elevation.
- Stroke/intracranial hemorrhage: Mechanisms of myocardial injury and troponin elevation are incompletely understood, but may include catecholamine surges that injure the heart.
Some underlying conditions can cause a type 2 MI or a non-MI troponin elevation depending on the clinical context. For example, hypertensive emergency, severe aortic valve stenosis, hypertrophic cardiomyopathy, and tachyarrhythmias (including atrial fibrillation with rapid ventricular response) may cause increased myocardial oxygen demand, and in patients with underlying CAD, could precipitate a type 2 MI.
However, these same conditions could cause a non-MI troponin elevation in patients without CAD and could also cause myocardial injury and troponin release by causing acute left ventricular stretch/strain. Distinguishing the diagnose of type 2 MI vs. non-MI troponin elevation depends on documenting whether there are ancillary ischemic symptoms, ECG findings, imaging, and/or cath findings of acute myocardial ischemia.
Case examples
1. A 60-year-old male presents with fever, cough, shortness of breath, and an infiltrate on CXR and is diagnosed with sepsis secondary to pneumonia. His initial troponin of 0.07 (normal < 0.05) rises to 0.11, peaks at 0.23, then subsequently trends down.
While some may be tempted to diagnose a type 2 MI, remember that sepsis can cause direct myocardial cell injury via direct cell toxicity. Unless this patient had at least one additional criteria (anginal chest pain, new ischemic ECG changes, or imaging evidence of new loss of viable myocardium, which does not recover with treatment of sepsis), this was most likely myocardial injury via direct cell toxicity, and should be documented as a non-MI troponin elevation due to sepsis without shock.
If there were ischemic ECG changes and the patient had chest pain, one would have to use clinical suspicion to differentiate between a type 1 NSTEMI and a type 2 MI. If there is a high clinical suspicion for an acute plaque rupture/thrombus, one would call it an NSTEMI and would have to document treatment as such (e.g. start heparin drip). Again, cardiology consultation can be helpful in cases where it may be hard to decide how to manage. Many times, the true mechanism is not determined until the patient is taken to the cath lab and if no acute plaque rupture is seen, then it was likely a type 2 MI.
2. A 70-year-old male with chronic systolic heart failure, noncompliant with medications, presents with 3 days of dyspnea on exertion and lower extremity edema. He had no chest discomfort. Exam shows bibasilar crackles and hepatojugular reflux. ECG shows no ischemic changes. Serial troponin values over 48 hours were: 0.48, 0.58, 0.51. A transthoracic echocardiogram reveals an LVEF of 40% with poor movement in the apex, similar to his prior echo.
This patient had no overt evidence of ischemia (no chest pain, ischemic ECG, or imaging changes) so the troponin elevation was most likely a non-MI troponin elevation secondary to acute on chronic systolic heart failure (in which the mechanism of troponin elevation is left ventricular chamber stretch from volume overload, and not demand ischemia). Generally, it is uncommon for a heart failure exacerbation to cause a type 2 MI.
Why is it so important to get this diagnosis right?
Misdiagnosing an MI when the patient does not have one can have multiple downstream repercussions. Because it stays on their medical record, it impacts their ability to get insurance and their premium costs. We expose patients to additional medications (e.g. dual antiplatelet therapy, statins), which can have adverse effects. As a result, it is very important to classify the etiology of the troponin elevation and treat accordingly.
Finally, when we incorrectly label a patient as having an MI, this can impact billing and reimbursement, DRG denials, insurance premiums, and quality metrics for both the hospital and the physicians. Hospitals’ 30-day readmission rates for AMI will suffer and quality metrics can be significantly impacted. We must be diligent and as precise as possible with our diagnoses and documentation to ensure the maximum benefit for our patients and our health care system.
Dr. Nave is assistant professor of medicine in the division of hospital medicine at Emory University, Atlanta. Dr. Goyal is associate professor of medicine (cardiology), at Emory University, and chief quality officer, Emory Heart and Vascular Center, Emory Healthcare. He is also codirector of nuclear cardiology at Emory University Hospital.
Key points
- A diagnosis of a type 1 MI is supported by evidence or strong suspicion of acute coronary artery thrombus or plaque rupture/erosion.
- A very high troponin level alone is not diagnostic for a type 1 or type 2 MI. It has to be contextualized with the patient’s presentation and other supporting findings.
- Type 2 MI is a mismatch between myocardial oxygen supply and demand unrelated to acute coronary thrombosis or plaque rupture triggered by an abrupt increase in myocardial oxygen demand, drop in myocardial blood supply, or both. Type 2 MI should be documented along with its underlying cause.
- To diagnose an MI (either type 1 or type 2 MI), in addition to the troponin elevation, the patient must have symptoms of acute ischemia, ischemic ECG findings, and/or imaging suggestive of new ischemia.
- An elevated troponin level without new symptoms or ECG/imaging evidence of myocardial ischemia should be documented as a non-MI troponin elevation secondary to an underlying cause.
References
1. Goyal A, Gluckman TJ, Tcheng JE. What’s in a name? The new ICD-10 (10th revision of the international statistical classification of diseases and related health problems) codes and type 2 myocardial infarction. Circulation. 2017;136:1180-2.
2. Thygesen K, Alpert JS, Jaffe AS, et al. Fourth universal definition of myocardial infarction (2018). J Am Coll Cardiol. 2018;Aug 25:[Epub ahead of print].
3. Goyal, et al. Translating the Fourth Universal Definition of Myocardial Infarction into Clinical Documentation: Ten Pearls For Frontline Clinicians. Cardiology Magazine. Nov 2018.
4. Roongsritong C, Warraich I, Bradley C. Common causes of troponin elevations in the absence of acute myocardial infarction: incidence and clinical significance. Chest. 2004;125:1877-84.
Misdiagnosis can have ‘downstream repercussions’
Misdiagnosis can have ‘downstream repercussions’
Hospitalists encounter troponin elevations daily, but we have to use clinical judgment to determine if the troponin elevation represents either a myocardial infarction (MI), or a non-MI troponin elevation (i.e. a , nonischemic myocardial injury).
It is important to remember that an MI specifically refers to myocardial injury due to acute myocardial ischemia to the myocardium. This lack of blood supply can be due to an acute absolute or relative deficiency in coronary artery blood flow. However, there are also many mechanisms of myocardial injury unrelated to reduced coronary artery blood flow, and these should be more appropriately termed non-MI troponin elevations.
Historically, when an ischemic mechanism of myocardial injury was suspected, providers would categorize troponin elevations into ST-elevation MI (STEMI) versus non-ST-elevation MI (NSTEMI) based on the electrocardiogram (ECG). We would further classify the NSTEMI into type 1 or type 2, depending on the mechanism of injury. The term “NSTEMI” served as a “catch-all” term to describe both type 1 NSTEMIs and type 2 MIs, but that classification system is no longer valid.
As of Oct. 1, 2017, ICD-10 and the Centers for Medicare & Medicaid Services have a new ICD-10 diagnosis code for type 2 MI (I21.A1), distinct from NSTEMI (I21.4) based on updated definitions from the American College of Cardiology, American Heart Association, European Society of Cardiology, and World Heart Federation. The term “NSTEMI” should be used only when referring to a type 1 MI not when referring to a type 2 MI.1
Classification of MI types
The Fourth Universal Definition of MI published in August 2018 further updated the definitions of MI (summarized in Figure 1).2 This review focuses on type 1 and type 2 MIs, which are the most common types encountered by hospitalists. Types 3-5 MI (grouped under a common ICD-10 diagnosis code for “Other MI Types,” or I21.A9) would rarely be diagnosed by hospitalists.
Figure 1: Classification of MI
MI Type | Classification |
1 | STEMI (acute coronary artery thrombosis) |
2 | Supply/demand mismatch (heterogeneous underlying causes) |
3 | Sudden cardiac death with ECG evidence of acute myocardial ischemia before cardiac troponins could be drawn |
4 | MI due to percutaneous coronary intervention (PCI) |
5 | MI due to coronary artery bypass grafting (CABG) |
The diagnosis of a type 1 MIs (STEMI and NSTEMI) is supported by the presence of an acute coronary thrombus or plaque rupture/erosion on coronary angiography or a strong suspicion for these when angiography is unavailable or contraindicated. Type 1 MI (also referred to as spontaneous MI) is generally a primary reason (or “principal” diagnosis) for a patient’s presentation to a hospital.3 Please note that a very high or rising troponin level alone is not diagnostic for a type 1 or type 2 NSTEMI. The lab has to be taken in the context of the patient’s presentation and other supporting findings.
In contrast to a type 1 MI (STEMI and NSTEMI), at type 2 MI results from an imbalance between myocardial oxygen supply and demand unrelated to acute coronary artery thrombosis or plaque rupture. A type 2 MI is a relative (as opposed to an absolute) deficiency in coronary artery blood flow triggered by an abrupt increase in myocardial oxygen demand, drop in myocardial blood supply, or both. In type 2 MI, myocardial injury occurs secondary to an underlying process, and therefore requires correct documentation of the underlying cause as well.
Common examples of underlying causes of type 2 MI include acute blood loss anemia (e.g. GI bleed), acute hypoxia (e.g. COPD exacerbation), shock states (cardiogenic, hypovolemic, hemorrhagic, or septic), coronary vasospasm (e.g. spontaneous), and bradyarrhythmias. Patients with type 2 MI often have a history of fixed obstructive coronary disease, which when coupled with the acute trigger facilitates the type 2 MI; however, underlying CAD is not always present.
Diagnosing a type 2 MI requires evidence of acute myocardial ischemia (Figure 2) with an elevated troponin but must also have at least one of the following:2
- Symptoms of acute myocardial ischemia such as typical chest pain.
- New ischemic ECG changes.
- Development of pathological Q waves.
- Imaging evidence of new loss of viable myocardium, significant reversible perfusion defect on nuclear imaging, or new regional wall motion abnormality in a pattern consistent with an ischemic etiology.
Distinguishing a type 1 NSTEMI from a type 2 MI depends mainly on the clinical context and clinical judgment. A patient whose presenting symptoms include acute chest discomfort, acute ST-T wave changes, and a rise in troponin would be suspected of having a type 1 NSTEMI. However, in a patient presenting with other or vague complaints where an elevated troponin was found amongst a battery of tests, a type 2 MI may be favored, particularly if there is evidence of an underlying trigger for a supply-demand mismatch. In challenging cases, cardiology consultation can help determine the MI type and/or the next diagnostic and treatment considerations.
When there is only elevated troponin levels (or even a rise and fall in troponin) without new symptoms or ECG/imaging evidence of myocardial ischemia, it is most appropriate to document a non-MI troponin elevation due to a nonischemic mechanism of myocardial injury.
Non-MI troponin elevation (nonischemic myocardial injury)
The number of conditions known to cause myocardial injury through mechanisms other than myocardial ischemia (see Figure 2) is growing, especially in the current era of high-sensitivity troponin assays.4
Common examples of underlying causes of non-MI troponin elevation include:
- Acute (on chronic) systolic or diastolic heart failure: Usually due to acute ventricular wall stretch/strain. Troponin elevations tend to be mild, with more indolent (or even flat) troponin trajectories.
- Pericarditis and myocarditis: Due to direct injury from myocardial inflammation.
- Cardiopulmonary resuscitation (CPR): Due to physical injury to the heart from mechanical chest compressions and from electrical shocks of external defibrillation.
- Stress-induced (takotsubo) cardiomyopathy: Stress-induced release of neurohormonal factors and catecholamines that cause direct myocyte injury and transient dilatation of the ventricle.
- Acute pulmonary embolism: Result of acute right ventricular wall stretch/strain, not from myocardial ischemia.
- Sepsis without shock: Direct toxicity of circulating cytokines to cardiac myocytes. In the absence of evidence of shock and symptoms/signs of myocardial ischemia, do not document type 2 MI.
- Renal failure (acute kidney injury or chronic kidney disease): Multiple etiologies, but at least partially related to reduced renal clearance of troponin. In general, renal failure in the absence of symptoms/signs of ischemia is best classified as a non-MI troponin elevation. ESRD patients who present with volume overload due to missed dialysis also typically have a non-MI troponin elevation.
- Stroke/intracranial hemorrhage: Mechanisms of myocardial injury and troponin elevation are incompletely understood, but may include catecholamine surges that injure the heart.
Some underlying conditions can cause a type 2 MI or a non-MI troponin elevation depending on the clinical context. For example, hypertensive emergency, severe aortic valve stenosis, hypertrophic cardiomyopathy, and tachyarrhythmias (including atrial fibrillation with rapid ventricular response) may cause increased myocardial oxygen demand, and in patients with underlying CAD, could precipitate a type 2 MI.
However, these same conditions could cause a non-MI troponin elevation in patients without CAD and could also cause myocardial injury and troponin release by causing acute left ventricular stretch/strain. Distinguishing the diagnose of type 2 MI vs. non-MI troponin elevation depends on documenting whether there are ancillary ischemic symptoms, ECG findings, imaging, and/or cath findings of acute myocardial ischemia.
Case examples
1. A 60-year-old male presents with fever, cough, shortness of breath, and an infiltrate on CXR and is diagnosed with sepsis secondary to pneumonia. His initial troponin of 0.07 (normal < 0.05) rises to 0.11, peaks at 0.23, then subsequently trends down.
While some may be tempted to diagnose a type 2 MI, remember that sepsis can cause direct myocardial cell injury via direct cell toxicity. Unless this patient had at least one additional criteria (anginal chest pain, new ischemic ECG changes, or imaging evidence of new loss of viable myocardium, which does not recover with treatment of sepsis), this was most likely myocardial injury via direct cell toxicity, and should be documented as a non-MI troponin elevation due to sepsis without shock.
If there were ischemic ECG changes and the patient had chest pain, one would have to use clinical suspicion to differentiate between a type 1 NSTEMI and a type 2 MI. If there is a high clinical suspicion for an acute plaque rupture/thrombus, one would call it an NSTEMI and would have to document treatment as such (e.g. start heparin drip). Again, cardiology consultation can be helpful in cases where it may be hard to decide how to manage. Many times, the true mechanism is not determined until the patient is taken to the cath lab and if no acute plaque rupture is seen, then it was likely a type 2 MI.
2. A 70-year-old male with chronic systolic heart failure, noncompliant with medications, presents with 3 days of dyspnea on exertion and lower extremity edema. He had no chest discomfort. Exam shows bibasilar crackles and hepatojugular reflux. ECG shows no ischemic changes. Serial troponin values over 48 hours were: 0.48, 0.58, 0.51. A transthoracic echocardiogram reveals an LVEF of 40% with poor movement in the apex, similar to his prior echo.
This patient had no overt evidence of ischemia (no chest pain, ischemic ECG, or imaging changes) so the troponin elevation was most likely a non-MI troponin elevation secondary to acute on chronic systolic heart failure (in which the mechanism of troponin elevation is left ventricular chamber stretch from volume overload, and not demand ischemia). Generally, it is uncommon for a heart failure exacerbation to cause a type 2 MI.
Why is it so important to get this diagnosis right?
Misdiagnosing an MI when the patient does not have one can have multiple downstream repercussions. Because it stays on their medical record, it impacts their ability to get insurance and their premium costs. We expose patients to additional medications (e.g. dual antiplatelet therapy, statins), which can have adverse effects. As a result, it is very important to classify the etiology of the troponin elevation and treat accordingly.
Finally, when we incorrectly label a patient as having an MI, this can impact billing and reimbursement, DRG denials, insurance premiums, and quality metrics for both the hospital and the physicians. Hospitals’ 30-day readmission rates for AMI will suffer and quality metrics can be significantly impacted. We must be diligent and as precise as possible with our diagnoses and documentation to ensure the maximum benefit for our patients and our health care system.
Dr. Nave is assistant professor of medicine in the division of hospital medicine at Emory University, Atlanta. Dr. Goyal is associate professor of medicine (cardiology), at Emory University, and chief quality officer, Emory Heart and Vascular Center, Emory Healthcare. He is also codirector of nuclear cardiology at Emory University Hospital.
Key points
- A diagnosis of a type 1 MI is supported by evidence or strong suspicion of acute coronary artery thrombus or plaque rupture/erosion.
- A very high troponin level alone is not diagnostic for a type 1 or type 2 MI. It has to be contextualized with the patient’s presentation and other supporting findings.
- Type 2 MI is a mismatch between myocardial oxygen supply and demand unrelated to acute coronary thrombosis or plaque rupture triggered by an abrupt increase in myocardial oxygen demand, drop in myocardial blood supply, or both. Type 2 MI should be documented along with its underlying cause.
- To diagnose an MI (either type 1 or type 2 MI), in addition to the troponin elevation, the patient must have symptoms of acute ischemia, ischemic ECG findings, and/or imaging suggestive of new ischemia.
- An elevated troponin level without new symptoms or ECG/imaging evidence of myocardial ischemia should be documented as a non-MI troponin elevation secondary to an underlying cause.
References
1. Goyal A, Gluckman TJ, Tcheng JE. What’s in a name? The new ICD-10 (10th revision of the international statistical classification of diseases and related health problems) codes and type 2 myocardial infarction. Circulation. 2017;136:1180-2.
2. Thygesen K, Alpert JS, Jaffe AS, et al. Fourth universal definition of myocardial infarction (2018). J Am Coll Cardiol. 2018;Aug 25:[Epub ahead of print].
3. Goyal, et al. Translating the Fourth Universal Definition of Myocardial Infarction into Clinical Documentation: Ten Pearls For Frontline Clinicians. Cardiology Magazine. Nov 2018.
4. Roongsritong C, Warraich I, Bradley C. Common causes of troponin elevations in the absence of acute myocardial infarction: incidence and clinical significance. Chest. 2004;125:1877-84.
Infection with 2019 novel coronavirus extends to infants
between Dec. 8, 2019, and Feb. 6, 2020, based on data from the Chinese central government and local health departments.

“As of February 6, 2020, China reported 31,211 confirmed cases of COVID-19 and 637 fatalities,” wrote Min Wei, MD, of Wuhan University, China, and colleagues. However, “few infections in children have been reported.”
In a research letter published in JAMA, the investigators reviewed data from nine infants aged 28 days to 1 year who were hospitalized with a diagnosis of COVID-19 between Dec. 8, 2019, and Feb. 6, 2020. The ages of the infants ranged from 1 month to 11 months, and seven were female. The patients included two children from Beijing, two from Hainan, and one each from the areas of Guangdong, Anhui, Shanghai, Zhejiang, and Guizhou.
All infected infants had at least one infected family member, and the infants’ infections occurred after the family members’ infections; seven infants lived in Wuhan or had family members who had visited Wuhan.
One of the infants had no symptoms but tested positive for the 2019 novel coronavirus, and two others had a diagnosis but missing information on any symptoms. Fever occurred in four patients, and mild upper respiratory tract symptoms occurred in two patients.
None of the infants died, and none reported severe complications or the need for intensive care or mechanical ventilation, the investigators said. The fact that most of the infants were female might suggest that they are more susceptible to the virus than males, although overall COVID-19 viral infections have been more common in adult men, especially those with chronic comorbidities, Dr. Wei and associates noted.
The study findings were limited by the small sample size and lack of symptom data for some patients, the researchers said. However, the results confirm that the COVID-19 virus is transmissible to infants younger than 1 year, and adult caregivers should exercise protective measures including wearing masks, washing hands before contact with infants, and routinely sterilizing toys and tableware, they emphasized.
The study was supported by the National Natural Science Foundation of China and the Fundamental Research Funds for the Central Universities. The researchers had no financial conflicts to disclose.
SOURCE: Wei M et al. JAMA. 2020 Feb 14. doi:10.1001/jama.2020.2131.
between Dec. 8, 2019, and Feb. 6, 2020, based on data from the Chinese central government and local health departments.
“As of February 6, 2020, China reported 31,211 confirmed cases of COVID-19 and 637 fatalities,” wrote Min Wei, MD, of Wuhan University, China, and colleagues. However, “few infections in children have been reported.”
In a research letter published in JAMA, the investigators reviewed data from nine infants aged 28 days to 1 year who were hospitalized with a diagnosis of COVID-19 between Dec. 8, 2019, and Feb. 6, 2020. The ages of the infants ranged from 1 month to 11 months, and seven were female. The patients included two children from Beijing, two from Hainan, and one each from the areas of Guangdong, Anhui, Shanghai, Zhejiang, and Guizhou.
All infected infants had at least one infected family member, and the infants’ infections occurred after the family members’ infections; seven infants lived in Wuhan or had family members who had visited Wuhan.
One of the infants had no symptoms but tested positive for the 2019 novel coronavirus, and two others had a diagnosis but missing information on any symptoms. Fever occurred in four patients, and mild upper respiratory tract symptoms occurred in two patients.
None of the infants died, and none reported severe complications or the need for intensive care or mechanical ventilation, the investigators said. The fact that most of the infants were female might suggest that they are more susceptible to the virus than males, although overall COVID-19 viral infections have been more common in adult men, especially those with chronic comorbidities, Dr. Wei and associates noted.
The study findings were limited by the small sample size and lack of symptom data for some patients, the researchers said. However, the results confirm that the COVID-19 virus is transmissible to infants younger than 1 year, and adult caregivers should exercise protective measures including wearing masks, washing hands before contact with infants, and routinely sterilizing toys and tableware, they emphasized.
The study was supported by the National Natural Science Foundation of China and the Fundamental Research Funds for the Central Universities. The researchers had no financial conflicts to disclose.
SOURCE: Wei M et al. JAMA. 2020 Feb 14. doi:10.1001/jama.2020.2131.
FROM JAMA
As novel coronavirus outbreak evolves, critical care providers need to be prepared
ORLANDO – While the impact of the 2019 novel coronavirus outbreak on hospitals outside of China remains to be determined, there are several practical points critical care professionals need to know to be prepared in the face of this dynamic and rapidly evolving outbreak, speakers said at the Critical Care Congress sponsored by the Society of Critical Care Medicine.

“Priorities for us in our hospitals are early detection, infection prevention, staff safety, and obviously, taking care of sick people,” said Ryan C. Maves, MD, of the Naval Medical Center San Diego in a special session on the 2019 Novel Coronavirus outbreak.*
Approximately 72,000 cases of coronavirus disease 2019 (COVID-19) had been reported as of Feb. 17, 2020, the day of Dr. Maves’ talk, according to statistics from Johns Hopkins Center for Science and Engineering in Baltimore. A total of 1,775 deaths had been recorded, nearly all of which were in Hubei Province, the central point of the outbreak. In the United States, the number of cases stood at 15, with no deaths reported.
While the dynamics of the 2019 novel coronavirus are still being learned, the estimated range of spread for droplet transmission is 2 meters, according to Dr. Maves. The duration of environmental persistence is not yet known, but he said that other coronaviruses persist in low-humidity conditions for up to 4 days.
The number of secondary cases that arise from a primary infection, or R0, is estimated to be between 1.5 and 3, though it can change as exposure evolves; by comparison, the R0 for H1N1 influenza has been reported as 1.5, while measles is 12-18, indicating that it is “very contagious,” said Dr. Maves. Severe acute respiratory syndrome had an initial R0 of about 3.5, which he said declined rapidly to 0.7 as environmental and policy controls were put into place.
Critical care professionals need to know how to identify patients at risk of having COVID-19 and determine whether they need further work-up, according to Dr. Maves, who highlighted recent criteria released by the Centers for Disease Control and Prevention.
The highest-risk category, he said, are individuals exposed to a laboratory-confirmed coronavirus case, which along with fever or signs and symptoms of a lower respiratory illness would be sufficient to classify them as a “person of interest” requiring further evaluation for disease. A history of travel from Hubei Province plus fever and signs/symptoms of lower respiratory illness would also meet criteria for evaluation, according to the CDC, while travel to mainland China would also meet the threshold, if those symptoms required hospitalization.
The CDC also published a step-wise flowchart to evaluate patients who may have been exposed to the 2019 novel coronavirus. According to that flowchart, if an individual has traveled to China or had close contact with someone infected with the 2019 Novel Coronavirus within 14 days of symptoms, and that individual has fever or symptoms of lower respiratory illness such as cough or shortness of breath, then providers should isolate that individual and assess clinical status, in addition to contacting the local health department.

Laura E. Evans, MD, MS, FCCM, of New York University, said she might recommend providers “flip the script” on that CDC algorithm when it comes to identifying patients who may have been exposed.
“I think perhaps what we should be doing at sites of entry is not talking about travel as the first question, but rather fever or symptoms of lower respiratory illnesses as the first question, and use that as the opportunity to implement risk mitigation at that stage,” Dr. Evans said in a presentation on preparing for COVID-19.
Even with “substantial uncertainty” about the potential impact of the 2019 Novel Coronavirus, a significant influx of seriously ill patients would put strain the U.S. health care delivery system, she added.
“None of us have tons of extra capacity in our emergency departments, inpatient units, or ICUs, and I think we need to be prepared for that,” she added. “We need to know what our process is for ‘identify, isolate, and inform,’ and we need to be testing that now.”
Dr. Maves and Dr. Evans both reported that they had no financial conflicts of interest to report. Dr. Maves indicated that the views expressed in his presentation did not necessarily reflect the official policy or position of the Department of the Navy, Department of Defense, or the United States government.
*Correction, 2/19/20: An earlier version of this article misstated the location of the naval center.
ORLANDO – While the impact of the 2019 novel coronavirus outbreak on hospitals outside of China remains to be determined, there are several practical points critical care professionals need to know to be prepared in the face of this dynamic and rapidly evolving outbreak, speakers said at the Critical Care Congress sponsored by the Society of Critical Care Medicine.
“Priorities for us in our hospitals are early detection, infection prevention, staff safety, and obviously, taking care of sick people,” said Ryan C. Maves, MD, of the Naval Medical Center San Diego in a special session on the 2019 Novel Coronavirus outbreak.*
Approximately 72,000 cases of coronavirus disease 2019 (COVID-19) had been reported as of Feb. 17, 2020, the day of Dr. Maves’ talk, according to statistics from Johns Hopkins Center for Science and Engineering in Baltimore. A total of 1,775 deaths had been recorded, nearly all of which were in Hubei Province, the central point of the outbreak. In the United States, the number of cases stood at 15, with no deaths reported.
While the dynamics of the 2019 novel coronavirus are still being learned, the estimated range of spread for droplet transmission is 2 meters, according to Dr. Maves. The duration of environmental persistence is not yet known, but he said that other coronaviruses persist in low-humidity conditions for up to 4 days.
The number of secondary cases that arise from a primary infection, or R0, is estimated to be between 1.5 and 3, though it can change as exposure evolves; by comparison, the R0 for H1N1 influenza has been reported as 1.5, while measles is 12-18, indicating that it is “very contagious,” said Dr. Maves. Severe acute respiratory syndrome had an initial R0 of about 3.5, which he said declined rapidly to 0.7 as environmental and policy controls were put into place.
Critical care professionals need to know how to identify patients at risk of having COVID-19 and determine whether they need further work-up, according to Dr. Maves, who highlighted recent criteria released by the Centers for Disease Control and Prevention.
The highest-risk category, he said, are individuals exposed to a laboratory-confirmed coronavirus case, which along with fever or signs and symptoms of a lower respiratory illness would be sufficient to classify them as a “person of interest” requiring further evaluation for disease. A history of travel from Hubei Province plus fever and signs/symptoms of lower respiratory illness would also meet criteria for evaluation, according to the CDC, while travel to mainland China would also meet the threshold, if those symptoms required hospitalization.
The CDC also published a step-wise flowchart to evaluate patients who may have been exposed to the 2019 novel coronavirus. According to that flowchart, if an individual has traveled to China or had close contact with someone infected with the 2019 Novel Coronavirus within 14 days of symptoms, and that individual has fever or symptoms of lower respiratory illness such as cough or shortness of breath, then providers should isolate that individual and assess clinical status, in addition to contacting the local health department.
Laura E. Evans, MD, MS, FCCM, of New York University, said she might recommend providers “flip the script” on that CDC algorithm when it comes to identifying patients who may have been exposed.
“I think perhaps what we should be doing at sites of entry is not talking about travel as the first question, but rather fever or symptoms of lower respiratory illnesses as the first question, and use that as the opportunity to implement risk mitigation at that stage,” Dr. Evans said in a presentation on preparing for COVID-19.
Even with “substantial uncertainty” about the potential impact of the 2019 Novel Coronavirus, a significant influx of seriously ill patients would put strain the U.S. health care delivery system, she added.
“None of us have tons of extra capacity in our emergency departments, inpatient units, or ICUs, and I think we need to be prepared for that,” she added. “We need to know what our process is for ‘identify, isolate, and inform,’ and we need to be testing that now.”
Dr. Maves and Dr. Evans both reported that they had no financial conflicts of interest to report. Dr. Maves indicated that the views expressed in his presentation did not necessarily reflect the official policy or position of the Department of the Navy, Department of Defense, or the United States government.
*Correction, 2/19/20: An earlier version of this article misstated the location of the naval center.
EXPERT ANALYSIS FROM CCC49
Flu increases activity but not its severity

The CDC’s latest report shows that 6.8% of outpatients visiting health care providers had influenza-like illness during the week ending Feb. 8. That’s up from the previous week’s 6.6%, but that rise of 0.2 percentage points is smaller than the 0.6-point rises that occurred each of the 2 weeks before, and that could mean that activity is slowing.
That slowing, however, is not noticeable from this week’s map, which puts 41 states (there were 35 last week) and Puerto Rico in the red at the highest level of activity on the CDC’s 1-10 scale and another three states in the “high” range with levels of 8 or 9, the CDC’s influenza division reported.
That leaves Nevada and Oregon at level 7; Alaska, Florida, and the District of Columbia at level 5; Idaho at level 3, and Delaware with insufficient data (it was at level 5 last week), the CDC said.
The 2019-2020 season’s high activity, fortunately, has not translated into high severity, as overall hospitalization and mortality rates continue to remain at fairly typical levels. Hospitalization rates are elevated among children and young adults, however, and pediatric deaths are now up to 92, the CDC said, which is high for this point in the season.
ACC issues guidance on cardiac implications of coronavirus
The American College of Cardiology on Feb. 13, 2020, released a clinical bulletin that aims to address cardiac implications of the current epidemic of the novel coronavirus, now known as COVID-19.
The bulletin, reviewed and approved by the college’s Science and Quality Oversight Committee, “provides background on the epidemic, which was first reported in late December 2019, and looks at early cardiac implications from case reports,” the ACC noted in a press release. “It also provides information on the potential cardiac implications from analog viral respiratory pandemics and offers early clinical guidance given current COVID-19 uncertainty.”
The document looks at some early cardiac implications of the infection. For example, early case reports suggest patients with underlying conditions are at higher risk of complications or mortality from the virus, with up to 50% of hospitalized patients having a chronic medical illness, the authors wrote.
About 40% of hospitalized patients confirmed to have the virus have cardiovascular or cerebrovascular disease, they noted.
In a recent case report on 138 hospitalized COVID-19 patients, they noted, 19.6% developed acute respiratory distress syndrome, 16.7% developed arrhythmia, 8.7% developed shock, 7.2% developed acute cardiac injury, and 3.6% developed acute kidney injury. “Rates of complication were universally higher for ICU patients,” they wrote.
“The first reported death was a 61-year-old male, with a long history of smoking, who succumbed to acute respiratory distress, heart failure, and cardiac arrest,” the document noted. “Early, unpublished first-hand reports suggest at least some patients develop myocarditis.”
Stressing the current uncertainty about the virus, the bulletin provides the following clinical guidance:
- COVID-19 is spread through droplets and can live for substantial periods outside the body; containment and prevention using standard public health and personal strategies for preventing the spread of communicable disease remains the priority.
- In geographies with active COVID-19 transmission (mainly China), it is reasonable to advise patients with underlying cardiovascular disease of the potential increased risk and to encourage additional, reasonable precautions.
- Older adults are less likely to present with fever, thus close assessment for other symptoms such as cough or shortness of breath is warranted.
- Some experts have suggested that the rigorous use of guideline-directed, plaque-stabilizing agents could offer additional protection to cardiovascular disease (CVD) patients during a widespread outbreak (statins, beta-blockers, ACE inhibitors, acetylsalicylic acid); however, such therapies should be tailored to individual patients.
- It is important for patients with CVD to remain current with vaccinations, including the pneumococcal vaccine, given the increased risk of secondary bacterial infection; it would also be prudent to receive vaccination to prevent another source of fever which could be initially confused with coronavirus infection.
- It may be reasonable to triage COVID-19 patients according to the presence of underlying cardiovascular, respiratory, renal, and other chronic diseases for prioritized treatment.
- Providers are cautioned that classic symptoms and presentation of acute MI may be overshadowed in the context of coronavirus, resulting in underdiagnosis.
- For CVD patients in geographies without widespread COVID-19, emphasis should remain on the threat from influenza, the importance of vaccination and frequent handwashing, and continued adherence to all guideline-directed therapy for underlying chronic conditions.
- COVID-19 is a fast-moving epidemic with an uncertain clinical profile; providers should be prepared for guidance to shift as more information becomes available.
The full clinical update is available here.
This article first appeared on Medscape.com.
Resetting your compensation
Using the State of Hospital Medicine Report to bolster your proposal
In the ever-changing world of health care, one thing is for sure: If you’re not paying attention, you’re falling behind. In this column, I will discuss how you may utilize the Society of Hospital Medicine (SHM) State of Hospital Medicine Report (SoHM) to evaluate your current compensation structure and strengthen your business plan for change. For purposes of this exercise, I will focus on data referenced as Internal Medicine only, hospital-owned Hospital Medicine Groups (HMG).

Issues with retention, recruitment, or burnout may be among the first factors that lead you to reevaluate your compensation plan. The SoHM Report can help you to take a dive into feedback for these areas. Look for any indications that compensation may be affecting your turnover, inability to hire, or leaving your current team frustrated with their current pay structure. Feedback surrounding each of these factors may drive you to evaluate your comp plan but remain mindful that money is not always the answer.
You may complete your evaluation and find the data could suggest you are in fact well paid for the work you do. Even though this may be the case, the evaluation and transparency to your provider team may help flush out the real reason you are struggling with recruitment, retention, or burnout. However, if you do find you have an opportunity to improve your compensation structure, remember that you will need a compelling, data-driven case, to present to your C-suite.
Let us start by understanding how the market has changed over time using data from the 2014, 2016, and 2018 SoHM Reports. Of note, each report is based on data from the prior year. Since 2013, hospital owned HMGs have seen a 16% increase in total compensation while experiencing only a 9% increase in collections. Meanwhile RVU productivity has remained relatively stable over time. From this, we see hospitalists are earning more for similar productivity. The hospital reimbursement for professional fees has not grown at the same rate as compensation. Also, the collection per RVU has remained relatively flat over time.
It’s simple: Hospitalists are earning more and professional revenues are not making up the difference. This market change is driving hospitals to invest more money to maintain their HMGs. If your hospital hasn’t been responding to these data, you will need a strong business plan to get buy in from your hospital administration.
Now that you have evaluated the market change, it is time to put some optics on where your compensation falls in the current market. When you combine your total compensation with your total RVU productivity, you can use the SoHM Report to evaluate the current reported benchmarks for Compensation per RVU. Plotting these benchmarks against your own compensation and any proposed changes can help your administration really begin to see whether a change should be considered. Providing that clear picture in relevance to the SoHM benchmark is important, as a chart or graph can simplify your C-suite’s understanding of your proposal.
By simplifying your example using Compensation per RVU, you are making the conversation easier to follow. Your hospital leaders can clearly see the cost for every RVU generated and understand the impact. This is not to say that you should base your compensation around productivity. It is merely a way to roll in all compensation factors, whether quality related, performance based, or productivity driven, and tie them to a metric that is clear and easy for administration to understand.
Remember, when designing your new compensation plan, you can reference the SoHM Report to see how HMGs around the country are providing incentive and what percentage of compensation is based on incentive. There are sections within the report directly outlining these data points.
Now that we have reviewed market change and how to visualize change between your current and proposed future state, I will leave you with some final thoughts regarding other considerations when building your business plan:
- Focus on only physician-generated RVUs.
- Consider Length of Stay impact on productivity.
- Decide if Case Mix Index changes have impacted your staffing needs.
- Understand your E and M coding practices in reference to industry benchmarks. The SoHM Report provides benchmarks for billing practices across the country.
- Lastly, clearly identify the issues you want to address and set goals with measurable outcomes.
There is still time for your group to be part of the 2020 State of Hospital Medicine Report data by participating in the 2020 Survey. Data are being accepted through Feb. 28, 2020. Submit your data at www.hospitalmedicine.org/2020survey.
Mr. Sandroni is director of operations, hospitalists, at Rochester (N.Y.) Regional Health.
Using the State of Hospital Medicine Report to bolster your proposal
Using the State of Hospital Medicine Report to bolster your proposal
In the ever-changing world of health care, one thing is for sure: If you’re not paying attention, you’re falling behind. In this column, I will discuss how you may utilize the Society of Hospital Medicine (SHM) State of Hospital Medicine Report (SoHM) to evaluate your current compensation structure and strengthen your business plan for change. For purposes of this exercise, I will focus on data referenced as Internal Medicine only, hospital-owned Hospital Medicine Groups (HMG).
Issues with retention, recruitment, or burnout may be among the first factors that lead you to reevaluate your compensation plan. The SoHM Report can help you to take a dive into feedback for these areas. Look for any indications that compensation may be affecting your turnover, inability to hire, or leaving your current team frustrated with their current pay structure. Feedback surrounding each of these factors may drive you to evaluate your comp plan but remain mindful that money is not always the answer.
You may complete your evaluation and find the data could suggest you are in fact well paid for the work you do. Even though this may be the case, the evaluation and transparency to your provider team may help flush out the real reason you are struggling with recruitment, retention, or burnout. However, if you do find you have an opportunity to improve your compensation structure, remember that you will need a compelling, data-driven case, to present to your C-suite.
Let us start by understanding how the market has changed over time using data from the 2014, 2016, and 2018 SoHM Reports. Of note, each report is based on data from the prior year. Since 2013, hospital owned HMGs have seen a 16% increase in total compensation while experiencing only a 9% increase in collections. Meanwhile RVU productivity has remained relatively stable over time. From this, we see hospitalists are earning more for similar productivity. The hospital reimbursement for professional fees has not grown at the same rate as compensation. Also, the collection per RVU has remained relatively flat over time.
It’s simple: Hospitalists are earning more and professional revenues are not making up the difference. This market change is driving hospitals to invest more money to maintain their HMGs. If your hospital hasn’t been responding to these data, you will need a strong business plan to get buy in from your hospital administration.
Now that you have evaluated the market change, it is time to put some optics on where your compensation falls in the current market. When you combine your total compensation with your total RVU productivity, you can use the SoHM Report to evaluate the current reported benchmarks for Compensation per RVU. Plotting these benchmarks against your own compensation and any proposed changes can help your administration really begin to see whether a change should be considered. Providing that clear picture in relevance to the SoHM benchmark is important, as a chart or graph can simplify your C-suite’s understanding of your proposal.
By simplifying your example using Compensation per RVU, you are making the conversation easier to follow. Your hospital leaders can clearly see the cost for every RVU generated and understand the impact. This is not to say that you should base your compensation around productivity. It is merely a way to roll in all compensation factors, whether quality related, performance based, or productivity driven, and tie them to a metric that is clear and easy for administration to understand.
Remember, when designing your new compensation plan, you can reference the SoHM Report to see how HMGs around the country are providing incentive and what percentage of compensation is based on incentive. There are sections within the report directly outlining these data points.
Now that we have reviewed market change and how to visualize change between your current and proposed future state, I will leave you with some final thoughts regarding other considerations when building your business plan:
- Focus on only physician-generated RVUs.
- Consider Length of Stay impact on productivity.
- Decide if Case Mix Index changes have impacted your staffing needs.
- Understand your E and M coding practices in reference to industry benchmarks. The SoHM Report provides benchmarks for billing practices across the country.
- Lastly, clearly identify the issues you want to address and set goals with measurable outcomes.
There is still time for your group to be part of the 2020 State of Hospital Medicine Report data by participating in the 2020 Survey. Data are being accepted through Feb. 28, 2020. Submit your data at www.hospitalmedicine.org/2020survey.
Mr. Sandroni is director of operations, hospitalists, at Rochester (N.Y.) Regional Health.
Two new Novel Coronavirus cases confirmed among quarantined U.S. patients
The Centers for Disease Control and Prevention announced two new patients now have the 2019 Novel Coronavirus (2019-nCoV), bringing the case total in the United States to 15.
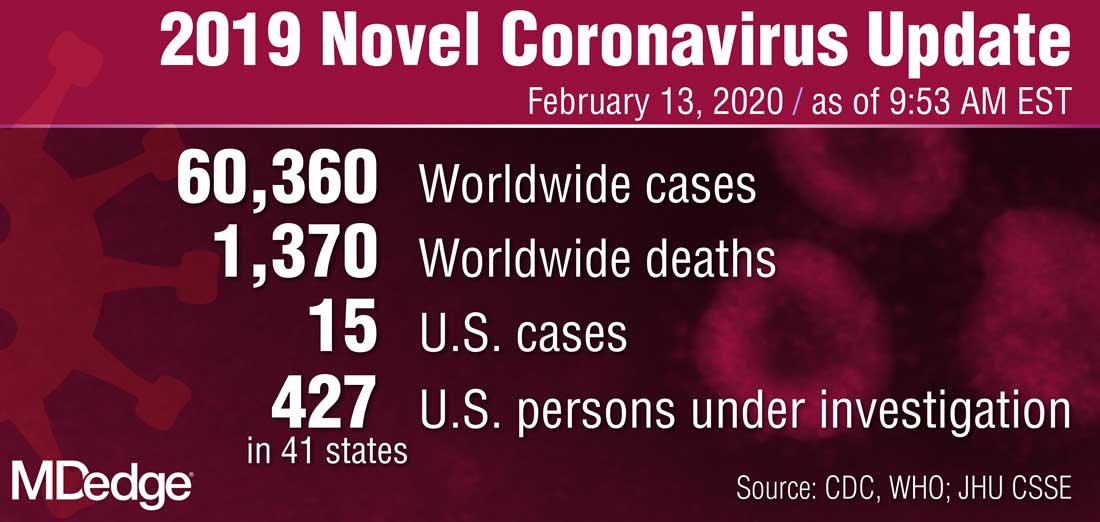
The 14th case was discovered in California among a group of people under federal quarantine after returning from the Hubei Province in China. That patient was on a U.S. State Department–chartered flight that arrived in the United States on Feb. 7.
The 15th case was discovered in Texas among a group of people who also are under federal quarantine. That patient arrived on a State Department–chartered flight that arrived on Feb. 7. It is the first person in Texas that has tested positive for 2019-nCoV.
CDC said in a statement announcing the Texas case that there “will likely be additional cases in the coming days and weeks, including among other people recently returned from Wuhan.” Officials noted that more than 600 people who have returned as part of State Department–chartered flights are currently under that 14-day quarantine.
The agency is preparing for more widespread cases of 2019-nCoV.
Nancy Messonnier, MD, director of the CDC National Center for Immunization and Respiratory Diseases, said that containment has been the early focus for the agency.
“The goal of the measures we have taken to date are to slow the introduction and impact of this disease in the United States, but at some point, we are likely to see community spread in the U.S.,” Dr. Messonnier said during a Feb. 12 teleconference with reporters. She added that the federal response will change over time as the virus spreads.
Dr. Messonnier noted that public health officials are planning for the increased demands that a wider outbreak of 2019-nCov would place on the health care delivery system, including ensuring an adequate supply of medical equipment.
The Centers for Disease Control and Prevention announced two new patients now have the 2019 Novel Coronavirus (2019-nCoV), bringing the case total in the United States to 15.
The 14th case was discovered in California among a group of people under federal quarantine after returning from the Hubei Province in China. That patient was on a U.S. State Department–chartered flight that arrived in the United States on Feb. 7.
The 15th case was discovered in Texas among a group of people who also are under federal quarantine. That patient arrived on a State Department–chartered flight that arrived on Feb. 7. It is the first person in Texas that has tested positive for 2019-nCoV.
CDC said in a statement announcing the Texas case that there “will likely be additional cases in the coming days and weeks, including among other people recently returned from Wuhan.” Officials noted that more than 600 people who have returned as part of State Department–chartered flights are currently under that 14-day quarantine.
The agency is preparing for more widespread cases of 2019-nCoV.
Nancy Messonnier, MD, director of the CDC National Center for Immunization and Respiratory Diseases, said that containment has been the early focus for the agency.
“The goal of the measures we have taken to date are to slow the introduction and impact of this disease in the United States, but at some point, we are likely to see community spread in the U.S.,” Dr. Messonnier said during a Feb. 12 teleconference with reporters. She added that the federal response will change over time as the virus spreads.
Dr. Messonnier noted that public health officials are planning for the increased demands that a wider outbreak of 2019-nCov would place on the health care delivery system, including ensuring an adequate supply of medical equipment.